University of Birmingham Mapping energy consumption in food manufacturing Ladha-Sabur, Alia; Bakalis, Serafim; Fryer, Peter J.; Lopez-Quiroga, Estefania DOI: 10.1016/j.tifs.2019.02.034 License: Creative Commons: Attribution (CC BY) Document Version Publisher's PDF, also known as Version of record Citation for published version (Harvard): Ladha-Sabur, A, Bakalis, S, Fryer, PJ & Lopez-Quiroga, E 2019, 'Mapping energy consumption in food manufacturing', Trends in Food Science and Technology, vol. 86, pp. 270-280. https://doi.org/10.1016/j.tifs.2019.02.034 Link to publication on Research at Birmingham portal Publisher Rights Statement: Checked for eligibility: 13/03/2019 General rights Unless a licence is specified above, all rights (including copyright and moral rights) in this document are retained by the authors and/or the copyright holders. The express permission of the copyright holder must be obtained for any use of this material other than for purposes permitted by law. • Users may freely distribute the URL that is used to identify this publication. • Users may download and/or print one copy of the publication from the University of Birmingham research portal for the purpose of private study or non-commercial research. • User may use extracts from the document in line with the concept of ‘fair dealing’ under the Copyright, Designs and Patents Act 1988 (?) • Users may not further distribute the material nor use it for the purposes of commercial gain. Where a licence is displayed above, please note the terms and conditions of the licence govern your use of this document. When citing, please reference the published version. Take down policy While the University of Birmingham exercises care and attention in making items available there are rare occasions when an item has been uploaded in error or has been deemed to be commercially or otherwise sensitive. If you believe that this is the case for this document, please contact [email protected] providing details and we will remove access to the work immediately and investigate. Download date: 24. Jan. 2022

Welcome message from author
This document is posted to help you gain knowledge. Please leave a comment to let me know what you think about it! Share it to your friends and learn new things together.
Transcript
University of Birmingham
Mapping energy consumption in foodmanufacturingLadha-Sabur, Alia; Bakalis, Serafim; Fryer, Peter J.; Lopez-Quiroga, Estefania
DOI:10.1016/j.tifs.2019.02.034
License:Creative Commons: Attribution (CC BY)
Document VersionPublisher's PDF, also known as Version of record
Citation for published version (Harvard):Ladha-Sabur, A, Bakalis, S, Fryer, PJ & Lopez-Quiroga, E 2019, 'Mapping energy consumption in foodmanufacturing', Trends in Food Science and Technology, vol. 86, pp. 270-280.https://doi.org/10.1016/j.tifs.2019.02.034
Link to publication on Research at Birmingham portal
Publisher Rights Statement:Checked for eligibility: 13/03/2019
General rightsUnless a licence is specified above, all rights (including copyright and moral rights) in this document are retained by the authors and/or thecopyright holders. The express permission of the copyright holder must be obtained for any use of this material other than for purposespermitted by law.
•Users may freely distribute the URL that is used to identify this publication.•Users may download and/or print one copy of the publication from the University of Birmingham research portal for the purpose of privatestudy or non-commercial research.•User may use extracts from the document in line with the concept of ‘fair dealing’ under the Copyright, Designs and Patents Act 1988 (?)•Users may not further distribute the material nor use it for the purposes of commercial gain.
Where a licence is displayed above, please note the terms and conditions of the licence govern your use of this document.
When citing, please reference the published version.
Take down policyWhile the University of Birmingham exercises care and attention in making items available there are rare occasions when an item has beenuploaded in error or has been deemed to be commercially or otherwise sensitive.
If you believe that this is the case for this document, please contact [email protected] providing details and we will remove access tothe work immediately and investigate.
Download date: 24. Jan. 2022
Contents lists available at ScienceDirect
Trends in Food Science & Technology
journal homepage: www.elsevier.com/locate/tifs
Review
Mapping energy consumption in food manufacturingAlia Ladha-Sabura, Serafim Bakalisa,b, Peter J. Fryera, Estefania Lopez-Quirogaa,∗
a School of Chemical Engineering, The University of Birmingham, Edgbaston, Birmingham, B15 2TT, UKb Faculty of Engineering, The University of Nottingham, Nottingham, NG7 2RD, UK
A R T I C L E I N F O
Keywords:Energy demandFood manufacturingSustainabilityUK
A B S T R A C T
Background: The food industry is heavily dependent on fossil fuels and significantly contributes to GHG emis-sions. The global population is also growing and food demand is expected to increase a 60% by 2050. To combatenvironmental pollution and create a more sustainable food sector, energy use during manufacturing needs to bereduced.Scope and approach: To gain a better understanding of the energy employed in manufacturing and distribution offoods - within the UK and globally - energy usage within the food industry has been collected from literature andclustered by product, processing technique and transportation method.Key findings and conclusions: Energy figures show that instant coffee, milk powder, French fries, crisps and breadare among the most energy intensive food products. The thermal processes involved in their manufacturingconsumed large proportions of the total processing energy. In the meat and dairy processing sectors, energy andwater use have increased due to a rise in hygienic standards and cleaning requirements. Additionally, meatproducts are processed - and sometime over processed - to a higher degree for consumer convenience, all thisincreasing the associated energy usage for manufacture. Regarding food transportation, more than 98% of allfoods within the UK are transported by road, and the distances travelled have increased in recent years. Tertiarydistribution using rigid vehicles was the most energy intensive transportation method, while primary distribu-tion at ambient temperature was the least. Refrigerated transportation, which is more intensive than stationaryrefrigerated systems, has also increased during the past years.
1. Introduction
The food sector consumes globally approx. 200 EJ per year (FAO,2017; EIA, 2017), of which a 45% corresponds to processing and dis-tribution activities (FAO, 2011; Sims, Flammini, Puri, & Bracco, 2015).In the UK, the food processing industry is the largest single manu-facturing sector, with an annual turnover of £97.3bn and 400 k em-ployees (Food and Drink Federation, 2018). It is also the fourth largestindustrial energy user: 117 petajoules (PJ) consumed in 2017(Department for Business, Energy and Industrial Strategy, 2018a).
This energy intensity is linked to large levels of greenhouse gasemissions (GHGEs) and depleting resources (FAO, 2017). While the useof solid fuels has steadily declined, the food industry is still reliant onother fossil energy sources (FoodDrinkEurope, 2015; Department forBusiness, Energy and Industrial Strategy, 2018a,b) like natural gas andpetroleum, so current practices in food manufacture are consideredunsustainable (EEA, 2015; FAO, 2017). The environmental impact offood distribution also needs to be considered. The amount of food
transported by heavy goods vehicles (HGVs) in the UK has increased by23% since 1978 - 287 Mt only in 2017 (Department for Transport,2018) - and distances travelled have increased by more than 50%(DEFRA, 2005). The globalisation of the food industry has causedconcerns over food security and an increasing gap between suppliersand consumers. It has also initiated a debate over the environmentalimpacts and cost of food miles (Coley, Howard, & Winter, 2009; Pretty,Ball, Lang, & Morison, 2005).
In response to environmental policies and rising social concerns, thefood manufacture sector has already undertaken important transfor-mations to meet long-term reduction goals on energy and water de-mand (e.g. fuel switching, investment in new energy efficient equip-ment and low carbon technologies). Initiatives like the “Five-FoldEnvironmental Ambition” promoted by the UK Food and DrinkFederation have led to a 44% reduction (by 2014 from the 1990baseline) in CO2 emissions from energy used in manufacturing (FDF,2016). However, in a global scenario of growing population and fooddemand – the food industry will have to meet the demands of 9 billion
https://doi.org/10.1016/j.tifs.2019.02.034Received 5 June 2017; Received in revised form 31 December 2018; Accepted 6 February 2019
∗ Corresponding author.E-mail addresses: [email protected] (A. Ladha-Sabur), [email protected] (S. Bakalis), [email protected] (P.J. Fryer),
[email protected] (E. Lopez-Quiroga).
Trends in Food Science & Technology 86 (2019) 270–280
Available online 08 February 20190924-2244/ © 2019 The Authors. Published by Elsevier Ltd. This is an open access article under the CC BY license (http://creativecommons.org/licenses/BY/4.0/).
T
people by 2050 (FAO, 2017) – additional efforts (Gowreesunker,Mudie, & Tassou, 2017) are required to meet the 2050 sustainabilitygoals (80–95% energy reduction from the 1990 baseline) (EuropeanCommission, 2012).
To achieve further reductions on energy demand during foodmanufacture and distribution, hotspots must be first identified. Energydata corresponding to different food processes can be found in anumber of handbooks providing a general overview of food systems(Arendt & Zannini, 2013; Singh, 2013; Smith, Cash, Nip, & Hui, 1997;Van Alfen, 2014) or focusing on food and energy (Klemes, Smith, &Kim, 2008; Morawicki & Hager, 2014; Pimentel & Hall, 1984; Stanhill,1984; Wang, 2008) and on climate change (Paloviita & Järvelä, 2016).On the other hand, detailed, comprehensive surveys compiling energyconsumption data for a variety of food products are scarce. One of themost complete surveys on energy use within the food sector was con-ducted by Carlsson-Kanyama and Faist (2000). A large amount of dataon food processing was collected, and details about the products, pro-cesses and energy sources were often specified. Similarly, Foster et al.(2006) analysed the life cycle of many food products in a report pro-duced for DEFRA (Department of Environment, Food and Rural Affairs,UK Government) to provide UK-specific information. Energy use acrossstages of the life cycle of products was clearly shown and the mostenergy intensive stages were easy to identify. The analysis undertakenattempted to identify activities that were energy intensive, but data waspredominantly reported in terms of primary energy use, making it moredifficult to compare the energy efficiency with other literature. Ana-logous studies focused on energy consumption in the U.S. food systemwere conducted by Hendrickson (1996), who summarised energy databy food sub-sectors and also provided a deep analysis on potential re-duction measures to be adopted, and more recently by Compton, Willis,Rezaie, and Humes (2018), who updated processing energy use dataand reported more efficient processes.
Typically, studies reporting data on energy use focus on foodsgrouped by chain/sub-sector (e.g. cereals, confectionary products, etc).For example, energy use data for different dairy products has been re-ported by Cox and Miller (1986), Briam, Walker, and Masanet (2015),Ramirez, Patel, and Blok (2006a), Xu and Flapper (2009; 2011) and Xu,Flapper, and Kramer (2009). Similarly, Therkelsen, Masanet, andWorrell (2014) focused on reporting efficiency opportunities in the U.S.baking sector, Özilgen (2016) calculated energy consumption in snacksand Wojdalski et al. (2015) evaluated energy efficiency in the manu-facture of confectionary products. Processors can also be useful sourcesof data (e.g. British Sugar) as well as LCA studies - for example works byBraschkat, Patyk, Quirin, and Reinhardt (2003) on bread, Del Borghi,Gallo, Strazza, and Del Borghi (2014) on tomato products, Pardo andZufía (2012) on food preservation technologies, Rivera and Azapagic(2016) on ready meals or Konstantas, Jeswani, Stamford, and Azapagic(2018) and Konstatas, Stamford, and Azapagic (2019) on chocolate andice cream, respectively. Energy use data of single foods products is oftenpaired with specific processes, particularly for emerging technologies.Examples can be found in Jindarat, Sungsoontorn, and Rattanadecho(2014) for microwave assisted drying of coffee beans, in Sharma andPrasad (2006) for microwave drying of garlic cloves, in Atuonwu et al.(2018) for pasteurisation of orange juice using high pressure, ohmicand microwave processes, or in Moejes and van Boxtel (2017) for themanufacture of milk powder. Information on energy consumption forindivual processes is sparse. For example, Pathare and Roskilly (2016)investigated meat cooking; Liu, Zhao, and Feng (2008) studied freeze-drying; Swain (2006) assessed energy consumption in refrigerationprocesses; Motevali, Minaei, and Khoshtagaza (2011) focused ondrying; while Li, Ziara, Dvorak, and Subbiah (2018) provided energydata for packing (meat).
Overall, available energy use data for food manufacture is veryfragmented, and a single comprehensive database is lacking. To addressthis and update previous work, energy use for the processing andtransportation of food goods was obtained from the literature to isolate
energy intensive activities and provide starting points for energy re-duction measures. This data can be also used to feed sustainabilityanalysis tools such as Life Cycle Assessment (LCA) and carbon or waterfootprint, helping to assess and secure the environmental performanceof the whole food chain. Processing energy use figures were clusteredboth by product (Section 3 and Appendices A-G in the SupplementaryData) and by technique (see Appendix H, Supplementary Data). Datacollected for transportation methods was analysed in terms of distancesand product carried (Section 4 and Appendix I in the SupplementaryData). Packaging, the retail sector and consumer activities were outsidethe scope of this study. General and UK specific trends were identifiedwhere possible (Section 5). The survey also exposed areas where data isnot available.
2. Methodology framework
A literature survey was carried out to collect energy consumptionfor the food manufacturing sector for the time period 1980 to 2015.ScienceDirect was the main source for published papers, and Knovelwas used for online access to books. Full access to some publicationswas obtained from the authors (Carlsson-Kanyama & Faist, 2000; VanAlfen, 2014)). Specific energy consumption (SEC) data for products,processes and food distribution was collected based on product-basedenergy intensity (PEI) metrics (Briam et al., 2015), where energy input inmegajoules (MJ) was divided by product output in kilograms (kg) -energy intensity expressed in different units was converted when pos-sible. This format was chosen to provide a consistent comparative basis.Data was manipulated as little as possible to minimise errors as SECvalues were collected for a large range of products, processes, locationsand dates. LCA (Life Cycle Assessment) studies reporting lumped SECvalues were not considered for this analysis. Nor were energy auditsthat reported overall energy use from processing plants. This searchyielded a total of 44 publications, with the Netherlands, New Zealandand Sweden being the countries where most studies were found.
Energy studies used different accounting methods and systemboundary conditions when quantifying a product or activity. This re-sulted in a large range of SEC values where the steps and processesinvolved were unknown. The accuracy of data was also often notmentioned. Different energy sources were reported, and these were keptin their original format to analyse the ratio of each type used for a givenactivity. Equipment details were rarely provided and often details likethe location of the study, the processes included, the production scaleand the energy sources were not specified, as also observed by Xu andFlapper (2011). Energy intensities of products and processes obtainedby studying the total energy consumed by processing plants (Xu &Flapper, 2011) did not always account for differences in product mixes,locations, energy sources, production scale and equipment age(Carlsson-Kanyama & Faist, 2000; Van Alfen, 2014). These factors couldhave a large impact on SEC values obtained. Allocating SEC values formulti-product activities was also particularly complex; as an example,whey production shares processes with cheese making. To quantify SECvalues for whey production, some researchers included energy con-sumed by those shared operations while others excluded them (Fosteret al., 2006).
Once the data set was collated, the following information was re-corded: the date and location of the study, product description, pro-cesses involved, energy sources, and bibliographic reference. Beforeanalysis, the data was sorted into the following groups: prior to 2000,2000–2004, and 2005–2015, to account for changes in technologies,processing and fuel efficiencies, and structural changes within thesector. A large number of energy studies were conducted in the 1970'sand 1980's - Berry and Makino (1974); Beech (1980); Cleland, Earle,and Boag (1981); Slesser and Wallace, (1982); Stanhill (1984);Pimentel and Hall (1984); Cox and Miller (1986) - and it is noteworthythat recent publications, such as Ramirez et al. (2006a), Van Alfen(2014) or Xu et al. (2009), still report those figures due to the lack of
A. Ladha-Sabur, et al. Trends in Food Science & Technology 86 (2019) 270–280
271
more recent data. Average energy consumption values for processes andproducts were only calculated when more than two replicates wereobtained from literature. Additionally, only energy expressed in its finalform was analysed as conversion efficiencies can vary. For example, theefficiency of electricity production can differ based on the type of fuel,the power plant capacity and the technology employed for production(OECD, 2012). Finally, food products were clustered in seven cate-gories: grains and oilseed milling, sugar and confectionary, fruit andvegetable, dairy, bakery, meat and others - SEC values are shown inAppendices A-G. Energy use figures organised by process are listed inAppendix H, while transportation data is presented in Appendix I. Allthe Appendices are available as Supplementary Data.
3. Energy consumption by product
Total energy consumption data in the literature was reported withdifferent combinations of energy sources. In some cases, the energysource was not specified. Therefore, results are presented in three dif-ferent formats to allow for comparison:
• Electricity and thermal energy• Electricity, fuel and steam energy• Total energy, source unspecified
Unless stated otherwise, all energy consumption figures in this workdo not include packaging.
3.1. Grains and oilseed milling - Appendix A
Apart from flour milling, energy consumption data in this sector wasvery sparse. Between 2005 and 2015, an average of 0.42 MJ/kg ofelectricity and 0.03 MJ/kg of fuel was reported for the milling process(Appendix A). Rice required the least amount of energy and was quotedto consume 0.43 MJ/kg in 2013. Data from multiple sources from 1975to 1996 reported 66 MJ/kg was used for manufacture of breakfastcereals (Appendix A), including grinding, milling, wetting, drying andbaking. Aguilera, Simpson, Welti-Chanes, Aguirre, and Barbosa-Cánovas (2011) confirmed the findings on breakfast cereals and dis-cussed milling of flour as an energy intensive process. Three millingmethods are commonly used: wet, semi-dry and dry. Dry milling is themost energy efficient process while wet milling is energy intensive(Arendt & Zannini, 2013). This suggests that the low SEC values ob-tained from literature might be for dry milling.
3.2. Sugar and confectionery - Appendix B
SEC data for popular confectionery products like chocolates andsweets is lacking. Average SEC values for the production of sugar frombeets and sugar cane are presented in Appendix B. No data prior to2005 was found. The average fuel consumption appears to decreaseover time while slightly more electricity is used. As data shows, theaverage total energy (6.90 MJ/kg) was higher than the sum of averageelectricity and fuel use within the same time frame (3.26 MJ/kg). Sugarextraction data from 1986 ranged from 2.3 to 26 MJ/kg.
In 2010, 160 million kg of sugar was produced globally, with 20%produced from sugar beets. A Japanese sugar factory reported that 65%of its thermal energy was used by the evaporative crystalliser. Meltingand centrifugal drying consumed 25% and 22% of total electricity, re-spectively (The Energy Conservation Centre, 2016). However, this en-ergy demand might be decreased by using multi-stage evaporation andheat exchanger networks. An alternative energy-reduced sugar manu-facturing process also exists: the juice purification step is removed andevaporative crystallisation of sugar is replaced by cooling crystal-lisation from concentrated raw juice (Klemes, 2013). Energy can also berecovered by using biofuels like bagasse, the lignocellulose residueobtained from sugar cane post extraction (Singh, 2013).
3.3. Fruits and vegetables - Appendix C
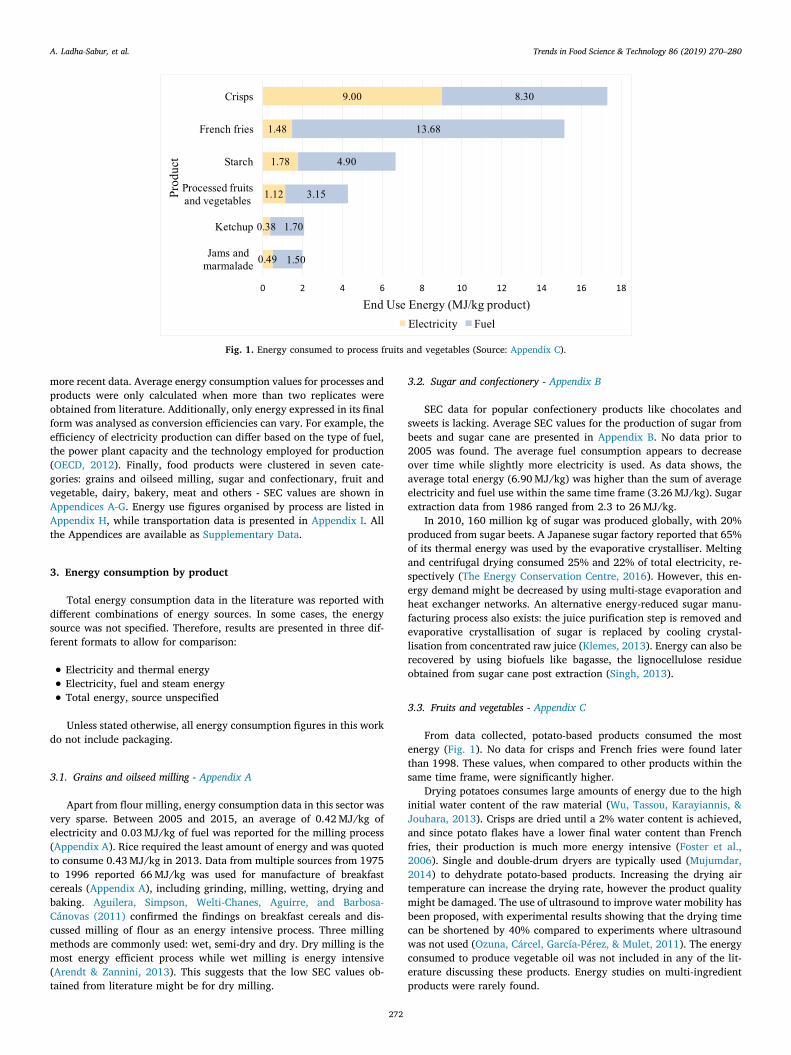
From data collected, potato-based products consumed the mostenergy (Fig. 1). No data for crisps and French fries were found laterthan 1998. These values, when compared to other products within thesame time frame, were significantly higher.
Drying potatoes consumes large amounts of energy due to the highinitial water content of the raw material (Wu, Tassou, Karayiannis, &Jouhara, 2013). Crisps are dried until a 2% water content is achieved,and since potato flakes have a lower final water content than Frenchfries, their production is much more energy intensive (Foster et al.,2006). Single and double-drum dryers are typically used (Mujumdar,2014) to dehydrate potato-based products. Increasing the drying airtemperature can increase the drying rate, however the product qualitymight be damaged. The use of ultrasound to improve water mobility hasbeen proposed, with experimental results showing that the drying timecan be shortened by 40% compared to experiments where ultrasoundwas not used (Ozuna, Cárcel, García-Pérez, & Mulet, 2011). The energyconsumed to produce vegetable oil was not included in any of the lit-erature discussing these products. Energy studies on multi-ingredientproducts were rarely found.
Fig. 1. Energy consumed to process fruits and vegetables (Source: Appendix C).
A. Ladha-Sabur, et al. Trends in Food Science & Technology 86 (2019) 270–280
272
3.4. Dairy - Appendix D
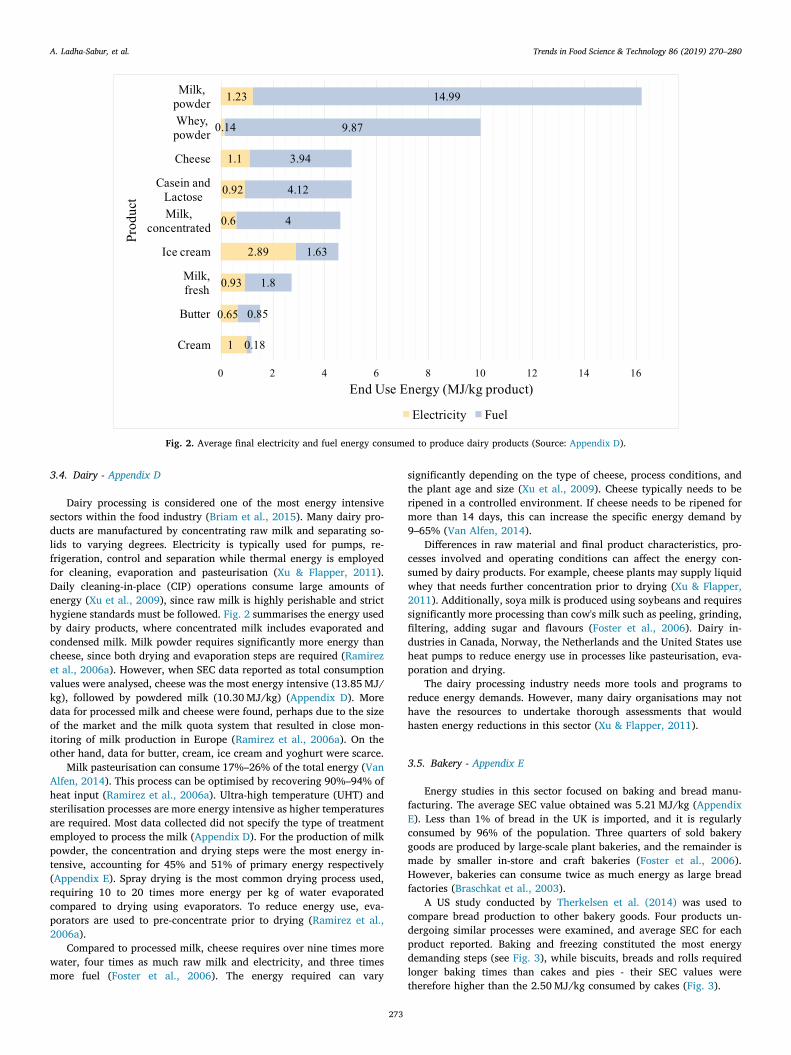
Dairy processing is considered one of the most energy intensivesectors within the food industry (Briam et al., 2015). Many dairy pro-ducts are manufactured by concentrating raw milk and separating so-lids to varying degrees. Electricity is typically used for pumps, re-frigeration, control and separation while thermal energy is employedfor cleaning, evaporation and pasteurisation (Xu & Flapper, 2011).Daily cleaning-in-place (CIP) operations consume large amounts ofenergy (Xu et al., 2009), since raw milk is highly perishable and stricthygiene standards must be followed. Fig. 2 summarises the energy usedby dairy products, where concentrated milk includes evaporated andcondensed milk. Milk powder requires significantly more energy thancheese, since both drying and evaporation steps are required (Ramirezet al., 2006a). However, when SEC data reported as total consumptionvalues were analysed, cheese was the most energy intensive (13.85 MJ/kg), followed by powdered milk (10.30 MJ/kg) (Appendix D). Moredata for processed milk and cheese were found, perhaps due to the sizeof the market and the milk quota system that resulted in close mon-itoring of milk production in Europe (Ramirez et al., 2006a). On theother hand, data for butter, cream, ice cream and yoghurt were scarce.
Milk pasteurisation can consume 17%–26% of the total energy (VanAlfen, 2014). This process can be optimised by recovering 90%–94% ofheat input (Ramirez et al., 2006a). Ultra-high temperature (UHT) andsterilisation processes are more energy intensive as higher temperaturesare required. Most data collected did not specify the type of treatmentemployed to process the milk (Appendix D). For the production of milkpowder, the concentration and drying steps were the most energy in-tensive, accounting for 45% and 51% of primary energy respectively(Appendix E). Spray drying is the most common drying process used,requiring 10 to 20 times more energy per kg of water evaporatedcompared to drying using evaporators. To reduce energy use, eva-porators are used to pre-concentrate prior to drying (Ramirez et al.,2006a).
Compared to processed milk, cheese requires over nine times morewater, four times as much raw milk and electricity, and three timesmore fuel (Foster et al., 2006). The energy required can vary
significantly depending on the type of cheese, process conditions, andthe plant age and size (Xu et al., 2009). Cheese typically needs to beripened in a controlled environment. If cheese needs to be ripened formore than 14 days, this can increase the specific energy demand by9–65% (Van Alfen, 2014).
Differences in raw material and final product characteristics, pro-cesses involved and operating conditions can affect the energy con-sumed by dairy products. For example, cheese plants may supply liquidwhey that needs further concentration prior to drying (Xu & Flapper,2011). Additionally, soya milk is produced using soybeans and requiressignificantly more processing than cow's milk such as peeling, grinding,filtering, adding sugar and flavours (Foster et al., 2006). Dairy in-dustries in Canada, Norway, the Netherlands and the United States useheat pumps to reduce energy use in processes like pasteurisation, eva-poration and drying.
The dairy processing industry needs more tools and programs toreduce energy demands. However, many dairy organisations may nothave the resources to undertake thorough assessments that wouldhasten energy reductions in this sector (Xu & Flapper, 2011).
3.5. Bakery - Appendix E
Energy studies in this sector focused on baking and bread manu-facturing. The average SEC value obtained was 5.21 MJ/kg (AppendixE). Less than 1% of bread in the UK is imported, and it is regularlyconsumed by 96% of the population. Three quarters of sold bakerygoods are produced by large-scale plant bakeries, and the remainder ismade by smaller in-store and craft bakeries (Foster et al., 2006).However, bakeries can consume twice as much energy as large breadfactories (Braschkat et al., 2003).
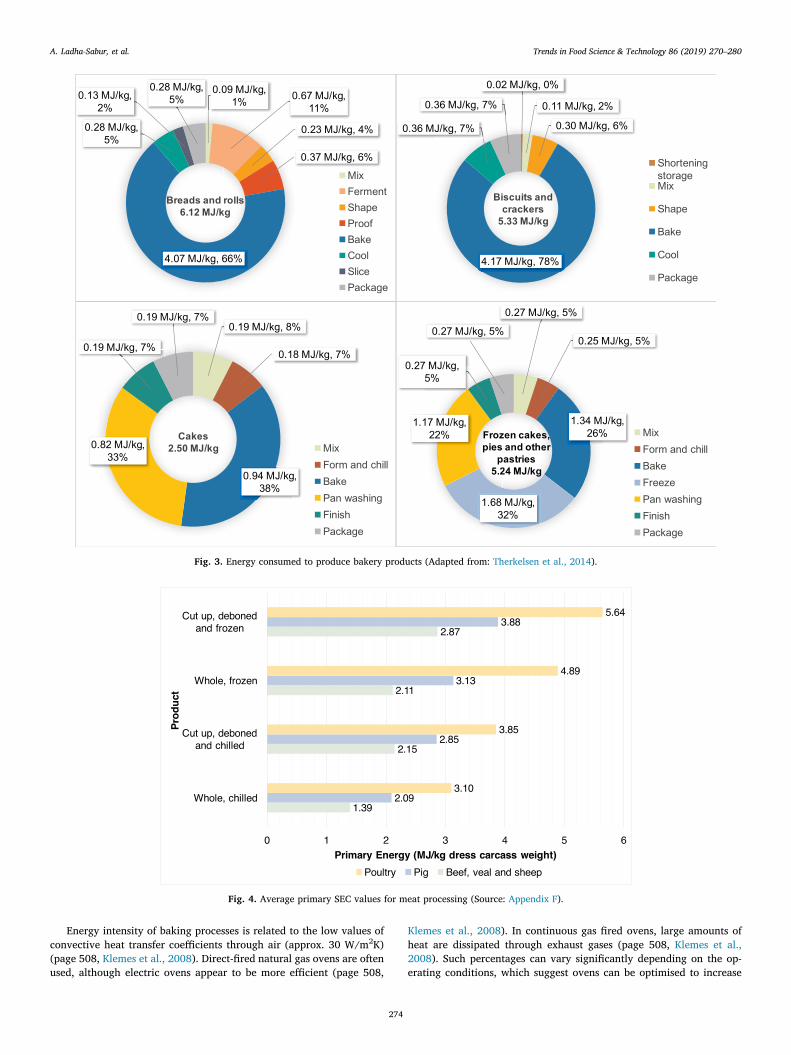
A US study conducted by Therkelsen et al. (2014) was used tocompare bread production to other bakery goods. Four products un-dergoing similar processes were examined, and average SEC for eachproduct reported. Baking and freezing constituted the most energydemanding steps (see Fig. 3), while biscuits, breads and rolls requiredlonger baking times than cakes and pies - their SEC values weretherefore higher than the 2.50 MJ/kg consumed by cakes (Fig. 3).
Fig. 2. Average final electricity and fuel energy consumed to produce dairy products (Source: Appendix D).
A. Ladha-Sabur, et al. Trends in Food Science & Technology 86 (2019) 270–280
273
Energy intensity of baking processes is related to the low values ofconvective heat transfer coefficients through air (approx. 30 W/m2K)(page 508, Klemes et al., 2008). Direct-fired natural gas ovens are oftenused, although electric ovens appear to be more efficient (page 508,
Klemes et al., 2008). In continuous gas fired ovens, large amounts ofheat are dissipated through exhaust gases (page 508, Klemes et al.,2008). Such percentages can vary significantly depending on the op-erating conditions, which suggest ovens can be optimised to increase
Fig. 3. Energy consumed to produce bakery products (Adapted from: Therkelsen et al., 2014).
Fig. 4. Average primary SEC values for meat processing (Source: Appendix F).
A. Ladha-Sabur, et al. Trends in Food Science & Technology 86 (2019) 270–280
274
energy efficiency (Khatir, Paton, Thompson, Kapur, & Toropov, 2013;Therdthai, Zhou, & Adamczak, 2002), e.g. by recirculating part of theoven exhaust gas. However, this should be done without impeding theproduct safety and quality. Large amounts of hot water and steam arealso consumed in baking plants. Steam is used for temperature andhumidity control in fermentation boxes and rooms, and cleaningequipment. Boiler systems can be optimised using different measuressuch as proper sizing and process control.
3.6. Meat and fish - Appendix F
In 2001, the UK meat sector consumed 32 petajoules (PJ) of primaryenergy. UK electricity usage increased by 2.9% annually from 1990 to2001 from increased demands for refrigeration and motor drive power(Ramirez, Patel, & Blok, 2006b). An increase in the consumption ofpoultry and processed meat products has been observed also in Europe -9% rise from 2007 to 2014 according to (Marquer, Rabade, & Forti,2015). Processes that use large proportions of electricity and fuels indifferent meat sectors were reported by Ramirez et al. (2006b): poultryslaughtering consumes more energy than other meats due to hair andfeather removal, and singeing operations. An increase in the use ofautomated equipment, temperature control and hot cleaning water hasraised energy consumption in slaughterhouses.
Meat products are frozen, cut and deboned more often to provideconvenient products for consumers. These processes are compared inFig. 4. There was a lack of SEC data in this sector so primary energieswere employed. Final energy values could not be calculated as the studywas carried out in different countries.
Typically, meat frozen products consumed more energy than chilledones (Fig. 4). Poultry products were the most energy intensive whilebeef, veal and sheep were the least. Greater refrigeration requirementsand higher temperatures during hard scalding make poultry productsmore energy demanding. Conversely, to produce 1 kg of broiler meat,poultry feeding requirements are 3.1 kg of dry matter feed, compared to6.3 kg for pigs and 24 kg for beef cattle (Ramirez et al., 2006b). Vacuumpacked and ready-to-eat products are also raising energy use. As thissector is largely influenced by consumer preferences, they must beconsidered when analysing energy consumption to better understandthe progress made in energy efficiency. Also, life-cycle studies rarelyfocus on meat processing, as stated by Roy et al. (2009).
Energy studies on seafood processing were scarce. Average SECvalues for fish processing were 0.38 MJ/kg electricity and 1.87 MJ/kgfuel (Appendix F), although the accuracy of the analysis is uncertaindue to the limited data found.
3.7. Others - Appendix G
Coffee was the most energy intensive product in this category. TheUK, with a preference for medium roasted and instant coffee (Chanakya& De Alwis, 2004), consumes approximately 95 millions of coffee cupsper day (The Bristish Coffee Association, 2018). Coffee beans, obtainedfrom primary processing, are sent for secondary processing, which in-cludes dehulling, roasting and grinding. Roasted coffee consumes anadditional 0.4 MJ/kg of electricity and fuel compared to non-roastedcoffee (Wang, 2014). A continuous roaster consumes approximately
0.5 MJ/kg green coffee compared to a batch roaster that uses 1.84 MJ/kg (Okada, Rao, Lima, & Torloni, 1980). While these energy figures donot appear significant, data collected in 2013 reported a total of23.24 MJ/kg for the processing of coffee (Lillywhite, Sarrouy,Davidson, May, & Plackett, 2013). Instant coffee, produced from ter-tiary processing, consumed 2.70 MJ/kg of electricity and 45 MJ/kg offuel in 1980 (Cleland et al., 1981), while a more recent study(Morawicki & Hager, 2014) reported 8.3 MJ/kg of electricity and30.2 MJ/kg of fuel. Processing coffee requires a much larger quantity ofthermal energy compared to electricity. The thermal energy used byeach unit operation to produce instant coffee as reported by (Okadaet al., 1980) is shown in Table 1. Instant coffee is more energy intensivedue to the spray drying process. Freeze-drying is also used for instantcoffee production and it can consume 0.42 MJ/kg to freeze and as muchas 31 MJ/kg to dry (Appendix H). A combined microwave-hot airspouted bed was recently explored as a novel drying method and pro-duced good quality coffee (Jindarat et al., 2014). Developing goodflavour is crucial in the coffee industry, however, energy reductionsmust be made during the extraction, concentration and drying steps.
4. Transportation
Most of the research found focused on the transportation of un-processed goods. Centralised and local food systems were also oftencompared to determine the validity of food miles. While reducing foodmiles lowers transport-related energy consumption, Carlsson-Kanyama(1998) showed that food miles may be irrelevant, in that farm-gateemissions for the production, storage and transportation of tomatoesfrom Israel to Sweden were lower than those for local production in UKglasshouses. According to this, the supply chain might be better eval-uated as a whole. Tassou, De-Lille, and Ge (2009) summarised theaverage energy consumed at different stages of food distribution in theUK. Articulated vehicles (32t to 44t) are typically used for primary andsecondary distribution, and account for 80% of the tkm of all goodmovements in the UK. Rigid vehicles up to 32t transport goods in ter-tiary distribution and are the most energy intensive. Mixed temperaturedistribution is energy intensive as heat transfer between differentcompartments must be controlled. Additionally, refrigeration systemsmust be designed to minimise disruptions from activities like loadingproducts and opening doors (Tassou et al., 2009).
The energy consumed during temperature-controlled distributionvaried with the distance, type of vehicle, distribution, and product(chilled or frozen). While a higher temperature difference is needed forfrozen products, chilled foods can consume more energy. Higher airflows are needed for uniform temperature distribution, products respireand temperature control requirements are tougher. The varied en-vironmental conditions and vibrations from the road were also found toresult in higher emissions for transportation refrigeration systemscompared to stationary systems. As major retailers in the UK aremaking more home deliveries and quality expectations are increasing,light vehicle refrigerated transportation must be optimised (Tassouet al., 2009). More than 98% of all foods within the UK are transportedby road. Regional distribution centres (RDCs) are therefore often lo-cated next to a motorway (Jones, 2002).
Data corresponding to energy intensity of road transportationalongside other common modes of transport can be found in VanHauwermeiren, Coene, Engelen, and Mathijs (2007). According to thissource, air transportation was the most energy intensive while inlandbulk transportation by vessel was the least. The transportation distancewas also compared to model transportation between neighbouringcountries, continental and international transport. Transportation byelectric freight train was more energy intensive than by truck, however,SEC values are dependent on factors like the transportation speed, loadfactor and weather condition (Van Hauwermeiren et al., 2007).Transportation to and from the loading points was not included.
The energy use of railroad transportation has decreased significantly
Table 1Thermal energy required to produce instant coffee (Adapted from: Okada et al.,1980).
Process Units Thermal energy
Roasting MJ/kg product∗ 3.73Extraction MJ/kg product∗ 8.50Concentration MJ/kg product∗ 7.45Spray drying MJ/kg product∗ 21.10
∗ Instant coffee.
A. Ladha-Sabur, et al. Trends in Food Science & Technology 86 (2019) 270–280
275
over the years. Road freight vehicles are now considered more energyintensive, and the number of electric freight trains in the EU is rising.GHG emissions are lowered by the reduction of road traffic and the useof electric powered vehicles (Gazzard, 2014).
5. UK energy consumption trends
Consumer preferences and regulations have influenced the energyrequirements, structure and level of concentration of the UK processingindustry. For example, through market reform, the number of sugarfactories in Europe has decreased and the processing capacity of beetshas increased. The UK is one of the top producers of sugar beet, growingaround 8 million tonnes per year (British Sugar, 2018). As beets have awater content of 75% by mass, significant amounts of energy areneeded to produce dry crystalline sugar (Appendix B).
Potatoes are important vegetables in the UK food market and ap-proximately 6 million tonnes are processed each year (Foster et al.,2006). As previously mentioned, drying potatoes is energy intensive. Interms of dairy products, cheese is the second most consumed productafter milk, particularly cheddar, and cheese production continues toincrease (Foster et al., 2006). In 2000, 30% of the net fuel use in the UKdairy processing sector was consumed by drying and concentrationprocesses (Ramirez et al., 2006a). The UK sector was less energy in-tensive in 2005 compared to Netherlands, Denmark and Norway, par-tially due to a lower production of energy-intensive products. However,UK GHGEs were the highest, probably due to different shares of energysources (Xu et al., 2009).
In the 2017, energy used in food processing was mainly obtainedfrom natural gas (58%) and electricity (34%) (Department for Business,Energy and Industrial Strategy, 2018a), accounting petroleum and coalfor the rest.
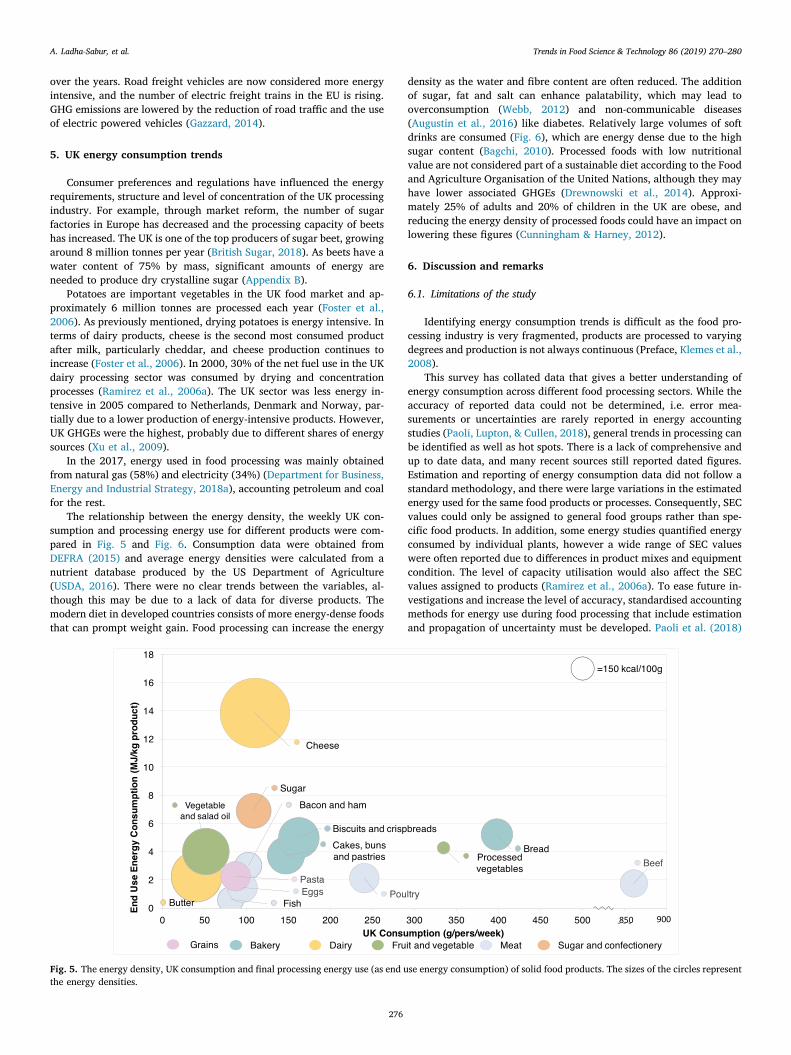
The relationship between the energy density, the weekly UK con-sumption and processing energy use for different products were com-pared in Fig. 5 and Fig. 6. Consumption data were obtained fromDEFRA (2015) and average energy densities were calculated from anutrient database produced by the US Department of Agriculture(USDA, 2016). There were no clear trends between the variables, al-though this may be due to a lack of data for diverse products. Themodern diet in developed countries consists of more energy-dense foodsthat can prompt weight gain. Food processing can increase the energy
density as the water and fibre content are often reduced. The additionof sugar, fat and salt can enhance palatability, which may lead tooverconsumption (Webb, 2012) and non-communicable diseases(Augustin et al., 2016) like diabetes. Relatively large volumes of softdrinks are consumed (Fig. 6), which are energy dense due to the highsugar content (Bagchi, 2010). Processed foods with low nutritionalvalue are not considered part of a sustainable diet according to the Foodand Agriculture Organisation of the United Nations, although they mayhave lower associated GHGEs (Drewnowski et al., 2014). Approxi-mately 25% of adults and 20% of children in the UK are obese, andreducing the energy density of processed foods could have an impact onlowering these figures (Cunningham & Harney, 2012).
6. Discussion and remarks
6.1. Limitations of the study
Identifying energy consumption trends is difficult as the food pro-cessing industry is very fragmented, products are processed to varyingdegrees and production is not always continuous (Preface, Klemes et al.,2008).
This survey has collated data that gives a better understanding ofenergy consumption across different food processing sectors. While theaccuracy of reported data could not be determined, i.e. error mea-surements or uncertainties are rarely reported in energy accountingstudies (Paoli, Lupton, & Cullen, 2018), general trends in processing canbe identified as well as hot spots. There is a lack of comprehensive andup to date data, and many recent sources still reported dated figures.Estimation and reporting of energy consumption data did not follow astandard methodology, and there were large variations in the estimatedenergy used for the same food products or processes. Consequently, SECvalues could only be assigned to general food groups rather than spe-cific food products. In addition, some energy studies quantified energyconsumed by individual plants, however a wide range of SEC valueswere often reported due to differences in product mixes and equipmentcondition. The level of capacity utilisation would also affect the SECvalues assigned to products (Ramirez et al., 2006a). To ease future in-vestigations and increase the level of accuracy, standardised accountingmethods for energy use during food processing that include estimationand propagation of uncertainty must be developed. Paoli et al. (2018)
Fig. 5. The energy density, UK consumption and final processing energy use (as end use energy consumption) of solid food products. The sizes of the circles representthe energy densities.
A. Ladha-Sabur, et al. Trends in Food Science & Technology 86 (2019) 270–280
276

has allocated a 25% uncertainty to useful energy demand of the UKindustrial sector – this needs to be broken down for the food industrysector.
No account has been taken on the fuel mix for energy generation.This can vary widely between countries: Swedish electricity is almostentirely generated through hydropower and nuclear energy (Fosteret al., 2006). In contrast, the UK food manufacturing sector heavilyrelies on fossil fuels – natural gas accounts for 58% of energy consumedin 2017, with coal and petroleum representing a 6% (Department forBusiness, Energy and Industrial Strategy, 2018a) - and in consequence itgenerates more GHGEs (a total of 23 Mt CO2e in 2015 (DEFRA, 2018a)).Figs. 2, 3 and 5 also reflect this strong dependency on fossil fuels. Whilemore energy intensive activities may not necessarily result in higherlevels of GHGEs, effective energy management is also important to re-duce costs and alleviate risks associated with changes in energy pricesand supply shortages (Briam et al., 2015).
Little data has been found on ready-to-eat meals that are increas-ingly popular and typically need to be cooked, preserved, and chilled orfrozen (Pardo & Zufía, 2012). The meat industry produces a widevariety of products, however a detailed analysis was not possible due tothe lack of data. While some data was available for meat and poultry,little data on seafood products was found. Similarly, food productswithin the grain and oilseed milling, and sugar and confectionery ca-tegories were difficult to find. To better understand how resources areused in the food processing industry, more support is needed fromproducers to allow site-specific data to be obtained (Andersson,Ohlsson, & Olsson, 1998). The energy consumed to manufacture morecomplex meals also needs to be quantified.
6.2. Phase change processes
Thermal processes are energy intensive and responsible for a largeproportion of the energy consumed in food processing. According toKlemes et al. (2008), p. 140, the US food and drink industry consumes647 PJ for process heating and 73 PJ for refrigeration. In the UK, it hasbeen estimated that about 68% of the energy is used for process andspace heating, 8% is electric heating and 6% corresponds to refrigera-tion (AEA Energy and Environment, 2007). Heat is extensively used in
heat preservation techniques (i.e. sterilisation and pasteurisation, seeAppendix H).
Many other food thermal processes require first the addition ofwater to the product followed by its removal, which usually involves aphase change. For example, baking, drying and freeze-drying are en-ergy intensive (see Appendix H) operations due to the high latent heatof vaporisation and sublimation of water present in the raw material oradded in during processing (freeze-drying involves both phasechanges). Consequently, products that are freeze-dried - like instantcoffee (average of 50.20 MJ/kg, Appendix H) or milk powder (averageof 16.22 MJ/kg, Appendix E) - or dried - such as French fries (average of15.16 MJ/kg, Appendix D) and crisps (average of 17.30 MJ/kg,Appendix D) - consume significant amounts of energy. The thermalefficiency of industrial dryers is also low, so large amounts of energy arewasted (Wang, 2008). Commonly this energy is supplied by fossil fuelsrather than electricity, as indicated in Fig. 1. Although electricity andgas show very similar high performance in terms of efficiency andflexibility of use, the lower price of gas might explain its preferred use -average prices of 1.8 pence/kWh and 8.3 pence/kWh for gas andelectricity, respectively in 2017 as reported by the UK Department forBusiness, Energy and Industrial Strategy (2018b).
6.3. Energy - efficient processes
Energy reductions can be made through process optimisation,technological and manufacturing behavioural changes (Tassou et al.,2014). The food industry could use methodologies employed in otherindustries like pinch analysis, where minimum process heating andcooling needs are determined prior to design (Ahmed & Rahman,2012). An example of the potential reductions of this approach is givenin Walmsley, Atkins, Walmsley, Philipp, and Peesel (2018), wheresavings up to 51% in thermal energy were estimated for production ofmilk powder. However, small food producers and processors are im-plementing energy optimisation strategies at a slower rate than theircounterparts in other similarly sized industries (page 144, Klemes et al.,2008). For example, ca. 2300 small and medium sized enterprisesproduce bakery products in the UK (DEFRA, 2018b), and producing at asmaller scale is more energy intensive. Baking accounts for the majority
Fig. 6. The energy density, UK consumption and processing energy use (as end use energy consumption) of liquid food products. The sizes of the circles represent theenergy density.
A. Ladha-Sabur, et al. Trends in Food Science & Technology 86 (2019) 270–280
277
of the energy consumed in this sector, and direct-fired natural gas ovensare still popular. Replacing them with electric ovens could help to re-duce energy use. A rise in hygiene standards and cleaning requirementshas increased energy use in the dairy and meat processing sectors. Thedairy industry continues to be energy intensive due to the thermalprocesses employed to ensure microbial safety, however the use offalling film evaporators, heat recovery systems (Ramirez et al., 2006a)or process integration and optimisation (Fritzson & Berntsson, 2006)can significantly reduce energy demand.
More energy efficient process technologies can also provide energysavings. For example, supercritical extraction can replace concentrationthrough boiling (Fellows, 2009), the use of membrane filtration(Ramirez et al., 2006a) can increase efficiency of dairy processes andosmotic pre-treatments can help to decrease the heating loads and timesin drying processes (Prosapio & Norton, 2017). Emerging technologies,e.g. high pressure processing (HPP) (Juliano et al., 2012), ohmic (OH)(Barba et al., 2016) or microwave heating (MWH) (Jindarat et al.,2014), might increase the efficiency of food processes, while reducingthe use of non-renewable resources (Barba et al., 2016). Their wide-scale application in the industry is limited by investment costs (Barbaet al., 2016; Jermann, Koutchma, Margas, Leadley, & Ros-Polski, 2015),although they are slowly replacing and complementing conventionalpreservation technologies (Barba et al., 2016). For instance, microwaveis used for drying, thawing or pasteurising (Barba et al., 2016; Atuonwuet al., 2018), an it is used as part of hybrid processing technologies too,e.g. or microwave -assisted freezing (Xanthakis et al., 2018, pp.176–181). Non-thermal processes, like HPP, typically need less waterand heat and could have a lower environmental impact (Atuonwu et al.,2018). Furthermore, the required energy source is electricity that couldbe generated from renewable resources, like biomass from food wastes(Pardo & Zufía, 2012). According to Jermann et al. (2015), ultravioletlight (UV) (Koutchma, Popović, Ros-Polski, & Popielarz, 2016), MWHand HPP technologies have the greatest commercialisation potential.On-going research focuses on reaching a complete understanding ofprocess conditions and adapting HPP microbial safety protocols.
6.4. Decentralised food chains – distributed food manufacture
Energy is intensively used both for manufacture and producttransport to the consumer. However, it might be possible to balance theintensity of the most energy demanding processes by decreasing theenergy use at the transportation stage. For example, manufacturing ofconvenience food typically requires more energy, but it could reduceenergy demand for storage and preparation in the retail and residentialsector. Dried food products are also lighter to transport and their shelflife is extended, sometimes without the need of refrigeration (Ramirezet al., 2006b), e.g. transport of tea bags is more efficient than transportof bottled water. Distributed manufacture methods, in which only va-luable ingredients are transported and other ingredients added later atthe local level may lead to more energy efficient food chains (Rooset al., 2016). Such use of distributed manufacture will create entirelynew decentralised food supply chains. In this decentralised food man-ufacture paradigm, techno-economic assessment tools are needed todecide which processes are the most efficient ones (Almena, Lopez-Quiroga, Theodoropoulos, Fryer, & Bakalis, 2017). LCA studies thatevaluate the whole food chain will also be critical to understand howspecific processes can impact other stages of the life cycle.
6.5. Future challenges
In addition to the environmental impact, the current global foodsystem also creates socio-economic challenges such as market distor-tions and a dependence on food imports. However, the implications ofcreating a more decentralised/localised food supply system also need tobe assessed (Almena et al., 2017). Findings that could improve thesustainability of the food system must reach a wider audience,
including consumers and policy-makers, to allow concerned individualsto make more informed decisions. Recently, France has adopted a foodlabelling system, Nutri-Score (Santé Publique France, 2018) that allowsconsumers to compare nutritional characteristics in a standardisedbasis. A similar approach to energy efficiency labelling might beadopted in foods, aiding in the lifestyle changes needed to reduce en-ergy use in the food industry. To make this possible, a greater colla-borative effort is needed to report energy use data not only at proces-sing stages but all across the food chain. Policies defining standardaccounting basis must be developed to this purpose.
7. Conclusions
Energy demand quantification during food manufacturing and dis-tribution is key to identify intensive activities, providing useful in-formation for policy and industry decision makers. By targeting thoseprocesses that represent a hot spot (such as those involving phasechanges) significant reductions on the sector energy consumption canbe achieved.
Despite the variability on the energy demand figures for differentproducts and processes available in the consulted sources, a database ofenergy consumption has been created from literature (Appendicesavailable as Additional Material) and general trends on consumptiondue to manufacturing and transportation methods have been identified,paying special attention to the UK food system. The most energy in-tensive food products are powders (i.e. instant coffee and milk powder),fried goods (i.e. French fries and crisps) and bread, all involvingthermal processes such freeze-drying or drying in their manufacture; inaddition, hygienic and cleaning requirements are the main sources ofwater consumption and waste in the meat and dairy industries.
In terms of transportation, current trends point towards more de-centralised/distributed supply systems and to local production.However, the environmental benefits of these changes are not alwaysclear. Global environmental assessment tools (such LCA, carbon andwater footprint) that take the whole food chain into consideration willbe increasingly important.
Overall, it is necessary to standardise reported consumption dataacross the sector and policy efforts must be devoted to this task ur-gently. Only then will it be possible to develop efficient strategies tooptimise the whole food system, allocate resources more effectively andreduce both waste and fossil fuel dependency.
Acknowledgments
Authors acknowledge financial support received from the RCUKCentre for Sustainable Energy Use in Food Chains (EPSRC grant no. EP/K011820/1).
Supplementary data
Supplementary data to this article (Appendices A–I) can be foundonline at https://doi.org/10.1016/j.tifs.2019.02.034.
References
AEA Energy and Environment (2007). Resource efficiency in food chains. Report to Defra,ED05226. Oxford, UK. http://sciencesearch.defra.gov.uk/Document.aspx?Document=WU0103_4830_FRA.pdf, Accessed date: 15 November 2018.
Aguilera, J., Simpson, R., Welti-Chanes, J., Aguirre, D., & Barbosa-Cánovas, G. (2011).Food engineering interfaces. New York, U.S.A: Springer.
Ahmed, J., & Rahman, M. (2012). Handbook of food process design. Chichester, UK: Wiley-Blackwell.
Almena, A., Lopez-Quiroga, E., Theodoropoulos, C., Fryer, P. J., & Bakalis, S. (2017).Modelling, simulation and economical evaluation of dry food manufacture at dif-ferent production scales. Computer Aided Chemical Engineering. 40, 787–792. https://doi.org/10.1016/B978-0-444-63965-3.50133-1.
Andersson, K., Ohlsson, T., & Olsson, P. (1998). Screening life cycle assessment (LCA) oftomato ketchup: a case study. Journal of Cleaner Production, 6(3–4), 277–288. https://doi.org/10.1016/S0959-6526(98)00027-4.
A. Ladha-Sabur, et al. Trends in Food Science & Technology 86 (2019) 270–280
278
Arendt, E., & Zannini, E. (2013). Cereal grains for the food and beverage industries. Oxford,UK: Woodhead Pub.
Atuonwu, J. C., Leadley, C., Bosman, A., Tassou, S. A., Lopez-Quiroga, E., & Fryer, P. J.(2018). Comparative assessment of innovative and conventional food preservationtechnologies: Process energy performance and greenhouse gas emissions. InnovativeFood Science & Emerging Technologies, 50, 174–187. https://doi.org/10.1016/j.ifset.2018.09.008.
Augustin, M. A., Riley, M., Stockmann, R., Bennett, L., Kahl, A., Lockett, T., et al. (2016).Role of food processing in food and nutrition security. Trends in Food Science &Technology, 56, 115–125. https://doi.org/10.1016/j.tifs.2016.08.005.
Bagchi, D. (2010). Global perspectives on childhood obesity: current status, consequences andprevention. Amsterdam, The Netherlands: Academic Press.
Barba, F. J., Orlien, V., Mota, M. J., Lopes, R. P., Pereira, S. A., & Saraiva, J. A. (2016).Implementation of emerging technologies. Innovation Strategies in the Food Industry:Tools for Implementation (pp. 117–148). https://doi.org/10.1016/B978-0-12-803751-5.00007-6.
Beech, G. (1980). Energy use in bread baking. Journal of the Science of Food andAgriculture, 31(3), 289–298. https://dx.doi.org/10.1002/jsfa.2740310314.
Berry, R., & Makino, H. (1974). Energy thrift in packaging and marketing. TechnologyReview, 76(4), 32–43. http://berrygroup.uchicago.edu/papers/97.pdf, Accessed date:15 November 2018.
Braschkat, J., Patyk, A., Quirin, M., & Reinhardt, G. (2003). Life cycle assessment of breadproduction – A comparison of eight different scenarios. Proceedings of the FourthInternational Conference on Life Cycle Assessment in the Agri-Food Sector. Bygholm,DenmarkDanish Institute of Agricultural Sciences. http://orgprints.org/id/file/59470, Accessed date: 15 November 2018.
Briam, R., Walker, M., & Masanet, E. (2015). A comparison of product-based energy in-tensity metrics for cheese and whey processing. Journal of Food Engineering, 151,25–33. https://doi.org/10.1016/j.jfoodeng.2014.11.011.
British Sugar 2018. Available at: https://www.britishsugar.co.uk/about-us/what-we-do/.Accessed 15 November 2018.
Carlsson-Kanyama, A. (1998). Climate change and dietary choices — How can emissionsof greenhouse gases from food consumption be reduced? Food Policy, 23(3–4),277–293. https://doi.org/10.1016/S0306-9192(98)00037-2.
Carlsson-Kanyama, A., & Faist, M. (2000). Energy use in the food sector: A data survey.Stockholm, Sweden: Swedish Environmental Protection Agency. 15.11.208 http://citeseerx.ist.psu.edu/viewdoc/download?rep=rep1&type=pdf&doi=10.1.1.205.8375.
Chanakya, H., & De Alwis, A. (2004). Environmental issues and management in primarycoffee processing. Process Safety and Environmental Protection, 82(4), 291–300.https://doi.org/10.1205/095758204323162319.
Cleland, A., Earle, M., & Boag, I. (1981). Application of multiple linear regression toanalysis of data from factory energy surveys. International Journal of Food Science andTechnology, 16(5), 481–492. https://doi.org/10.1111/j.1365-2621.1981.tb01841.x.
Coley, D., Howard, M., & Winter, M. (2009). Local food, food miles and carbon emissions:A comparison of farm shop and mass distribution approaches. Food Policy, 34(2),150–155. https://doi.org/10.1016/j.foodpol.2008.11.001.
Compton, M., Willis, S., Rezaie, B., & Humes, K. (2018). Food processing industry energyand water consumption in the Pacific northwest. Innovative Food Science & EmergingTechnologies, 47, 371–383. https://doi.org/10.1016/j.ifset.2018.04.001.
Cox, G., & Miller, E. (1986). Comparative energy efficiencies of the dairy manufacturingand processing industry: Australia and New Zealand. Engineering Costs and ProductionEconomics, 10(4), 293–303. https://doi.org/10.1016/S0167-188X(86)80028-3.
Cunningham, J., & Harney, B. (2012). Strategy & strategists. Oxford, UK: Oxford UniversityPress.
DEFRA (2005). The Validity of food miles as an indicator of sustainable development.Available at: http://webarchive.nationalarchives.gov.uk/20130131093910/http:/www.defra.gov.uk/statistics/files/defra-stats-foodfarm-food-transport-foodmiles-050715.pdf, Accessed date: 15 November 2018.
DEFRA (2015). Family Food 2014 - report tables dataset. Available at: https://www.gov.uk/government/statistics/family-food-2014, Accessed date: 15 November 2018.
DEFRA (2018a). UK's carbon footprint 1997-2015. Annual carbon dioxide emissions relatingto UK consumption. London, UK: Department of Environment, Food and Rural Affairs.https://www.gov.uk/government/uploads/system/uploads/attachment_data/file/704425/UK-Carbon_Footprint_1997_2015.ods, Accessed date: 16 November 2018.
DEFRA (2018b). Food statistics pocketbook 2018. Online resource. London, UK: Departmentof Environment, Food and Rural Affairs. https://www.gov.uk/government/publications/food-statistics-pocketbook/food-statistics-in-your-pocket-chapter-1,Accessed date: 16 November 2018.
Del Borghi, A., Gallo, M., Strazza, C., & Del Borghi, M. (2014). An evaluation of en-vironmental sustainability in the food industry through Life Cycle Assessment: Thecase study of tomato products supply chain. Journal of Cleaner Production, 78,121–130. https://doi.org/10.1016/j.jclepro.2014.04.083.
Department for Business, Energy and Industrial Strategy (2018a). Digest of United KingdomEnergy Statistics (DUKES) July 2018. London, UK. https://assets.publishing.service.gov.uk/government/uploads/system/uploads/attachment_data/file/736148/DUKES_2018.pdf, Accessed date: 15 November 2018.
Department for Business, Energy and Industrial Strategy (2018b). Annual prices of fuelspurchased by manufacturing industry (p/kWh). London, UK. https://assets.publishing.service.gov.uk/government/uploads/system/uploads/attachment_data/file/743784/table_314.xls, Accessed date: 15 November 2018.
Department for Transport (2018). Domestic Road Freight Statistics, United Kingdom 2017.London, UK. https://www.gov.uk/government/statistics/road-freight-statistics-2017,Accessed date: 22 November 2018.
Drewnowski, A., Rehm, C., Martin, A., Verger, E., Voinnesson, M., & Imbert, P. (2014).Energy and nutrient density of foods in relation to their carbon footprint. American
Journal of Clinical Nutrition, 101(1), 184–191. https://doi.org/10.3945/ajcn.114.092486.
EEA (2015). The European environment — State and outlook 2015: SynthesisreportCopenhagen, Denmark: European Environment Agency. https://www.eea.europa.eu/soer/#pdf-choice-synthesis, Accessed date: 15 November 2018.
Energy Information Administration, EIA (2017). International Energy Outlook 2017.https://www.eia.gov/outlooks/archive/ieo17/pdf/exec_summ.pdf last accessedNovember 2018.
European Commission (2012). Energy roadmap 2050. Luxembourg, Belgium. 978-92-79-21798-2. https://doi.org/10.2833/10759.
FAO (2011). Energy-smart Food for People and Climate. Issue Paper. Food and AgricultureOrganization of the United Nations. Rome, Italy. www.fao.org/docrep/014/i2454e/i2454e00.pdf, Accessed date: 16 November 2018.
FAO (2017). The future of food and agriculture – Trends and challenges. Rome, Italy: Foodand Agriculture Organization of the United Nations. http://www.fao.org/3/a-i6583e.pdf, Accessed date: 15 November 2018.
FDF (2016). Ambition 2025 – Climate Change. https://www.fdf.org.uk/sustainability-ambition2025-climate-change.aspx, Accessed date: 22 November 2018.
FDF (2018). Facts and Stats. Stats at a glance. London, UK: Food and Drink Federation.www.fdf.org.uk/statsataglance.aspx, Accessed date: 16 November 2018.
Fellows, P. (2009). Food processing technology: Principles and practice (3rd ed.). Boca Raton,USA: CRC Press.
FoodDrinkEurope (2015). A time to act. Climate action and the Food and Drink industry.London UK. http://www.fooddrinkeurope.eu/uploads/publications_documents/FoodDrink_Europe_Climate_Action_Brochure.pdf, Accessed date: 22 November 2018.
Foster, C., Green, K., Bleda, M., Dewick, P., Evans, B., Flynn, A., et al. (2006).Environmental impacts of food production and consumption: A report to the Departmentfor EnvironmentManchester, UK: Food and Rural Affairs. Manchester Business School.http://randd.defra.gov.uk/Document.aspx?Document=EV02007_4601_FRP.pdf,Accessed date: 16 November 2018.
Fritzson, A., & Berntsson, T. (2006). Efficient energy use in a slaughter and meat pro-cessing plant-opportunities for process integration. Journal of Food Engineering, 76(4),594–604.
Gazzard, N. (2014). Improving the efficiency of freight movements: The contribution to UKeconomic growth, Interim ReportLondon, UK: Independent Transport Commission.http://www.theitc.org.uk/wp-content/uploads/2011/03/ITC-Freight-interim-report-July-14.pdf, Accessed date: 16 November 2018.
Gowreesunker, B., Mudie, S., & Tassou, S. A. (2017). The impact of the UK's emissionsreduction initiative on the national food industry. Energy Procedia, 123, 30–35.https://doi.org/10.1016/j.egypro.2017.07.281.
Hendrickson, J. (1996). Energy use in the U.S. food system: A summary of existing researchand analysis. Madison, USA: Center for Integrated Agriculture Systems, University ofWisconsin-Madison. https://www.cias.wisc.edu/wp-content/uploads/2008/07/energyuse.pdf.
Jermann, C., Koutchma, T., Margas, E., Leadley, C., & Ros-Polski, V. (2015). Mappingtrends in novel and emerging food processing technologies around the world.Innovative Food Science & Emerging Technologies, 31, 14–27. https://doi.org/10.1016/j.ifset.2015.06.007.
Jindarat, W., Sungsoontorn, S., & Rattanadecho, P. (2014). Analysis of energy con-sumption in a combined microwave–hot air spouted bed drying of biomaterial: Coffeebeans. Experimental Heat Transfer, 28, 107–124. https://doi.org/10.1080/08916152.2013.821544.
Jones, A. (2002). An environmental assessment of food supply chains: A case study ondessert apples. Environmental Management, 30(4), 560–576. https://doi.org/10.1007/s00267-002-2383-6.
Juliano, P., Bilbao-Sáinz, C., Koutchma, T., Balasubramaniam, V. M., Clark, S., Stewart, C.M., et al. (2012). Shelf-stable egg-based products processed by high pressure thermalsterilization. Food Engineering Reviews, 4(1), 55–67. https://doi.org/10.1007/s12393-011-9046-4.
Khatir, Z., Paton, J., Thompson, H., Kapur, N., & Toropov, V. (2013). Optimisation of theenergy efficiency of bread-baking ovens using a combined experimental and com-putational approach. Applied Energy, 112, 918–927. https://doi.org/10.1016/j.apenergy.2013.02.034.
Klemes, J. (2013). Handbook of process integration: Minimisation of energy and water use,waste and emissions. Oxford, UK: Woodhead Publishing.
Klemes, J., Smith, R., & Kim, J. (2008). Handbook of water and energy management in foodprocessing. Cambridge, UK: Woodhead Publishing Limited.
Konstantas, A., Jeswani, H. K., Stamford, L., & Azapagic, A. (2018). Environmental im-pacts of chocolate production and consumption in the UK. Food Research International,106, 1012–1025. https://doi.org/10.1016/j.foodres.2018.02.042.
Konstantas, A., Stamford, L., & Azapagic, A. (2019). Environmental impacts of ice cream.Journal of Cleaner Production, 209, 259–272. https://doi.org/10.1016/j.jclepro.2018.10.237.
Koutchma, T., Popović, V., Ros-Polski, V., & Popielarz, A. (2016). Effects of ultravioletlight and high-pressure processing on quality and health-related constituents of freshjuice products. Comprehensive Reviews in Food Science and Food Safety, 15(5),844–867. https://doi.org/10.1111/1541-4337.12214.
Lillywhite, R., Sarrouy, C., Davidson, J., May, D., & Plackett, C. (2013). Energy dependencyand food chain security (1st ed.). Warwick: The University of Warwick. Warwick, UK.http://randd.defra.gov.uk/Document.aspx?Document=10557_FO0415_ENERGYDEPENDENCYANDFOODCHAINSECURITY_V.pdf, Accessed date: 16November 2018.
Liu, Y., Zhao, Y., & Feng, X. (2008). Exergy analysis for a freeze-drying process. AppliedThermal Engineering, 28(7), 675–690. https://doi.org/10.1016/j.applthermaleng.2007.06.004.
Li, S., Ziara, R. M. M., Dvorak, B., & Subbiah, J. (2018). Assessment of water and energy
A. Ladha-Sabur, et al. Trends in Food Science & Technology 86 (2019) 270–280
279
use at process level in the U.S. beef packing industry: Case study in a typical U.S.large-size plant. Journal of Food Process Engineering, 41(8), e12919. https://doi.org/10.1111/jfpe.12919.
Marquer, P., Rabade, T., & Forti, R., (2015). Meat product statistics. Eurostat. Available at:http://ec.europa.eu/eurostat/statistics-explained/index.php/Meat_production_statistics#Poultry_meat, Accessed date: 16 November 2018.
Moejes, S. N., & van Boxtel, A. J. B. (2017). Energy saving potential of emerging tech-nologies in milk powder production. Trends in Food Science & Technology, 60, 31–42.https://doi.org/10.1016/j.tifs.2016.10.023.
Morawicki, R. O., & Hager, T. (2014). Energy and greenhouse gases footprint of foodprocessing. Encyclopedia of Agriculture and Food Systems: Vol. 3, (pp. 82–99). Oxford,UK: Academic Press.
Motevali, A., Minaei, S., & Khoshtagaza, M. (2011). Evaluation of energy consumption indifferent drying methods. Energy Conversion and Management, 52(2), 1192–1199.https://doi.org/10.1016/j.enconman.2010.09.014.
Mujumdar, A. (2014). Handbook of industrial drying (4th ed.). Boca Raton, USA: CRC PressInc.
OECD (2012). Energy and climate policy: Bending the technological trajectory, OECD Studieson Environmental Innovation. Paris, France: OECD Publishing. https://doi.org/10.1787/9789264174573-en.
Okada, M., Rao, M., Lima, J., & Torloni, M. (1980). Energy consumption and the potentialfor conservation in a spray-dried coffee plant. Journal of Food Science, 45(3), 685–688http:/dx.doi.org/10.1111/j.1365-2621.1980.tb04132.x.
Özilgen, M. (2016). Energy utilization and carbon dioxide emission during production ofsnacks. Journal of Cleaner Production, 112, 2601–2612. https://doi.org/10.1016/j.jclepro.2015.10.031.
Ozuna, C., Cárcel, J., García-Pérez, J., & Mulet, A. (2011). Improvement of water trans-port mechanisms during potato drying by applying ultrasound. Journal of the Scienceof Food and Agriculture, 91(14), 2511–2517. https://doi.org/10.1002/jsfa.4344.
Paloviita, A., & Järvelä, M. (2016). Climate change adaptation and food supply chainmanagement. Abingdon, UK: Routledge.
Paoli, L., Lupton, R. C., & Cullen, J. M. (2018). Useful energy balance for the UK: Anuncertainty analysis. Applied Energy, 228, 176–188. https://doi.org/10.1016/j.apenergy.2018.06.063.
Pardo, G., & Zufía, J. (2012). Life cycle assessment of food-preservation technologies.Journal of Cleaner Production, 28, 198–207. https://doi.org/10.1016/j.jclepro.2011.10.016.
Pathare, P., & Roskilly, A. (2016). Quality and energy evaluation in meat cooking. FoodEngineering Reviews, 8(4), 435–447. https://doi.org/10.1007/s12393-016-9143-5.
Pimentel, D., & Hall, C. (1984). Food and energy resources. Oxford, UK: Elsevier.Pretty, J. N., Ball, A. S., Lang, T., & Morison, J. I. L. (2005). Farm costs and food miles: An
assessment of the full cost of the UK weekly food basket. Food Policy, 30(1), 1–19.https://doi.org/10.1016/j.foodpol.2005.02.001.
Prosapio, V., & Norton, I. (2017). Influence of osmotic dehydration pre-treatment on ovendrying and freeze drying performance. Lebensmittel-Wissenschaft und -Technologie-Food Science and Technology, 80, 401–408. https://doi.org/10.1016/j.lwt.2017.03.012.
Ramirez, C., Patel, M., & Blok, K. (2006a). From fluid milk to milk powder: Energy useand energy efficiency in the European dairy industry. Energy, 31(12), 1984–2004.https://doi.org/10.1016/j.energy.2005.10.014.
Ramirez, C., Patel, M., & Blok, K. (2006b). How much energy to process one pound ofmeat? A comparison of energy use and specific energy consumption in the meat in-dustry of four European countries. Energy, 31(12), 2047–2063. https://doi.org/10.1016/j.energy.2005.08.007.
Rivera, X. C. S., & Azapagic, A. (2016). Life cycle costs and environmental impacts ofproduction and consumption of ready and home-made meals. Journal of CleanerProduction, 112, 214–228. https://doi.org/10.1016/j.jclepro.2015.07.111.
Roos, Y. H., Fryer, P. J., Knorr, D., Schuchmann, H. P., Schroën, K., Schutyser, M. A. I.,et al. (2016). Food engineering at multiple scales: Case studies, challenges and thefuture—A European perspective. Food Engineering Reviews, 8(2), 91–115. https://doi.org/10.1007/s12393-015-9125-z.
Roy, P., Nei, D., Orikasa, T., Xu, Q., Okadome, H., Nakamura, N., et al. (2009). A reviewof life cycle assessment (LCA) on some food products. Journal of Food Engineering,90(1), 1–10. https://doi.org/10.1016/j.jfoodeng.2008.06.016.
Santé Publique France (2018). Nutri-Score. https://www.santepubliquefrance.fr/Sante-publique-France/Nutri-Score Last accessed November 2018.
Sharma, G., & Prasad, S. (2006). Specific energy consumption in microwave drying ofgarlic cloves. Energy, 31(12), 1921–1926. https://doi.org/10.1016/j.energy.2005.08.006.
Sims, R., Flammini, A., Puri, M., & Bracco, S. (2015). Opportunities for agri-food chains tobecome energy-smart. Rome: FAO. http://www.fao.org/3/ai5125e.pdf last accessedNovember 2018.
Singh, B. (2013). Biofuel crop sustainability. Ames, USA: John Wiley &Sons9781118635643.
Slesser, M., & Wallace, F. (1982). Energy consumption per tonne of competing agriculturalproducts available to the EC. Luxembourg, Luxembourg: Office for Official Publicationsof the European Communities. 16.112.08 http://bookshop.europa.eu/en/energy-consumption-per-tonne-of-competing-agricultural-products-available-to-the-ec-pbCBNA82085/.
Smith, D., Cash, J., Nip, W., & Hui, Y. (1997). Processing vegetables: Science and technology.Lancaster, UK: CRC Press.
Stanhill, G. (1984). Energy and agriculture. Heidelberg, Germany: Springer978-3-642-69784-5.
Swain, M. (2006). Energy use in food refrigeration - calculations, assumptions and datasources. Fond Refrigeration and Process Engineering Research CentreBristol, UK:University of Bristol. Technical Report www.grimsby.ac.uk/documents/defra/usrs-top10users.pdf.
Tassou, S., De-Lille, G., & Ge, Y. (2009). Food transport refrigeration – Approaches toreduce energy consumption and environmental impacts of road transport. AppliedThermal Energy, 29(8–9), 1467–1477. https://doi.org/10.1016/j.applthermaleng.2008.06.027.
Tassou, S. A., Kolokotroni, M., Gowreesunker, B., Stojceska, V., Azapagic, A., Fryer, P.,et al. (2014). Energy demand and reduction opportunities in the UK food chain.Proceedings - Institution of Civil Engineers: Energy, 167(3), 162–170. https://doi.org/10.1680/ener.14.00014.
The Bristish Coffee Association (2018). Coffee facts. Available at: http://www.britishcoffeeassociation.org/about_coffee/coffee_facts/, Accessed date: 16 November2018.
The Energy Conservation Centre (2016). Food processing industry - output of a seminar onenergy conservation in food processing industry. United Nations Industrial DevelopmentOrganisation (UNIDO).
Therdthai, N., Zhou, W., & Adamczak, T. (2002). Optimisation of the temperature profilein bread baking. Journal of Food Engineering, 55(1), 41–48. https://doi.org/10.1016/S0260-8774(01)00240-0.
Therkelsen, P., Masanet, E., & Worrell, E. (2014). Energy efficiency opportunities in theU.S. commercial baking industry. Journal of Food Engineering, 130, 14–22. https://doi.org/10.1016/j.jfoodeng.2014.01.004.
USDA (2016). USDA Food Composition Database. Available at:https://ndb.nal.usda.gov/Accessed 16.11.208.
Van Alfen, N. (2014). Encyclopedia of agriculture and food systems (2nd ed.). Oxford, UK:Elsevier978-0-08-093139-5.
Van Hauwermeiren, A., Coene, H., Engelen, G., & Mathijs, E. (2007). Energy lifecycleinputs in food systems: A comparison of local versus mainstream cases. Journal ofEnvironmental Policy and Planning, 9(1), 31–51. https://doi.org/10.1080/15239080701254958.
Walmsley, T. G., Atkins, M. J., Walmsley, M. R. W., Philipp, M., & Peesel, R.-H. (2018).Process and utility systems integration and optimisation for ultra-low energy milkpowder production. Energy, 146, 67–81. https://doi.org/10.1016/j.energy.2017.04.142.
Wang, L. (2008). Energy efficiency and management in food processing facilities. Boca Raton,USA: CRC Press9781420063387.
Wang, L. (2014). Energy efficiency technologies for sustainable food processing. EnergyEfficiency, 7(5), 791–810. https://doi.org/10.1007/s12053-014-9256-8.
Webb, G. (2012). Nutrition - Maintaining and improving health (4th ed.). Boca Raton, USA:Hodder Arnold -CRC Press9781444142464.
Wojdalski, J., Grochowicz, J., Dróżdż, B., Bartoszewska, K., Zdanowska, P., Kupczyk, A.,et al. (2015). Energy efficiency of a confectionery plant – Case study. Journal of FoodEngineering, 146, 182–191. https://doi.org/10.1016/j.jfoodeng.2014.08.019.
Wu, H., Tassou, S. A., Karayiannis, T. G., & Jouhara, H. (2013). Analysis and simulation ofcontinuous food frying processes. Applied Thermal Engineering, 53(2), 332–339.https://doi.org/10.1016/j.applthermaleng.2012.04.023.
Xanthakis, E., Huen, J., Eliasson, L., Jha, P. K., Le-Bail, A., & Shrestha, M. (2018).Evaluation of microwave assisted freezing (MAF) impact on meat and fish matrices.Refrigeration Science and Technology. https://doi.org/10.18462/iir.iccc.2018.0024.
Xu, T., & Flapper, J. (2009). Energy use and implications for efficiency strategies in globalfluid-milk processing industry. Energy Policy, 37(12), 5334–5341. https://doi.org/10.1016/j.enpol.2009.07.056.
Xu, T., & Flapper, J. (2011). Reduce energy use and greenhouse gas emissions from globaldairy processing facilities. Energy Policy, 39(1), 234–247. https://doi.org/10.1016/j.enpol.2010.09.037.
Xu, T., Flapper, J., & Kramer, K. (2009). Characterization of energy use and performanceof global cheese processing. Energy, 34(11), 1993–2000. https://doi.org/10.1016/j.energy.2009.08.014.
A. Ladha-Sabur, et al. Trends in Food Science & Technology 86 (2019) 270–280
280
Related Documents