Mapping and ne-mapping of genetic factors affecting bovine milk composition Sandrine Isolde Duchemin Acta Universitatis Agriculturae Sueciae Doctoral Thesis No. 2016:39

Welcome message from author
This document is posted to help you gain knowledge. Please leave a comment to let me know what you think about it! Share it to your friends and learn new things together.
Transcript
Mapping and ne-mapping
of genetic factors affecting
bovine milk composition
Sandrine Isolde DucheminActa Universitatis Agriculturae Sueciae
Doctoral Thesis No. 2016:39
Propositions
1. Imputation is the limiting factor for detection of rare-variant quantitative trait
loci in traditional genome-wide association studies.
(this thesis)
2. Good annotation of the cattle genome is crucial for gene discovery.
(this thesis)
3. The real CRISPR/Cas9 revolution is the editing of human somatic cells, not the
editing of human germ-line cells.
4. Diseases in animals as dynamic events are best modelled, diagnosed and treated
by veterinarians.
5. Women who accept a gender quota are in fact agreeing they are less than men.
6. In science sand grains from publications build up to mountains of knowledge.
Propositions belonging to the thesis, entitled:
“Mapping and fine-mapping of genetic factors affecting bovine milk composition”
Sandrine Isolde Duchemin
Wageningen, 30 May 2016
Mapping and fine-mapping of genetic factors affecting bovine milk
composition
Thesis committee
Promotors
Prof. Dr. ir. J.A.M. van Arendonk
Professor of Animal Breeding and Genetics
Wageningen University
Co-promotor
Dr. ir. H. Bovenhuis
Associate professor, Animal Breeding and Genomics Centre
Wageningen University
Dr. ir. M.H.P.W. Visker
Researcher, Animal Breeding and Genomics Centre
Wageningen University
Dr. ir. W.F. Fikse
Senior researcher, Department of Animal Breeding and Genetics
Swedish University of Agricultural Sciences
Other members (assessment committee)
Prof. Dr. E.J.M. Feskens, Wageningen University
Prof. Dr. A.C.M. van Hooijdonk, Wageningen University
Prof. Dr. L. Andersson-Eklund, Swedish University of Agricultural Sciences, Sweden
Dr. D. Boichard, National Institute for Agricultural Research (INRA), France
The research presented in this doctoral thesis was conducted under the joint
auspices of the Swedish University of Agricultural Sciences and the Graduate School
Wageningen Institute of Animal Sciences of Wageningen University and is part of the
Erasmus Mundus Joint Doctorate program “EGS-ABG".
Mapping and fine-mapping of genetic factors affecting bovine milk
composition
Sandrine Isolde Duchemin
ACTA UNIVERSITATIS AGRICULTURAE SUECIAE
DOCTORAL THESIS Nº 2016:39
Thesis
submitted in fulfillment of the requirements for the degree of doctor from
Swedish University of Agricultural Sciences
by the authority of the Board of the Faculty of Veterinary Medicine and
Animal Science and from
Wageningen University
by the authority of the Rector Magnificus, Prof. Dr. A.P.J. Mol,
in the presence of the
Thesis Committee appointed by the Academic Board of Wageningen University and
the Board of the Faculty of Veterinary Medicine and Animal Science at
the Swedish University of Agricultural Sciences
to be defended in public
on Monday May 30, 2016
at 4.00 p.m. in the Aula of Wageningen University
ISSN 1652-6880
ISBN (print version) 978-91-576-8580-3
ISBN (electronic version) 978-91-576-8581-0
ISBN 978-94-6257-730-5
DOI:10.18174/370103
Duchemin, S.I.
Mapping and fine-mapping of genetic factors affecting bovine milk composition.
Joint PhD thesis, Swedish University of Agricultural Sciences, Uppsala, Sweden and
Wageningen University, the Netherlands (2016)
With references, with summary in English
5
Abstract
Duchemin, S.I. (2016). Mapping and fine-mapping of genetic factors affecting bovine
milk composition. Joint PhD thesis, between Swedish University of Agricultural
Sciences, Sweden and Wageningen University, the Netherlands
Bovine milk is an important source of nutrients in Western diets. Unraveling the
genetic background of bovine milk composition by finding genes associated with
milk-fat composition and non-coagulation of milk were the main goals of this thesis.
In Chapter 1, a brief description of phenotypes and genotypes used throughout the
thesis is given. In Chapter 2, I calculated the genetic parameters for winter and
summer milk-fat composition from ~2,000 Holstein-Friesian cows, and concluded
that most of the fatty acids (FA) can be treated as genetically the same trait. The
main differences between milk-fat composition between winter and summer milk
samples are most likely due to differences in diets. In Chapter 3, I performed
genome-wide association studies (GWAS) with imputed 777,000 single nucleotide
polymorphism (SNP) genotypes. I targeted a quantitative trait locus (QTL) region on
Bos taurus autosome (BTA) 17 previously identified with 50,000 SNP genotypes, and
identified a region covering 5 mega-base pairs on BTA17 that explained a large
proportion of the genetic variation in de novo synthesized milk FA. In Chapter 4, the
availability of whole-genome sequences of keys ancestors of our population of cows
allowed to fine-mapped BTA17 with imputed sequences. The resolution of the 5
mega base-pairs region substantially improved, which allowed the identification of
the LA ribonucleoprotein domain family, member 1B (LARP1B) gene as the most
likely candidate gene associated with de novo synthesized milk FA on BTA17. The
LARP1B gene has not been associated with milk-fat composition before. In Chapter
5, I explored the genetic background of non-coagulation of bovine milk. I performed
a GWAS with 777,000 SNP genotypes in 382 Swedish Red cows, and identified a
region covering 7 mega base-pairs on BTA18 strongly associated with non-
coagulation of milk. This region was further characterized by means of fine-mapping
with imputed sequences. In addition, haplotypes were built, genetically
differentiated by means of a phylogenetic tree, and tested in phenotype-genotype
association studies. As a result, I identified the vacuolar protein sorting 35 homolog,
mRNA (VPS35) gene, as candidate. The VPS35 gene has not been associated to milk
composition before. In Chapter 6, the general discussion is presented. I start
discussing the challenges with respect to high-density genotypes for gene discovery,
and I continue discussing future possibilities to expand gene discovery studies, with
which I propose some alternatives to identify causal variants underlying complex
traits in cattle.


For my family
“Flatter me, and I may not believe you.
Criticize me, and I may not like you.
Ignore me, and I may not forgive you.
Encourage me, and I will not forget you.
Love me and I may be forced to love you.”
William Arthur Ward, writer, 1921-1994.

9
Table of Contents
5 Abstract
7 Prologue
11 1 – General Introduction
21 2 – Genetic correlation between composition of bovine milk fat in winter
and summer, and DGAT1 and SCD1 by season interactions
49 3 – A quantitative trait locus on Bos taurus autosome 17 explains a large
proportion of the genetic variation in de novo synthesized milk fatty acids
73 4 – Fine-mapping of Bos taurus autosome 17 using imputed sequences for
associations with de novo synthesized fatty acids in bovine milk
99 5 – Identification of QTL on chromosome 18 associated with non-
coagulating milk in Swedish Red cows
141 6 – General Discussion
163 Summary
169 Training and Education
175 Curriculum vitae
181 Acknowledgements
189 Colophon


1
General Introduction

1 General Introduction
13
1.1 Milk
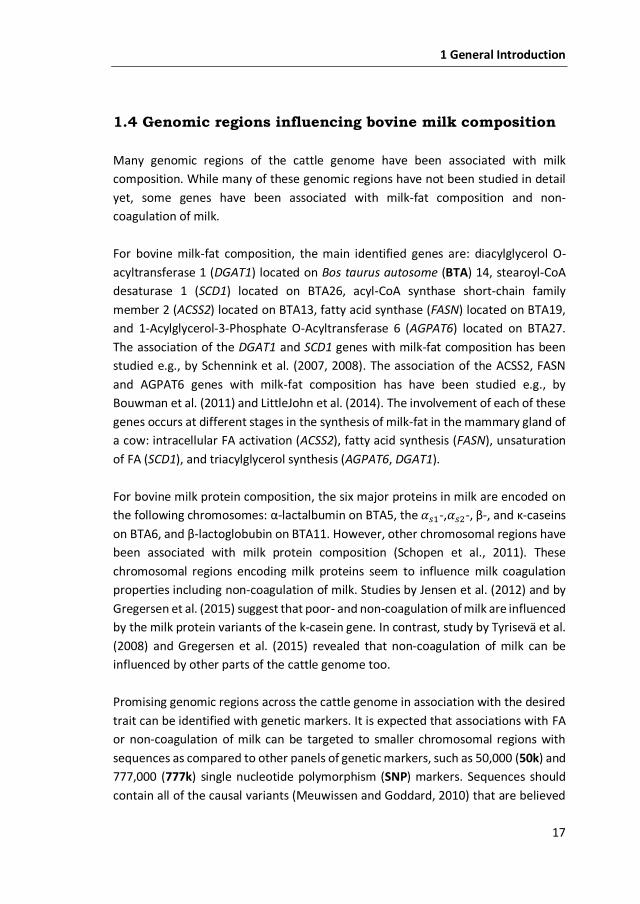
Milk has fascinated mankind since the beginning of the ages. A clear example of this
fascination is the Milky Way galaxy, which contains our Planet Earth. The Milky Way
galaxy has its roots in the Greek-Roman Mythology. The word galaxy originates from
galas, which is a synonym for milk in Greek language. According to the Mythology,
the Milky Way galaxy was “drops of milk” spelt by goddess Hera, when breastfeeding
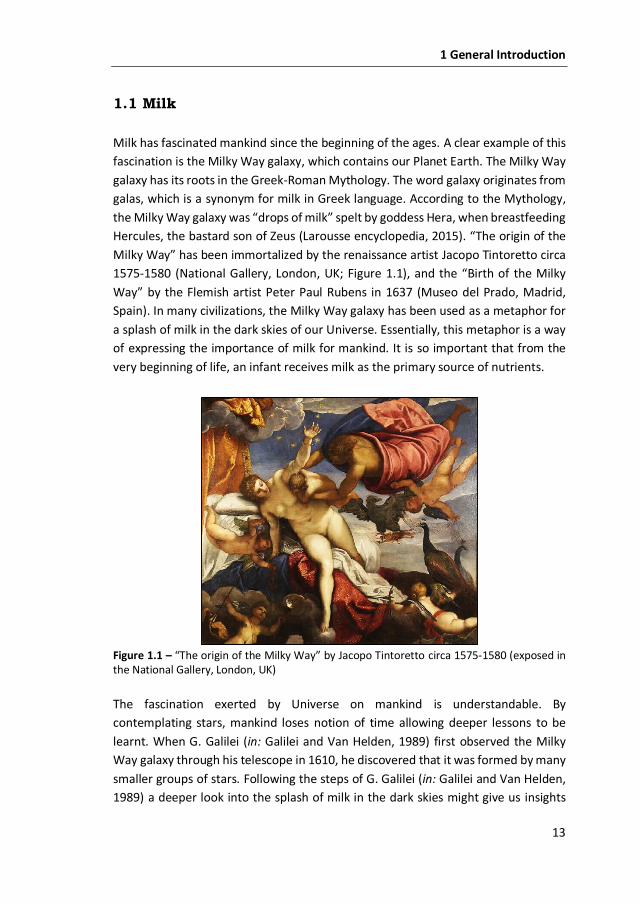
Hercules, the bastard son of Zeus (Larousse encyclopedia, 2015). “The origin of the
Milky Way” has been immortalized by the renaissance artist Jacopo Tintoretto circa
1575-1580 (National Gallery, London, UK; Figure 1.1), and the “Birth of the Milky
Way” by the Flemish artist Peter Paul Rubens in 1637 (Museo del Prado, Madrid,
Spain). In many civilizations, the Milky Way galaxy has been used as a metaphor for
a splash of milk in the dark skies of our Universe. Essentially, this metaphor is a way
of expressing the importance of milk for mankind. It is so important that from the
very beginning of life, an infant receives milk as the primary source of nutrients.
Figure 1.1 – “The origin of the Milky Way” by Jacopo Tintoretto circa 1575-1580 (exposed in the National Gallery, London, UK)
The fascination exerted by Universe on mankind is understandable. By
contemplating stars, mankind loses notion of time allowing deeper lessons to be
learnt. When G. Galilei (in: Galilei and Van Helden, 1989) first observed the Milky
Way galaxy through his telescope in 1610, he discovered that it was formed by many
smaller groups of stars. Following the steps of G. Galilei (in: Galilei and Van Helden,
1989) a deeper look into the splash of milk in the dark skies might give us insights
1 General Introduction
14
into the composition of milk. The splash might represent the fluid part of milk. The
small groups of stars composing this splash might represent the main components
in milk, such as proteins and fatty acids. The interstellar dust accompanying these
stars might represent the minerals in milk. In just a few instants, the composition of
milk is described as an (scientific) idea that has been transmitted throughout
centuries by a simple metaphor.
Metaphors with our Universe do not stop at the Milky Way galaxy. Mankind named
constellations after species of animals (e.g., Taurus, Aries, and Pisces), just like cave
men have represented wild animals in their cave drawings. From stone-age to
modern times, domestication of animals has been one of the drivers for men’s
transition from hunters to farmers. During this process, the role of cattle was
undeniable. By domesticating cows, mankind preserved through time important
resources, such as the genetic variation of bovine species. The preservation of this
genetic variation has important consequences for the current technological
development of mankind. It is so important that from the beginning of every life,
genetic variation will determine the future of all species.
By using metaphors, such as Milky Way galaxy and names of constellations, mankind
transmitted more than just a simple image from cave to modern men. As intrinsic
parts of the Milky Way galaxy, cave and modern men would be united forever as one
student. For mankind, these metaphors have engraved in our collective memories a
deep respect for our Planet Earth and its scarce resources. Resources beyond genetic
variation have been translated. In our modern times, this deep respect is taught by
uniting human needs (milk as a nutrient) and animal resources (genes affecting
bovine milk composition) through Animal Breeding and Genetics.
The scope of my thesis was to investigate the genetic background of bovine milk
composition. More specifically, my thesis focuses on the composition of milk-fat, and
on non-coagulation of milk.
1.2 Milk-fat composition
Bovine milk fat is an important source of energy for mankind. The main bioactive
lipids in bovine milk are fatty acids (FA). According to Jensen (2002), bovine milk-fat
is composed of more than 400 individual FA, most occurring in amounts less than
1%. The individual FA in bovine milk-fat are organized in chain of carbons that vary
in length from 4 to 22 carbons. According to their chain-lengths, these individual FA
1 General Introduction
15
are grouped as short-chain (C4:0 – C12:0), medium-chain (C14:0 – C16:0) and long-
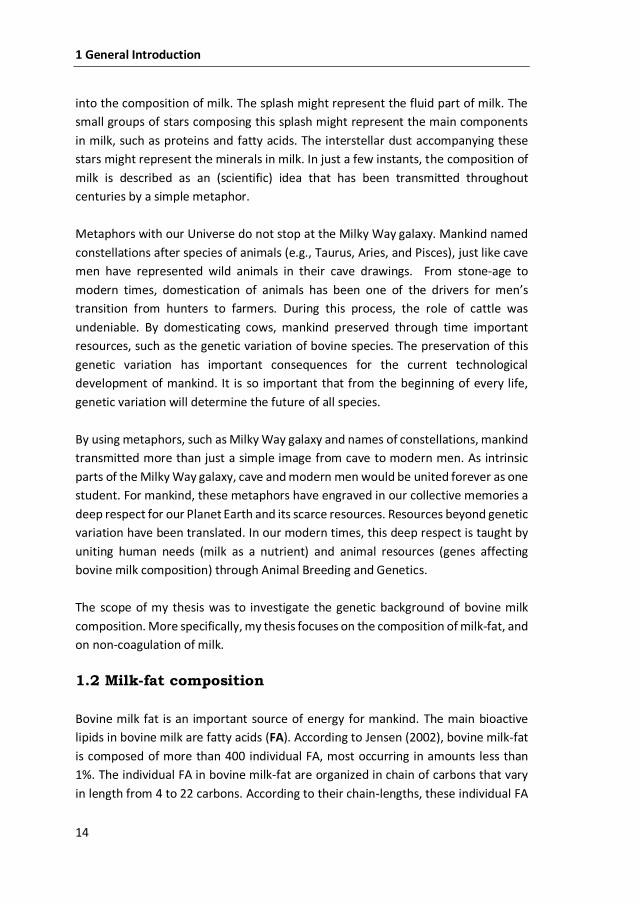
chain (C18:0 – C22:0) FA. In addition, individual FA can be either saturated or
unsaturated. FA are saturated when a carbon is connected by a single bond to an
adjacent carbon in the chain, and FA are unsaturated when a carbon is connected to
an adjacent carbon in the chain by double or triple bonds. Differences in FA regarding
their saturation are shown in Figure 1.2.
Figure 1.2 – Representation of fatty acids (FA). Butyric acid representing saturated FA, and
conjugated linoleic acid representing unsaturated FA. Arrows in red point out the double
bonds between adjacent carbons.
The biosynthesis of milk-fat occurs in the mammary gland of a cow. Individual FA in
the mammary gland arise from circulating blood lipids and de novo synthesis.
Circulating blood lipids originate from the feed of the cow or from the cow’s body
fat. Through the de novo synthesis, FA are elongated from precursors by adding C2:0.
These precursors can be either acetate (C2:0), propionate (C3:0) or butyrate (C4:0).
C2:0 and C3:0 originate from lipids in circulating blood, while C4:0 may either
originate from blood lipids or the de novo synthesis itself (e.g., Craninx et al., 2008).
Depending on the precursor, FA synthesized de novo may terminate at either C16:0
or C17:0. It is assumed that de novo synthesis produces the short-chain FA, C14:0
and 50% of C16:0 in milk, whereas the remaining 50% of C16:0 and the long-chain
FA come from the lipids in circulating blood.
FA in bovine milk are relevant for human health. According to Calder et al. (2015),
FA are essential for the well-being of humans, and they have important biological
activities regarding the cell and tissue metabolism, as well as responsiveness to
hormones and other signals in human cells. Stoop et al. (2008) indicated that FA in
bovine milk are heritable, with heritability estimates between 0.22 and 0.71. These
heritability estimates suggest that milk-fat composition can be improved by
1 General Introduction
16
breeding. In addition, Tzompa-Sosa et al. (2014) showed that increases in long-chain
saturated FA can influence the thermal properties of milk-fat, which can lead to
important changes in the quality of milk-fat derived products. Moreover, breeding
could be used to reduce the concentration of certain FA in bovine milk-fat. For
instance, low concentrations of C16:0 in bovine milk-fat would best meet infant
requirements regarding the consumption of milk-fat derived products (e.g., Tzompa-
Sosa et al., 2014). Therefore, increasing the biological knowledge regarding bovine
milk-fat composition can be of great interest to the dairy industry.
1.3 Non-coagulation of milk
In addition to FA, bovine milk is an important source of proteins for mankind. The
main proteins in bovine milk are the caseins, which account for almost 80% of the
proteins in milk. There are four caseins in bovine milk: 𝛼𝑠1-,𝛼𝑠2-, β-, and κ-casein.
Most of these caseins are organized in micelles. These micelles are not soluble in
water and can precipitate in the presence of rennet. This property is used in cheese
production to induce coagulation of milk. In 2013, almost 30% of the total production
of bovine milk in Sweden was destined to cheese production (LRF Dairy Sweden,
2015).
Besides the caseins, whey proteins account for the remaining 20% of the proteins in
milk, of which β-lactoglobubin and α-lactalbumin are the most important ones. The
whey proteins are considered by-products of cheese production. In contrast to
caseins, whey proteins are soluble in water, and can only be denatured by heat.
When heated, whey proteins can produce products such as ricotta and whey butter.
It is economically relevant for the cheese industry to reduce time and losses while
producing cheese. In this sense, if caseins in bovine milk do not coagulate after
rennet addition, the entire chain of cheese production is delayed, generating losses
for this industry. Consequently, non-coagulation of milk can be considered as a new
phenotype that accounts for the needs of the cheese industry. Non-coagulation (NC)
of milk is prevalent among several dairy cattle breeds, such as Swedish Red, Finnish
Ayrshire, Holstein-Friesian, and Italian Brown Swiss, to name a few (e.g., Frederiksen
et al., 2011; Cecchinato et al., 2011, Gustavsson et al., 2014). The prevalence of NC
milk varies among these breeds ranging from 4% in Italian Brown Swiss (Cecchinato
et al., 2009) up to 13% in Finnish Ayrshires (Ikonen et al., 2004). A recent study
reported the prevalence of NC milk at 18% in the Swedish Red cows (Gustavsson et
al., 2014).
1 General Introduction
17
1.4 Genomic regions influencing bovine milk composition
Many genomic regions of the cattle genome have been associated with milk
composition. While many of these genomic regions have not been studied in detail
yet, some genes have been associated with milk-fat composition and non-
coagulation of milk.
For bovine milk-fat composition, the main identified genes are: diacylglycerol O-
acyltransferase 1 (DGAT1) located on Bos taurus autosome (BTA) 14, stearoyl-CoA
desaturase 1 (SCD1) located on BTA26, acyl-CoA synthase short-chain family
member 2 (ACSS2) located on BTA13, fatty acid synthase (FASN) located on BTA19,
and 1-Acylglycerol-3-Phosphate O-Acyltransferase 6 (AGPAT6) located on BTA27.
The association of the DGAT1 and SCD1 genes with milk-fat composition has been
studied e.g., by Schennink et al. (2007, 2008). The association of the ACSS2, FASN
and AGPAT6 genes with milk-fat composition has have been studied e.g., by
Bouwman et al. (2011) and LittleJohn et al. (2014). The involvement of each of these
genes occurs at different stages in the synthesis of milk-fat in the mammary gland of
a cow: intracellular FA activation (ACSS2), fatty acid synthesis (FASN), unsaturation
of FA (SCD1), and triacylglycerol synthesis (AGPAT6, DGAT1).
For bovine milk protein composition, the six major proteins in milk are encoded on
the following chromosomes: α-lactalbumin on BTA5, the 𝛼𝑠1-,𝛼𝑠2-, β-, and κ-caseins
on BTA6, and β-lactoglobubin on BTA11. However, other chromosomal regions have
been associated with milk protein composition (Schopen et al., 2011). These
chromosomal regions encoding milk proteins seem to influence milk coagulation
properties including non-coagulation of milk. Studies by Jensen et al. (2012) and by
Gregersen et al. (2015) suggest that poor- and non-coagulation of milk are influenced
by the milk protein variants of the k-casein gene. In contrast, study by Tyrisevä et al.
(2008) and Gregersen et al. (2015) revealed that non-coagulation of milk can be
influenced by other parts of the cattle genome too.
Promising genomic regions across the cattle genome in association with the desired
trait can be identified with genetic markers. It is expected that associations with FA
or non-coagulation of milk can be targeted to smaller chromosomal regions with
sequences as compared to other panels of genetic markers, such as 50,000 (50k) and
777,000 (777k) single nucleotide polymorphism (SNP) markers. Sequences should
contain all of the causal variants (Meuwissen and Goddard, 2010) that are believed
1 General Introduction
18
to be associated with the studied phenotype. The use of sequences for association
studies has been enabled by the availability of an increasing number of sequenced
animals (bulls and cows) from projects like the 1000Bull Genome Consortium
(Daetwyler et al., 2014).
1.5 Aim and outline of this thesis
The present thesis aims at unraveling the genetic background of bovine milk
composition by finding genes associated with milk-fat composition and non-
coagulation of milk in targeted chromosomal regions. Throughout this thesis, there
is a consistent increase in the number of genotypes analyzed, which have been useful
to increase the resolution of some interesting genomic regions associated with
bovine milk composition. In Chapter 2, we calculated the genetic correlations
between the composition of bovine milk fat in winter and summer, and DGAT1 and
SCD1 by season interactions. The conclusions of this work were further explored in
Chapters 3 and 4. In Chapter 3, a quantitative trait locus on Bos taurus autosome
(BTA) 17 explaining a large proportion of the genetic variation in de novo synthesized
milk FA is mapped. In Chapter 4, we fine-mapped this QTL associated with de novo
synthesized milk FA on BTA17 using imputed sequences. In Chapter 5, a similar fine-
mapping methodology was used for the identification of a QTL on BTA18 associated
with non-coagulation of milk in Swedish Red cows. In Chapter 6, challenges regarding
the substantial increase in the number of genotypes used in this thesis, and the
future possibilities to expand gene discovery are discussed.
1.6 References
Bouwman, A. C., Bovenhuis, H., Visker, M. H. P. W., and van Arendonk, J. A. M. 2011.
Genome-wide association of milk fatty acids in Dutch dairy cattle. BMC Genetics
12:43.
Calder, P. C. 2015. Functional roles of fatty acids and their effects on human health.
J Parenter Enteral Nutr, 39.1: 18S-32S.
Cecchinato, A., De Marchi, M., Gallo, L., Bittante, G., and Carnier, P. 2009. Mid-
infrared spectroscopy predictions as indicator traits in breeding programs for
enhanced coagulation properties of milk. J Dairy Sci 92, 5304–5313.
Cecchinato, A., Penasa, M., De Marchi, M., Gallo, L., Bittante, G., and Carnier, P. 2011.
Genetic parameters of coagulation properties, milk yield, quality, and acidity:
estimated using coagulating milk and noncoagulating information in Brown Swiss
and Holstein cows. J Dairy Sci 94, 4205-4213.
1 General Introduction
19
Craninx, M., A. Steen, H. Van Laar, T. Van Nespen, J. Martin-Tereso, B. De Baets, and
V. Fievez. 2008. Effect of lactation stage on the odd- and branched-chain milk fatty
acids of dairy cattle under grazing and indoor conditions. J. Dairy Sci. 91:2662–
2677.
Daetwyler, H.D., Capitan, A., Pausch, H., Stothard, P., van Binsbergen, R., Brondum,
R.F., Liao, X., Djari, A., Rodriguez, S.C., Grohs, C., Esquerre, D., Bouchez, O.,
Rossignol, M-N., Klopp, C., Rocha, D., Fritz, S., Eggen, A., Bowman, P.J., Coote, D.
Chamberlain, A.J., Anderson, C., VanTassell, C.P., Hulsegge, I., Goddard, M.E.,
Guldbrandtsen, B., Lund, M.S., Veerkamp, R.F., Boichard, D.A., Fries, R., and Hayes,
B. J. 2014. Whole-genome sequencing of 234 bulls facilitates mapping of
monogenic and complex traits in cattle. Nat Genet 46, 858–865.
Frederiksen, P. D., Andersen, K. K., Hammershøj, M., Poulsen, H. D., Sørensen, J.,
Bakman, M., Qvist, K.B., and Larsen, L.B. 2011. Composition and effect of blending
of noncoagulating, poorly coagulating, and well-coagulating bovine milk from
individual Danish Holstein cows. J Dairy Sci 94, 4787–4799.
Galilei, G., and Van Helden, A. 1989.Sidereus Nuncius, or the sidereal messenger.
Chicago: University of Chicago Press.
Gustavsson, F., Glantz, M., Poulsen, N. A., Wadsö, L., Stålhammar, H., Andrén, A.,
Lindmark-Månsson, H., Larsen, L.B., Paulsson, M., and Fikse, W. F. 2014. Genetic
parameters for rennet- and acid-induced coagulation properties in milk from
Swedish Red dairy cows. J Dairy Sci 97, 5219–5229.
Gregersen, V. R., Gustavsson, F., Glantz, M., Christensen, O. F., Stålhammar, H.,
Andrén, A., Lindmark-Månsson, H., Poulsen, N. A., Larsen, L.B., Paulsson, M., and
Bendixen, C. 2015. Bovine chromosomal regions affecting rheological traits in
rennet-induced skim milk gels. J Dairy Sci 98, 1261-1272.
Ikonen, T., Morri, S., Tyrisevä, A-M., Ruottinen, O., and Ojala, M. 2004. Genetic and
phenotypic correlations between milk coagulation properties, milk production
traits, somatic cell count, casein content, and pH of milk. J Dairy Sci 87, 458–467.
Jensen, R. G. 2002. The composition of bovine milk lipids: January 1995 to December
2000. J. Dairy Sci. 85:295–350.
Jensen, H. B., Poulsen, N. A., Andersen, K. K., Hammershøj, M., Poulsen, H. D., and
Larsen, L. B. 2012. Distinct composition of bovine milk from Jersey and Holstein-
Friesian cows with good, poor, or noncoagulation properties as reflected in protein
genetic variants and isoforms. J Dairy Sci 95, 6905–17.
Larousse Encyclopedia. 2015. http://www.larousse.fr/encyclopedie, accessed on
Nov 3rd, 2015.
Littlejohn, M.D., Tiplady, K., Lopdell, T., Law, T. A., Scott, A., Harland, C., Sherlock, R.,
Henty, K., Obolonkin, V.,Lehnert, K., MacGibbon, A., Spelman, R. J., Davis, S. R., and
1 General Introduction
20
Snell, R. G. 2014. Expression variants of the lipogenic AGPAT6 gene affect diverse
milk composition phenotypes in Bos taurus. PLoS ONE 9: e85757.
LRF Dairy Sweden. 2015. http://www.lrf.se/globalassets/dokument/om-
lrf/branscher/lrf-mjolk/statistik/milk_key_figures_sweden.pdf , accessed on Nov
3rd, 2015.
Meuwissen, T., and Goddard, M. 2010. Accurate prediction of genetic values for
complex traits by whole-genome resequencing. Genetics 185, 623–631.
Rubens, P. P. 1637. Birth of the Milky Way. Museo del Prado, Madrid, Spain.
Schennink, A., Stoop, W. M., Visker, M. H. P. W., Heck, J. , Bovenhuis, H., Van Der
Poel, J., van Valenberg, H., and van Arendonk, J. A. M. 2007. DGAT1 underlies large
genetic variation in milk-fat composition of dairy cows. Anim. Genet. 38:467–473.
Schennink, A., J. M. L. Heck, H. Bovenhuis, M. H. P. W. Visker, H. J. F. van Valenberg,
and J. A. M. van Arendonk. 2008. Milk fatty acid unsaturation: genetic parameters
and effects of Stearoyl-CoA Desaturase (SCD1) and Acyl CoA: Diacylglycerol
Acyltransferase 1 (DGAT1). J. Dairy Sci. 91:2135-2143.
Schopen, G.C., Visker, M. H. P. W., Koks, P. D., Mullaart, E., van Arendonk, J. A. M.,
and Bovenhuis, H. 2011. Whole-genome association study for milk protein
composition in dairy cattle. J Dairy Sci 94: 3148-3158.
Stoop, W. M., van Arendonk, J. A. M., Heck, J. M. L.,van Valenberg, H. J. F., and
Bovenhuis, H. 2008. Genetic parameters for major milk fatty acids and milk
production traits of Dutch Holstein-Friesians. J Dairy Sci. 91:385–394.
Tintoretto, J. (circa 1575-1580). Origins of the Milky Way. National Gallery, London,
UK.
Tyrisevä, A. M., Elo, K., Kuusipuro, A., Vilva, V., Jänönen, I., Karjalainen, H., Ikonen,
T., Ojala, M. 2008. Chromosomal regions underlying noncoagulation of milk in
Finnish Ayrshire cows. Genetics 180, 1211–1220
Tzompa-Sosa, D. A., van Aken, G. A., van Hooijdonk, A. C. M., and van Valenberg, H.
J. F. 2014. Influence of C16: 0 and long-chain saturated fatty acids on normal
variation of bovine milk fat triacylglycerol structure. J Dairy Sci 97:4542-4551.
2
Genetic correlation between composition of bovine milk fat in winter and summer, and
DGAT1 and SCD1 by season interactions
S. Duchemin1,2, H. Bovenhuis1, W. M. Stoop1, A. C. Bouwman1, J. A. M. van
Arendonk1, M. H. P. W. Visker1
1Animal Breeding and Genomics Centre, Wageningen University, PO Box 338, 6700
AH Wageningen, the Netherlands; 2Department of Animal Breeding and Genetics,
Swedish University of Agricultural Sciences, Uppsala, Sweden
Journal of Dairy Sciences (2013) 96:592-604
22
Abstract
Milk fat composition shows substantial seasonal variation, most of which is probably
caused by differences in the feeding of dairy cows. The present study aimed to know
whether milk fat composition in winter is genetically the same trait as milk fat
composition in summer. For this purpose, we estimated heritabilities, genetic
correlations, effects of acyl-CoA: diacylglycerol acyltransferase1 (DGAT1) K232A and
stearoyl-CoA desaturase1 (SCD1) A293V polymorphisms for milk fat composition in
winter and summer, and tested for genotype by season interactions of DGAT1 K232A
and SCD1 A293V polymorphisms. Milk samples were obtained from 2,001 first
lactation Dutch Holstein Friesian cows, most of which with records in both winter
and summer. Summer milk contained higher amounts of unsaturated fatty acids (FA)
and lower amounts of saturated FA compared to winter milk. Heritability estimates
were comparable between seasons: moderate to high for short and medium chain
FA (0.33 to 0.74) and moderate for long chain FA (0.19 to 0.43) in both seasons.
Genetic correlations between winter and summer milk were high, indicating that
milk fat composition in winter and in summer can largely be considered as genetically
the same trait. DGAT1 K232A and SCD1 A293V polymorphisms effects were similar
across seasons for most FA. DGAT1 232A allele in winter as well as in summer milk
samples was negatively associated with most FA with less than 18 carbons, SFA, SFA
to UFA, and C10 to C16 unsaturation indices, and was positively associated with
C14:0, unsaturated C18, UFA, and C18 and CLA unsaturation indices. SCD1 293V
allele in winter as well as in summer milk samples was negatively associated with
C18:0, C10:1 to C14:1cis-9, C18:1trans-11, and C10 to C14 unsaturation indices, and
positively associated with C8:0 to C14:0, C16:1cis-9, and C16 to CLA unsaturation
indices. In addition, significant DGAT1 K232A by season interaction was found for
some FA and SCD1 A293V by season interaction was only found for C18:1trans-11.
These interactions were due to scaling of genotype effects.
Key words: genetic correlation, seasonal variation, DGAT1, SCD1
2 Milk-fat composition in winter and summer
23
2.1 Introduction
Milk is an important source of lipids, proteins, vitamins and minerals in many
Western human diets. Among the milk produced by the main dairy species (e.g.,
cows, goats and sheep), bovine milk is economically the most important. Bovine milk
fat contains essential nutrients including fat soluble vitamins and bio-active lipids
(German & Dillard, 2006) and is pointed out by FAO (2008) as being the main source
of saturated fatty acids (SFA) in human diets.
Genetic factors can influence milk fat composition, and its genetic variation has been
reported in previous studies (e.g., Soyeurt et al., 2006; Schennink et al., 2007). Stoop
et al. (2008) concluded that short and medium chain fatty acids (FA) synthesized de
novo are more affected by genetic factors than long chain FA that originate from the
cow’s diet or from mobilization of body fat (Chilliard et al., 2000; Palmquist, 2006).
Moreover, polymorphisms in DGAT1 and SCD1 genes have been recognized as having
large effects on milk fat composition (Moioli et al., 2007; Schennink et al., 2007;
2008).
In addition, nutrition of dairy cows can considerably alter milk fat composition (e.g.,
Palmquist et al., 1993; Lock & Bauman, 2004; Chilliard et al., 2007). It is well
established that feeding dairy cows with polyunsaturated fatty acids (PUFA) that
originate from forages results in a reduction of de novo synthesized FA and in an
increase of long chain FA in milk fat (e.g., Chilliard et al., 2001; Bauman and Griinari,
2003). Furthermore, there are indications that nutrition affects mammary lipogenic
gene expression (Bernard et al., 2008; Mach et al., 2011).
Substantial seasonal variation in milk fat composition has been found in European
countries (Precht and Molketin, 2000; Thorsdottir et al., 2004; Heck et al., 2009). The
main cause for this seasonal variation seems to be the differences in diets: in winter
cows in Northern Europe are usually kept inside and fed silage whereas in summer
cows are mainly on pasture and fed with fresh grass. These considerable differences
in diets might affect the genetic background of milk fat composition. However, at
present no information is available of possible genotype by season interaction on
milk fat composition. Therefore, our aim was to study whether winter milk fat
composition is genetically the same trait as summer milk fat composition. For this
purpose, we estimated heritabilities, genetic correlations, effects of DGAT1 K232A
and SCD1 A293V polymorphisms for milk fat composition in winter and summer, and
2 Milk-fat composition in winter and summer
24
tested for genotype by season interactions of DGAT1 K232A and SCD1 A293V
polymorphisms.
2.2 Materials and methods
This study is part of the Dutch Milk Genomics Initiative, which was initiated to
identify opportunities to change milk composition through breeding. Based on data
collected in this project, heritability estimates for milk fat composition based on
winter milk samples have been published by Stoop et al. (2008) and effects of
polymorphisms in the DGAT1 and SCD1 genes on milk fat composition based on
winter samples have been published by Schennink et al. (2007; 2008). In the present
study, heritability estimates for milk fat composition in winter and summer were
obtained using a bivariate approach. Furthermore, to test whether winter milk fat
composition is genetically the same trait as summer milk fat composition, we
estimated genetic correlations between milk fat composition in winter and summer
and, more specifically, we tested for DGAT1 and SCD1 by season interactions.
2.2.1 Animals
Data were available on 2,001 first lactation Holstein Friesian cows from 398
commercial herds in the Netherlands. Winter records were available from 1,905
cows, with each cow between 63 and 282 days in lactation. Summer records were
available from 1,795 cows, with each cow between 97 and 335 days in lactation. A
total of 1,699 cows had both a winter and a summer record, 206 animals had only a
winter milk sample and 96 animals had only a summer sample. Details about the
experimental design can be found in Stoop et al. (2008). In total 3,700 records on
milk fat composition were available.
2.2.2 Phenotypes
One milk sample of 500 mL per cow per season was collected during morning milking
between February and March 2005 (“winter”) and between May and June 2005
(“summer”). Sample bottles contained sodium azide (0.03 w/w%) for conservation.
Fat percentage (fat%) was measured by infrared spectroscopy using a MilkoScan
FT6000 (Foss Electric, Hillerod, Denmark) at the Milk Control Station (Qlip, Zutphen,
the Netherlands). Milk fat composition was measured by gas chromatography (GC)
at the COKZ laboratory (Qlip, Leudsen, the Netherlands), as described by Schennink
et al. (2007). The fatty acids were identified and quantified by comparing the methyl
ester chromatograms of the milk fat samples with the chromatograms of pure FA
2 Milk-fat composition in winter and summer
25
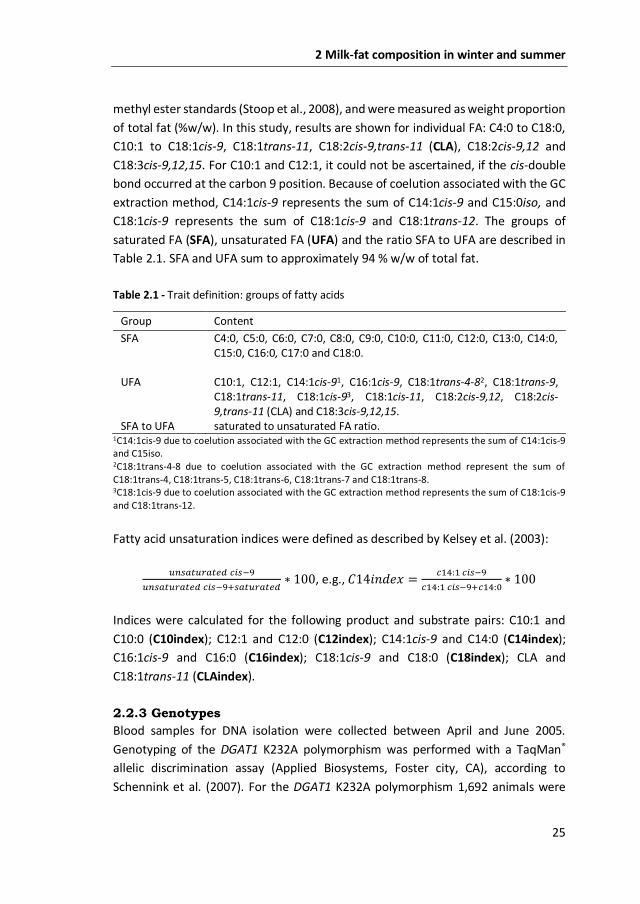
methyl ester standards (Stoop et al., 2008), and were measured as weight proportion
of total fat (%w/w). In this study, results are shown for individual FA: C4:0 to C18:0,
C10:1 to C18:1cis-9, C18:1trans-11, C18:2cis-9,trans-11 (CLA), C18:2cis-9,12 and
C18:3cis-9,12,15. For C10:1 and C12:1, it could not be ascertained, if the cis-double
bond occurred at the carbon 9 position. Because of coelution associated with the GC
extraction method, C14:1cis-9 represents the sum of C14:1cis-9 and C15:0iso, and
C18:1cis-9 represents the sum of C18:1cis-9 and C18:1trans-12. The groups of
saturated FA (SFA), unsaturated FA (UFA) and the ratio SFA to UFA are described in
Table 2.1. SFA and UFA sum to approximately 94 % w/w of total fat.
Table 2.1 - Trait definition: groups of fatty acids
1C14:1cis-9 due to coelution associated with the GC extraction method represents the sum of C14:1cis-9 and C15iso. 2C18:1trans-4-8 due to coelution associated with the GC extraction method represent the sum of C18:1trans-4, C18:1trans-5, C18:1trans-6, C18:1trans-7 and C18:1trans-8. 3C18:1cis-9 due to coelution associated with the GC extraction method represents the sum of C18:1cis-9 and C18:1trans-12.
Fatty acid unsaturation indices were defined as described by Kelsey et al. (2003):
𝑢𝑛𝑠𝑎𝑡𝑢𝑟𝑎𝑡𝑒𝑑 𝑐𝑖𝑠−9
𝑢𝑛𝑠𝑎𝑡𝑢𝑟𝑎𝑡𝑒𝑑 𝑐𝑖𝑠−9+𝑠𝑎𝑡𝑢𝑟𝑎𝑡𝑒𝑑∗ 100, e.g., 𝐶14𝑖𝑛𝑑𝑒𝑥 =
𝑐14:1 𝑐𝑖𝑠−9
𝑐14:1 𝑐𝑖𝑠−9+𝑐14:0∗ 100
Indices were calculated for the following product and substrate pairs: C10:1 and
C10:0 (C10index); C12:1 and C12:0 (C12index); C14:1cis-9 and C14:0 (C14index);
C16:1cis-9 and C16:0 (C16index); C18:1cis-9 and C18:0 (C18index); CLA and
C18:1trans-11 (CLAindex).
2.2.3 Genotypes
Blood samples for DNA isolation were collected between April and June 2005.
Genotyping of the DGAT1 K232A polymorphism was performed with a TaqMan®
allelic discrimination assay (Applied Biosystems, Foster city, CA), according to
Schennink et al. (2007). For the DGAT1 K232A polymorphism 1,692 animals were
Group Content
SFA C4:0, C5:0, C6:0, C7:0, C8:0, C9:0, C10:0, C11:0, C12:0, C13:0, C14:0, C15:0, C16:0, C17:0 and C18:0.
UFA C10:1, C12:1, C14:1cis-91, C16:1cis-9, C18:1trans-4-82, C18:1trans-9,
C18:1trans-11, C18:1cis-93, C18:1cis-11, C18:2cis-9,12, C18:2cis-9,trans-11 (CLA) and C18:3cis-9,12,15.
SFA to UFA saturated to unsaturated FA ratio.
2 Milk-fat composition in winter and summer
26
genotyped, whereas for 103 animals no genotypes were available either because no
DNA was available (N = 92) or because the genotyping was ambiguous (N = 11).
Genotypes for the SCD1 A293V polymorphism were assayed with the SNaPshot®
single base primer extension method (Applied Biosystems, Foster city, CA), according
to Schennink et al. (2008). For the SCD1 A293V polymorphism 1,637 animals were
genotyped, whereas for 158 animals no genotypes were available either because no
DNA was available (N = 92) or the sample was genotyped ambiguously (N = 66).
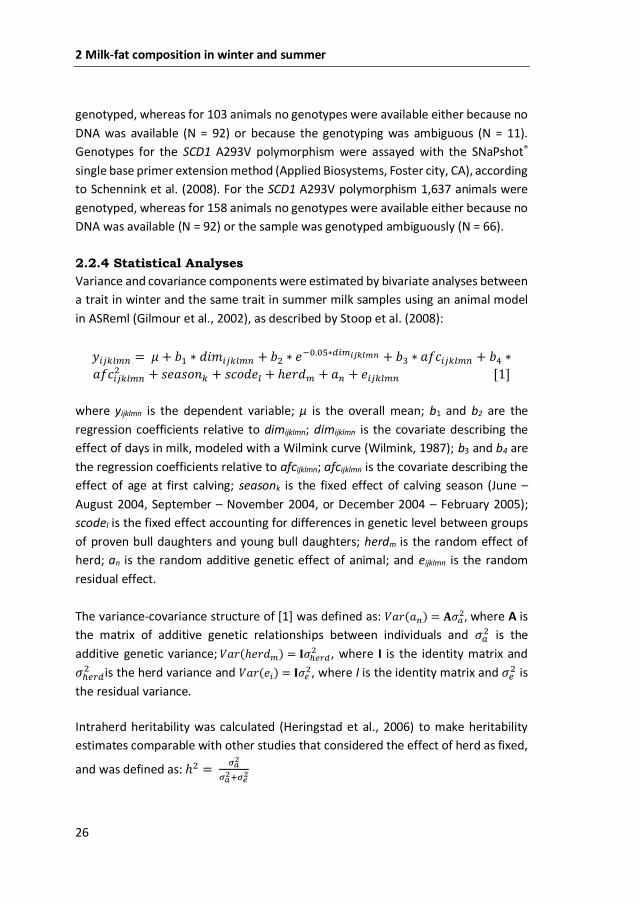
2.2.4 Statistical Analyses
Variance and covariance components were estimated by bivariate analyses between
a trait in winter and the same trait in summer milk samples using an animal model
in ASReml (Gilmour et al., 2002), as described by Stoop et al. (2008):
𝑦𝑖𝑗𝑘𝑙𝑚𝑛 = 𝜇 + 𝑏1 ∗ 𝑑𝑖𝑚𝑖𝑗𝑘𝑙𝑚𝑛 + 𝑏2 ∗ 𝑒−0.05∗𝑑𝑖𝑚𝑖𝑗𝑘𝑙𝑚𝑛 + 𝑏3 ∗ 𝑎𝑓𝑐𝑖𝑗𝑘𝑙𝑚𝑛 + 𝑏4 ∗
𝑎𝑓𝑐𝑖𝑗𝑘𝑙𝑚𝑛2 + 𝑠𝑒𝑎𝑠𝑜𝑛𝑘 + 𝑠𝑐𝑜𝑑𝑒𝑙 + ℎ𝑒𝑟𝑑𝑚 + 𝑎𝑛 + 𝑒𝑖𝑗𝑘𝑙𝑚𝑛 [1]
where yijklmn is the dependent variable; µ is the overall mean; b1 and b2 are the
regression coefficients relative to dimijklmn; dimijklmn is the covariate describing the
effect of days in milk, modeled with a Wilmink curve (Wilmink, 1987); b3 and b4 are
the regression coefficients relative to afcijklmn; afcijklmn is the covariate describing the
effect of age at first calving; seasonk is the fixed effect of calving season (June –
August 2004, September – November 2004, or December 2004 – February 2005);
scodel is the fixed effect accounting for differences in genetic level between groups
of proven bull daughters and young bull daughters; herdm is the random effect of
herd; an is the random additive genetic effect of animal; and eijklmn is the random
residual effect.
The variance-covariance structure of [1] was defined as: 𝑉𝑎𝑟(𝑎𝑛) = 𝐀𝜎𝑎2, where A is
the matrix of additive genetic relationships between individuals and 𝜎𝑎2 is the
additive genetic variance; 𝑉𝑎𝑟(ℎ𝑒𝑟𝑑𝑚) = 𝐈𝜎ℎ𝑒𝑟𝑑2 , where I is the identity matrix and
𝜎ℎ𝑒𝑟𝑑2 is the herd variance and 𝑉𝑎𝑟(𝑒𝑖) = 𝐈𝜎𝑒
2, where I is the identity matrix and 𝜎𝑒2 is
the residual variance.
Intraherd heritability was calculated (Heringstad et al., 2006) to make heritability
estimates comparable with other studies that considered the effect of herd as fixed,
and was defined as: ℎ2 = 𝜎𝑎
2
𝜎𝑎2+𝜎𝑒
2
2 Milk-fat composition in winter and summer
27
The fraction of variance due to herd reflects the relative importance of herd effects
such as feed and management practices, and was defined as: ℎ𝑒𝑟𝑑 =𝜎ℎ𝑒𝑟𝑑
2
𝜎𝑎2+𝜎ℎ𝑒𝑟𝑑
2 +𝜎𝑒2 .
Phenotypic, genetic, herd and residual correlations between a trait in winter and the
same trait in summer milk samples were calculated as: 𝑟 =𝜎𝑇𝑤,𝑇𝑠
√(𝜎𝑇𝑤2 ∗𝜎𝑇𝑠
2 )
, where
𝜎𝑇𝑤,𝑇𝑠 = covariance between the same trait measured in winter and summer milk
samples; 𝜎𝑇𝑤 2 = variance of the trait in winter samples and 𝜎𝑇𝑠
2 = variance of the trait
in summer samples. The genetic correlation between a trait measured in two
different environments can be used to assess genotype by environment interaction
(e.g. Falconer and Mackay, 1996). We followed this approach to assess whether milk
fat composition in winter and summer milk is genetically the same trait. Significance
of genetic correlations was based on the likelihood ratio test, in which the likelihood
of the full model was compared to the likelihood of a model with restricted genetic
correlation of 0.995. A value of 0.995 was chosen because restricting the genetic
correlation to 1 leads to singularity. Significance of the likelihood ratio test was based
on a Chi-Square distribution with one degree of freedom.
Model [1] was extended with a fixed genotype effect to estimate effects of DGAT1
(KK, KA or AA genotypes) or SCD1 (AA, AV or VV genotypes), and to estimate DGAT1
or SCD1 by season interactions. Animals with missing genotypes were assigned to a
separate genotype class. Missing genotypes appeared to be randomly distributed
across other effects in the model.
2.3 Results
2.3.1 Milk-fat composition in winter and summer
Phenotypic means for fat composition in winter and summer milk samples are shown
in Table 2.2. In summer milk, short chain FA (C4:0 to C12:0) contributed 13.67% to
total fat, medium chain FA (C14:0 and C16:0) contributed 40.32% and C18:0
contributed 9.88%. Among the unsaturated C18 FA, the largest fraction was C18:1cis-
9 (20.56%). Fat% was slightly higher in winter (4.36) as compared to summer milk
(4.26; P=2.4e-5). The largest differences in summer compared to winter milk were a
3.42%w/w decrease in C16:0 (P<0.001), a 2.38%w/w increase in C18:1cis-9 (P<0.001)
and a 1.16%w/w increase in C18:0 (P<0.001). Furthermore, relatively large increases
could also be seen for C18:1trans-11 (+0.45%w/w), CLA (+0.17%w/w) and C18:3cis-
9,12,15 (+0.07%w/w; P<0.001). In addition, a 3.39%w/w decrease in SFA and a
2 Milk-fat composition in winter and summer
28
3.00%w/w increase in UFA were observed (P<0.001). Among unsaturation indices,
increases for C14index (+0.49%w/w) and C16index (+0.37%w/w), and a decrease in
CLAindex (2.10%w/w) were seen in summer compared to winter milk (P<0.001).
Standard deviations of unadjusted FA were on average 20% larger in summer than
in winter milk.
2.3.2 Heritability estimates and variance components
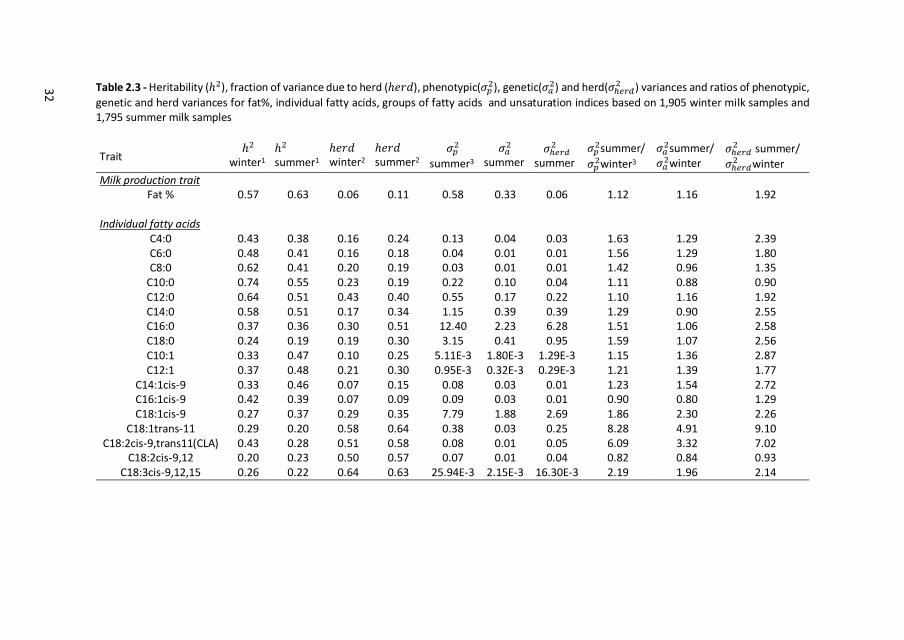
Heritability (ℎ2), the fraction of variance due to herd (ℎ𝑒𝑟𝑑), and the ratios of
phenotypic, genetic and herd variances for milk fat composition in winter and
summer are shown in Table 2.3. In winter milk, moderate to high heritability
estimates were found for fat%, short chain FA (C4:0 to C12:0), medium chain FA
(C14:0 and C16:0), C12:1, C16:1cis-9, CLA, and C12 to C18 unsaturation indices. In
summer milk, moderate to high heritability estimates were found for fat%, short
chain FA (C4:0 to C12:0), medium chain FA (C14:0 and C16:0), C10:1 to C18:1cis-9,
and C10 to C14 unsaturation indices. In general, heritability estimates for winter and
summer milk were very similar.
Fraction of variance due to herd (ℎ𝑒𝑟𝑑) in winter milk was moderate to high for
C12:0, and most unsaturated C18 FA. H𝑒𝑟𝑑 in summer milk was moderate to high
for C12:0, C16:0, unsaturated C18 FA, and groups of FA. In general, ℎ𝑒𝑟𝑑 was higher
in summer compared to winter milk for most FA, groups of FA, and all unsaturation
indices.
Differences in ℎ2 and ℎ𝑒𝑟𝑑 for milk fat composition between winter and summer
can either be the result of changes in additive genetic, herd or residual variance.
Therefore, we also compared the magnitude of the individual variance components
in winter and in summer milk. In summer, 𝜎𝑎2 was considerably higher for C18:1trans-
11 and CLA compared to winter milk. For most FA, 𝜎ℎ𝑒𝑟𝑑2
was substantially higher in
summer compared to winter milk, especially for C18:1trans-11, CLA, and SFA.
2.3.3 Correlations between milk-fat composition in winter and
summer
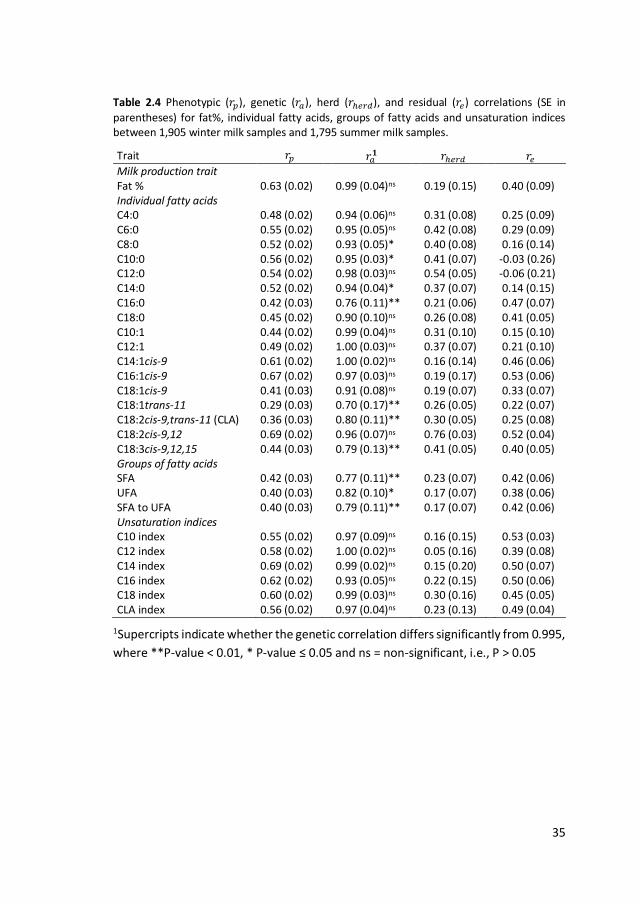
The phenotypic, genetic, herd and residual correlations between winter and summer
milk fat composition are shown in Table 2.4. The phenotypic correlations ranged
from 0.29 for C18:1trans-11 to 0.69 for C18:2cis-9,12 and C14index, indicating that
phenotypic correlation between winter and summer milk for individual FA is in the
same order of magnitude as the phenotypic correlation for fat% (0.63). Genetic
2 Milk-fat composition in winter and summer
29
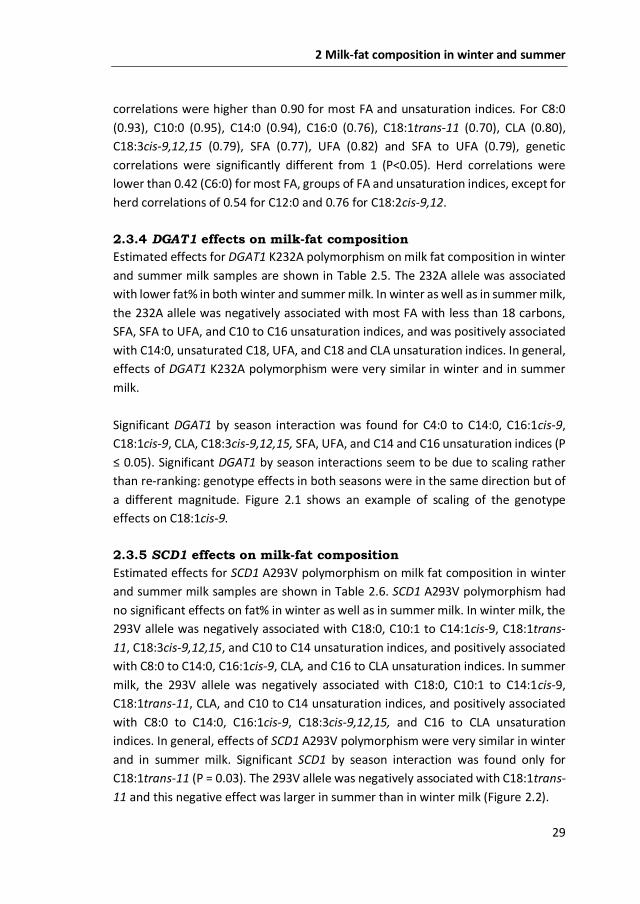
correlations were higher than 0.90 for most FA and unsaturation indices. For C8:0
(0.93), C10:0 (0.95), C14:0 (0.94), C16:0 (0.76), C18:1trans-11 (0.70), CLA (0.80),
C18:3cis-9,12,15 (0.79), SFA (0.77), UFA (0.82) and SFA to UFA (0.79), genetic
correlations were significantly different from 1 (P<0.05). Herd correlations were
lower than 0.42 (C6:0) for most FA, groups of FA and unsaturation indices, except for
herd correlations of 0.54 for C12:0 and 0.76 for C18:2cis-9,12.
2.3.4 DGAT1 effects on milk-fat composition
Estimated effects for DGAT1 K232A polymorphism on milk fat composition in winter
and summer milk samples are shown in Table 2.5. The 232A allele was associated
with lower fat% in both winter and summer milk. In winter as well as in summer milk,
the 232A allele was negatively associated with most FA with less than 18 carbons,
SFA, SFA to UFA, and C10 to C16 unsaturation indices, and was positively associated
with C14:0, unsaturated C18, UFA, and C18 and CLA unsaturation indices. In general,
effects of DGAT1 K232A polymorphism were very similar in winter and in summer
milk.
Significant DGAT1 by season interaction was found for C4:0 to C14:0, C16:1cis-9,
C18:1cis-9, CLA, C18:3cis-9,12,15, SFA, UFA, and C14 and C16 unsaturation indices (P
≤ 0.05). Significant DGAT1 by season interactions seem to be due to scaling rather
than re-ranking: genotype effects in both seasons were in the same direction but of
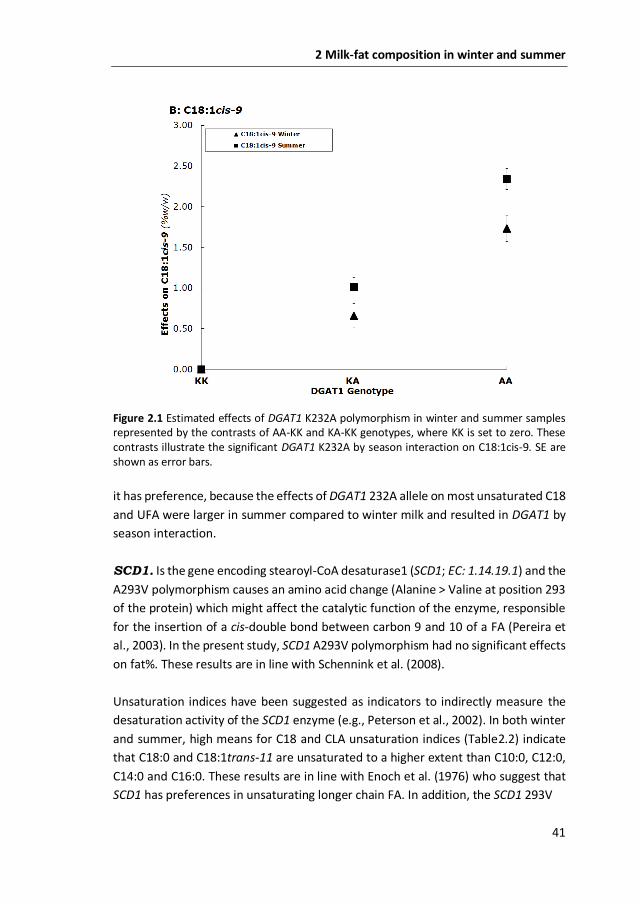
a different magnitude. Figure 2.1 shows an example of scaling of the genotype
effects on C18:1cis-9.
2.3.5 SCD1 effects on milk-fat composition
Estimated effects for SCD1 A293V polymorphism on milk fat composition in winter
and summer milk samples are shown in Table 2.6. SCD1 A293V polymorphism had
no significant effects on fat% in winter as well as in summer milk. In winter milk, the
293V allele was negatively associated with C18:0, C10:1 to C14:1cis-9, C18:1trans-
11, C18:3cis-9,12,15, and C10 to C14 unsaturation indices, and positively associated
with C8:0 to C14:0, C16:1cis-9, CLA, and C16 to CLA unsaturation indices. In summer
milk, the 293V allele was negatively associated with C18:0, C10:1 to C14:1cis-9,
C18:1trans-11, CLA, and C10 to C14 unsaturation indices, and positively associated
with C8:0 to C14:0, C16:1cis-9, C18:3cis-9,12,15, and C16 to CLA unsaturation
indices. In general, effects of SCD1 A293V polymorphism were very similar in winter
and in summer milk. Significant SCD1 by season interaction was found only for
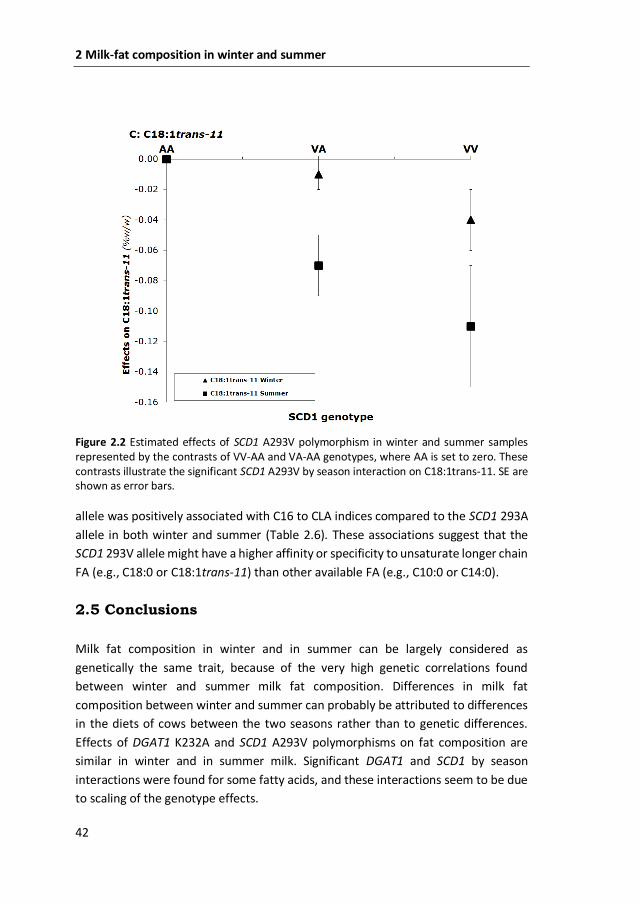
C18:1trans-11 (P = 0.03). The 293V allele was negatively associated with C18:1trans-
11 and this negative effect was larger in summer than in winter milk (Figure 2.2).
2 Milk-fat composition in winter and summer
30
2.4 Discussion
Heritability estimates for fat composition in winter and summer milk were very
similar, and estimates of winter milk are comparable with results published by Stoop
et al. (2008) , which are based on univariate analyses. Intraherd heritability estimates
in our study are higher than estimates reported by others (Renner and Kosmack,
1974; Karijord et al., 1982, Soyeurt et al., 2008). This might be because these studies
used different methods to measure FA, or studied different breeds.
Genetic correlations between winter and summer milk were high for all FA,
indicating that milk fat composition in winter and in summer can be largely
considered as genetically the same trait. Effects of DGAT1 K232A and SCD1 A293V
polymorphisms on milk fat composition in winter and in summer were similar and
their effects in summer milk confirm the results of Schennink et al. (2007; 2008) for
winter milk. The results also showed several differences between winter and
summer milk, which will be discussed in more detail.
2.4.1 Effects of season on milk-fat composition
Summer milk contained larger proportions of C18:0 and unsaturated C18, and
smaller proportions of short and medium chain FA compared to winter milk, which
is in agreement with literature (Palmquist et al., 1993; Soyeurt et al., 2008; Heck et
al., 2009). Differences between winter and summer milk fat in our study could be
partly due to differences in lactation stage, as cows in summer were on average 80
days later in lactation than in winter (247 versus 167 days). Effects of lactation stage
were accounted for in the statistical analysis and are known to be relatively small
(Kelsey et al., 2003; Stoop et al., 2008). Therefore, we expect that it has not
influenced our results.
31
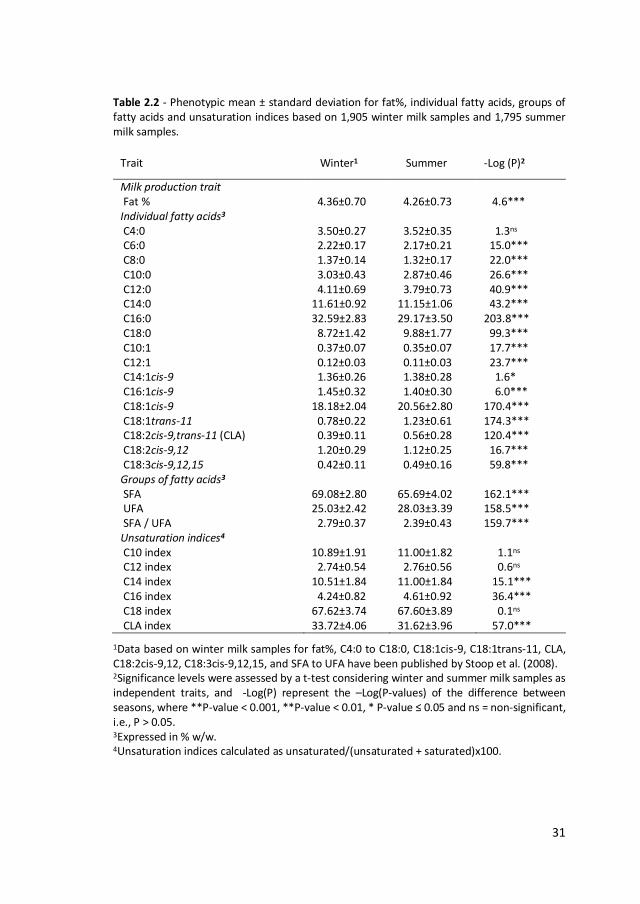
Table 2.2 - Phenotypic mean ± standard deviation for fat%, individual fatty acids, groups of fatty acids and unsaturation indices based on 1,905 winter milk samples and 1,795 summer milk samples.
Trait Winter1 Summer -Log (P)2
Milk production trait Fat % 4.36±0.70 4.26±0.73 4.6*** Individual fatty acids3 C4:0 3.50±0.27 3.52±0.35 1.3ns C6:0 2.22±0.17 2.17±0.21 15.0*** C8:0 1.37±0.14 1.32±0.17 22.0*** C10:0 3.03±0.43 2.87±0.46 26.6*** C12:0 4.11±0.69 3.79±0.73 40.9*** C14:0 11.61±0.92 11.15±1.06 43.2*** C16:0 32.59±2.83 29.17±3.50 203.8*** C18:0 8.72±1.42 9.88±1.77 99.3*** C10:1 0.37±0.07 0.35±0.07 17.7*** C12:1 0.12±0.03 0.11±0.03 23.7*** C14:1cis-9 1.36±0.26 1.38±0.28 1.6* C16:1cis-9 1.45±0.32 1.40±0.30 6.0*** C18:1cis-9 18.18±2.04 20.56±2.80 170.4*** C18:1trans-11 0.78±0.22 1.23±0.61 174.3*** C18:2cis-9,trans-11 (CLA) 0.39±0.11 0.56±0.28 120.4*** C18:2cis-9,12 1.20±0.29 1.12±0.25 16.7*** C18:3cis-9,12,15 0.42±0.11 0.49±0.16 59.8*** Groups of fatty acids3 SFA 69.08±2.80 65.69±4.02 162.1*** UFA 25.03±2.42 28.03±3.39 158.5*** SFA / UFA 2.79±0.37 2.39±0.43 159.7*** Unsaturation indices4 C10 index 10.89±1.91 11.00±1.82 1.1ns C12 index 2.74±0.54 2.76±0.56 0.6ns C14 index 10.51±1.84 11.00±1.84 15.1*** C16 index 4.24±0.82 4.61±0.92 36.4*** C18 index 67.62±3.74 67.60±3.89 0.1ns CLA index 33.72±4.06 31.62±3.96 57.0***
1Data based on winter milk samples for fat%, C4:0 to C18:0, C18:1cis-9, C18:1trans-11, CLA, C18:2cis-9,12, C18:3cis-9,12,15, and SFA to UFA have been published by Stoop et al. (2008). 2Significance levels were assessed by a t-test considering winter and summer milk samples as independent traits, and -Log(P) represent the –Log(P-values) of the difference between seasons, where **P-value < 0.001, **P-value < 0.01, * P-value ≤ 0.05 and ns = non-significant, i.e., P > 0.05. 3Expressed in % w/w. 4Unsaturation indices calculated as unsaturated/(unsaturated + saturated)x100.
32
Table 2.3 - Heritability (ℎ2), fraction of variance due to herd (ℎ𝑒𝑟𝑑), phenotypic(𝜎𝑝2), genetic(𝜎𝑎
2) and herd(𝜎ℎ𝑒𝑟𝑑2 ) variances and ratios of phenotypic,
genetic and herd variances for fat%, individual fatty acids, groups of fatty acids and unsaturation indices based on 1,905 winter milk samples and 1,795 summer milk samples
Trait ℎ2
winter1 ℎ2 summer1
ℎ𝑒𝑟𝑑 winter2
ℎ𝑒𝑟𝑑 summer2
𝜎𝑝2
summer3
𝜎𝑎2
summer 𝜎ℎ𝑒𝑟𝑑
2 summer
𝜎𝑝2summer/
𝜎𝑝2winter3
𝜎𝑎2summer/
𝜎𝑎2winter
𝜎ℎ𝑒𝑟𝑑2 summer/
𝜎ℎ𝑒𝑟𝑑2 winter
Milk production trait Fat % 0.57 0.63 0.06 0.11 0.58 0.33 0.06 1.12 1.16 1.92
Individual fatty acids
C4:0 0.43 0.38 0.16 0.24 0.13 0.04 0.03 1.63 1.29 2.39 C6:0 0.48 0.41 0.16 0.18 0.04 0.01 0.01 1.56 1.29 1.80 C8:0 0.62 0.41 0.20 0.19 0.03 0.01 0.01 1.42 0.96 1.35
C10:0 0.74 0.55 0.23 0.19 0.22 0.10 0.04 1.11 0.88 0.90 C12:0 0.64 0.51 0.43 0.40 0.55 0.17 0.22 1.10 1.16 1.92 C14:0 0.58 0.51 0.17 0.34 1.15 0.39 0.39 1.29 0.90 2.55 C16:0 0.37 0.36 0.30 0.51 12.40 2.23 6.28 1.51 1.06 2.58 C18:0 0.24 0.19 0.19 0.30 3.15 0.41 0.95 1.59 1.07 2.56 C10:1 0.33 0.47 0.10 0.25 5.11E-3 1.80E-3 1.29E-3 1.15 1.36 2.87 C12:1 0.37 0.48 0.21 0.30 0.95E-3 0.32E-3 0.29E-3 1.21 1.39 1.77
C14:1cis-9 0.33 0.46 0.07 0.15 0.08 0.03 0.01 1.23 1.54 2.72 C16:1cis-9 0.42 0.39 0.07 0.09 0.09 0.03 0.01 0.90 0.80 1.29 C18:1cis-9 0.27 0.37 0.29 0.35 7.79 1.88 2.69 1.86 2.30 2.26
C18:1trans-11 0.29 0.20 0.58 0.64 0.38 0.03 0.25 8.28 4.91 9.10 C18:2cis-9,trans11(CLA) 0.43 0.28 0.51 0.58 0.08 0.01 0.05 6.09 3.32 7.02
C18:2cis-9,12 0.20 0.23 0.50 0.57 0.07 0.01 0.04 0.82 0.84 0.93 C18:3cis-9,12,15 0.26 0.22 0.64 0.63 25.94E-3 2.15E-3 16.30E-3 2.19 1.96 2.14
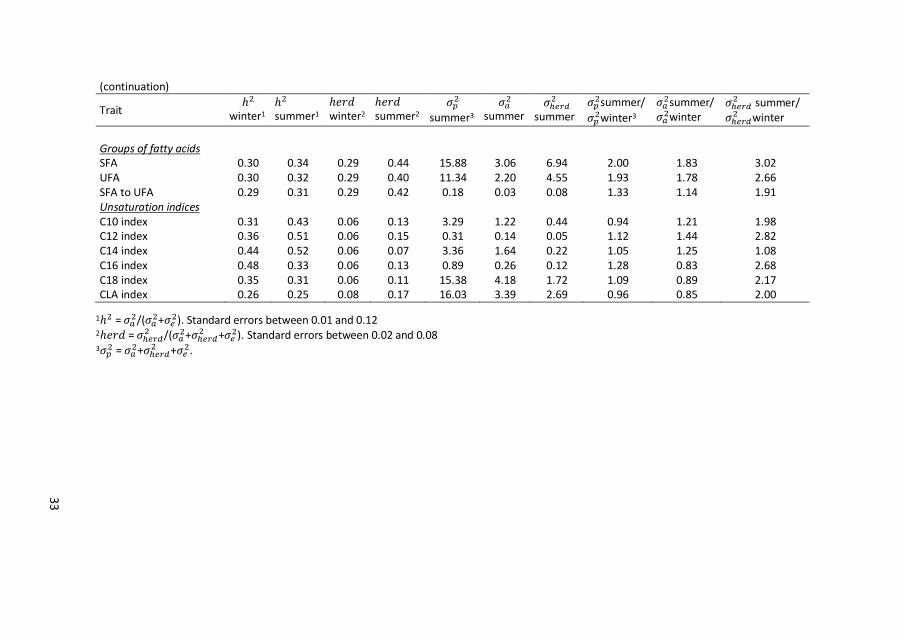
33
(continuation)
Trait ℎ2
winter1 ℎ2 summer1
ℎ𝑒𝑟𝑑 winter2
ℎ𝑒𝑟𝑑 summer2
𝜎𝑝2
summer3
𝜎𝑎2
summer 𝜎ℎ𝑒𝑟𝑑
2 summer
𝜎𝑝2summer/
𝜎𝑝2winter3
𝜎𝑎2summer/
𝜎𝑎2winter
𝜎ℎ𝑒𝑟𝑑2 summer/
𝜎ℎ𝑒𝑟𝑑2 winter
Groups of fatty acids SFA 0.30 0.34 0.29 0.44 15.88 3.06 6.94 2.00 1.83 3.02 UFA 0.30 0.32 0.29 0.40 11.34 2.20 4.55 1.93 1.78 2.66 SFA to UFA 0.29 0.31 0.29 0.42 0.18 0.03 0.08 1.33 1.14 1.91 Unsaturation indices C10 index 0.31 0.43 0.06 0.13 3.29 1.22 0.44 0.94 1.21 1.98 C12 index 0.36 0.51 0.06 0.15 0.31 0.14 0.05 1.12 1.44 2.82 C14 index 0.44 0.52 0.06 0.07 3.36 1.64 0.22 1.05 1.25 1.08 C16 index 0.48 0.33 0.06 0.13 0.89 0.26 0.12 1.28 0.83 2.68 C18 index 0.35 0.31 0.06 0.11 15.38 4.18 1.72 1.09 0.89 2.17 CLA index 0.26 0.25 0.08 0.17 16.03 3.39 2.69 0.96 0.85 2.00
1ℎ2 = 𝜎𝑎2/(𝜎𝑎
2+𝜎𝑒2). Standard errors between 0.01 and 0.12
2ℎ𝑒𝑟𝑑 = 𝜎ℎ𝑒𝑟𝑑2 /(𝜎𝑎
2+𝜎ℎ𝑒𝑟𝑑2 +𝜎𝑒
2). Standard errors between 0.02 and 0.08 3𝜎𝑝
2 = 𝜎𝑎2+𝜎ℎ𝑒𝑟𝑑
2 +𝜎𝑒2.
2 Milk-fat composition in winter and summer
34
Seasonal variation in milk fat composition seems to be the result of pasture grazing
of dairy cows in summer compared to winter (Precht and Molketin, 2000; Thorsdottir
et al., 2004). Grazing or availability of fresh cut grass in summer will result in a
different dietary supply of FA, because fresh cut grass contains more PUFA than
conserved forages which are affected by decreases in the leaf/stem ratio during the
maturation period (Dewhurst et al., 2001). It is well known that supply of PUFA
through the diet of dairy cows decreases de novo synthesized FA and increases long
chain FA in milk fat (e.g., Chilliard et al., 2001; Agenas et al, 2002; Bernard et al,
2008). Therefore, our observation that summer milk had higher amounts of long
chain FA and lower amounts of de novo synthesized FA compared to winter milk is
probably because about 50% of the cows in our experiment had access to pasture in
summer (3.5 to 24 hours/day), whereas all cows were kept indoors in winter.
Differences in dietary supply of FA between winter and summer are also reflected by
our relatively low herd correlations between milk fat composition in winter and
summer milk. This suggests that effect of herd, of which diet is part, on milk fat
composition is not constant over the year. This might be related to the considerably
higher herd variances in summer compared to winter milk found in our results.
Variation due to herd might be due to several factors, however, differences in
feeding regimes between and within herds play a major role. Larger herd variances
in summer are most likely due to larger differences in feeding strategies between
herds as well as within a herd: apparently the quantity and composition of forages,
either fresh or conserved, varies more between herds and within a herd in summer
compared to winter.
In contrast, herd correlations found in our study for C12:0 and for C18:2cis-9,12 were
higher than for other FA, probably because the supply of these FA on a herd were
relatively constant during the year. Most concentrate feed supplied to Dutch dairy
cows have high concentration of C12:0, due to the presence of ingredients such as
palm kernel expeller (47%) and extracted coconut (48%) both rich in C12:0
(Grummer, 1991; Heck et al., 2009). The high herd correlation for C12:0 might be
because on a herd the same type of concentrate is fed to cows in both winter and
summer. C18:2cis-9,12 is one of the major PUFA found in maize silage (Chilliard et
al., 2001, Khanal et al., 2008). The high herd correlation for this FA suggest that herds
that feed maize silage do this in winter as well as in summer.
35
Table 2.4 Phenotypic (𝑟𝑝), genetic (𝑟𝑎), herd (𝑟ℎ𝑒𝑟𝑑), and residual (𝑟𝑒) correlations (SE in
parentheses) for fat%, individual fatty acids, groups of fatty acids and unsaturation indices between 1,905 winter milk samples and 1,795 summer milk samples.
Trait 𝑟𝑝 𝑟𝑎𝟏 𝑟ℎ𝑒𝑟𝑑 𝑟𝑒
Milk production trait Fat % 0.63 (0.02) 0.99 (0.04)ns 0.19 (0.15) 0.40 (0.09) Individual fatty acids C4:0 0.48 (0.02) 0.94 (0.06)ns 0.31 (0.08) 0.25 (0.09) C6:0 0.55 (0.02) 0.95 (0.05)ns 0.42 (0.08) 0.29 (0.09) C8:0 0.52 (0.02) 0.93 (0.05)* 0.40 (0.08) 0.16 (0.14) C10:0 0.56 (0.02) 0.95 (0.03)* 0.41 (0.07) -0.03 (0.26) C12:0 0.54 (0.02) 0.98 (0.03)ns 0.54 (0.05) -0.06 (0.21) C14:0 0.52 (0.02) 0.94 (0.04)* 0.37 (0.07) 0.14 (0.15) C16:0 0.42 (0.03) 0.76 (0.11)** 0.21 (0.06) 0.47 (0.07) C18:0 0.45 (0.02) 0.90 (0.10)ns 0.26 (0.08) 0.41 (0.05) C10:1 0.44 (0.02) 0.99 (0.04)ns 0.31 (0.10) 0.15 (0.10) C12:1 0.49 (0.02) 1.00 (0.03)ns 0.37 (0.07) 0.21 (0.10) C14:1cis-9 0.61 (0.02) 1.00 (0.02)ns 0.16 (0.14) 0.46 (0.06) C16:1cis-9 0.67 (0.02) 0.97 (0.03)ns 0.19 (0.17) 0.53 (0.06) C18:1cis-9 0.41 (0.03) 0.91 (0.08)ns 0.19 (0.07) 0.33 (0.07) C18:1trans-11 0.29 (0.03) 0.70 (0.17)** 0.26 (0.05) 0.22 (0.07) C18:2cis-9,trans-11 (CLA) 0.36 (0.03) 0.80 (0.11)** 0.30 (0.05) 0.25 (0.08) C18:2cis-9,12 0.69 (0.02) 0.96 (0.07)ns 0.76 (0.03) 0.52 (0.04) C18:3cis-9,12,15 0.44 (0.03) 0.79 (0.13)** 0.41 (0.05) 0.40 (0.05) Groups of fatty acids SFA 0.42 (0.03) 0.77 (0.11)** 0.23 (0.07) 0.42 (0.06) UFA 0.40 (0.03) 0.82 (0.10)* 0.17 (0.07) 0.38 (0.06) SFA to UFA 0.40 (0.03) 0.79 (0.11)** 0.17 (0.07) 0.42 (0.06) Unsaturation indices C10 index 0.55 (0.02) 0.97 (0.09)ns 0.16 (0.15) 0.53 (0.03) C12 index 0.58 (0.02) 1.00 (0.02)ns 0.05 (0.16) 0.39 (0.08) C14 index 0.69 (0.02) 0.99 (0.02)ns 0.15 (0.20) 0.50 (0.07) C16 index 0.62 (0.02) 0.93 (0.05)ns 0.22 (0.15) 0.50 (0.06) C18 index 0.60 (0.02) 0.99 (0.03)ns 0.30 (0.16) 0.45 (0.05) CLA index 0.56 (0.02) 0.97 (0.04)ns 0.23 (0.13) 0.49 (0.04)
1Supercripts indicate whether the genetic correlation differs significantly from 0.995,
where **P-value < 0.01, * P-value ≤ 0.05 and ns = non-significant, i.e., P > 0.05
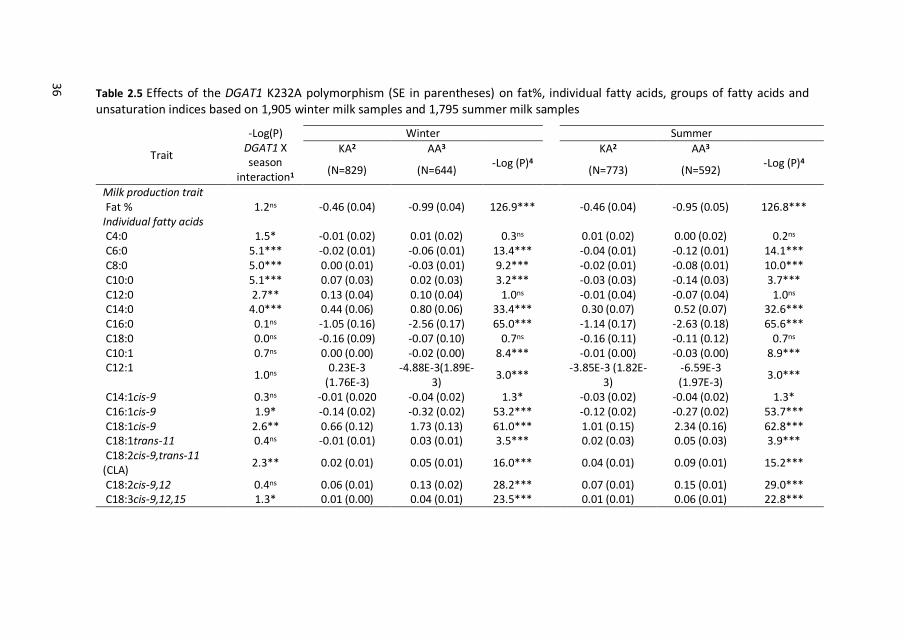
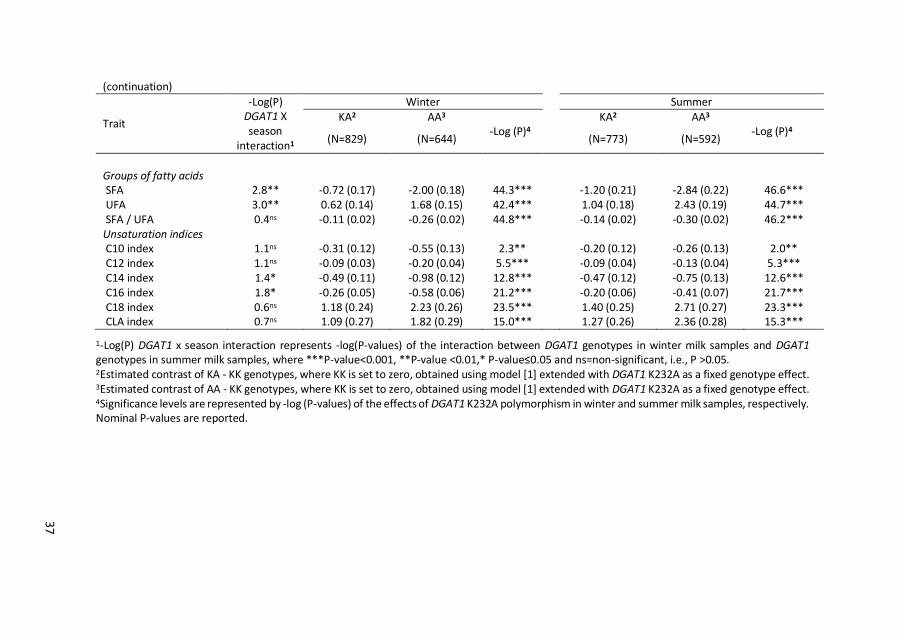
36 Table 2.5 Effects of the DGAT1 K232A polymorphism (SE in parentheses) on fat%, individual fatty acids, groups of fatty acids and unsaturation indices based on 1,905 winter milk samples and 1,795 summer milk samples
Trait
-Log(P) DGAT1 X season
interaction1
Winter Summer
KA2 AA3 -Log (P)4
KA2 AA3 -Log (P)4
(N=829) (N=644) (N=773) (N=592)
Milk production trait Fat % 1.2ns -0.46 (0.04) -0.99 (0.04) 126.9*** -0.46 (0.04) -0.95 (0.05) 126.8*** Individual fatty acids C4:0 1.5* -0.01 (0.02) 0.01 (0.02) 0.3ns 0.01 (0.02) 0.00 (0.02) 0.2ns C6:0 5.1*** -0.02 (0.01) -0.06 (0.01) 13.4*** -0.04 (0.01) -0.12 (0.01) 14.1*** C8:0 5.0*** 0.00 (0.01) -0.03 (0.01) 9.2*** -0.02 (0.01) -0.08 (0.01) 10.0*** C10:0 5.1*** 0.07 (0.03) 0.02 (0.03) 3.2*** -0.03 (0.03) -0.14 (0.03) 3.7*** C12:0 2.7** 0.13 (0.04) 0.10 (0.04) 1.0ns -0.01 (0.04) -0.07 (0.04) 1.0ns C14:0 4.0*** 0.44 (0.06) 0.80 (0.06) 33.4*** 0.30 (0.07) 0.52 (0.07) 32.6*** C16:0 0.1ns -1.05 (0.16) -2.56 (0.17) 65.0*** -1.14 (0.17) -2.63 (0.18) 65.6*** C18:0 0.0ns -0.16 (0.09) -0.07 (0.10) 0.7ns -0.16 (0.11) -0.11 (0.12) 0.7ns C10:1 0.7ns 0.00 (0.00) -0.02 (0.00) 8.4*** -0.01 (0.00) -0.03 (0.00) 8.9*** C12:1
1.0ns 0.23E-3
(1.76E-3) -4.88E-3(1.89E-
3) 3.0***
-3.85E-3 (1.82E-3)
-6.59E-3 (1.97E-3)
3.0***
C14:1cis-9 0.3ns -0.01 (0.020 -0.04 (0.02) 1.3* -0.03 (0.02) -0.04 (0.02) 1.3* C16:1cis-9 1.9* -0.14 (0.02) -0.32 (0.02) 53.2*** -0.12 (0.02) -0.27 (0.02) 53.7*** C18:1cis-9 2.6** 0.66 (0.12) 1.73 (0.13) 61.0*** 1.01 (0.15) 2.34 (0.16) 62.8*** C18:1trans-11 0.4ns -0.01 (0.01) 0.03 (0.01) 3.5*** 0.02 (0.03) 0.05 (0.03) 3.9*** C18:2cis-9,trans-11 (CLA)
2.3** 0.02 (0.01) 0.05 (0.01) 16.0*** 0.04 (0.01) 0.09 (0.01) 15.2***
C18:2cis-9,12 0.4ns 0.06 (0.01) 0.13 (0.02) 28.2*** 0.07 (0.01) 0.15 (0.01) 29.0*** C18:3cis-9,12,15 1.3* 0.01 (0.00) 0.04 (0.01) 23.5*** 0.01 (0.01) 0.06 (0.01) 22.8***
37
(continuation)
Trait
-Log(P) DGAT1 X season
interaction1
Winter Summer KA2 AA3
-Log (P)4 KA2 AA3
-Log (P)4 (N=829) (N=644) (N=773) (N=592)
Groups of fatty acids SFA 2.8** -0.72 (0.17) -2.00 (0.18) 44.3*** -1.20 (0.21) -2.84 (0.22) 46.6*** UFA 3.0** 0.62 (0.14) 1.68 (0.15) 42.4*** 1.04 (0.18) 2.43 (0.19) 44.7*** SFA / UFA 0.4ns -0.11 (0.02) -0.26 (0.02) 44.8*** -0.14 (0.02) -0.30 (0.02) 46.2*** Unsaturation indices C10 index 1.1ns -0.31 (0.12) -0.55 (0.13) 2.3** -0.20 (0.12) -0.26 (0.13) 2.0** C12 index 1.1ns -0.09 (0.03) -0.20 (0.04) 5.5*** -0.09 (0.04) -0.13 (0.04) 5.3*** C14 index 1.4* -0.49 (0.11) -0.98 (0.12) 12.8*** -0.47 (0.12) -0.75 (0.13) 12.6*** C16 index 1.8* -0.26 (0.05) -0.58 (0.06) 21.2*** -0.20 (0.06) -0.41 (0.07) 21.7*** C18 index 0.6ns 1.18 (0.24) 2.23 (0.26) 23.5*** 1.40 (0.25) 2.71 (0.27) 23.3*** CLA index 0.7ns 1.09 (0.27) 1.82 (0.29) 15.0*** 1.27 (0.26) 2.36 (0.28) 15.3***
1-Log(P) DGAT1 x season interaction represents -log(P-values) of the interaction between DGAT1 genotypes in winter milk samples and DGAT1 genotypes in summer milk samples, where ***P-value<0.001, **P-value <0.01,* P-value≤0.05 and ns=non-significant, i.e., P >0.05. 2Estimated contrast of KA - KK genotypes, where KK is set to zero, obtained using model [1] extended with DGAT1 K232A as a fixed genotype effect. 3Estimated contrast of AA - KK genotypes, where KK is set to zero, obtained using model [1] extended with DGAT1 K232A as a fixed genotype effect. 4Significance levels are represented by -log (P-values) of the effects of DGAT1 K232A polymorphism in winter and summer milk samples, respectively. Nominal P-values are reported.
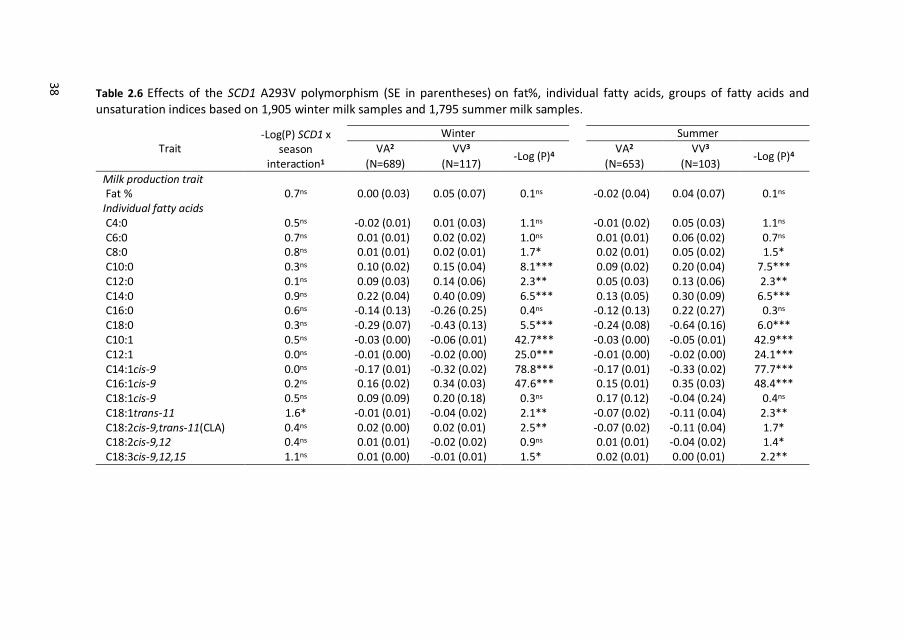
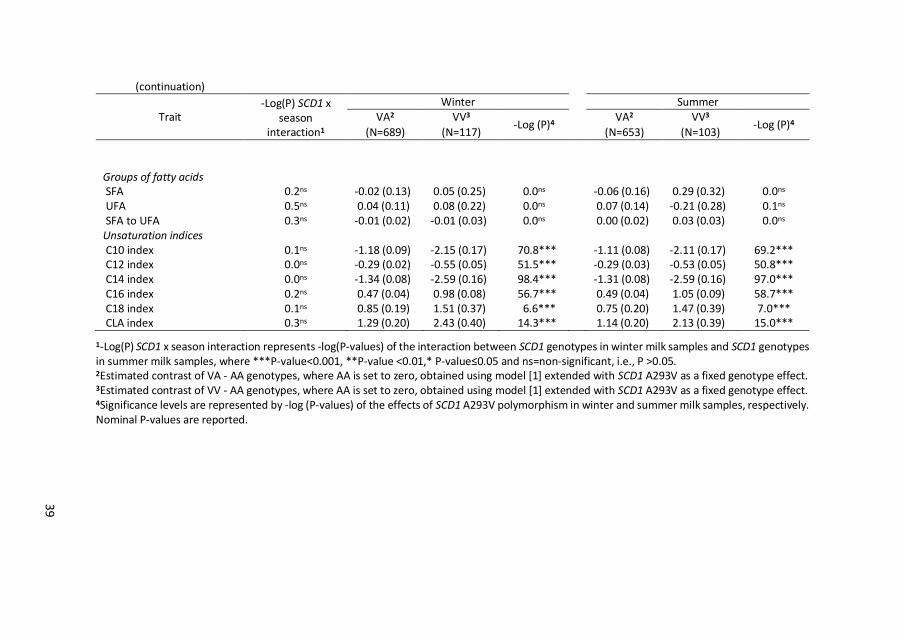
38 Table 2.6 Effects of the SCD1 A293V polymorphism (SE in parentheses) on fat%, individual fatty acids, groups of fatty acids and unsaturation indices based on 1,905 winter milk samples and 1,795 summer milk samples.
Trait -Log(P) SCD1 x
season interaction1
Winter Summer
VA2 VV3 -Log (P)4
VA2 VV3 -Log (P)4
(N=689) (N=117) (N=653) (N=103)
Milk production trait Fat % 0.7ns 0.00 (0.03) 0.05 (0.07) 0.1ns -0.02 (0.04) 0.04 (0.07) 0.1ns Individual fatty acids C4:0 0.5ns -0.02 (0.01) 0.01 (0.03) 1.1ns -0.01 (0.02) 0.05 (0.03) 1.1ns C6:0 0.7ns 0.01 (0.01) 0.02 (0.02) 1.0ns 0.01 (0.01) 0.06 (0.02) 0.7ns C8:0 0.8ns 0.01 (0.01) 0.02 (0.01) 1.7* 0.02 (0.01) 0.05 (0.02) 1.5* C10:0 0.3ns 0.10 (0.02) 0.15 (0.04) 8.1*** 0.09 (0.02) 0.20 (0.04) 7.5*** C12:0 0.1ns 0.09 (0.03) 0.14 (0.06) 2.3** 0.05 (0.03) 0.13 (0.06) 2.3** C14:0 0.9ns 0.22 (0.04) 0.40 (0.09) 6.5*** 0.13 (0.05) 0.30 (0.09) 6.5*** C16:0 0.6ns -0.14 (0.13) -0.26 (0.25) 0.4ns -0.12 (0.13) 0.22 (0.27) 0.3ns C18:0 0.3ns -0.29 (0.07) -0.43 (0.13) 5.5*** -0.24 (0.08) -0.64 (0.16) 6.0*** C10:1 0.5ns -0.03 (0.00) -0.06 (0.01) 42.7*** -0.03 (0.00) -0.05 (0.01) 42.9*** C12:1 0.0ns -0.01 (0.00) -0.02 (0.00) 25.0*** -0.01 (0.00) -0.02 (0.00) 24.1*** C14:1cis-9 0.0ns -0.17 (0.01) -0.32 (0.02) 78.8*** -0.17 (0.01) -0.33 (0.02) 77.7*** C16:1cis-9 0.2ns 0.16 (0.02) 0.34 (0.03) 47.6*** 0.15 (0.01) 0.35 (0.03) 48.4*** C18:1cis-9 0.5ns 0.09 (0.09) 0.20 (0.18) 0.3ns 0.17 (0.12) -0.04 (0.24) 0.4ns C18:1trans-11 1.6* -0.01 (0.01) -0.04 (0.02) 2.1** -0.07 (0.02) -0.11 (0.04) 2.3** C18:2cis-9,trans-11(CLA) 0.4ns 0.02 (0.00) 0.02 (0.01) 2.5** -0.07 (0.02) -0.11 (0.04) 1.7* C18:2cis-9,12 0.4ns 0.01 (0.01) -0.02 (0.02) 0.9ns 0.01 (0.01) -0.04 (0.02) 1.4* C18:3cis-9,12,15 1.1ns 0.01 (0.00) -0.01 (0.01) 1.5* 0.02 (0.01) 0.00 (0.01) 2.2**
39
(continuation)
Trait -Log(P) SCD1 x
season interaction1
Winter Summer VA2 VV3
-Log (P)4 VA2 VV3
-Log (P)4 (N=689) (N=117) (N=653) (N=103)
Groups of fatty acids SFA 0.2ns -0.02 (0.13) 0.05 (0.25) 0.0ns -0.06 (0.16) 0.29 (0.32) 0.0ns UFA 0.5ns 0.04 (0.11) 0.08 (0.22) 0.0ns 0.07 (0.14) -0.21 (0.28) 0.1ns SFA to UFA 0.3ns -0.01 (0.02) -0.01 (0.03) 0.0ns 0.00 (0.02) 0.03 (0.03) 0.0ns Unsaturation indices C10 index 0.1ns -1.18 (0.09) -2.15 (0.17) 70.8*** -1.11 (0.08) -2.11 (0.17) 69.2*** C12 index 0.0ns -0.29 (0.02) -0.55 (0.05) 51.5*** -0.29 (0.03) -0.53 (0.05) 50.8*** C14 index 0.0ns -1.34 (0.08) -2.59 (0.16) 98.4*** -1.31 (0.08) -2.59 (0.16) 97.0*** C16 index 0.2ns 0.47 (0.04) 0.98 (0.08) 56.7*** 0.49 (0.04) 1.05 (0.09) 58.7*** C18 index 0.1ns 0.85 (0.19) 1.51 (0.37) 6.6*** 0.75 (0.20) 1.47 (0.39) 7.0*** CLA index 0.3ns 1.29 (0.20) 2.43 (0.40) 14.3*** 1.14 (0.20) 2.13 (0.39) 15.0***
1-Log(P) SCD1 x season interaction represents -log(P-values) of the interaction between SCD1 genotypes in winter milk samples and SCD1 genotypes in summer milk samples, where ***P-value<0.001, **P-value <0.01,* P-value≤0.05 and ns=non-significant, i.e., P >0.05. 2Estimated contrast of VA - AA genotypes, where AA is set to zero, obtained using model [1] extended with SCD1 A293V as a fixed genotype effect. 3Estimated contrast of VV - AA genotypes, where AA is set to zero, obtained using model [1] extended with SCD1 A293V as a fixed genotype effect. 4Significance levels are represented by -log (P-values) of the effects of SCD1 A293V polymorphism in winter and summer milk samples, respectively. Nominal P-values are reported.
2 Milk-fat composition in winter and summer
40
It is well established that the supply of FA reaching the mammary gland of a cow for
milk fat synthesis can be indirectly affected by processes that occur in the rumen
known to convert PUFA into SFA (e.g., Chilliard et al., 2001, Jenkins et al., 2008).
These processes are dependent on many factors that include: quantity and
composition of microbiota (Haarfoot & Hazlewood, 1997; Lock & Bauman, 2004), the
proportion of forages and concentrates in a cow’s diet (Dewhurst et al., 2006) and
the source of the PUFA supplied to dairy cows (Sterk et al., 2011). Therefore, part of
the observed differences in milk fat composition between winter and summer milk
can also be attributed to dietary effects on processes in the rumen, which are known
to affect the amounts of C18:1trans-11 and CLA reaching the mammary gland of a
cow (Mach et al., 2011).
2.4.2 Effects of polymorphisms in DGAT1 and in SCD1
Some studies indicate that nutrition affects mammary expression of lipogenic genes
(Bernard et al., 2008; Mach et al., 2011). Therefore, effects of polymorphisms in
DGAT1 and SCD1 on milk fat composition might differ between winter and summer.
In the present study, significant DGAT1 by season interactions were found on many
FA, and SCD1 by season interaction was found only on C18:1trans-11. However,
estimated genotype effects suggest that these interactions are due to scaling rather
than to re-ranking (Figures 2.1 and 2.2). High genetic correlations between milk fat
composition in winter and summer as well as similar genotypic effects in winter and
summer support the idea that mainly the same genes are involved in milk fat
composition in winter and in summer.
DGAT1. Is the gene encoding acyl-CoA: diacylglycerol acyltransferase1 (DGAT1; EC:
2.3.1.20), which is an enzyme responsible for the fixation of FA to the third position
of triacylglycerol (TAG) (Cases et al., 1998; Palmquist, 2006; Yen et al., 2008). The
K232A polymorphism causes an amino acid change (Lysine > Alanine at position 232
of the protein) that might alter the activity or specificity of the enzyme. In our study,
the DGAT1 232A allele was associated with a lower milk fat%, which agrees with
previous research (e. g., Grisart et al., 2002; Winter et al., 2002; Thaller et al., 2003).
DGAT1 shows a preference to esterify short chain and UFA to the third position of a
TAG (Kinsella, 1976; Morand et al., 1998; Mistry and Medrano, 2002). In winter, the
DGAT1 232A allele was negatively associated with most FA with less than 18 carbons
and was positively associated with all unsaturated C18. In summer milk, higher
amounts of UFA were found compared to winter milk. This larger supply seems to
increase the effect of the DGAT1 K232A polymorphism, especially for UFA for which
2 Milk-fat composition in winter and summer
41
Figure 2.1 Estimated effects of DGAT1 K232A polymorphism in winter and summer samples represented by the contrasts of AA-KK and KA-KK genotypes, where KK is set to zero. These contrasts illustrate the significant DGAT1 K232A by season interaction on C18:1cis-9. SE are shown as error bars.
it has preference, because the effects of DGAT1 232A allele on most unsaturated C18
and UFA were larger in summer compared to winter milk and resulted in DGAT1 by
season interaction.
SCD1. Is the gene encoding stearoyl-CoA desaturase1 (SCD1; EC: 1.14.19.1) and the
A293V polymorphism causes an amino acid change (Alanine > Valine at position 293
of the protein) which might affect the catalytic function of the enzyme, responsible
for the insertion of a cis-double bond between carbon 9 and 10 of a FA (Pereira et
al., 2003). In the present study, SCD1 A293V polymorphism had no significant effects
on fat%. These results are in line with Schennink et al. (2008).
Unsaturation indices have been suggested as indicators to indirectly measure the
desaturation activity of the SCD1 enzyme (e.g., Peterson et al., 2002). In both winter
and summer, high means for C18 and CLA unsaturation indices (Table2.2) indicate
that C18:0 and C18:1trans-11 are unsaturated to a higher extent than C10:0, C12:0,
C14:0 and C16:0. These results are in line with Enoch et al. (1976) who suggest that
SCD1 has preferences in unsaturating longer chain FA. In addition, the SCD1 293V
2 Milk-fat composition in winter and summer
42
Figure 2.2 Estimated effects of SCD1 A293V polymorphism in winter and summer samples represented by the contrasts of VV-AA and VA-AA genotypes, where AA is set to zero. These contrasts illustrate the significant SCD1 A293V by season interaction on C18:1trans-11. SE are shown as error bars.
allele was positively associated with C16 to CLA indices compared to the SCD1 293A
allele in both winter and summer (Table 2.6). These associations suggest that the
SCD1 293V allele might have a higher affinity or specificity to unsaturate longer chain
FA (e.g., C18:0 or C18:1trans-11) than other available FA (e.g., C10:0 or C14:0).
2.5 Conclusions
Milk fat composition in winter and in summer can be largely considered as
genetically the same trait, because of the very high genetic correlations found
between winter and summer milk fat composition. Differences in milk fat
composition between winter and summer can probably be attributed to differences
in the diets of cows between the two seasons rather than to genetic differences.
Effects of DGAT1 K232A and SCD1 A293V polymorphisms on fat composition are
similar in winter and in summer milk. Significant DGAT1 and SCD1 by season
interactions were found for some fatty acids, and these interactions seem to be due
to scaling of the genotype effects.
2 Milk-fat composition in winter and summer
43
2.6 Acknowledgements
This study is part of the Dutch Milk Genomics Initiative, funded by Wageningen
University, NZO (Dutch Dairy Association, Zoetermeer, the Netherlands),
Cooperative Cattle Improvement organization CRV (Arnhem, the Netherlands), and
the Dutch technology foundation STW (Utrecht, the Netherlands). The authors thank
the owners of the herds for their help in collecting the data.The first author expresses
her gratitude for having benefitted from academic and financial support of the
Erasmus Mundus program “European Master in Animal Breeding and Genetics (EM-
ABG)”, and the Koepon Foundation.
2.7 References
Agenäs, S., K. Holtenius, M. Griinari, and E. Burstedt. 2002. Effects of turnout to
pasture and dietary fat supplementation on milk fat composition and Conjugated
Linoleic Acid in dairy cows. Acta Agric. Scand. A Anim. Sci. 52:25-33.
Bauman, D. E., and J. M. Griinari. 2003. Nutritional regulation of milk fat synthesis.
Annual Review of Nutrition 23:203-227.
Bernard, L., C. Leroux, and Y. Chilliard. 2008. Expression and nutritional regulation of
lipogenic genes in the ruminant lactating mammary gland. Bioactive components
of milk. Pages 67-108. Vol. 606. Z. Bösze, ed. Springer, New York, USA.
Cases, S., S. J. Smith, Y.-W. Zheng, H. M. Myers, S. R. Lear, E. Sande, S. Novak, C.
Collins, C. B. Welch, A. J. Lusis, S. K. Erickson, and R. V. Farese. 1998. Identification
of a gene encoding an acyl CoA:diacylglycerol acyltransferase, a key enzyme in
triacylglycerol synthesis. Proc. Natl. Acad. Sci. USA 95:13018-13023.
Chilliard, Y., A. Ferlay, R. M. Mansbridge, and M. Doreau. 2000. Ruminant milk fat
plasticity: nutritional control of saturated, polyunsaturated, trans and conjugated
fatty acids. Ann. Zootech. 49:181-205.
Chilliard, Y., A. Ferlay, and M. Doreau. 2001. Effect of different types of forages,
animal fat or marine oils in cow’s diet on milk fat secretion and composition,
especially conjugated linoleic acid (CLA) and polyunsaturated fatty acids. Livest.
Prod. Sci. 70:31-48.
Chilliard, Y., F. Glasser, A. Ferlay, L. Bernard, J. Rouel, and M. Doreau. 2007. Diet,
rumen biohydrogenation and nutritional quality of cow and goat milk fat. Eur. J.
Lipid Sci. Technol. 109:828-855.
2 Milk-fat composition in winter and summer
44
Dewhurst, R. J., N. D. Scollan, S. J. Youell, J. K. S. Tweed, and M. O. Humphreys. 2001.
Influence of species, cutting date and cutting interval on the fatty acid composition
of grasses. Grass for. Sci. 56:69-74.
Dewhurst, R. J., K. J. Shingfield, M. R. F. Lee, and N. D. Scollan. 2006. Increasing the
concentrations of beneficial polyunsaturated fatty acids in milk produced by dairy
cows in high-forage systems. Anim. Feed Sci. Technol. 131:168-206.
Enoch, H. G., A. Catala, and. P. Strittmatter. 1976. Mechanism of rat liver microsomal
stearol-CoA desaturase. Studies of the substrate specificity, enzyme-substrate
interactions, and the function of lipid. J. Biol. Chem. 251:5095-5103.
Falconer, D. S., and T. F. C. Mackay. 1996. Introduction to Quantitative Genetics.
Correlated characters: genotype-environment interaction. Pages 321-325. Fourth
edition, ed. Longman Greens, Harlow, Essex, UK.
FAO. 2008. Fats and fatty acids in human nutrition - Report of an expert consultation.
in Food and Nutrition Paper. Vol. 91. Food and Agriculture Organization of the
United Nations (FAO), Geneva.
German, J. B., and C. J. Dillard. 2006. Composition, Structure and Absorption of Milk
Lipids: A Source of Energy, Fat-Soluble Nutrients and Bioactive Molecules. Crit.
Rev. Food Sci. 46:57-92.
Gilmour, A. R., Gogel, B. J., Cullis, B. R., and R. Thompson. 2002. ASReml User Guide
Release 2.0. Hemel Hempstead, HP1 1ES, UK.
Grisart, B., W. Coppieters, F. Fanir, L. Karim, C. Ford, P. Berzi, N. Cambisano, M. Mni,
S. Reid, P. Simon, R. Spelman, M. Georges, and R. Snell. 2002. Positional candidate
cloning of a QTL in dairy cattle: identification of a missense mutation in the bovine
DGAT1 gene with major effect on milk yield and composition. Genome Res.
12:222-231.
Grummer, R. R. 1991. Effect of Feed on the Composition of Milk Fat. J. Dairy Sci.
74:3244-3257.
Harfoot, C. G., and G. P. Hazlewood. 1997. Lipid in the rumen. Pages 382-426 in
Rumen Microbial Ecosystem. 2nd ed. B. A. Professional, ed. P.N. Hobson and C. S.
Stewart, London, UK.
Heck, J. M. L., H. J. F. van Valenberg, J. Dijkstra, and A. C. M. van Hooijdonk. 2009.
Seasonal variation in the Dutch bovine raw milk composition. J. Dairy Sci. 92:4745-
4755.
Heringstad, B., D. Gianola, Y. M. Chang, J. Ødegård, and G. Klemetsdal. 2006. Genetic
associations between clinical mastitis and somatic cell score in early first-lactation
cows. J. Dairy Sci. 89:2236-2244.
2 Milk-fat composition in winter and summer
45
Jenkins, T. C., R. J. Wallace, P. J. Moate, and E. E. Mosley. 2008. Board-invited review:
Recent advances in biohydrogenation of unsaturated fatty acids within the rumen
microbial ecosystem. J. Anim. Sci. 86:397-412.
Karijord, Ø., N. Standal, and O. Syrstad. 1982. Sources of variation in composition of
milk fat. Z. Tierz. Züchtungsbio. 99:81-93.
Kelsey, J. A., B. A. Corl, R. J. Collier, and D. E. Bauman. 2003. The effect of breed,
parity, and stage of lactation on conjugated linoleic acid (CLA) in milk fat from dairy
cows. J. Dairy Sci. 86:2588-2597.
Khanal, R. C., T. R. Dhiman, and R. L. Boman. 2008. Changes in fatty acid composition
of milk from lactating dairy cows during transition to and from pasture. Livest. Sci.
114:164-175.
Kinsella, J. E. 1976. Monoacyl-sn-glycerol 3-phosphate acyltransferase specificity in
bovine mammary microsomes. Lipids 11:680-684.
Lock, A. L. and D. E. Bauman. 2004. Modifying milk fat composition of dairy cows to
enhance fatty acids beneficial to human health. Lipids 39:1197-1206.
Mach, N., A. A. A. Jacobs, L. Kruijt, J. van Baal, and M. A. Smits. 2011. Alteration of
gene expression in mammary gland tissue of dairy cows in response to dietary
unsaturated fatty acids. Animal 5:1217-1230.
Mistry, D. H. and J. F. Medrano. 2002. Cloning and localization of the bovine and
ovine Lysophosphatidic Acid Acyltransferase (LPAAT) genes that codes for an
enzyme involved in triglyceride biosynthesis. J. Dairy Sci. 85:28-35.
Moioli, B., G. Contarini, A. Avalli, G. Catillo, L. Orru, G. De Matteis, G. Masoero, and
F. Napolitano. 2007. Short communication: Effect of stearoyl-coenzyme A
desaturase polymorphism on fatty acid composition of milk. J. Dairy Sci. 90:3553-
3558.
Morand, L. Z., J. N. Morand, R. Matson, and J. B. German. 1998. Effect of insulin and
prolactin on acyltransferase activities in MAC-T bovine mammary cells. J. Dairy Sci.
81:100-106.
Palmquist, D. L. 2006. Milk fat: origin of fatty acids and influence of nutritional factors
thereon. Pages 43-92 in Advanced Dairy Chemistry: Lipids. Vol. 2. Springer, ed. P.
F. Fox, P. L. H. McSweeney, New York, USA.
Palmquist, D. L., A. Denise Beaulieu, and D. M. Barbano. 1993. Feed and animal
factors influencing milk fat composition. J. Dairy Sci. 76:1753-1771.
Pereira, S. L., A. E. Leonard, and P. Mukerji. 2003. Recent advances in the study of
fatty acid desaturases from animals and lower eukaryotes. Prostaglandins Leukot.
Essent. Fatty Acids 68:97-106.
2 Milk-fat composition in winter and summer
46
Peterson, D. G., J. A. Kelsey, and D. E. Bauman. 2002. Analysis of variation in cis-9,
trans-11 conjugated linoleic acid (CLA) in milk fat of dairy cows. J. Dairy Sci.
85:2164-2172.
Precht, J., and D. Molketin. 2000. Frequency distributions of conjugated linoleic acid
and trans fatty acids in European milk fats. Milchwissenschaft 55:687-691.
Renner, E., and U. Kosmack. 1974. Genetische aspekte zur
fettsaürenzusammensetzung des milchfettes. Züchtungskunde 46:217-226.
Schennink, A., W. M. Stoop, M. H. P. W. Visker, J. M. L. Heck, H. Bovenhuis, J. J. Van
Der Poel, H. J. F. Van Valenberg, and J. A. M. Van Arendonk. 2007. DGAT1 underlies
large genetic variation in milk-fat composition of dairy cows. Anim. Genet. 38:467-
473.
Schennink, A., J. M. L. Heck, H. Bovenhuis, M. H. P. W. Visker, H. J. F. van Valenberg,
and J. A. M. van Arendonk. 2008. Milk fatty acid unsaturation: genetic parameters
and effects of Stearoyl-CoA Desaturase (SCD1) and Acyl CoA: Diacylglycerol
Acyltransferase 1 (DGAT1). J. Dairy Sci. 91:2135-2143.
Soyeurt, H., P. Dardenne, A. Gillon, C. Croquet, S. Vanderick, P. Mayeres, C. Bertozzi,
and N. Gengler. 2006. Variation in fatty acid contents of milk and milk fat within
and across breeds. J. Dairy Sci. 89:4858-4865.
Soyeurt, H., P. Dardenne, F. Dehareng, C. Bastin, and N. Gengler. 2008. Genetic
parameters of saturated and monounsaturated fatty acid content and the ratio of
saturated to unsaturated fatty acids in bovine milk. J. Dairy Sci. 91:3611-3626.
Sterk, A.-R. 2011. Ruminant fatty acid metabolism. PhD thesis. Wageningen
University, Wageningen, the Netherlands.
Stoop, W. M., J. A. M. van Arendonk, J. M. L. Heck, H. J. F. van Valenberg, and H.
Bovenhuis. 2008. Genetic parameters for major milk fatty acids and milk
production traits of Dutch Holstein-Friesians. J. Dairy Sci. 91:385-394.
Thaller, G., W. Krämer, A. Winter, B. Kaupe, G. Erhardt, and R. Fries. 2003. Effects of
DGAT1 variants on milk production traits in German cattle breeds. J. Anim. Sci.
81:1911-1918.
Thorsdottir, I., J. Hill, and A. Ramel. 2004. Short communication: Seasonal variation
in cis-9, trans-11 conjugated linoleic acid content in milk fat from Nordic countries.
J. Dairy Sci. 87:2800-2802.
Wilmink, J. B. M. 1987. Adjustment of test-day milk, fat and protein yield for age,
season and stage of lactation. Livest. Prod. Sci. 16:335-348.
Winter, A., W. Krämer, F. A. O. Werner, S. Kollers, S. Kata, G. Durstewitz, J. Buitkamp,
J. E. Womack, G. Thaller, and R. Fries. 2002. Association of a lysine-232/alanine
polymorphism in a bovine gene encoding acyl-CoA:diacylglycerol acyltransferase
2 Milk-fat composition in winter and summer
47
(DGAT1) with variation at a quantitative trait locus for milk fat content. Proc. Natl.
Acad. Sci. USA 99:9300-9305.
Yen, C.-L. E., S. J. Stone, S. Koliwad, C. Harris, and R. V. Farese. 2008. Thematic Review
Series: Glycerolipids. DGAT enzymes and triacylglycerol biosynthesis. J. Lipid Res.
49:2283-2301.

3
A quantitative trait locus on Bos taurus autosome 17 explains a large proportion of
the genetic variation in de novo synthesized milk fatty acids
S. I. Duchemin1,2, M. H. P. W. Visker1, J. A. M. Van Arendonk1, H. Bovenhuis1
1Animal Breeding and Genomics Centre, Wageningen University, PO Box 338, 6700
AH Wageningen, the Netherlands; 2Department of Animal Breeding and Genetics,
Swedish University of Agricultural Sciences, Uppsala, Sweden
Journal of Dairy Science (2014) 97:7276-7285
50
Abstract
A genomic region associated with milk fatty acid (FA) composition has been detected
on Bos Taurus Autosome (BTA) 17 based on 50k SNP genotypes. The aim of our study
was to fine-map BTA17 with imputed 777k single nucleotide polymorphism (SNP)
genotypes in order to identify candidate genes associated with milk FA composition.
Phenotypes consisted of gas chromatography measurements of 14 FA based on
winter and summer milk samples. Phenotypes and genotypes were available on
1,640 animals in winter milk, and on 1,581 animals in summer milk samples. Single-
SNP analyses showed that several SNP in a region located between 29.0 and 34.0
mega base-pairs were in strong association with C6:0, C8:0, and C10:0. This region
was further characterized based on haplotypes. In summer milk samples, for
example, these haplotypes explained almost 10% of the genetic variance in C6:0, 9%
in C8:0, 3.5% in C10:0, 1.8% in C12:0, and 0.9% in C14:0. Two groups of haplotypes
with distinct predicted effects could be defined, suggesting the presence of one
causal variant. Predicted haplotype effects tended to increase from C6:0 to C14:0,
however, the proportion of genetic variance explained by the haplotypes tended to
decrease from C6:0 to C14:0. This is an indication that the quantitative trait locus
(QTL) region is either involved in the elongation process or in early termination of de
novo synthesized FA. Although many genes are present in this QTL region, most of
these genes on BTA17 have not been characterized yet. The strongest association
was found close to the progesterone receptor membrane component 2 (PGRMC2)
gene. This gene has not been associated to milk FA composition. Therefore, no clear
candidate gene associated with milk FA composition could be identified for this QTL.
Key words: milk fatty acid composition, dairy cattle, candidate genes, high-density
genotyping.
3 Fine mapping of BTA17
51
3.1 Introduction
Bovine milk-fat is composed of more than 400 different fatty acids (FA), many of
which are still un-identified (Jensen, 2002). FA may differ in the number of carbons
and this difference can be related to the origin of the FA. Most short-chain FA are FA
of less than 12 carbons that are mainly elongated from acetate by de novo synthesis
in the mammary gland of a cow (e.g., Palmquist, 2006). Medium-chain FA are FA of
14 and 16 carbons and, while C14:0 mainly originates from de novo synthesis, C16:0
originates from two sources: approximately 50% from de novo synthesis and 50%
from the diet of a cow. Most long-chain FA are FA of 18 or more carbons that mainly
originate from the cow’s diet, or from body fat mobilization (e.g., Chilliard et al.,
2000). In addition to differences in the number of carbons, FA may also differ in their
degree of saturation. On average, more than 70% of the identified FA in milk consist
of saturated FA, and the remaining consist of unsaturated FA.
Variation in the content of several FA in milk is affected by genetic factors. Stoop et
al. (2008) reported that individual milk FA have heritability estimates that range from
0.22 to 0.71. Some well characterized genes are recognized as having large effects
on milk-fat and FA composition, such as acyl-CoA: diacylglycerol acyltransferase1
(DGAT1) located on BTA14, and stearoyl-CoA desaturase1 (SCD1) located on BTA26
(e.g., Schennink et al., 2007, Schennink et al., 2008). In addition, several regions of
the bovine genome have been identified as having effects on milk-fat and FA
composition but have not been characterized yet (e.g., Bouwman et al, 2012). By
fine–mapping these regions, it is possible to identify candidate genes (Ishii et al.,
2013) associated with milk FA composition. Further insights into the biosynthesis of
milk-fat and FA are relevant if the aim is to change milk FA composition by means of
breeding (Boichard and Brochard, 2012) or feeding strategies.
Fine-mapping allows to refine genomic regions by testing a large number of single
nucleotide polymorphism (SNP) that are likely associated with a quantitative trait
locus (QTL) (Hinds et al., 2005). Recently, a genomic region associated with short-
chain FA in milk has been detected on BTA17 (Bouwman et al., 2012). However, no
candidate gene or causal variant has been identified so far. The aim of our study was
to fine-map BTA17 with imputed 777k SNP genotypes in order to identify candidate
genes associated with milk FA composition.
3 Fine mapping of BTA17
52
3.2 Material and Methods
This study is part of the Dutch Milk Genomics Initiative that aims at exploring the
possibilities to modify milk FA composition through breeding. Bouwman et al. (2012)
performed a genome-wide association study (GWAS) using 50k SNP genotypes based
on milk FA composition of winter and summer milk samples. In the present study,
we re-analyzed the same phenotypes, and fine-mapped BTA17 using imputed 777k
SNP genotypes.
3.2.1 Animals and phenotypes
Morning milk samples of 500mL per cow were retrieved from 2,001 first-lactation
Holstein-Friesian cows from 398 herds throughout the Netherlands. At least three
cows per herd were sampled in two distinct seasons: February-March 2005 (which
will be referred to as “Winter” samples) and May-June 2005 (which will be referred
to as “Summer” samples). The milk samples were taken from the same cows during
the same lactation. Some cows sampled in winter were no longer lactating when
summer milk samples were taken. Additional cows were sampled from the same
herds to guarantee milk samples from at least three cows per herd. A total of 1,905
cows had phenotypic records in the winter, with each cow lactating between 63 and
282 days (see Stoop et al., 2008). A total of 1,795 cows had phenotypic records in
the summer, with each cow lactating between 97 and 335 days (see Duchemin et al,
2013). About 50% of the cows in our experiment had access to pasture in summer
(3.5 to 24 h/d), whereas all cows were kept indoors and fed silage in winter. Further
details about the experimental design can be found in Stoop et al. (2008).
Milk FA composition was measured by gas chromatography at the COKZ laboratory
(Qlip, Leudsen, Netherlands). Milk-fat was extracted from the milk samples, and fatty
acid methyl esters were prepared from fat fractions, as described by Schennink et al.
(2007). The FA were identified and quantified by comparing the methyl ester
chromatograms of the milk fat samples with the chromatograms of pure FA methyl
ester standards (Stoop et al., 2008). FA included in this study were measured as
weight proportion of total fat (%wt/wt) and are described in Table 3.1. In addition,
an indicator of de novo synthesized milk FA was created by combining C6:0 through
C14:0 individual FA in the index referred to as “C6:0-C14:0” (Table 3.2).
3 Fine mapping of BTA17
53
3.2.2 Genotypes and imputation
A blood sample from each cow and semen from each bull were used to extract DNA.
The DNA of 55 sires and 1,813 daughters belonging to our experimental population
was genotyped with a 50k SNP chip. This chip was designed by CRV (Arnhem,
Netherlands), and was used to genotype the animals with the Infinium assay
(Illumina, San Diego, CA).
A reference population of 1,333 animals belonging to CRV and including the 55 sires
with offsprings in our data was additionally genotyped with a 777k SNP chip
(Illumina, San Diego, CA). This information on the reference population was used to
impute the genotypes of our experimental population from 50k to 777k SNP. This
imputation was done using Beagle version 3.2.2 (Browning and Browning, 2009), and
resulted in a total of 1,736 animals being imputed to 777k SNP. From these 1,736
animals, 12 animals were excluded because of pedigree inconsistencies and,
subsequently, three animals were excluded because their herds no longer met the
requirement of a minimum of three animals sampled per herd. As a consequence,
1,721 animals with imputed 777k SNP genotypes were available for this study.
Imputation of BTA17 increased the number of SNP genotypes from 1,562 (i.e., 50k)
to 22,240 (i.e., 777k). The positions of the imputed SNP were based on the bovine
genome assembly UMD 3.1. (Zimin et al., 2009)
3.2.3 Fine-mapping of BTA17
The fine-mapping of BTA17 was performed separately for winter and summer milk
samples by using imputed 777k SNP genotypes and the 14 FA described in Table 3.1.
For each season, animals were included in the analyses if both phenotypic and
genotypic data were available. Therefore, a total of 1,640 animals were available for
winter milk, and a total of 1,581 animals were available for summer milk samples.
Single SNP analyses were performed using the following animal model:
𝑦𝑖𝑗𝑘𝑙𝑚𝑛𝑜 = 𝜇 + 𝑏1 ∗ 𝑑𝑖𝑚 𝑖 + 𝑏2 ∗ 𝑒−0.05 ∗ 𝑑𝑖𝑚𝑖 + 𝑏3 ∗ 𝑎𝑓𝑐𝑗 + 𝑏4 ∗ 𝑎𝑓𝑐𝑗2 +
𝑠𝑒𝑎𝑠𝑜𝑛𝑘 + 𝑠𝑐𝑜𝑑𝑒𝑙 + 𝑆𝑁𝑃𝑚 + ℎ𝑒𝑟𝑑𝑛 + 𝑎𝑜 + 𝑒𝑖𝑗𝑘𝑙𝑚𝑛𝑜 (1)
where 𝑦𝑖𝑗𝑘𝑙𝑚𝑛𝑜 is the dependent variable; µ is the overall mean; b1 and b2 are the
regression coefficients related to 𝑑𝑖𝑚𝑖; 𝑑𝑖𝑚𝑖 is the covariate describing the effect of
days in milk, modeled with a Wilmink curve (Wilmink, 1987); b3 and b4 are the
regression coefficients related to 𝑎𝑓𝑐𝑗; 𝑎𝑓𝑐𝑗 is the covariate describing the effect of
age at first calving; 𝑠𝑒𝑎𝑠𝑜𝑛𝑘 is the fixed effect of calving season (June – August 2004,
3 Fine mapping of BTA17
54
September – November 2004, or December 2004 – February 2005); 𝑠𝑐𝑜𝑑𝑒𝑙 is the
fixed effect accounting for differences in genetic level between groups of proven bull
daughters and young bull daughters; 𝑆𝑁𝑃𝑚 is the fixed effect of SNP genotype ; ℎ𝑒𝑟𝑑𝑛
is the random effect of herd, and is assumed to be distributed as ~N(0, 𝐈𝜎ℎ𝑒𝑟𝑑2 ), for
which I is the identity matrix, and is the herd variance; 𝑎𝑜 is the random additive
genetic effect of animal, and is assumed to be distributed as ~N(0, 𝐀𝜎𝑎2), where A is
the additive genetic relationships matrix which consisted of 12,548 animals, and 𝜎𝑎2
is the additive genetic variance; and 𝑒𝑖𝑗𝑘𝑙𝑚𝑛𝑜 is the random residual effect, and is
assumed to be distributed as ~N(0, 𝐈𝜎𝑒2), for which I is the identity matrix, and 𝜎𝑒
2 is
the residual variance.
Additive genetic and herd variances were estimated without the inclusion of SNP
information, and the resulting estimates were fixed within model (1).
Heritability estimates were calculated from univariate analyses based on model (1)
without the inclusion of SNP effects as follows: ℎ2 =𝜎𝑎
2
𝜎𝑎2 + 𝜎𝑒
2. Analyses were
performed separately for winter and summer milk samples. All statistical analyses
were performed using ASReml 3.0 (Gilmour et al., 2009).
3.2.4 Construction of haplotypes
Haplotypes were constructed to further characterize a genomic region on BTA17,
and these were constructed separately for winter and summer milk samples. This
construction started with the identification of promising SNP by single SNP analyses
using model (1). The SNP with the highest significance was defined as “QTagSNP1”.
Subsequently, we corrected for the effect of QTagSNP1, by including QTagSNP1 as a
fixed effect in model (1). This correction allowed to run a second round of single SNP
analyses, and to retrieve remaining significant SNP. After this second round of
analyses, if another SNP still was significant, it was defined as “QTagSNP2”. In these
analyses, a SNP was considered to be still significant if – log10(P-value) ≥ 3. Next, we
corrected for the effects of QTagSNP2 in the model already extended with
QTagSNP1, by further including QTagSNP2 as a fixed effect. This methodology was
repeated until no additional significant SNP were retrieved. Linkage disequilibrium
(LD) was estimated as r2 between all the identified QTagSNP using PLINK version 1.07
(Purcell et al., 2007). After the identification of QTagSNP, haplotypes were
constructed based on the identified QTagSNP.
3 Fine mapping of BTA17
55
Effects of haplotypes were estimated with the following animal model:
𝑦𝑖𝑗𝑘𝑙𝑛𝑝𝑞𝑟 = 𝜇 + 𝑏1 ∗ 𝑑𝑖𝑚𝑖 + 𝑏2 ∗ 𝑒−0.05 ∗ 𝑑𝑖𝑚𝑖 + 𝑏3 ∗ 𝑎𝑓𝑐𝑗 + 𝑏4 ∗ 𝑎𝑓𝑐𝑗2 +
𝑠𝑒𝑎𝑠𝑜𝑛𝑘 + 𝑠𝑐𝑜𝑑𝑒𝑙 + ℎ𝑎𝑝𝑙𝑜1𝑝 + ℎ𝑎𝑝𝑙𝑜2𝑞 + ℎ𝑒𝑟𝑑𝑛 + 𝑎𝑟∗ + 𝑒𝑖𝑗𝑘𝑙𝑛𝑝𝑞𝑟 (2)
where variables are as previously described for model (1), and: haplo1p is the random
effect of the first haplotype; haplo2q is the random effect of the second haplotype,
and they are both assumed to be distributed as N ~ (0, I𝜎ℎ𝑎𝑝𝑙𝑜2 ), for which I is the
identity matrix, and 𝜎ℎ𝑎𝑝𝑙𝑜 2 is the haplotype variance. The first and second haplotypes
were jointly used to estimate one haplotype variance (𝜎ℎ𝑎𝑝𝑙𝑜 2 ) and one effect for
each haplotype. This was achieved by combining the design matrices of both
haplotypes in ASReml. 𝑎𝑟∗ is the random additive genetic effect of animal estimated
without the inclusion of haplotypes, and is assumed to be distributed as N ~ (0,𝐀𝜎𝑎∗2 ),
for which A is the additive genetic relationships matrix which consisted of 12,548
animals, and 𝜎𝑎∗2 is the additive genetic variance that remains after accounting for
haplotype effects. The total additive genetic variance was defined as:𝜎𝑎2 = 𝜎𝑎∗
2 +
𝜎ℎ𝑎𝑝𝑙𝑜2 . The fraction of genetic variance explained by haplotypes was defined
as:𝜎ℎ𝑎𝑝𝑙𝑜2 𝜎𝑎
2⁄ .
Additionally, we tested whether predicted haplotype effects differed from each
other. Significance levels of the differences between predicted effects of haplotypes
were assessed using Student’s t-tests, as implemented in ASReml. The predicted
effect of a haplotype was considered significantly different from another haplotype
if P-value ≤ 0.05.
3.3 Results
3.3.1 Phenotypic means and heritability estimates
Phenotypic means and heritability estimates for milk FA composition in winter and
summer milk samples are shown in Table 3.1. Winter milk had higher contents of
short-chain FA than summer milk samples (14.2% vs. 13.7%), higher contents of
medium-chain FA (44.2% vs. 40.4%), and lower contents of long-chain FA, such as
C18:0 (8.7% vs. 9.9%) and cis-9 C18:1 (18,2% vs. 20.5%). Phenotypic variances were
higher in summer as compared to winter milk samples, but genetic variances were
similar in both seasons. A detailed discussion on differences between winter and
summer milk samples can be found in our previous study (Duchemin et al., 2013).
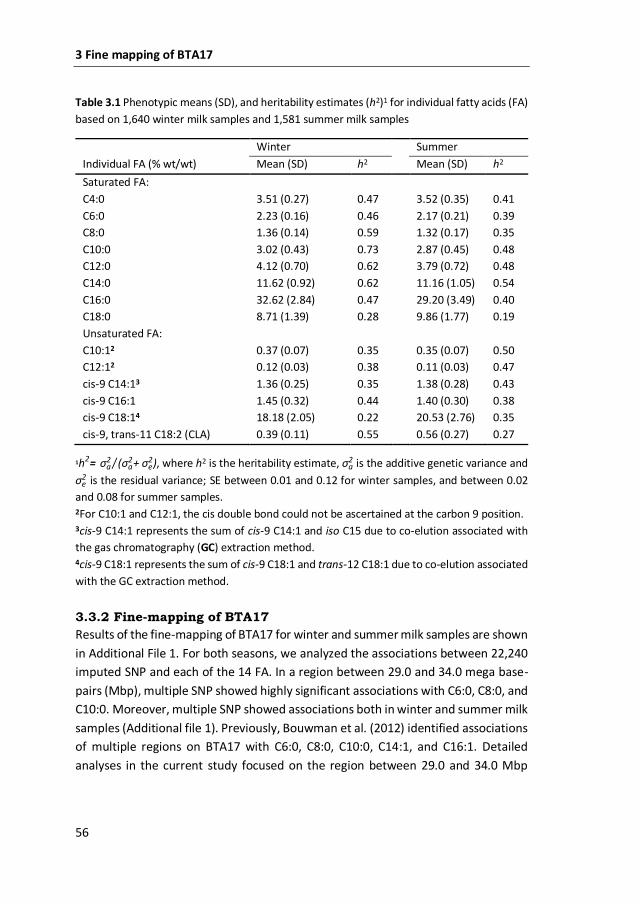
3 Fine mapping of BTA17
56
Table 3.1 Phenotypic means (SD), and heritability estimates (h2)1 for individual fatty acids (FA)
based on 1,640 winter milk samples and 1,581 summer milk samples
Individual FA (% wt/wt)
Winter Summer
Mean (SD) h2 Mean (SD) h2
Saturated FA:
C4:0 3.51 (0.27) 0.47 3.52 (0.35) 0.41
C6:0 2.23 (0.16) 0.46 2.17 (0.21) 0.39
C8:0 1.36 (0.14) 0.59 1.32 (0.17) 0.35
C10:0 3.02 (0.43) 0.73 2.87 (0.45) 0.48
C12:0 4.12 (0.70) 0.62 3.79 (0.72) 0.48
C14:0 11.62 (0.92) 0.62 11.16 (1.05) 0.54
C16:0 32.62 (2.84) 0.47 29.20 (3.49) 0.40
C18:0 8.71 (1.39) 0.28 9.86 (1.77) 0.19
Unsaturated FA:
C10:12 0.37 (0.07) 0.35 0.35 (0.07) 0.50
C12:12 0.12 (0.03) 0.38 0.11 (0.03) 0.47
cis-9 C14:13 1.36 (0.25) 0.35 1.38 (0.28) 0.43
cis-9 C16:1 1.45 (0.32) 0.44 1.40 (0.30) 0.38
cis-9 C18:14 18.18 (2.05) 0.22 20.53 (2.76) 0.35
cis-9, trans-11 C18:2 (CLA) 0.39 (0.11) 0.55 0.56 (0.27) 0.27
1h2= σa2 (σa
2+ σe2)⁄ , where h2 is the heritability estimate, σa
2 is the additive genetic variance and
σe2 is the residual variance; SE between 0.01 and 0.12 for winter samples, and between 0.02
and 0.08 for summer samples. 2For C10:1 and C12:1, the cis double bond could not be ascertained at the carbon 9 position. 3cis-9 C14:1 represents the sum of cis-9 C14:1 and iso C15 due to co-elution associated with
the gas chromatography (GC) extraction method. 4cis-9 C18:1 represents the sum of cis-9 C18:1 and trans-12 C18:1 due to co-elution associated
with the GC extraction method.
3.3.2 Fine-mapping of BTA17
Results of the fine-mapping of BTA17 for winter and summer milk samples are shown
in Additional File 1. For both seasons, we analyzed the associations between 22,240
imputed SNP and each of the 14 FA. In a region between 29.0 and 34.0 mega base-
pairs (Mbp), multiple SNP showed highly significant associations with C6:0, C8:0, and
C10:0. Moreover, multiple SNP showed associations both in winter and summer milk
samples (Additional file 1). Previously, Bouwman et al. (2012) identified associations
of multiple regions on BTA17 with C6:0, C8:0, C10:0, C14:1, and C16:1. Detailed
analyses in the current study focused on the region between 29.0 and 34.0 Mbp
3 Fine mapping of BTA17
57
because here the strongest and most consistent associations were found across
winter and summer milk samples.
Figure 3.1A illustrates the strongest associations found with the imputed 777k SNP
genotypes for C8:0 in summer milk samples. Additionally in Figure 3.1A, these
associations were overlaid with the associations found by Bouwman et al. (2012)
using 50k SNP genotypes, which was mainly the same data as used in the current
study. Within the marked region (figure 3.1A), 10 significant SNP were found with
the 50k SNP whereas 83 significant SNP were found with the imputed 777k SNP. The
most significant SNP identified based on the imputed 777k SNP (-log10(P-value) =
7.93) was not present on the 50k SNP array. The most significant SNP identified
based on the 50k SNP genotypes was less significant (-log10(P-value) = 6.21;
Bouwman et al., 2012) than the most significant SNP identified in the present study.
The location of the QTL could be refined to the genomic region located between 29.0
and 34.0 Mbp on BTA17 (figure 3.1A). Figure 3.1B shows the results of the
associations for five FA in summer milk samples for this region.
3.3.3 Construction of haplotypes
The construction of haplotypes was based on the identified QTagSNP in the fine-
mapping of BTA17. These SNP, QTagSNP1 and QTagSNP2, were different for winter
and summer milk samples. For winter milk samples, QTagSNP1 was
BovineHD1700008470 (rs109426433) located at 29.92 Mbp, and with minor allele
frequency (MAF) of 0.47. QTagSNP1 was associated with C6:0 (-log10(P-value) =
4.90), C8:0 (-log10(P-value) = 6.28), C10:0 (-log10(P-value) = 4.03) and C12:0 (-log10(P-
value) = 1.33). QTagSNP2 was BovineHD1700009150 (rs135934524) located at 32.90
Mbp, with MAF of 0.44. QTagSNP2 was associated with C6:0 (-log10(P-value) = 2.76),
C8:0 (-log10(P-value) = 3.27), and C10:0 (-log10(P-value) = 2.24). QTagSNP1 and
QTagSNP2 showed the strongest associations with C8:0. LD between QTagSNP1 and
QTagSNP2 was r2 = 0.04.
For summer milk samples, QTagSNP1 was BovineHD1700008490 (rs109290136)
located at 30.08 Mbp (Figure 3.1B), with MAF of 0.44. QTagSNP1 was associated with
C6:0 (-log10(P-value) = 6.82), C8:0 (-log10(P-value) = 7.93), C10:0 (-log10(P-value) =
6.13) and C12:0 (-log10(P-value) = 3.35). QTagSNP2 was BovineHD1700008967
(rs135465158) located at 32.17 Mbp (Figure 3.1C), with MAF of 0.14. QTagSNP2 was
associated with C6:0 (-log10(P-value) = 2.82), C8:0 (-log10(P-value) = 3.19), and
C10:0 (-log10(P-value) = 1.84). QTagSNP1 and QTagSNP2 showed the strongest
associations with C8:0. LD between QTagSNP1 and QTagSNP2 was r2 = 0.07. LD
3 Fine mapping of BTA17
58
between QTagSNP1 and all other markers in the fine-mapped region as well as
significance of association with C8:0 is represented in Additional File 3.2 – figure A.
LD between QTagSNP2 and all other markers in the fine-mapped region as well as
significance of association with C8:0 is represented in Additional file 3.2 - figure B.
LD between QtagSNP1 for winter milk samples and QtagSNP1 for summer milk
samples was r2 = 0.56; LD among other combinations of QTagSNP based on winter
or on summer milk samples was low (r2 < 0.10). For both winter and summer milk
samples, two QTagSNP were identified. These two QTagSNP were used for haplotype
construction, and this construction resulted in four haplotypes. As QTagSNP were
not the same in winter and in summer milk samples, different haplotypes were
constructed for both seasons.
3.3.4 Predicted effects of haplotypes
Predicted effects of haplotypes are shown in Table 3.2. For winter samples,
frequencies of haplotypes were 0.33 for A-A, 0.21 for A-G, 0.12 for C-A, and 0.35 for
C-G. While A-A haplotypes were associated with higher contents of C6:0, C8:0, C10:0,
C12:0, C14:0 and the index C6:0-C14:0, C-G haplotypes were associated with lower
contents of these FA and index. The absolute difference between one copy of the
most contrasting haplotypes (A-A and C-G) was 0.040 for C6:0, 0.039 for C8:0, 0.090
for C10:0, 0.054 for C12:0, 0.065 for C14:0, and 0.239 for the index C6:0-C14:0. The
fraction of genetic variance explained by haplotypes was 2.7% for C6:0, 2.8% for
C8:0, 1.4% for C10:0, 0.5% for C12:0, 0.3% for C14:0, and 0.7% for the index C6:0-
C14:0. Effects of the C-A haplotype did not differ from effects of the A-G haplotype
for C6:0, C8:0 and C10:0, while they differed significantly (P-value ≤ 0.05) from
effects of the C-G haplotype for C8:0. These results suggest that there are two groups
of haplotypes with distinct effects (A-A, and A-G/C-A/C-G) for C6:0 and C10:0, and
there are three groups of haplotypes with distinct effects (A-A, C-G, and A-G/C-A) for
C8:0.
For summer samples, frequencies of haplotypes were 0.44 for A-G, 0.12 for A-A, 0.01
for C-A, and 0.42 for C-G. While C-G haplotypes were associated with higher contents
of C6:0, C8:0, C10:0, C12:0, C14:0, and the index C6:0-C14:0, A-G haplotypes were
associated with lower contents of these FA and index. The absolute difference
between one copy of the most contrasting haplotypes (C-G and A-G) was 0.048 for
C6:0, 0.043 for C8:0, 0.102 for C10:0, 0.101 for C12:0, 0.106 for C14:0, and 0.495 for
the index C6:0-C14:0. The fraction of genetic variance explained by haplotypes was
0.3% for C4:0, 9.7% for C6:0, 9% for C8:0, 3.5% for C10:0, 1.8% for C12:0, 0.9% for
C14:0, and 5.0% for the index C6:0-C14:0.
3 Fine mapping of BTA17
59
In summer samples, predicted effects of the A-G haplotype differed significantly (P-
value ≤ 0.05; table 3.2) from effects of A-A, C-G and C-A haplotypes for C6:0, C8:0,
C10:0, and the index C6:0-C14:0. Additionally, effects of the A-G haplotype differed
significantly (P-value ≤ 0.05) from effects of the C-G haplotype for C12:0, and C14:0.
Effects of the C-G haplotype did not differ from the effects of C-A and A-A haplotypes
for any of the traits. These results suggest that there are two groups of haplotypes
with distinct effects (A-G, and A-A/C-A/C-G) for C6:0, C8:0, C10:0, C12:0, C14:0, and
the index C6:0-C14:0.
3.4 Discussion
In the present study, we refined the location of a QTL first described by Bouwman et
al. (2012). This QTL seems to influence multiple de novo synthesized FA. We fine-
mapped BTA17 by using imputed 777k SNP genotypes, and by using winter and
summer milk FA composition. To further characterize the effects associated with this
genomic region, we constructed haplotypes for each season.
3.4.1 Fine-mapping of BTA17
The fine-mapping of BTA17 combined high-density SNP genotyping with imputation.
Imputation was based on a large reference population genotyped with 777k SNP.
Additionally, the 55 sires belonging to our experimental population were genotyped
with both 50k and 777k SNP. Our experimental population, which is composed of the
daughters of the 55 sires, was imputed from 50k to 777k SNP genotypes using Beagle
(Browning and Browning, 2009). The estimated error of this imputation was below
1%. Pausch et al. (2013) showed that imputation to high-density genotypes largely
depends on the size of the reference population. An imputation accuracy of about
~99% can be obtained when a reference population of more than 400 animals is used
(Pausch et al., 2013). This is in line with the imputation accuracy obtained in the
current study. When imputation accuracy is high, GWAS based on imputed
genotypes can assist in fine-mapping because imputation provides a high-resolution
view of an associated region, and increases the chance that a causal SNP can be
directly identified (Marchini and Howie, 2010). In the present study, the number of
SNP increased by at least 10 times with the imputation of BTA17 from 50k to 777k
SNP genotypes.
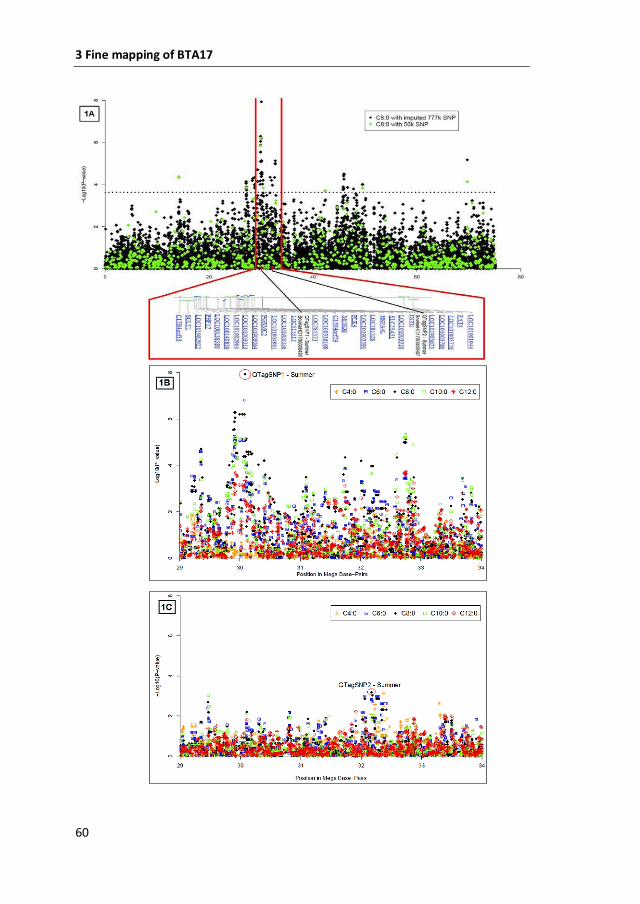
3 Fine mapping of BTA17
60
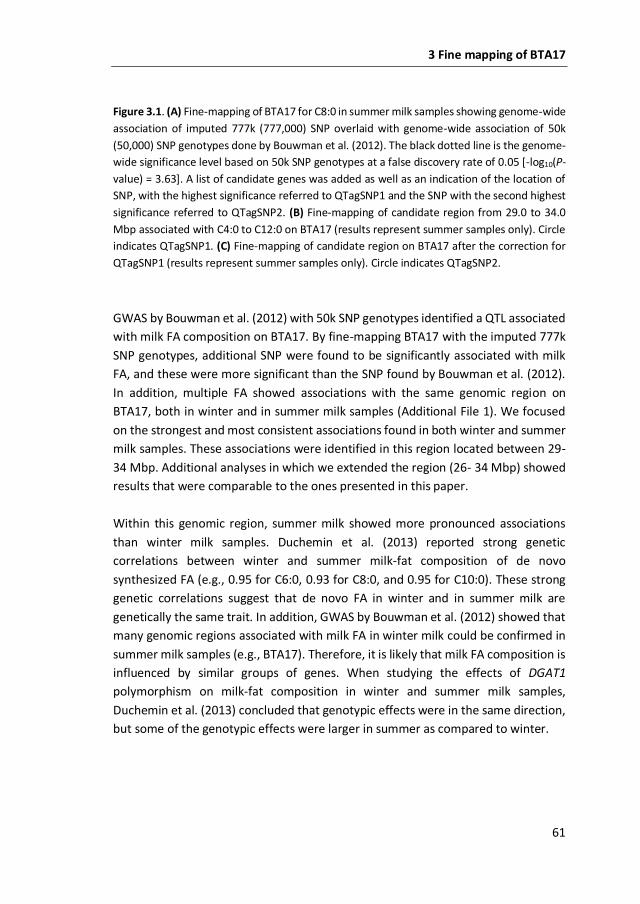
3 Fine mapping of BTA17
61
Figure 3.1. (A) Fine-mapping of BTA17 for C8:0 in summer milk samples showing genome-wide
association of imputed 777k (777,000) SNP overlaid with genome-wide association of 50k
(50,000) SNP genotypes done by Bouwman et al. (2012). The black dotted line is the genome-
wide significance level based on 50k SNP genotypes at a false discovery rate of 0.05 [-log10(P-
value) = 3.63]. A list of candidate genes was added as well as an indication of the location of
SNP, with the highest significance referred to QTagSNP1 and the SNP with the second highest
significance referred to QTagSNP2. (B) Fine-mapping of candidate region from 29.0 to 34.0
Mbp associated with C4:0 to C12:0 on BTA17 (results represent summer samples only). Circle
indicates QTagSNP1. (C) Fine-mapping of candidate region on BTA17 after the correction for
QTagSNP1 (results represent summer samples only). Circle indicates QTagSNP2.
GWAS by Bouwman et al. (2012) with 50k SNP genotypes identified a QTL associated
with milk FA composition on BTA17. By fine-mapping BTA17 with the imputed 777k
SNP genotypes, additional SNP were found to be significantly associated with milk
FA, and these were more significant than the SNP found by Bouwman et al. (2012).
In addition, multiple FA showed associations with the same genomic region on
BTA17, both in winter and in summer milk samples (Additional File 1). We focused
on the strongest and most consistent associations found in both winter and summer
milk samples. These associations were identified in this region located between 29-
34 Mbp. Additional analyses in which we extended the region (26- 34 Mbp) showed
results that were comparable to the ones presented in this paper.
Within this genomic region, summer milk showed more pronounced associations
than winter milk samples. Duchemin et al. (2013) reported strong genetic
correlations between winter and summer milk-fat composition of de novo
synthesized FA (e.g., 0.95 for C6:0, 0.93 for C8:0, and 0.95 for C10:0). These strong
genetic correlations suggest that de novo FA in winter and in summer milk are
genetically the same trait. In addition, GWAS by Bouwman et al. (2012) showed that
many genomic regions associated with milk FA in winter milk could be confirmed in
summer milk samples (e.g., BTA17). Therefore, it is likely that milk FA composition is
influenced by similar groups of genes. When studying the effects of DGAT1
polymorphism on milk-fat composition in winter and summer milk samples,
Duchemin et al. (2013) concluded that genotypic effects were in the same direction,
but some of the genotypic effects were larger in summer as compared to winter.
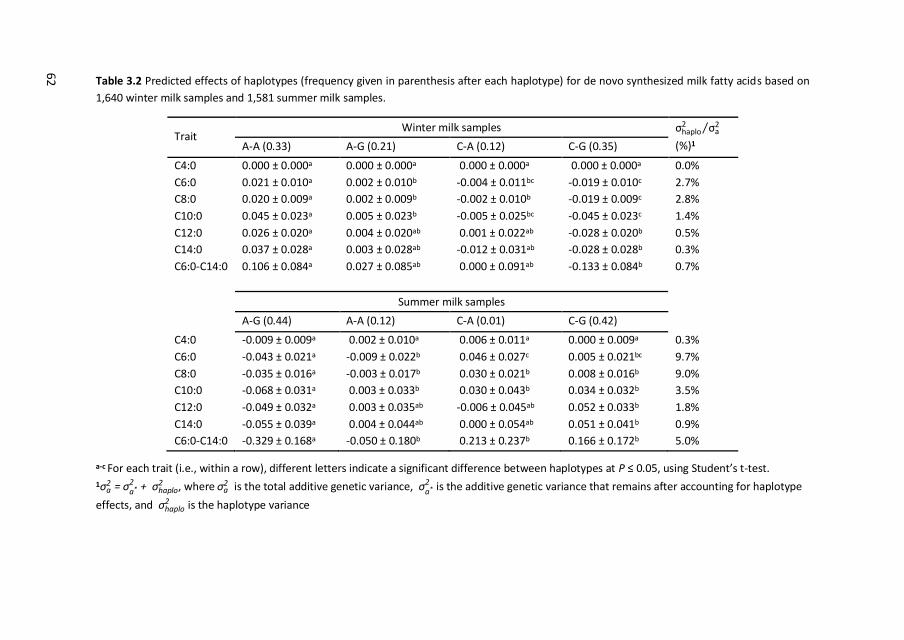
62 Table 3.2 Predicted effects of haplotypes (frequency given in parenthesis after each haplotype) for de novo synthesized milk fatty acids based on
1,640 winter milk samples and 1,581 summer milk samples.
Trait Winter milk samples σhaplo
2 σa2⁄
(%)1 A-A (0.33) A-G (0.21) C-A (0.12) C-G (0.35)
C4:0 0.000 ± 0.000a 0.000 ± 0.000a 0.000 ± 0.000a 0.000 ± 0.000a 0.0%
C6:0 0.021 ± 0.010a 0.002 ± 0.010b -0.004 ± 0.011bc -0.019 ± 0.010c 2.7%
C8:0 0.020 ± 0.009a 0.002 ± 0.009b -0.002 ± 0.010b -0.019 ± 0.009c 2.8%
C10:0 0.045 ± 0.023a 0.005 ± 0.023b -0.005 ± 0.025bc -0.045 ± 0.023c 1.4%
C12:0 0.026 ± 0.020a 0.004 ± 0.020ab 0.001 ± 0.022ab -0.028 ± 0.020b 0.5%
C14:0 0.037 ± 0.028a 0.003 ± 0.028ab -0.012 ± 0.031ab -0.028 ± 0.028b 0.3%
C6:0-C14:0 0.106 ± 0.084a 0.027 ± 0.085ab 0.000 ± 0.091ab -0.133 ± 0.084b 0.7%
Summer milk samples
A-G (0.44) A-A (0.12) C-A (0.01) C-G (0.42)
C4:0 -0.009 ± 0.009a 0.002 ± 0.010a 0.006 ± 0.011a 0.000 ± 0.009a 0.3%
C6:0 -0.043 ± 0.021a -0.009 ± 0.022b 0.046 ± 0.027c 0.005 ± 0.021bc 9.7%
C8:0 -0.035 ± 0.016a -0.003 ± 0.017b 0.030 ± 0.021b 0.008 ± 0.016b 9.0%
C10:0 -0.068 ± 0.031a 0.003 ± 0.033b 0.030 ± 0.043b 0.034 ± 0.032b 3.5%
C12:0 -0.049 ± 0.032a 0.003 ± 0.035ab -0.006 ± 0.045ab 0.052 ± 0.033b 1.8%
C14:0 -0.055 ± 0.039a 0.004 ± 0.044ab 0.000 ± 0.054ab 0.051 ± 0.041b 0.9%
C6:0-C14:0 -0.329 ± 0.168a -0.050 ± 0.180b 0.213 ± 0.237b 0.166 ± 0.172b 5.0%
a-c For each trait (i.e., within a row), different letters indicate a significant difference between haplotypes at P ≤ 0.05, using Student’s t-test. 1σa
2 = σa*2 + σhaplo
2 , where σa2 is the total additive genetic variance, σa*
2 is the additive genetic variance that remains after accounting for haplotype
effects, and σhaplo2 is the haplotype variance
3 Fine mapping of BTA17
63
Duchemin et al. (2013) concluded that differences between winter and summer milk-
fat composition were likely due to differences in the diets of the cows, and that the
effects of DGAT1 were scaled. This scaling resulted in significant DGAT1 by season
interaction, especially for short-chain FA (C4:0 to C14:0). In the present study, similar
scaling effects might explain the more pronounced associations found in summer as
compared to winter milk samples.
3.4.2 Construction of haplotypes
Haplotypes were constructed by first retrieving the most significant SNP within the
fine-mapped region. This SNP, QTagSNP1, was associated with C8:0. Most of the
variation in the region was explained by QTagSNP1, but not all. The remaining
variation was accounted for by QTagSNP2 (results shown for summer samples,
Figure 3.1B and 3.1C). After adjusting for both QTagSNP, no other significant SNP
was found. Based on the two QTagSNP, a total of four haplotypes were constructed.
In summer milk samples, these haplotypes explained almost 10% of the genetic
variance in C6:0, 9% in C8:0, 3.5% in C10:0, 1.8% in C12:0, and 0.9% in C14:0 (Table
3.2). When these FA were combined into an index, haplotypes explained 5% of the
genetic variance in de novo synthesized milk FA (C6:0-C14:0; Table 3.2).After testing
for differences between these haplotypes, we concluded that estimated effects in
summer milk for three out of four haplotypes did not differ from each other.
Therefore, our four haplotypes could be divided in two groups with distinct effects
on C6:0, C8:0, C10:0, C12:0, C14:0, and the index C6:0-C14:0: A-G versus the
remaining haplotypes. The existence of two groups of haplotypes with distinct
effects can be explained by one causal variant, i.e., one QTL. However, we cannot
exclude the presence of multiple causal variants in strong LD.
The QTL region is associated with multiple de novo synthesized FA. The de novo
synthesis occurs within the mammary gland of a cow, and is a process that elongates
precursors by adding C2:0. These precursors originate from blood lipids and can be
either acetate (C2:0), propionate (C3:0) or butyrate (C4:0). Butyrate in milk may
originate from de novo synthesis or directly from β-hydroxybutyrate derived from
the blood (e.g., Craninx et al., 2008). Depending on the precursor, the elongation
process ends either at C16:0 or at C17:0. Results of the current study show that
predicted effects of haplotypes increase from C6:0 to C14:0, however, the
proportion of genetic variance explained by haplotypes decreases from C6:0 to
C14:0. This increase of haplotype effects tends to be more pronounced in summer
than in winter milk samples (Table 3.2). These results suggest that our candidate
gene is involved in the elongation of FA or the early termination of this process
3 Fine mapping of BTA17
64
(Barber et al., 1997), and it might be up-regulated in summer as compared to winter
milk samples.
Interestingly, in other species, such as humans, macaques and pigs, this genomic
region is highly conserved. Further, in dairy cattle breeds, two studies suggested that
this region on BTA17 contains signatures of selection: Qanbari et al. (2011) identified
signatures of selection in a region close to the progesterone receptor membrane
component 2 (PGRMC2 at 29.8Mb) gene; and Stella et al. (2010) in a region close to
the sprout homolog1, antagonist of FGF signaling (Drosophila) (SPRY1 at 34.7 Mbp)
gene. Possibly this genomic region is related to a highly conserved evolutionary
mechanism.
3.4.3 Candidate genes
Information on candidate genes possibly associated with de novo synthesized FA was
retrieved from the National Center for Biotechnology Information (NCBI) website.
The QTL region on BTA17 contains 29 genes, but 18 of these genes have not been
characterized yet Between QTagSNP1 and QTagSNP2 in summer samples, there are
11 genes of which five have been characterized (Figure 3.1A).
The gene that has been characterized and is closest to the most significant
association is PGRMC2, which is located between 29.87 and 29.89 Mbp. This gene
belongs to the Superfamily cytochrome b5-like heme/steroid binding domain. This
Superfamily is involved in the fatty acid metabolic process, and oxido-reductase
activity. In humans, this gene has been associated with breast adenocarcinoma
(Causey et al., 2011), and it was pointed out as a regulator of cytochrome P450
enzyme activity (Wendler and Wehling, 2013). By sequencing the mRNA found in
milk fat layer, Lemay et al. (2013) showed that PGRMC2 is expressed in humans
throughout the lactation, which included colostrum, transitional and mature milk.
In cattle, PGRMC2 has been associated with fertility. Kowalik et al. (2013) showed
that expression of PGRMC2 mRNA in the bovine endometrium was higher in the first
trimester of pregnant cows as compared to cyclic animals. However, the translation
of PGRMC2 mRNA in protein within the bovine endometrium was not different
between cyclic and pregnant cows. In our study, cows in winter and summer
sampling period were in a different stage of lactation (average of 166 days in winter
and average of 247 days in summer samples), and probably at different stages of
pregnancy. This might be a reason for the more pronounced associations found in
summer milk samples. Therefore, we performed additional analyses in which we
investigated interactions between stage of lactation and our QTagSNPs in both
3 Fine mapping of BTA17
65
seasons. None of these interactions were significant (results not shown). Bionaz et
al. (2012) showed that PGRMC2 is expressed during lactation in bovine mammary
tissue. PGRMC2 has not been associated with milk FA composition in dairy cattle.
Of the genes located within our QTL region, Bionaz et al. (2012) showed that four
other genes are highly expressed during lactation in bovine mammary tissue:
UPF0462 protein C4orf33-like (LOC513251), sodium channel and clathrin linker 1
(SCLT1), la-related protein 1B-like (LOC515517), and chromosome 17 open reading
frame, human C4orf29 (C17H4orf29). The location in Mbp for these genes is between
29.10-29.12 for LOC513251, between 29.12-29.35 for SCLT1, between 30.03-30.07
for LOC515517, and between 30.10-30.13 for C17H4orf29. By sequencing the mRNA
found in milk fat layer, Lemay et al. (2013) showed in humans that C17h4orf33
(validated LOC513251 gene in humans), LARP1B (validated LOC515517 gene in
humans), and C17H4orf29 are expressed during all stages of lactation. These four
genes have not yet been associated to milk FA composition.
In the present paper, we refined the location of a QTL, which is associated with
multiple de novo synthesized milk FA, to a region between 29.0 and 34.0 Mbp on
BTA17. We characterized the effects associated with this region by constructing
haplotypes, and identified candidate genes possibly related to this QTL.
3.5 Conclusions
The fine-mapping of BTA17 improved the location of a QTL associated with multiple
de novo synthesized milk FA. In summer milk samples, this QTL region explained a
large proportion of the genetic variance in these FA individually (e.g., 10% in C6:0).
When all de novo synthesized milk FA were combined into an index, this QTL region
explained 5% of the genetic variance. This QTL region seems to be involved in either
the elongation process of the de novo FA synthesis or in the early termination of this
process. In addition, the effects of this QTL region are bigger in summer as compared
to winter milk samples. Candidate genes associated with milk FA composition could
not be clearly identified for this QTL because the QTL region on BTA17 is still being
characterized. A characterized gene that might be of interest within the QTL region
is PGRMC2.
3 Fine mapping of BTA17
66
3.6 Acknowledgements
This study is part of the Dutch Milk Genomics Initiative, funded by Wageningen
University, the Dutch Dairy Association (NZO), Cooperative Cattle Improvement
Organization (CRV; Arnhem, the Netherlands), and the Dutch Technology Foundation
(STW). We would like thank Chris Schrooten from CRV for the imputation of the 777k
SNP genotypes. The first author currently benefits from a joint grant from the
European Commission (within the framework of the Erasmus-Mundus joint
doctorate “EGS-ABG”) and Breed4Food (a public-private partnership in the domain
of animal breeding and genomics and CRV).
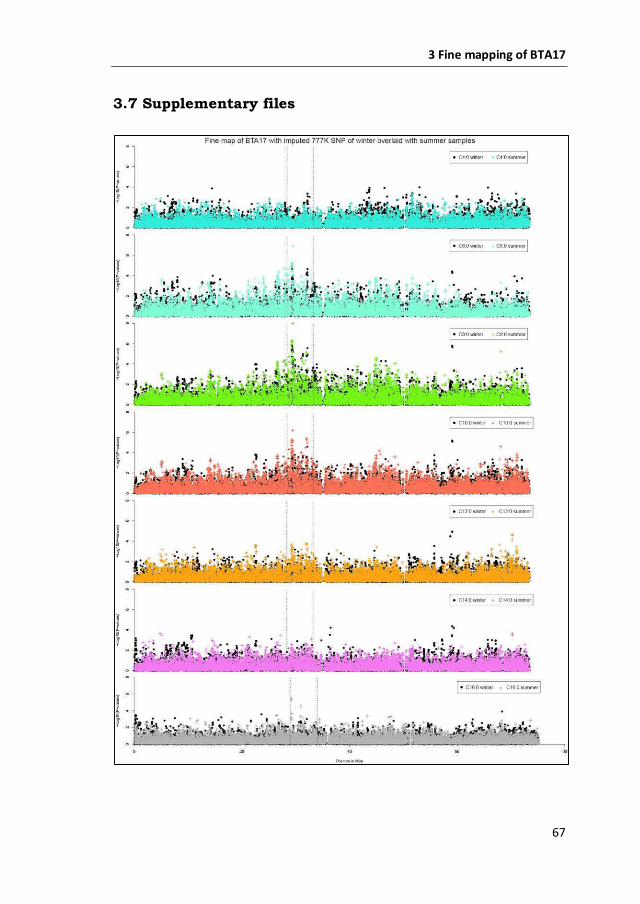
3 Fine mapping of BTA17
67
3.7 Supplementary files
1
2
3
4
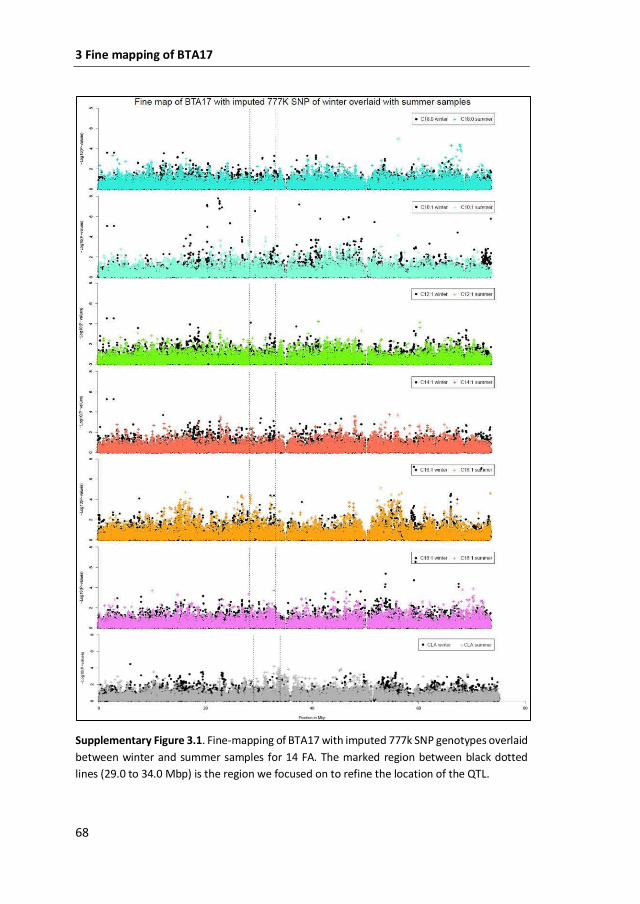
3 Fine mapping of BTA17
68
Supplementary Figure 3.1. Fine-mapping of BTA17 with imputed 777k SNP genotypes overlaid
between winter and summer samples for 14 FA. The marked region between black dotted
lines (29.0 to 34.0 Mbp) is the region we focused on to refine the location of the QTL.
1
2
3
4
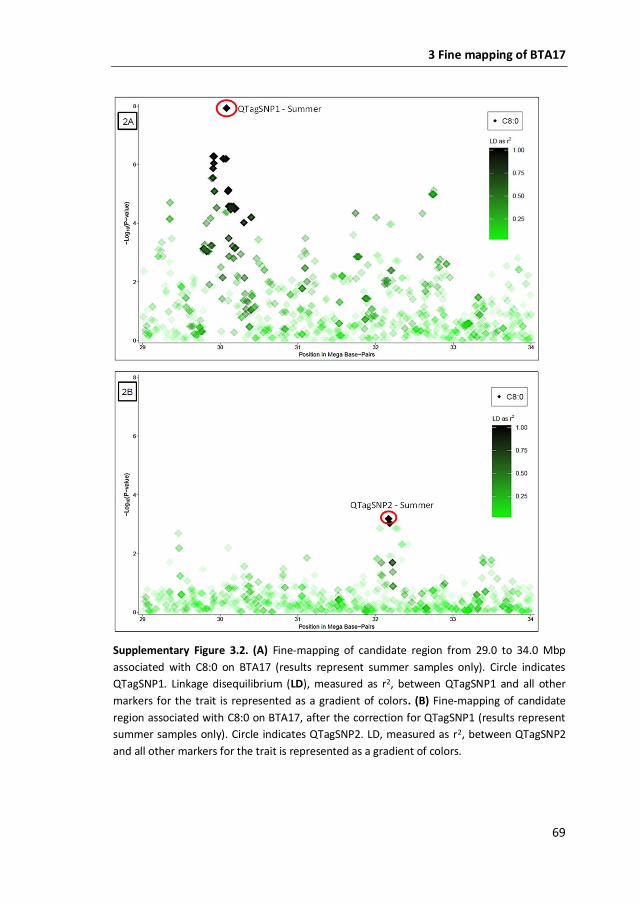
3 Fine mapping of BTA17
69
Supplementary Figure 3.2. (A) Fine-mapping of candidate region from 29.0 to 34.0 Mbp
associated with C8:0 on BTA17 (results represent summer samples only). Circle indicates
QTagSNP1. Linkage disequilibrium (LD), measured as r2, between QTagSNP1 and all other
markers for the trait is represented as a gradient of colors. (B) Fine-mapping of candidate
region associated with C8:0 on BTA17, after the correction for QTagSNP1 (results represent
summer samples only). Circle indicates QTagSNP2. LD, measured as r2, between QTagSNP2
and all other markers for the trait is represented as a gradient of colors.
3 Fine mapping of BTA17
70
3.8 References
Barber, M. C., R. A. Clegg, M. T. Travers, and R. G. Vernon. 1997. Lipid metabolism in
the lactating mammary gland. Biochim. Biophys. Acta. 1347:101–126
Bionaz, M., K. Periasamy, S. L. Rodriguez-Zas, W. L. Hurley, and J. J. Loor. 2012. A
novel dynamic impact approach DIA for functional analysis of time-course omics
studies: validation using the bovine mammary transcriptome. PLoS ONE.7: e32455
Boichard, D., and M. Brochard. 2012. New phenotypes for new breeding goals in
dairy cattle. Animal. 6:544-550.
Bouwman, A., M. H. P. W. Visker, J. A. M. van Arendonk, and H. Bovenhuis. 2012.
Genomic regions associated with bovine milk fatty acids in both summer and
winter milk samples. BMC Genet. 13:93.
Browning, B. L., and S. R. Browning. 2009. A unified approach to genotype imputation
and haplotype-phase inference for large data sets of trios and unrelated
individuals. Am. J. Hum. Genet. 84:210-223.
Causey, M. W., L. J. Huston, D. M. Harold, C. J. Charaba, D. L. Ippolito, Z. S. Hoffer, T.
A. Brown, and J. D. Stallings. 2011. Transcriptional analysis of novel hormone
receptors PGRMC1 and PGRMC2 as potential biomarkers of breast
adenocarcinoma staging. J. Surg. Res. 171:615-622.
Chilliard, Y., A. Ferlay, R. M. Mansbridge, and M. Doreau. 2000. Ruminant milk fat
plasticity: Nutritional control of saturated, polyunsaturated, trans and conjugated
fatty acids. Ann. Zootech. 49:181–206.
Duchemin, S., H. Bovenhuis, W. M. Stoop, A. C. Bouwman, J. A. M. van Arendonk,
and M. H. P. W. Visker. 2013. Genetic correlation between composition of bovine
milk fat in winter and summer, and DGAT1 and SCD1 by season interactions. J.
Dairy Sci. 96:592-604.
Gilmour, A. R., B. Gogel, B. Cullis, and R. Thompson. 2009. ASReml user guide release
3.0. VSN International Ltd, Hemel Hempstead, UK.
Hinds, D. A., L. L. Stuve, G. B. Nilsen, E. Halperin, E. Eskin, D. G. Ballinger, K. A. Frazer,
and D. R. Cox. 2005. Whole-genome patterns of common DNA variation in three
human populations. Science. 307:1072-1079.
Ishii, A., K. Yamaji, Y. Uemoto, N. Sasago, E. Kobayashi, N. Kobayashi, T. Matsuhashi,
S. Maruyama, H. Matsumoto, S. Sasazaki, and H. Mannen. 2013. Genome-wide
association study for fatty acid composition in Japanese Black cattle. Anim. Sci. J.
84:675-682.
Jensen, R. G. 2002. The composition of bovine milk lipids: January 1995 to December
2000. J. Dairy Sci. 85:295-350.
3 Fine mapping of BTA17
71
Kowalik, M. K., D. Slonina, R. Rekawiecki, and J. Kotwica. 2013. Expression of
progesterone receptor membrane component (PGRMC) 1 and 2, serpine mRNA
binding protein 1 (SERBP1) and nuclear progesterone receptor (PGR) in the bovine
endometrium during the estrous cycle and the first trimester of pregnancy.
Reprod. Biol. 13:15-23.
Lemay, D. G., O. A. Ballard, M. A. Hughes, A. L. Morrow, N. D. Horseman, and L. A.
Nommsen-Rivers. 2013. RNA sequencing of the human milk fat layer
transcriptome reveals distinct gene expression profiles at three stages of lactation.
PLoS ONE 8:e67531.
Marchini, J., and B. Howie. 2010. Genotype imputation for genome-wide association
studies. Nat. Rev. Genet. 11:499-511.
Palmquist, D. L. 2006. Milk fat: Origin of fatty acids and influence of nutritional
factors thereon. Pages 43–92 in Advanced Dairy Chemistry: Lipids. Vol. 2. P. F. Fox
and P. L. H. McSweeney, ed. Springer, New York, USA.
Pausch, H., B. Aigner, R. Emmerling, C. Edel, K.-U. Götz, and R. Fries. 2013. Imputation
of high-density genotypes in the Fleckvieh cattle population. Genet. Sel. Evol. 45:3.
Purcell, S., B. Neale, K. Todd-Brown, L. Thomas, M. A. Ferreira, D. Bender, J. Maller,
P. Sklar, P. I. De Bakker, and M. J. Daly. 2007. PLINK: a tool set for whole-genome
association and population-based linkage analyses. Am. J. Hum. Genet. 81:559-
575.
Qanbari, S., D. Gianola, B. Hayes, F. Schenkel, S. Miller, S. Moore, G. Thaller, and H.
Simianer. 2011. Application of site and haplotype-frequency based approaches for
detecting selection signatures in cattle. BMC Genomics 12:318.
Schennink, A., J. M. L. Heck, H. Bovenhuis, M. H. P. W. Visker, H. J. F. van Valenberg,
and J. A. M. van Arendonk. 2008. Milk fatty acid unsaturation: genetic parameters
and effects of stearoyl-coa desaturase (SCD1) and acyl coa: diacylglycerol
acyltransferase 1 (DGAT1). J. Dairy Sci. 91:2135-2143.
Schennink, A., W. Stoop, M. Visker, J. Heck, H. Bovenhuis, J. Van Der Poel, H. Van
Valenberg, and J. Van Arendonk. 2007. DGAT1 underlies large genetic variation in
milk‐fat composition of dairy cows. Anim. Genet. 38:467-473.
Stella, A., P. Ajmone-Marsan, B. Lazzari, and P. Boettcher. 2010. Identification of
selection signatures in cattle breeds selected for dairy production. Genetics.
185:1451-1461.
Stoop, W. M., J. A. M. van Arendonk, J. M. L. Heck, H. J. F. van Valenberg, and H.
Bovenhuis. 2008. Genetic parameters for major milk fatty acids and milk
production traits of Dutch Holstein-Friesians. J. Dairy Sci. 91:385-394.
3 Fine mapping of BTA17
72
Wendler, A., and M. Wehling. 2013. PGRMC2, a yet uncharacterized protein with
potential as tumor suppressor, migration inhibitor, and regulator of cytochrome
P450 enzyme activity. Steroids.78:555-558.
Wilmink, J. B. M. 1987. Adjustment of test-day milk, fat and protein yield for age,
season and stage of lactation. Livest. Prod. Sci. 16:335-348.
Zimin, A. V., A. L. Delcher, L. Florea, D. R. Kelley, M. C. Schatz, D. Puiu, F. Hanrahan,
G. Pertea, C. P. Van Tassell, and T. S. Sonstegard. 2009. A whole-genome assembly
of the domestic cow, Bos taurus. Genome Biol. 10:R42.
4
Fine-mapping of BTA17 using imputed
sequences for associations with de novo synthesized fatty acids in bovine milk
S. I. Duchemin1,2, H. Bovenhuis1, H-J. Megens1, J. A. M. Van Arendonk1, M. H. P. W.
Visker1
1 Animal Breeding and Genomics Centre, Wageningen University, PO Box 338, 6700
AH Wageningen, the Netherlands; 2 Department of Animal Breeding and Genetics,
Swedish University of Agricultural Sciences, Uppsala, Sweden
(Manuscript in preparation)
74
Abstract
A genomic region associated with milk fatty acids on Bos taurus autosome (BTA) 17
has been discovered with 50,000 (50k) SNP and characterized with imputed 777,000
(777k) SNP genotypes. The aim of this study was to characterize this genomic region
using imputed whole-genome sequences (WGS) and identify candidate genes
associated with milk fatty acids (FA) composition on BTA17. Phenotypes and
genotypes were available for 1,905 cows sampled in winter, and for 1,795 cows
sampled in summer. Phenotypes consisted of gas chromatography measurements of
6 FA in winter and in summer milk samples. Genotypes consisted of imputed 777k
SNP, and 89 sequenced founders of our population of cows. In addition, 450 WGS
from the 1,000 bull genome consortium were available. Using 495 Holstein-Friesians
sequences as reference population, we imputed the imputed 777k SNP genotyped
cows to sequence level. Single-marker analyses were run with an animal model, and
many significant associations with C6:0, C8:0, C10:0, C12:0 and C14:0 were
identified. For example, for C8:0, a total of 1,182 significant associations in winter
milk samples, and a total of 1,943 significant associations in summer milk samples
were identified. Similar results were identified for all 6 FA. For C8:0 in summer milk
samples, the genomic region located between 29 and 34 mega base-pairs on BTA17
revealed a total of 608 significant associations. The most significant association (–
Log10(P-value) = 7.66) was found for 8 SNP in perfect linkage disequilibrium. After
fitting one of these 8 SNP as a fixed effect in the model, and re-running the single-
marker analyses, no further significant associations were found. In the QTL region
located between 29 and 34 mega base-pairs, a total of 14 genes could be identified.
Six out of the 8 SNP in perfect LD were located in the LA ribonucleoprotein domain
family, member 1B (LARP1B) gene. This primary candidate gene has not been
associated with milk-fat composition yet.
Key words: QTL, candidate genes, sequences, LARP1B
4 Fine-mapping of BTA17 with imputed sequences
75
4.1 Introduction
Bovine milk-fat is an important source of energy in human diets. The main bioactive
lipids in bovine milk are fatty acids (FA). FA from bovine milk have important
biological activities regarding the cell and tissue metabolism, as well as
responsiveness to hormones and other signals in human cells (Calder, 2015).
Previous studies on milk FA composition have indicated that amounts of individual
FA in bovine milk are heritable (e.g., Duchemin et al., 2013). Heritability estimates
range from 0.22 to 0.71 in Dutch Holstein-Friesian cows (Stoop et al., 2008). These
findings suggested there is high genetic variability in the content of many individual
FA in bovine milk.
Supporting these findings, polymorphisms in the acyl-CoA: diacylglycerol (DGAT1)
and in the stearoyl-CoA desaturase1 (SCD1) genes have been associated with milk
FA composition (e.g., Moioli et al, 2007; Schennink et al., 2007, 2008). In addition,
Bouwman et al. (2012) identified many promising genomic regions associated with
individual FA in bovine milk, when performing a genome-wide association study
(GWAS) with 50,000 single-nucleotide polymorphism (SNP) genotypes. One of these
regions located on Bos taurus autosome (BTA) 17 was fine-mapped with imputed
777,000 SNP (777k) genotypes, and significant associations with short-chain de novo
synthesized FA have been identified (Duchemin et al., 2014). Furthermore, other
studies have helped characterize BTA17. In Danish Holsteins, Buitenhuis et al. (2014)
performed a GWAS identifying a QTL on BTA17 associated with conjugated linoleic
acid (CLA). In Fleckvieh cattle breed, Pausch et al. (2012) performed a GWAS
identifying a genomic region on BTA17 associated with supernumerary teats, and
this genomic region has been associated with the absence of teats in Japanese Black
cattle (Ihara et al., 2007). In Bubalus bubalis, Venturini et al. (2014) performed a
GWAS on milk production traits and identified significant associations with milk
production traits (i.e., milk yield, fat yield and protein yield) on BTA17 (note: BTA17
is used as a one-to-one correspondence to BBU17 in buffaloes). Despite the attempts
to characterize BTA17 with a limited annotation of the cattle genome and genetic
markers separated by more than 4 mega-base pairs in most cases, it is still difficult
to identify the causal variants underlying the identified QTL.
With the advent of whole-genome sequences (WGS) in cattle, causal variants
underlying QTL should be identified more easily with GWAS. WGS should contain the
polymorphisms causing the genetic differences between individuals (Meuwissen and
Goddard, 2010). To overcome the high-costs associated with WGS, Druet et al.
4 Fine-mapping of BTA17 with imputed sequences
76
(2014) proposed to sequence influential ancestors of a population, and impute the
rest of this population to sequence level. A GWAS using imputed WGS was first
implemented by Daetwyler et al. (2014). Their study successfully mapped previously
identified QTL affecting milk production traits and curly coat in cattle. Therefore,
GWAS using imputed WGS can be used successful in (fine) mapping complex traits.
GWAS by Bouwman et al. (2012) identified a QTL region on BTA17 influencing C6:0,
C8:0 and C10:0 FA. This genomic region was further characterized by Duchemin et
al. (2014), and their findings suggested that this QTL region influenced multiple
short-chain FA (C6:0 to C12:0) in a similar location on BTA17. Although candidate
genes have been suggested for this QTL region, no causal variant for this QTL has
been identified yet. The aim of this study was to use imputed WGS to identify the
causal variant underlying the QTL on BTA17 associated with multiple short-chain FA
previously identified by Bouwman et al. (2012), and fine-mapped by Duchemin et al.
(2014).
4.2 Material and Methods
4.2.1 Animals and phenotypes
Morning milk (500mL/cow) was sampled from 2,001 primiparous Holstein-Friesian
cows belonging to 398 herds throughout the Netherlands. These samples were
collected in two periods: February-March 2005 (referred to as winter samples) and
May-June 2005 (referred to as summer samples). For each herd, most of the cows
were sampled in both periods. However, some cows sampled in winter were no
longer in lactation in summer. Consequently, additional cows were sampled in
summer to ensure that at least 3 cows per herd were sampled in both periods. For
winter milk samples, phenotypes were available on 1,905 cows, and their lactation
stages ranged from 63 to 282d (see Stoop et al., 2008). For summer milk samples,
phenotypes were available on 1,795 cows, and their lactation stages ranged from 97
to 335d (see Duchemin et al., 2013). During the winter, all cows were kept indoors
and fed silage, while in summer 50% of the cows could graze pasture (3.5 to 24h/d).
More information on the experimental design is available in Stoop et al. (2008).
Milk FA were measured by gas chromatography at the COKZ laboratory (Qlip,
Leudsen, Netherlands). The milk FA included in this study were C4:0, C6:0, C8:0,
C10:0, C12:0, and C14:0, and they were expressed as weight proportion of total fat
(%wt/wt). For more information regarding phenotypes, see Stoop et al. (2008).
4 Fine-mapping of BTA17 with imputed sequences
77
4.2.2 Genotypes and variant calling
Blood from cows and semen from bulls were sampled to retrieve DNA for genotyping
purposes. First, a total of 55 sires (founders) and 1,813 cows (experimental
population) were genotyped with a 50k SNP chip designed by CRV (Arnhem, the
Netherlands) with the Illumina Infinium array (Illumina Inc., San Diego, CA). Second,
777k SNP genotypes were imputed for the 1,813 cows, based on their 50k SNP
genotypes and a reference population of 1,333 animals including the 55 founder
sires genotyped with the 777k SNP chip (Illumina). See Duchemin et al., (2014) for
details. The imputation resulted in 1,736 cows imputed to 777k SNP genotypes. From
these 1,736 animals, some animals were removed from the data: 12 animals because
of pedigree inconsistencies, and, subsequently, 3 animals that did not meet the
criteria of a minimum of 3 animals sampled per herd. Therefore, 777K SNP genotypes
were available for 1,721 cows. For BTA17, the target of the present study, the data
consisted of a total of 22,240 imputed SNP genotypes for each of the 1,721 cows.
Third, the 55 founder sires and 34 influential ancestors (grand-sires) of the
experimental population (MGI) were sequenced. These 89 ancestors were
sequenced with the HiSeq® 2000 Sequencing System (Illumina Inc., San Diego, CA).
All downstream analyses were performed according to the protocols described by
Daetwyler et al., (2014). Multi-sample variant calling was done using the
UnifiedGenotyper implemented in GATK, following the procedures as explained by
Daetwyler et al., (2014). The resulting raw VCF files were filtered for exclusion of
duplicates, resulting in 854,779 called sites for BTA17.
In addition, 450 WGS from Holstein-Friesian cows and bulls were available from Run5
of the 1000 Bull Genome Consortium (RUN5; Daetwyler et al., 2014). These 450 WGS
included the re-sequenced 44 out of the 55 founder sires. All positions of the variants
on sequences were aligned to the bovine genome assembly UMD3.1 (Zimin et al.,
2009). SNP and indels at same base-pairs positions were excluded because of
alignment and sequencing problems. For further details on alignment, variant calling
and filtering, see Daewytler et al. (2014). For BTA17, a total of 1,157,678 sites were
available for each of the 450 sequenced animals.
4.2.3 Imputation
We created a reference population containing both MGI and RUN5 WGS. This
reference population consisted of imputing the 45 MGI WGS to the level of the 450
RUN5 WGS to equalize the number of sites. Comparison of called sites for BTA17
between the 45 MGI and the 450 RUN5 WGS showed that 495,726 called sites
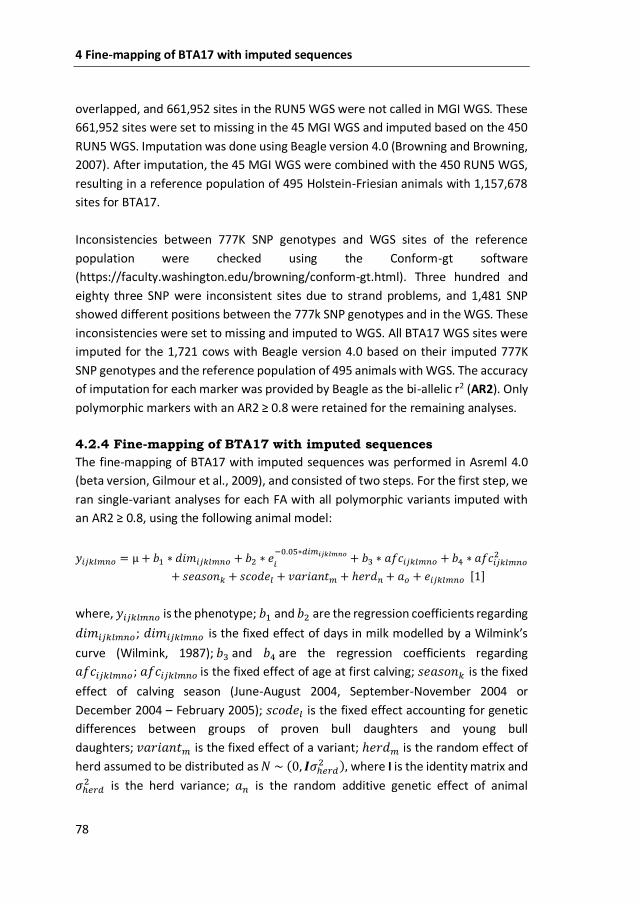
4 Fine-mapping of BTA17 with imputed sequences
78
overlapped, and 661,952 sites in the RUN5 WGS were not called in MGI WGS. These
661,952 sites were set to missing in the 45 MGI WGS and imputed based on the 450
RUN5 WGS. Imputation was done using Beagle version 4.0 (Browning and Browning,
2007). After imputation, the 45 MGI WGS were combined with the 450 RUN5 WGS,
resulting in a reference population of 495 Holstein-Friesian animals with 1,157,678
sites for BTA17.
Inconsistencies between 777K SNP genotypes and WGS sites of the reference
population were checked using the Conform-gt software
(https://faculty.washington.edu/browning/conform-gt.html). Three hundred and
eighty three SNP were inconsistent sites due to strand problems, and 1,481 SNP
showed different positions between the 777k SNP genotypes and in the WGS. These
inconsistencies were set to missing and imputed to WGS. All BTA17 WGS sites were
imputed for the 1,721 cows with Beagle version 4.0 based on their imputed 777K
SNP genotypes and the reference population of 495 animals with WGS. The accuracy
of imputation for each marker was provided by Beagle as the bi-allelic r2 (AR2). Only
polymorphic markers with an AR2 ≥ 0.8 were retained for the remaining analyses.
4.2.4 Fine-mapping of BTA17 with imputed sequences
The fine-mapping of BTA17 with imputed sequences was performed in Asreml 4.0
(beta version, Gilmour et al., 2009), and consisted of two steps. For the first step, we
ran single-variant analyses for each FA with all polymorphic variants imputed with
an AR2 ≥ 0.8, using the following animal model:
𝑦𝑖𝑗𝑘𝑙𝑚𝑛𝑜 = µ + 𝑏1 ∗ 𝑑𝑖𝑚𝑖𝑗𝑘𝑙𝑚𝑛𝑜 + 𝑏2 ∗ 𝑒𝑖
−0.05∗𝑑𝑖𝑚𝑖𝑗𝑘𝑙𝑚𝑛𝑜 + 𝑏3 ∗ 𝑎𝑓𝑐𝑖𝑗𝑘𝑙𝑚𝑛𝑜 + 𝑏4 ∗ 𝑎𝑓𝑐𝑖𝑗𝑘𝑙𝑚𝑛𝑜2
+ 𝑠𝑒𝑎𝑠𝑜𝑛𝑘 + 𝑠𝑐𝑜𝑑𝑒𝑙 + 𝑣𝑎𝑟𝑖𝑎𝑛𝑡𝑚 + ℎ𝑒𝑟𝑑𝑛 + 𝑎𝑜 + 𝑒𝑖𝑗𝑘𝑙𝑚𝑛𝑜 [1]
where, 𝑦𝑖𝑗𝑘𝑙𝑚𝑛𝑜 is the phenotype; 𝑏1 and 𝑏2 are the regression coefficients regarding
𝑑𝑖𝑚𝑖𝑗𝑘𝑙𝑚𝑛𝑜; 𝑑𝑖𝑚𝑖𝑗𝑘𝑙𝑚𝑛𝑜 is the fixed effect of days in milk modelled by a Wilmink’s
curve (Wilmink, 1987); 𝑏3 and 𝑏4 are the regression coefficients regarding
𝑎𝑓𝑐𝑖𝑗𝑘𝑙𝑚𝑛𝑜; 𝑎𝑓𝑐𝑖𝑗𝑘𝑙𝑚𝑛𝑜 is the fixed effect of age at first calving; 𝑠𝑒𝑎𝑠𝑜𝑛𝑘 is the fixed
effect of calving season (June-August 2004, September-November 2004 or
December 2004 – February 2005); 𝑠𝑐𝑜𝑑𝑒𝑙 is the fixed effect accounting for genetic
differences between groups of proven bull daughters and young bull
daughters; 𝑣𝑎𝑟𝑖𝑎𝑛𝑡𝑚 is the fixed effect of a variant; ℎ𝑒𝑟𝑑𝑚 is the random effect of
herd assumed to be distributed as 𝑁 ~ (0, 𝑰𝜎ℎ𝑒𝑟𝑑2 ), where I is the identity matrix and
𝜎ℎ𝑒𝑟𝑑2 is the herd variance; 𝑎𝑛 is the random additive genetic effect of animal
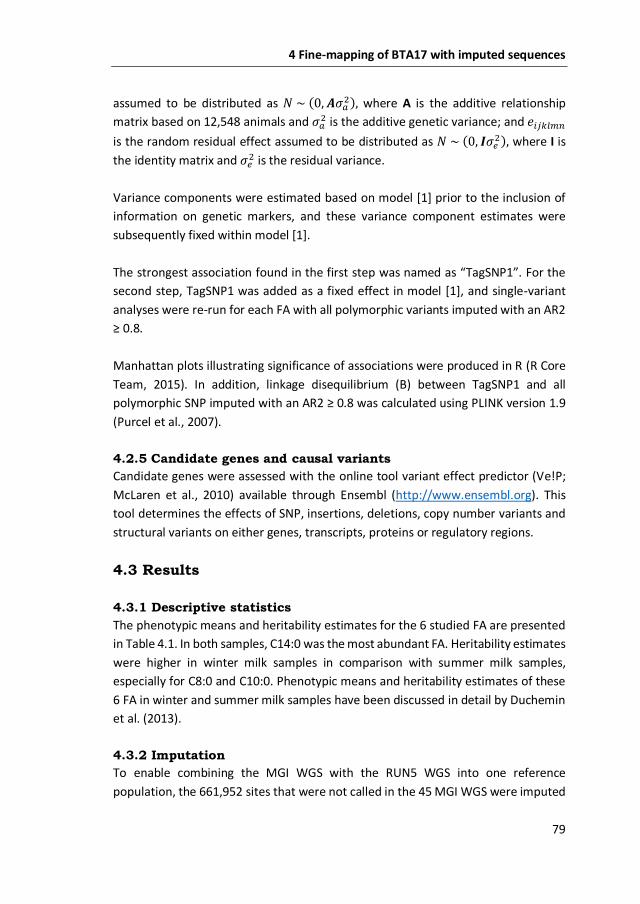
4 Fine-mapping of BTA17 with imputed sequences
79
assumed to be distributed as 𝑁 ~ (0, 𝑨𝜎𝑎2), where A is the additive relationship
matrix based on 12,548 animals and 𝜎𝑎2 is the additive genetic variance; and 𝑒𝑖𝑗𝑘𝑙𝑚𝑛
is the random residual effect assumed to be distributed as 𝑁 ~ (0, 𝑰𝜎𝑒2), where I is
the identity matrix and 𝜎𝑒2 is the residual variance.
Variance components were estimated based on model [1] prior to the inclusion of
information on genetic markers, and these variance component estimates were
subsequently fixed within model [1].
The strongest association found in the first step was named as “TagSNP1”. For the
second step, TagSNP1 was added as a fixed effect in model [1], and single-variant
analyses were re-run for each FA with all polymorphic variants imputed with an AR2
≥ 0.8.
Manhattan plots illustrating significance of associations were produced in R (R Core
Team, 2015). In addition, linkage disequilibrium (B) between TagSNP1 and all
polymorphic SNP imputed with an AR2 ≥ 0.8 was calculated using PLINK version 1.9
(Purcel et al., 2007).
4.2.5 Candidate genes and causal variants
Candidate genes were assessed with the online tool variant effect predictor (Ve!P;
McLaren et al., 2010) available through Ensembl (http://www.ensembl.org). This
tool determines the effects of SNP, insertions, deletions, copy number variants and
structural variants on either genes, transcripts, proteins or regulatory regions.
4.3 Results
4.3.1 Descriptive statistics
The phenotypic means and heritability estimates for the 6 studied FA are presented
in Table 4.1. In both samples, C14:0 was the most abundant FA. Heritability estimates
were higher in winter milk samples in comparison with summer milk samples,
especially for C8:0 and C10:0. Phenotypic means and heritability estimates of these
6 FA in winter and summer milk samples have been discussed in detail by Duchemin
et al. (2013).
4.3.2 Imputation
To enable combining the MGI WGS with the RUN5 WGS into one reference
population, the 661,952 sites that were not called in the 45 MGI WGS were imputed
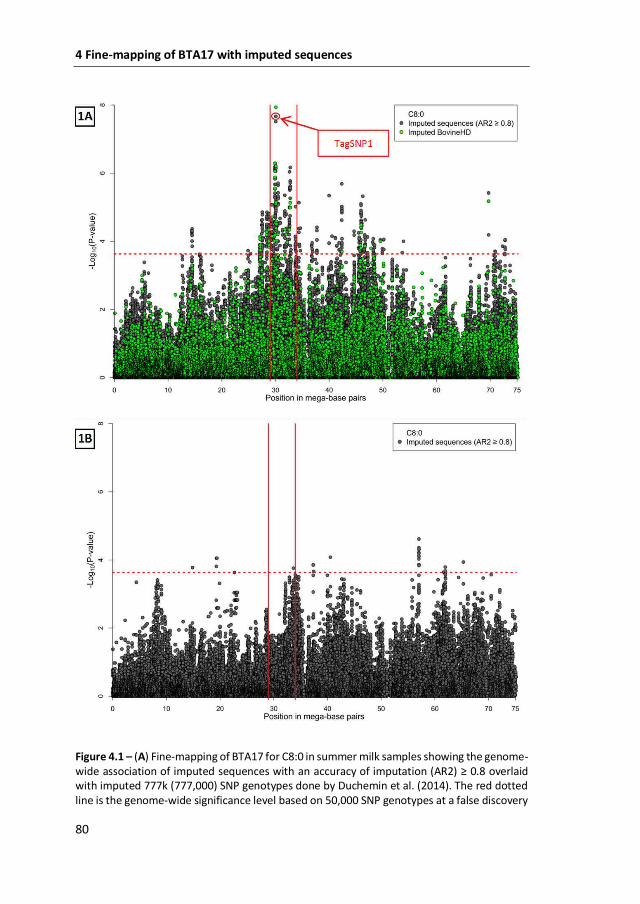
4 Fine-mapping of BTA17 with imputed sequences
80
Figure 4.1 – (A) Fine-mapping of BTA17 for C8:0 in summer milk samples showing the genome-wide association of imputed sequences with an accuracy of imputation (AR2) ≥ 0.8 overlaid with imputed 777k (777,000) SNP genotypes done by Duchemin et al. (2014). The red dotted line is the genome-wide significance level based on 50,000 SNP genotypes at a false discovery
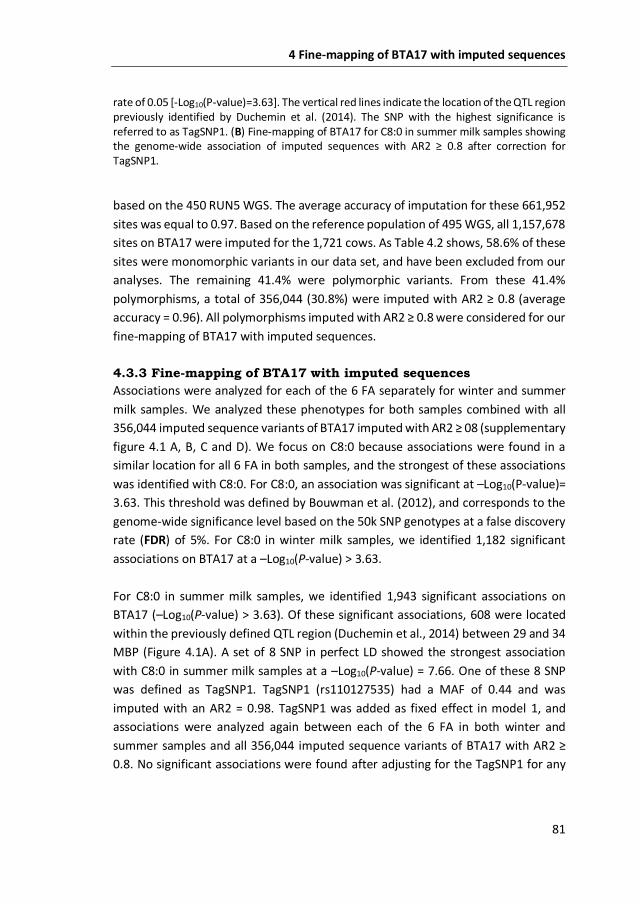
4 Fine-mapping of BTA17 with imputed sequences
81
rate of 0.05 [-Log10(P-value)=3.63]. The vertical red lines indicate the location of the QTL region previously identified by Duchemin et al. (2014). The SNP with the highest significance is referred to as TagSNP1. (B) Fine-mapping of BTA17 for C8:0 in summer milk samples showing the genome-wide association of imputed sequences with AR2 ≥ 0.8 after correction for TagSNP1.
based on the 450 RUN5 WGS. The average accuracy of imputation for these 661,952
sites was equal to 0.97. Based on the reference population of 495 WGS, all 1,157,678
sites on BTA17 were imputed for the 1,721 cows. As Table 4.2 shows, 58.6% of these
sites were monomorphic variants in our data set, and have been excluded from our
analyses. The remaining 41.4% were polymorphic variants. From these 41.4%
polymorphisms, a total of 356,044 (30.8%) were imputed with AR2 ≥ 0.8 (average
accuracy = 0.96). All polymorphisms imputed with AR2 ≥ 0.8 were considered for our
fine-mapping of BTA17 with imputed sequences.
4.3.3 Fine-mapping of BTA17 with imputed sequences
Associations were analyzed for each of the 6 FA separately for winter and summer
milk samples. We analyzed these phenotypes for both samples combined with all
356,044 imputed sequence variants of BTA17 imputed with AR2 ≥ 08 (supplementary
figure 4.1 A, B, C and D). We focus on C8:0 because associations were found in a
similar location for all 6 FA in both samples, and the strongest of these associations
was identified with C8:0. For C8:0, an association was significant at –Log10(P-value)=
3.63. This threshold was defined by Bouwman et al. (2012), and corresponds to the
genome-wide significance level based on the 50k SNP genotypes at a false discovery
rate (FDR) of 5%. For C8:0 in winter milk samples, we identified 1,182 significant
associations on BTA17 at a –Log10(P-value) > 3.63.
For C8:0 in summer milk samples, we identified 1,943 significant associations on
BTA17 (–Log10(P-value) > 3.63). Of these significant associations, 608 were located
within the previously defined QTL region (Duchemin et al., 2014) between 29 and 34
MBP (Figure 4.1A). A set of 8 SNP in perfect LD showed the strongest association
with C8:0 in summer milk samples at a –Log10(P-value) = 7.66. One of these 8 SNP
was defined as TagSNP1. TagSNP1 (rs110127535) had a MAF of 0.44 and was
imputed with an AR2 = 0.98. TagSNP1 was added as fixed effect in model 1, and
associations were analyzed again between each of the 6 FA in both winter and
summer samples and all 356,044 imputed sequence variants of BTA17 with AR2 ≥
0.8. No significant associations were found after adjusting for the TagSNP1 for any
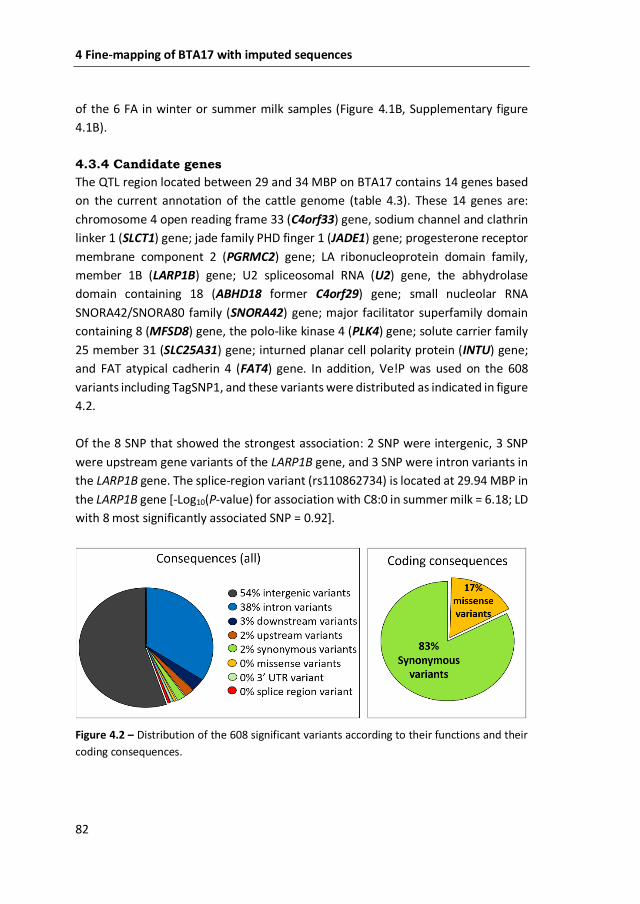
4 Fine-mapping of BTA17 with imputed sequences
82
of the 6 FA in winter or summer milk samples (Figure 4.1B, Supplementary figure
4.1B).
4.3.4 Candidate genes
The QTL region located between 29 and 34 MBP on BTA17 contains 14 genes based
on the current annotation of the cattle genome (table 4.3). These 14 genes are:
chromosome 4 open reading frame 33 (C4orf33) gene, sodium channel and clathrin
linker 1 (SLCT1) gene; jade family PHD finger 1 (JADE1) gene; progesterone receptor
membrane component 2 (PGRMC2) gene; LA ribonucleoprotein domain family,
member 1B (LARP1B) gene; U2 spliceosomal RNA (U2) gene, the abhydrolase
domain containing 18 (ABHD18 former C4orf29) gene; small nucleolar RNA
SNORA42/SNORA80 family (SNORA42) gene; major facilitator superfamily domain
containing 8 (MFSD8) gene, the polo-like kinase 4 (PLK4) gene; solute carrier family
25 member 31 (SLC25A31) gene; inturned planar cell polarity protein (INTU) gene;
and FAT atypical cadherin 4 (FAT4) gene. In addition, Ve!P was used on the 608
variants including TagSNP1, and these variants were distributed as indicated in figure
4.2.
Of the 8 SNP that showed the strongest association: 2 SNP were intergenic, 3 SNP
were upstream gene variants of the LARP1B gene, and 3 SNP were intron variants in
the LARP1B gene. The splice-region variant (rs110862734) is located at 29.94 MBP in
the LARP1B gene [-Log10(P-value) for association with C8:0 in summer milk = 6.18; LD
with 8 most significantly associated SNP = 0.92].
Figure 4.2 – Distribution of the 608 significant variants according to their functions and their
coding consequences.
4 Fine-mapping of BTA17 with imputed sequences
83
4.4 Discussion
The fine-mapping of BTA17 was first performed by Duchemin et al. (2014), in which
the de novo synthesized FA in winter and summer milk samples were analyzed with
imputed 777k SNP genotypes. Their study identified two intergenic SNP associated
with multiple FA in a QTL region located between 29 and 34 mega base-pairs on
BTA17. In the present work, 6 of the FA studied by Duchemin et al. (2014) have been
considered. Our goal was to identify the causal variant underlying this QTL region,
and to characterize this QTL region with recent information on candidate genes.
4.4.1 Fine-mapping of BTA17 with imputed sequences
The fine-mapping of BTA17 with imputed sequences identified many significant
associations with the 6 studied FA. In agreement with Duchemin et al. (2014),
multiple FA showed strong signals at a similar location on BTA17. These multiple FA
were the de novo synthesized FA in the mammary gland of a cow. It is assumed that
de novo synthesis elongates FA by adding C2:0 to precursors, such as C2:0, C3:0 and
C4:0. Depending on which precursors, the elongation of FA is assumed to end at
either C16:0 or C17:0. The origin of these precursors in the mammary gland of a cow
varies: C2:0 and C3:0 are originated mainly from blood lipids, while C4:0 can either
arise from blood lipids or be de novo synthesized (e.g., Craninx et al, 2008). In the
present study, C4:0 does not seem to be influenced by this QTL region, while this QTL
region seems to influence the other 5 FA. With imputed sequences, it was possible
to observe that the QTL region does not only influences C6:0, C8:0 and C10:0, but
also C12:0 and C14:0 (Supplementary file 1). Although the signals were weaker for
C12:0 and C14:0, their signals overlap with the remaining FA in the QTL region for
winter and summer milk samples (Supplementary file 1A and B).
Whole-genome sequences (WGS) should contain all of the causal variants underlying
complex traits. On BTA17, the density of markers increased by more than 20 times
from imputed 777k SNP genotypes to sequence level. With this increased density,
more associations became significantly associated with the 6 studied FA: from less
than 100 using imputed 777k SNP genotypes to more than a thousand with sequence
data. For instance, 8 SNP were in perfect LD, and represent our strongest
associations with C8:0 in summer milk samples. Duchemin et al. (2014) using
imputed 777k SNP genotypes identified only one top SNP, and at a higher
significance level than the eight SNP identified by this study. In the present study, we
imputed to sequence level the already imputed 777k SNP genotypes. With sequence
data, the extent of LD among SNP is conversed at 5-10kb in Bos Taurus breeds (e.g.,
4 Fine-mapping of BTA17 with imputed sequences
84
Gibbs et al., 2009). According to Weiss and Terwilliger (2000), the distribution of LD
shows stochastic variance, which tends to be highly skewed under certain conditions,
as described by Terwilliger (2001). As a consequence, some parts of the genome will
exhibit regions of long LD, while most SNP will exhibit less LD than predicted by lower
density panels of genetic markers. If this is the case, it is possible that the imputation
overestimated the extent of LD between genetic markers, and therefore, the effect
of the top SNP with imputed 777k SNP is likely overestimated in comparison with
sequence data. Other GWAS using imputed sequences have identified a considerable
number of significant variants closely linked to each other (e.g., Daetwyler et al.,
2014; Sahana et al., 2014). In addition, single-marker analyses assume that each
marker contributes independently to the genetic variance. Taken together, these
findings might explain why Duchemin et al. (2014) obtained better significance level
for their top SNP than in the present study.
TagSNP1 seems to explain most of the genetic variation in a region distributed over
almost 20 MBP on BTA17 (Figure 4.1B). The QTL region identified in the present study
is wider than the 5 MBP QTL region narrowed by Duchemin et al. (2014). The present
study confirms the multiple FA that were found associated with a similar QTL region
and the strongest association that was found with C8:0, both by Duchemin et al.
(2014). Study conducted by Govignon-Gion et al. (2014) found a QTL region on BTA17
associated with C4:0 and C6:0 when performing GWAS with imputed 500K SNP
genotypes for three different breeds of dairy cattle. This QTL region was present in
the three breeds, and the strongest associations were identified with C4:0. In our
study, C4:0 in winter and summer milk samples was not significantly associated with
our QTL region. The main difference between Govignon-Gion et al. (2014) and the
present study is the method of measurement of fatty acids. Our 6 studied FA were
measured by gas chromatography for both winter and summer milk samples,
whereas the FA studied by Govignon-Gion et al. (2014) were measured by mid-
infrared spectrometry. This might explain the observed differences between the
studies.
Previously for the same QTL region, Bouwman et al. (2012) identified 10 significant
SNP with 50k SNP genotypes, and Duchemin et al. (2014) identified 83 significant
SNP with imputed 777k SNP genotypes for C8:0 in summer samples. From the 50K
to the imputed 777k SNP genotypes, there was no overlap of associations. From
imputed 777k SNP to imputed sequences, 70 associations found by the imputed 777k
SNP genotypes were also found among the 608 significant associations with imputed
sequences. In addition, the 8 SNP include the strongest SNP (rs109290136) identified

4 Fine-mapping of BTA17 with imputed sequences
85
by Duchemin et al. (2014) with imputed 777k SNP genotypes. However, the
significance of the top SNP in Duchemin et al. (2014) was higher [–Log10(P-value) =
7.93] than the significance of the strongest SNP identified with imputed sequences
(Figure 4.1A).
4.4.2 Candidate genes
Six of our eight strongest associations are located within the LARP1B gene. According
to genecards (http://www.genecards.org/), the LARP1B gene encodes a protein
containing domains found in the La related protein of Drosophila melanogaster. The
LARP1 family was first described in Drosophila melanogaster (Chauvet et al., 2000),
where the Drosophila LARP1 gene is required for spermatogenesis, embryogenesis
and cell cycle progression (e.g., Ichihara et al., 2007). Study by Blagden et al. (2009)
showed that the Drosophila LARP1 gene interacts with poly A binding protein (PABP),
and suggested that the phenotype observed in LARP1 mutants could be the result of
defective mRNA translation or regulation. In Caenorhabditis elegans, the CeLARP1
gene was identified as an RNA-binding protein (Nykamp et al., 2008). In yeast, the
mRNA-dependent LA-related proteins family (LARP1) when in association with SLF1
promotes copper detoxification (Schenk et al., 2012). In viruses, the LARP1B gene
has the biological process of mitophagy in response to mitochondrial depolarization
(Orvedahl et al., 2011). In Arabidopsis, the overexpression of the LARP1B gene causes
a premature leaf yellowing phenotype, and leaf senescence (Zhang et al., 2012).
According to Stavraka and Blagden (2015), la related proteins family 1 (LARP1) genes
in humans have two paralogues: LARP1A and LARP1B. LARP1A (or simply LARP1) is
positioned at chromosome 5q34, encoding 1096 amino acid proteins. LARP1B (or
LARP2) is positioned at chromosome 4q28, encoding 914 amino acid proteins.
According to Stavraka and Blagden (2015), LARP1A and LARP1B are similar (60%
homology and 73% of positivity). Burrows et al. (2010) showed that LARP1A is more
abundant than LARP1B, therefore LARP1B has been less studied. According to
Uniprot (www.uniprot.org; accessed on 11/21/2015), the gene ontology regarding
the molecular function of the LARP1B gene in humans is the poly(A) RNA binding,
i.e., the very same as LARP1A. Review by Bousquet-Antonelli, and Deragon (2009)
suggested that members of the same family are functional homologs and/or share a
common molecular mode of action on different RNA baits.
Interestingly, in mammalian cells, Tcherkezian et al. (2014) found that the LARP1A
gene associates with the mTOR complex 1 (mTORC1) and is required for global
protein synthesis as well as cell growth and proliferation. This implicates the LARP1A
4 Fine-mapping of BTA17 with imputed sequences
86
gene as an important regulator of cell growth and proliferation. Bionaz et al. (2012)
reviewed the role of mTORC1 relating it to the regulation of protein synthesis,
particularly translation in the mammary tissue. Interestingly, mTORC1 was
considered to be the missing link between nutrition and milk protein synthesis
(Bionaz et al., 2012). According to Bionaz et al. (2012), insulin regulates the amount
of translation of the mTORC pathway that will influence milk protein synthesis.
Gomes and Blenis (2015) suggest that, through various mechanisms, mTORC1
stimulate mRNA translation, aerobic glycolysis, glutamine anaplerosis, lipid
synthesis, the pentose phosphate and pyrimidine synthesis, thus producing the
major components necessary for cell growth and proliferation. Although less studied
as compared with the LARP1A gene, the LARP1B gene possess the same molecular
function as LARP1A gene. We cannot exclude that the LARP1B might play a role
regarding cell growth and proliferation in the mammary gland of a cow.
Furthermore, the LARP1B gene contains a splice-region variant. According to
Sammeth et al. (2008) splice-region variants generate different mature transcripts
from the same primary RNA sequence. Although no further information is available
on the possible transcripts generated by the LARP1B gene, this gene is highly
expressed in bovine mammary tissue (Bionaz et al., 2012), and it is expressed in all
stages of lactation in humans (Lemay et al., 2013). Yet, the LARP1B gene has not been
associated to milk FA composition or milk-fat synthesis.
Previously, the candidate gene identified by Duchemin et al. (2014) was the PGRMC2
gene. The PGRMC2 gene is still among the genes associated with the QTL region that
influences multiple FA on BTA17 (Table 4.3). However, the PGRMC2 gene was
assigned as the most likely candidate gene because it was the closest gene to the
strongest association found by Duchemin et al. (2014). At that time, there were no
associations found in the PGRMC2 gene. In addition, the identified LOC515517 was
the gene closest to the strongest association on BTA17. However, because of limited
annotation available on BTA17 at that time, LOC515517 was identified as a
suggestive candidate gene while PGRMC2 was suggested as primary candidate gene.
Since then, LOC515517 has been annotated in the cattle genome as LARP1B gene.
4.5 Conclusions
The fine-mapping of BTA17 with imputed sequences identified a substantial number
(in the thousands) of significant associations with de novo synthesized milk FA (C6:0
4 Fine-mapping of BTA17 with imputed sequences
87
to 14:0). With imputed sequences, the resolution of the QTL region influencing
multiple milk FA improved compared to previous studies. The strongest associations
were identified with C8:0 in summer milk samples. With imputed sequences, the
number of candidate genes in this QTL region was reduced from 29 to 14. Among
these 14 candidate genes, 6 out of 8 SNP in strong LD were identified in the LARP1B
gene. The LARP1B gene is expressed in bovine mammary tissue. Nonetheless, the
LARP1B gene has not been associated with milk FA composition at present.
4.6 References
Bionaz, M., K. Periasamy, S. L. Rodriguez-Zas, W. L. Hurley, and J. J. Loor. 2012. A
novel dynamic impact approach DIA for functional analysis of time-course omics
studies: validation using the bovine mammary transcriptome. PLoS ONE.7: e32455
Bionaz, M., Hurley, W., and Loor, J. 2012. Milk protein synthesis in the lactating
mammary gland: Insights from transcriptomics analyses.INTECH Open Access
Publisher.
Blagden, S. P., Gatt, M. K., Archambault, V., Lada, K., Ichihara, K., Lilley, K. S. , Inoue,
Y. H., and Glover, D. M. 2009.Drosophila Larp associates with poly(A)-binding
protein and is required for male fertility and syncytial embryo development,
Developmental Biology 334:186-197.
Bousquet-Antonelli, C., and Deragon, J. M. 2009. A comprehensive analysis of the La-
motif protein superfamily. RNA 15:750-764.
Bouwman, A., M. H. P. W. Visker, J. A. M. van Arendonk, and H. Bovenhuis. 2012.
Genomic regions associated with bovine milk fatty acids in both summer and
winter milk samples. BMC Genet. 13:93.
Browning, S. R., and Browning, B. L. (2007). Rapid and accurate haplotype phasing
and missing-data inference for whole-genome association studies by use of
localized haplotype clustering. Am J Hum Genet 81, 1084–1097.
Buitenhuis, B., Janss, L.L.G., Poulsen, N.A., Larsen, L.B., Larsen, M. K., and Sørensen,
P. 2014. Genome-wide association and biological pathway analysis for milk-fat
composition in Danish Holstein and Danish Jersey cattle. BMC Genomics 2014,
15:1112.
Burrows, C., Abd Latip, N., Lam, S.J., Carpenter, L., Sawicka, K., Tzolovsky, G., Gabra,
H., Bushell, M., Glover, D.M., Willis, A. E., et al. 2010. The RNA binding protein
Larp1 regulates cell division, apoptosis and cell migration. Nucleic Acids Res 38:
5542–5553.
Calder, P.C. 2015. Functional roles of fatty acids and their effects on human health. J
Parenter Enteral Nutr, 39.1: 18S-32S.
4 Fine-mapping of BTA17 with imputed sequences
88
Chauvet, S., Maurel-Zaffran, C., Miassod, R., Jullien, N., Pradel, J., Aragnol, D. 2000.
Dlarp, a new candidate Hox target in Drosophila whose orthologue in mouse is
expressed at sites of epithelium/mesenchymal interactions. Dev Dyn 218: 401–
413.
Craninx, M., A. Steen, H. Van Laar, T. Van Nespen, J. Martin-Tereso, B. De Baets, and
V. Fievez. 2008. Effect of lactation stage on the odd- and branched-chain milk fatty
acids of dairy cattle under grazing and indoor conditions. J. Dairy Sci. 91:2662–
2677.
Daetwyler, H.D., Capitan, A., Pausch, H., Stothard, P., van Binsbergen, R., Brondum,
R.F., Liao, X., Djari, A., Rodriguez, S.C., Grohs, C., Esquerre, D., Bouchez, O.,
Rossignol, M-N., Klopp, C., Rocha, D., Fritz, S., Eggen, A., Bowman, P.J., Coote, D.
Chamberlain, A.J., Anderson, C., VanTassell, C.P., Hulsegge, I., Goddard, M.E.,
Guldbrandtsen, B., Lund, M.S., Veerkamp, R.F., Boichard, D.A., Fries, R., and Hayes,
B. J. 2014. Whole-genome sequencing of 234 bulls facilitates mapping of
monogenic and complex traits in cattle. Nat Genet 46, 858–865.
Druet, T., Macleod, I. M., and Hayes, B. J. (2014). Toward genomic prediction from
whole-genome sequence data: impact of sequencing design on genotype
imputation and accuracy of predictions. Heredity (Edinb) 112, 39–47.
doi:10.1038/hdy.2013.13.
Duchemin, S. I., H. Bovenhuis, W. M. Stoop, A. C. Bouwman, J. A. M. van Arendonk,
and M. H. P. W. Visker. 2013. Genetic correlation between composition of bovine
milk fat in winter and summer, and DGAT1 and SCD1 by season interactions. J.
Dairy Sci. 96:592-604.
Duchemin, S. I., Visker, M.H.P.W., Van Arendonk, J.A.M., and Bovenhuis, H. 2014. A
quantitative trait locus on Bos taurus autosome 17 explains a large proportion of
the genetic variation in de novo synthesized milk fatty acids. J Dairy Sci 97: 7276-
7285.
Gibbs, R. A., Taylor, J. F., Van Tassell, C.P., Barendse, W., Eversole, K. A., Gill, C. A.,
Green, R. D., Hamernik, D. L., Kappes, S. M., Lien, S., Matukumalli, L. K., Mcewan,
J. C., Nazareth, L. V., Schnabel, R. D., Weinstock, G. M., Wheeler, D. A., Ajmone-
Marsan, P., Boettcher, P. J., Caetano, A. R., Garcia, J. F., Hanotte, O., Mariani, P.,
Skow, L. C., Sonstegard, T. S., Williams, J. L., Diallo, B., Hailemariam, L., Martinez,
M. L., Morris, C. A., Silva, L. O. C., Spelman, R. J., Mulatu, W., Zhao, K., Abbey, C. A.,
Agaba, M., Araujo, F. R., Bunch, R. J., Burton, J., Gorni, C., Olivier, H., Harrison, B.
E., Luff, B., Machado, M. A., Mwakaya, J., Plastow, G., Sim, W., Smith, T., Thomas,
M. B., Valentini, A., Williams, P., Womack, J., Woolliams, J.A., Liu, Y., Qin, X.,
Worley, K. C., Gao, C., Jiang, H., Moore, S. S., Ren, Y., Song, X.-Z., Bustamante, C.
D., Hernandez, R. D., Muzny, D. M., Patil, S., San Lucas, A., Fu, Q., Kent, M. P., Vega,
4 Fine-mapping of BTA17 with imputed sequences
89
R., Matukumalli, A., Mcwilliam, S., Sclep, G., Bryc, K., Choi, J., Gao, H., Grefenstette,
J. J., Murdoch, B., Stella, A., Villa-Angulo, R., Wright, M., Aerts, J., Jann, O., Negrini,
R., Goddard, M. E., Hayes, B. J., Bradley, D. G., Barbosa Da Silva, M., Lau, L.P. L., Liu,
G. E., Lynn, D. J., Panzitta, F., Dodds, K. G. 2009. Genome-wide survey of SNP
variation uncovers the genetic structure of cattle breeds. Science 324:528-32.
Gilmour, A. R., Gogel, B., Cullis, B., and Thompson, R. (2009). ASReml user guide,
release 3.0. VSN International Ltd., Hemel Hempstead, UK.
Gomes,A. P., and Blenis, J. 2015. A nexus for cellular homeostasis: the interplay
between metabolic and signal transduction pathways. Current opinion in
biotechnology 34:110-117.
Govignon-Gion, A., Fritz, S., Larroque, H., Brochard, M., Chantry, C., Lahalle, F., and
Boichard, D. 2014. QTL Detection for Milk Fatty Acids in French Dairy Cattle. In 10th
World Congress on Genetics Applied to Livestock Production. Asas.
Ichihara, K., Shimizu, H., Taguchi, O., Yamaguchi, M., and Inoue, Y.H. 2007. A
Drosophila orthologue of larp protein family is required for multiple processes in
male meiosis. Cell Struct Funct 32: 89–100
Ihara, N., Watanabe, T., Sato, Y., Itoh, T., Suzuki, T., and Sugimoto, Y. 2007. Oligogenic
transmission of abnormal teat patterning phenotype (ATPP) in cattle. Animal
Genetics 38, 15–9.
Lemay, D. G., O. A. Ballard, M. A. Hughes, A. L. Morrow, N. D. Horseman, and L. A.
Nommsen-Rivers. 2013. RNA sequencing of the human milk fat layer
transcriptome reveals distinct gene expression profiles at three stages of lactation.
PLoS ONE 8:e67531.
McLaren, W., Pritchard, B., Rios, D., Chen, Y., Flicek, P., and Cunningham, F. (2010).
Deriving the consequences of genomic variants with the Ensembl API and SNP
Effect Predictor. Bioinformatics 26, 2069–2070.
Meuwissen, T., and Goddard, M. 2010. Accurate prediction of genetic values for
complex traits by whole-genome resequencing. Genetics 185, 623–631.
Moioli, B., G. Contarini, A. Avalli, G. Catillo, L. Orru, G. De Matteis, G. Masoero, and
F. Napolitano. 2007. Short communication: Effect of stearoyl-coenzyme A
desaturase polymorphism on fatty acid composition of milk. J. Dairy Sci. 90:3553-
3558.
Nykamp, K., Lee, M. H., and Kimble, J. 2008. C. elegans La-related protein, LARP-1,
localizes to germline P bodies and attenuates Ras-MAPK signaling during
oogenesis. Rna 14: 1378-1389.
Orvedahl, A., Sumpter Jr, R., Xiao, G., Ng, A., Zou, Z., Tang, Y., Narimatsu, M., Gilpin,
C., Sun, Q., Roth, M., Forst, C. V., Wrana, J. L., Zhang, Y. E., Luby-Phelps, K., Xavier,
4 Fine-mapping of BTA17 with imputed sequences
90
R. J., Xie, Y., and Levine, B. 2011. Image-based genome-wide siRNA screen
identifies selective autophagy factors.Nature 480:113-117.
Pausch, H., Jung, S., Edel, C., Emmerling, R., Krogmeier, D., Götz, K.-U., and Fries, R.
2012. Genome-wide association study uncovers four QTL predisposing to
supernumerary teats in cattle. Animal Genetics 43: 689–695.
Purcell, S., Neale, B., Todd-Brown, K., Thomas, L., Ferreira, M. A. R., Bender, D., et al.
(2007). PLINK: a tool set for whole-genome association and population-based
linkage analyses. Am J Hum Genet 81: 559-575.
R Core Team (2015). R: A language and environment for statistical computing. R
Foundation for Statistical Computing, Vienna, Austria. https://www.R-
project.org/.
Sahana, G., Guldbrandtsen, B., Thomsen B., Holm, L.-E., Panitz, F., Brøndum, R. F., et
al. (2014). Genome-wide association study using high-density single nucleotide
polymorphism arrays and whole-genome sequences for clinical mastitis traits in
dairy cattle. J Dairy Sci 97: 7258–7275.
Sammeth, M., Foissac, S., and Guigó, R. 2008. A general definition and nomenclature
for alternative splicing events. PLoS Comput Biol 4:e1000147.
Schennink, A., W. M. Stoop, M. H. P. W. Visker, J. M. L. Heck, H. Bovenhuis, J. J. Van
Der Poel, H. J. F. Van Valenberg, and J. A. M. Van Arendonk. 2007. DGAT1 underlies
large genetic variation in milk-fat composition of dairy cows. Anim. Genet. 38:467-
473.
Schennink, A., J. M. L. Heck, H. Bovenhuis, M. H. P. W. Visker, H. J. F. van Valenberg,
and J. A. M. van Arendonk. 2008. Milk fatty acid unsaturation: genetic parameters
and effects of Stearoyl-CoA Desaturase (SCD1) and Acyl CoA: Diacylglycerol
Acyltransferase 1 (DGAT1). J. Dairy Sci. 91:2135-2143.
Schenk, L., Meinel, D. M., Strässer, K., and Gerber, A. P. 2012. La-motif–dependent
mRNA association with Slf1 promotes copper detoxification in yeast. RNA 18: 449-
461.
Stavraka, C., and Blagden, S. 2015. The la-related proteins, a family with connections
to cancer. Biomolecules 5: 2701-2722.
Stoop, W. M., van Arendonk, J. A. M., Heck, J. M. L.,van Valenberg, H. J. F., and
Bovenhuis, H. 2008. Genetic parameters for major milk fatty acids and milk
production traits of Dutch Holstein-Friesians. J Dairy Sci. 91:385–394.
Tcherkezian, J., Cargnello, M., Romeo, Y., Huttlin, E. L., Lavoie, G., Gygi, S. P., and
Roux, P. P. 2014. Proteomic analysis of cap-dependent translation identifies LARP1
as a key regulator of 5′ TOP mRNA translation. Genes and development 28:357-
371.

4 Fine-mapping of BTA17 with imputed sequences
91
Terwilliger, J. D. 2001. 23 On the resolution and feasibility of genome scanning
approaches. Advances in Genetics 42: 351-391.
Venturini, G. C., Cardoso, D. F., Baldi, F., Freitas, A. C., Aspilcueta-Borquis, R. R.,
Santos, D. J., and Tonhati, H. 2014. Association between single-nucleotide
polymorphisms and milk production traits in buffalo. Genetics and molecular
research 13:10256.
Weiss, K. M., and Terwilliger, J. D. 2000. How many diseases does it take to map a
gene with SNPs? Nature genetics 26:151-158.
Wilmink, J. B. M. 1987. Adjustment of test-day milk, fat and protein yield for age,
season and stage of lactation. Livest. Prod. Sci. 16:335-348.
Zhang, B., Jia, J., Yang, M., Yan, C., and Han, Y. 2012. Overexpression of a LAM domain
containing RNA-binding protein LARP1c induces precocious leaf senescence in
Arabidopsis. Molecules and cells 34:367-374.
Zimin, A. V., A. L. Delcher, L. Florea, D. R. Kelley, M. C. Schatz, D. Puiu, F. Hanrahan,
G. Pertea, C. P. Van Tassell, and T. S. Sonstegard. 2009. A whole-genome assembly
of the domestic cow, Bos taurus. Genome Biol. 10:R42.
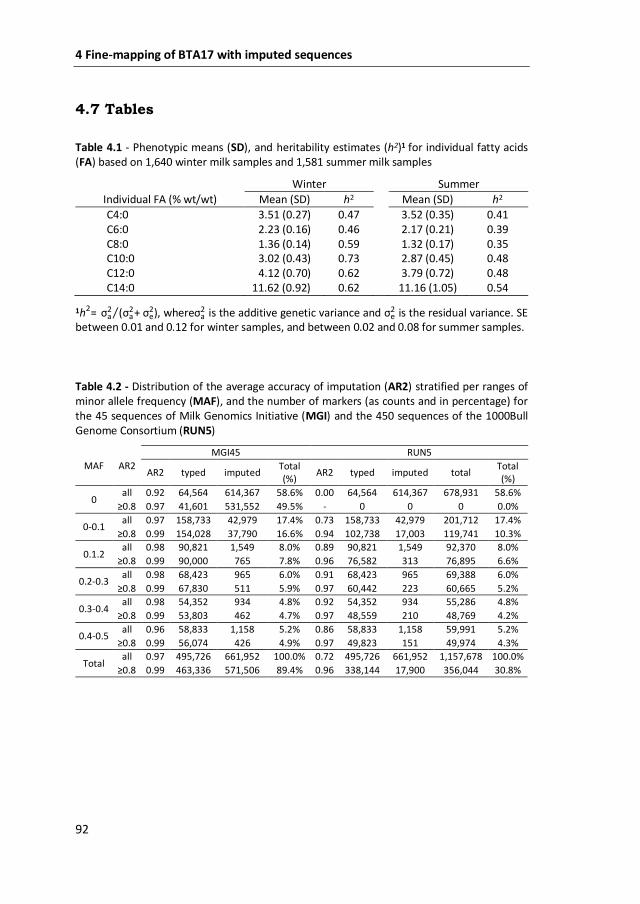
4 Fine-mapping of BTA17 with imputed sequences
92
4.7 Tables
Table 4.1 - Phenotypic means (SD), and heritability estimates (h2)1 for individual fatty acids (FA) based on 1,640 winter milk samples and 1,581 summer milk samples
Individual FA (% wt/wt)
Winter Summer
Mean (SD) h2 Mean (SD) h2
C4:0 3.51 (0.27) 0.47 3.52 (0.35) 0.41 C6:0 2.23 (0.16) 0.46 2.17 (0.21) 0.39 C8:0 1.36 (0.14) 0.59 1.32 (0.17) 0.35 C10:0 3.02 (0.43) 0.73 2.87 (0.45) 0.48 C12:0 4.12 (0.70) 0.62 3.79 (0.72) 0.48 C14:0 11.62 (0.92) 0.62 11.16 (1.05) 0.54
1h2= σa2 (σa
2+ σe2)⁄ , whereσa
2 is the additive genetic variance and σe2 is the residual variance. SE
between 0.01 and 0.12 for winter samples, and between 0.02 and 0.08 for summer samples.
Table 4.2 - Distribution of the average accuracy of imputation (AR2) stratified per ranges of minor allele frequency (MAF), and the number of markers (as counts and in percentage) for the 45 sequences of Milk Genomics Initiative (MGI) and the 450 sequences of the 1000Bull Genome Consortium (RUN5)
MAF AR2
MGI45 RUN5
AR2 typed imputed Total (%)
AR2 typed imputed total Total (%)
0 all 0.92 64,564 614,367 58.6% 0.00 64,564 614,367 678,931 58.6%
≥0.8 0.97 41,601 531,552 49.5% - 0 0 0 0.0%
0-0.1 all 0.97 158,733 42,979 17.4% 0.73 158,733 42,979 201,712 17.4%
≥0.8 0.99 154,028 37,790 16.6% 0.94 102,738 17,003 119,741 10.3%
0.1.2 all 0.98 90,821 1,549 8.0% 0.89 90,821 1,549 92,370 8.0%
≥0.8 0.99 90,000 765 7.8% 0.96 76,582 313 76,895 6.6%
0.2-0.3 all 0.98 68,423 965 6.0% 0.91 68,423 965 69,388 6.0%
≥0.8 0.99 67,830 511 5.9% 0.97 60,442 223 60,665 5.2%
0.3-0.4 all 0.98 54,352 934 4.8% 0.92 54,352 934 55,286 4.8%
≥0.8 0.99 53,803 462 4.7% 0.97 48,559 210 48,769 4.2%
0.4-0.5 all 0.96 58,833 1,158 5.2% 0.86 58,833 1,158 59,991 5.2%
≥0.8 0.99 56,074 426 4.9% 0.97 49,823 151 49,974 4.3%
Total all 0.97 495,726 661,952 100.0% 0.72 495,726 661,952 1,157,678 100.0%
≥0.8 0.99 463,336 571,506 89.4% 0.96 338,144 17,900 356,044 30.8%
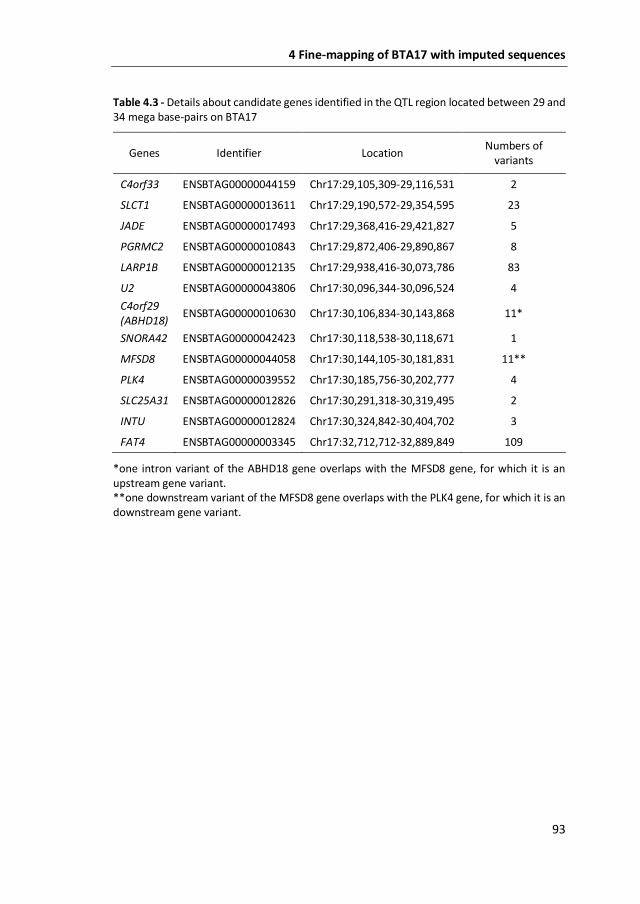
4 Fine-mapping of BTA17 with imputed sequences
93
Table 4.3 - Details about candidate genes identified in the QTL region located between 29 and 34 mega base-pairs on BTA17
Genes Identifier Location Numbers of
variants
C4orf33 ENSBTAG00000044159 Chr17:29,105,309-29,116,531 2
SLCT1 ENSBTAG00000013611 Chr17:29,190,572-29,354,595 23
JADE ENSBTAG00000017493 Chr17:29,368,416-29,421,827 5
PGRMC2 ENSBTAG00000010843 Chr17:29,872,406-29,890,867 8
LARP1B ENSBTAG00000012135 Chr17:29,938,416-30,073,786 83
U2 ENSBTAG00000043806 Chr17:30,096,344-30,096,524 4
C4orf29 (ABHD18)
ENSBTAG00000010630 Chr17:30,106,834-30,143,868 11*
SNORA42 ENSBTAG00000042423 Chr17:30,118,538-30,118,671 1
MFSD8 ENSBTAG00000044058 Chr17:30,144,105-30,181,831 11**
PLK4 ENSBTAG00000039552 Chr17:30,185,756-30,202,777 4
SLC25A31 ENSBTAG00000012826 Chr17:30,291,318-30,319,495 2
INTU ENSBTAG00000012824 Chr17:30,324,842-30,404,702 3
FAT4 ENSBTAG00000003345 Chr17:32,712,712-32,889,849 109
*one intron variant of the ABHD18 gene overlaps with the MFSD8 gene, for which it is an upstream gene variant. **one downstream variant of the MFSD8 gene overlaps with the PLK4 gene, for which it is an downstream gene variant.
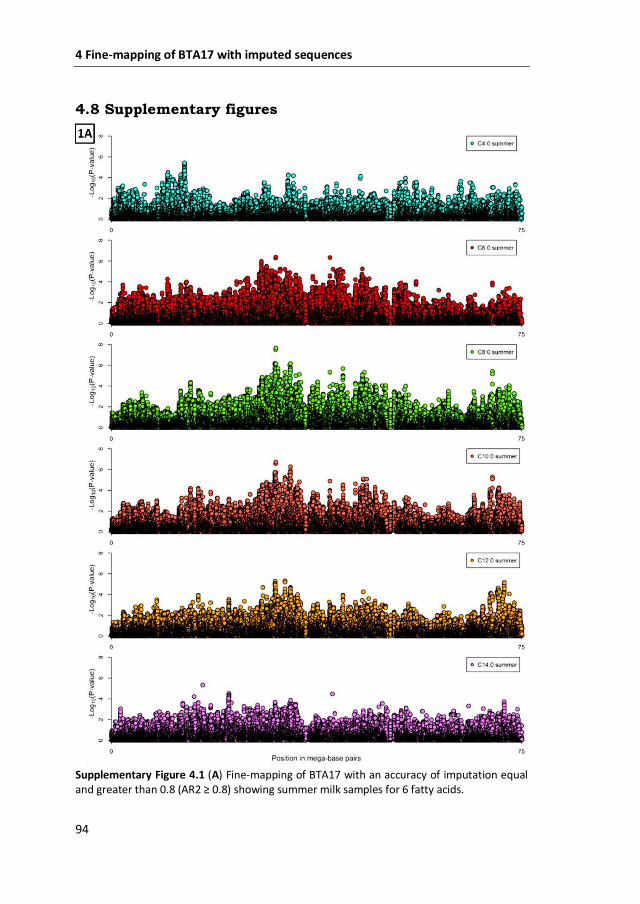
4 Fine-mapping of BTA17 with imputed sequences
94
4.8 Supplementary figures
Supplementary Figure 4.1 (A) Fine-mapping of BTA17 with an accuracy of imputation equal and greater than 0.8 (AR2 ≥ 0.8) showing summer milk samples for 6 fatty acids.
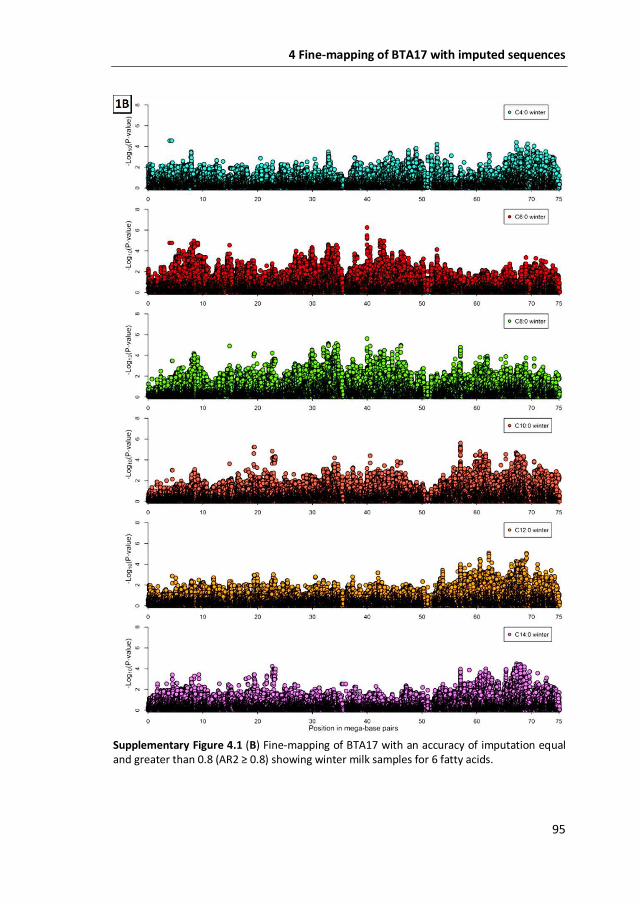
4 Fine-mapping of BTA17 with imputed sequences
95
Supplementary Figure 4.1 (B) Fine-mapping of BTA17 with an accuracy of imputation equal and greater than 0.8 (AR2 ≥ 0.8) showing winter milk samples for 6 fatty acids.
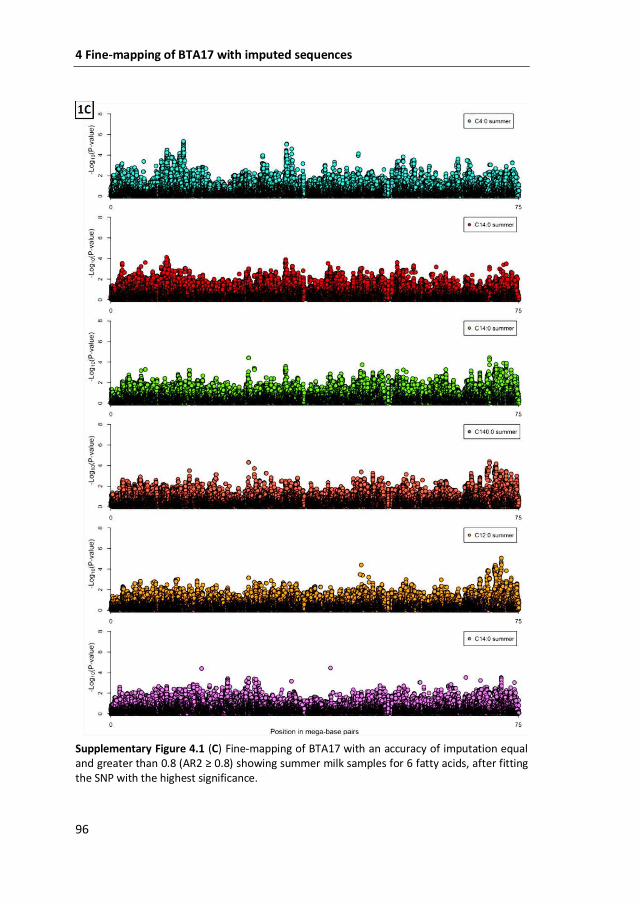
4 Fine-mapping of BTA17 with imputed sequences
96
Supplementary Figure 4.1 (C) Fine-mapping of BTA17 with an accuracy of imputation equal and greater than 0.8 (AR2 ≥ 0.8) showing summer milk samples for 6 fatty acids, after fitting the SNP with the highest significance.
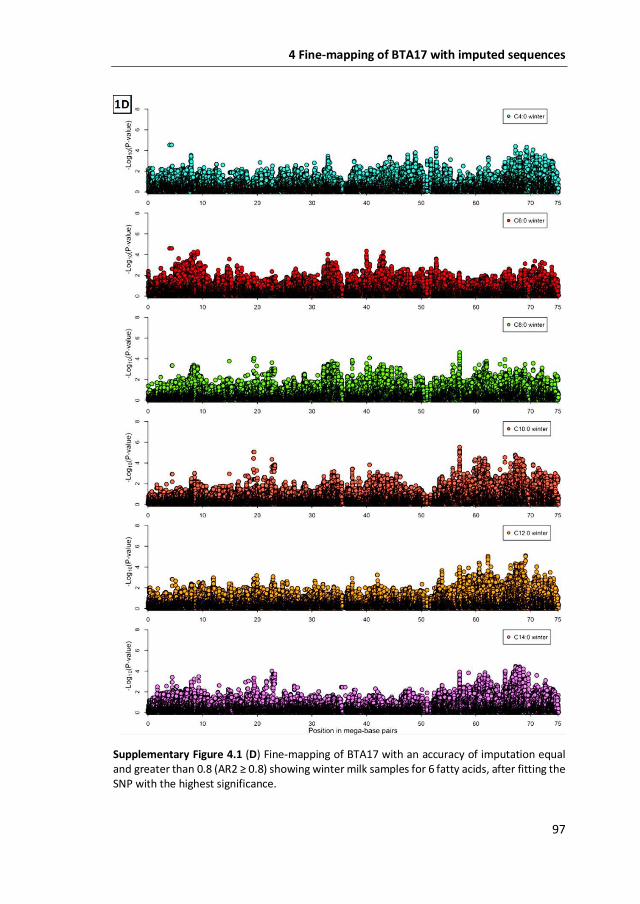
4 Fine-mapping of BTA17 with imputed sequences
97
Supplementary Figure 4.1 (D) Fine-mapping of BTA17 with an accuracy of imputation equal and greater than 0.8 (AR2 ≥ 0.8) showing winter milk samples for 6 fatty acids, after fitting the SNP with the highest significance.

5
Identification of QTL on chromosome 18 associated with non-coagulating milk in
Swedish Red cows
S.I. Duchemin1,2, M. Glantz3, D-J. de Koning2, M. Paulsson3, W.F. Fikse2
1Animal Breeding and Genomics Centre, Wageningen University, Wageningen,
Netherlands; 2Department of Animal Breeding and Genetics, Swedish University of
Agricultural Sciences, PO box 7023, SE-750 07, Uppsala, Sweden; 3 Department of
Food Technology, Engineering and Nutrition, Lund University, Lund, Sweden.
Frontiers in Genetics: Livestock Genomics (2016) 7:57.
100
Abstract
Non-coagulating (NC) milk, defined as milk not coagulating within 40 min after
rennet-addition, can have a negative influence on cheese production. Its prevalence
is estimated at 18% in the Swedish Red (SR) cow population. Our study aimed at
identifying genomic regions and causal variants associated with NC milk in SR cows,
by doing a GWAS using 777k SNP genotypes and using imputed sequences to fine
map the most promising genomic region. Phenotypes were available from 382 SR
cows belonging to 21 herds in the south of Sweden, from which individual morning
milk was sampled. NC milk was treated as a binary trait, receiving a score of one in
case of non-coagulation within 40 minutes. For all 382 SR cows, 777k SNP genotypes
were available as well as the combined genotypes of the genetic variants of αs1-β-κ-
caseins. In addition, whole–genome sequences from the 1000Bull Genome
Consortium (Run 3) were available for 429 animals of 15 different breeds. From
these sequences, 33 sequences belonged to SR and Finish Ayrshire bulls with a large
impact in the SR cow population. Single-marker analyses were run in ASReml using
an animal model. After fitting the casein loci, 14 associations at –Log10(P-value) > 6
identified a promising region located on BTA18. We imputed sequences to the 382
genotyped SR cows using Beagle 4 for half of BTA18, and ran a region-wide
association study with imputed sequences. In a 7 mega base-pairs region on BTA18,
our strongest association with NC milk explained almost 34% of the genetic variation
in NC milk. Since it is possible that multiple QTL are in strong LD in this region, 59
haplotypes were built, genetically differentiated by means of a phylogenetic tree,
and tested in phenotype-genotype association studies. Haplotype analyses support
the existence of one QTL underlying NC milk in SR cows. A candidate gene of interest
is the VPS35 gene, for which one of our strongest association is an intron SNP in this
gene. The VPS35 gene belongs to the mammary gene sets of pre-parturient and of
lactating cows.
Key words: non-coagulating milk, sequences, dairy, cheese production, haplotypes,
VPS35.
5 RWAS with NC milk on BTA18
101
5.1 Introduction
Non- or poor-coagulating milk is an undesirable characteristic of milk with a negative
influence on cheese production. Non-coagulating (NC) milk is prevalent among
several dairy cattle breeds, such as Swedish Red (SR), Finnish Ayrshire (FAY),
Holstein-Friesian (HF) and Italian Brown Swiss, to name a few (e.g., Frederiksen et
al., 2011; Cecchinato et al., 2011, Gustavsson et al., 2014a). The prevalence of NC
milk varies among these breeds ranging from 4% in Italian Brown Swiss (Cecchinato
et al., 2009) up to 13% in FAY (Ikonen et al., 2004). A recent study has estimated the
prevalence of NC milk, defined as milk not coagulating within 40 min after rennet-
addition, at 18% in the SR cow population (Gustavsson et al., 2014a). Targeted
research on NC milk can help geneticists develop breeding programs to modify milk
composition and technological properties of milk and thus reduce the prevalence of
NC milk.
Bittante et al. (2012) suggested that effects of herd have little influence on milk
coagulation properties (MCP) including NC milk, although several factors can
influence the composition of bovine milk (e.g., breed, a cow’s diet, age of a cow, and
the stage of lactation; Chilliard et al., 2001). In addition, MCP seem be influenced by
many factors, such as SCC (e.g., Ikonen et al., 2004; Cassandro et al., 2008), titratable
acidity (e.g., Penasa et al., 2010), casein composition (Okigbo et al., 1985b), pH
(Nájera et al., 2003), stage of lactation (Okigbo et al., 1985a; Ostersen et al.,1997),
and breed (e.g., Auldist et al., 2004; De Marchi et al., 2007, Bittante et al., 2012),
among many other factors. Heritability estimates for MCP and NC milk range from
0.26 in FAY (Ikonen et al., 2004) to 0.45 in SR cows (Gustavsson et al., 2014a). These
heritability estimates suggest that breeding could effectively reduce the prevalence
of NC milk. In Sweden, the breeding program includes production traits to guarantee
the increase in both protein and fat contents (Nordic Cattle Genetic Evaluation,
2013). The negative genetic correlations between NC milk and protein content
estimated by Gustavsson et al. (2014a) suggest that breeding for higher protein
content in the Swedish Red cows can lead to an increase in the prevalence of NC
milk. In Sweden, 41% of SR cows produce milk for the dairy industry, and more than
30% of total milk production is used for cheese production (LRF Dairy Sweden, 2015).
Since total milk production is about 3 million tons per year (LRF Dairy Sweden, 2015)
and the market price of milk produced is about 0.28 euros per kg, the problem of NC
milk affects milk with a value of approximately 63 million euros per year. Frederiksen
et al. (2011) has estimated in 25% the proportion of NC milk in a batch of well-
coagulating milk that is sufficient to deteriorate the MCP of well-coagulating milk.
5 RWAS with NC milk on BTA18
102
Van Hooydonk et al. (1986) showed that the addition of calcium would restore
coagulation of NC milk but not to the level of well–coagulating milk according to
Hallén et al. (2010). Furthermore, addition of calcium above 0.04% have been
reported to produce a bitter flavour (Schwarz and Mumm, 1948) which could be
detrimental to cheese production. Therefore, it is important to the Swedish industry
to reduce the frequency of NC milk.
It is well established that MCP, including NC milk, are strongly influenced by variable
proportions, and genetic variants of milk protein fractions (especially of κ-casein
(CN); Bittante et al., 2012). In poor- and non-coagulating milk samples of Danish
Jerseys and HF cows, Jensen et al. (2012) showed that BB-A2A2-AA was the
predominant combined genotype of αS1-, β-, and κ-CN associated with NC milk.
Hallén et al. (2007) and Gustavsson et al. (2014b) showed that some of these
genotypes (especially β-, and κ-CN genotypes A2A2-AA) segregate in SR cows. Besides
these genetic variants of milk protein fractions in the cattle genome, other
undiscovered genes might play a role in the prevalence of NC milk. These genes can
be identified by genome-wide association studies (GWAS) using high-density
genotyping techniques.
High-density genotyping techniques, such as whole-genome sequences (WGS), can
help GWAS increase the power and the precision of quantitative trait loci (QTL)
mapping. Whole-genome sequences are expected to contain most of the
polymorphisms causing the genetic differences between individuals (Meuwissen and
Goddard, 2010). When an entire population is sequenced, WGS are independent of
linkage disequilibrium (LD) between polymorphisms and the causal variant (Druet et
al., 2014) compared with a lower panel of markers. However, sequencing an entire
population can be expensive, and a cost-effective strategy consists of sequencing key
ancestors of a population, and imputing to sequence level the rest of this population
(Druet et al., 2014). To demonstrate this approach, Daetwyler et al. (2014) imputed
dairy cattle populations that were genotyped with 777k SNP (BovineHD) to sequence
level using WGS from the 1000 Bull Genome Project. Their study targeted some
known genomic regions where QTL affecting milk production and curly coat had
previously been identified, and they successfully identified the causal variants
underlying these QTL. Therefore, GWAS using imputed sequences could assist in the
identification of causal variants.
A recent GWAS on SR cows used BovineHD as genotypes and MCP as phenotypes
(Gregersen et al., 2015). However, their GWAS did not include NC milk in the
5 RWAS with NC milk on BTA18
103
analyses. The aim of our study was to identify genomic regions and causal variants
associated with NC milk in SR cows. For this purpose, firstly we ran a GWAS using
BovineHD genotypes to identify the most promising genomic region associated with
NC milk, and secondly we fine-mapped this genomic region using imputed
sequences.
5.2 Material and Methods
5.2.1 Animals and phenotypes
Morning milk samples were retrieved from 382 SR cows belonging to 21 herds in the
southern part of Sweden. Cows were kept indoors, were fed according to standard
practices, and were milked 2 or 3 times a day. Cows were daughters of 160 sires, and
were chosen to be as genetically unrelated as possible. Cows were multiparous,
ranging from 1 through 3 parturitions, and were in different lactations stages,
ranging from 2.5 through 61 weeks in lactation.
Milk samples were collected in two distinct periods: April through May 2010, and
September 2010 through April 2011. Directly after collection, milk samples were
cooled and transported to Lund University (Lund, Sweden), where samples were
defatted by centrifugation (at 2,000 x g for 30 min) to reduce the number of factors
influencing coagulation properties. Fresh skimmed milk samples were preserved by
adding bronopol (Sigma-Aldrich, Schnelldorf, Germany) solution of 17% wt/vol
(2µL/mL), as described in Hallén et al. (2007). For rheological measurements, these
milk samples were stored at +4ºC, but no longer than 3d. Skimmed milk samples
were heated to 32ºC for 30min, after which chymosin (0.44mL/L Chy-Max Plus, 205
international milk clotting units (IMCU)/mL, Chr. Hansen A/S Hørsholm, Denmark)
was added, and the resulting solution was gently stirred. The addition of the
chymosin represented time zero. Measurements, such as rennet gel strength, rennet
coagulation time, and yield stress of rennet-induced gels, were done and described
by Gustavsson et al. (2014a). Some samples were unable to coagulate within 40 min
after rennet-addition, and were defined as non-coagulating (NC) milk samples. When
observed, NC milk was scored as one, while coagulating milk was scored as zero. Of
the 382 cows that had available phenotypes on coagulation properties, 18% of these
cows had NC milk.
5.2.2 Genotypes
A blood sample of each of the 382 SR cows was collected for genotyping purposes.
These cows were genotyped for 777,963 SNP using the Illumina BovineHD BeadChip
5 RWAS with NC milk on BTA18
104
(Illumina Inc., San Diego, CA). Quality controls of the data were performed using the
R-package GenAbel (Aulchenko et al., 2007), and consisted of a minimum of 95% of
non-missing SNP per called genotypes (call rate) and minor allele frequency (MAF)
of a minimum of 1% for a called SNP. All SNP without a map position on the UMD 3.1
genome assembly (Zimin et al., 2009) as well as SNP on the sex chromosome were
discarded. After these edits, a total of 624,302 SNP were available for further
analyses.
In addition, blood samples were used to extract DNA to genotype all cows for genetic
variants of αs1-, β- and κ-caseins (CN) using TaqMan SNP genotyping assays (Applied
Biosystems, Foster City, CA), as described in Gustavsson et al. (2014b). For these
variants, the assays were distinguished among the following: αs1-CN variant A, B, C,
D, and F; β-CN variants A1, A2, A3, B and I; and κ-CN variants A, B and E). In their study,
combined genotypes were created by combining the genetic variants of αs1-β-κ-CN.
These combined genotypes were used in the present study, and are referred to as
“CNcluster”.
Whole–genome sequences were available for 428 bulls and for 1 cow from 15
different breeds (Run 3 of the 1000 Bull Genomes consortium; Daetwyler et al.,
2014), representing a multi-breed reference population. Among these sequences, 33
belonged to SR and FAY bulls with a large impact in the SR cow population. All
positions of the variants on sequences were aligned to the bovine genome assembly
UMD3.1 (Zimin et al., 2009). Within this multi-breed reference population, positions
containing both a SNP and an indel were excluded because of possible problems with
alignment and sequencing.
5.2.3 GWAS on BovineHD genotypes
Single-marker analyses were run in ASReml 4.0 (Beta version; Gilmour et al., 2009)
using the following animal model:
𝑦 = 𝜇 + ℎ𝑒𝑟𝑑 + 𝑝𝑎𝑟𝑖𝑡𝑦 + 𝑤𝑖𝑚 + 𝑒−0.05∗𝑤𝑖𝑚 + 𝐶𝑁𝑐𝑙𝑢𝑠𝑡𝑒𝑟 + 𝑀𝑎𝑟𝑘𝑒𝑟 + 𝑎
+ 𝑒 [1]
where y is the dependent variable; µ is the overall mean, herd is the covariate that
describes the effect of a cow belonging to a specific herd; parity is the covariate that
describes the effect of number of parities per cow; wim is the covariate that
describes the effect of weeks in milk, modeled as a Wilmink curve (Wilmink, 1987);
CNcluster is the covariate describing the effect of the combined genotypes; Marker
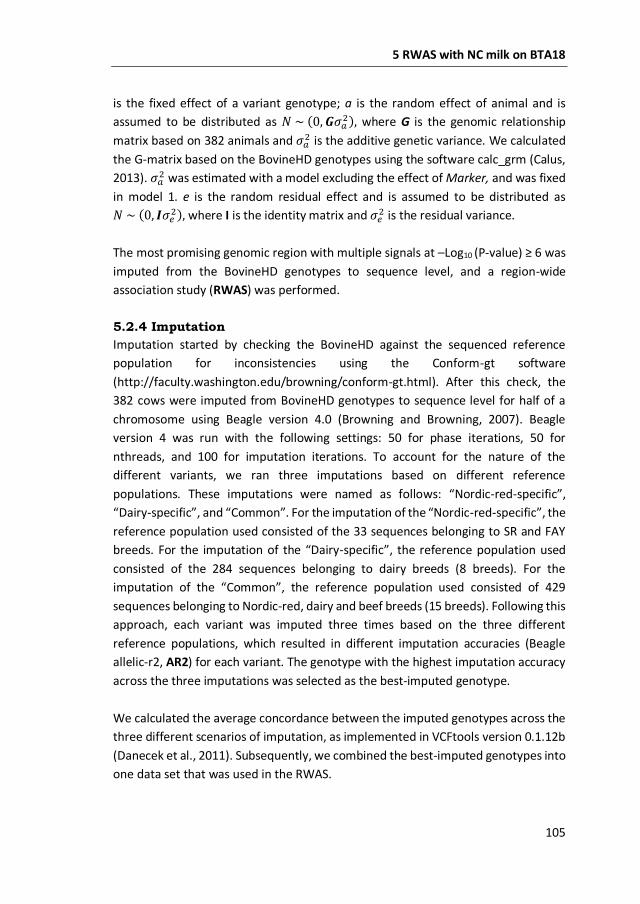
5 RWAS with NC milk on BTA18
105
is the fixed effect of a variant genotype; a is the random effect of animal and is
assumed to be distributed as 𝑁 ~ (0, 𝑮𝜎𝑎2), where G is the genomic relationship
matrix based on 382 animals and 𝜎𝑎2 is the additive genetic variance. We calculated
the G-matrix based on the BovineHD genotypes using the software calc_grm (Calus,
2013). 𝜎𝑎2 was estimated with a model excluding the effect of Marker, and was fixed
in model 1. e is the random residual effect and is assumed to be distributed as
𝑁 ~ (0, 𝑰𝜎𝑒2), where I is the identity matrix and 𝜎𝑒
2 is the residual variance.
The most promising genomic region with multiple signals at –Log10 (P-value) ≥ 6 was
imputed from the BovineHD genotypes to sequence level, and a region-wide
association study (RWAS) was performed.
5.2.4 Imputation
Imputation started by checking the BovineHD against the sequenced reference
population for inconsistencies using the Conform-gt software
(http://faculty.washington.edu/browning/conform-gt.html). After this check, the
382 cows were imputed from BovineHD genotypes to sequence level for half of a
chromosome using Beagle version 4.0 (Browning and Browning, 2007). Beagle
version 4 was run with the following settings: 50 for phase iterations, 50 for
nthreads, and 100 for imputation iterations. To account for the nature of the
different variants, we ran three imputations based on different reference
populations. These imputations were named as follows: “Nordic-red-specific”,
“Dairy-specific”, and “Common”. For the imputation of the “Nordic-red-specific”, the
reference population used consisted of the 33 sequences belonging to SR and FAY
breeds. For the imputation of the “Dairy-specific”, the reference population used
consisted of the 284 sequences belonging to dairy breeds (8 breeds). For the
imputation of the “Common”, the reference population used consisted of 429
sequences belonging to Nordic-red, dairy and beef breeds (15 breeds). Following this
approach, each variant was imputed three times based on the three different
reference populations, which resulted in different imputation accuracies (Beagle
allelic-r2, AR2) for each variant. The genotype with the highest imputation accuracy
across the three imputations was selected as the best-imputed genotype.
We calculated the average concordance between the imputed genotypes across the
three different scenarios of imputation, as implemented in VCFtools version 0.1.12b
(Danecek et al., 2011). Subsequently, we combined the best-imputed genotypes into
one data set that was used in the RWAS.
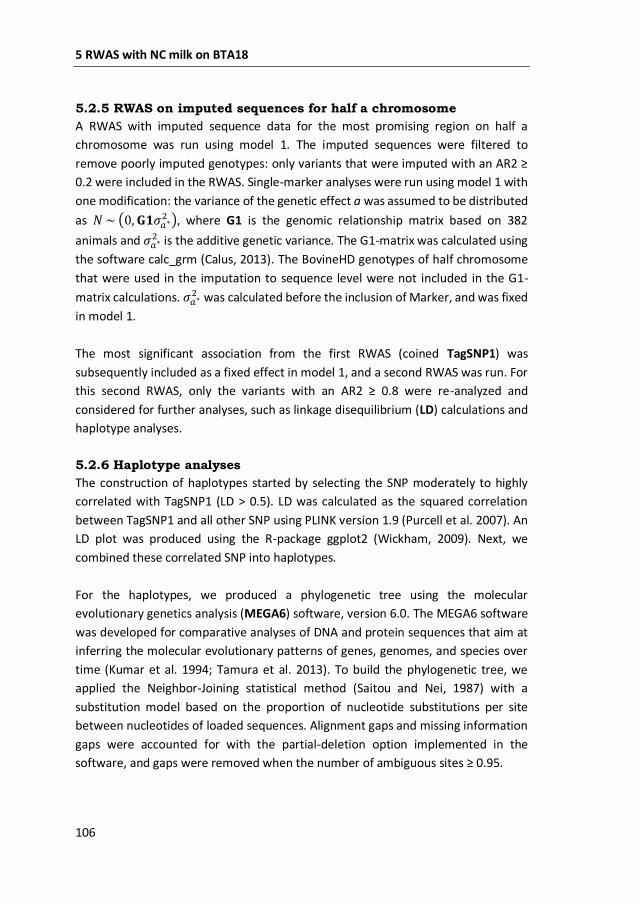
5 RWAS with NC milk on BTA18
106
5.2.5 RWAS on imputed sequences for half a chromosome
A RWAS with imputed sequence data for the most promising region on half a
chromosome was run using model 1. The imputed sequences were filtered to
remove poorly imputed genotypes: only variants that were imputed with an AR2 ≥
0.2 were included in the RWAS. Single-marker analyses were run using model 1 with
one modification: the variance of the genetic effect a was assumed to be distributed
as 𝑁 ~ (0, 𝐆𝟏𝜎𝑎∗2 ), where G1 is the genomic relationship matrix based on 382
animals and 𝜎𝑎∗2 is the additive genetic variance. The G1-matrix was calculated using
the software calc_grm (Calus, 2013). The BovineHD genotypes of half chromosome
that were used in the imputation to sequence level were not included in the G1-
matrix calculations. 𝜎𝑎∗2 was calculated before the inclusion of Marker, and was fixed
in model 1.
The most significant association from the first RWAS (coined TagSNP1) was
subsequently included as a fixed effect in model 1, and a second RWAS was run. For
this second RWAS, only the variants with an AR2 ≥ 0.8 were re-analyzed and
considered for further analyses, such as linkage disequilibrium (LD) calculations and
haplotype analyses.
5.2.6 Haplotype analyses
The construction of haplotypes started by selecting the SNP moderately to highly
correlated with TagSNP1 (LD > 0.5). LD was calculated as the squared correlation
between TagSNP1 and all other SNP using PLINK version 1.9 (Purcell et al. 2007). An
LD plot was produced using the R-package ggplot2 (Wickham, 2009). Next, we
combined these correlated SNP into haplotypes.
For the haplotypes, we produced a phylogenetic tree using the molecular
evolutionary genetics analysis (MEGA6) software, version 6.0. The MEGA6 software
was developed for comparative analyses of DNA and protein sequences that aim at
inferring the molecular evolutionary patterns of genes, genomes, and species over
time (Kumar et al. 1994; Tamura et al. 2013). To build the phylogenetic tree, we
applied the Neighbor-Joining statistical method (Saitou and Nei, 1987) with a
substitution model based on the proportion of nucleotide substitutions per site
between nucleotides of loaded sequences. Alignment gaps and missing information
gaps were accounted for with the partial-deletion option implemented in the
software, and gaps were removed when the number of ambiguous sites ≥ 0.95.
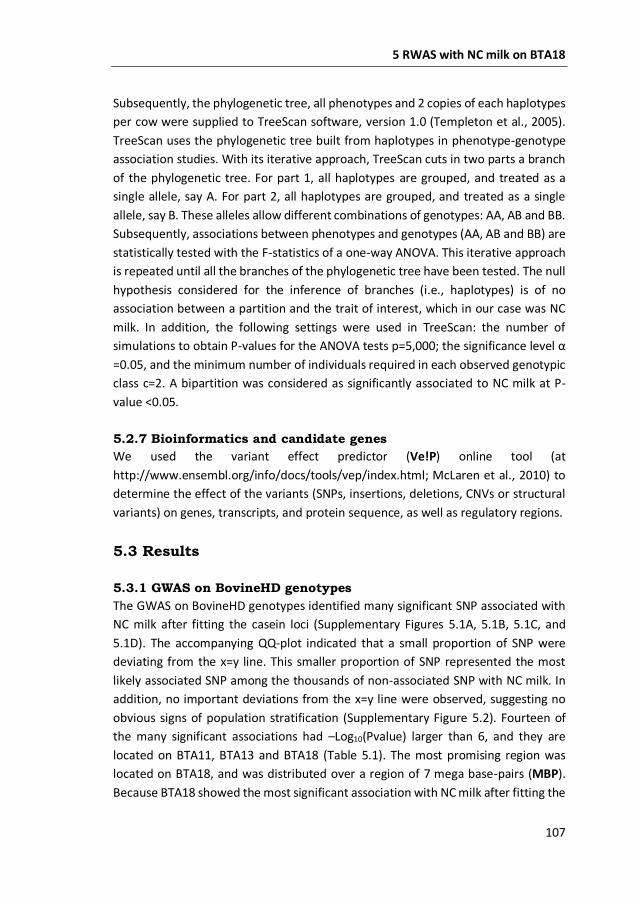
5 RWAS with NC milk on BTA18
107
Subsequently, the phylogenetic tree, all phenotypes and 2 copies of each haplotypes
per cow were supplied to TreeScan software, version 1.0 (Templeton et al., 2005).
TreeScan uses the phylogenetic tree built from haplotypes in phenotype-genotype
association studies. With its iterative approach, TreeScan cuts in two parts a branch
of the phylogenetic tree. For part 1, all haplotypes are grouped, and treated as a
single allele, say A. For part 2, all haplotypes are grouped, and treated as a single
allele, say B. These alleles allow different combinations of genotypes: AA, AB and BB.
Subsequently, associations between phenotypes and genotypes (AA, AB and BB) are
statistically tested with the F-statistics of a one-way ANOVA. This iterative approach
is repeated until all the branches of the phylogenetic tree have been tested. The null
hypothesis considered for the inference of branches (i.e., haplotypes) is of no
association between a partition and the trait of interest, which in our case was NC
milk. In addition, the following settings were used in TreeScan: the number of
simulations to obtain P-values for the ANOVA tests p=5,000; the significance level α
=0.05, and the minimum number of individuals required in each observed genotypic
class c=2. A bipartition was considered as significantly associated to NC milk at P-
value <0.05.
5.2.7 Bioinformatics and candidate genes
We used the variant effect predictor (Ve!P) online tool (at
http://www.ensembl.org/info/docs/tools/vep/index.html; McLaren et al., 2010) to
determine the effect of the variants (SNPs, insertions, deletions, CNVs or structural
variants) on genes, transcripts, and protein sequence, as well as regulatory regions.
5.3 Results
5.3.1 GWAS on BovineHD genotypes
The GWAS on BovineHD genotypes identified many significant SNP associated with
NC milk after fitting the casein loci (Supplementary Figures 5.1A, 5.1B, 5.1C, and
5.1D). The accompanying QQ-plot indicated that a small proportion of SNP were
deviating from the x=y line. This smaller proportion of SNP represented the most
likely associated SNP among the thousands of non-associated SNP with NC milk. In
addition, no important deviations from the x=y line were observed, suggesting no
obvious signs of population stratification (Supplementary Figure 5.2). Fourteen of
the many significant associations had –Log10(Pvalue) larger than 6, and they are
located on BTA11, BTA13 and BTA18 (Table 5.1). The most promising region was
located on BTA18, and was distributed over a region of 7 mega base-pairs (MBP).
Because BTA18 showed the most significant association with NC milk after fitting the
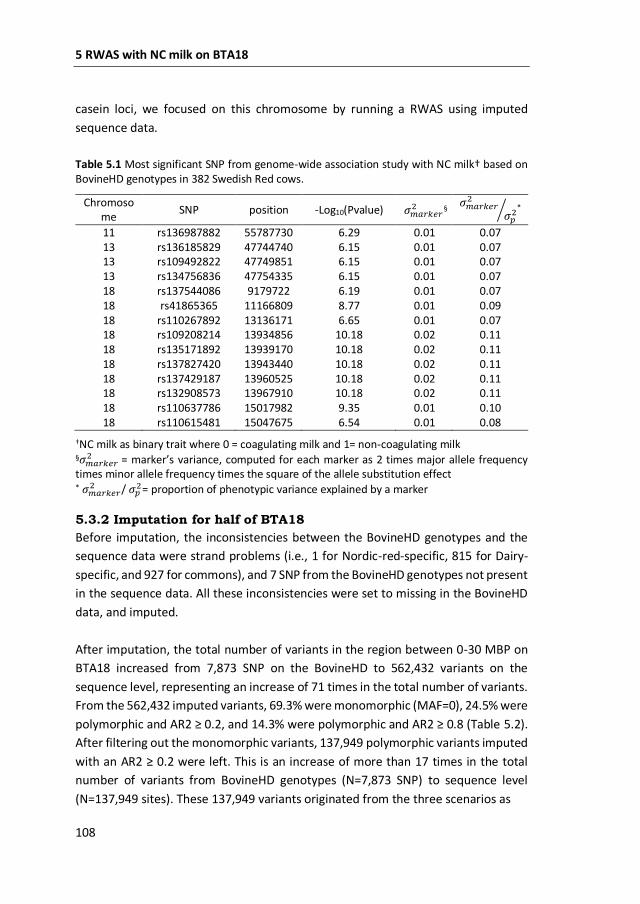
5 RWAS with NC milk on BTA18
108
casein loci, we focused on this chromosome by running a RWAS using imputed
sequence data.
Table 5.1 Most significant SNP from genome-wide association study with NC milk† based on BovineHD genotypes in 382 Swedish Red cows.
Chromosome
SNP position -Log10(Pvalue) 𝜎𝑚𝑎𝑟𝑘𝑒𝑟2 §
𝜎𝑚𝑎𝑟𝑘𝑒𝑟2
𝜎𝑝2⁄ *
11 rs136987882 55787730 6.29 0.01 0.07 13 rs136185829 47744740 6.15 0.01 0.07 13 rs109492822 47749851 6.15 0.01 0.07 13 rs134756836 47754335 6.15 0.01 0.07 18 rs137544086 9179722 6.19 0.01 0.07 18 rs41865365 11166809 8.77 0.01 0.09 18 rs110267892 13136171 6.65 0.01 0.07 18 rs109208214 13934856 10.18 0.02 0.11 18 rs135171892 13939170 10.18 0.02 0.11 18 rs137827420 13943440 10.18 0.02 0.11 18 rs137429187 13960525 10.18 0.02 0.11 18 rs132908573 13967910 10.18 0.02 0.11 18 rs110637786 15017982 9.35 0.01 0.10 18 rs110615481 15047675 6.54 0.01 0.08
†NC milk as binary trait where 0 = coagulating milk and 1= non-coagulating milk §𝜎𝑚𝑎𝑟𝑘𝑒𝑟
2 = marker’s variance, computed for each marker as 2 times major allele frequency times minor allele frequency times the square of the allele substitution effect * 𝜎𝑚𝑎𝑟𝑘𝑒𝑟
2 / 𝜎𝑝2= proportion of phenotypic variance explained by a marker
5.3.2 Imputation for half of BTA18
Before imputation, the inconsistencies between the BovineHD genotypes and the
sequence data were strand problems (i.e., 1 for Nordic-red-specific, 815 for Dairy-
specific, and 927 for commons), and 7 SNP from the BovineHD genotypes not present
in the sequence data. All these inconsistencies were set to missing in the BovineHD
data, and imputed.
After imputation, the total number of variants in the region between 0-30 MBP on
BTA18 increased from 7,873 SNP on the BovineHD to 562,432 variants on the
sequence level, representing an increase of 71 times in the total number of variants.
From the 562,432 imputed variants, 69.3% were monomorphic (MAF=0), 24.5% were
polymorphic and AR2 ≥ 0.2, and 14.3% were polymorphic and AR2 ≥ 0.8 (Table 5.2).
After filtering out the monomorphic variants, 137,949 polymorphic variants imputed
with an AR2 ≥ 0.2 were left. This is an increase of more than 17 times in the total
number of variants from BovineHD genotypes (N=7,873 SNP) to sequence level
(N=137,949 sites). These 137,949 variants originated from the three scenarios as
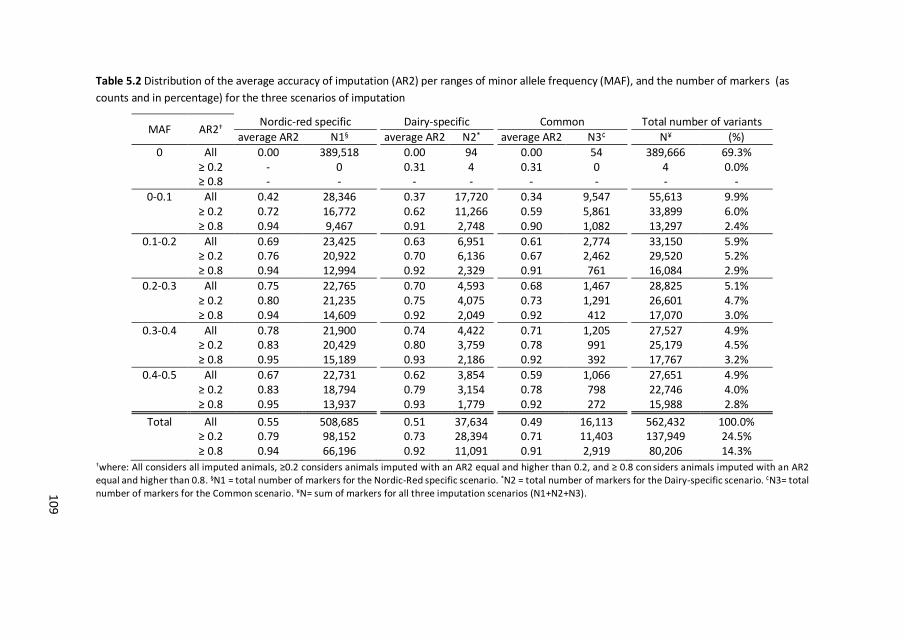
109
Table 5.2 Distribution of the average accuracy of imputation (AR2) per ranges of minor allele frequency (MAF), and the number of markers (as
counts and in percentage) for the three scenarios of imputation
†where: All considers all imputed animals, ≥0.2 considers animals imputed with an AR2 equal and higher than 0.2, and ≥ 0.8 con siders animals imputed with an AR2 equal and higher than 0.8. §N1 = total number of markers for the Nordic-Red specific scenario. *N2 = total number of markers for the Dairy-specific scenario. ¢N3= total number of markers for the Common scenario. ¥N= sum of markers for all three imputation scenarios (N1+N2+N3).
MAF AR2† Nordic-red specific
Dairy-specific
Common
Total number of variants
average AR2 N1§ average AR2 N2* average AR2 N3¢ N¥ (%)
0 All 0.00 389,518 0.00 94 0.00 54 389,666 69.3% ≥ 0.2 - 0 0.31 4 0.31 0 4 0.0% ≥ 0.8 - - - - - - - -
0-0.1 All 0.42 28,346 0.37 17,720 0.34 9,547 55,613 9.9% ≥ 0.2 0.72 16,772 0.62 11,266 0.59 5,861 33,899 6.0% ≥ 0.8 0.94 9,467 0.91 2,748 0.90 1,082 13,297 2.4%
0.1-0.2 All 0.69 23,425 0.63 6,951 0.61 2,774 33,150 5.9% ≥ 0.2 0.76 20,922 0.70 6,136 0.67 2,462 29,520 5.2% ≥ 0.8 0.94 12,994 0.92 2,329 0.91 761 16,084 2.9%
0.2-0.3 All 0.75 22,765 0.70 4,593 0.68 1,467 28,825 5.1% ≥ 0.2 0.80 21,235 0.75 4,075 0.73 1,291 26,601 4.7% ≥ 0.8 0.94 14,609 0.92 2,049 0.92 412 17,070 3.0%
0.3-0.4 All 0.78 21,900 0.74 4,422 0.71 1,205 27,527 4.9% ≥ 0.2 0.83 20,429 0.80 3,759 0.78 991 25,179 4.5% ≥ 0.8 0.95 15,189 0.93 2,186 0.92 392 17,767 3.2%
0.4-0.5 All 0.67 22,731 0.62 3,854 0.59 1,066 27,651 4.9% ≥ 0.2 0.83 18,794 0.79 3,154 0.78 798 22,746 4.0% ≥ 0.8 0.95 13,937 0.93 1,779 0.92 272 15,988 2.8%
Total All 0.55 508,685 0.51 37,634 0.49 16,113 562,432 100.0% ≥ 0.2 0.79 98,152 0.73 28,394 0.71 11,403 137,949 24.5% ≥ 0.8 0.94 66,196 0.92 11,091 0.91 2,919 80,206 14.3%
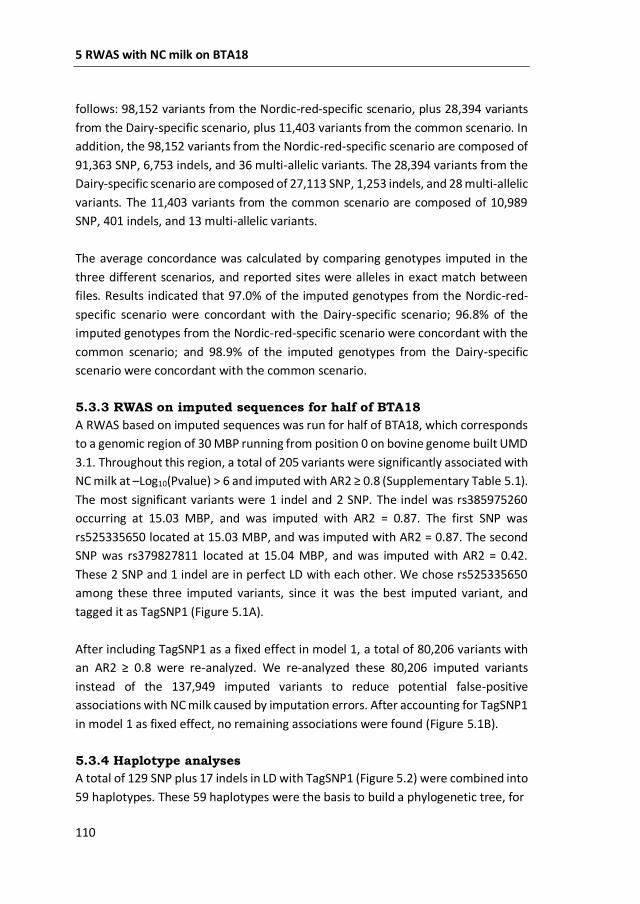
5 RWAS with NC milk on BTA18
110
follows: 98,152 variants from the Nordic-red-specific scenario, plus 28,394 variants
from the Dairy-specific scenario, plus 11,403 variants from the common scenario. In
addition, the 98,152 variants from the Nordic-red-specific scenario are composed of
91,363 SNP, 6,753 indels, and 36 multi-allelic variants. The 28,394 variants from the
Dairy-specific scenario are composed of 27,113 SNP, 1,253 indels, and 28 multi-allelic
variants. The 11,403 variants from the common scenario are composed of 10,989
SNP, 401 indels, and 13 multi-allelic variants.
The average concordance was calculated by comparing genotypes imputed in the
three different scenarios, and reported sites were alleles in exact match between
files. Results indicated that 97.0% of the imputed genotypes from the Nordic-red-
specific scenario were concordant with the Dairy-specific scenario; 96.8% of the
imputed genotypes from the Nordic-red-specific scenario were concordant with the
common scenario; and 98.9% of the imputed genotypes from the Dairy-specific
scenario were concordant with the common scenario.
5.3.3 RWAS on imputed sequences for half of BTA18
A RWAS based on imputed sequences was run for half of BTA18, which corresponds
to a genomic region of 30 MBP running from position 0 on bovine genome built UMD
3.1. Throughout this region, a total of 205 variants were significantly associated with
NC milk at –Log10(Pvalue) > 6 and imputed with AR2 ≥ 0.8 (Supplementary Table 5.1).
The most significant variants were 1 indel and 2 SNP. The indel was rs385975260
occurring at 15.03 MBP, and was imputed with AR2 = 0.87. The first SNP was
rs525335650 located at 15.03 MBP, and was imputed with AR2 = 0.87. The second
SNP was rs379827811 located at 15.04 MBP, and was imputed with AR2 = 0.42.
These 2 SNP and 1 indel are in perfect LD with each other. We chose rs525335650
among these three imputed variants, since it was the best imputed variant, and
tagged it as TagSNP1 (Figure 5.1A).
After including TagSNP1 as a fixed effect in model 1, a total of 80,206 variants with
an AR2 ≥ 0.8 were re-analyzed. We re-analyzed these 80,206 imputed variants
instead of the 137,949 imputed variants to reduce potential false-positive
associations with NC milk caused by imputation errors. After accounting for TagSNP1
in model 1 as fixed effect, no remaining associations were found (Figure 5.1B).
5.3.4 Haplotype analyses
A total of 129 SNP plus 17 indels in LD with TagSNP1 (Figure 5.2) were combined into
59 haplotypes. These 59 haplotypes were the basis to build a phylogenetic tree, for
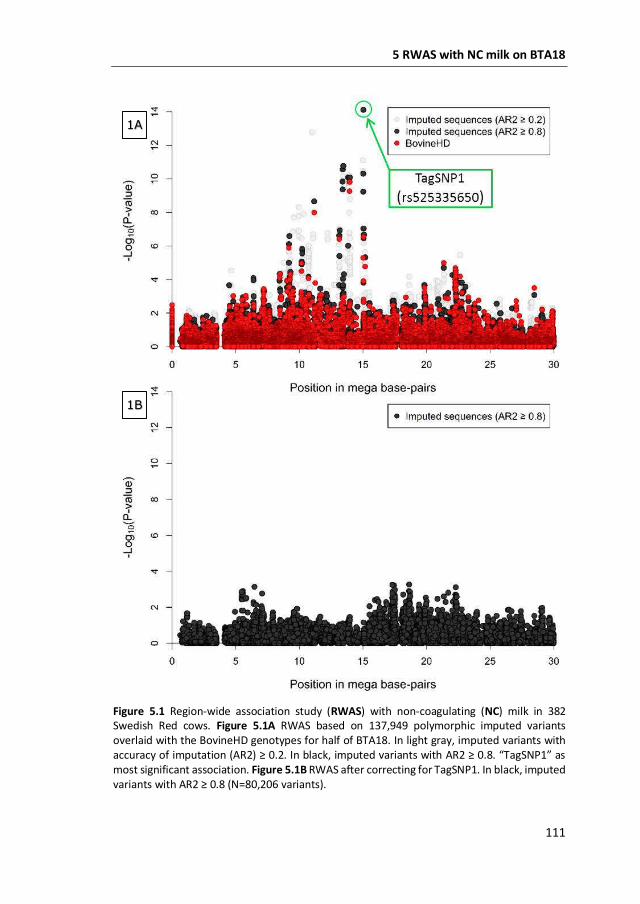
5 RWAS with NC milk on BTA18
111
Figure 5.1 Region-wide association study (RWAS) with non-coagulating (NC) milk in 382 Swedish Red cows. Figure 5.1A RWAS based on 137,949 polymorphic imputed variants overlaid with the BovineHD genotypes for half of BTA18. In light gray, imputed variants with accuracy of imputation (AR2) ≥ 0.2. In black, imputed variants with AR2 ≥ 0.8. “TagSNP1” as most significant association. Figure 5.1B RWAS after correcting for TagSNP1. In black, imputed variants with AR2 ≥ 0.8 (N=80,206 variants).
1A
1B
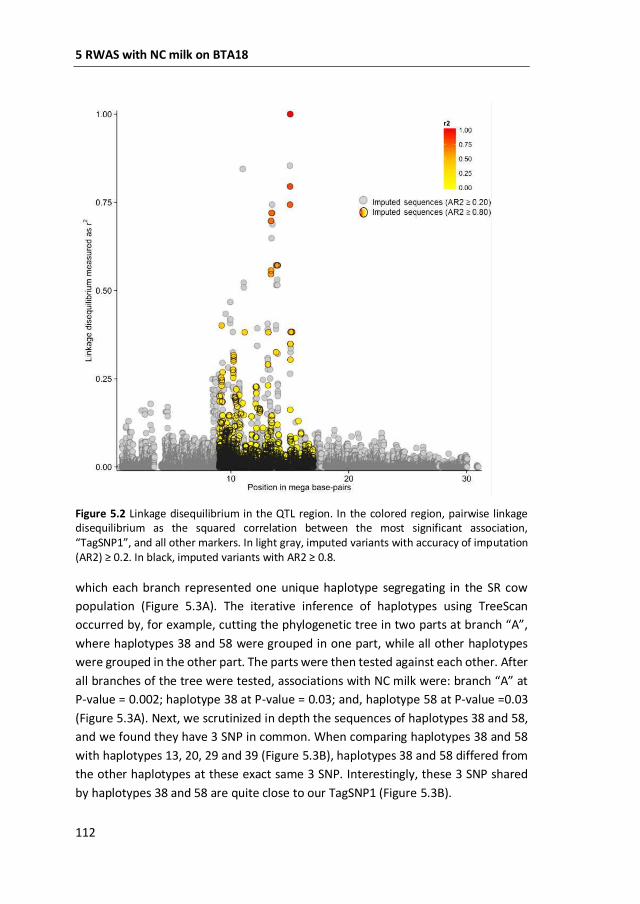
5 RWAS with NC milk on BTA18
112
Figure 5.2 Linkage disequilibrium in the QTL region. In the colored region, pairwise linkage disequilibrium as the squared correlation between the most significant association, “TagSNP1”, and all other markers. In light gray, imputed variants with accuracy of imputation (AR2) ≥ 0.2. In black, imputed variants with AR2 ≥ 0.8.
which each branch represented one unique haplotype segregating in the SR cow
population (Figure 5.3A). The iterative inference of haplotypes using TreeScan
occurred by, for example, cutting the phylogenetic tree in two parts at branch “A”,
where haplotypes 38 and 58 were grouped in one part, while all other haplotypes
were grouped in the other part. The parts were then tested against each other. After
all branches of the tree were tested, associations with NC milk were: branch “A” at
P-value = 0.002; haplotype 38 at P-value = 0.03; and, haplotype 58 at P-value =0.03
(Figure 5.3A). Next, we scrutinized in depth the sequences of haplotypes 38 and 58,
and we found they have 3 SNP in common. When comparing haplotypes 38 and 58
with haplotypes 13, 20, 29 and 39 (Figure 5.3B), haplotypes 38 and 58 differed from
the other haplotypes at these exact same 3 SNP. Interestingly, these 3 SNP shared
by haplotypes 38 and 58 are quite close to our TagSNP1 (Figure 5.3B).
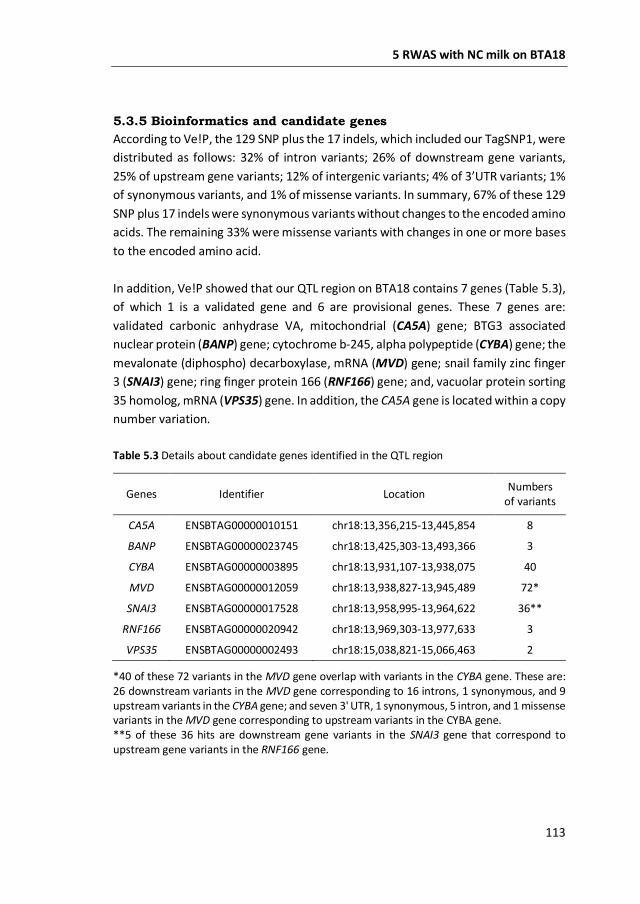
5 RWAS with NC milk on BTA18
113
5.3.5 Bioinformatics and candidate genes
According to Ve!P, the 129 SNP plus the 17 indels, which included our TagSNP1, were
distributed as follows: 32% of intron variants; 26% of downstream gene variants,
25% of upstream gene variants; 12% of intergenic variants; 4% of 3’UTR variants; 1%
of synonymous variants, and 1% of missense variants. In summary, 67% of these 129
SNP plus 17 indels were synonymous variants without changes to the encoded amino
acids. The remaining 33% were missense variants with changes in one or more bases
to the encoded amino acid.
In addition, Ve!P showed that our QTL region on BTA18 contains 7 genes (Table 5.3),
of which 1 is a validated gene and 6 are provisional genes. These 7 genes are:
validated carbonic anhydrase VA, mitochondrial (CA5A) gene; BTG3 associated
nuclear protein (BANP) gene; cytochrome b-245, alpha polypeptide (CYBA) gene; the
mevalonate (diphospho) decarboxylase, mRNA (MVD) gene; snail family zinc finger
3 (SNAI3) gene; ring finger protein 166 (RNF166) gene; and, vacuolar protein sorting
35 homolog, mRNA (VPS35) gene. In addition, the CA5A gene is located within a copy
number variation.
Table 5.3 Details about candidate genes identified in the QTL region
Genes Identifier Location Numbers
of variants
CA5A ENSBTAG00000010151 chr18:13,356,215-13,445,854 8
BANP ENSBTAG00000023745 chr18:13,425,303-13,493,366 3
CYBA ENSBTAG00000003895 chr18:13,931,107-13,938,075 40
MVD ENSBTAG00000012059 chr18:13,938,827-13,945,489 72*
SNAI3 ENSBTAG00000017528 chr18:13,958,995-13,964,622 36**
RNF166 ENSBTAG00000020942 chr18:13,969,303-13,977,633 3
VPS35 ENSBTAG00000002493 chr18:15,038,821-15,066,463 2
*40 of these 72 variants in the MVD gene overlap with variants in the CYBA gene. These are: 26 downstream variants in the MVD gene corresponding to 16 introns, 1 synonymous, and 9 upstream variants in the CYBA gene; and seven 3' UTR, 1 synonymous, 5 intron, and 1 missense variants in the MVD gene corresponding to upstream variants in the CYBA gene. **5 of these 36 hits are downstream gene variants in the SNAI3 gene that correspond to upstream gene variants in the RNF166 gene.
5 RWAS with NC milk on BTA18
114
The genomic position of the 3 strongest associations with NC milk on BTA18 are
shown in Supplementary Figure 5.3A. Of these associations, rs379827811 is an intron
variant in the VPS35 gene. According to Ve!P, rs379827811 is upstream to 14
missense variants, 1 synonymous variant, 1 stop gained variant and 1 splice region
variant (Supplementary Figure 5.3B).
The 3 SNP shared by haplotypes 38 and 58 identified in the haplotype analyses are
intergenic variants located between 20.5 and 31.2 kilo base-pairs (kbp) downstream
to the VPS35 gene.
5.4 Discussion
In the present study, we used the same phenotypes and BovineHD genotypes as in
Gustavsson et al. (2014a) to perform a GWAS with NC milk, and we further fine-
mapped a genomic region on half of BTA18 using imputed sequences. This genomic
region is distributed over 7 MBP on BTA18, and is strongly associated with NC milk.
At least one QTL could be fine-mapped using imputed sequences. In addition, we
conducted haplotype analyses to disentangle the occurrence of multiple QTL in
strong LD within this region. At last, we identified potential candidate genes within
this QTL region.
5.4.1 GWAS on BovineHD genotypes
The GWAS on BovineHD genotypes showed significant associations with NC milk
distributed over 7 mega base-pairs (MBP) on BTA18 (Table 5.1). These 7 MBP explain
large fractions of the phenotypic variation in NC milk, ranging from 7% to 11%.
Tyrisevä et al. (2008) performed a genome scan to map non-coagulation of milk in
477 genotyped FAY cows. Their study used microsatellite markers and identified a
QTL located around 17 MBP on BTA18. Their QTL is very close to the 7 MBP region
identified in our study. The methodology used by Tyrisevä et al. (2008) is different
from the present study. It is important to note that the study by Tyrisevä et al. (2008)
is based on a linkage study within sire families with pooled DNA of cows with extreme
phenotypes, and our study is based on an association analysis of genotyped cows
with scored phenotypes. Both methodologies have the common goal of pointing out
the potential candidate genes associated with a trait of interest, and, despite the
differences between both studies, a similar genomic region was associated with NC
milk.
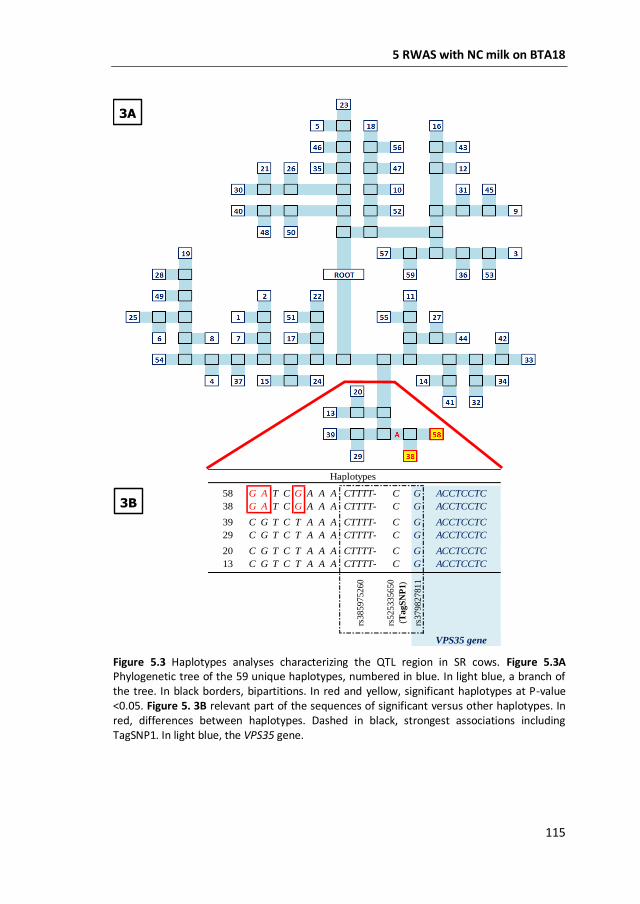
5 RWAS with NC milk on BTA18
115
Figure 5.3 Haplotypes analyses characterizing the QTL region in SR cows. Figure 5.3A Phylogenetic tree of the 59 unique haplotypes, numbered in blue. In light blue, a branch of the tree. In black borders, bipartitions. In red and yellow, significant haplotypes at P-value <0.05. Figure 5. 3B relevant part of the sequences of significant versus other haplotypes. In red, differences between haplotypes. Dashed in black, strongest associations including TagSNP1. In light blue, the VPS35 gene.
RWAS with NC milk on BTA18
1
2
58 G A T C G A A A CTTTT- C G ACCTCCTC
38 G A T C G A A A CTTTT- C G ACCTCCTC
39 C G T C T A A A CTTTT- C G ACCTCCTC
29 C G T C T A A A CTTTT- C G ACCTCCTC
20 C G T C T A A A CTTTT- C G ACCTCCTC
13 C G T C T A A A CTTTT- C G ACCTCCTC
rs385975260
rs525335650
(Ta
gS
NP
1)
rs379827811
VPS35 gene
Haplotypes
3A
3B
5 RWAS with NC milk on BTA18
116
Eleven significant associations found by our GWAS were in agreement with
associations found by the GWAS of Gregersen et al. (2015), who studied MCP
properties but not NC milk. This agreement occurred with the following two traits:
rennet gel strength measured 30 minutes after chymosin addition (G’30), and rennet
coagulation time (CTrennet). For G’30, associations agreed on BTA1, BTA13, BTA18,
and BTA22. More specifically, these associations were: 4 SNP located between 70.75
and 70.90 MBP on BTA1; 5 SNP located between 58.10 and 58.14 MBP on BTA13; 1
SNP at 13.13MBP on BTA18; and 1 SNP located at 19.35 MBP on BTA22. The strong
negative genetic correlation between NC milk and G’30 (-0.82; Gustavsson et al.,
2014a) is likely to explain the agreement of results between both studies regarding
G’30. For CTrennet, associations agreed on BTA18, and these were: 1 SNP located at
11.16 MBP, and 1 SNP located at 11.65 MBP. Gregersen et al. (2015) used (log-
transformed) CTrennet in their GWAS, whereas we analyzed NC milk, a trait derived
from CTrennet. Despite the use of different but CTrennet-related traits, it was
unexpected to find only two associations in agreement between both studies. A
reason for this little agreement might be caused by our approach to analyze NC milk,
which dealt with the right-censored nature of coagulation time in a more suitable
way (Cecchinato and Carnier, 2011).
An important aspect of our GWAS on BovineHD genotypes was the analyses of NC
milk as a normally distributed trait despite its binary nature. Cecchinato and Carnier
(2011) were the first authors to suggest this approach because NC milk samples have
been consistently excluded from most analyses when observed (e.g., Ikonen et al.,
2004; Gregersen et al., 2015). Cecchinato and Carnier (2011) showed that statistical
models have difficulties to correctly account for NC milk, and suggested to score NC
milk as a binary trait and include it as a normally distributed trait in linear mixed
models. This option allows for analyses of NC milk without the exclusion of
information. Following this approach, Gustavsson et al. (2014a) included NC milk as
a binary trait in their analyses, and estimated genetic parameters for rennet-induced
coagulation properties in SR cows. In addition, the inclusion of NC milk as a binary
trait in our study could be one of the reasons why little overlap was found with the
study by Gregersen et al. (2015) regarding CTrennet.
Besides their GWAS, Gregersen et al. (2015) found a suggestive QTL for the log-
transformed G’30 trait by haplotypes analyses. This suggestive QTL was found in the
interval located between 11.65 and 22.34 MBP on BTA18. Although not significant in
their study, this suggestive QTL interval is in agreement with 9 out of 10 of our most
significant SNP associated with NC milk on BTA18 (Table 5.1). In addition, the top
5 RWAS with NC milk on BTA18
117
SNP indicated by Gregersen et al. (2015) at 11.16 MBP is among our most significant
SNP associated with NC milk.
Breeding for higher protein content in SR cows might lead to problems in the
foreseeable future, suggested by the moderate, yet unfavorable genetic correlation
between NC milk and protein content (Gustavsson et al., 2014a). Our main goal was
to disentangle the effects of genetic variants of milk protein fractions from other
genetic variants associated with NC milk. For this reason, we included a multi-locus
genotype that combined the genetic variants of the main milk protein fractions (i.e.,
αs1-β-κ-CN; “CNcluster”) in our model. Bittante et al. (2012) reviewed the most
important genetic factors that affect MCP, indicating that MCP, including NC milk,
are strongly influenced by variable proportions, and genetic variants of milk protein
fractions (especially of κ-CN). These milk protein fractions, mainly representing
caseins, are encoded on BTA6 and thus, the recombination among alleles is small
(Bittante et al., 2012). In contrast, Tyrisevä et al. (2008) did not find significant
associations between NC milk and the casein loci. In the present study, the casein
loci were included as part of the design of our GWAS with NC milk, resulting in
significant associations that are independent from the casein loci. This means that
genes found by our study represent a new set of genes compared with the genes of
the casein loci known to influence the prevalence of NC milk (e.g., Jensen et al., 2012;
Gustavsson et al., 2014b).
5.4.2 Imputation
Imputation of SR cows was quite challenging because most of the variants were
poorly imputed at sequence level when directly using the 429 WGS as reference
population. As pointed out by Bouwman and Veerkamp (2014), breed-specific
variants are best imputed by using a large single-breed reference population. This
suggestion would mean that only 33 out of the 429 WGS would be of interest to
impute our 382 SR cows to sequence level. The challenge of imputing a small breed
like SR was overcome by running three different scenarios of imputation, and each
time with a different reference population. The genotype that had the best
imputation accuracy across the three scenarios was selected as the best-imputed
genotype. The average accuracies of imputation using our approach were 0.79 for
variants imputed with AR2 ≥ 0.2, and 0.93 for variants imputed with AR2 ≥ 0.8. While
this is a slightly ad-hoc approach, there was good concordance between the three
imputation scenarios and our subsequent focus on variants with AR2 ≥ 0.8 adds
further rigor to our analyses.
5 RWAS with NC milk on BTA18
118
5.4.3 RWAS on imputed sequences for half of BTA18
The RWAS on imputed sequences for half of BTA18 revealed many significant
associations with NC milk (Supplementary Table 5.1). One of our three strongest
associations, TagSNP1, explained almost 34% of the genetic variation and 14% of the
phenotypic variance in NC milk (Figures 5.1A and 5.1B). This large fraction of genetic
variance explained by TagSNP1 is independent of the casein loci on located on BTA6.
Altogether, these findings strongly suggest the existence of at least one causal
variant in our focus region distributed over 7 MBP associated with NC milk. It might
be plausible that one causal variant, i.e., 1 QTL is associated with NC milk in our focus
region, although we cannot exclude the presence of multiple QTL in strong LD
associated with NC milk in our focus region. Similar findings were found by Daetwyler
et al. (2014) and Sahana et al. (2014). In their GWAS with imputed sequences, the
considerable number of significant variants closely linked to each other increased
the complexity of identifying a causal variant. In our study, we performed haplotype
analyses to answer whether one or multiple QTL were present in the 7 MBP.
5.4.4 Haplotype analyses
Among the many advantages of haplotype over single-variant analyses (Balding,
2006), two of them are: a) haplotype analyses naturally account for the correlated
structure between variants because all the genetic variation in a population is
transmitted from parent to offspring through haplotypes (Clark, 2004); and b)
haplotype analyses reduce the number of parameters tested in association studies
as compared with single-variant analyses (e.g., Clark, 2004; Balding, 2006). In
contrast, a “tagging” strategy would reduce the power gained from using haplotypes
per se (Balding, 2006). In our study, this limitation was dealt with by using the
TreeScan approach (Templeton et al., 2005). TreeScan considered two aspects
simultaneously: the correlated structure of variants closely linked to each other, and
the origin of this haplotype in the population through a phylogenetic tree. Using the
TreeScan approach, 2 out of the 59 haplotypes were found to be associated with NC
milk in our QTL region (Figure 5.3A). The two significant haplotypes had 3 SNP in
common, and these SNP are located from 13.7 to 24.4 kbp apart from TagSNP1
(Figure 5.3B). These findings support the presence of one QTL influencing NC milk in
our focus region. Nonetheless, the task of identifying the causal variant remains
challenging. According to Vasemägi and Primmer (2005), when an association
between TagSNP1 and the causal variant is found, other linked associations can be
responsible for the variation in the trait of interest. This might be our case since
TagSNP1 was one out of three closely linked variants strongly associated with NC
milk.
5 RWAS with NC milk on BTA18
119
5.4.5 Bioinformatics and candidate genes
Our three strongest association with NC milk are composed of 1 indel and 2 SNP. One
of the 2 SNP (rs379827811) is an intron variant located between 15.04 MBP within
the VPS35 gene (Figures 5.3B, Supplementary Figure 5.3A, and Supplementary Figure
5.3B). In humans, the VPS35 gene is a component of the retromer complex that
mediates endosome-to-Golgi retrieval of membrane proteins such as the cation-
independent mannose 6-phosphate receptor. According to Malik et al. (2015), cargo-
selective sorting is important for the correct sub-cellular destination of membrane
proteins. The retromer complex mediated by VPS35 gene seems to promote the
recycling of specific membrane proteins, such as β2-adrenergic receptor and the
glucose transporter GLUT1, directly back to plasma membrane (Seaman et al., 2013).
It is important to mention that GLUT1 is the major glucose transporter in the basal
membrane of epithelial cells and, in the mice mammary gland, its expression was
increased when greater demand for glucose for the synthesis of lactose was needed
(Anderson et al., 2007). If the recycling mechanism of the retromer complex is
defective, it is possible that not enough membrane proteins are recycled, and in turn,
are not available for milk synthesis.
A mutation in the VPS35 gene has been associated with Parkinson’s disease
(Zavodszky et al., 2014). In mice-models for Parkinson’s disease, a VPS35 deficiency
could contribute to retinal ganglion neuro-degeneration, leading to the blindness of
many retinal degenerative disorders (Liu et al., 2014). In addition, Lemay et al. (2013)
shows that the VPS35 gene is expressed throughout lactation in humans, which
include colostrum, transitional, and mature milk, after they sequenced the mRNA
found in milk fat layer. In Arabidopsis, the VPS35 gene has been associated with
protein sorting and is involved in the plant growth and leaf senescence (Yamazaki et
al., 2008). In addition, Munch et al. (2015) shows that a dysfunction in the VPS35
gene can contribute to immune-associated cell death in Arabidopsis. In cattle, Lemay
et al. (2009) classified the mammary gene sets according to their condition and their
developmental specific-stage, and showed that the VPS35 gene belonged to the
mammary gene sets of pre-parturient and of lactating cows. The VPS35 gene has not
been associated to non-coagulating milk yet.
5.5 Conclusions
The GWAS on BovineHD genotypes found significant associations with NC milk
distributed over 7 MBP on BTA18 for SR cows. These 7 MBP contained 14 SNP that
5 RWAS with NC milk on BTA18
120
explained from 7% to 11% of phenotypic variation in NC milk. This large proportion
of explained phenotypic variance is independent of the casein loci. To further
characterize these 7 MBP, we ran a region-wide association study with imputed
sequences. The significance of the associations increased from –Log10(P-value)
=10.18 on BovineHD genotypes to –Log10(Pvalue) = 14.12 on imputed sequences. NC
milk in SR cows was influenced by at least one QTL within these 7 MBP. A haplotype
analyses identified 2 haplotypes that differed from the other 57 haplotypes at 3 SNP.
These 3 SNP were located near to the strongest association identified by the region-
wide association study with imputed sequences. For BTA18, haplotype analyses
support the existence of one QTL underlying NC milk in SR cows. A candidate gene
of interest is the VPS35 gene, for which one of our strongest association is an intronic
SNP in this gene. It has been suggested that the VPS35 gene is involved in the
recycling of specific membrane proteins, such as β2- adrenergic receptor and the
glucose transporter GLUT1. The VPS35 gene belongs to the mammary gene sets of
pre-parturient and of lactating cows, and has not been associated to NC milk yet.
5.6 Author Contributions
MG and MP coordinated the data collection and analysis of milk samples. MG, MP,
WFF & DJK designed and supervised the study. SID, DJK & WFF analyzed the data and
interpreted the results. SID, MG, DJK, MP, WFF wrote the manuscript. All authors
revised and accepted the final version of the manuscript.
5.7 List of abbreviations
AR2 – beagle’s accuracy of imputation;
BovineHD – 777,963 SNP genotypes
BTA – Bos taurus autosome
CN – caseins
CTrennet - rennet coagulation time
FAY – Finnish Ayrshire
G’30 – rennet gel strength measured 30 minutes after chymosin addition
GWAS – genome-wide association study
LD – linkage disequilibrium
MAF – minor allele frequency
MBP – mega base-pair
MCP – milk coagulation properties
5 RWAS with NC milk on BTA18
121
NC – non-coagulating
QTL - quantitative trait loci
RWAS – region-wide association study
SR - Swedish Red
TagSNP1- most significant association retrieved from RWAS
Ve!P – variant effect predictor
WGS – whole-genome sequences
5.8 Acknowledgements
SID currently benefits from a joint-grant from the European Commission [within the
framework of the Erasmus-Mundus joint doctorate “EGS-ABG” (Paris, France) and
Breed4Food (a public-private partnership in the domain of animal breeding and
genomics and CRV]. Further, the authors wish to thank the Swedish Farmer's
Foundation for Agricultural Research (SLF), Stockholm, Sweden for financial support
as well as Dr. Frida Gustavsson, Lund University, Sweden for milk collection and
analyses of coagulation data. DJK & WFF acknowledges Mistra Biotech, a research
program financed by Mistra – Stiftelsen för miljoöstrategisk forskning and SLU.
5.9 Conflict of Interest Statement
The authors declare that the research was conducted in the absence of any
commercial or financial relationships that could be construed as a potential conflict
of interest.
5.10 References
Anderson, S. M., Rudolph, M. C., McManaman, J. L., and Neville, M. C. (2007).
Secretory activation in the mammary gland: it’s not just about milk protein
synthesis. Breast Cancer Res 9:204-217. doi:10.1186/bcr1653.
Auldist, M. J., Johnston, K. A., White, N. J., Fitzsimons, W. P., and Boland, M. J. (2004).
A comparison of the composition, coagulation characteristics and cheesemaking
capacity of milk from Friesian and Jersey dairy cows. J Dairy Res 71:51-57.
Aulchenko, Y. S., Ripke, S., Isaacs, A., and Van Duijn, C. M. (2007). GenABEL: an R
library for genome-wide association analysis. Bioinformatics 23, 1294-1296.
doi:10.1093/bioinformatics/btm108.
5 RWAS with NC milk on BTA18
122
Balding, D. J. (2006). A tutorial on statistical methods for population association-
studies. Nature Rev Genet 7, 781-791.
Bittante, G., Penasa, M., and Cecchinato, A. (2012). Invited review: Genetics and
modeling of milk coagulation properties. J Dairy Sci 95, 6843-6870.
doi:10.3168/jds.2012-5507.
Browning, S. R., and Browning, B. L. (2007). Rapid and accurate haplotype phasing
and missing-data inference for whole-genome association studies by use of
localized haplotype clustering. Am J Hum Genet 81, 1084–1097.
doi:10.1086/521987.
Bouwman, A. C., and Veerkamp, R. F. (2014). Consequences of splitting whole-
genome sequencing effort over multiple breeds on imputation accuracy. BMC
genet 15, 105. doi:10.1186/s12863-014-0105-8.
Calus, M. P. L. (2013). Calc_grm–A programme to compute pedigree, genomic, and
combined relationship matrices. Animal Breeding and Genomics Centre,
Wageningen UR Livestock Research, Wageningen, Netherlands.
Cassandro, M., Comin, A., Ojala, M., Dal Zotto, R., De Marchi, M., Gallo, L., et al.
(2008). Genetic parameters of milk coagulation properties and their relationships
with milk yield and quality traits in Italian Holstein cows. J Dairy Sci 91:371-376.
Cecchinato, A., De Marchi, M., Gallo, L., Bittante, G., and Carnier, P. (2009). Mid-
infrared spectroscopy predictions as indicator traits in breeding programs for
enhanced coagulation properties of milk. J Dairy Sci 92, 5304–5313.
doi:10.3168/jds.2009-2246.
Cecchinato, A., and Carnier, P. (2011). Short communication: statistical models for
the analysis of coagulation traits using coagulating and noncoagulating milk
information. J Dairy Sci 94, 4214–4219. doi:10.3168/jds.2010-3911.
Cecchinato, A., Penasa, M., De Marchi, M., Gallo, L., Bittante, G., and Carnier, P.
(2011). Genetic parameters of coagulation properties, milk yield, quality, and
acidity: estimated using coagulating milk and noncoagulating information in Brown
Swiss and Holstein cows. J Dairy Sci 94, 4205-4213. doi:10.3168/jds.2010-3913.
Chilliard, Y., Ferlay, A., and Doreau, M. (2001). Effect of different types of forages,
animal fat or marine oils in cow’s diet on milk fat secretion and composition,
especially conjugated linoleic acid (CLA) and polyunsaturated fatty acids. Livest
Prod Sci 70, 31–48. doi:10.1016/S0301-6226(01)00196-8.
Clark, A. G. (2004). The role of haplotypes in candidate-gene studies. Genet Epidemiol
27, 321–333.
Danecek, P., Auton, A., Abecasis, G., Albers, C. A., Banks, E., DePristo, M. A., et al.
(2011). The variant call format and VCFtools. Bioinformatics 27, 2156-2158.
doi:10.1093/bioinformatics/btr330
5 RWAS with NC milk on BTA18
123
Daetwyler, H. D., Capitan, A., Pausch, H., Stothard, P., van Binsbergen, R., Brøndum,
R. F., et al. (2014). Whole-genome sequencing of 234 bulls facilitates mapping of
monogenic and complex traits in cattle. Nat Genet 46, 858–865.
doi:10.1038/ng.3034.
De Marchi, M., Dal Zotto, R., Cassandro, M., and Bittante, G. (2007). Milk coagulation
ability of five dairy cattle breeds. J Dairy Sci 90, 3986–3992. doi:10.3168/jds.2006-
627.
Druet, T., Macleod, I. M., and Hayes, B. J. (2014). Toward genomic prediction from
whole-genome sequence data: impact of sequencing design on genotype
imputation and accuracy of predictions. Heredity (Edinb) 112, 39–47.
doi:10.1038/hdy.2013.13.
Frederiksen, P. D., Andersen, K. K., Hammershøj, M., Poulsen, H. D., Sørensen, J.,
Bakman, M., et al. (2011). Composition and effect of blending of noncoagulating,
poorly coagulating, and well-coagulating bovine milk from individual Danish
Holstein cows. J Dairy Sci 94, 4787–4799. doi:10.3168/jds.2011-4343.
Gilmour, A. R., Gogel, B., Cullis, B., and Thompson, R. (2009). ASReml user guide,
release 3.0. VSN International Ltd., Hemel Hempstead, UK.
Gregersen, V. R., Gustavsson, F., Glantz, M., Christensen, O. F., Stålhammar, H.,
Andrén, A., et al. (2015). Bovine chromosomal regions affecting rheological traits
in rennet-induced skim milk gels. J Dairy Sci 98, 1261-1272. doi:10.3168/jds.2014-
8136.
Gustavsson, F., Glantz, M., Poulsen, N. A., Wadsö, L., Stålhammar, H., Andrén, A., et
al. (2014a). Genetic parameters for rennet- and acid-induced coagulation
properties in milk from Swedish Red dairy cows. J Dairy Sci 97, 5219–5229.
doi:10.3168/jds.2014-7996.
Gustavsson, F., Buitenhuis, A. J., Glantz, M., Stålhammar, H., Lindmark-Månsson, H.,
Poulsen, N. A., et al. (2014b). Impact of genetic variants of milk proteins on
chymosin-induced gelation properties of milk from individual cows of Swedish Red
dairy cattle. Int Dairy J 39, 102-107. doi:10.1016/j.idairyj.2014.05.007.
Hallén, E., Allmere, T., Näslund, J., Andrén, A., and Lundén, A. (2007). Effect of
genetic polymorphism of milk proteins on rheology of chymosin-induced milk gels.
Int Dairy J 17, 791–799. doi:10.1016/j.idairyj.2006.09.011.
Hallén, E., Lundén, A., Tyrisevä, A. M., Westerlind, M., and Andrén, A. (2010).
Composition of poorly and non-coagulating bovine milk and effect of calcium
addition. J Dairy Res 77:398-403.
Ikonen, T., Morri, S., Tyrisevä, A-M., Ruottinen, O., and Ojala, M. (2004). Genetic and
phenotypic correlations between milk coagulation properties, milk production
traits, somatic cell count, casein content, and pH of milk. J Dairy Sci 87, 458–467.
5 RWAS with NC milk on BTA18
124
Jensen, H. B., Poulsen, N. A, Andersen, K. K., Hammershøj, M., Poulsen, H. D., and
Larsen, L. B. (2012). Distinct composition of bovine milk from Jersey and Holstein-
Friesian cows with good, poor, or noncoagulation properties as reflected in protein
genetic variants and isoforms. J Dairy Sci 95, 6905–17. doi:10.3168/jds.2012-5675.
Kumar, S., Tamura, K., and Nei, M. (1994). MEGA: Molecular Evolutionary Genetics
Analysis software for microcomputers. Comput Appl Biosci 10, 189–191.
doi:10.1093/bioinformatics/10.2.189.
LRF Dairy Sweden. 2015. http://www.lrf.se/globalassets/dokument/om-
lrf/branscher/lrf-mjolk/statistik/milk_key_figures_sweden.pdf, accessed on Nov
3rd, 2015.
Lemay, D. G., Ballard, O. A., Hughes, M. A., Morrow, A. L., Horseman, N. D., and
Nommsen-Rivers, L. A. (2013). RNA sequencing of the human milk fat layer
transcriptome reveals distinct gene expression profiles at three stages of lactation.
PLoS One 8, e67531. doi:10.1371/journal.pone.0067531.
Lemay, D. G., Lynn, D. J., Martin, W. F., Neville, M. C., Casey, T. M., Rincon, G., et al.
(2009). The bovine lactation genome: insights into the evolution of mammalian
milk. Genome Biol 10, R43. doi:10.1186/gb-2009-10-4-r43.
Liu, W., Tang, F., Erion, J., and Xiao, H. (2014). VPS35 haploinsufficiency results in
degenerative-like deficit in mouse retinal ganglion neurons and impairment of
optic nerve injury-induced gliosis. Mol Brain 7, 1-11.
Malik, B. R., Godena, V. K., and Whitworth, A. J. (2015). VPS35 pathogenic mutations
confer no dominant toxicity but partial loss of function in Drosophila and
genetically interact with parkin. Hum Mol Genet 24:6106–6117.
10.1093/hmg/ddv322
McLaren, W., Pritchard, B., Rios, D., Chen, Y., Flicek, P., and Cunningham, F. (2010).
Deriving the consequences of genomic variants with the Ensembl API and SNP
Effect Predictor. Bioinformatics 26, 2069–2070.
doi:10.1093/bioinformatics/btq330.
Meuwissen, T., and Goddard, M. (2010). Accurate prediction of genetic values for
complex traits by whole-genome resequencing. Genetics 185, 623–631.
doi:10.1534/genetics.110.116590.
Munch, D., Teh, O.-K., Malinovsky, F. G., Liu, Q., Vetukuri, R. R., El Kasmi, F., et al.
(2015). Retromer contributes to immunity-associated cell death in Arabidopsis.
Plant Cell Online 27,463-479. tpc.114.132043. doi:10.1105/tpc.114.132043.
Nájera, A. I., De Renobales, M., and Barron, L. J. R. (2003). Effects of pH, temperature,
CaCl2 and enzyme concentrations on the rennet-clotting properties of milk: a
multifactorial study. Food Chem 80:345-352. doi:10.1016/S0308-8146(02)00270-
4.
5 RWAS with NC milk on BTA18
125
Nordic Cattle Genetic Evaluation, 2013.NAV – routine genetic evaluation of dairy
cattle – data and genetic models. Available online at:
http://www.nordicebv.info/wp-content/uploads/2015/04/General-description_
from-old-homepage_06052015.pdf.
Okigbo, L. M., Richardson, G. H., Brown, R. J., and Ernstrom, C. A. (1985a). Variation
in Coagulation Properties of Milk from Individual Cows 1, 2. J Dairy Sci 68:822-828.
doi:10.3168/jds.S0022-0302(85)80899-7.
Okigbo, L. M., Richardson, G. H., Brown, R. J., and Ernstrom, C. A. (1985b). Casein
composition of cow's milk of different chymosin coagulation properties. J Dairy Sci
68:1887-1892. doi:10.3168/jds.S0022-0302(85)81045-6.
Ostersen, S., Foldager, J., and Hermansen, J. E. (1997). Effects of stage of lactation,
milk protein genotype and body condition at calving on protein composition and
renneting properties of bovine milk. J Dairy Res 64 :207-219.
Penasa, M., Cassandro, M., Pretto, D., De Marchi, M., Comin, A., Chessa, S., et al.
(2010). Short communication: Influence of composite casein genotypes on
additive genetic variation of milk production traits and coagulation properties in
Holstein-Friesian cows. J Dairy Sci 93:3346-3349. doi:10.3168/jds.2010-3164.
Purcell, S., Neale, B., Todd-Brown, K., Thomas, L., Ferreira, M. A. R., Bender, D., et al.
(2007). PLINK: a tool set for whole-genome association and population-based
linkage analyses. Am J Hum Genet 81, 559-575. doi:10.1086/519795.
Sahana, G., Guldbrandtsen, B., Thomsen B., Holm, L.-E., Panitz, F., Brøndum, R. F., et
al. (2014). Genome-wide association study using high-density single nucleotide
polymorphism arrays and whole-genome sequences for clinical mastitis traits in
dairy cattle. J Dairy Sci 97, 7258–7275. doi:10.3168/jds.2014-8141.
Saitou, N., and Nei, M. (1987).The neighbor-joining method: a new method for
reconstructing phylogenetic trees. Mol Biol Evol 4, 406-425.
Seaman, M. N., Gautreau, A., & Billadeau, D. D. (2013). Retromer-mediated
endosomal protein sorting: all WASHed up! Trends Cell Biol 23:522-528.
10.1016/j.tcb.2013.04.010
Schwarz, G., and Mumm, H. (1948). The effects of adding calcium chloride potassium
nitrate or sodium nitrate to the cheese milk during Tilsit cheese making.
Süddeutsche Molkereizeitung, 69:160-161.
Tamura, K., Stecher, G., Peterson, D., Filipski, A., and Kumar, S. (2013). MEGA6:
Molecular evolutionary genetics analysis version 6.0. Mol Biol Evol 30, 2725–2729.
doi:10.1093/molbev/mst197.
Templeton, A. R., Maxwell, T., Posada, D., Stengård, J. H., Boerwinkle, E., and Sing, C.
F. (2005). Tree scanning: A method for using haplotype trees in
5 RWAS with NC milk on BTA18
126
phenotype/genotype association studies. Genetics 169, 441–453.
doi:10.1534/genetics.104.030080.
Tyrisevä, A. M., Elo, K., Kuusipuro, A., Vilva, V., Jänönen, I., Karjalainen, H., et al.
(2008). Chromosomal regions underlying noncoagulation of milk in Finnish
Ayrshire cows. Genetics 180, 1211–1220. doi:10.1534/genetics.107.083964.
Van Hooydonk, A. C. M., Hagedoorn, H. G., and Boerrigter, I. J. (1986). The effect of
various cations on the renneting of milk. Neth Milk Dairy J 40:369-390.
Vasemägi, A., and Primmer, C. R. (2005). Invited review - Challenges for identifying
functionally important genetic variation:the promise of combining complementary
research strategies. Mol Ecol 14, 3623-3642. doi: 10.1111/j.1365-
294X.2005.02690.x.
Wickham, H. (2009). Ggplot2: elegant graphics for data analysis. Springer Science &
Business Media, New York, USA.
Wilmink, J. B. M. (1987). Adjustment of test-day milk, fat and protein yield for age,
season and stage of lactation. Livest Prod Sci 16, 335–348. doi:10.1016/0301-
6226(87)90003-0.
Yamazaki, M., Shimada, T., Takahashi, H., Tamura, K., Kondo, M., Nishimura, M., et
al. (2008). Arabidopsis VPS35, a retromer component, is required for vacuolar
protein sorting and involved in plant growth and leaf senescence. Plant Cell Physiol
49, 142–156. doi:10.1093/pcp/pcn006.
Zavodszky, E., Seaman, M. N. J., Moreau, K., Jimenez-Sanchez, M., Breusegem, S. Y.,
Harbour, M. E., et al. (2014). Mutation in VPS35 associated with Parkinson’s
disease impairs WASH complex association and inhibits autophagy. Nat Commun
5, 3828. doi:10.1038/ncomms4828.
Zimin, A. V., Delcher, A. L., Florea, L., Kelley, D. R., Schatz, M. C., Puiu, D., et al. (2009).
A whole-genome assembly of the domestic cow, Bos taurus. Genome Biol 10, R42.
doi:10.1186/gb-2009-10-4-r42.
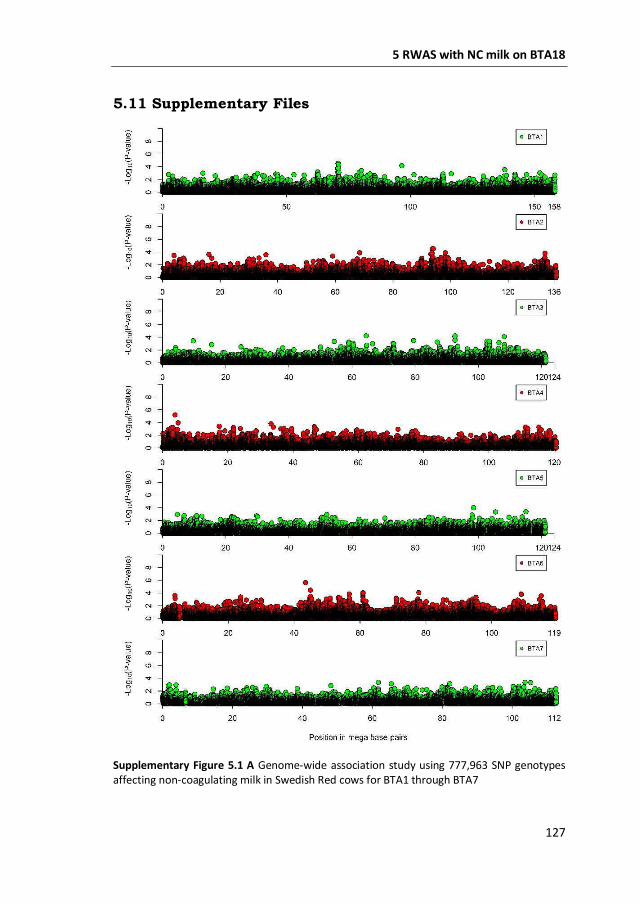
5 RWAS with NC milk on BTA18
127
5.11 Supplementary Files
Supplementary Figure 5.1 A Genome-wide association study using 777,963 SNP genotypes affecting non-coagulating milk in Swedish Red cows for BTA1 through BTA7
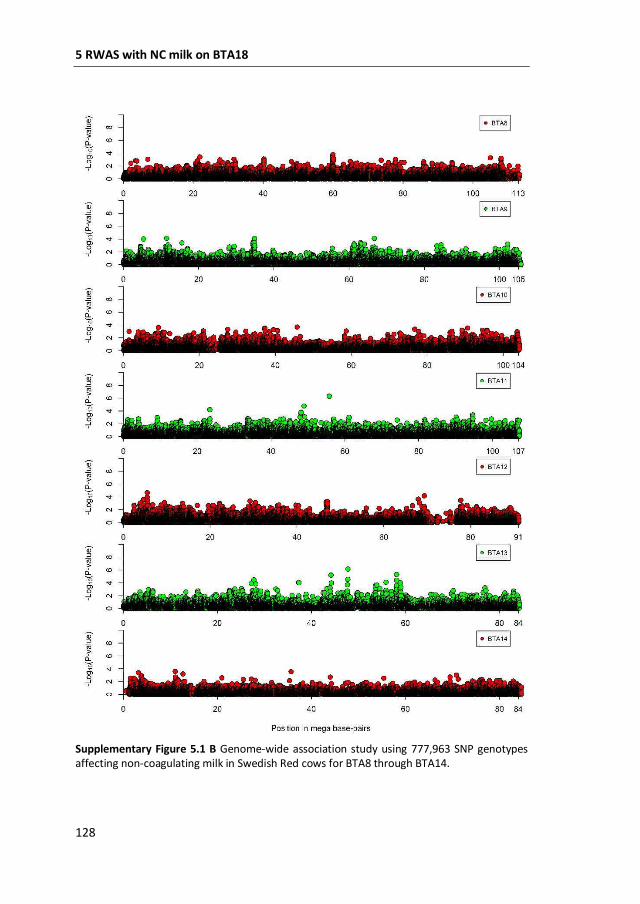
5 RWAS with NC milk on BTA18
128
Supplementary Figure 5.1 B Genome-wide association study using 777,963 SNP genotypes affecting non-coagulating milk in Swedish Red cows for BTA8 through BTA14.
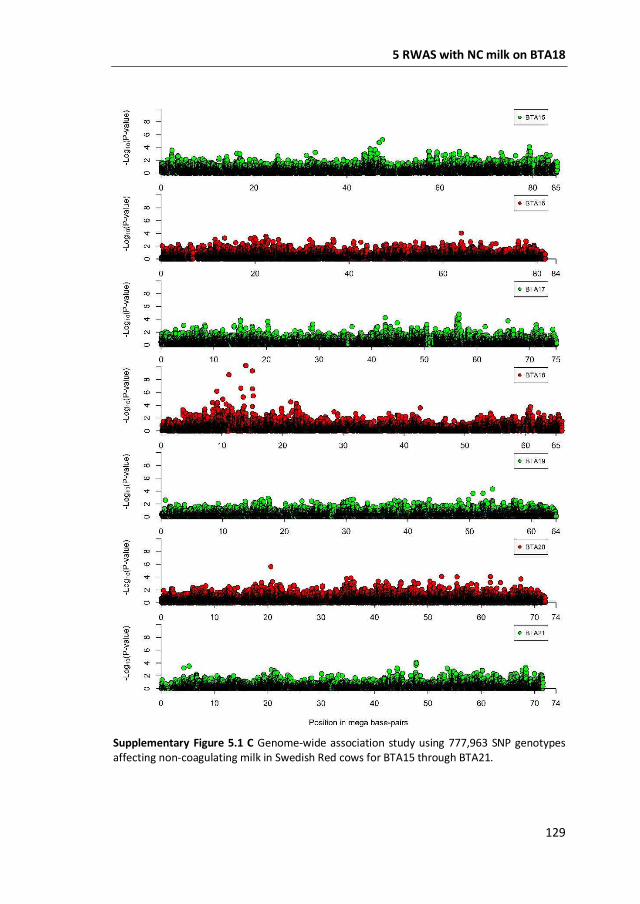
5 RWAS with NC milk on BTA18
129
Supplementary Figure 5.1 C Genome-wide association study using 777,963 SNP genotypes affecting non-coagulating milk in Swedish Red cows for BTA15 through BTA21.
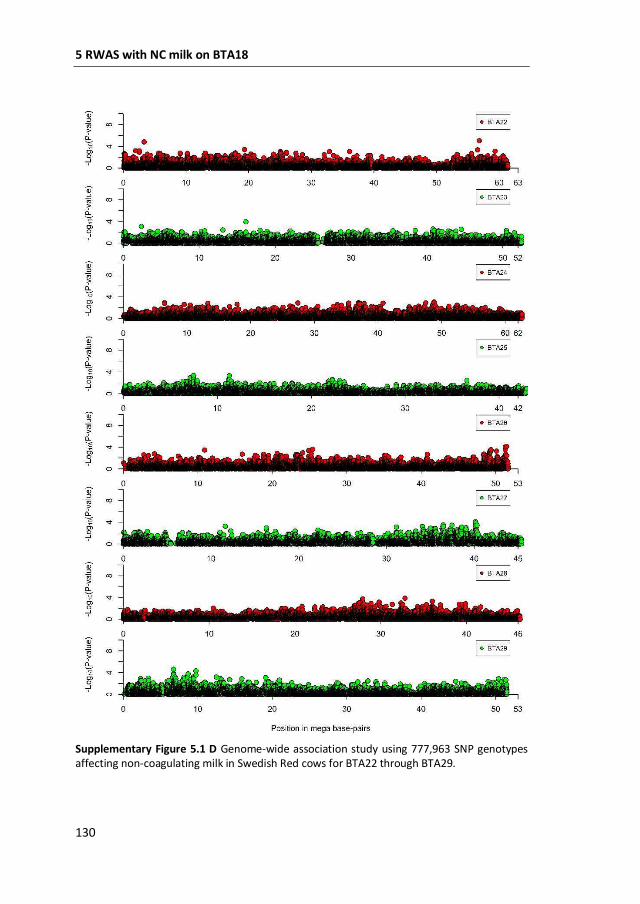
5 RWAS with NC milk on BTA18
130
Supplementary Figure 5.1 D Genome-wide association study using 777,963 SNP genotypes affecting non-coagulating milk in Swedish Red cows for BTA22 through BTA29.
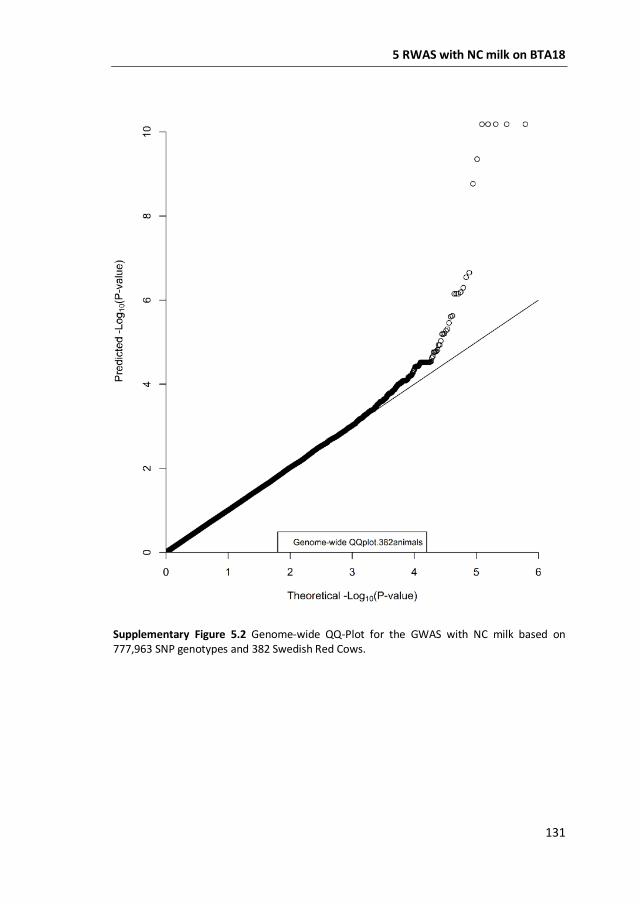
5 RWAS with NC milk on BTA18
131
Supplementary Figure 5.2 Genome-wide QQ-Plot for the GWAS with NC milk based on 777,963 SNP genotypes and 382 Swedish Red Cows.
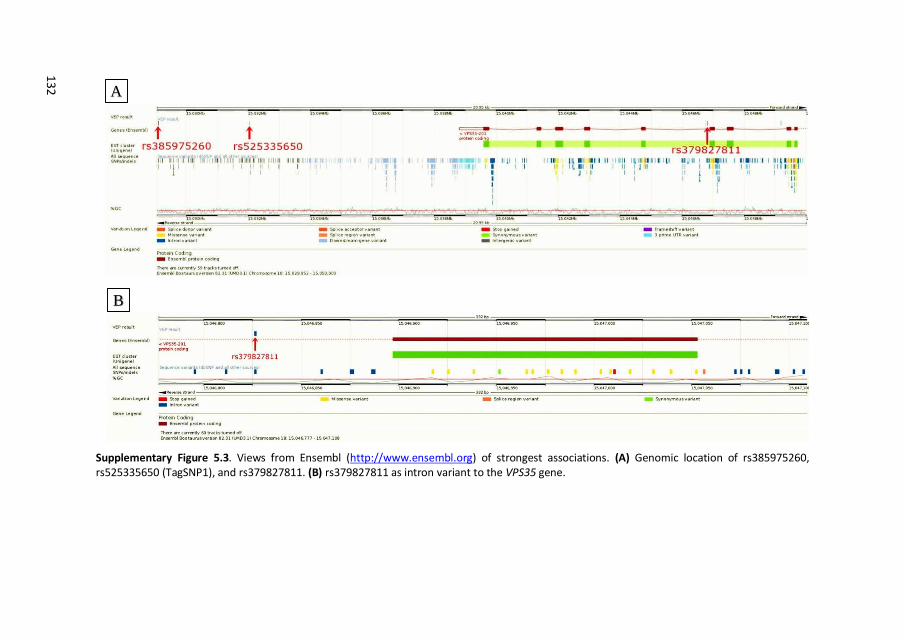
132
Supplementary Figure 5.3. Views from Ensembl (http://www.ensembl.org) of strongest associations. (A) Genomic location of rs385975260, rs525335650 (TagSNP1), and rs379827811. (B) rs379827811 as intron variant to the VPS35 gene.
A
B
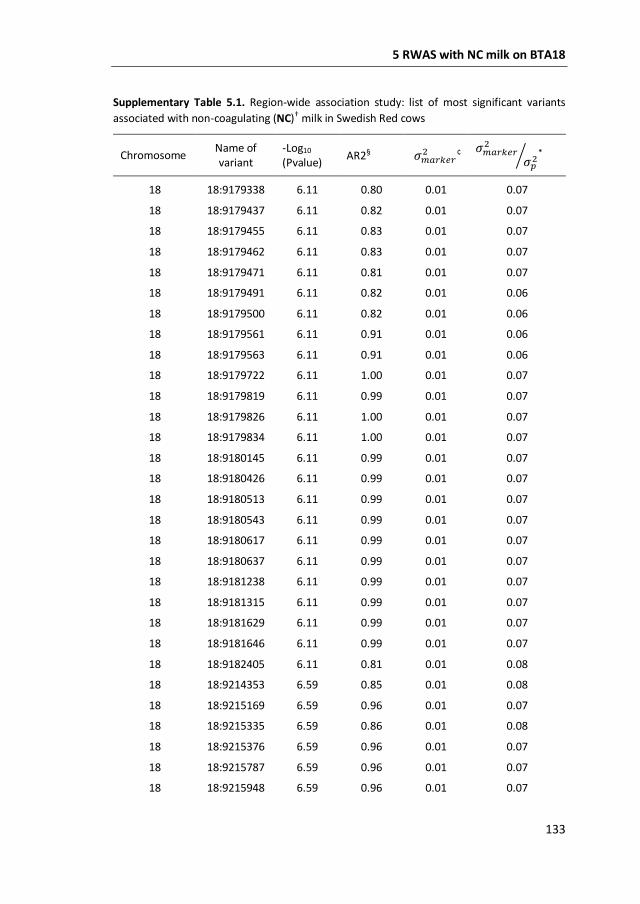
5 RWAS with NC milk on BTA18
133
Supplementary Table 5.1. Region-wide association study: list of most significant variants
associated with non-coagulating (NC)† milk in Swedish Red cows
Chromosome Name of variant
-Log10
(Pvalue) AR2§ 𝜎𝑚𝑎𝑟𝑘𝑒𝑟
2 ¢ 𝜎𝑚𝑎𝑟𝑘𝑒𝑟
2
𝜎𝑝2⁄ *
18 18:9179338 6.11 0.80 0.01 0.07
18 18:9179437 6.11 0.82 0.01 0.07
18 18:9179455 6.11 0.83 0.01 0.07
18 18:9179462 6.11 0.83 0.01 0.07
18 18:9179471 6.11 0.81 0.01 0.07
18 18:9179491 6.11 0.82 0.01 0.06
18 18:9179500 6.11 0.82 0.01 0.06
18 18:9179561 6.11 0.91 0.01 0.06
18 18:9179563 6.11 0.91 0.01 0.06
18 18:9179722 6.11 1.00 0.01 0.07
18 18:9179819 6.11 0.99 0.01 0.07
18 18:9179826 6.11 1.00 0.01 0.07
18 18:9179834 6.11 1.00 0.01 0.07
18 18:9180145 6.11 0.99 0.01 0.07
18 18:9180426 6.11 0.99 0.01 0.07
18 18:9180513 6.11 0.99 0.01 0.07
18 18:9180543 6.11 0.99 0.01 0.07
18 18:9180617 6.11 0.99 0.01 0.07
18 18:9180637 6.11 0.99 0.01 0.07
18 18:9181238 6.11 0.99 0.01 0.07
18 18:9181315 6.11 0.99 0.01 0.07
18 18:9181629 6.11 0.99 0.01 0.07
18 18:9181646 6.11 0.99 0.01 0.07
18 18:9182405 6.11 0.81 0.01 0.08
18 18:9214353 6.59 0.85 0.01 0.08
18 18:9215169 6.59 0.96 0.01 0.07
18 18:9215335 6.59 0.86 0.01 0.08
18 18:9215376 6.59 0.96 0.01 0.07
18 18:9215787 6.59 0.96 0.01 0.07
18 18:9215948 6.59 0.96 0.01 0.07
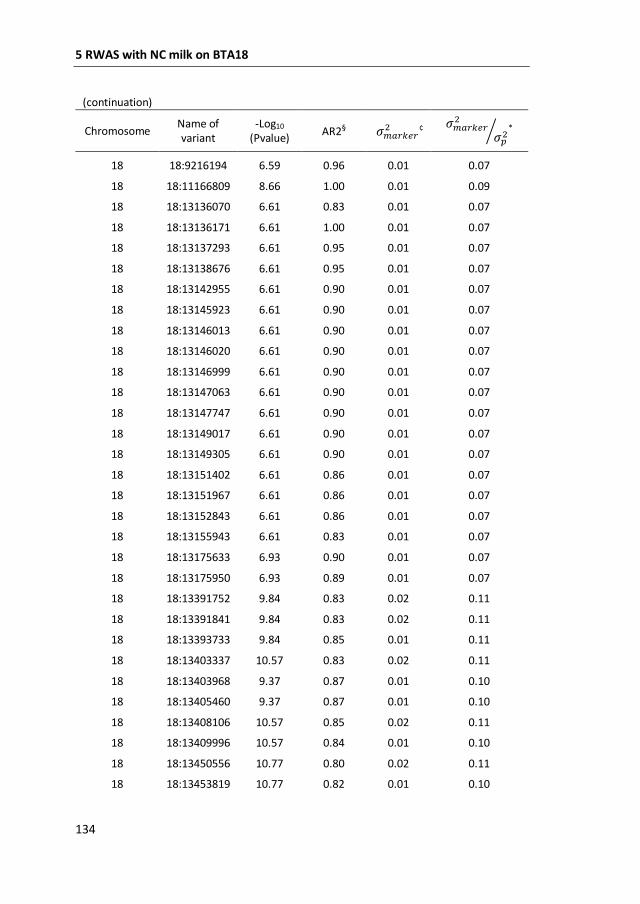
5 RWAS with NC milk on BTA18
134
(continuation)
Chromosome Name of variant
-Log10
(Pvalue) AR2§ 𝜎𝑚𝑎𝑟𝑘𝑒𝑟
2 ¢ 𝜎𝑚𝑎𝑟𝑘𝑒𝑟
2
𝜎𝑝2⁄ *
18 18:9216194 6.59 0.96 0.01 0.07
18 18:11166809 8.66 1.00 0.01 0.09
18 18:13136070 6.61 0.83 0.01 0.07
18 18:13136171 6.61 1.00 0.01 0.07
18 18:13137293 6.61 0.95 0.01 0.07
18 18:13138676 6.61 0.95 0.01 0.07
18 18:13142955 6.61 0.90 0.01 0.07
18 18:13145923 6.61 0.90 0.01 0.07
18 18:13146013 6.61 0.90 0.01 0.07
18 18:13146020 6.61 0.90 0.01 0.07
18 18:13146999 6.61 0.90 0.01 0.07
18 18:13147063 6.61 0.90 0.01 0.07
18 18:13147747 6.61 0.90 0.01 0.07
18 18:13149017 6.61 0.90 0.01 0.07
18 18:13149305 6.61 0.90 0.01 0.07
18 18:13151402 6.61 0.86 0.01 0.07
18 18:13151967 6.61 0.86 0.01 0.07
18 18:13152843 6.61 0.86 0.01 0.07
18 18:13155943 6.61 0.83 0.01 0.07
18 18:13175633 6.93 0.90 0.01 0.07
18 18:13175950 6.93 0.89 0.01 0.07
18 18:13391752 9.84 0.83 0.02 0.11
18 18:13391841 9.84 0.83 0.02 0.11
18 18:13393733 9.84 0.85 0.01 0.11
18 18:13403337 10.57 0.83 0.02 0.11
18 18:13403968 9.37 0.87 0.01 0.10
18 18:13405460 9.37 0.87 0.01 0.10
18 18:13408106 10.57 0.85 0.02 0.11
18 18:13409996 10.57 0.84 0.01 0.10
18 18:13450556 10.77 0.80 0.02 0.11
18 18:13453819 10.77 0.82 0.01 0.10
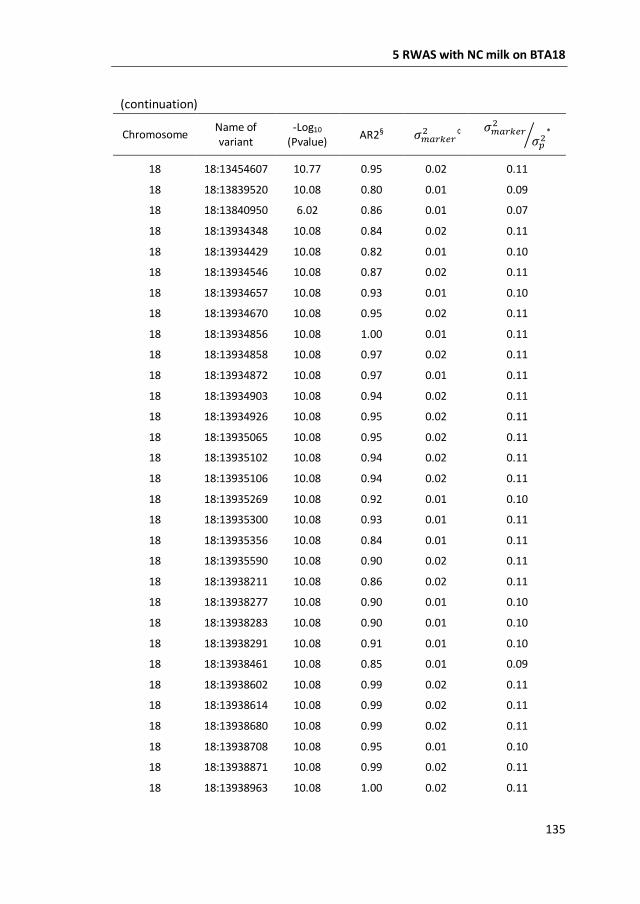
5 RWAS with NC milk on BTA18
135
(continuation)
Chromosome Name of variant
-Log10
(Pvalue) AR2§ 𝜎𝑚𝑎𝑟𝑘𝑒𝑟
2 ¢ 𝜎𝑚𝑎𝑟𝑘𝑒𝑟
2
𝜎𝑝2⁄ *
18 18:13454607 10.77 0.95 0.02 0.11
18 18:13839520 10.08 0.80 0.01 0.09
18 18:13840950 6.02 0.86 0.01 0.07
18 18:13934348 10.08 0.84 0.02 0.11
18 18:13934429 10.08 0.82 0.01 0.10
18 18:13934546 10.08 0.87 0.02 0.11
18 18:13934657 10.08 0.93 0.01 0.10
18 18:13934670 10.08 0.95 0.02 0.11
18 18:13934856 10.08 1.00 0.01 0.11
18 18:13934858 10.08 0.97 0.02 0.11
18 18:13934872 10.08 0.97 0.01 0.11
18 18:13934903 10.08 0.94 0.02 0.11
18 18:13934926 10.08 0.95 0.02 0.11
18 18:13935065 10.08 0.95 0.02 0.11
18 18:13935102 10.08 0.94 0.02 0.11
18 18:13935106 10.08 0.94 0.02 0.11
18 18:13935269 10.08 0.92 0.01 0.10
18 18:13935300 10.08 0.93 0.01 0.11
18 18:13935356 10.08 0.84 0.01 0.11
18 18:13935590 10.08 0.90 0.02 0.11
18 18:13938211 10.08 0.86 0.02 0.11
18 18:13938277 10.08 0.90 0.01 0.10
18 18:13938283 10.08 0.90 0.01 0.10
18 18:13938291 10.08 0.91 0.01 0.10
18 18:13938461 10.08 0.85 0.01 0.09
18 18:13938602 10.08 0.99 0.02 0.11
18 18:13938614 10.08 0.99 0.02 0.11
18 18:13938680 10.08 0.99 0.02 0.11
18 18:13938708 10.08 0.95 0.01 0.10
18 18:13938871 10.08 0.99 0.02 0.11
18 18:13938963 10.08 1.00 0.02 0.11
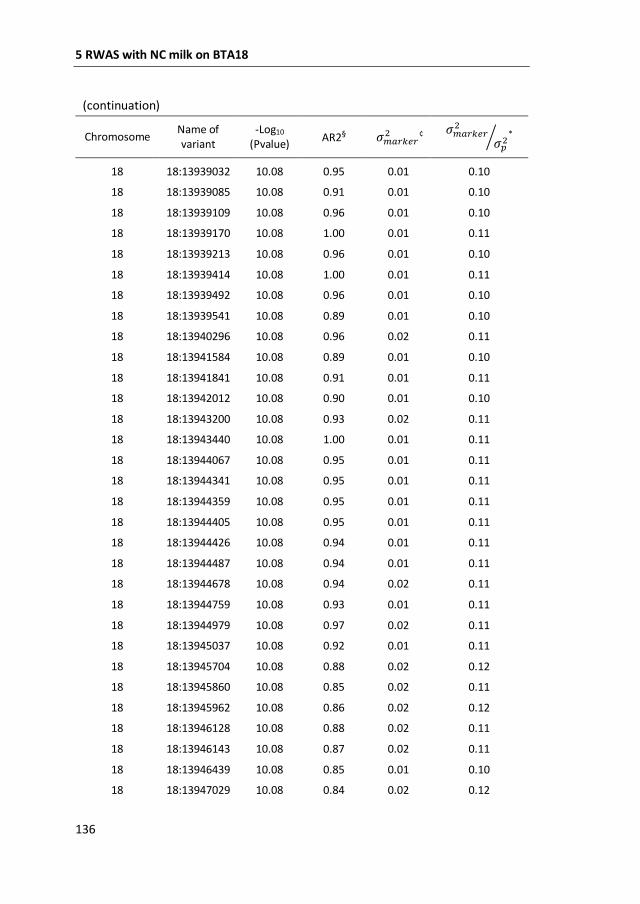
5 RWAS with NC milk on BTA18
136
(continuation)
Chromosome Name of variant
-Log10
(Pvalue) AR2§ 𝜎𝑚𝑎𝑟𝑘𝑒𝑟
2 ¢ 𝜎𝑚𝑎𝑟𝑘𝑒𝑟
2
𝜎𝑝2⁄ *
18 18:13939032 10.08 0.95 0.01 0.10
18 18:13939085 10.08 0.91 0.01 0.10
18 18:13939109 10.08 0.96 0.01 0.10
18 18:13939170 10.08 1.00 0.01 0.11
18 18:13939213 10.08 0.96 0.01 0.10
18 18:13939414 10.08 1.00 0.01 0.11
18 18:13939492 10.08 0.96 0.01 0.10
18 18:13939541 10.08 0.89 0.01 0.10
18 18:13940296 10.08 0.96 0.02 0.11
18 18:13941584 10.08 0.89 0.01 0.10
18 18:13941841 10.08 0.91 0.01 0.11
18 18:13942012 10.08 0.90 0.01 0.10
18 18:13943200 10.08 0.93 0.02 0.11
18 18:13943440 10.08 1.00 0.01 0.11
18 18:13944067 10.08 0.95 0.01 0.11
18 18:13944341 10.08 0.95 0.01 0.11
18 18:13944359 10.08 0.95 0.01 0.11
18 18:13944405 10.08 0.95 0.01 0.11
18 18:13944426 10.08 0.94 0.01 0.11
18 18:13944487 10.08 0.94 0.01 0.11
18 18:13944678 10.08 0.94 0.02 0.11
18 18:13944759 10.08 0.93 0.01 0.11
18 18:13944979 10.08 0.97 0.02 0.11
18 18:13945037 10.08 0.92 0.01 0.11
18 18:13945704 10.08 0.88 0.02 0.12
18 18:13945860 10.08 0.85 0.02 0.11
18 18:13945962 10.08 0.86 0.02 0.12
18 18:13946128 10.08 0.88 0.02 0.11
18 18:13946143 10.08 0.87 0.02 0.11
18 18:13946439 10.08 0.85 0.01 0.10
18 18:13947029 10.08 0.84 0.02 0.12
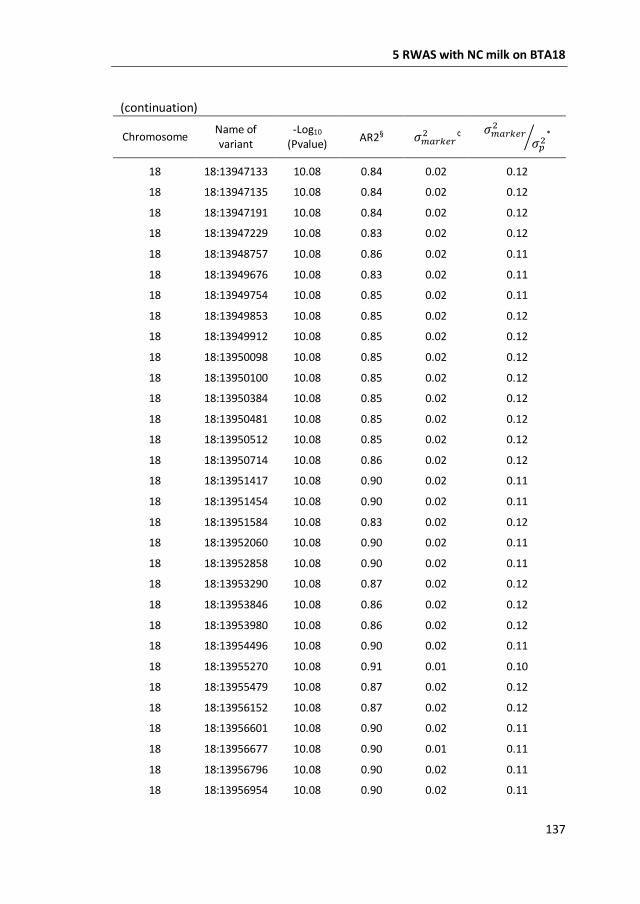
5 RWAS with NC milk on BTA18
137
(continuation)
Chromosome Name of variant
-Log10
(Pvalue) AR2§ 𝜎𝑚𝑎𝑟𝑘𝑒𝑟
2 ¢ 𝜎𝑚𝑎𝑟𝑘𝑒𝑟
2
𝜎𝑝2⁄ *
18 18:13947133 10.08 0.84 0.02 0.12
18 18:13947135 10.08 0.84 0.02 0.12
18 18:13947191 10.08 0.84 0.02 0.12
18 18:13947229 10.08 0.83 0.02 0.12
18 18:13948757 10.08 0.86 0.02 0.11
18 18:13949676 10.08 0.83 0.02 0.11
18 18:13949754 10.08 0.85 0.02 0.11
18 18:13949853 10.08 0.85 0.02 0.12
18 18:13949912 10.08 0.85 0.02 0.12
18 18:13950098 10.08 0.85 0.02 0.12
18 18:13950100 10.08 0.85 0.02 0.12
18 18:13950384 10.08 0.85 0.02 0.12
18 18:13950481 10.08 0.85 0.02 0.12
18 18:13950512 10.08 0.85 0.02 0.12
18 18:13950714 10.08 0.86 0.02 0.12
18 18:13951417 10.08 0.90 0.02 0.11
18 18:13951454 10.08 0.90 0.02 0.11
18 18:13951584 10.08 0.83 0.02 0.12
18 18:13952060 10.08 0.90 0.02 0.11
18 18:13952858 10.08 0.90 0.02 0.11
18 18:13953290 10.08 0.87 0.02 0.12
18 18:13953846 10.08 0.86 0.02 0.12
18 18:13953980 10.08 0.86 0.02 0.12
18 18:13954496 10.08 0.90 0.02 0.11
18 18:13955270 10.08 0.91 0.01 0.10
18 18:13955479 10.08 0.87 0.02 0.12
18 18:13956152 10.08 0.87 0.02 0.12
18 18:13956601 10.08 0.90 0.02 0.11
18 18:13956677 10.08 0.90 0.01 0.11
18 18:13956796 10.08 0.90 0.02 0.11
18 18:13956954 10.08 0.90 0.02 0.11
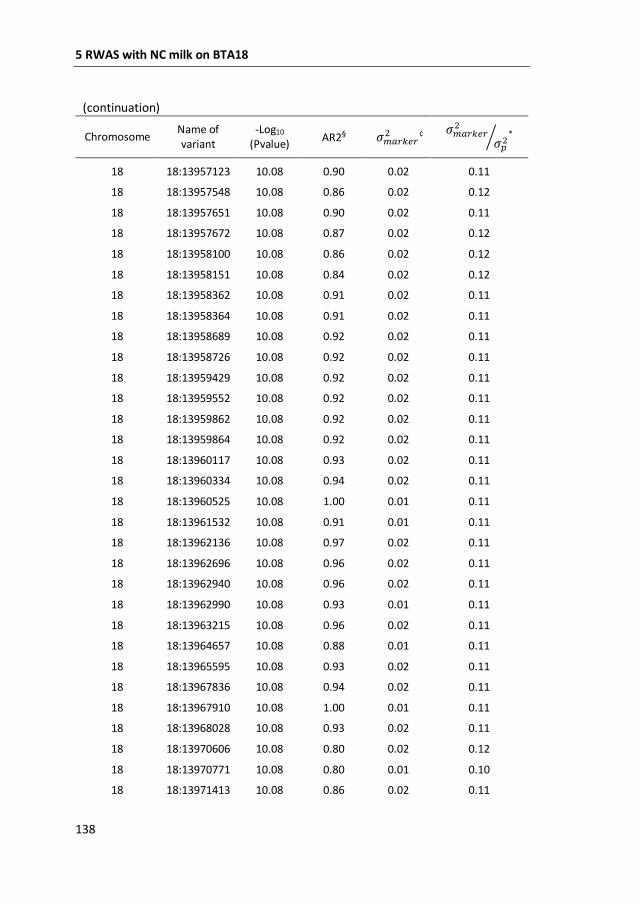
5 RWAS with NC milk on BTA18
138
(continuation)
Chromosome Name of variant
-Log10
(Pvalue) AR2§ 𝜎𝑚𝑎𝑟𝑘𝑒𝑟
2 ¢ 𝜎𝑚𝑎𝑟𝑘𝑒𝑟
2
𝜎𝑝2⁄ *
18 18:13957123 10.08 0.90 0.02 0.11
18 18:13957548 10.08 0.86 0.02 0.12
18 18:13957651 10.08 0.90 0.02 0.11
18 18:13957672 10.08 0.87 0.02 0.12
18 18:13958100 10.08 0.86 0.02 0.12
18 18:13958151 10.08 0.84 0.02 0.12
18 18:13958362 10.08 0.91 0.02 0.11
18 18:13958364 10.08 0.91 0.02 0.11
18 18:13958689 10.08 0.92 0.02 0.11
18 18:13958726 10.08 0.92 0.02 0.11
18 18:13959429 10.08 0.92 0.02 0.11
18 18:13959552 10.08 0.92 0.02 0.11
18 18:13959862 10.08 0.92 0.02 0.11
18 18:13959864 10.08 0.92 0.02 0.11
18 18:13960117 10.08 0.93 0.02 0.11
18 18:13960334 10.08 0.94 0.02 0.11
18 18:13960525 10.08 1.00 0.01 0.11
18 18:13961532 10.08 0.91 0.01 0.11
18 18:13962136 10.08 0.97 0.02 0.11
18 18:13962696 10.08 0.96 0.02 0.11
18 18:13962940 10.08 0.96 0.02 0.11
18 18:13962990 10.08 0.93 0.01 0.11
18 18:13963215 10.08 0.96 0.02 0.11
18 18:13964657 10.08 0.88 0.01 0.11
18 18:13965595 10.08 0.93 0.02 0.11
18 18:13967836 10.08 0.94 0.02 0.11
18 18:13967910 10.08 1.00 0.01 0.11
18 18:13968028 10.08 0.93 0.02 0.11
18 18:13970606 10.08 0.80 0.02 0.12
18 18:13970771 10.08 0.80 0.01 0.10
18 18:13971413 10.08 0.86 0.02 0.11
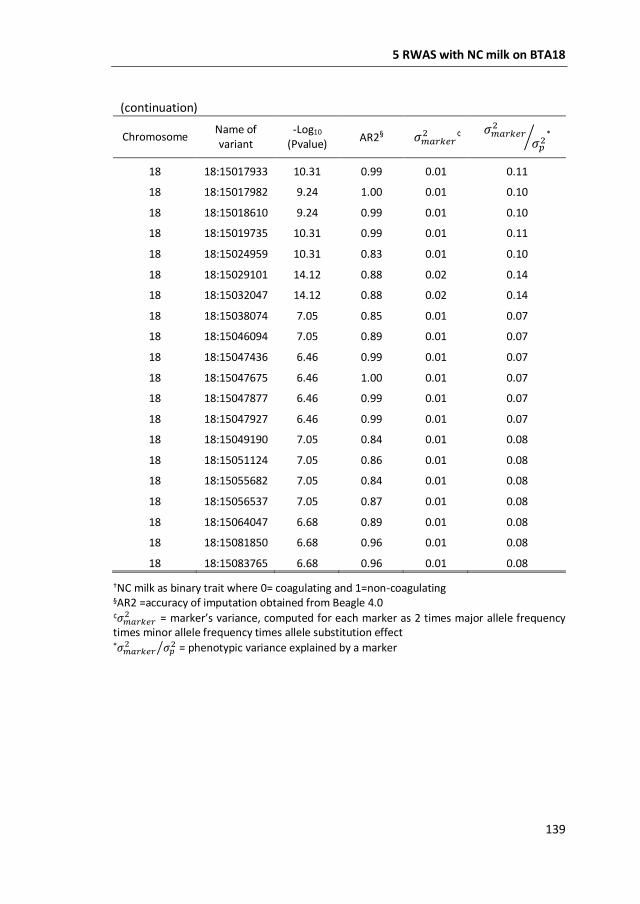
5 RWAS with NC milk on BTA18
139
(continuation)
Chromosome Name of variant
-Log10
(Pvalue) AR2§ 𝜎𝑚𝑎𝑟𝑘𝑒𝑟
2 ¢ 𝜎𝑚𝑎𝑟𝑘𝑒𝑟
2
𝜎𝑝2⁄ *
18 18:15017933 10.31 0.99 0.01 0.11
18 18:15017982 9.24 1.00 0.01 0.10
18 18:15018610 9.24 0.99 0.01 0.10
18 18:15019735 10.31 0.99 0.01 0.11
18 18:15024959 10.31 0.83 0.01 0.10
18 18:15029101 14.12 0.88 0.02 0.14
18 18:15032047 14.12 0.88 0.02 0.14
18 18:15038074 7.05 0.85 0.01 0.07
18 18:15046094 7.05 0.89 0.01 0.07
18 18:15047436 6.46 0.99 0.01 0.07
18 18:15047675 6.46 1.00 0.01 0.07
18 18:15047877 6.46 0.99 0.01 0.07
18 18:15047927 6.46 0.99 0.01 0.07
18 18:15049190 7.05 0.84 0.01 0.08
18 18:15051124 7.05 0.86 0.01 0.08
18 18:15055682 7.05 0.84 0.01 0.08
18 18:15056537 7.05 0.87 0.01 0.08
18 18:15064047 6.68 0.89 0.01 0.08
18 18:15081850 6.68 0.96 0.01 0.08
18 18:15083765 6.68 0.96 0.01 0.08
†NC milk as binary trait where 0= coagulating and 1=non-coagulating §AR2 =accuracy of imputation obtained from Beagle 4.0
¢𝜎𝑚𝑎𝑟𝑘𝑒𝑟2 = marker’s variance, computed for each marker as 2 times major allele frequency
times minor allele frequency times allele substitution effect
*𝜎𝑚𝑎𝑟𝑘𝑒𝑟2 𝜎𝑝
2⁄ = phenotypic variance explained by a marker


6
General discussion

6 General Discussion
143
6.1 Introduction
In this thesis, the genetic backgrounds of milk-fat composition and of non-
coagulation of milk have been explored. Firstly, for bovine milk-fat composition, we
investigated how genetic differences between winter and summer milk contributed
to the observed phenotypic differences (Chapter 2). We showed that winter and
summer milk-fat composition are largely genetically the same trait. Phenotypic
differences between winter and summer milk-fat composition were mainly caused
by dietary differences rather than by genetic differences. Furthermore, for most fatty
acids (FA), no significant DGAT1 and SCD1 by season interactions were found. In case
significant interactions were present, we showed that these interactions were likely
caused by the scaling of the genotype effects. Secondly, for bovine milk-fat
composition and for non-coagulation (NC) of milk, we explored their genetic
variation by means of genome-wide association studies (GWAS). Through GWAS (in
Chapters 3 and 5), we characterized promising chromosomal regions associated with
the phenotypes. Subsequently, in Chapters 3, 4 and 5, these promising regions were
fine-mapped with imputed 777k SNP genotypes and imputed sequence data. The
fine-mappings refined the location of quantitative trait loci (QTL), and contributed
to the identification of candidate genes for these QTLs.
In this general discussion, I discuss different perspectives regarding gene discovery
in cattle. I had the opportunity to use a substantial number of genetic markers for
gene discovery, and encountered some challenges. Therefore, firstly, I discuss the
challenges with respect to high-density genotypes for gene discovery. Secondly, I
discuss future possibilities to expand gene discovery studies, and I propose some
alternatives to identify causal variants underlying complex traits in cattle.
6.2 Challenges with high-density genotypes for gene
discovery
The two main challenges for gene discovery were the imputation to high-density
genotypes and the annotation of the cattle genome. In general, the attainment of
high-density genotypes (and herein, I include sequences as high-density genotypes)
requires several expensive steps, such as genotyping DNA samples in laboratories,
using bioinformatic tools plus programmers to handle the huge data sets, and storing
data. In recent years in cattle, imputation has been used to reduce costs and to
accelerate the attainment of these high-density genotypes for large groups of
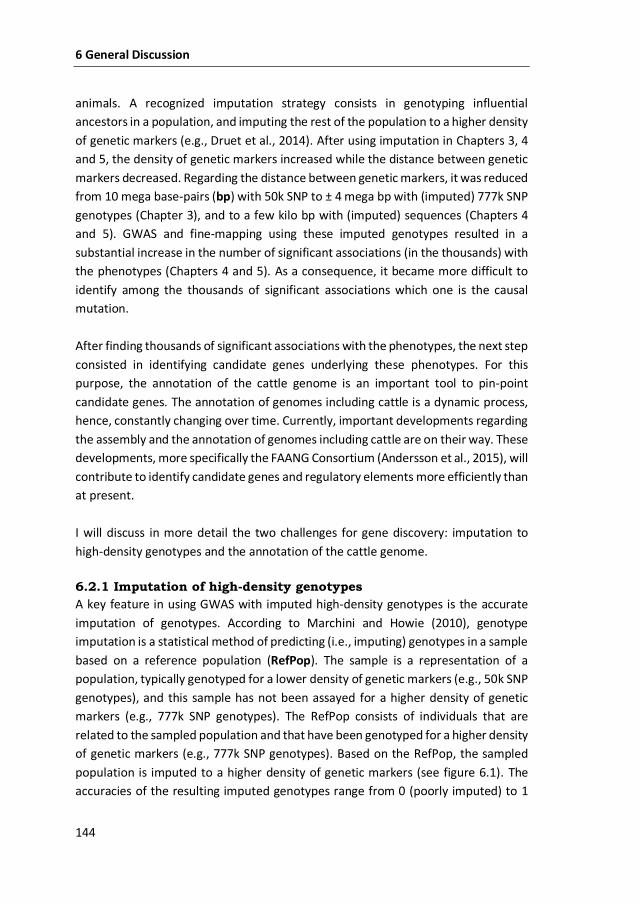
6 General Discussion
144
animals. A recognized imputation strategy consists in genotyping influential
ancestors in a population, and imputing the rest of the population to a higher density
of genetic markers (e.g., Druet et al., 2014). After using imputation in Chapters 3, 4
and 5, the density of genetic markers increased while the distance between genetic
markers decreased. Regarding the distance between genetic markers, it was reduced
from 10 mega base-pairs (bp) with 50k SNP to ± 4 mega bp with (imputed) 777k SNP
genotypes (Chapter 3), and to a few kilo bp with (imputed) sequences (Chapters 4
and 5). GWAS and fine-mapping using these imputed genotypes resulted in a
substantial increase in the number of significant associations (in the thousands) with
the phenotypes (Chapters 4 and 5). As a consequence, it became more difficult to
identify among the thousands of significant associations which one is the causal
mutation.
After finding thousands of significant associations with the phenotypes, the next step
consisted in identifying candidate genes underlying these phenotypes. For this
purpose, the annotation of the cattle genome is an important tool to pin-point
candidate genes. The annotation of genomes including cattle is a dynamic process,
hence, constantly changing over time. Currently, important developments regarding
the assembly and the annotation of genomes including cattle are on their way. These
developments, more specifically the FAANG Consortium (Andersson et al., 2015), will
contribute to identify candidate genes and regulatory elements more efficiently than
at present.
I will discuss in more detail the two challenges for gene discovery: imputation to
high-density genotypes and the annotation of the cattle genome.
6.2.1 Imputation of high-density genotypes
A key feature in using GWAS with imputed high-density genotypes is the accurate
imputation of genotypes. According to Marchini and Howie (2010), genotype
imputation is a statistical method of predicting (i.e., imputing) genotypes in a sample
based on a reference population (RefPop). The sample is a representation of a
population, typically genotyped for a lower density of genetic markers (e.g., 50k SNP
genotypes), and this sample has not been assayed for a higher density of genetic
markers (e.g., 777k SNP genotypes). The RefPop consists of individuals that are
related to the sampled population and that have been genotyped for a higher density
of genetic markers (e.g., 777k SNP genotypes). Based on the RefPop, the sampled
population is imputed to a higher density of genetic markers (see figure 6.1). The
accuracies of the resulting imputed genotypes range from 0 (poorly imputed) to 1
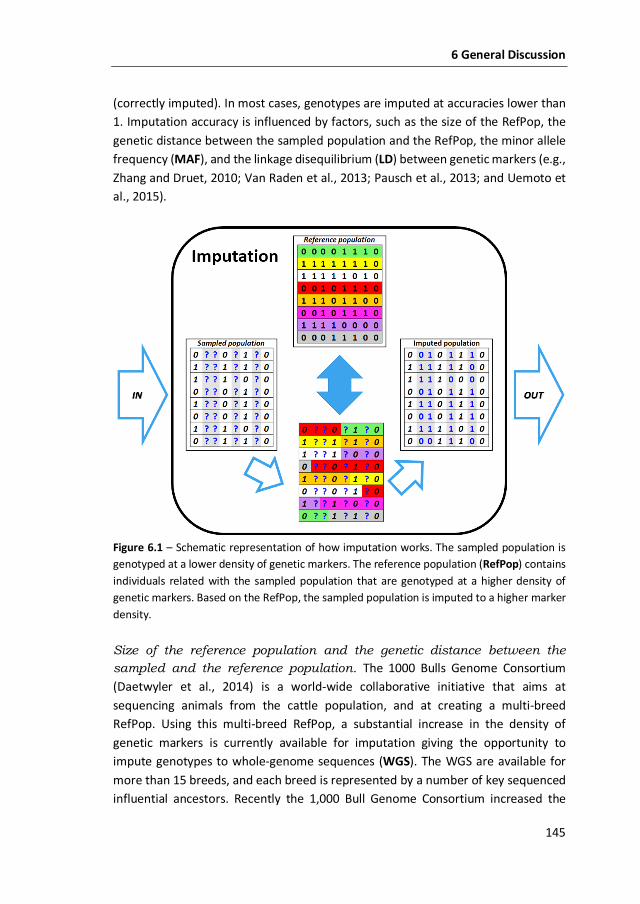
6 General Discussion
145
(correctly imputed). In most cases, genotypes are imputed at accuracies lower than
1. Imputation accuracy is influenced by factors, such as the size of the RefPop, the
genetic distance between the sampled population and the RefPop, the minor allele
frequency (MAF), and the linkage disequilibrium (LD) between genetic markers (e.g.,
Zhang and Druet, 2010; Van Raden et al., 2013; Pausch et al., 2013; and Uemoto et
al., 2015).
Figure 6.1 – Schematic representation of how imputation works. The sampled population is
genotyped at a lower density of genetic markers. The reference population (RefPop) contains
individuals related with the sampled population that are genotyped at a higher density of
genetic markers. Based on the RefPop, the sampled population is imputed to a higher marker
density.
Size of the reference population and the genetic distance between the
sampled and the reference population. The 1000 Bulls Genome Consortium
(Daetwyler et al., 2014) is a world-wide collaborative initiative that aims at
sequencing animals from the cattle population, and at creating a multi-breed
RefPop. Using this multi-breed RefPop, a substantial increase in the density of
genetic markers is currently available for imputation giving the opportunity to
impute genotypes to whole-genome sequences (WGS). The WGS are available for
more than 15 breeds, and each breed is represented by a number of key sequenced
influential ancestors. Recently the 1,000 Bull Genome Consortium increased the
6 General Discussion
146
number of sequenced animals, and has included sequences of influential cows in this
multi-breed RefPop. By accounting for influential cows and bulls, more relationships
between the sampled population and the RefPop are considered. Consequently, the
accuracy of imputed genotypes should increase.In this multi-breed RefPop, the
Hostein-Friesian (HF) breed is well represented with 450 HF sequenced ancestors
(the latest Run5). In contrast, the Swedish Red (SR) breed is represented with 16 SR
sequenced ancestors and the Finnish Ayrshire (FAY) breed is represented with 17
FAY sequenced ancestors.
In Chapter 4, we aimed at imputing the imputed 777k SNP genotypes of HF cows to
WGS level. Therefore, only HF sequences (N=450) from the multi-breed RefPop were
used to impute genotypes to WGS level, and due to the size of the RefPop, at high
accuracies (> 0.9). In contrast, in Chapter 5, a rather limited number (N=33) of
sequenced SR and FAY were available for the imputation to WGS level. The 33
sequenced SR and FAY bulls have a large impact in the SR cow population. To make
the best possible use of the multi-breed RefPop, our approach in Chapter 5 consisted
of imputing a variant three times, each time with a different RefPop (33 SR and FAY
sequences, 284 dairy-breeds sequences, and 429 beef- and dairy-breeds sequences).
Subsequently, we were able to impute the genotypes of SR cow population to WGS.
Based on the findings of Chapter 5, the accuracies of imputed genotypes in smaller
breeds (e.g., SR) will only improve if the addition of sequenced animals in the multi-
breed RefPop is tailored toward smaller breeds.
Minor Allele Frequency. According to Daetwyler et al. (2014) imputation errors for
low MAF (< 0.05) genetic markers are high when imputing a cow population to WGS
level. If an allele segregates at low MAF, then there is a relatively small number of
sequenced ancestors in the RefPop carrying this low MAF variant. Hence, the
imputation of this low MAF variant in the sampled population will be more difficult,
and there is a high probability that this variant will be poorly imputed. Therefore, the
interpretation of GWAS findings needs more caution when significant associations
concern imputed low MAF variants. GWAS detects QTL with genetic markers at a
certain power. This detection occurs under the assumption that a genetic marker is
correlated with the QTL. MAF at the QTL is an important determinant of power
because the heritability of a QTL is directly proportional to the frequencies of the
alleles at the QTL locus (Sham and Purcell, 2014). In this context, the power of
detecting a QTL segregating at low MAF is low. In addition, the power of detecting
this QTL becomes even lower when using imputed low MAF variants, especially if
their imputation accuracy is low. If a variant has low MAF, low imputation accuracy
6 General Discussion
147
and is strongly correlated with the QTL, this implies that QTL effect size needs to be
sufficiently high to be detected by GWAS. In Chapter 4, the 8 strongest associations
with milk-fat composition segregate at a MAF=0.44. For the findings of Chapter 4,
the imputation accuracy of low MAF variants was not an important issue. In Chapter
5, the 3 strongest associations with NC milk were segregating at a MAF=0.03 and
explained more than 10% of the phenotypic variance. This strong signal, which was
first detected in SR cows genotyped for 777k SNP genotypes, can be explained by a
large QTL effect of more 1 phenotypic standard deviation. This illustrates that rare
variants should not by default be considered sequencing errors and therefore
excluded from GWAS.
The inclusion of pedigree information can improve the accuracy of imputation of low
MAF genetic markers. This approach focuses on imputing identical-by-descent
genetic markers that segregate from parents to offspring instead of using
information on LD between genetic markers. However, this approach is
computationally time-consuming. Some examples of softwares with implemented
algorithm that account for simple pedigree information (i.e., duos and trios) are
Beagle, fastPHASE, and Fimpute. Recently, a method that imputes SNP combining LD
and identical-by-descent information has been proposed (iBLUP, Yang et al., 2014).
In general, accounting for pedigree information is expected to impute low MAF
genetic markers more accurately than without pedigree information.
Linkage disequilibrium. The non-random association between two loci is defined
as LD. Two sampling processes cause LD to arise in a population according to Hill and
Weir (1980). First, the sampling of gametes from parents to offspring, and this
process depends on the effective population size. Second, the number of individuals
sampled from a finite population. In the case of cattle, crossbreeding, mutation, drift,
and small population size are events that create LD. Imputation uses LD present in
the RefPop to impute the genotypes of the sampled population. One of the problems
is that LD can exist between an (imputed) marker and QTL in one family but not in
other families (Goddard and Hayes, 2012). For Chapters 3 and 4, the sires of the
sampled population of HF cows were included in the RefPop, and in Chapter 5, this
was also the case with the 33 sequenced ancestors of SR and FAY. However, in
Chapter 5, we also used two other imputation scenarios that included different
breeds, for which the sequenced SR and FAY have no common ancestors. In this case,
LD in SR and FAY breeds can be different than LD in other breeds. LD across-breeds
is expected to be smaller than LD within a breed because more recombination events
separate individuals from different breeds (De Roos et al., 2008). Therefore,
6 General Discussion
148
imputation accuracy is probably influenced by the differences in LD within- and
across- breeds, which might result in lower imputation accuracies for genotypes in
small breeds compared with large breeds.
In both cases, for milk-fat composition and for NC milk, imputation to high-density
genotypes was challenging. The factors affecting imputation and their consequences
on the interpretation of GWAS and fine-mapping results cannot be solved with the
data at hand. Only through validation studies it will be possible to confirm the
findings reported in this thesis. Validation studies would further help to ascertain if
the strongest associations identified in Chapters 3, 4 and 5, and thus the most likely
candidate genes, can be confirmed. If a validation study would be based on multiple
breeds and these associations persist across breeds, the genetic markers are likely
to be very close to the QTL, because of the limited extent of LD across-breeds (e.g.,
De Roos et al., 2008; Goddard and Hayes, 2012). However, we cannot exclude the
possibility that the QTL might not segregate in other breeds (Goddard and Hayes,
2012). Nonetheless, by attempting to validate our associations, it would lead us
closer to the identification of the causal variants for the QTL identified in Chapters 3,
4 and 5.
6.2.2 Annotation of the cattle genome
The second major challenge encountered in Chapters 3, 4 and 5 was the limited,
hence, incomplete annotation of the cattle genome. The cattle genome contains the
genetic information organized in chromosomes, which include the genes for the
protein coding regions, and the DNA sequences for the non-protein coding regions.
The genome annotation attaches to these genes and DNA sequences the biological
information of an organism (Stein, 2001). In Chapter 3, the QTL region located
between 29 and 34 mega bp on BTA17 contained 29 genes. A total of 18 out of the
29 genes had not been annotated yet. Among these 18 genes, the non-annotated
LOC515517 was the gene closest to our strongest association on BTA17, and was
pointed out as a suggestive candidate gene in Chapter 3. LOC515517 was assigned
this symbol because the investigation of all orthologs for this gene was incomplete.
Orthologs are genes in different species that evolved from a common ancestral gene
by speciation. The full determination of orthologs assist in the annotation of a gene.
Two years later, this QTL region was re-analyzed with imputed sequences (Chapter
4). In these two years, the non-annotated LOC515517 has been annotated as the
LARP1B gene in the cattle genome. In Chapter 4, the LARP1B gene became our
primary candidate gene because 6 out of the 8 strongest associations were located
in this gene. In two years, a clear improvement has been made on the annotation of
6 General Discussion
149
genes and their biological functions, at least for BTA17. The lesson taken from
Chapters 3 and 4 is that the limited annotation of the cattle genome should not be a
reason to discard suggestive candidate genes.
The annotation of the genome of domesticated animal species is a slow and complex
process. In the last decade, the annotation of the genome of domesticated animal
species has been extrapolated from the annotation of the human genome, through
actions such as the encyclopedia of DNA elements (ENCODE). ENCODE is a global
initiative to identify functional variants in high-quality sequences of humans. It is the
aim of ENCODE to improve the annotation of structural and regulatory variants as
well as non-coding genes in humans. The ENCODE initiative has been very successful
in humans, and was expanded to other species like mouse (Shen et al., 2012; Yue et
al., 2014). However, the idea of extrapolating gene-expression and its regulation
network from human to mouse was not successful because of substantial divergence
between these two species (Yue et al., 2014). This genetic diversity between species
contributes to the complexity and the slow annotation of the domesticated animal
species genomes.
The genetic diversity of domesticated animal species is the focus of the recently
started functional annotation of the animal genomes (FAANG) consortium. The
FAANG consortium aims at identifying all functional elements in the genome of
domesticated animal species (Andersson et al., 2015), and involves a collaboration
between several research groups worldwide. In a first stage, many different tissues
across domesticated animal species will be sampled, such as skeletal muscle, adipose
and liver tissues, and in addition, samples of reproductive, immune and nervous
systems will be collected. These sampled tissues and systems are necessary to
perform functional studies. These studies enable the prediction of the function
encoded in sequences. Andersson et al. (2015) argue that filling the genotype-to-
phenotype gap requires functional genome annotation of species with substantial
phenotype information. The FAANG initiative aims at improving the annotation of
the genome of domesticated animal species by creating standardized protocols for
sampling, storing, and analyzing the information among the participating research
groups (Clarke et al., 2015). The samples will be analyzed by some of the following
protocols: transcribed loci (using RNA sequencing), chromatin accessibility and
architecture (the link between gene-expression and nuclear organization of cells),
and histone modification marks (to identify regulatory elements; Andersson et al.,
2015). In a second stage, other tissues will be sampled, such as rumen tissues from
ruminant species, mammary tissue from mammals, among others (Andersson et al.,
6 General Discussion
150
2015). As pointed out by Zhou et al. (2015), the genomes of chicken, cow and pig
have been assembled, but limited information is available on the enhancers,
promoters, and other elements of the genome of these species. The identification of
these elements and their biological roles will improve the annotation of these three
genomes. I expect that it will take some time (> 5 years) to gather and analyze all this
information, in order to produce a comprehensive and better annotated genome for
each of the domesticated animal species, including cattle. Therefore, the
identification of candidate genes will be more efficient in the near future.
6.3 From GWAS to causal variants
The typical outcomes of GWAS are large chromosomal regions, and many
polymorphisms that are statistically associated with phenotypes. In Chapter 3, GWAS
with imputed 777k SNP genotypes identified a QTL region covering 5 mega bp that
contained 29 genes. Subsequent fine-mapping with imputed sequences (Chapter 4)
refined the QTL region and reduced the number of candidate genes from 29 to 14.
Although this characterization of chromosomal regions associated with our
phenotypes (Chapters 3, 4 and 5) was successful, what remains unclear from GWAS
and subsequent fine-mapping is whether a polymorphism is the actual causal
variant. For complex traits, such as bovine milk composition, it would be interesting
to identify causal variants. It would increase biological knowledge, and specifically,
help to understand how these causal variants influence our phenotypes.
Consequently, it would be possible to predict potential pleiotropic effects on non-
(routinely) recorded traits with consequences on the selection of the next-
generation of cows. According to Falconer and Mackay (1996), quantitative genetic
theory will become more realistic when the numbers and the properties of genes are
known because it would improve the methods to studying complex traits. If this is
the case, we need to find causal variants to confirm that the identified genes
influence the phenotypes. Therefore, in this section, I propose several possibilities
to identify causal variants. In more detail, I explore the possibilities of using targeted
gene-expression studies, gene-editing, and gene knockouts in livestock to identify
causal variants.
6.3.1 Exploring alternatives to identify causal variants
As indicated by Das et al. (2011), the causality of a polymorphism is difficult to be
determined by GWAS and fine-mapping. In practice, when GWAS and fine-mapping
identify significant associations with the phenotype, the associated variants can be
located within protein-coding regions. When this happens, the gene is declared a
6 General Discussion
151
candidate gene and the polymorphism might be a causal variant. If the variant is
causal, it is possible to predict changes to the encoded-protein, thus predicting
functional changes to the phenotype (e.g., Freedman et al., 2011). Consequences on
the phenotype can be straightforward for monogenic diseases in humans, such as
the Duchenne muscular dystrophy. This disease is caused by large deletions of one
or more exon(s) in the dystrophin gene causing severe muscular dystrophy in about
60% of male infants (Hoffman et al., 1987). However, consequences on complex
traits are more difficult to interpret than for monogenic diseases. In Chapters 4 and
5, many associations with milk FA composition and with NC milk were identified
within and outside protein-coding regions. In Chapters 4 and 5, the LARP1B and the
VPS35 genes were nominated as positional candidate genes, after these genes were
found expressed in bovine mammary tissue (Bionaz et al., 2012), and during different
stages of lactation in humans (Lemay et al., 2013). Figure 6.2 (A and B) illustrates the
strongest associations with milk FA composition in the LARP1B gene and with NC
milk in the VPS35 gene. Although we limited the number of candidate genes to only
2, the interpretation of possible functional changes of these 2 genes on milk FA
composition and on NC milk are unclear.
Furthermore, two other complications arise. First, the strongest identified
associations with milk FA composition and with NC milk are in strong LD (figure 6.2-
A and B). Hence, we cannot disentangle which of these associations would promote
changes to the phenotypes. Second, some of these correlated associations are intron
variants in these candidate genes (figures 6.2 A and B). Particularly in livestock
species, there might be a bias in declaring candidate genes toward well–annotated
genes (Taȿan et al., 2015) because non-coding protein regions still need to be
characterized (Andersson et al., 2015). Consequently, associations identified in non-
protein coding regions are often ignored. To understand the possible changes to the
phenotypes, I hypothesize that the causal variants are among one of the significant
associations with the LARP1B and VPS35 genes. If this is the case, this hypothesis can
serve as research question for further studies, such as targeted gene-expression
studies.
6.3.2 Targeted gene-expression studies
Gene-expression is the process by which functional gene products are formed. Gene
products have been studied in many species including mice, rats and humans, and in
different cell types (e.g., de Koning et al., 2007; Civelek and Lusis, 2014). Gene
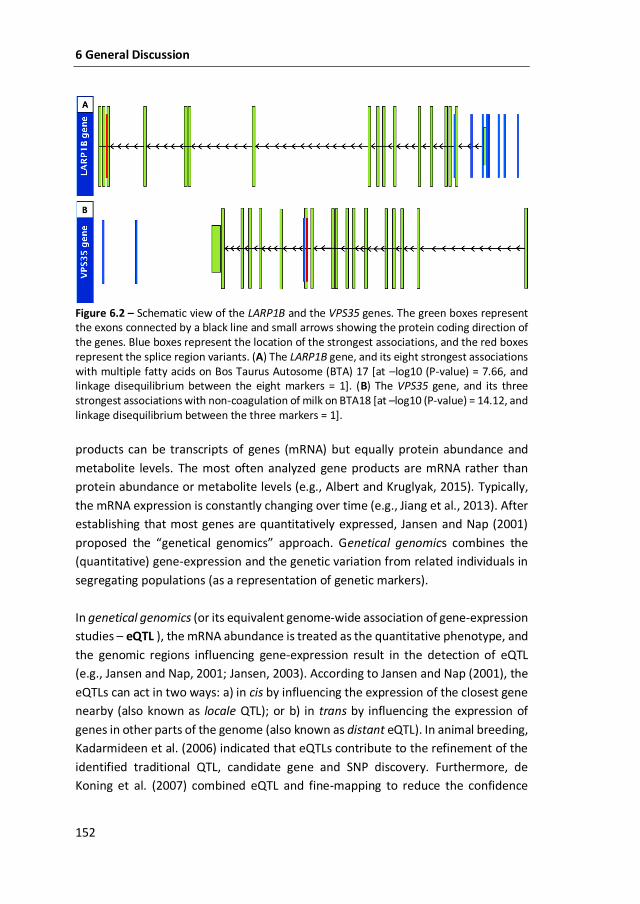
6 General Discussion
152
Figure 6.2 – Schematic view of the LARP1B and the VPS35 genes. The green boxes represent the exons connected by a black line and small arrows showing the protein coding direction of the genes. Blue boxes represent the location of the strongest associations, and the red boxes represent the splice region variants. (A) The LARP1B gene, and its eight strongest associations with multiple fatty acids on Bos Taurus Autosome (BTA) 17 [at –log10 (P-value) = 7.66, and linkage disequilibrium between the eight markers = 1]. (B) The VPS35 gene, and its three strongest associations with non-coagulation of milk on BTA18 [at –log10 (P-value) = 14.12, and linkage disequilibrium between the three markers = 1].
products can be transcripts of genes (mRNA) but equally protein abundance and
metabolite levels. The most often analyzed gene products are mRNA rather than
protein abundance or metabolite levels (e.g., Albert and Kruglyak, 2015). Typically,
the mRNA expression is constantly changing over time (e.g., Jiang et al., 2013). After
establishing that most genes are quantitatively expressed, Jansen and Nap (2001)
proposed the “genetical genomics” approach. Genetical genomics combines the
(quantitative) gene-expression and the genetic variation from related individuals in
segregating populations (as a representation of genetic markers).
In genetical genomics (or its equivalent genome-wide association of gene-expression
studies – eQTL ), the mRNA abundance is treated as the quantitative phenotype, and
the genomic regions influencing gene-expression result in the detection of eQTL
(e.g., Jansen and Nap, 2001; Jansen, 2003). According to Jansen and Nap (2001), the
eQTLs can act in two ways: a) in cis by influencing the expression of the closest gene
nearby (also known as locale QTL); or b) in trans by influencing the expression of
genes in other parts of the genome (also known as distant eQTL). In animal breeding,
Kadarmideen et al. (2006) indicated that eQTLs contribute to the refinement of the
identified traditional QTL, candidate gene and SNP discovery. Furthermore, de
Koning et al. (2007) combined eQTL and fine-mapping to reduce the confidence
6 General Discussion
153
interval of functional trait loci in poultry. As a consequence, the chromosomal region
under investigation and the number of candidate genes were reduced. This targeted
eQTL approach allows the identification of cis-acting eQTL rather than trans-eQTL.
Targeted eQTL are especially important when there is no obvious biological reason
supporting a significant association with the phenotypes. The reason being that eQTL
can provide further insights into the function, regulation and pathways of genes
underlying a complex trait (e.g., Jansen, 2003; de Koning et al., 2007; Lowe and
Reddy, 2015). For instance, the LARP1B and the VPS35 genes have not been
associated to bovine milk composition before the present thesis. Further insights
into the function, regulation and pathways would clarify the functional role of the
LARP1B and the VPS35 genes in relation to their respective phenotypes.
According to Hassan and Saeij (2014), if a genetic variant influences the mRNA
abundance of a nearby gene, which in turn modulates a complex trait, this cis-eQTL
can co-localize with the QTL identified by traditional GWAS. When a common
chromosomal region identified by cis-eQTL co-localizes with the QTL from traditional
GWAS at the same genetic variant, it provide strong evidence that the underlying
candidate gene is correctly identified (Schadt et al., 2005). In addition, this co-
localization (if observed) would suggest that the causal variant is associated with the
gene-expression and with the phenotype simultaneously (Schadt et al., 2005). Based
on these findings, targeted eQTL focused on the expression of the LARP1B and the
VPS35 genes would help confirm that the candidate genes were correctly assigned,
and help determine the most likely causal variants for these phenotypes.
Nonetheless, targeted eQTL on the expression of LARP1B and VPS35 genes can point
out variants in regulatory elements. In humans, some studies have suggested that
multiple correlated associations can influence the activity of multiple enhancers
(regulatory elements). When the activity of these regulatory elements is
coordinated, their effects can alter gene-expression (e.g., Corrandin et al., 2014;
Lowe and Reddy, 2015). Albert and Kruglyak (2015) indicated that many
polymorphisms identified in human GWAS are over-represented in regulatory
regions. In addition, Parikshak et al. (2015) indicated that these regulatory elements
are located in non-protein coding regions of the genome. In our case, multiple
significant associations with the LARP1B and the VPS35 genes are in strong LD and
are located in non-protein coding regions (figure 6.2 A and B). I would investigate if
the co-localization of the cis-eQTL with the QTL from a traditional GWAS would occur
at one of the variants located in the non-protein coding regions of LARP1B and VPS35
genes. If this would happen, the position of the regulatory element showing the cis-
6 General Discussion
154
eQTL effect could be accurately determined based on the sequence data. One
limitation, however, is that the regulatory elements of the cattle genome are not
annotated yet. In summary, it is possible that the significant associations in strong
LD for the LARP1B and the VPS35 genes are regulatory elements.
A step further from targeted eQTL would be to investigate the proteins encoded by
the genes directly. This approach would be interesting because of a highly regulated
mechanism known as alternative splicing (Hassan and Saeij, 2014). Through this
process, introns and exons in genes are re-arranged creating the opportunity for
mRNA to synthesize different protein variants (isoforms) that may have different
cellular functions (Wang et al., 2008). This process occurs at a specific site known as
splice junction (or splice variant). Interestingly, the LARP1B and the VPS35 genes
contain splice-region variants (figure 6.2 A and B). Using RNA-sequencing
technology, it is possible to distinguish between the transcript abundance from
alternative splicing and regular transcript abundance (Trapnell et al., 2010).
According to Wickramasinghe et al. (2014), RNA-sequencing technology is the
method of choice for studying RNA transcripts, and this technology shows great
ability in studying allele-specific expression and non-coding RNA. In a further study,
it might be worth investigating the different isoforms resulting from the splice-
variants found in the LARP1B and the VPS35 genes with RNA-sequencing.
The contribution of RNA-sequencing is not limited to studying gene-expression. RNA-
sequencing can also be used for SNP and gene discovery, as well as gene ontology
and pathway analysis. The RNA-sequencing approach is different than genetical
genomics. Using RNA-sequencing and gene-expression of bovine milk retrieved from
somatic cells, the different isoforms of interesting genes are tested for associations
directly with the phenotypes. When a significant association is identified, if this
association is identified within the isoforms, then SNP and candidate genes can be
identified. Several studies have used this approach to identify candidate genes
associated with bovine milk composition (e.g., Cánovas et al.,2010; Wickramasinghe
et al., 2012; and Cánovas et al., 2013). It is important to acknowledge the substantial
contribution of the RNA sequencing technology for studying bovine milk
composition.
6.3.3 Gene-editing and gene knockouts in livestock
A complementary approach to gene-expression studies is targeting genes in mouse
models. Targeting a gene in mouse models means to disrupt a specific gene in the
genome of a mouse, thus creating a knockout mouse for that specific gene. In the
6 General Discussion
155
last 50 years, gene targeting by means of homologous recombination combined with
the refinement of protocols (e.g., microinjection of purified DNA, electroporation,
and positive selection enrichments) and the subsequent transmission to mouse
germlines have led to knockout more than 7,000 genes in transgenic mouse models
(Capecchi, 2005). The “principles for introducing specific gene modifications in mice
by the use of embryonic stem cells” have made Dr. Capecchi, Dr. Evans and Dr. Oliver
winners of the Nobel Prizes in Physiology or Medicine in 2007. This refinement of
methods and protocols has substantially accelerated the biological knowledge of
genes, and has led to the development of gene-editing.
Gene-editing. Although gene targeting has required the introgression of exogenous
DNA into the genome of a mouse, gene-editing with site-specific nucleases is an
alternative to target specific genes without the introgression of exogenous DNA (e.g.,
Capecchi, 2005; Carlson et al., 2014). According to Cappechi (2005), the use of these
site-specific nucleases allow to target a series of alleles in the same gene, thus
manipulating any chosen allele in mouse models. There are at least three known site-
specific nucleases: the zinc-finger nucleases (Kim et al., 1996), the transcription
activator-like effector nucleases (Boch et al., 2009; Moscou and Bogdanove, 2009),
and the clustered regularly interspaced short palindromic repeats associated
endonuclease cas9 (CRISPR/Cas9; Cong et al., 2013; Mali et al., 2013). My focus will
be on the most recent, the CRISPR/Cas9 system.
The CRISPR/Cas9 system is part of the protection mechanism against viruses that has
been identified from the immune system of bacteria. The CRISPR/Cas9 was first
described by Cong et al. (2013) and by Mali et al. (2013), as a RNA-guided site-specific
DNA cleavage technique. According to Cong et al. (2013), the Cas9 nuclease can
direct short RNAs to induce precise cleavage at DNA loci, facilitating the knockout of
targeted genes. Initially, the CRISPR/Cas9 technique was intended to understand
genes, their regulation and their biological functions because of its easiness of
programmability and of usage (Cong et al., 2013). Gene-editing has the potential of
targeting a single gene as well as multiple genes simultaneously. Gene-editing can
be used to obtain cell-specific knockdown (one copy of the gene inactivated) or
knockout (both copies of a gene inactivated) as well as gene specific mutations using
rodent models (Shalem et al., 2015). For this reason, it has become an important ally
to study genes underlying complex traits, such as bovine milk composition. For
bovine milk composition, gene-editing has the potential to accelerate knowledge
discovery (about genes, their biological function, and their influence at the
6 General Discussion
156
phenotypic level). On this regard, gene-editing is substantially contributing to
improve the annotation of domesticated animal species genomes, including cattle.
Gene knockouts in livestock. With gene-editing, some gene knockouts in livestock
have been successfully produced. With the zinc-finger nuclease, the knockout of the
PPARγ gene in pigs (Yang et al., 2011) and of the β-LG gene in cattle (Yu et al., 2011)
was possible. However, Carlson et al. (2014) indicated that proprietary algorithms
were responsible for impeding the use of this zinc-finger nuclease. With the
transcription activator-like effector nucleases, Proudfoot et al. (2015) reports the
gene-editing of the myostatin (MSTS) gene in sheep and in cattle with successful
results. In the future, using gene-editing with the CRISPR/Cas9 technique, knockout
cows are likely to be produced. The resulting (functional) changes will be
interpretable at the phenotypic level. It would be useful to understand the extent of
changes from one or multiple genes on bovine milk composition, but also on the
important physiologic changes faced by cows at parturition. For phenotypes such as
bovine milk, I foresee in the coming future gene knockout cows being widely
produced, kept and challenged in a commercial environment. I can also foresee the
knockdown of one or multiple alleles in the LARP1B and the VPS35 genes, as well as
the knockout of these genes in gene-edited cows.
While gene-editing with the CRISPR/Cas9 technique will become widely used in the
future, functional changes in bovine milk composition can already be studied using
a lactating bovine mammary epithelial cell (bMEC) model. Zhao et al. (2010) and
Jedrzejczak and Szatkowska (2014) indicated that bMEC models are suitable to study
bovine milk synthesis. Instead of using bMEC sampled from tissues through biopsy,
Boutinaud et al. (2002) isolated mRNA directly from somatic cells, which are
naturally released in milk during lactation. Using RNA sequencing, Medrano et al.
(2010) and Cánovas et al. (2014), both concluded the viability of using milk somatic
cells and milk fat globules to study mammary gland expression. For bovine milk
composition, functional changes to be phenotypes can already be assessed by
studying the gene-expression of LARP1B and the VPS35 genes directly from milk
samples. In addition, it is also a possibility to target one or multiple alleles in a single
gene (e.g., the LARP1B and the VPS35 genes) using bMEC models.
In summary, there are many opportunities to transform the significant associations
identified from traditional GWAS and fine-mapping in research questions for further
studies. All the approaches discussed in this section would, a priori, help to identify
causal variants underlying complex traits such as bovine milk composition, and a
6 General Discussion
157
posteriori, help to understand the function of genes and their biological role in
bovine milk.
6.4 References
Albert, F. W., and Kruglyak, L. 2015. The role of regulatory variation in complex traits
and disease. Nature Rev Genet 16: 197-212.
L. Andersson, Archibald, A. L., Bottema, C.D., Brauning, R., Burgess, S.C., Burt, D.W.,
et al. 2015. Coordinated international action to accelerate genome-to-phenome
with FAANG, the Functional Annotation of Animal Genomes project. Genome Biol
16:57
Bionaz, M., K. Periasamy, S. L. Rodriguez-Zas, W. L. Hurley, and Loor, J. J. 2012. A
novel dynamic impact approach DIA for functional analysis of time-course omics
studies: validation using the bovine mammary transcriptome. PLoS ONE.7: e32455
Boch, J., Scholze, H., Schornack, S., Landgraf, A., Hahn, S., Kay, S., Lahaye, T.,
Nickstadt, A., and Bonas, U. 2009. Breaking the code of DNA binding specificity of
TAL-type III effectors. Science 326: 1509–12. doi:10.1126/science.1178811.
Boutinaud, M., and Jammes, H. 2002. Potential uses of milk epithelial cells: a review.
Reprod Nutr Dev 42:133-147.
Cánovas, A., Rincon, G., Islas-Trejo, A., Wickramasinghe, S., and Medrano, J. F. 2010.
SNP discovery in the bovine milk transcriptome using RNA-Seq technology. Mamm
genome 21: 592-598.
Cánovas, A., Rincón, G., Islas-Trejo, A., Jimenez-Flores, R., Laubscher, A., and
Medrano, J. F. 2013. RNA sequencing to study gene expression and single
nucleotide polymorphism variation associated with citrate content in cow milk. J
Dairy Sci 96: 2637-2648.
Cánovas, A., Rincón, G., Bevilacqua, C., Islas-Trejo, A., Brenaut, P., Hovey, R. C., et al.
2014. Comparison of five different RNA sources to examine the lactating bovine
mammary gland transcriptome using RNA-Sequencing. Sci Rep 4.
doi:10.1038/srep05297
Capecchi, M. R. 2005. Gene targeting in mice: functional analysis of the mammalian
genome for the twenty-first century. Nat Rev Genet 6: 507-512.
Carlson, D. F., Tan, W., Hackett, P. B., and Fahrenkrug, S. C. 2014. Editing livestock
genomes with site-specific nucleases. Reprod Fertil Dev 26: 74-82.
Civelek, M., and Lusis, A. J. 2014. Systems genetics approaches to understand
complex traits. Nat Rev Genet 15:34-48.
6 General Discussion
158
Clarke, L, Archibald, A. L.,Flicek, P., Burt, D. ,Hume, D., Vernimmen, D., et al. 2015.
The functional annotation of animal genomes, data standards, annotation and
sharing. In Plant and Animal Genome XXIII Conference. Plant and Animal Genome.
Cong, L., Ran, F. A., Cox, D., Lin, S., Barretto, R., Habib, N., et al. 2013. Multiplex
genome engineering using CRISPR/Cas systems. Science 339:819-823.
Corradin, O., Saiakhova, A., Akhtar-Zaidi, B., Myeroff, L., Willis, J., Cowper-Sal lari, R.,
et al. 2014. Combinatorial effects of multiple enhancer variants in linkage
disequilibrium dictate levels of gene expression to confer susceptibility to common
traits. Genome Res 24: 1–13.
Daetwyler, H. D., Capitan, A., Pausch, H., Stothard, P., van Binsbergen, R., Brøndum,
R. F., et al. 2014. Whole-genome sequencing of 234 bulls facilitates mapping of
monogenic and complex traits in cattle. Nat Genet 46, 858–865.
doi:10.1038/ng.3034.
Das, S. K., and Sharma, N. K. 2014. Expression quantitative trait analyses to identify
causal genetic variants for type 2 diabetes susceptibility. World J Diabetes 5:97–
114.
de Koning, D. J., Cabrera, C. P., and Haley, C. S. 2007. Genetical genomics: combining
gene expression with marker genotypes in poultry. Poultry Sci 86:1501-1509.
De Roos, A. P. W., Hayes, B. J., Spelman, R. J., and Goddard, M. E. 2008. Linkage
disequilibrium and persistence of phase in Holstein–Friesian, Jersey and Angus
cattle. Genetics 179:1503-1512.
Druet, T., Macleod, I. M., and Hayes, B. J. 2014. Toward genomic prediction from
whole-genome sequence data: impact of sequencing design on genotype
imputation and accuracy of predictions. Heredity 112:39–47.
Falconer, D. S., and Mackay, T. F. C. 1996. Introduction to Quantitative Genetics.
Correlated characters: genotype-environment interaction. Pages 321-325. Fourth
edition, ed. Longman Greens, Harlow, Essex, UK.
Freedman, M. L., Monteiro, A. N., Gayther, S. A., Coetzee, G. A., Risch, A., Plass, C.,
et al. 2011. Principles for the post-GWAS functional characterization of cancer risk
loci. Nat genet 43:513-518.
Goddard, M. E., and Hayes, B. J. 2012. Bovine Genomics. Linkage disequilibrium in
cattle. Pages 192-210. Ed. John Wiley and Sons, Inc. West Sussex, UK.
Hassan, M. A., and Saeij, J. P. 2014. Incorporating alternative splicing and mRNA
editing into the genetic analysis of complex traits. BioEssays, 36:1032-1040.
Weir, B. S., and Hill, W. G. 1980. Effect of mating structure on variation in linkage
disequilibrium. Genetics 95:477-488.
Hoffman, E. P., Brown, R. H., and Kunkel, L. M. 1987. Dystrophin: the protein product
of the Duchenne muscular dystrophy locus. Cell, 51:919-928.
6 General Discussion
159
Jansen, R. C., and Nap, J. P. 2001. Genetical genomics: the added value from
segregation. Trends Genet 17:388-391.
Jansen, R. C. 2003. Studying complex biological systems using multifactorial
perturbation. Nat Rev Genet 4: 145-151.
Jedrzejczak, M., and Szatkowska, I. 2014. Bovine mammary epithelial cell cultures for
the study of mammary gland functions. In Vitro Cell Dev Biol Anim 50: 389-398.
Jiang, J., Cui, W., Vongsangnak, W., Hu, G., and Shen, B. 2013. Post genome-wide
association studies functional characterization of prostate cancer risk loci. BMC
genomics 14:S9.
Kadarmideen, H. N., von Rohr, P., and L. L. Janss. 2006. From genetical genomics to
systems genetics: potential applications in quantitative genomics and animal
breeding. Mamm Genome 17:548-564.
Kim, Y. G., Cha, J., and Chandrasegaran, S. 1996. Hybrid restriction enzymes: zinc
finger fusions to Fok I cleavage domain. Proc. Natl Acad. Sci. USA 93:1156–1160.
doi:10.1073/PNAS.93.3.1156
Lemay, D. G., Ballard, O. A., Hughes, M. A., Morrow, A. L., Horseman, N. D., and
Nommsen-Rivers, L. A. 2013. RNA sequencing of the human milk fat layer
transcriptome reveals distinct gene expression profiles at three stages of lactation.
PloS one 8:e67531.
Lowe, W. L., and Reddy, T. E. 2015. Genomic approaches for understanding the
genetics of complex disease. Genom Res 25:1432-1441.
Mali, P., Yang, L., Esvelt, K. M., Aach, J., Guell, M., DiCarlo, J. E., et al. 2013. RNA-
guided human genome engineering via Cas9. Science 339:823-826.
Marchini, J., and Howie, B. 2010. Genotype imputation for genome-wide association
studies. Nat Rev Genet 11:499-511.
Medrano, J.F., Rincon, G.,and Islas-Trejo, A. 2010. Comparative analysis of bovine
milk and mammary gland transcriptome using RNA-Seq. In: 9th World congress on
genetics applied to livestock production, Leipzig, Germany, August 1-6, 2010,
Paper no 0852.
Moscou, M. J., and Bogdanove, A. J. 2009. A simple cipher governs DNA recognition
by TAL effectors. Science 326:1501-1501.
Parikshak, N. N., Gandal, M. J., and Geschwind, D. H. 2015. Systems biology and gene
networks in neurodevelopmental and neurodegenerative disorders. Nat Rev
Genet 16:441-458.
Pausch, H., Aigner, B., Emmerling, R., Edel, C., Götz, K. U., and Fries, R. 2013.
Imputation of high-density genotypes in the Fleckvieh cattle population. Genet Sel
Evol 45:10-1186.
6 General Discussion
160
Proudfoot, C., Carlson, D. F., Huddart, R., Long, C. R., Pryor, J. H., and King, T. J., et al.
2015. Genome edited sheep and cattle. Transgenic Res 24:147-153.
Schadt, E. E., Lamb, J., Yang, X., Zhu, J., Edwards, S., GuhaThakurta, D., et al. 2005.
An integrative genomics approach to infer causal associations between gene
expression and disease. Nat Genet 37:710-717.
Shalem, O., Sanjana, N. E., and Zhang, F. 2015. High-throughput functional genomics
using CRISPR-Cas9. Nat Rev Genet 16:299-311.
Sham, P. C., and Purcell, S. M. 2014. Statistical power and significance testing in large-
scale genetic studies. Nat Rev Genet, 15:335-346.
Shen, Y., Yue, F., McCleary, D. F., Ye, Z., Edsall, L., Kuan, S., et al. 2012. A map of the
cis-regulatory sequences in the mouse genome. Nature 488:116-120.
Stein, L. 2001. Genome annotation: from sequence to biology. Nat Rev Genet 2:493-
503.
Taşan, M., Musso, G., Hao, T., Vidal, M., MacRae, C. A., and Roth, F. P. 2015. Selecting
causal genes from genome-wide association studies via functionally coherent
subnetworks. Nat Methods, 12:154-159.
Trapnell, C., Williams, B. A., Pertea, G., Mortazavi, A., Kwan, G., van Baren, M. J., et
al. 2010. Transcript assembly and abundance estimation from RNA-Seq reveals
thousands of new transcripts and switching among isoforms. Nat Biotechnol 28:
511–515.
Uemoto, Y., Sasaki, S., Sugimoto, Y., and Watanabe, T. 2015. Accuracy of high‐density
genotype imputation in Japanese Black cattle. Anim Genet 46: 388-394.
VanRaden, P. M., Null, D. J., Sargolzaei, M., Wiggans, G. R., Tooker, M. E., Cole, J. B.,
et al. 2013. Genomic imputation and evaluation using high-density Holstein
genotypes. J Dairy Sci 96:668-678.
Wang, E. T., Sandberg, R., Luo, S., Khrebtukova, I., Zhang, L., Mayr, C., et al. 2008.
Alternative isoform regulation in human tissue transcriptomes. Nature 456:470-
476.
Wickramasinghe, S., Rincon, G., Islas-Trejo, A., and J. F. Medrano. 2012.
Transcriptional profiling of bovine milk using RNA sequencing. BMC genomics 13:1
Wickramasinghe, S., Cánovas, A., Rincón, G., and Medrano, J. F. 2014. RNA-
sequencing: a tool to explore new frontiers in animal genetics. Livest Sci, 166: 206-
216.
Yang, D., Yang, H., Li, W., Zhao, B., Ouyang, Z., Liu, Z., et al. 2011. Generation of PPARγ
mono-allelic knockout pigs via zinc-finger nucleases and nuclear transfer cloning.
Cell Res 21:979.
6 General Discussion
161
Yang, Y., Wang, Q., Chen, Q., Liao, R., Zhang, X., Yang, H., et al. 2014. A new genotype
imputation method with tolerance to high missing rate and rare variants. PloS one
9:e101025.
Yu, S., Luo, J., Song, Z., Ding, F., Dai, Y., and Li, N. 2011. Highly efficient modification
of beta-lactoglobulin (BLG) gene via zinc-finger nucleases in cattle. Cell Res.
21:1638–1640. doi:10.1038/CR.2011.153
Yue, F., Cheng, Y., Breschi, A., Vierstra, J., Wu, W., Ryba, T, et al. 2014. A comparative
encyclopedia of DNA elements in the mouse genome. Nature 515:355-364.
Zhang, Z., and Druet, T. 2010. Marker imputation with low-density marker panels in
Dutch Holstein cattle. J Dairy Sci 93:5487-5494.
Zhao, K., Liu, H. Y., Zhou, M. M., and Liu, J. X. 2010. Establishment and
characterization of a lactating bovine mammary epithelial cell model for the study
of milk synthesis. Cell Biol Int 34: 717-721.
Zhou, H., Ross, P.J., Korf, I., Delany, M. E., Cheng, H., Medrano, J. F., et al. 2015.
Annotation of functional regulatory elements in livestock species. In ADSA-ASAS
2015 Midwest Meeting. Asas.


Summary

Summary
165
Summary
The present thesis aims at unraveling the genetic background of bovine milk
composition by finding genes associated with milk-fat composition and non-
coagulation of milk. The fine-mapping was realized by increasing the number of
genotypes analyzed in the targeted chromosomal regions. This allowed to increase
the resolution for these genomic regions and pin-point candidate genes associated
with bovine milk composition.
In Chapter 2, we analyzed milk fat composition in winter and summer and estimated
in both seasons’ genetic parameters, the effects of acyl-CoA: diacylglycerol
acyltransferase1 (DGAT1) K232A and stearoyl-CoA desaturase1 (SCD1) A293V
polymorphisms. Furthermore, we estimated genetic correlations between winter
and summer milk fatty acids and tested for genotype by season interactions of
DGAT1 K232A and SCD1 A293V polymorphisms. Phenotypes consisted of gas
chromatography measurements (%w/%w) of seventeen individual fatty acids (C4:0
to C18:0, C10:1 to C18:1cis-9, C18:1trans-11, C18:2cis-9,trans-11 (CLA), C18:2cis-
9,12 and C18:3cis-9,12,15), groups of fatty acids (saturated FA (SFA), unsaturated FA
(UFA) and the ratio SFA to UFA), and six unsaturation indices (C10 index – CLAindex).
These phenotypes were available for 2,001 cows in winter and in summer milk
samples. We showed that the genetic correlations between winter and summer milk
FA were very high, and these indicated that milk-fat composition in winter and in
summer can largely be considered as genetically the same trait. We showed that
effects of DGAT1 K232A and SCD1 A293V polymorphism were very similar in winter
and in summer milk for most FA. At last, we tested for genotype by season
interactions, and demonstrated significant DGAT1 K232A by season interaction for
some FA. A SCD1 A293V by season interaction was only found for C18:1trans-11.
These genotype by season interactions were due to scaling of genotype effects.
In Chapter 3 and in Chapter 4, we used a subset of the fatty acids analyzed in Chapter
2. This subset consisted of six individual FA (C4:0 - C14:0) were available for winter
and for summer milk samples.
In Chapter 3, a quantitative trait locus (QTL) on Bos taurus autosome (BTA) 17
explaining a large proportion of the genetic variation in de novo synthesized milk FA
was fine-mapped. This QTL region has been identified previously using 50k SNP
genotypes. We fine-mapped this QTL region with imputed 777k single nucleotide
polymorphism (SNP) genotypes to identify candidate genes associated with milk FA
composition. Single-SNP analyses showed that several SNP in a region located
Summary
166
between 29.0 and 34.0 mega base-pairs were in strong association with C6:0, C8:0,
and C10:0. This region was further characterized based on haplotypes, and these
analyses suggested the presence of one causal variant. Although many genes are
present in this QTL region on BTA17, the strongest association was found close to
the progesterone receptor membrane component 2 (PGRMC2) gene. This gene has
not been associated previously to milk FA composition.
In Chapter 4, the chromosomal region associated with de novo synthesized milk FA
on BTA17 was further re-fined using imputed whole-genome sequences (WGS). WGS
were available for 450 Holstein-Friesian (HF) animals (the 1000 bull genome
consortium (Run5) and 45 HF sequenced animals from the Dutch Milk Genomics
Initiative. Based on these 495 HF sequences, all cows were imputed from (imputed)
777k SNP genotypes to sequence level. Single-marker analyses identified many
significant associations (in the thousands) with c6:0, c8:0, c10:0, c12:0 and c14:0.
Most significant associations were detected in a region covering 5 mega base-pairs
and in this region a total of 14 genes could be identified. Six out of the 8 SNP that
showed the strongest associations were located in the LA ribonucleoprotein domain
family, member 1B (LARP1B) gene. This candidate gene has not been associated with
milk-fat composition before.
In Chapter 5, firstly, we performed a GWAS using 777k SNP genotypes to identify the
most promising genomic regions associated with non-coagulation (NC) of milk in
Swedish Red cows. Secondly, we fine-mapped the most promising genomic region
using imputed sequences. Individual morning milk samples were available for the
382 Swedish Red cows that were also genotyped using a 777k SNP array. Using 429
sequences from the 1000 bull genome consortium (Run 3), all cows were imputed
from 777k to sequence level. Single-marker analyses identified 14 associations with
NC milk in a 7 mega base-pairs region on BTA18. For this region, our strongest
association explained almost 34% of the genetic variation in NC milk. Haplotypes
were built, genetically differentiated by means of a phylogenetic tree, and tested in
phenotype-genotype association studies. A candidate gene is the vacuolar protein
sorting 35 homolog, mRNA (VPS35) gene, for which one of our strongest association
is an intron SNP in this gene. The VPS35 gene belongs to the mammary gene sets of
pre-parturient and of lactating cows, and has not been associated to milk
composition yet.
In Chapter 6, the general discussion is presented. Firstly, I discuss the imputation to
high-density genotypes and the annotation of the cattle genome. I discuss what
Summary
167
imputation is, the factors which affect imputation accuracy, and the consequences
of using imputed genotypes for GWAS and fine-mapping studies. Regarding the
annotation of the cattle genome, I discuss the major difficulties in finding candidate
genes with the current annotation, and discuss future initiatives that will contribute
for a better annotation of genomes in the future.
Secondly, the future possibilities to expand gene discovery are discussed. In this
section, the discussion starts with the importance of identifying causal variants
underlying complex traits. The discussion continues by exploring possibilities, such
as targeted gene-expression studies, eQTL, gene editing and knockout cows, to
identify the causal variants underlying complex traits


Training and education

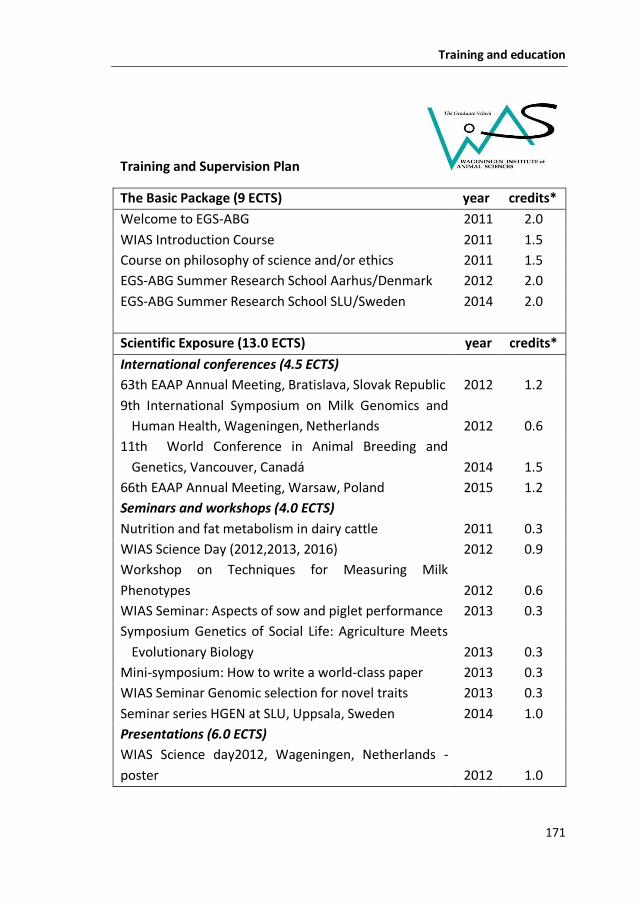
Training and education
171
Training and Supervision Plan
The Basic Package (9 ECTS) year credits*
Welcome to EGS-ABG 2011 2.0
WIAS Introduction Course 2011 1.5
Course on philosophy of science and/or ethics 2011 1.5
EGS-ABG Summer Research School Aarhus/Denmark 2012 2.0
EGS-ABG Summer Research School SLU/Sweden 2014 2.0
Scientific Exposure (13.0 ECTS) year credits*
International conferences (4.5 ECTS)
63th EAAP Annual Meeting, Bratislava, Slovak Republic 2012 1.2
9th International Symposium on Milk Genomics and
Human Health, Wageningen, Netherlands 2012 0.6
11th World Conference in Animal Breeding and
Genetics, Vancouver, Canadá 2014 1.5
66th EAAP Annual Meeting, Warsaw, Poland 2015 1.2
Seminars and workshops (4.0 ECTS)
Nutrition and fat metabolism in dairy cattle 2011 0.3
WIAS Science Day (2012,2013, 2016) 2012 0.9
Workshop on Techniques for Measuring Milk
Phenotypes 2012 0.6
WIAS Seminar: Aspects of sow and piglet performance 2013 0.3
Symposium Genetics of Social Life: Agriculture Meets
Evolutionary Biology 2013 0.3
Mini-symposium: How to write a world-class paper 2013 0.3
WIAS Seminar Genomic selection for novel traits 2013 0.3
Seminar series HGEN at SLU, Uppsala, Sweden 2014 1.0
Presentations (6.0 ECTS)
WIAS Science day2012, Wageningen, Netherlands -
poster 2012 1.0
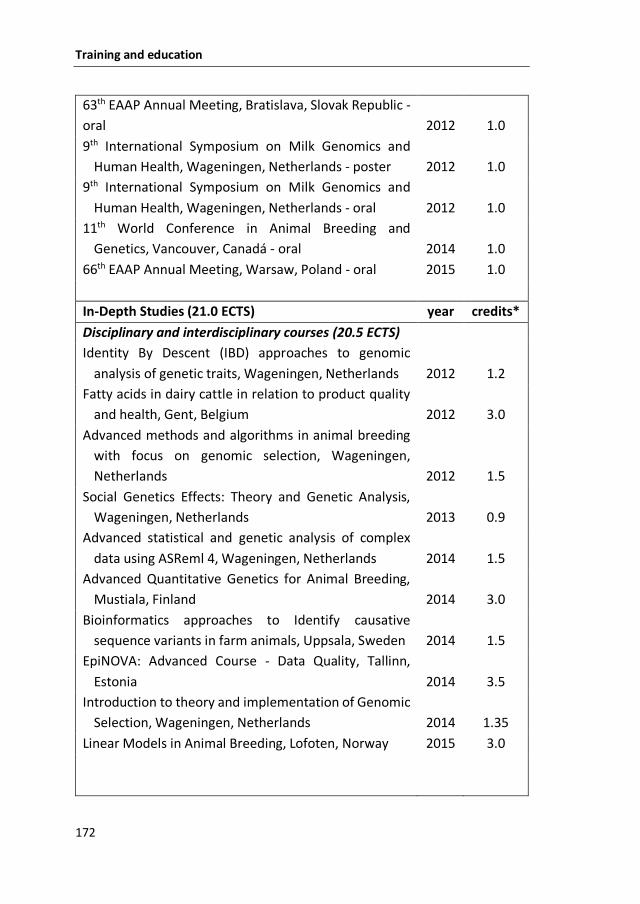
Training and education
172
63th EAAP Annual Meeting, Bratislava, Slovak Republic -
oral 2012 1.0
9th International Symposium on Milk Genomics and
Human Health, Wageningen, Netherlands - poster 2012 1.0
9th International Symposium on Milk Genomics and
Human Health, Wageningen, Netherlands - oral 2012 1.0
11th World Conference in Animal Breeding and
Genetics, Vancouver, Canadá - oral 2014 1.0
66th EAAP Annual Meeting, Warsaw, Poland - oral 2015 1.0
In-Depth Studies (21.0 ECTS) year credits*
Disciplinary and interdisciplinary courses (20.5 ECTS)
Identity By Descent (IBD) approaches to genomic
analysis of genetic traits, Wageningen, Netherlands 2012 1.2
Fatty acids in dairy cattle in relation to product quality
and health, Gent, Belgium 2012 3.0
Advanced methods and algorithms in animal breeding
with focus on genomic selection, Wageningen,
Netherlands 2012 1.5
Social Genetics Effects: Theory and Genetic Analysis,
Wageningen, Netherlands 2013 0.9
Advanced statistical and genetic analysis of complex
data using ASReml 4, Wageningen, Netherlands 2014 1.5
Advanced Quantitative Genetics for Animal Breeding,
Mustiala, Finland 2014 3.0
Bioinformatics approaches to Identify causative
sequence variants in farm animals, Uppsala, Sweden 2014 1.5
EpiNOVA: Advanced Course - Data Quality, Tallinn,
Estonia 2014 3.5
Introduction to theory and implementation of Genomic
Selection, Wageningen, Netherlands 2014 1.35
Linear Models in Animal Breeding, Lofoten, Norway 2015 3.0
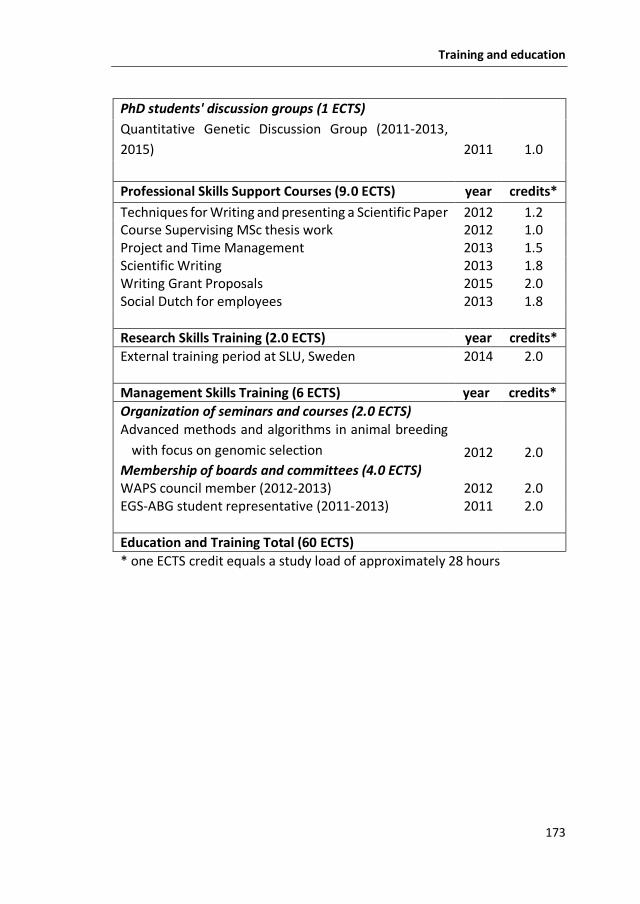
Training and education
173
PhD students' discussion groups (1 ECTS)
Quantitative Genetic Discussion Group (2011-2013,
2015) 2011 1.0
Professional Skills Support Courses (9.0 ECTS) year credits*
Techniques for Writing and presenting a Scientific Paper 2012 1.2 Course Supervising MSc thesis work 2012 1.0 Project and Time Management 2013 1.5 Scientific Writing 2013 1.8 Writing Grant Proposals 2015 2.0 Social Dutch for employees 2013 1.8
Research Skills Training (2.0 ECTS) year credits*
External training period at SLU, Sweden 2014 2.0
Management Skills Training (6 ECTS) year credits*
Organization of seminars and courses (2.0 ECTS) Advanced methods and algorithms in animal breeding
with focus on genomic selection 2012 2.0 Membership of boards and committees (4.0 ECTS) WAPS council member (2012-2013) 2012 2.0 EGS-ABG student representative (2011-2013) 2011 2.0
Education and Training Total (60 ECTS)
* one ECTS credit equals a study load of approximately 28 hours


Curriculum vitae

Curriculum vitae
177
About the author
Sandrine Isolde Duchemin is born on the 4th August 1975 in Vendôme, France. When
she was 5 years old, her family emigrated to Brazil. She obtained her first bachelor
in Economic Sciences at Pontifícia Universidade Católica do Rio de Janeiro (PUC-RJ)
in 1998. After a few years, she changed her career orientation and, in 2009, Sandrine
became Doctor in Veterinary Medicine (DVM). Her bachelor thesis was entitled
“Utilização de embriões F1 produzidos in vitro em rebanhos leiteiros comerciais e
em rebanho controlado”. In August 2009, she started the European Masters in
Animal Breeding and Genetics (EM-ABG). This program gave her the opportunity to
stay one year in the Netherlands, and one year in France. During these two years,
she wrote two major theses. The first major thesis was written in the Netherlands,
entitled “Effects of polymorphisms in DGAT1 and SCD1 on milk-fat composition of
summer milk samples”, and the second major thesis was written in France, entitled
“Genomic selection in Lacaune dairy sheep”. In August 2011, she received her
double-degree Masters in Animal Breeding and Genetics. In September 2011, she
started her PhD, which is part of the European Graduate School in Animal Breeding
and Genetics (EGS-ABG). While most of her PhD was done at Wageningen
(Netherlands), she had the opportunity to spend one year at Uppsala (Sweden). The
results of her PhD are presented in this thesis entitled “Mapping and fine-mapping
of genetic factors affecting bovine milk composition.”
Curriculum vitae
178
Peer-reviewed publications
Duchemin, S. I., Colombani, C., Legarra, A., Baloche, G., Larroque, H., Astruc, J.-M.,
Barillet, F., Robert-Granié, C., and E. Manfredi. 2012. Genomic selection in the
French Lacaune dairy sheep breed. J Dairy Sci 95:2723-2733.
Duchemin, S. , H. Bovenhuis, W. M. Stoop, A. C. Bouwman, J. A. M. van Arendonk,
and M. H. P. W. Visker. 2013. Genetic correlation between composition of bovine
milk fat in winter and summer, and DGAT1 and SCD1 by season interactions. J Dairy
Sci 96:592-604.
Duchemin, S. I., Visker, M.H.P.W., Van Arendonk, J.A.M., and Bovenhuis, H. 2014. A
quantitative trait locus on Bos taurus autosome 17 explains a large proportion of
the genetic variation in de novo synthesized milk fatty acids. J Dairy Sci 97: 7276-
7285.
Duchemin, S. I., Glantz, M., de Koning, D-J., Paulsson, M., and W.F. Fikse. 2016.
Identification of QTL on chromosome 18 associated with non-coagulating milk in
Swedish Red cows. Front Genet 7:57. doi: 10.3389/fgene.2016.00057.
Manuscripts in preparation
Duchemin, S. I., Bovenhuis, H., Megens, H-J., Van Arendonk, J. A. M., and M. H. P. W.
Visker. Fine-mapping of BTA17 using imputed sequences for associations with de
novo synthesized fatty acids in bovine milk.
Conference papers
Robert-Granié, C., Duchemin, S., Larroque, H., Baloche, G., Barillet , F., Moreno-
Romieux, C., Legarra, A.,and E. Manfredi. A comparison of various methods for the
computation of genomic breeding values in French Lacaune dairy sheep breed. In:
62th Annual Meeting of the European Federation of Animal Science (EAAP),
Stavanger, Norway in August 2011.
Duchemin, S. I., Bovenhuis, H., Stoop, W. M., Bouwman, A. C., van Arendonk, J. A.
M., and Visker, M. H. P. W. Genetic relation between composition of bovine milk
fat in winter and summer. The 9th International Symposium Milk Genomics and
Human Health, Wageningen, The Netherlands, October 2012.
Curriculum vitae
179
Duchemin, S.I., Visker, M. H. P. W., Van Arendonk, J. A. M., and Bovenhuis, H. Fine-
mapping of a chromosomal region on BTA17 associated with milk-fat composition.
In: 64th Annual Meeting of the European Federation of Animal Science (EAAP),
Nantes, France in August 2013.
Duchemin, S. I., Visker, M. H. P. W., Van Arendonk, J. A. M., and Bovenhuis, H. Fine-
mapping of a candidate region associated with milk-fat composition on Bos taurus
autosome 17. Proceedings of 10th World Congress on Genetics Applied to
Livestock Production (WCGALP), Vancouver, Canadá in August 2014.
Duchemin, S. I., Glantz, M., de Koning, D-J, Paulsson, M., and Fikse, W. F. Fine-
mapping of a QTL region on BTA18 affecting non-coagulating milk in Swedish Red
cows. In: 66th Annual Meeting of the European Federation of Animal Science
(EAAP), Warsaw, Poland in September 2015.
Duchemin, S. I., Glantz, M., de Koning, D-J, Paulsson, M., and Fikse, W. F. Fine-
mapping of non-coagulating milk in Swedish Red cows using sequences. In: IDF
parallel symposia, Dublin, Ireland in April 2016.


Acknowledgements

Acknowledgements
183
Acknowledgements
To God: Thank you for this third opportunity.
To my friends and colleagues: Acknowledgements are always a very difficult task to
write. And throughout this PhD, lots of people have contributed directly and indirectly
to this achievement. I would like to say thank you to each and every one of you who
contributed, but in a different way.
This is the year 2009 and I am decided to make some changes. Yet, I have no idea
what is to come. Guided by my will, this idea grows stronger and stronger inside my
heart. After a few clicks and a directed search on the internet, I find EM-ABG. The
advertisement seem too good to be true. Never mind: I subscribe. The road ahead is
unknown, and one of the most important journeys of my life is about to start.
Exactly three days after I subscribed, I receive an e-mail from the captain of ABGC,
Johan Van Arendonk, asking me if I would like to apply for a scholarship that would
cover my living expenses while on board. I will never forget that I really thought it
was a phishing attempt. After successfully getting the scholarship, I travel to this far
distant new world called the Netherlands. In my luggage, some pieces of clothes and
a heart full of hope and eager for adventure. After 26 hours of travel, I finally arrive
to this beautiful place called Wageningen Bay.
What an exciting first view! Beyond the main deck of ABGC, I can see Forum Building
as the harbor that connects all the other ships. The joy and the excitement are
suddenly cut by the voice of the captain: “You have the opportunity and the privilege
to be part of this diverse and multicultural team. Enjoy the training, the trip, and
have fun!”. After a few introductions, EM-ABG are sent to the hold of ABGC ship,
where during two years, me and my colleagues will struggle with codes, cleaning
data and learning all aspects of the genetic architecture of traits in Animal Breeding
and Genetics. As final exam, I am challenged to sail across these beautiful and calm
waters of Wageningen Bay. The final result is priceless! After two unforgettable
years, the training is completed.
I would like to kindly thank Johan, Dieuwertje, Patricia, Marleen, Aniek, Ada, Gerda,
Piet, Eduardo, Christelle, Andrés, Guillaume and all the teachers for their support,
guidance and friendship during EM-ABG. I would kindly thank the Koepon family for
the amazing opportunity that they offered me.
This is the year 2011, and new challenges have been announced: there is a possibility
of subscribing to EGS-ABG. The catchy advertisement comes with a difficult mission:
sailing to the North in the open sea. Without hesitation, I subscribe. .“All on
Acknowledgements
184
board”, shouts Captain Johan! EGS-ABG gathers together for the first time. The main
deck is a huge promotion for most of us. Some came with more experience than
others, and the group is very diverse. At first sight, this is going to be challenging.
The main deck is indeed a huge responsibility. But we are not alone, at least we think
so! All PhD receive specific jobs, but our destination remains unknown. Only the
captain and his crew know the direction ABGC ship is heading for. The sails are lifted,
and in no time, we leave the quiet and calm waters of Wageningen Bay!
Under the supervision of Colonel Henk and Major Marleen, I happily start my task.
After a few months at sea, the excitement has been replaced by a tedious and
continuous routine. Asreml, Excel, Linux and R are just part of the job, which is
complemented with endless meetings with Colonel Henk and Major Marleen. To
keep the spirit alive, some strategic stops are planned, like harbors Pub-Quiz, WE-
day and ABGC day-outs. Ahead of us, the first storm in sight: the huge storm coined
“Paper One”. Paper One Storm soon brings lots of bumpy waves and strong winds.
Winds from the North and South reviewers that seemed to battle endlessly with us
on the main desk. I almost was thrown out of the main deck. Colonel Henk shouting
endless orders, followed by obedient Major Marleen, and a beaten up PhD Sandrine.
“Pull the sails down!” shouts Colonel Henk, “The reviewers are angry”, he continues.
“We need to hold ourselves, ‘cause these winds are too strong!!!!”. Milk Genomics
meetings, presentations, minutes, discussions, posters, endless shift hours, few sets
of brilliant ideas, a list of new suggestions, and frustration stepping in at high speed.
These were unusual times for me, and all my expectations changed. Would I be able
to continue? At these times, the excellent team of PhDs is like an island of comfort
in these troubled waters. After discussing and sharing our deepest fears and
frustrations, the morale of the PhDs substantially improves. Motivated as I have
never been before, I think: “Let’s go through this storm, let’s do this!”. Welcome
meetings, presentations, minutes, discussions, posters, QDG, TLMs! Finally, Paper
One Storm has passed; and I remember thinking: “OUF, I survived!”.
I would like to kindly thank Johan, Henk and Marleen for their guidance and support
throughout the PhD. Yes, I do not come with a manual, but neither do you. . I would
kindly thank CRV for their financial support for the last year of my PhD. I would kindly
say thank you to Erik Mullaart for your constant interest in my work, Daylan, Elsa,
Kasper, and Hein for the nice discussions within Milk Genomics. I would like to say
thank you to Mahlet, Marzieh, Yogesh, Hooiling, Troncg, Susan, Ewa, Katrijn, Naomi,
Gabriel, Marcos, Hamed, Mirte, Bert, Kimberly, Sabine, Tessa, Jovana, Sonia, Maria,
Zih-Hua, Anoop, Maulik, Vinicius, Coralia, Amabel, Mathijs, Claudia, Kasper, Saskia,
Mathieu, Floor, Qiuyu, Mandy, Wosseni, Robert, Haibo, Shuwen, Yvonne, Esther, Ilse,
Acknowledgements
185
Anouk, Aniek, Jérémie, Alex, Rosilde and Maya. I would also like to say thank you to
Pim, Henry, Jan, Piter, Liesbeth, John, Richard, Martin, and all the other staff
members for all the discussions at QDG and at lunch breaks.
In subsequent years, ABGC ship came across some other important storms. I can say
Paper One Storm prepared me for the next storms that were still to come. However,
nothing was as frightening as in 2013 when the sea started shaking so much that I
was sea-sick. This has never happened before. After receiving a lot of help from my
good friend Marshall Dieuwertje, I discover that I have to go back to Rio de Janeiro
Bay and stay some time recovering while on land. Before I left, Captain Johan was
very supportive “Sandrine”, he said, “Take your time, health is more important than
anything. When you are fully recovered you come back.” How grateful I am to have
this kind of support. I leave ABGC ship thinking: “I will be back before you know it”.
A few months later, I return to ABGC ship. A part of me is excited. I miss being at
ABGC, I miss the EGS-ABG gang, all the other PhDs, I miss the Marshalls, the nice
friends and colleagues, and I miss the blue Sea of Knowledge that lies in front of
ABGC ship. The other part of me is different. I have deeply changed after the sickness,
and things do not look the same. It seems that time has continued for everyone, and
it has stopped for me. Caught in my thoughts, I hear this voice behind me, “Oh dear,
don’t be sad, everything is going to be fine”. I look back, and see Marshall Ada. She
continues: “Your program has been upgraded. You just need time to get used to it.
All will be fine at the end. You will see, relax, and no worries”. I am so grateful to be
hearing this. And Marshall Lisette adds a little more: “No worries, we, 1975 are the
best! I am sure you will recover in no time. Hey girl, we are ‘75s! Uh-u!”. My heart is
feeling lighter again, and I think proudly to myself: “Yes, ‘mam. I am a ‘75s. Go for
it!”.
Dieuwertje, I will never forget how much you helped me. Thank you! For all the
support and help on this difficult phase, I acknowledge Dr. Cafure and his family, my
family, Johan, Marleen, and Henk. I would like to say thank you for the amazing
support and hard work that Ada and Lisette did. “Lieve Dames, dank jullie wel!”
This is the year 2014, and on this very sunny day, Captain Johan, Colonel Henk and
Major Marleen altogether announce my final destination: “Sandrine”, said captain
Johan, “You are going to the North Pole. There, you will spend some time in a ship
called SLU. The captain is a good friend of mine and you can learn lots of things from
him and his crew. I argued back: “Captain, my Captain! These are dangerous waters.
I am going to freeze to death!” “Naja”, says Captain Johan, “You just need some good
clothes, then it will be OK!”. Colonel Henk watching me worried, says “Sandrine, keep
Acknowledgements
186
an eye on polar bears. Beware of sliding bears! They can swipe you out of the deck!”.
“Safe trip! ”said Major Marleen. After waving goodbye to all colleagues and friends,
and gathering nice tips from my fellow PhD Dianne, my puzzlement was replaced by
the eagerness of discovering this new boat, place and crew.
It is on a summer sunny day when I finally reach ship SLU. This boat was somewhat
surprising; the main deck was round. I was a little lost at first, especially because so
many people around me were saying “Fiiiikka!”. I could not stop thinking: “What a
strange language!”. “AH, AH”, says this voice at the far end of the deck. “You made
it! Welcome, welcome to the main deck of the SLU ship. By the way, I am Captain DJ
and this is my crew: Major Freddy, Lieutenants Fernando and Lisa. You also know
Nancy and André!”. It was so nice to see these familiar faces. Very supportive PhDs
Nancy and André helped me settling in very fast. In no time, the round deck became
a very familiar place. But there was that dark side of the deck. I turn to André, and
ask: “Hey bro, what is on that dark side of the deck?”. “Sandrine, follow me”, he said.
In no time, we step into the dark side, and André says: “Meet the SLU Mafia!”. “Hey,
bro! Who is THAT? You are not supposed to bring strange people in.” says this PhD
to André. She turns to me and says: “My name is Agnese, and I am sort of the leader
of the SLU mafia! And these are Merina, Chrissy, Bingjie, Ahmed, Thu, Shizhi,
Xiaowei, and all the others! This is where all the PhD gather and organize many
parties and all sorts of activities! You are most welcome to join! By the way,
Fiiiiikkka.” I thought “And here we go again”.
It was mid-October 2014 and strong winds were bringing very dark clouds that
marked the beginning of the winter. The forecast was announcing light snow for the
evening, and at the main deck, I noticed that the days were getting shorter quite
rapidly. Captain DJ in his usual good shoes was sort of inspired: “Sandrine, the
weather is not an issue, we are inside the ship. For some months, the main deck will
remain closed, and we will be stuck in the North Pole until spring, next year.” I say:
“WHAT????? Spring is in April, we are gonna die!” Major Freddy and Lieutenant
Fernando started their usual jokes “Ah, Ah, we are gonna die indoors, so we will go
out to ski, ice-skate and all sorts of nice things! It will be fun! You will see!”. The next
morning the weatherman announces: “Yesterday, it only snowed one meter of
snow.” “Whow, this winter is gonna be promising”, I thought.
I would like to say thank DJ and Freddy for all the support that you gave me while in
Sweden and afterwards. Thank you Maria and Marie for all the nice comments. A
special thank you to Lisa because you let me stay two months in your house, and I am
really grateful for this. Fernando, Karl and Cano thanks for keeping me smiling. A
Acknowledgements
187
special thank you to the SLU Mafia. Thank you for all the amazing stuff we did
together: “Guys, you rock!”. Thanks Sofia, Kim, Emilie, Thomas, Eva and Valentina for
the nice discussions.
Thank you Dianne for the tips before I went to Sweden, especially the one to go to
Kiruna! It was fantastic! Nancy and André: Hey you two! I shall never forget you!
After a PhD, we shared so many moments! I can only say: thanks for everything.
This is the year 2015 and spring makes its way in this rather dark room. This new ship
ABGC 2.0 is located in the middle of this rather dark forest. A change that I notice,
especially after spending sometime at the North Pole. This is the last chapter of this
tremendous adventure called EGS-ABG to me. I have experienced so much, and
many PhD have harvested their thesis already. The direction set for me now is
towards the sun. I am heading full speed towards the final stage of every training:
the Aula. This period of time is intense, and everything has to be ready before spring
2016. Courses have to be finalized, all the Storm Papers are mastered by now, and
the final challenge makes its entrance in no time: Hurricane General Discussion.
Winds much stronger than expected and waves just look like mountains of waters in
front of ABGC 2.0 ship. Everything is so dark, and suddenly caught off guards, I fell in
the sea. “Woman at Sea”, shouts the Captain. I am safe and sound. I am quite lucky
because new EGS-ABG and PhDs have started their training.
So nice to meet them with their high spirits and hearts full of determination. The nice
and quiet main deck is suddenly taken by their voices, bringing a new sense of hope.
They do not realize, but they came to the rescue right on … “DRING, DRING”, I am
immediately transposed at the computer behind my desk at Radix building. “DRING,
DRING”, insists the phone. “Bonjour Maman, Bonjour Papa!”…
Para minha Família: Merci Maman et Papa! Merci pour tous ce que vous avez fait
pour moi et de m’avoir enseignée ce que l’amour inconditionnel est. Je vous aime!
Merci Yvan et Stéphane, pour les visites, voyages et vos soucis. Obrigada Maria-
Claudia e Sophia pelo carinho. Obrigada à tia Carmen, tio Reimar , Alexandra, Simão,
Felipe, Mariana, Fernando e à falecida tia Margitte por todo o carinho, interesse e
apoio.
Afinal, um PhD não é fruto de coincidências. É fruto de muito trabalho, e dedicação.
Por isso, estendo os meus agradeçimentos a todos os meus professores da FAA-
Valença/RJ, e em especial à minha amiga Aparecida e ao meu amigo Generoso.


Colophon
Colophon
190
Colophon
The work performed in Chapters 2, 3 and 4 are part of the Dutch Milk Genomics
Initiative, funded by Wageningen University, the Dutch Dairy Association (NZO),
Cooperative Cattle Improvement Organization (CRV; Arnhem, the Netherlands), and
the Dutch Technology Foundation (STW). The work performed in Chapter 5 was
financed by the Swedish Farmer's Foundation for Agricultural Research (SLF),
Stockholm, Sweden.
The author was supported by the European Commission (within the framework of
the Erasmus-Mundus joint doctorate “EGS-ABG”) and Breed4Food (a public-private
partnership in the domain of animal breeding and genomics and CRV).
The cover of this thesis was designed by Sandrine I. Duchemin.
The thesis was printed by Digiforce | Proefschriftmaken.nl, De Limiet 26, 4131NC,
Vianen, the Netherlands.
Related Documents