Mapping Adequacy of Staffing to Ensure Service Guarantees for Maternal and Child Health: A Study of Ganjam District in Orissa using WISN Method By Dr. Manmath K. Mohanty, Head, HRU Human Development Foundation (HDF) In collaboration with Washington University, CHSJ, UNFPA 22 nd July 2009

Mapping Adequacy of Staffing to Ensure Service Guarantees for Maternal and Child Health: A Study of Ganjam District in Orissa using WISN Method By Dr.
Dec 16, 2015
Welcome message from author
This document is posted to help you gain knowledge. Please leave a comment to let me know what you think about it! Share it to your friends and learn new things together.
Transcript

Mapping Adequacy of Staffing to Ensure Service Guarantees for Maternal and Child Health:
A Study of Ganjam District in Orissa using WISN MethodBy
Dr. Manmath K. Mohanty, Head, HRUHuman Development Foundation (HDF)
In collaboration with Washington University, CHSJ, UNFPA22nd July 2009
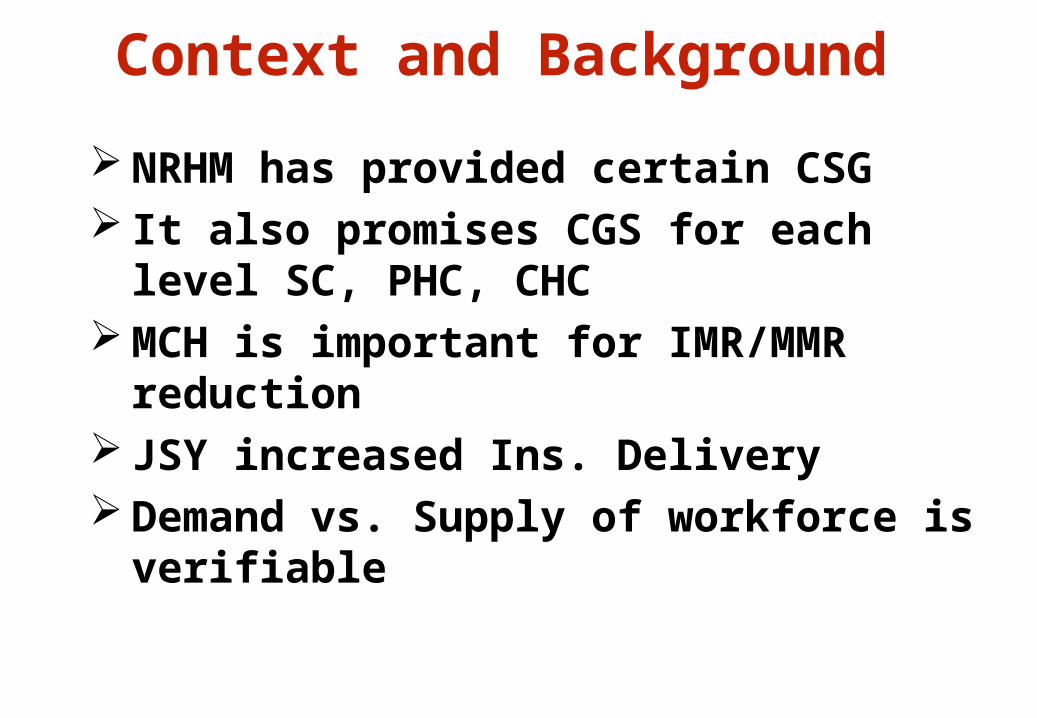
Context and Background
NRHM has provided certain CSG It also promises CGS for each level SC, PHC, CHC MCH is important for IMR/MMR reduction JSY increased Ins. Delivery Demand vs. Supply of workforce is verifiable

Research Question:
Is there adequate staffing for Maternal and Child Health (MCH) Services in government health care facilities to meet the service guarantees under NRHM in Ganjam district of Orissa?

About WISN Method
WISN- Workload Indicators of Staffing Need A method of setting the correct Heath Facility staffing
levels. Developed by Shipp (1998) and popularized by WHO Tried in Tanzania, Papua New Guinea, Kenya, Hong
Kong, Turkey and Bangladesh No previous work in India
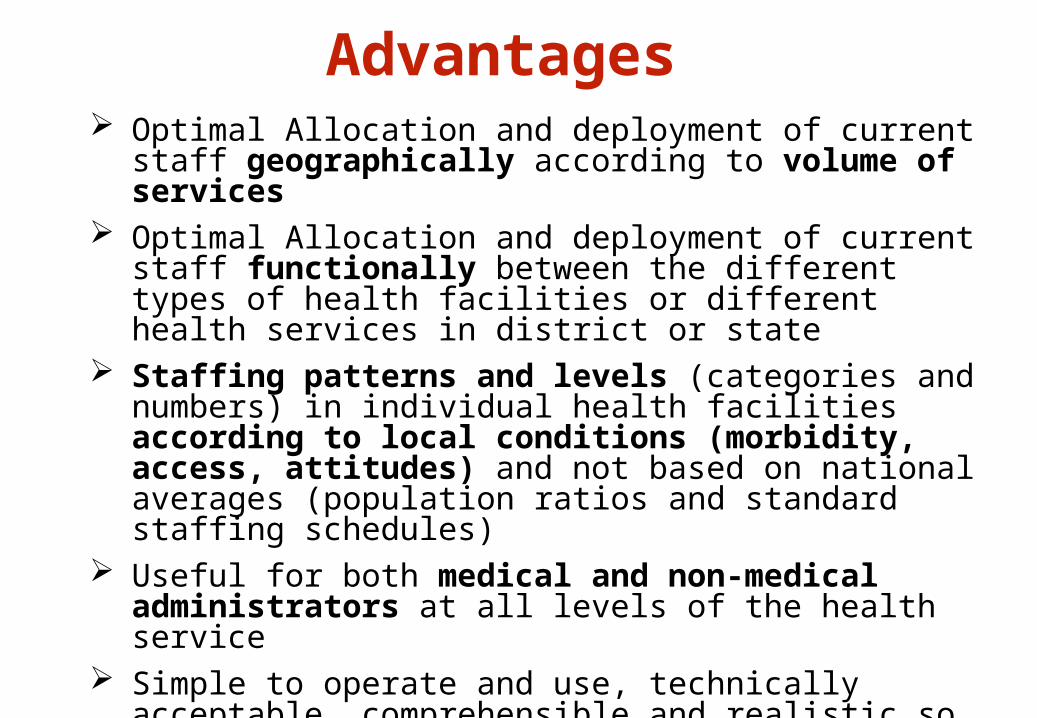
Advantages Optimal Allocation and deployment of current staff
geographically according to volume of services Optimal Allocation and deployment of current staff functionally
between the different types of health facilities or different health services in district or state
Staffing patterns and levels (categories and numbers) in individual health facilities according to local conditions (morbidity, access, attitudes) and not based on national averages (population ratios and standard staffing schedules)
Useful for both medical and non-medical administrators at all levels of the health service
Simple to operate and use, technically acceptable, comprehensible and realistic so that results are acceptable by non clinical manager.

Limitations of the Study Actual time requirements could be different from the
estimates of practitioners, for a variety of reasons. We did not directly calculate time standards of the MCH
activities through time/motion observation Other scopes of observation may have generated
different conclusions. There may be activities involved in MCH care that we
did not capture in our lists, which would understate the gap in service availability.

WISN Steps Chart
X
Time required for procedure
Service guarantees
Proportion of population requiring MCH
Total deman
d
Time available per worker
Personnel strength
Total supply of staff
time
Surplus/Gap
Total deman
d
Total supply of staff
time
Interview & FGD
IPHS HMIS & Secondary data
Interview & FGD
HMIS/Record review
X X =
=
_ =
Step-I
Step-II
Step-III


FINDINGS

Extent of Shortage or Surplus of Health Workers in Ganjam for providing MCH services
Staff Category (a) Number of workers in our study area devoted to MCH care (b)
Total Demand in Hours (c)
Total Supply in Hours (d)
Gaps/Surplus in Hours (e=c-d)
Number Additional Staff Required to Meet Gap (f=e/hours worked per year per worker)
Ratio of Staff Supply/Required (WISN)* (g=d/c)
Doctors 45 104859 25272 -79587 42.51 0.24
Staff Nurses 21 43535 15725 -27810 14.86 0.36
ANMs 173 375739 226699 -149040 79.62 0.60
Lady Health Visitors
16 19055 23587 4532 -2.42 1.24
Lab Staff 11 23257 2622 -20635 8.66 0.11
Male Health Workers
91 137729 68141 -69588 37.17 0.49
Totals 357 704174 362046 -342128 180.39 0.51
*Note: When supply meets demand, the WISN number is 1.0; when demand exceeds supply, the WISN score falls below 1.0. Severity of shortage or surplus can be measured by the distance from 1.0

Staffing Requirement Staffing Requirement for MCH at Ganjam
-20%0%
20%40%60%80%
100%
Do
cto
rs
Sta
ff N
urs
es
AN
Ms
LH
Vs
La
b S
taff
He
alt
hW
ork
ers
(M)
Category of Staff
Pe
rce
nt
of
He
alt
h
Wo
rke
rs
Proportion of Additional Staff Required to Meet the Gap
Proportion of workers available for MCH care
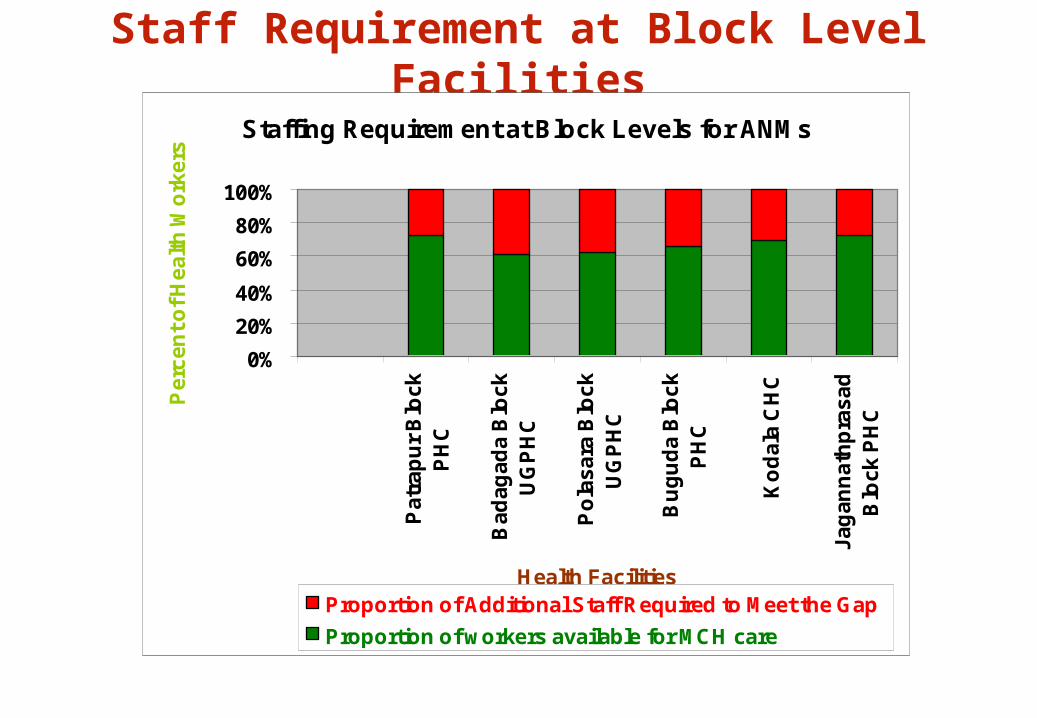
Staff Requirement at Block Level Facilities
Staffing Requirement at Block Levels for ANMs
0%
20%
40%
60%
80%
100%
Pa
tra
pu
r B
loc
kP
HC
Ba
da
ga
da
Blo
ck
UG
PH
C
Po
las
ara
Blo
ck
UG
PH
C
Bu
gu
da
Blo
ck
PH
C
Ko
da
la C
HC
Ja
ga
nn
ath
pra
sa
dB
loc
k P
HC
Health Facilities
Pe
rce
nt
of
He
alt
h W
ork
ers
Proportion of Additional Staff Required to Meet the Gap
Proportion of workers available for MCH care

Staff Requirement at PHC New Level
Staffing Requirement at PHC (New) Level for ANMs
0%20%40%60%80%
100%
Ba
ran
ga
PH
C N
ew
Go
ud
ag
oth
aP
HC
Ne
w
Ka
rch
uli
PH
C N
ew
Be
gu
nia
pa
da
PH
C N
ew
Ra
ha
da
PH
CN
ew
Ba
rag
ao
nP
HC
Ne
w
Health Facility
Pe
rce
nt
of
He
alt
h
Wo
rke
rs
Proportion of Additional Staff Required to Meet the Gap
Proportion of workers available for MCH care

Staff Requirement at Sub Centre Level
Staffing Requirement at Sub Centre Level
0%20%40%60%80%
100%
Go
ud
ag
oth
aS
C
Ko
nk
ora
da
SC
Bir
an
ch
ipu
rS
C
Bu
gu
da
-II
SC
Ko
da
la-I
I
Kh
am
arp
ali
SC
Health Facility
Pe
rce
nt
of
AN
Ms
Proportion of Additional Staff Required to Meet the Gap
Proportion of workers available for MCH care

Conclusion To meet the requirements of the NRHM service guarantees,
the 18 health facilities would need to supply an additional 342,128 hours, translating to about 181 additional FTE workers.
Additional staff required to the extent 80 ANMs, 37 male HW, 43 physicians, 15 staff nurses and 9 lab staff.
However the supply of LHV is 16, which is about 2.4 more than required to meet the demand.
In case of ANMs Badagada Block UGPHC has the largest shortfall of staff, requiring an additional 13 FTEs to meet the SG in the NRHM.
The WISN ratio for that center is 0.52, indicating the supply of hours of care is only slightly better than half of that required.

Recommendations In the presence of government promises to deliver a minimum
package of services, the WISN method should be used as a methodology to calculate the expected demand as well as supply and the gap.
Government health planners should use WISN data to consider the magnitude of staffing increases that would be needed to meet service guarantees.
Our study generated time standards in minutes for each MCH activity promised by the NRHM. These standards could now be applied to other districts in India with slight modification if required.
WISN, then, can provide a useful tool for civil society advocates who seek to hold governments accountable for their health service guarantees.

THANK YOU
Related Documents