10.1101/gr.081026.108 Access the most recent version at doi: 2008 18: 1924-1937 originally published online October 3, 2008 Genome Res. Michael Freeling, Eric Lyons, Brent Pedersen, et al. the order Brassicales transposed after the origin of Arabidopsis Many or most genes in Material Supplemental http://genome.cshlp.org/content/suppl/2008/11/06/gr.081026.108.DC2.html References http://genome.cshlp.org/content/18/12/1924.full.html#ref-list-1 This article cites 64 articles, 32 of which can be accessed free at: service Email alerting click here top right corner of the article or Receive free email alerts when new articles cite this article - sign up in the box at the http://genome.cshlp.org/subscriptions/ go to: Genome Research To subscribe to Copyright © 2008, Cold Spring Harbor Laboratory Press Cold Spring Harbor Laboratory Press on December 4, 2008 - Published by genome.cshlp.org Downloaded from

Welcome message from author
This document is posted to help you gain knowledge. Please leave a comment to let me know what you think about it! Share it to your friends and learn new things together.
Transcript

10.1101/gr.081026.108Access the most recent version at doi: 2008 18: 1924-1937 originally published online October 3, 2008Genome Res.
Michael Freeling, Eric Lyons, Brent Pedersen, et al. the order Brassicales
transposed after the origin ofArabidopsisMany or most genes in
MaterialSupplemental http://genome.cshlp.org/content/suppl/2008/11/06/gr.081026.108.DC2.html
References http://genome.cshlp.org/content/18/12/1924.full.html#ref-list-1
This article cites 64 articles, 32 of which can be accessed free at:
serviceEmail alerting
click heretop right corner of the article orReceive free email alerts when new articles cite this article - sign up in the box at the
http://genome.cshlp.org/subscriptions/ go to:Genome ResearchTo subscribe to
Copyright © 2008, Cold Spring Harbor Laboratory Press
Cold Spring Harbor Laboratory Press on December 4, 2008 - Published by genome.cshlp.orgDownloaded from

Many or most genes in Arabidopsis transposedafter the origin of the order BrassicalesMichael Freeling,1,4 Eric Lyons,1 Brent Pedersen,1 Maqsudul Alam,2 Ray Ming,3
and Damon Lisch1
1Department of Plant and Microbial Biology, University of California at Berkeley, Berkeley, California 94720, USA;2Advanced Studies in Genomics, Proteomics and Bioinformatics and Department of Microbiology, University of Hawaii,Honolulu, Hawaii 96822, USA; 3Department of Plant Biology, University of Illinois at Urbana-Champaign,Urbana, Illinois 61801, USA
Previous to this work, typical genes were thought to move from one position to another infrequently. On thecontrary, we now estimate that between one-fourth and three-fourths of the genes in Arabidopsis transposed in theBrassicales. We used the CoGe comparative genomics system to perform and visualize multiple orthologouschromosomal alignments. Using this tool, we found large differences between different categories of genes. Ten ofthe gene families examined, including genes in most transcription factor families, exhibited a median frequency of5% transposed genes. In contrast, other gene families were composed largely of transposed genes: NB-LRRdisease-resistance genes, genes encoding MADS-box and B3 transcription factors, and genes encoding F-box proteins.A unique method involving transposition-rich regions of genome allowed us to obtain an indirect estimate of thepositional stability of the average gene. The observed differences between gene families raise important questionsconcerning the causes and consequences of gene transposition.
[Supplemental material is available online at www.genome.org.]
One of the most striking results that comes from comparing re-lated genomes is the prevalence of collinear runs of genes.Broadly speaking, even distantly related species within the samefamily have roughly the same gene content in roughly the sameorder (Gale and Devos 1998; Bennetzen 2007). However, order isreadily detected and it is easy to overlook exceptions to thatorder. These exceptions are the subject of this work.
It is important here to distinguish between collinearity,which is a direct and empirical comparison of gene order, andsynteny, which is an inference about a common ancestral geneorder shared between two or more chromosomal regions. In theabsence of collinearity, synteny can be difficult to infer. There areseveral reasons for this. Most importantly, plant lineages haveoften undergone repeated tetraploidies and/or large segmentalduplications. Such large-scale duplications are eventually re-duced back to near that of the pre-tetraploid in terms of genecontent and chromosome number by a mutational process calledfractionation. However, the resulting genome is scrambled due todeletions, translocations, and inversions (Bowers et al. 2003;Yogeeswaran et al. 2005; Thomas et al. 2006). These rearrange-ments and fractionations disrupt or even eliminate collinearity,but synteny can usually be deduced by comparison to outgroupgenomes.
The second reason that synteny can be difficult to measureinvolves gene detectability. In some cases, genes or families ofgenes may evolve by base substitution so rapidly that they can-not be detected in outgroups. We call such genes or gene families“rapidly diverged,” but the term “lineage-specific genes” has alsobeen used (Lespinet et al. 2002). Also undetectable are newly
originated genes (Bosch et al. 2007; Zhou et al. 2008). Neither ofthese classes of genes can be measured for synteny or a lackthereof. Thus, if a gene seems to have moved from an ancestralchromosomal position to a new position, we require that thenewly positioned gene must be detectable somewhere in the out-group genome. Only detectable genes are designated as trans-posed in our analysis.
Finally, there are genes and families of genes whose distri-bution among related species is patchy. These gene families canbe detected in some outgroup genomes but not others; a givenfamily may have gone extinct in particular lineages but is none-theless ancient. This behavior has been explained by combina-tions of high gene birth-and-death coupled with strong purifyingselection (Nei 1992; Nei et al. 2000). The most dramatic examplesof this are transposons; they only survive to the extent that activeelements can move to new positions within a genome and indi-vidual transposon lineages are often lost in particular clades. Thisresults in very high birth-and-death and a near absence of syn-teny (Brookfield 1986; Petrov et al. 1996; Marino-Ramirez et al.2005).
Our purpose here is to test genes and gene families for move-ment from an ancestral chromosomal position to a new positionbeginning with the origin of the order Brassicales and along thelineage leading to modern Arabidopsis thaliana (At). We measuremovement by finding genes in At that are flanked closely byneighbor genes that are adjacent in the Brassicales outgroup ge-nome. We call this the “flanking gene method.”
The flanking gene method does not work for all chromo-somal positions and it is important to recognize its limitations.First, the methodology depends on adequate sequences from out-group genomes. If sequences flanking a given gene are absent orincomplete in an outgroup, or if an inversion could have insertedinto unsequenced DNA in the region, the movement of that genecannot be evaluated for transposition. Second, we depend on
4Corresponding author.E-mail [email protected]; fax (510) 642-4995.Article published online before print. Article and publication date are at http://www.genome.org/cgi/doi/10.1101/gr.081026.108
Letter
1924 Genome Researchwww.genome.org
18:1924–1937 ©2008 by Cold Spring Harbor Laboratory Press; ISSN 1088-9051/08; www.genome.org
Cold Spring Harbor Laboratory Press on December 4, 2008 - Published by genome.cshlp.orgDownloaded from

local synteny between At and orthologous outgroup chromo-somes. If the gene in question is in a region showing no synteny(Fortna et al. 2004; Gordon et al. 2007; Kurahashi et al. 2007) thegene cannot be evaluated using the flanking gene method.
At has the best-annotated plant genome and is the preferredspecies with which to begin an analysis of the evolution of genechromosomal position. The most recent analyses of intrage-nomic collinearity within At inferred two sequential tetraploidies(designated � and �), although the timing and exact gene con-tents of these two events differed markedly when estimated bytwo independent research groups (Bowers et al. 2003; Maere et al.2005). Most of the genes that had been duplicated as a conse-quence of tetraploidy were subsequently removed by fraction-ation. Those duplicates that were not fractionated enriched theAt genome for genes involved in complex regulatory interactions(Blanc and Wolfe 2004; Seoighe and Gehring 2004; Birchler et al.2005; Maere et al. 2005; Freeling and Thomas 2006). Accordingto the Gene Balance Hypothesis (for review, see Birchler et al.2005), such genes are retained following tetraploidy events be-cause they are dose sensitive. The net effect of this process is todrive regulatory, and probably morphological, complexity up-ward (Freeling and Thomas 2006). Biases in gene family expan-sion or contraction—for any reason—have profound evolution-ary consequences involving drives and directions (Freeling2008). We suggest that the same may be true for biases in a gene’spropensity to transpose.
The power of comparative genomics is enhanced by usingproper outgroups. Fortunately, two excellent comparators forArabidopsis research have been recently sequenced. A 3� papaya(Carica papaya, or Cp) genome was released recently (Ming et al.2008). Although only 75% of the sequence is represented in thisassembly, the authors estimate that >90% of the gene content isrepresented. This genome is a particularly important outgroupfor At because it has not undergone a tetraploidy in its lineage forover 100 MY and is a basal Brassicales, the order that also includesAt. It is clear that Cp diverged from At before either of the twomost recent At lineage tetraploidies occurred, so any one Cp chro-mosomal segment is often represented as four different segmentsin At, each one of which, because of fractionation, contains onlya subset of the genes in the Cp segment. In order to distinguishbetween gain versus loss, we use a second outgroup. The grape(Vitis vinifera, or Vv) genome (Jaillon et al. 2007) is also recentlysequenced and, like Cp, is devoid of obvious whole-genome du-plications subsequent to the radiation of the rosids. Figure 1 il-lustrates this 1Cp:1Vv:4At relationship. It portrays a GEvo (Lyonsand Freeling 2008) graphic representation of a BLASTZ alignmentoutput, where all sequences are compared with Cp. The CoGeplatform for organizing whole genomic data and its GEvo tool forcomparison of genomic regions (Lyons and Freeling 2008) hasbeen tailored specifically to support comparisons among rosidgenomes (Lyons et al. 2008). High-scoring pairs are representedas colored rectangular BLAST “hits.” Note that nearly every genepresent in this region of Cp is present on at least one of the Atsegments. Genes present in these At segments that are not pres-ent in a syntenous region in Cp have been either gained at thisposition in At, lost in Cp, or are not authentic genes. Returning toFigure 1, At genes that are flanked by syntenic genes in Cp and Vv(identified by the lines) but do not appear to be present in eitherof these outgroup species at this position, are the subject of thisstudy. Examples of these potentially interesting genes are en-closed in ovals.
There are a variety of ways that single genes are known to
have moved. One way is via transposon-mediated transduplica-tion, a process in which portions of genes are captured by trans-posons such as MULEs (Jiang et al. 2004; Juretic et al. 2005; Lisch2005) or helitrons (Morgante et al. 2005). There are thousands ofexamples of transduplication in rice and maize. In addition totransduplication, there are three other ways that genes areknown experimentally to have transposed singly or in smallgroups: (1) Excision and reinsertion, mediated by two flankingtransposons (Tonzetich et al. 1990); (2) reverse transcription of apre-existing mRNA and retro-transposition (retroposition) of theintronless copy to a new location (Neufeld et al. 1991); or (3)intrachromosomal recombination among locally duplicatedgenes or genes flanking repetitive sequences (Yi and Charles-worth 2000).
Although there is little evidence against the common occur-rence of single gene transposition in plants, the possibility israrely mentioned. There is an exception (Fischer et al. 1995):Studies mapping MADS-box genes in maize concluded that manyof them acted like transposons. With this exception, the possi-bility of transposition can come up when disease-resistance (es-pecially NB-LRR) genes (Jones and Dangl 2006) are involved, butthe word “transposition” is avoided. Leister (2004) called trans-positions “ectopic duplications,” and did not exclude them fromexplanations of the positions of singlets and clusters of NB-LRRgenes in all plants, as had others (Baumgarten et al. 2003). Arecent study (Ameline-Torregrosa et al. 2008) called transposi-tions “ectopic translocations” and inferred a significant numberof them among the disease-resistance genes of the legume Medi-cago truncatula. NB-LRR genes are certainly diverse within Arabi-dopsis thaliana, Columbia (Meyers et al. 1998), and some of themare particularly polymorphic in their LRR regions (Bakker et al.2006; Shen et al. 2006; Borevitz et al. 2007), as judged from re-sequencing in wild accessions. There is at least one suggestionthat plant disease-resistance gene clusters might generate diver-sity under extreme stress (Friedman and Baker 2007). Here wepresent evidence that NB-LRR genes, and many others, are par-ticularly prone to have become transposed. In contrast, genes inother gene families, like those encoding most sorts of transcrip-tion factors, tend to stay in an ancestral chromosomal position.
Results
Our goal was to determine the frequency with which genes wererelocated or transposed into the At lineage genome subsequent toits divergence from Cp. In order to do this, it was necessary toidentify genes in At that are flanked by syntenic genes in Cp, butthat are not themselves present at that syntenic position in Cp.Ultimately, we examine flanked genes using BLASTN orTBLASTX, and display the results, as illustrated in Figures 1 and2. We then calculate the resulting “not ancestral” frequency foreach of several gene families. If the gene is detectable in theoutgroups (not rapidly diverging or high birth-and-death), thenwe infer that the gene transposed into Arabidopsis. By “transpo-sition,” we do not imply a specific mechanism, only that thesegenes were apparently mobilized and inserted at some point sub-sequent to the divergence of At and Cp without disrupting an-cestral flanking markers.
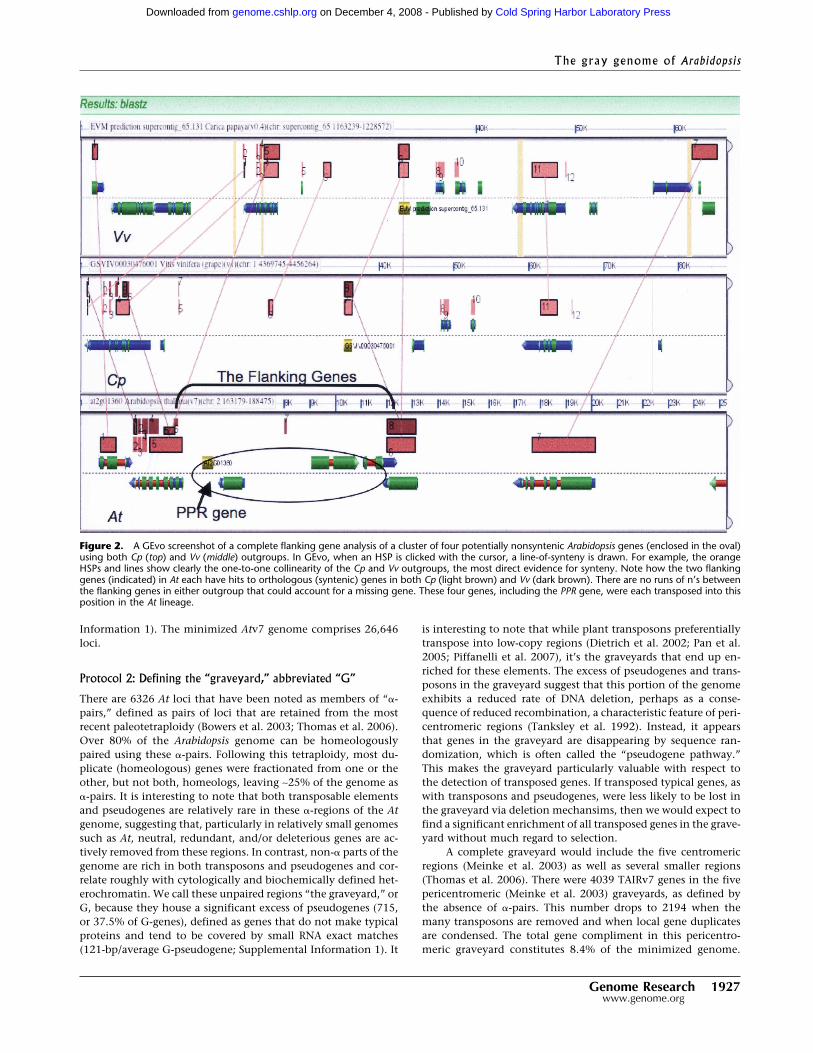
In order to accurately determine the frequency of transpo-sition for each family examined, we used a series of protocols andcontrols, detailed below. Results are summarized in numbers inTable 1, words in Table 2, and cataloged in Supplemental Infor-mation 1.
The gray genome of Arabidopsis
Genome Research 1925www.genome.org
Cold Spring Harbor Laboratory Press on December 4, 2008 - Published by genome.cshlp.orgDownloaded from
Protocol 1: Minimizing the Atv7 genome
There are 31,762 annotated genes in the v7 TAIR Arabidopsis ge-nome. For the purposes of counting positions (loci), we removed
annotated transposons as well as ULP protease genes that arehitchhiking within transposons, and we condensed local dupli-cations to one arbitrary gene-space identifier (Methods; details ofour gene list explained in header of column S, Supplementary
Figure 1. A GEvo graphic of a BLASTZ six-way multiple alignments including one syntenous region from Cp, the four homeologous (orthologous) Atregions, and the orthologous Vv segment. Both Cp (top) and Vv (bottom) are references, so a maximum of five high-scoring pairs (HSPs, colored boxes)could be piled above, or, for inversion, below the gene models. If syntenic lines connecting HSPs could be drawn without obscuring the graphic, essentialcollinearity of all HSPs would be demonstrated. The arrow in the Cp panel marks a Cp gene that is present in the expected syntenic position in Vv, andis present in all four At homeologs, meaning that the gene was retained following both � and � tetraploidies in the At-specific lineage. The other Cp genestend to be on one, two, or three of the four possible At homeologs, reflecting various patterns of fractionation. At genes that are flanked by ancestralgenes but are not hit by BLASTZ in either outgroup in this region are circled. These are candidate transpositions. Unsequenced nucleotides, n’s, aremarked orange. Continue research at http://tinyurl.com/23lybd.
Freeling et al.
1926 Genome Researchwww.genome.org
Cold Spring Harbor Laboratory Press on December 4, 2008 - Published by genome.cshlp.orgDownloaded from
Information 1). The minimized Atv7 genome comprises 26,646loci.
Protocol 2: Defining the “graveyard,” abbreviated “G”
There are 6326 At loci that have been noted as members of “�-pairs,” defined as pairs of loci that are retained from the mostrecent paleotetraploidy (Bowers et al. 2003; Thomas et al. 2006).Over 80% of the Arabidopsis genome can be homeologouslypaired using these �-pairs. Following this tetraploidy, most du-plicate (homeologous) genes were fractionated from one or theother, but not both, homeologs, leaving ∼25% of the genome as�-pairs. It is interesting to note that both transposable elementsand pseudogenes are relatively rare in these �-regions of the Atgenome, suggesting that, particularly in relatively small genomessuch as At, neutral, redundant, and/or deleterious genes are ac-tively removed from these regions. In contrast, non-� parts of thegenome are rich in both transposons and pseudogenes and cor-relate roughly with cytologically and biochemically defined het-erochromatin. We call these unpaired regions “the graveyard,” orG, because they house a significant excess of pseudogenes (715,or 37.5% of G-genes), defined as genes that do not make typicalproteins and tend to be covered by small RNA exact matches(121-bp/average G-pseudogene; Supplemental Information 1). It
is interesting to note that while plant transposons preferentiallytranspose into low-copy regions (Dietrich et al. 2002; Pan et al.2005; Piffanelli et al. 2007), it’s the graveyards that end up en-riched for these elements. The excess of pseudogenes and trans-posons in the graveyard suggest that this portion of the genomeexhibits a reduced rate of DNA deletion, perhaps as a conse-quence of reduced recombination, a characteristic feature of peri-centromeric regions (Tanksley et al. 1992). Instead, it appearsthat genes in the graveyard are disappearing by sequence ran-domization, which is often called the “pseudogene pathway.”This makes the graveyard particularly valuable with respect tothe detection of transposed genes. If transposed typical genes, aswith transposons and pseudogenes, were less likely to be lost inthe graveyard via deletion mechansims, then we would expect tofind a significant enrichment of all transposed genes in the grave-yard without much regard to selection.
A complete graveyard would include the five centromericregions (Meinke et al. 2003) as well as several smaller regions(Thomas et al. 2006). There were 4039 TAIRv7 genes in the fivepericentromeric (Meinke et al. 2003) graveyards, as defined bythe absence of �-pairs. This number drops to 2194 when themany transposons are removed and when local gene duplicatesare condensed. The total gene compliment in this pericentro-meric graveyard constitutes 8.4% of the minimized genome.
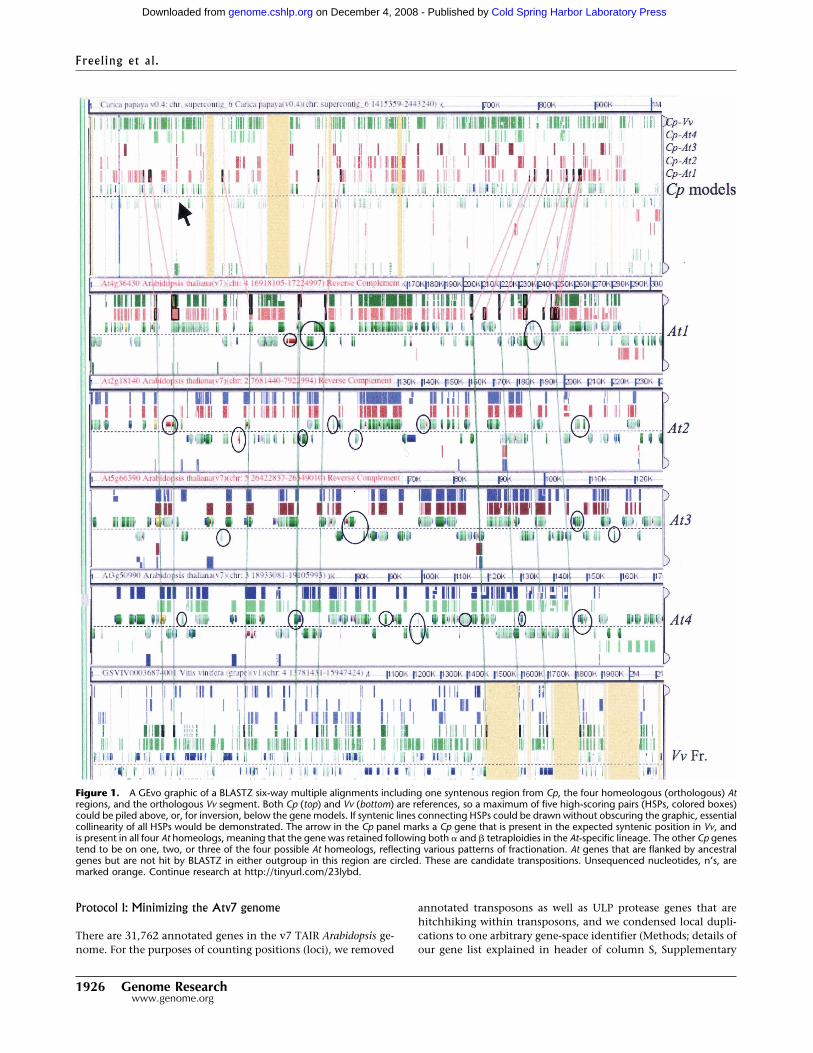
Figure 2. A GEvo screenshot of a complete flanking gene analysis of a cluster of four potentially nonsyntenic Arabidopsis genes (enclosed in the oval)using both Cp (top) and Vv (middle) outgroups. In GEvo, when an HSP is clicked with the cursor, a line-of-synteny is drawn. For example, the orangeHSPs and lines show clearly the one-to-one collinearity of the Cp and Vv outgroups, the most direct evidence for synteny. Note how the two flankinggenes (indicated) in At each have hits to orthologous (syntenic) genes in both Cp (light brown) and Vv (dark brown). There are no runs of n’s betweenthe flanking genes in either outgroup that could account for a missing gene. These four genes, including the PPR gene, were each transposed into thisposition in the At lineage.
The gray genome of Arabidopsis
Genome Research 1927www.genome.org
Cold Spring Harbor Laboratory Press on December 4, 2008 - Published by genome.cshlp.orgDownloaded from
Tab
le1.
Flan
kin
gg
ene
met
hod
dat
afo
r24
Arab
idop
sis
gen
eca
teg
orie
sd
ocum
enti
ng
case
sof
rece
nt
tran
spos
itio
n
Gen
e“f
amily
”aN
o.of
gen
ess+
pb
p/(
s+
p)
(%ta
nd
.)b
No.
ofN
oSy
nte
ny
Perc
ent
ofIn
valid
ated
No.
ofA
nce
stra
lN
o.of
Not
An
cest
ral
Perc
ent
Not
An
cest
ral
Perc
ent
Det
ecta
ble
cPe
rcen
tof
�d
upR
etai
ned
dsm
RN
A:
hit
s@av
g.b
pe
Anc
estr
alTF
-GRA
S30
293%
41
240
0%(0
/29)
All
48%
2/30
@9b
pTF
-WRK
Y71
693%
144
465
10%
(5/5
1)A
ll33
%0/
71@
1bp
WD
40-s
ampl
e38
383%
90
263
10%
(3/2
9)A
ll50
%1/
38@
3bp
Ger
min
2813
31%
43
60
0%(0
/6)
—23
%8/
28@
20bp
Pare
nts
retr
o-p.
f51
5112
%15
426
619
%(6
/32)
All
29%
3/51
@6b
pPr
otea
som
eco
reg
5048
2%6
735
00%
(0/3
5)—
59%
0/50
@4b
pPP
Rh42
140
82%
134
4419
535
15%
(35/
/230
All
10%
8/42
1@11
bpD
VL20
200%
80
120
0%(0
/10)
—5%
0/20
@0b
pTF
-AS2
:LO
B38
373%
101
251
4%(1
/26)
All
19%
0/38
@0b
pC
a++
Prot
.ki
n15
150%
00
141
6.7%
(1/1
5)A
ll20
%2/
15@
7bp
Mix
edA
PUM
2623
13%
55
103
23%
(3/1
3)A
ll9%
1/23
@16
bpRe
arra
ngem
ent-
pron
eFA
Dox
idor
i27
1354
%6
60
1N
DA
ll31
%2/
27@
8bp
Jaca
lin,
lect
in32
1753
%10
51
1N
DA
ll12
%1/
32@
3bp
Gra
y(t
rans
pose
d)Re
tro-
p’sf
6968
1%20
1511
2267
%(2
2/33
)A
ll13
%2/
69@
5bp
TIR-
NB-
LRRj
156
117
18%
5216
544
90%
(44/
49)
All
18%
6/15
6@7b
pC
C-N
B-LR
Rj39
2733
%9
31
1493
%(1
4/15
)A
ll4%
5/39
@10
bpO
ther
-LRR
j52
3732
%15
15
1676
%(1
6/21
)A
ll19
%0/
37@
1bp
TFA
B13V
P1B3
3425
16%
85
39
75%
(9/1
2)A
ll8%
0/34
@1b
pTF
MA
DS
8577
12%
2715
1520
50%
(15/
30)
All
16%
4/85
@11
bpF-
box
sam
pler
k11
885
26%
2315
1037
79%
(37/
42)
78%
13%
4/11
8@4b
pH
ypo
v5up
grad
edl
1406
1260
8%g
g96
201
68%
(201
/297
)28
%9%
309/
1406
@29
bU
ndet
ecta
ble
(rap
idly
dive
rged
)Th
ioni
n59
4025
%15
50
2010
0%(2
0/20
)5%
ND
20/5
9@27
bpD
efen
sins
200
154
19%
7721
154
98%
(54/
55)
2%N
D26
/200
@13
bpH
igh
birt
h-an
d-de
ath
MIR
m11
296
9%36
2521
1440
%(1
4/35
)l
ND
58/1
12@
30bp
a(T
F)A
gene
enco
ding
atr
ansc
riptio
nfa
ctor
.bTh
epe
rcen
tta
ndem
even
ts=
p/p
+s.
Loca
ldup
licat
ion
data
from
Supp
lem
enta
lMat
eria
ls1,
colu
mn
“Bre
nt’s
dupl
icat
es,”
whe
rea
pare
ntof
adu
plic
ate
arra
yis
mar
ked
“p,”
and
sing
leto
ns(s
)ar
eun
mar
ked.
c Per
cent
of“N
otA
nces
tral
”ge
nes
that
wer
epr
esen
tso
mew
here
inth
epr
imar
you
tgro
up,
Cp.
dAt
�-d
uplic
ate
rete
ntio
nfr
eque
ncie
sar
efr
omTh
omas
etal
.(2
006)
.eN
umbe
rof
exac
tm
atch
es/g
ene
(hits
)co
verin
g(@
)an
dav
erag
eof
base
pairs
/gen
e.f Z
hang
etal
.20
05.
g26
San
d20
Son
ly.
hLu
rinet
al.
2004
.i C
anno
net
al.
2004
.j In
itial
lyfr
omM
eyer
set
al.(
2003
)au
gmen
ted
byge
nes
that
wer
e�
-pai
rsw
ithkn
own
NB-
LRR-
gene
s(T
hom
aset
al.2
006)
and
furt
her
augm
ente
dan
dre
fined
byth
eus
er-s
uppl
ied-
data
from
TAIR
desc
riptio
ns,
v7,
11-0
7.k T
hefir
st∼2
0ge
nes
onea
chof
the
five
chro
mos
omes
bega
nth
isap
prox
imat
ion
ofa
rand
omsa
mpl
e.l T
helis
tof
TAIR
v5hy
poth
etic
alge
nes
was
redu
ced
byre
mov
ing
thos
ege
nes
that
rem
aine
dhy
poth
etic
alin
v7.
Thes
e“u
pgra
ded
hypo
thet
ical
s”w
ere
auto
mat
ical
lyju
dged
tobe
“Not
Synt
enic
”if
they
had
ano
nsyn
teni
cBL
AST
Nhi
tto
age
nead
jace
nt,
even
ifth
ere
gion
was
clea
rlysy
nten
ic,
soth
e92
6“N
oSy
nten
y”ge
nes
here
are
vast
lyov
er-r
epre
sent
edan
dar
eno
tto
beco
mpa
red.
mv7
MIR
gene
sju
dged
“Not
Anc
estr
al”
wer
e∼5
0%no
tde
tect
able
inC
p,bu
t,us
ing
BLA
STN
toVi
ridip
lant
aeat
NC
BI,
evid
ence
dhi
ghbi
rth-
and-
deat
h(s
eete
xt).
Freeling et al.
1928 Genome Researchwww.genome.org
Cold Spring Harbor Laboratory Press on December 4, 2008 - Published by genome.cshlp.orgDownloaded from
Protocol 3: Defining “interrupter gene,” I
A second potentially useful region within the At genome lieswithin local (usually tandem) arrays of duplicated genes. If a geneinterrupts a tandem array of genes, we designate it an “inter-rupter” (or I) gene. I-gene content is particularly informative be-cause it is reasonable to hypothesize that most I-genes were in-serted within a local array after the array existed. If an I genecame from outside the array on a short inversion, for example,one of the flanks would invert. However, interrupter genes arenot duplicates of nearby genes, strongly suggesting that they arelegitimate insertions.
There are 3088 locally duplicated At genes in 1953 arrays(see Methods). Removing transposons, there are 1773 duplicatedgenes, yielding a tandem duplication frequency of 6.8% in theminimized genome. Within these arrays, we detected 937 I-genes. These genes were rarely duplicates themselves (Supple-mental Information I). As expected, and as is the case for G-genes, a significant fraction (24.7%) of I-genes are transposons.After transposons were removed, there were 704 I-genes remain-ing, or 2.65% of the minimized genome. Therefore, a gene in an“average or typical” gene family would be positioned as an I-gene2.6% of the time if they were randomly distributed. I-gene pseu-dogenes were targeted by small RNAs to about the same extent asG-gene pseudogenes (136 bp/average pseudogene, SupplementalInformation 1); this is about half of that expected of annotatedtransposons.
Protocol 4: Defining nonsyntenic regions
Some gene families included genes that were preferentially posi-tioned in “rearrangement-prone” regions of chromosomes, genesthat were not flanked by syntenic markers. This lack of syntenywas determined by scanning columns of most-homologous chro-
mosomal/supercontig positions in a spreadsheet (SupplementalInformation 2) and confirmed using SynMap (Methods). Geneslocated in rearrangement-prone regions could not be subjected tothe flanking gene method, so we could not test for transpositiondirectly. Interestingly, some gene families were significantlyover-represented in these nonsyntenic regions. Genes encodingJACALIN lectins and FAD oxidoreductases (FADoxidor) are ex-emplary, with 46% (6/13) and 59% (10/17) of the genes, respec-tively, located in regions without synteny (Table 1). Almost all ofthe rest were invalidated for technical reasons, which can becaused by rearrangements as well. Only 10% of jacalin andFADoxidors could be analyzed, even though all were detectablein Cp. These two gene families—and probably hundreds of other,similar families that we have not analyzed—also have veryhigh local (tandem) duplication frequencies. Genes positioned inregions we found to be in rearrangement-prone regions weredenoted “No Synteny” in Table 1 (and “No” in SupplementalInformation 1). Even within essentially ancestral families, bothindividuals and clades of “No Synteny” genes can occur, com-prising meaningful data.
Control 1: Genes that are known to have transposed
In addition to regions of the genome that are more likely tocontain transposed copies of genes, we wanted to examine classesof genes that are known to have transposed in order to comparethem with gene families that we hypothesized to have trans-posed.
Zhang et al. (2005) annotated 69 retropositioned genes inthe Arabidopsis genome, with one being a tandem duplicate. Allare intronless compared with their 51 probable genes of origin.The “parents” of retroposons, a small but “normal” set of genes,are not present at their ancestral position (“not ancestral” in
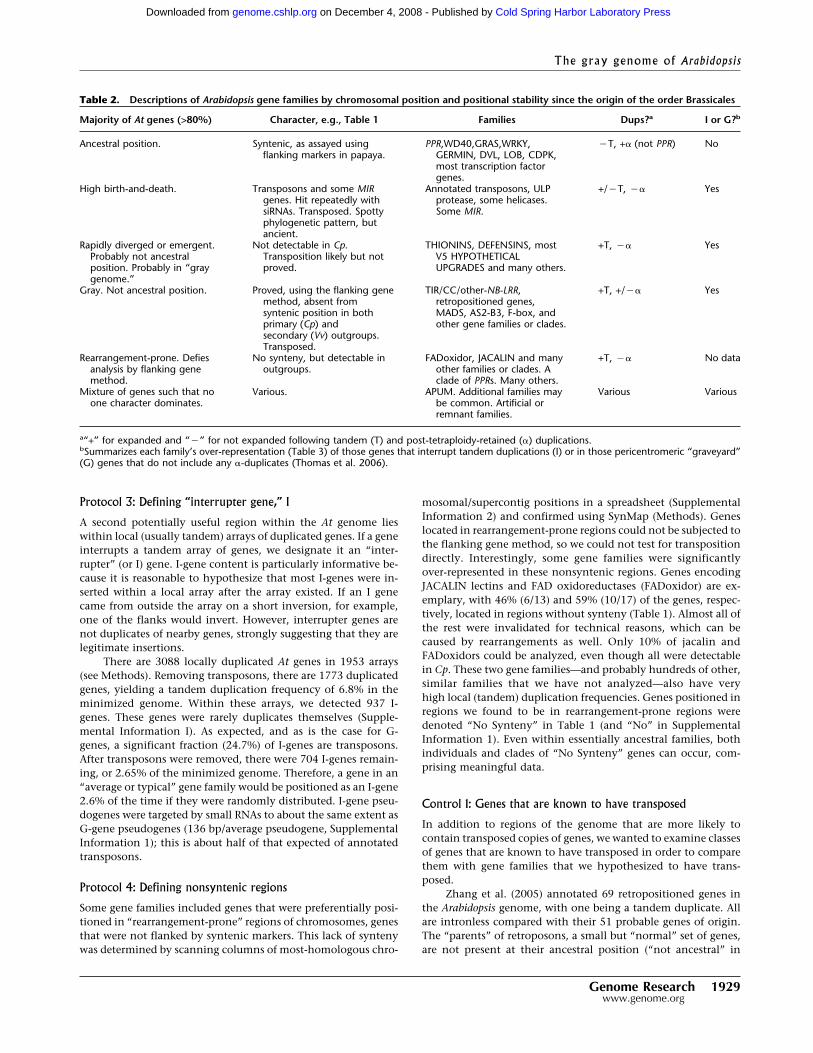
Table 2. Descriptions of Arabidopsis gene families by chromosomal position and positional stability since the origin of the order Brassicales
Majority of At genes (>80%) Character, e.g., Table 1 Families Dups?a I or G?b
Ancestral position. Syntenic, as assayed usingflanking markers in papaya.
PPR,WD40,GRAS,WRKY,GERMIN, DVL, LOB, CDPK,most transcription factorgenes.
�T, +� (not PPR) No
High birth-and-death. Transposons and some MIRgenes. Hit repeatedly withsiRNAs. Transposed. Spottyphylogenetic pattern, butancient.
Annotated transposons, ULPprotease, some helicases.Some MIR.
+/�T, �� Yes
Rapidly diverged or emergent.Probably not ancestralposition. Probably in “graygenome.”
Not detectable in Cp.Transposition likely but notproved.
THIONINS, DEFENSINS, mostV5 HYPOTHETICALUPGRADES and many others.
+T, �� Yes
Gray. Not ancestral position. Proved, using the flanking genemethod, absent fromsyntenic position in bothprimary (Cp) andsecondary (Vv) outgroups.Transposed.
TIR/CC/other-NB-LRR,retropositioned genes,MADS, AS2-B3, F-box, andother gene families or clades.
+T, +/�� Yes
Rearrangement-prone. Defiesanalysis by flanking genemethod.
No synteny, but detectable inoutgroups.
FADoxidor, JACALIN and manyother families or clades. Aclade of PPRs. Many others.
+T, �� No data
Mixture of genes such that noone character dominates.
Various. APUM. Additional families maybe common. Artificial orremnant families.
Various Various
a“+” for expanded and “�” for not expanded following tandem (T) and post-tetraploidy-retained (�) duplications.bSummarizes each family’s over-representation (Table 3) of those genes that interrupt tandem duplications (I) or in those pericentromeric “graveyard”(G) genes that do not include any �-duplicates (Thomas et al. 2006).
The gray genome of Arabidopsis
Genome Research 1929www.genome.org
Cold Spring Harbor Laboratory Press on December 4, 2008 - Published by genome.cshlp.orgDownloaded from
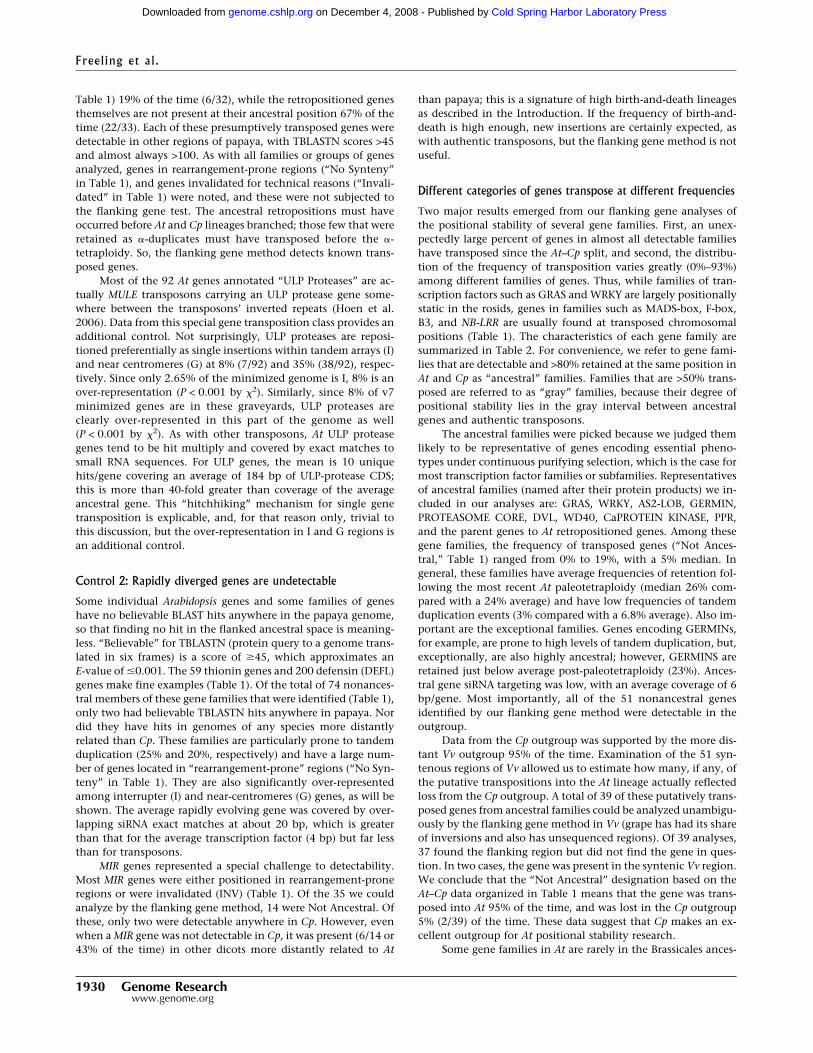
Table 1) 19% of the time (6/32), while the retropositioned genesthemselves are not present at their ancestral position 67% of thetime (22/33). Each of these presumptively transposed genes weredetectable in other regions of papaya, with TBLASTN scores >45and almost always >100. As with all families or groups of genesanalyzed, genes in rearrangement-prone regions (“No Synteny”in Table 1), and genes invalidated for technical reasons (“Invali-dated” in Table 1) were noted, and these were not subjected tothe flanking gene test. The ancestral retropositions must haveoccurred before At and Cp lineages branched; those few that wereretained as �-duplicates must have transposed before the �-tetraploidy. So, the flanking gene method detects known trans-posed genes.
Most of the 92 At genes annotated “ULP Proteases” are ac-tually MULE transposons carrying an ULP protease gene some-where between the transposons’ inverted repeats (Hoen et al.2006). Data from this special gene transposition class provides anadditional control. Not surprisingly, ULP proteases are reposi-tioned preferentially as single insertions within tandem arrays (I)and near centromeres (G) at 8% (7/92) and 35% (38/92), respec-tively. Since only 2.65% of the minimized genome is I, 8% is anover-representation (P < 0.001 by �2). Similarly, since 8% of v7minimized genes are in these graveyards, ULP proteases areclearly over-represented in this part of the genome as well(P < 0.001 by �2). As with other transposons, At ULP proteasegenes tend to be hit multiply and covered by exact matches tosmall RNA sequences. For ULP genes, the mean is 10 uniquehits/gene covering an average of 184 bp of ULP-protease CDS;this is more than 40-fold greater than coverage of the averageancestral gene. This “hitchhiking” mechanism for single genetransposition is explicable, and, for that reason only, trivial tothis discussion, but the over-representation in I and G regions isan additional control.
Control 2: Rapidly diverged genes are undetectable
Some individual Arabidopsis genes and some families of geneshave no believable BLAST hits anywhere in the papaya genome,so that finding no hit in the flanked ancestral space is meaning-less. “Believable” for TBLASTN (protein query to a genome trans-lated in six frames) is a score of �45, which approximates anE-value of �0.001. The 59 thionin genes and 200 defensin (DEFL)genes make fine examples (Table 1). Of the total of 74 nonances-tral members of these gene families that were identified (Table 1),only two had believable TBLASTN hits anywhere in papaya. Nordid they have hits in genomes of any species more distantlyrelated than Cp. These families are particularly prone to tandemduplication (25% and 20%, respectively) and have a large num-ber of genes located in “rearrangement-prone” regions (“No Syn-teny” in Table 1). They are also significantly over-representedamong interrupter (I) and near-centromeres (G) genes, as will beshown. The average rapidly evolving gene was covered by over-lapping siRNA exact matches at about 20 bp, which is greaterthan that for the average transcription factor (4 bp) but far lessthan for transposons.
MIR genes represented a special challenge to detectability.Most MIR genes were either positioned in rearrangement-proneregions or were invalidated (INV) (Table 1). Of the 35 we couldanalyze by the flanking gene method, 14 were Not Ancestral. Ofthese, only two were detectable anywhere in Cp. However, evenwhen a MIR gene was not detectable in Cp, it was present (6/14 or43% of the time) in other dicots more distantly related to At
than papaya; this is a signature of high birth-and-death lineagesas described in the Introduction. If the frequency of birth-and-death is high enough, new insertions are certainly expected, aswith authentic transposons, but the flanking gene method is notuseful.
Different categories of genes transpose at different frequencies
Two major results emerged from our flanking gene analyses ofthe positional stability of several gene families. First, an unex-pectedly large percent of genes in almost all detectable familieshave transposed since the At–Cp split, and second, the distribu-tion of the frequency of transposition varies greatly (0%–93%)among different families of genes. Thus, while families of tran-scription factors such as GRAS and WRKY are largely positionallystatic in the rosids, genes in families such as MADS-box, F-box,B3, and NB-LRR are usually found at transposed chromosomalpositions (Table 1). The characteristics of each gene family aresummarized in Table 2. For convenience, we refer to gene fami-lies that are detectable and >80% retained at the same position inAt and Cp as “ancestral” families. Families that are >50% trans-posed are referred to as “gray” families, because their degree ofpositional stability lies in the gray interval between ancestralgenes and authentic transposons.
The ancestral families were picked because we judged themlikely to be representative of genes encoding essential pheno-types under continuous purifying selection, which is the case formost transcription factor families or subfamilies. Representativesof ancestral families (named after their protein products) we in-cluded in our analyses are: GRAS, WRKY, AS2-LOB, GERMIN,PROTEASOME CORE, DVL, WD40, CaPROTEIN KINASE, PPR,and the parent genes to At retropositioned genes. Among thesegene families, the frequency of transposed genes (“Not Ances-tral,” Table 1) ranged from 0% to 19%, with a 5% median. Ingeneral, these families have average frequencies of retention fol-lowing the most recent At paleotetraploidy (median 26% com-pared with a 24% average) and have low frequencies of tandemduplication events (3% compared with a 6.8% average). Also im-portant are the exceptional families. Genes encoding GERMINs,for example, are prone to high levels of tandem duplication, but,exceptionally, are also highly ancestral; however, GERMINS areretained just below average post-paleotetraploidy (23%). Ances-tral gene siRNA targeting was low, with an average coverage of 6bp/gene. Most importantly, all of the 51 nonancestral genesidentified by our flanking gene method were detectable in theoutgroup.
Data from the Cp outgroup was supported by the more dis-tant Vv outgroup 95% of the time. Examination of the 51 syn-tenous regions of Vv allowed us to estimate how many, if any, ofthe putative transpositions into the At lineage actually reflectedloss from the Cp outgroup. A total of 39 of these putatively trans-posed genes from ancestral families could be analyzed unambigu-ously by the flanking gene method in Vv (grape has had its shareof inversions and also has unsequenced regions). Of 39 analyses,37 found the flanking region but did not find the gene in ques-tion. In two cases, the gene was present in the syntenic Vv region.We conclude that the “Not Ancestral” designation based on theAt–Cp data organized in Table 1 means that the gene was trans-posed into At 95% of the time, and was lost in the Cp outgroup5% (2/39) of the time. These data suggest that Cp makes an ex-cellent outgroup for At positional stability research.
Some gene families in At are rarely in the Brassicales ances-
Freeling et al.
1930 Genome Researchwww.genome.org
Cold Spring Harbor Laboratory Press on December 4, 2008 - Published by genome.cshlp.orgDownloaded from

tral position, if such a position ever existed. These genes behavelike slow transposons. Retropositioned genes (as expected), dis-ease-resistance genes (mainly TIR/CC-NB-LRRs), MADS-box,AB13-Vp1-B3a, many F-box genes, and a large group of genescalled “Expressed in V6, Hypotheticals in V5” are the foundingmembers of what we now call “the gray genome.”
Two of the gray families require special explanations be-cause their membership is so large. Genes annotated as encodingan F-box protein are numerous, usually occur in local clustersand are rarely retained post-paleotetraploidy. Preliminary exami-nation also indicated that they were often “Not Ancestral.” Wesampled ∼20 F-box genes on each of the five At chromosomes inorder to obtain the estimate given in Table 1 of 79% “Not An-cestral,” of which 78% were detectable in Cp (that is, 22% were“rapidly diverged”). Another gene category is not a family at all,but a collection of genes that were annotated as “Hypothetical”in v5, but upgraded to “Unknown” or “Expressed” in v6, usuallyon the basis of cDNA sequence. These 926 genes were so numer-ous that we made our criterion for “flanking” as rigorous as pos-sible: We only analyzed genes that were flanked perfectly by theiradjacent, orthologous genes in At and Cp based on the bestBLASTN hit only (Methods). This stringency inflated greatly thenumber and proportion of those genes showing “No Synteny.”Because we do not want this proportion compared with the “NoSynteny” value of any other family, we include this number inTable 1 only as a footnote. Among those 297 upgraded hypo-theticals that were analyzed by the flanking gene method, 68%were “Not Ancestral,” of which 28% were detectable in Cp some-where, and the remainder were rapidly diverged (like defensins).So, this category is predominantly rapidly diverged, but is alsogray. The unverified upgraded V5 category could, in theory, haveincluded unannotated transposons, which would provide a readyexplanation for transposability, but this “unannotated transpo-son” hypothesis will be disproved in the last section of theseResults.
Detailed positional analysis of the ancestral At PPR gene family
We wanted to examine one ancestral family in detail. We chosethe 364 analyzable genes encoding PPR proteins because they arerarely duplicated in tandem (2.2%) and have a relatively highproportion (15%; 35/230) of transposition for an ancestral fam-ily, making statistics meaningful. PPR proteins are thought tofunction in organellar biogenesis and, sometimes, in fertility andfertility restoration (Saha et al. 2007). Additionally, previouswork on these genes indicated that “at least some” PPR geneswere nomadic within the family Brassicacea because they did notshare syntenic positions between At and its close relative Brassicarapis (Geddy and Brown 2007). We were able to analyze abouttwo-thirds (230) of the PPR genes by using the flanking genemethod. Based on analyses using both Cp and Vv outgroups, the15% of genes that are not ancestral are, with one exception, newtranspositions into the At lineage, not losses of the gene in the Cpprimary outgroup. Building phylogenetic trees with PPR genes iscomplicated (Howell et al. 2007); we are fortunate that the Car-rington laboratory had completed a tree including almost all PPRgenes, and made it available to us. After decorating this tree withour data, it is clear that proved PPR insertions seem to occur atrandom over the tree (Supplemental Information 3), demonstrat-ing that there is no particular clade that is more likely to haveproved transposed members. There is, however, a clade withinthis tree that cannot be analyzed for being new insertions be-
cause they are preferentially located in nonsyntenic (rearrange-ment-prone) chromosomal regions; these are the nomadic genesdescribed previously (Geddy and Brown 2007). So, even thoughour flanking gene method could not test it, this detectable cladeis likely to be transposed. Interestingly, this clade, which is pres-ent in two regions of chromosome 1, is also targeted by a specificset of tasiRNAs derived from MIR173 (Howell et al. 2007).
Among transposed PPR genes, the median number of genesinserted at a new position, counting the initial PPR gene, is one,although insertions including several genes do occur. Figure 2shows a PPR gene transposed adjacent to three additional trans-posed genes. Three cases of multiple transposed genes wereexamined in detail using the CoGeBlast tool and our GEvoViewer (Methods); these three tiny syntenic groups do not existin Cp or Vv.
Genes in gene families that are significantly over- andunder-represented in G and I chromosomal space
As evidenced in our control experiments, both I-space and G-space are enriched for pseudogenes and transposable elements,perhaps because genes in theses regions are lost via a pseudogenepathway, rather than via deletion. Given this, we predict that anyfamily that has a larger proportion of members that have trans-posed into new chromosomal positions (based on our flankinggene method) will also have a higher proportion of I-genes andG-genes. This reasoning allows us to estimate indirectly the po-sitional stability of the average At gene whether or not it is de-tectable in an outgroup.
For the calculations that follow, we use the 26,646 genes/gene-spaces of the minimized TAIR v7 genome. Recall our previ-ous results: Were a gene’s position random, the typical mini-mized gene has an 8.4% chance of being G and a 2.6% chance ofbeing I.
As a control for gray gene families, we used a collection ofgenes that that are largely (95%) positioned in the ancestral or-der. Based on previous work, we focused on genes encoding tran-scription factors. Of the 1975 genes encoding transcription fac-tors in the 2005 edition of the DATF database, http://datf.cbi.pku.edu.cn/, many of the families had fewer than 20genes, and five of the smaller families were exceptional in thatthey tended to be locally duplicated at above the average fre-quency of about 6%, and to be retained as pairs post-� tetra-ploidy well below the average frequency of 24%. These familieswere ARF, AS2 A, and HSF, as well as the two gray families B3 andMADS. Removing these outlier and unpopulated DATF familiesleft a core of 1265 genes encoding transcription factors that wenow call “95% ancestral.” Table 3 compares our I and G repre-sentation data for genes in Gray families, rapidly diverged fami-lies and upgraded hypotheticals (v5 hypotheticals to v7 ex-pressed) to expectations derived from this “95% ancestral” con-trol gene group. These expectations are: I = 1.1%, G = 1.9%.These control values are used to derive the expected numbers ofTable 3. The legend of Table 3 indicates exactly which familiesconstitute these three experimental groups of genes.
The data of Table 3 indicate that all three categories ofgenes—gray, rapidly diverged and upgraded hypotheticals—aresignificantly (P < 0.05 by �2) over-represented in I and G space ascompared with expectations derived by the “95% ancestral” con-trol group of genes encoding transcription factors. Gray genes aresignificantly over-represented in both I and G space. This sup-ports our hypothesis that the increased frequency of insertion of
The gray genome of Arabidopsis
Genome Research 1931www.genome.org
Cold Spring Harbor Laboratory Press on December 4, 2008 - Published by genome.cshlp.orgDownloaded from

gray genes into syntenic regions is a reflection of overall higherfrequency of insertional activity or retention. However, if allgenes transposed at about the same rate, and the ones we seetransposed are those not removed by purifying selection in I andG, then our control group of genes encoding transcription factors(“95% ancestral”) must have been continuously removed frommost regions of chromosome, including I and G space, by somemechanism other than the point mutation/pseudogene path-way, since pseudogenes are vastly over-represented in I and Gspace.
Most unexpected is the comparative data for the averageminimized At gene (Table 3, last row). None of the experimentalcategories of genes are dramatically atypical except for the huge23% G representation of upgraded hypothetical genes. What isatypical is the data for the “95% ancestral” control genes them-selves, as if the control is far more positionally ancestral than isthe average gene. In general, the data summarized in Table 3paints the average At gene dark gray, behaving more like a slowtransposon and less like a static ancestral locus since the splitbetween At and Cp.
Discussion
We have shown that a significant fraction of genes in Arabidopsis(At) have changed location, or transposed, at some point sincethe divergence of this species from another species in the orderBrassicales, papaya (Cp). Although our sampling was certainlybiased by the families we chose to examine, the 10 ancestral genefamilies we chose showed a median transposition frequency of∼5% (Table 1). This indicates that even in the most positionallyconserved families, a substantial fraction of genes have trans-posed since the At–Cp split. Most of these transpositions aresingle gene events.
Although a comprehensive analysis of all At genes using theflanking gene method is beyond the scope of this work, we cancalculate an approximate minimum transposition frequency. Atotal of 2.6% of the 26,646 minimized At genes are Interrupter (I)genes, and are certainly insertions, and 8.4% are Graveyard (G)genes. We suggest that many of the G-genes are in fact trans-posed, given the observation that gene families that are over-represented among I-genes are invariably over-representedamong G-genes (Table 3). The five graveyards we sum to be “G”are the largest, but not the only pseudogene/transposon-rich re-
gions in the genome, so we add another 1% of the genes for eachchromosome, or 5%. Of the remaining genome, at least 2000genes are transposed genes in those gray families we have iden-tified. That leaves 20,231 in potentially ancestral families (>80%ancestral), and these average 5% transposed, or at least 1012genes that escaped from ancestral positions. Based on these esti-mates, we conservatively estimate that at least 7231 genes, or27% of the minimized At genome, transposed within the Arabi-dopsis lineage after the Cp–At divergence. This is a conservativeestimate because our data suggests that the average gene is farmore likely to be transposed than are members of highly ances-tral families of genes (Table 3).
We have also shown that transposition is nonrandom withrespect to gene function. Some large gene families are far morelikely to have members that have transposed than others. A totalof 79% of the F-box genes sampled, for instance, are located inthe nonancestral position. Since 78% of these are detectable inthe outgroup, most F-box genes are newly transposed. On theother hand, none of the 30 GRAS transcription factor genes weretransposed (Table 1). These data clearly indicate a bias with re-spect the frequency of transposed genes within a given family.
Even though the vast majority of genes we have examinedhave no defined function, a trend can be clearly discerned. Genesencoding products known to interact specifically with rapidlychanging biotic and abiotic extrinsic factors are far more likely tohave transposed than genes encoding products involved in rela-tively stable processes. NB-LRR gene products must rapidlychange to meet new pathogenic challenges (Jones and Dangl2006), as must many plant defensins, which have been impli-cated in defense against fungal pathogens (Thomma et al. 2002).Similarly, it has been suggested that rapidly evolving and posi-tively selected F-box genes are part of an innate immune systemwhose function is to degrade various bacterial and viral toxicproteins (Thomas 2006). Although MADS box genes are not re-quired for pathogen response, many of them are involved infloral organ identity and boundary determination (Nam et al.2003), or flowering time (Dennis and Peacock 2007). Given ex-pected fluctuations in specific pollinator species, flower shapeand pollen availability over the at least 50 million year lifespan ofthe Brassicales, MADS-box genes may well have been particularlyexposed to fluctuating selection. In contrast, we hypothesize thatancestral gene families, defined in Tables 1 and 2 as families with>80% genes in the ancestral position, often encode proteins in-
Table 3. Over-representation of gray and rapidly diverged gene families in Graveyard (G) and Interrupter (I) chromosomal positions, andhow the average gene is positioned more like a gray gene than a control transcription factor gene (TF)
No. of genes Experimental categoriesNo.of I
No. ofI-TF
ExpectedI/I-TF Freq. I
No.of G
No. ofG-TF
ExpectedG/G-TF Freq. G
358 Gray (R,MADS, B3, retropositioned) 12 4 3.0 3.4% 14 7 2.0 3.9%653 Rapidly diverged (F-box, thionins, defensins) 32 7 4.6 4.9% 48 12 4.0 7.4%
1261a V5 Hypothetical upgraded in V7 90 14 6.4 7.1% 289 24 12.0 23%Null hypothesis 1 1
26,646 TAIR v7 Minimized: The average gene 702 2.6% 2229 8.4%1265 Control: “95% ancestral” TF genes 14 1.1% 24 1.9%
Families are the same as in Tables 1 and 2. Two of these families are mixed gray-ancestral (MADS) and mixed gray rapidly diverged (F-box). Allcalculations are from within the minimized genome. (#) The number of genes in the experimental and expected columns; (I) interrupter genes withinlocal repeat arrays; (#I-TF) the number of genes expected if the genes in the experimental “family categories” were positioned as expected of the control“95% ancestral” TF group (bottom row); (G) the five pericentromeric regions. The null hypotheses, row 4, state that the experimental genes will bepositioned like the “95% ancestral” control genes. The null hypothesis is uniformly incorrect. The bottom row is the “95% ancestral” TF control groupof genes; these are the exceptional genes.a22% of these genes are hit more than once with siRNAs (Supplementary Information 1, Column W). When these genes are removed, this category isonly slightly less over-represented in I and G. That some transposons are unannotated in At does not explain these data.
Freeling et al.
1932 Genome Researchwww.genome.org
Cold Spring Harbor Laboratory Press on December 4, 2008 - Published by genome.cshlp.orgDownloaded from

volved in pathways that seem likely to be under continuous se-lection. Transcription factors that carry out developmental pro-grams, for example, must bind downstream promoter elementsthat may evolve over time, but these TF genes are unlikely can-didates for fluctuating selection. Similarly, PPR genes (85% an-cestral) are largely targeted to the mitochondria or chloroplastsand are thought to be involved in RNA processing in these or-ganelles (Small and Peeters 2000; Lurin et al. 2004; Saha et al.2007). It seems unlikely that these genes would be subjected tostrong fluctuating selection (although exceptional PPR geneshave been implicated in cytoplasmic incompatibilities/fertility).In summary, it makes sense that the gray and rapidly divergedgene families analyzed so far correlate with selective environ-ments that fluctuate, while ancestral genes may encode functionsthat are under continuous selection.
Why such dramatic differences in transposition frequencybetween different categories of genes? There are at least two rea-sonable and mutually nonexclusive explanations for the trans-position bias we observe. The first is that all genes are competentto transpose, and all genes do so at an equal frequency overevolutionary time, but that selection removes transposed copiesof some genes or classes of genes more efficiently than others.The other possibility is that some genes or gene families are in-trinsically more prone to transpose because a propensity fortransposition has a long-term benefit to the organism and hasbeen embedded into the gene’s sequence or into features of itspreferred chromosomal positions. The first hypothesis reliespurely on direct selection on gene function; the second on whathas been called “second order selection,” which can be thoughtof as a mechanism that increases the propensity to produce newalleles via any distinctive mechanism (Pennisi 1998; Tenaillon etal. 2001). We will briefly discuss each of these possibilities.
The purely selectionist hypothesis suggests that negative(purifying) selection removes transposed copies of members ofsome gene families preferentially, and/or positive selection fa-vors transposed copies of other gene families. Evidence in favorof negative selection comes from much previous work on thepreferential retention of genes encoding transcription factors orother interactive gene products following paleotetraploidy inArabidopsis, as predicted by the Gene Balance Hypothesis(Birchler and Veitia 2007). In this case, selection operates to pre-vent imbalanced gene product dosage. For the same reason, se-lection would be expected to disfavor both tandem duplicationsand duplicative transpositions of those same genes favored fol-lowing paleotetraploidy (Freeling and Thomas 2006; Freeling2008), and this is what we have observed in almost all of the 24gene categories of Table 1. GRAS transcription factors, for in-stance have a transposition frequency of 0% (0/29), a tandemduplication frequency of 3% (1/29), and an � duplicate retentionfrequency of 48%. In contrast, F-box genes have a transpositionfrequency of 79% (78% detectable), a high tandem duplicationfrequency of 26%, and low �-duplicate retention frequency of13%. Cannon and coworkers (Cannon et al. 2004) point out theextremes of this potentially reciprocal relationship, and evidencefor it has grown (Freeling and Thomas 2006; Freeling 2008).These observations support the hypothesis that the lack of trans-posed copies of some genes is a consequence of negative selectionagainst unbalanced gene product levels.
Our data also supports the idea that positive selection favorstransposition of genes, in particular gene families. Here, we as-sume that transposed copies of genes are more likely to be ex-pressed in novel ways, which could be selectively advantageous if
the factors with which they interact are constantly changing. Ifpositive selection is strong but acts only periodically, the resultcould be a constantly shifting population of genes within a fam-ily whose positions would vary over time. Clear examples of thisare the NB-LRR genes (91% transposed). As new or altered patho-gens are encountered, old copies of these genes would becomeselectively neutral, or even deleterious, and would then be lost.New copies with altered function would continually appear andbe selected for. In this case, the intrinsic (and blindly) dynamicnature of the genome may have been harnessed by selection toproduce useful variation in the form of a population of genes atvarious positions. This process is no different in principle fromselection on random mutations in coding sequences; the “muta-tion” in this case being a change in location rather than a changein coding sequence. In contrast, gene families whose basic char-acteristics are not selected to change, or where negative selectionefficiently removes duplicated copies of genes, would not be ex-pected to exhibit a high apparent rate of transposition. Thus,both negative and positive selection could play a role in thefrequency that transposed copies of genes are retained or lost.
So what of second order selection? Is it possible that mem-bers of some gene families are more prone to transpose thanothers? Although equivocal, we do have supporting evidence.Our flanking gene method examines regions of the genome thatare relatively stable in order to provide evidence of new inser-tions. However, there are two other independent measures ofinsertional activity. If a gene is inserted into a tandem array, it isalmost certainly transposed. Consistent with this, roughly aquarter of the sequences inserted into tandem arrays are trans-posons. Among the other genes more likely to have inserted intothese arrays are members of gene families, gray gene families,that we had determined to transpose more frequently using theflanking gene method (Table 3). A second independent methodfor measuring transposition frequency involves examination ofthe graveyards. These regions of the genome have an excess oftransposable elements. Unlike euchromatic regions of the ge-nome, they are also enriched for pseudogenes, suggesting thatinsertions of all kinds are inefficiently removed from these grave-yards. As in the case of interrupter genes, graveyard genes aresignificantly enriched for gene families that we had determinedto transpose more frequently (last row of Table 3). This is true ofboth potentially functional genes as well as pseudogenes.
Together, these data suggest that the average gene encoding,for instance, a transcription factor (the 95% ancestral controlfamilies), transposes into interrupter gene space at a threefoldlower rate than the average gene in a gray family and five- tosixfold less than a gene in a “rapidly diverged” family. There aretwo reasons that this argument is equivocal. First, selectionagainst dosage changes or ectopic expression could act to removeinsertions into tandem arrays or the graveyards in the same waythat it acts to remove insertions into more stable regions of thegenome. However, the presence of large numbers of inactivepseudogenes in the graveyards suggests that insertions into theseheterochromatic regions are often lost not by deletion, but by theslow accumulation of point mutations. The absence of signifi-cant numbers of transcription-factor pseudogenes in the grave-yards is most easily explained if these genes simply transposeinto these regions of the genome at a reduced rate. Second, biasedgene-loss mechanisms could also account for these data. If our95% ancestral transcription factor genes were removed from Iand G space preferentially by a special deletion mechanism, anddid not last long enough to be removed by the pseudogene path-
The gray genome of Arabidopsis
Genome Research 1933www.genome.org
Cold Spring Harbor Laboratory Press on December 4, 2008 - Published by genome.cshlp.orgDownloaded from

way that obviously operates in I and G space, then these data arealso explained. Were this contrived gene-loss mechanism real,this too would be biased and, therefore, of great interest.
Most or all plant lineages have survived repeated paleo-tetraploidies, and each of these events is a saltation that musthave greatly reduced diversity. The Arabidopsis genome has evi-dence of four paleotetraploidies within its genome, and possiblymore that happened too long ago to see clearly. Population-levelestimates of NB-LRR gene polymorphism and selection do finddiversity (Bakker et al. 2006; Shen et al. 2006; Borevitz et al.2007), but it is not yet clear whether or not this diversity wasnecessary in the wild for a plant to have survived pathogens. Ifthe specificity of the plant immune system is actually held at thepopulation level in a great bank of alleles and plus–minus poly-morphisms—for example, very many different NB-LRR se-quences—then, the early descendants of any polyploid were cer-tainly immune deficient. These tiny populations, beginning withone plant, had no bank of diverse alleles; an allotetraploid has atmost four alleles for any one locus. These post-tetraploid popu-lations not only survived, they repeatedly founded major cladesof plant life. It is reasonable to entertain the possibility that NB-LRR and similar genes evolved, by second order selection, mecha-nisms to accelerate diversity.
No matter what mechanism explains why some genes endup transposed more than other genes, gene movement charac-terizes a large or even the major portion of the Brassicales branchof the Arabidopsis lineage. The new information conferred uponthe inserted genes due to their new chromosomal locations hasprobably had a significant impact on all evolutionary trends andpossibilities. But what is the extent of this impact? The ∼3000species in the family Brassicaceae (crucifers) inhabit all conti-nents except Antarctica, and species exist in virtually all sorts ofenvironments including all edaphic (soil type) environments, inthe extremes of these environments known to support plant life,and exhibit most every adaptation known to be possible in plants(Bressan et al. 2001). We need to know whether the large pro-portion of gray genes characterizing the Arabidopsis and presum-ably other Brassicaceae genomes describes all other particularlywidespread and adaptable clades. Perhaps the gray genome ex-pands along with fractionation of ancient polyploids. Alterna-tively, perhaps all plants have well-expanded gray genomes likeArabidopsis. We are at such a primitive level of knowledge involv-ing gene expansion by transposition, we can’t begin to estimatehow useful our findings are likely to be for understanding trendsin eukaryotic evolution. It does seem likely, however, that genemobility enhances evolvability, especially in intermittently hos-tile environments. Whether that mobility is a global phenom-enon, or one specialized to produce higher rates of movement ofparticular classes of genes, the intrinsically dynamic nature ofgenomes has certainly contributed to the mode and tempo ofevolution.
Methods
At data acquisition and displayThe data acquired or used in this study are listed in an Excelspreadsheet (Supplemental Information 1). Column C of thisspreadsheet is one model of every gene in the Arabidopsis ge-nome, version 7, downloaded from The Arabidopsis InformationResource (TAIR) along with a TAIR gene description. Papaya se-quence (3�) is version 4 from the Hawaii Papaya Genome Project
(Ming et al. 2008). A grape genome was obtained from the Frenchconsortium (Jaillon et al. 2007). Both of these shotgun sequenceassemblies have regions that are either unassembled or unse-quenced; these runs of “n” are color-coded orange in our align-ment viewer because our methods require that we keep track of“holes” in the sequence, since missing genes might not be miss-ing, but located in unsequenced chromosome. Small RNAs weredownloaded from the Arabidopsis Small RNA Project on 12-2007,(http://asrp.cgrb.oregonstate.edu/db/download.html; 218,928smRNA sequences). Using these to find exact matches to CDS or,if necessary, mRNA sequence, we report a number of indepen-dent hits and total base pair of subject covered by small RNAsequences.
Local repeats and Interrupter genes (I) in AtIn order to minimize the genome (Results), to calculate localrepeat frequencies (Table 1), and to locate Interrupter geneswithin tandem arrays (Table 3), we wrote a Perl script that beganwith the lowest numbered gene on each chromosome andsearched for a nearby homologous gene without skipping morethan three adjacent, ascending genes. Homology was quantifiedusing BLASTN; the query was a CDS sequence—or RNA if thegene had no CDS—and the subject was the next four CDS/RNAson the chromosome, using BLASTN at E < 0.0001. We then de-manded >50% HSP coverage of the feature. If one of these fourgenes was hit, skipped genes were labeled “I,” the lowest num-bered gene was tagged “parent” arbitrarily, the duplicates weretagged with the locus name of the parent, and the lowest num-bered duplicate became the next query in hopes of expanding thearray. These tags are noted in Supplemental Information 1 under“Brent’s duplicates.” Most of these arrays are tandem repeats, but“reverse tandems” happen, and a reverse tandem segmental in-version could—in theory—bring unwanted genes into the Inter-rupter set. We decided to not demand tandem repeats because ofthe prevalence of single gene inversions (some are visible in Fig.1). Therefore, our Interrupter gene set is expected to containsome noise.
Establishing candidate At genes for the flanking gene method,and assigning “No Synteny”The first step in our analysis was to determine whether or not anAt gene was located in a syntenic region of At–Cp aligned chro-mosome. If no syntenic region could be found, then “No Syn-teny” was recorded in Supplemental Information 1 and on Table1. To make this syntenic assessment, we constructed a list of allTAIR v7 genes and their descriptions. For each was listed, in sepa-rate columns, the best BLASTN hit to Cp at an E < 0.001, its startposition on a papaya supercontig, and each of the top fiveTBLASTN hits, E-values, scores, and start positions more signifi-cant than E = 0.1 (which is well within noise). Finally, each genehas, indicated in the last column, a link to GEvo that automati-cally anchors our alignment viewer on the BLASTN hit. By keep-ing this list (Supplemental Information 2) sorted on At genes intheir actual chromosomal order, it was possible to see whetherany particular gene was likely to be (1) present in papaya at thesyntenic position, or (2) potentially not in papaya, but sur-rounded (flanked) by At–Cp orthologs that might provide an ac-curate definition of the papaya chromosomal region where theAt gene might be expected to exist. If the former, “Ancestral” wasentered in Table 1 (and “Cp” was entered in Supplemental Infor-mation 1). If the latter, we went on to apply the flanking genemethod. Even if not flanked by orthologs, sometimes the posi-tion of an At gene hit in Cp was at the exact end of a syntenicseries of gene positions, thus indicating synteny; for this reason,
Freeling et al.
1934 Genome Researchwww.genome.org
Cold Spring Harbor Laboratory Press on December 4, 2008 - Published by genome.cshlp.orgDownloaded from

this initial test for synteny is biased toward finding ancestralgenes. To help researchers adverse to “eyeball” methods repro-duce our results, we implemented the synteny-finding algorithmDAGchainer (Haas et al. 2004) in an online application calledSynMap and now include it in our CoGe suite of genomicsdatabases and tools: http://synteny.cnr.berkeley.edu/CoGe/SynMap.pl. Settings for At–Cp: �g = 200kb; �D = 400kb; �A = 3generates DAGchainer syntenic pairs as lines of red dots andsome reassuring noise. An individual At gene may be found inthe graphic using chromosomal position and by mousing overred lines; click any red dot for an anchored At–Cp GEvo align-ment. Alternatively, below the SynMap graphic readout are linksincluding “Syntolog File.” Here, every syntenic pair (red dot) be-tween the two genomes is cataloged and each has a GEvo linkavailable by text search.
One gene category used the Supplemental Information 2prescreen for synteny in an especially rigorous way. The At TAIRv5 hypothetical genes that were upgraded to “expressed” or “un-known” in v7, called “upgraded hypotheticals,” were numerousand mostly not ancestral. We demanded that the nearest up-stream and downstream BLASTN hits (E < 0.001) were flanking.This was done in automated fashion. So, even when evidence forsynteny was strong, if there was even one intervening nonsyn-tenic hit within the flanking genes, the gene was called “NotSyntenic,” leading to a comparatively inflated number in thiscolumn of Table 1. Therefore, this number in Table 1 is replacedwith a footnote to discourage comparisons.
The flanking gene method with a primary and secondaryoutgroupWe chose one of the GEvo links on a flanking orthologous At–Cpgene very near our gene of interest and examined the regionsvisually, beginning with a graphic edition of BLASTZ output atour default settings, and choosing the option to color sequencesnot sequenced (n’s) orange. Figure 2, top and bottom, is a screen-shot of such an At–Cp syntenic region surrounding a cluster offour genes, including a PPR gene (the gene under analysis); thiscluster of potentially transposed genes is enclosed by the oval inthe At panel. The light brown rectangles, BLASTZ At–Cp hits dis-played above the Cp (top) and At (bottom) models, show noindication of any of the four genes in the expected Cp region. Atthis point we rerun the alignment using BLASTN set at an E-valueequivalent of a 15/15 exact match—which is just at the noiselevel—and also TBLASTX (translated protein to translated pro-tein); we found what BLASTZ missed ∼1% of the time. Occasion-ally, with small genes, we avoided the BLASTN 7-bp nucleationrequirement by using Chaos and other alternative alignment al-gorithms (all available and cited in GEvo.) The light-orangebands in a GEvo graphic denote unsequenced regions of papayaand grape. While there is an unsequenced DNA in the flankedregion of Figure 2, it is not big enough to hide any of the testgenes, so the genes were denoted “Not Ancestral” in Table 1 (and“new” in Supplemental Information 1). If there had been unse-quenced DNA in the flanked region large enough to “hide” halfof a test gene at a >5% probability (expert opinion), or if a nearbyinversion was judged possibly to have imported such an unse-quenced region, the test gene evaluation was terminated, and“Invalidated” was marked in Table 1 (and “INV” was marked inSupplemental Information 1). “Invalidate” is used in this studyto indicate invalidation for technical reasons. Each “Not Ances-tral” gene was verified for detectability somewhere else in the Cpgenome. The E-values/scores of the best TBLASTN hit in Cp wascompared with known noise levels of TBLASTN hits in the ge-nome. We set a score of 45—approximating a hit with an E-value
of 0.001—as the noise cutoff. Scores above this cutoff were “yes”under the “detectable?” column of Table 1. For MIR genes,BLASTN to Viridiplantae (green plants) at NCBI was performedfor each “Not Ancestral” gene. The results were often spottythroughout the plant kingdom, leading to the “high birth-and-death” notation in Tables 1 and 2, as described in the text.
After our At–Cp results were almost complete, we obtainedthe French grape genome as a second outgroup. We did not usepre-made GEvo links to anchor At:Cp:Vv orthologous chromo-somes. Rather, we created our own anchors using a tool in ourCoGe platform of comparative genomics databases and toolscalled “CoGe BLAST”: http://synteny.cnr.berkeley.edu/CoGe/CoGeBlast.pl. For example, the anchor position (yellow exons) ofAt and Cp was from a pre-made menu of GEvo links, anchor inthe middle, grape chromosome derived from CoGe BLAST, wherea Cp syntenic group of exons were merged as a BLASTN query toa Vv subject with an E < 0.0001 cutoff. The one to three mostlikely syntenic Vv regions are made into GEvo links automati-cally in CoGe BLAST and then evaluated visually. Figure 2 is theresult of one such complete At:Cp:Vv analysis. Note that the four-gene region of the “Not Ancestral,” verified PPR gene is not ineither Cp nor Vv, although the flanking markers are. Therefore,all four genes are transposed in the Brassicales branch of the Atlineage. As should be apparent, the flanking gene method wasnot automated. We judged that both the choice of candidatesyntenous regions and the invalidation by possible inversionsnearby were too biologically complicated for automation, butnot too complicated to understand if rendered as visual output.The syntenic gene lists and the GEvo multiple sequence align-ment viewer and its associated tools in our CoGe platform madeit possible for one annotator to generate the gene family datareported here in ∼400 h. A GEvo tutorial designed for the Arabi-dopsis (rosid) researcher is available in CoGe, and has been sum-marized (Lyons et al. 2008).
AcknowledgmentsWe thank all who are part of the multinational Hawaii PapayaGenome Project (http://asgpb.mhpcc.hawaii.edu/papaya/). Thisresearch was funded by National Science Foundation researchgrants DBI-0701871 to M.F. and DBI-0321726 to D.L. Brian C.Thomas was our systems administrator during the early stages ofthis work. Lakshmi Rapaka provided technical assistance.
References
Ameline-Torregrosa, C., Wang, B.B., O’Bleness, M.S., Deshpande, S.,Zhu, H., Roe, B., Young, N.D., and Cannon, S.B. 2008. Identificationand characterization of nucleotide-binding-site leucine-rich-repeatgenes in the model plant Medicago truncatula. Plant Physiol. 146:5–21.
Bakker, E.G., Toomajian, C., Kreitman, M., and Bergelson, J. 2006. Agenome-wide survey of R gene polymorphisms in Arabidopsis. PlantCell 18: 1803–1818.
Baumgarten, A., Cannon, S., Spangler, R., and May, G. 2003.Genome-level evolution of resistance genes in Arabidopsis thaliana.Genetics 165: 309–319.
Bennetzen, J.L. 2007. Patterns in grass genome evolution. Curr. Opin.Plant Biol. 10: 176–181.
Birchler, J.A. and Veitia, R.A. 2007. The gene balance hypothesis: Fromclassical genetics to modern genomics. Plant Cell 19: 395–402.
Birchler, J.A., Riddle, N.C., Auger, D.L., and Veitia, R.A. 2005. Dosagebalance in gene regulation: Biological implications. Trends Genet. 21:219–226.
Blanc, G. and Wolfe, K.H. 2004. Functional divergence of duplicatedgenes formed by polyploidy during Arabidopsis evolution. Plant Cell16: 1679–1691.
Borevitz, J.O., Hazen, S.P., Michael, T.P., Morris, G.P., Baxter, I.R., Hu,T.T., Chen, H., Werner, J.D., Nordborg, M., Salt, D.E., et al. 2007.
The gray genome of Arabidopsis
Genome Research 1935www.genome.org
Cold Spring Harbor Laboratory Press on December 4, 2008 - Published by genome.cshlp.orgDownloaded from
Genome-wide patterns of single-feature polymorphism in Arabidopsisthaliana. Proc. Natl. Acad. Sci. 104: 12057–12062.
Bosch, N., Caceres, M., Cardone, M.F., Carreras, A., Ballana, M.R.,Armengol, L., and Estivill, X. 2007. Chracterization and evolution ofthe novel gene family FAM90A in primates originated by multipleduplication and rearrangement events. Hum. Mol. Genet. 16:2572–2582.
Bowers, J.E., Chapman, B.A., Rong, J., and Paterson, A.H. 2003.Unravelling angiosperm genome evolution by phylogenetic analysisof chromosomal duplication events. Nature 422: 433–438.
Bressan, R.A., Zhang, C., Zhang, H., Hasegawa, P.M., Bohnert, H.J., andZhu, J.-K. 2001. Lerning from the Arbidopsis experience. The nextgene search pradigm. Plant Physiol. 127: 1354–1360.
Brookfield, J.F. 1986. The population biology of transposable elements.Philos. Trans. R. Soc. Lond. B Biol. Sci. 312: 217–226.
Cannon, S.B., Mitra, A., Baumgarten, A., Young, N.D., and May, G.2004. The roles of segmental and tandem gene duplication in theevolution of large gene families in Arabidopsis thaliana. BMC PlantBiol. 4: 10. doi: 10.1186/1471-2229-4-10.
Dennis, E.S. and Peacock, W.J. 2007. Epigenetic regulation of flowering.Curr. Opin. Plant Biol. 10: 520–527.
Dietrich, C.R., Cui, F., Packila, M.L., Li, J., Ashlock, D.A., Nikolau, B.J.,and Schnable, P.S. 2002. Maize Mu transposons are targeted to the5� untranslated region of the gl8 gene and sequences flanking Mutarget-site duplications exhibit nonrandom nucleotide compositionthroughout the genome. Genetics 160: 697–716.
Fischer, A., Baum, N., Saedler, H., and Theissen, G. 1995. Chromosomalmapping of the MADS-box multigene family in Zea mays revealsdispersed distribution of allelic genes as well as transposed copies.Nucleic Acids Res. 23: 1901–1911.
Fortna, A., Kim, Y., MacLaren, E., Marshall, K., Hahn, G., Meltesen, L.,Brenton, M., Hink, R., Burgers, S., Hernandez-Boussard, T., et al.2004. Lineage-specific gene duplication and loss in human and greatape evolution. PLoS Biol. 2: e207. doi: 10.137l/journal.pbio,.0020207.
Freeling, M. 2008. The evolutionary position of subfunctionalization,downgraded. Genome Dyn. 4: 25–40.
Freeling, M. and Thomas, B.C. 2006. Gene-balanced duplications, liketetraploidy, provide predictable drive to increase morphologicalcomplexity. Genome Res. 16: 805–814.
Friedman, A.R. and Baker, B.J. 2007. The evolution of resistance genes inmulti-protein plant resistance systems. Curr. Opin. Genet. Dev. 17:493–499.
Gale, M.D. and Devos, K.M. 1998. Comparative genetics in the grasses.Proc. Natl. Acad. Sci. 95: 1971–1974.
Geddy, R. and Brown, G.G. 2007. Genes encoding pentatricopeptiderepeat (PPR) proteins are not conserved in location in plant genomesand may be subject to diversifying selection. BMC Genomics 8: 130.doi: 10.1186-1471-2164-8-130.
Gordon, L., Yang, S., Tran-Gyamfi, M., Baggott, D., Christensen, M.,Hamilton, A., Crooijmans, R., Groenen, M., Lucas, S., Ovcharenko,I., et al. 2007. Comparative analysis of chicken chromosome 28provides new clues to the evolutionary fragility of gene-richvertebrate regions. Genome Res. 17: 1603–1613.
Haas, B.J., Delcher, A.L., Wortman, J.R., and Salzberg, S.L. 2004.DAGchainer: A tool for mining segmental genome duplications andsynteny. Bioinformatics 20: 3643–3646.
Hoen, D.R., Park, K.C., Elrouby, N., Yu, Z., Mohabir, N., Cowan, R.K.,and Bureau, T.E. 2006. Transposon-mediated expansion anddiversification of a family of ULP-like genes. Mol. Biol. Evol. 23:1254–1268.
Howell, M.D., Fahlgren, N., Chapman, E.J., Cumbie, J.S., Sullivan, C.M.,Givan, S.A., Kasschau, K.D., and Carrington, J.C. 2007.Genome-wide analysis of the RNA-DEPENDENT RNAPOLYMERASE6/DICER-LIKE4 pathway in Arabidopsis revealsdependency on miRNA- and tasiRNA-directed targeting. Plant Cell19: 926–942.
Jaillon, O., Aury, J.M., Noel, B., Policriti, A., Clepet, C., Casagrande, A.,Choisne, N., Aubourg, S., Vitulo, N., Jubin, C., et al. 2007. Thegrapevine genome sequence suggests ancestral hexaploidization inmajor angiosperm phyla. Nature 449: 463–467.
Jiang, N., Bao, Z., Zhang, X., Eddy, S.R., and Wessler, S.R. 2004.Pack-MULE transposable elements mediate gene evolution in plants.Nature 431: 569–573.
Jones, J.D. and Dangl, J.L. 2006. The plant immune system. Nature 444:323–329.
Juretic, N., Hoen, D.R., Huynh, M.L., Harrison, P.M., and Bureau, T.E.2005. The evolutionary fate of MULE-mediated duplications of hostgene fragments in rice. Genome Res. 15: 1292–1297.
Kurahashi, H., Inagaki, H., Hosoba, E., Kato, T., Ohye, T., Kogo, H., andEmanuel, B.S. 2007. Molecular cloning of a translocation breakpointhotspot in 22q11. Genome Res. 17: 461–469.
Leister, D. 2004. Tandem and segmental gene duplication andrecombination in the evolution of plant disease resistance gene.Trends Genet. 20: 116–122.
Lespinet, O., Wolf, Y.I., Koonin, E.V., and Aravind, L. 2002. The role oflineage-specific gene family expansion in the evolution ofeukaryotes. Genome Res. 12: 1048–1059.
Lisch, D. 2005. Pack-MULEs: Theft on a massive scale. BioEssays 27:353–355.
Lurin, C., Andres, C., Aubourg, S., Bellaoui, M., Bitton, F., Bruyere, C.,Caboche, M., Debast, C., Gualberto, J., Hoffmann, B., et al. 2004.Genome-wide analysis of Arabidopsis pentatricopeptide repeatproteins reveals their essential role in organelle biogenesis. Plant Cell16: 2089–2103.
Lyons, E. and Freeling, M. 2008. How to usefully compare homologousplant genes and chromosomes as DNA sequence. Plant J. 53:661–673.
Lyons, E., Pedersen, B., Kane, J., Alam, M., Ming, R., Tang, H., Wang, X.,Bowers, J., Paterson, A., and Lisch, D. 2008. Finding and comparingsyntenic regions among Arabidopsis and outgroups papaya, poplarand grape: CoGe with Rosids. Plant Physiol. (in press).
Maere, S., De Bodt, S., Raes, J., Casneuf, T., Van Montagu, M., Kuiper,M., and Van de Peer, Y. 2005. Modeling gene and genomeduplications in eukaryotes. Proc. Natl. Acad. Sci. 102: 5454–5459.
Marino-Ramirez, L., Lewis, K.C., Landsman, D., and Jordan, I.K. 2005.Transposable elements donate lineage-specific regulatory sequencesto host genomes. Cytogenet. Genome Res. 110: 333–341.
Meinke, D.W., Meinke, L.K., Showalter, T.C., Schissel, A.M., Mueller,L.A., and Tzafrir, I. 2003. A sequence-based map of Arabidopsis geneswith mutant phenotypes. Plant Physiol. 131: 409–418.
Meyers, B.C., Shen, K.A., Rohani, P., Gaut, B.S., and Michelmore, R.W.1998. Receptor-like genes in the major resistance locus of lettuce aresubject to divergent selection. Plant Cell 10: 1833–1846.
Meyers, B.C., Lee, D.K., Vu, T.H., Tej, S.S., Edberg, S.B., Matvienko, M.,and Tindell, L.D. 2003. Genome-wide analysis of NBS-LRR-encodinggenes in Arabidopsis. Plant Cell 15: 809–834.
Ming, R., Hou, S., Feng, Y., Yu, Q., Dionne-Laporte, A., Saw, J.H., Senin,P., Wang, W., Ly, B.V., Lewis, K.L., et al. 2008. The draft genome ofthe transgenic tropical fruit tree papaya (Carica papaya Linnaeus).Nature 452: 991–996.
Morgante, M., Brunner, S., Pea, G., Fengler, K., Zuccolo, A., and Rafalski,A. 2005. Gene duplication and exon shuffling by helitron-liketransposons generate intraspecies diversity in maize. Nat. Genet. 37:997–1002.
Nam, J., dePamphilis, C.W., Ma, H., and Nei, M. 2003. Antiquity andevolution of the MADS-box gene family controlling flowerdevelopment in plants. Mol. Biol. Evol. 20: 1435–1447.
Nei, M. 1992. Balanced polymorphism and evolution by the birth anddeath process in the MHC loci. In Proceedings of the 11thhistocompatibility workshop and conference (eds. K. Tsuji et al.) pp.27–38. Oxford University Press, Oxford, UK.
Nei, M., Rogozin, I., and Piontkivska, H. 2000. Purifying selection andbirth-and-death evolution in the ubiquitin gene family. Proc. Natl.Acad. Sci. 97: 10866–10871.
Neufeld, T.P., Carthew, R.W., and Rubin, G.M. 1991. Evolution of geneposition: Chromosomal arrangement and sequence comparison ofthe Drosophila melanogaster and Drosophila virilis sina and Rh4 genes.Proc. Natl. Acad. Sci. 88: 10203–10207.
Pan, X., Li, Y., and Stein, L. 2005. Site preferences of insertionalmutagenesis agents in Arabidopsis. Plant Physiol. 137: 168–175.
Pennisi, E. 1998. How the genome readies itself for evolution. Science281: 1131–1134.
Petrov, D.A., Lozovskaya, E.R., and Hartl, D.L. 1996. High intrinsic rateof DNA loss in Drosophila. Nature 384: 346–349.
Piffanelli, P., Droc, G., Mieulet, D., Lanau, N., Bes, M., Bourgeois, E.,Rouviere, C., Gavory, F., Cruaud, C., Ghesquiere, A., et al. 2007.Large-scale characterization of Tos17 insertion sites in a rice T-DNAmutant library. Plant Mol. Biol. 65: 587–601.
Saha, D., Prasad, A.M., and Srinivasan, R. 2007. Pentatricopeptide repeatproteins and their emerging roles in plants. Plant Physiol. Biochem.45: 521–534.
Seoighe, C. and Gehring, C. 2004. Genome duplication led to highlyselective expansion of the Arabidopsis thaliana proteome. TrendsGenet. 20: 461–464.
Shen, J., Araki, H., Chen, L., Chen, J.Q., and Tian, D. 2006. Uniqueevolutionary mechanism in R-genes under the presence/absencepolymorphism in Arabidopsis thaliana. Genetics 172: 1243–1250.
Small, I.D. and Peeters, N. 2000. The PPR motif—A TPR-related motifprevalent in plant organellar proteins. Trends Biochem. Sci. 25:46–47.
Tanksley, S.D., Ganal, M.W., Prince, J.P., de Vicente, M.C., Bonierbale,M.W., Broun, P., Fulton, T.M., Giovannoni, J.J., Grandillo, S.,
Freeling et al.
1936 Genome Researchwww.genome.org
Cold Spring Harbor Laboratory Press on December 4, 2008 - Published by genome.cshlp.orgDownloaded from

Martin, G.B., et al. 1992. High density molecular linkage maps ofthe tomato and potato genomes. Genetics 132: 1141–1160.
Tenaillon, O., Taddei, F., Radmian, M., and Matic, I. 2001. Second-orderselection in bacterial evolution: Selection acting on mutation andrecombination rates in the course of adaptation. Res. Microbiol. 152:11–16.
Thomas, J.H. 2006. Adaptive evolution in two large families ofubiquitin-ligase adapters in nematodes and plants. Genome Res. 16:1017–1030.
Thomas, B.C., Pedersen, B., and Freeling, M. 2006. Following tetraploidyin an Arabidopsis ancestor, genes were removed preferentially fromone homeolog leaving clusters enriched in dose-sensitive genes.Genome Res. 16: 934–946.
Thomma, B.P., Cammue, B.P., and Thevissen, K. 2002. Plant defensins.Planta 216: 193–202.
Tonzetich, J., Hayashi, S., and Grigliatti, T.A. 1990. Conservation of thesites of tRNA loci among the linkage groups of several Drosophilaspecies. J. Mol. Evol. 30: 182–188.
Yi, S. and Charlesworth, B. 2000. A selective sweep associated with arecent gene transposition in Drosophila miranda. Genetics 156:1753–1763.
Yogeeswaran, K., Frary, A., York, T.L., Amenta, A., Lesser, A.H.,Nasrallah, J.B., Tanksley, S.D., and Nasrallah, M.E. 2005.Comparative genome analyses of Arabidopsis spp.: Inferringchromosomal rearrangement events in the evolutionary history of A.thaliana. Genome Res. 15: 505–515.
Zhang, Y., Wu, Y., Liu, Y., and Han, B. 2005. Computationalidentification of 69 retroposons in Arabidopsis. Plant Physiol. 138:935–948.
Zhou, Q., Zhang, G., Zhang, Y., Xu, S., Zhao, R., Zhan, Z., Xin, L., Ding,Y., Yang, S., and Wang, W. 2008. On the origin of new genes inDrosophila. Genome Res. 18: 1446–1455.
Received May 18, 2008; accepted in revised form September 29, 2008.
The gray genome of Arabidopsis
Genome Research 1937www.genome.org
Cold Spring Harbor Laboratory Press on December 4, 2008 - Published by genome.cshlp.orgDownloaded from
Related Documents