Manufacturing in Ohio: World-class and under- appreciated by all but the market Edward W. Hill The Urban Center Levin College of Urban Affairs Cleveland State University

Manufacturing in Ohio: World-class and under- appreciated by all but the market Edward W. Hill The Urban Center Levin College of Urban Affairs Cleveland.
Dec 20, 2015
Welcome message from author
This document is posted to help you gain knowledge. Please leave a comment to let me know what you think about it! Share it to your friends and learn new things together.
Transcript
Manufacturing in Ohio:World-class and under-appreciated by all but the market
Edward W. HillThe Urban CenterLevin College of Urban AffairsCleveland State University
Levin College of Urban Affairs, Cleveland State University
2
Public policy and manufacturing in Ohio: The Challenge
The challenge of the “new economy” and “high tech” is to understand it—to get it rightPublic policy is currently getting it wrongWhat is the reality of technology, its impact on production, and its impact on incomes in Ohio?

Levin College of Urban Affairs, Cleveland State University
3
Real Per Capita Income 1969- 1998 in 1998 Dollars
Period 1 Period 2 Period 3
Period 4
Period 5
Levin College of Urban Affairs, Cleveland State University
4
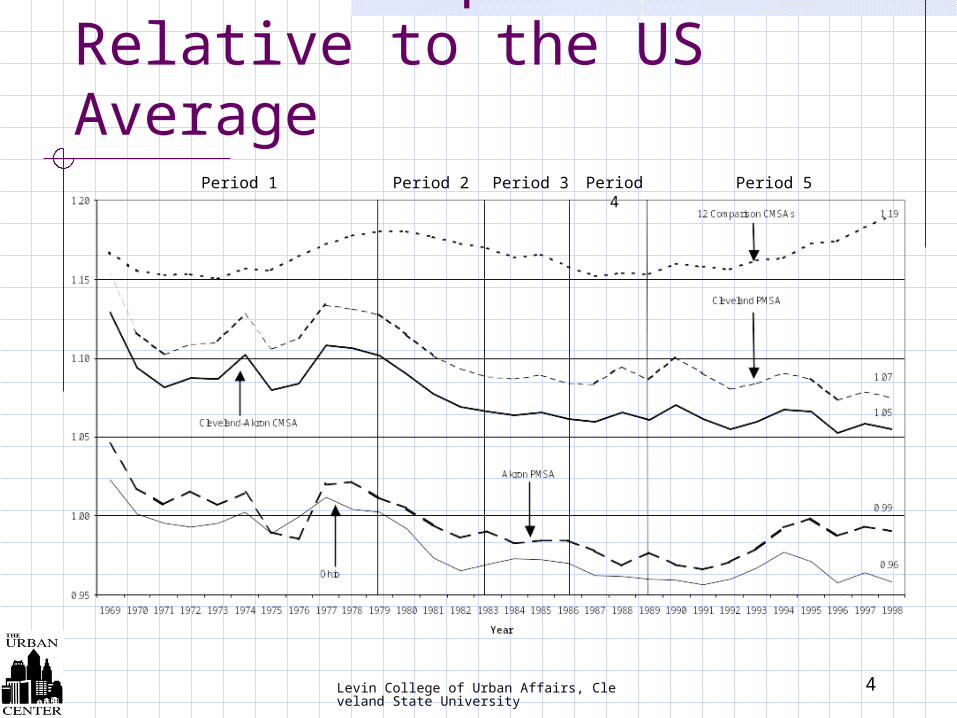
Real Per Capita Income Relative to the US Average
Period 1 Period 2 Period 3 Period 4
Period 5
Levin College of Urban Affairs, Cleveland State University
5
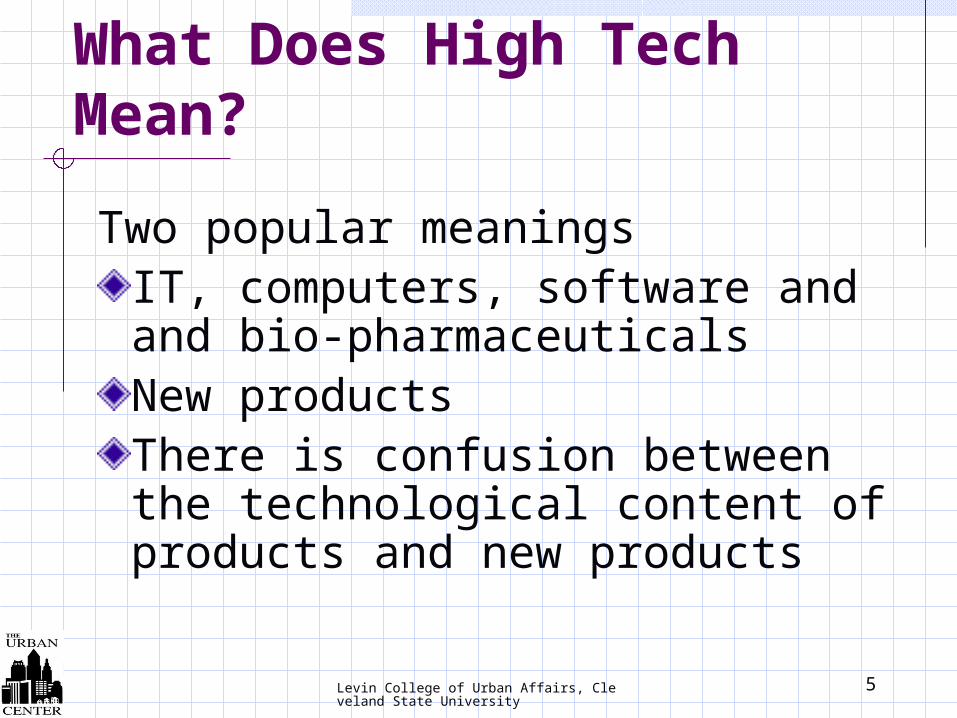
What Does High Tech Mean?
Two popular meaningsIT, computers, software and and bio-pharmaceuticalsNew productsThere is confusion between the technological content of products and new products
Levin College of Urban Affairs, Cleveland State University
6
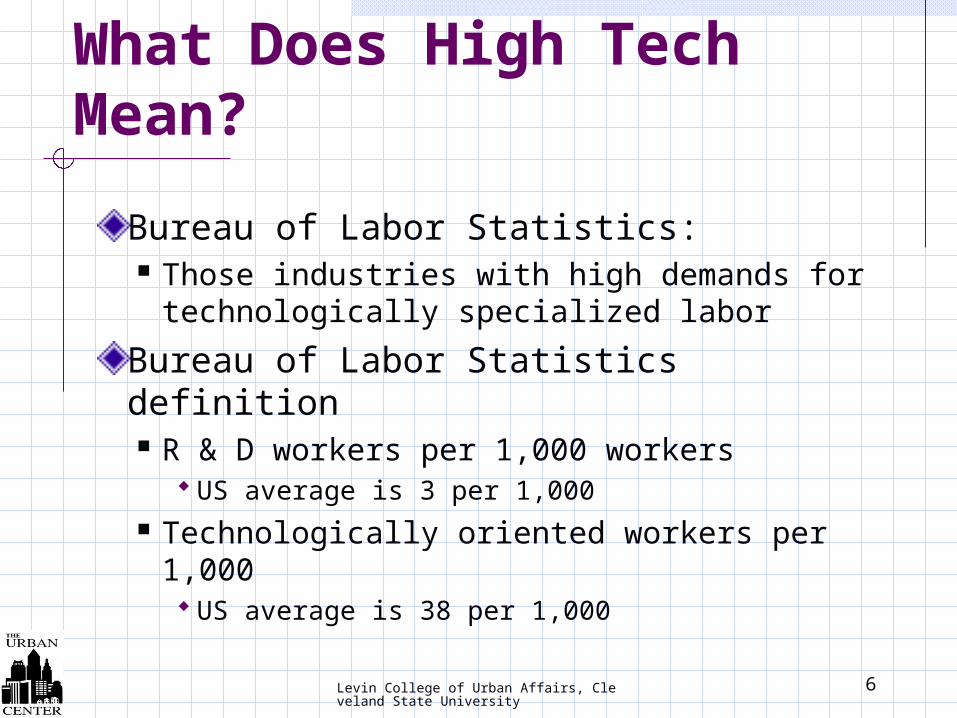
What Does High Tech Mean?
Bureau of Labor Statistics: Those industries with high demands for
technologically specialized labor
Bureau of Labor Statistics definition R & D workers per 1,000 workers
US average is 3 per 1,000 Technologically oriented workers per
1,000 US average is 38 per 1,000

Levin College of Urban Affairs, Cleveland State University
7
BLS: 10 Technology-Intensive Industries(At least 5 times US average)
Industrial chemicals Drugs Computer and office equipmentCommunications equipmentElectronic componentsAerospace
Search and navigation equipment Measuring and control devicesComputer and data processing servicesResearch and development testing services

Levin College of Urban Affairs, Cleveland State University
8
BLS: 18 Technology Industries(2 times US average, but less than 5 times the average)
Plastics materials & syntheticsSoaps, cleaners & toilet goods Paint & allied productsAgricultural chemicalsMiscellaneous chemical processes Petroleum refiningOrdnance & accessoriesEngines & turbinesConstruction & related machinery
Special industrial machineryGeneral industrial machinery Electric distribution equipHousehold audio & video equipMotor vehicles & equipmentMedical equipment, instruments & suppliesPhotographic equipment & suppliesEngineering & architectural servicesManagement & public relations services

Levin College of Urban Affairs, Cleveland State University
9
The Specialization of Central Cities in Technologically Intensive Employment
Source: U.S. Department of Housing and Urban Development, SOCCDS
Technology-Intensive 1997 City Market Share
Share of
Private Employment
Metropolitan Area Metro Area Central City
Cleveland-Akron 6.7% 6.3%
Akron 6.1% 5.1%
Cleveland 6.9% 6.8%
All Areas Total 7.0% 6.9%
Atlanta 6.5% 6.9%
Austin-San Antonio 7.6% 7.5%
Austin 9.5% 9.5%
San Antonio 6.1% 6.1%
Boston NECMA 8.6% 8.0%
Minneapolis-St. Paul 7.0% 7.0%
San Francisco CMSA 8.9% 8.1%
Oakland 7.4% 5.8%
San Francisco 7.0% 6.9%
San Jose 12.3% 11.0%
Portland, Oregon 7.0% 6.8%

Levin College of Urban Affairs, Cleveland State University
10
Ohio’s Technologically Intensive Employment
Technology-Intensive 1997 City Market Share
Share of
Private Employment
Metropolitan Area Metro Area Central City
Cleveland-Akron 6.7% 6.3%
Akron 6.1% 5.1%
Cleveland 6.9% 6.8%
All Areas Total 7.0% 6.9%
Baltimore 6.8% 6.8%
Buffalo 6.4% 6.0%
Charlotte 6.5% 7.0%
Chicago 7.3% 7.3%
Cincinnati 6.6% 6.8%
Columbus, O hio 6.0% 5.9%
Dayton 7.4% 7.2%
Detroit 6.4% 6.4%
Fort Wayne 7.5% 6.7%
Technology-Intensive 1997 City Market Share
Share of
Private Employment
Metropolitan Area Metro Area Central City
Grand Rapids 6.7% 6.8%
Hartford 7.2% 7.0%
Indianapolis 6.1% 6.0%
Louisville 6.1% 5.9%
Milwaukee 7.7% 7.7%
Philadelphia 7.5% 7.6%
Pittsburgh 6.8% 7.6%
Providence 6.7% 7.7%
Rochester 8.9% 11.0%
St. Louis 6.7% 7.5%
Toledo 6.4% 5.9%
Wilmington, DE 6.1% 5.2%
Levin College of Urban Affairs, Cleveland State University
11
High Technology or Technology-Intensive Production
“Business-to-business trade isn’t growing up in high-tech centers like Silicon Valley; it’s developing in industrial hubs like Cleveland and Detroit. As B2B trade expands, there will be a flight of talent and venture capital money to support these efforts, leaving the coasts feeling a bit of frost—while middle America experiences the Internet boom in 2001.”
--Forrester Research, February 2000
Levin College of Urban Affairs, Cleveland State University
12
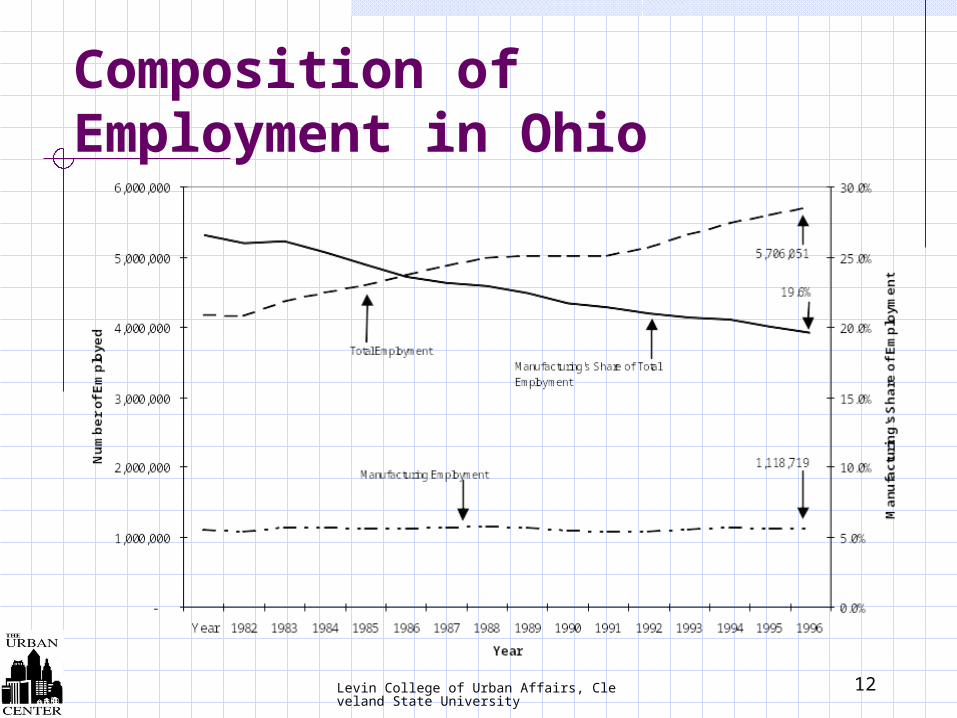
Composition of Employment in Ohio

Levin College of Urban Affairs, Cleveland State University
13
Employment Growth: The Wrong Measure for Ohio
-4.0%
-3.0%
-2.0%
-1.0%
0.0%
1.0%
2.0%
3.0%
4.0%
5.0%
6.0%
7.0%
1983 1984 1985 1986 1987 1988 1989 1990 1991 1992 1993 1994 1995 1996 1997
Year
% C
han
ge
fro
m P
revi
ou
s Y
ear
Annual % Change in Manufacturing Employment
Annual % Change in Total Employment

Levin College of Urban Affairs, Cleveland State University
14
The Role of Manufacturing in Ohio’s Economic Growth
-
50,000
100,000
150,000
200,000
250,000
300,000
350,000
1982 1983 1984 1985 1986 1987 1988 1989 1990 1991 1992 1993 1994 1995 1996 1997
Year
Mil
lio
ns
of
$92
24.5%
25.0%
25.5%
26.0%
26.5%
27.0%
27.5%
28.0%
28.5%
29.0%
29.5%
30.0%
Pe
rce
nt
of
GS
P
Real Gross State Product (GSP)
Manufacturing's Dollar Contribution to GSP
Manufacturing's Share of GSP
$291.4 billion
28.4%
$82.7 billion

Levin College of Urban Affairs, Cleveland State University
15
Real Gross Metropolitan Product for the Cleveland-Akron CMSA (1992 dollars)
Period 3 Period 4 Period 5Period 2
Levin College of Urban Affairs, Cleveland State University
16
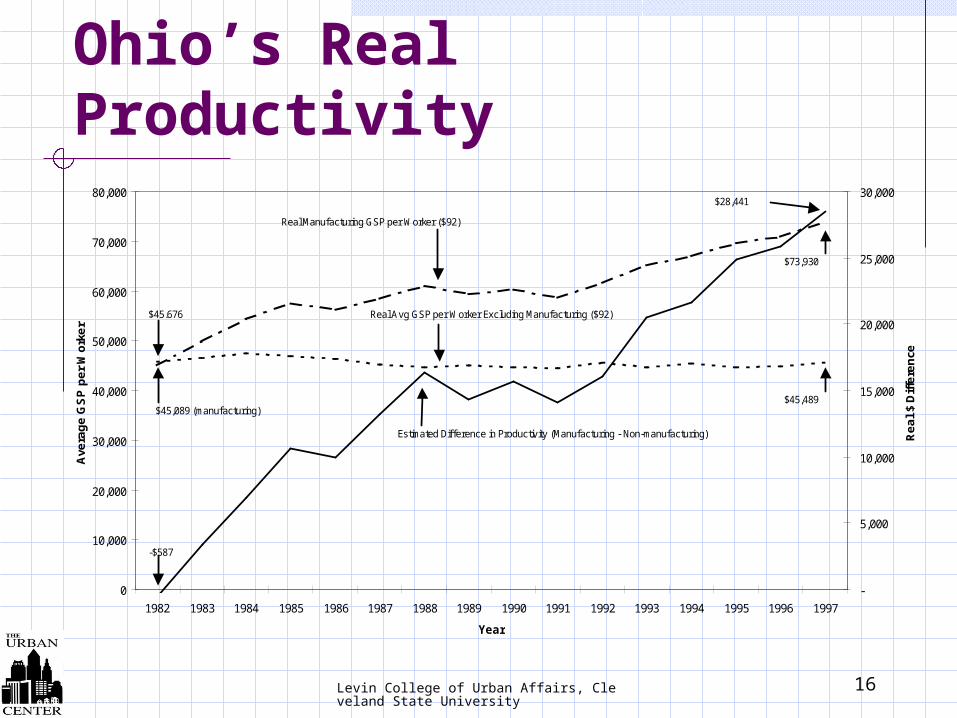
Ohio’s Real Productivity
0
10,000
20,000
30,000
40,000
50,000
60,000
70,000
80,000
1982 1983 1984 1985 1986 1987 1988 1989 1990 1991 1992 1993 1994 1995 1996 1997
Year
Ave
rag
e G
SP
pe
r W
ork
er
-
5,000
10,000
15,000
20,000
25,000
30,000
Re
al
$ D
iffe
ren
ce
Real Manufacturing GSP per Worker ($92)
Estimated Difference in Productivity (Manufacturing - Non-manufacturing)
Real Avg GSP per Worker Excluding Manufacturing ($92)
-$587
$45,089 (manufacturing)
$45,676
$45,489
$28,441
$73,930

Levin College of Urban Affairs, Cleveland State University
17
Five Parts to the Production Process
1. Headquarters2. Research, design, development,
& deployment3. Production or procurement4. Marketing, sales, and service5. Distribution or logistics
Levin College of Urban Affairs, Cleveland State University
18
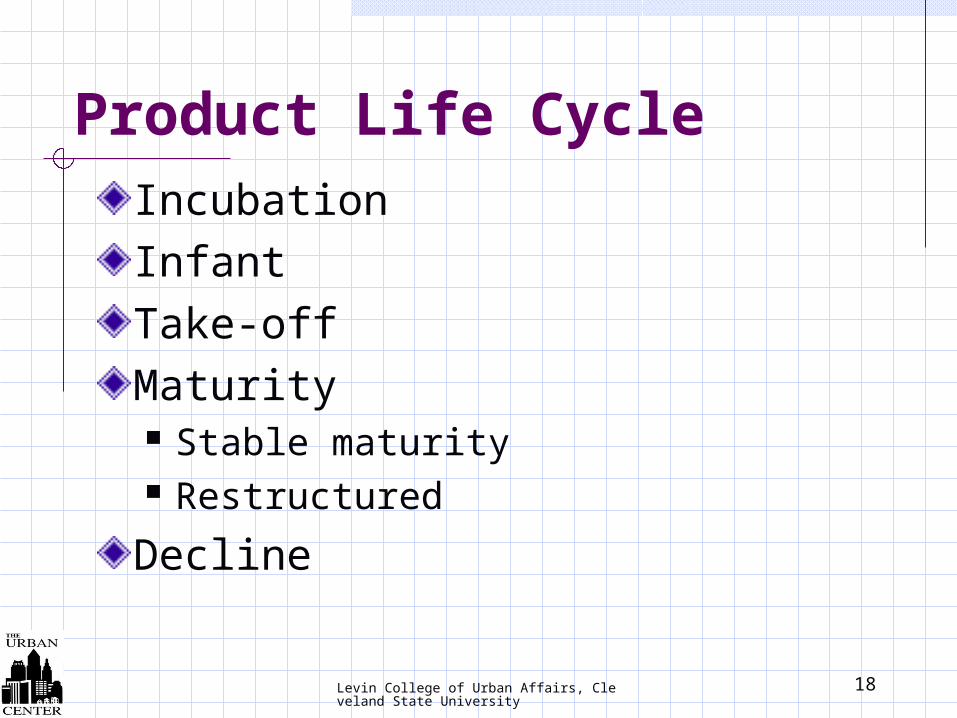
Product Life CycleIncubationInfantTake-offMaturity Stable maturity Restructured
Decline

Levin College of Urban Affairs, Cleveland State University
19
Looking at the Cycle
Time
Profit
Sales
Output
declinematuritytake-offincubation
infant
restructured
Levin College of Urban Affairs, Cleveland State University
20
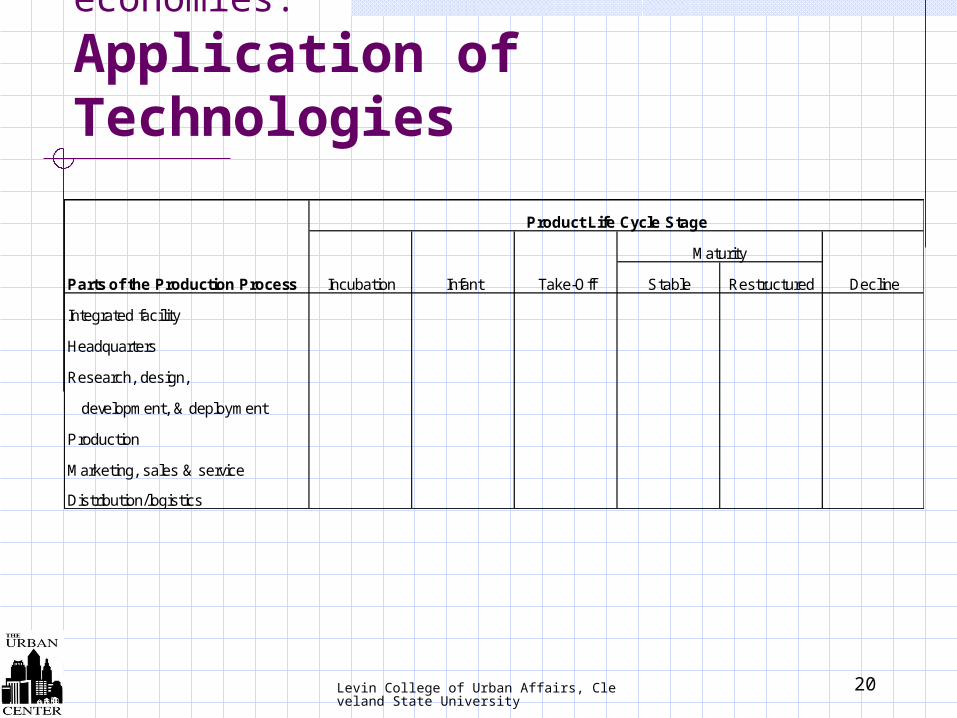
Interaction with regional economies:
Application of Technologies
Product Life Cycle Stage
Maturity
Parts of the Production Process Incubation Infant Take-Off Stable Restructured Decline
Integrated facility
Headquarters
Research, design,
development, & deployment
Production
Marketing, sales & service
Distribution/logistics
Levin College of Urban Affairs, Cleveland State University
21
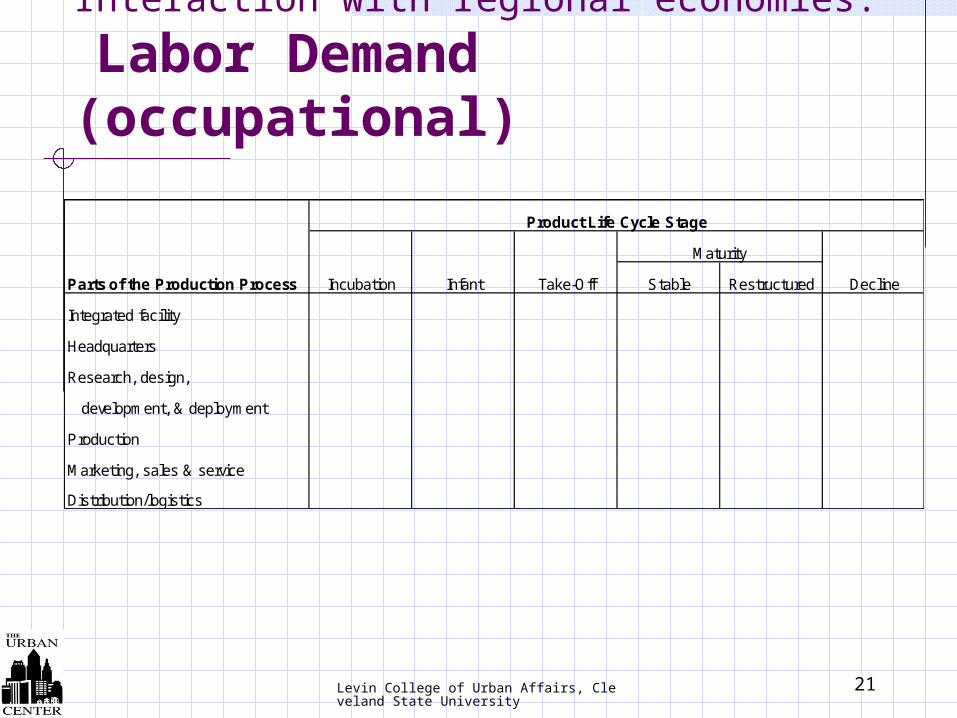
Interaction with regional economies:
Labor Demand (occupational)
Product Life Cycle Stage
Maturity
Parts of the Production Process Incubation Infant Take-Off Stable Restructured Decline
Integrated facility
Headquarters
Research, design,
development, & deployment
Production
Marketing, sales & service
Distribution/logistics
Levin College of Urban Affairs, Cleveland State University
22
Three Public Policy Issues
The role of software and information technology in the economy
Land assembly and renewal
Business taxes

Levin College of Urban Affairs, Cleveland State University
23
Three Public Policy Issues
Four Facets of Information
Technology
1. Economic development infrastructure
2. Ubiquitous software & network applications
3. Applying IT to existing products4. Export products: competitive
advantage Example: factory automation systems
Levin College of Urban Affairs, Cleveland State University
24
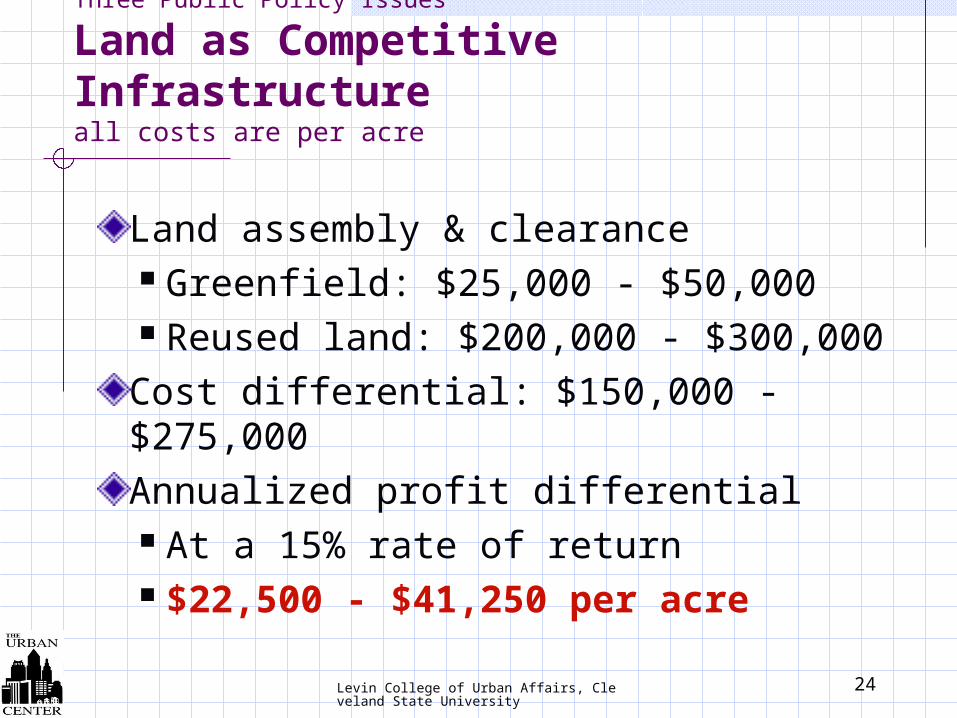
Three Public Policy Issues
Land as Competitive Infrastructureall costs are per acre
Land assembly & clearance Greenfield: $25,000 - $50,000 Reused land: $200,000 - $300,000Cost differential: $150,000 - $275,000Annualized profit differential At a 15% rate of return $22,500 - $41,250 per acre
Levin College of Urban Affairs, Cleveland State University
25
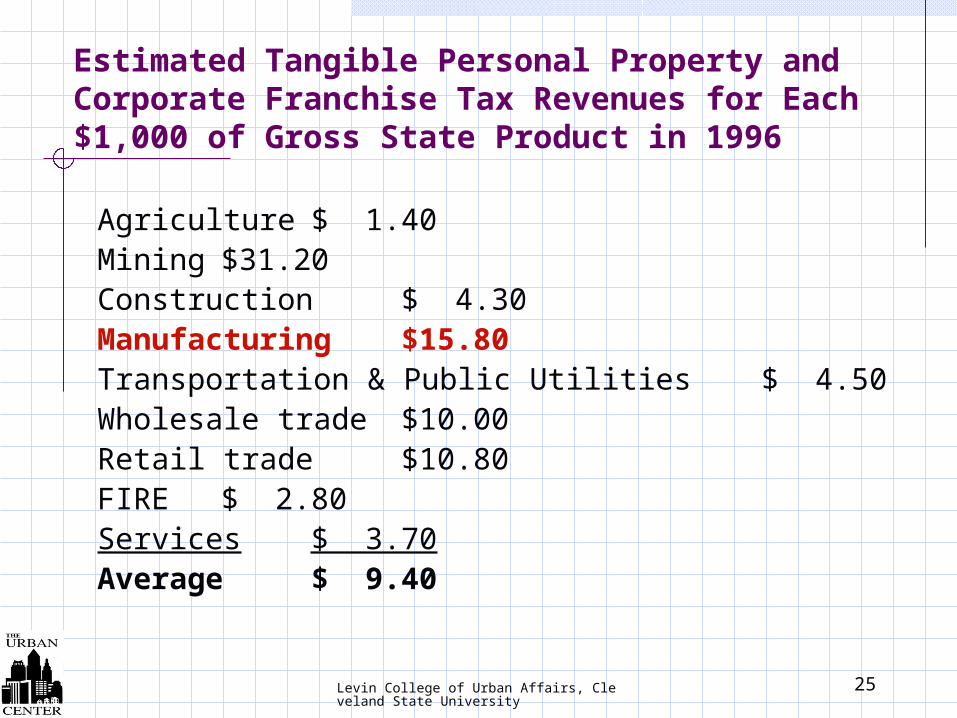
Estimated Tangible Personal Property and Corporate Franchise Tax Revenues for Each $1,000 of Gross State Product in 1996
Agriculture $ 1.40Mining $31.20Construction $ 4.30Manufacturing $15.80Transportation & Public Utilities $ 4.50Wholesale trade $10.00Retail trade $10.80FIRE $ 2.80Services $ 3.70Average $ 9.40

Levin College of Urban Affairs, Cleveland State University
26
Manufacturing in Northeast Ohio
It’s all about productsWorld-class and under-appreciated by all but the market

Levin College of Urban Affairs, Cleveland State University
27
The 12 Comparison CMSAs
Chicago-Gary-KenoshaCincinnati-HamiltonDallas-Fort WorthDenver-BoulderDetroit-Ann Arbor-FlintHouston-GalvestonMiami-Ft Lauderdale
Milwaukee-RacinePhiladelphia-Wilmington-Atlantic CityPortland-SalemSan Francisco-Oakland-San JoseSeattle-Tacoma-Bremerton
Related Documents