Manual of diagnostic ultrasound Second edition Vol. 2 During the last decades , use of ultrasonography became increasingly common in medical practice and hospitals around the world, and a large number of scientific publications reported the benefit and even the superiority of ultrasonography over commonly used X-ray techniques, resulting in significant changes in diagnostic imaging procedures. With increasing use of ultrasonography in medical settings, the need for education and training became essential. WHO took up this challenge and in 1995 published its first training manual in ultrasonography. Soon, however, rapid developments and improvements in equipment and indications for the extension of medical ultrasonography into therapy indicated the need for a totally new ultrasonography manual. The manual (consisting of two volumes) has been written by an international group of experts of the World Federation for Ultrasound in Medicine and Biology (WFUMB), well-known for their publications regarding the clinical use of ultrasound and with substantial experience in the teaching of ultrasonography in both developed and developing countries. The contributors (more than fifty for the two volumes) belong to five different continents, to guarantee that manual content represents all clinical, cultural and epidemiological contexts This new publication, which covers modern diagnostic and therapeutic ultrasonography extensively, will certainly benefit and inspire medical professionals in improving ‘health for all’ in both developed and emerging countries. ISBN 978 92 4 154854 0 Manual of diagnostic ultrasound Manual of diagnostic ultrasound vol. 2 volume2

Welcome message from author
This document is posted to help you gain knowledge. Please leave a comment to let me know what you think about it! Share it to your friends and learn new things together.
Transcript
0.1
[TIB 1.3]7.5L40/4.0SCHILDDR.100%48dB ZD44.0cm 11B/s ZTHICF5.1MHzPRF1102HzF-Mittel70dB ZD6
DF5.5MHzPRF5208Hz62dBFT25FG1.0
60
40
20
0
-20
cm/sM
anu
al of d
iagn
ostic u
ltrasou
nd
Second edition
Vol. 2
During the last decades , use of ultrasonography became increasingly common in medical practice and hospitals around the world, and a large number of scientific publications reported the benefit and even the superiority of ultrasonography over commonly used X-ray techniques, resulting in significant changes in diagnostic imaging procedures.
With increasing use of ultrasonography in medical settings, the need for education and training became essential. WHO took up this challenge and in 1995 published its first training manual in ultrasonography. Soon, however, rapid developments and improvements in equipment and indications for the extension of medical ultrasonography into therapy indicated the need for a totally new ultrasonography manual.
The manual (consisting of two volumes) has been written by an international group of experts of the World Federation for Ultrasound in Medicine and Biology (WFUMB), well-known for their publications regarding the clinical use of ultrasound and with substantial experience in the teaching of ultrasonography in both developed and developing countries. The contributors (more than fifty for the two volumes) belong to five different continents, to guarantee that manual content represents all clinical, cultural and epidemiological contexts
This new publication, which covers modern diagnostic and therapeutic ultrasonography extensively, will certainly benefit and inspire medical professionals in improving ‘health for all’ in both developed and emerging countries.
ISBN 978 92 4 154854 0
Manual ofdiagnostic ultrasound
Manual of diagnostic ultrasound vol. 2
v o l u m e 2
DIM Cover_Final Proof.indd 1 7/1/13 6:47 AM
Second edition
0.1
Manual ofdiagnostic ultrasound
[TIB 1.3]7.5L40/4.0SCHILDDR.100%48dB ZD44.0cm 11B/s ZTHICF5.1MHzPRF1102HzF-Mittel70dB ZD6
DF5.5MHzPRF5208Hz62dBFT25FG1.0
60
40
20
0
-20
cm/s
v o l u m e 2
Ttl_page_Final Proof.indd 1 6/10/13 10:43 AM
WHO Library Cataloguing-in-Publication Data
Manual of diagnostic ultrasound. Vol. 2 – 2nd ed. / edited by Elisabetta Buscarini, Harald Lutz and Paoletta Mirk.
1.Diagnostic imaging. 2.Ultrasonography. 3.Pediatrics - instrumentation. 4.Handbooks. I.Buscarini, Elisabetta. II.Lutz, Harald. III.Mirk, P. IV.World Health Organization. V.World Federation for Ultrasound in Medicine and Biology.
ISBN 978 92 4 154854 0 (NLM classification: WN 208)
© World Health Organization 2013
All rights reserved. Publications of the World Health Organization are available on the WHO web site (www.who.int) or can be purchased from WHO Press, World Health Organization, 20 Avenue Appia, 1211 Geneva 27, Switzerland (tel.: +41 22 791 3264; fax: +41 22 791 4857; e-mail: [email protected]).
Requests for permission to reproduce or translate WHO publications – whether for sale or for noncommercial distribution – should be addressed to WHO Press through the WHO web site (http://www.who.int/about/licensing/copyright_form/en/index.html).
The designations employed and the presentation of the material in this publication do not imply the expression of any opinion whatsoever on the part of the World Health Organization concerning the legal status of any country, territory, city or area or of its authorities, or concerning the delimitation of its frontiers or boundaries. Dotted lines on maps represent approximate border lines for which there may not yet be full agreement. The mention of specific companies or of certain manufacturers’ products does not imply that they are endorsed or recommended by the World Health Organization in preference to others of a similar nature that are not mentioned. Errors and omissions excepted, the names of proprietary products are distinguished by initial capital letters.
All reasonable precautions have been taken by the World Health Organization to verify the information contained in this publication. However, the published material is being distributed without warranty of any kind, either expressed or implied. The responsibility for the interpretation and use of the material lies with the reader. In no event shall the World Health Organization be liable for damages arising from its use.
The named editors alone are responsible for the views expressed in this publication.
Production editor: Melanie Lauckner Design & layout: Sophie Guetaneh Aguettant and Cristina Ortiz
Printed in Slovenia
Ttl_page_Final Proof.indd 2 6/10/13 10:43 AM
iii
Contents
vAcknowledgements v
Chapter 1 1 Safety of diagnostic ultrasoundStan Barnett
Chapter 2 7 ObstetricsDomenico Arduini, Leonardo Caforio, Anna Franca Cavaliere, Vincenzo D’Addario, Marco De Santis, Alessandra Di Giovanni, Lucia Masini, Maria Elena Pietrolucci, Paolo Rosati, Cristina Rossi
Chapter 3 131 GynaecologyCaterina Exacoustos, Paoletta Mirk, Stefania Speca, Antonia Carla Testa
Chapter 4 191 BreastPaolo Belli, Melania Costantini, Maurizio Romani
Chapter 5 227 Paediatric ultrasoundIbtissem Bellagha, Ferid Ben Chehida, Alain Couture, Hassen Gharbi, Azza Hammou, Wiem Douira Khomsi, Hela Louati, Corinne Veyrac
Chapter 6 407 Musculoskeletal ultrasoundGiovanni G. Cerri, Maria Cristina Chammas, Renato A. Sernik
Recommended reading 467Index 475
978-9241548540-TOC PRF ml-0-Final Proof.indd 3 6/10/13 10:28 AM

978-9241548540-TOC PRF ml-0-Final Proof.indd 4 6/10/13 10:28 AM

v
Acknowledgements
The Editors Elisabetta Buscarini, Harald Lutz and Paoletta Mirk wish to thank all members of
the Board of the World Federation for Ultrasound in Medicine and Biology for their support and
encouragement during preparation of this manual.
The Editors also express their gratitude to and appreciation of those listed below, who supported
preparation of the manuscript by contributing as co-authors and by providing illustrations and
competent advice.
Domenico Arduini: Department of Obstetrics and Gynecology, University of Roma
Tor Vergata, Rome, Italy
Stan Barnett: Discipline of Biomedical Science, Faculty of Medicine, University
of Sydney, Sydney, Australia
Ibtissem Bellagha: Department of Paediatric Radiology, Tunis Children’s Hospital,
Tunis, Tunisia
Paolo Belli: Department of Radiological Sciences, Catholic University of the
Sacred Heart, Rome, Italy
Leonardo Caforio: Department of Obstetrics and Gynecology, Catholic University of
the Sacred Heart, Rome, Italy
Lucia Casarella: Department of Obstetrics and Gynecology, Catholic University of
the Sacred Heart, Rome, Italy
Anna Franca Cavaliere: Department of Obstetrics and Gynecology, Catholic University of
the Sacred Heart, Rome, Italy
Giovanni Cerri: School of Medicine, University of Sao Paulo, Sao Paulo, Brazil
Maria Cristina Chammas: School of Medicine, University of Sao Paulo, Sao Paulo, Brazil
Ferid Ben Chehida: Department of Radiology, Ibn Zohr Center, Tunis, Tunisia
Melania Costantini: Department of Radiological Sciences, Catholic University of the
Sacred Heart, Rome, Italy
Alain Couture: Department of Paediatric Radiology, Arnaud de Villeneuve
Hospital, Montpellier, France
Vincenzo D’Addario: Department of Obstetrics, Gynecology and Neonatology,
University of Bari, Bari, Italy
Marco De Santis: Department of Obstetrics and Gynecology, Catholic University of
the Sacred Heart, Rome, Italy
Josef Deuerling: Department of Internal Medicine, Klinikum Bayreuth,
Bayreuth, Germany
978-9241548540-ACK PRF ml ln ml ml-1-Final Proof.indd 5 6/10/13 10:38 AM

vi
Alessandra Di Giovanni: Department of Obstetrics and Gynecology, University of Roma
Tor Vergata, Rome, Italy
Alessia Di Legge: Department of Obstetrics and Gynecology, Catholic University of
the Sacred Heart, Rome, Italy
Wiem Douira Khomsi: Department of Paediatric Radiology, Tunis Children’s Hospital,
Tunis El Manar University, Tunis, Tunisia
Caterina Exacoustos: Department of Obstetrics and Gynecology, University of Roma
Tor Vergata, Rome, Italy
Hassen A Gharbi: Department of Radiology, Ibn Zohr Center, Tunis, Tunisia
Azza Hammou: National Center for Radio Protection, Tunis, Tunisia
Hela Louati: Department of Paediatric Radiology, Tunis Children’s Hospital,
Tunis, Tunisia
Lucia Masini: Department of Obstetrics and Gynecology, Catholic University of
the Sacred Heart, Rome, Italy
Maria Elena Pietrolucci: Department of Obstetrics and Gynecology, University of Roma
Tor Vergata, Rome, Italy
Maurizio Romani: Department of Radiological Sciences, Catholic University of the
Sacred Heart, Rome, Italy
Paolo Rosati: Department of Obstetrics and Gynecology, Catholic University of
the Sacred Heart, Rome, Italy
Cristina Rossi: Department of Obstetrics, Gynecology and Neonatology,
University of Bari, Bari, Italy
Renato A. Sernik: Musculoskeletal Dept. Clinical Radiology, University of Sao Paulo,
Sao Paulo, Brazil
Stefania Speca: Department of Radiological Sciences, Catholic University of the
Sacred Heart, Rome, Italy
Antonia Carla Testa: Department of Obstetrics and Gynecology, Catholic University of
the Sacred Heart, Rome, Italy
Claudia Tomei: Department of Obstetrics and Gynecology, Catholic University of
the Sacred Heart, Rome, Italy
Corinne Veyrac: Department of Paediatric Radiology, Arnaud de Villeneuve
Hospital, Montpellier, France
Daniela Visconti: Department of Obstetrics and Gynecology, Catholic University of
the Sacred Heart, Rome, Italy
Maria Paola Zannella: Department of Obstetrics and Gynecology, Catholic University of
the Sacred Heart, Rome, Italy
978-9241548540-ACK PRF ml ln ml ml-1-Final Proof.indd 6 6/10/13 10:38 AM
Ultrasound and the World Health Organization 3
Safety of ultrasound 4
Conclusion 6
Chapter 1 Safety of diagnostic ultrasound
978-9241548540-C001 ln ml ml-1-Final Proof.indd 1 6/10/13 10:36 AM

978-9241548540-C001 ln ml ml-1-Final Proof.indd 2 6/10/13 10:36 AM
Ultrasound and the World Health Organization
�e World Health Organization (WHO) recognizes ultrasound as an important medical diagnostic imaging technology. Manuals on ultrasound have been published by WHO since 2001, with the purpose of guiding health professionals on the safe and e�ective use of ultrasound. Among the diagnostic imaging technologies, ultrasound is the safer and least expensive, and technological advances are making it more user friendly and portable. Ultrasound has many uses, both diagnostic and therapeutic. For the purposes of this manual, only diagnostic ultrasound will be considered and further analysed.
Basic physics of ultrasonographic imaging was released in 2005; since then, WHO has addressed the physics, safe use and di�erent applications of ultrasound as an impor-tant diagnostic imaging tool. Since it is a nonionizing radiation technology, along with nuclear magnetic resonance imaging, the risks inherent to its use are lower than those presented by other diagnostic imaging technologies using ionizing radiation, such as the radiological technologies (X-rays and computed tomography scanners).
To disseminate policies, programmes and strategies, WHO holds the o�cial collaboration of international nongovernmental organizations. Out of 183 such organizations, at least four deal with topics related to ultrasound:
■ ISR: the International Society of Radiology ■ ISRRT: the International Society of Radiographers and Radiological
Technologists ■ IFMBE: the International Federation for Medical and Biological Engineering ■ WFUMB: the World Federation for Ultrasound in Medicine and Biology.
It is WFUMB that has authored and edited volumes 1 and 2 of this Manual of Diagnostic Ultrasound.
WHO has three collaborating centres working on studies to demonstrate the clinical e�ectiveness, economic impact and a�ordability of ultrasound technolo-gies. Today, these studies are being conducted by the following WHO collaborat-ing centres: the National Center for Fetal Medicine, Trondheim University Hospital (Norway), Je�erson Ultrasound Research and Education Institute (USA) and the National Center for Health Technology Excellence (Mexico).
1Safety of diagnostic ultrasound
3
978-9241548540-C001 ln ml ml-1-Final Proof.indd 3 6/10/13 10:36 AM
4
�e Diagnostic Imaging and Medical devices unit of the Department of Essential Medicines and Health products of WHO’s Health Systems and Innovation cluster, along with WHO’s Public Health and Enviroment cluster, are working on the Basic Safety Standards and the Basic Referral Guidelines, which will support and recom-mend the use of ultrasound for speci�c diseases and diagnostics.
�e WFUMB has been working with WHO for 10 years in the publishing and editing of ultrasound manuals, from the �rst version to the present one, to increase the safe use of ultrasound for the di�erent pathologies that will be demonstrated in volumes 1 and 2 of this publication.
WHO is now working with the International Commission of Non-Ionizing Radi-ation to review the safe use of ultrasound for diagnostic and therapeutic applications.
Safety of ultrasound
�e use of diagnostic ultrasound is generally accepted as safe, in the absence of plausible, con�rmed evidence of adverse outcome in humans. Nevertheless, with rapid technological advances, the possibility of ultrasound-induced adverse e�ects occurring in the future cannot be ruled out. While there may be no concern with regard to most applications, prudent use is justi�ed. Obstetric applications are of particular concern, as rapidly dividing and di�erentiating embryonic and fetal tis-sues are sensitive to physical damage, and perturbation of cell di�erentiation might have signi�cant biological consequences. Technological advances have resulted in improved diagnostic acuity but have been accompanied by substantially increased levels of acoustic output, and the possible health e�ects of equivalent levels of expo-sure have not been studied in humans.
Modern ultrasound equipment combines a range of frequencies in complex scan modes to increase diagnostic accuracy. Misdiagnosis is, however, a real risk to patients, and the clinical bene�t of procedures such as Doppler �ow embryo-sonography should be established. Unregulated use of freely available equipment by unaccredited or inadequately trained people increases the risk for misdiagnosis and harm. So-called entertainment or social scanning is frowned upon by professional ultrasound societies and is the subject of a project of the Safety Committee of the World Federation for Ultrasound in Medicine and Biology.
In obstetrics scanning, the amount of ultrasound-induced heating of the fetus correlates with gestational age and increasing mineralization of bone. Because of its particularly high acoustic absorption characteristics, bone is rapidly heated when placed in the path of an ultrasound beam. Signi�cant increases in temperature have been consistently recorded when pulsed Doppler ultrasound beams encounter bone in either transcranial or fetal exposures. �e greatest heating is usually associated with the use of pulsed spectral Doppler ultrasound applications, in which a station-ary beam of relatively high intensity is directed at a single tissue target. As a result, tissue near bone can be heated by around 5 °C. A responsible, cautious approach
Man
ual o
f dia
gnos
tic u
ltras
ound
– V
olum
e 2
978-9241548540-C001 ln ml ml-1-Final Proof.indd 4 6/10/13 10:36 AM
5
is justi�ed, particularly in the use of Doppler ultrasound in pregnancy; however, there is no risk for adverse heating e�ects from simple B-mode ultrasound scanning procedures when tissues are insonated for fractions of a second each time a beam passes. Diagnostic ultrasound causes a modest temperature increase in so� embry-onic tissue and is unlikely to be a major concern, thermally, during the �rst trimester.
�e World Federation for Ultrasound in Medicine and Biology concluded that the e�ects of elevated temperatures can be minimized by keeping the time during which the beam passes through any area of tissue as short as possible.
�e nonthermal biological e�ect that has been most thoroughly examined is acoustic inertial cavitation, which involves collapse of bubbles in liquid in a sound �eld and the sudden release of energy, which can be su�ciently intense to disrupt molecular bonds.
While it is comforting that there is no conclusive evidence of serious adverse health e�ects caused by antenatal exposure to ultrasound, the scienti�c database has obvious limitations and inadequacies. �e available epidemiological data refer to exposure to ultrasound at levels considerably lower than those from modern ultra-sonographic equipment. �ere are no data on perinatal applications of spectral or colour �ow Doppler or of other modern ultrasound procedures, such as harmonic imaging techniques and use of echocontrast agents.
It is important that users of ultrasound for clinical purposes:
■ monitor the thermal and mechanical indices and keep them as low as consist-ent with clinical needs;
■ document output display indices as a part of the permanent record of an examination;
■ verify the accuracy of the displayed mechanical index, particularly when new hardware or so�ware is introduced;
■ examine the adequacy of the mechanical index as a guide to the likelihood of rupture of contrast microbubbles.
It is suggested that manufacturers set the default (switch-on) mechanical index to less than 0.4, except for high mechanical index modes, and that they provide an unambiguous on-screen display of centre frequency (acoustic working frequency). For scienti�c purposes, it would be helpful if the value of the peak negative acoustic pressure were made available, to allow studies of alternative means of assessing clini-cal biological responses under particular circumstances.
Safe
ty o
f dia
gnos
tic u
ltras
ound
978-9241548540-C001 ln ml ml-1-Final Proof.indd 5 6/10/13 10:36 AM
6
Conclusion
Ultrasound is a core technology for diagnostics and remains one of the safest. Clinical e�ectiveness is enhanced when used properly. �e following chapters provide infor-mation on the best use and applications of diagnostic ultrasound. A responsible, cautious approach to ultrasound is required to maintain safety, particularly in the use of Doppler ultrasound in pregnancy. �e output displays on modern ultrasono-graphic equipment allow users to take greater responsibility in risk–bene�t assess-ments. With new ultrasound applications, continued safety and e�ectiveness can be assured only if it is used according to recognized guidelines at the lowest exposure necessary to provide essential diagnostic information.
Man
ual o
f dia
gnos
tic u
ltras
ound
– V
olum
e 2
978-9241548540-C001 ln ml ml-1-Final Proof.indd 6 6/10/13 10:36 AM
First trimester 99 Indications
10 Preparation10 Examination technique13 Normal �ndings20 First-trimester screening for aneuploidy21 Pathological �ndings
Second trimester 3535 Indications35 Estimation of gestational age35 Assessment of fetal morphology42 Amniotic �uid volume42 Placenta
Third trimester 4343 Introduction43 Biometric parameters47 Amniotic �uid48 Estimation of fetal weight with ultrasound50 Fetal macrosomia51 Clinical indications for ultrasound
examination:placenta praevia and accreta
Fetal growth restriction 5353 Causes of intrauterine growth restriction54 Diagnosis and de�nition55 Ultrasound biometry56 Haemodynamic modi�cations59 Management and delivery planning
Chapter 2 Obstetrics
978-9241548540-C002 PRF ml YVR ln ml ml-1-Final Proof.indd 7 6/10/13 10:34 AM
61 Perinatal and long-term sequelae62 Future directions and prevention
Placenta, umbilical cord, amniotic fluid
62
62 Placenta67 Umbilical cord69 Amniotic �uid
Cervix 7071 Indication71 Preparation71 Examination techniques73 Normal �ndings73 Pathological �ndings
Multiple pregnancies 7676 Indications77 Preparation77 Normal �ndings82 Pathological �ndings
Fetal malformations 8990 Fetal head96 Fetal spine98 Fetal lungs
100 Fetal heart106 Fetal gastrointestinal tract110 Urinary tract anomalies114 Fetal skeletal system
Use of Doppler in obstetrics
118
119 Doppler ultrasound: principles and practice
122 Doppler assessment of placental and fetal circulation
128 Recommendations on reporting of obstetrical ultrasound examinations
978-9241548540-C002 PRF ml YVR ln ml ml-1-Final Proof.indd 8 6/10/13 10:34 AM
First trimester
�e �rst trimester is the gestational period between conception and 13 weeks + 6 days of gestational age. An embryo is the product of conception until 10 weeks + 0 days of gestational age; a fetus is the product of conception from 10 weeks + 1 day until delivery.
Indications�e indications for ultrasound during the �rst trimester are:
■ vaginal bleeding or pelvic pain; ■ a discrepant uterine size for gestational age; ■ estimation of gestational age; ■ support for an invasive diagnostic procedure (e.g. sampling the chorionic villus); ■ prediction of the risk for recurrence of fetal anomalies; ■ screening for fetal anomalies and aneuploidies (in selected, high-risk pregnancies); ■ routine assessment (screening) of low-risk pregnancies.
�e purposes of ultrasound during the �rst trimester are:
■ to visualize the gestational sac inside the uterus and evaluate the number and implant site of sacs;
■ to visualize the embryo or fetus, evaluate their number and visualize their cardiac activity;
■ to estimate gestational age, by measuring the mean sac diameter or crown–rump length or the biparietal diameter of the head;
■ to evaluate the morphology of the uterus and adnexa; ■ to provide an early diagnosis of fetal anomalies (in selected cases); ■ to screen for aneuploidy (in selected cases).
With these evaluations, it is possible to diagnose during the �rst trimester:
■ a normal (intrauterine) or ectopic (intra- or extrauterine) implant; ■ embryo or fetus life or early pregnancy failure (miscarriage, abortion);
2Obstetrics
9
978-9241548540-C002 PRF ml YVR ln ml ml-1-Final Proof.indd 9 6/10/13 10:34 AM
10
■ the number of embryos or fetuses (single or multiple pregnancy); ■ chorionicity and amnionicity in multiple pregnancies; ■ correct gestational age; ■ anomalies of the uterus (e.g. malformations, myomas) and adnexa (e.g.
cysts, neoplasms); ■ morphological fetal abnormalities; ■ aneuploidy, by measuring nuchal translucency between 11 and 14 weeks of
gestation.
PreparationFor transabdominal ultrasound, the woman should have a full bladder. To �ll her bladder, the woman should drink 1 l (four glasses) of water 0.5–1 h before the proce-dure. If the woman cannot drink and transabdominal ultrasound must be used, the bladder can be �lled with saline solution through a Foley catheter. For transvaginal ultrasound, the woman should have an empty bladder: she must void her bladder immediately before the procedure.
Examination technique�e �rst trimester scan can be made either transvaginally or transabdominally. If a transabdominal scan does not provide all the necessary information, it should be complemented by a transvaginal scan, and vice versa.
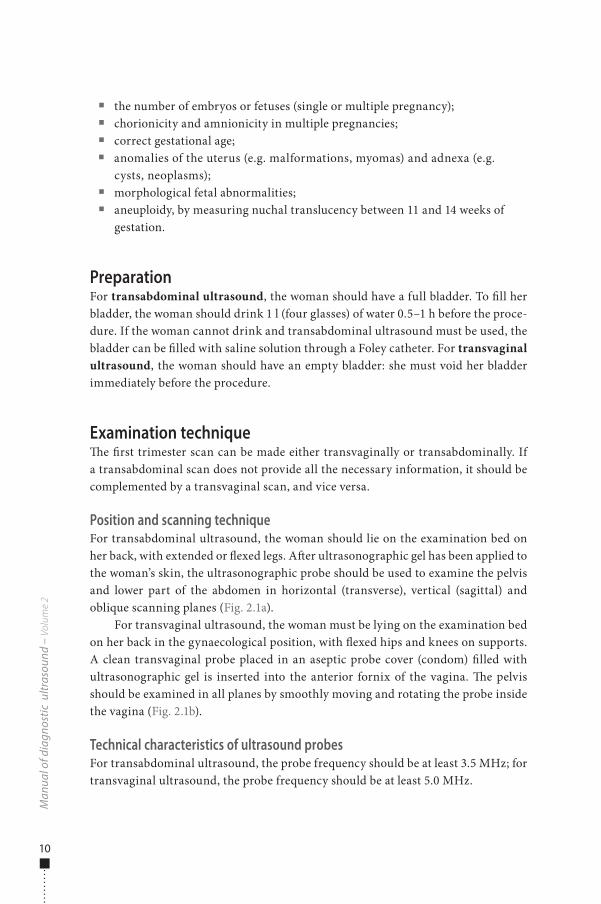
Position and scanning techniqueFor transabdominal ultrasound, the woman should lie on the examination bed on her back, with extended or �exed legs. A�er ultrasonographic gel has been applied to the woman’s skin, the ultrasonographic probe should be used to examine the pelvis and lower part of the abdomen in horizontal (transverse), vertical (sagittal) and oblique scanning planes (Fig. 2.1a).
For transvaginal ultrasound, the woman must be lying on the examination bed on her back in the gynaecological position, with �exed hips and knees on supports. A clean transvaginal probe placed in an aseptic probe cover (condom) �lled with ultrasonographic gel is inserted into the anterior fornix of the vagina. �e pelvis should be examined in all planes by smoothly moving and rotating the probe inside the vagina (Fig. 2.1b).
Technical characteristics of ultrasound probesFor transabdominal ultrasound, the probe frequency should be at least 3.5 MHz; for transvaginal ultrasound, the probe frequency should be at least 5.0 MHz.
Man
ual o
f dia
gnos
tic u
ltras
ound
– V
olum
e 2
978-9241548540-C002 PRF ml YVR ln ml ml-1-Final Proof.indd 10 6/10/13 10:34 AM
11
End-points of first-trimester scans
■ Establish the presence of a gestational sac inside the uterus. ■ Visualize the embryo or fetus. ■ Evaluate the number of embryos or fetuses. ■ Establish the presence or absence of embryonic or fetal cardiac activity, only
with B-mode or M-mode technique up to 10 weeks + 0 days; later, pulse or colour Doppler can be used.
■ Estimate gestational age by one of two means.
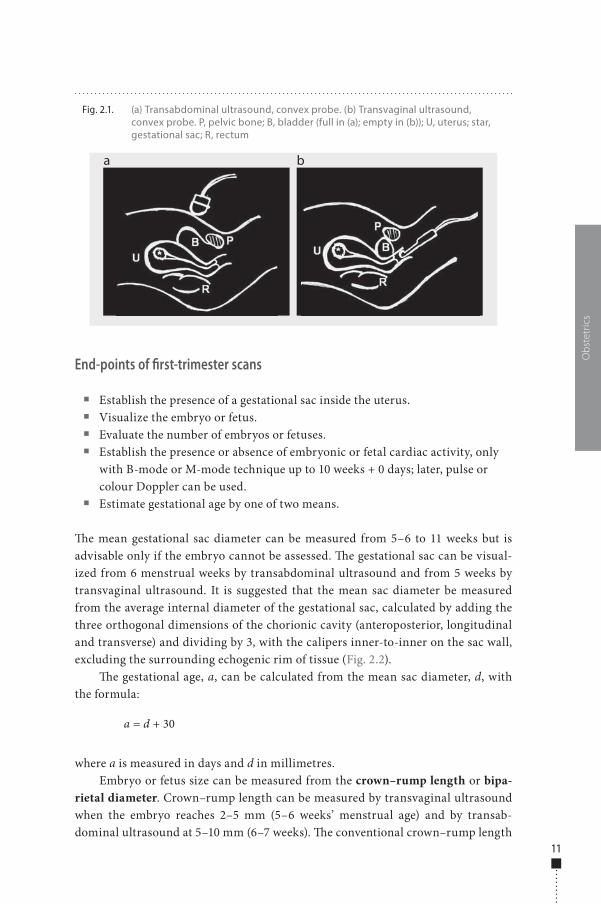
�e mean gestational sac diameter can be measured from 5–6 to 11 weeks but is advisable only if the embryo cannot be assessed. �e gestational sac can be visual-ized from 6 menstrual weeks by transabdominal ultrasound and from 5 weeks by transvaginal ultrasound. It is suggested that the mean sac diameter be measured from the average internal diameter of the gestational sac, calculated by adding the three orthogonal dimensions of the chorionic cavity (anteroposterior, longitudinal and transverse) and dividing by 3, with the calipers inner-to-inner on the sac wall, excluding the surrounding echogenic rim of tissue (Fig. 2.2).
�e gestational age, a, can be calculated from the mean sac diameter, d, with the formula:
a = d + 30
where a is measured in days and d in millimetres.Embryo or fetus size can be measured from the crown–rump length or bipa-
rietal diameter. Crown–rump length can be measured by transvaginal ultrasound when the embryo reaches 2–5 mm (5–6 weeks’ menstrual age) and by transab-dominal ultrasound at 5–10 mm (6–7 weeks). �e conventional crown–rump length
Obs
tetr
ics
Fig. 2.1. (a) Transabdominal ultrasound, convex probe. (b) Transvaginal ultrasound, convex probe. P, pelvic bone; B, bladder (full in (a); empty in (b)); U, uterus; star, gestational sac; R, rectum
a b
978-9241548540-C002 PRF ml YVR ln ml ml-1-Final Proof.indd 11 6/10/13 10:34 AM
12
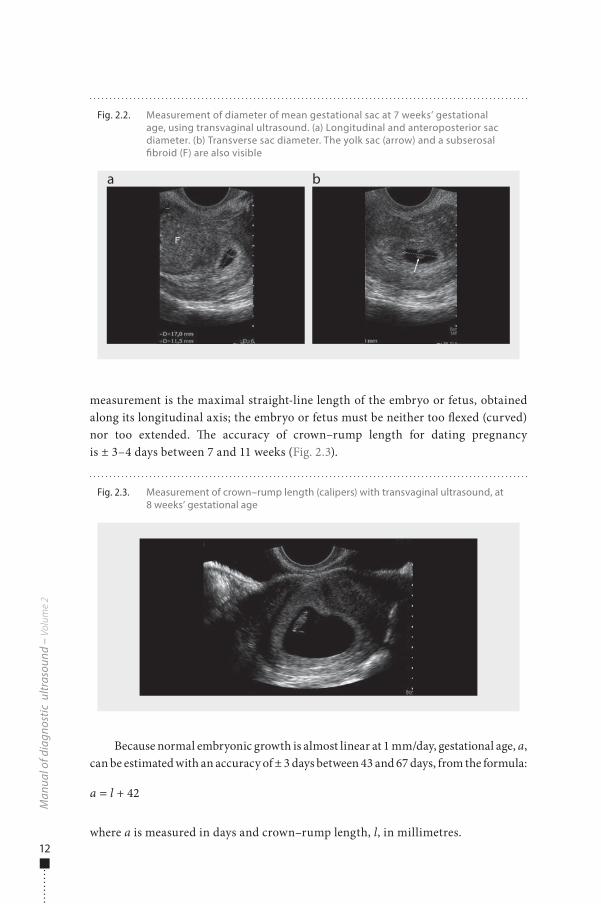
measurement is the maximal straight-line length of the embryo or fetus, obtained along its longitudinal axis; the embryo or fetus must be neither too �exed (curved) nor too extended. �e accuracy of crown–rump length for dating pregnancy is ± 3–4 days between 7 and 11 weeks (Fig. 2.3).
Because normal embryonic growth is almost linear at 1 mm/day, gestational age, a, can be estimated with an accuracy of ± 3 days between 43 and 67 days, from the formula:
a = l + 42
where a is measured in days and crown–rump length, l, in millimetres.
Man
ual o
f dia
gnos
tic u
ltras
ound
– V
olum
e 2
Fig. 2.2. Measurement of diameter of mean gestational sac at 7 weeks’ gestational age, using transvaginal ultrasound. (a) Longitudinal and anteroposterior sac diameter. (b) Transverse sac diameter. The yolk sac (arrow) and a subserosal �broid (F) are also visible
a b
Fig. 2.3. Measurement of crown–rump length (calipers) with transvaginal ultrasound, at 8 weeks’ gestational age
978-9241548540-C002 PRF ml YVR ln ml ml-1-Final Proof.indd 12 6/10/13 10:34 AM
13
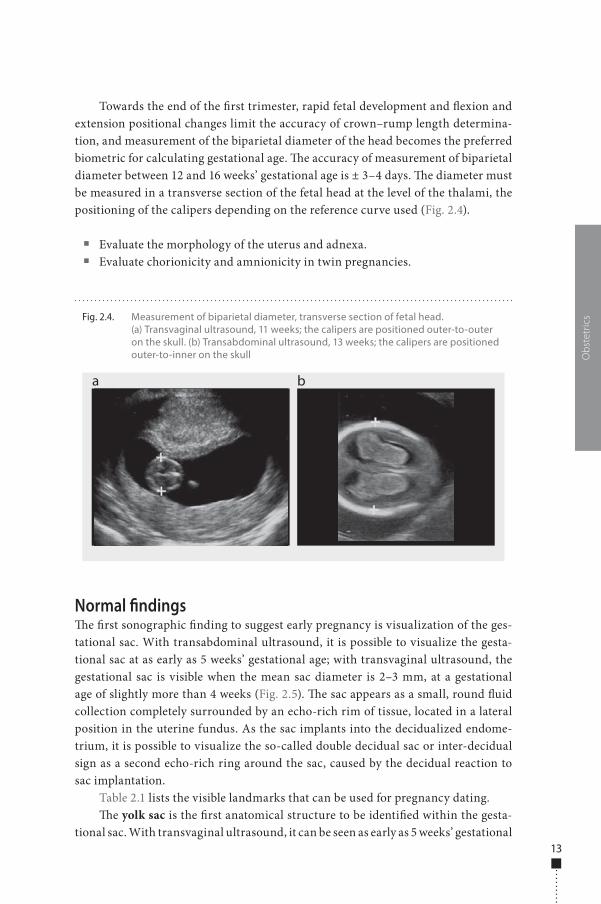
Towards the end of the �rst trimester, rapid fetal development and �exion and extension positional changes limit the accuracy of crown–rump length determina-tion, and measurement of the biparietal diameter of the head becomes the preferred biometric for calculating gestational age. �e accuracy of measurement of biparietal diameter between 12 and 16 weeks’ gestational age is ± 3–4 days. �e diameter must be measured in a transverse section of the fetal head at the level of the thalami, the positioning of the calipers depending on the reference curve used (Fig. 2.4).
■ Evaluate the morphology of the uterus and adnexa. ■ Evaluate chorionicity and amnionicity in twin pregnancies.
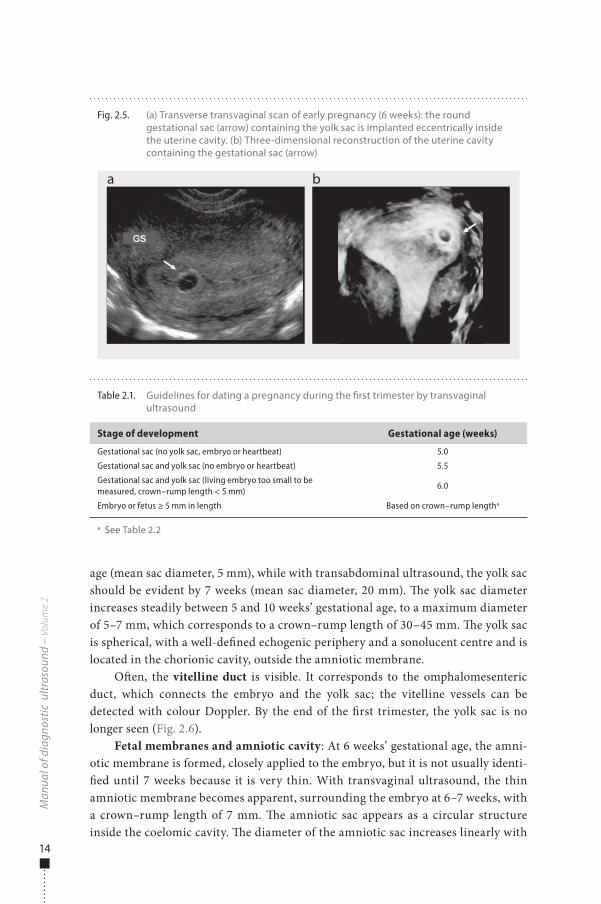
Normal �ndings�e �rst sonographic �nding to suggest early pregnancy is visualization of the ges-tational sac. With transabdominal ultrasound, it is possible to visualize the gesta-tional sac at as early as 5 weeks’ gestational age; with transvaginal ultrasound, the gestational sac is visible when the mean sac diameter is 2–3 mm, at a gestational age of slightly more than 4 weeks (Fig. 2.5). �e sac appears as a small, round �uid collection completely surrounded by an echo-rich rim of tissue, located in a lateral position in the uterine fundus. As the sac implants into the decidualized endome-trium, it is possible to visualize the so-called double decidual sac or inter-decidual sign as a second echo-rich ring around the sac, caused by the decidual reaction to sac implantation.
Table 2.1 lists the visible landmarks that can be used for pregnancy dating.�e yolk sac is the �rst anatomical structure to be identi�ed within the gesta-
tional sac. With transvaginal ultrasound, it can be seen as early as 5 weeks’ gestational
Obs
tetr
icsFig. 2.4. Measurement of biparietal diameter, transverse section of fetal head.
(a) Transvaginal ultrasound, 11 weeks; the calipers are positioned outer-to-outer on the skull. (b) Transabdominal ultrasound, 13 weeks; the calipers are positioned outer-to-inner on the skull
a b
978-9241548540-C002 PRF ml YVR ln ml ml-1-Final Proof.indd 13 6/10/13 10:34 AM
14
age (mean sac diameter, 5 mm), while with transabdominal ultrasound, the yolk sac should be evident by 7 weeks (mean sac diameter, 20 mm). �e yolk sac diameter increases steadily between 5 and 10 weeks’ gestational age, to a maximum diameter of 5–7 mm, which corresponds to a crown–rump length of 30–45 mm. �e yolk sac is spherical, with a well-de�ned echogenic periphery and a sonolucent centre and is located in the chorionic cavity, outside the amniotic membrane.
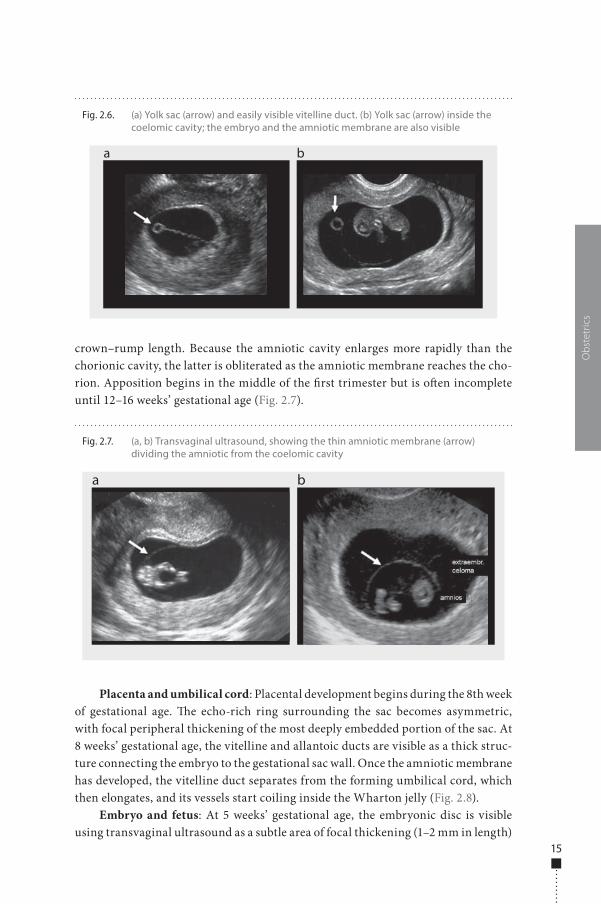
O�en, the vitelline duct is visible. It corresponds to the omphalomesenteric duct, which connects the embryo and the yolk sac; the vitelline vessels can be detected with colour Doppler. By the end of the �rst trimester, the yolk sac is no longer seen (Fig. 2.6).
Fetal membranes and amniotic cavity: At 6 weeks’ gestational age, the amni-otic membrane is formed, closely applied to the embryo, but it is not usually identi-�ed until 7 weeks because it is very thin. With transvaginal ultrasound, the thin amniotic membrane becomes apparent, surrounding the embryo at 6–7 weeks, with a crown–rump length of 7 mm. �e amniotic sac appears as a circular structure inside the coelomic cavity. �e diameter of the amniotic sac increases linearly with
Man
ual o
f dia
gnos
tic u
ltras
ound
– V
olum
e 2
Fig. 2.5. (a) Transverse transvaginal scan of early pregnancy (6 weeks): the round gestational sac (arrow) containing the yolk sac is implanted eccentrically inside the uterine cavity. (b) Three-dimensional reconstruction of the uterine cavity containing the gestational sac (arrow)
a b
Table 2.1. Guidelines for dating a pregnancy during the �rst trimester by transvaginal ultrasound
Stage of development Gestational age (weeks)
Gestational sac (no yolk sac, embryo or heartbeat) 5.0
Gestational sac and yolk sac (no embryo or heartbeat) 5.5
Gestational sac and yolk sac (living embryo too small to be measured, crown–rump length < 5 mm)
6.0
Embryo or fetus ≥ 5 mm in length Based on crown–rump lengtha
a See Table 2.2
978-9241548540-C002 PRF ml YVR ln ml ml-1-Final Proof.indd 14 6/10/13 10:34 AM
15
crown–rump length. Because the amniotic cavity enlarges more rapidly than the chorionic cavity, the latter is obliterated as the amniotic membrane reaches the cho-rion. Apposition begins in the middle of the �rst trimester but is o�en incomplete until 12–16 weeks’ gestational age (Fig. 2.7).
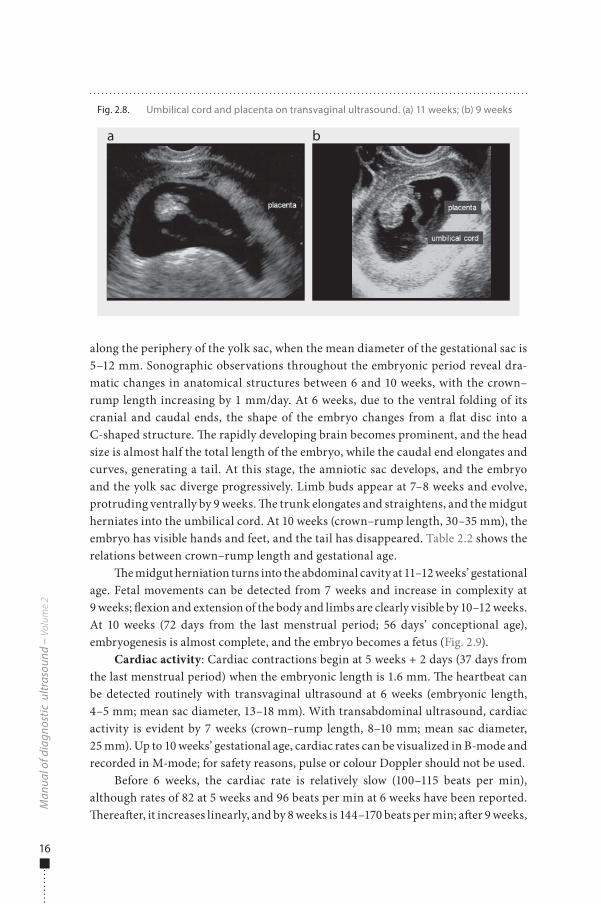
Placenta and umbilical cord: Placental development begins during the 8th week of gestational age. �e echo-rich ring surrounding the sac becomes asymmetric, with focal peripheral thickening of the most deeply embedded portion of the sac. At 8 weeks’ gestational age, the vitelline and allantoic ducts are visible as a thick struc-ture connecting the embryo to the gestational sac wall. Once the amniotic membrane has developed, the vitelline duct separates from the forming umbilical cord, which then elongates, and its vessels start coiling inside the Wharton jelly (Fig. 2.8).
Embryo and fetus: At 5 weeks’ gestational age, the embryonic disc is visible using transvaginal ultrasound as a subtle area of focal thickening (1–2 mm in length)
Obs
tetr
ics
Fig. 2.6. (a) Yolk sac (arrow) and easily visible vitelline duct. (b) Yolk sac (arrow) inside the coelomic cavity; the embryo and the amniotic membrane are also visible
a b
Fig. 2.7. (a, b) Transvaginal ultrasound, showing the thin amniotic membrane (arrow) dividing the amniotic from the coelomic cavity
a b
978-9241548540-C002 PRF ml YVR ln ml ml-1-Final Proof.indd 15 6/10/13 10:34 AM
16
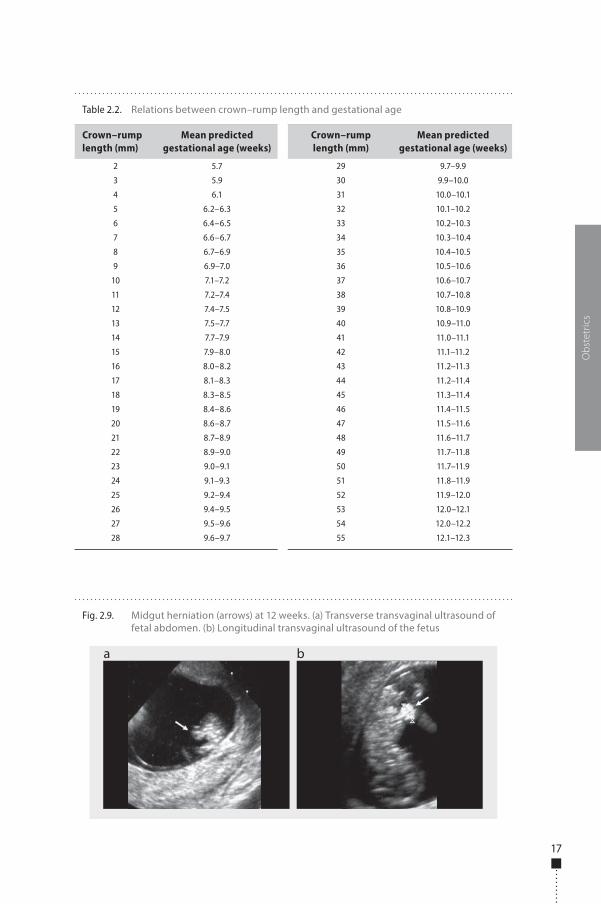
along the periphery of the yolk sac, when the mean diameter of the gestational sac is 5–12 mm. Sonographic observations throughout the embryonic period reveal dra-matic changes in anatomical structures between 6 and 10 weeks, with the crown–rump length increasing by 1 mm/day. At 6 weeks, due to the ventral folding of its cranial and caudal ends, the shape of the embryo changes from a �at disc into a C-shaped structure. �e rapidly developing brain becomes prominent, and the head size is almost half the total length of the embryo, while the caudal end elongates and curves, generating a tail. At this stage, the amniotic sac develops, and the embryo and the yolk sac diverge progressively. Limb buds appear at 7–8 weeks and evolve, protruding ventrally by 9 weeks. �e trunk elongates and straightens, and the midgut herniates into the umbilical cord. At 10 weeks (crown–rump length, 30–35 mm), the embryo has visible hands and feet, and the tail has disappeared. Table 2.2 shows the relations between crown–rump length and gestational age.
�e midgut herniation turns into the abdominal cavity at 11–12 weeks’ gestational age. Fetal movements can be detected from 7 weeks and increase in complexity at 9 weeks; �exion and extension of the body and limbs are clearly visible by 10–12 weeks. At 10 weeks (72 days from the last menstrual period; 56 days’ conceptional age), embryogenesis is almost complete, and the embryo becomes a fetus (Fig. 2.9).
Cardiac activity: Cardiac contractions begin at 5 weeks + 2 days (37 days from the last menstrual period) when the embryonic length is 1.6 mm. �e heartbeat can be detected routinely with transvaginal ultrasound at 6 weeks (embryonic length, 4–5 mm; mean sac diameter, 13–18 mm). With transabdominal ultrasound, cardiac activity is evident by 7 weeks (crown–rump length, 8–10 mm; mean sac diameter, 25 mm). Up to 10 weeks’ gestational age, cardiac rates can be visualized in B-mode and recorded in M-mode; for safety reasons, pulse or colour Doppler should not be used.
Before 6 weeks, the cardiac rate is relatively slow (100–115 beats per min), although rates of 82 at 5 weeks and 96 beats per min at 6 weeks have been reported. �erea�er, it increases linearly, and by 8 weeks is 144–170 beats per min; a�er 9 weeks,
Man
ual o
f dia
gnos
tic u
ltras
ound
– V
olum
e 2
Fig. 2.8. Umbilical cord and placenta on transvaginal ultrasound. (a) 11 weeks; (b) 9 weeks
a b
978-9241548540-C002 PRF ml YVR ln ml ml-1-Final Proof.indd 16 6/10/13 10:34 AM
17
Obs
tetr
ics
Fig. 2.9. Midgut herniation (arrows) at 12 weeks. (a) Transverse transvaginal ultrasound of fetal abdomen. (b) Longitudinal transvaginal ultrasound of the fetus
a b
Table 2.2. Relations between crown–rump length and gestational age
Crown–rump length (mm)
Mean predicted gestational age (weeks)
Crown–rump length (mm)
Mean predicted gestational age (weeks)
2 5.7 29 9.7–9.9
3 5.9 30 9.9–10.0
4 6.1 31 10.0–10.1
5 6.2–6.3 32 10.1–10.2
6 6.4–6.5 33 10.2–10.3
7 6.6–6.7 34 10.3–10.4
8 6.7–6.9 35 10.4–10.5
9 6.9–7.0 36 10.5–10.6
10 7.1–7.2 37 10.6–10.7
11 7.2–7.4 38 10.7–10.8
12 7.4–7.5 39 10.8–10.9
13 7.5–7.7 40 10.9–11.0
14 7.7–7.9 41 11.0–11.1
15 7.9–8.0 42 11.1–11.2
16 8.0–8.2 43 11.2–11.3
17 8.1–8.3 44 11.2–11.4
18 8.3–8.5 45 11.3–11.4
19 8.4–8.6 46 11.4–11.5
20 8.6–8.7 47 11.5–11.6
21 8.7–8.9 48 11.6–11.7
22 8.9–9.0 49 11.7–11.8
23 9.0–9.1 50 11.7–11.9
24 9.1–9.3 51 11.8–11.9
25 9.2–9.4 52 11.9–12.0
26 9.4–9.5 53 12.0–12.1
27 9.5–9.6 54 12.0–12.2
28 9.6–9.7 55 12.1–12.3
978-9241548540-C002 PRF ml YVR ln ml ml-1-Final Proof.indd 17 6/10/13 10:34 AM
18
the rate plateaus at 137–150 beats per min. �e cardiac rate is stable in early gestation but shows progressively more variation with gestational age.
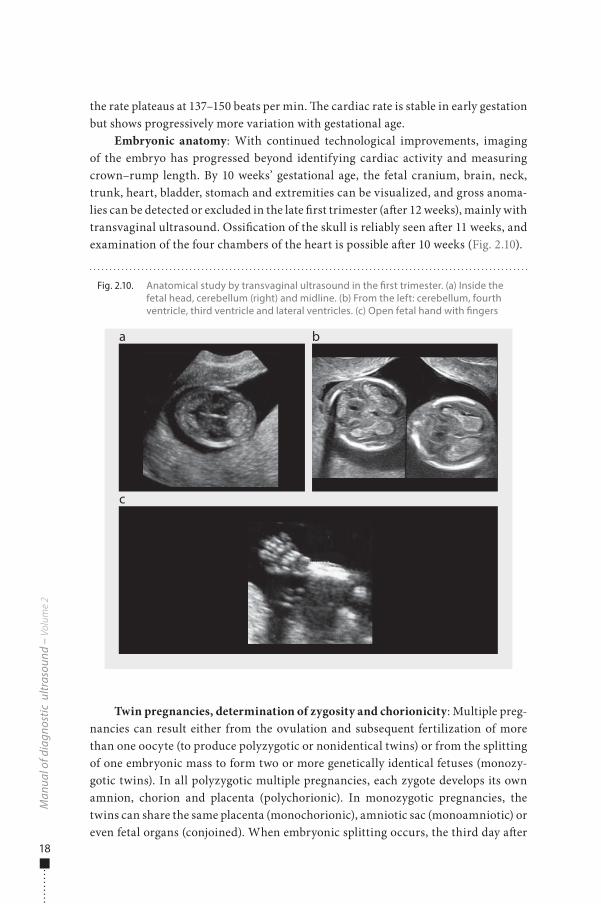
Embryonic anatomy: With continued technological improvements, imaging of the embryo has progressed beyond identifying cardiac activity and measuring crown–rump length. By 10 weeks’ gestational age, the fetal cranium, brain, neck, trunk, heart, bladder, stomach and extremities can be visualized, and gross anoma-lies can be detected or excluded in the late �rst trimester (a�er 12 weeks), mainly with transvaginal ultrasound. Ossi�cation of the skull is reliably seen a�er 11 weeks, and examination of the four chambers of the heart is possible a�er 10 weeks (Fig. 2.10).
Twin pregnancies, determination of zygosity and chorionicity: Multiple preg-nancies can result either from the ovulation and subsequent fertilization of more than one oocyte (to produce polyzygotic or nonidentical twins) or from the splitting of one embryonic mass to form two or more genetically identical fetuses (monozy-gotic twins). In all polyzygotic multiple pregnancies, each zygote develops its own amnion, chorion and placenta (polychorionic). In monozygotic pregnancies, the twins can share the same placenta (monochorionic), amniotic sac (monoamniotic) or even fetal organs (conjoined). When embryonic splitting occurs, the third day a�er
Man
ual o
f dia
gnos
tic u
ltras
ound
– V
olum
e 2
Fig. 2.10. Anatomical study by transvaginal ultrasound in the �rst trimester. (a) Inside the fetal head, cerebellum (right) and midline. (b) From the left: cerebellum, fourth ventricle, third ventricle and lateral ventricles. (c) Open fetal hand with �ngers
a
c
b
978-9241548540-C002 PRF ml YVR ln ml ml-1-Final Proof.indd 18 6/10/13 10:34 AM
19
fertilization, there is vascular communication of the circulation in the two placentas (monochorionic). Zygosity can be determined only by DNA analysis, but chorionic-ity can be determined by ultrasound on the basis of the number of placentas, the characteristics of the membrane between the two amniotic sacs and fetal sex.
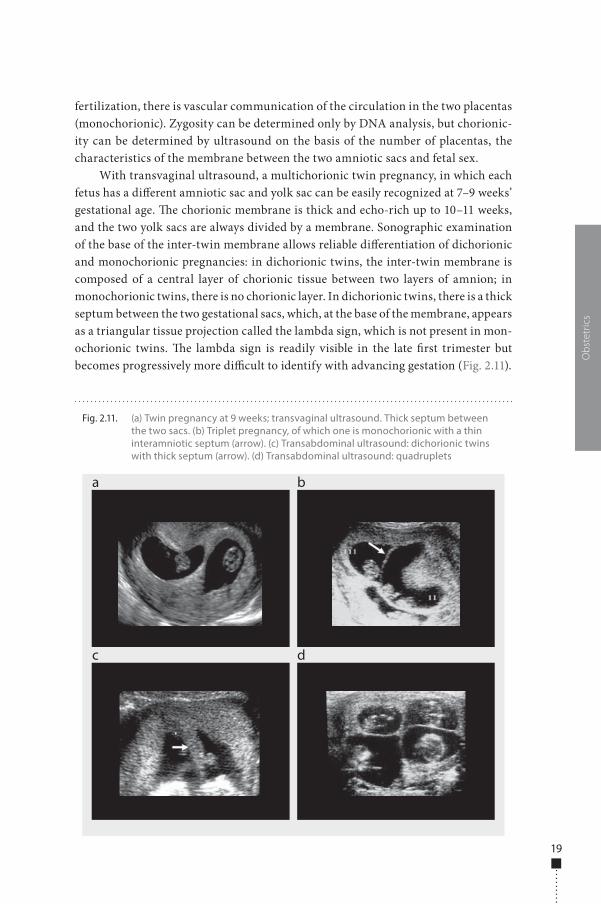
With transvaginal ultrasound, a multichorionic twin pregnancy, in which each fetus has a di�erent amniotic sac and yolk sac can be easily recognized at 7–9 weeks’ gestational age. �e chorionic membrane is thick and echo-rich up to 10–11 weeks, and the two yolk sacs are always divided by a membrane. Sonographic examination of the base of the inter-twin membrane allows reliable di�erentiation of dichorionic and monochorionic pregnancies: in dichorionic twins, the inter-twin membrane is composed of a central layer of chorionic tissue between two layers of amnion; in monochorionic twins, there is no chorionic layer. In dichorionic twins, there is a thick septum between the two gestational sacs, which, at the base of the membrane, appears as a triangular tissue projection called the lambda sign, which is not present in mon-ochorionic twins. �e lambda sign is readily visible in the late �rst trimester but becomes progressively more di�cult to identify with advancing gestation (Fig. 2.11).
Obs
tetr
ics
Fig. 2.11. (a) Twin pregnancy at 9 weeks; transvaginal ultrasound. Thick septum between the two sacs. (b) Triplet pregnancy, of which one is monochorionic with a thin interamniotic septum (arrow). (c) Transabdominal ultrasound: dichorionic twins with thick septum (arrow). (d) Transabdominal ultrasound: quadruplets
a
c
b
d
978-9241548540-C002 PRF ml YVR ln ml ml-1-Final Proof.indd 19 6/10/13 10:34 AM
20
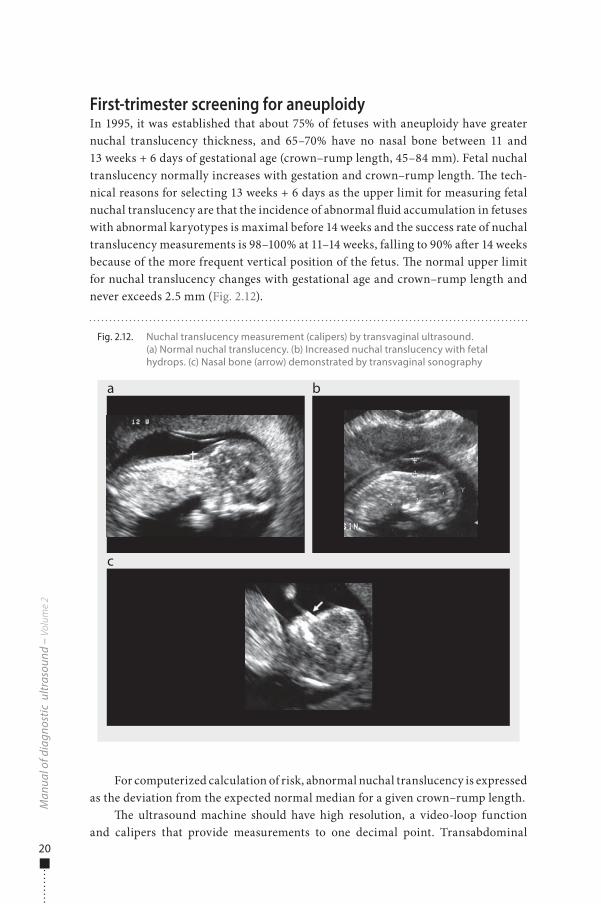
First-trimester screening for aneuploidyIn 1995, it was established that about 75% of fetuses with aneuploidy have greater nuchal translucency thickness, and 65–70% have no nasal bone between 11 and 13 weeks + 6 days of gestational age (crown–rump length, 45–84 mm). Fetal nuchal translucency normally increases with gestation and crown–rump length. �e tech-nical reasons for selecting 13 weeks + 6 days as the upper limit for measuring fetal nuchal translucency are that the incidence of abnormal �uid accumulation in fetuses with abnormal karyotypes is maximal before 14 weeks and the success rate of nuchal translucency measurements is 98–100% at 11–14 weeks, falling to 90% a�er 14 weeks because of the more frequent vertical position of the fetus. �e normal upper limit for nuchal translucency changes with gestational age and crown–rump length and never exceeds 2.5 mm (Fig. 2.12).
For computerized calculation of risk, abnormal nuchal translucency is expressed as the deviation from the expected normal median for a given crown–rump length.
�e ultrasound machine should have high resolution, a video-loop function and calipers that provide measurements to one decimal point. Transabdominal
Man
ual o
f dia
gnos
tic u
ltras
ound
– V
olum
e 2
Fig. 2.12. Nuchal translucency measurement (calipers) by transvaginal ultrasound. (a) Normal nuchal translucency. (b) Increased nuchal translucency with fetal hydrops. (c) Nasal bone (arrow) demonstrated by transvaginal sonography
a
c
b
978-9241548540-C002 PRF ml YVR ln ml ml-1-Final Proof.indd 20 6/10/13 10:34 AM
21
ultrasound is successful in about 95% of cases. Appropriate training of sonogra-phers and adherence to a standard technique for measuring nuchal translucency are essential prerequisites for good clinical practice and for the success of a screening programme. To measure nuchal translucency:
■ A mid-sagittal section of the fetus should be obtained, and nuchal translu-cency should be measured with the fetus in the neutral position and horizon-tal on the screen.
■ Only the fetal head and upper thorax should be included in the image. ■ �e magni�cation should be as great as possible, such that a slight movement
of the calipers causes only a 0.1-mm change in the measurement. ■ �e maximum thickness of the subcutaneous translucency between the skin
and the so� tissue overlying the cervical spine should be measured. ■ �e calipers should be placed on the lines that de�ne the thickness of the
nuchal translucency. ■ More than one measurement should be taken during the scan, and the maxi-
mum should be recorded.
�e fetal nasal bone can be visualized at 11–14 weeks. Several studies have shown a strong association between an absent nasal bone in the late �rst trimester and trisomy 21, as well as other chromosomal abnormalities. �e fetal pro�le can be examined in more than 95% of cases at 11–14 weeks (Fig. 2.12). In chromosomally normal fetuses, the nasal bone is absent in less than 1% of Caucasians and Asians and in about 10% of Afro-Caribbeans. It is absent in 65–70% of cases of trisomy 21, more than 50% cases of trisomy 18 and 30% of cases of trisomy 13. For examination of the nasal bone:
■ �e image should be magni�ed so that only the fetal head and upper thorax are included.
■ A mid-sagittal view of the fetal pro�le should be obtained with the ultrasound transducer held in parallel to the direction of the nose.
■ �e image of the nose should contain three distinct lines: the top line repre-sents the skin, the thicker, more echogenic line represents the nasal bone, and the third line, in continuity with the skin but higher, represents the tip of the nose (Fig. 2.12).
Pathological �ndingsBecause of the complexity of �rst-trimester development, complications are fre-quent. Spontaneous miscarriage occurs in approximately 15% of clinically diag-nosed pregnancies, but the loss rate is estimated to be two to three times higher in very early, o�en unrecognized pregnancies. Vaginal bleeding or spotting occurs in 25% of �rst-trimester pregnancies. O�en, the bleeding is mild and self-limited, and
Obs
tetr
ics
978-9241548540-C002 PRF ml YVR ln ml ml-1-Final Proof.indd 21 6/10/13 10:34 AM
22
ultrasound usually shows normal �ndings. In cases of severe pain, uterine contrac-tions, heavy bleeding or a dilated cervix, however, the pregnancy will probably fail, and ultrasound shows abnormal �ndings.
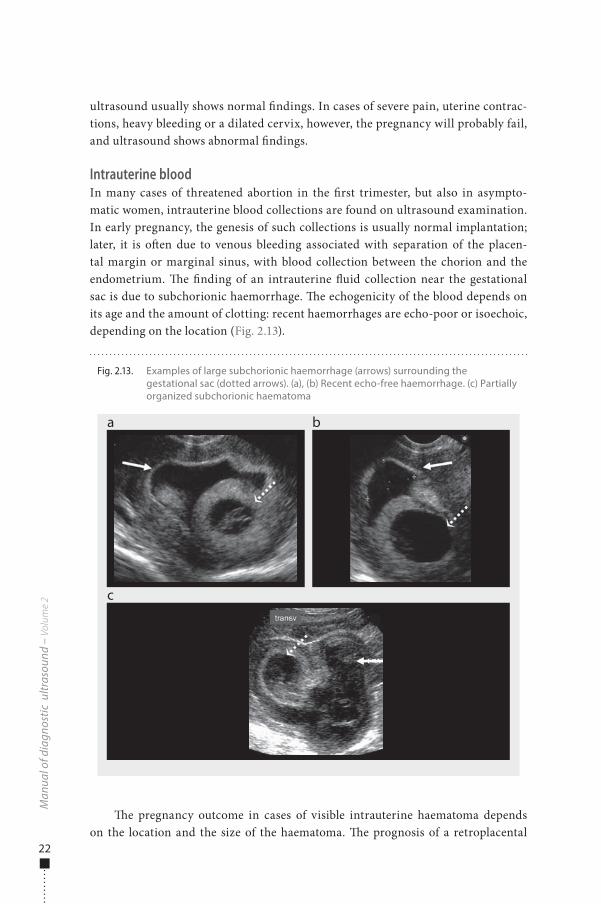
Intrauterine bloodIn many cases of threatened abortion in the �rst trimester, but also in asympto-matic women, intrauterine blood collections are found on ultrasound examination. In early pregnancy, the genesis of such collections is usually normal implantation; later, it is o�en due to venous bleeding associated with separation of the placen-tal margin or marginal sinus, with blood collection between the chorion and the endometrium. �e �nding of an intrauterine �uid collection near the gestational sac is due to subchorionic haemorrhage. �e echogenicity of the blood depends on its age and the amount of clotting: recent haemorrhages are echo-poor or isoechoic, depending on the location (Fig. 2.13).
�e pregnancy outcome in cases of visible intrauterine haematoma depends on the location and the size of the haematoma. �e prognosis of a retroplacental
Man
ual o
f dia
gnos
tic u
ltras
ound
– V
olum
e 2
Fig. 2.13. Examples of large subchorionic haemorrhage (arrows) surrounding the gestational sac (dotted arrows). (a), (b) Recent echo-free haemorrhage. (c) Partially organized subchorionic haematoma
a
c
b
978-9241548540-C002 PRF ml YVR ln ml ml-1-Final Proof.indd 22 6/10/13 10:34 AM
23
haematoma or a progressively larger haematoma is poor, but the evidence is equivo-cal. Despite vaginal bleeding, most women with intrauterine haematoma have suc-cessful pregnancy outcomes.
AbortionSpontaneous abortion is de�ned as termination of a pregnancy before 20 com-pleted weeks’ gestational age. Sixty-�ve per cent of spontaneous abortions occur during the �rst 16 weeks of pregnancy. Recurrent abortion is de�ned as three or more consecutive spontaneous abortions; its occurrence is 0.4–0.8% of all pregnancies.
In cases of threatened abortion (vaginal bleeding with a long, closed cervix), ultrasound examination gives information about the evolution of the pregnancy. �e term ‘missed abortion’ is not clear, and the term ‘embryonic demise’ should be used when a non-living embryo is found, whereas the term ‘blighted ovum’ should be used when a gestational sac with no visible embryo is found. Other entities that can present with symptoms suggesting threatened abortion are ectopic pregnancy and gestational trophoblastic disease. �e ultrasonographic �ndings in women with threatened abortion are crucial both for diagnosis and therapy. Sometimes, for a more precise diagnosis, it is necessary to integrate the ultrasound images with the quantity of serum human chorionic gonadotropin (hCG).
�e term ‘incomplete abortion’ is used when partial expulsion of products occurs. �e ultrasound scan reveals retained products of conception, endometrial blood and trophoblastic tissue, with no normal gestational sac. In cases of ‘complete abortion’, with complete expulsion of the products of conception, the ultrasound scan shows an empty uterus with a normal or slightly thickened endometrium. For practical reasons, the ultrasound �ndings in diagnoses of abortion are divided into those that reveal an absent intrauterine sac, a sac with no embryo visible and a sac containing an embryo.
Absent intrauterine sac: On ultrasound examination, if the uterus appears normal or if the endometrial echoes appear thickened without a visible gestational sac, the di�erential diagnosis may be early spontaneous abortion, very early intrau-terine pregnancy or ectopic pregnancy. �e woman’s history and the quantity of hCG can o�en clarify the sonographic �ndings. With transvaginal ultrasound, the gesta-tional sac is usually visible at 4 weeks’ gestational age, when the mean sac diameter is 2–3 mm and the hCG level 800–2600 IU/l; with both transvaginal and transab-dominal ultrasound, a sac should be detected when its mean diameter is 5 mm, cor-responding to 5 weeks’ gestational age. If the hCG concentration is less than 1000 IU/l, it is di�cult to identify the gestational sac. In these cases, it is advisable to repeat the hCG measurement and ultrasound a�er at least 48–72 h. If the hCG level is more than 2500 IU/l and no gestational sac is visible inside the uterus, the probability of an ectopic pregnancy is high.
Intrauterine sac without an embryo or yolk sac: In this situation, there are three possible diagnoses: a normal early intrauterine pregnancy, an abnormal intrau-terine pregnancy or a pseudogestational sac in an ectopic pregnancy. In theory, an
Obs
tetr
ics
978-9241548540-C002 PRF ml YVR ln ml ml-1-Final Proof.indd 23 6/10/13 10:34 AM
24
intrauterine sac can be distinguished from a pseudogestational sac, as the former is located within the decidua and the latter is within the uterine cavity. In practice, this distinction is o�en di�cult, and a follow-up ultrasound should be made to verify the subsequent appearance of the yolk sac or the embryo. Size criteria can be used to di�erentiate a normal from an abnormal intrauterine sac. With transabdominal ultrasound, discriminatory size criteria suggestive of an abortion include: failure to detect a double decidual sac with a mean gestational sac diameter of ≥ 10 mm; failure to detect a yolk sac with a mean gestational sac diameter of ≥ 20 mm; and failure to detect an embryo and its cardiac activity with a mean gestational sac diameter of ≥ 25 mm. With transvaginal ultrasound, the discriminatory size criteria are: failure to detect a yolk sac with a mean gestational sac diameter of ≥ 8 mm; and failure to detect an embryo and its cardiac activity with a mean gestational sac diameter of ≥ 20 mm. �e normal gestational sac grows at 1.13 mm/day, whereas an abnormal sac is estimated to grow at only 0.70 mm/day. If the ultrasound �ndings are contro-versial, the examination is di�cult or the sonographer is inexperienced, caution is
Man
ual o
f dia
gnos
tic u
ltras
ound
– V
olum
e 2
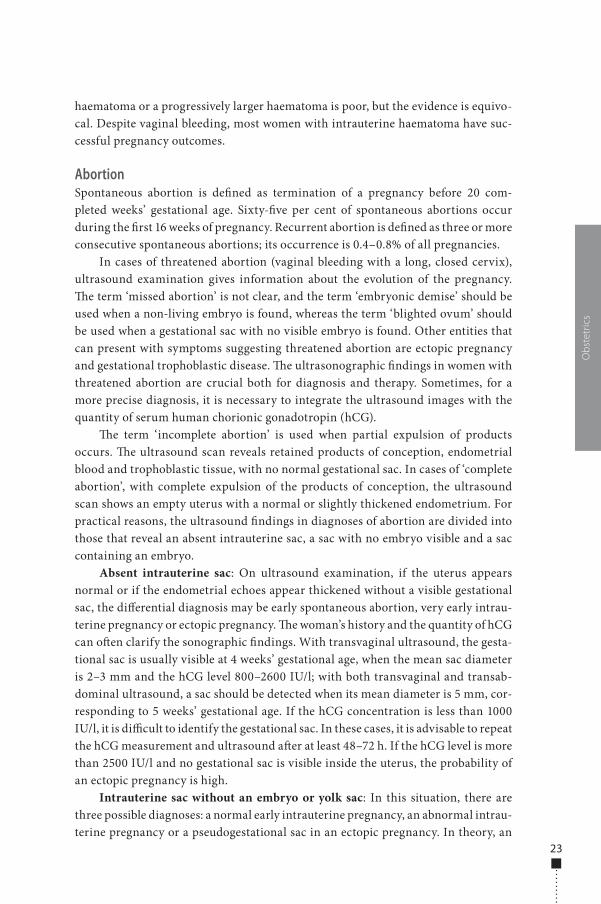
Fig. 2.14. Transvaginal ultrasound in cases of spontaneous abortion. (a) Intrauterine sac containing a yolk sac and a small embryo (> 5 mm) without a heartbeat. (b) Non-living embryo (crown–rump length, 20 mm). (c) Bright yolk sac (arrow), often seen in abortion. (d) Twin abortion at 10 weeks’ gestational age: transverse scan demonstrates an empty gestational sac (right) and a gestational sac containing a small embryo (< 5 mm; left) near the inter-twin membrane
a
c
b
d
978-9241548540-C002 PRF ml YVR ln ml ml-1-Final Proof.indd 24 6/10/13 10:34 AM
25
warranted, and follow-up ultrasound should be done a�er an appropriate interval to obviate the risk of terminating a normal intrauterine pregnancy.
Intrauterine sac containing an embryo: When an embryo is visible with transabdominal ultrasound but cardiac activity is absent, the prognosis is poor. Nevertheless, cardiac activity is not detectable in very small embryos; the discrimi-natory embryonic size for detecting cardiac motion by transabdominal ultrasound is 10 mm. With transvaginal ultrasound, the discriminatory crown–rump length for visualizing cardiac motion is 5 mm. If the embryonic length is less than the dis-criminatory size, women should be managed expectantly, and follow-up ultrasound should be done when the expected crown–rump length exceeds the discriminatory value. When the crown–rump length exceeds the discriminatory length and cardiac activity is absent, a nonviable gestation is diagnosed (missed abortion or embryonic demise). Observation of the heartbeat inside the embryo is helpful for evaluating its relation to the yolk sac. At 6–7 weeks’ gestational age, the embryo and the yolk sac
Obs
tetr
ics
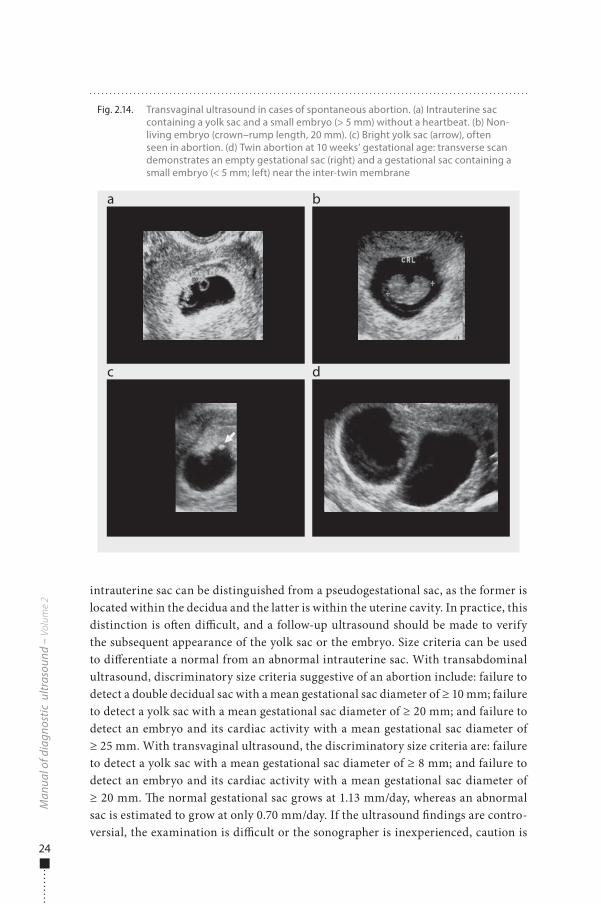
Fig. 2.15. Transabdominal ultrasound in cases of spontaneous abortion. (a) Empty gestational sac at 7 weeks + 3 days, with a leiomyoma of the posterior uterine wall (arrow). (b, c) Spontaneous expulsion of gestational sac and placenta (visible as a complex mass) in transverse (b) and longitudinal (c) scans of the uterine cervix. (d) Embryonic demise at 16 weeks’ menstrual age, 8 weeks’ gestational age: a large gestational sac, �lling the uterine cavity completely, shown in transverse (top) and longitudinal (bottom) scans of the uterus
a
c d
b
978-9241548540-C002 PRF ml YVR ln ml ml-1-Final Proof.indd 25 6/10/13 10:34 AM
26
are contiguous; they diverge a�er 7 weeks. Cardiac activity should be recorded at the highest transducer frequency available in real-time or M-mode; for safety reasons, Doppler should be avoided before 10 weeks’ gestational age. �e normal cardiac rate should be > 100 beats per min up to 6 weeks + 2 days and > 120 beats per min later (Fig. 2.14, Fig. 2.15).
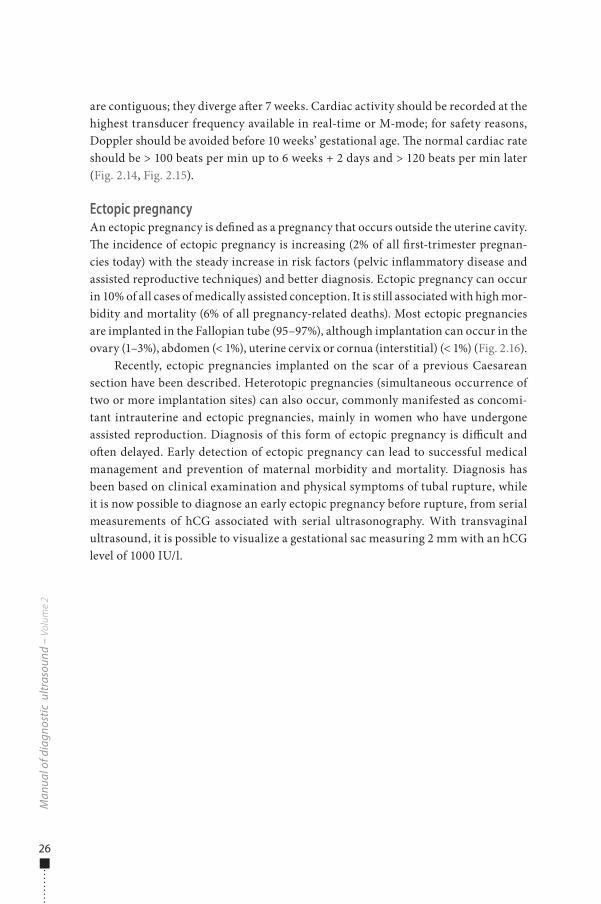
Ectopic pregnancyAn ectopic pregnancy is de�ned as a pregnancy that occurs outside the uterine cavity. �e incidence of ectopic pregnancy is increasing (2% of all �rst-trimester pregnan-cies today) with the steady increase in risk factors (pelvic in�ammatory disease and assisted reproductive techniques) and better diagnosis. Ectopic pregnancy can occur in 10% of all cases of medically assisted conception. It is still associated with high mor-bidity and mortality (6% of all pregnancy-related deaths). Most ectopic pregnancies are implanted in the Fallopian tube (95–97%), although implantation can occur in the ovary (1–3%), abdomen (< 1%), uterine cervix or cornua (interstitial) (< 1%) (Fig. 2.16).
Recently, ectopic pregnancies implanted on the scar of a previous Caesarean section have been described. Heterotopic pregnancies (simultaneous occurrence of two or more implantation sites) can also occur, commonly manifested as concomi-tant intrauterine and ectopic pregnancies, mainly in women who have undergone assisted reproduction. Diagnosis of this form of ectopic pregnancy is di�cult and o�en delayed. Early detection of ectopic pregnancy can lead to successful medical management and prevention of maternal morbidity and mortality. Diagnosis has been based on clinical examination and physical symptoms of tubal rupture, while it is now possible to diagnose an early ectopic pregnancy before rupture, from serial measurements of hCG associated with serial ultrasonography. With transvaginal ultrasound, it is possible to visualize a gestational sac measuring 2 mm with an hCG level of 1000 IU/l.
Man
ual o
f dia
gnos
tic u
ltras
ound
– V
olum
e 2
978-9241548540-C002 PRF ml YVR ln ml ml-1-Final Proof.indd 26 6/10/13 10:34 AM
27
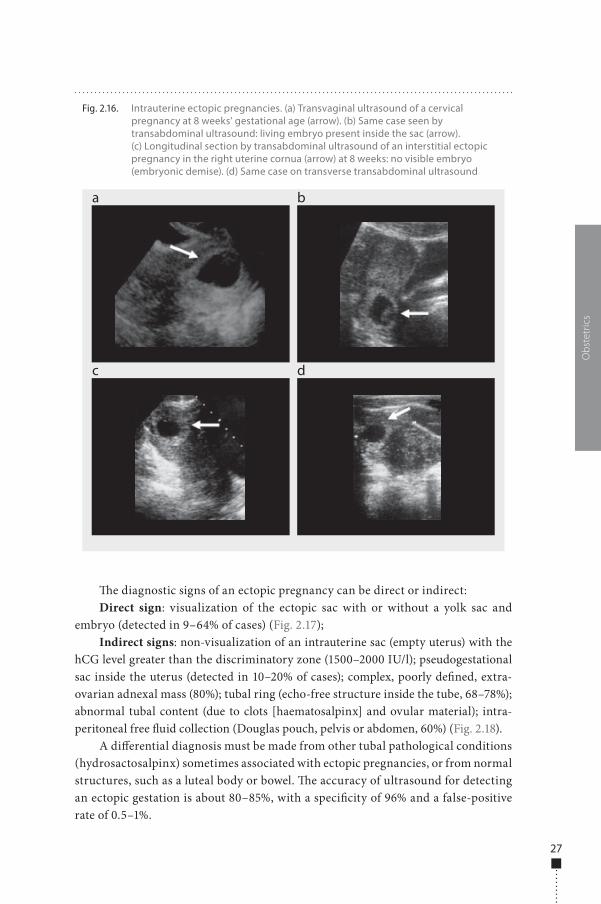
�e diagnostic signs of an ectopic pregnancy can be direct or indirect:Direct sign: visualization of the ectopic sac with or without a yolk sac and
embryo (detected in 9–64% of cases) (Fig. 2.17);Indirect signs: non-visualization of an intrauterine sac (empty uterus) with the
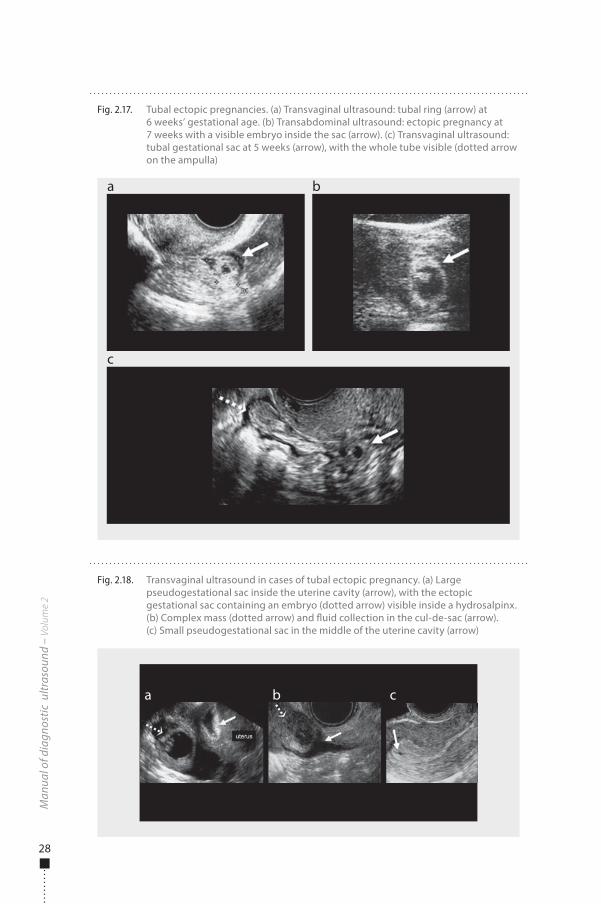
hCG level greater than the discriminatory zone (1500–2000 IU/l); pseudogestational sac inside the uterus (detected in 10–20% of cases); complex, poorly de�ned, extra-ovarian adnexal mass (80%); tubal ring (echo-free structure inside the tube, 68–78%); abnormal tubal content (due to clots [haematosalpinx] and ovular material); intra-peritoneal free �uid collection (Douglas pouch, pelvis or abdomen, 60%) (Fig. 2.18).
A di�erential diagnosis must be made from other tubal pathological conditions (hydrosactosalpinx) sometimes associated with ectopic pregnancies, or from normal structures, such as a luteal body or bowel. �e accuracy of ultrasound for detecting an ectopic gestation is about 80–85%, with a speci�city of 96% and a false-positive rate of 0.5–1%.
Obs
tetr
ics
Fig. 2.16. Intrauterine ectopic pregnancies. (a) Transvaginal ultrasound of a cervical pregnancy at 8 weeks’ gestational age (arrow). (b) Same case seen by transabdominal ultrasound: living embryo present inside the sac (arrow). (c) Longitudinal section by transabdominal ultrasound of an interstitial ectopic pregnancy in the right uterine cornua (arrow) at 8 weeks: no visible embryo (embryonic demise). (d) Same case on transverse transabdominal ultrasound
a
c
b
d
978-9241548540-C002 PRF ml YVR ln ml ml-1-Final Proof.indd 27 6/10/13 10:34 AM
28
Man
ual o
f dia
gnos
tic u
ltras
ound
– V
olum
e 2
Fig. 2.17. Tubal ectopic pregnancies. (a) Transvaginal ultrasound: tubal ring (arrow) at 6 weeks’ gestational age. (b) Transabdominal ultrasound: ectopic pregnancy at 7 weeks with a visible embryo inside the sac (arrow). (c) Transvaginal ultrasound: tubal gestational sac at 5 weeks (arrow), with the whole tube visible (dotted arrow on the ampulla)
a
c
b
Fig. 2.18. Transvaginal ultrasound in cases of tubal ectopic pregnancy. (a) Large pseudogestational sac inside the uterine cavity (arrow), with the ectopic gestational sac containing an embryo (dotted arrow) visible inside a hydrosalpinx. (b) Complex mass (dotted arrow) and �uid collection in the cul-de-sac (arrow). (c) Small pseudogestational sac in the middle of the uterine cavity (arrow)
a b c
978-9241548540-C002 PRF ml YVR ln ml ml-1-Final Proof.indd 28 6/10/13 10:34 AM
29
Gestational trophoblastic diseaseGestational trophoblastic disease is a spectrum of conditions, including hydatidi-form mole, invasive mole and chorioncarcinoma. First-trimester bleeding is o�en the commonest clinical presentation of these disorders, with excessive, rapidly growing uterine size, exceeding the normal size for gestational age. Other clinical features are hyperemesis gravidarum or pre-eclampsia before 24 weeks. Maternal blood contains excessive hCG due to abnormal proliferation of trophoblastic tissue.
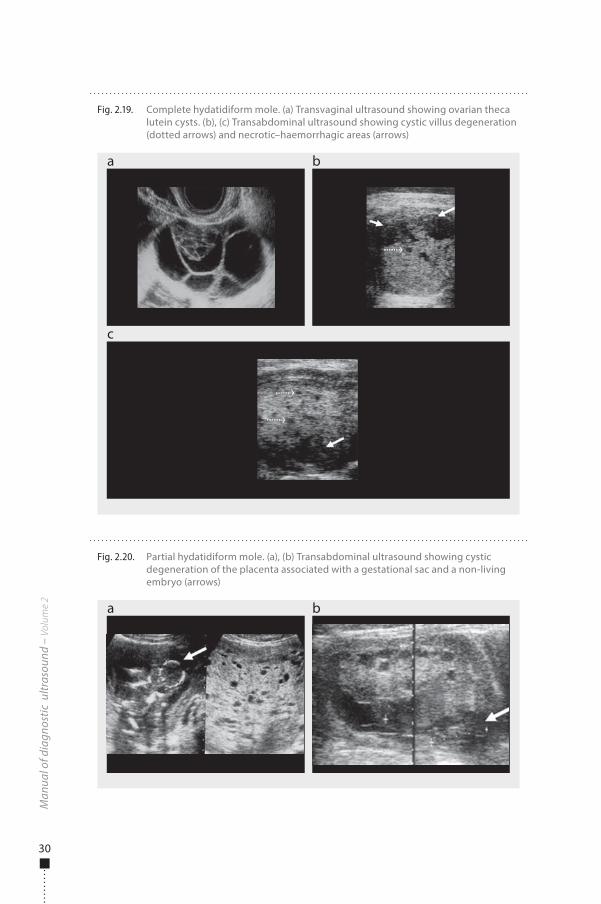
Hydatidiform mole (molar pregnancy)Hydatidiform mole is a gestational complication that occurs in 1 out of 1000–2000 pregnancies. Complete and partial molar pregnancies have been described. Complete hydatidiform mole is the commonest trophoblastic disease, resulting from fecunda-tion of an egg with no active nucleus: all the chromosomes present in the product of conception are of paternal origin (complete hydatidiform mole is also known as uniparental disomy, with a 46,XX karyotype in 90% of cases). �e uniparental disomy causes early embryonic demise and proliferation of trophoblastic tissue, with the gross pathological appearance of a complex multicystic mass, shown as a snowstorm pattern with the oldest ultrasound equipment. �e current ultrasound appearance of a com-plete hydatidiform mole is a heterogeneous echogenic endometrial mass with multiple cysts of variable size and necrotic–haemorrhagic areas. Doppler examination reveals increased uterine vascularity with high velocities and a low resistance index in the uterine arteries. In 50% of cases of complete hydatidiform mole, theca lutein cysts are present in the adnexa, resulting from hCG stimulation of the ovaries. On ultra-sound, theca lutein cysts appear as multiple, large, bilateral, multiseptated ovarian cysts, sometimes haemorrhagic or complex, described as clusters of grapes (Fig. 2.19).
Partial hydatidiform moles result from fecundation of a normal egg with two spermatozoa or a diploid sperm, known as diandry (extra haploid set from the father). �e abnormal karyotype is triploid (69,XXY) or tetraploid (92,XXXY). In partial moles, the triploidy is always paternal. In cases of maternal triploidy (digyny, an extra haploid set from the mother), other disorders, such as intrauterine growth retarda-tion or spontaneous abortion, occur, with a non-molar placenta. In partial molar pregnancy, the ultrasound scan shows a gestational sac containing a fetus and an enlarged placenta with focal areas of multiple cysts. O�en, the fetus coexisting with a molar pregnancy shows growth retardation and congenital anomalies (Fig. 2.20).
�e di�erential diagnosis of a partial mole includes:
■ twin pregnancy with one normal fetus and placenta and an accompanying complete hydatidiform mole; in this case, the fetal growth and anatomy are normal;
■ fetal demise with hydropic degeneration of the placenta; the ultrasound pres-entation can be identical to that of a partial molar pregnancy, and pathological diagnosis is needed;
■ placental pseudomole, due to mesenchymal dysplasia with villous hydrops, seen in pre-eclampsia. This placental pathology is rare in the first trimester.
Obs
tetr
ics
978-9241548540-C002 PRF ml YVR ln ml ml-1-Final Proof.indd 29 6/10/13 10:34 AM
30
Man
ual o
f dia
gnos
tic u
ltras
ound
– V
olum
e 2
Fig. 2.20. Partial hydatidiform mole. (a), (b) Transabdominal ultrasound showing cystic degeneration of the placenta associated with a gestational sac and a non-living embryo (arrows)
a b
Fig. 2.19. Complete hydatidiform mole. (a) Transvaginal ultrasound showing ovarian theca lutein cysts. (b), (c) Transabdominal ultrasound showing cystic villus degeneration (dotted arrows) and necrotic–haemorrhagic areas (arrows)
a
c
b
978-9241548540-C002 PRF ml YVR ln ml ml-1-Final Proof.indd 30 6/10/13 10:34 AM
31
Invasive mole and chorioncarcinomaInvasive mole presents as a deep growth into the myometrium and beyond, some-times with penetration into the peritoneum and parametria. �is tumour is locally invasive and rarely metastasizes, in contrast to chorioncarcinoma, which typically metastasizes extensively to the lung and pelvic organs. Of these tumours, 50% derive from a molar pregnancy, 25% from an abortion and 25% from an apparently normal pregnancy. A diagnosis is made when hCG levels remain elevated a�er evacuation of a pregnancy or a�er a delivery. Ultrasound may show the presence of a uterine mass similar to a complete hydatidiform mole and sometimes myometrial trophoblastic invasion. Haemorrhagic areas are o�en present inside the molar tissue, giving a com-plex aspect, mainly in chorioncarcinoma. Doppler shows increased myometrial �ow, with abnormal vessels and shunts.
Computed tomography (CT) is useful for detecting metastases, and magnetic resonance imaging (MRI) demonstrates myometrial and vaginal invasion.
Embryo–fetal anomaliesAlthough many congenital anomalies cannot be diagnosed with con�dence until the middle of the second trimester, imaging of the embryo has improved with continued technological advances, and many major fetal defects (such as acrania or anenceph-aly, large encephalocoele, holoprosencephaly, ventral wall defects, megacystis and conjoined twins) can be detected in the latter part of the �rst trimester. By 10 weeks’ gestational age, the fetal cranium, brain, trunk and extremities can be visualized.
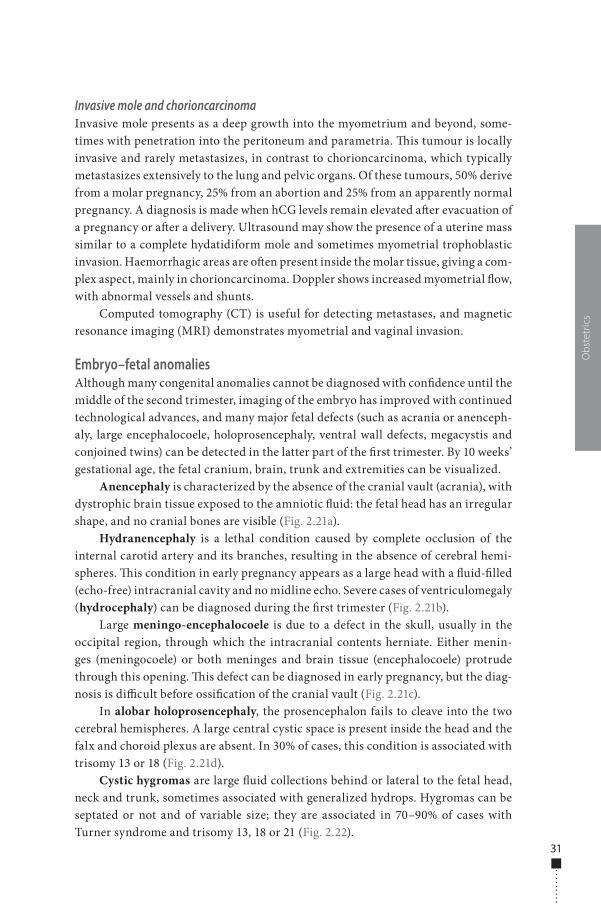
Anencephaly is characterized by the absence of the cranial vault (acrania), with dystrophic brain tissue exposed to the amniotic �uid: the fetal head has an irregular shape, and no cranial bones are visible (Fig. 2.21a).
Hydranencephaly is a lethal condition caused by complete occlusion of the internal carotid artery and its branches, resulting in the absence of cerebral hemi-spheres. �is condition in early pregnancy appears as a large head with a �uid-�lled (echo-free) intracranial cavity and no midline echo. Severe cases of ventriculomegaly (hydrocephaly) can be diagnosed during the �rst trimester (Fig. 2.21b).
Large meningo-encephalocoele is due to a defect in the skull, usually in the occipital region, through which the intracranial contents herniate. Either menin-ges (meningocoele) or both meninges and brain tissue (encephalocoele) protrude through this opening. �is defect can be diagnosed in early pregnancy, but the diag-nosis is di�cult before ossi�cation of the cranial vault (Fig. 2.21c).
In alobar holoprosencephaly, the prosencephalon fails to cleave into the two cerebral hemispheres. A large central cystic space is present inside the head and the falx and choroid plexus are absent. In 30% of cases, this condition is associated with trisomy 13 or 18 (Fig. 2.21d).
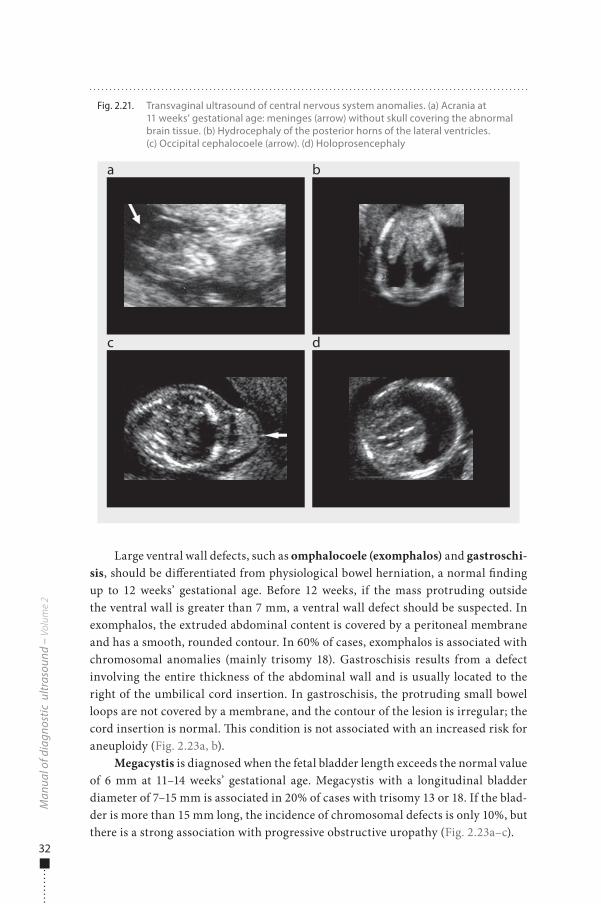
Cystic hygromas are large �uid collections behind or lateral to the fetal head, neck and trunk, sometimes associated with generalized hydrops. Hygromas can be septated or not and of variable size; they are associated in 70–90% of cases with Turner syndrome and trisomy 13, 18 or 21 (Fig. 2.22).
Obs
tetr
ics
978-9241548540-C002 PRF ml YVR ln ml ml-1-Final Proof.indd 31 6/10/13 10:34 AM
32
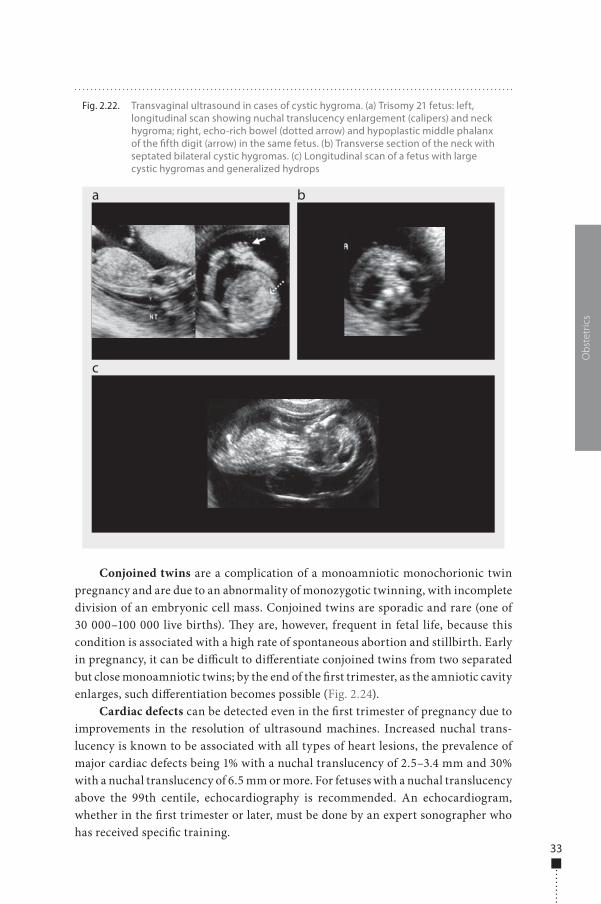
Large ventral wall defects, such as omphalocoele (exomphalos) and gastroschi-sis, should be di�erentiated from physiological bowel herniation, a normal �nding up to 12 weeks’ gestational age. Before 12 weeks, if the mass protruding outside the ventral wall is greater than 7 mm, a ventral wall defect should be suspected. In exomphalos, the extruded abdominal content is covered by a peritoneal membrane and has a smooth, rounded contour. In 60% of cases, exomphalos is associated with chromosomal anomalies (mainly trisomy 18). Gastroschisis results from a defect involving the entire thickness of the abdominal wall and is usually located to the right of the umbilical cord insertion. In gastroschisis, the protruding small bowel loops are not covered by a membrane, and the contour of the lesion is irregular; the cord insertion is normal. �is condition is not associated with an increased risk for aneuploidy (Fig. 2.23a, b).
Megacystis is diagnosed when the fetal bladder length exceeds the normal value of 6 mm at 11–14 weeks’ gestational age. Megacystis with a longitudinal bladder diameter of 7–15 mm is associated in 20% of cases with trisomy 13 or 18. If the blad-der is more than 15 mm long, the incidence of chromosomal defects is only 10%, but there is a strong association with progressive obstructive uropathy (Fig. 2.23a–c).
Man
ual o
f dia
gnos
tic u
ltras
ound
– V
olum
e 2
Fig. 2.21. Transvaginal ultrasound of central nervous system anomalies. (a) Acrania at 11 weeks’ gestational age: meninges (arrow) without skull covering the abnormal brain tissue. (b) Hydrocephaly of the posterior horns of the lateral ventricles. (c) Occipital cephalocoele (arrow). (d) Holoprosencephaly
a
c
b
d
978-9241548540-C002 PRF ml YVR ln ml ml-1-Final Proof.indd 32 6/10/13 10:34 AM
33
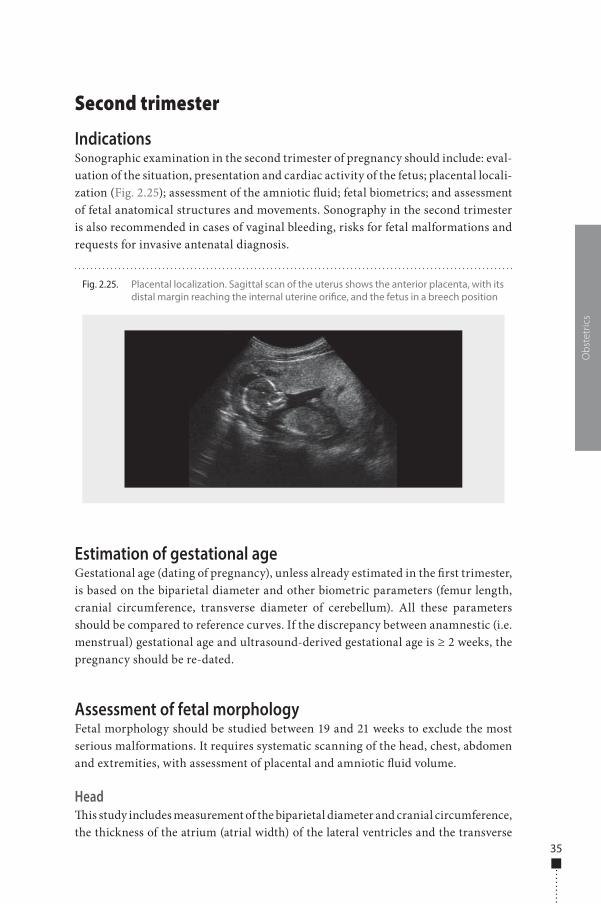
Conjoined twins are a complication of a monoamniotic monochorionic twin pregnancy and are due to an abnormality of monozygotic twinning, with incomplete division of an embryonic cell mass. Conjoined twins are sporadic and rare (one of 30 000–100 000 live births). �ey are, however, frequent in fetal life, because this condition is associated with a high rate of spontaneous abortion and stillbirth. Early in pregnancy, it can be di�cult to di�erentiate conjoined twins from two separated but close monoamniotic twins; by the end of the �rst trimester, as the amniotic cavity enlarges, such di�erentiation becomes possible (Fig. 2.24).
Cardiac defects can be detected even in the �rst trimester of pregnancy due to improvements in the resolution of ultrasound machines. Increased nuchal trans-lucency is known to be associated with all types of heart lesions, the prevalence of major cardiac defects being 1% with a nuchal translucency of 2.5–3.4 mm and 30% with a nuchal translucency of 6.5 mm or more. For fetuses with a nuchal translucency above the 99th centile, echocardiography is recommended. An echocardiogram, whether in the �rst trimester or later, must be done by an expert sonographer who has received speci�c training.
Obs
tetr
ics
Fig. 2.22. Transvaginal ultrasound in cases of cystic hygroma. (a) Trisomy 21 fetus: left, longitudinal scan showing nuchal translucency enlargement (calipers) and neck hygroma; right, echo-rich bowel (dotted arrow) and hypoplastic middle phalanx of the �fth digit (arrow) in the same fetus. (b) Transverse section of the neck with septated bilateral cystic hygromas. (c) Longitudinal scan of a fetus with large cystic hygromas and generalized hydrops
a
c
b
978-9241548540-C002 PRF ml YVR ln ml ml-1-Final Proof.indd 33 6/10/13 10:34 AM
34
Man
ual o
f dia
gnos
tic u
ltras
ound
– V
olum
e 2
Fig. 2.24. Transabdominal ultrasound of monoamniotic conjoined twins. (a) Two fetuses close within the same sac. (b) Conjunction between the two fetal abdomens (arrow)
a b
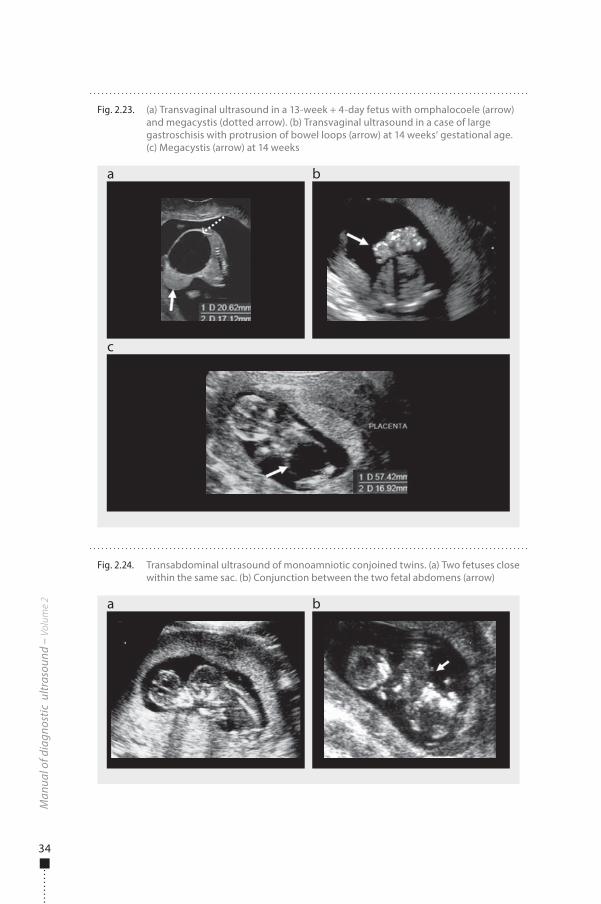
Fig. 2.23. (a) Transvaginal ultrasound in a 13-week + 4-day fetus with omphalocoele (arrow) and megacystis (dotted arrow). (b) Transvaginal ultrasound in a case of large gastroschisis with protrusion of bowel loops (arrow) at 14 weeks’ gestational age. (c) Megacystis (arrow) at 14 weeks
a
c
b
978-9241548540-C002 PRF ml YVR ln ml ml-1-Final Proof.indd 34 6/10/13 10:34 AM
35
Second trimester
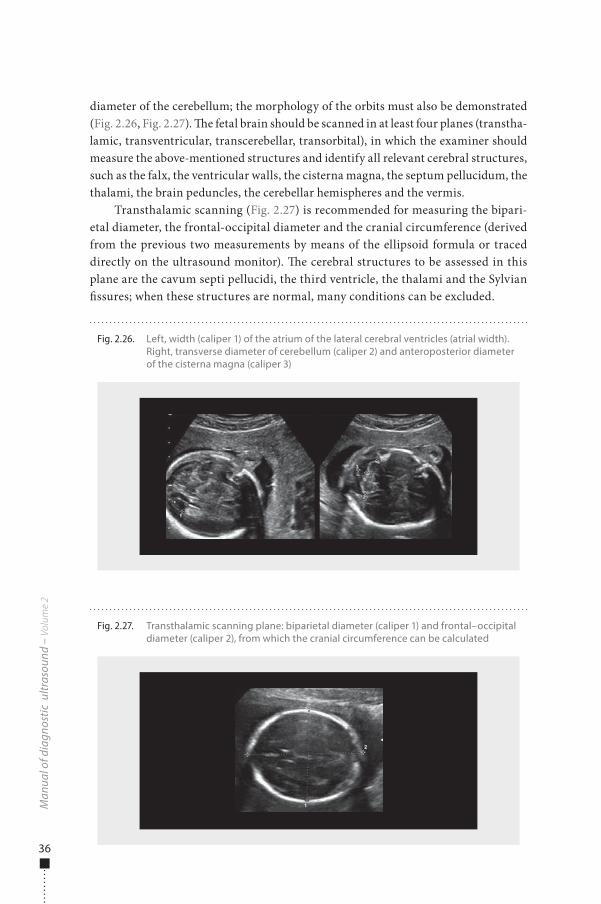
IndicationsSonographic examination in the second trimester of pregnancy should include: eval-uation of the situation, presentation and cardiac activity of the fetus; placental locali-zation (Fig. 2.25); assessment of the amniotic �uid; fetal biometrics; and assessment of fetal anatomical structures and movements. Sonography in the second trimester is also recommended in cases of vaginal bleeding, risks for fetal malformations and requests for invasive antenatal diagnosis.
Estimation of gestational ageGestational age (dating of pregnancy), unless already estimated in the �rst trimester, is based on the biparietal diameter and other biometric parameters (femur length, cranial circumference, transverse diameter of cerebellum). All these parameters should be compared to reference curves. If the discrepancy between anamnestic (i.e. menstrual) gestational age and ultrasound-derived gestational age is ≥ 2 weeks, the pregnancy should be re-dated.
Assessment of fetal morphologyFetal morphology should be studied between 19 and 21 weeks to exclude the most serious malformations. It requires systematic scanning of the head, chest, abdomen and extremities, with assessment of placental and amniotic �uid volume.
Head�is study includes measurement of the biparietal diameter and cranial circumference, the thickness of the atrium (atrial width) of the lateral ventricles and the transverse
Obs
tetr
ics
Fig. 2.25. Placental localization. Sagittal scan of the uterus shows the anterior placenta, with its distal margin reaching the internal uterine ori�ce, and the fetus in a breech position
978-9241548540-C002 PRF ml YVR ln ml ml-1-Final Proof.indd 35 6/10/13 10:34 AM
36
diameter of the cerebellum; the morphology of the orbits must also be demonstrated (Fig. 2.26, Fig. 2.27). �e fetal brain should be scanned in at least four planes (transtha-lamic, transventricular, transcerebellar, transorbital), in which the examiner should measure the above-mentioned structures and identify all relevant cerebral structures, such as the falx, the ventricular walls, the cisterna magna, the septum pellucidum, the thalami, the brain peduncles, the cerebellar hemispheres and the vermis.
Transthalamic scanning (Fig. 2.27) is recommended for measuring the bipari-etal diameter, the frontal-occipital diameter and the cranial circumference (derived from the previous two measurements by means of the ellipsoid formula or traced directly on the ultrasound monitor). �e cerebral structures to be assessed in this plane are the cavum septi pellucidi, the third ventricle, the thalami and the Sylvian �ssures; when these structures are normal, many conditions can be excluded.
Man
ual o
f dia
gnos
tic u
ltras
ound
– V
olum
e 2
Fig. 2.26. Left, width (caliper 1) of the atrium of the lateral cerebral ventricles (atrial width). Right, transverse diameter of cerebellum (caliper 2) and anteroposterior diameter of the cisterna magna (caliper 3)
Fig. 2.27. Transthalamic scanning plane: biparietal diameter (caliper 1) and frontal–occipital diameter (caliper 2), from which the cranial circumference can be calculated
978-9241548540-C002 PRF ml YVR ln ml ml-1-Final Proof.indd 36 6/10/13 10:34 AM
37
Transventricular scanning is done at a plane slightly higher than the previous one, allowing visualization at the median line of the same structures and the front and rear of the ventricular cavities. �e atrial width of the frontal horns must be measured and reported at each examination: its average value is 7.5 ± 0.5 mm and its maximum value is 10 mm. A�er the 30th week, the cavity of the frontal horns can no longer be seen in the normal fetus.
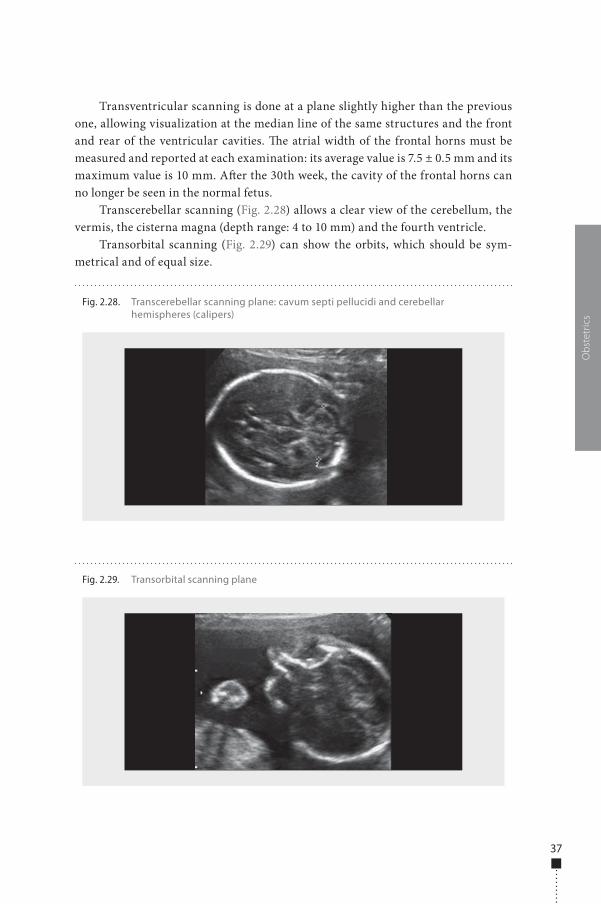
Transcerebellar scanning (Fig. 2.28) allows a clear view of the cerebellum, the vermis, the cisterna magna (depth range: 4 to 10 mm) and the fourth ventricle.
Transorbital scanning (Fig. 2.29) can show the orbits, which should be sym-metrical and of equal size.
Obs
tetr
ics
Fig. 2.28. Transcerebellar scanning plane: cavum septi pellucidi and cerebellar hemispheres (calipers)
Fig. 2.29. Transorbital scanning plane
978-9241548540-C002 PRF ml YVR ln ml ml-1-Final Proof.indd 37 6/10/13 10:34 AM
38
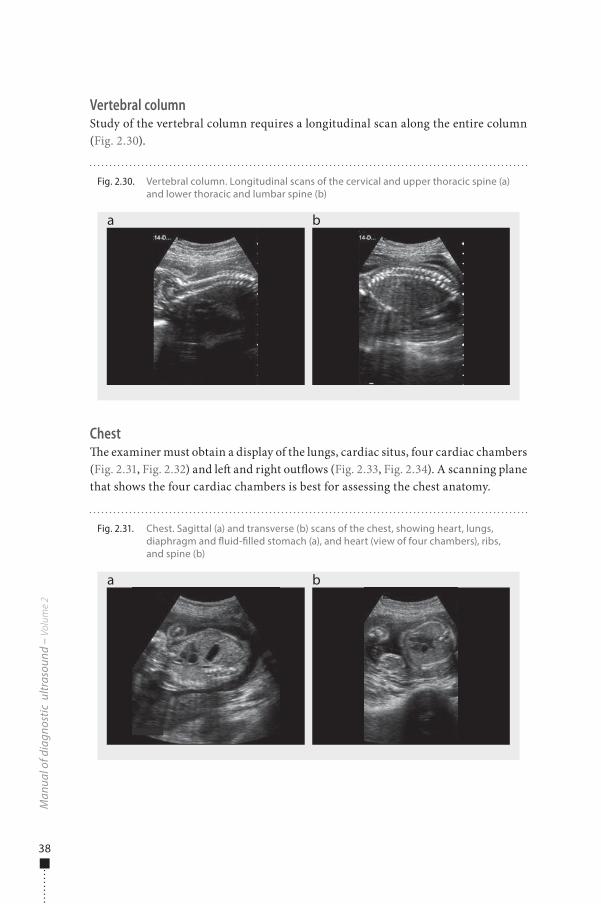
Vertebral columnStudy of the vertebral column requires a longitudinal scan along the entire column (Fig. 2.30).
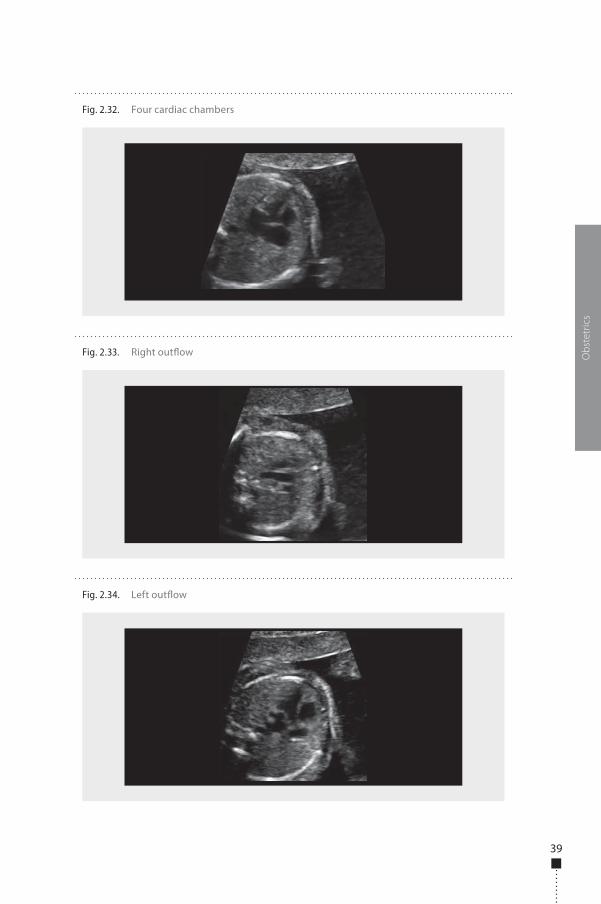
Chest�e examiner must obtain a display of the lungs, cardiac situs, four cardiac chambers (Fig. 2.31, Fig. 2.32) and le� and right out�ows (Fig. 2.33, Fig. 2.34). A scanning plane that shows the four cardiac chambers is best for assessing the chest anatomy.
Man
ual o
f dia
gnos
tic u
ltras
ound
– V
olum
e 2
Fig. 2.30. Vertebral column. Longitudinal scans of the cervical and upper thoracic spine (a) and lower thoracic and lumbar spine (b)
a b
Fig. 2.31. Chest. Sagittal (a) and transverse (b) scans of the chest, showing heart, lungs, diaphragm and �uid-�lled stomach (a), and heart (view of four chambers), ribs, and spine (b)
a b
978-9241548540-C002 PRF ml YVR ln ml ml-1-Final Proof.indd 38 6/10/13 10:34 AM
39
Obs
tetr
ics
Fig. 2.32. Four cardiac chambers
Fig. 2.33. Right out�ow
Fig. 2.34. Left out�ow
978-9241548540-C002 PRF ml YVR ln ml ml-1-Final Proof.indd 39 6/10/13 10:34 AM
40
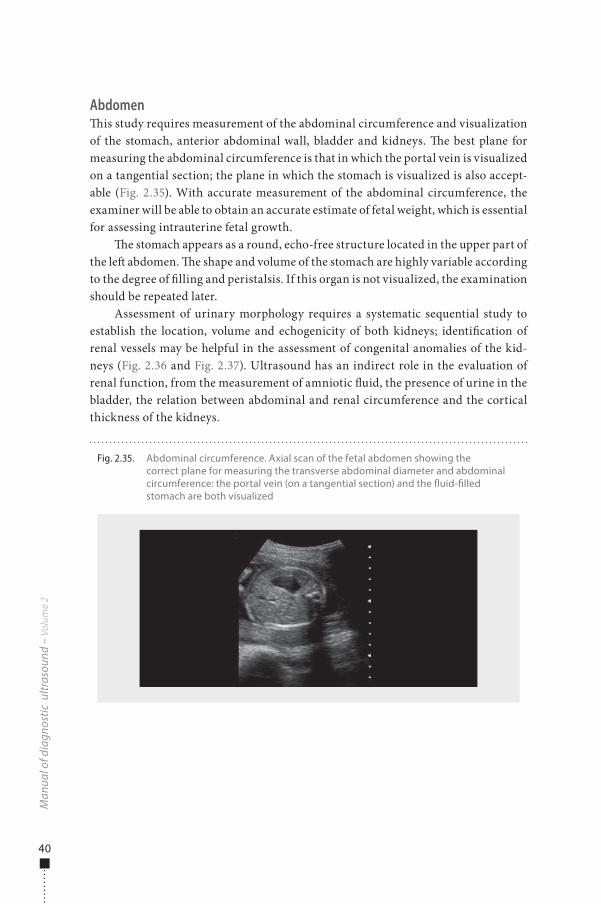
Abdomen�is study requires measurement of the abdominal circumference and visualization of the stomach, anterior abdominal wall, bladder and kidneys. �e best plane for measuring the abdominal circumference is that in which the portal vein is visualized on a tangential section; the plane in which the stomach is visualized is also accept-able (Fig. 2.35). With accurate measurement of the abdominal circumference, the examiner will be able to obtain an accurate estimate of fetal weight, which is essential for assessing intrauterine fetal growth.
�e stomach appears as a round, echo-free structure located in the upper part of the le� abdomen. �e shape and volume of the stomach are highly variable according to the degree of �lling and peristalsis. If this organ is not visualized, the examination should be repeated later.
Assessment of urinary morphology requires a systematic sequential study to establish the location, volume and echogenicity of both kidneys; identi�cation of renal vessels may be helpful in the assessment of congenital anomalies of the kid-neys (Fig. 2.36 and Fig. 2.37). Ultrasound has an indirect role in the evaluation of renal function, from the measurement of amniotic �uid, the presence of urine in the bladder, the relation between abdominal and renal circumference and the cortical thickness of the kidneys.
Man
ual o
f dia
gnos
tic u
ltras
ound
– V
olum
e 2
Fig. 2.35. Abdominal circumference. Axial scan of the fetal abdomen showing the correct plane for measuring the transverse abdominal diameter and abdominal circumference: the portal vein (on a tangential section) and the �uid-�lled stomach are both visualized
978-9241548540-C002 PRF ml YVR ln ml ml-1-Final Proof.indd 40 6/10/13 10:34 AM
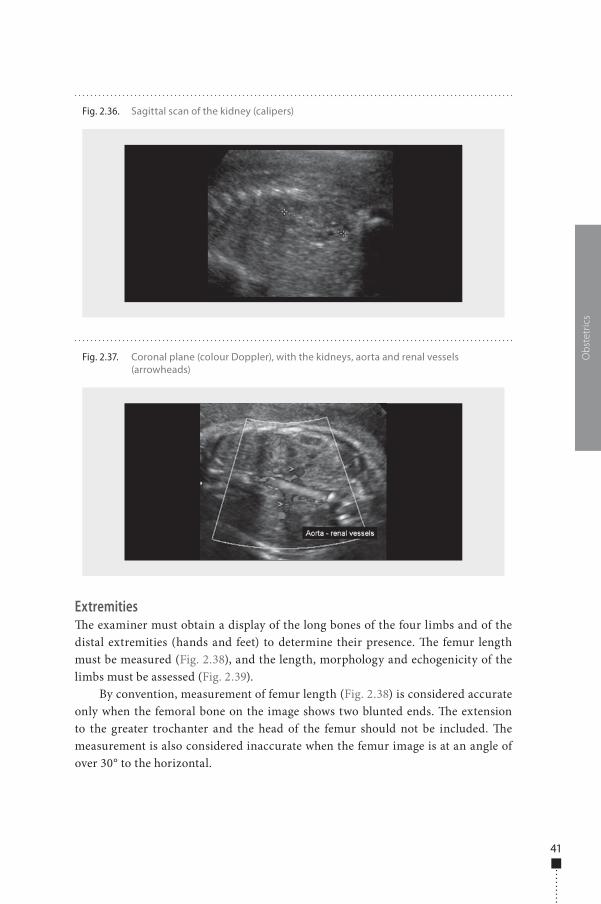
41
Extremities�e examiner must obtain a display of the long bones of the four limbs and of the distal extremities (hands and feet) to determine their presence. �e femur length must be measured (Fig. 2.38), and the length, morphology and echogenicity of the limbs must be assessed (Fig. 2.39).
By convention, measurement of femur length (Fig. 2.38) is considered accurate only when the femoral bone on the image shows two blunted ends. �e extension to the greater trochanter and the head of the femur should not be included. �e measurement is also considered inaccurate when the femur image is at an angle of over 30° to the horizontal.
Obs
tetr
ics
Fig. 2.36. Sagittal scan of the kidney (calipers)
Fig. 2.37. Coronal plane (colour Doppler), with the kidneys, aorta and renal vessels (arrowheads)
978-9241548540-C002 PRF ml YVR ln ml ml-1-Final Proof.indd 41 6/10/13 10:34 AM
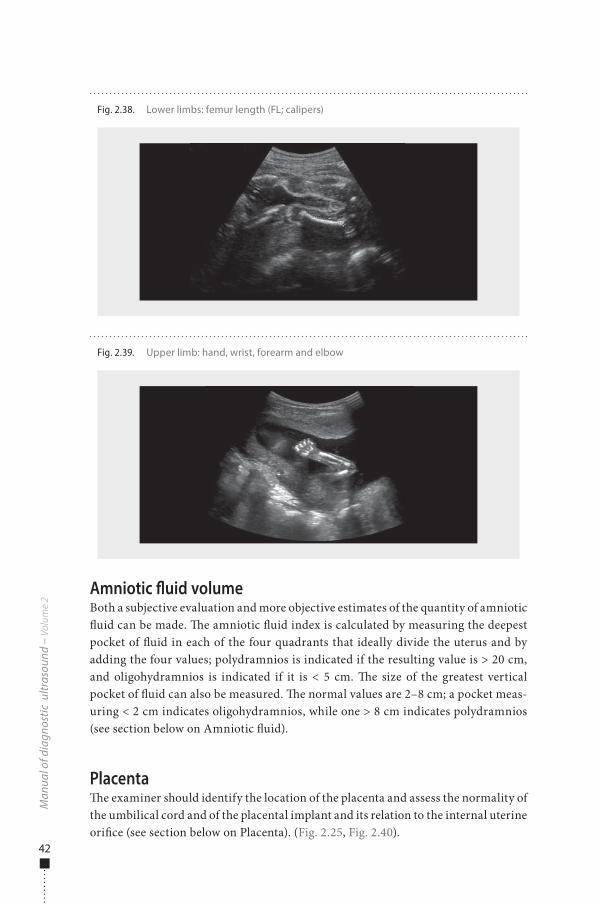
42
Amniotic �uid volumeBoth a subjective evaluation and more objective estimates of the quantity of amniotic �uid can be made. �e amniotic �uid index is calculated by measuring the deepest pocket of �uid in each of the four quadrants that ideally divide the uterus and by adding the four values; polydramnios is indicated if the resulting value is > 20 cm, and oligohydramnios is indicated if it is < 5 cm. �e size of the greatest vertical pocket of �uid can also be measured. �e normal values are 2–8 cm; a pocket meas-uring < 2 cm indicates oligohydramnios, while one > 8 cm indicates polydramnios (see section below on Amniotic �uid).
Placenta�e examiner should identify the location of the placenta and assess the normality of the umbilical cord and of the placental implant and its relation to the internal uterine ori�ce (see section below on Placenta). (Fig. 2.25, Fig. 2.40).
Man
ual o
f dia
gnos
tic u
ltras
ound
– V
olum
e 2
Fig. 2.39. Upper limb: hand, wrist, forearm and elbow
Fig. 2.38. Lower limbs: femur length (FL; calipers)
978-9241548540-C002 PRF ml YVR ln ml ml-1-Final Proof.indd 42 6/10/13 10:34 AM
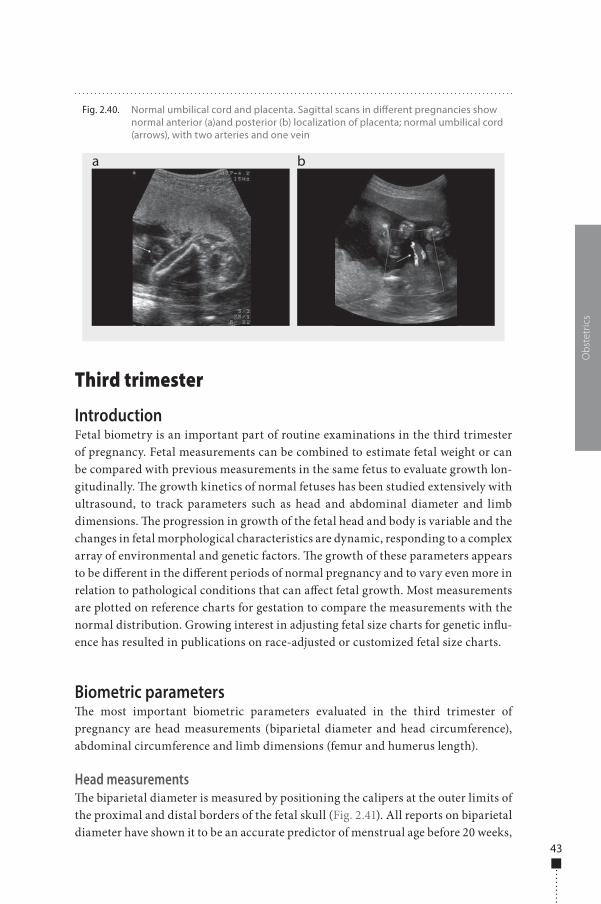
43
Third trimester
IntroductionFetal biometry is an important part of routine examinations in the third trimester of pregnancy. Fetal measurements can be combined to estimate fetal weight or can be compared with previous measurements in the same fetus to evaluate growth lon-gitudinally. �e growth kinetics of normal fetuses has been studied extensively with ultrasound, to track parameters such as head and abdominal diameter and limb dimensions. �e progression in growth of the fetal head and body is variable and the changes in fetal morphological characteristics are dynamic, responding to a complex array of environmental and genetic factors. �e growth of these parameters appears to be di�erent in the di�erent periods of normal pregnancy and to vary even more in relation to pathological conditions that can a�ect fetal growth. Most measurements are plotted on reference charts for gestation to compare the measurements with the normal distribution. Growing interest in adjusting fetal size charts for genetic in�u-ence has resulted in publications on race-adjusted or customized fetal size charts.
Biometric parameters�e most important biometric parameters evaluated in the third trimester of pregnancy are head measurements (biparietal diameter and head circumference), abdominal circumference and limb dimensions (femur and humerus length).
Head measurements�e biparietal diameter is measured by positioning the calipers at the outer limits of the proximal and distal borders of the fetal skull (Fig. 2.41). All reports on biparietal diameter have shown it to be an accurate predictor of menstrual age before 20 weeks,
Obs
tetr
ics
Fig. 2.40. Normal umbilical cord and placenta. Sagittal scans in di�erent pregnancies show normal anterior (a)and posterior (b) localization of placenta; normal umbilical cord (arrows), with two arteries and one vein
a b
978-9241548540-C002 PRF ml YVR ln ml ml-1-Final Proof.indd 43 6/10/13 10:34 AM
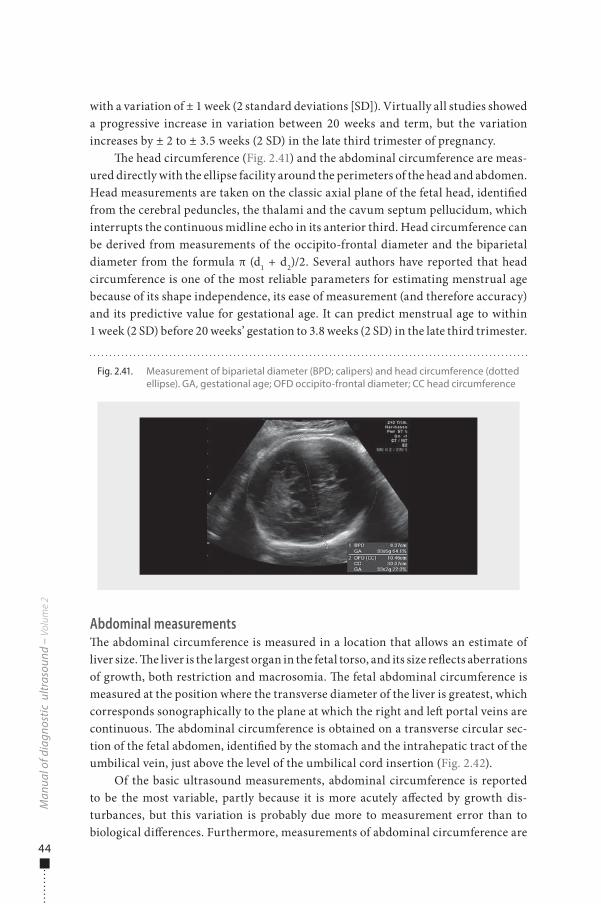
44
with a variation of ± 1 week (2 standard deviations [SD]). Virtually all studies showed a progressive increase in variation between 20 weeks and term, but the variation increases by ± 2 to ± 3.5 weeks (2 SD) in the late third trimester of pregnancy.
�e head circumference (Fig. 2.41) and the abdominal circumference are meas-ured directly with the ellipse facility around the perimeters of the head and abdomen. Head measurements are taken on the classic axial plane of the fetal head, identi�ed from the cerebral peduncles, the thalami and the cavum septum pellucidum, which interrupts the continuous midline echo in its anterior third. Head circumference can be derived from measurements of the occipito-frontal diameter and the biparietal diameter from the formula π (d1 + d2)/2. Several authors have reported that head circumference is one of the most reliable parameters for estimating menstrual age because of its shape independence, its ease of measurement (and therefore accuracy) and its predictive value for gestational age. It can predict menstrual age to within 1 week (2 SD) before 20 weeks’ gestation to 3.8 weeks (2 SD) in the late third trimester.
Abdominal measurements�e abdominal circumference is measured in a location that allows an estimate of liver size. �e liver is the largest organ in the fetal torso, and its size re�ects aberrations of growth, both restriction and macrosomia. �e fetal abdominal circumference is measured at the position where the transverse diameter of the liver is greatest, which corresponds sonographically to the plane at which the right and le� portal veins are continuous. �e abdominal circumference is obtained on a transverse circular sec-tion of the fetal abdomen, identi�ed by the stomach and the intrahepatic tract of the umbilical vein, just above the level of the umbilical cord insertion (Fig. 2.42).
Of the basic ultrasound measurements, abdominal circumference is reported to be the most variable, partly because it is more acutely a�ected by growth dis-turbances, but this variation is probably due more to measurement error than to biological di�erences. Furthermore, measurements of abdominal circumference are
Man
ual o
f dia
gnos
tic u
ltras
ound
– V
olum
e 2
Fig. 2.41. Measurement of biparietal diameter (BPD; calipers) and head circumference (dotted ellipse). GA, gestational age; OFD occipito-frontal diameter; CC head circumference
978-9241548540-C002 PRF ml YVR ln ml ml-1-Final Proof.indd 44 6/10/13 10:34 AM
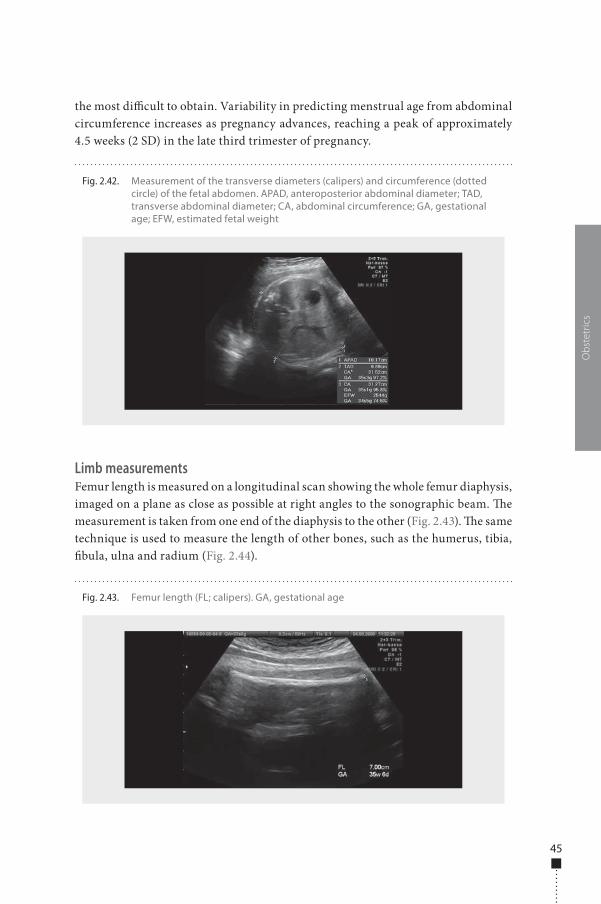
45
the most di�cult to obtain. Variability in predicting menstrual age from abdominal circumference increases as pregnancy advances, reaching a peak of approximately 4.5 weeks (2 SD) in the late third trimester of pregnancy.
Limb measurementsFemur length is measured on a longitudinal scan showing the whole femur diaphysis, imaged on a plane as close as possible at right angles to the sonographic beam. �e measurement is taken from one end of the diaphysis to the other (Fig. 2.43). �e same technique is used to measure the length of other bones, such as the humerus, tibia, �bula, ulna and radium (Fig. 2.44).
Obs
tetr
ics
Fig. 2.42. Measurement of the transverse diameters (calipers) and circumference (dotted circle) of the fetal abdomen. APAD, anteroposterior abdominal diameter; TAD, transverse abdominal diameter; CA, abdominal circumference; GA, gestational age; EFW, estimated fetal weight
Fig. 2.43. Femur length (FL; calipers). GA, gestational age
978-9241548540-C002 PRF ml YVR ln ml ml-1-Final Proof.indd 45 6/10/13 10:34 AM
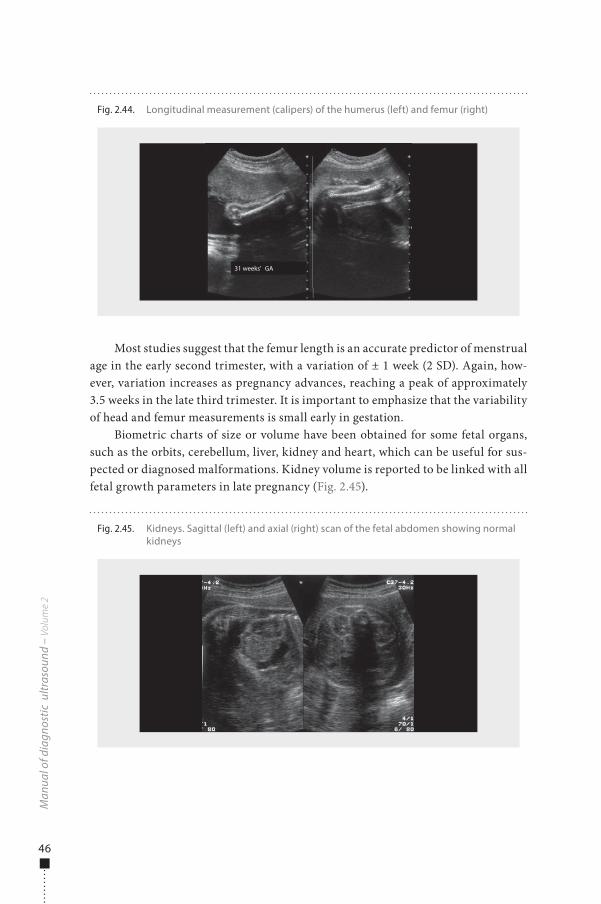
46
Most studies suggest that the femur length is an accurate predictor of menstrual age in the early second trimester, with a variation of ± 1 week (2 SD). Again, how-ever, variation increases as pregnancy advances, reaching a peak of approximately 3.5 weeks in the late third trimester. It is important to emphasize that the variability of head and femur measurements is small early in gestation.
Biometric charts of size or volume have been obtained for some fetal organs, such as the orbits, cerebellum, liver, kidney and heart, which can be useful for sus-pected or diagnosed malformations. Kidney volume is reported to be linked with all fetal growth parameters in late pregnancy (Fig. 2.45).
Man
ual o
f dia
gnos
tic u
ltras
ound
– V
olum
e 2
Fig. 2.45. Kidneys. Sagittal (left) and axial (right) scan of the fetal abdomen showing normal kidneys
Fig. 2.44. Longitudinal measurement (calipers) of the humerus (left) and femur (right)
31 weeks’ GA
978-9241548540-C002 PRF ml YVR ln ml ml-1-Final Proof.indd 46 6/10/13 10:34 AM
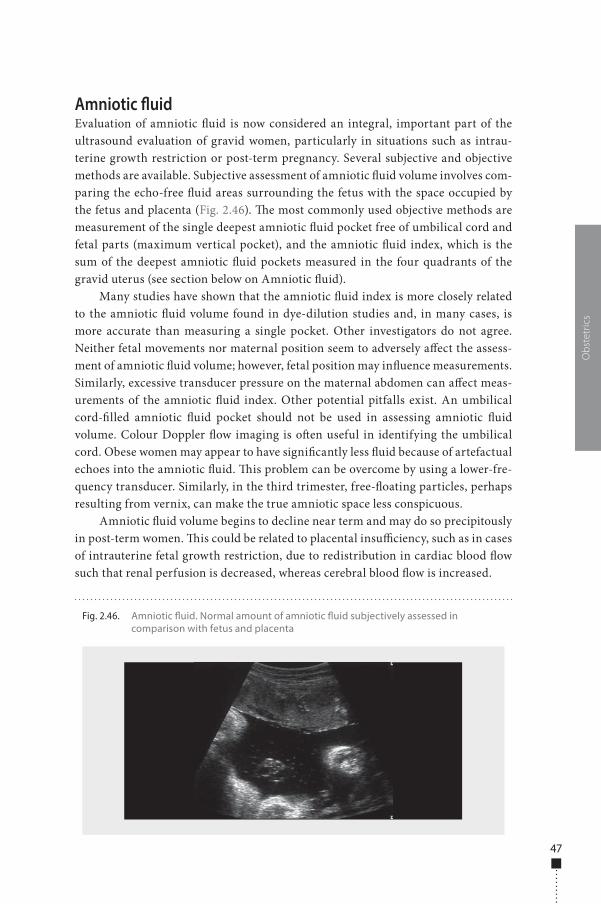
47
Amniotic �uidEvaluation of amniotic �uid is now considered an integral, important part of the ultrasound evaluation of gravid women, particularly in situations such as intrau-terine growth restriction or post-term pregnancy. Several subjective and objective methods are available. Subjective assessment of amniotic �uid volume involves com-paring the echo-free �uid areas surrounding the fetus with the space occupied by the fetus and placenta (Fig. 2.46). �e most commonly used objective methods are measurement of the single deepest amniotic �uid pocket free of umbilical cord and fetal parts (maximum vertical pocket), and the amniotic �uid index, which is the sum of the deepest amniotic �uid pockets measured in the four quadrants of the gravid uterus (see section below on Amniotic �uid).
Many studies have shown that the amniotic �uid index is more closely related to the amniotic �uid volume found in dye-dilution studies and, in many cases, is more accurate than measuring a single pocket. Other investigators do not agree. Neither fetal movements nor maternal position seem to adversely a�ect the assess-ment of amniotic �uid volume; however, fetal position may in�uence measurements. Similarly, excessive transducer pressure on the maternal abdomen can a�ect meas-urements of the amniotic �uid index. Other potential pitfalls exist. An umbilical cord-�lled amniotic �uid pocket should not be used in assessing amniotic �uid volume. Colour Doppler �ow imaging is o�en useful in identifying the umbilical cord. Obese women may appear to have signi�cantly less �uid because of artefactual echoes into the amniotic �uid. �is problem can be overcome by using a lower-fre-quency transducer. Similarly, in the third trimester, free-�oating particles, perhaps resulting from vernix, can make the true amniotic space less conspicuous.
Amniotic �uid volume begins to decline near term and may do so precipitously in post-term women. �is could be related to placental insu�ciency, such as in cases of intrauterine fetal growth restriction, due to redistribution in cardiac blood �ow such that renal perfusion is decreased, whereas cerebral blood �ow is increased.
Obs
tetr
ics
Fig. 2.46. Amniotic �uid. Normal amount of amniotic �uid subjectively assessed in comparison with fetus and placenta
978-9241548540-C002 PRF ml YVR ln ml ml-1-Final Proof.indd 47 6/10/13 10:34 AM
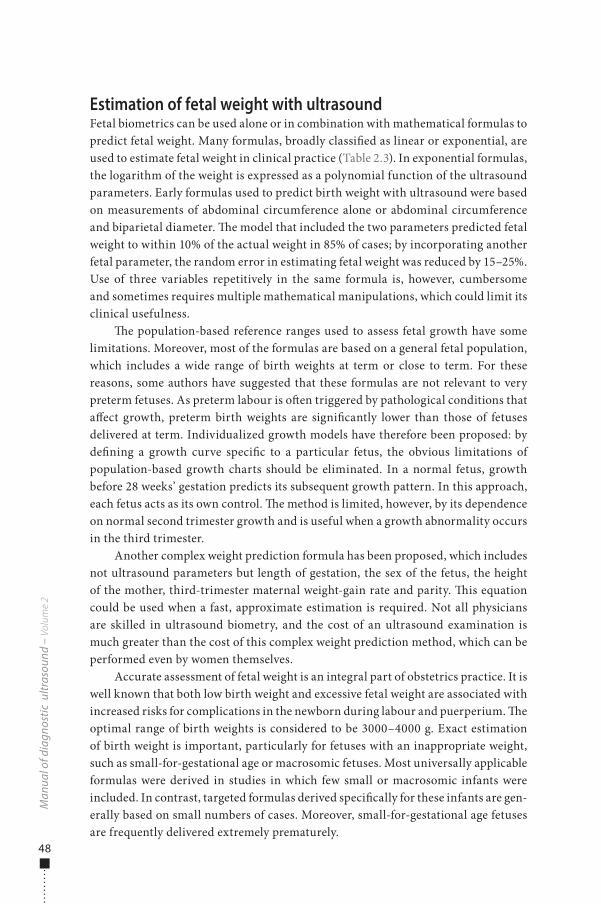
48
Estimation of fetal weight with ultrasoundFetal biometrics can be used alone or in combination with mathematical formulas to predict fetal weight. Many formulas, broadly classi�ed as linear or exponential, are used to estimate fetal weight in clinical practice (Table 2.3). In exponential formulas, the logarithm of the weight is expressed as a polynomial function of the ultrasound parameters. Early formulas used to predict birth weight with ultrasound were based on measurements of abdominal circumference alone or abdominal circumference and biparietal diameter. �e model that included the two parameters predicted fetal weight to within 10% of the actual weight in 85% of cases; by incorporating another fetal parameter, the random error in estimating fetal weight was reduced by 15–25%. Use of three variables repetitively in the same formula is, however, cumbersome and sometimes requires multiple mathematical manipulations, which could limit its clinical usefulness.
�e population-based reference ranges used to assess fetal growth have some limitations. Moreover, most of the formulas are based on a general fetal population, which includes a wide range of birth weights at term or close to term. For these reasons, some authors have suggested that these formulas are not relevant to very preterm fetuses. As preterm labour is o�en triggered by pathological conditions that a�ect growth, preterm birth weights are signi�cantly lower than those of fetuses delivered at term. Individualized growth models have therefore been proposed: by de�ning a growth curve speci�c to a particular fetus, the obvious limitations of population-based growth charts should be eliminated. In a normal fetus, growth before 28 weeks’ gestation predicts its subsequent growth pattern. In this approach, each fetus acts as its own control. �e method is limited, however, by its dependence on normal second trimester growth and is useful when a growth abnormality occurs in the third trimester.
Another complex weight prediction formula has been proposed, which includes not ultrasound parameters but length of gestation, the sex of the fetus, the height of the mother, third-trimester maternal weight-gain rate and parity. �is equation could be used when a fast, approximate estimation is required. Not all physicians are skilled in ultrasound biometry, and the cost of an ultrasound examination is much greater than the cost of this complex weight prediction method, which can be performed even by women themselves.
Accurate assessment of fetal weight is an integral part of obstetrics practice. It is well known that both low birth weight and excessive fetal weight are associated with increased risks for complications in the newborn during labour and puerperium. �e optimal range of birth weights is considered to be 3000–4000 g. Exact estimation of birth weight is important, particularly for fetuses with an inappropriate weight, such as small-for-gestational age or macrosomic fetuses. Most universally applicable formulas were derived in studies in which few small or macrosomic infants were included. In contrast, targeted formulas derived speci�cally for these infants are gen-erally based on small numbers of cases. Moreover, small-for-gestational age fetuses are frequently delivered extremely prematurely.
Man
ual o
f dia
gnos
tic u
ltras
ound
– V
olum
e 2
978-9241548540-C002 PRF ml YVR ln ml ml-1-Final Proof.indd 48 6/10/13 10:34 AM
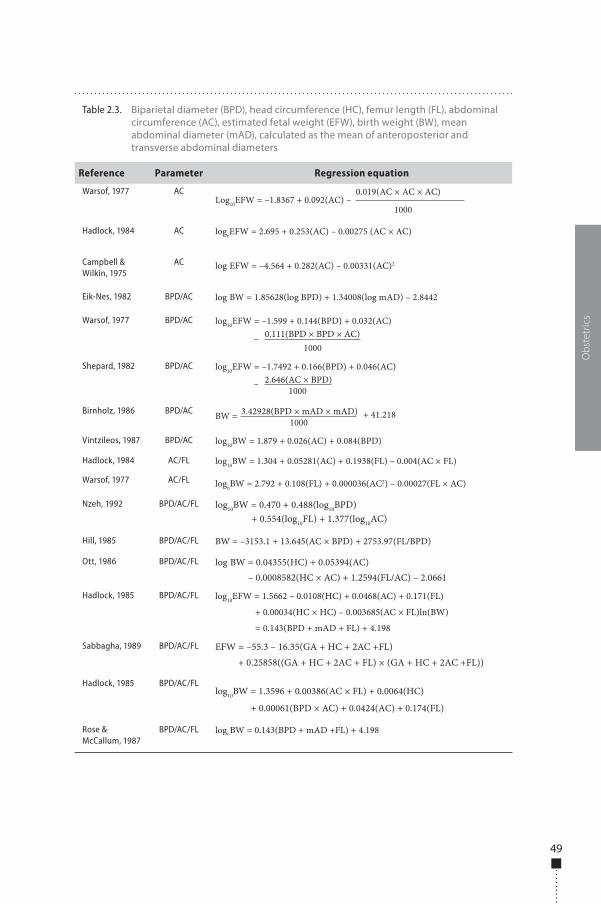
49
Obs
tetr
ics
Table 2.3. Biparietal diameter (BPD), head circumference (HC), femur length (FL), abdominal circumference (AC), estimated fetal weight (EFW), birth weight (BW), mean abdominal diameter (mAD), calculated as the mean of anteroposterior and transverse abdominal diameters
Reference Parameter Regression equation
Warsof, 1977 AC
1000Log10EFW = –1.8367 + 0.092(AC) –
0.019(AC × AC × AC)
Hadlock, 1984 AC logeEFW = 2.695 + 0.253(AC) – 0.00275 (AC × AC)
Campbell & Wilkin, 1975
AC log EFW = –4.564 + 0.282(AC) – 0.00331(AC)2
Eik-Nes, 1982 BPD/AC log BW = 1.85628(log BPD) + 1.34008(log mAD) – 2.8442
Warsof, 1977 BPD/AC
1000
log10EFW = –1.599 + 0.144(BPD) + 0.032(AC)0.111(BPD × BPD × AC)–
Shepard, 1982 BPD/AC
1000
log10EFW = –1.7492 + 0.166(BPD) + 0.046(AC)2.646(AC × BPD)–
Birnholz, 1986 BPD/AC1000
BW = 3.42928(BPD × mAD × mAD) + 41.218
Vintzileos, 1987 BPD/AC log10BW = 1.879 + 0.026(AC) + 0.084(BPD)
Hadlock, 1984 AC/FL log10BW = 1.304 + 0.05281(AC) + 0.1938(FL) – 0.004(AC × FL)
Warsof, 1977 AC/FL lognBW = 2.792 + 0.108(FL) + 0.000036(AC2) – 0.00027(FL × AC)
Nzeh, 1992 BPD/AC/FL log10BW = 0.470 + 0.488(log10BPD)+ 0.554(log10FL) + 1.377(log10AC)
Hill, 1985 BPD/AC/FL BW = –3153.1 + 13.645(AC × BPD) + 2753.97(FL/BPD)
Ott, 1986 BPD/AC/FL log BW = 0.04355(HC) + 0.05394(AC)– 0.0008582(HC × AC) + 1.2594(FL/AC) – 2.0661
Hadlock, 1985 BPD/AC/FL log10EFW = 1.5662 – 0.0108(HC) + 0.0468(AC) + 0.171(FL)
+ 0.00034(HC × HC) – 0.003685(AC × FL)ln(BW)
= 0.143(BPD + mAD + FL) + 4.198
Sabbagha, 1989 BPD/AC/FL EFW = –55.3 – 16.35(GA + HC + 2AC +FL)+ 0.25858((GA + HC + 2AC + FL) × (GA + HC + 2AC +FL))
Hadlock, 1985 BPD/AC/FLlog10BW = 1.3596 + 0.00386(AC × FL) + 0.0064(HC)
+ 0.00061(BPD × AC) + 0.0424(AC) + 0.174(FL)
Rose & McCallum, 1987
BPD/AC/FL lognBW = 0.143(BPD + mAD +FL) + 4.198
978-9241548540-C002 PRF ml YVR ln ml ml-1-Final Proof.indd 49 6/10/13 10:34 AM
50
Fetal macrosomiaMacrosomic fetuses, de�ned as fetuses with a birth weight over 4000 g, represent about 10% of all newborns, but the percentage has been increasing over the past few decades in western countries because of nutrient supplements and better nutri-tion. During the past 2–3 decades, an overall 15–25% increase in the proportion of women giving birth to large infants has been found in various populations around the world, with a few exceptions, such as the United States. Fetal macrosomia is frequently associated with neonatal morbidity and traumatic birth, and the compli-cations associated with this condition include increased maternal and fetal trauma, shoulder dystocia with resulting Erb palsy, perinatal asphyxia, meconium aspira-tion, increased frequency of labour disorders, postpartum atonia and haemorrhage, lacerations of the birth canal and haematomas.
Weight prediction by ultrasound gives adequate results for the general fetal population, but the results are less satisfactory for the macrosomic population. Nevertheless, sonographically estimated fetal weight, obtained with models that include abdominal circumference and femur length, remains a useful method for evaluating women at risk for macrosomia.
Many methods for ultrasound determination of fetal weight have been reported; in most, the predictive accuracy declines as the fetal weight approaches 4000 g. A major problem in the estimation of macrosomic fetal weight with ultrasound is the high degree of inherent error. Moreover, most formulas for estimating fetal weight are derived from cross-sectional data on unselected patient populations, a minority of whom probably have diabetes. �e proposed ultrasound methods do not appear to di�er substantially in terms of accuracy in predicting macrosomia. �e mean abso-lute percentage error in predicting fetal birth weight was about 7%, but the sensitivity of ultrasound in detecting macrosomia was only 65%.
As clinical and ultrasound methods have similar limited power to predict fetal weight greater than 4000 g, the American College of Obstetricians and Gynecologists cited a third method, namely the mothers’ own estimate of fetal size. �e probability that this method could predict macrosomia is similar to that of clinical and ultrasound methods.
Because fat is less dense that lean mass and because of the disproportionate increase in the fetal fat component of infants of women with diabetes, the weight of their fetuses, especially those with excessive birth weight, may be systematically overestimated by ultrasound with these formulas. �e results of studies addressing this issue are, however, inconsistent. Because of the increased contribution of fat mass to the fetal weight of infants of women with diabetes, formulas based exclusively on so� tissue measurements might be more accurate than those with measures of both fat and lean tissue. Although a good correlation has been found between ultrasound measures of fetal body composition and those taken at birth, the usefulness of the approach of measuring fetal fat for detecting macrosomic newborns was not con-�rmed, and its clinical use in comparison with other predictors remains to be de�ned.
Man
ual o
f dia
gnos
tic u
ltras
ound
– V
olum
e 2
978-9241548540-C002 PRF ml YVR ln ml ml-1-Final Proof.indd 50 6/10/13 10:34 AM
51
Fetal body con�guration may be more important than an arbitrarily de�ned birth weight threshold. Macrosomic fetuses are in fact characterized by larger trunk and chest circumference and an increased bisacromial diameter as fetal weight increases. Macrosomic infants of diabetic mothers are also characterized by larger shoulder and extremity circumferences, a decreased head-to-shoulder ratio, signi�cantly higher percentages of body fat and thicker upper extremity skin folds than controls of simi-lar birth weight and length. Use of other, nonstandard ultrasound measurements, such as humeral so� tissue thickness, ratio of subcutaneous tissue to femur length and cheek-to-cheek diameter, to estimate fetal weight does not, however, signi�cantly improve the predictive value of obstetric ultrasound for birth weight.
In normal pregnancies, fetal abdominal subcutaneous tissue thickness at term is positively associated with birth weight. With increasing thickness, the likelihood of operative vaginal and Caesarean delivery increases; however, this measure is not associated with perinatal outcome.
Advancements in ultrasound technology have not changed this situation. �e introduction of three-dimensional ultrasound led some authors to propose new for-mulas that incorporate volumetric data on fetal limbs. Application of these techniques was generally limited by the excessive time required for measuring volume and by the need for a three-dimensional machine with speci�c so�ware. Similarly, the clinical usefulness of MRI to estimate fetal weight requires further documentation.
Clinical indications for ultrasound examination: placenta praevia and accreta
In late pregnancy, diagnostic ultrasound is used selectively for speci�c clinical indi-cations, and the value of routine ultrasound screening during late pregnancy in unse-lected populations is controversial. �e Cochrane Database used existing evidence to conclude that routine ultrasound in late pregnancy in low-risk or unselected popula-tions provided no bene�t for the mother or the infant. Information is lacking about the potential psychological e�ects of routine ultrasound in late pregnancy and the e�ects on both short- and long-term neonatal and childhood outcomes. Ultrasound examination could be useful in certain situations, such as a suspected anomalous placental location (placenta praevia) or adherence (placenta accreta–percreta).
Placenta praeviaWhile clinical judgement remains crucial in suspecting and managing placenta praevia, a de�nitive diagnosis of most low-lying placentas is now achieved with ultrasound imaging. Clinical suspicion should, however, be raised in any case of vaginal bleeding. Transvaginal ultrasound, if available, can be used to investigate placental location at any time in preg-nancy and in particular in the third trimester, if the placenta is thought to be low-lying. �e transvaginal approach is signi�cantly more accurate than transabdominal ultrasound
Obs
tetr
ics
978-9241548540-C002 PRF ml YVR ln ml ml-1-Final Proof.indd 51 6/10/13 10:34 AM
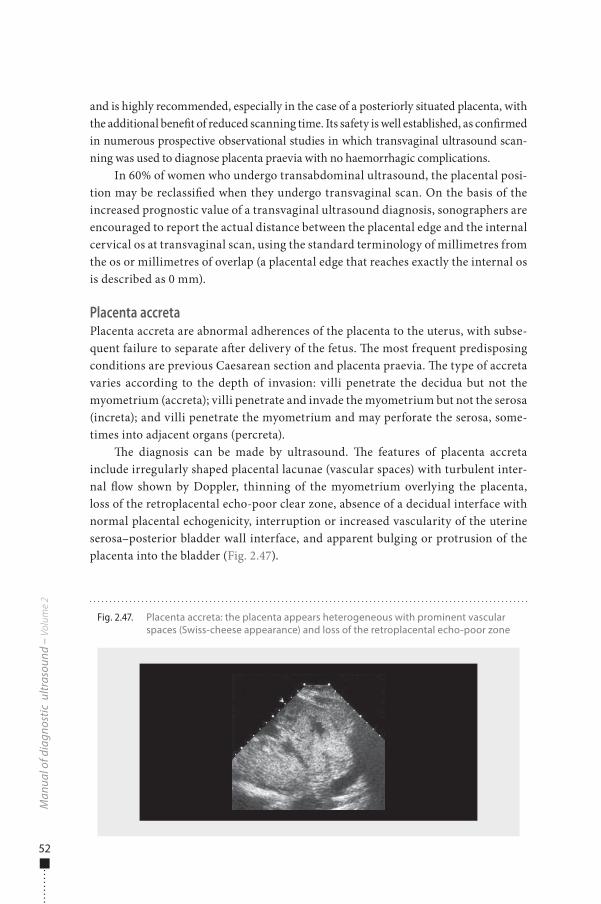
52
and is highly recommended, especially in the case of a posteriorly situated placenta, with the additional bene�t of reduced scanning time. Its safety is well established, as con�rmed in numerous prospective observational studies in which transvaginal ultrasound scan-ning was used to diagnose placenta praevia with no haemorrhagic complications.
In 60% of women who undergo transabdominal ultrasound, the placental posi-tion may be reclassi�ed when they undergo transvaginal scan. On the basis of the increased prognostic value of a transvaginal ultrasound diagnosis, sonographers are encouraged to report the actual distance between the placental edge and the internal cervical os at transvaginal scan, using the standard terminology of millimetres from the os or millimetres of overlap (a placental edge that reaches exactly the internal os is described as 0 mm).
Placenta accretaPlacenta accreta are abnormal adherences of the placenta to the uterus, with subse-quent failure to separate a�er delivery of the fetus. �e most frequent predisposing conditions are previous Caesarean section and placenta praevia. �e type of accreta varies according to the depth of invasion: villi penetrate the decidua but not the myometrium (accreta); villi penetrate and invade the myometrium but not the serosa (increta); and villi penetrate the myometrium and may perforate the serosa, some-times into adjacent organs (percreta).
�e diagnosis can be made by ultrasound. �e features of placenta accreta include irregularly shaped placental lacunae (vascular spaces) with turbulent inter-nal �ow shown by Doppler, thinning of the myometrium overlying the placenta, loss of the retroplacental echo-poor clear zone, absence of a decidual interface with normal placental echogenicity, interruption or increased vascularity of the uterine serosa–posterior bladder wall interface, and apparent bulging or protrusion of the placenta into the bladder (Fig. 2.47).
Man
ual o
f dia
gnos
tic u
ltras
ound
– V
olum
e 2
Fig. 2.47. Placenta accreta: the placenta appears heterogeneous with prominent vascular spaces (Swiss-cheese appearance) and loss of the retroplacental echo-poor zone
978-9241548540-C002 PRF ml YVR ln ml ml-1-Final Proof.indd 52 6/10/13 10:34 AM
53
In addition to grey-scale ultrasound �ndings, targeted Doppler assessment should be performed. Sometimes, MRI may be considered in this evaluation, as it can provide additional diagnostic information in equivocal cases or when the placenta is in a posterior location.
Fetal growth restriction
Fetal growth depends on genetic, placental and maternal factors. Each fetus has an inherent growth potential which, under normal circumstances, yields a healthy newborn of appropriate size. �e maternal–placental–fetal unit acts in harmony to provide the needs of the fetus while supporting the physiological changes of the mother. In normal pregnancy, the fetus and the placenta grow at di�erent rates. �e placenta expands early and develops into a large tertiary villus structure, with maximum surface area and thus functional activity for exchange peaking at about 37 weeks’ gestation; at this time, it weighs about 500 g. From then until delivery, its surface area decreases slightly as microinfarctions occur. �e placenta partially regulates fetal growth. �e fetus grows throughout pregnancy, but the rate of weight increase per week begins to slow from the 36th week of gestation.
�e fetus requires three kinds of substrate for its growth. Glucose freely crosses the placental barrier by facilitated di�usion, while maternal amino acids are actively transported to the fetus, so that their concentration is higher in fetal blood that in the maternal circulation. Oxygen passes to the fetal circulation by simple di�usion. Glucose is burnt with oxygen to produce energy and to convert amino acids into struc-tural proteins: the result is a normally growing fetus. Regulation of the fetal growth rate depends not only on the availability of substrates from placental transfer but also on the activity of fetal hormones, such as insulin and insulin-like growth factors.
Causes of intrauterine growth restriction�e causes of intrauterine growth restriction (Table 2.4) can be grouped into three categories on the basis of substrate availability and consumption:
■ Maternal substrate availability: Maternal nutrition before and during preg-nancy is crucial for normal fetal development. Abnormalities may occur if the mother has chronic disorders that reduce substrate availability, e.g. chronic lung disease for oxygen supply or malabsorption syndromes.
■ Placenta group: Women may have poor uterine blood �ow or a small placen-tal surface-active area. Even cigarette smoking can a�ect this area, because it both causes endothelial damage and releases vasospastic modulators that reduce uterine and placental blood �ow. �e commonest clinical symptom of constricted uterine vessels is maternal hypertension, and this is also the com-monest maternal factor associated with intrauterine growth restriction.
Obs
tetr
ics
978-9241548540-C002 PRF ml YVR ln ml ml-1-Final Proof.indd 53 6/10/13 10:34 AM
54
■ Fetal group: In some fetuses, substrate consumption is impaired due to a genetic disorder, major congenital anomalies, metabolic disorders or accelerated metabolism and impaired growth caused by congenital intrauterine infection.
Diagnosis and de�nitionIntrauterine growth restriction refers to conditions in which a fetus is unable to achieve its inherent growth potential. �is functional de�nition applies to fetuses at risk for various poor outcomes. It intentionally excludes fetuses who are small for gestational age, i.e. at or below the 10th percentile for weight of normal fetuses of the same gestational age, but not pathologically small. A certain number of fetuses at or below the 10th percentile may be constitutionally small. In these cases, maternal or paternal features, the neonate’s ability to maintain its own growth rate even if at a low centile, and the absence of other signs of uteroplacental insu�ciency (e.g. oligohydramnios, abnormal Doppler �ndings) can be reassuring. Some fetuses who are pathologically growth-restricted may nevertheless be over the 10th percentile of estimated fetal weight. An estimated fetal weight at or below the 10th percentile is therefore used only to identify fetuses at risk.
�e incidence of intrauterine growth restriction in the general obstetric population is estimated to be approximately 5%. Identi�cation of this condition is crucial because proper evaluation and management can result in a favourable outcome. Certain pregnan-cies are at high risk for growth restriction, although a substantial percentage of cases occur in the general obstetric population. Accurate dating early in pregnancy is essential for a diagnosis; ultrasound biometry on serial longitudinal evaluation is the gold stand-ard for determining fetal size and the amount of amniotic �uid, while Doppler assessment of fetal circulation may be of value in determining fetal status and assessing well-being.
In 1977, Campbell and �oms introduced the concept of symmetric versus asym-metric growth-restriction. Symmetric growth restriction results in a fetus whose entire body is proportionally small, o�en due to a condition occurring in the �rst trimester, such
Man
ual o
f dia
gnos
tic u
ltras
ound
– V
olum
e 2
Table 2.4. Causes of intrauterine growth restriction
Maternal causes Fetal causes
Disease
Poor nutritional status Genetic disorders
Cardiovascular disease Malformations
Diabetes Infections
Placental insufficiency
Idiopathic
Metabolic disorders
Pre-eclampsia and other hypertensive disorders of pregnancy
Abnormal placentation
Substance abuse (smoking, alcohol, drugs)
Multiple pregnancy
Cord anomalies
Autoimmune diseases
978-9241548540-C002 PRF ml YVR ln ml ml-1-Final Proof.indd 54 6/10/13 10:34 AM
55
as a congenital anomaly, a genetic disorder or congenital infection. Asymmetric growth restriction results in a fetus who is undernourished and is directing most of its energy to maintaining the growth of vital organs, such as the brain and heart, at the expense of other structures, such as muscle, fat and the abdomen, especially its storage organ, the liver. �is type of growth restriction is usually the result of placental insu�ciency.
�is di�erentiation has been questioned, because intrauterine growth restric-tion due to placental causes that have been present for a long time may present as sym-metric growth impairment, as even brain development may be adversely a�ected. In growth-restricted hypoxic fetuses, redistribution of well-oxygenated blood to vital organs, such as the brain, heart and adrenal glands, is a compensatory mechanism to prevent fetal damage. When the reserve capacity of circulatory redistribution reaches its limit, fetal deterioration may occur rapidly. �e most widely used de�ni-tion of intrauterine growth restriction is now a fetus whose estimated weight is below the 10th percentile for gestational age and whose abdominal circumference is below the second percentile.
Accurate dating in early pregnancy is essential in diagnosing intrauterine growth restriction. �e most reliable dating method is an ultrasound examination performed during the �rst trimester and no later than 20 weeks’ gestation. Pregnancy can be re-dated by ultrasound scanning if the di�erence between menstrual age and ultrasound parameters is 7 days or more in the �rst trimester or 2 weeks or more in the second trimester. Re-dating during the second trimester should be avoided if an ultrasound scan from the �rst trimester is available. A woman’s due date should never be changed on the basis of a third-trimester sonogram.
Ultrasound biometryUltrasound biometry of the fetus from measurements of the biparietal diameter, head circumference, abdominal circumference and femur length is now the gold standard for assessing fetal growth (Fig. 2.48). �e percentiles have been established for each of these parameters, and fetal weight can be calculated.
In the presence of normal head and femur measurements, an abdominal cir-cumference measurement less than 2 SD below the mean is considered a reasonable cut-o� for considering a fetus to be asymmetric. �e most sensitive indicator of sym-metric and asymmetric intrauterine growth restriction is the abdominal circum-ference, which has a sensitivity of over 98% if the measurement is below the 2.5th percentile and has the lowest positive predictive value (36.3%). It may also be useful to calculate the ratio of the head circumference to the abdominal circumference. Between 20 and 36 weeks of gestation, this ratio normally drops almost linearly from 1.2 to 1.0. It is normal in a fetus with symmetric growth restriction and increased in asymmetric growth restriction.
Evidence of a hostile intrauterine environment can be obtained by looking spe-ci�cally at the amniotic �uid volume. A decreased volume is strongly associated with intrauterine growth restriction. Signi�cant morbidity has been found in pregnancies
Obs
tetr
ics
978-9241548540-C002 PRF ml YVR ln ml ml-1-Final Proof.indd 55 6/10/13 10:34 AM
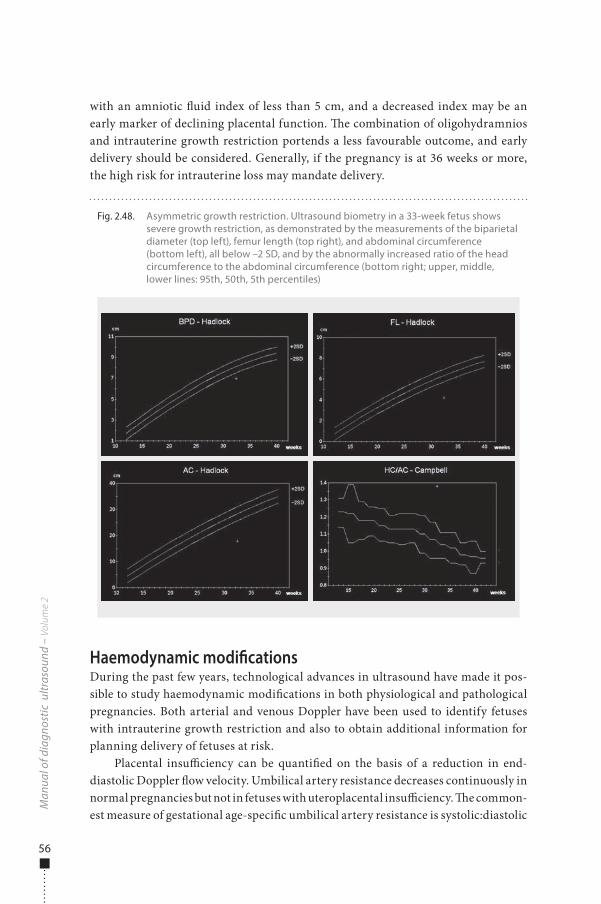
56
with an amniotic �uid index of less than 5 cm, and a decreased index may be an early marker of declining placental function. �e combination of oligohydramnios and intrauterine growth restriction portends a less favourable outcome, and early delivery should be considered. Generally, if the pregnancy is at 36 weeks or more, the high risk for intrauterine loss may mandate delivery.
Haemodynamic modi�cationsDuring the past few years, technological advances in ultrasound have made it pos-sible to study haemodynamic modi�cations in both physiological and pathological pregnancies. Both arterial and venous Doppler have been used to identify fetuses with intrauterine growth restriction and also to obtain additional information for planning delivery of fetuses at risk.
Placental insu�ciency can be quanti�ed on the basis of a reduction in end-diastolic Doppler �ow velocity. Umbilical artery resistance decreases continuously in normal pregnancies but not in fetuses with uteroplacental insu�ciency. �e common-est measure of gestational age-speci�c umbilical artery resistance is systolic:diastolic
Man
ual o
f dia
gnos
tic u
ltras
ound
– V
olum
e 2
Fig. 2.48. Asymmetric growth restriction. Ultrasound biometry in a 33-week fetus shows severe growth restriction, as demonstrated by the measurements of the biparietal diameter (top left), femur length (top right), and abdominal circumference (bottom left), all below –2 SD, and by the abnormally increased ratio of the head circumference to the abdominal circumference (bottom right; upper, middle, lower lines: 95th, 50th, 5th percentiles)
978-9241548540-C002 PRF ml YVR ln ml ml-1-Final Proof.indd 56 6/10/13 10:34 AM
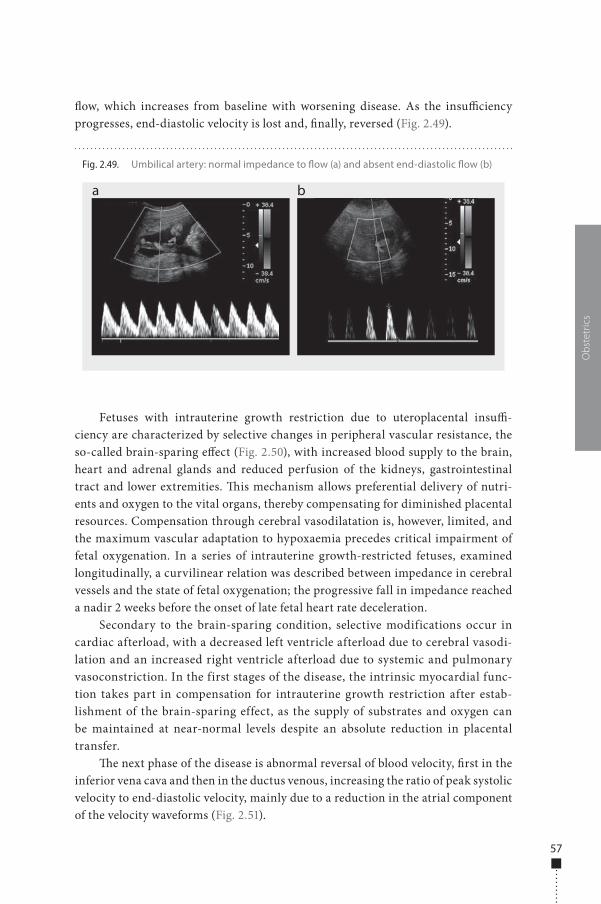
57
�ow, which increases from baseline with worsening disease. As the insu�ciency progresses, end-diastolic velocity is lost and, �nally, reversed (Fig. 2.49).
Fetuses with intrauterine growth restriction due to uteroplacental insu�-ciency are characterized by selective changes in peripheral vascular resistance, the so-called brain-sparing e�ect (Fig. 2.50), with increased blood supply to the brain, heart and adrenal glands and reduced perfusion of the kidneys, gastrointestinal tract and lower extremities. �is mechanism allows preferential delivery of nutri-ents and oxygen to the vital organs, thereby compensating for diminished placental resources. Compensation through cerebral vasodilatation is, however, limited, and the maximum vascular adaptation to hypoxaemia precedes critical impairment of fetal oxygenation. In a series of intrauterine growth-restricted fetuses, examined longitudinally, a curvilinear relation was described between impedance in cerebral vessels and the state of fetal oxygenation; the progressive fall in impedance reached a nadir 2 weeks before the onset of late fetal heart rate deceleration.
Secondary to the brain-sparing condition, selective modifications occur in cardiac afterload, with a decreased left ventricle afterload due to cerebral vasodi-lation and an increased right ventricle afterload due to systemic and pulmonary vasoconstriction. In the first stages of the disease, the intrinsic myocardial func-tion takes part in compensation for intrauterine growth restriction after estab-lishment of the brain-sparing effect, as the supply of substrates and oxygen can be maintained at near-normal levels despite an absolute reduction in placental transfer.
�e next phase of the disease is abnormal reversal of blood velocity, �rst in the inferior vena cava and then in the ductus venous, increasing the ratio of peak systolic velocity to end-diastolic velocity, mainly due to a reduction in the atrial component of the velocity waveforms (Fig. 2.51).
Obs
tetr
ics
Fig. 2.49. Umbilical artery: normal impedance to �ow (a) and absent end-diastolic �ow (b)
a b
978-9241548540-C002 PRF ml YVR ln ml ml-1-Final Proof.indd 57 6/10/13 10:34 AM
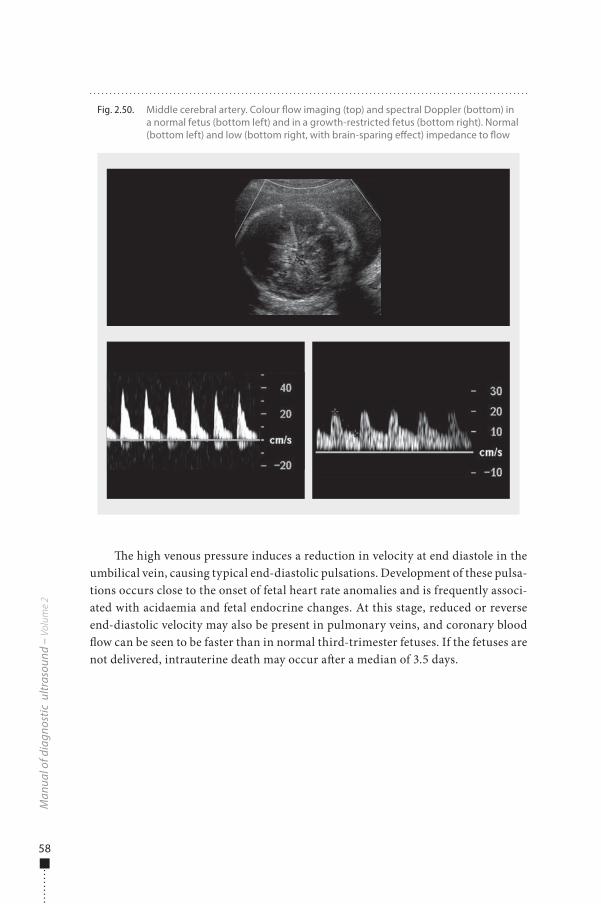
58
�e high venous pressure induces a reduction in velocity at end diastole in the umbilical vein, causing typical end-diastolic pulsations. Development of these pulsa-tions occurs close to the onset of fetal heart rate anomalies and is frequently associ-ated with acidaemia and fetal endocrine changes. At this stage, reduced or reverse end-diastolic velocity may also be present in pulmonary veins, and coronary blood �ow can be seen to be faster than in normal third-trimester fetuses. If the fetuses are not delivered, intrauterine death may occur a�er a median of 3.5 days.
Man
ual o
f dia
gnos
tic u
ltras
ound
– V
olum
e 2
Fig. 2.50. Middle cerebral artery. Colour �ow imaging (top) and spectral Doppler (bottom) in a normal fetus (bottom left) and in a growth-restricted fetus (bottom right). Normal (bottom left) and low (bottom right, with brain-sparing e�ect) impedance to �ow
978-9241548540-C002 PRF ml YVR ln ml ml-1-Final Proof.indd 58 6/10/13 10:34 AM
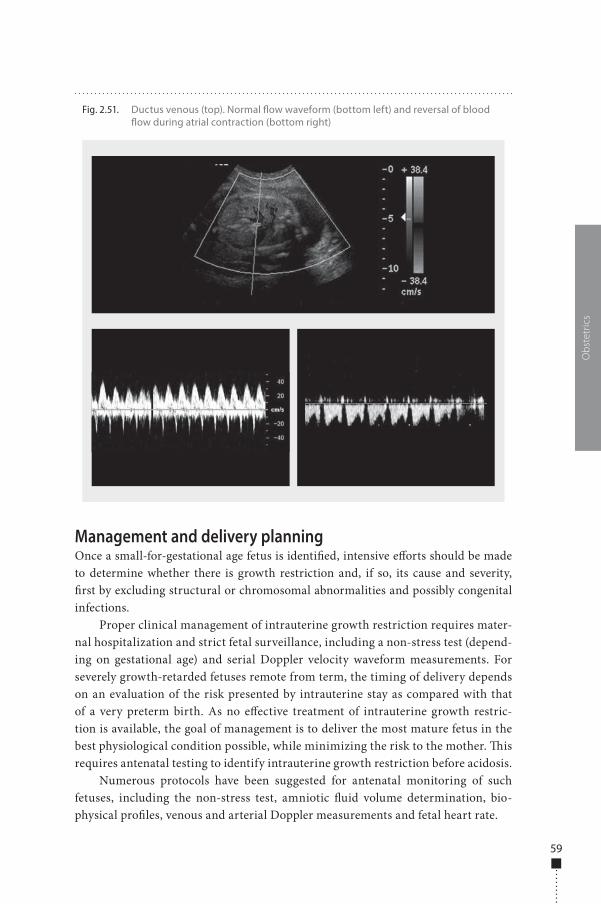
59
Management and delivery planningOnce a small-for-gestational age fetus is identi�ed, intensive e�orts should be made to determine whether there is growth restriction and, if so, its cause and severity, �rst by excluding structural or chromosomal abnormalities and possibly congenital infections.
Proper clinical management of intrauterine growth restriction requires mater-nal hospitalization and strict fetal surveillance, including a non-stress test (depend-ing on gestational age) and serial Doppler velocity waveform measurements. For severely growth-retarded fetuses remote from term, the timing of delivery depends on an evaluation of the risk presented by intrauterine stay as compared with that of a very preterm birth. As no e�ective treatment of intrauterine growth restric-tion is available, the goal of management is to deliver the most mature fetus in the best physiological condition possible, while minimizing the risk to the mother. �is requires antenatal testing to identify intrauterine growth restriction before acidosis.
Numerous protocols have been suggested for antenatal monitoring of such fetuses, including the non-stress test, amniotic �uid volume determination, bio-physical pro�les, venous and arterial Doppler measurements and fetal heart rate.
Obs
tetr
ics
Fig. 2.51. Ductus venous (top). Normal �ow waveform (bottom left) and reversal of blood �ow during atrial contraction (bottom right)
978-9241548540-C002 PRF ml YVR ln ml ml-1-Final Proof.indd 59 6/10/13 10:34 AM
60
Harman and Baschat suggested a strategy for monitoring intrauterine growth restriction, which integrates fetal testing for increasing orders of severity, from 1 to 5.
Step 1 ■ Test results: abdominal circumference less than the ��h percentile, low
abdominal circumference growth rate, high ratio of head circumference to abdominal circumference; biophysical pro�le score ≥ 8 and normal amniotic �uid volume; abnormal umbilical artery or cerebroplacental ratio; normal middle cerebral artery;
■ Interpretation: intrauterine growth restriction diagnosed, asphyxia extremely rare, increased risk for intrapartum distress;
■ Recommended management: intervention for obstetric or maternal factors only, weekly biophysical pro�le score, multivessel Doppler every 2 weeks.
Step 2 ■ Test results: intrauterine growth restriction criteria met, biophysical pro�le
score ≥ 8, normal amniotic �uid volume, umbilical artery with absent or reversed end-diastolic velocities, decreased middle cerebral artery;
■ Interpretation: intrauterine growth restriction with brain sparing, hypoxaemia possible and asphyxia rare, at risk for intrapartum distress;
■ Recommended management: intervention for obstetric or maternal factors only; biophysical pro�le score three times a week; weekly umbilical artery, middle cerebral artery and venous Doppler.
Step 3 ■ Test results: intrauterine growth restriction with low middle cerebral artery
pulsatility index; oligohydramnios; biophysical pro�le score ≥ 6; normal inferior vena cava, ductus venous and umbilical vein �ow;
■ Interpretation: intrauterine growth restriction with signi�cant brain sparing, onset of fetal compromise, hypoxaemia common, acidaemia or asphyxia possible;
■ Recommended management: if at more than 34 weeks’ gestation, deliver (route determined by obstetric factors); if at less than 34 weeks’ gestation, administer steroids to achieve lung maturity and repeat all testing a�er 24 h.
Step 4 ■ Test results: intrauterine growth restriction with brain sparing, oligohydram-
nios, biophysical pro�le score ≥ 6, increased inferior vena cava and ductus venous indices, umbilical vein �ow normal;
■ Interpretation: intrauterine growth restriction with brain sparing, proven fetal compromise, hypoxaemia common, acidaemia or asphyxia likely;
■ Recommended management: if at more than 34 weeks’ gestation, deliver (route determined by obstetric factors and oxytocin challenge test results); if at less
Man
ual o
f dia
gnos
tic u
ltras
ound
– V
olum
e 2
978-9241548540-C002 PRF ml YVR ln ml ml-1-Final Proof.indd 60 6/10/13 10:34 AM
61
than 34 weeks’ gestation, individualize treatment with admission, continuous cardiotocography, steroids, maternal oxygen or amnioinfusion, then repeat all testing up to three times a day, depending on status.
Step 5 ■ Test results: intrauterine growth restriction with accelerating compromise,
biophysical pro�le score ≤ 6, abnormal inferior vena cava and ductus venous indices, pulsatile umbilical vein �ow;
■ Interpretation: intrauterine growth restriction with decompensation, cardio-vascular instability, hypoxaemia certain, acidaemia or asphyxia common, high perinatal mortality, death imminent;
■ Recommended management: if fetus is considered viable by size, deliver as soon as possible at tertiary centre (route determined by obstetric factors and oxytocin challenge test results); fetus requires highest level of natal intensive care.
In all cases, a diagnosis of intrauterine growth restriction before 32 weeks’ gestation is associated with a poor prognosis. �erapy must be highly individual-ized. Several studies have shown that the ductus venous pulsatility index and short-term variation in fetal heart rate are important indicators for the optimal timing of delivery before 32 weeks’ gestation. Delivery should be considered if one of these parameters is persistently abnormal, and it should be delayed for 48 h to allow maxi-mum fetal bene�t of maternal administration of glucocorticoids. Worsening of the mother’s condition because of the pregnancy must be considered in deciding on the delivery of a severely growth-retarded fetus.
Perinatal and long-term sequelaeAs the likelihood of severe distress in growth-retarded fetuses during labour is con-siderably increased, they should be monitored closely and Caesarean section should be considered. Moreover, the lack of amniotic �uid predisposes to cord accidents and their consequences. Growth-retarded newborns are also susceptible to hypo-thermia and other metabolic e�ects, such as serious hypoglycaemia. Polycythaemia and blood hyperviscosity (due to chronic hypoxia in utero) may occasionally cause cardiac heart failure at birth.
Most infants who have growth restriction in utero have normal rates of growth in infancy and childhood, although at least one third of them may show impaired growth and neurological development of various degrees. Many of these infants are also born prematurely, with additional morbidity. Children with a history of intrau-terine growth restriction have been found to have attention and performance de�cits. Minimizing hypoxic episodes during labour and delivery and intensive neonatal care at birth are mandatory for the best outcome.
Obs
tetr
ics
978-9241548540-C002 PRF ml YVR ln ml ml-1-Final Proof.indd 61 6/10/13 10:34 AM
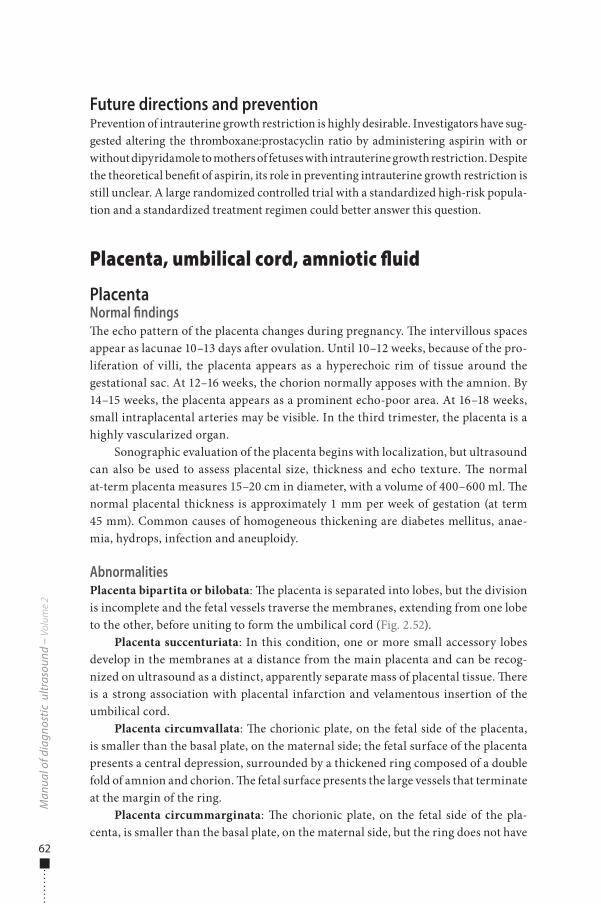
62
Future directions and preventionPrevention of intrauterine growth restriction is highly desirable. Investigators have sug-gested altering the thromboxane:prostacyclin ratio by administering aspirin with or without dipyridamole to mothers of fetuses with intrauterine growth restriction. Despite the theoretical bene�t of aspirin, its role in preventing intrauterine growth restriction is still unclear. A large randomized controlled trial with a standardized high-risk popula-tion and a standardized treatment regimen could better answer this question.
Placenta, umbilical cord, amniotic fluid
PlacentaNormal findings�e echo pattern of the placenta changes during pregnancy. �e intervillous spaces appear as lacunae 10–13 days a�er ovulation. Until 10–12 weeks, because of the pro-liferation of villi, the placenta appears as a hyperechoic rim of tissue around the gestational sac. At 12–16 weeks, the chorion normally apposes with the amnion. By 14–15 weeks, the placenta appears as a prominent echo-poor area. At 16–18 weeks, small intraplacental arteries may be visible. In the third trimester, the placenta is a highly vascularized organ.
Sonographic evaluation of the placenta begins with localization, but ultrasound can also be used to assess placental size, thickness and echo texture. �e normal at-term placenta measures 15–20 cm in diameter, with a volume of 400–600 ml. �e normal placental thickness is approximately 1 mm per week of gestation (at term 45 mm). Common causes of homogeneous thickening are diabetes mellitus, anae-mia, hydrops, infection and aneuploidy.
AbnormalitiesPlacenta bipartita or bilobata: �e placenta is separated into lobes, but the division is incomplete and the fetal vessels traverse the membranes, extending from one lobe to the other, before uniting to form the umbilical cord (Fig. 2.52).
Placenta succenturiata: In this condition, one or more small accessory lobes develop in the membranes at a distance from the main placenta and can be recog-nized on ultrasound as a distinct, apparently separate mass of placental tissue. �ere is a strong association with placental infarction and velamentous insertion of the umbilical cord.
Placenta circumvallata: �e chorionic plate, on the fetal side of the placenta, is smaller than the basal plate, on the maternal side; the fetal surface of the placenta presents a central depression, surrounded by a thickened ring composed of a double fold of amnion and chorion. �e fetal surface presents the large vessels that terminate at the margin of the ring.
Placenta circummarginata: �e chorionic plate, on the fetal side of the pla-centa, is smaller than the basal plate, on the maternal side, but the ring does not have
Man
ual o
f dia
gnos
tic u
ltras
ound
– V
olum
e 2
978-9241548540-C002 PRF ml YVR ln ml ml-1-Final Proof.indd 62 6/10/13 10:34 AM
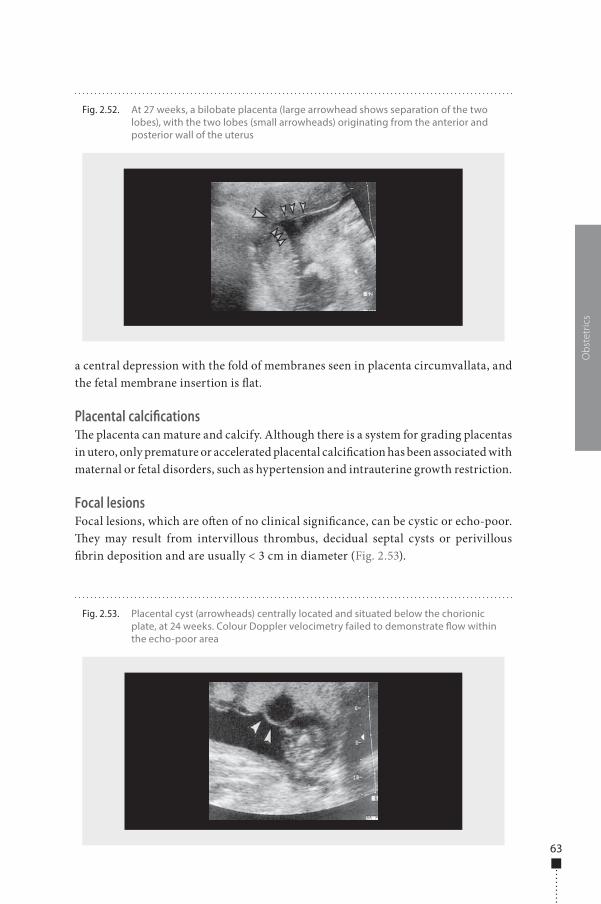
63
a central depression with the fold of membranes seen in placenta circumvallata, and the fetal membrane insertion is �at.
Placental calcifications�e placenta can mature and calcify. Although there is a system for grading placentas in utero, only premature or accelerated placental calci�cation has been associated with maternal or fetal disorders, such as hypertension and intrauterine growth restriction.
Focal lesionsFocal lesions, which are o�en of no clinical signi�cance, can be cystic or echo-poor. �ey may result from intervillous thrombus, decidual septal cysts or perivillous �brin deposition and are usually < 3 cm in diameter (Fig. 2.53).
Obs
tetr
ics
Fig. 2.52. At 27 weeks, a bilobate placenta (large arrowhead shows separation of the two lobes), with the two lobes (small arrowheads) originating from the anterior and posterior wall of the uterus
Fig. 2.53. Placental cyst (arrowheads) centrally located and situated below the chorionic plate, at 24 weeks. Colour Doppler velocimetry failed to demonstrate �ow within the echo-poor area
978-9241548540-C002 PRF ml YVR ln ml ml-1-Final Proof.indd 63 6/10/13 10:34 AM
64
Vascular abnormalitiesPlacental infarct: A placental infarct is a localized area of ischaemic villous necrosis, more commonly at the periphery of the placenta. In almost 90% of cases, it is located at the placental margin and is < 1 cm. �is type of limited infarction results from occlusion of the maternal uteroplacental circulation and usually represents normal ageing. Placental infarcts can be an incidental, normal �nding, but placental insuf-�ciency may develop if they are numerous.
Most placental infarcts are not readily detectable by ultrasound because they are isoechoic with adjacent placental tissue; in rare instances, an acute placental infarct may be visible as a slightly echo-rich region. Most infarcts are small and are not clini-cally signi�cant. When they are thick, centrally located and randomly distributed, they may be associated with pre-eclampsia or lupus anticoagulant.
Maternal �oor infarct: �is uteroplacental vasculopathy di�ers from the previ-ously described infarcts in that there are no large areas of villous infarction. Instead, �brinoid deposition occurs within the decidua basalis, usually con�ned to the pla-cental �oor. �ese lesions are not detectable by antenatal ultrasound.
Haematomas�e location, cause, sonographic �ndings and clinical impact of haematomas should be determined. Subchorionic or marginal haematomas are located at the lateral margin of the placenta. Retroplacental haematomas, which can manifest as placental abruption, are of the greatest clinical consequence. When the placenta is imaged, the retroplacental echo-poor complex, composed of uteroplacental vessels (veins) and myometrium, should be observed. When this region appears thicker, the possibility of retroplacental haemorrhage should be considered.
Placental abruption�e clinical condition (abruption) and the pathological condition (haematoma) both involve abnormal accumulation of maternal blood within or above the placenta or membranes. �e sonographic appearance of retroplacental haemorrhage depends on age and location of bleeding. Characteristically, haemorrhage may be hyperechoic acutely (0–48 h), isoechoic at 3–7 days and hypoechoic at 1–2 weeks. A�er 2 weeks, portions of the clot may become echo-free.
Placenta praeviaIn placenta praevia, the placenta is located over or very near the internal os (Fig. 2.54). Four degrees of this abnormality have been recognized:
■ Total placenta praevia: the internal cervical os is completely covered by placenta. ■ Partial placenta praevia: the internal os is partially covered by placenta. ■ Marginal placenta praevia: the edge of the placenta is at the margin of the
internal os.
Man
ual o
f dia
gnos
tic u
ltras
ound
– V
olum
e 2
978-9241548540-C002 PRF ml YVR ln ml ml-1-Final Proof.indd 64 6/10/13 10:34 AM
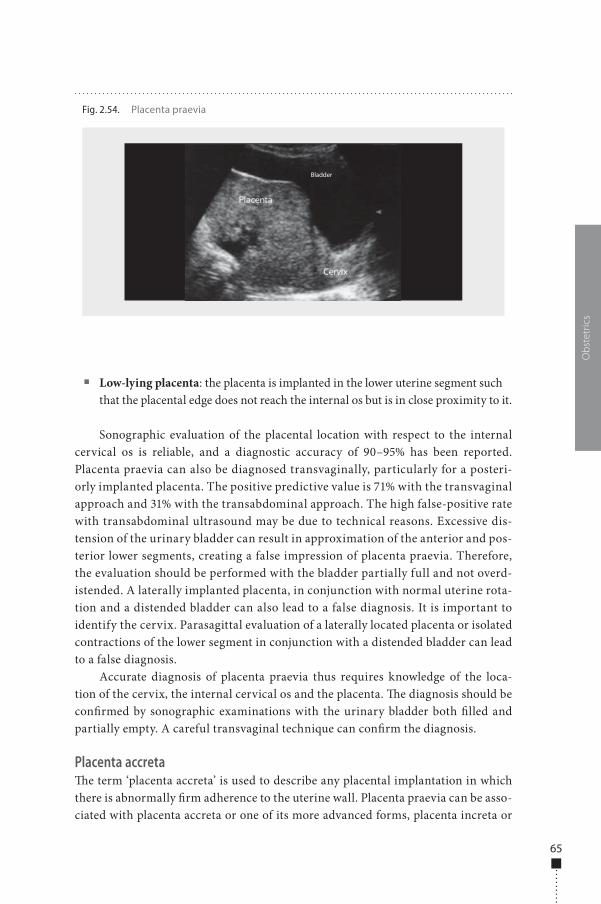
65
■ Low-lying placenta: the placenta is implanted in the lower uterine segment such that the placental edge does not reach the internal os but is in close proximity to it.
Sonographic evaluation of the placental location with respect to the internal cervical os is reliable, and a diagnostic accuracy of 90–95% has been reported. Placenta praevia can also be diagnosed transvaginally, particularly for a posteri-orly implanted placenta. The positive predictive value is 71% with the transvaginal approach and 31% with the transabdominal approach. The high false-positive rate with transabdominal ultrasound may be due to technical reasons. Excessive dis-tension of the urinary bladder can result in approximation of the anterior and pos-terior lower segments, creating a false impression of placenta praevia. Therefore, the evaluation should be performed with the bladder partially full and not overd-istended. A laterally implanted placenta, in conjunction with normal uterine rota-tion and a distended bladder can also lead to a false diagnosis. It is important to identify the cervix. Parasagittal evaluation of a laterally located placenta or isolated contractions of the lower segment in conjunction with a distended bladder can lead to a false diagnosis.
Accurate diagnosis of placenta praevia thus requires knowledge of the loca-tion of the cervix, the internal cervical os and the placenta. �e diagnosis should be con�rmed by sonographic examinations with the urinary bladder both �lled and partially empty. A careful transvaginal technique can con�rm the diagnosis.
Placenta accreta�e term ‘placenta accreta’ is used to describe any placental implantation in which there is abnormally �rm adherence to the uterine wall. Placenta praevia can be asso-ciated with placenta accreta or one of its more advanced forms, placenta increta or
Obs
tetr
ics
Fig. 2.54. Placenta praevia
Bladder
978-9241548540-C002 PRF ml YVR ln ml ml-1-Final Proof.indd 65 6/10/13 10:34 AM
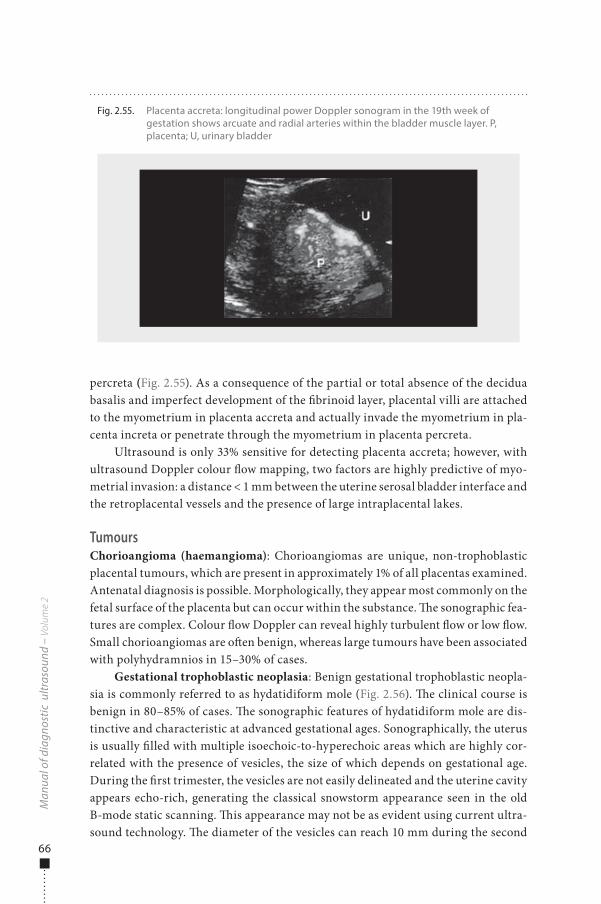
66
percreta (Fig. 2.55). As a consequence of the partial or total absence of the decidua basalis and imperfect development of the �brinoid layer, placental villi are attached to the myometrium in placenta accreta and actually invade the myometrium in pla-centa increta or penetrate through the myometrium in placenta percreta.
Ultrasound is only 33% sensitive for detecting placenta accreta; however, with ultrasound Doppler colour �ow mapping, two factors are highly predictive of myo-metrial invasion: a distance < 1 mm between the uterine serosal bladder interface and the retroplacental vessels and the presence of large intraplacental lakes.
TumoursChorioangioma (haemangioma): Chorioangiomas are unique, non-trophoblastic placental tumours, which are present in approximately 1% of all placentas examined. Antenatal diagnosis is possible. Morphologically, they appear most commonly on the fetal surface of the placenta but can occur within the substance. �e sonographic fea-tures are complex. Colour �ow Doppler can reveal highly turbulent �ow or low �ow. Small chorioangiomas are o�en benign, whereas large tumours have been associated with polyhydramnios in 15–30% of cases.
Gestational trophoblastic neoplasia: Benign gestational trophoblastic neopla-sia is commonly referred to as hydatidiform mole (Fig. 2.56). �e clinical course is benign in 80–85% of cases. �e sonographic features of hydatidiform mole are dis-tinctive and characteristic at advanced gestational ages. Sonographically, the uterus is usually �lled with multiple isoechoic-to-hyperechoic areas which are highly cor-related with the presence of vesicles, the size of which depends on gestational age. During the �rst trimester, the vesicles are not easily delineated and the uterine cavity appears echo-rich, generating the classical snowstorm appearance seen in the old B-mode static scanning. �is appearance may not be as evident using current ultra-sound technology. �e diameter of the vesicles can reach 10 mm during the second
Man
ual o
f dia
gnos
tic u
ltras
ound
– V
olum
e 2
Fig. 2.55. Placenta accreta: longitudinal power Doppler sonogram in the 19th week of gestation shows arcuate and radial arteries within the bladder muscle layer. P, placenta; U, urinary bladder
978-9241548540-C002 PRF ml YVR ln ml ml-1-Final Proof.indd 66 6/10/13 10:34 AM
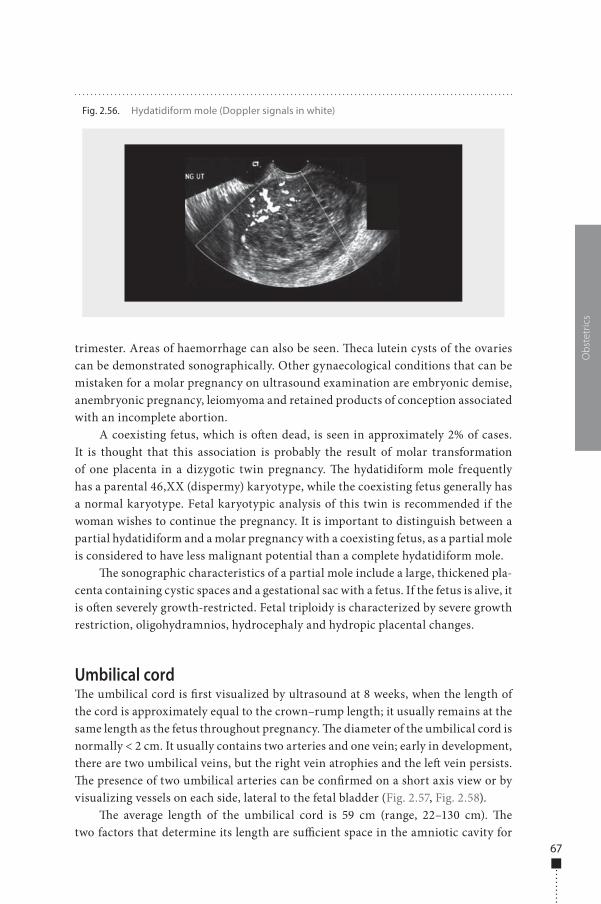
67
trimester. Areas of haemorrhage can also be seen. �eca lutein cysts of the ovaries can be demonstrated sonographically. Other gynaecological conditions that can be mistaken for a molar pregnancy on ultrasound examination are embryonic demise, anembryonic pregnancy, leiomyoma and retained products of conception associated with an incomplete abortion.
A coexisting fetus, which is o�en dead, is seen in approximately 2% of cases. It is thought that this association is probably the result of molar transformation of one placenta in a dizygotic twin pregnancy. �e hydatidiform mole frequently has a parental 46,XX (dispermy) karyotype, while the coexisting fetus generally has a normal karyotype. Fetal karyotypic analysis of this twin is recommended if the woman wishes to continue the pregnancy. It is important to distinguish between a partial hydatidiform and a molar pregnancy with a coexisting fetus, as a partial mole is considered to have less malignant potential than a complete hydatidiform mole.
�e sonographic characteristics of a partial mole include a large, thickened pla-centa containing cystic spaces and a gestational sac with a fetus. If the fetus is alive, it is o�en severely growth-restricted. Fetal triploidy is characterized by severe growth restriction, oligohydramnios, hydrocephaly and hydropic placental changes.
Umbilical cord�e umbilical cord is �rst visualized by ultrasound at 8 weeks, when the length of the cord is approximately equal to the crown–rump length; it usually remains at the same length as the fetus throughout pregnancy. �e diameter of the umbilical cord is normally < 2 cm. It usually contains two arteries and one vein; early in development, there are two umbilical veins, but the right vein atrophies and the le� vein persists. �e presence of two umbilical arteries can be con�rmed on a short axis view or by visualizing vessels on each side, lateral to the fetal bladder (Fig. 2.57, Fig. 2.58).
�e average length of the umbilical cord is 59 cm (range, 22–130 cm). �e two factors that determine its length are su�cient space in the amniotic cavity for
Obs
tetr
ics
Fig. 2.56. Hydatidiform mole (Doppler signals in white)
978-9241548540-C002 PRF ml YVR ln ml ml-1-Final Proof.indd 67 6/10/13 10:34 AM
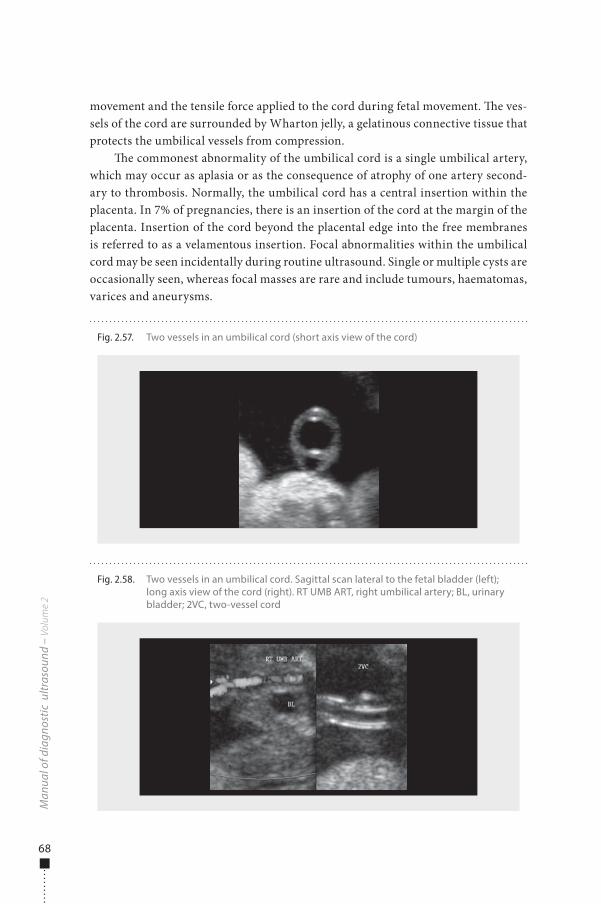
68
movement and the tensile force applied to the cord during fetal movement. �e ves-sels of the cord are surrounded by Wharton jelly, a gelatinous connective tissue that protects the umbilical vessels from compression.
�e commonest abnormality of the umbilical cord is a single umbilical artery, which may occur as aplasia or as the consequence of atrophy of one artery second-ary to thrombosis. Normally, the umbilical cord has a central insertion within the placenta. In 7% of pregnancies, there is an insertion of the cord at the margin of the placenta. Insertion of the cord beyond the placental edge into the free membranes is referred to as a velamentous insertion. Focal abnormalities within the umbilical cord may be seen incidentally during routine ultrasound. Single or multiple cysts are occasionally seen, whereas focal masses are rare and include tumours, haematomas, varices and aneurysms.
Man
ual o
f dia
gnos
tic u
ltras
ound
– V
olum
e 2
Fig. 2.58. Two vessels in an umbilical cord. Sagittal scan lateral to the fetal bladder (left); long axis view of the cord (right). RT UMB ART, right umbilical artery; BL, urinary bladder; 2VC, two-vessel cord
Fig. 2.57. Two vessels in an umbilical cord (short axis view of the cord)
978-9241548540-C002 PRF ml YVR ln ml ml-1-Final Proof.indd 68 6/10/13 10:34 AM
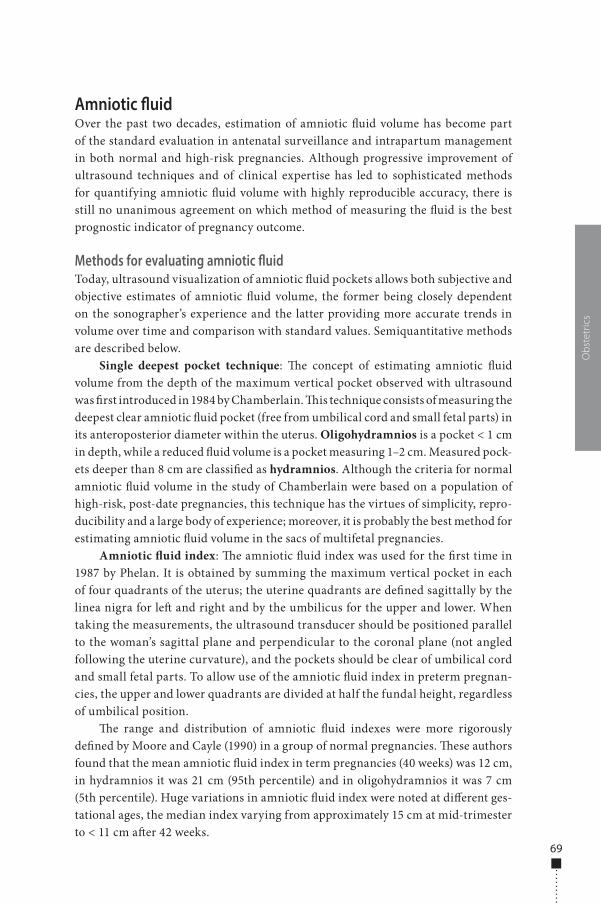
69
Amniotic �uidOver the past two decades, estimation of amniotic �uid volume has become part of the standard evaluation in antenatal surveillance and intrapartum management in both normal and high-risk pregnancies. Although progressive improvement of ultrasound techniques and of clinical expertise has led to sophisticated methods for quantifying amniotic �uid volume with highly reproducible accuracy, there is still no unanimous agreement on which method of measuring the �uid is the best prognostic indicator of pregnancy outcome.
Methods for evaluating amniotic fluidToday, ultrasound visualization of amniotic �uid pockets allows both subjective and objective estimates of amniotic �uid volume, the former being closely dependent on the sonographer’s experience and the latter providing more accurate trends in volume over time and comparison with standard values. Semiquantitative methods are described below.
Single deepest pocket technique: �e concept of estimating amniotic �uid volume from the depth of the maximum vertical pocket observed with ultrasound was �rst introduced in 1984 by Chamberlain. �is technique consists of measuring the deepest clear amniotic �uid pocket (free from umbilical cord and small fetal parts) in its anteroposterior diameter within the uterus. Oligohydramnios is a pocket < 1 cm in depth, while a reduced �uid volume is a pocket measuring 1–2 cm. Measured pock-ets deeper than 8 cm are classi�ed as hydramnios. Although the criteria for normal amniotic �uid volume in the study of Chamberlain were based on a population of high-risk, post-date pregnancies, this technique has the virtues of simplicity, repro-ducibility and a large body of experience; moreover, it is probably the best method for estimating amniotic �uid volume in the sacs of multifetal pregnancies.
Amniotic �uid index: �e amniotic �uid index was used for the �rst time in 1987 by Phelan. It is obtained by summing the maximum vertical pocket in each of four quadrants of the uterus; the uterine quadrants are de�ned sagittally by the linea nigra for le� and right and by the umbilicus for the upper and lower. When taking the measurements, the ultrasound transducer should be positioned parallel to the woman’s sagittal plane and perpendicular to the coronal plane (not angled following the uterine curvature), and the pockets should be clear of umbilical cord and small fetal parts. To allow use of the amniotic �uid index in preterm pregnan-cies, the upper and lower quadrants are divided at half the fundal height, regardless of umbilical position.
�e range and distribution of amniotic �uid indexes were more rigorously de�ned by Moore and Cayle (1990) in a group of normal pregnancies. �ese authors found that the mean amniotic �uid index in term pregnancies (40 weeks) was 12 cm, in hydramnios it was 21 cm (95th percentile) and in oligohydramnios it was 7 cm (5th percentile). Huge variations in amniotic �uid index were noted at di�erent ges-tational ages, the median index varying from approximately 15 cm at mid-trimester to < 11 cm a�er 42 weeks.
Obs
tetr
ics
978-9241548540-C002 PRF ml YVR ln ml ml-1-Final Proof.indd 69 6/10/13 10:34 AM
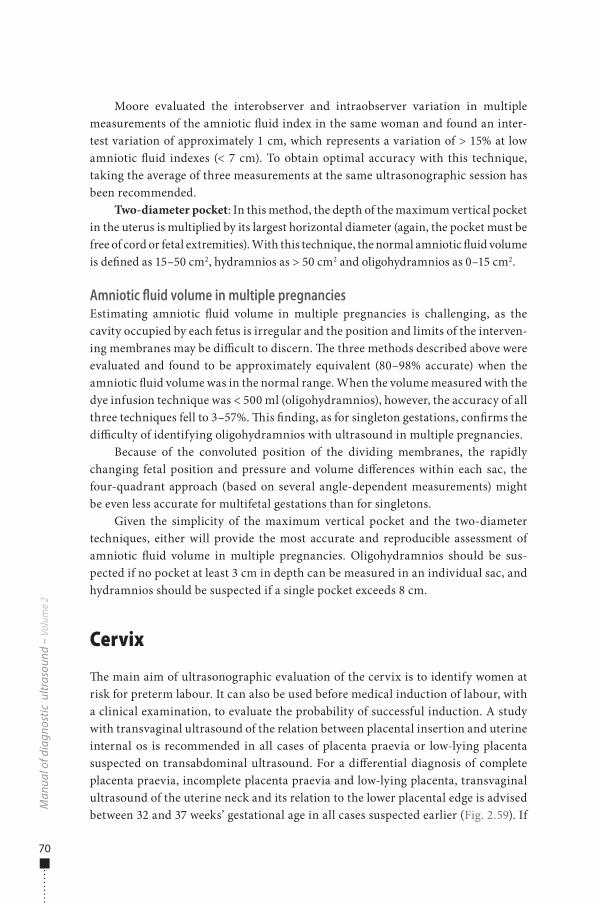
70
Moore evaluated the interobserver and intraobserver variation in multiple measurements of the amniotic �uid index in the same woman and found an inter-test variation of approximately 1 cm, which represents a variation of > 15% at low amniotic �uid indexes (< 7 cm). To obtain optimal accuracy with this technique, taking the average of three measurements at the same ultrasonographic session has been recommended.
Two-diameter pocket: In this method, the depth of the maximum vertical pocket in the uterus is multiplied by its largest horizontal diameter (again, the pocket must be free of cord or fetal extremities). With this technique, the normal amniotic �uid volume is de�ned as 15–50 cm2, hydramnios as > 50 cm2 and oligohydramnios as 0–15 cm2.
Amniotic fluid volume in multiple pregnanciesEstimating amniotic �uid volume in multiple pregnancies is challenging, as the cavity occupied by each fetus is irregular and the position and limits of the interven-ing membranes may be di�cult to discern. �e three methods described above were evaluated and found to be approximately equivalent (80–98% accurate) when the amniotic �uid volume was in the normal range. When the volume measured with the dye infusion technique was < 500 ml (oligohydramnios), however, the accuracy of all three techniques fell to 3–57%. �is �nding, as for singleton gestations, con�rms the di�culty of identifying oligohydramnios with ultrasound in multiple pregnancies.
Because of the convoluted position of the dividing membranes, the rapidly changing fetal position and pressure and volume di�erences within each sac, the four-quadrant approach (based on several angle-dependent measurements) might be even less accurate for multifetal gestations than for singletons.
Given the simplicity of the maximum vertical pocket and the two-diameter techniques, either will provide the most accurate and reproducible assessment of amniotic �uid volume in multiple pregnancies. Oligohydramnios should be sus-pected if no pocket at least 3 cm in depth can be measured in an individual sac, and hydramnios should be suspected if a single pocket exceeds 8 cm.
Cervix
�e main aim of ultrasonographic evaluation of the cervix is to identify women at risk for preterm labour. It can also be used before medical induction of labour, with a clinical examination, to evaluate the probability of successful induction. A study with transvaginal ultrasound of the relation between placental insertion and uterine internal os is recommended in all cases of placenta praevia or low-lying placenta suspected on transabdominal ultrasound. For a di�erential diagnosis of complete placenta praevia, incomplete placenta praevia and low-lying placenta, transvaginal ultrasound of the uterine neck and its relation to the lower placental edge is advised between 32 and 37 weeks’ gestational age in all cases suspected earlier (Fig. 2.59). If
Man
ual o
f dia
gnos
tic u
ltras
ound
– V
olum
e 2
978-9241548540-C002 PRF ml YVR ln ml ml-1-Final Proof.indd 70 6/10/13 10:34 AM
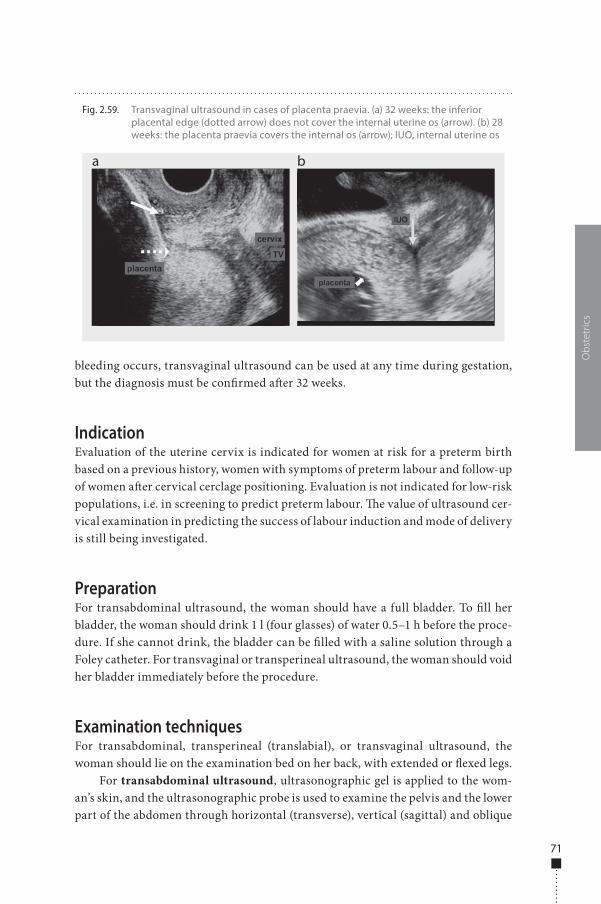
71
bleeding occurs, transvaginal ultrasound can be used at any time during gestation, but the diagnosis must be con�rmed a�er 32 weeks.
IndicationEvaluation of the uterine cervix is indicated for women at risk for a preterm birth based on a previous history, women with symptoms of preterm labour and follow-up of women a�er cervical cerclage positioning. Evaluation is not indicated for low-risk populations, i.e. in screening to predict preterm labour. �e value of ultrasound cer-vical examination in predicting the success of labour induction and mode of delivery is still being investigated.
PreparationFor transabdominal ultrasound, the woman should have a full bladder. To �ll her bladder, the woman should drink 1 l (four glasses) of water 0.5–1 h before the proce-dure. If she cannot drink, the bladder can be �lled with a saline solution through a Foley catheter. For transvaginal or transperineal ultrasound, the woman should void her bladder immediately before the procedure.
Examination techniquesFor transabdominal, transperineal (translabial), or transvaginal ultrasound, the woman should lie on the examination bed on her back, with extended or �exed legs.
For transabdominal ultrasound, ultrasonographic gel is applied to the wom-an’s skin, and the ultrasonographic probe is used to examine the pelvis and the lower part of the abdomen through horizontal (transverse), vertical (sagittal) and oblique
Obs
tetr
ics
Fig. 2.59. Transvaginal ultrasound in cases of placenta praevia. (a) 32 weeks: the inferior placental edge (dotted arrow) does not cover the internal uterine os (arrow). (b) 28 weeks: the placenta praevia covers the internal os (arrow); IUO, internal uterine os
a b
978-9241548540-C002 PRF ml YVR ln ml ml-1-Final Proof.indd 71 6/10/13 10:34 AM
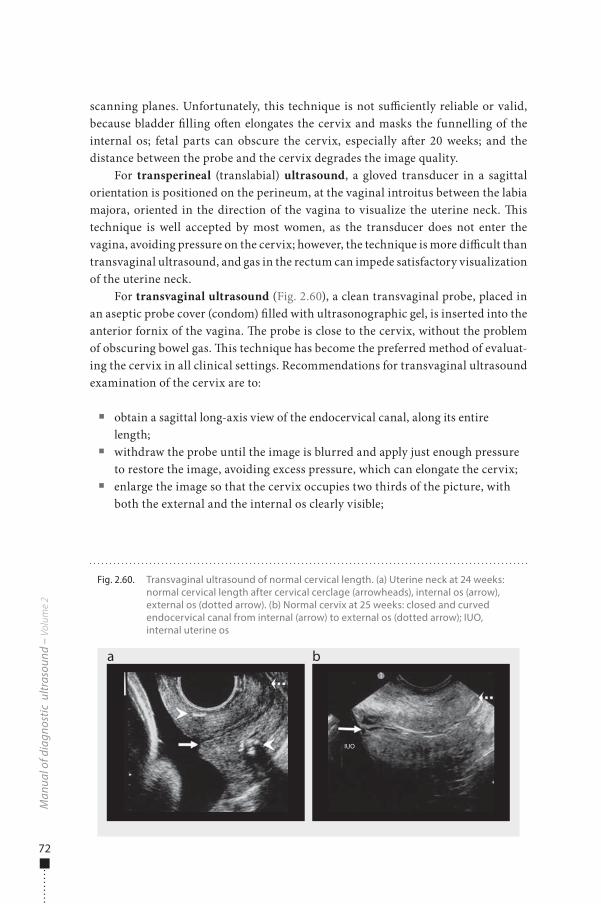
72
scanning planes. Unfortunately, this technique is not su�ciently reliable or valid, because bladder �lling o�en elongates the cervix and masks the funnelling of the internal os; fetal parts can obscure the cervix, especially a�er 20 weeks; and the distance between the probe and the cervix degrades the image quality.
For transperineal (translabial) ultrasound, a gloved transducer in a sagittal orientation is positioned on the perineum, at the vaginal introitus between the labia majora, oriented in the direction of the vagina to visualize the uterine neck. �is technique is well accepted by most women, as the transducer does not enter the vagina, avoiding pressure on the cervix; however, the technique is more di�cult than transvaginal ultrasound, and gas in the rectum can impede satisfactory visualization of the uterine neck.
For transvaginal ultrasound (Fig. 2.60), a clean transvaginal probe, placed in an aseptic probe cover (condom) �lled with ultrasonographic gel, is inserted into the anterior fornix of the vagina. �e probe is close to the cervix, without the problem of obscuring bowel gas. �is technique has become the preferred method of evaluat-ing the cervix in all clinical settings. Recommendations for transvaginal ultrasound examination of the cervix are to:
■ obtain a sagittal long-axis view of the endocervical canal, along its entire length;
■ withdraw the probe until the image is blurred and apply just enough pressure to restore the image, avoiding excess pressure, which can elongate the cervix;
■ enlarge the image so that the cervix occupies two thirds of the picture, with both the external and the internal os clearly visible;
Man
ual o
f dia
gnos
tic u
ltras
ound
– V
olum
e 2
Fig. 2.60. Transvaginal ultrasound of normal cervical length. (a) Uterine neck at 24 weeks: normal cervical length after cervical cerclage (arrowheads), internal os (arrow), external os (dotted arrow). (b) Normal cervix at 25 weeks: closed and curved endocervical canal from internal (arrow) to external os (dotted arrow); IUO, internal uterine os
a b
IUO
978-9241548540-C002 PRF ml YVR ln ml ml-1-Final Proof.indd 72 6/10/13 10:34 AM
73
■ measure the cervical length from the internal to the external os along the endocervical canal (take at least three measurements and record the shortest, best measurement in millimetres);
■ apply transfundal pressure for 15 s and record the cervical length again; ■ describe the presence of funnelling (opening) of the internal os and cervix and
measure its length and width.
Normal �ndingsTransvaginal sonography has been shown to be superior to manual examination for evaluating the cervix. Various cervical parameters have been evaluated, but cervical length, measured from the internal os to the external os along the endocervical canal, is the most reproducible and reliable measurement. If the cervical canal is curved, the cervical length can be measured on a straight line between the internal and external os or as the sum of two straight lines that follow the curve.
�e normal cervical length is 25–50 mm at 14–30 weeks’ gestational age in singleton pregnancies. A cervical length > 25–30 mm is a reassuring �nding. A�er 30 weeks, the cervix progressively shortens in preparation for term labour, so that a length of 15–24 mm can be physiological in asymptomatic women. In normal pregnancies, the internal os is �at, the cervical canal and the internal os are closed, and the length of the cervix is the only measurement to be made (Fig. 2.60). �e length may change dynamically during a 5- to 10-min examination, and in some cases funnelling of the upper cervical canal may appear and resolve. �is occurs in women having contractions, and, similarly, the cervix may shorten in response to transfundal pressure in an otherwise normal cervix.
In multiple pregnancies, cervical length measured at 14–19 weeks is similar to that in singleton pregnancies, but in multiple pregnancies the cervix is progressively much shorter, starting from 20 weeks’ gestational age.
Pathological �ndingsRisk of preterm birth and patient with preterm birth�e changes in the cervix that lead to preterm or term labour, seen by transvaginal ultrasound, include: initial opening of the internal os of the cervix; progressive cervi-cal shortening and widening along the endocervical canal (from the internal to the external os); and opening of the external os. A short cervical length (< 25 mm) is the best predictor of preterm birth at 16–24 weeks: the shorter the cervical length, the higher the risk for preterm birth. In high-risk women, preterm birth a�er the detection of a short cervix (< 10 mm) is o�en preceded by premature rupture of the membranes. When funnelling occurs, the internal os and the open part of the cervical canal have a triangular shape, and the total cervical length is the sum of the funnel (open portion of the cervix) length and the functional cervical length (closed portion of the endocervical canal). It is also possible to measure the internal os diameter (funnel width) (Fig. 2.61).
Obs
tetr
ics
978-9241548540-C002 PRF ml YVR ln ml ml-1-Final Proof.indd 73 6/10/13 10:34 AM
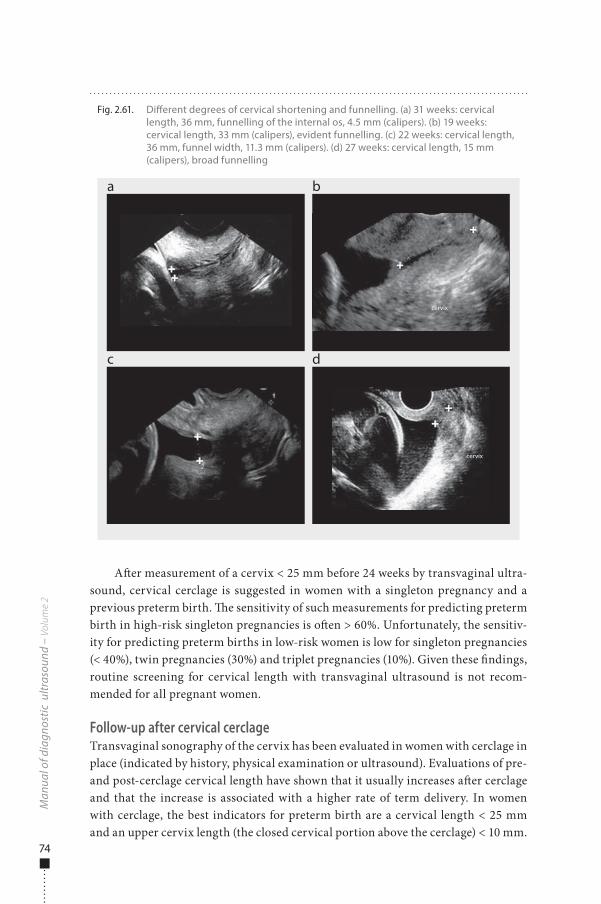
74
A�er measurement of a cervix < 25 mm before 24 weeks by transvaginal ultra-sound, cervical cerclage is suggested in women with a singleton pregnancy and a previous preterm birth. �e sensitivity of such measurements for predicting preterm birth in high-risk singleton pregnancies is o�en > 60%. Unfortunately, the sensitiv-ity for predicting preterm births in low-risk women is low for singleton pregnancies (< 40%), twin pregnancies (30%) and triplet pregnancies (10%). Given these �ndings, routine screening for cervical length with transvaginal ultrasound is not recom-mended for all pregnant women.
Follow-up after cervical cerclageTransvaginal sonography of the cervix has been evaluated in women with cerclage in place (indicated by history, physical examination or ultrasound). Evaluations of pre- and post-cerclage cervical length have shown that it usually increases a�er cerclage and that the increase is associated with a higher rate of term delivery. In women with cerclage, the best indicators for preterm birth are a cervical length < 25 mm and an upper cervix length (the closed cervical portion above the cerclage) < 10 mm.
Man
ual o
f dia
gnos
tic u
ltras
ound
– V
olum
e 2
Fig. 2.61. Di�erent degrees of cervical shortening and funnelling. (a) 31 weeks: cervical length, 36 mm, funnelling of the internal os, 4.5 mm (calipers). (b) 19 weeks: cervical length, 33 mm (calipers), evident funnelling. (c) 22 weeks: cervical length, 36 mm, funnel width, 11.3 mm (calipers). (d) 27 weeks: cervical length, 15 mm (calipers), broad funnelling
a
c
b
d
cervix
cervix
978-9241548540-C002 PRF ml YVR ln ml ml-1-Final Proof.indd 74 6/10/13 10:34 AM
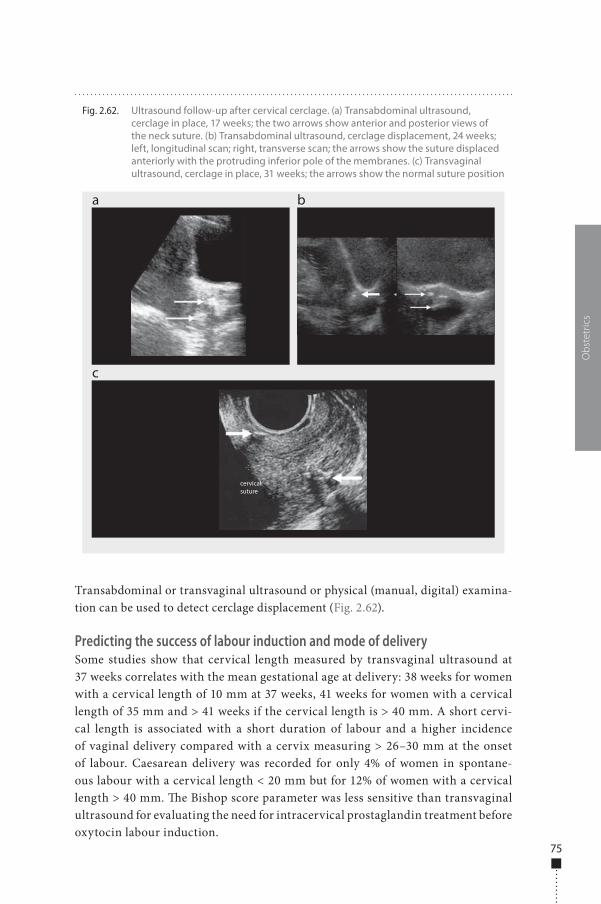
75
Transabdominal or transvaginal ultrasound or physical (manual, digital) examina-tion can be used to detect cerclage displacement (Fig. 2.62).
Predicting the success of labour induction and mode of deliverySome studies show that cervical length measured by transvaginal ultrasound at 37 weeks correlates with the mean gestational age at delivery: 38 weeks for women with a cervical length of 10 mm at 37 weeks, 41 weeks for women with a cervical length of 35 mm and > 41 weeks if the cervical length is > 40 mm. A short cervi-cal length is associated with a short duration of labour and a higher incidence of vaginal delivery compared with a cervix measuring > 26–30 mm at the onset of labour. Caesarean delivery was recorded for only 4% of women in spontane-ous labour with a cervical length < 20 mm but for 12% of women with a cervical length > 40 mm. �e Bishop score parameter was less sensitive than transvaginal ultrasound for evaluating the need for intracervical prostaglandin treatment before oxytocin labour induction.
Obs
tetr
ics
Fig. 2.62. Ultrasound follow-up after cervical cerclage. (a) Transabdominal ultrasound, cerclage in place, 17 weeks; the two arrows show anterior and posterior views of the neck suture. (b) Transabdominal ultrasound, cerclage displacement, 24 weeks; left, longitudinal scan; right, transverse scan; the arrows show the suture displaced anteriorly with the protruding inferior pole of the membranes. (c) Transvaginal ultrasound, cerclage in place, 31 weeks; the arrows show the normal suture position
a
c
b
cervical suture
978-9241548540-C002 PRF ml YVR ln ml ml-1-Final Proof.indd 75 6/10/13 10:34 AM
76
Multiple pregnancies
�e incidence of multiple pregnancies is 3%. Over the past 20 years, the number of twin births has increased by 50% and the number of multiple deliveries by 400%, primarily because of the availability and increased use of ovulation-inducing drugs and assisted reproductive techniques. �e increase is also related to advanced mater-nal age, with the rate of dizygotic twinning peaking between 35 and 40 years of age, mainly in multiparous women. Heredity and a maternal history of twinning (either dizygotic or monozygotic) are particularly important for twinning, while the father’s history plays little or no part. Race is also a factor: the percentage of dizygotic twins is 1% in whites, lower in blacks and higher in Asians.
�ere are two kinds of twins. Dizygotic twins are the result of simultaneous fertilization of two di�erent oocytes by two di�erent spermatozoa. Monozygotic or identical twins result from duplication of a single conceptional product. As dizygotic twins originate from multiple ovulations, they re�ect the incidence of genetic and ethnic factors, whereas monozygotic twins result from duplication of a single zygote, with a constant frequency in all ethnic groups. Dizygotic twins have two di�erent placentas and amniotic membranes in two amniochorionic membranes (dichorionic twins). �ey are the same sex in 50% of cases. In monozygotic twins, who are always the same sex, placentation depends on the time of embryo duplication:
■ within 3–4 days a�er conception: dichorionic diamniotic; ■ between 3 and 9 days a�er conception: monochorionic diamniotic; ■ between 9 and 12 days a�er conception: monochorionic monoamniotic; ■ at ≥ 12 days a�er conception: Siamese or joined.
�e placenta can be mono- or dichorionic. Fetal risks increase in relation to mono-chorionicity and monoamnionicity. Fetal mortality is three times greater among twins than among singletons. �e fetal risk for cerebral palsy is eight times greater than in singletons and 47 times greater in triplets. Maternal risks, such as hypertension, postpartum haemorrhage and mortality, are twice as high as in a single pregnancy.
�e purposes of management are to:
■ prevent preterm birth; ■ identify growth alterations in one or both twins; ■ recognize correlated pathological conditions and, if necessary, treat them; ■ determine the timing and type of delivery.
IndicationsEarly diagnosis of multiple pregnancy is possible from the 5th to 6th week by ultra-sound scan. �e �nal diagnosis, however, relies on embryo individuation, which is possible from week 6–7.
Man
ual o
f dia
gnos
tic u
ltras
ound
– V
olum
e 2
978-9241548540-C002 PRF ml YVR ln ml ml-1-Final Proof.indd 76 6/10/13 10:34 AM
77
An ultrasound scan should be performed in the �rst trimester to:
■ visualize ovular implants (or gestational sacs) in the uterus and their number; ■ verify the presence of embryos or fetuses, their number and their cardiac activity; ■ date the pregnancy.
In the case of multiple pregnancies, chorionicity and amniocity should be evaluated.
PreparationPregnancy can be evaluated with transabdominal or transvaginal probes. The main advantage of transvaginal scan is the significant improvement in image resolution. For transabdominal scanning, a probe of at least 3.5 MHz should be used to scan through the abdominal wall, with a full bladder, at an early gesta-tional age. For the transvaginal scan, with an empty bladder, a high-frequency probe (at least 5 MHz) can be used because of the shorter distance between the transducer and the organ target, with a large increase in resolution. The two methods are, however, complementary. Transvaginal scan is preferred at early gestational ages (first trimester).
Normal �ndingsA twin pregnancy can be diagnosed from week 5 with a transabdominal or trans-vaginal probe to evaluate the number of intrauterine gestational sacs.
�e main aims of ultrasound scanning in the �rst trimester are:
■ pregnancy dating ■ evaluation of the number of embryos or fetuses ■ evaluation of fetal heartbeat ■ diagnosis of amnionicity and chorionicity ■ exclusion of early morphological anomalies ■ cervix evaluation.
In the second trimester, ultrasound is used for morphostructural examina-tions, fetal growth evaluation and cervix evaluation; and in the third trimester, ultrasound is used for fetal growth evaluation and assessment of fetal well-being (Doppler).
In multiple pregnancies, the determination of chorionicity, as a distinction between monochorionicity and dichorionicity, will di�erentiate between monozy-gotic and dizygotic twins.
�e accuracy of ultrasound scanning for diagnosing chorionicity is nearly 100% in the �rst trimester (14 weeks), but ultrasonographic determination is not always possible at an advanced gestational age, especially for a di�erential diagnosis of a
Obs
tetr
ics
978-9241548540-C002 PRF ml YVR ln ml ml-1-Final Proof.indd 77 6/10/13 10:34 AM
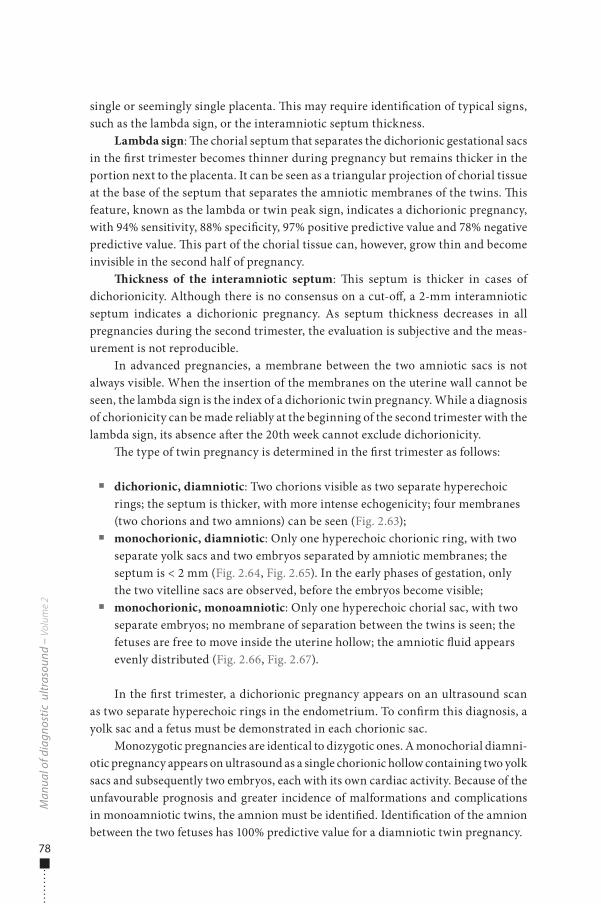
78
single or seemingly single placenta. �is may require identi�cation of typical signs, such as the lambda sign, or the interamniotic septum thickness.
Lambda sign: �e chorial septum that separates the dichorionic gestational sacs in the �rst trimester becomes thinner during pregnancy but remains thicker in the portion next to the placenta. It can be seen as a triangular projection of chorial tissue at the base of the septum that separates the amniotic membranes of the twins. �is feature, known as the lambda or twin peak sign, indicates a dichorionic pregnancy, with 94% sensitivity, 88% speci�city, 97% positive predictive value and 78% negative predictive value. �is part of the chorial tissue can, however, grow thin and become invisible in the second half of pregnancy.
�ickness of the interamniotic septum: �is septum is thicker in cases of dichorionicity. Although there is no consensus on a cut-o�, a 2-mm interamniotic septum indicates a dichorionic pregnancy. As septum thickness decreases in all pregnancies during the second trimester, the evaluation is subjective and the meas-urement is not reproducible.
In advanced pregnancies, a membrane between the two amniotic sacs is not always visible. When the insertion of the membranes on the uterine wall cannot be seen, the lambda sign is the index of a dichorionic twin pregnancy. While a diagnosis of chorionicity can be made reliably at the beginning of the second trimester with the lambda sign, its absence a�er the 20th week cannot exclude dichorionicity.
�e type of twin pregnancy is determined in the �rst trimester as follows:
■ dichorionic, diamniotic: Two chorions visible as two separate hyperechoic rings; the septum is thicker, with more intense echogenicity; four membranes (two chorions and two amnions) can be seen (Fig. 2.63);
■ monochorionic, diamniotic: Only one hyperechoic chorionic ring, with two separate yolk sacs and two embryos separated by amniotic membranes; the septum is < 2 mm (Fig. 2.64, Fig. 2.65). In the early phases of gestation, only the two vitelline sacs are observed, before the embryos become visible;
■ monochorionic, monoamniotic: Only one hyperechoic chorial sac, with two separate embryos; no membrane of separation between the twins is seen; the fetuses are free to move inside the uterine hollow; the amniotic �uid appears evenly distributed (Fig. 2.66, Fig. 2.67).
In the �rst trimester, a dichorionic pregnancy appears on an ultrasound scan as two separate hyperechoic rings in the endometrium. To con�rm this diagnosis, a yolk sac and a fetus must be demonstrated in each chorionic sac.
Monozygotic pregnancies are identical to dizygotic ones. A monochorial diamni-otic pregnancy appears on ultrasound as a single chorionic hollow containing two yolk sacs and subsequently two embryos, each with its own cardiac activity. Because of the unfavourable prognosis and greater incidence of malformations and complications in monoamniotic twins, the amnion must be identi�ed. Identi�cation of the amnion between the two fetuses has 100% predictive value for a diamniotic twin pregnancy.
Man
ual o
f dia
gnos
tic u
ltras
ound
– V
olum
e 2
978-9241548540-C002 PRF ml YVR ln ml ml-1-Final Proof.indd 78 6/10/13 10:34 AM
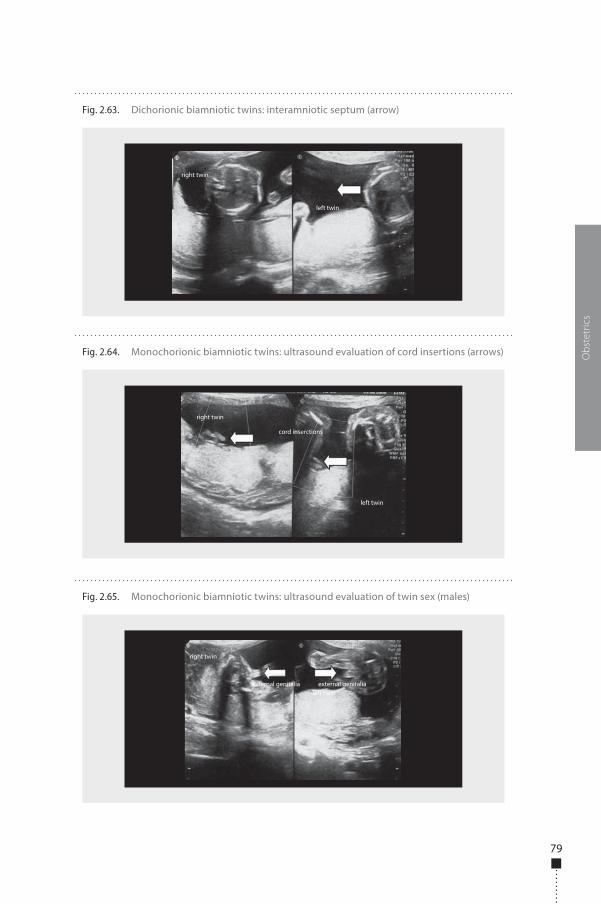
79
Obs
tetr
ics
Fig. 2.64. Monochorionic biamniotic twins: ultrasound evaluation of cord insertions (arrows)
right twin
left twin
cord inserctions
Fig. 2.65. Monochorionic biamniotic twins: ultrasound evaluation of twin sex (males)
right twin
left twinexternal genitalia external genitalia
Fig. 2.63. Dichorionic biamniotic twins: interamniotic septum (arrow)
right twin
left twin
978-9241548540-C002 PRF ml YVR ln ml ml-1-Final Proof.indd 79 6/10/13 10:34 AM
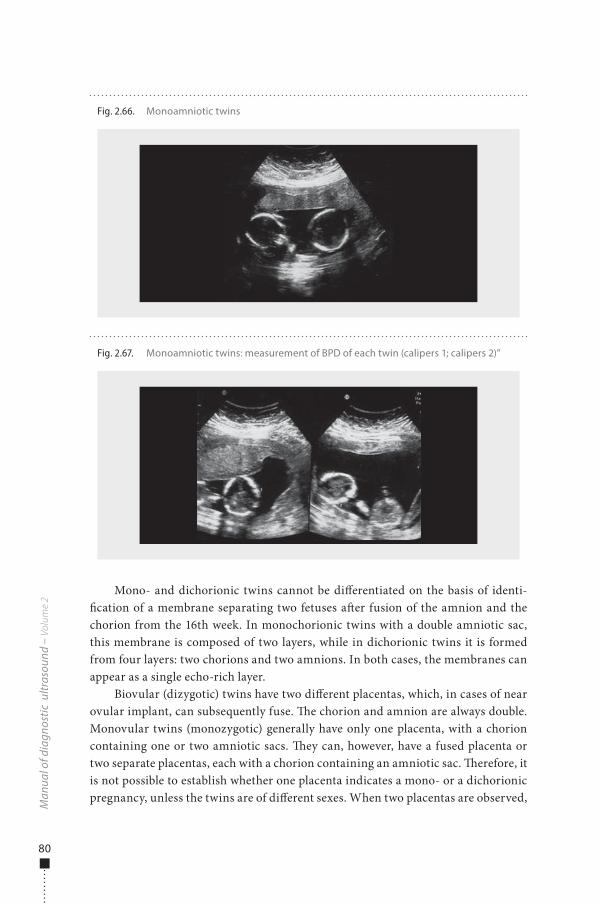
80
Mono- and dichorionic twins cannot be di�erentiated on the basis of identi-�cation of a membrane separating two fetuses a�er fusion of the amnion and the chorion from the 16th week. In monochorionic twins with a double amniotic sac, this membrane is composed of two layers, while in dichorionic twins it is formed from four layers: two chorions and two amnions. In both cases, the membranes can appear as a single echo-rich layer.
Biovular (dizygotic) twins have two di�erent placentas, which, in cases of near ovular implant, can subsequently fuse. �e chorion and amnion are always double. Monovular twins (monozygotic) generally have only one placenta, with a chorion containing one or two amniotic sacs. �ey can, however, have a fused placenta or two separate placentas, each with a chorion containing an amniotic sac. �erefore, it is not possible to establish whether one placenta indicates a mono- or a dichorionic pregnancy, unless the twins are of di�erent sexes. When two placentas are observed,
Man
ual o
f dia
gnos
tic u
ltras
ound
– V
olum
e 2
Fig. 2.67. Monoamniotic twins: measurement of BPD of each twin (calipers 1; calipers 2)”
Fig. 2.66. Monoamniotic twins
978-9241548540-C002 PRF ml YVR ln ml ml-1-Final Proof.indd 80 6/10/13 10:34 AM
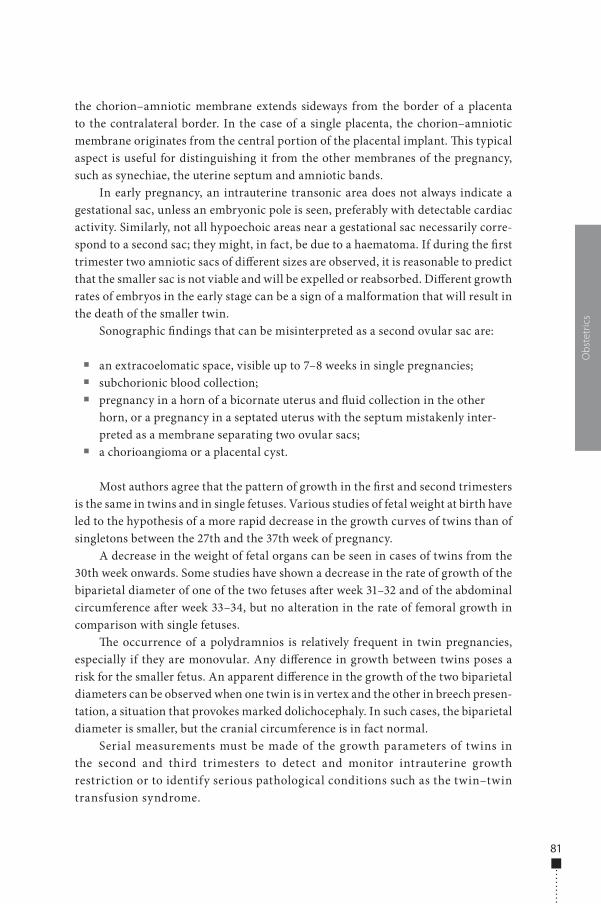
81
the chorion–amniotic membrane extends sideways from the border of a placenta to the contralateral border. In the case of a single placenta, the chorion–amniotic membrane originates from the central portion of the placental implant. �is typical aspect is useful for distinguishing it from the other membranes of the pregnancy, such as synechiae, the uterine septum and amniotic bands.
In early pregnancy, an intrauterine transonic area does not always indicate a gestational sac, unless an embryonic pole is seen, preferably with detectable cardiac activity. Similarly, not all hypoechoic areas near a gestational sac necessarily corre-spond to a second sac; they might, in fact, be due to a haematoma. If during the �rst trimester two amniotic sacs of di�erent sizes are observed, it is reasonable to predict that the smaller sac is not viable and will be expelled or reabsorbed. Di�erent growth rates of embryos in the early stage can be a sign of a malformation that will result in the death of the smaller twin.
Sonographic �ndings that can be misinterpreted as a second ovular sac are:
■ an extracoelomatic space, visible up to 7–8 weeks in single pregnancies; ■ subchorionic blood collection; ■ pregnancy in a horn of a bicornate uterus and �uid collection in the other
horn, or a pregnancy in a septated uterus with the septum mistakenly inter-preted as a membrane separating two ovular sacs;
■ a chorioangioma or a placental cyst.
Most authors agree that the pattern of growth in the �rst and second trimesters is the same in twins and in single fetuses. Various studies of fetal weight at birth have led to the hypothesis of a more rapid decrease in the growth curves of twins than of singletons between the 27th and the 37th week of pregnancy.
A decrease in the weight of fetal organs can be seen in cases of twins from the 30th week onwards. Some studies have shown a decrease in the rate of growth of the biparietal diameter of one of the two fetuses a�er week 31–32 and of the abdominal circumference a�er week 33–34, but no alteration in the rate of femoral growth in comparison with single fetuses.
�e occurrence of a polydramnios is relatively frequent in twin pregnancies, especially if they are monovular. Any di�erence in growth between twins poses a risk for the smaller fetus. An apparent di�erence in the growth of the two biparietal diameters can be observed when one twin is in vertex and the other in breech presen-tation, a situation that provokes marked dolichocephaly. In such cases, the biparietal diameter is smaller, but the cranial circumference is in fact normal.
Serial measurements must be made of the growth parameters of twins in the second and third trimesters to detect and monitor intrauterine growth restriction or to identify serious pathological conditions such as the twin–twin transfusion syndrome.
Obs
tetr
ics
978-9241548540-C002 PRF ml YVR ln ml ml-1-Final Proof.indd 81 6/10/13 10:34 AM
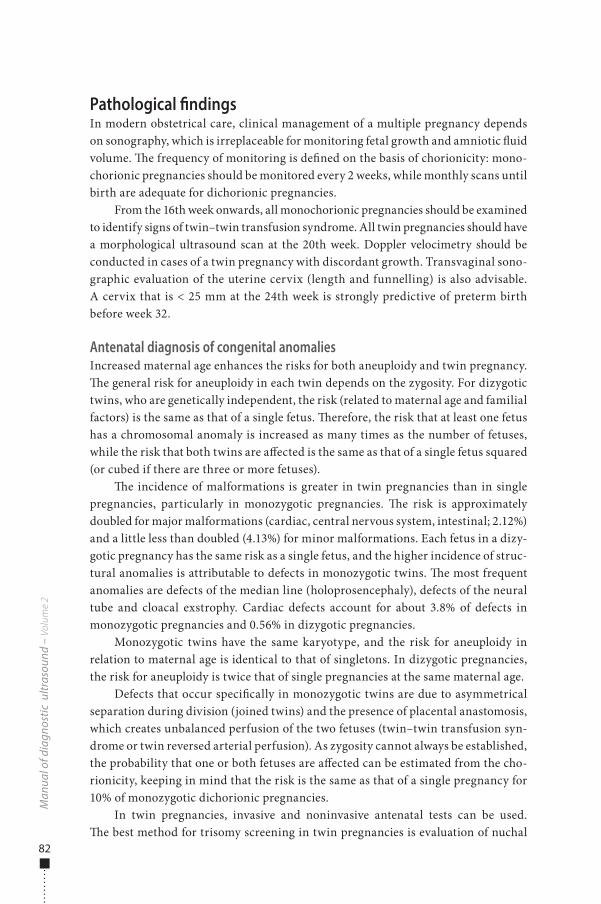
82
Pathological �ndingsIn modern obstetrical care, clinical management of a multiple pregnancy depends on sonography, which is irreplaceable for monitoring fetal growth and amniotic �uid volume. �e frequency of monitoring is de�ned on the basis of chorionicity: mono-chorionic pregnancies should be monitored every 2 weeks, while monthly scans until birth are adequate for dichorionic pregnancies.
From the 16th week onwards, all monochorionic pregnancies should be examined to identify signs of twin–twin transfusion syndrome. All twin pregnancies should have a morphological ultrasound scan at the 20th week. Doppler velocimetry should be conducted in cases of a twin pregnancy with discordant growth. Transvaginal sono-graphic evaluation of the uterine cervix (length and funnelling) is also advisable. A cervix that is < 25 mm at the 24th week is strongly predictive of preterm birth before week 32.
Antenatal diagnosis of congenital anomaliesIncreased maternal age enhances the risks for both aneuploidy and twin pregnancy. �e general risk for aneuploidy in each twin depends on the zygosity. For dizygotic twins, who are genetically independent, the risk (related to maternal age and familial factors) is the same as that of a single fetus. �erefore, the risk that at least one fetus has a chromosomal anomaly is increased as many times as the number of fetuses, while the risk that both twins are a�ected is the same as that of a single fetus squared (or cubed if there are three or more fetuses).
�e incidence of malformations is greater in twin pregnancies than in single pregnancies, particularly in monozygotic pregnancies. �e risk is approximately doubled for major malformations (cardiac, central nervous system, intestinal; 2.12%) and a little less than doubled (4.13%) for minor malformations. Each fetus in a dizy-gotic pregnancy has the same risk as a single fetus, and the higher incidence of struc-tural anomalies is attributable to defects in monozygotic twins. �e most frequent anomalies are defects of the median line (holoprosencephaly), defects of the neural tube and cloacal exstrophy. Cardiac defects account for about 3.8% of defects in monozygotic pregnancies and 0.56% in dizygotic pregnancies.
Monozygotic twins have the same karyotype, and the risk for aneuploidy in relation to maternal age is identical to that of singletons. In dizygotic pregnancies, the risk for aneuploidy is twice that of single pregnancies at the same maternal age.
Defects that occur speci�cally in monozygotic twins are due to asymmetrical separation during division (joined twins) and the presence of placental anastomosis, which creates unbalanced perfusion of the two fetuses (twin–twin transfusion syn-drome or twin reversed arterial perfusion). As zygosity cannot always be established, the probability that one or both fetuses are a�ected can be estimated from the cho-rionicity, keeping in mind that the risk is the same as that of a single pregnancy for 10% of monozygotic dichorionic pregnancies.
In twin pregnancies, invasive and noninvasive antenatal tests can be used. �e best method for trisomy screening in twin pregnancies is evaluation of nuchal
Man
ual o
f dia
gnos
tic u
ltras
ound
– V
olum
e 2
978-9241548540-C002 PRF ml YVR ln ml ml-1-Final Proof.indd 82 6/10/13 10:34 AM
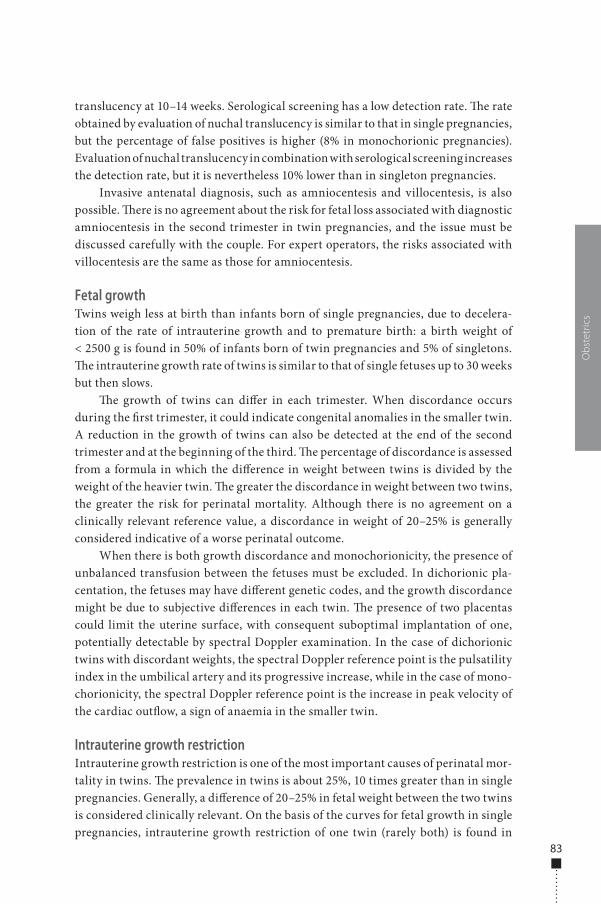
83
translucency at 10–14 weeks. Serological screening has a low detection rate. �e rate obtained by evaluation of nuchal translucency is similar to that in single pregnancies, but the percentage of false positives is higher (8% in monochorionic pregnancies). Evaluation of nuchal translucency in combination with serological screening increases the detection rate, but it is nevertheless 10% lower than in singleton pregnancies.
Invasive antenatal diagnosis, such as amniocentesis and villocentesis, is also possible. �ere is no agreement about the risk for fetal loss associated with diagnostic amniocentesis in the second trimester in twin pregnancies, and the issue must be discussed carefully with the couple. For expert operators, the risks associated with villocentesis are the same as those for amniocentesis.
Fetal growthTwins weigh less at birth than infants born of single pregnancies, due to decelera-tion of the rate of intrauterine growth and to premature birth: a birth weight of < 2500 g is found in 50% of infants born of twin pregnancies and 5% of singletons. �e intrauterine growth rate of twins is similar to that of single fetuses up to 30 weeks but then slows.
�e growth of twins can di�er in each trimester. When discordance occurs during the �rst trimester, it could indicate congenital anomalies in the smaller twin. A reduction in the growth of twins can also be detected at the end of the second trimester and at the beginning of the third. �e percentage of discordance is assessed from a formula in which the di�erence in weight between twins is divided by the weight of the heavier twin. �e greater the discordance in weight between two twins, the greater the risk for perinatal mortality. Although there is no agreement on a clinically relevant reference value, a discordance in weight of 20–25% is generally considered indicative of a worse perinatal outcome.
When there is both growth discordance and monochorionicity, the presence of unbalanced transfusion between the fetuses must be excluded. In dichorionic pla-centation, the fetuses may have di�erent genetic codes, and the growth discordance might be due to subjective di�erences in each twin. �e presence of two placentas could limit the uterine surface, with consequent suboptimal implantation of one, potentially detectable by spectral Doppler examination. In the case of dichorionic twins with discordant weights, the spectral Doppler reference point is the pulsatility index in the umbilical artery and its progressive increase, while in the case of mono-chorionicity, the spectral Doppler reference point is the increase in peak velocity of the cardiac out�ow, a sign of anaemia in the smaller twin.
Intrauterine growth restrictionIntrauterine growth restriction is one of the most important causes of perinatal mor-tality in twins. �e prevalence in twins is about 25%, 10 times greater than in single pregnancies. Generally, a di�erence of 20–25% in fetal weight between the two twins is considered clinically relevant. On the basis of the curves for fetal growth in single pregnancies, intrauterine growth restriction of one twin (rarely both) is found in
Obs
tetr
ics
978-9241548540-C002 PRF ml YVR ln ml ml-1-Final Proof.indd 83 6/10/13 10:34 AM
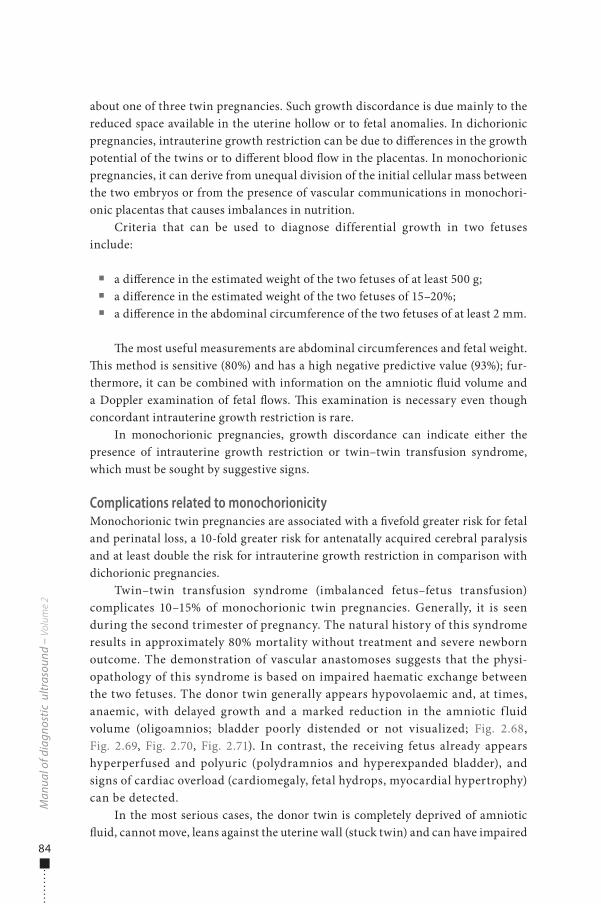
84
about one of three twin pregnancies. Such growth discordance is due mainly to the reduced space available in the uterine hollow or to fetal anomalies. In dichorionic pregnancies, intrauterine growth restriction can be due to di�erences in the growth potential of the twins or to di�erent blood �ow in the placentas. In monochorionic pregnancies, it can derive from unequal division of the initial cellular mass between the two embryos or from the presence of vascular communications in monochori-onic placentas that causes imbalances in nutrition.
Criteria that can be used to diagnose differential growth in two fetuses include:
■ a di�erence in the estimated weight of the two fetuses of at least 500 g; ■ a di�erence in the estimated weight of the two fetuses of 15–20%; ■ a di�erence in the abdominal circumference of the two fetuses of at least 2 mm.
�e most useful measurements are abdominal circumferences and fetal weight. �is method is sensitive (80%) and has a high negative predictive value (93%); fur-thermore, it can be combined with information on the amniotic �uid volume and a Doppler examination of fetal �ows. �is examination is necessary even though concordant intrauterine growth restriction is rare.
In monochorionic pregnancies, growth discordance can indicate either the presence of intrauterine growth restriction or twin–twin transfusion syndrome, which must be sought by suggestive signs.
Complications related to monochorionicityMonochorionic twin pregnancies are associated with a �vefold greater risk for fetal and perinatal loss, a 10-fold greater risk for antenatally acquired cerebral paralysis and at least double the risk for intrauterine growth restriction in comparison with dichorionic pregnancies.
Twin–twin transfusion syndrome (imbalanced fetus–fetus transfusion) complicates 10–15% of monochorionic twin pregnancies. Generally, it is seen during the second trimester of pregnancy. The natural history of this syndrome results in approximately 80% mortality without treatment and severe newborn outcome. The demonstration of vascular anastomoses suggests that the physi-opathology of this syndrome is based on impaired haematic exchange between the two fetuses. The donor twin generally appears hypovolaemic and, at times, anaemic, with delayed growth and a marked reduction in the amniotic f luid volume (oligoamnios; bladder poorly distended or not visualized; Fig. 2.68, Fig. 2.69, Fig. 2.70, Fig. 2.71). In contrast, the receiving fetus already appears hyperperfused and polyuric (polydramnios and hyperexpanded bladder), and signs of cardiac overload (cardiomegaly, fetal hydrops, myocardial hypertrophy) can be detected.
In the most serious cases, the donor twin is completely deprived of amniotic �uid, cannot move, leans against the uterine wall (stuck twin) and can have impaired
Man
ual o
f dia
gnos
tic u
ltras
ound
– V
olum
e 2
978-9241548540-C002 PRF ml YVR ln ml ml-1-Final Proof.indd 84 6/10/13 10:34 AM
85
Obs
tetr
ics
Fig. 2.68. Monochorionic biamniotic pregnancy complicated by twin–twin transfusion syndrome: di�erent fetal growth and di�erent amniotic �uid volume, with polyhydramnios of the recipient twin and oligoamnios of the donor twin
Fig. 2.69. Normal monochorionic biamniotic twins: no di�erences in bladder volumes (arrows)
Fig. 2.70. Twin–twin transfusion syndrome: di�erent bladder volumes (arrows)
right twin
bladderbladder
left twin
978-9241548540-C002 PRF ml YVR ln ml ml-1-Final Proof.indd 85 6/10/13 10:34 AM
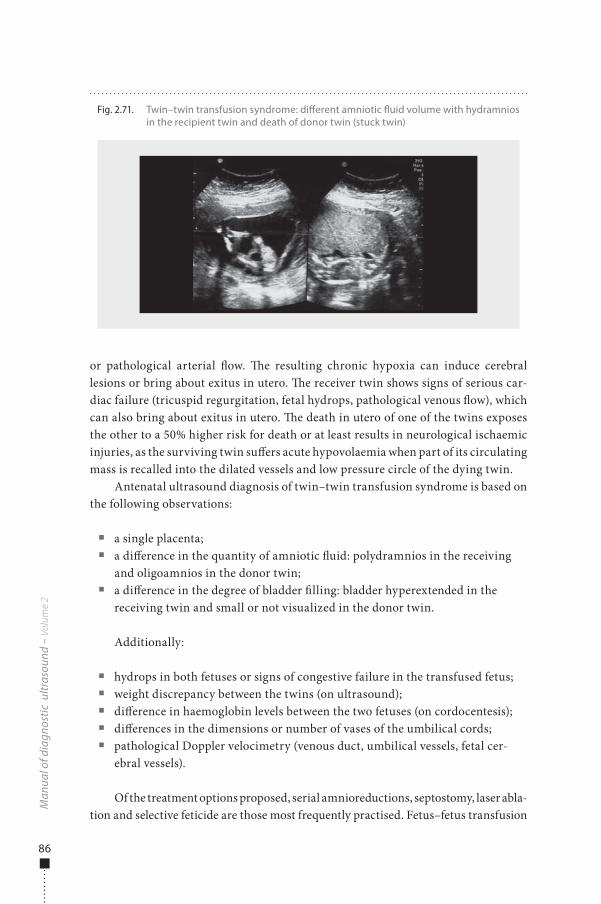
86
or pathological arterial �ow. �e resulting chronic hypoxia can induce cerebral lesions or bring about exitus in utero. �e receiver twin shows signs of serious car-diac failure (tricuspid regurgitation, fetal hydrops, pathological venous �ow), which can also bring about exitus in utero. �e death in utero of one of the twins exposes the other to a 50% higher risk for death or at least results in neurological ischaemic injuries, as the surviving twin su�ers acute hypovolaemia when part of its circulating mass is recalled into the dilated vessels and low pressure circle of the dying twin.
Antenatal ultrasound diagnosis of twin–twin transfusion syndrome is based on the following observations:
■ a single placenta; ■ a di�erence in the quantity of amniotic �uid: polydramnios in the receiving
and oligoamnios in the donor twin; ■ a di�erence in the degree of bladder �lling: bladder hyperextended in the
receiving twin and small or not visualized in the donor twin.
Additionally:
■ hydrops in both fetuses or signs of congestive failure in the transfused fetus; ■ weight discrepancy between the twins (on ultrasound); ■ di�erence in haemoglobin levels between the two fetuses (on cordocentesis); ■ di�erences in the dimensions or number of vases of the umbilical cords; ■ pathological Doppler velocimetry (venous duct, umbilical vessels, fetal cer-
ebral vessels).
Of the treatment options proposed, serial amnioreductions, septostomy, laser abla-tion and selective feticide are those most frequently practised. Fetus–fetus transfusion
Man
ual o
f dia
gnos
tic u
ltras
ound
– V
olum
e 2
Fig. 2.71. Twin–twin transfusion syndrome: di�erent amniotic �uid volume with hydramnios in the recipient twin and death of donor twin (stuck twin)
978-9241548540-C002 PRF ml YVR ln ml ml-1-Final Proof.indd 86 6/10/13 10:34 AM
87
can also occur acutely during labour. One of the two newborns will appear plethoric and the other strongly anaemic in a pregnancy without complications.
Fetal mortality in monoamniotic pregnancies is mainly due to twisting of the umbilical cord, which leads to fetal asphyxia. As fetal death is sudden and unpredict-able, close sonographic checks are necessary to verify fetal comfort, especially if the cords are already entangled. Twisting of the umbilical cords occurs early in pregnancy, during the �rst or second trimester, when the fetuses can move freely within the uterus. In monochorionic monoamniotic pregnancies, in which the cords have a close placen-tal insertion and there may be some large-calibre vascular anastomoses between the two fetal circulations, acute episodes of haemodynamic failure can also occur.
Intrauterine twin death�e incidence of death in twin pregnancies is greater in the �rst trimester than at birth. It has been estimated that about 12% of pregnancies are multiple at conception but only 2% evolve to twin births. About 20–70% of pregnancies diagnosed as twin in the �rst trimester result in a vanishing twin. In such cases, the prognosis of the surviving twin is good, although the risk for miscarriage is greater, particularly in monochorionic pregnancies.
�e outcome of the surviving twin is poorer if one fetus is lost at a more advanced stage of pregnancy, particularly in the third trimester. �e risk is estimated to be about 6% (about 8% in monochorionicity and about 4% in dichorionicity). �e risk of death for the surviving twin reaches 30% and the risk for cerebral paralysis has been estimated variously to be 10–46% in monochorionic twins; in dichorionic twins, the outcome is favourable except for cases of congenital anomalies. �e mechanism of the damage in the surviving twin is acute haemodynamic failure (hypotension and ischaemia) consequent to the passage of blood towards the vascular bed of the dead twin through the placental anastomosis.
Clinical management of such pregnancies is not simple. �e most important ele-ments are chorionicity and gestational age. In cases of dichorionicity, an immediate intervention is not necessary if the cause is established, and wait-and-see manage-ment associated with careful maternal and fetal monitoring shows no signi�cant di�erences in terms of weeks and weight at birth of the surviving twin from interven-tional management. Moreover, in the presence of acute twin–twin transfusion syn-drome, delivery immediately a�er the death of a twin does not prevent the ischaemic complications for the central nervous system of the surviving twin. Management greatly depends on gestational age, as delivery of the healthy twin at an early stage of pregnancy has little justi�cation. If the cause of a twin’s death in utero might also compromise the other (for instance, pre-eclampsia or chorioamniotitis), manage-ment must be adapted to avoid loss of the survivor. In monochorionic twin pregnan-cies, the risk for neurological damage can be monitored during the pregnancy with ultrasound or MRI. Evidence of a serious anaemic state is a poor prognosis, but the advantages of transfusion in utero through cordocentesis have not been clearly
Obs
tetr
ics
978-9241548540-C002 PRF ml YVR ln ml ml-1-Final Proof.indd 87 6/10/13 10:34 AM
88
demonstrated. Doppler measurement of peak velocity in the middle cerebral artery has been proposed as a noninvasive index for evaluating fetal anaemia.
Twin reversed arterial perfusion sequence�e twin reversed arterial perfusion sequence, also called the acardiac twin syn-drome, is a rare disease that occurs in about 1% of monochorionic pregnancies. It is considered to be an extreme example of haemodynamic anomaly in a twin preg-nancy with a single placenta: the acardiac twin receives blood into the umbilical artery through a large arterio-arterial anastomosis that allows the passage of blood from the umbilical artery of the twin cardiac donor (pump twin).
On colour Doppler, the cord of the perfused twin is composed of only two ves-sels, a single artery and a vein (there are only rarely two arteries), for arterial �ow from the placenta to the fetus and venous �ow from the fetus to the placenta. �e perfused twin receives poorly oxygenated blood, which is distributed particularly to the iliac district; the a�ected twin’s organs show anomalies that are probably due to hypoxic injuries, and the heart is completely absent or rudimentary. �e cephalic extremity is usually absent (acardiac–acephalus twin), as are the upper extremities, while the lower part of the trunk is usually present. �e acardiac twin o�en develops oedema and appears to be double the size of the other. Due to congestive cardiac failure and hydrops or as a result of prematurity induced by polydramnios, up to 50% of cardiac twins die during the perinatal period.
Joined twinsJoined twins occur in one of every 50 000 pregnancies. �e cause is late, incomplete division of the embryonic disc around day 15–17 a�er conception. �e twins are always monozygotic, monochorionic and monoamniotic. A diagnosis is based on the �nding of a monochorionic monoamniotic pregnancy without separation of the vascular systems of the two fetuses.
If the two fetal heads are close to one another, there is a strong probability of Siamese twins, although the absence of this �nding does not exclude the diagnosis. When the two twins are almost entirely formed, the point of union is o�en the ante-rior surface of the chest (thoracopagus) or more rarely the abdomen (omphalopagus), the back (pygopagus), the skull (craniopagus) or the pelvis (ischiopagus). When the duplication is less complete, the point of union is o�en lateral.
�e survival of such twins is related to the gestational age at birth and the type of connection between the fetuses. In cases of extensive cardiovascular connections, the death of at least one twin is inevitable (Fig. 2.72).
Man
ual o
f dia
gnos
tic u
ltras
ound
– V
olum
e 2
978-9241548540-C002 PRF ml YVR ln ml ml-1-Final Proof.indd 88 6/10/13 10:34 AM
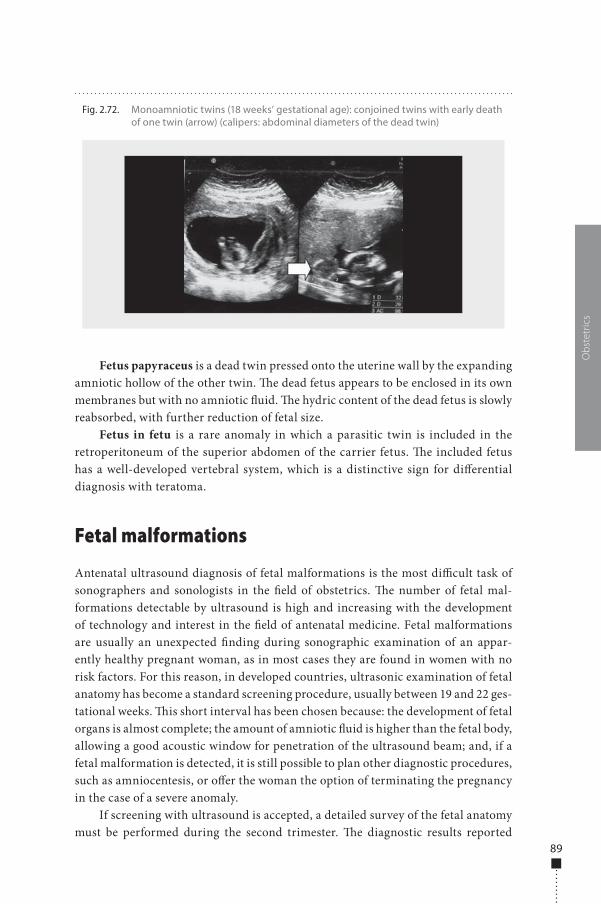
89
Fetus papyraceus is a dead twin pressed onto the uterine wall by the expanding amniotic hollow of the other twin. �e dead fetus appears to be enclosed in its own membranes but with no amniotic �uid. �e hydric content of the dead fetus is slowly reabsorbed, with further reduction of fetal size.
Fetus in fetu is a rare anomaly in which a parasitic twin is included in the retroperitoneum of the superior abdomen of the carrier fetus. �e included fetus has a well-developed vertebral system, which is a distinctive sign for di�erential diagnosis with teratoma.
Fetal malformations
Antenatal ultrasound diagnosis of fetal malformations is the most di�cult task of sonographers and sonologists in the �eld of obstetrics. �e number of fetal mal-formations detectable by ultrasound is high and increasing with the development of technology and interest in the �eld of antenatal medicine. Fetal malformations are usually an unexpected �nding during sonographic examination of an appar-ently healthy pregnant woman, as in most cases they are found in women with no risk factors. For this reason, in developed countries, ultrasonic examination of fetal anatomy has become a standard screening procedure, usually between 19 and 22 ges-tational weeks. �is short interval has been chosen because: the development of fetal organs is almost complete; the amount of amniotic �uid is higher than the fetal body, allowing a good acoustic window for penetration of the ultrasound beam; and, if a fetal malformation is detected, it is still possible to plan other diagnostic procedures, such as amniocentesis, or o�er the woman the option of terminating the pregnancy in the case of a severe anomaly.
If screening with ultrasound is accepted, a detailed survey of the fetal anatomy must be performed during the second trimester. �e diagnostic results reported
Obs
tetr
ics
Fig. 2.72. Monoamniotic twins (18 weeks’ gestational age): conjoined twins with early death of one twin (arrow) (calipers: abdominal diameters of the dead twin)
978-9241548540-C002 PRF ml YVR ln ml ml-1-Final Proof.indd 89 6/10/13 10:34 AM
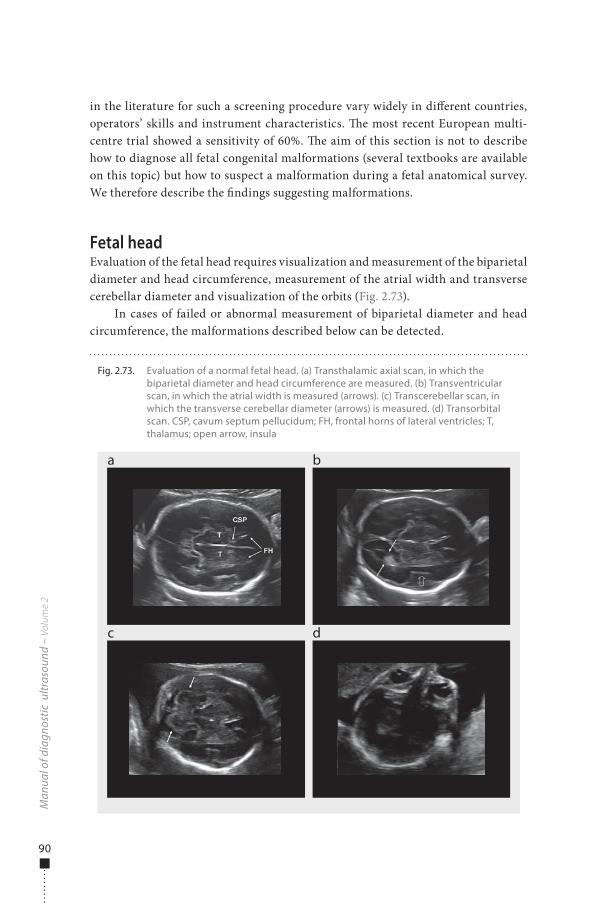
90
in the literature for such a screening procedure vary widely in di�erent countries, operators’ skills and instrument characteristics. �e most recent European multi-centre trial showed a sensitivity of 60%. �e aim of this section is not to describe how to diagnose all fetal congenital malformations (several textbooks are available on this topic) but how to suspect a malformation during a fetal anatomical survey. We therefore describe the �ndings suggesting malformations.
Fetal headEvaluation of the fetal head requires visualization and measurement of the biparietal diameter and head circumference, measurement of the atrial width and transverse cerebellar diameter and visualization of the orbits (Fig. 2.73).
In cases of failed or abnormal measurement of biparietal diameter and head circumference, the malformations described below can be detected.
Man
ual o
f dia
gnos
tic u
ltras
ound
– V
olum
e 2
Fig. 2.73. Evaluation of a normal fetal head. (a) Transthalamic axial scan, in which the biparietal diameter and head circumference are measured. (b) Transventricular scan, in which the atrial width is measured (arrows). (c) Transcerebellar scan, in which the transverse cerebellar diameter (arrows) is measured. (d) Transorbital scan. CSP, cavum septum pellucidum; FH, frontal horns of lateral ventricles; T, thalamus; open arrow, insula
a
c
b
d
978-9241548540-C002 PRF ml YVR ln ml ml-1-Final Proof.indd 90 6/10/13 10:34 AM
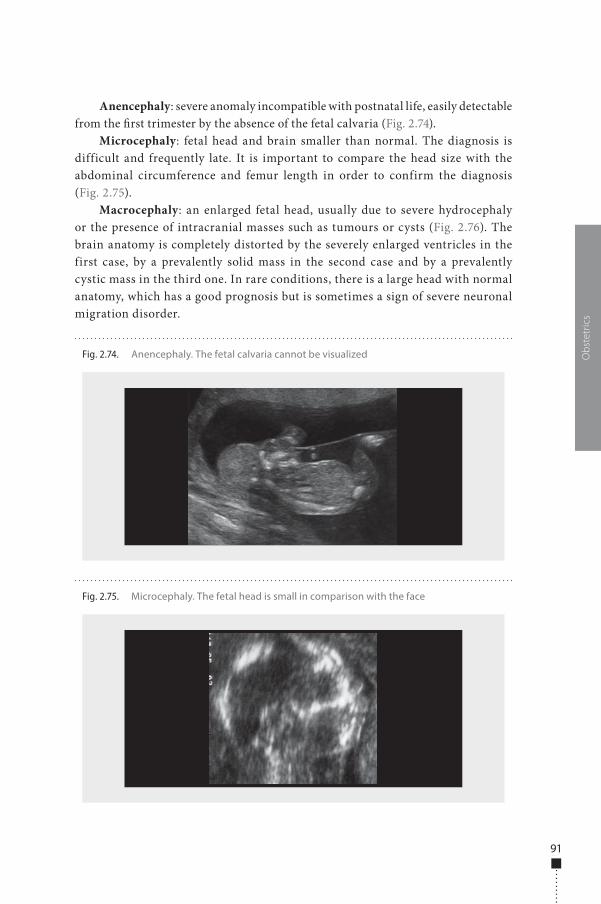
91
Anencephaly: severe anomaly incompatible with postnatal life, easily detectable from the �rst trimester by the absence of the fetal calvaria (Fig. 2.74).
Microcephaly: fetal head and brain smaller than normal. The diagnosis is difficult and frequently late. It is important to compare the head size with the abdominal circumference and femur length in order to confirm the diagnosis (Fig. 2.75).
Macrocephaly: an enlarged fetal head, usually due to severe hydrocephaly or the presence of intracranial masses such as tumours or cysts (Fig. 2.76). The brain anatomy is completely distorted by the severely enlarged ventricles in the first case, by a prevalently solid mass in the second case and by a prevalently cystic mass in the third one. In rare conditions, there is a large head with normal anatomy, which has a good prognosis but is sometimes a sign of severe neuronal migration disorder.
Obs
tetr
ics
Fig. 2.74. Anencephaly. The fetal calvaria cannot be visualized
Fig. 2.75. Microcephaly. The fetal head is small in comparison with the face
978-9241548540-C002 PRF ml YVR ln ml ml-1-Final Proof.indd 91 6/10/13 10:34 AM
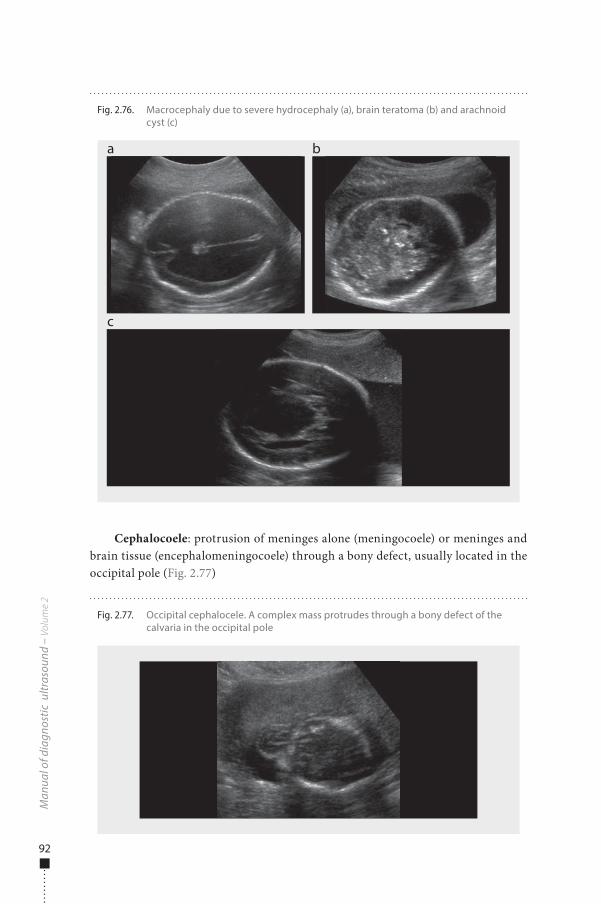
92
Cephalocoele: protrusion of meninges alone (meningocoele) or meninges and brain tissue (encephalomeningocoele) through a bony defect, usually located in the occipital pole (Fig. 2.77)
Man
ual o
f dia
gnos
tic u
ltras
ound
– V
olum
e 2
Fig. 2.77. Occipital cephalocele. A complex mass protrudes through a bony defect of the calvaria in the occipital pole
Fig. 2.76. Macrocephaly due to severe hydrocephaly (a), brain teratoma (b) and arachnoid cyst (c)
a
c
b
978-9241548540-C002 PRF ml YVR ln ml ml-1-Final Proof.indd 92 6/10/13 10:34 AM
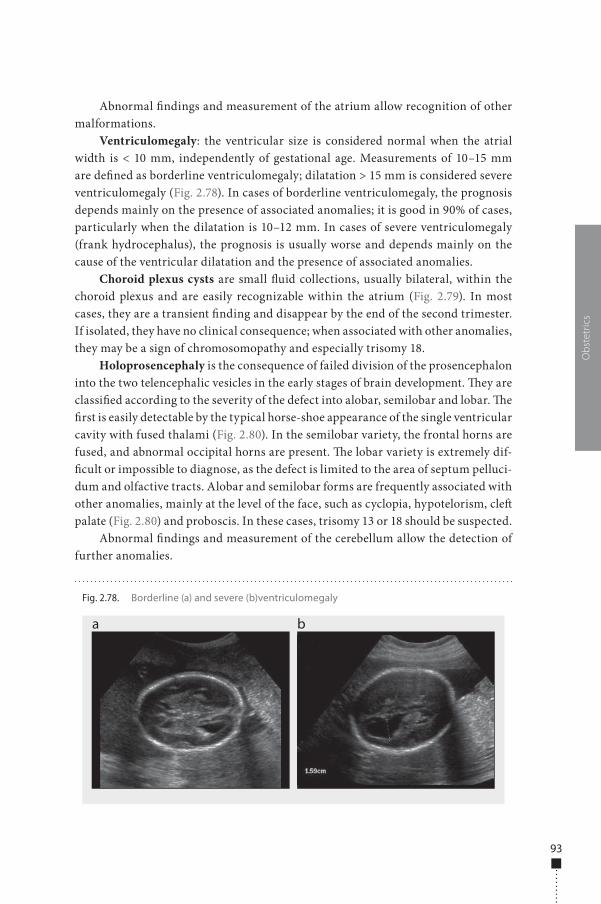
93
Abnormal �ndings and measurement of the atrium allow recognition of other malformations.
Ventriculomegaly: the ventricular size is considered normal when the atrial width is < 10 mm, independently of gestational age. Measurements of 10–15 mm are de�ned as borderline ventriculomegaly; dilatation > 15 mm is considered severe ventriculomegaly (Fig. 2.78). In cases of borderline ventriculomegaly, the prognosis depends mainly on the presence of associated anomalies; it is good in 90% of cases, particularly when the dilatation is 10–12 mm. In cases of severe ventriculomegaly (frank hydrocephalus), the prognosis is usually worse and depends mainly on the cause of the ventricular dilatation and the presence of associated anomalies.
Choroid plexus cysts are small �uid collections, usually bilateral, within the choroid plexus and are easily recognizable within the atrium (Fig. 2.79). In most cases, they are a transient �nding and disappear by the end of the second trimester. If isolated, they have no clinical consequence; when associated with other anomalies, they may be a sign of chromosomopathy and especially trisomy 18.
Holoprosencephaly is the consequence of failed division of the prosencephalon into the two telencephalic vesicles in the early stages of brain development. �ey are classi�ed according to the severity of the defect into alobar, semilobar and lobar. �e �rst is easily detectable by the typical horse-shoe appearance of the single ventricular cavity with fused thalami (Fig. 2.80). In the semilobar variety, the frontal horns are fused, and abnormal occipital horns are present. �e lobar variety is extremely dif-�cult or impossible to diagnose, as the defect is limited to the area of septum pelluci-dum and olfactive tracts. Alobar and semilobar forms are frequently associated with other anomalies, mainly at the level of the face, such as cyclopia, hypotelorism, cle� palate (Fig. 2.80) and proboscis. In these cases, trisomy 13 or 18 should be suspected.
Abnormal �ndings and measurement of the cerebellum allow the detection of further anomalies.
Obs
tetr
ics
Fig. 2.78. Borderline (a) and severe (b)ventriculomegaly
a b
978-9241548540-C002 PRF ml YVR ln ml ml-1-Final Proof.indd 93 6/10/13 10:34 AM
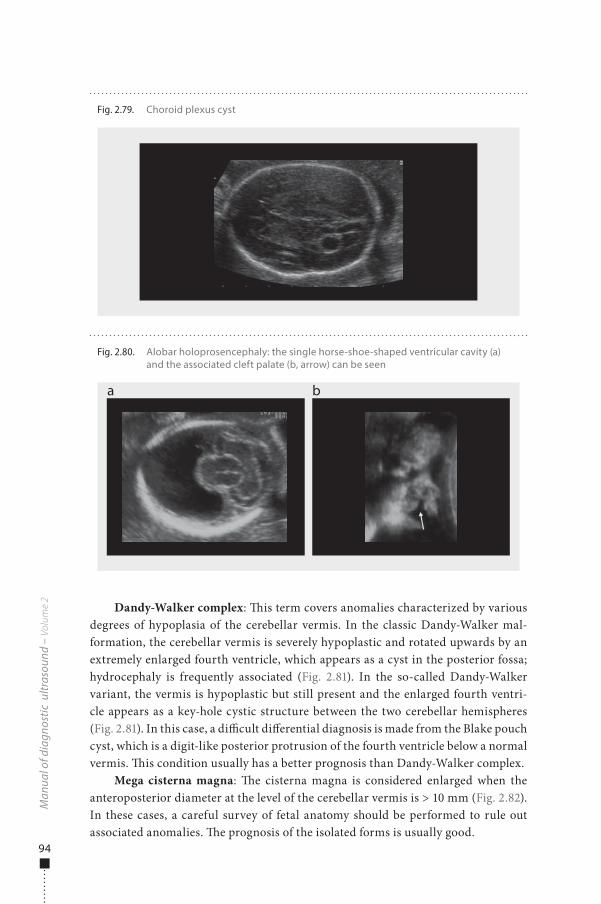
94
Dandy-Walker complex: �is term covers anomalies characterized by various degrees of hypoplasia of the cerebellar vermis. In the classic Dandy-Walker mal-formation, the cerebellar vermis is severely hypoplastic and rotated upwards by an extremely enlarged fourth ventricle, which appears as a cyst in the posterior fossa; hydrocephaly is frequently associated (Fig. 2.81). In the so-called Dandy-Walker variant, the vermis is hypoplastic but still present and the enlarged fourth ventri-cle appears as a key-hole cystic structure between the two cerebellar hemispheres (Fig. 2.81). In this case, a di�cult di�erential diagnosis is made from the Blake pouch cyst, which is a digit-like posterior protrusion of the fourth ventricle below a normal vermis. �is condition usually has a better prognosis than Dandy-Walker complex.
Mega cisterna magna: �e cisterna magna is considered enlarged when the anteroposterior diameter at the level of the cerebellar vermis is > 10 mm (Fig. 2.82). In these cases, a careful survey of fetal anatomy should be performed to rule out associated anomalies. �e prognosis of the isolated forms is usually good.
Man
ual o
f dia
gnos
tic u
ltras
ound
– V
olum
e 2
Fig. 2.80. Alobar holoprosencephaly: the single horse-shoe-shaped ventricular cavity (a) and the associated cleft palate (b, arrow) can be seen
a b
Fig. 2.79. Choroid plexus cyst
978-9241548540-C002 PRF ml YVR ln ml ml-1-Final Proof.indd 94 6/10/13 10:34 AM
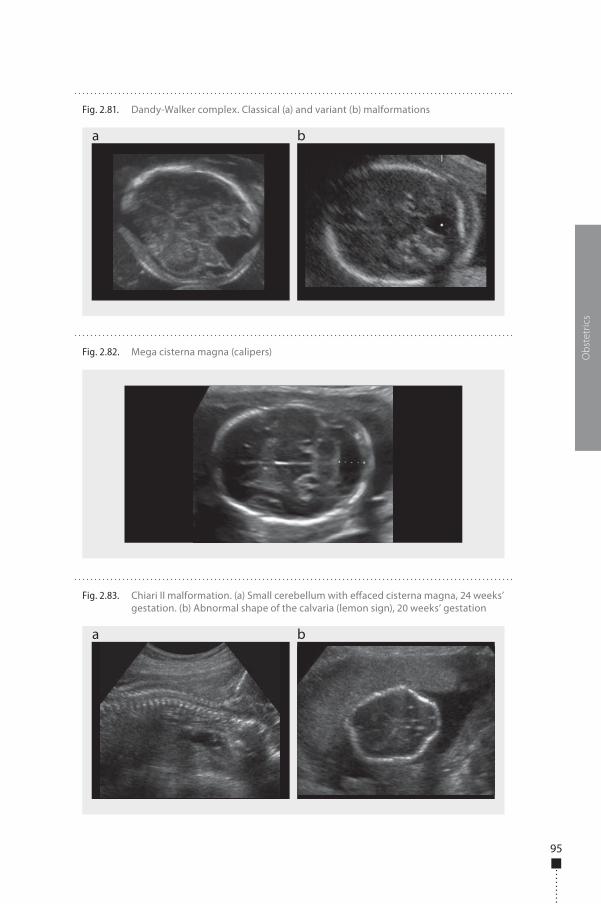
95
Obs
tetr
ics
Fig. 2.82. Mega cisterna magna (calipers)
Fig. 2.83. Chiari II malformation. (a) Small cerebellum with e�aced cisterna magna, 24 weeks’ gestation. (b) Abnormal shape of the calvaria (lemon sign), 20 weeks’ gestation
a b
Fig. 2.81. Dandy-Walker complex. Classical (a) and variant (b) malformations
a b
978-9241548540-C002 PRF ml YVR ln ml ml-1-Final Proof.indd 95 6/10/13 10:34 AM
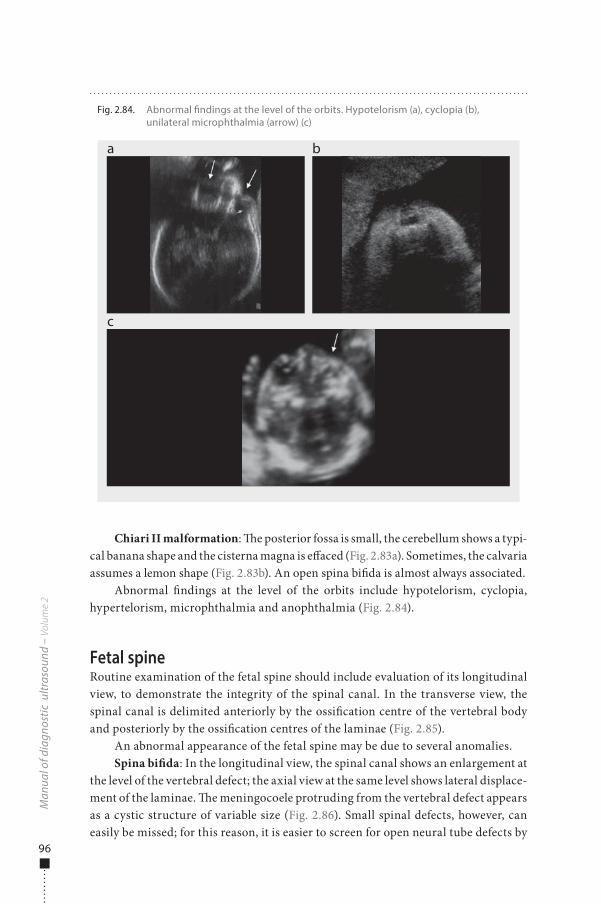
96
Chiari II malformation: �e posterior fossa is small, the cerebellum shows a typi-cal banana shape and the cisterna magna is e�aced (Fig. 2.83a). Sometimes, the calvaria assumes a lemon shape (Fig. 2.83b). An open spina bi�da is almost always associated.
Abnormal �ndings at the level of the orbits include hypotelorism, cyclopia, hypertelorism, microphthalmia and anophthalmia (Fig. 2.84).
Fetal spineRoutine examination of the fetal spine should include evaluation of its longitudinal view, to demonstrate the integrity of the spinal canal. In the transverse view, the spinal canal is delimited anteriorly by the ossi�cation centre of the vertebral body and posteriorly by the ossi�cation centres of the laminae (Fig. 2.85).
An abnormal appearance of the fetal spine may be due to several anomalies.Spina bi�da: In the longitudinal view, the spinal canal shows an enlargement at
the level of the vertebral defect; the axial view at the same level shows lateral displace-ment of the laminae. �e meningocoele protruding from the vertebral defect appears as a cystic structure of variable size (Fig. 2.86). Small spinal defects, however, can easily be missed; for this reason, it is easier to screen for open neural tube defects by
Man
ual o
f dia
gnos
tic u
ltras
ound
– V
olum
e 2
Fig. 2.84. Abnormal �ndings at the level of the orbits. Hypotelorism (a), cyclopia (b), unilateral microphthalmia (arrow) (c)
a
c
b
978-9241548540-C002 PRF ml YVR ln ml ml-1-Final Proof.indd 96 6/10/13 10:35 AM
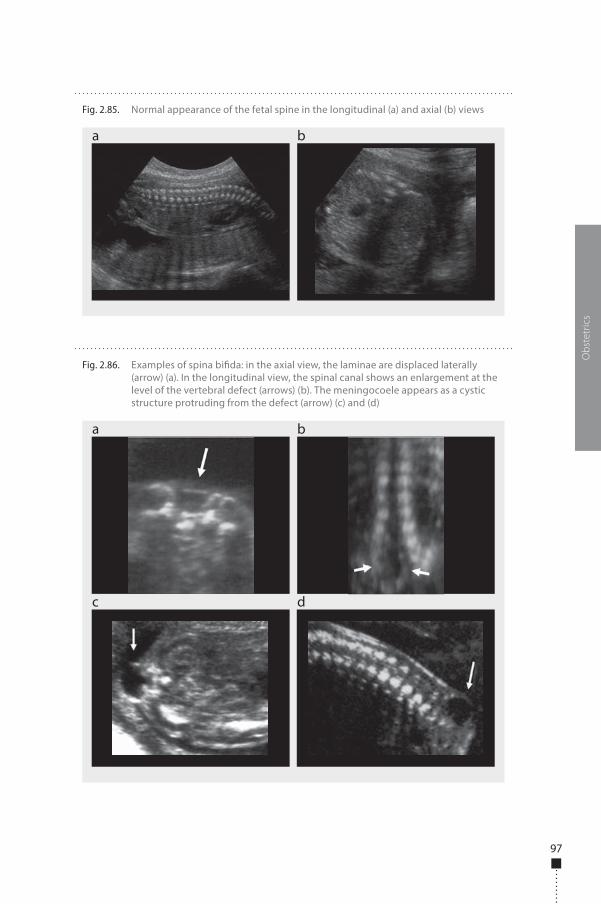
97
Obs
tetr
ics
Fig. 2.86. Examples of spina bi�da: in the axial view, the laminae are displaced laterally (arrow) (a). In the longitudinal view, the spinal canal shows an enlargement at the level of the vertebral defect (arrows) (b). The meningocoele appears as a cystic structure protruding from the defect (arrow) (c) and (d)
a
c d
b
Fig. 2.85. Normal appearance of the fetal spine in the longitudinal (a) and axial (b) views
a b
978-9241548540-C002 PRF ml YVR ln ml ml-1-Final Proof.indd 97 6/10/13 10:35 AM
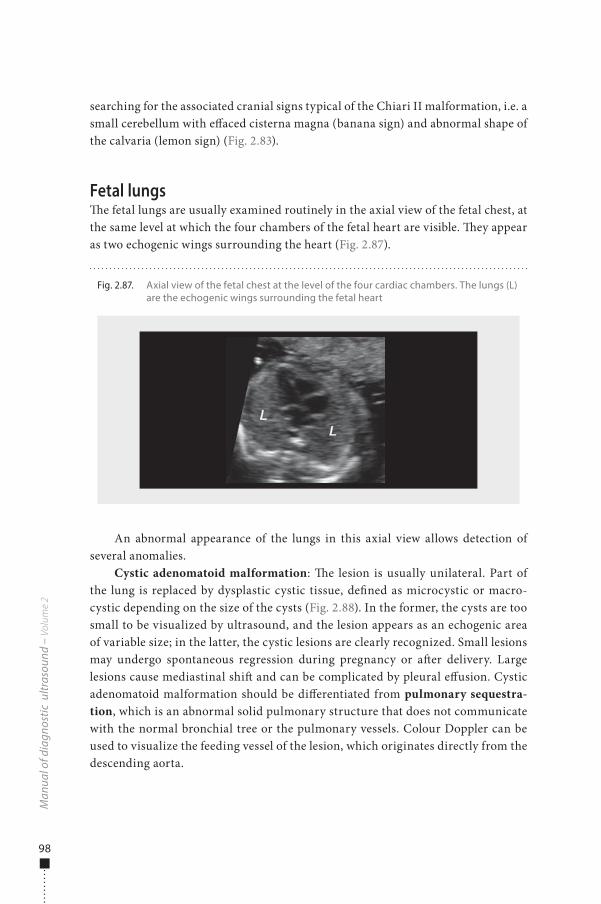
98
searching for the associated cranial signs typical of the Chiari II malformation, i.e. a small cerebellum with e�aced cisterna magna (banana sign) and abnormal shape of the calvaria (lemon sign) (Fig. 2.83).
Fetal lungs�e fetal lungs are usually examined routinely in the axial view of the fetal chest, at the same level at which the four chambers of the fetal heart are visible. �ey appear as two echogenic wings surrounding the heart (Fig. 2.87).
An abnormal appearance of the lungs in this axial view allows detection of several anomalies.
Cystic adenomatoid malformation: �e lesion is usually unilateral. Part of the lung is replaced by dysplastic cystic tissue, de�ned as microcystic or macro-cystic depending on the size of the cysts (Fig. 2.88). In the former, the cysts are too small to be visualized by ultrasound, and the lesion appears as an echogenic area of variable size; in the latter, the cystic lesions are clearly recognized. Small lesions may undergo spontaneous regression during pregnancy or a�er delivery. Large lesions cause mediastinal shi� and can be complicated by pleural e�usion. Cystic adenomatoid malformation should be di�erentiated from pulmonary sequestra-tion, which is an abnormal solid pulmonary structure that does not communicate with the normal bronchial tree or the pulmonary vessels. Colour Doppler can be used to visualize the feeding vessel of the lesion, which originates directly from the descending aorta.
Man
ual o
f dia
gnos
tic u
ltras
ound
– V
olum
e 2
Fig. 2.87. Axial view of the fetal chest at the level of the four cardiac chambers. The lungs (L) are the echogenic wings surrounding the fetal heart
978-9241548540-C002 PRF ml YVR ln ml ml-1-Final Proof.indd 98 6/10/13 10:35 AM
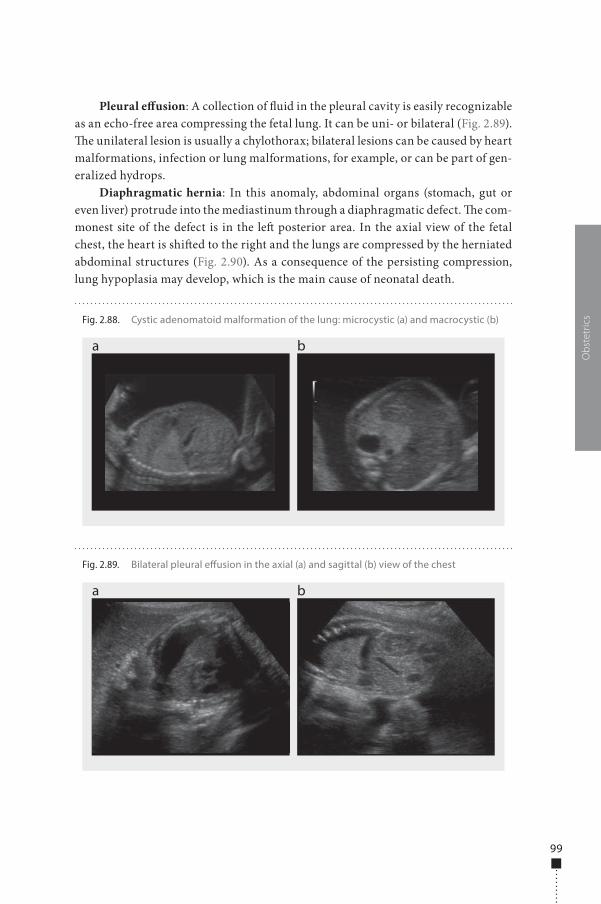
99
Pleural e�usion: A collection of �uid in the pleural cavity is easily recognizable as an echo-free area compressing the fetal lung. It can be uni- or bilateral (Fig. 2.89). �e unilateral lesion is usually a chylothorax; bilateral lesions can be caused by heart malformations, infection or lung malformations, for example, or can be part of gen-eralized hydrops.
Diaphragmatic hernia: In this anomaly, abdominal organs (stomach, gut or even liver) protrude into the mediastinum through a diaphragmatic defect. �e com-monest site of the defect is in the le� posterior area. In the axial view of the fetal chest, the heart is shi�ed to the right and the lungs are compressed by the herniated abdominal structures (Fig. 2.90). As a consequence of the persisting compression, lung hypoplasia may develop, which is the main cause of neonatal death.
Obs
tetr
ics
Fig. 2.89. Bilateral pleural e�usion in the axial (a) and sagittal (b) view of the chest
a b
Fig. 2.88. Cystic adenomatoid malformation of the lung: microcystic (a) and macrocystic (b)
a b
978-9241548540-C002 PRF ml YVR ln ml ml-1-Final Proof.indd 99 6/10/13 10:35 AM
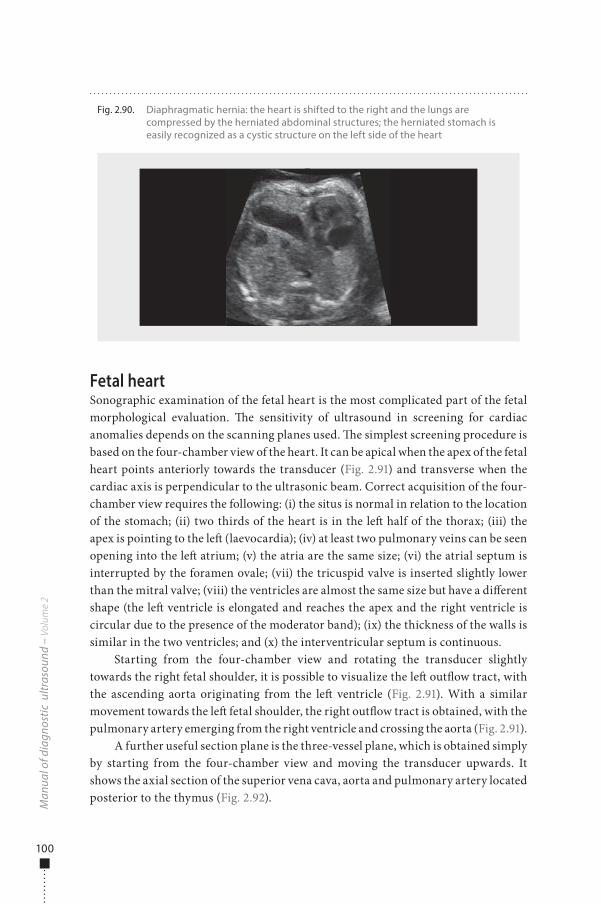
100
Fetal heartSonographic examination of the fetal heart is the most complicated part of the fetal morphological evaluation. �e sensitivity of ultrasound in screening for cardiac anomalies depends on the scanning planes used. �e simplest screening procedure is based on the four-chamber view of the heart. It can be apical when the apex of the fetal heart points anteriorly towards the transducer (Fig. 2.91) and transverse when the cardiac axis is perpendicular to the ultrasonic beam. Correct acquisition of the four-chamber view requires the following: (i) the situs is normal in relation to the location of the stomach; (ii) two thirds of the heart is in the le� half of the thorax; (iii) the apex is pointing to the le� (laevocardia); (iv) at least two pulmonary veins can be seen opening into the le� atrium; (v) the atria are the same size; (vi) the atrial septum is interrupted by the foramen ovale; (vii) the tricuspid valve is inserted slightly lower than the mitral valve; (viii) the ventricles are almost the same size but have a di�erent shape (the le� ventricle is elongated and reaches the apex and the right ventricle is circular due to the presence of the moderator band); (ix) the thickness of the walls is similar in the two ventricles; and (x) the interventricular septum is continuous.
Starting from the four-chamber view and rotating the transducer slightly towards the right fetal shoulder, it is possible to visualize the le� out�ow tract, with the ascending aorta originating from the le� ventricle (Fig. 2.91). With a similar movement towards the le� fetal shoulder, the right out�ow tract is obtained, with the pulmonary artery emerging from the right ventricle and crossing the aorta (Fig. 2.91).
A further useful section plane is the three-vessel plane, which is obtained simply by starting from the four-chamber view and moving the transducer upwards. It shows the axial section of the superior vena cava, aorta and pulmonary artery located posterior to the thymus (Fig. 2.92).
Man
ual o
f dia
gnos
tic u
ltras
ound
– V
olum
e 2
Fig. 2.90. Diaphragmatic hernia: the heart is shifted to the right and the lungs are compressed by the herniated abdominal structures; the herniated stomach is easily recognized as a cystic structure on the left side of the heart
978-9241548540-C002 PRF ml YVR ln ml ml-1-Final Proof.indd 100 6/10/13 10:35 AM
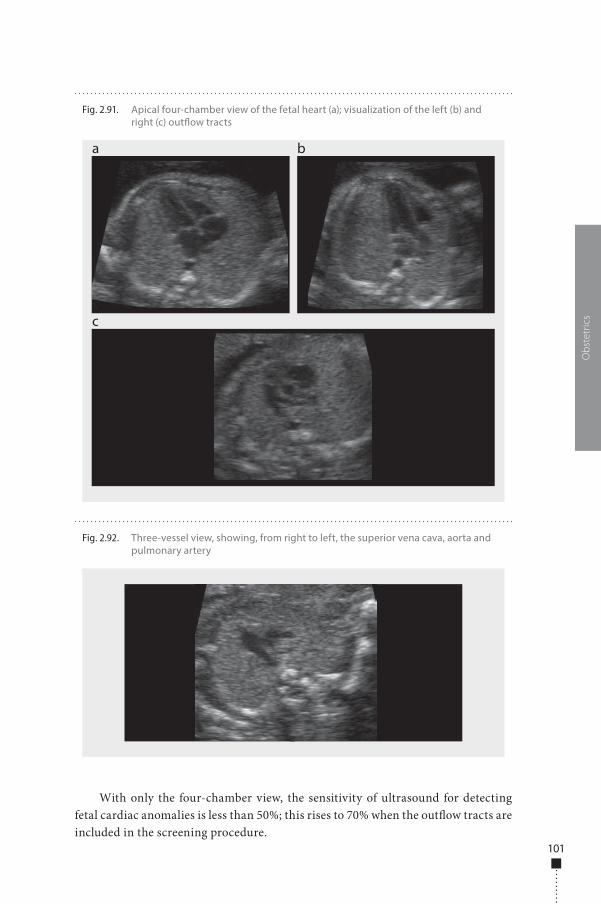
101
With only the four-chamber view, the sensitivity of ultrasound for detecting fetal cardiac anomalies is less than 50%; this rises to 70% when the out�ow tracts are included in the screening procedure.
Obs
tetr
ics
Fig. 2.92. Three-vessel view, showing, from right to left, the superior vena cava, aorta and pulmonary artery
Fig. 2.91. Apical four-chamber view of the fetal heart (a); visualization of the left (b) and right (c) out�ow tracts
a
c
b
978-9241548540-C002 PRF ml YVR ln ml ml-1-Final Proof.indd 101 6/10/13 10:35 AM
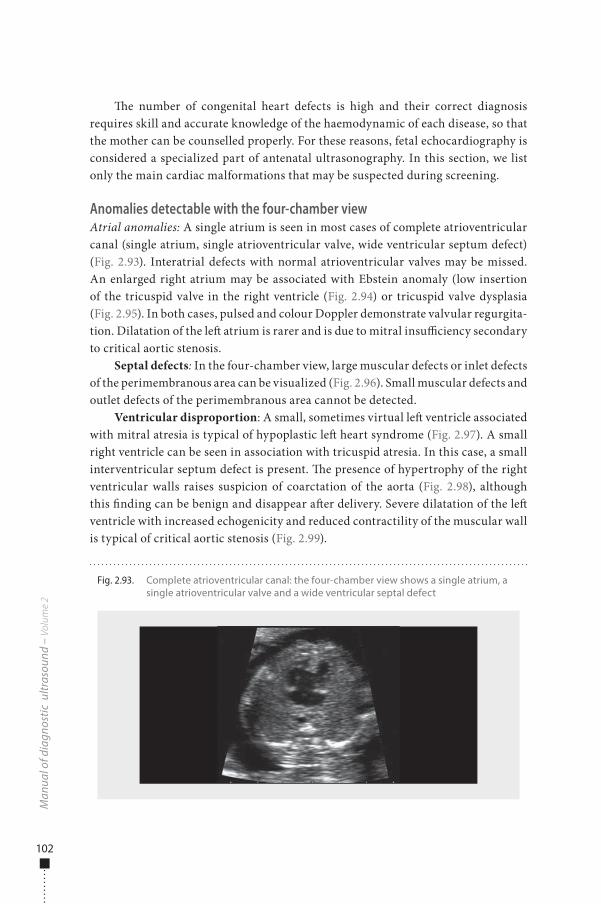
102
�e number of congenital heart defects is high and their correct diagnosis requires skill and accurate knowledge of the haemodynamic of each disease, so that the mother can be counselled properly. For these reasons, fetal echocardiography is considered a specialized part of antenatal ultrasonography. In this section, we list only the main cardiac malformations that may be suspected during screening.
Anomalies detectable with the four-chamber viewAtrial anomalies: A single atrium is seen in most cases of complete atrioventricular canal (single atrium, single atrioventricular valve, wide ventricular septum defect) (Fig. 2.93). Interatrial defects with normal atrioventricular valves may be missed. An enlarged right atrium may be associated with Ebstein anomaly (low insertion of the tricuspid valve in the right ventricle (Fig. 2.94) or tricuspid valve dysplasia (Fig. 2.95). In both cases, pulsed and colour Doppler demonstrate valvular regurgita-tion. Dilatation of the le� atrium is rarer and is due to mitral insu�ciency secondary to critical aortic stenosis.
Septal defects: In the four-chamber view, large muscular defects or inlet defects of the perimembranous area can be visualized (Fig. 2.96). Small muscular defects and outlet defects of the perimembranous area cannot be detected.
Ventricular disproportion: A small, sometimes virtual le� ventricle associated with mitral atresia is typical of hypoplastic le� heart syndrome (Fig. 2.97). A small right ventricle can be seen in association with tricuspid atresia. In this case, a small interventricular septum defect is present. �e presence of hypertrophy of the right ventricular walls raises suspicion of coarctation of the aorta (Fig. 2.98), although this �nding can be benign and disappear a�er delivery. Severe dilatation of the le� ventricle with increased echogenicity and reduced contractility of the muscular wall is typical of critical aortic stenosis (Fig. 2.99).
Man
ual o
f dia
gnos
tic u
ltras
ound
– V
olum
e 2
Fig. 2.93. Complete atrioventricular canal: the four-chamber view shows a single atrium, a single atrioventricular valve and a wide ventricular septal defect
978-9241548540-C002 PRF ml YVR ln ml ml-1-Final Proof.indd 102 6/10/13 10:35 AM
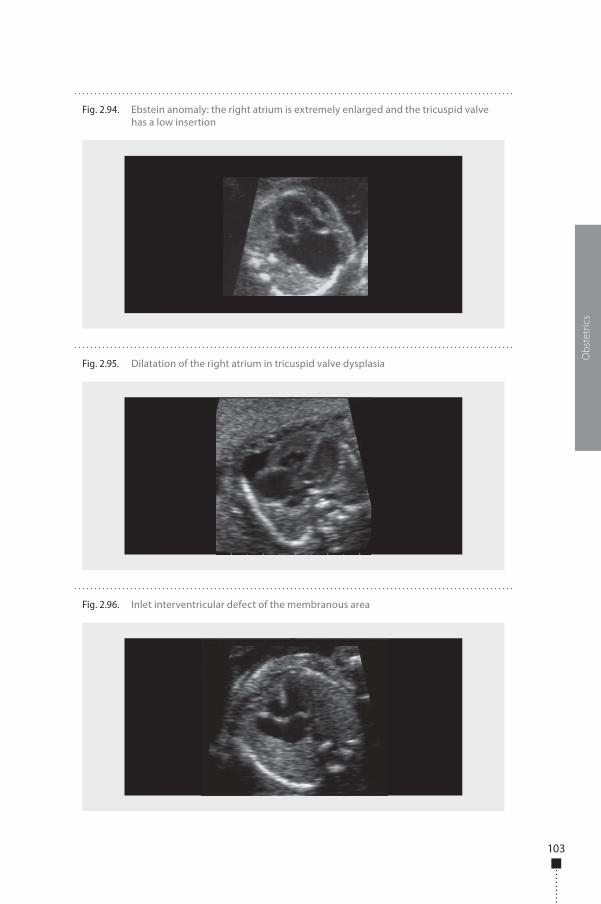
103
Obs
tetr
ics
Fig. 2.96. Inlet interventricular defect of the membranous area
Fig. 2.94. Ebstein anomaly: the right atrium is extremely enlarged and the tricuspid valve has a low insertion
Fig. 2.95. Dilatation of the right atrium in tricuspid valve dysplasia
978-9241548540-C002 PRF ml YVR ln ml ml-1-Final Proof.indd 103 6/10/13 10:35 AM
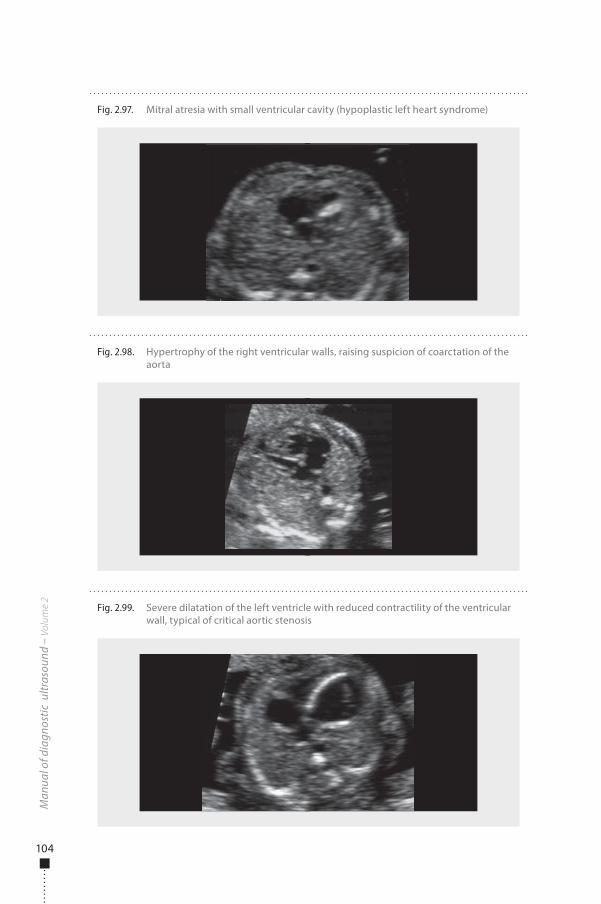
104
Man
ual o
f dia
gnos
tic u
ltras
ound
– V
olum
e 2
Fig. 2.98. Hypertrophy of the right ventricular walls, raising suspicion of coarctation of the aorta
Fig. 2.99. Severe dilatation of the left ventricle with reduced contractility of the ventricular wall, typical of critical aortic stenosis
Fig. 2.97. Mitral atresia with small ventricular cavity (hypoplastic left heart syndrome)
978-9241548540-C002 PRF ml YVR ln ml ml-1-Final Proof.indd 104 6/10/13 10:35 AM
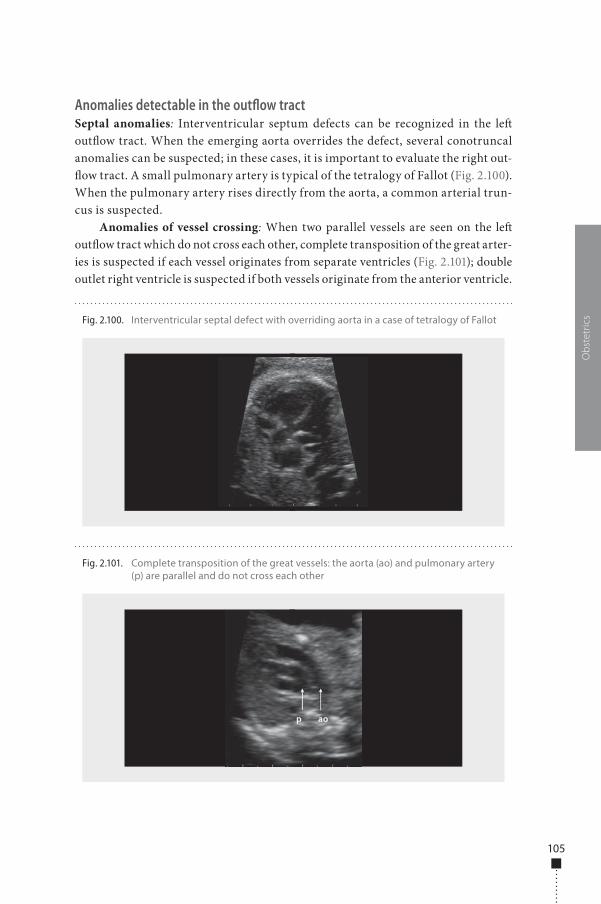
105
Anomalies detectable in the outflow tractSeptal anomalies: Interventricular septum defects can be recognized in the le� out�ow tract. When the emerging aorta overrides the defect, several conotruncal anomalies can be suspected; in these cases, it is important to evaluate the right out-�ow tract. A small pulmonary artery is typical of the tetralogy of Fallot (Fig. 2.100). When the pulmonary artery rises directly from the aorta, a common arterial trun-cus is suspected.
Anomalies of vessel crossing: When two parallel vessels are seen on the le� out�ow tract which do not cross each other, complete transposition of the great arter-ies is suspected if each vessel originates from separate ventricles (Fig. 2.101); double outlet right ventricle is suspected if both vessels originate from the anterior ventricle.
Obs
tetr
ics
Fig. 2.101. Complete transposition of the great vessels: the aorta (ao) and pulmonary artery (p) are parallel and do not cross each other
Fig. 2.100. Interventricular septal defect with overriding aorta in a case of tetralogy of Fallot
978-9241548540-C002 PRF ml YVR ln ml ml-1-Final Proof.indd 105 6/10/13 10:35 AM
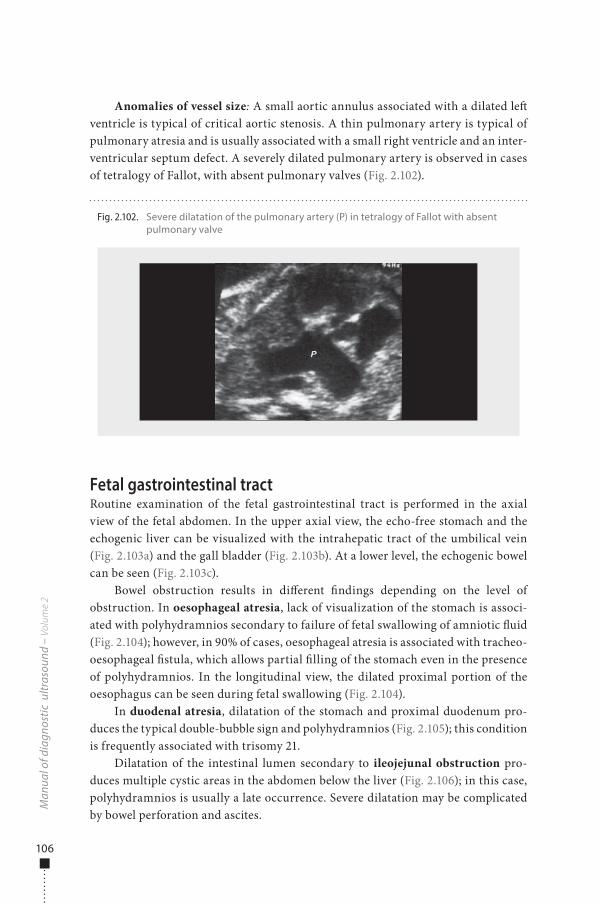
106
Anomalies of vessel size: A small aortic annulus associated with a dilated le� ventricle is typical of critical aortic stenosis. A thin pulmonary artery is typical of pulmonary atresia and is usually associated with a small right ventricle and an inter-ventricular septum defect. A severely dilated pulmonary artery is observed in cases of tetralogy of Fallot, with absent pulmonary valves (Fig. 2.102).
Fetal gastrointestinal tractRoutine examination of the fetal gastrointestinal tract is performed in the axial view of the fetal abdomen. In the upper axial view, the echo-free stomach and the echogenic liver can be visualized with the intrahepatic tract of the umbilical vein (Fig. 2.103a) and the gall bladder (Fig. 2.103b). At a lower level, the echogenic bowel can be seen (Fig. 2.103c).
Bowel obstruction results in di�erent �ndings depending on the level of obstruction. In oesophageal atresia, lack of visualization of the stomach is associ-ated with polyhydramnios secondary to failure of fetal swallowing of amniotic �uid (Fig. 2.104); however, in 90% of cases, oesophageal atresia is associated with tracheo-oesophageal �stula, which allows partial �lling of the stomach even in the presence of polyhydramnios. In the longitudinal view, the dilated proximal portion of the oesophagus can be seen during fetal swallowing (Fig. 2.104).
In duodenal atresia, dilatation of the stomach and proximal duodenum pro-duces the typical double-bubble sign and polyhydramnios (Fig. 2.105); this condition is frequently associated with trisomy 21.
Dilatation of the intestinal lumen secondary to ileojejunal obstruction pro-duces multiple cystic areas in the abdomen below the liver (Fig. 2.106); in this case, polyhydramnios is usually a late occurrence. Severe dilatation may be complicated by bowel perforation and ascites.
Man
ual o
f dia
gnos
tic u
ltras
ound
– V
olum
e 2
Fig. 2.102. Severe dilatation of the pulmonary artery (P) in tetralogy of Fallot with absent pulmonary valve
978-9241548540-C002 PRF ml YVR ln ml ml-1-Final Proof.indd 106 6/10/13 10:35 AM
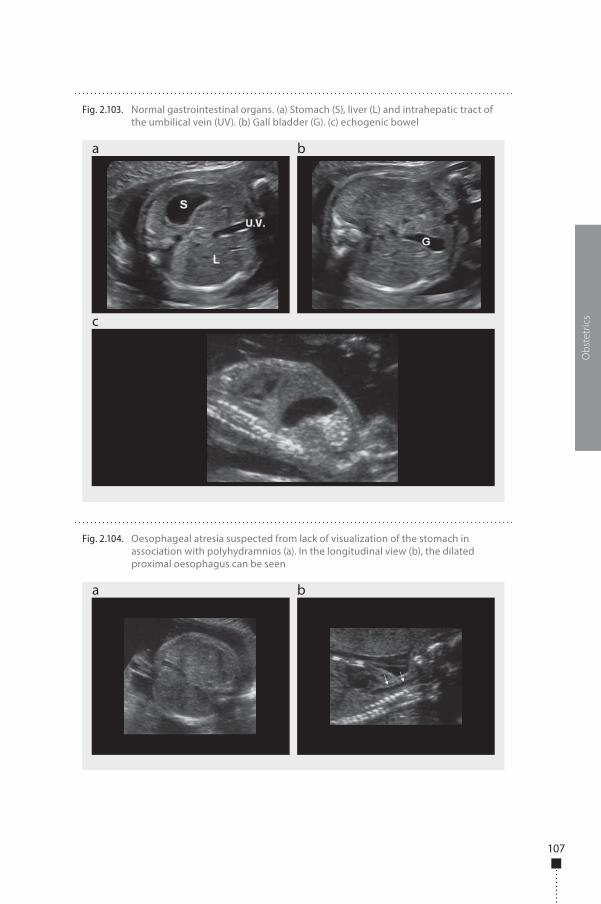
107
Obs
tetr
ics
Fig. 2.104. Oesophageal atresia suspected from lack of visualization of the stomach in association with polyhydramnios (a). In the longitudinal view (b), the dilated proximal oesophagus can be seen
a b
Fig. 2.103. Normal gastrointestinal organs. (a) Stomach (S), liver (L) and intrahepatic tract of the umbilical vein (UV). (b) Gall bladder (G). (c) echogenic bowel
a
c
b
978-9241548540-C002 PRF ml YVR ln ml ml-1-Final Proof.indd 107 6/10/13 10:35 AM
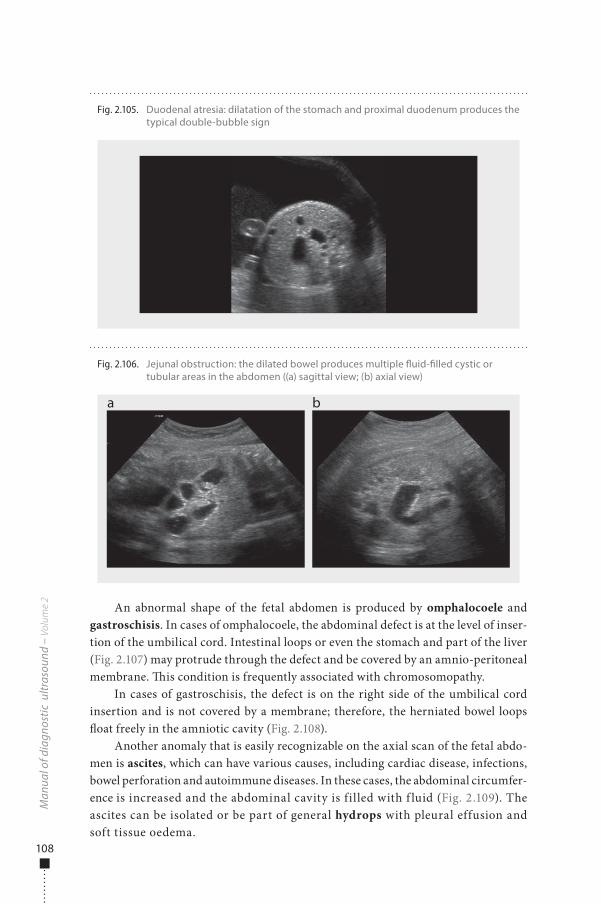
108
An abnormal shape of the fetal abdomen is produced by omphalocoele and gastroschisis. In cases of omphalocoele, the abdominal defect is at the level of inser-tion of the umbilical cord. Intestinal loops or even the stomach and part of the liver (Fig. 2.107) may protrude through the defect and be covered by an amnio-peritoneal membrane. �is condition is frequently associated with chromosomopathy.
In cases of gastroschisis, the defect is on the right side of the umbilical cord insertion and is not covered by a membrane; therefore, the herniated bowel loops �oat freely in the amniotic cavity (Fig. 2.108).
Another anomaly that is easily recognizable on the axial scan of the fetal abdo-men is ascites, which can have various causes, including cardiac disease, infections, bowel perforation and autoimmune diseases. In these cases, the abdominal circumfer-ence is increased and the abdominal cavity is filled with f luid (Fig. 2.109). The ascites can be isolated or be part of general hydrops with pleural effusion and soft tissue oedema.
Man
ual o
f dia
gnos
tic u
ltras
ound
– V
olum
e 2
Fig. 2.105. Duodenal atresia: dilatation of the stomach and proximal duodenum produces the typical double-bubble sign
Fig. 2.106. Jejunal obstruction: the dilated bowel produces multiple �uid-�lled cystic or tubular areas in the abdomen ((a) sagittal view; (b) axial view)
a b
978-9241548540-C002 PRF ml YVR ln ml ml-1-Final Proof.indd 108 6/10/13 10:35 AM
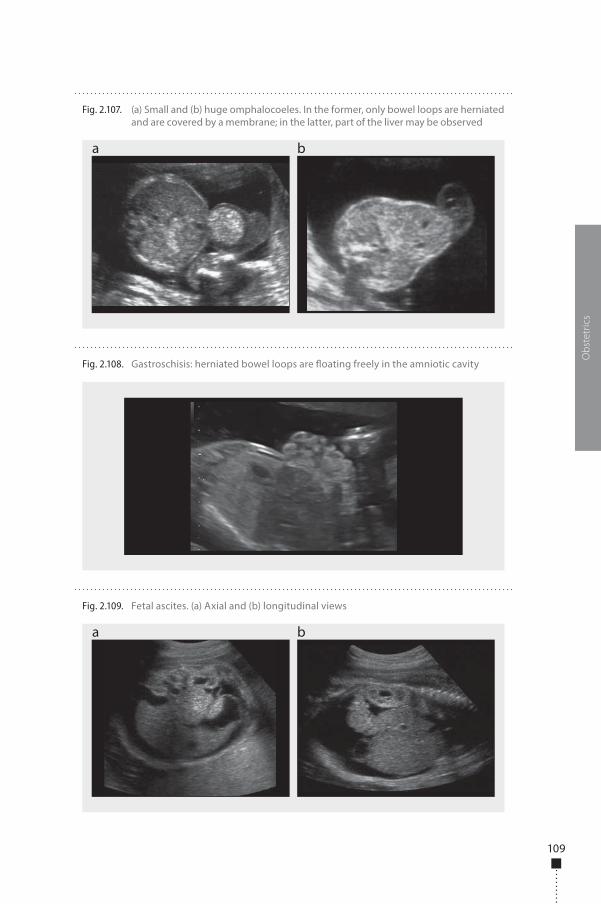
109
Obs
tetr
ics
Fig. 2.109. Fetal ascites. (a) Axial and (b) longitudinal views
a b
Fig. 2.107. (a) Small and (b) huge omphalocoeles. In the former, only bowel loops are herniated and are covered by a membrane; in the latter, part of the liver may be observed
a b
Fig. 2.108. Gastroschisis: herniated bowel loops are �oating freely in the amniotic cavity
978-9241548540-C002 PRF ml YVR ln ml ml-1-Final Proof.indd 109 6/10/13 10:35 AM
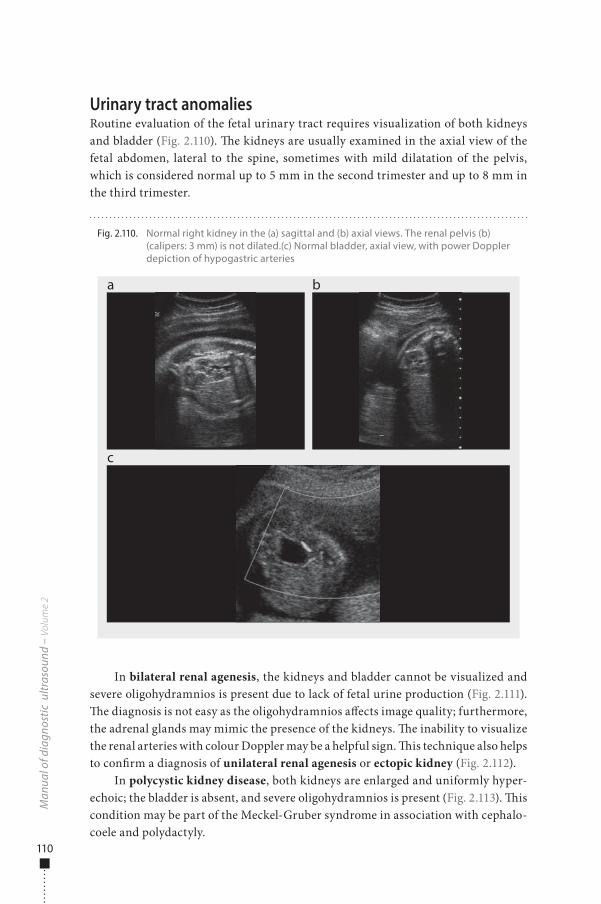
110
Urinary tract anomaliesRoutine evaluation of the fetal urinary tract requires visualization of both kidneys and bladder (Fig. 2.110). �e kidneys are usually examined in the axial view of the fetal abdomen, lateral to the spine, sometimes with mild dilatation of the pelvis, which is considered normal up to 5 mm in the second trimester and up to 8 mm in the third trimester.
In bilateral renal agenesis, the kidneys and bladder cannot be visualized and severe oligohydramnios is present due to lack of fetal urine production (Fig. 2.111). �e diagnosis is not easy as the oligohydramnios a�ects image quality; furthermore, the adrenal glands may mimic the presence of the kidneys. �e inability to visualize the renal arteries with colour Doppler may be a helpful sign. �is technique also helps to con�rm a diagnosis of unilateral renal agenesis or ectopic kidney (Fig. 2.112).
In polycystic kidney disease, both kidneys are enlarged and uniformly hyper-echoic; the bladder is absent, and severe oligohydramnios is present (Fig. 2.113). �is condition may be part of the Meckel-Gruber syndrome in association with cephalo-coele and polydactyly.
Man
ual o
f dia
gnos
tic u
ltras
ound
– V
olum
e 2
Fig. 2.110. Normal right kidney in the (a) sagittal and (b) axial views. The renal pelvis (b) (calipers: 3 mm) is not dilated.(c) Normal bladder, axial view, with power Doppler depiction of hypogastric arteries
a
c
b
978-9241548540-C002 PRF ml YVR ln ml ml-1-Final Proof.indd 110 6/10/13 10:35 AM
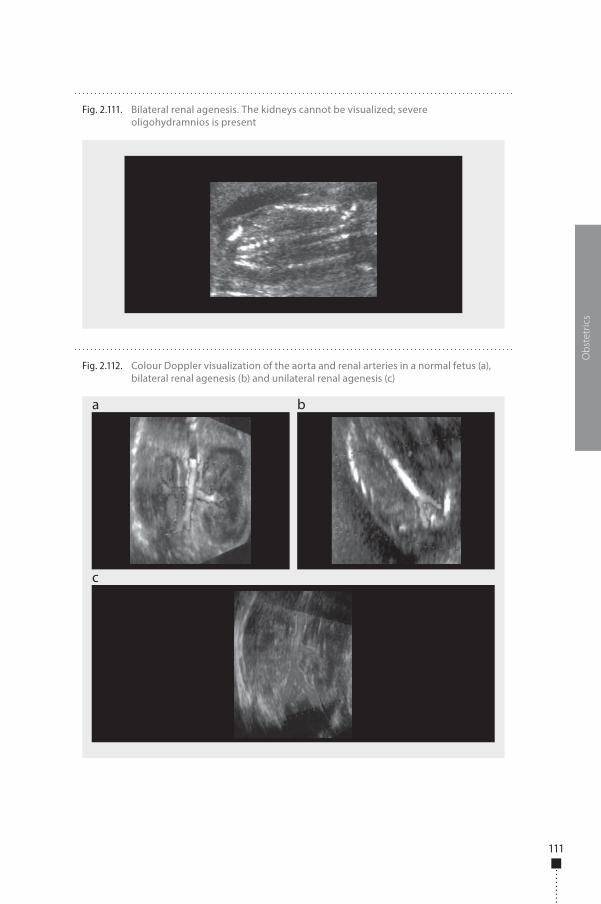
111
Obs
tetr
ics
Fig. 2.112. Colour Doppler visualization of the aorta and renal arteries in a normal fetus (a), bilateral renal agenesis (b) and unilateral renal agenesis (c)
a
c
b
Fig. 2.111. Bilateral renal agenesis. The kidneys cannot be visualized; severe oligohydramnios is present
978-9241548540-C002 PRF ml YVR ln ml ml-1-Final Proof.indd 111 6/10/13 10:35 AM
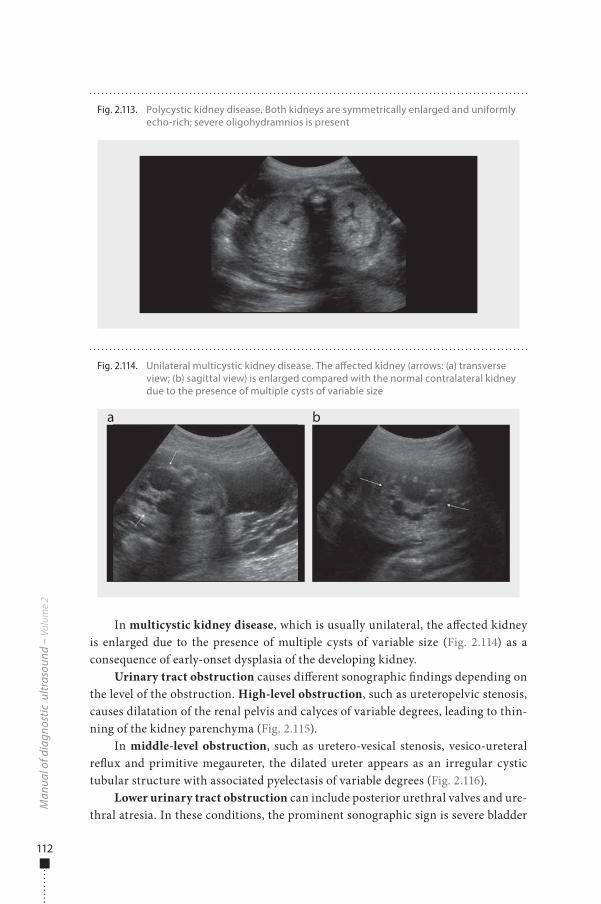
112
In multicystic kidney disease, which is usually unilateral, the a�ected kidney is enlarged due to the presence of multiple cysts of variable size (Fig. 2.114) as a consequence of early-onset dysplasia of the developing kidney.
Urinary tract obstruction causes di�erent sonographic �ndings depending on the level of the obstruction. High-level obstruction, such as ureteropelvic stenosis, causes dilatation of the renal pelvis and calyces of variable degrees, leading to thin-ning of the kidney parenchyma (Fig. 2.115).
In middle-level obstruction, such as uretero-vesical stenosis, vesico-ureteral re�ux and primitive megaureter, the dilated ureter appears as an irregular cystic tubular structure with associated pyelectasis of variable degrees (Fig. 2.116).
Lower urinary tract obstruction can include posterior urethral valves and ure-thral atresia. In these conditions, the prominent sonographic sign is severe bladder
Man
ual o
f dia
gnos
tic u
ltras
ound
– V
olum
e 2
Fig. 2.113. Polycystic kidney disease. Both kidneys are symmetrically enlarged and uniformly echo-rich; severe oligohydramnios is present
Fig. 2.114. Unilateral multicystic kidney disease. The a�ected kidney (arrows: (a) transverse view; (b) sagittal view) is enlarged compared with the normal contralateral kidney due to the presence of multiple cysts of variable size
a b
978-9241548540-C002 PRF ml YVR ln ml ml-1-Final Proof.indd 112 6/10/13 10:35 AM
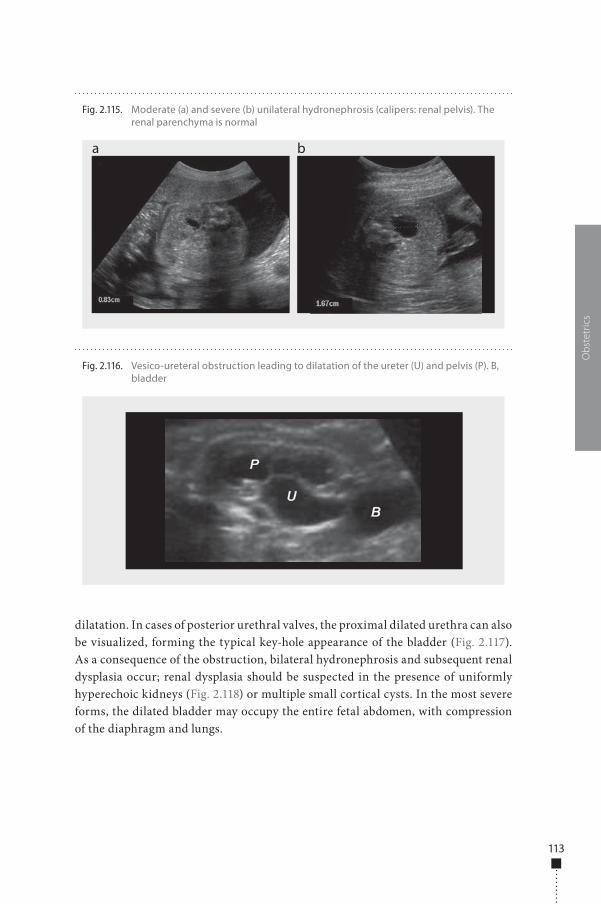
113
dilatation. In cases of posterior urethral valves, the proximal dilated urethra can also be visualized, forming the typical key-hole appearance of the bladder (Fig. 2.117). As a consequence of the obstruction, bilateral hydronephrosis and subsequent renal dysplasia occur; renal dysplasia should be suspected in the presence of uniformly hyperechoic kidneys (Fig. 2.118) or multiple small cortical cysts. In the most severe forms, the dilated bladder may occupy the entire fetal abdomen, with compression of the diaphragm and lungs.
Obs
tetr
ics
Fig. 2.116. Vesico-ureteral obstruction leading to dilatation of the ureter (U) and pelvis (P). B, bladder
Fig. 2.115. Moderate (a) and severe (b) unilateral hydronephrosis (calipers: renal pelvis). The renal parenchyma is normal
a b
978-9241548540-C002 PRF ml YVR ln ml ml-1-Final Proof.indd 113 6/10/13 10:35 AM
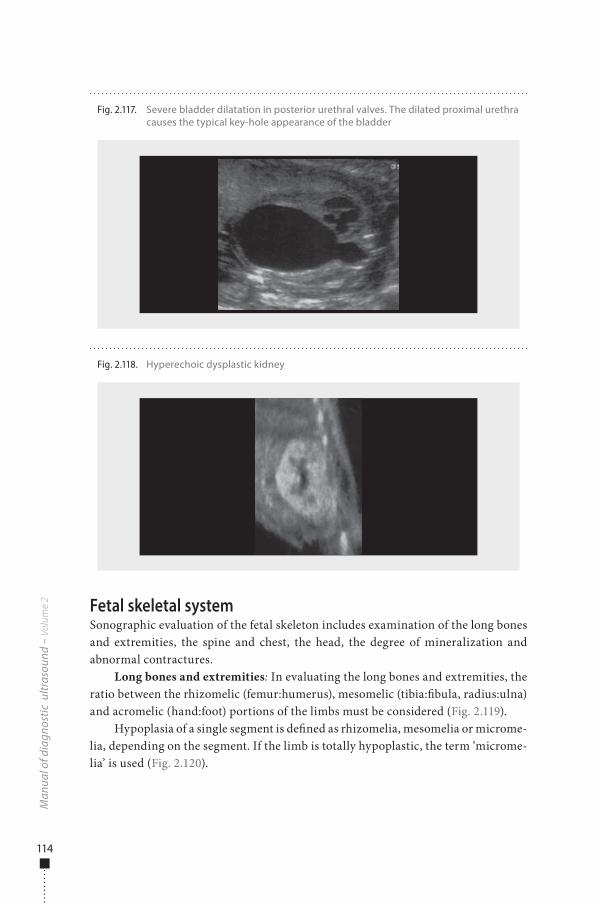
114
Fetal skeletal systemSonographic evaluation of the fetal skeleton includes examination of the long bones and extremities, the spine and chest, the head, the degree of mineralization and abnormal contractures.
Long bones and extremities: In evaluating the long bones and extremities, the ratio between the rhizomelic (femur:humerus), mesomelic (tibia:�bula, radius:ulna) and acromelic (hand:foot) portions of the limbs must be considered (Fig. 2.119).
Hypoplasia of a single segment is de�ned as rhizomelia, mesomelia or microme-lia, depending on the segment. If the limb is totally hypoplastic, the term ‘microme-lia’ is used (Fig. 2.120).
Man
ual o
f dia
gnos
tic u
ltras
ound
– V
olum
e 2
Fig. 2.118. Hyperechoic dysplastic kidney
Fig. 2.117. Severe bladder dilatation in posterior urethral valves. The dilated proximal urethra causes the typical key-hole appearance of the bladder
978-9241548540-C002 PRF ml YVR ln ml ml-1-Final Proof.indd 114 6/10/13 10:35 AM
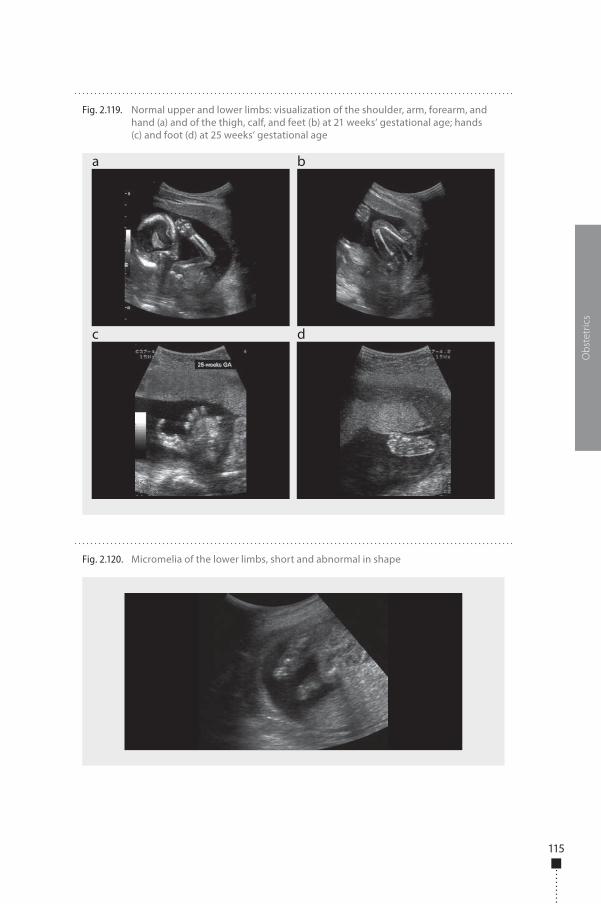
115
Obs
tetr
ics
Fig. 2.119. Normal upper and lower limbs: visualization of the shoulder, arm, forearm, and hand (a) and of the thigh, calf, and feet (b) at 21 weeks’ gestational age; hands (c) and foot (d) at 25 weeks’ gestational age
a
c d
b
Fig. 2.120. Micromelia of the lower limbs, short and abnormal in shape
978-9241548540-C002 PRF ml YVR ln ml ml-1-Final Proof.indd 115 6/10/13 10:35 AM
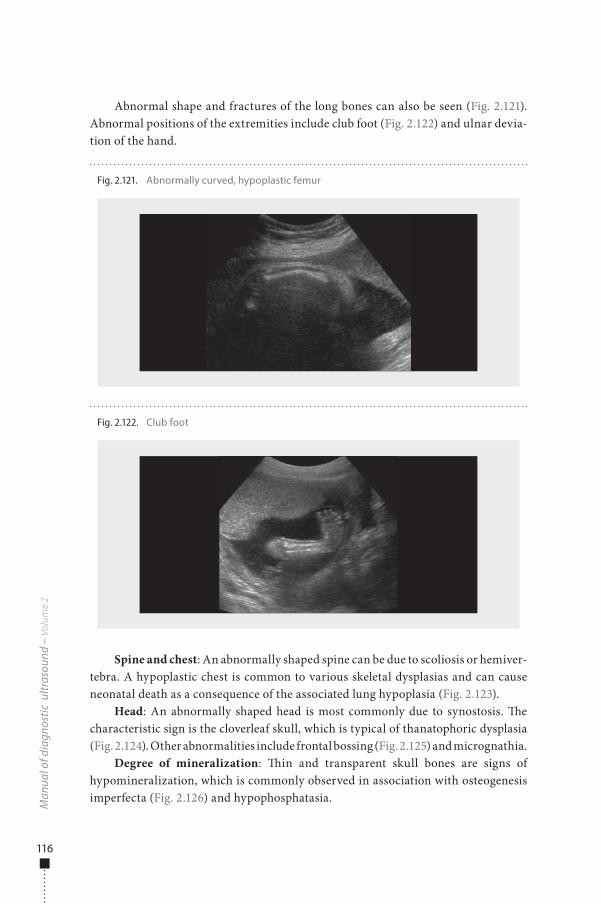
116
Abnormal shape and fractures of the long bones can also be seen (Fig. 2.121). Abnormal positions of the extremities include club foot (Fig. 2.122) and ulnar devia-tion of the hand.
Spine and chest: An abnormally shaped spine can be due to scoliosis or hemiver-tebra. A hypoplastic chest is common to various skeletal dysplasias and can cause neonatal death as a consequence of the associated lung hypoplasia (Fig. 2.123).
Head: An abnormally shaped head is most commonly due to synostosis. �e characteristic sign is the cloverleaf skull, which is typical of thanatophoric dysplasia (Fig. 2.124). Other abnormalities include frontal bossing (Fig. 2.125) and micrognathia.
Degree of mineralization: �in and transparent skull bones are signs of hypomineralization, which is commonly observed in association with osteogenesis imperfecta (Fig. 2.126) and hypophosphatasia.
Man
ual o
f dia
gnos
tic u
ltras
ound
– V
olum
e 2
Fig. 2.121. Abnormally curved, hypoplastic femur
Fig. 2.122. Club foot
978-9241548540-C002 PRF ml YVR ln ml ml-1-Final Proof.indd 116 6/10/13 10:35 AM
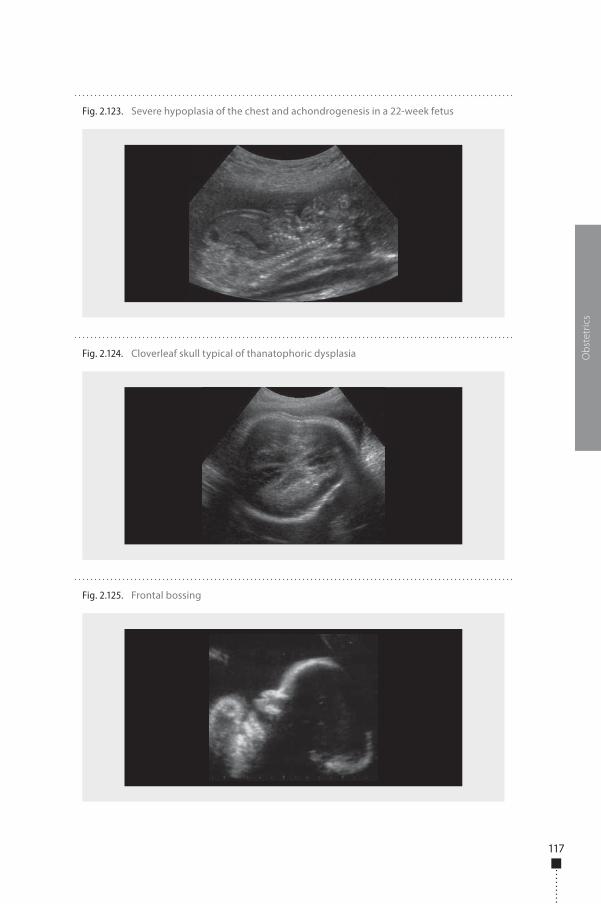
117
Obs
tetr
ics
Fig. 2.123. Severe hypoplasia of the chest and achondrogenesis in a 22-week fetus
Fig. 2.124. Cloverleaf skull typical of thanatophoric dysplasia
Fig. 2.125. Frontal bossing
978-9241548540-C002 PRF ml YVR ln ml ml-1-Final Proof.indd 117 6/10/13 10:35 AM
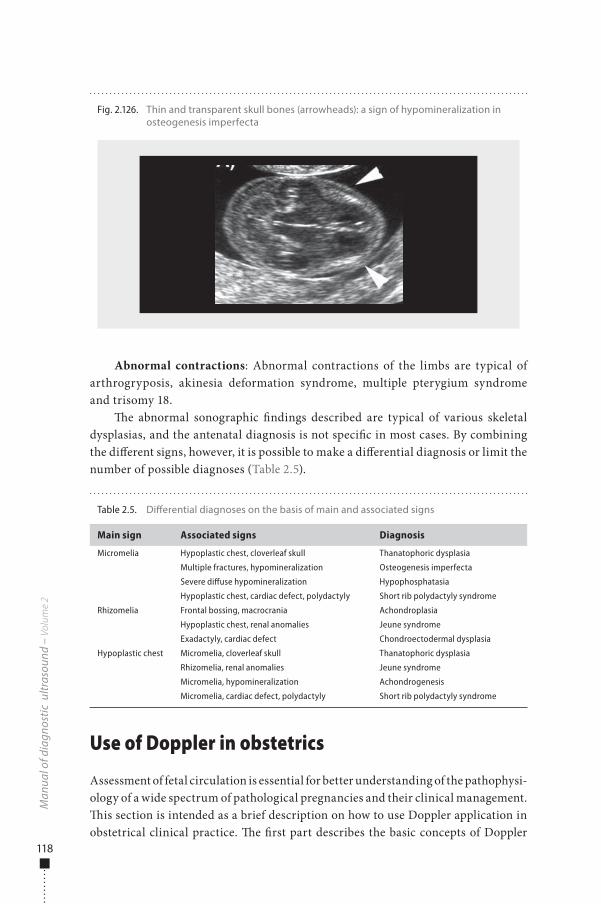
118
Abnormal contractions: Abnormal contractions of the limbs are typical of arthrogryposis, akinesia deformation syndrome, multiple pterygium syndrome and trisomy 18.
�e abnormal sonographic �ndings described are typical of various skeletal dysplasias, and the antenatal diagnosis is not speci�c in most cases. By combining the di�erent signs, however, it is possible to make a di�erential diagnosis or limit the number of possible diagnoses (Table 2.5).
Use of Doppler in obstetrics
Assessment of fetal circulation is essential for better understanding of the pathophysi-ology of a wide spectrum of pathological pregnancies and their clinical management. �is section is intended as a brief description on how to use Doppler application in obstetrical clinical practice. �e �rst part describes the basic concepts of Doppler
Man
ual o
f dia
gnos
tic u
ltras
ound
– V
olum
e 2
Table 2.5. Di�erential diagnoses on the basis of main and associated signs
Main sign Associated signs Diagnosis
Micromelia Hypoplastic chest, cloverleaf skull Thanatophoric dysplasia
Multiple fractures, hypomineralization Osteogenesis imperfecta
Severe diffuse hypomineralization Hypophosphatasia
Hypoplastic chest, cardiac defect, polydactyly Short rib polydactyly syndrome
Rhizomelia Frontal bossing, macrocrania Achondroplasia
Hypoplastic chest, renal anomalies Jeune syndrome
Exadactyly, cardiac defect Chondroectodermal dysplasia
Hypoplastic chest Micromelia, cloverleaf skull Thanatophoric dysplasia
Rhizomelia, renal anomalies Jeune syndrome
Micromelia, hypomineralization Achondrogenesis
Micromelia, cardiac defect, polydactyly Short rib polydactyly syndrome
Fig. 2.126. Thin and transparent skull bones (arrowheads): a sign of hypomineralization in osteogenesis imperfecta
978-9241548540-C002 PRF ml YVR ln ml ml-1-Final Proof.indd 118 6/10/13 10:35 AM
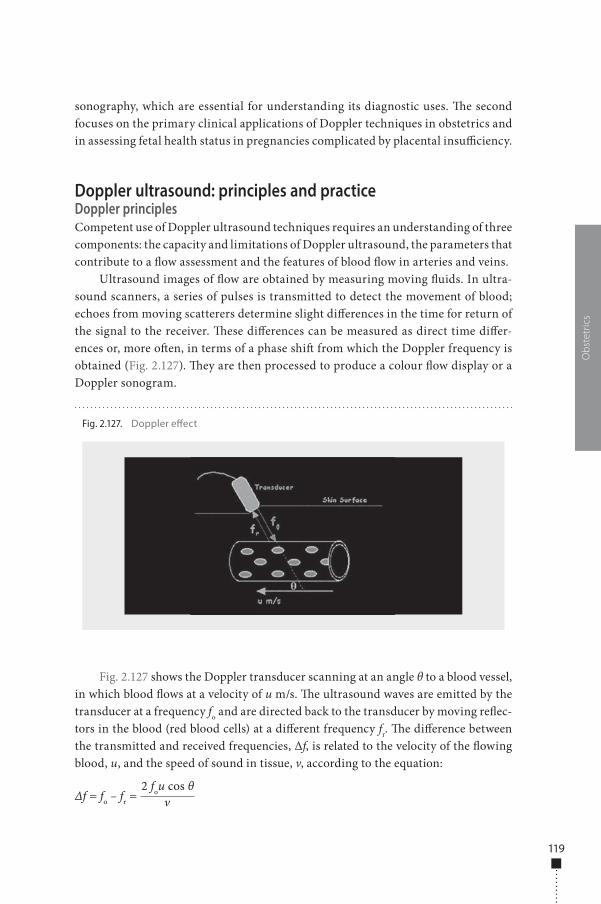
119
sonography, which are essential for understanding its diagnostic uses. �e second focuses on the primary clinical applications of Doppler techniques in obstetrics and in assessing fetal health status in pregnancies complicated by placental insu�ciency.
Doppler ultrasound: principles and practiceDoppler principlesCompetent use of Doppler ultrasound techniques requires an understanding of three components: the capacity and limitations of Doppler ultrasound, the parameters that contribute to a �ow assessment and the features of blood �ow in arteries and veins.
Ultrasound images of �ow are obtained by measuring moving �uids. In ultra-sound scanners, a series of pulses is transmitted to detect the movement of blood; echoes from moving scatterers determine slight di�erences in the time for return of the signal to the receiver. �ese di�erences can be measured as direct time di�er-ences or, more o�en, in terms of a phase shi� from which the Doppler frequency is obtained (Fig. 2.127). �ey are then processed to produce a colour �ow display or a Doppler sonogram.
Fig. 2.127 shows the Doppler transducer scanning at an angle θ to a blood vessel, in which blood �ows at a velocity of u m/s. �e ultrasound waves are emitted by the transducer at a frequency fo and are directed back to the transducer by moving re�ec-tors in the blood (red blood cells) at a di�erent frequency fr. �e di�erence between the transmitted and received frequencies, Δf, is related to the velocity of the �owing blood, u, and the speed of sound in tissue, v, according to the equation:
Δf = fo – fr = v2 fou cos θ
Obs
tetr
ics
Fig. 2.127. Doppler e�ect
978-9241548540-C002 PRF ml YVR ln ml ml-1-Final Proof.indd 119 6/10/13 10:35 AM
120
�ere has to be motion in the direction of the beam to obtain Doppler signals; this does not happen if the �ow is perpendicular to the beam.
�e magnitude of the Doppler signal depends on:
■ blood velocity; ■ ultrasound frequency: the higher the ultrasound frequency, the higher the
Doppler frequency. As in B-mode, lower ultrasound frequencies have better penetration; the choice of frequency is therefore a compromise between better sensitivity and better penetration;
■ the angle of insonation: the Doppler frequency increases as the angle between the beam and the direction of �ow becomes smaller.
�e two main types of Doppler systems in common use today are continuous wave and pulsed wave. �ey di�er in transducer design, operating features, signal processing procedures, and the types of information provided.
Doppler practiceContinuous-wave Doppler requires continuous generation of ultrasound waves with continuous ultrasound reception. A two-crystal transducer has this dual function, with one crystal for each function. �e main advantage of continuous-wave Doppler is for measuring high blood velocities accurately; its main disadvantage is the lack of selectivity and depth discrimination. As continuous-wave Doppler is constantly transmitting and receiving from two di�erent transducer heads (crystals), there is no provision for imaging or range gating to allow selective placing of a given Doppler sample volume in space.
Pulsed-wave Doppler systems have a transducer that alternates transmission and reception of ultrasound in a way similar to the M-mode transducer. �e main advantage of pulsed Doppler is that Doppler shi� data are produced selectively from a small segment along the ultrasound beam, referred to as the sample volume, the location of which is controlled by the operator. An ultrasound pulse is transmitted into tissues and travels for a given time (time X) until it is re�ected back by a moving red cell. It then returns to the transducer over the same interval but at a shi�ed frequency. �e total transit time to and from the area is 2X. �is process is repeated alternately through many transmit–receive cycles each second. �e range gating therefore depends on a timing mechanism that samples the returning Doppler shi� data from only a given region. All other returning ultrasound information is essen-tially ignored. �e main disadvantage of pulsed-wave Doppler is that high blood �ow velocities cannot be measured accurately.
Aliasing e�ect: Pulsed-wave systems have a fundamental limitation. When pulses are transmitted at a given sampling frequency (pulse repetition frequency), the maximum Doppler frequency that can be measured is half of that frequency. �erefore, if the Doppler frequency is greater than half the pulse repetition frequency,
Man
ual o
f dia
gnos
tic u
ltras
ound
– V
olum
e 2
978-9241548540-C002 PRF ml YVR ln ml ml-1-Final Proof.indd 120 6/10/13 10:35 AM
121
the Doppler signal is ambiguous. �is condition is known as aliasing. �e interval between sampling pulses must be su�cient for a pulse to go away and come back to the transducer. If a second pulse is sent before the �rst is received, the receiver cannot correctly discriminate between the two. �e deeper the sample volume, the longer the pulse’s journey, so that the pulse repetition frequency must be reduced for unambiguous ranging. �e result is that the maximum measurable Doppler fre-quency decreases with depth.
Ultrasound Doppler modes: colour flow imaging and spectral DopplerColour flow imaging produces a picture of a blood vessel by converting the Doppler data into colours, which are overlaid onto the B-mode image of the blood vessel and represent the speed and direction of blood �ow through the vessel. It is useful for identifying the vessels under examination, verifying the presence and direc-tion of �ow and �nding the correct angle of insonation for velocity measurements.
Power Doppler is a newer ultrasound technique that is up to �ve times more sensitive in detecting low blood �ow than standard colour Doppler. �e magnitude of the �ow output rather than the Doppler frequency signal is shown. Power Doppler can obtain some images that are di�cult or impossible to obtain with standard colour Doppler.
Spectral Doppler (pulsed-wave Doppler) is used to provide a sonogram of a vessel in order to measure the distribution of �ow velocities in the sample volume. �e Doppler signal is processed in a Fourier spectrum analyser. �e amplitudes of the resulting spectra are encoded as brightness, and these are plotted as a function of time (horizontal axis) and frequency shi� (vertical axis) to give a two-dimensional spectral display. With this technique, a range of blood velocities in a sample volume will produce a corresponding range of frequency shi�s on the spectral display.
To obtain proper images and measures, the operator should:
■ identify the vessel (possibly by colour �ow imaging); ■ adjust the gain so that the sonogram is clear and free of noise; ■ place the Doppler cursor on the vessel to be investigated (sample volume) and
set the correct size; ■ obtain a proper angle of insonation (60° or less); ■ adjust the pulse repetition frequency to suit �ow conditions and avoid aliasing.
Flow waveform analysis: Doppler waveform analysis is o�en used for diagnosis in the clinical assessment of disease. �e complex shapes of Doppler waveforms can be described by relatively simple indices, which have been used to evaluate fetal health and organ blood �ow. Common indices are the pulsatility index (PI), resist-ance index (RI) and the ratio of systolic to diastolic (S/D or A/B).
PI = fmax – fmin
fmean
Obs
tetr
ics
978-9241548540-C002 PRF ml YVR ln ml ml-1-Final Proof.indd 121 6/10/13 10:35 AM
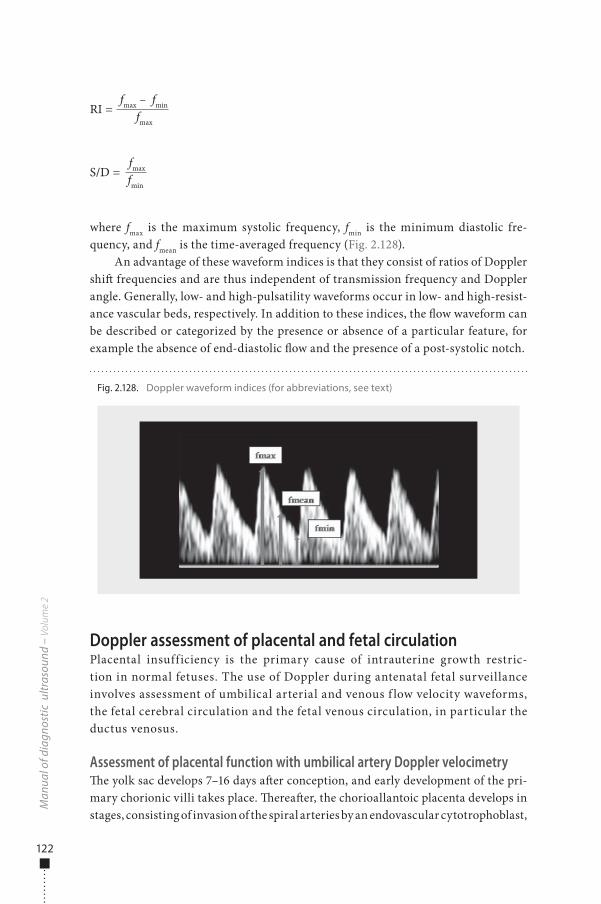
122
RI = fmax – fmin
fmax
S/D = fmax fmin
where fmax is the maximum systolic frequency, fmin is the minimum diastolic fre-quency, and fmean is the time-averaged frequency (Fig. 2.128).
An advantage of these waveform indices is that they consist of ratios of Doppler shi� frequencies and are thus independent of transmission frequency and Doppler angle. Generally, low- and high-pulsatility waveforms occur in low- and high-resist-ance vascular beds, respectively. In addition to these indices, the �ow waveform can be described or categorized by the presence or absence of a particular feature, for example the absence of end-diastolic �ow and the presence of a post-systolic notch.
Doppler assessment of placental and fetal circulationPlacental insufficiency is the primary cause of intrauterine growth restric-tion in normal fetuses. The use of Doppler during antenatal fetal surveillance involves assessment of umbilical arterial and venous f low velocity waveforms, the fetal cerebral circulation and the fetal venous circulation, in particular the ductus venosus.
Assessment of placental function with umbilical artery Doppler velocimetry�e yolk sac develops 7–16 days a�er conception, and early development of the pri-mary chorionic villi takes place. �erea�er, the chorioallantoic placenta develops in stages, consisting of invasion of the spiral arteries by an endovascular cytotrophoblast,
Man
ual o
f dia
gnos
tic u
ltras
ound
– V
olum
e 2
Fig. 2.128. Doppler waveform indices (for abbreviations, see text)
978-9241548540-C002 PRF ml YVR ln ml ml-1-Final Proof.indd 122 6/10/13 10:35 AM
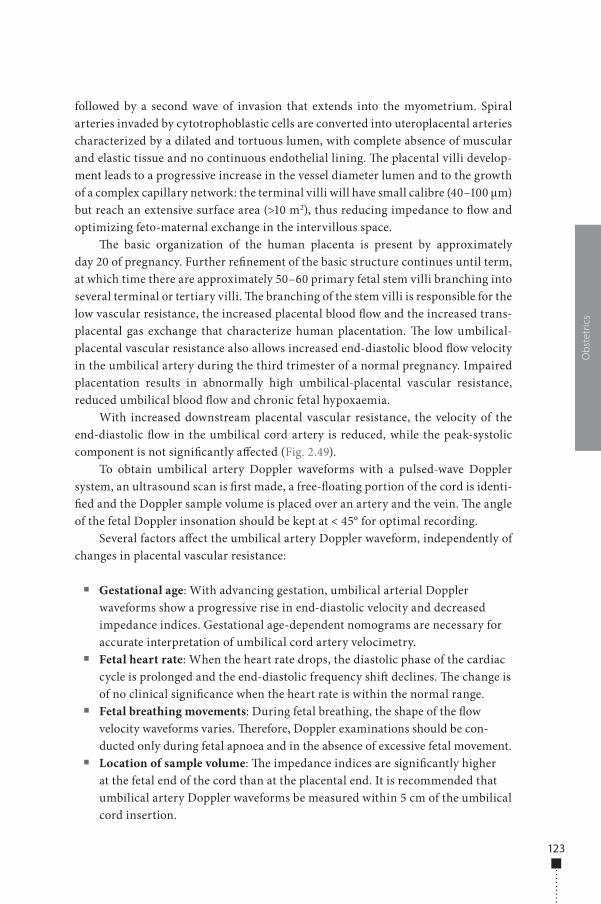
123
followed by a second wave of invasion that extends into the myometrium. Spiral arteries invaded by cytotrophoblastic cells are converted into uteroplacental arteries characterized by a dilated and tortuous lumen, with complete absence of muscular and elastic tissue and no continuous endothelial lining. �e placental villi develop-ment leads to a progressive increase in the vessel diameter lumen and to the growth of a complex capillary network: the terminal villi will have small calibre (40–100 μm) but reach an extensive surface area (>10 m2), thus reducing impedance to �ow and optimizing feto-maternal exchange in the intervillous space.
�e basic organization of the human placenta is present by approximately day 20 of pregnancy. Further re�nement of the basic structure continues until term, at which time there are approximately 50–60 primary fetal stem villi branching into several terminal or tertiary villi. �e branching of the stem villi is responsible for the low vascular resistance, the increased placental blood �ow and the increased trans-placental gas exchange that characterize human placentation. �e low umbilical-placental vascular resistance also allows increased end-diastolic blood �ow velocity in the umbilical artery during the third trimester of a normal pregnancy. Impaired placentation results in abnormally high umbilical-placental vascular resistance, reduced umbilical blood �ow and chronic fetal hypoxaemia.
With increased downstream placental vascular resistance, the velocity of the end-diastolic �ow in the umbilical cord artery is reduced, while the peak-systolic component is not signi�cantly a�ected (Fig. 2.49).
To obtain umbilical artery Doppler waveforms with a pulsed-wave Doppler system, an ultrasound scan is �rst made, a free-�oating portion of the cord is identi-�ed and the Doppler sample volume is placed over an artery and the vein. �e angle of the fetal Doppler insonation should be kept at < 45° for optimal recording.
Several factors a�ect the umbilical artery Doppler waveform, independently of changes in placental vascular resistance:
■ Gestational age: With advancing gestation, umbilical arterial Doppler waveforms show a progressive rise in end-diastolic velocity and decreased impedance indices. Gestational age-dependent nomograms are necessary for accurate interpretation of umbilical cord artery velocimetry.
■ Fetal heart rate: When the heart rate drops, the diastolic phase of the cardiac cycle is prolonged and the end-diastolic frequency shi� declines. �e change is of no clinical signi�cance when the heart rate is within the normal range.
■ Fetal breathing movements: During fetal breathing, the shape of the �ow velocity waveforms varies. �erefore, Doppler examinations should be con-ducted only during fetal apnoea and in the absence of excessive fetal movement.
■ Location of sample volume: �e impedance indices are signi�cantly higher at the fetal end of the cord than at the placental end. It is recommended that umbilical artery Doppler waveforms be measured within 5 cm of the umbilical cord insertion.
Obs
tetr
ics
978-9241548540-C002 PRF ml YVR ln ml ml-1-Final Proof.indd 123 6/10/13 10:35 AM
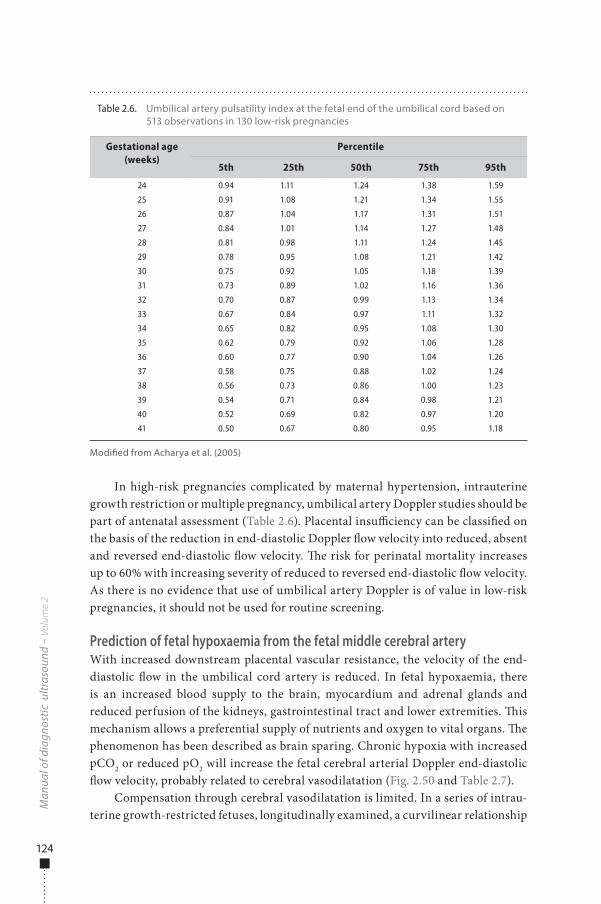
124
In high-risk pregnancies complicated by maternal hypertension, intrauterine growth restriction or multiple pregnancy, umbilical artery Doppler studies should be part of antenatal assessment (Table 2.6). Placental insu�ciency can be classi�ed on the basis of the reduction in end-diastolic Doppler �ow velocity into reduced, absent and reversed end-diastolic �ow velocity. �e risk for perinatal mortality increases up to 60% with increasing severity of reduced to reversed end-diastolic �ow velocity. As there is no evidence that use of umbilical artery Doppler is of value in low-risk pregnancies, it should not be used for routine screening.
Prediction of fetal hypoxaemia from the fetal middle cerebral arteryWith increased downstream placental vascular resistance, the velocity of the end-diastolic �ow in the umbilical cord artery is reduced. In fetal hypoxaemia, there is an increased blood supply to the brain, myocardium and adrenal glands and reduced perfusion of the kidneys, gastrointestinal tract and lower extremities. �is mechanism allows a preferential supply of nutrients and oxygen to vital organs. �e phenomenon has been described as brain sparing. Chronic hypoxia with increased pCO2 or reduced pO2 will increase the fetal cerebral arterial Doppler end-diastolic �ow velocity, probably related to cerebral vasodilatation (Fig. 2.50 and Table 2.7).
Compensation through cerebral vasodilatation is limited. In a series of intrau-terine growth-restricted fetuses, longitudinally examined, a curvilinear relationship
Man
ual o
f dia
gnos
tic u
ltras
ound
– V
olum
e 2
Table 2.6. Umbilical artery pulsatility index at the fetal end of the umbilical cord based on 513 observations in 130 low-risk pregnancies
Gestational age (weeks)
Percentile
5th 25th 50th 75th 95th
24 0.94 1.11 1.24 1.38 1.59
25 0.91 1.08 1.21 1.34 1.55
26 0.87 1.04 1.17 1.31 1.51
27 0.84 1.01 1.14 1.27 1.48
28 0.81 0.98 1.11 1.24 1.45
29 0.78 0.95 1.08 1.21 1.42
30 0.75 0.92 1.05 1.18 1.39
31 0.73 0.89 1.02 1.16 1.36
32 0.70 0.87 0.99 1.13 1.34
33 0.67 0.84 0.97 1.11 1.32
34 0.65 0.82 0.95 1.08 1.30
35 0.62 0.79 0.92 1.06 1.28
36 0.60 0.77 0.90 1.04 1.26
37 0.58 0.75 0.88 1.02 1.24
38 0.56 0.73 0.86 1.00 1.23
39 0.54 0.71 0.84 0.98 1.21
40 0.52 0.69 0.82 0.97 1.20
41 0.50 0.67 0.80 0.95 1.18
Modi�ed from Acharya et al. (2005)
978-9241548540-C002 PRF ml YVR ln ml ml-1-Final Proof.indd 124 6/10/13 10:35 AM
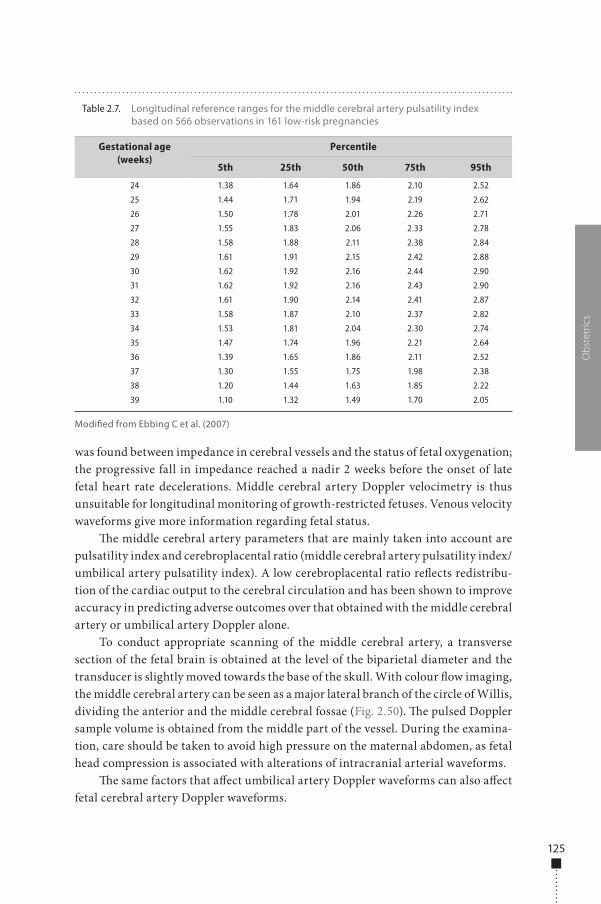
125
was found between impedance in cerebral vessels and the status of fetal oxygenation; the progressive fall in impedance reached a nadir 2 weeks before the onset of late fetal heart rate decelerations. Middle cerebral artery Doppler velocimetry is thus unsuitable for longitudinal monitoring of growth-restricted fetuses. Venous velocity waveforms give more information regarding fetal status.
�e middle cerebral artery parameters that are mainly taken into account are pulsatility index and cerebroplacental ratio (middle cerebral artery pulsatility index/umbilical artery pulsatility index). A low cerebroplacental ratio re�ects redistribu-tion of the cardiac output to the cerebral circulation and has been shown to improve accuracy in predicting adverse outcomes over that obtained with the middle cerebral artery or umbilical artery Doppler alone.
To conduct appropriate scanning of the middle cerebral artery, a transverse section of the fetal brain is obtained at the level of the biparietal diameter and the transducer is slightly moved towards the base of the skull. With colour �ow imaging, the middle cerebral artery can be seen as a major lateral branch of the circle of Willis, dividing the anterior and the middle cerebral fossae (Fig. 2.50). �e pulsed Doppler sample volume is obtained from the middle part of the vessel. During the examina-tion, care should be taken to avoid high pressure on the maternal abdomen, as fetal head compression is associated with alterations of intracranial arterial waveforms.
�e same factors that a�ect umbilical artery Doppler waveforms can also a�ect fetal cerebral artery Doppler waveforms.
Obs
tetr
ics
Table 2.7. Longitudinal reference ranges for the middle cerebral artery pulsatility index based on 566 observations in 161 low-risk pregnancies
Gestational age (weeks)
Percentile
5th 25th 50th 75th 95th
24 1.38 1.64 1.86 2.10 2.52
25 1.44 1.71 1.94 2.19 2.62
26 1.50 1.78 2.01 2.26 2.71
27 1.55 1.83 2.06 2.33 2.78
28 1.58 1.88 2.11 2.38 2.84
29 1.61 1.91 2.15 2.42 2.88
30 1.62 1.92 2.16 2.44 2.90
31 1.62 1.92 2.16 2.43 2.90
32 1.61 1.90 2.14 2.41 2.87
33 1.58 1.87 2.10 2.37 2.82
34 1.53 1.81 2.04 2.30 2.74
35 1.47 1.74 1.96 2.21 2.64
36 1.39 1.65 1.86 2.11 2.52
37 1.30 1.55 1.75 1.98 2.38
38 1.20 1.44 1.63 1.85 2.22
39 1.10 1.32 1.49 1.70 2.05
Modi�ed from Ebbing C et al. (2007)
978-9241548540-C002 PRF ml YVR ln ml ml-1-Final Proof.indd 125 6/10/13 10:35 AM
126
Prediction of fetal hypoxaemia with fetal venous Doppler�e fetal liver with its venous vasculature (umbilical and portal veins, ductus veno-sus and hepatic veins) and the inferior vena cava are the main areas of interest in investigating venous blood return to the fetal heart. �e ductus venosus originates from the umbilical vein before it turns to the right, and it enters the inferior vena cava in a venous vestibulum just below the diaphragm. �e diameter of the ductus venosus is approximately one third that of the umbilical vein. With colour Doppler, the ductus venosus is identi�ed in a midsagittal or oblique transection as a vessel connecting the umbilical vein with the inferior vena cava and exhibiting the typical aliasing of high velocities when compared with the umbilical vein (Fig. 2.51).
In severe hypoxaemia, the umbilical venous blood is redistributed to the ductus venosus at the expense of the hepatic blood �ow. Consequently, the proportion of umbilical venous blood contributing to the fetal cardiac output is increased to ensure an increase in umbilical venous-derived oxygen delivery to the myocardium and increased oxygen delivery to the fetal brain. Increased placental resistance and peripheral vasoconstriction, seen in fetal arterial redistribution, cause an increase in the right ventricular a�erload, and thus ventricular end-diastolic pressure increases. �is may result in highly pulsatile venous blood �ow waveforms and umbilical venous pulsations due to transmission of atrial pressure waves through the ductus venosus. In the inferior vena cava, reverse �ow during atrial contraction increases with pro-gressive fetal deterioration, suggesting a higher pressure gradient in the right atrium.
�e next step in the disease is extension of the abnormal reversal of blood veloci-ties in the inferior vena cava to the ductus venosus, inducing an increase in the ratio of peak systolic velocity to end-diastolic velocity, mainly due to a reduction in the latter component of the velocity waveforms (Fig. 2.51). �e main ductus venosus Doppler parameter that is taken into account is the pulsatility index for veins, PI, which is calculated as:
PI = vs – vd
vm
where vs is peak systolic velocity, vd is end-diastolic velocity and vm is time-averaged maximum velocity.
�e high venous pressure induces a reduction in velocity at end-diastole in the umbilical vein, causing typical end-diastolic pulsations. Umbilical venous pulsa-tions, particularly double pulsations, have been associated with perinatal mortality rates of up to 16% with absent umbilical artery end-diastolic �ow velocity and 60% with reversed umbilical artery end-diastolic �ow velocity.
�e ductus venosus pulsatility index and short-term variations in fetal heart rate are important indicators for the optimal timing of delivery before 32 weeks of gestation (Table 2.8). Delivery should be considered if one of these parameters is persistently abnormal. �e interval may be as short as a few hours in late gestation
Man
ual o
f dia
gnos
tic u
ltras
ound
– V
olum
e 2
978-9241548540-C002 PRF ml YVR ln ml ml-1-Final Proof.indd 126 6/10/13 10:35 AM
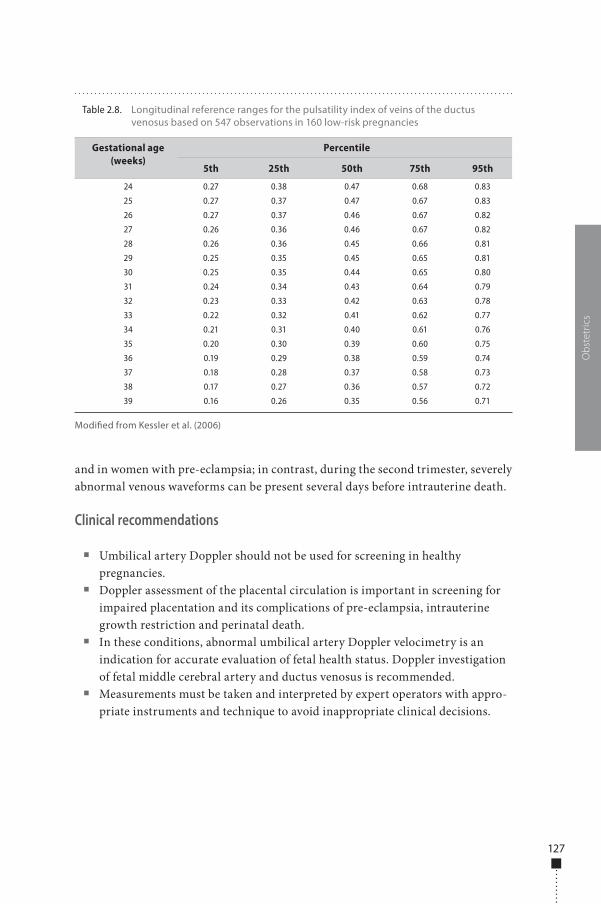
127
and in women with pre-eclampsia; in contrast, during the second trimester, severely abnormal venous waveforms can be present several days before intrauterine death.
Clinical recommendations
■ Umbilical artery Doppler should not be used for screening in healthy pregnancies.
■ Doppler assessment of the placental circulation is important in screening for impaired placentation and its complications of pre-eclampsia, intrauterine growth restriction and perinatal death.
■ In these conditions, abnormal umbilical artery Doppler velocimetry is an indication for accurate evaluation of fetal health status. Doppler investigation of fetal middle cerebral artery and ductus venosus is recommended.
■ Measurements must be taken and interpreted by expert operators with appro-priate instruments and technique to avoid inappropriate clinical decisions.
Obs
tetr
ics
Table 2.8. Longitudinal reference ranges for the pulsatility index of veins of the ductus venosus based on 547 observations in 160 low-risk pregnancies
Gestational age (weeks)
Percentile
5th 25th 50th 75th 95th
24 0.27 0.38 0.47 0.68 0.83
25 0.27 0.37 0.47 0.67 0.83
26 0.27 0.37 0.46 0.67 0.82
27 0.26 0.36 0.46 0.67 0.82
28 0.26 0.36 0.45 0.66 0.81
29 0.25 0.35 0.45 0.65 0.81
30 0.25 0.35 0.44 0.65 0.80
31 0.24 0.34 0.43 0.64 0.79
32 0.23 0.33 0.42 0.63 0.78
33 0.22 0.32 0.41 0.62 0.77
34 0.21 0.31 0.40 0.61 0.76
35 0.20 0.30 0.39 0.60 0.75
36 0.19 0.29 0.38 0.59 0.74
37 0.18 0.28 0.37 0.58 0.73
38 0.17 0.27 0.36 0.57 0.72
39 0.16 0.26 0.35 0.56 0.71
Modi�ed from Kessler et al. (2006)
978-9241548540-C002 PRF ml YVR ln ml ml-1-Final Proof.indd 127 6/10/13 10:35 AM
128
Recommendations on reporting of obstetrical ultrasound examinations
A report should be written at the end of every sonographic examination.
First trimesterIn the �rst trimester of pregnancy, the report must contain:
■ the reason for the examination; ■ the position and number of gestational sacs; ■ the number of embryos and fetuses; ■ the presence or absence of cardiac activity; ■ chorionicity and amnionicity in cases of multiple pregnancy; ■ the mean diameter of the gestational sac; ■ craniocaudal length (crown–rump length) or biparietal diameter of the
embryo or fetus.
�e measurements of all parameters must be compared to reference curves in order to assess whether the sonographic age coincides with the anamnestic (i.e. menstrual) gestational age. �e report should mention whether the pregnancy is to be re-dated.
�e report should also include:
■ possible uterine or adnexal anomalies; ■ suggestions on the need and timing of further sonographic examinations (between
20 and 22 weeks and 30 and 34 weeks or, on particular indications, at other times); ■ any limitations of the examination (maternal obesity, unfavourable position of
the fetus); ■ the device used: 3.5-MHz transabdominal probe or 7.5-MHz endovaginal probe; ■ images; ■ the date and signature of the operator.
Second trimesterIn the second trimester of the pregnancy, the report must contain:
■ number of fetuses and presence or absence of cardiac activity ■ results of the anatomical evaluation ■ results of the biometric evaluation ■ chorionicity and amnionicity in cases of multiple pregnancy ■ the position of the placenta.
Man
ual o
f dia
gnos
tic u
ltras
ound
– V
olum
e 2
978-9241548540-C002 PRF ml YVR ln ml ml-1-Final Proof.indd 128 6/10/13 10:35 AM
129
�e measurements of all parameters and morphological aspects must be compared to reference curves in order to assess whether the sonographic age coincides with the anam-nestic gestational age. �e report should mention whether the pregnancy is to be re-dated.
�e report should also include:
■ any limitations of the examination (maternal obesity, unfavourable position of the fetus, oligoamnios) that hindered or limited morphological study of the fetus;
■ suspect or pathological features requiring further diagnostic investigations; ■ suggestions on the need and timing of further sonographic examinations
(between 30 and 34 weeks or, on particular indications, at other times); ■ images; ■ the date and signature of the operator.
Third trimesterIn the third trimester of the pregnancy, the report must contain:
■ the number of fetuses and the presence or absence of cardiac activity; ■ the situation and presentation of the fetus; ■ the position of the placenta; ■ the quantity of amniotic �uid; ■ the estimated fetal weight; ■ all biometric parameters and morphological aspects, particularly the thick-
ness of the atrium (atrial width) of the cerebral ventricles, fetal cardiac activ-ity, both kidneys and the bladder; and the curve of fetal growth, reported on a reference curve;
■ suggestions about the need and timing of further sonographic examinations; ■ any limitations of the examination (maternal obesity, unfavourable position of
the fetus, oligoamnios); ■ images; ■ the date and signature of the operator.
Obs
tetr
ics
978-9241548540-C002 PRF ml YVR ln ml ml-1-Final Proof.indd 129 6/10/13 10:35 AM

978-9241548540-C002 PRF ml YVR ln ml ml-1-Final Proof.indd 130 6/10/13 10:35 AM
Chapter 3 Gynaecology
Uterus and ovaries 133134 Preparation and
scanning techniques
137 Normal �ndingsUterine disorders 146
146 Congenital abnormalities148 Benign endometrial
disease
152 Benign myometrial disease156 Neoplasms163 Adnexal lesions174 Fallopian tubes
978-9241548540-C003 PRF ml YVR ln ml ml-1-Final Proof.indd 131 6/10/13 10:33 AM

978-9241548540-C003 PRF ml YVR ln ml ml-1-Final Proof.indd 132 6/10/13 10:33 AM
Uterus and ovaries
Gynaecological ultrasonography is a non-invasive imaging technique that can be used:
■ in the diagnostic work-up of pelvic masses suspected on the basis of history and pelvic clinical examination;
■ in the diagnostic work-up of dysfunctional or infective diseases that involve or can involve the pelvis;
■ in the di�erential diagnosis of other acute abdominopelvic diseases (appendi-citis, diverticulitis, in�ammatory bowel diseases);
■ in the peri- and postmenopausal diagnostic evaluation of women with atypical uterine bleeding, in order to de�ne the macroscopic characteristics of the endometrium and uterine cavity;
■ in ovarian and endometrial surveillance of women at high-risk for ovarian and endometrial cancer (familial, drugs);
■ in monitoring spontaneous or drug-induced ovulation; ■ in monitoring therapy and surgery.
Sonography plays an important role in the detection of gynaecological disor-ders and is used widely with clinical examinations but also for �rst-line imaging to give an accurate indication for more sophisticated diagnostic techniques or more invasive endoscopic procedures. Technological advances have made it possible to use transabdominal (suprapubic) sonography with transvaginal or transrectal scanning.
�e choice of an ultrasound examination should be guided by clinical indications, but the widespread availability of ultrasound equipment leads many specialists to request an ultrasound scan on almost all women, to complete their clinical examination.
Transvaginal scanning is now the examination technique of choice. Some conditions do not allow or limit transvaginal scanning: the integrity of the hymen, women’s refusal to undergo an imaging technique that they consider invasive, or the presence of phlogistic and cicatricial processes involving the vaginal walls that could make the transducer’s movements painful or limit them. Uterine bleeding is not a contraindication for ultrasound examination, even for suspected miscarriage.
3Gynaecology
133
978-9241548540-C003 PRF ml YVR ln ml ml-1-Final Proof.indd 133 6/10/13 10:33 AM
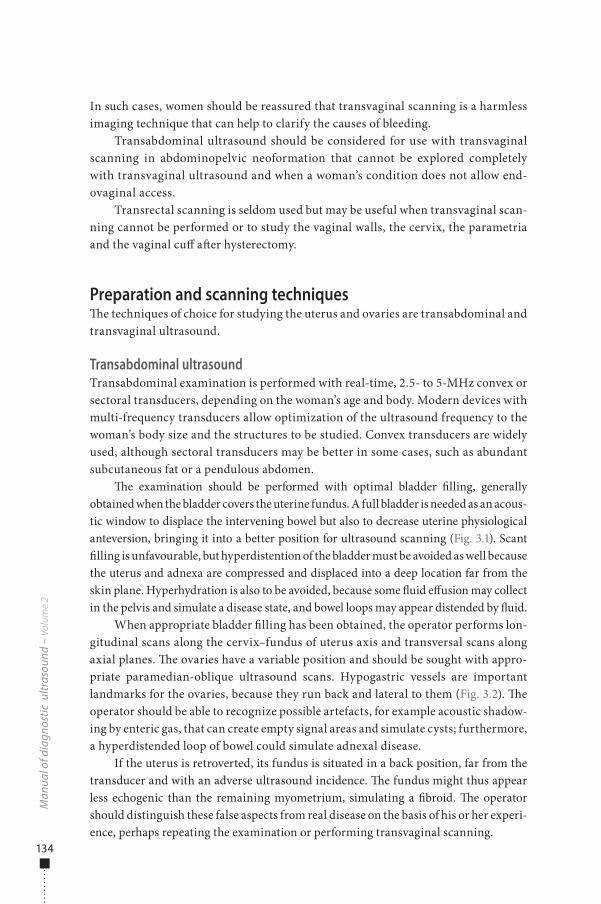
134
In such cases, women should be reassured that transvaginal scanning is a harmless imaging technique that can help to clarify the causes of bleeding.
Transabdominal ultrasound should be considered for use with transvaginal scanning in abdominopelvic neoformation that cannot be explored completely with transvaginal ultrasound and when a woman’s condition does not allow end-ovaginal access.
Transrectal scanning is seldom used but may be useful when transvaginal scan-ning cannot be performed or to study the vaginal walls, the cervix, the parametria and the vaginal cu� a�er hysterectomy.
Preparation and scanning techniques�e techniques of choice for studying the uterus and ovaries are transabdominal and transvaginal ultrasound.
Transabdominal ultrasoundTransabdominal examination is performed with real-time, 2.5- to 5-MHz convex or sectoral transducers, depending on the woman’s age and body. Modern devices with multi-frequency transducers allow optimization of the ultrasound frequency to the woman’s body size and the structures to be studied. Convex transducers are widely used, although sectoral transducers may be better in some cases, such as abundant subcutaneous fat or a pendulous abdomen.
�e examination should be performed with optimal bladder �lling, generally obtained when the bladder covers the uterine fundus. A full bladder is needed as an acous-tic window to displace the intervening bowel but also to decrease uterine physiological anteversion, bringing it into a better position for ultrasound scanning (Fig. 3.1). Scant �lling is unfavourable, but hyperdistention of the bladder must be avoided as well because the uterus and adnexa are compressed and displaced into a deep location far from the skin plane. Hyperhydration is also to be avoided, because some �uid e�usion may collect in the pelvis and simulate a disease state, and bowel loops may appear distended by �uid.
When appropriate bladder �lling has been obtained, the operator performs lon-gitudinal scans along the cervix–fundus of uterus axis and transversal scans along axial planes. �e ovaries have a variable position and should be sought with appro-priate paramedian-oblique ultrasound scans. Hypogastric vessels are important landmarks for the ovaries, because they run back and lateral to them (Fig. 3.2). �e operator should be able to recognize possible artefacts, for example acoustic shadow-ing by enteric gas, that can create empty signal areas and simulate cysts; furthermore, a hyperdistended loop of bowel could simulate adnexal disease.
If the uterus is retroverted, its fundus is situated in a back position, far from the transducer and with an adverse ultrasound incidence. �e fundus might thus appear less echogenic than the remaining myometrium, simulating a �broid. �e operator should distinguish these false aspects from real disease on the basis of his or her experi-ence, perhaps repeating the examination or performing transvaginal scanning.
Man
ual o
f dia
gnos
tic u
ltras
ound
– V
olum
e 2
978-9241548540-C003 PRF ml YVR ln ml ml-1-Final Proof.indd 134 6/10/13 10:33 AM
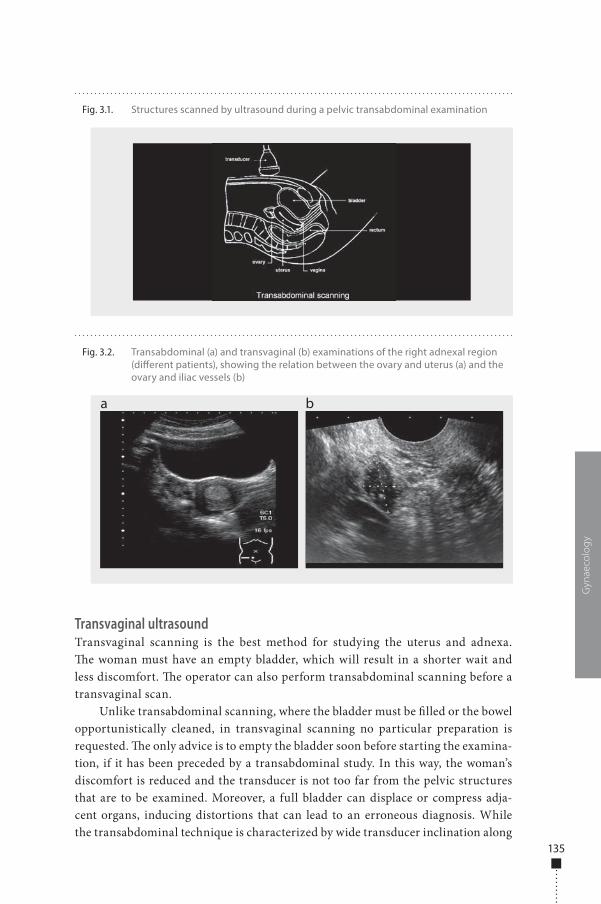
135
Transvaginal ultrasoundTransvaginal scanning is the best method for studying the uterus and adnexa. �e woman must have an empty bladder, which will result in a shorter wait and less discomfort. �e operator can also perform transabdominal scanning before a transvaginal scan.
Unlike transabdominal scanning, where the bladder must be �lled or the bowel opportunistically cleaned, in transvaginal scanning no particular preparation is requested. �e only advice is to empty the bladder soon before starting the examina-tion, if it has been preceded by a transabdominal study. In this way, the woman’s discomfort is reduced and the transducer is not too far from the pelvic structures that are to be examined. Moreover, a full bladder can displace or compress adja-cent organs, inducing distortions that can lead to an erroneous diagnosis. While the transabdominal technique is characterized by wide transducer inclination along
Gyn
aeco
log
y
Fig. 3.1. Structures scanned by ultrasound during a pelvic transabdominal examination
Fig. 3.2. Transabdominal (a) and transvaginal (b) examinations of the right adnexal region (di�erent patients), showing the relation between the ovary and uterus (a) and the ovary and iliac vessels (b)
a b
978-9241548540-C003 PRF ml YVR ln ml ml-1-Final Proof.indd 135 6/10/13 10:33 AM
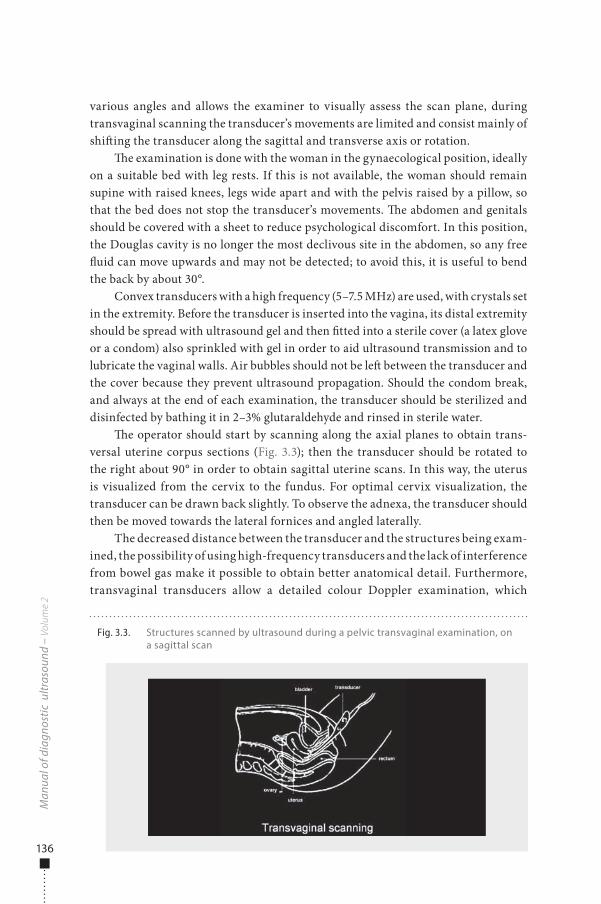
136
various angles and allows the examiner to visually assess the scan plane, during transvaginal scanning the transducer’s movements are limited and consist mainly of shi�ing the transducer along the sagittal and transverse axis or rotation.
�e examination is done with the woman in the gynaecological position, ideally on a suitable bed with leg rests. If this is not available, the woman should remain supine with raised knees, legs wide apart and with the pelvis raised by a pillow, so that the bed does not stop the transducer’s movements. �e abdomen and genitals should be covered with a sheet to reduce psychological discomfort. In this position, the Douglas cavity is no longer the most declivous site in the abdomen, so any free �uid can move upwards and may not be detected; to avoid this, it is useful to bend the back by about 30°.
Convex transducers with a high frequency (5–7.5 MHz) are used, with crystals set in the extremity. Before the transducer is inserted into the vagina, its distal extremity should be spread with ultrasound gel and then �tted into a sterile cover (a latex glove or a condom) also sprinkled with gel in order to aid ultrasound transmission and to lubricate the vaginal walls. Air bubbles should not be le� between the transducer and the cover because they prevent ultrasound propagation. Should the condom break, and always at the end of each examination, the transducer should be sterilized and disinfected by bathing it in 2–3% glutaraldehyde and rinsed in sterile water.
�e operator should start by scanning along the axial planes to obtain trans-versal uterine corpus sections (Fig. 3.3); then the transducer should be rotated to the right about 90° in order to obtain sagittal uterine scans. In this way, the uterus is visualized from the cervix to the fundus. For optimal cervix visualization, the transducer can be drawn back slightly. To observe the adnexa, the transducer should then be moved towards the lateral fornices and angled laterally.
The decreased distance between the transducer and the structures being exam-ined, the possibility of using high-frequency transducers and the lack of interference from bowel gas make it possible to obtain better anatomical detail. Furthermore, transvaginal transducers allow a detailed colour Doppler examination, which
Man
ual o
f dia
gnos
tic u
ltras
ound
– V
olum
e 2
Fig. 3.3. Structures scanned by ultrasound during a pelvic transvaginal examination, on a sagittal scan
978-9241548540-C003 PRF ml YVR ln ml ml-1-Final Proof.indd 136 6/10/13 10:33 AM
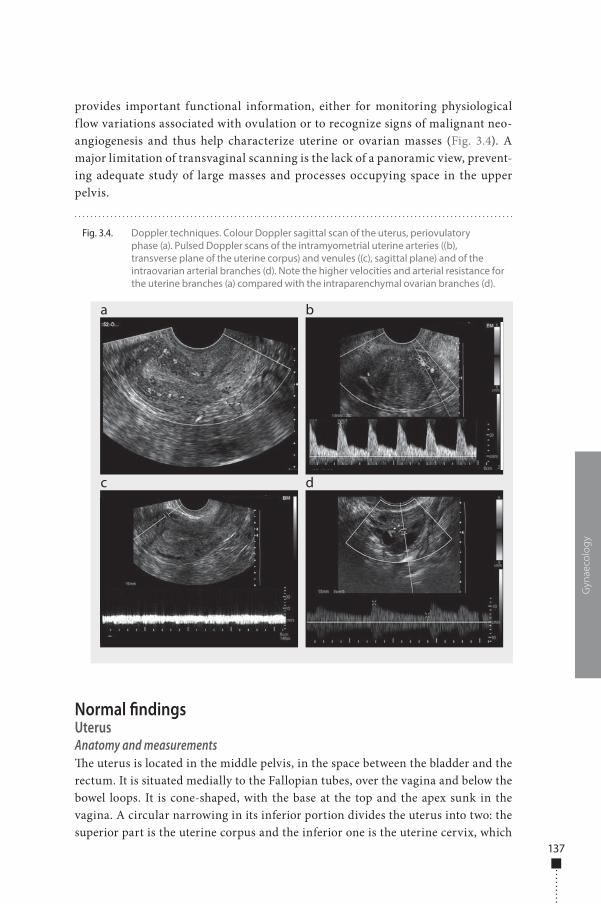
137
provides important functional information, either for monitoring physiological f low variations associated with ovulation or to recognize signs of malignant neo-angiogenesis and thus help characterize uterine or ovarian masses (Fig. 3.4). A major limitation of transvaginal scanning is the lack of a panoramic view, prevent-ing adequate study of large masses and processes occupying space in the upper pelvis.
Normal �ndingsUterusAnatomy and measurements�e uterus is located in the middle pelvis, in the space between the bladder and the rectum. It is situated medially to the Fallopian tubes, over the vagina and below the bowel loops. It is cone-shaped, with the base at the top and the apex sunk in the vagina. A circular narrowing in its inferior portion divides the uterus into two: the superior part is the uterine corpus and the inferior one is the uterine cervix, which
Gyn
aeco
log
y
Fig. 3.4. Doppler techniques. Colour Doppler sagittal scan of the uterus, periovulatory phase (a). Pulsed Doppler scans of the intramyometrial uterine arteries ((b), transverse plane of the uterine corpus) and venules ((c), sagittal plane) and of the intraovarian arterial branches (d). Note the higher velocities and arterial resistance for the uterine branches (a) compared with the intraparenchymal ovarian branches (d).
a
c
b
d
978-9241548540-C003 PRF ml YVR ln ml ml-1-Final Proof.indd 137 6/10/13 10:33 AM
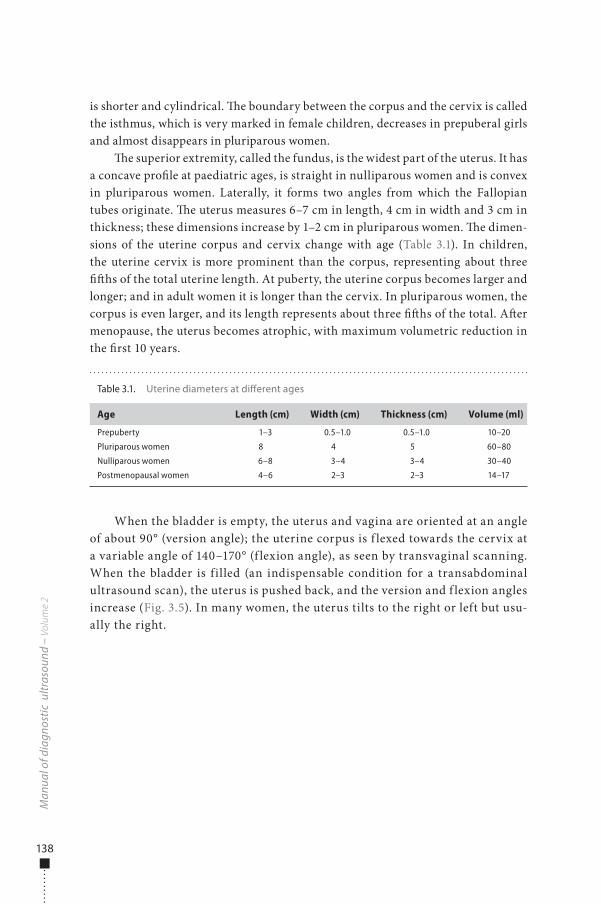
138
is shorter and cylindrical. �e boundary between the corpus and the cervix is called the isthmus, which is very marked in female children, decreases in prepuberal girls and almost disappears in pluriparous women.
�e superior extremity, called the fundus, is the widest part of the uterus. It has a concave pro�le at paediatric ages, is straight in nulliparous women and is convex in pluriparous women. Laterally, it forms two angles from which the Fallopian tubes originate. �e uterus measures 6–7 cm in length, 4 cm in width and 3 cm in thickness; these dimensions increase by 1–2 cm in pluriparous women. �e dimen-sions of the uterine corpus and cervix change with age (Table 3.1). In children, the uterine cervix is more prominent than the corpus, representing about three ��hs of the total uterine length. At puberty, the uterine corpus becomes larger and longer; and in adult women it is longer than the cervix. In pluriparous women, the corpus is even larger, and its length represents about three ��hs of the total. A�er menopause, the uterus becomes atrophic, with maximum volumetric reduction in the �rst 10 years.
When the bladder is empty, the uterus and vagina are oriented at an angle of about 90° (version angle); the uterine corpus is f lexed towards the cervix at a variable angle of 140–170° (f lexion angle), as seen by transvaginal scanning. When the bladder is filled (an indispensable condition for a transabdominal ultrasound scan), the uterus is pushed back, and the version and f lexion angles increase (Fig. 3.5). In many women, the uterus tilts to the right or left but usu-ally the right.
Man
ual o
f dia
gnos
tic u
ltras
ound
– V
olum
e 2
Table 3.1. Uterine diameters at di�erent ages
Age Length (cm) Width (cm) Thickness (cm) Volume (ml)
Prepuberty 1–3 0.5–1.0 0.5–1.0 10–20
Pluriparous women 8 4 5 60–80
Nulliparous women 6–8 3–4 3–4 30–40
Postmenopausal women 4–6 2–3 2–3 14–17
978-9241548540-C003 PRF ml YVR ln ml ml-1-Final Proof.indd 138 6/10/13 10:33 AM
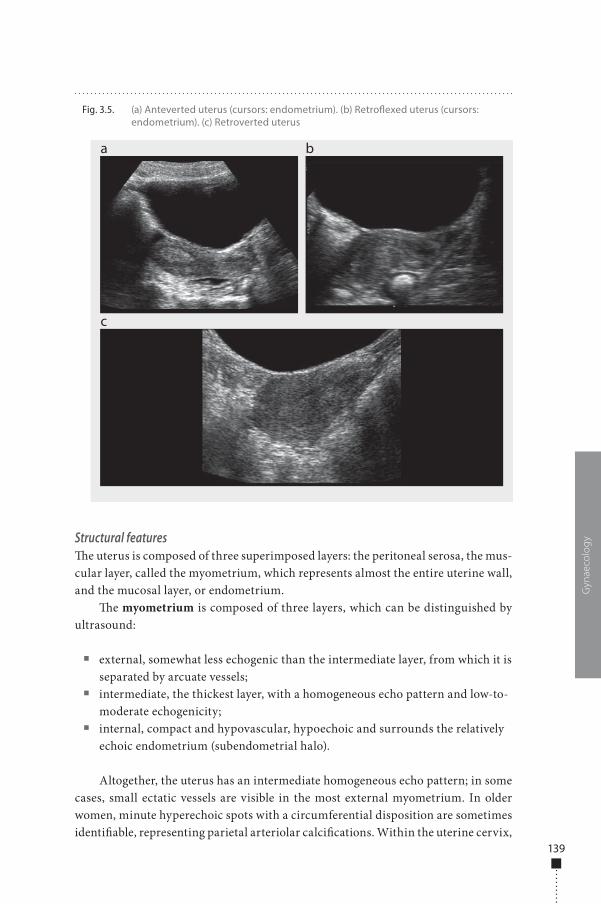
139
Structural features�e uterus is composed of three superimposed layers: the peritoneal serosa, the mus-cular layer, called the myometrium, which represents almost the entire uterine wall, and the mucosal layer, or endometrium.
�e myometrium is composed of three layers, which can be distinguished by ultrasound:
■ external, somewhat less echogenic than the intermediate layer, from which it is separated by arcuate vessels;
■ intermediate, the thickest layer, with a homogeneous echo pattern and low-to-moderate echogenicity;
■ internal, compact and hypovascular, hypoechoic and surrounds the relatively echoic endometrium (subendometrial halo).
Altogether, the uterus has an intermediate homogeneous echo pattern; in some cases, small ectatic vessels are visible in the most external myometrium. In older women, minute hyperechoic spots with a circumferential disposition are sometimes identi�able, representing parietal arteriolar calci�cations. Within the uterine cervix,
Gyn
aeco
log
y
Fig. 3.5. (a) Anteverted uterus (cursors: endometrium). (b) Retro�exed uterus (cursors: endometrium). (c) Retroverted uterus
a
c
b
978-9241548540-C003 PRF ml YVR ln ml ml-1-Final Proof.indd 139 6/10/13 10:33 AM
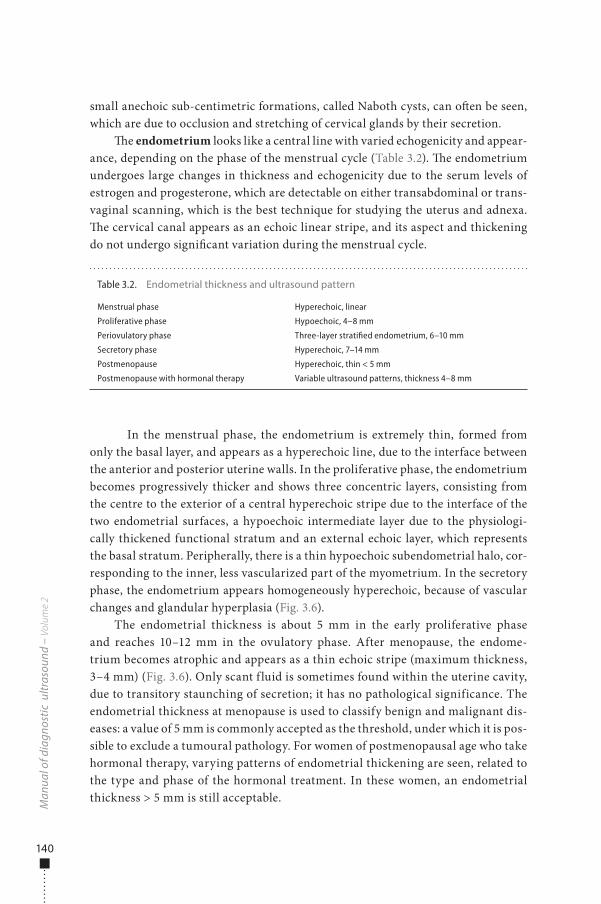
140
small anechoic sub-centimetric formations, called Naboth cysts, can o�en be seen, which are due to occlusion and stretching of cervical glands by their secretion.
�e endometrium looks like a central line with varied echogenicity and appear-ance, depending on the phase of the menstrual cycle (Table 3.2). �e endometrium undergoes large changes in thickness and echogenicity due to the serum levels of estrogen and progesterone, which are detectable on either transabdominal or trans-vaginal scanning, which is the best technique for studying the uterus and adnexa. �e cervical canal appears as an echoic linear stripe, and its aspect and thickening do not undergo signi�cant variation during the menstrual cycle.
In the menstrual phase, the endometrium is extremely thin, formed from only the basal layer, and appears as a hyperechoic line, due to the interface between the anterior and posterior uterine walls. In the proliferative phase, the endometrium becomes progressively thicker and shows three concentric layers, consisting from the centre to the exterior of a central hyperechoic stripe due to the interface of the two endometrial surfaces, a hypoechoic intermediate layer due to the physiologi-cally thickened functional stratum and an external echoic layer, which represents the basal stratum. Peripherally, there is a thin hypoechoic subendometrial halo, cor-responding to the inner, less vascularized part of the myometrium. In the secretory phase, the endometrium appears homogeneously hyperechoic, because of vascular changes and glandular hyperplasia (Fig. 3.6).
The endometrial thickness is about 5 mm in the early proliferative phase and reaches 10–12 mm in the ovulatory phase. After menopause, the endome-trium becomes atrophic and appears as a thin echoic stripe (maximum thickness, 3–4 mm) (Fig. 3.6). Only scant f luid is sometimes found within the uterine cavity, due to transitory staunching of secretion; it has no pathological significance. The endometrial thickness at menopause is used to classify benign and malignant dis-eases: a value of 5 mm is commonly accepted as the threshold, under which it is pos-sible to exclude a tumoural pathology. For women of postmenopausal age who take hormonal therapy, varying patterns of endometrial thickening are seen, related to the type and phase of the hormonal treatment. In these women, an endometrial thickness > 5 mm is still acceptable.
Man
ual o
f dia
gnos
tic u
ltras
ound
– V
olum
e 2
Table 3.2. Endometrial thickness and ultrasound pattern
Menstrual phase Hyperechoic, linear
Proliferative phase Hypoechoic, 4–8 mm
Periovulatory phase Three-layer stratified endometrium, 6–10 mm
Secretory phase Hyperechoic, 7–14 mm
Postmenopause Hyperechoic, thin < 5 mm
Postmenopause with hormonal therapy Variable ultrasound patterns, thickness 4–8 mm
978-9241548540-C003 PRF ml YVR ln ml ml-1-Final Proof.indd 140 6/10/13 10:33 AM
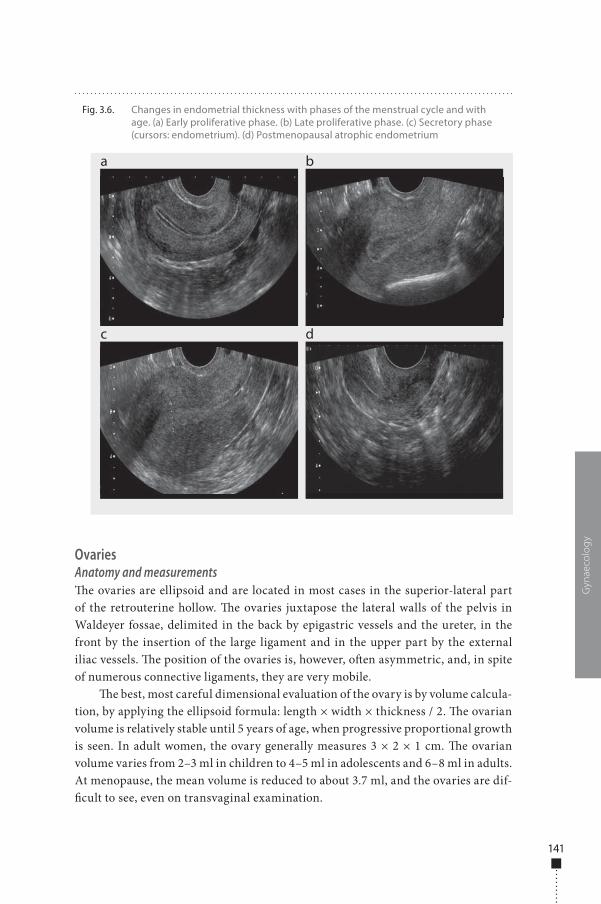
141
OvariesAnatomy and measurements�e ovaries are ellipsoid and are located in most cases in the superior-lateral part of the retrouterine hollow. �e ovaries juxtapose the lateral walls of the pelvis in Waldeyer fossae, delimited in the back by epigastric vessels and the ureter, in the front by the insertion of the large ligament and in the upper part by the external iliac vessels. �e position of the ovaries is, however, o�en asymmetric, and, in spite of numerous connective ligaments, they are very mobile.
�e best, most careful dimensional evaluation of the ovary is by volume calcula-tion, by applying the ellipsoid formula: length × width × thickness / 2. �e ovarian volume is relatively stable until 5 years of age, when progressive proportional growth is seen. In adult women, the ovary generally measures 3 × 2 × 1 cm. �e ovarian volume varies from 2–3 ml in children to 4–5 ml in adolescents and 6–8 ml in adults. At menopause, the mean volume is reduced to about 3.7 ml, and the ovaries are dif-�cult to see, even on transvaginal examination.
Gyn
aeco
log
y
Fig. 3.6. Changes in endometrial thickness with phases of the menstrual cycle and with age. (a) Early proliferative phase. (b) Late proliferative phase. (c) Secretory phase (cursors: endometrium). (d) Postmenopausal atrophic endometrium
a
c
b
d
978-9241548540-C003 PRF ml YVR ln ml ml-1-Final Proof.indd 141 6/10/13 10:33 AM
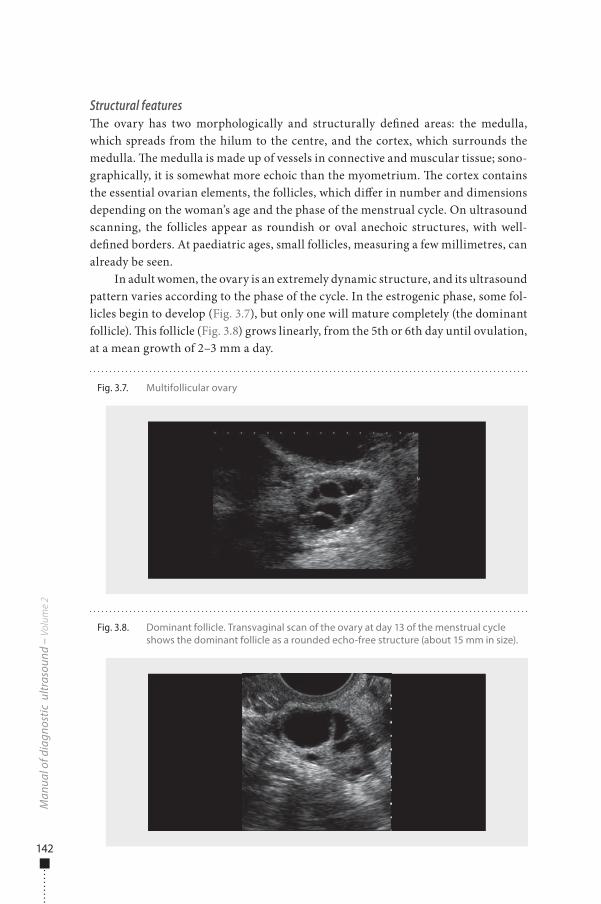
142
Structural features�e ovary has two morphologically and structurally de�ned areas: the medulla, which spreads from the hilum to the centre, and the cortex, which surrounds the medulla. �e medulla is made up of vessels in connective and muscular tissue; sono-graphically, it is somewhat more echoic than the myometrium. �e cortex contains the essential ovarian elements, the follicles, which di�er in number and dimensions depending on the woman’s age and the phase of the menstrual cycle. On ultrasound scanning, the follicles appear as roundish or oval anechoic structures, with well-de�ned borders. At paediatric ages, small follicles, measuring a few millimetres, can already be seen.
In adult women, the ovary is an extremely dynamic structure, and its ultrasound pattern varies according to the phase of the cycle. In the estrogenic phase, some fol-licles begin to develop (Fig. 3.7), but only one will mature completely (the dominant follicle). �is follicle (Fig. 3.8) grows linearly, from the 5th or 6th day until ovulation, at a mean growth of 2–3 mm a day.
Man
ual o
f dia
gnos
tic u
ltras
ound
– V
olum
e 2
Fig. 3.7. Multifollicular ovary
Fig. 3.8. Dominant follicle. Transvaginal scan of the ovary at day 13 of the menstrual cycle shows the dominant follicle as a rounded echo-free structure (about 15 mm in size).
978-9241548540-C003 PRF ml YVR ln ml ml-1-Final Proof.indd 142 6/10/13 10:33 AM
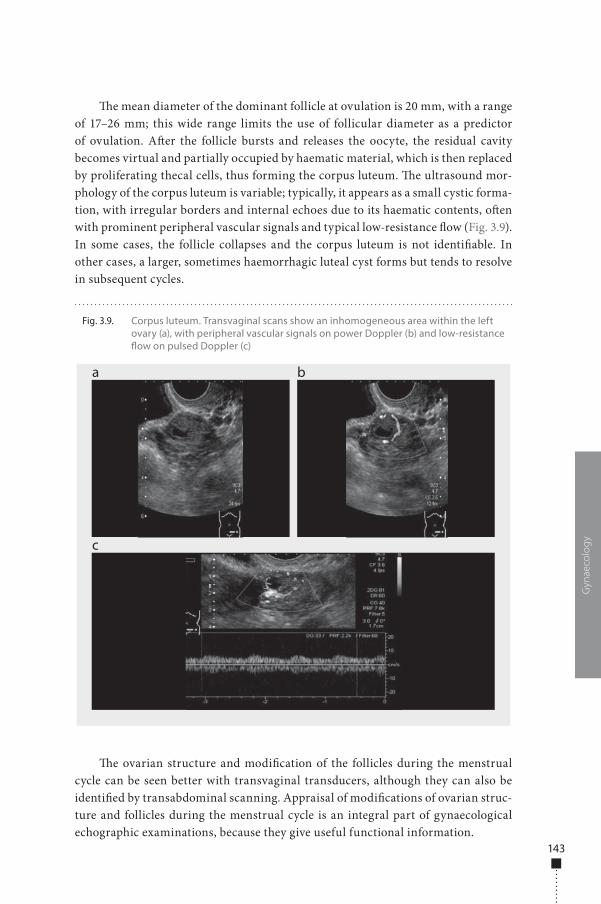
143
�e mean diameter of the dominant follicle at ovulation is 20 mm, with a range of 17–26 mm; this wide range limits the use of follicular diameter as a predictor of ovulation. A�er the follicle bursts and releases the oocyte, the residual cavity becomes virtual and partially occupied by haematic material, which is then replaced by proliferating thecal cells, thus forming the corpus luteum. �e ultrasound mor-phology of the corpus luteum is variable; typically, it appears as a small cystic forma-tion, with irregular borders and internal echoes due to its haematic contents, o�en with prominent peripheral vascular signals and typical low-resistance �ow (Fig. 3.9). In some cases, the follicle collapses and the corpus luteum is not identi�able. In other cases, a larger, sometimes haemorrhagic luteal cyst forms but tends to resolve in subsequent cycles.
�e ovarian structure and modi�cation of the follicles during the menstrual cycle can be seen better with transvaginal transducers, although they can also be identi�ed by transabdominal scanning. Appraisal of modi�cations of ovarian struc-ture and follicles during the menstrual cycle is an integral part of gynaecological echographic examinations, because they give useful functional information.
Gyn
aeco
log
y
Fig. 3.9. Corpus luteum. Transvaginal scans show an inhomogeneous area within the left ovary (a), with peripheral vascular signals on power Doppler (b) and low-resistance �ow on pulsed Doppler (c)
a
c
b
978-9241548540-C003 PRF ml YVR ln ml ml-1-Final Proof.indd 143 6/10/13 10:33 AM
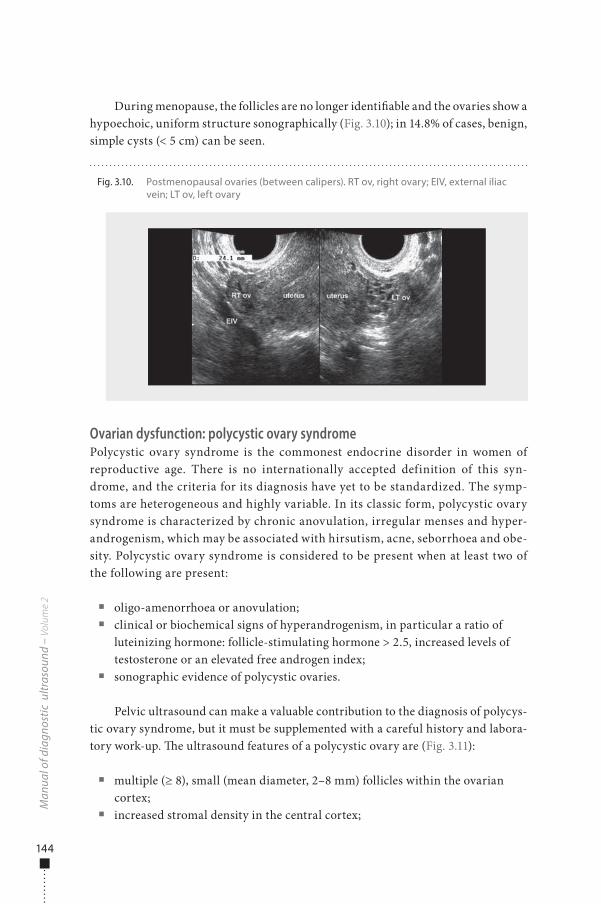
144
During menopause, the follicles are no longer identi�able and the ovaries show a hypoechoic, uniform structure sonographically (Fig. 3.10); in 14.8% of cases, benign, simple cysts (< 5 cm) can be seen.
Ovarian dysfunction: polycystic ovary syndromePolycystic ovary syndrome is the commonest endocrine disorder in women of reproductive age. There is no internationally accepted definition of this syn-drome, and the criteria for its diagnosis have yet to be standardized. The symp-toms are heterogeneous and highly variable. In its classic form, polycystic ovary syndrome is characterized by chronic anovulation, irregular menses and hyper-androgenism, which may be associated with hirsutism, acne, seborrhoea and obe-sity. Polycystic ovary syndrome is considered to be present when at least two of the following are present:
■ oligo-amenorrhoea or anovulation; ■ clinical or biochemical signs of hyperandrogenism, in particular a ratio of
luteinizing hormone: follicle-stimulating hormone > 2.5, increased levels of testosterone or an elevated free androgen index;
■ sonographic evidence of polycystic ovaries.
Pelvic ultrasound can make a valuable contribution to the diagnosis of polycys-tic ovary syndrome, but it must be supplemented with a careful history and labora-tory work-up. �e ultrasound features of a polycystic ovary are (Fig. 3.11):
■ multiple (≥ 8), small (mean diameter, 2–8 mm) follicles within the ovarian cortex;
■ increased stromal density in the central cortex;
Man
ual o
f dia
gnos
tic u
ltras
ound
– V
olum
e 2
Fig. 3.10. Postmenopausal ovaries (between calipers). RT ov, right ovary; EIV, external iliac vein; LT ov, left ovary
978-9241548540-C003 PRF ml YVR ln ml ml-1-Final Proof.indd 144 6/10/13 10:33 AM
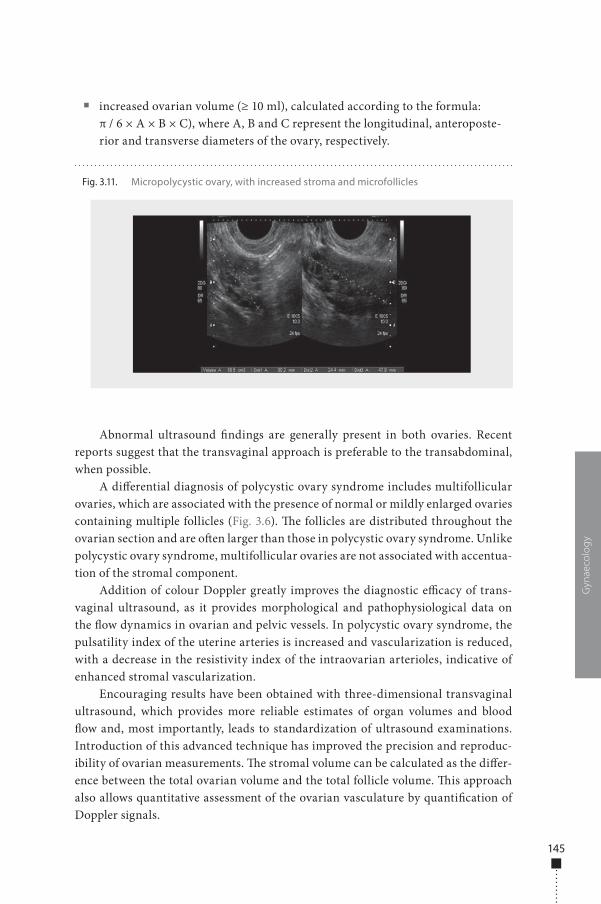
145
■ increased ovarian volume (≥ 10 ml), calculated according to the formula: π / 6 × A × B × C), where A, B and C represent the longitudinal, anteroposte-rior and transverse diameters of the ovary, respectively.
Abnormal ultrasound �ndings are generally present in both ovaries. Recent reports suggest that the transvaginal approach is preferable to the transabdominal, when possible.
A di�erential diagnosis of polycystic ovary syndrome includes multifollicular ovaries, which are associated with the presence of normal or mildly enlarged ovaries containing multiple follicles (Fig. 3.6). �e follicles are distributed throughout the ovarian section and are o�en larger than those in polycystic ovary syndrome. Unlike polycystic ovary syndrome, multifollicular ovaries are not associated with accentua-tion of the stromal component.
Addition of colour Doppler greatly improves the diagnostic e�cacy of trans-vaginal ultrasound, as it provides morphological and pathophysiological data on the �ow dynamics in ovarian and pelvic vessels. In polycystic ovary syndrome, the pulsatility index of the uterine arteries is increased and vascularization is reduced, with a decrease in the resistivity index of the intraovarian arterioles, indicative of enhanced stromal vascularization.
Encouraging results have been obtained with three-dimensional transvaginal ultrasound, which provides more reliable estimates of organ volumes and blood �ow and, most importantly, leads to standardization of ultrasound examinations. Introduction of this advanced technique has improved the precision and reproduc-ibility of ovarian measurements. �e stromal volume can be calculated as the di�er-ence between the total ovarian volume and the total follicle volume. �is approach also allows quantitative assessment of the ovarian vasculature by quanti�cation of Doppler signals.
Gyn
aeco
log
y
Fig. 3.11. Micropolycystic ovary, with increased stroma and microfollicles
978-9241548540-C003 PRF ml YVR ln ml ml-1-Final Proof.indd 145 6/10/13 10:33 AM
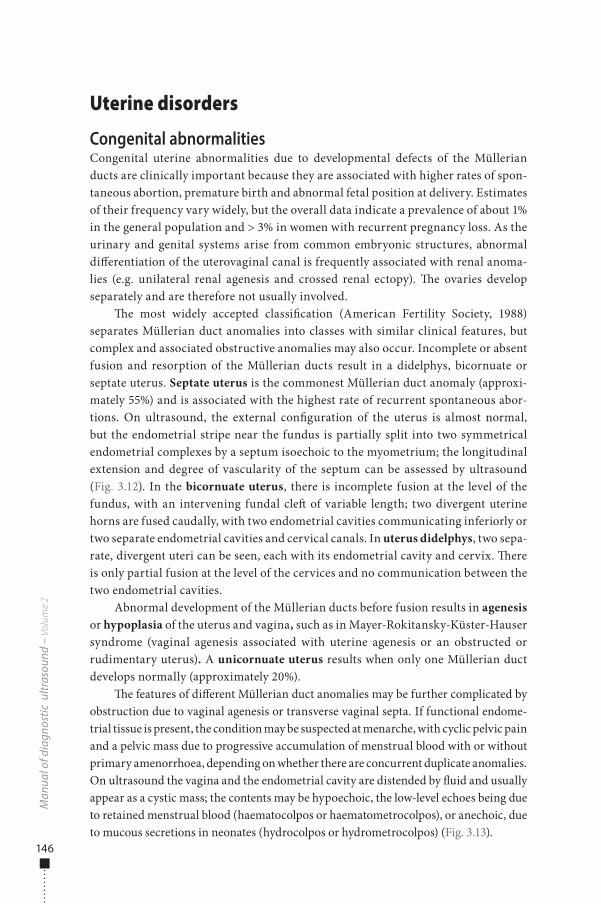
146
Uterine disorders
Congenital abnormalitiesCongenital uterine abnormalities due to developmental defects of the Müllerian ducts are clinically important because they are associated with higher rates of spon-taneous abortion, premature birth and abnormal fetal position at delivery. Estimates of their frequency vary widely, but the overall data indicate a prevalence of about 1% in the general population and > 3% in women with recurrent pregnancy loss. As the urinary and genital systems arise from common embryonic structures, abnormal di�erentiation of the uterovaginal canal is frequently associated with renal anoma-lies (e.g. unilateral renal agenesis and crossed renal ectopy). �e ovaries develop separately and are therefore not usually involved.
�e most widely accepted classi�cation (American Fertility Society, 1988) separates Müllerian duct anomalies into classes with similar clinical features, but complex and associated obstructive anomalies may also occur. Incomplete or absent fusion and resorption of the Müllerian ducts result in a didelphys, bicornuate or septate uterus. Septate uterus is the commonest Müllerian duct anomaly (approxi-mately 55%) and is associated with the highest rate of recurrent spontaneous abor-tions. On ultrasound, the external con�guration of the uterus is almost normal, but the endometrial stripe near the fundus is partially split into two symmetrical endometrial complexes by a septum isoechoic to the myometrium; the longitudinal extension and degree of vascularity of the septum can be assessed by ultrasound (Fig. 3.12). In the bicornuate uterus, there is incomplete fusion at the level of the fundus, with an intervening fundal cle� of variable length; two divergent uterine horns are fused caudally, with two endometrial cavities communicating inferiorly or two separate endometrial cavities and cervical canals. In uterus didelphys, two sepa-rate, divergent uteri can be seen, each with its endometrial cavity and cervix. �ere is only partial fusion at the level of the cervices and no communication between the two endometrial cavities.
Abnormal development of the Müllerian ducts before fusion results in agenesis or hypoplasia of the uterus and vagina, such as in Mayer-Rokitansky-Küster-Hauser syndrome (vaginal agenesis associated with uterine agenesis or an obstructed or rudimentary uterus). A unicornuate uterus results when only one Müllerian duct develops normally (approximately 20%).
�e features of di�erent Müllerian duct anomalies may be further complicated by obstruction due to vaginal agenesis or transverse vaginal septa. If functional endome-trial tissue is present, the condition may be suspected at menarche, with cyclic pelvic pain and a pelvic mass due to progressive accumulation of menstrual blood with or without primary amenorrhoea, depending on whether there are concurrent duplicate anomalies. On ultrasound the vagina and the endometrial cavity are distended by �uid and usually appear as a cystic mass; the contents may be hypoechoic, the low-level echoes being due to retained menstrual blood (haematocolpos or haematometrocolpos), or anechoic, due to mucous secretions in neonates (hydrocolpos or hydrometrocolpos) (Fig. 3.13).
Man
ual o
f dia
gnos
tic u
ltras
ound
– V
olum
e 2
978-9241548540-C003 PRF ml YVR ln ml ml-1-Final Proof.indd 146 6/10/13 10:33 AM
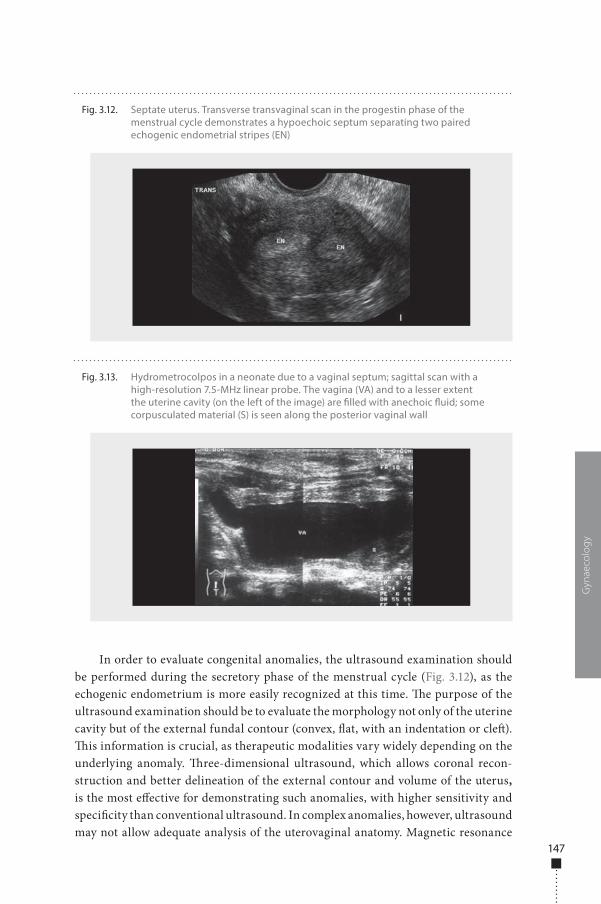
147
In order to evaluate congenital anomalies, the ultrasound examination should be performed during the secretory phase of the menstrual cycle (Fig. 3.12), as the echogenic endometrium is more easily recognized at this time. �e purpose of the ultrasound examination should be to evaluate the morphology not only of the uterine cavity but of the external fundal contour (convex, �at, with an indentation or cle�). �is information is crucial, as therapeutic modalities vary widely depending on the underlying anomaly. �ree-dimensional ultrasound, which allows coronal recon-struction and better delineation of the external contour and volume of the uterus, is the most e�ective for demonstrating such anomalies, with higher sensitivity and speci�city than conventional ultrasound. In complex anomalies, however, ultrasound may not allow adequate analysis of the uterovaginal anatomy. Magnetic resonance
Gyn
aeco
log
y
Fig. 3.12. Septate uterus. Transverse transvaginal scan in the progestin phase of the menstrual cycle demonstrates a hypoechoic septum separating two paired echogenic endometrial stripes (EN)
Fig. 3.13. Hydrometrocolpos in a neonate due to a vaginal septum; sagittal scan with a high-resolution 7.5-MHz linear probe. The vagina (VA) and to a lesser extent the uterine cavity (on the left of the image) are �lled with anechoic �uid; some corpusculated material (S) is seen along the posterior vaginal wall
978-9241548540-C003 PRF ml YVR ln ml ml-1-Final Proof.indd 147 6/10/13 10:33 AM
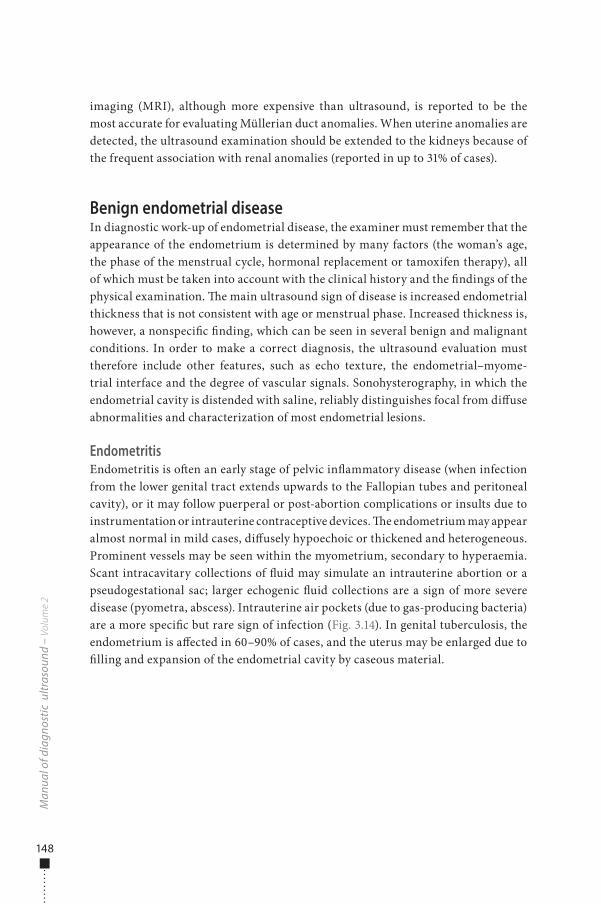
148
imaging (MRI), although more expensive than ultrasound, is reported to be the most accurate for evaluating Müllerian duct anomalies. When uterine anomalies are detected, the ultrasound examination should be extended to the kidneys because of the frequent association with renal anomalies (reported in up to 31% of cases).
Benign endometrial diseaseIn diagnostic work-up of endometrial disease, the examiner must remember that the appearance of the endometrium is determined by many factors (the woman’s age, the phase of the menstrual cycle, hormonal replacement or tamoxifen therapy), all of which must be taken into account with the clinical history and the �ndings of the physical examination. �e main ultrasound sign of disease is increased endometrial thickness that is not consistent with age or menstrual phase. Increased thickness is, however, a nonspeci�c �nding, which can be seen in several benign and malignant conditions. In order to make a correct diagnosis, the ultrasound evaluation must therefore include other features, such as echo texture, the endometrial–myome-trial interface and the degree of vascular signals. Sonohysterography, in which the endometrial cavity is distended with saline, reliably distinguishes focal from di�use abnormalities and characterization of most endometrial lesions.
EndometritisEndometritis is o�en an early stage of pelvic in�ammatory disease (when infection from the lower genital tract extends upwards to the Fallopian tubes and peritoneal cavity), or it may follow puerperal or post-abortion complications or insults due to instrumentation or intrauterine contraceptive devices. �e endometrium may appear almost normal in mild cases, di�usely hypoechoic or thickened and heterogeneous. Prominent vessels may be seen within the myometrium, secondary to hyperaemia. Scant intracavitary collections of �uid may simulate an intrauterine abortion or a pseudogestational sac; larger echogenic �uid collections are a sign of more severe disease (pyometra, abscess). Intrauterine air pockets (due to gas-producing bacteria) are a more speci�c but rare sign of infection (Fig. 3.14). In genital tuberculosis, the endometrium is a�ected in 60–90% of cases, and the uterus may be enlarged due to �lling and expansion of the endometrial cavity by caseous material.
Man
ual o
f dia
gnos
tic u
ltras
ound
– V
olum
e 2
978-9241548540-C003 PRF ml YVR ln ml ml-1-Final Proof.indd 148 6/10/13 10:33 AM
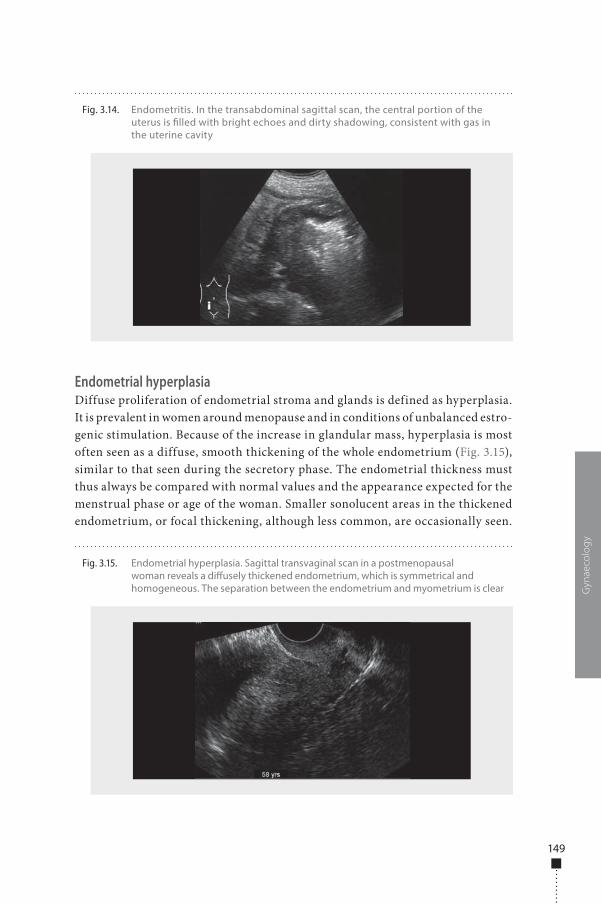
149
Endometrial hyperplasiaDiffuse proliferation of endometrial stroma and glands is defined as hyperplasia. It is prevalent in women around menopause and in conditions of unbalanced estro-genic stimulation. Because of the increase in glandular mass, hyperplasia is most often seen as a diffuse, smooth thickening of the whole endometrium (Fig. 3.15), similar to that seen during the secretory phase. The endometrial thickness must thus always be compared with normal values and the appearance expected for the menstrual phase or age of the woman. Smaller sonolucent areas in the thickened endometrium, or focal thickening, although less common, are occasionally seen.
Gyn
aeco
log
y
Fig. 3.14. Endometritis. In the transabdominal sagittal scan, the central portion of the uterus is �lled with bright echoes and dirty shadowing, consistent with gas in the uterine cavity
Fig. 3.15. Endometrial hyperplasia. Sagittal transvaginal scan in a postmenopausal woman reveals a di�usely thickened endometrium, which is symmetrical and homogeneous. The separation between the endometrium and myometrium is clear
978-9241548540-C003 PRF ml YVR ln ml ml-1-Final Proof.indd 149 6/10/13 10:33 AM
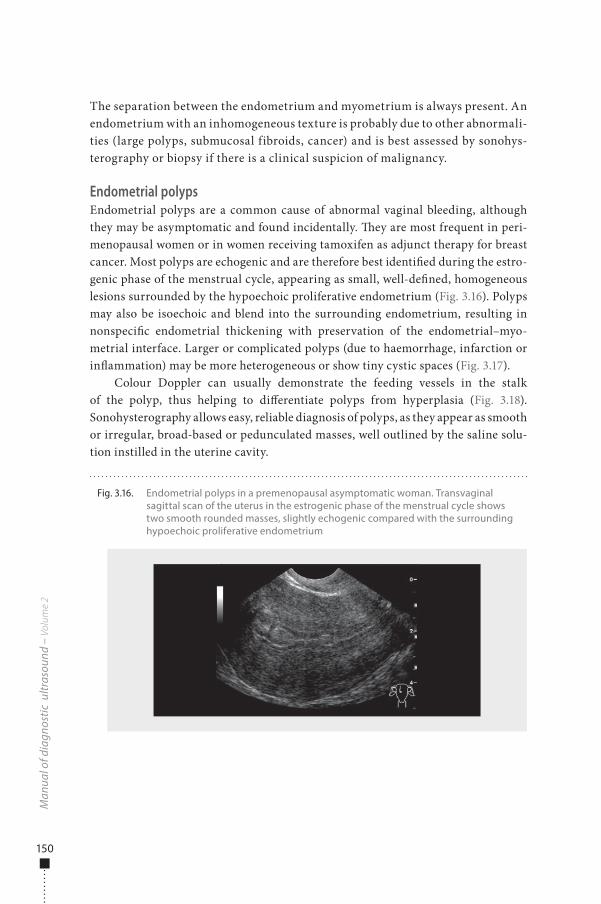
150
The separation between the endometrium and myometrium is always present. An endometrium with an inhomogeneous texture is probably due to other abnormali-ties (large polyps, submucosal fibroids, cancer) and is best assessed by sonohys-terography or biopsy if there is a clinical suspicion of malignancy.
Endometrial polypsEndometrial polyps are a common cause of abnormal vaginal bleeding, although they may be asymptomatic and found incidentally. �ey are most frequent in peri-menopausal women or in women receiving tamoxifen as adjunct therapy for breast cancer. Most polyps are echogenic and are therefore best identi�ed during the estro-genic phase of the menstrual cycle, appearing as small, well-de�ned, homogeneous lesions surrounded by the hypoechoic proliferative endometrium (Fig. 3.16). Polyps may also be isoechoic and blend into the surrounding endometrium, resulting in nonspeci�c endometrial thickening with preservation of the endometrial–myo-metrial interface. Larger or complicated polyps (due to haemorrhage, infarction or in�ammation) may be more heterogeneous or show tiny cystic spaces (Fig. 3.17).
Colour Doppler can usually demonstrate the feeding vessels in the stalk of the polyp, thus helping to di�erentiate polyps from hyperplasia (Fig. 3.18). Sonohysterography allows easy, reliable diagnosis of polyps, as they appear as smooth or irregular, broad-based or pedunculated masses, well outlined by the saline solu-tion instilled in the uterine cavity.
Man
ual o
f dia
gnos
tic u
ltras
ound
– V
olum
e 2
Fig. 3.16. Endometrial polyps in a premenopausal asymptomatic woman. Transvaginal sagittal scan of the uterus in the estrogenic phase of the menstrual cycle shows two smooth rounded masses, slightly echogenic compared with the surrounding hypoechoic proliferative endometrium
978-9241548540-C003 PRF ml YVR ln ml ml-1-Final Proof.indd 150 6/10/13 10:33 AM
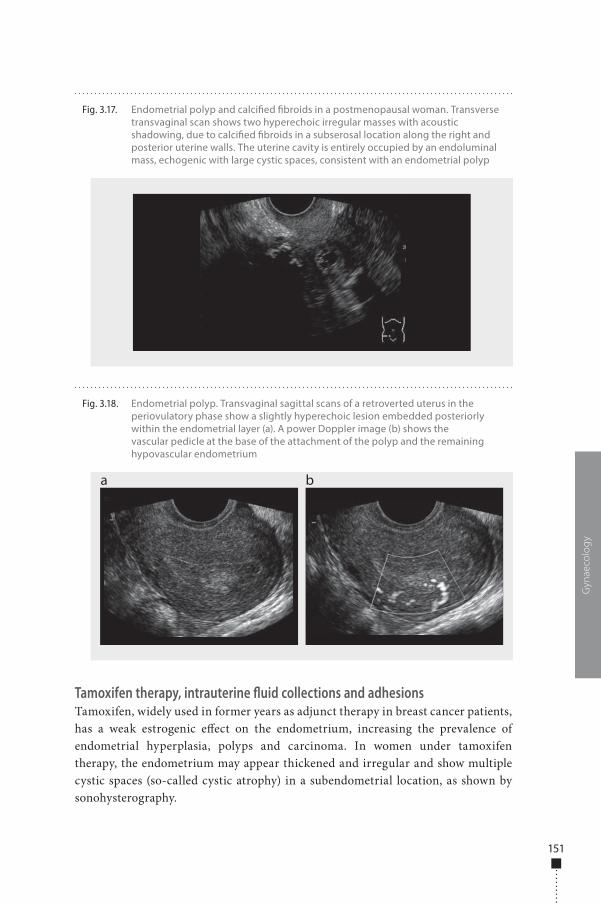
151
Tamoxifen therapy, intrauterine fluid collections and adhesionsTamoxifen, widely used in former years as adjunct therapy in breast cancer patients, has a weak estrogenic e�ect on the endometrium, increasing the prevalence of endometrial hyperplasia, polyps and carcinoma. In women under tamoxifen therapy, the endometrium may appear thickened and irregular and show multiple cystic spaces (so-called cystic atrophy) in a subendometrial location, as shown by sonohysterography.
Gyn
aeco
log
y
Fig. 3.17. Endometrial polyp and calci�ed �broids in a postmenopausal woman. Transverse transvaginal scan shows two hyperechoic irregular masses with acoustic shadowing, due to calci�ed �broids in a subserosal location along the right and posterior uterine walls. The uterine cavity is entirely occupied by an endoluminal mass, echogenic with large cystic spaces, consistent with an endometrial polyp
Fig. 3.18. Endometrial polyp. Transvaginal sagittal scans of a retroverted uterus in the periovulatory phase show a slightly hyperechoic lesion embedded posteriorly within the endometrial layer (a). A power Doppler image (b) shows the vascular pedicle at the base of the attachment of the polyp and the remaining hypovascular endometrium
a b
978-9241548540-C003 PRF ml YVR ln ml ml-1-Final Proof.indd 151 6/10/13 10:33 AM
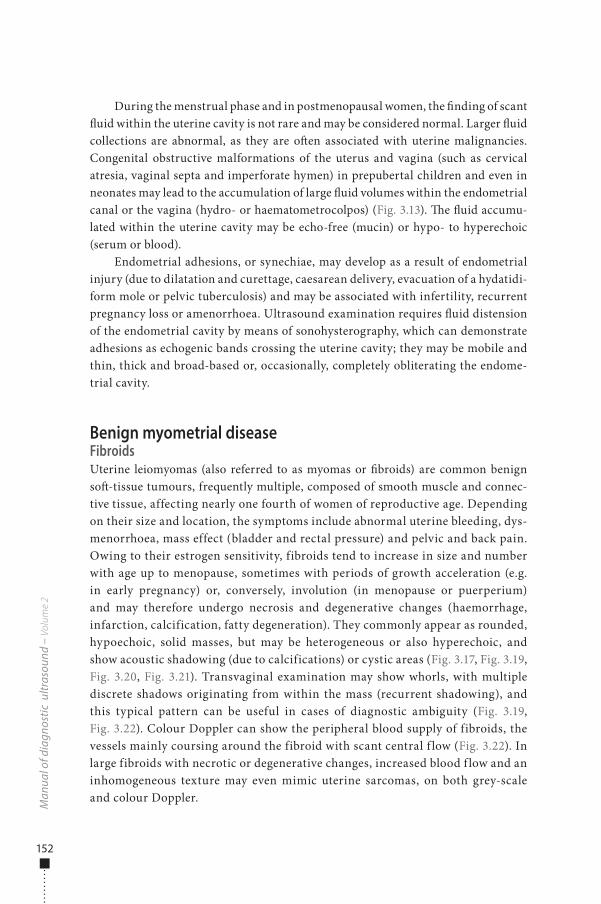
152
During the menstrual phase and in postmenopausal women, the �nding of scant �uid within the uterine cavity is not rare and may be considered normal. Larger �uid collections are abnormal, as they are o�en associated with uterine malignancies. Congenital obstructive malformations of the uterus and vagina (such as cervical atresia, vaginal septa and imperforate hymen) in prepubertal children and even in neonates may lead to the accumulation of large �uid volumes within the endometrial canal or the vagina (hydro- or haematometrocolpos) (Fig. 3.13). �e �uid accumu-lated within the uterine cavity may be echo-free (mucin) or hypo- to hyperechoic (serum or blood).
Endometrial adhesions, or synechiae, may develop as a result of endometrial injury (due to dilatation and curettage, caesarean delivery, evacuation of a hydatidi-form mole or pelvic tuberculosis) and may be associated with infertility, recurrent pregnancy loss or amenorrhoea. Ultrasound examination requires �uid distension of the endometrial cavity by means of sonohysterography, which can demonstrate adhesions as echogenic bands crossing the uterine cavity; they may be mobile and thin, thick and broad-based or, occasionally, completely obliterating the endome-trial cavity.
Benign myometrial diseaseFibroidsUterine leiomyomas (also referred to as myomas or �broids) are common benign so�-tissue tumours, frequently multiple, composed of smooth muscle and connec-tive tissue, affecting nearly one fourth of women of reproductive age. Depending on their size and location, the symptoms include abnormal uterine bleeding, dys-menorrhoea, mass effect (bladder and rectal pressure) and pelvic and back pain. Owing to their estrogen sensitivity, fibroids tend to increase in size and number with age up to menopause, sometimes with periods of growth acceleration (e.g. in early pregnancy) or, conversely, involution (in menopause or puerperium) and may therefore undergo necrosis and degenerative changes (haemorrhage, infarction, calcification, fatty degeneration). They commonly appear as rounded, hypoechoic, solid masses, but may be heterogeneous or also hyperechoic, and show acoustic shadowing (due to calcifications) or cystic areas (Fig. 3.17, Fig. 3.19, Fig. 3.20, Fig. 3.21). Transvaginal examination may show whorls, with multiple discrete shadows originating from within the mass (recurrent shadowing), and this typical pattern can be useful in cases of diagnostic ambiguity (Fig. 3.19, Fig. 3.22). Colour Doppler can show the peripheral blood supply of fibroids, the vessels mainly coursing around the fibroid with scant central f low (Fig. 3.22). In large fibroids with necrotic or degenerative changes, increased blood f low and an inhomogeneous texture may even mimic uterine sarcomas, on both grey-scale and colour Doppler.
Man
ual o
f dia
gnos
tic u
ltras
ound
– V
olum
e 2
978-9241548540-C003 PRF ml YVR ln ml ml-1-Final Proof.indd 152 6/10/13 10:33 AM
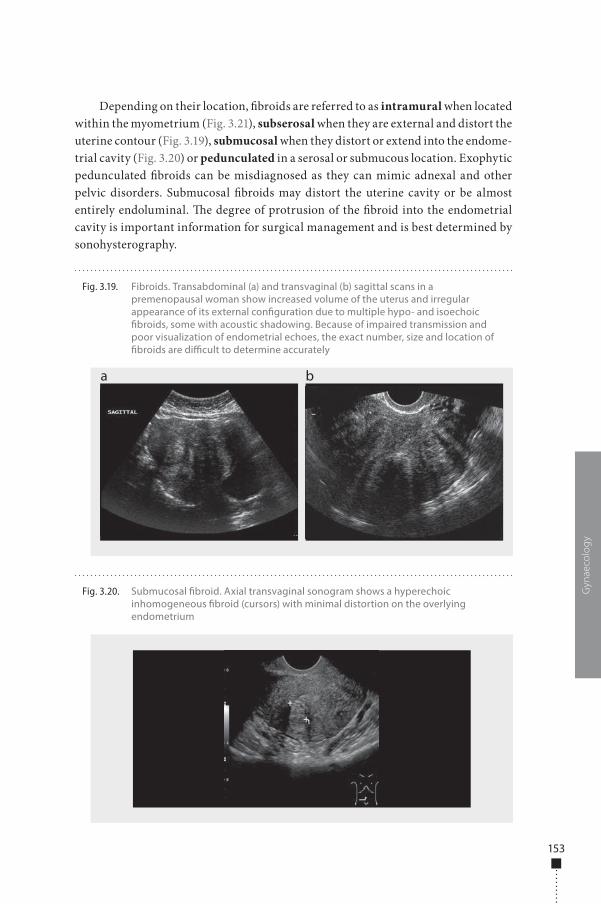
153
Depending on their location, �broids are referred to as intramural when located within the myometrium (Fig. 3.21), subserosal when they are external and distort the uterine contour (Fig. 3.19), submucosal when they distort or extend into the endome-trial cavity (Fig. 3.20) or pedunculated in a serosal or submucous location. Exophytic pedunculated �broids can be misdiagnosed as they can mimic adnexal and other pelvic disorders. Submucosal �broids may distort the uterine cavity or be almost entirely endoluminal. �e degree of protrusion of the �broid into the endometrial cavity is important information for surgical management and is best determined by sonohysterography.
Gyn
aeco
log
y
Fig. 3.19. Fibroids. Transabdominal (a) and transvaginal (b) sagittal scans in a premenopausal woman show increased volume of the uterus and irregular appearance of its external con�guration due to multiple hypo- and isoechoic �broids, some with acoustic shadowing. Because of impaired transmission and poor visualization of endometrial echoes, the exact number, size and location of �broids are di�cult to determine accurately
a b
Fig. 3.20. Submucosal �broid. Axial transvaginal sonogram shows a hyperechoic inhomogeneous �broid (cursors) with minimal distortion on the overlying endometrium
978-9241548540-C003 PRF ml YVR ln ml ml-1-Final Proof.indd 153 6/10/13 10:33 AM
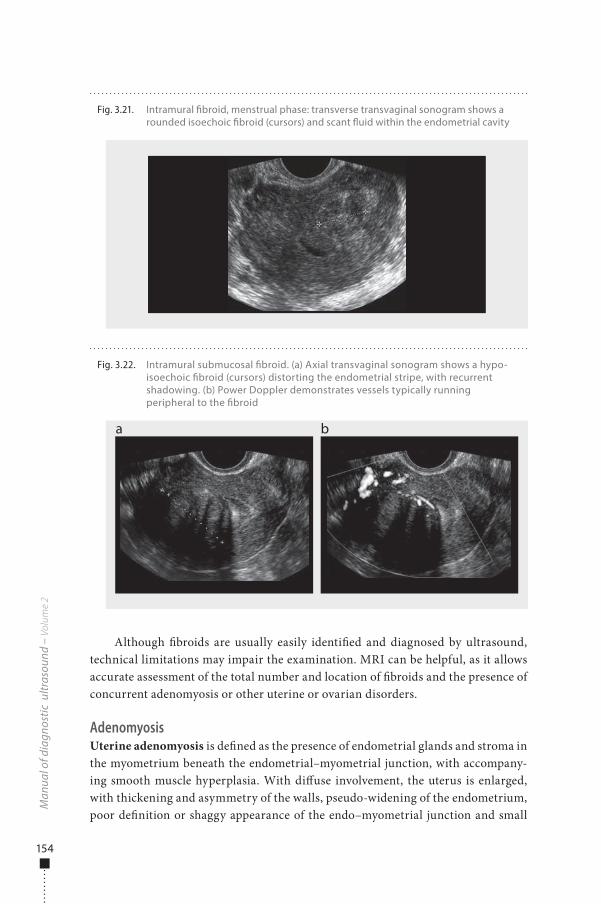
154
Although �broids are usually easily identi�ed and diagnosed by ultrasound, technical limitations may impair the examination. MRI can be helpful, as it allows accurate assessment of the total number and location of �broids and the presence of concurrent adenomyosis or other uterine or ovarian disorders.
AdenomyosisUterine adenomyosis is de�ned as the presence of endometrial glands and stroma in the myometrium beneath the endometrial–myometrial junction, with accompany-ing smooth muscle hyperplasia. With di�use involvement, the uterus is enlarged, with thickening and asymmetry of the walls, pseudo-widening of the endometrium, poor de�nition or shaggy appearance of the endo–myometrial junction and small
Man
ual o
f dia
gnos
tic u
ltras
ound
– V
olum
e 2
Fig. 3.22. Intramural submucosal �broid. (a) Axial transvaginal sonogram shows a hypo-isoechoic �broid (cursors) distorting the endometrial stripe, with recurrent shadowing. (b) Power Doppler demonstrates vessels typically running peripheral to the �broid
a b
Fig. 3.21. Intramural �broid, menstrual phase: transverse transvaginal sonogram shows a rounded isoechoic �broid (cursors) and scant �uid within the endometrial cavity
978-9241548540-C003 PRF ml YVR ln ml ml-1-Final Proof.indd 154 6/10/13 10:33 AM

155
cyst-like areas of �uid (usually < 5 mm) within the myometrium (Fig. 3.23). With focal involvement, the myometrium is thickened and heterogeneous, with echogenic linear striations, poorly de�ned echogenic nodules or circumscribed hypoechoic nodules resembling a �broid but with ill-de�ned margins and minimal mass e�ect. In contrast to �broids, the adenomyosis nodules have blood �ow (raindrop appearance).
Notwithstanding these many signs, the ultrasound detection of adenomyo-sis, and especially di�erential diagnosis from �broids, can be di�cult, so that this condition is frequently overlooked, especially when uterine �broids coexist. As the therapeutic options di�er, equivocal ultrasound �ndings (�broids or adenomyosis) can be resolved by MRI to assess both adenomyosis and pelvic endometriosis with greater accuracy.
Gyn
aeco
log
y
Fig. 3.23. Adenomyosis. Transvaginal transverse (a), (b) and sagittal (c) sonograms in di�erent patients. (a) Di�usely heterogeneous myometrium and poorly de�ned endometrium, with a tiny cystic space posteriorly at the endo–myometrial junction. (b) Di�usely heterogeneous myometrium with multiple ill-de�ned and irregular hypoechoic areas scattered throughout the posterior uterine wall; note the enhanced transmission near the hyperechoic secretory endometrium. (c) Marked distortion of the endometrial stripe, with poor de�nition of the endo–myometrial junction anteriorly and tiny cystic spaces within the anterior myometrium
a
c
b
978-9241548540-C003 PRF ml YVR ln ml ml-1-Final Proof.indd 155 6/10/13 10:33 AM
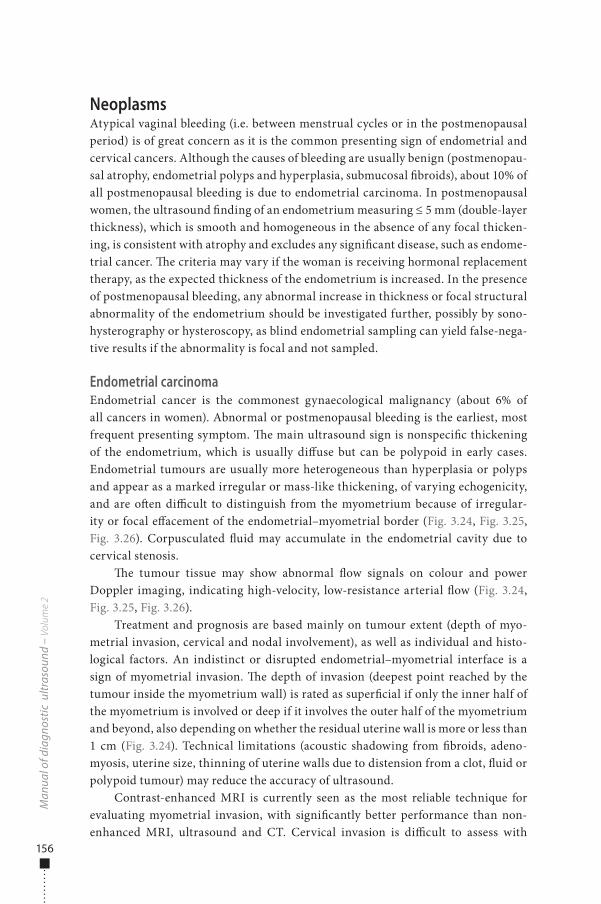
156
NeoplasmsAtypical vaginal bleeding (i.e. between menstrual cycles or in the postmenopausal period) is of great concern as it is the common presenting sign of endometrial and cervical cancers. Although the causes of bleeding are usually benign (postmenopau-sal atrophy, endometrial polyps and hyperplasia, submucosal �broids), about 10% of all postmenopausal bleeding is due to endometrial carcinoma. In postmenopausal women, the ultrasound �nding of an endometrium measuring ≤ 5 mm (double-layer thickness), which is smooth and homogeneous in the absence of any focal thicken-ing, is consistent with atrophy and excludes any signi�cant disease, such as endome-trial cancer. �e criteria may vary if the woman is receiving hormonal replacement therapy, as the expected thickness of the endometrium is increased. In the presence of postmenopausal bleeding, any abnormal increase in thickness or focal structural abnormality of the endometrium should be investigated further, possibly by sono-hysterography or hysteroscopy, as blind endometrial sampling can yield false-nega-tive results if the abnormality is focal and not sampled.
Endometrial carcinomaEndometrial cancer is the commonest gynaecological malignancy (about 6% of all cancers in women). Abnormal or postmenopausal bleeding is the earliest, most frequent presenting symptom. �e main ultrasound sign is nonspeci�c thickening of the endometrium, which is usually di�use but can be polypoid in early cases. Endometrial tumours are usually more heterogeneous than hyperplasia or polyps and appear as a marked irregular or mass-like thickening, of varying echogenicity, and are o�en di�cult to distinguish from the myometrium because of irregular-ity or focal e�acement of the endometrial–myometrial border (Fig. 3.24, Fig. 3.25, Fig. 3.26). Corpusculated �uid may accumulate in the endometrial cavity due to cervical stenosis.
�e tumour tissue may show abnormal �ow signals on colour and power Doppler imaging, indicating high-velocity, low-resistance arterial �ow (Fig. 3.24, Fig. 3.25, Fig. 3.26).
Treatment and prognosis are based mainly on tumour extent (depth of myo-metrial invasion, cervical and nodal involvement), as well as individual and histo-logical factors. An indistinct or disrupted endometrial–myometrial interface is a sign of myometrial invasion. �e depth of invasion (deepest point reached by the tumour inside the myometrium wall) is rated as super�cial if only the inner half of the myometrium is involved or deep if it involves the outer half of the myometrium and beyond, also depending on whether the residual uterine wall is more or less than 1 cm (Fig. 3.24). Technical limitations (acoustic shadowing from �broids, adeno-myosis, uterine size, thinning of uterine walls due to distension from a clot, �uid or polypoid tumour) may reduce the accuracy of ultrasound.
Contrast-enhanced MRI is currently seen as the most reliable technique for evaluating myometrial invasion, with signi�cantly better performance than non-enhanced MRI, ultrasound and CT. Cervical invasion is di�cult to assess with
Man
ual o
f dia
gnos
tic u
ltras
ound
– V
olum
e 2
978-9241548540-C003 PRF ml YVR ln ml ml-1-Final Proof.indd 156 6/10/13 10:33 AM
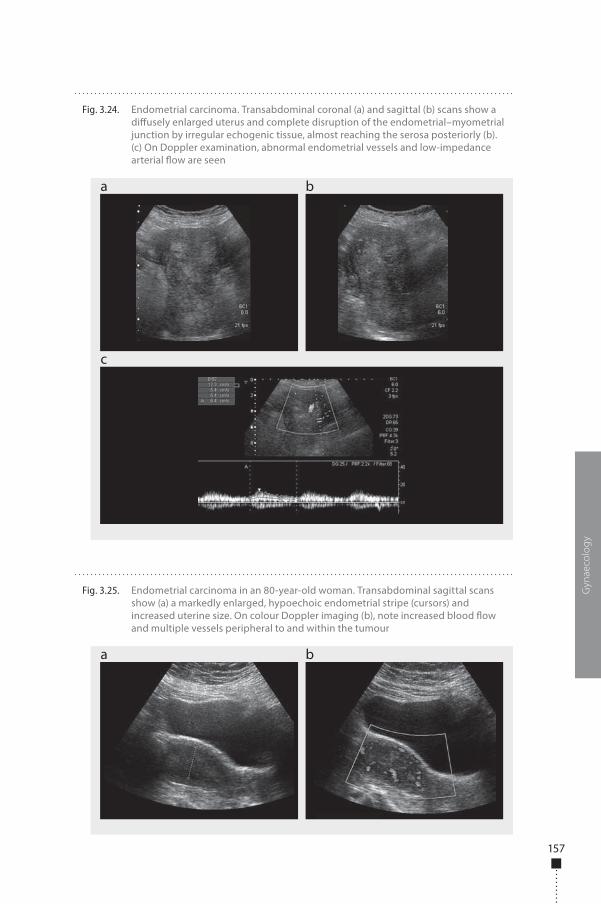
157
Gyn
aeco
log
y
Fig. 3.24. Endometrial carcinoma. Transabdominal coronal (a) and sagittal (b) scans show a di�usely enlarged uterus and complete disruption of the endometrial–myometrial junction by irregular echogenic tissue, almost reaching the serosa posteriorly (b). (c) On Doppler examination, abnormal endometrial vessels and low-impedance arterial �ow are seen
a
c
b
Fig. 3.25. Endometrial carcinoma in an 80-year-old woman. Transabdominal sagittal scans show (a) a markedly enlarged, hypoechoic endometrial stripe (cursors) and increased uterine size. On colour Doppler imaging (b), note increased blood �ow and multiple vessels peripheral to and within the tumour
a b
978-9241548540-C003 PRF ml YVR ln ml ml-1-Final Proof.indd 157 6/10/13 10:33 AM
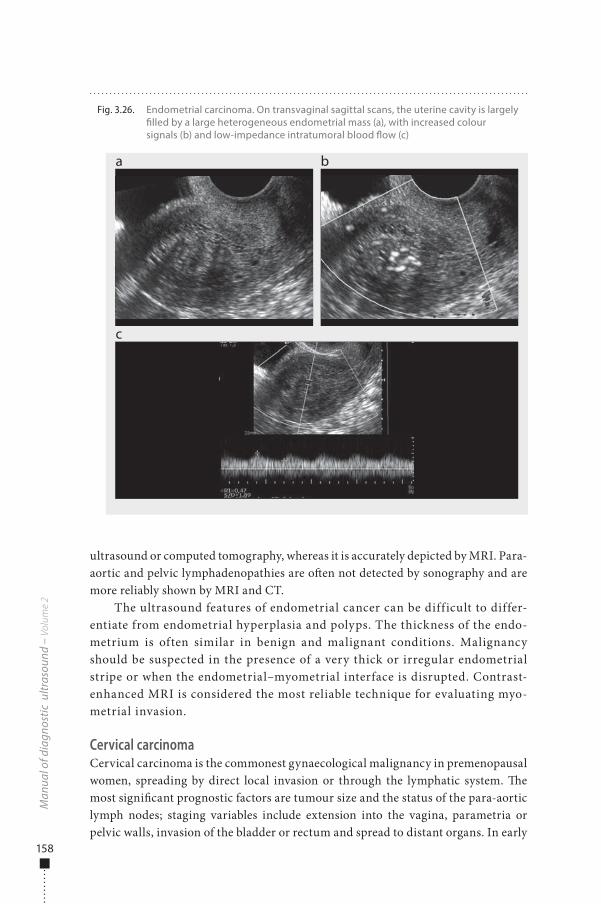
158
ultrasound or computed tomography, whereas it is accurately depicted by MRI. Para-aortic and pelvic lymphadenopathies are o�en not detected by sonography and are more reliably shown by MRI and CT.
The ultrasound features of endometrial cancer can be difficult to differ-entiate from endometrial hyperplasia and polyps. The thickness of the endo-metrium is often similar in benign and malignant conditions. Malignancy should be suspected in the presence of a very thick or irregular endometrial stripe or when the endometrial–myometrial interface is disrupted. Contrast-enhanced MRI is considered the most reliable technique for evaluating myo-metrial invasion.
Cervical carcinomaCervical carcinoma is the commonest gynaecological malignancy in premenopausal women, spreading by direct local invasion or through the lymphatic system. �e most signi�cant prognostic factors are tumour size and the status of the para-aortic lymph nodes; staging variables include extension into the vagina, parametria or pelvic walls, invasion of the bladder or rectum and spread to distant organs. In early
Man
ual o
f dia
gnos
tic u
ltras
ound
– V
olum
e 2
Fig. 3.26. Endometrial carcinoma. On transvaginal sagittal scans, the uterine cavity is largely �lled by a large heterogeneous endometrial mass (a), with increased colour signals (b) and low-impedance intratumoral blood �ow (c)
a
c
b
978-9241548540-C003 PRF ml YVR ln ml ml-1-Final Proof.indd 158 6/10/13 10:33 AM
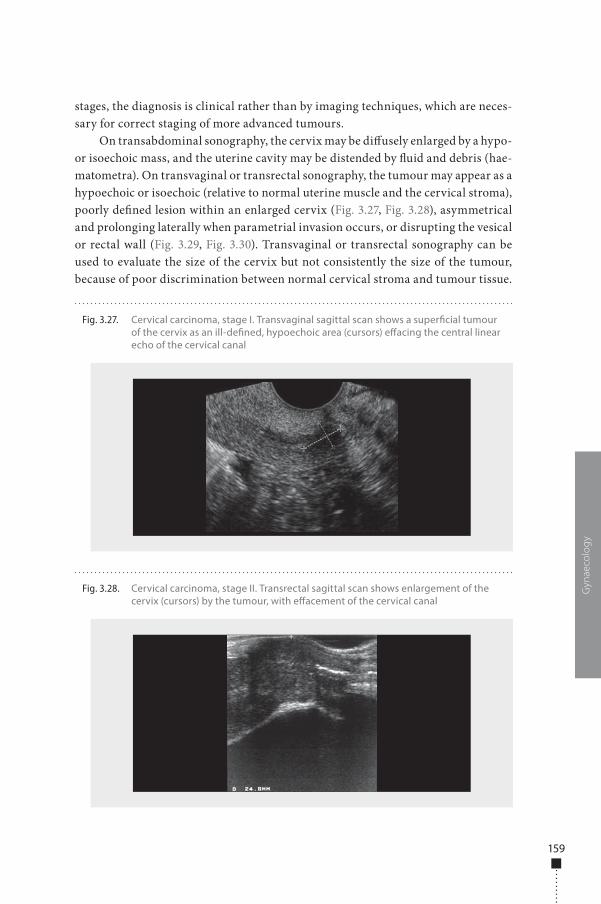
159
stages, the diagnosis is clinical rather than by imaging techniques, which are neces-sary for correct staging of more advanced tumours.
On transabdominal sonography, the cervix may be di�usely enlarged by a hypo- or isoechoic mass, and the uterine cavity may be distended by �uid and debris (hae-matometra). On transvaginal or transrectal sonography, the tumour may appear as a hypoechoic or isoechoic (relative to normal uterine muscle and the cervical stroma), poorly de�ned lesion within an enlarged cervix (Fig. 3.27, Fig. 3.28), asymmetrical and prolonging laterally when parametrial invasion occurs, or disrupting the vesical or rectal wall (Fig. 3.29, Fig. 3.30). Transvaginal or transrectal sonography can be used to evaluate the size of the cervix but not consistently the size of the tumour, because of poor discrimination between normal cervical stroma and tumour tissue.
Gyn
aeco
log
y
Fig. 3.27. Cervical carcinoma, stage I. Transvaginal sagittal scan shows a super�cial tumour of the cervix as an ill-de�ned, hypoechoic area (cursors) e�acing the central linear echo of the cervical canal
Fig. 3.28. Cervical carcinoma, stage II. Transrectal sagittal scan shows enlargement of the cervix (cursors) by the tumour, with e�acement of the cervical canal
978-9241548540-C003 PRF ml YVR ln ml ml-1-Final Proof.indd 159 6/10/13 10:33 AM
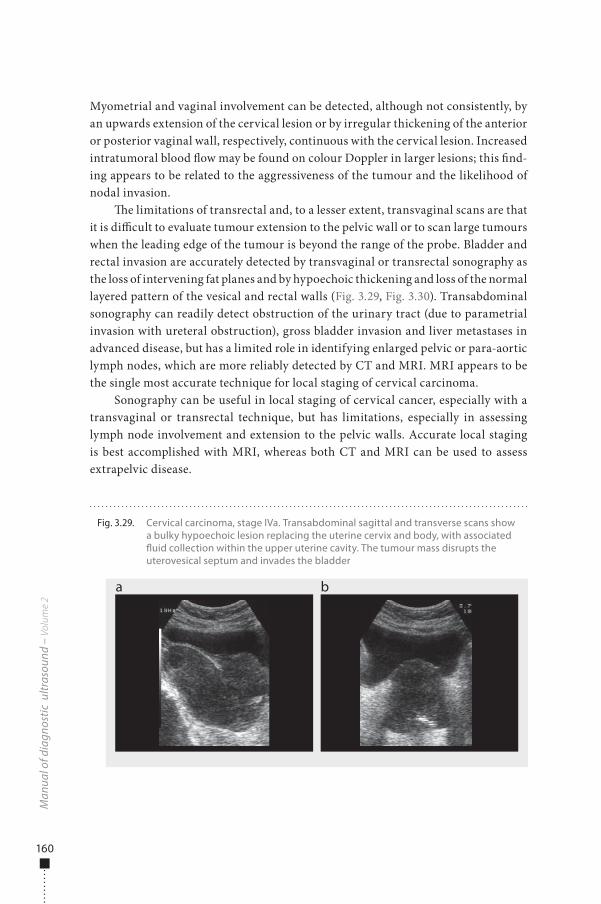
160
Myometrial and vaginal involvement can be detected, although not consistently, by an upwards extension of the cervical lesion or by irregular thickening of the anterior or posterior vaginal wall, respectively, continuous with the cervical lesion. Increased intratumoral blood �ow may be found on colour Doppler in larger lesions; this �nd-ing appears to be related to the aggressiveness of the tumour and the likelihood of nodal invasion.
�e limitations of transrectal and, to a lesser extent, transvaginal scans are that it is di�cult to evaluate tumour extension to the pelvic wall or to scan large tumours when the leading edge of the tumour is beyond the range of the probe. Bladder and rectal invasion are accurately detected by transvaginal or transrectal sonography as the loss of intervening fat planes and by hypoechoic thickening and loss of the normal layered pattern of the vesical and rectal walls (Fig. 3.29, Fig. 3.30). Transabdominal sonography can readily detect obstruction of the urinary tract (due to parametrial invasion with ureteral obstruction), gross bladder invasion and liver metastases in advanced disease, but has a limited role in identifying enlarged pelvic or para-aortic lymph nodes, which are more reliably detected by CT and MRI. MRI appears to be the single most accurate technique for local staging of cervical carcinoma.
Sonography can be useful in local staging of cervical cancer, especially with a transvaginal or transrectal technique, but has limitations, especially in assessing lymph node involvement and extension to the pelvic walls. Accurate local staging is best accomplished with MRI, whereas both CT and MRI can be used to assess extrapelvic disease.
Man
ual o
f dia
gnos
tic u
ltras
ound
– V
olum
e 2
Fig. 3.29. Cervical carcinoma, stage IVa. Transabdominal sagittal and transverse scans show a bulky hypoechoic lesion replacing the uterine cervix and body, with associated �uid collection within the upper uterine cavity. The tumour mass disrupts the uterovesical septum and invades the bladder
a b
978-9241548540-C003 PRF ml YVR ln ml ml-1-Final Proof.indd 160 6/10/13 10:33 AM
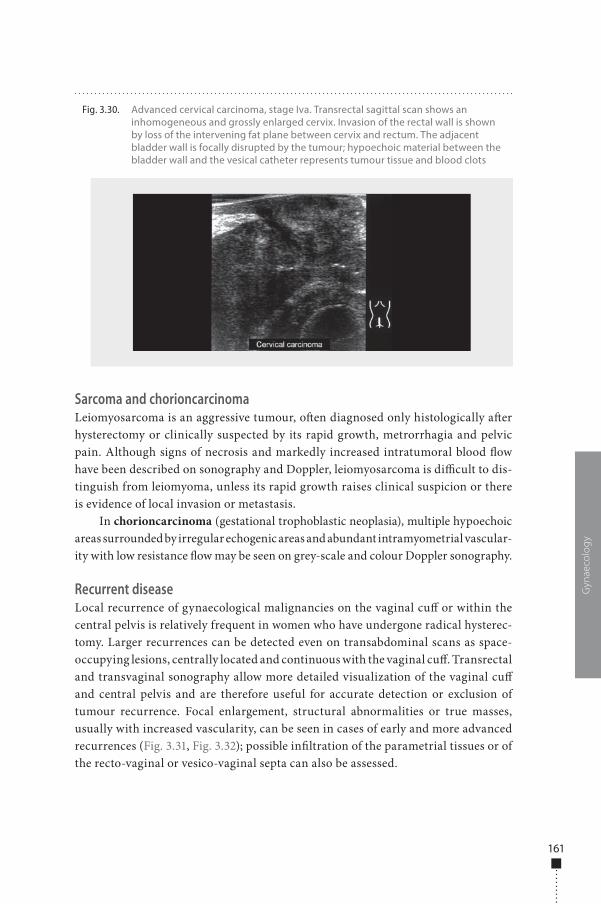
161
Sarcoma and chorioncarcinomaLeiomyosarcoma is an aggressive tumour, o�en diagnosed only histologically a�er hysterectomy or clinically suspected by its rapid growth, metrorrhagia and pelvic pain. Although signs of necrosis and markedly increased intratumoral blood �ow have been described on sonography and Doppler, leiomyosarcoma is di�cult to dis-tinguish from leiomyoma, unless its rapid growth raises clinical suspicion or there is evidence of local invasion or metastasis.
In chorioncarcinoma (gestational trophoblastic neoplasia), multiple hypoechoic areas surrounded by irregular echogenic areas and abundant intramyometrial vascular-ity with low resistance �ow may be seen on grey-scale and colour Doppler sonography.
Recurrent diseaseLocal recurrence of gynaecological malignancies on the vaginal cu� or within the central pelvis is relatively frequent in women who have undergone radical hysterec-tomy. Larger recurrences can be detected even on transabdominal scans as space-occupying lesions, centrally located and continuous with the vaginal cu�. Transrectal and transvaginal sonography allow more detailed visualization of the vaginal cu� and central pelvis and are therefore useful for accurate detection or exclusion of tumour recurrence. Focal enlargement, structural abnormalities or true masses, usually with increased vascularity, can be seen in cases of early and more advanced recurrences (Fig. 3.31, Fig. 3.32); possible in�ltration of the parametrial tissues or of the recto-vaginal or vesico-vaginal septa can also be assessed.
Gyn
aeco
log
y
Fig. 3.30. Advanced cervical carcinoma, stage Iva. Transrectal sagittal scan shows an inhomogeneous and grossly enlarged cervix. Invasion of the rectal wall is shown by loss of the intervening fat plane between cervix and rectum. The adjacent bladder wall is focally disrupted by the tumour; hypoechoic material between the bladder wall and the vesical catheter represents tumour tissue and blood clots
978-9241548540-C003 PRF ml YVR ln ml ml-1-Final Proof.indd 161 6/10/13 10:33 AM
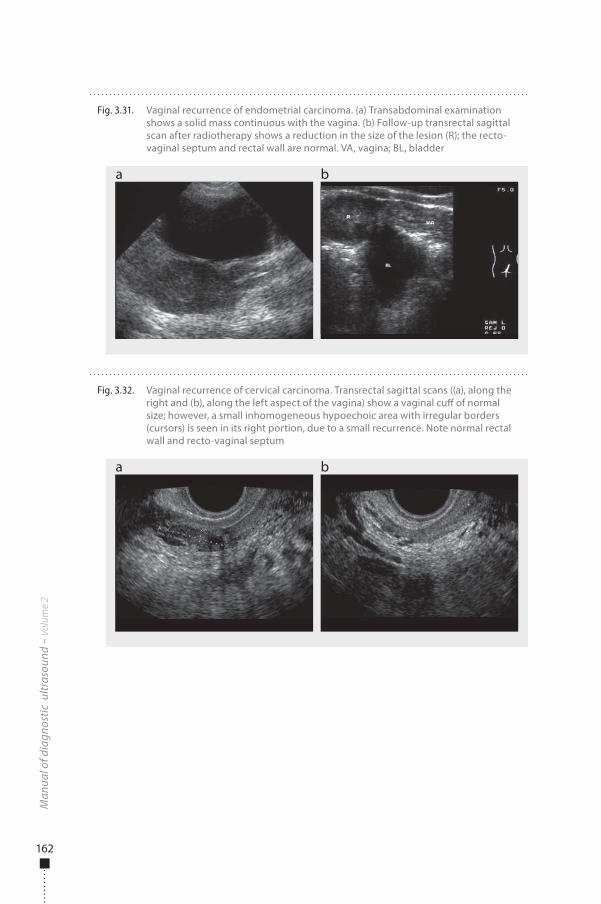
162
Man
ual o
f dia
gnos
tic u
ltras
ound
– V
olum
e 2
Fig. 3.32. Vaginal recurrence of cervical carcinoma. Transrectal sagittal scans ((a), along the right and (b), along the left aspect of the vagina) show a vaginal cu� of normal size; however, a small inhomogeneous hypoechoic area with irregular borders (cursors) is seen in its right portion, due to a small recurrence. Note normal rectal wall and recto-vaginal septum
a b
Fig. 3.31. Vaginal recurrence of endometrial carcinoma. (a) Transabdominal examination shows a solid mass continuous with the vagina. (b) Follow-up transrectal sagittal scan after radiotherapy shows a reduction in the size of the lesion (R); the recto-vaginal septum and rectal wall are normal. VA, vagina; BL, bladder
a b
978-9241548540-C003 PRF ml YVR ln ml ml-1-Final Proof.indd 162 6/10/13 10:33 AM
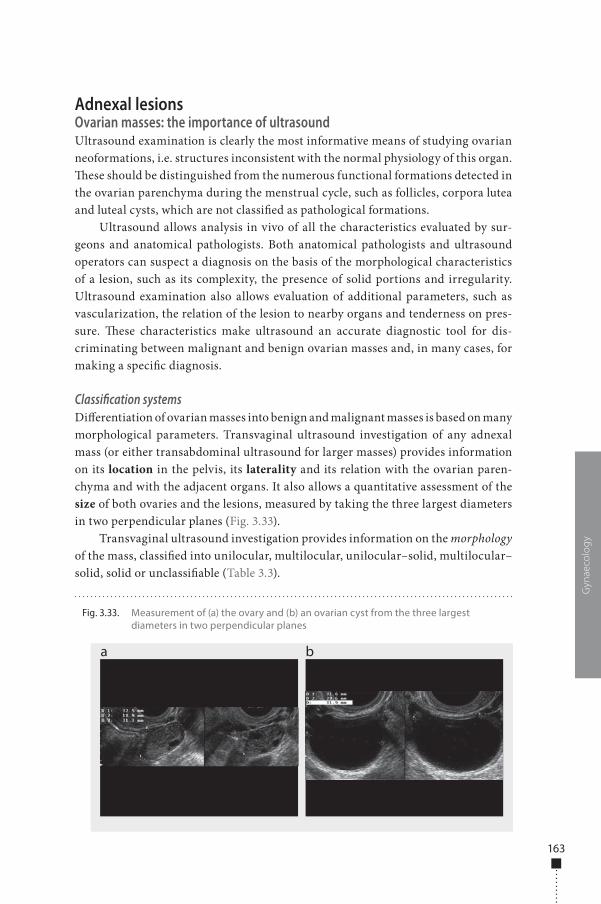
163
Adnexal lesionsOvarian masses: the importance of ultrasoundUltrasound examination is clearly the most informative means of studying ovarian neoformations, i.e. structures inconsistent with the normal physiology of this organ. �ese should be distinguished from the numerous functional formations detected in the ovarian parenchyma during the menstrual cycle, such as follicles, corpora lutea and luteal cysts, which are not classi�ed as pathological formations.
Ultrasound allows analysis in vivo of all the characteristics evaluated by sur-geons and anatomical pathologists. Both anatomical pathologists and ultrasound operators can suspect a diagnosis on the basis of the morphological characteristics of a lesion, such as its complexity, the presence of solid portions and irregularity. Ultrasound examination also allows evaluation of additional parameters, such as vascularization, the relation of the lesion to nearby organs and tenderness on pres-sure. �ese characteristics make ultrasound an accurate diagnostic tool for dis-criminating between malignant and benign ovarian masses and, in many cases, for making a speci�c diagnosis.
Classification systemsDi�erentiation of ovarian masses into benign and malignant masses is based on many morphological parameters. Transvaginal ultrasound investigation of any adnexal mass (or either transabdominal ultrasound for larger masses) provides information on its location in the pelvis, its laterality and its relation with the ovarian paren-chyma and with the adjacent organs. It also allows a quantitative assessment of the size of both ovaries and the lesions, measured by taking the three largest diameters in two perpendicular planes (Fig. 3.33).
Transvaginal ultrasound investigation provides information on the morphology of the mass, classi�ed into unilocular, multilocular, unilocular–solid, multilocular–solid, solid or unclassi�able (Table 3.3).
Gyn
aeco
log
y
Fig. 3.33. Measurement of (a) the ovary and (b) an ovarian cyst from the three largest diameters in two perpendicular planes
a b
978-9241548540-C003 PRF ml YVR ln ml ml-1-Final Proof.indd 163 6/10/13 10:33 AM
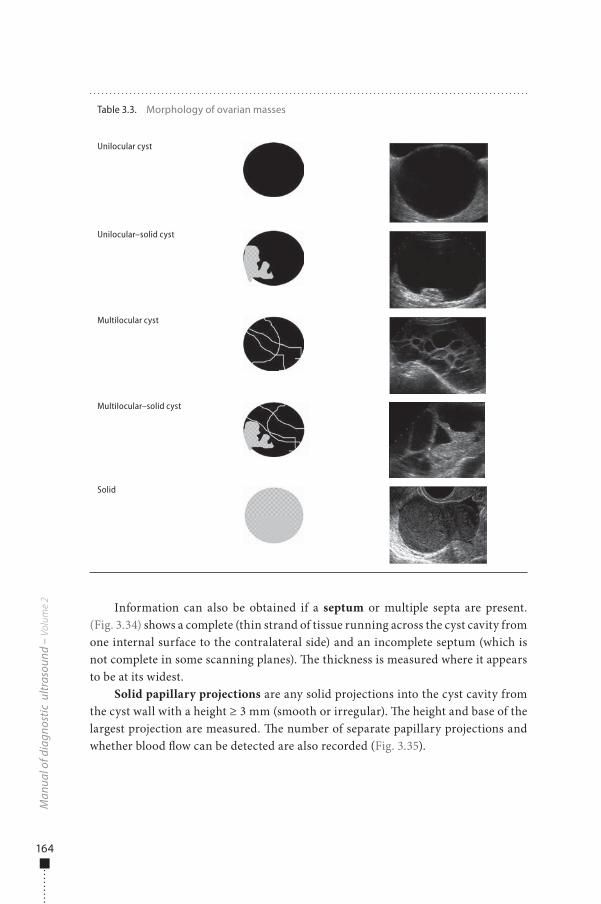
164
Information can also be obtained if a septum or multiple septa are present. (Fig. 3.34) shows a complete (thin strand of tissue running across the cyst cavity from one internal surface to the contralateral side) and an incomplete septum (which is not complete in some scanning planes). �e thickness is measured where it appears to be at its widest.
Solid papillary projections are any solid projections into the cyst cavity from the cyst wall with a height ≥ 3 mm (smooth or irregular). �e height and base of the largest projection are measured. �e number of separate papillary projections and whether blood �ow can be detected are also recorded (Fig. 3.35).
Man
ual o
f dia
gnos
tic u
ltras
ound
– V
olum
e 2
Table 3.3. Morphology of ovarian masses
Unilocular cyst
Unilocular–solid cyst
Multilocular cyst
Multilocular–solid cyst
Solid
978-9241548540-C003 PRF ml YVR ln ml ml-1-Final Proof.indd 164 6/10/13 10:33 AM
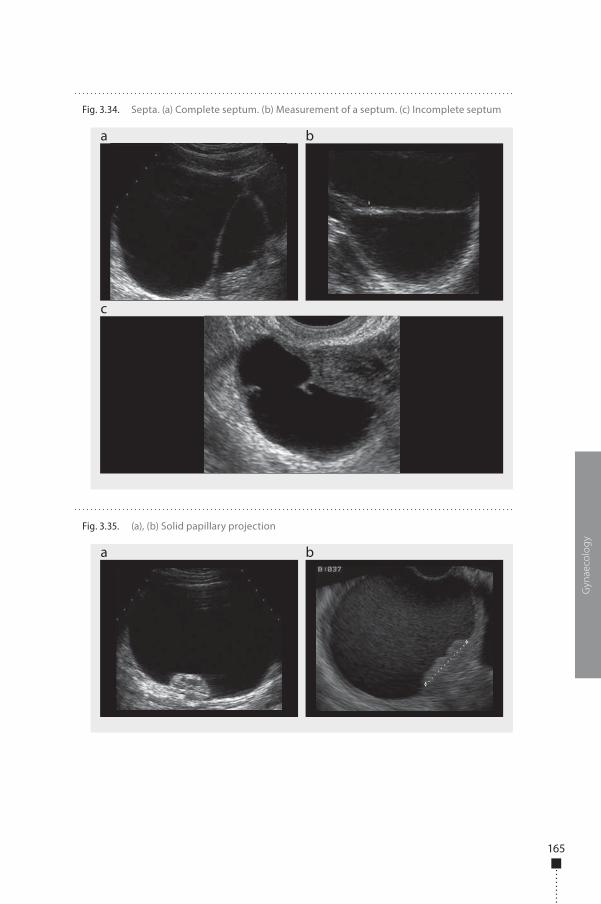
165
Gyn
aeco
log
y
Fig. 3.34. Septa. (a) Complete septum. (b) Measurement of a septum. (c) Incomplete septum
a
c
b
Fig. 3.35. (a), (b) Solid papillary projection
a b
978-9241548540-C003 PRF ml YVR ln ml ml-1-Final Proof.indd 165 6/10/13 10:33 AM
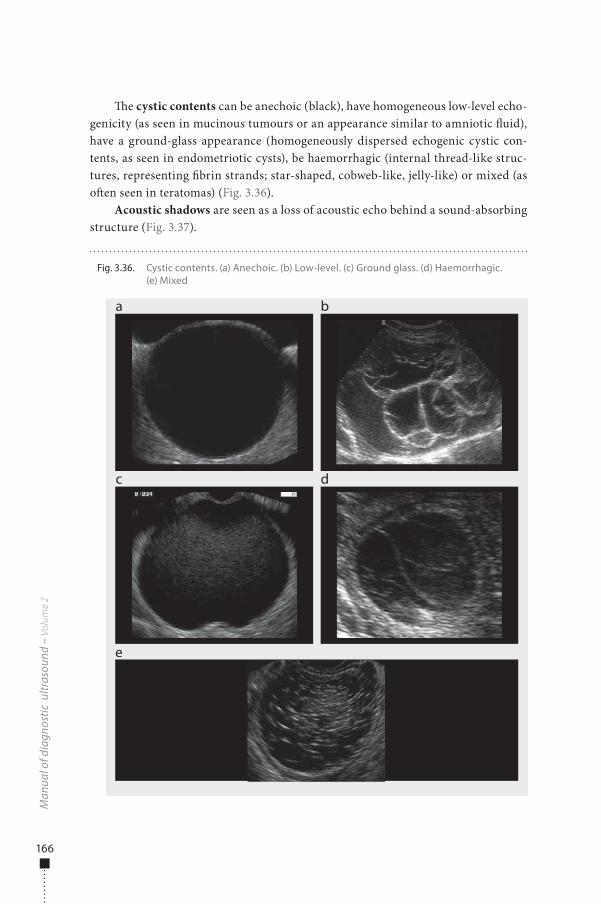
166
�e cystic contents can be anechoic (black), have homogeneous low-level echo-genicity (as seen in mucinous tumours or an appearance similar to amniotic �uid), have a ground-glass appearance (homogeneously dispersed echogenic cystic con-tents, as seen in endometriotic cysts), be haemorrhagic (internal thread-like struc-tures, representing �brin strands; star-shaped, cobweb-like, jelly-like) or mixed (as o�en seen in teratomas) (Fig. 3.36).
Acoustic shadows are seen as a loss of acoustic echo behind a sound-absorbing structure (Fig. 3.37).
Man
ual o
f dia
gnos
tic u
ltras
ound
– V
olum
e 2
Fig. 3.36. Cystic contents. (a) Anechoic. (b) Low-level. (c) Ground glass. (d) Haemorrhagic. (e) Mixed
a
c
e
b
d
978-9241548540-C003 PRF ml YVR ln ml ml-1-Final Proof.indd 166 6/10/13 10:33 AM
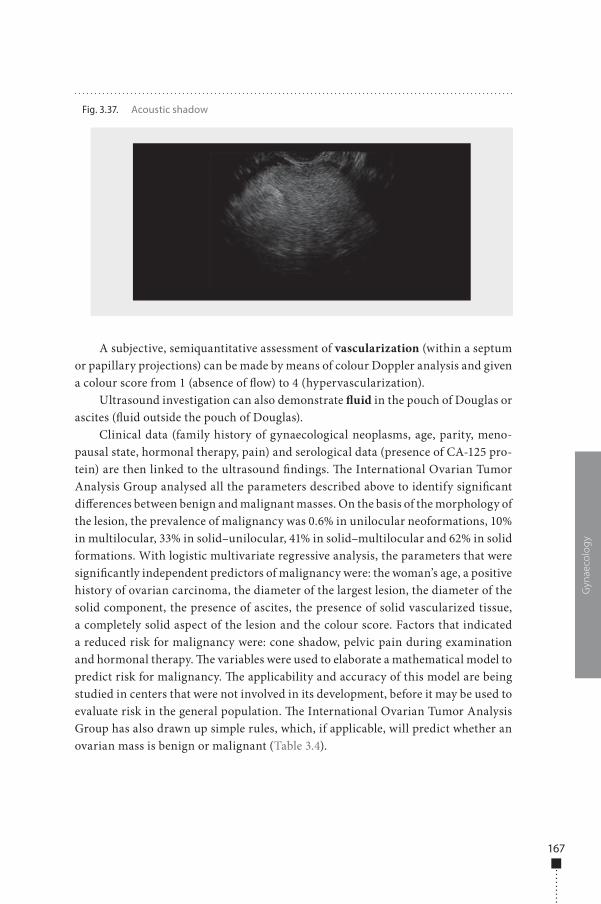
167
A subjective, semiquantitative assessment of vascularization (within a septum or papillary projections) can be made by means of colour Doppler analysis and given a colour score from 1 (absence of �ow) to 4 (hypervascularization).
Ultrasound investigation can also demonstrate �uid in the pouch of Douglas or ascites (�uid outside the pouch of Douglas).
Clinical data (family history of gynaecological neoplasms, age, parity, meno-pausal state, hormonal therapy, pain) and serological data (presence of CA-125 pro-tein) are then linked to the ultrasound �ndings. �e International Ovarian Tumor Analysis Group analysed all the parameters described above to identify signi�cant di�erences between benign and malignant masses. On the basis of the morphology of the lesion, the prevalence of malignancy was 0.6% in unilocular neoformations, 10% in multilocular, 33% in solid–unilocular, 41% in solid–multilocular and 62% in solid formations. With logistic multivariate regressive analysis, the parameters that were signi�cantly independent predictors of malignancy were: the woman’s age, a positive history of ovarian carcinoma, the diameter of the largest lesion, the diameter of the solid component, the presence of ascites, the presence of solid vascularized tissue, a completely solid aspect of the lesion and the colour score. Factors that indicated a reduced risk for malignancy were: cone shadow, pelvic pain during examination and hormonal therapy. �e variables were used to elaborate a mathematical model to predict risk for malignancy. �e applicability and accuracy of this model are being studied in centers that were not involved in its development, before it may be used to evaluate risk in the general population. �e International Ovarian Tumor Analysis Group has also drawn up simple rules, which, if applicable, will predict whether an ovarian mass is benign or malignant (Table 3.4).
Gyn
aeco
log
y
Fig. 3.37. Acoustic shadow
978-9241548540-C003 PRF ml YVR ln ml ml-1-Final Proof.indd 167 6/10/13 10:33 AM
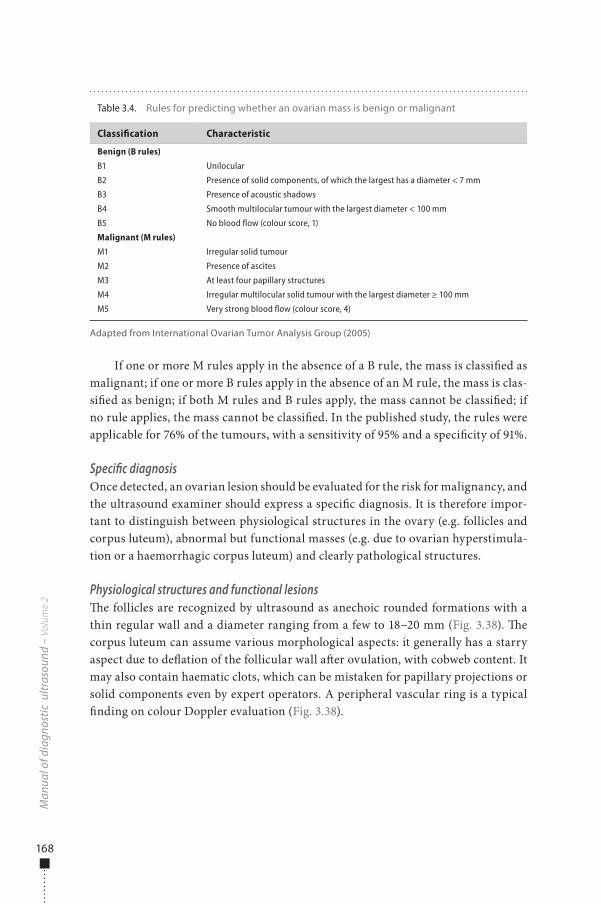
168
If one or more M rules apply in the absence of a B rule, the mass is classi�ed as malignant; if one or more B rules apply in the absence of an M rule, the mass is clas-si�ed as benign; if both M rules and B rules apply, the mass cannot be classi�ed; if no rule applies, the mass cannot be classi�ed. In the published study, the rules were applicable for 76% of the tumours, with a sensitivity of 95% and a speci�city of 91%.
Specific diagnosisOnce detected, an ovarian lesion should be evaluated for the risk for malignancy, and the ultrasound examiner should express a speci�c diagnosis. It is therefore impor-tant to distinguish between physiological structures in the ovary (e.g. follicles and corpus luteum), abnormal but functional masses (e.g. due to ovarian hyperstimula-tion or a haemorrhagic corpus luteum) and clearly pathological structures.
Physiological structures and functional lesions�e follicles are recognized by ultrasound as anechoic rounded formations with a thin regular wall and a diameter ranging from a few to 18−20 mm (Fig. 3.38). �e corpus luteum can assume various morphological aspects: it generally has a starry aspect due to de�ation of the follicular wall a�er ovulation, with cobweb content. It may also contain haematic clots, which can be mistaken for papillary projections or solid components even by expert operators. A peripheral vascular ring is a typical �nding on colour Doppler evaluation (Fig. 3.38).
Man
ual o
f dia
gnos
tic u
ltras
ound
– V
olum
e 2
Table 3.4. Rules for predicting whether an ovarian mass is benign or malignant
Classification Characteristic
Benign (B rules)
B1 Unilocular
B2 Presence of solid components, of which the largest has a diameter < 7 mm
B3 Presence of acoustic shadows
B4 Smooth multilocular tumour with the largest diameter < 100 mm
B5 No blood flow (colour score, 1)
Malignant (M rules)
M1 Irregular solid tumour
M2 Presence of ascites
M3 At least four papillary structures
M4 Irregular multilocular solid tumour with the largest diameter ≥ 100 mm
M5 Very strong blood flow (colour score, 4)
Adapted from International Ovarian Tumor Analysis Group (2005)
978-9241548540-C003 PRF ml YVR ln ml ml-1-Final Proof.indd 168 6/10/13 10:33 AM
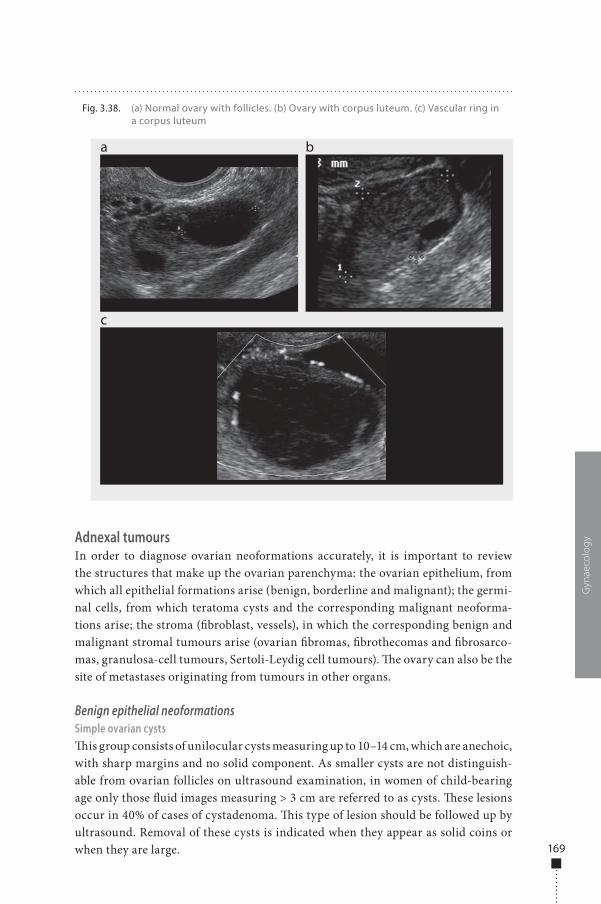
169
Adnexal tumoursIn order to diagnose ovarian neoformations accurately, it is important to review the structures that make up the ovarian parenchyma: the ovarian epithelium, from which all epithelial formations arise (benign, borderline and malignant); the germi-nal cells, from which teratoma cysts and the corresponding malignant neoforma-tions arise; the stroma (�broblast, vessels), in which the corresponding benign and malignant stromal tumours arise (ovarian �bromas, �brothecomas and �brosarco-mas, granulosa-cell tumours, Sertoli-Leydig cell tumours). �e ovary can also be the site of metastases originating from tumours in other organs.
Benign epithelial neoformationsSimple ovarian cysts�is group consists of unilocular cysts measuring up to 10–14 cm, which are anechoic, with sharp margins and no solid component. As smaller cysts are not distinguish-able from ovarian follicles on ultrasound examination, in women of child-bearing age only those �uid images measuring > 3 cm are referred to as cysts. �ese lesions occur in 40% of cases of cystadenoma. �is type of lesion should be followed up by ultrasound. Removal of these cysts is indicated when they appear as solid coins or when they are large.
Gyn
aeco
log
y
Fig. 3.38. (a) Normal ovary with follicles. (b) Ovary with corpus luteum. (c) Vascular ring in a corpus luteum
a
c
b
978-9241548540-C003 PRF ml YVR ln ml ml-1-Final Proof.indd 169 6/10/13 10:33 AM
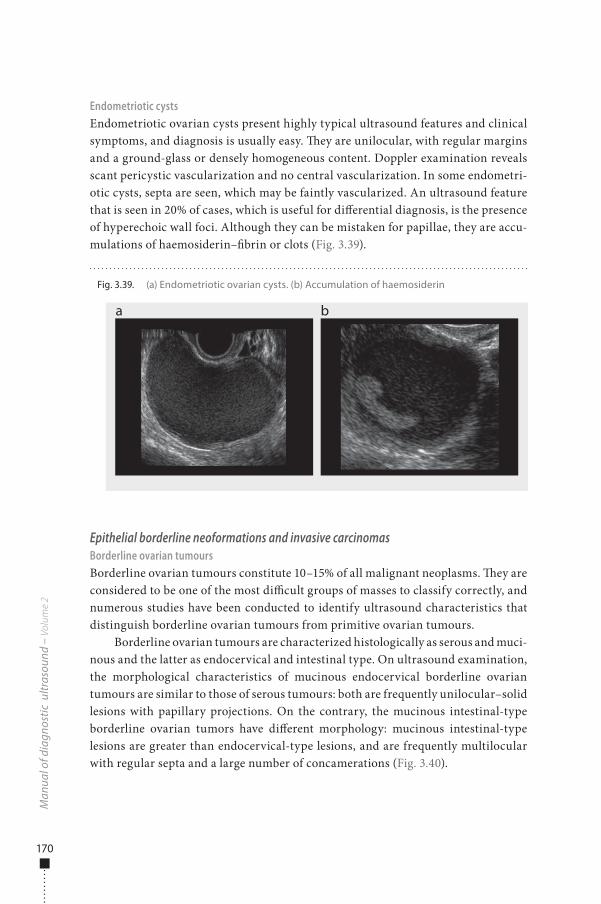
170
Endometriotic cystsEndometriotic ovarian cysts present highly typical ultrasound features and clinical symptoms, and diagnosis is usually easy. �ey are unilocular, with regular margins and a ground-glass or densely homogeneous content. Doppler examination reveals scant pericystic vascularization and no central vascularization. In some endometri-otic cysts, septa are seen, which may be faintly vascularized. An ultrasound feature that is seen in 20% of cases, which is useful for di�erential diagnosis, is the presence of hyperechoic wall foci. Although they can be mistaken for papillae, they are accu-mulations of haemosiderin–�brin or clots (Fig. 3.39).
Epithelial borderline neoformations and invasive carcinomasBorderline ovarian tumoursBorderline ovarian tumours constitute 10–15% of all malignant neoplasms. �ey are considered to be one of the most di�cult groups of masses to classify correctly, and numerous studies have been conducted to identify ultrasound characteristics that distinguish borderline ovarian tumours from primitive ovarian tumours.
Borderline ovarian tumours are characterized histologically as serous and muci-nous and the latter as endocervical and intestinal type. On ultrasound examination, the morphological characteristics of mucinous endocervical borderline ovarian tumours are similar to those of serous tumours: both are frequently unilocular–solid lesions with papillary projections. On the contrary, the mucinous intestinal-type borderline ovarian tumors have di�erent morphology: mucinous intestinal-type lesions are greater than endocervical-type lesions, and are frequently multilocular with regular septa and a large number of concamerations (Fig. 3.40).
Man
ual o
f dia
gnos
tic u
ltras
ound
– V
olum
e 2
Fig. 3.39. (a) Endometriotic ovarian cysts. (b) Accumulation of haemosiderin
a b
978-9241548540-C003 PRF ml YVR ln ml ml-1-Final Proof.indd 170 6/10/13 10:33 AM
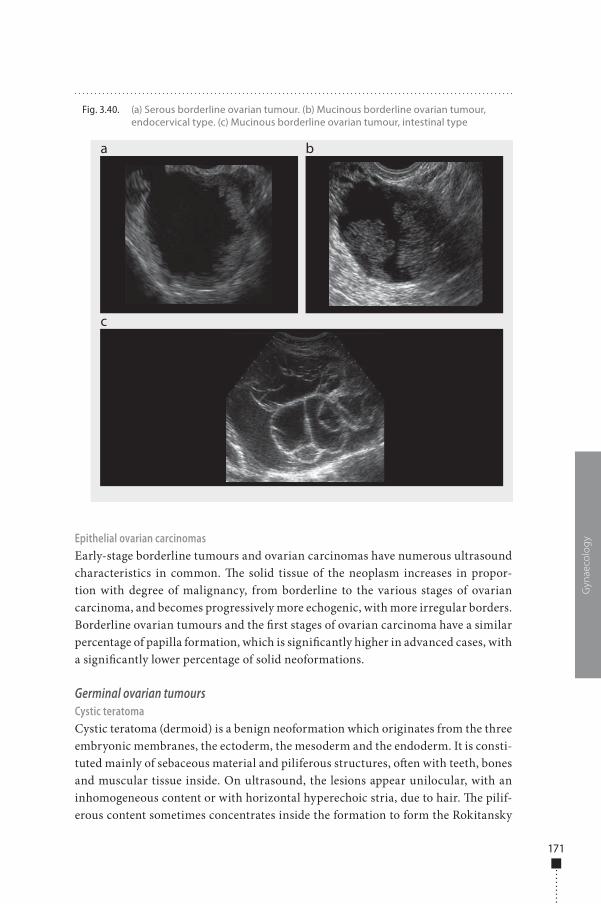
171
Epithelial ovarian carcinomasEarly-stage borderline tumours and ovarian carcinomas have numerous ultrasound characteristics in common. �e solid tissue of the neoplasm increases in propor-tion with degree of malignancy, from borderline to the various stages of ovarian carcinoma, and becomes progressively more echogenic, with more irregular borders. Borderline ovarian tumours and the �rst stages of ovarian carcinoma have a similar percentage of papilla formation, which is signi�cantly higher in advanced cases, with a signi�cantly lower percentage of solid neoformations.
Germinal ovarian tumoursCystic teratomaCystic teratoma (dermoid) is a benign neoformation which originates from the three embryonic membranes, the ectoderm, the mesoderm and the endoderm. It is consti-tuted mainly of sebaceous material and piliferous structures, o�en with teeth, bones and muscular tissue inside. On ultrasound, the lesions appear unilocular, with an inhomogeneous content or with horizontal hyperechoic stria, due to hair. �e pilif-erous content sometimes concentrates inside the formation to form the Rokitansky
Gyn
aeco
log
y
Fig. 3.40. (a) Serous borderline ovarian tumour. (b) Mucinous borderline ovarian tumour, endocervical type. (c) Mucinous borderline ovarian tumour, intestinal type
a
c
b
978-9241548540-C003 PRF ml YVR ln ml ml-1-Final Proof.indd 171 6/10/13 10:33 AM
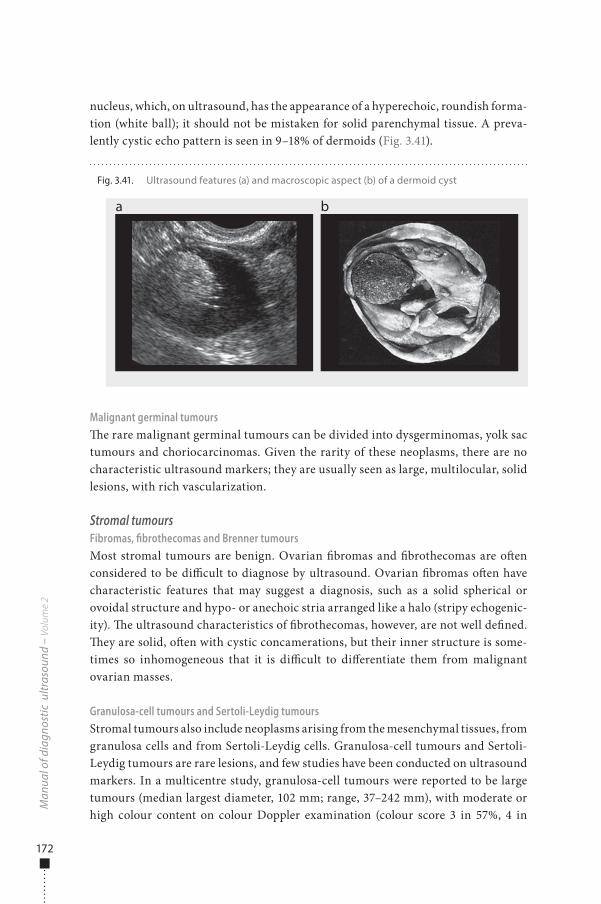
172
nucleus, which, on ultrasound, has the appearance of a hyperechoic, roundish forma-tion (white ball); it should not be mistaken for solid parenchymal tissue. A preva-lently cystic echo pattern is seen in 9–18% of dermoids (Fig. 3.41).
Malignant germinal tumours�e rare malignant germinal tumours can be divided into dysgerminomas, yolk sac tumours and choriocarcinomas. Given the rarity of these neoplasms, there are no characteristic ultrasound markers; they are usually seen as large, multilocular, solid lesions, with rich vascularization.
Stromal tumoursFibromas, fibrothecomas and Brenner tumoursMost stromal tumours are benign. Ovarian �bromas and �brothecomas are o�en considered to be di�cult to diagnose by ultrasound. Ovarian �bromas o�en have characteristic features that may suggest a diagnosis, such as a solid spherical or ovoidal structure and hypo- or anechoic stria arranged like a halo (stripy echogenic-ity). �e ultrasound characteristics of �brothecomas, however, are not well de�ned. �ey are solid, o�en with cystic concamerations, but their inner structure is some-times so inhomogeneous that it is di�cult to di�erentiate them from malignant ovarian masses.
Granulosa-cell tumours and Sertoli-Leydig tumoursStromal tumours also include neoplasms arising from the mesenchymal tissues, from granulosa cells and from Sertoli-Leydig cells. Granulosa-cell tumours and Sertoli-Leydig tumours are rare lesions, and few studies have been conducted on ultrasound markers. In a multicentre study, granulosa-cell tumours were reported to be large tumours (median largest diameter, 102 mm; range, 37–242 mm), with moderate or high colour content on colour Doppler examination (colour score 3 in 57%, 4 in
Man
ual o
f dia
gnos
tic u
ltras
ound
– V
olum
e 2
Fig. 3.41. Ultrasound features (a) and macroscopic aspect (b) of a dermoid cyst
a b
978-9241548540-C003 PRF ml YVR ln ml ml-1-Final Proof.indd 172 6/10/13 10:33 AM
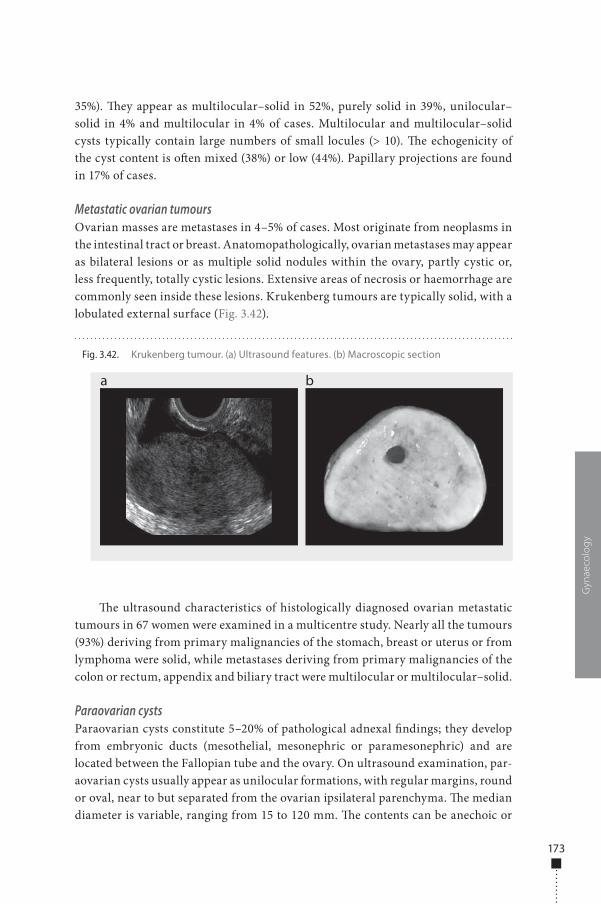
173
35%). �ey appear as multilocular–solid in 52%, purely solid in 39%, unilocular–solid in 4% and multilocular in 4% of cases. Multilocular and multilocular–solid cysts typically contain large numbers of small locules (> 10). �e echogenicity of the cyst content is o�en mixed (38%) or low (44%). Papillary projections are found in 17% of cases.
Metastatic ovarian tumoursOvarian masses are metastases in 4–5% of cases. Most originate from neoplasms in the intestinal tract or breast. Anatomopathologically, ovarian metastases may appear as bilateral lesions or as multiple solid nodules within the ovary, partly cystic or, less frequently, totally cystic lesions. Extensive areas of necrosis or haemorrhage are commonly seen inside these lesions. Krukenberg tumours are typically solid, with a lobulated external surface (Fig. 3.42).
�e ultrasound characteristics of histologically diagnosed ovarian metastatic tumours in 67 women were examined in a multicentre study. Nearly all the tumours (93%) deriving from primary malignancies of the stomach, breast or uterus or from lymphoma were solid, while metastases deriving from primary malignancies of the colon or rectum, appendix and biliary tract were multilocular or multilocular–solid.
Paraovarian cystsParaovarian cysts constitute 5–20% of pathological adnexal �ndings; they develop from embryonic ducts (mesothelial, mesonephric or paramesonephric) and are located between the Fallopian tube and the ovary. On ultrasound examination, par-aovarian cysts usually appear as unilocular formations, with regular margins, round or oval, near to but separated from the ovarian ipsilateral parenchyma. �e median diameter is variable, ranging from 15 to 120 mm. �e contents can be anechoic or
Gyn
aeco
log
y
Fig. 3.42. Krukenberg tumour. (a) Ultrasound features. (b) Macroscopic section
a b
978-9241548540-C003 PRF ml YVR ln ml ml-1-Final Proof.indd 173 6/10/13 10:33 AM
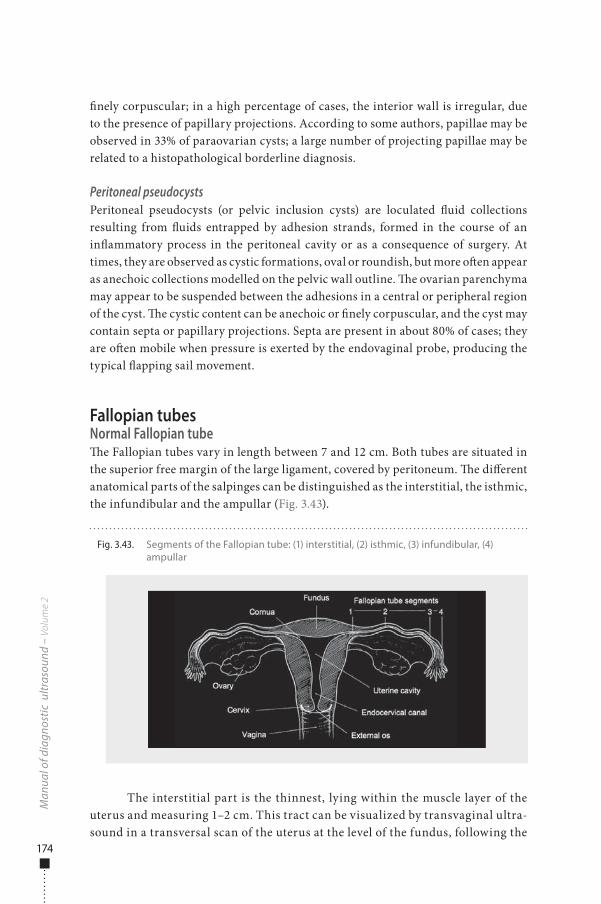
174
�nely corpuscular; in a high percentage of cases, the interior wall is irregular, due to the presence of papillary projections. According to some authors, papillae may be observed in 33% of paraovarian cysts; a large number of projecting papillae may be related to a histopathological borderline diagnosis.
Peritoneal pseudocystsPeritoneal pseudocysts (or pelvic inclusion cysts) are loculated �uid collections resulting from �uids entrapped by adhesion strands, formed in the course of an in�ammatory process in the peritoneal cavity or as a consequence of surgery. At times, they are observed as cystic formations, oval or roundish, but more o�en appear as anechoic collections modelled on the pelvic wall outline. �e ovarian parenchyma may appear to be suspended between the adhesions in a central or peripheral region of the cyst. �e cystic content can be anechoic or �nely corpuscular, and the cyst may contain septa or papillary projections. Septa are present in about 80% of cases; they are o�en mobile when pressure is exerted by the endovaginal probe, producing the typical �apping sail movement.
Fallopian tubesNormal Fallopian tube�e Fallopian tubes vary in length between 7 and 12 cm. Both tubes are situated in the superior free margin of the large ligament, covered by peritoneum. �e di�erent anatomical parts of the salpinges can be distinguished as the interstitial, the isthmic, the infundibular and the ampullar (Fig. 3.43).
The interstitial part is the thinnest, lying within the muscle layer of the uterus and measuring 1–2 cm. This tract can be visualized by transvaginal ultra-sound in a transversal scan of the uterus at the level of the fundus, following the
Man
ual o
f dia
gnos
tic u
ltras
ound
– V
olum
e 2
Fig. 3.43. Segments of the Fallopian tube: (1) interstitial, (2) isthmic, (3) infundibular, (4) ampullar
978-9241548540-C003 PRF ml YVR ln ml ml-1-Final Proof.indd 174 6/10/13 10:33 AM
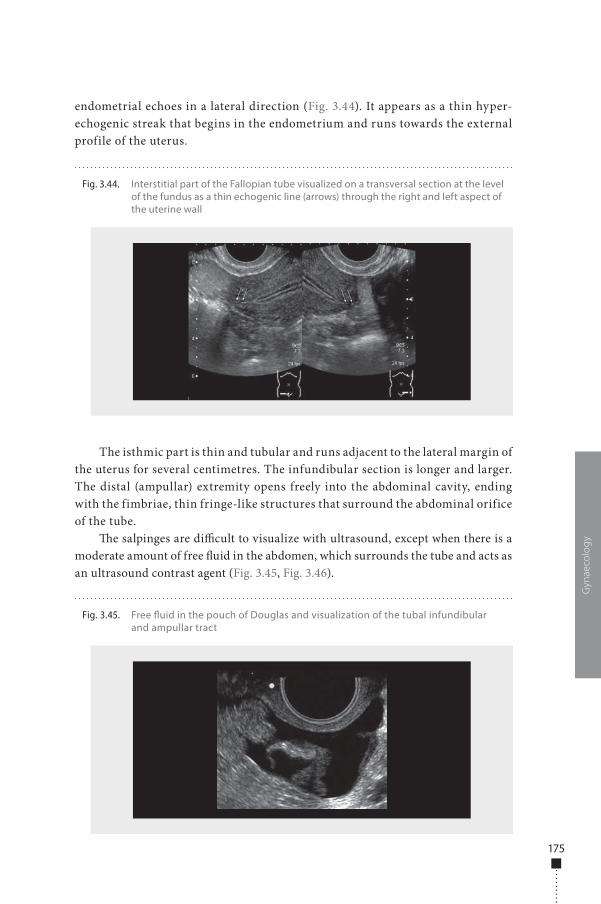
175
endometrial echoes in a lateral direction (Fig. 3.44). It appears as a thin hyper-echogenic streak that begins in the endometrium and runs towards the external profile of the uterus.
The isthmic part is thin and tubular and runs adjacent to the lateral margin of the uterus for several centimetres. The infundibular section is longer and larger. The distal (ampullar) extremity opens freely into the abdominal cavity, ending with the fimbriae, thin fringe-like structures that surround the abdominal orifice of the tube.
�e salpinges are di�cult to visualize with ultrasound, except when there is a moderate amount of free �uid in the abdomen, which surrounds the tube and acts as an ultrasound contrast agent (Fig. 3.45, Fig. 3.46).
Gyn
aeco
log
y
Fig. 3.44. Interstitial part of the Fallopian tube visualized on a transversal section at the level of the fundus as a thin echogenic line (arrows) through the right and left aspect of the uterine wall
Fig. 3.45. Free �uid in the pouch of Douglas and visualization of the tubal infundibular and ampullar tract
978-9241548540-C003 PRF ml YVR ln ml ml-1-Final Proof.indd 175 6/10/13 10:33 AM
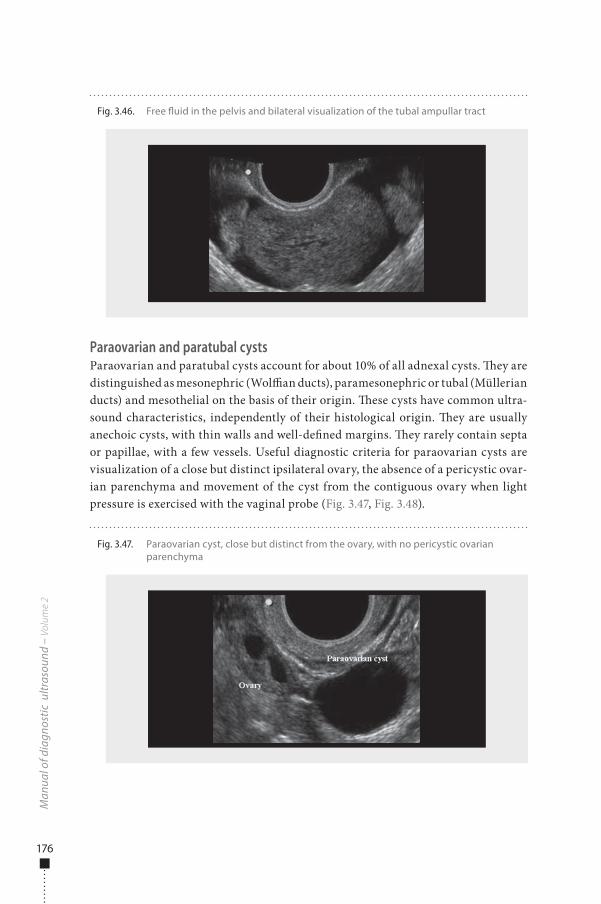
176
Paraovarian and paratubal cystsParaovarian and paratubal cysts account for about 10% of all adnexal cysts. �ey are distinguished as mesonephric (Wol�an ducts), paramesonephric or tubal (Müllerian ducts) and mesothelial on the basis of their origin. �ese cysts have common ultra-sound characteristics, independently of their histological origin. �ey are usually anechoic cysts, with thin walls and well-de�ned margins. �ey rarely contain septa or papillae, with a few vessels. Useful diagnostic criteria for paraovarian cysts are visualization of a close but distinct ipsilateral ovary, the absence of a pericystic ovar-ian parenchyma and movement of the cyst from the contiguous ovary when light pressure is exercised with the vaginal probe (Fig. 3.47, Fig. 3.48).
Man
ual o
f dia
gnos
tic u
ltras
ound
– V
olum
e 2
Fig. 3.46. Free �uid in the pelvis and bilateral visualization of the tubal ampullar tract
Fig. 3.47. Paraovarian cyst, close but distinct from the ovary, with no pericystic ovarian parenchyma
978-9241548540-C003 PRF ml YVR ln ml ml-1-Final Proof.indd 176 6/10/13 10:33 AM
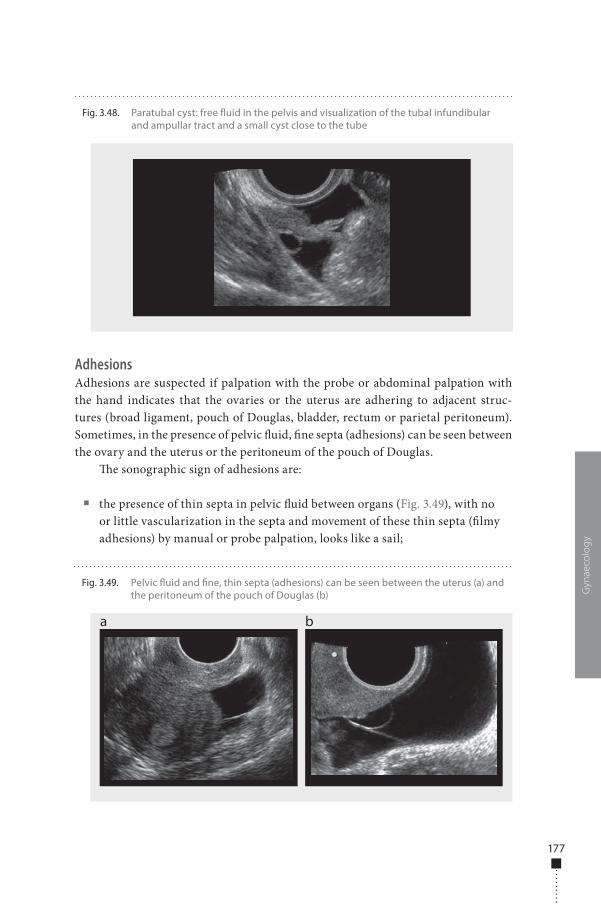
177
AdhesionsAdhesions are suspected if palpation with the probe or abdominal palpation with the hand indicates that the ovaries or the uterus are adhering to adjacent struc-tures (broad ligament, pouch of Douglas, bladder, rectum or parietal peritoneum). Sometimes, in the presence of pelvic �uid, �ne septa (adhesions) can be seen between the ovary and the uterus or the peritoneum of the pouch of Douglas.
�e sonographic sign of adhesions are:
■ the presence of thin septa in pelvic �uid between organs (Fig. 3.49), with no or little vascularization in the septa and movement of these thin septa (�lmy adhesions) by manual or probe palpation, looks like a sail;
Gyn
aeco
log
yFig. 3.49. Pelvic �uid and �ne, thin septa (adhesions) can be seen between the uterus (a) and
the peritoneum of the pouch of Douglas (b)
a b
Fig. 3.48. Paratubal cyst: free �uid in the pelvis and visualization of the tubal infundibular and ampullar tract and a small cyst close to the tube
978-9241548540-C003 PRF ml YVR ln ml ml-1-Final Proof.indd 177 6/10/13 10:33 AM
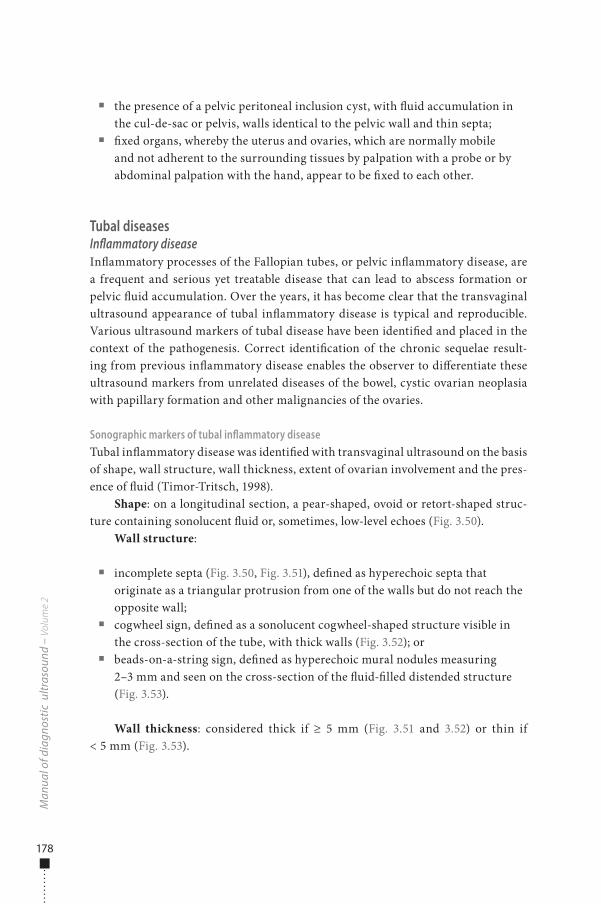
178
■ the presence of a pelvic peritoneal inclusion cyst, with �uid accumulation in the cul-de-sac or pelvis, walls identical to the pelvic wall and thin septa;
■ �xed organs, whereby the uterus and ovaries, which are normally mobile and not adherent to the surrounding tissues by palpation with a probe or by abdominal palpation with the hand, appear to be �xed to each other.
Tubal diseasesInflammatory diseaseIn�ammatory processes of the Fallopian tubes, or pelvic in�ammatory disease, are a frequent and serious yet treatable disease that can lead to abscess formation or pelvic �uid accumulation. Over the years, it has become clear that the transvaginal ultrasound appearance of tubal in�ammatory disease is typical and reproducible. Various ultrasound markers of tubal disease have been identi�ed and placed in the context of the pathogenesis. Correct identi�cation of the chronic sequelae result-ing from previous in�ammatory disease enables the observer to di�erentiate these ultrasound markers from unrelated diseases of the bowel, cystic ovarian neoplasia with papillary formation and other malignancies of the ovaries.
Sonographic markers of tubal inflammatory diseaseTubal in�ammatory disease was identi�ed with transvaginal ultrasound on the basis of shape, wall structure, wall thickness, extent of ovarian involvement and the pres-ence of �uid (Timor-Tritsch, 1998).
Shape: on a longitudinal section, a pear-shaped, ovoid or retort-shaped struc-ture containing sonolucent �uid or, sometimes, low-level echoes (Fig. 3.50).
Wall structure:
■ incomplete septa (Fig. 3.50, Fig. 3.51), de�ned as hyperechoic septa that originate as a triangular protrusion from one of the walls but do not reach the opposite wall;
■ cogwheel sign, de�ned as a sonolucent cogwheel-shaped structure visible in the cross-section of the tube, with thick walls (Fig. 3.52); or
■ beads-on-a-string sign, de�ned as hyperechoic mural nodules measuring 2–3 mm and seen on the cross-section of the �uid-�lled distended structure (Fig. 3.53).
Wall thickness: considered thick if ≥ 5 mm (Fig. 3.51 and 3.52) or thin if < 5 mm (Fig. 3.53).
Man
ual o
f dia
gnos
tic u
ltras
ound
– V
olum
e 2
978-9241548540-C003 PRF ml YVR ln ml ml-1-Final Proof.indd 178 6/10/13 10:33 AM
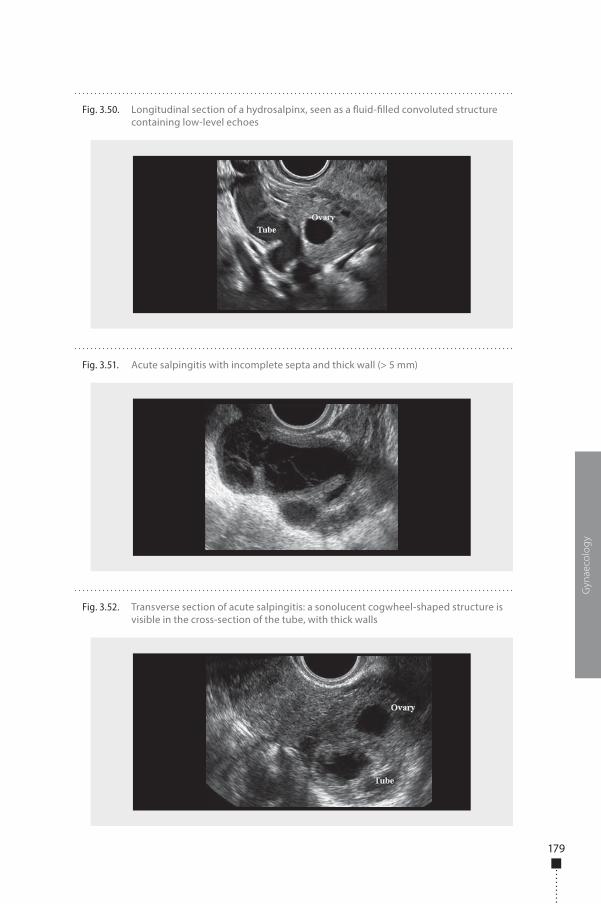
179
Gyn
aeco
log
y
Fig. 3.51. Acute salpingitis with incomplete septa and thick wall (> 5 mm)
Fig. 3.52. Transverse section of acute salpingitis: a sonolucent cogwheel-shaped structure is visible in the cross-section of the tube, with thick walls
Fig. 3.50. Longitudinal section of a hydrosalpinx, seen as a �uid-�lled convoluted structure containing low-level echoes
978-9241548540-C003 PRF ml YVR ln ml ml-1-Final Proof.indd 179 6/10/13 10:33 AM
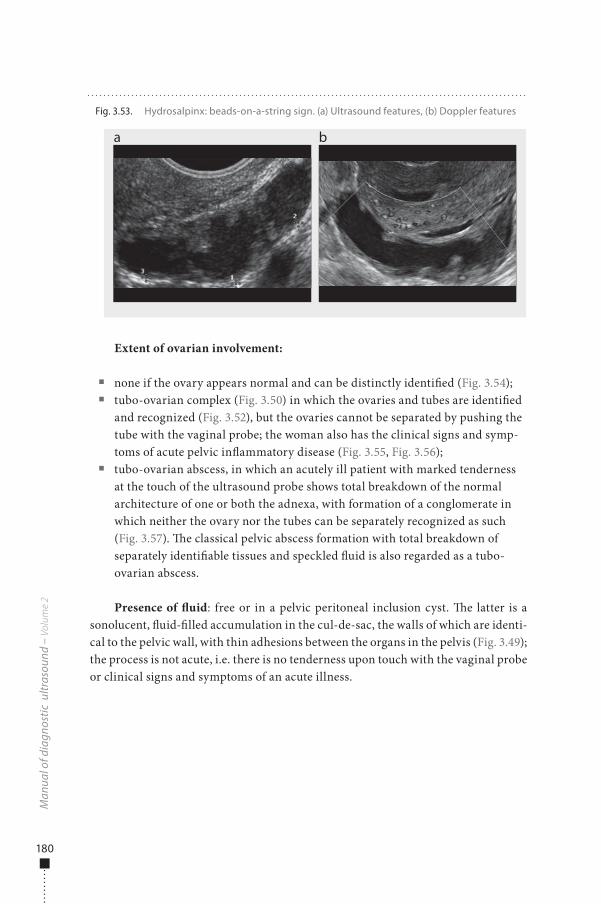
180
Extent of ovarian involvement:
■ none if the ovary appears normal and can be distinctly identi�ed (Fig. 3.54); ■ tubo-ovarian complex (Fig. 3.50) in which the ovaries and tubes are identi�ed
and recognized (Fig. 3.52), but the ovaries cannot be separated by pushing the tube with the vaginal probe; the woman also has the clinical signs and symp-toms of acute pelvic in�ammatory disease (Fig. 3.55, Fig. 3.56);
■ tubo-ovarian abscess, in which an acutely ill patient with marked tenderness at the touch of the ultrasound probe shows total breakdown of the normal architecture of one or both the adnexa, with formation of a conglomerate in which neither the ovary nor the tubes can be separately recognized as such (Fig. 3.57). �e classical pelvic abscess formation with total breakdown of separately identi�able tissues and speckled �uid is also regarded as a tubo-ovarian abscess.
Presence of �uid: free or in a pelvic peritoneal inclusion cyst. �e latter is a sonolucent, �uid-�lled accumulation in the cul-de-sac, the walls of which are identi-cal to the pelvic wall, with thin adhesions between the organs in the pelvis (Fig. 3.49); the process is not acute, i.e. there is no tenderness upon touch with the vaginal probe or clinical signs and symptoms of an acute illness.
Man
ual o
f dia
gnos
tic u
ltras
ound
– V
olum
e 2
Fig. 3.53. Hydrosalpinx: beads-on-a-string sign. (a) Ultrasound features, (b) Doppler features
a b
978-9241548540-C003 PRF ml YVR ln ml ml-1-Final Proof.indd 180 6/10/13 10:33 AM
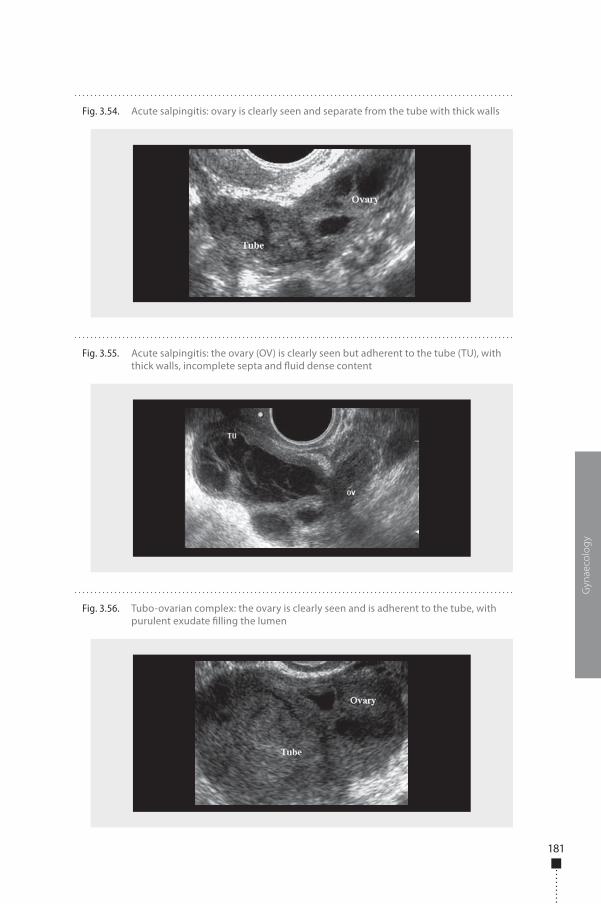
181
Gyn
aeco
log
y
Fig. 3.56. Tubo-ovarian complex: the ovary is clearly seen and is adherent to the tube, with purulent exudate �lling the lumen
Fig. 3.54. Acute salpingitis: ovary is clearly seen and separate from the tube with thick walls
Fig. 3.55. Acute salpingitis: the ovary (OV) is clearly seen but adherent to the tube (TU), with thick walls, incomplete septa and �uid dense content
978-9241548540-C003 PRF ml YVR ln ml ml-1-Final Proof.indd 181 6/10/13 10:33 AM
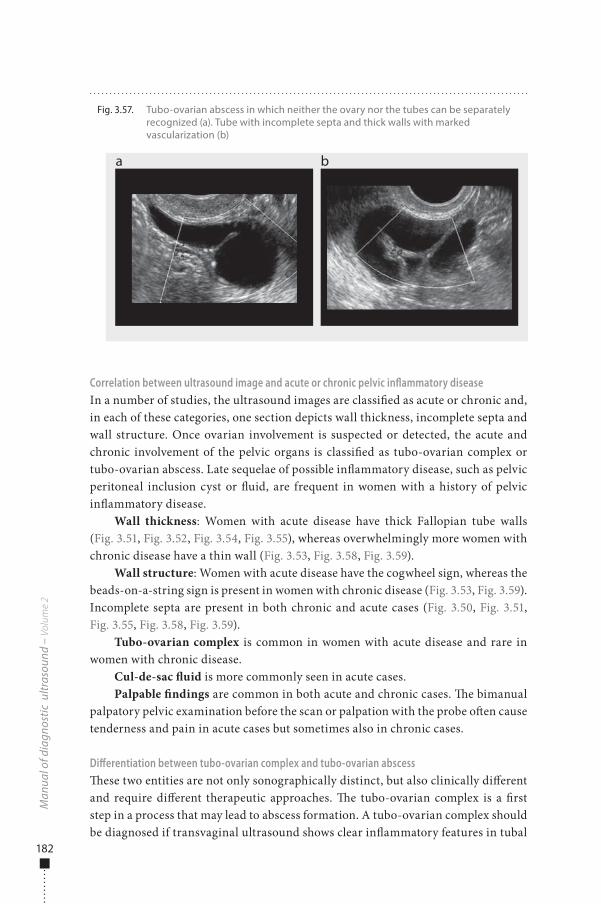
182
Correlation between ultrasound image and acute or chronic pelvic inflammatory diseaseIn a number of studies, the ultrasound images are classi�ed as acute or chronic and, in each of these categories, one section depicts wall thickness, incomplete septa and wall structure. Once ovarian involvement is suspected or detected, the acute and chronic involvement of the pelvic organs is classi�ed as tubo-ovarian complex or tubo-ovarian abscess. Late sequelae of possible in�ammatory disease, such as pelvic peritoneal inclusion cyst or �uid, are frequent in women with a history of pelvic in�ammatory disease.
Wall thickness: Women with acute disease have thick Fallopian tube walls (Fig. 3.51, Fig. 3.52, Fig. 3.54, Fig. 3.55), whereas overwhelmingly more women with chronic disease have a thin wall (Fig. 3.53, Fig. 3.58, Fig. 3.59).
Wall structure: Women with acute disease have the cogwheel sign, whereas the beads-on-a-string sign is present in women with chronic disease (Fig. 3.53, Fig. 3.59). Incomplete septa are present in both chronic and acute cases (Fig. 3.50, Fig. 3.51, Fig. 3.55, Fig. 3.58, Fig. 3.59).
Tubo-ovarian complex is common in women with acute disease and rare in women with chronic disease.
Cul-de-sac �uid is more commonly seen in acute cases.Palpable �ndings are common in both acute and chronic cases. �e bimanual
palpatory pelvic examination before the scan or palpation with the probe o�en cause tenderness and pain in acute cases but sometimes also in chronic cases.
Differentiation between tubo-ovarian complex and tubo-ovarian abscess�ese two entities are not only sonographically distinct, but also clinically di�erent and require di�erent therapeutic approaches. �e tubo-ovarian complex is a �rst step in a process that may lead to abscess formation. A tubo-ovarian complex should be diagnosed if transvaginal ultrasound shows clear in�ammatory features in tubal
Man
ual o
f dia
gnos
tic u
ltras
ound
– V
olum
e 2
Fig. 3.57. Tubo-ovarian abscess in which neither the ovary nor the tubes can be separately recognized (a). Tube with incomplete septa and thick walls with marked vascularization (b)
a b
978-9241548540-C003 PRF ml YVR ln ml ml-1-Final Proof.indd 182 6/10/13 10:33 AM
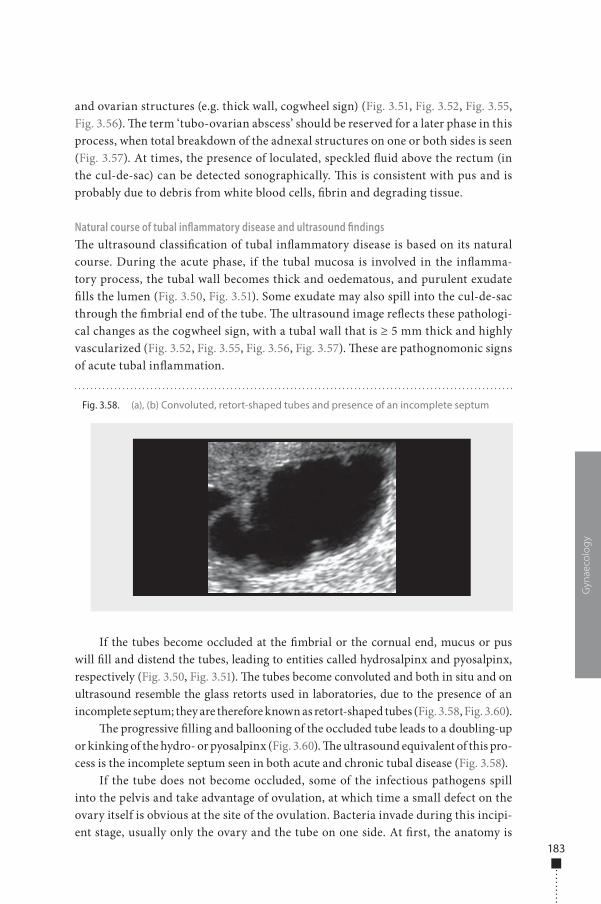
183
and ovarian structures (e.g. thick wall, cogwheel sign) (Fig. 3.51, Fig. 3.52, Fig. 3.55, Fig. 3.56). �e term ‘tubo-ovarian abscess’ should be reserved for a later phase in this process, when total breakdown of the adnexal structures on one or both sides is seen (Fig. 3.57). At times, the presence of loculated, speckled �uid above the rectum (in the cul-de-sac) can be detected sonographically. �is is consistent with pus and is probably due to debris from white blood cells, �brin and degrading tissue.
Natural course of tubal inflammatory disease and ultrasound findings�e ultrasound classi�cation of tubal in�ammatory disease is based on its natural course. During the acute phase, if the tubal mucosa is involved in the in�amma-tory process, the tubal wall becomes thick and oedematous, and purulent exudate �lls the lumen (Fig. 3.50, Fig. 3.51). Some exudate may also spill into the cul-de-sac through the �mbrial end of the tube. �e ultrasound image re�ects these pathologi-cal changes as the cogwheel sign, with a tubal wall that is ≥ 5 mm thick and highly vascularized (Fig. 3.52, Fig. 3.55, Fig. 3.56, Fig. 3.57). �ese are pathognomonic signs of acute tubal in�ammation.
If the tubes become occluded at the �mbrial or the cornual end, mucus or pus will �ll and distend the tubes, leading to entities called hydrosalpinx and pyosalpinx, respectively (Fig. 3.50, Fig. 3.51). �e tubes become convoluted and both in situ and on ultrasound resemble the glass retorts used in laboratories, due to the presence of an incomplete septum; they are therefore known as retort-shaped tubes (Fig. 3.58, Fig. 3.60).
�e progressive �lling and ballooning of the occluded tube leads to a doubling-up or kinking of the hydro- or pyosalpinx (Fig. 3.60). �e ultrasound equivalent of this pro-cess is the incomplete septum seen in both acute and chronic tubal disease (Fig. 3.58).
If the tube does not become occluded, some of the infectious pathogens spill into the pelvis and take advantage of ovulation, at which time a small defect on the ovary itself is obvious at the site of the ovulation. Bacteria invade during this incipi-ent stage, usually only the ovary and the tube on one side. At �rst, the anatomy is
Gyn
aeco
log
y
Fig. 3.58. (a), (b) Convoluted, retort-shaped tubes and presence of an incomplete septum
978-9241548540-C003 PRF ml YVR ln ml ml-1-Final Proof.indd 183 6/10/13 10:33 AM
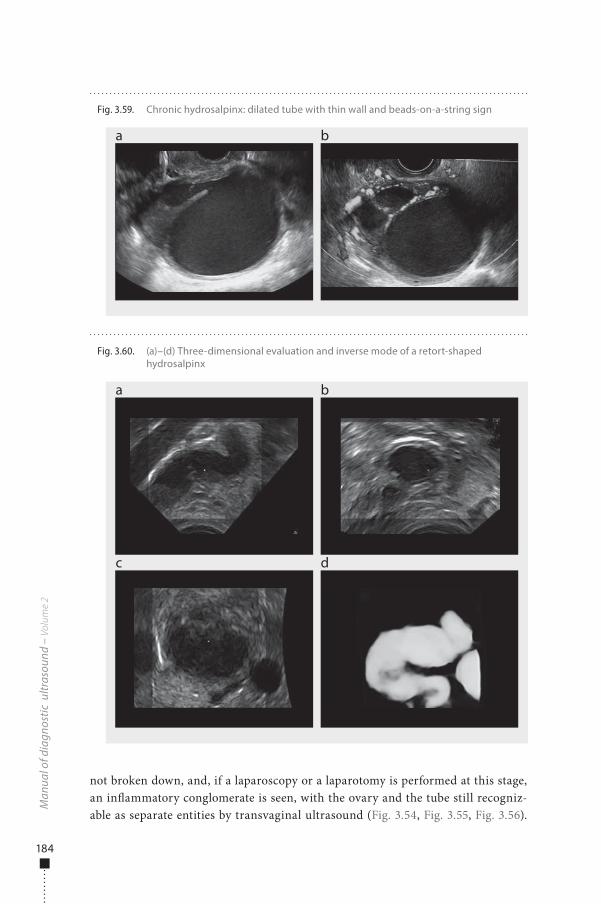
184
not broken down, and, if a laparoscopy or a laparotomy is performed at this stage, an in�ammatory conglomerate is seen, with the ovary and the tube still recogniz-able as separate entities by transvaginal ultrasound (Fig. 3.54, Fig. 3.55, Fig. 3.56).
Man
ual o
f dia
gnos
tic u
ltras
ound
– V
olum
e 2
Fig. 3.59. Chronic hydrosalpinx: dilated tube with thin wall and beads-on-a-string sign
a b
Fig. 3.60. (a)–(d) Three-dimensional evaluation and inverse mode of a retort-shaped hydrosalpinx
a
c
b
d
978-9241548540-C003 PRF ml YVR ln ml ml-1-Final Proof.indd 184 6/10/13 10:33 AM
185
If treatment fails or is not applied, the acute in�ammatory process progresses to its most severe phase, resulting in a full-blown tubo-ovarian abscess (Fig. 3.57). Only at a relatively later stage (days) does the process spread to the other side to involve the contralateral ovary and Fallopian tube. �erefore, an out-of-phase appearance of the two adnexa may be seen: one in which the process has advanced to the tubo-ovarian abscess stage and the contralateral one which lags behind, exhibiting all the signs of a tubo-ovarian complex in which the anatomy has not yet broken down.
�e process may enter a chronic phase, characterized by a completely blocked tube in which �uid accumulates, distending the wall and rendering it very thin. �e endosalpingeal folds almost disappear or become �attened and extremely �brous. On cross-section of the tube, the pathological specimen and histological sections show these remnants of the �brosed endosalpingeal folds (Fig. 3.53). Ultrasound examination also shows the typical dilated, thin-walled structure, studded with the echogenic remnants of the endosalpingeal structures, known as beads-on-a-string (Fig. 3.53, Fig. 3.58, Fig. 3.59). �is ultrasound sign is a reliable marker of chronic tubal disease, e.g. hydrosalpinx. Hydrosalpinx can be the result of previous acute salpingitis and has also been described in women with a history of pelvic in�amma-tory disease or salpingitis or even hysterectomy. Hydrosalpinx can also develop in tubes occluded previously by ligation or cauterization. �e ultrasound �nding of a thin-walled, �uid-�lled tube with the characteristics described here in women who have undergone hysterectomy or tubal sterilization is harder to explain; however, there is evidence that, in these cases, the �mbrial end of the tube may already have been occluded or give the typical ultrasound picture of a hydrosalpinx.
In the acute phase, a small amount of �uid may accumulate in the cul-de-sac or in other parts of the pelvis and persist for a variable length of time. Adhesions between various organs in the pelvis, formed during the acute phase of the in�am-matory disease, may persist for months or even years (Fig. 3.49).
Tubal inflammatory disease and differential diagnosis from ovarian lesionsIt is critical to di�erentiate tubal in�ammatory disease from an ovarian tumour, whether benign or malignant. In the case of an acute in�ammatory process, this is relatively easy, determined by the acute in�ammatory features of the pelvic disease. Di�erentiation is more di�cult when a diagnosis of chronic tubal disease with the beads-on-a-string sign and some septations must be di�erentiated from that of an ovarian cystic structure with small internal papillations and septa. In the case of a chronic hydrosalpinx, the mural lesions (beads-on-a-string) are small, almost equal in size and distributed around the thin wall, whereas papillary formations of an ovar-ian tumour are usually dissimilar in size and located along the wall, which may show variable thickness. If incomplete septa are present, these almost always indicate a Fallopian tube as the true septa of ovarian tumours are very seldom, if ever, incomplete.
For an accurate di�erential diagnosis of other adnexal lesions, each case must be placed in its appropriate clinical context. By combining the information provided by
Gyn
aeco
log
y
978-9241548540-C003 PRF ml YVR ln ml ml-1-Final Proof.indd 185 6/10/13 10:33 AM
186
the woman with the transvaginal ultrasound work-up of the pelvis, valuable ultra-sound markers of in�ammatory disease of the tubes and the ovary can be recognized and the appropriate diagnosis established.
Tubal carcinomaTubal carcinomas are the rarest tumours of the female reproductive system, with an incidence of 0.5% of all gynaecological tumours. Only about 1500 cases have been reported in the literature. �e clinical characteristics and the response to cytostatic therapy are similar to those of ovarian cancer, but their ultrasound appearance may be di�erent. Preoperative diagnosis of tubal cancer is di�cult and is based on visualiza-tion of both ovaries, of normal dimensions and morphology, and an adnexal mass with malignant ultrasound characteristics, separated and distinct from the ovaries. �ese neoplasms o�en have an elongated oval shape (sausage-like); the cystic component is generally hypoechoic, and its appearance is similar to that of an adnexal in�ammation at an advanced stage or a tubo-ovarian abscess.
Tumour markers (e.g. CA-125) may be only moderately increased. The per-sistence of the mass, its growth over a brief period and a lack of response to anti-biotics should guide a differential diagnosis. Ultrasound features of peritoneal carcinomatosis are found in 30–40% of patients with tubal cancer at diagnosis. Otherwise, it appears as a uni- or bilateral adnexal mass, with a complex echo-texture and extensive, richly vascularized solid areas that can be visualized with transvaginal ultrasound.
Tubal patencyTubal occlusion is the single most common cause of female infertility. Some degree of tubal disease, resulting in occlusion of one or both tubes, is found in one of three infertile women (30–50%), and the proportion is considered to be increasing. Evaluation of tubal status is generally the �rst step in an investigation of infertility factors in women. �e usual methods for assessing tubal patency are hysterosalpin-gography and laparoscopic dye chromopertubation (lap-and-dye). �e lap-and-dye test is the gold standard for tubal investigations; however, it involves anaesthesia and surgery, is expensive and o�en involves delays, as it is an inpatient procedure. Hysterosalpingography can be performed on outpatients but involves gonadal expo-sure to X-ray irradiation, may produce a hypersensitivity reaction to iodinated con-trast medium and is 80–90% as accurate as lap-and-dye.
Hysterosalpingo-contrast sonographyTransvaginal hysterosalpingo-contrast sonography (HyCoSy) can be used to evalu-ate tubal patency. It involves the introduction of saline solution into the uterine cavity and the Fallopian tubes during transvaginal ultrasound; when free �uid is found in the pouch of Douglas, the patency of at least one tube can be deduced. Saline solution has the advantage of being completely safe and inexpensive. Although it is a useful negative contrast medium for visualizing intrauterine disease (sonohysterography),
Man
ual o
f dia
gnos
tic u
ltras
ound
– V
olum
e 2
978-9241548540-C003 PRF ml YVR ln ml ml-1-Final Proof.indd 186 6/10/13 10:33 AM
187
saline is not an accurate medium for evaluating the state and patency of the Fallopian tubes. Combination of transvaginal ultrasonography with colour Doppler or ultra-sound positive contrast media has increased the accuracy of this method.
To examine the Fallopian tubes, a positive contrast medium, such as air or albu-min or galactose with micro-air bubbles, is used. �ese agents outline the lumina of the Fallopian tubes, giving a hyperechoic appearance. Use of contrast media (such as Echovist, Levovist and Infoson) facilitates evaluation of tubal patency by hyster-osalpingo-contrast sonography; however, these contrast media are expensive, not available in many countries and not always accepted by women. �e most readily available, least expensive contrast medium is saline solution mixed with air; when this solution is shaken, it produces a suspension of air bubbles which are easily seen when injected into the uterine cavity and the Fallopian tubes.
Hysterosalpingo-contrast sonography is performed as an outpatient procedure a�er a preliminary scan to detect the position of the ovaries and the interstitial part of the tubes. A�er insertion of a speculum, a 5-French salpingographic balloon cath-eter is placed in the uterine cavity and �lled with 1–2 ml of air. �is step ensures that the cervical canal is closed, prevents leakage of saline solution and air and keeps the catheter in position. A 20-ml syringe containing 15 ml of saline solution and 5 ml of air is prepared and shaken immediately before injection.
A vaginal ultrasound probe is then inserted, and a transversal section of the uterus is taken to localize the interstitial part of the tube. Saline solution is injected slowly and continuously through the catheter, and any resistance during injection is noted. Power Doppler can be used to locate the tubal area. Although colour Doppler imaging is not essential for evaluation of tubal patency, it might facilitate visualiza-tion of the passage of saline solution and localization of the tube. When the saline solution and air are injected, a �ow of air bubbles through the tubes can be seen. �e tube is followed as distally as possible by moving the probe slowly.
�e salpinges should be sought and scanned methodically and continuously during injection, starting at the uterine cornu in a plane that also shows the intersti-tial part of the tube, and then scanning laterally to identify for the �ow of air bubbles throughout the tube and near the ovaries. Each salpinx must be examined separately.
If the procedure becomes painful, the examination can be interrupted for a short time to allow any tubal spasm to pass. Hard pressure felt during injection of air and �uid is regarded as a sign of tubal spasm or occlusion. If the pressure does not decrease and no air bubbles are seen to �ow from the tube, it is considered to be obstructed.
�e criteria for tubal patency on hysterosalpingo-contrast sonography with saline and air contrast media are:
■ the passage of air and saline through the interstitial part of the tube; ■ detection of air bubbles moving around the ovary, even without visualization
of the passage through the tube; ■ detection of the solution and air bubbles in the pouch of Douglas; ■ power Doppler evidence of the passage of saline solution.
Gyn
aeco
log
y
978-9241548540-C003 PRF ml YVR ln ml ml-1-Final Proof.indd 187 6/10/13 10:33 AM
188
Man
ual o
f dia
gnos
tic u
ltras
ound
– V
olum
e 2
Transvaginal hysterosalpingo-contrast sonography with saline and air solution is a relatively simple, safe, inexpensive, rapid, well-tolerated outpatient technique for determining tubal patency. Furthermore, transvaginal ultrasound accurately dem-onstrates various pelvic conditions that may be responsible for infertility, so that, in the same setting and at the same time, more information on the pelvis and tubal patency can be obtained. �e accuracy and advantages of hysterosalpingo-contrast sonography over hysterosalpingography and lap-and-dye have been demonstrated, especially when the tubes are patent; poorer accuracy has been found in cases of tubal occlusion, especially when it is unilateral.
Several studies have suggested that hysterosalpingo-contrast sonography could be used in initial screening of infertile women; however, a reported false occlusion rate of 5–15% raises some concern. In contrast to hysterosalpingography, hysterosal-pingo-contrast sonography does not allow imaging of the entire tube and its course. Use of ultrasound contrast media has been proposed to improve evaluation of tubal occlusion and for visualization of the tubal course. Ultrasound contrast media create an image because of the vibration of the bubbles caused by the ultrasound beam at low acoustic pressure. Even with contrast media, however, the false-positive rate for tubal occlusion is still 5–10%, because it is not always possible to visualize the entire tube due to either tubal spasm, only partial occlusion or overlapping by the ultrasound images of other organs (uterus, ovaries, intestine).
�e contrast media generally used produce a contrast response, with an overlap between the tissue and the contrast response. To ensure that a signal is received only from the contrast medium, application of dedicated so�ware to the vaginal probe and new contrast media have been proposed. �is technique optimizes the use of ultrasound contrast media by means of low acoustic pressure and allows detection of the contrast medium by selecting the harmonic response of the microbubbles of the medium from the signals coming from insonated organs. �e image displayed with this technique is due only to harmonic signals produced by contrast media micro-bubbles; broadband ultrasonic signals from surrounding tissue are �ltered out com-pletely, therefore obviating any overlap between the tissue and the contrast response.
When intrauterine injection of contrast medium is visualized by ultrasound with low acoustic pressure, the contrast medium is �rst seen in the tube, if it is patent proximally, and then spills into the abdominal cavity if the tube is distally and totally patent. Tubal occlusion can be assumed when the contrast medium remains concentrated within the uterus or the tubes and does not spill into the abdominal cavity, which remains hypoechoic (Fig. 3.61).
As the contrast medium is extremely hyperechogenic and can be visualized for several minutes, it is possible to study the tubal course and shape (Fig. 3.62).
Hysterosalpingo-contrast sonography associated with transvaginal scanning can be used for primary investigation of infertility in women on an outpatient basis. Hysterosalpingo-contrast sonography performed with a combination of air and saline is a quick, inexpensive, well-tolerated method for determining tubal patency, but it requires some experience. One of the most important advantages
978-9241548540-C003 PRF ml YVR ln ml ml-1-Final Proof.indd 188 6/10/13 10:33 AM
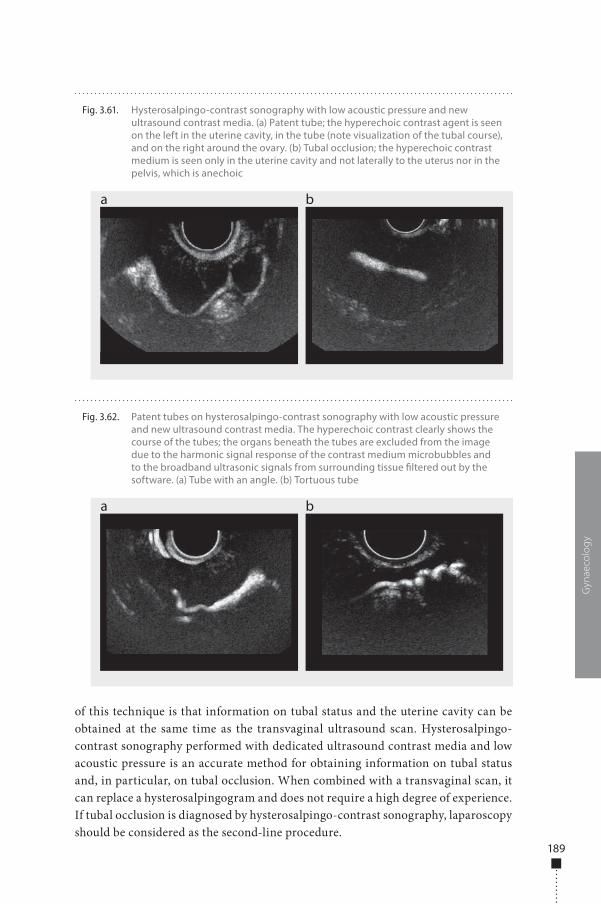
189
Gyn
aeco
log
y
of this technique is that information on tubal status and the uterine cavity can be obtained at the same time as the transvaginal ultrasound scan. Hysterosalpingo-contrast sonography performed with dedicated ultrasound contrast media and low acoustic pressure is an accurate method for obtaining information on tubal status and, in particular, on tubal occlusion. When combined with a transvaginal scan, it can replace a hysterosalpingogram and does not require a high degree of experience. If tubal occlusion is diagnosed by hysterosalpingo-contrast sonography, laparoscopy should be considered as the second-line procedure.
Fig. 3.62. Patent tubes on hysterosalpingo-contrast sonography with low acoustic pressure and new ultrasound contrast media. The hyperechoic contrast clearly shows the course of the tubes; the organs beneath the tubes are excluded from the image due to the harmonic signal response of the contrast medium microbubbles and to the broadband ultrasonic signals from surrounding tissue �ltered out by the software. (a) Tube with an angle. (b) Tortuous tube
a b
Fig. 3.61. Hysterosalpingo-contrast sonography with low acoustic pressure and new ultrasound contrast media. (a) Patent tube; the hyperechoic contrast agent is seen on the left in the uterine cavity, in the tube (note visualization of the tubal course), and on the right around the ovary. (b) Tubal occlusion; the hyperechoic contrast medium is seen only in the uterine cavity and not laterally to the uterus nor in the pelvis, which is anechoic
a b
978-9241548540-C003 PRF ml YVR ln ml ml-1-Final Proof.indd 189 6/10/13 10:33 AM

978-9241548540-C003 PRF ml YVR ln ml ml-1-Final Proof.indd 190 6/10/13 10:33 AM
Normal anatomy, basic examination and biopsy technique
193
193 Indications193 Preparation194 Examination technique195 Normal �ndings201 Biopsy201 New ultrasound techniques
Benign lesions 202202 Cysts205 Acute mastitis and abscesses207 Haematoma207 Fibroadenoma209 Phyllodes tumour209 Intraductal papilloma210 Intraparenchymal
lymph nodes
211 Fibrocystic alterations213 Fibrolipoadenoma213 Galactocoele214 Adenoma215 Liponecrosis216 Male breast disease
Malignant lesions 217217 Breast cancer218 Role of ultrasound218 Sonographic features225 Local staging
Chapter 4 Breast
978-9241548540-C004 PRF ml YVR ln ml ml-1-Final Proof.indd 191 6/10/13 10:32 AM

978-9241548540-C004 PRF ml YVR ln ml ml-1-Final Proof.indd 192 6/10/13 10:32 AM
Normal anatomy, basic examination and biopsy technique
IndicationsBreast ultrasound is a non-invasive imaging technique for diagnosing breast dis-ease. Mammography is a well-established imaging tool for screening breast cancer in order to reduce its inherent mortality by an early diagnosis. Even so, mammograms do not detect all breast cancers: some breast lesions and abnormalities are not visible or are di�cult to interpret on mammograms. In dense breasts (a lot of breast tissue and less fat), many cancers can be hard to see on mammography.
Breast ultrasound can be used in several ways. �e commonest application is for investigating an area of the breast in which a problem is suspected. A palpable lump or a lump or density discovered by X-ray imaging (mammogram) can be evaluated further by ultrasound. �is is especially helpful for distinguishing between a �uid-�lled cyst and a solid mass.
Breast ultrasound is o�en the �rst examination performed to evaluate masses in women under 35 years of age, whose mammograms can be di�cult to interpret because of the density of their breast tissue. Ultrasound may also be used in women for whom radiation is contraindicated, such as pregnant women, young women and women with silicone breast implants.
Breast ultrasound is also used to observe and guide a needle in several inter-ventional procedures, including cyst aspiration, �ne-needle aspiration, large-core needle biopsy and needle localization in surgical breast biopsy. Biopsies guided by ultrasound have distinct advantages: they are generally less costly than surgical biop-sies, and, if the abnormality to be sampled can be seen on both a mammogram and ultrasound, an ultrasound-guided biopsy is o�en more comfortable for the woman, as no compression is necessary.
Preparation�e ultrasound unit should be on the woman’s right. �e radiologist takes images with the right hand and operates the machine with the le� hand. �e woman is in a supine position with a raised arm, and the examiner sits at her level. A raised arm
4Breast
193
978-9241548540-C004 PRF ml YVR ln ml ml-1-Final Proof.indd 193 6/10/13 10:32 AM
194
�attens and immobilizes the breast on the chest wall by tension on the pectoral muscles. �is position is the same as that used for breast operation and ensures the reproducibility of the examination. Larger breasts shi� laterally, creating non-uniform tissue distortion. In this case, the radiologist should ask the woman to roll to allow study of the lateral quadrants. Asking the women to assume a sitting position might help the examiner to localize the lesion if a palpable mass cannot be found when she is in the supine position.
Before the procedure, clear gel is applied to the woman’s skin to allow smooth movement of the transducer over the skin and to eliminate air between the skin and the transducer. The transducer is held at the base, in maximum contact with the f ingers and palm. The examiner’s forearm rests lightly on the woman’s torso, and the movement of the transducer is controlled by the wrist, not the entire arm.
Examination techniqueReal-time hand-held scanners should include a linear array and a high-frequency transducer operating at a frequency of 7.5–10 MHz or more, which provides good tissue penetration to 4–5 cm. �e depth of focus is placed at ≤ 3 cm. �e time-compensated gain curve should be adjusted so that fat is uniformly grey, from the subcutaneous tissue to the chest wall. Improper adjustment of technical parameters can lead to suboptimal images and produce artefactual echoes that can result in mis-diagnosis. Routine calibration of the unit and evaluation of the unit’s performance with a breast phantom help prevent technical errors.
To ensure that the �eld of view includes all the breast tissue, from the skin surface to the chest wall, the operator should see the pectoral muscles and the chest wall at the bottom of the screen. In order to reduce re�ective and refractive attenua-tion, the transducer should be kept parallel to the breast surface and the ultrasound beam perpendicular to the breast tissue by applying gentle, uniform pressure. Use of a Doppler probe during an ultrasound procedure allows assessment of blood �ow within the breast.
�e breast is moveable and contains few anatomical landmarks. In order to achieve complete coverage, a systemic scanning pattern is needed, involving sagit-tal, transverse, radial and tangential scans. Radial scanning is critical for detecting intraductal mammary lesions. If it is not viewed along the long axis of the duct, a mass will be di�cult to detect; it is relatively easy to see a mass in the duct when the transducer is aligned along it.
An ultrasound examination should always be complemented by a study of the axillary regions.
Palpation during scanning allows precise localization of palpable abnormali-ties. It enables the examiner not only to �nd subtle lesions, but also to determine
Man
ual o
f dia
gnos
tic u
ltras
ound
– V
olum
e 2
978-9241548540-C004 PRF ml YVR ln ml ml-1-Final Proof.indd 194 6/10/13 10:32 AM
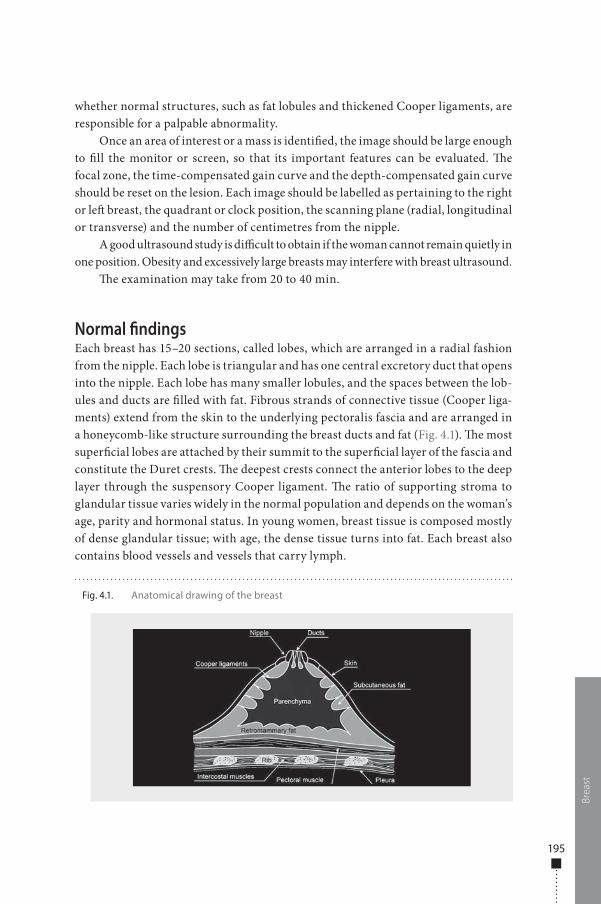
195
whether normal structures, such as fat lobules and thickened Cooper ligaments, are responsible for a palpable abnormality.
Once an area of interest or a mass is identi�ed, the image should be large enough to �ll the monitor or screen, so that its important features can be evaluated. �e focal zone, the time-compensated gain curve and the depth-compensated gain curve should be reset on the lesion. Each image should be labelled as pertaining to the right or le� breast, the quadrant or clock position, the scanning plane (radial, longitudinal or transverse) and the number of centimetres from the nipple.
A good ultrasound study is di�cult to obtain if the woman cannot remain quietly in one position. Obesity and excessively large breasts may interfere with breast ultrasound.
�e examination may take from 20 to 40 min.
Normal �ndingsEach breast has 15–20 sections, called lobes, which are arranged in a radial fashion from the nipple. Each lobe is triangular and has one central excretory duct that opens into the nipple. Each lobe has many smaller lobules, and the spaces between the lob-ules and ducts are �lled with fat. Fibrous strands of connective tissue (Cooper liga-ments) extend from the skin to the underlying pectoralis fascia and are arranged in a honeycomb-like structure surrounding the breast ducts and fat (Fig. 4.1). �e most super�cial lobes are attached by their summit to the super�cial layer of the fascia and constitute the Duret crests. �e deepest crests connect the anterior lobes to the deep layer through the suspensory Cooper ligament. �e ratio of supporting stroma to glandular tissue varies widely in the normal population and depends on the woman’s age, parity and hormonal status. In young women, breast tissue is composed mostly of dense glandular tissue; with age, the dense tissue turns into fat. Each breast also contains blood vessels and vessels that carry lymph.
Brea
stFig. 4.1. Anatomical drawing of the breast
978-9241548540-C004 PRF ml YVR ln ml ml-1-Final Proof.indd 195 6/10/13 10:32 AM
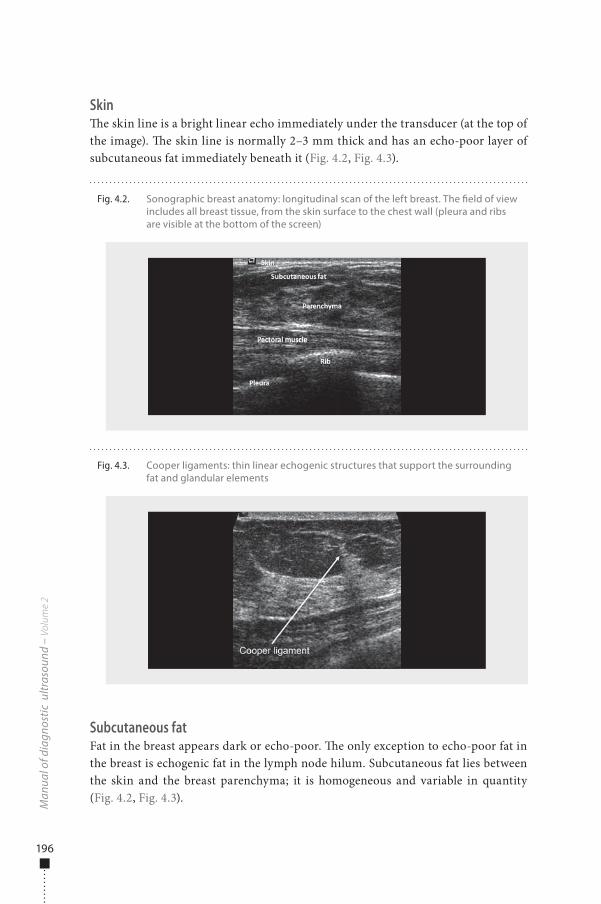
196
Skin�e skin line is a bright linear echo immediately under the transducer (at the top of the image). �e skin line is normally 2–3 mm thick and has an echo-poor layer of subcutaneous fat immediately beneath it (Fig. 4.2, Fig. 4.3).
Subcutaneous fatFat in the breast appears dark or echo-poor. �e only exception to echo-poor fat in the breast is echogenic fat in the lymph node hilum. Subcutaneous fat lies between the skin and the breast parenchyma; it is homogeneous and variable in quantity (Fig. 4.2, Fig. 4.3).
Man
ual o
f dia
gnos
tic u
ltras
ound
– V
olum
e 2
Fig. 4.2. Sonographic breast anatomy: longitudinal scan of the left breast. The �eld of view includes all breast tissue, from the skin surface to the chest wall (pleura and ribs are visible at the bottom of the screen)
Fig. 4.3. Cooper ligaments: thin linear echogenic structures that support the surrounding fat and glandular elements
978-9241548540-C004 PRF ml YVR ln ml ml-1-Final Proof.indd 196 6/10/13 10:32 AM
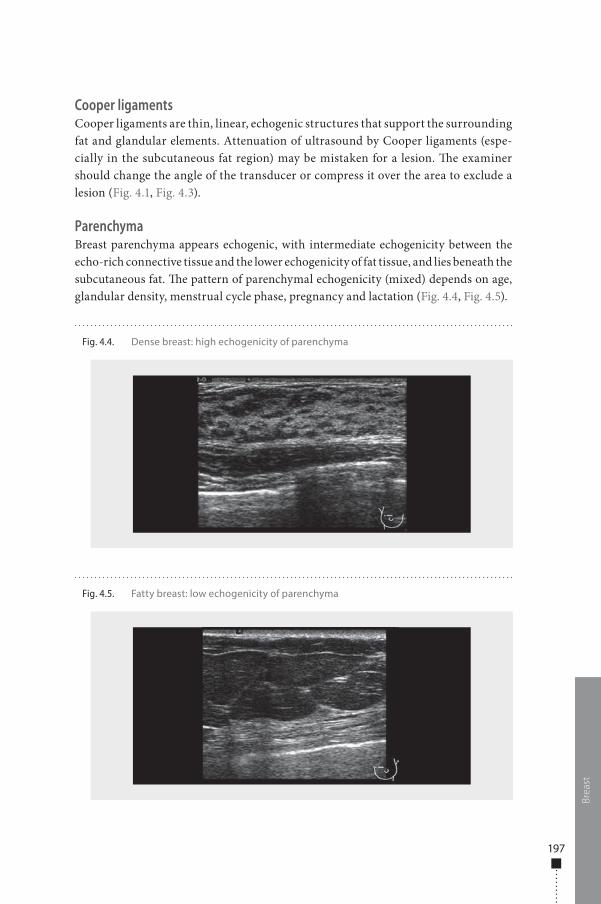
197
Cooper ligamentsCooper ligaments are thin, linear, echogenic structures that support the surrounding fat and glandular elements. Attenuation of ultrasound by Cooper ligaments (espe-cially in the subcutaneous fat region) may be mistaken for a lesion. �e examiner should change the angle of the transducer or compress it over the area to exclude a lesion (Fig. 4.1, Fig. 4.3).
ParenchymaBreast parenchyma appears echogenic, with intermediate echogenicity between the echo-rich connective tissue and the lower echogenicity of fat tissue, and lies beneath the subcutaneous fat. �e pattern of parenchymal echogenicity (mixed) depends on age, glandular density, menstrual cycle phase, pregnancy and lactation (Fig. 4.4, Fig. 4.5).
Brea
st
Fig. 4.4. Dense breast: high echogenicity of parenchyma
Fig. 4.5. Fatty breast: low echogenicity of parenchyma
978-9241548540-C004 PRF ml YVR ln ml ml-1-Final Proof.indd 197 6/10/13 10:32 AM
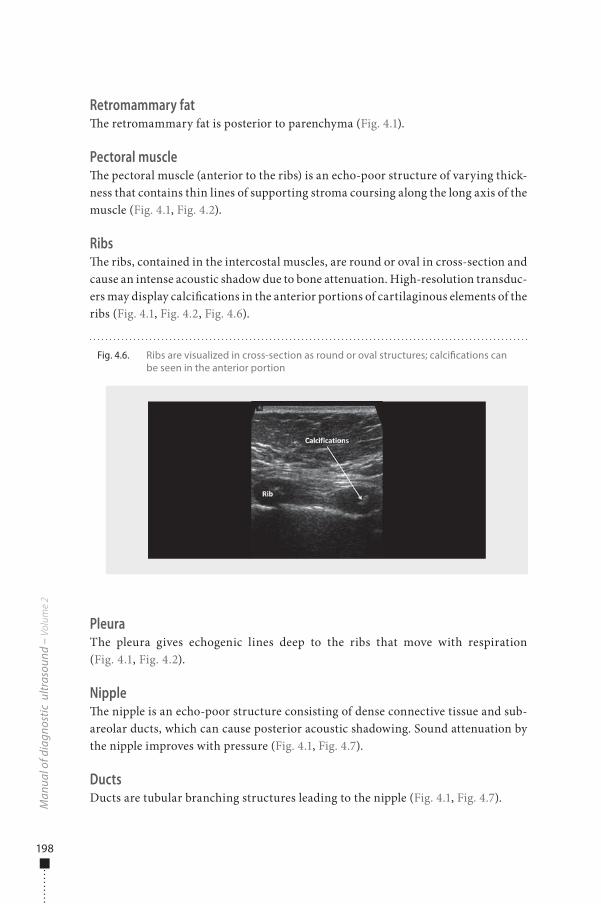
198
Retromammary fat�e retromammary fat is posterior to parenchyma (Fig. 4.1).
Pectoral muscle�e pectoral muscle (anterior to the ribs) is an echo-poor structure of varying thick-ness that contains thin lines of supporting stroma coursing along the long axis of the muscle (Fig. 4.1, Fig. 4.2).
Ribs�e ribs, contained in the intercostal muscles, are round or oval in cross-section and cause an intense acoustic shadow due to bone attenuation. High-resolution transduc-ers may display calci�cations in the anterior portions of cartilaginous elements of the ribs (Fig. 4.1, Fig. 4.2, Fig. 4.6).
PleuraThe pleura gives echogenic lines deep to the ribs that move with respiration (Fig. 4.1, Fig. 4.2).
Nipple�e nipple is an echo-poor structure consisting of dense connective tissue and sub-areolar ducts, which can cause posterior acoustic shadowing. Sound attenuation by the nipple improves with pressure (Fig. 4.1, Fig. 4.7).
DuctsDucts are tubular branching structures leading to the nipple (Fig. 4.1, Fig. 4.7).
Man
ual o
f dia
gnos
tic u
ltras
ound
– V
olum
e 2
Fig. 4.6. Ribs are visualized in cross-section as round or oval structures; calci�cations can be seen in the anterior portion
978-9241548540-C004 PRF ml YVR ln ml ml-1-Final Proof.indd 198 6/10/13 10:32 AM
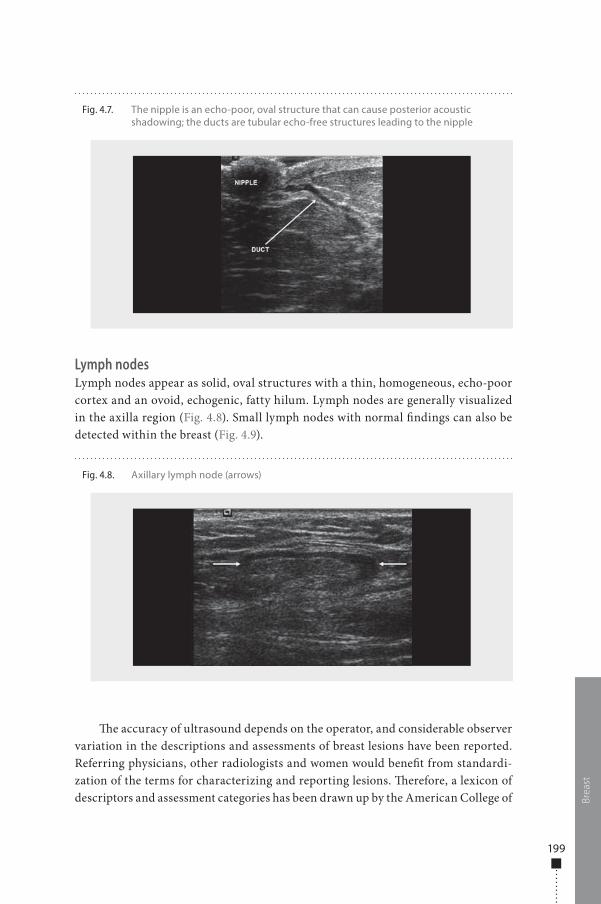
199
Lymph nodesLymph nodes appear as solid, oval structures with a thin, homogeneous, echo-poor cortex and an ovoid, echogenic, fatty hilum. Lymph nodes are generally visualized in the axilla region (Fig. 4.8). Small lymph nodes with normal �ndings can also be detected within the breast (Fig. 4.9).
�e accuracy of ultrasound depends on the operator, and considerable observer variation in the descriptions and assessments of breast lesions have been reported. Referring physicians, other radiologists and women would bene�t from standardi-zation of the terms for characterizing and reporting lesions. �erefore, a lexicon of descriptors and assessment categories has been drawn up by the American College of Br
east
Fig. 4.7. The nipple is an echo-poor, oval structure that can cause posterior acoustic shadowing; the ducts are tubular echo-free structures leading to the nipple
Fig. 4.8. Axillary lymph node (arrows)
978-9241548540-C004 PRF ml YVR ln ml ml-1-Final Proof.indd 199 6/10/13 10:32 AM
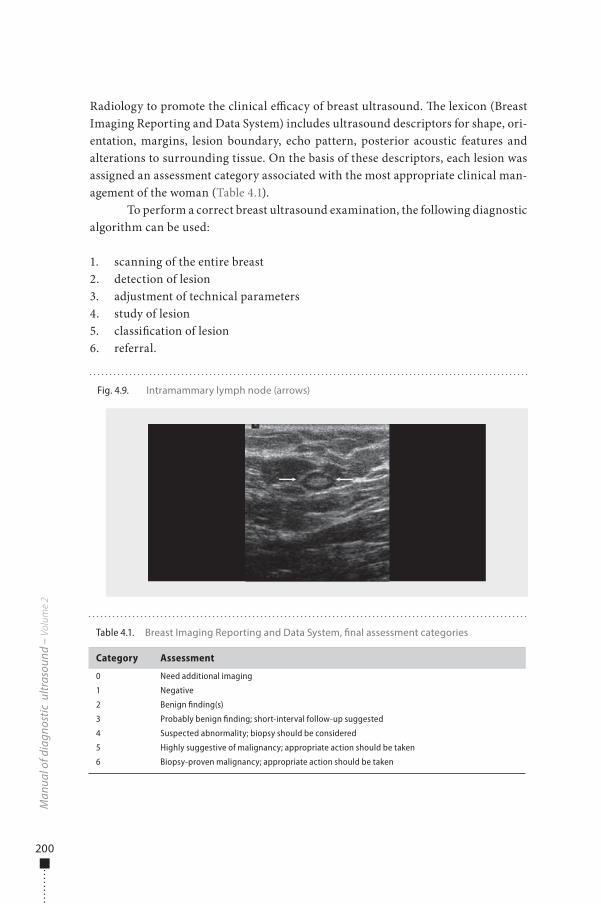
200
Radiology to promote the clinical e�cacy of breast ultrasound. �e lexicon (Breast Imaging Reporting and Data System) includes ultrasound descriptors for shape, ori-entation, margins, lesion boundary, echo pattern, posterior acoustic features and alterations to surrounding tissue. On the basis of these descriptors, each lesion was assigned an assessment category associated with the most appropriate clinical man-agement of the woman (Table 4.1).
To perform a correct breast ultrasound examination, the following diagnostic algorithm can be used:
1. scanning of the entire breast2. detection of lesion3. adjustment of technical parameters4. study of lesion5. classi�cation of lesion6. referral.
Man
ual o
f dia
gnos
tic u
ltras
ound
– V
olum
e 2
Table 4.1. Breast Imaging Reporting and Data System, �nal assessment categories
Category Assessment
0 Need additional imaging
1 Negative
2 Benign finding(s)
3 Probably benign finding; short-interval follow-up suggested
4 Suspected abnormality; biopsy should be considered
5 Highly suggestive of malignancy; appropriate action should be taken
6 Biopsy-proven malignancy; appropriate action should be taken
Fig. 4.9. Intramammary lymph node (arrows)
978-9241548540-C004 PRF ml YVR ln ml ml-1-Final Proof.indd 200 6/10/13 10:32 AM
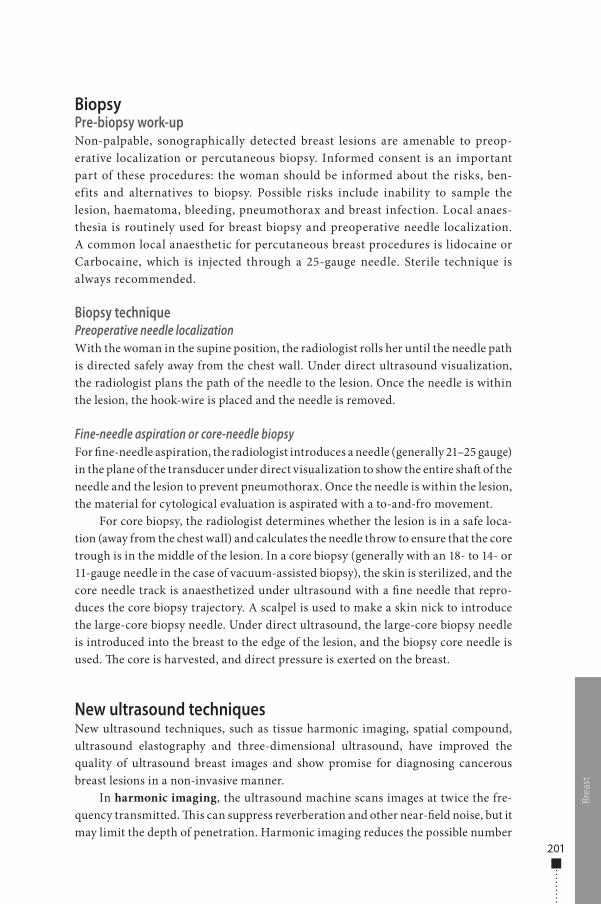
201
BiopsyPre-biopsy work-upNon-palpable, sonographically detected breast lesions are amenable to preop-erative localization or percutaneous biopsy. Informed consent is an important part of these procedures: the woman should be informed about the risks, ben-efits and alternatives to biopsy. Possible risks include inability to sample the lesion, haematoma, bleeding, pneumothorax and breast infection. Local anaes-thesia is routinely used for breast biopsy and preoperative needle localization. A common local anaesthetic for percutaneous breast procedures is lidocaine or Carbocaine, which is injected through a 25-gauge needle. Sterile technique is always recommended.
Biopsy techniquePreoperative needle localizationWith the woman in the supine position, the radiologist rolls her until the needle path is directed safely away from the chest wall. Under direct ultrasound visualization, the radiologist plans the path of the needle to the lesion. Once the needle is within the lesion, the hook-wire is placed and the needle is removed.
Fine-needle aspiration or core-needle biopsyFor �ne-needle aspiration, the radiologist introduces a needle (generally 21–25 gauge) in the plane of the transducer under direct visualization to show the entire sha� of the needle and the lesion to prevent pneumothorax. Once the needle is within the lesion, the material for cytological evaluation is aspirated with a to-and-fro movement.
For core biopsy, the radiologist determines whether the lesion is in a safe loca-tion (away from the chest wall) and calculates the needle throw to ensure that the core trough is in the middle of the lesion. In a core biopsy (generally with an 18- to 14- or 11-gauge needle in the case of vacuum-assisted biopsy), the skin is sterilized, and the core needle track is anaesthetized under ultrasound with a �ne needle that repro-duces the core biopsy trajectory. A scalpel is used to make a skin nick to introduce the large-core biopsy needle. Under direct ultrasound, the large-core biopsy needle is introduced into the breast to the edge of the lesion, and the biopsy core needle is used. �e core is harvested, and direct pressure is exerted on the breast.
New ultrasound techniquesNew ultrasound techniques, such as tissue harmonic imaging, spatial compound, ultrasound elastography and three-dimensional ultrasound, have improved the quality of ultrasound breast images and show promise for diagnosing cancerous breast lesions in a non-invasive manner.
In harmonic imaging, the ultrasound machine scans images at twice the fre-quency transmitted. �is can suppress reverberation and other near-�eld noise, but it may limit the depth of penetration. Harmonic imaging reduces the possible number
Brea
st
978-9241548540-C004 PRF ml YVR ln ml ml-1-Final Proof.indd 201 6/10/13 10:32 AM
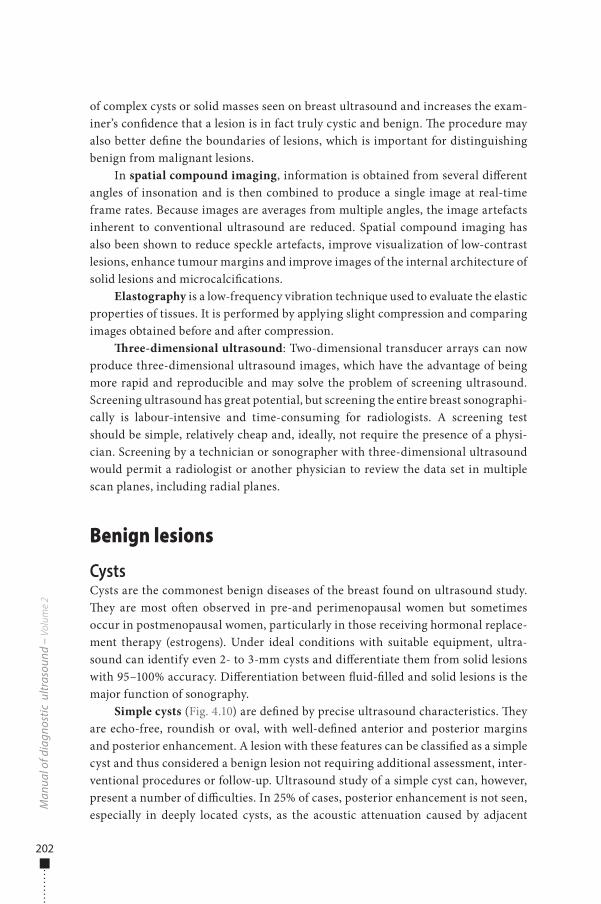
202
of complex cysts or solid masses seen on breast ultrasound and increases the exam-iner’s con�dence that a lesion is in fact truly cystic and benign. �e procedure may also better de�ne the boundaries of lesions, which is important for distinguishing benign from malignant lesions.
In spatial compound imaging, information is obtained from several di�erent angles of insonation and is then combined to produce a single image at real-time frame rates. Because images are averages from multiple angles, the image artefacts inherent to conventional ultrasound are reduced. Spatial compound imaging has also been shown to reduce speckle artefacts, improve visualization of low-contrast lesions, enhance tumour margins and improve images of the internal architecture of solid lesions and microcalci�cations.
Elastography is a low-frequency vibration technique used to evaluate the elastic properties of tissues. It is performed by applying slight compression and comparing images obtained before and a�er compression.
�ree-dimensional ultrasound: Two-dimensional transducer arrays can now produce three-dimensional ultrasound images, which have the advantage of being more rapid and reproducible and may solve the problem of screening ultrasound. Screening ultrasound has great potential, but screening the entire breast sonographi-cally is labour-intensive and time-consuming for radiologists. A screening test should be simple, relatively cheap and, ideally, not require the presence of a physi-cian. Screening by a technician or sonographer with three-dimensional ultrasound would permit a radiologist or another physician to review the data set in multiple scan planes, including radial planes.
Benign lesions
CystsCysts are the commonest benign diseases of the breast found on ultrasound study. �ey are most o�en observed in pre-and perimenopausal women but sometimes occur in postmenopausal women, particularly in those receiving hormonal replace-ment therapy (estrogens). Under ideal conditions with suitable equipment, ultra-sound can identify even 2- to 3-mm cysts and di�erentiate them from solid lesions with 95–100% accuracy. Di�erentiation between �uid-�lled and solid lesions is the major function of sonography.
Simple cysts (Fig. 4.10) are de�ned by precise ultrasound characteristics. �ey are echo-free, roundish or oval, with well-de�ned anterior and posterior margins and posterior enhancement. A lesion with these features can be classi�ed as a simple cyst and thus considered a benign lesion not requiring additional assessment, inter-ventional procedures or follow-up. Ultrasound study of a simple cyst can, however, present a number of di�culties. In 25% of cases, posterior enhancement is not seen, especially in deeply located cysts, as the acoustic attenuation caused by adjacent
Man
ual o
f dia
gnos
tic u
ltras
ound
– V
olum
e 2
978-9241548540-C004 PRF ml YVR ln ml ml-1-Final Proof.indd 202 6/10/13 10:32 AM
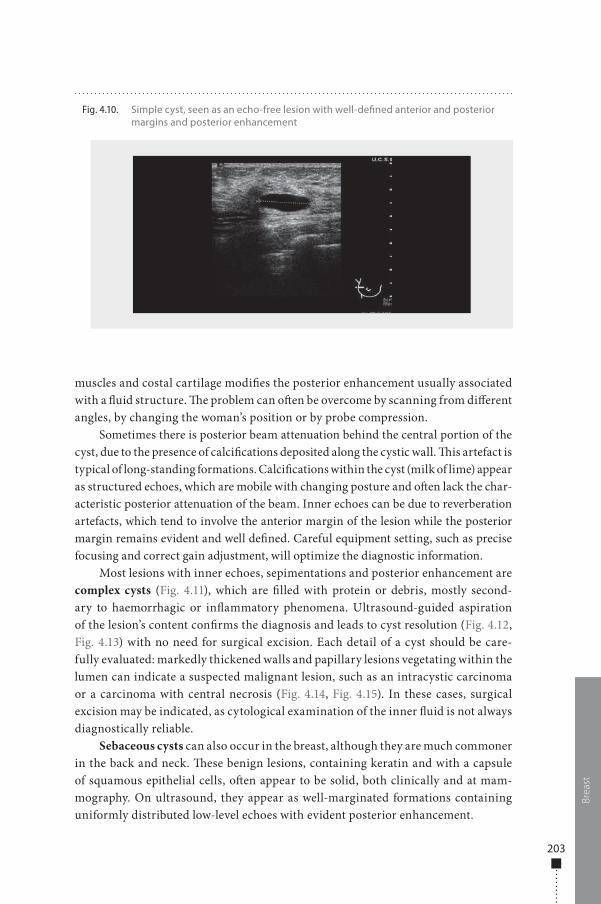
203
muscles and costal cartilage modi�es the posterior enhancement usually associated with a �uid structure. �e problem can o�en be overcome by scanning from di�erent angles, by changing the woman’s position or by probe compression.
Sometimes there is posterior beam attenuation behind the central portion of the cyst, due to the presence of calci�cations deposited along the cystic wall. �is artefact is typical of long-standing formations. Calci�cations within the cyst (milk of lime) appear as structured echoes, which are mobile with changing posture and o�en lack the char-acteristic posterior attenuation of the beam. Inner echoes can be due to reverberation artefacts, which tend to involve the anterior margin of the lesion while the posterior margin remains evident and well de�ned. Careful equipment setting, such as precise focusing and correct gain adjustment, will optimize the diagnostic information.
Most lesions with inner echoes, sepimentations and posterior enhancement are complex cysts (Fig. 4.11), which are �lled with protein or debris, mostly second-ary to haemorrhagic or in�ammatory phenomena. Ultrasound-guided aspiration of the lesion’s content con�rms the diagnosis and leads to cyst resolution (Fig. 4.12, Fig. 4.13) with no need for surgical excision. Each detail of a cyst should be care-fully evaluated: markedly thickened walls and papillary lesions vegetating within the lumen can indicate a suspected malignant lesion, such as an intracystic carcinoma or a carcinoma with central necrosis (Fig. 4.14, Fig. 4.15). In these cases, surgical excision may be indicated, as cytological examination of the inner �uid is not always diagnostically reliable.
Sebaceous cysts can also occur in the breast, although they are much commoner in the back and neck. �ese benign lesions, containing keratin and with a capsule of squamous epithelial cells, o�en appear to be solid, both clinically and at mam-mography. On ultrasound, they appear as well-marginated formations containing uniformly distributed low-level echoes with evident posterior enhancement.
Brea
st
Fig. 4.10. Simple cyst, seen as an echo-free lesion with well-de�ned anterior and posterior margins and posterior enhancement
978-9241548540-C004 PRF ml YVR ln ml ml-1-Final Proof.indd 203 6/10/13 10:32 AM
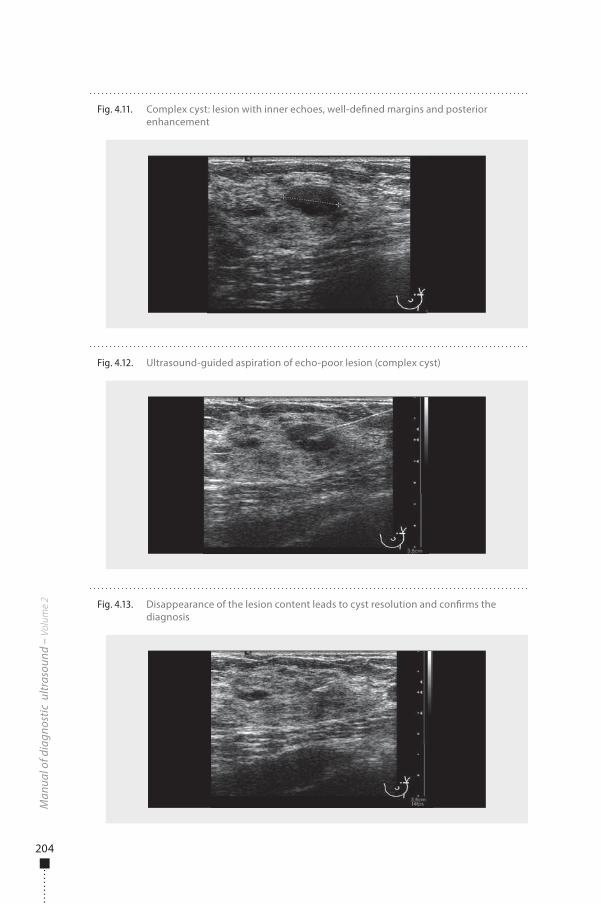
204
Man
ual o
f dia
gnos
tic u
ltras
ound
– V
olum
e 2
Fig. 4.12. Ultrasound-guided aspiration of echo-poor lesion (complex cyst)
Fig. 4.13. Disappearance of the lesion content leads to cyst resolution and con�rms the diagnosis
Fig. 4.11. Complex cyst: lesion with inner echoes, well-de�ned margins and posterior enhancement
978-9241548540-C004 PRF ml YVR ln ml ml-1-Final Proof.indd 204 6/10/13 10:32 AM
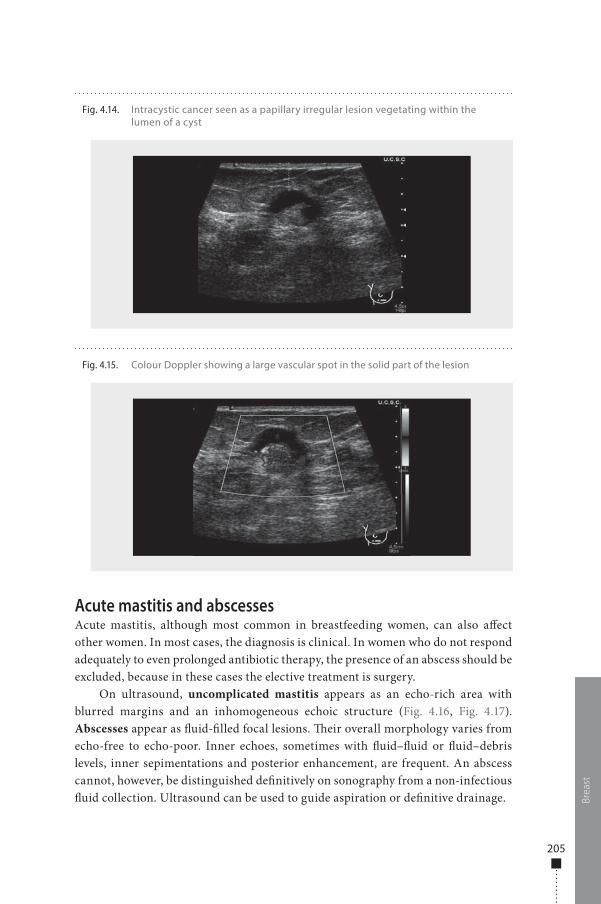
205
Acute mastitis and abscessesAcute mastitis, although most common in breastfeeding women, can also a�ect other women. In most cases, the diagnosis is clinical. In women who do not respond adequately to even prolonged antibiotic therapy, the presence of an abscess should be excluded, because in these cases the elective treatment is surgery.
On ultrasound, uncomplicated mastitis appears as an echo-rich area with blurred margins and an inhomogeneous echoic structure (Fig. 4.16, Fig. 4.17). Abscesses appear as �uid-�lled focal lesions. �eir overall morphology varies from echo-free to echo-poor. Inner echoes, sometimes with �uid–�uid or �uid–debris levels, inner sepimentations and posterior enhancement, are frequent. An abscess cannot, however, be distinguished de�nitively on sonography from a non-infectious �uid collection. Ultrasound can be used to guide aspiration or de�nitive drainage. Br
east
Fig. 4.14. Intracystic cancer seen as a papillary irregular lesion vegetating within the lumen of a cyst
Fig. 4.15. Colour Doppler showing a large vascular spot in the solid part of the lesion
978-9241548540-C004 PRF ml YVR ln ml ml-1-Final Proof.indd 205 6/10/13 10:32 AM
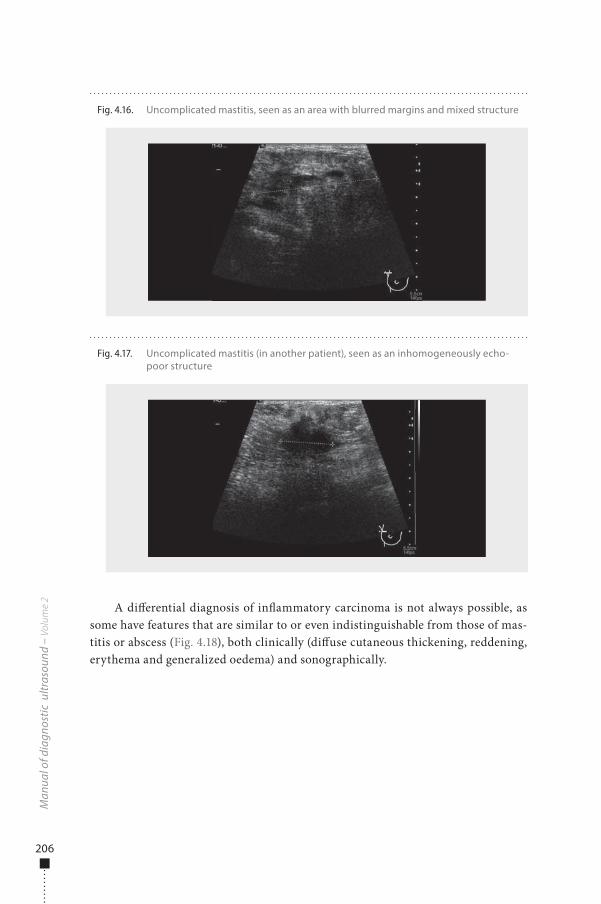
206
A di�erential diagnosis of in�ammatory carcinoma is not always possible, as some have features that are similar to or even indistinguishable from those of mas-titis or abscess (Fig. 4.18), both clinically (di�use cutaneous thickening, reddening, erythema and generalized oedema) and sonographically.
Man
ual o
f dia
gnos
tic u
ltras
ound
– V
olum
e 2
Fig. 4.17. Uncomplicated mastitis (in another patient), seen as an inhomogeneously echo-poor structure
Fig. 4.16. Uncomplicated mastitis, seen as an area with blurred margins and mixed structure
978-9241548540-C004 PRF ml YVR ln ml ml-1-Final Proof.indd 206 6/10/13 10:32 AM
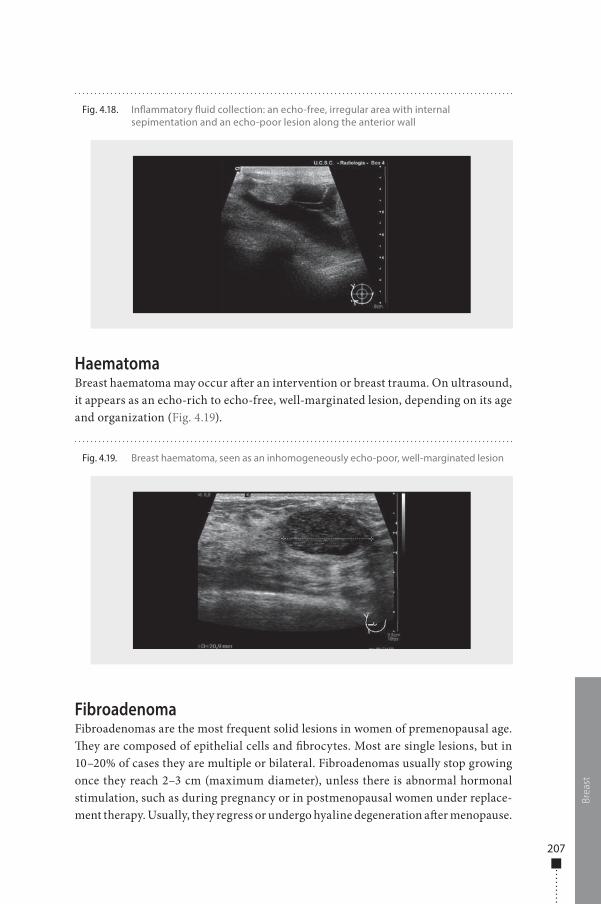
207
HaematomaBreast haematoma may occur a�er an intervention or breast trauma. On ultrasound, it appears as an echo-rich to echo-free, well-marginated lesion, depending on its age and organization (Fig. 4.19).
FibroadenomaFibroadenomas are the most frequent solid lesions in women of premenopausal age. �ey are composed of epithelial cells and �brocytes. Most are single lesions, but in 10–20% of cases they are multiple or bilateral. Fibroadenomas usually stop growing once they reach 2–3 cm (maximum diameter), unless there is abnormal hormonal stimulation, such as during pregnancy or in postmenopausal women under replace-ment therapy. Usually, they regress or undergo hyaline degeneration a�er menopause.
Brea
st
Fig. 4.18. In�ammatory �uid collection: an echo-free, irregular area with internal sepimentation and an echo-poor lesion along the anterior wall
Fig. 4.19. Breast haematoma, seen as an inhomogeneously echo-poor, well-marginated lesion
978-9241548540-C004 PRF ml YVR ln ml ml-1-Final Proof.indd 207 6/10/13 10:32 AM
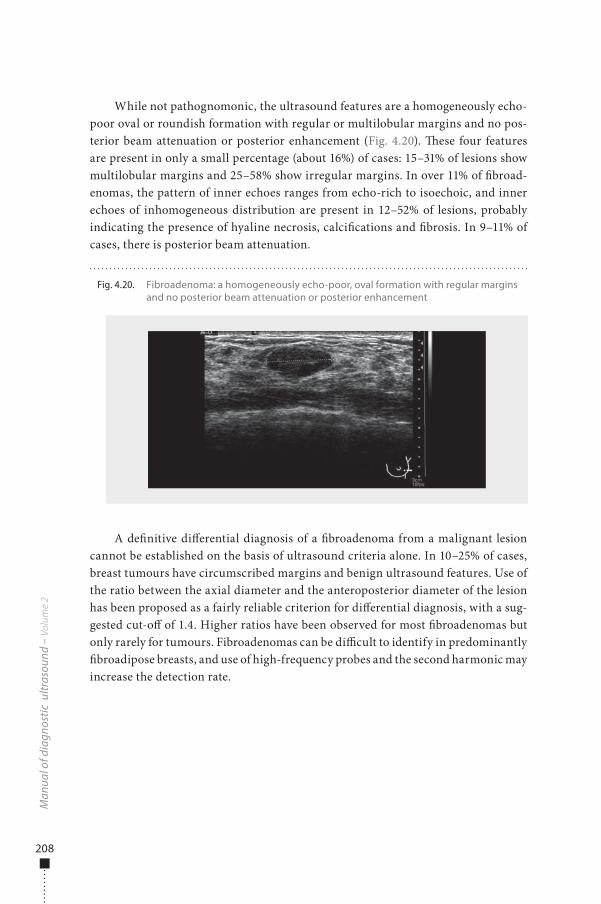
208
While not pathognomonic, the ultrasound features are a homogeneously echo-poor oval or roundish formation with regular or multilobular margins and no pos-terior beam attenuation or posterior enhancement (Fig. 4.20). �ese four features are present in only a small percentage (about 16%) of cases: 15–31% of lesions show multilobular margins and 25–58% show irregular margins. In over 11% of �broad-enomas, the pattern of inner echoes ranges from echo-rich to isoechoic, and inner echoes of inhomogeneous distribution are present in 12–52% of lesions, probably indicating the presence of hyaline necrosis, calci�cations and �brosis. In 9–11% of cases, there is posterior beam attenuation.
A de�nitive di�erential diagnosis of a �broadenoma from a malignant lesion cannot be established on the basis of ultrasound criteria alone. In 10–25% of cases, breast tumours have circumscribed margins and benign ultrasound features. Use of the ratio between the axial diameter and the anteroposterior diameter of the lesion has been proposed as a fairly reliable criterion for di�erential diagnosis, with a sug-gested cut-o� of 1.4. Higher ratios have been observed for most �broadenomas but only rarely for tumours. Fibroadenomas can be di�cult to identify in predominantly �broadipose breasts, and use of high-frequency probes and the second harmonic may increase the detection rate.
Man
ual o
f dia
gnos
tic u
ltras
ound
– V
olum
e 2
Fig. 4.20. Fibroadenoma: a homogeneously echo-poor, oval formation with regular margins and no posterior beam attenuation or posterior enhancement
978-9241548540-C004 PRF ml YVR ln ml ml-1-Final Proof.indd 208 6/10/13 10:32 AM
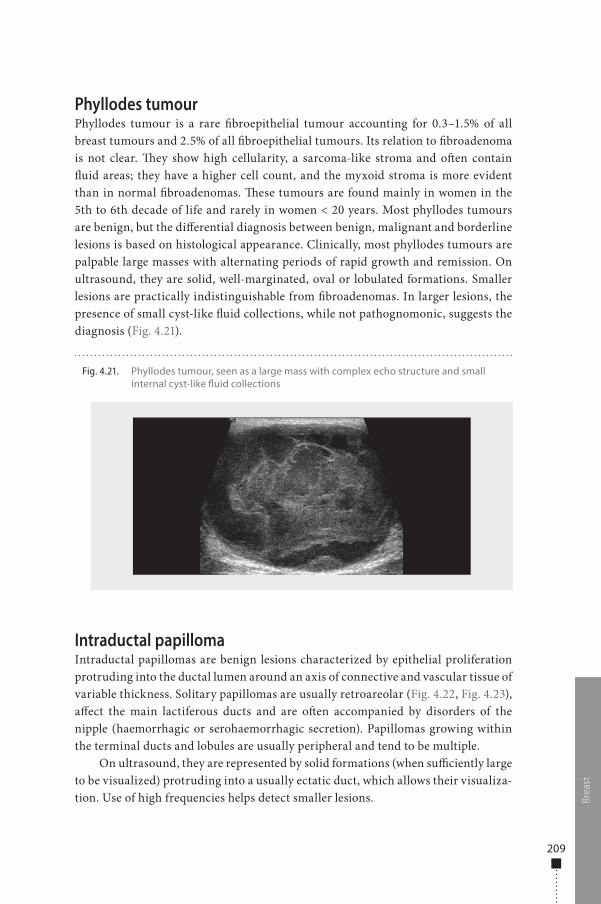
209
Phyllodes tumourPhyllodes tumour is a rare �broepithelial tumour accounting for 0.3–1.5% of all breast tumours and 2.5% of all �broepithelial tumours. Its relation to �broadenoma is not clear. �ey show high cellularity, a sarcoma-like stroma and o�en contain �uid areas; they have a higher cell count, and the myxoid stroma is more evident than in normal �broadenomas. �ese tumours are found mainly in women in the 5th to 6th decade of life and rarely in women < 20 years. Most phyllodes tumours are benign, but the di�erential diagnosis between benign, malignant and borderline lesions is based on histological appearance. Clinically, most phyllodes tumours are palpable large masses with alternating periods of rapid growth and remission. On ultrasound, they are solid, well-marginated, oval or lobulated formations. Smaller lesions are practically indistinguishable from �broadenomas. In larger lesions, the presence of small cyst-like �uid collections, while not pathognomonic, suggests the diagnosis (Fig. 4.21).
Intraductal papillomaIntraductal papillomas are benign lesions characterized by epithelial proliferation protruding into the ductal lumen around an axis of connective and vascular tissue of variable thickness. Solitary papillomas are usually retroareolar (Fig. 4.22, Fig. 4.23), a�ect the main lactiferous ducts and are o�en accompanied by disorders of the nipple (haemorrhagic or serohaemorrhagic secretion). Papillomas growing within the terminal ducts and lobules are usually peripheral and tend to be multiple.
On ultrasound, they are represented by solid formations (when su�ciently large to be visualized) protruding into a usually ectatic duct, which allows their visualiza-tion. Use of high frequencies helps detect smaller lesions. Br
east
Fig. 4.21. Phyllodes tumour, seen as a large mass with complex echo structure and small internal cyst-like �uid collections
978-9241548540-C004 PRF ml YVR ln ml ml-1-Final Proof.indd 209 6/10/13 10:32 AM
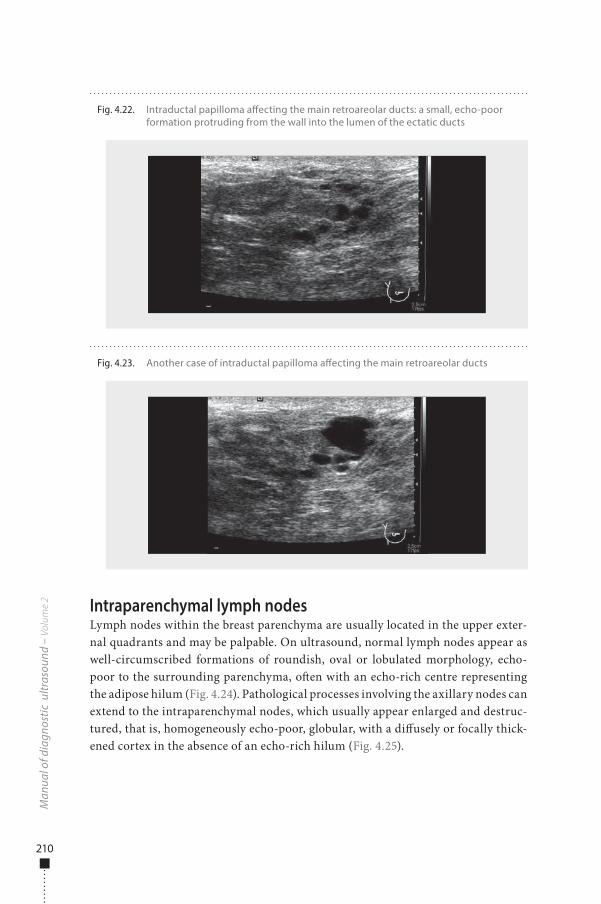
210
Intraparenchymal lymph nodesLymph nodes within the breast parenchyma are usually located in the upper exter-nal quadrants and may be palpable. On ultrasound, normal lymph nodes appear as well-circumscribed formations of roundish, oval or lobulated morphology, echo-poor to the surrounding parenchyma, o�en with an echo-rich centre representing the adipose hilum (Fig. 4.24). Pathological processes involving the axillary nodes can extend to the intraparenchymal nodes, which usually appear enlarged and destruc-tured, that is, homogeneously echo-poor, globular, with a di�usely or focally thick-ened cortex in the absence of an echo-rich hilum (Fig. 4.25).
Man
ual o
f dia
gnos
tic u
ltras
ound
– V
olum
e 2
Fig. 4.23. Another case of intraductal papilloma a�ecting the main retroareolar ducts
Fig. 4.22. Intraductal papilloma a�ecting the main retroareolar ducts: a small, echo-poor formation protruding from the wall into the lumen of the ectatic ducts
978-9241548540-C004 PRF ml YVR ln ml ml-1-Final Proof.indd 210 6/10/13 10:32 AM
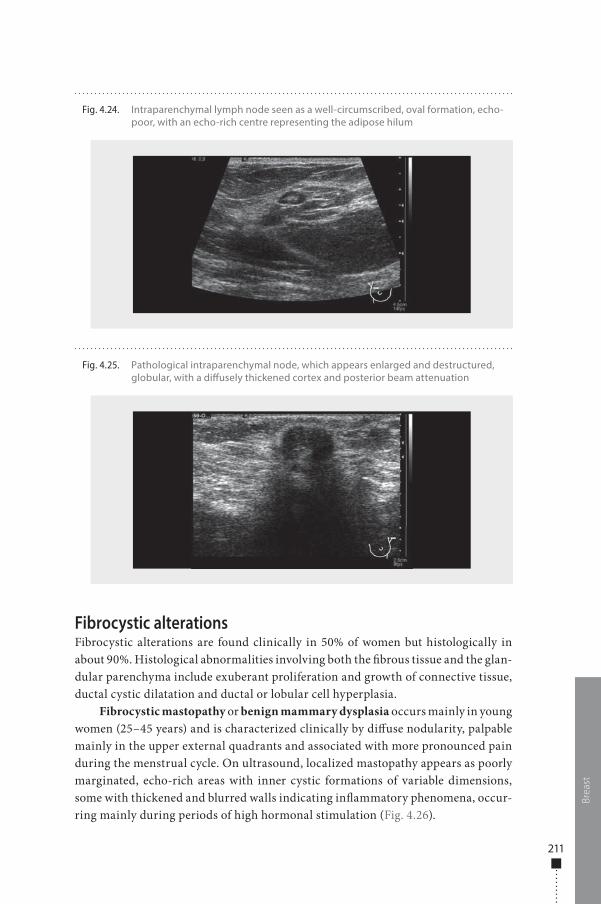
211
Fibrocystic alterationsFibrocystic alterations are found clinically in 50% of women but histologically in about 90%. Histological abnormalities involving both the �brous tissue and the glan-dular parenchyma include exuberant proliferation and growth of connective tissue, ductal cystic dilatation and ductal or lobular cell hyperplasia.
Fibrocystic mastopathy or benign mammary dysplasia occurs mainly in young women (25–45 years) and is characterized clinically by di�use nodularity, palpable mainly in the upper external quadrants and associated with more pronounced pain during the menstrual cycle. On ultrasound, localized mastopathy appears as poorly marginated, echo-rich areas with inner cystic formations of variable dimensions, some with thickened and blurred walls indicating in�ammatory phenomena, occur-ring mainly during periods of high hormonal stimulation (Fig. 4.26).
Brea
st
Fig. 4.24. Intraparenchymal lymph node seen as a well-circumscribed, oval formation, echo-poor, with an echo-rich centre representing the adipose hilum
Fig. 4.25. Pathological intraparenchymal node, which appears enlarged and destructured, globular, with a di�usely thickened cortex and posterior beam attenuation
978-9241548540-C004 PRF ml YVR ln ml ml-1-Final Proof.indd 211 6/10/13 10:32 AM
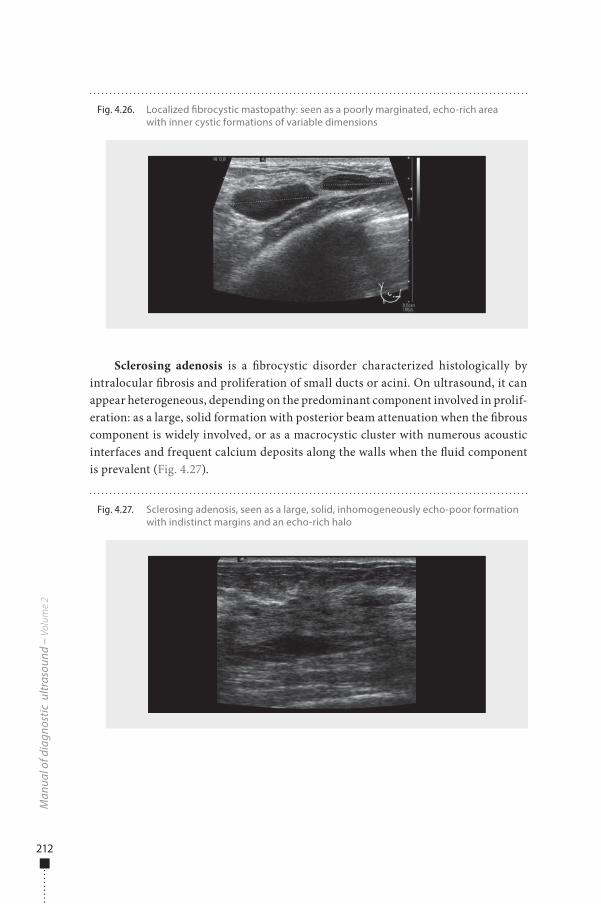
212
Sclerosing adenosis is a �brocystic disorder characterized histologically by intralocular �brosis and proliferation of small ducts or acini. On ultrasound, it can appear heterogeneous, depending on the predominant component involved in prolif-eration: as a large, solid formation with posterior beam attenuation when the �brous component is widely involved, or as a macrocystic cluster with numerous acoustic interfaces and frequent calcium deposits along the walls when the �uid component is prevalent (Fig. 4.27).
Man
ual o
f dia
gnos
tic u
ltras
ound
– V
olum
e 2
Fig. 4.27. Sclerosing adenosis, seen as a large, solid, inhomogeneously echo-poor formation with indistinct margins and an echo-rich halo
Fig. 4.26. Localized �brocystic mastopathy: seen as a poorly marginated, echo-rich area with inner cystic formations of variable dimensions
978-9241548540-C004 PRF ml YVR ln ml ml-1-Final Proof.indd 212 6/10/13 10:32 AM
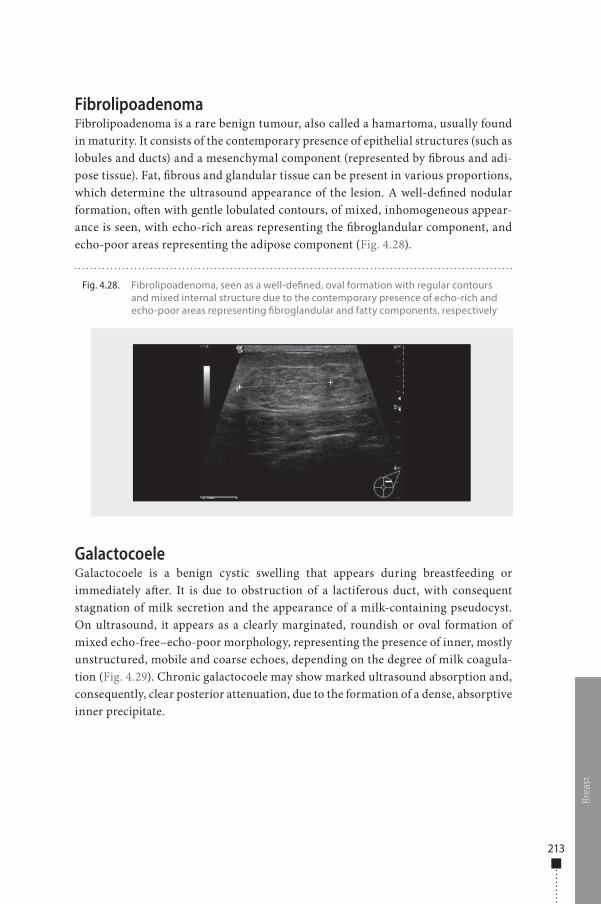
213
FibrolipoadenomaFibrolipoadenoma is a rare benign tumour, also called a hamartoma, usually found in maturity. It consists of the contemporary presence of epithelial structures (such as lobules and ducts) and a mesenchymal component (represented by �brous and adi-pose tissue). Fat, �brous and glandular tissue can be present in various proportions, which determine the ultrasound appearance of the lesion. A well-de�ned nodular formation, o�en with gentle lobulated contours, of mixed, inhomogeneous appear-ance is seen, with echo-rich areas representing the �broglandular component, and echo-poor areas representing the adipose component (Fig. 4.28).
GalactocoeleGalactocoele is a benign cystic swelling that appears during breastfeeding or immediately a�er. It is due to obstruction of a lactiferous duct, with consequent stagnation of milk secretion and the appearance of a milk-containing pseudocyst. On ultrasound, it appears as a clearly marginated, roundish or oval formation of mixed echo-free–echo-poor morphology, representing the presence of inner, mostly unstructured, mobile and coarse echoes, depending on the degree of milk coagula-tion (Fig. 4.29). Chronic galactocoele may show marked ultrasound absorption and, consequently, clear posterior attenuation, due to the formation of a dense, absorptive inner precipitate.
Brea
st
Fig. 4.28. Fibrolipoadenoma, seen as a well-de�ned, oval formation with regular contours and mixed internal structure due to the contemporary presence of echo-rich and echo-poor areas representing �broglandular and fatty components, respectively
978-9241548540-C004 PRF ml YVR ln ml ml-1-Final Proof.indd 213 6/10/13 10:32 AM
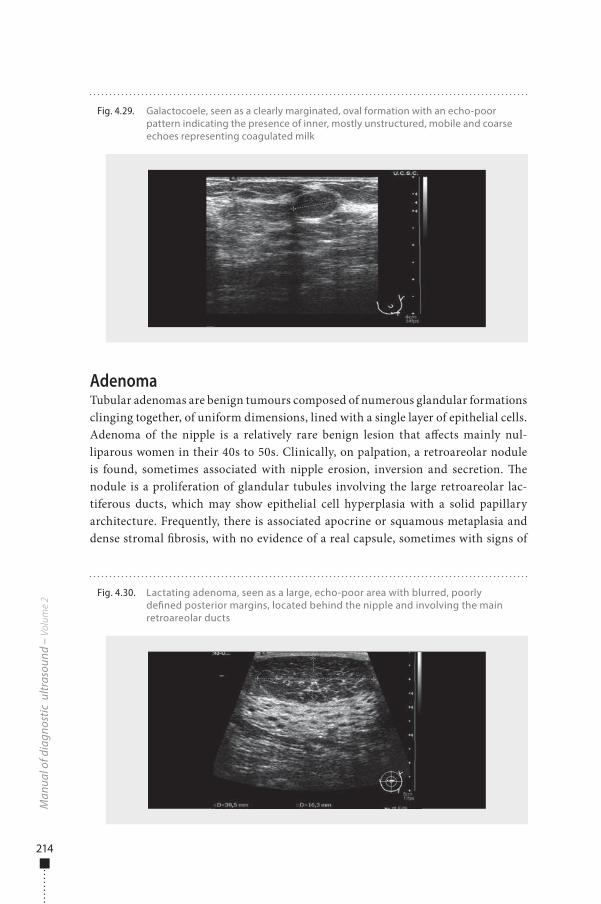
214
AdenomaTubular adenomas are benign tumours composed of numerous glandular formations clinging together, of uniform dimensions, lined with a single layer of epithelial cells. Adenoma of the nipple is a relatively rare benign lesion that a�ects mainly nul-liparous women in their 40s to 50s. Clinically, on palpation, a retroareolar nodule is found, sometimes associated with nipple erosion, inversion and secretion. �e nodule is a proliferation of glandular tubules involving the large retroareolar lac-tiferous ducts, which may show epithelial cell hyperplasia with a solid papillary architecture. Frequently, there is associated apocrine or squamous metaplasia and dense stromal �brosis, with no evidence of a real capsule, sometimes with signs of
Man
ual o
f dia
gnos
tic u
ltras
ound
– V
olum
e 2
Fig. 4.30. Lactating adenoma, seen as a large, echo-poor area with blurred, poorly de�ned posterior margins, located behind the nipple and involving the main retroareolar ducts
Fig. 4.29. Galactocoele, seen as a clearly marginated, oval formation with an echo-poor pattern indicating the presence of inner, mostly unstructured, mobile and coarse echoes representing coagulated milk
978-9241548540-C004 PRF ml YVR ln ml ml-1-Final Proof.indd 214 6/10/13 10:32 AM
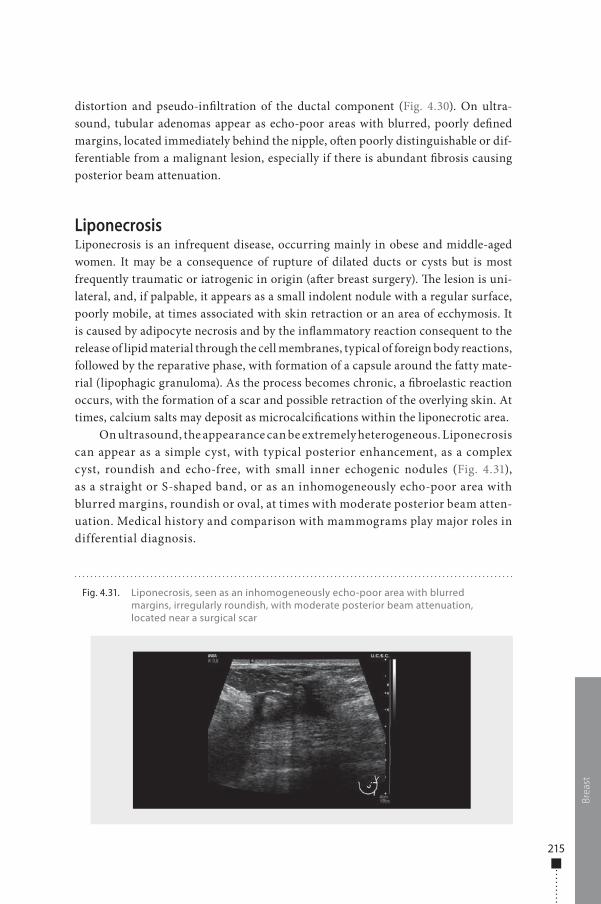
215
distortion and pseudo-in�ltration of the ductal component (Fig. 4.30). On ultra-sound, tubular adenomas appear as echo-poor areas with blurred, poorly de�ned margins, located immediately behind the nipple, o�en poorly distinguishable or dif-ferentiable from a malignant lesion, especially if there is abundant �brosis causing posterior beam attenuation.
LiponecrosisLiponecrosis is an infrequent disease, occurring mainly in obese and middle-aged women. It may be a consequence of rupture of dilated ducts or cysts but is most frequently traumatic or iatrogenic in origin (a�er breast surgery). �e lesion is uni-lateral, and, if palpable, it appears as a small indolent nodule with a regular surface, poorly mobile, at times associated with skin retraction or an area of ecchymosis. It is caused by adipocyte necrosis and by the in�ammatory reaction consequent to the release of lipid material through the cell membranes, typical of foreign body reactions, followed by the reparative phase, with formation of a capsule around the fatty mate-rial (lipophagic granuloma). As the process becomes chronic, a �broelastic reaction occurs, with the formation of a scar and possible retraction of the overlying skin. At times, calcium salts may deposit as microcalci�cations within the liponecrotic area.
On ultrasound, the appearance can be extremely heterogeneous. Liponecrosis can appear as a simple cyst, with typical posterior enhancement, as a complex cyst, roundish and echo-free, with small inner echogenic nodules (Fig. 4.31), as a straight or S-shaped band, or as an inhomogeneously echo-poor area with blurred margins, roundish or oval, at times with moderate posterior beam atten-uation. Medical history and comparison with mammograms play major roles in differential diagnosis.
Brea
stFig. 4.31. Liponecrosis, seen as an inhomogeneously echo-poor area with blurred
margins, irregularly roundish, with moderate posterior beam attenuation, located near a surgical scar
978-9241548540-C004 PRF ml YVR ln ml ml-1-Final Proof.indd 215 6/10/13 10:32 AM
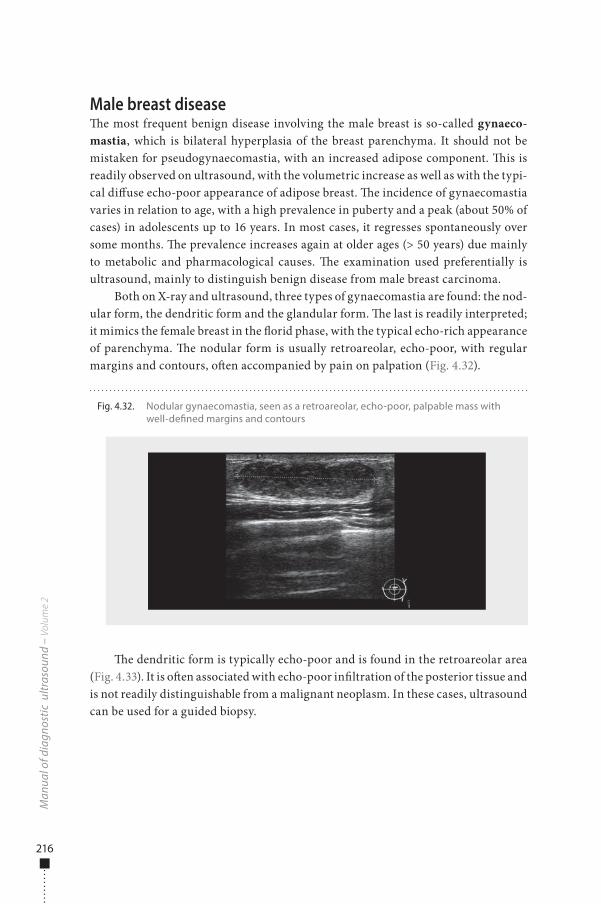
216
Male breast disease�e most frequent benign disease involving the male breast is so-called gynaeco-mastia, which is bilateral hyperplasia of the breast parenchyma. It should not be mistaken for pseudogynaecomastia, with an increased adipose component. �is is readily observed on ultrasound, with the volumetric increase as well as with the typi-cal di�use echo-poor appearance of adipose breast. �e incidence of gynaecomastia varies in relation to age, with a high prevalence in puberty and a peak (about 50% of cases) in adolescents up to 16 years. In most cases, it regresses spontaneously over some months. �e prevalence increases again at older ages (> 50 years) due mainly to metabolic and pharmacological causes. �e examination used preferentially is ultrasound, mainly to distinguish benign disease from male breast carcinoma.
Both on X-ray and ultrasound, three types of gynaecomastia are found: the nod-ular form, the dendritic form and the glandular form. �e last is readily interpreted; it mimics the female breast in the �orid phase, with the typical echo-rich appearance of parenchyma. �e nodular form is usually retroareolar, echo-poor, with regular margins and contours, o�en accompanied by pain on palpation (Fig. 4.32).
�e dendritic form is typically echo-poor and is found in the retroareolar area (Fig. 4.33). It is o�en associated with echo-poor in�ltration of the posterior tissue and is not readily distinguishable from a malignant neoplasm. In these cases, ultrasound can be used for a guided biopsy.
Man
ual o
f dia
gnos
tic u
ltras
ound
– V
olum
e 2
Fig. 4.32. Nodular gynaecomastia, seen as a retroareolar, echo-poor, palpable mass with well-de�ned margins and contours
978-9241548540-C004 PRF ml YVR ln ml ml-1-Final Proof.indd 216 6/10/13 10:32 AM
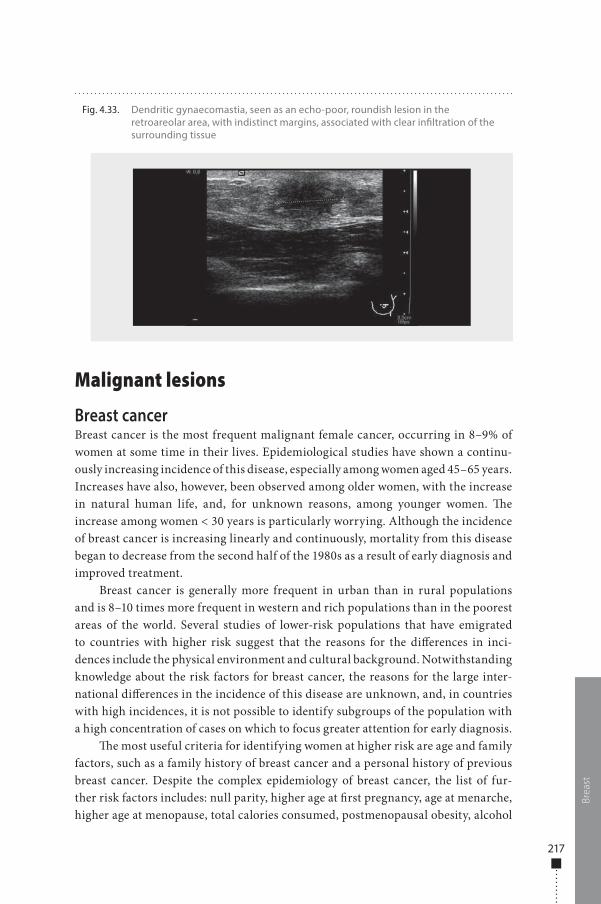
217
Malignant lesions
Breast cancerBreast cancer is the most frequent malignant female cancer, occurring in 8–9% of women at some time in their lives. Epidemiological studies have shown a continu-ously increasing incidence of this disease, especially among women aged 45–65 years. Increases have also, however, been observed among older women, with the increase in natural human life, and, for unknown reasons, among younger women. �e increase among women < 30 years is particularly worrying. Although the incidence of breast cancer is increasing linearly and continuously, mortality from this disease began to decrease from the second half of the 1980s as a result of early diagnosis and improved treatment.
Breast cancer is generally more frequent in urban than in rural populations and is 8–10 times more frequent in western and rich populations than in the poorest areas of the world. Several studies of lower-risk populations that have emigrated to countries with higher risk suggest that the reasons for the di�erences in inci-dences include the physical environment and cultural background. Notwithstanding knowledge about the risk factors for breast cancer, the reasons for the large inter-national di�erences in the incidence of this disease are unknown, and, in countries with high incidences, it is not possible to identify subgroups of the population with a high concentration of cases on which to focus greater attention for early diagnosis.
�e most useful criteria for identifying women at higher risk are age and family factors, such as a family history of breast cancer and a personal history of previous breast cancer. Despite the complex epidemiology of breast cancer, the list of fur-ther risk factors includes: null parity, higher age at �rst pregnancy, age at menarche, higher age at menopause, total calories consumed, postmenopausal obesity, alcohol
Brea
st
Fig. 4.33. Dendritic gynaecomastia, seen as an echo-poor, roundish lesion in the retroareolar area, with indistinct margins, associated with clear in�ltration of the surrounding tissue
978-9241548540-C004 PRF ml YVR ln ml ml-1-Final Proof.indd 217 6/10/13 10:32 AM
218
use, thorax irradiation, benign proliferative mastopathy, higher grade of education, use of hormonal replacement therapy, a higher level of low-density lipoprotein and a lower level of high-density lipoprotein and oxidative stress.
Role of ultrasoundUltrasound examination of the breast is not an alternative to mammography but rather complementary, providing di�erent information. It is particularly useful for examining young, dense breasts, for which mammography is less sensitive, and in pregnancy. Sometimes, ultrasound is the only means for understanding the nature of a mammographic abnormality or a palpable lesion, with adjunctive criteria, and can also be used as a guide during biopsy.
Ultrasound examination of the breast is conducted according to the criteria of the American College of Radiology. Accordingly, all signs of a suspected malignant lesion must be recorded: shape (irregular), orientation (not parallel to the skin), mar-gins (not circumscribed), boundaries (echogenic halo), echo pattern (echo-poor), posterior acoustic features (shadowing), microcalci�cations if present and vascu-larity (intra- and peri-lesional vascular spots on colour Doppler examination). �e presence of these features, and particularly their association, supports a suspicion of a malignant lesion and thus the need for biopsy.
Breast lesions o�en represent benign conditions, such as cysts or �broadenomas. If their diagnosis is veri�ed, they are not a clinical problem for women.
Sonographic featuresPremalignant lesions and in situ carcinomasEpithelial malignant cancers account for 98% of all malignant breast neoplasms, including ductal carcinoma in situ, invasive ductal carcinoma and invasive lobular car-cinoma. Di�erentiation of these forms is useful for de�ning the prognosis and therapy.
Ductal carcinoma in situ is constituted of a group of neoplastic cells inside the basal membrane, whereas the neoplasm becomes invasive if some neoplastic cells disrupt the membrane. �e most frequent mammographic sign (60–80% of cases) of ductal carcinoma in situ is the presence of an isolated cluster of microcalci�cations; in multifocal and multicentric forms, more than one cluster is located in the same or in di�erent quadrants. Some microcalci�cations, however, are associated with a nodular or spiculated mass (15–30%) or a nodular or spiculated opacity without microcalci�cation (10–15%). Generally, mammographic examination o�en underes-timates the real extent of a ductal carcinoma in situ, particularly low-grade lesions. In these cases, ultrasound examination shows only the microcalci�cations and does not identify their morphology clearly (as mammography does). Sometimes, a small, echo-poor lesion can be seen, with or without internal calci�cation. �e distribution of the actual microcalci�cations within a duct can sometimes be seen, especially when high-frequency ultrasound transducers are used.
Man
ual o
f dia
gnos
tic u
ltras
ound
– V
olum
e 2
978-9241548540-C004 PRF ml YVR ln ml ml-1-Final Proof.indd 218 6/10/13 10:32 AM
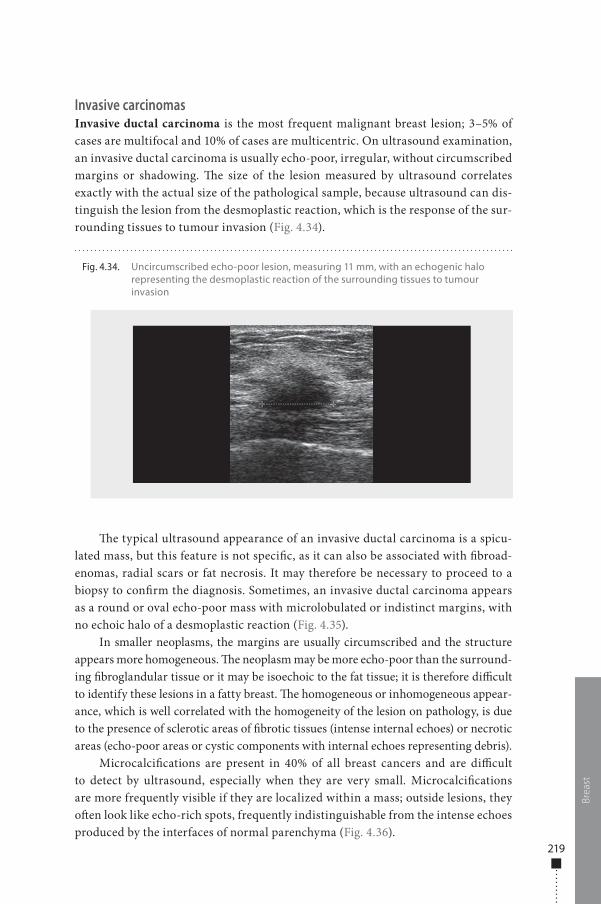
219
Invasive carcinomasInvasive ductal carcinoma is the most frequent malignant breast lesion; 3–5% of cases are multifocal and 10% of cases are multicentric. On ultrasound examination, an invasive ductal carcinoma is usually echo-poor, irregular, without circumscribed margins or shadowing. �e size of the lesion measured by ultrasound correlates exactly with the actual size of the pathological sample, because ultrasound can dis-tinguish the lesion from the desmoplastic reaction, which is the response of the sur-rounding tissues to tumour invasion (Fig. 4.34).
�e typical ultrasound appearance of an invasive ductal carcinoma is a spicu-lated mass, but this feature is not speci�c, as it can also be associated with �broad-enomas, radial scars or fat necrosis. It may therefore be necessary to proceed to a biopsy to con�rm the diagnosis. Sometimes, an invasive ductal carcinoma appears as a round or oval echo-poor mass with microlobulated or indistinct margins, with no echoic halo of a desmoplastic reaction (Fig. 4.35).
In smaller neoplasms, the margins are usually circumscribed and the structure appears more homogeneous. �e neoplasm may be more echo-poor than the surround-ing �broglandular tissue or it may be isoechoic to the fat tissue; it is therefore di�cult to identify these lesions in a fatty breast. �e homogeneous or inhomogeneous appear-ance, which is well correlated with the homogeneity of the lesion on pathology, is due to the presence of sclerotic areas of �brotic tissues (intense internal echoes) or necrotic areas (echo-poor areas or cystic components with internal echoes representing debris).
Microcalci�cations are present in 40% of all breast cancers and are di�cult to detect by ultrasound, especially when they are very small. Microcalci�cations are more frequently visible if they are localized within a mass; outside lesions, they o�en look like echo-rich spots, frequently indistinguishable from the intense echoes produced by the interfaces of normal parenchyma (Fig. 4.36).
Brea
st
Fig. 4.34. Uncircumscribed echo-poor lesion, measuring 11 mm, with an echogenic halo representing the desmoplastic reaction of the surrounding tissues to tumour invasion
978-9241548540-C004 PRF ml YVR ln ml ml-1-Final Proof.indd 219 6/10/13 10:32 AM
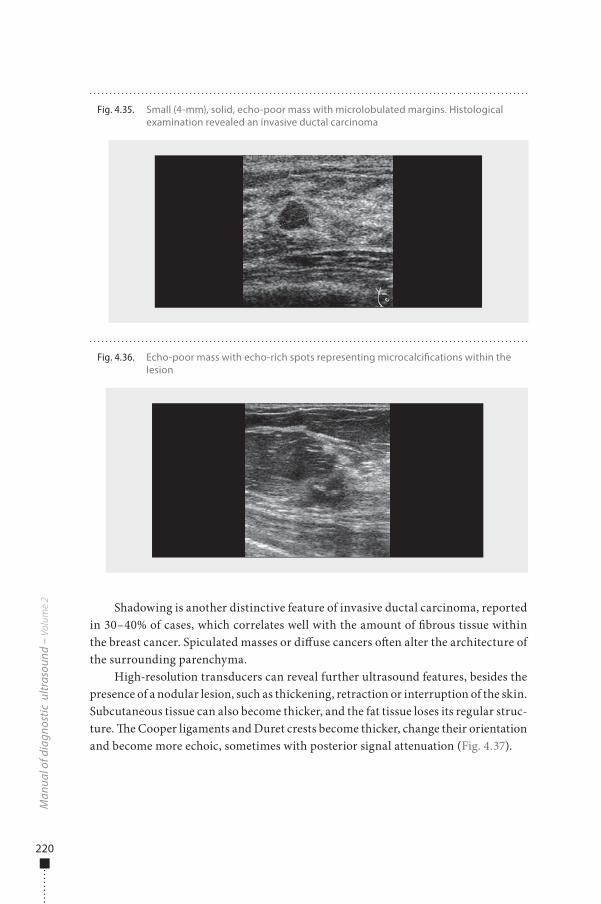
220
Shadowing is another distinctive feature of invasive ductal carcinoma, reported in 30–40% of cases, which correlates well with the amount of �brous tissue within the breast cancer. Spiculated masses or di�use cancers o�en alter the architecture of the surrounding parenchyma.
High-resolution transducers can reveal further ultrasound features, besides the presence of a nodular lesion, such as thickening, retraction or interruption of the skin. Subcutaneous tissue can also become thicker, and the fat tissue loses its regular struc-ture. �e Cooper ligaments and Duret crests become thicker, change their orientation and become more echoic, sometimes with posterior signal attenuation (Fig. 4.37).
Man
ual o
f dia
gnos
tic u
ltras
ound
– V
olum
e 2
Fig. 4.35. Small (4-mm), solid, echo-poor mass with microlobulated margins. Histological examination revealed an invasive ductal carcinoma
Fig. 4.36. Echo-poor mass with echo-rich spots representing microcalci�cations within the lesion
978-9241548540-C004 PRF ml YVR ln ml ml-1-Final Proof.indd 220 6/10/13 10:32 AM
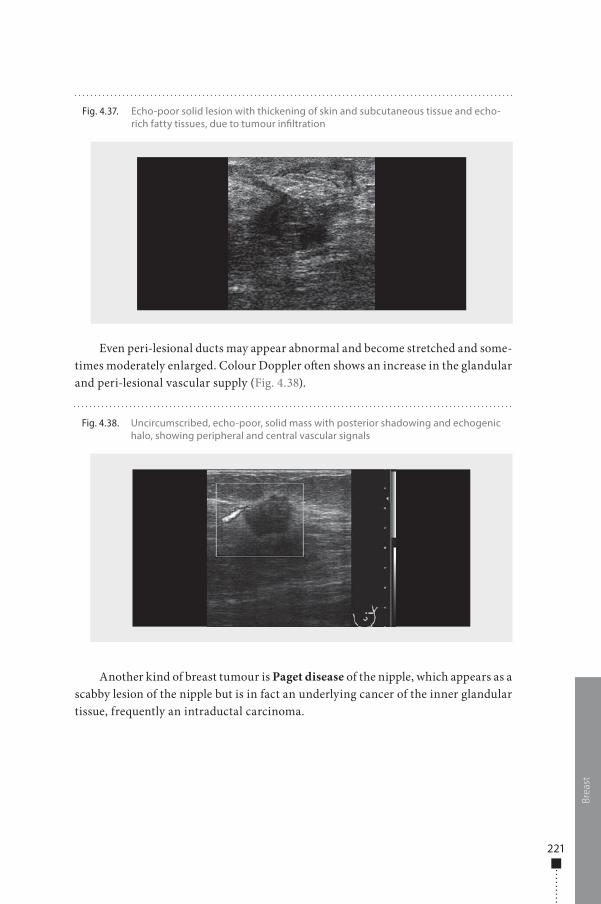
221
Even peri-lesional ducts may appear abnormal and become stretched and some-times moderately enlarged. Colour Doppler o�en shows an increase in the glandular and peri-lesional vascular supply (Fig. 4.38).
Another kind of breast tumour is Paget disease of the nipple, which appears as a scabby lesion of the nipple but is in fact an underlying cancer of the inner glandular tissue, frequently an intraductal carcinoma.
Brea
st
Fig. 4.37. Echo-poor solid lesion with thickening of skin and subcutaneous tissue and echo-rich fatty tissues, due to tumour in�ltration
Fig. 4.38. Uncircumscribed, echo-poor, solid mass with posterior shadowing and echogenic halo, showing peripheral and central vascular signals
978-9241548540-C004 PRF ml YVR ln ml ml-1-Final Proof.indd 221 6/10/13 10:32 AM
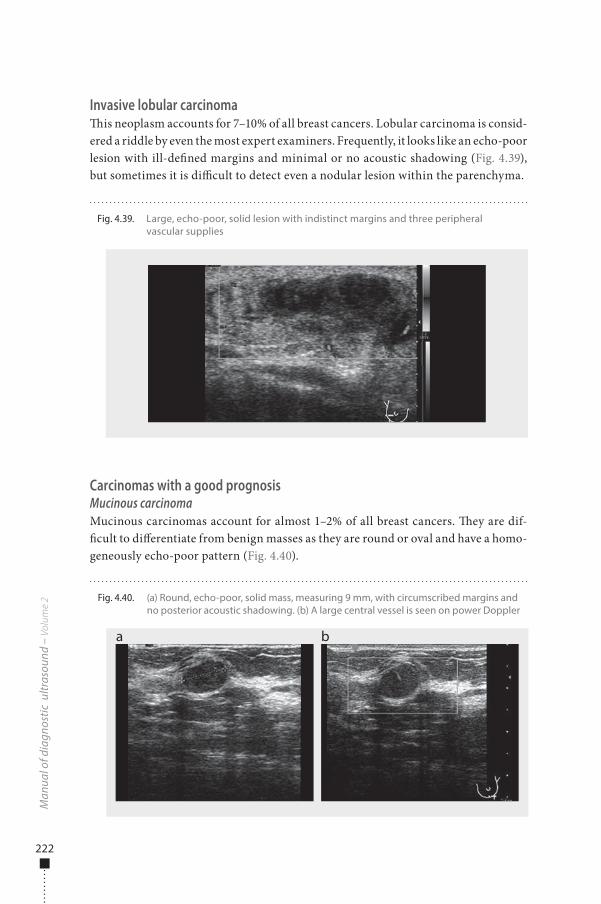
222
Invasive lobular carcinoma�is neoplasm accounts for 7–10% of all breast cancers. Lobular carcinoma is consid-ered a riddle by even the most expert examiners. Frequently, it looks like an echo-poor lesion with ill-de�ned margins and minimal or no acoustic shadowing (Fig. 4.39), but sometimes it is di�cult to detect even a nodular lesion within the parenchyma.
Carcinomas with a good prognosisMucinous carcinomaMucinous carcinomas account for almost 1–2% of all breast cancers. �ey are dif-�cult to di�erentiate from benign masses as they are round or oval and have a homo-geneously echo-poor pattern (Fig. 4.40).
Man
ual o
f dia
gnos
tic u
ltras
ound
– V
olum
e 2
Fig. 4.39. Large, echo-poor, solid lesion with indistinct margins and three peripheral vascular supplies
Fig. 4.40. (a) Round, echo-poor, solid mass, measuring 9 mm, with circumscribed margins and no posterior acoustic shadowing. (b) A large central vessel is seen on power Doppler
a b
978-9241548540-C004 PRF ml YVR ln ml ml-1-Final Proof.indd 222 6/10/13 10:32 AM
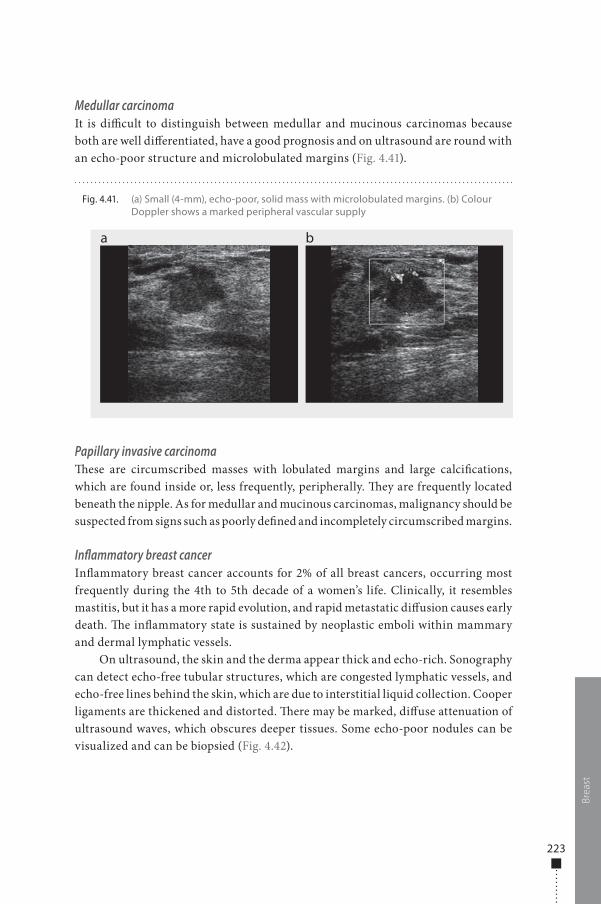
223
Medullar carcinomaIt is di�cult to distinguish between medullar and mucinous carcinomas because both are well di�erentiated, have a good prognosis and on ultrasound are round with an echo-poor structure and microlobulated margins (Fig. 4.41).
Papillary invasive carcinoma�ese are circumscribed masses with lobulated margins and large calci�cations, which are found inside or, less frequently, peripherally. �ey are frequently located beneath the nipple. As for medullar and mucinous carcinomas, malignancy should be suspected from signs such as poorly de�ned and incompletely circumscribed margins.
Inflammatory breast cancerIn�ammatory breast cancer accounts for 2% of all breast cancers, occurring most frequently during the 4th to 5th decade of a women’s life. Clinically, it resembles mastitis, but it has a more rapid evolution, and rapid metastatic di�usion causes early death. �e in�ammatory state is sustained by neoplastic emboli within mammary and dermal lymphatic vessels.
On ultrasound, the skin and the derma appear thick and echo-rich. Sonography can detect echo-free tubular structures, which are congested lymphatic vessels, and echo-free lines behind the skin, which are due to interstitial liquid collection. Cooper ligaments are thickened and distorted. �ere may be marked, di�use attenuation of ultrasound waves, which obscures deeper tissues. Some echo-poor nodules can be visualized and can be biopsied (Fig. 4.42).
Brea
st
Fig. 4.41. (a) Small (4-mm), echo-poor, solid mass with microlobulated margins. (b) Colour Doppler shows a marked peripheral vascular supply
a b
978-9241548540-C004 PRF ml YVR ln ml ml-1-Final Proof.indd 223 6/10/13 10:32 AM
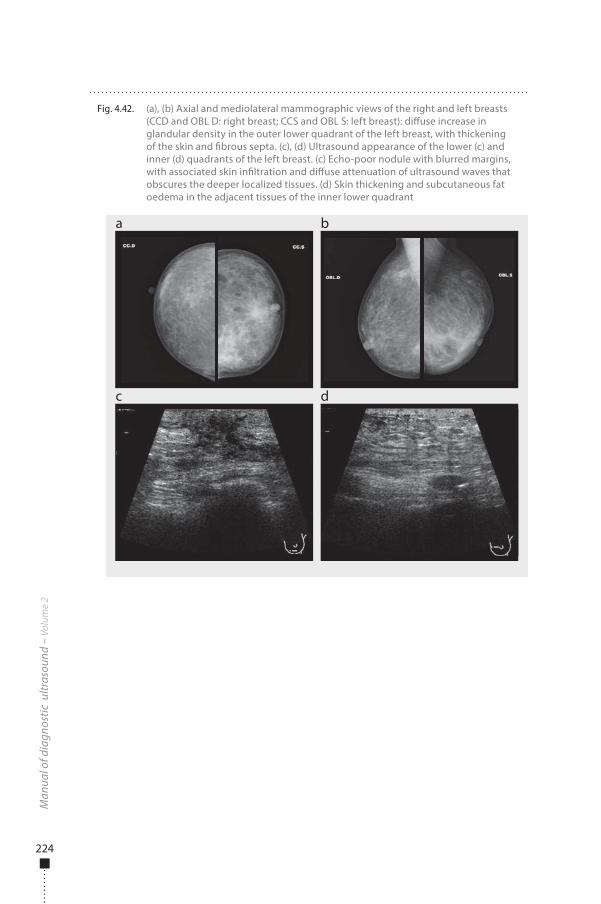
224
Man
ual o
f dia
gnos
tic u
ltras
ound
– V
olum
e 2
Fig. 4.42. (a), (b) Axial and mediolateral mammographic views of the right and left breasts (CCD and OBL D: right breast; CCS and OBL S: left breast): di�use increase in glandular density in the outer lower quadrant of the left breast, with thickening of the skin and �brous septa. (c), (d) Ultrasound appearance of the lower (c) and inner (d) quadrants of the left breast. (c) Echo-poor nodule with blurred margins, with associated skin in�ltration and di�use attenuation of ultrasound waves that obscures the deeper localized tissues. (d) Skin thickening and subcutaneous fat oedema in the adjacent tissues of the inner lower quadrant
a
c
b
d
978-9241548540-C004 PRF ml YVR ln ml ml-1-Final Proof.indd 224 6/10/13 10:32 AM
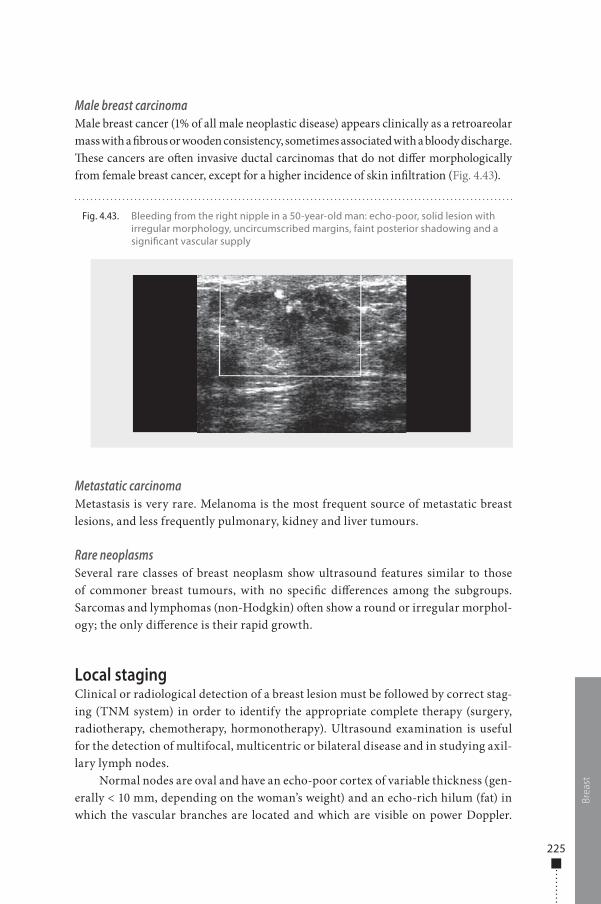
225
Brea
st
Male breast carcinomaMale breast cancer (1% of all male neoplastic disease) appears clinically as a retroareolar mass with a �brous or wooden consistency, sometimes associated with a bloody discharge. �ese cancers are o�en invasive ductal carcinomas that do not di�er morphologically from female breast cancer, except for a higher incidence of skin in�ltration (Fig. 4.43).
Metastatic carcinomaMetastasis is very rare. Melanoma is the most frequent source of metastatic breast lesions, and less frequently pulmonary, kidney and liver tumours.
Rare neoplasmsSeveral rare classes of breast neoplasm show ultrasound features similar to those of commoner breast tumours, with no speci�c di�erences among the subgroups. Sarcomas and lymphomas (non-Hodgkin) o�en show a round or irregular morphol-ogy; the only di�erence is their rapid growth.
Local stagingClinical or radiological detection of a breast lesion must be followed by correct stag-ing (TNM system) in order to identify the appropriate complete therapy (surgery, radiotherapy, chemotherapy, hormonotherapy). Ultrasound examination is useful for the detection of multifocal, multicentric or bilateral disease and in studying axil-lary lymph nodes.
Normal nodes are oval and have an echo-poor cortex of variable thickness (gen-erally < 10 mm, depending on the woman’s weight) and an echo-rich hilum (fat) in which the vascular branches are located and which are visible on power Doppler.
Fig. 4.43. Bleeding from the right nipple in a 50-year-old man: echo-poor, solid lesion with irregular morphology, uncircumscribed margins, faint posterior shadowing and a signi�cant vascular supply
978-9241548540-C004 PRF ml YVR ln ml ml-1-Final Proof.indd 225 6/10/13 10:32 AM
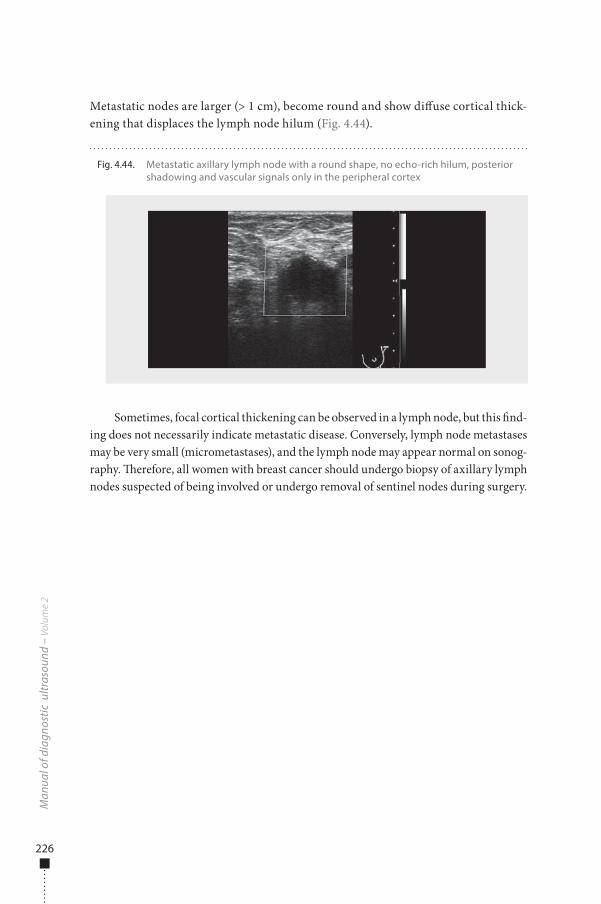
226
Man
ual o
f dia
gnos
tic u
ltras
ound
– V
olum
e 2
Metastatic nodes are larger (> 1 cm), become round and show di�use cortical thick-ening that displaces the lymph node hilum (Fig. 4.44).
Sometimes, focal cortical thickening can be observed in a lymph node, but this �nd-ing does not necessarily indicate metastatic disease. Conversely, lymph node metastases may be very small (micrometastases), and the lymph node may appear normal on sonog-raphy. �erefore, all women with breast cancer should undergo biopsy of axillary lymph nodes suspected of being involved or undergo removal of sentinel nodes during surgery.
Fig. 4.44. Metastatic axillary lymph node with a round shape, no echo-rich hilum, posterior shadowing and vascular signals only in the peripheral cortex
978-9241548540-C004 PRF ml YVR ln ml ml-1-Final Proof.indd 226 6/10/13 10:32 AM
Introduction 229Liver and
biliary tract229
229 Indications230 Preparation230 Examination technique230 Normal �ndings233 Pathological �ndings
Spleen 254254 Indications254 Preparation254 Examination technique255 Normal �ndings256 Pathological �ndings
Pancreas 264264 Indications264 Preparation265 Examination technique265 Normal �ndings266 Pathological �ndings267 Acute pancreatitis269 Chronic pancreatitis270 Trauma271 Pancreatic tumours
Digestive tract 272272 Indications272 Preparation273 Examination technique273 Normal �ndings275 Pathological �ndings
Chapter 5 Paediatric ultrasound
978-9241548540-C005 PRF ml YVR ln ml ml-1-Final Proof.indd 227 6/10/13 10:31 AM
Urinary tract and retroperitoneum
289
289 Indications289 Preparation289 Examination technique289 Normal �ndings293 Pathological �ndings
Pelvis 314314 Indications315 Preparation315 Examination technique315 Normal �ndings319 Pathological �ndings
Scrotum 333333 Indications333 Preparation333 Examination technique333 Normal �ndings336 Pathological �ndings
Neck 343343 Indications343 Preparation343 Examination technique343 Normal �ndings346 Pathological �ndings
Chest 354354 Indications354 Preparation354 Examination technique354 Normal �ndings356 Pathological �ndings
Neonatal cranial ultrasound
360
360 Indications360 Preparation360 Examination technique361 Normal �ndings364 Pathological �ndings
Spine 377377 Indications377 Preparation377 Examination technique377 Normal �ndings380 Pathological �ndings
Musculoskeletal system
383
383 Indications383 Preparation383 Examination technique384 Normal �ndings385 Pathological �ndings
Special clinical situations
394
394 Abdominal pain395 Neonatal intestinal
obstruction
978-9241548540-C005 PRF ml YVR ln ml ml-1-Final Proof.indd 228 6/10/13 10:31 AM
Introduction
Ultrasound incorporating new technological improvements is widely used in pae-diatrics, and high-resolution images are produced because children’s bodies have low levels of fat. Nevertheless, it should be remembered that children are not small adults but have their own speci�cities and speci�c pathological conditions, especially malformations. If necessary, the examination room should be heated, and infants must be covered. �e parents should be present in the room to help keep the infant quiet and calm. �e examination should be as short as possible, and the operators should be specially trained. �e ultrasound system used must have appropriate high-frequency probes, and accessories such as pillows should be available. A child’s his-tory should be well known before the examination is begun. �e more the physician (or operator) knows about the child’s symptoms, the easier he or she can solve the medical problem and begin treatment.
Ultrasound is the imaging modality of choice for children with abdominal pain, abdominal masses and intra-abdominal anomalies. Several diseases that occur fre-quently should be excluded by ultrasound examination. Although ultrasound imag-ing is a powerful technique, it is sometimes insu�cient, and other modalities, such as plain X-rays, CT scan, MRI and nuclear medicine, if available, are required to con�rm a diagnosis. For example, cystography is needed to evaluate vesico-ureteral re�ux, and evaluation of tumour extension requires CT or MRI. Use of ultrasound imaging, however, will save time and reduce costs and can avoid exposure to radia-tion with no reduction in diagnostic accuracy. Misuse of ultrasound must be avoided, as it discredits the technique and the operator and wastes time and money.
Liver and biliary tract
IndicationsUltrasound is the preferred initial imaging modality for evaluating the liver and biliary tract in children. Typical indications are hepatomegaly, jaundice, anomalous hepatic assessment, ascites, suspected liver abscess or liver mass, abdominal trauma, right upper abdominal pain and screening for endemic echinococcosis. Ultrasound gives information on the size and structure of the liver and demonstrates both
5Paediatric ultrasound
229
978-9241548540-C005 PRF ml YVR ln ml ml-1-Final Proof.indd 229 6/10/13 10:31 AM
230
localized lesions (tumour, cyst and abscess) and di�use diseases. It can also be useful for histological and therapeutic purposes, as it can be used to guide �ne-needle biop-sies, punctures and drainage of abscesses.
PreparationFasting is not necessary before an examination of the hepatic parenchyma; however, 2–6 h of fasting, depending on the age of the child, is necessary for a study of the gall bladder, the intrahepatic and extrahepatic bile ducts and the hilus of the liver.
Examination technique�e child should lie in the supine position initially and later on the le� or right side. No premedication is needed (an important advantage of ultrasound). Coupling agent is applied liberally, �rst over the right upper abdomen, then over the rest of the abdo-men as the examination proceeds.
Scanning should be carried out in the longitudinal, transverse and oblique planes, systematically, including scans through the intercostal and subcostal routes. Convex probes should be used, ranging from 3.5 to 7 MHz, and linear probes of at least 7–15 MHz for neonates. �e frequency should always be as high as possible.
Doppler ultrasound is useful for locating vessels and for ensuring the perme-ability of the vascular structures. It is helpful for assessing the presence and direction of blood �ow in the hepatic artery, hepatic veins and portal veins. Normal vascular �ow patterns can be readily seen in children of all ages.
Normal �ndings�e normal hepatic parenchymal echogenicity is uniform, with clear, delineated ves-sels. Its sonographic appearance is similar to that of the renal medulla during the �rst 6 months of life, but the echogenicity becomes similar to that of the cortex later (Fig. 5.1). Its surface is smooth, and the inferior edge is wedge-shaped. �e vertical diameter in the right middle clavicular line is 5 cm at birth, then increases gradually to reach 10 cm at 5 years and 14 cm at puberty (Fig. 5.2). �e tip of the liver should not extend below the inferior pole of the right kidney.
Man
ual o
f dia
gnos
tic u
ltras
ound
– V
olum
e 2
978-9241548540-C005 PRF ml YVR ln ml ml-1-Final Proof.indd 230 6/10/13 10:31 AM
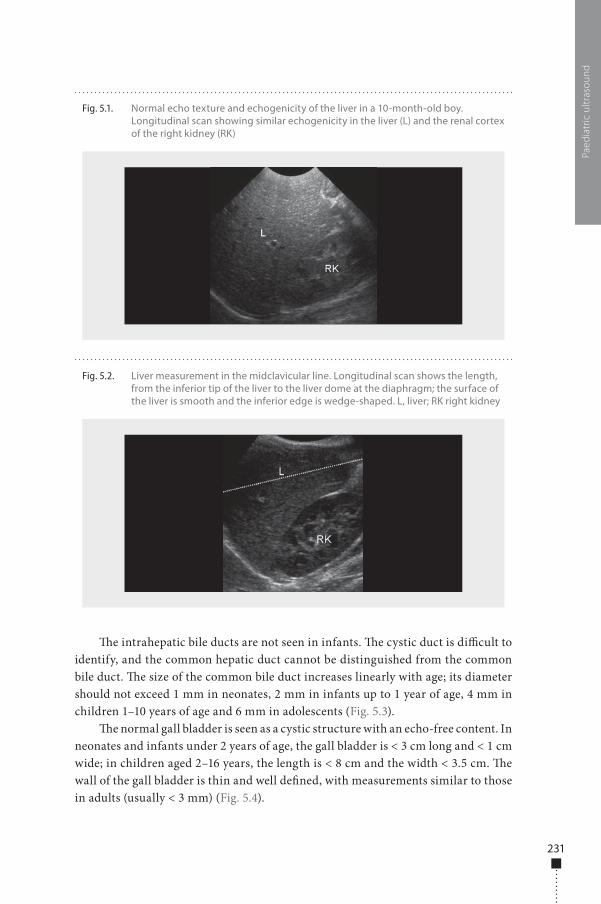
231
�e intrahepatic bile ducts are not seen in infants. �e cystic duct is di�cult to identify, and the common hepatic duct cannot be distinguished from the common bile duct. �e size of the common bile duct increases linearly with age; its diameter should not exceed 1 mm in neonates, 2 mm in infants up to 1 year of age, 4 mm in children 1–10 years of age and 6 mm in adolescents (Fig. 5.3).
�e normal gall bladder is seen as a cystic structure with an echo-free content. In neonates and infants under 2 years of age, the gall bladder is < 3 cm long and < 1 cm wide; in children aged 2–16 years, the length is < 8 cm and the width < 3.5 cm. �e wall of the gall bladder is thin and well de�ned, with measurements similar to those in adults (usually < 3 mm) (Fig. 5.4).
Paed
iatr
ic u
ltras
ound
Fig. 5.1. Normal echo texture and echogenicity of the liver in a 10-month-old boy. Longitudinal scan showing similar echogenicity in the liver (L) and the renal cortex of the right kidney (RK)
Fig. 5.2. Liver measurement in the midclavicular line. Longitudinal scan shows the length, from the inferior tip of the liver to the liver dome at the diaphragm; the surface of the liver is smooth and the inferior edge is wedge-shaped. L, liver; RK right kidney
978-9241548540-C005 PRF ml YVR ln ml ml-1-Final Proof.indd 231 6/10/13 10:31 AM
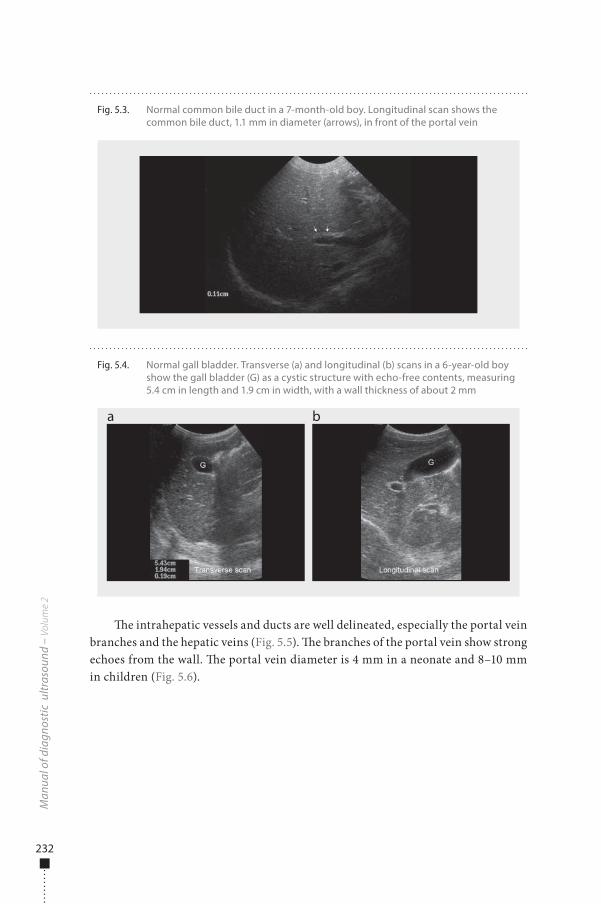
232
�e intrahepatic vessels and ducts are well delineated, especially the portal vein branches and the hepatic veins (Fig. 5.5). �e branches of the portal vein show strong echoes from the wall. �e portal vein diameter is 4 mm in a neonate and 8–10 mm in children (Fig. 5.6).
Man
ual o
f dia
gnos
tic u
ltras
ound
– V
olum
e 2
Fig. 5.4. Normal gall bladder. Transverse (a) and longitudinal (b) scans in a 6-year-old boy show the gall bladder (G) as a cystic structure with echo-free contents, measuring 5.4 cm in length and 1.9 cm in width, with a wall thickness of about 2 mm
a b
Fig. 5.3. Normal common bile duct in a 7-month-old boy. Longitudinal scan shows the common bile duct, 1.1 mm in diameter (arrows), in front of the portal vein
978-9241548540-C005 PRF ml YVR ln ml ml-1-Final Proof.indd 232 6/10/13 10:31 AM
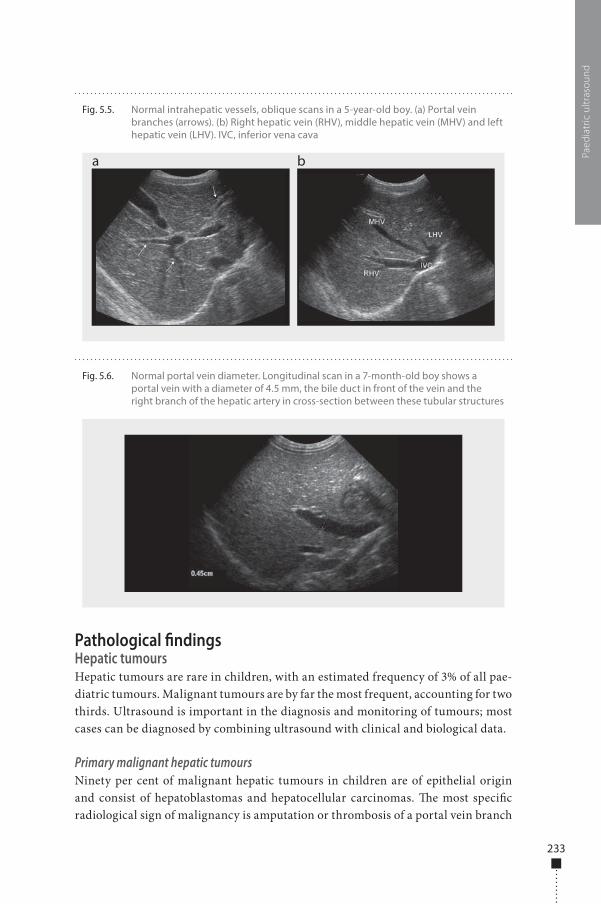
233
Pathological �ndingsHepatic tumoursHepatic tumours are rare in children, with an estimated frequency of 3% of all pae-diatric tumours. Malignant tumours are by far the most frequent, accounting for two thirds. Ultrasound is important in the diagnosis and monitoring of tumours; most cases can be diagnosed by combining ultrasound with clinical and biological data.
Primary malignant hepatic tumoursNinety per cent of malignant hepatic tumours in children are of epithelial origin and consist of hepatoblastomas and hepatocellular carcinomas. �e most speci�c radiological sign of malignancy is amputation or thrombosis of a portal vein branch
Paed
iatr
ic u
ltras
ound
Fig. 5.5. Normal intrahepatic vessels, oblique scans in a 5-year-old boy. (a) Portal vein branches (arrows). (b) Right hepatic vein (RHV), middle hepatic vein (MHV) and left hepatic vein (LHV). IVC, inferior vena cava
a b
Fig. 5.6. Normal portal vein diameter. Longitudinal scan in a 7-month-old boy shows a portal vein with a diameter of 4.5 mm, the bile duct in front of the vein and the right branch of the hepatic artery in cross-section between these tubular structures
978-9241548540-C005 PRF ml YVR ln ml ml-1-Final Proof.indd 233 6/10/13 10:31 AM
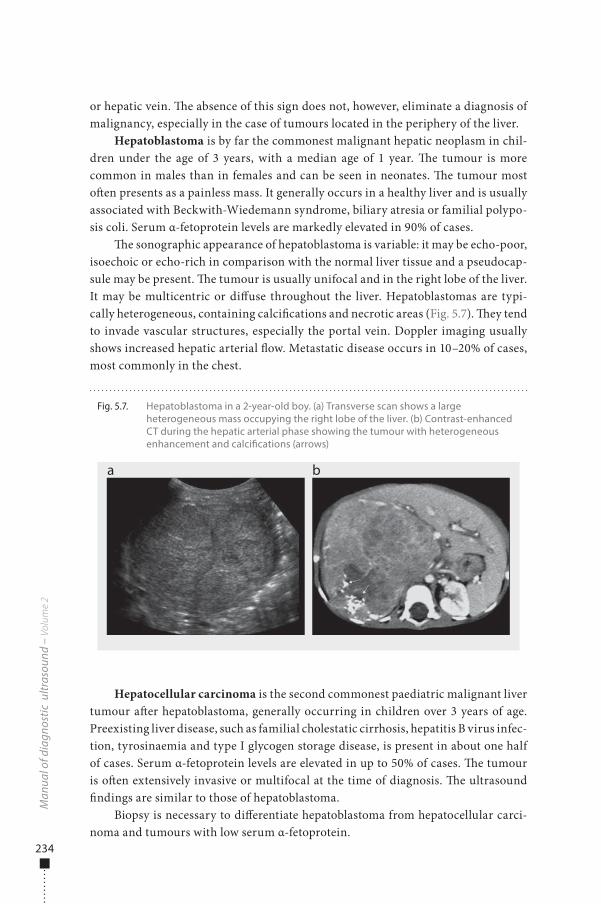
234
or hepatic vein. �e absence of this sign does not, however, eliminate a diagnosis of malignancy, especially in the case of tumours located in the periphery of the liver.
Hepatoblastoma is by far the commonest malignant hepatic neoplasm in chil-dren under the age of 3 years, with a median age of 1 year. �e tumour is more common in males than in females and can be seen in neonates. �e tumour most o�en presents as a painless mass. It generally occurs in a healthy liver and is usually associated with Beckwith-Wiedemann syndrome, biliary atresia or familial polypo-sis coli. Serum α-fetoprotein levels are markedly elevated in 90% of cases.
�e sonographic appearance of hepatoblastoma is variable: it may be echo-poor, isoechoic or echo-rich in comparison with the normal liver tissue and a pseudocap-sule may be present. �e tumour is usually unifocal and in the right lobe of the liver. It may be multicentric or di�use throughout the liver. Hepatoblastomas are typi-cally heterogeneous, containing calci�cations and necrotic areas (Fig. 5.7). �ey tend to invade vascular structures, especially the portal vein. Doppler imaging usually shows increased hepatic arterial �ow. Metastatic disease occurs in 10–20% of cases, most commonly in the chest.
Hepatocellular carcinoma is the second commonest paediatric malignant liver tumour a�er hepatoblastoma, generally occurring in children over 3 years of age. Preexisting liver disease, such as familial cholestatic cirrhosis, hepatitis B virus infec-tion, tyrosinaemia and type I glycogen storage disease, is present in about one half of cases. Serum α-fetoprotein levels are elevated in up to 50% of cases. �e tumour is o�en extensively invasive or multifocal at the time of diagnosis. �e ultrasound �ndings are similar to those of hepatoblastoma.
Biopsy is necessary to di�erentiate hepatoblastoma from hepatocellular carci-noma and tumours with low serum α-fetoprotein.
Man
ual o
f dia
gnos
tic u
ltras
ound
– V
olum
e 2
Fig. 5.7. Hepatoblastoma in a 2-year-old boy. (a) Transverse scan shows a large heterogeneous mass occupying the right lobe of the liver. (b) Contrast-enhanced CT during the hepatic arterial phase showing the tumour with heterogeneous enhancement and calci�cations (arrows)
a b
978-9241548540-C005 PRF ml YVR ln ml ml-1-Final Proof.indd 234 6/10/13 10:31 AM
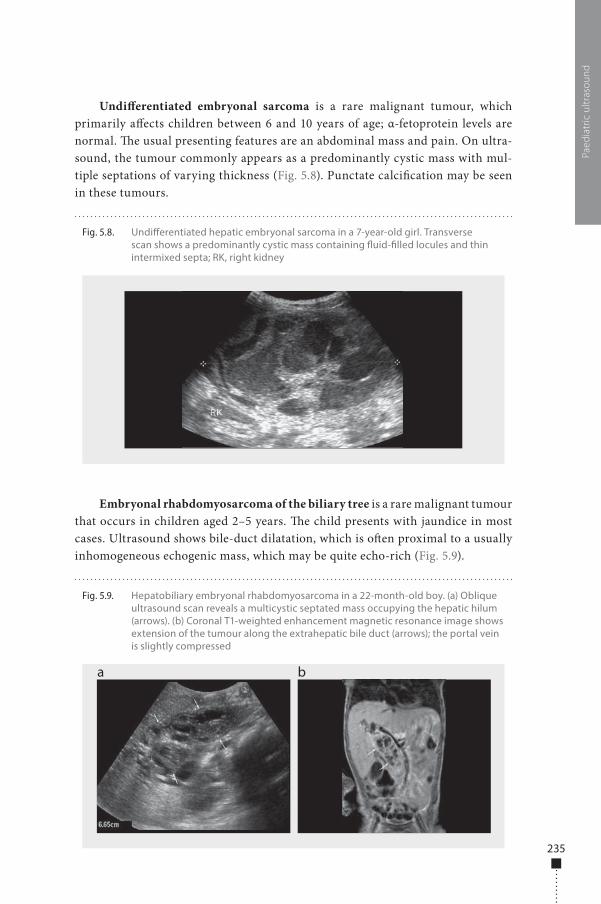
235
Undi�erentiated embryonal sarcoma is a rare malignant tumour, which primarily a�ects children between 6 and 10 years of age; α-fetoprotein levels are normal. �e usual presenting features are an abdominal mass and pain. On ultra-sound, the tumour commonly appears as a predominantly cystic mass with mul-tiple septations of varying thickness (Fig. 5.8). Punctate calci�cation may be seen in these tumours.
Embryonal rhabdomyosarcoma of the biliary tree is a rare malignant tumour that occurs in children aged 2–5 years. �e child presents with jaundice in most cases. Ultrasound shows bile-duct dilatation, which is o�en proximal to a usually inhomogeneous echogenic mass, which may be quite echo-rich (Fig. 5.9).
Paed
iatr
ic u
ltras
ound
Fig. 5.8. Undi�erentiated hepatic embryonal sarcoma in a 7-year-old girl. Transverse scan shows a predominantly cystic mass containing �uid-�lled locules and thin intermixed septa; RK, right kidney
Fig. 5.9. Hepatobiliary embryonal rhabdomyosarcoma in a 22-month-old boy. (a) Oblique ultrasound scan reveals a multicystic septated mass occupying the hepatic hilum (arrows). (b) Coronal T1-weighted enhancement magnetic resonance image shows extension of the tumour along the extrahepatic bile duct (arrows); the portal vein is slightly compressed
a b
978-9241548540-C005 PRF ml YVR ln ml ml-1-Final Proof.indd 235 6/10/13 10:31 AM
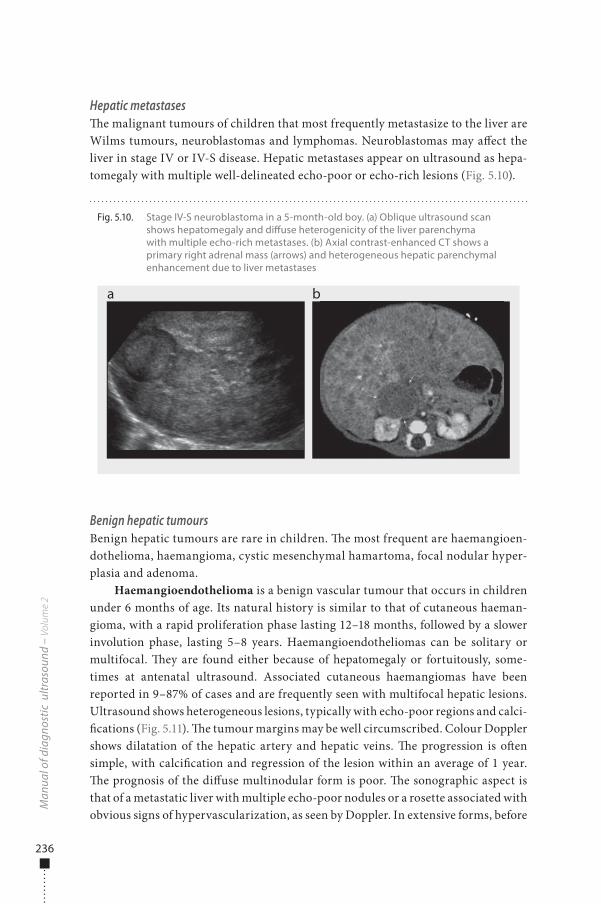
236
Hepatic metastases�e malignant tumours of children that most frequently metastasize to the liver are Wilms tumours, neuroblastomas and lymphomas. Neuroblastomas may a�ect the liver in stage IV or IV-S disease. Hepatic metastases appear on ultrasound as hepa-tomegaly with multiple well-delineated echo-poor or echo-rich lesions (Fig. 5.10).
Benign hepatic tumoursBenign hepatic tumours are rare in children. �e most frequent are haemangioen-dothelioma, haemangioma, cystic mesenchymal hamartoma, focal nodular hyper-plasia and adenoma.
Haemangioendothelioma is a benign vascular tumour that occurs in children under 6 months of age. Its natural history is similar to that of cutaneous haeman-gioma, with a rapid proliferation phase lasting 12–18 months, followed by a slower involution phase, lasting 5–8 years. Haemangioendotheliomas can be solitary or multifocal. �ey are found either because of hepatomegaly or fortuitously, some-times at antenatal ultrasound. Associated cutaneous haemangiomas have been reported in 9–87% of cases and are frequently seen with multifocal hepatic lesions. Ultrasound shows heterogeneous lesions, typically with echo-poor regions and calci-�cations (Fig. 5.11). �e tumour margins may be well circumscribed. Colour Doppler shows dilatation of the hepatic artery and hepatic veins. �e progression is o�en simple, with calci�cation and regression of the lesion within an average of 1 year. �e prognosis of the di�use multinodular form is poor. �e sonographic aspect is that of a metastatic liver with multiple echo-poor nodules or a rosette associated with obvious signs of hypervascularization, as seen by Doppler. In extensive forms, before
Man
ual o
f dia
gnos
tic u
ltras
ound
– V
olum
e 2
Fig. 5.10. Stage IV-S neuroblastoma in a 5-month-old boy. (a) Oblique ultrasound scan shows hepatomegaly and di�use heterogenicity of the liver parenchyma with multiple echo-rich metastases. (b) Axial contrast-enhanced CT shows a primary right adrenal mass (arrows) and heterogeneous hepatic parenchymal enhancement due to liver metastases
a b
978-9241548540-C005 PRF ml YVR ln ml ml-1-Final Proof.indd 236 6/10/13 10:31 AM
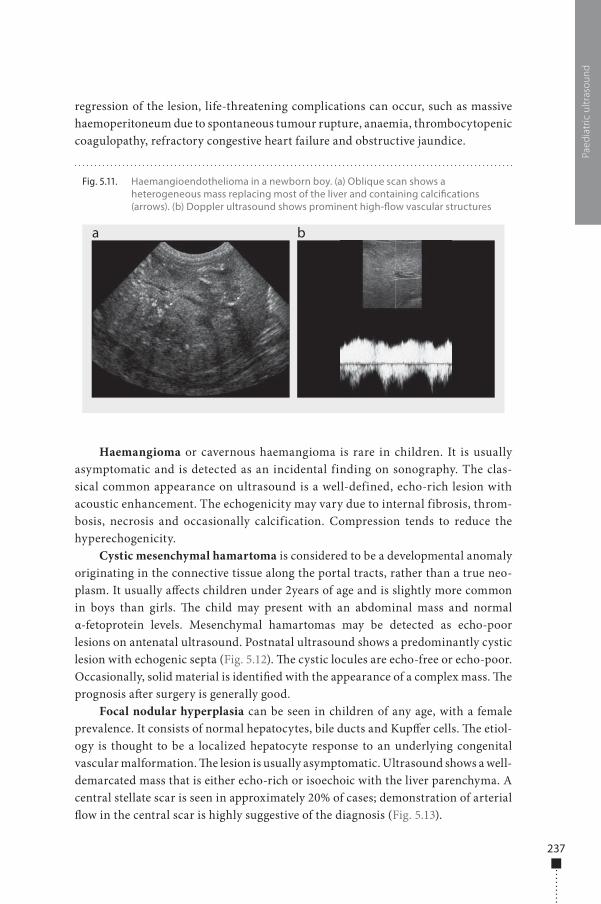
237
regression of the lesion, life-threatening complications can occur, such as massive haemoperitoneum due to spontaneous tumour rupture, anaemia, thrombocytopenic coagulopathy, refractory congestive heart failure and obstructive jaundice.
Haemangioma or cavernous haemangioma is rare in children. It is usually asymptomatic and is detected as an incidental finding on sonography. The clas-sical common appearance on ultrasound is a well-defined, echo-rich lesion with acoustic enhancement. The echogenicity may vary due to internal fibrosis, throm-bosis, necrosis and occasionally calcification. Compression tends to reduce the hyperechogenicity.
Cystic mesenchymal hamartoma is considered to be a developmental anomaly originating in the connective tissue along the portal tracts, rather than a true neo-plasm. It usually a�ects children under 2years of age and is slightly more common in boys than girls. �e child may present with an abdominal mass and normal α-fetoprotein levels. Mesenchymal hamartomas may be detected as echo-poor lesions on antenatal ultrasound. Postnatal ultrasound shows a predominantly cystic lesion with echogenic septa (Fig. 5.12). �e cystic locules are echo-free or echo-poor. Occasionally, solid material is identi�ed with the appearance of a complex mass. �e prognosis a�er surgery is generally good.
Focal nodular hyperplasia can be seen in children of any age, with a female prevalence. It consists of normal hepatocytes, bile ducts and Kup�er cells. �e etiol-ogy is thought to be a localized hepatocyte response to an underlying congenital vascular malformation. �e lesion is usually asymptomatic. Ultrasound shows a well-demarcated mass that is either echo-rich or isoechoic with the liver parenchyma. A central stellate scar is seen in approximately 20% of cases; demonstration of arterial �ow in the central scar is highly suggestive of the diagnosis (Fig. 5.13).
Paed
iatr
ic u
ltras
ound
Fig. 5.11. Haemangioendothelioma in a newborn boy. (a) Oblique scan shows a heterogeneous mass replacing most of the liver and containing calci�cations (arrows). (b) Doppler ultrasound shows prominent high-�ow vascular structures
a b
978-9241548540-C005 PRF ml YVR ln ml ml-1-Final Proof.indd 237 6/10/13 10:31 AM
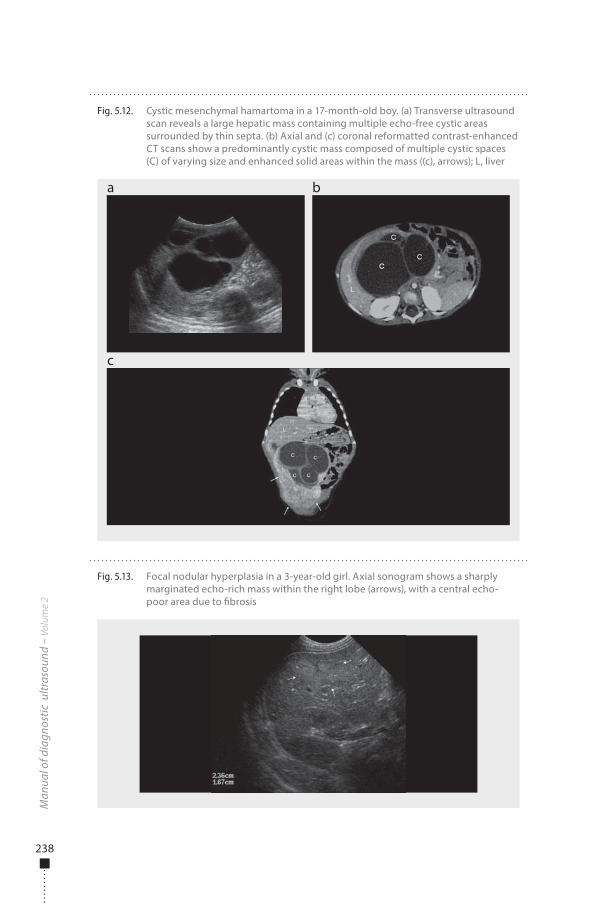
238
Man
ual o
f dia
gnos
tic u
ltras
ound
– V
olum
e 2
Fig. 5.13. Focal nodular hyperplasia in a 3-year-old girl. Axial sonogram shows a sharply marginated echo-rich mass within the right lobe (arrows), with a central echo-poor area due to �brosis
Fig. 5.12. Cystic mesenchymal hamartoma in a 17-month-old boy. (a) Transverse ultrasound scan reveals a large hepatic mass containing multiple echo-free cystic areas surrounded by thin septa. (b) Axial and (c) coronal reformatted contrast-enhanced CT scans show a predominantly cystic mass composed of multiple cystic spaces (C) of varying size and enhanced solid areas within the mass ((c), arrows); L, liver
a
c
b
978-9241548540-C005 PRF ml YVR ln ml ml-1-Final Proof.indd 238 6/10/13 10:31 AM
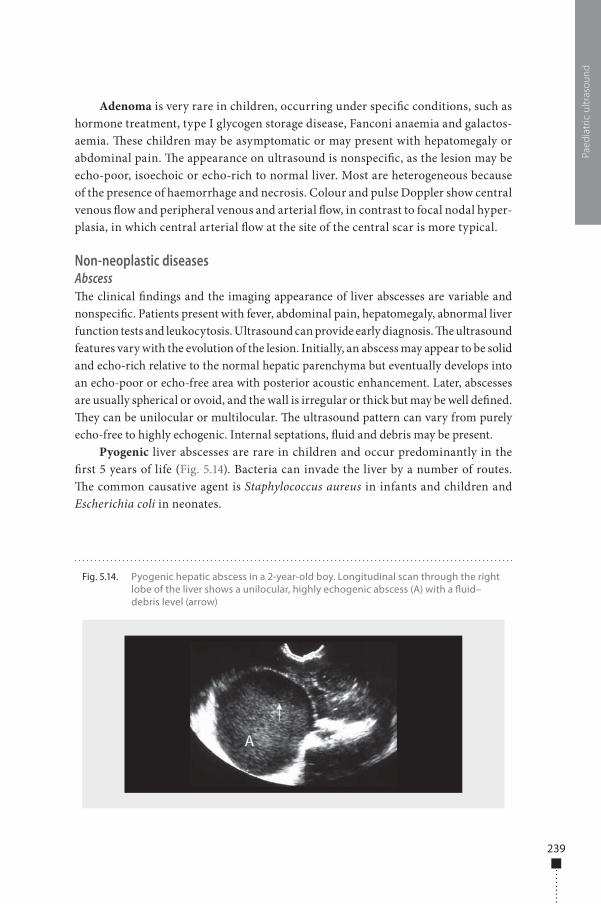
239
Adenoma is very rare in children, occurring under speci�c conditions, such as hormone treatment, type I glycogen storage disease, Fanconi anaemia and galactos-aemia. �ese children may be asymptomatic or may present with hepatomegaly or abdominal pain. �e appearance on ultrasound is nonspeci�c, as the lesion may be echo-poor, isoechoic or echo-rich to normal liver. Most are heterogeneous because of the presence of haemorrhage and necrosis. Colour and pulse Doppler show central venous �ow and peripheral venous and arterial �ow, in contrast to focal nodal hyper-plasia, in which central arterial �ow at the site of the central scar is more typical.
Non-neoplastic diseasesAbscess�e clinical �ndings and the imaging appearance of liver abscesses are variable and nonspeci�c. Patients present with fever, abdominal pain, hepatomegaly, abnormal liver function tests and leukocytosis. Ultrasound can provide early diagnosis. �e ultrasound features vary with the evolution of the lesion. Initially, an abscess may appear to be solid and echo-rich relative to the normal hepatic parenchyma but eventually develops into an echo-poor or echo-free area with posterior acoustic enhancement. Later, abscesses are usually spherical or ovoid, and the wall is irregular or thick but may be well de�ned. �ey can be unilocular or multilocular. �e ultrasound pattern can vary from purely echo-free to highly echogenic. Internal septations, �uid and debris may be present.
Pyogenic liver abscesses are rare in children and occur predominantly in the �rst 5 years of life (Fig. 5.14). Bacteria can invade the liver by a number of routes. �e common causative agent is Staphylococcus aureus in infants and children and Escherichia coli in neonates.
Paed
iatr
ic u
ltras
ound
Fig. 5.14. Pyogenic hepatic abscess in a 2-year-old boy. Longitudinal scan through the right lobe of the liver shows a unilocular, highly echogenic abscess (A) with a �uid–debris level (arrow)
978-9241548540-C005 PRF ml YVR ln ml ml-1-Final Proof.indd 239 6/10/13 10:31 AM
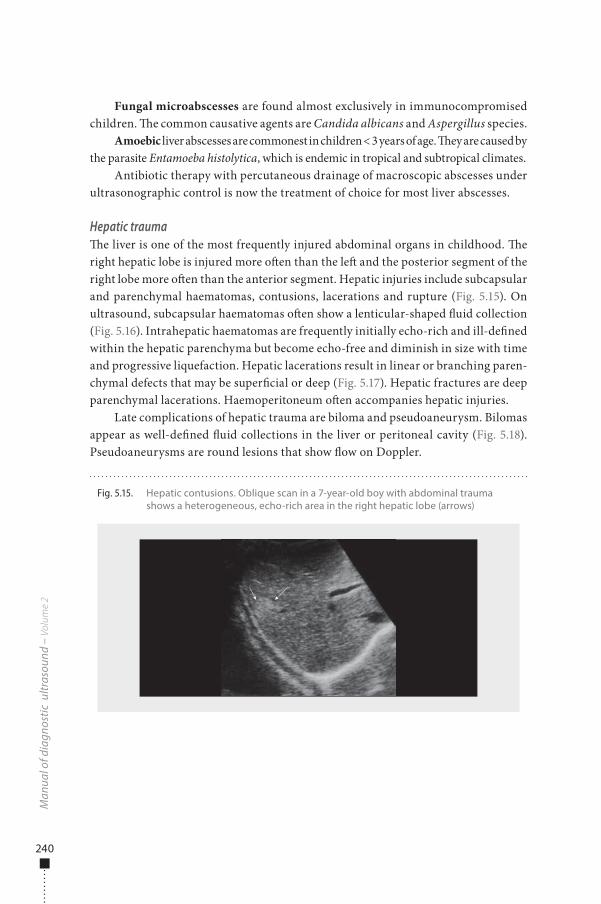
240
Fungal microabscesses are found almost exclusively in immunocompromised children. �e common causative agents are Candida albicans and Aspergillus species.
Amoebic liver abscesses are commonest in children < 3 years of age. �ey are caused by the parasite Entamoeba histolytica, which is endemic in tropical and subtropical climates.
Antibiotic therapy with percutaneous drainage of macroscopic abscesses under ultrasonographic control is now the treatment of choice for most liver abscesses.
Hepatic trauma�e liver is one of the most frequently injured abdominal organs in childhood. �e right hepatic lobe is injured more o�en than the le� and the posterior segment of the right lobe more o�en than the anterior segment. Hepatic injuries include subcapsular and parenchymal haematomas, contusions, lacerations and rupture (Fig. 5.15). On ultrasound, subcapsular haematomas o�en show a lenticular-shaped �uid collection (Fig. 5.16). Intrahepatic haematomas are frequently initially echo-rich and ill-de�ned within the hepatic parenchyma but become echo-free and diminish in size with time and progressive liquefaction. Hepatic lacerations result in linear or branching paren-chymal defects that may be super�cial or deep (Fig. 5.17). Hepatic fractures are deep parenchymal lacerations. Haemoperitoneum o�en accompanies hepatic injuries.
Late complications of hepatic trauma are biloma and pseudoaneurysm. Bilomas appear as well-de�ned �uid collections in the liver or peritoneal cavity (Fig. 5.18). Pseudoaneurysms are round lesions that show �ow on Doppler.
Man
ual o
f dia
gnos
tic u
ltras
ound
– V
olum
e 2
Fig. 5.15. Hepatic contusions. Oblique scan in a 7-year-old boy with abdominal trauma shows a heterogeneous, echo-rich area in the right hepatic lobe (arrows)
978-9241548540-C005 PRF ml YVR ln ml ml-1-Final Proof.indd 240 6/10/13 10:31 AM
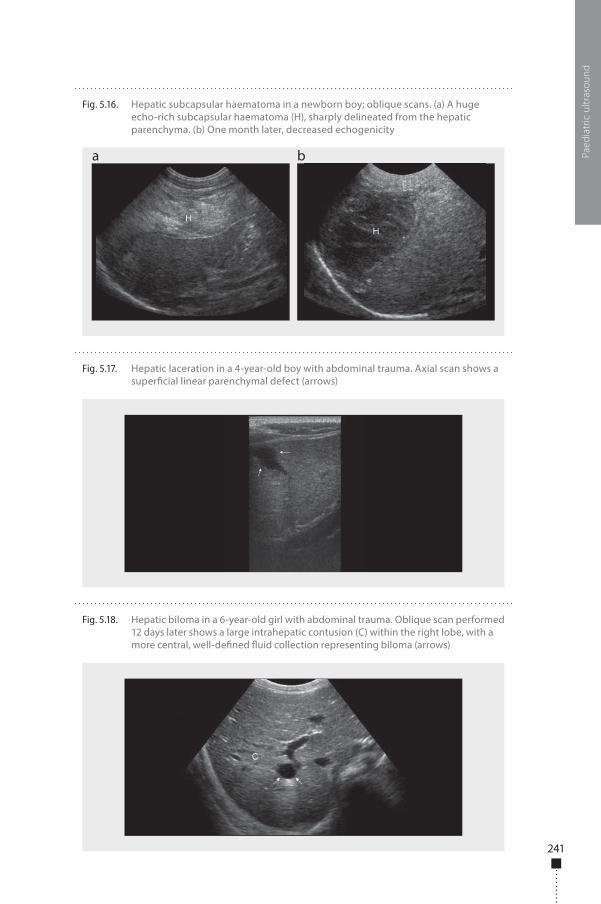
241
Paed
iatr
ic u
ltras
ound
Fig. 5.16. Hepatic subcapsular haematoma in a newborn boy; oblique scans. (a) A huge echo-rich subcapsular haematoma (H), sharply delineated from the hepatic parenchyma. (b) One month later, decreased echogenicity
a b
Fig. 5.17. Hepatic laceration in a 4-year-old boy with abdominal trauma. Axial scan shows a super�cial linear parenchymal defect (arrows)
Fig. 5.18. Hepatic biloma in a 6-year-old girl with abdominal trauma. Oblique scan performed 12 days later shows a large intrahepatic contusion (C) within the right lobe, with a more central, well-de�ned �uid collection representing biloma (arrows)
978-9241548540-C005 PRF ml YVR ln ml ml-1-Final Proof.indd 241 6/10/13 10:31 AM
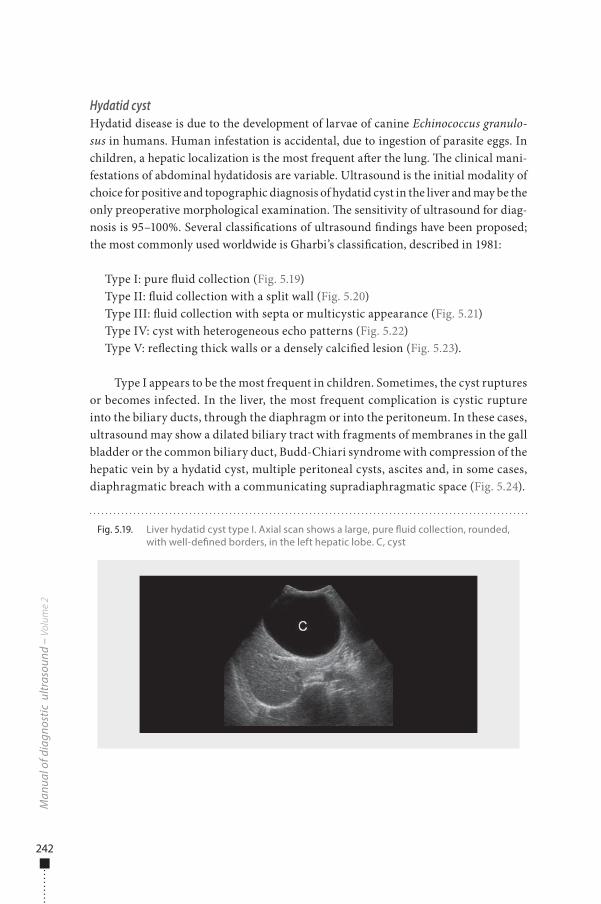
242
Hydatid cystHydatid disease is due to the development of larvae of canine Echinococcus granulo-sus in humans. Human infestation is accidental, due to ingestion of parasite eggs. In children, a hepatic localization is the most frequent a�er the lung. �e clinical mani-festations of abdominal hydatidosis are variable. Ultrasound is the initial modality of choice for positive and topographic diagnosis of hydatid cyst in the liver and may be the only preoperative morphological examination. �e sensitivity of ultrasound for diag-nosis is 95–100%. Several classi�cations of ultrasound �ndings have been proposed; the most commonly used worldwide is Gharbi’s classi�cation, described in 1981:
Type I: pure �uid collection (Fig. 5.19)Type II: �uid collection with a split wall (Fig. 5.20)Type III: �uid collection with septa or multicystic appearance (Fig. 5.21)Type IV: cyst with heterogeneous echo patterns (Fig. 5.22)Type V: re�ecting thick walls or a densely calci�ed lesion (Fig. 5.23).
Type I appears to be the most frequent in children. Sometimes, the cyst ruptures or becomes infected. In the liver, the most frequent complication is cystic rupture into the biliary ducts, through the diaphragm or into the peritoneum. In these cases, ultrasound may show a dilated biliary tract with fragments of membranes in the gall bladder or the common biliary duct, Budd-Chiari syndrome with compression of the hepatic vein by a hydatid cyst, multiple peritoneal cysts, ascites and, in some cases, diaphragmatic breach with a communicating supradiaphragmatic space (Fig. 5.24).
Man
ual o
f dia
gnos
tic u
ltras
ound
– V
olum
e 2
Fig. 5.19. Liver hydatid cyst type I. Axial scan shows a large, pure �uid collection, rounded, with well-de�ned borders, in the left hepatic lobe. C, cyst
978-9241548540-C005 PRF ml YVR ln ml ml-1-Final Proof.indd 242 6/10/13 10:31 AM
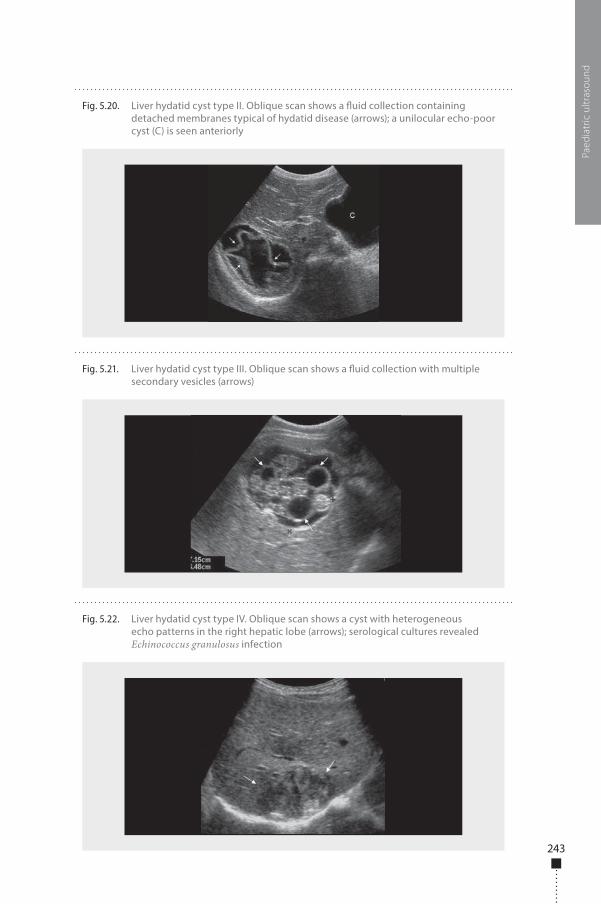
243
Paed
iatr
ic u
ltras
ound
Fig. 5.20. Liver hydatid cyst type II. Oblique scan shows a �uid collection containing detached membranes typical of hydatid disease (arrows); a unilocular echo-poor cyst (C) is seen anteriorly
Fig. 5.21. Liver hydatid cyst type III. Oblique scan shows a �uid collection with multiple secondary vesicles (arrows)
Fig. 5.22. Liver hydatid cyst type IV. Oblique scan shows a cyst with heterogeneous echo patterns in the right hepatic lobe (arrows); serological cultures revealed Echinococcus granulosus infection
978-9241548540-C005 PRF ml YVR ln ml ml-1-Final Proof.indd 243 6/10/13 10:31 AM
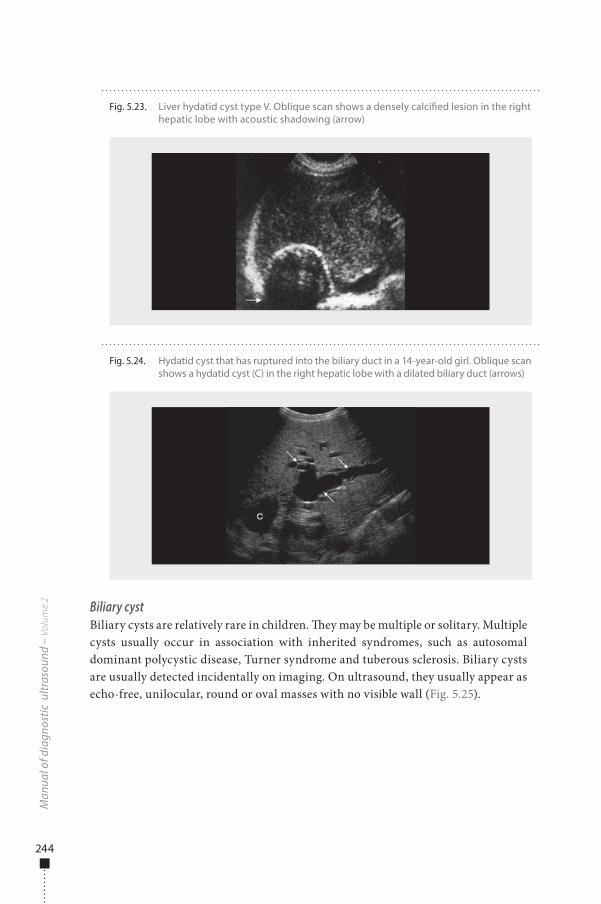
244
Biliary cystBiliary cysts are relatively rare in children. �ey may be multiple or solitary. Multiple cysts usually occur in association with inherited syndromes, such as autosomal dominant polycystic disease, Turner syndrome and tuberous sclerosis. Biliary cysts are usually detected incidentally on imaging. On ultrasound, they usually appear as echo-free, unilocular, round or oval masses with no visible wall (Fig. 5.25).
Man
ual o
f dia
gnos
tic u
ltras
ound
– V
olum
e 2
Fig. 5.23. Liver hydatid cyst type V. Oblique scan shows a densely calci�ed lesion in the right hepatic lobe with acoustic shadowing (arrow)
Fig. 5.24. Hydatid cyst that has ruptured into the biliary duct in a 14-year-old girl. Oblique scan shows a hydatid cyst (C) in the right hepatic lobe with a dilated biliary duct (arrows)
978-9241548540-C005 PRF ml YVR ln ml ml-1-Final Proof.indd 244 6/10/13 10:31 AM
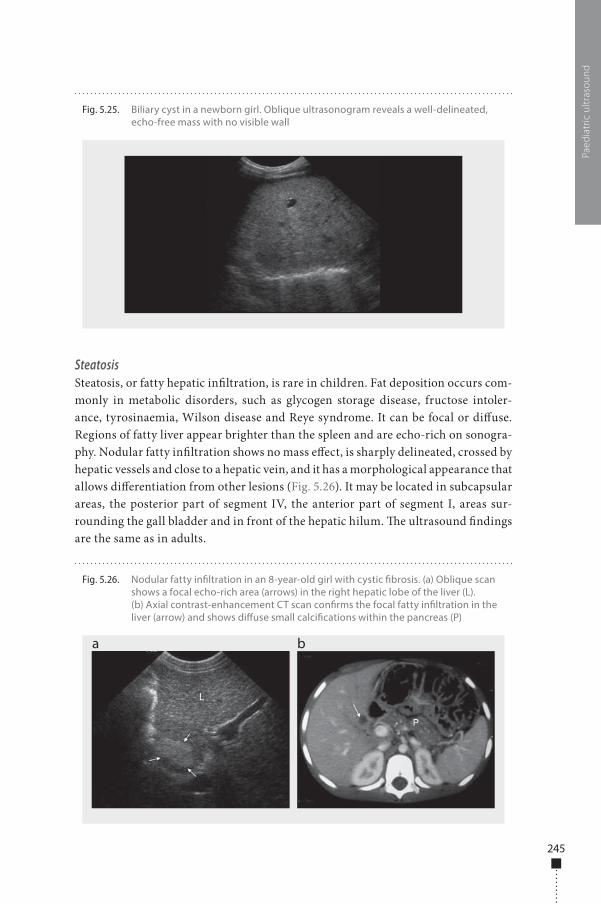
245
SteatosisSteatosis, or fatty hepatic in�ltration, is rare in children. Fat deposition occurs com-monly in metabolic disorders, such as glycogen storage disease, fructose intoler-ance, tyrosinaemia, Wilson disease and Reye syndrome. It can be focal or di�use. Regions of fatty liver appear brighter than the spleen and are echo-rich on sonogra-phy. Nodular fatty in�ltration shows no mass e�ect, is sharply delineated, crossed by hepatic vessels and close to a hepatic vein, and it has a morphological appearance that allows di�erentiation from other lesions (Fig. 5.26). It may be located in subcapsular areas, the posterior part of segment IV, the anterior part of segment I, areas sur-rounding the gall bladder and in front of the hepatic hilum. �e ultrasound �ndings are the same as in adults.
Paed
iatr
ic u
ltras
ound
Fig. 5.25. Biliary cyst in a newborn girl. Oblique ultrasonogram reveals a well-delineated, echo-free mass with no visible wall
Fig. 5.26. Nodular fatty in�ltration in an 8-year-old girl with cystic �brosis. (a) Oblique scan shows a focal echo-rich area (arrows) in the right hepatic lobe of the liver (L). (b) Axial contrast-enhancement CT scan con�rms the focal fatty in�ltration in the liver (arrow) and shows di�use small calci�cations within the pancreas (P)
a b
978-9241548540-C005 PRF ml YVR ln ml ml-1-Final Proof.indd 245 6/10/13 10:31 AM
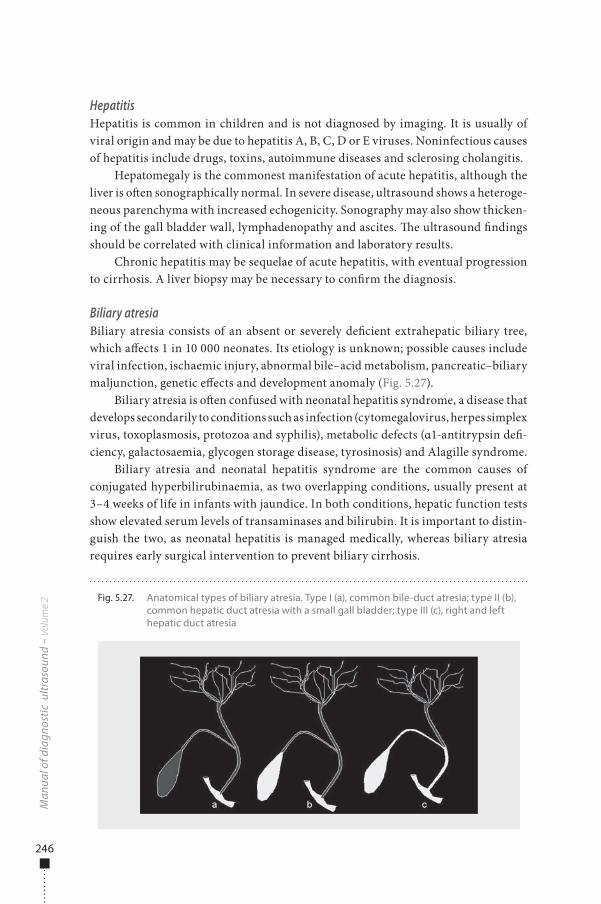
246
HepatitisHepatitis is common in children and is not diagnosed by imaging. It is usually of viral origin and may be due to hepatitis A, B, C, D or E viruses. Noninfectious causes of hepatitis include drugs, toxins, autoimmune diseases and sclerosing cholangitis.
Hepatomegaly is the commonest manifestation of acute hepatitis, although the liver is o�en sonographically normal. In severe disease, ultrasound shows a heteroge-neous parenchyma with increased echogenicity. Sonography may also show thicken-ing of the gall bladder wall, lymphadenopathy and ascites. �e ultrasound �ndings should be correlated with clinical information and laboratory results.
Chronic hepatitis may be sequelae of acute hepatitis, with eventual progression to cirrhosis. A liver biopsy may be necessary to con�rm the diagnosis.
Biliary atresiaBiliary atresia consists of an absent or severely de�cient extrahepatic biliary tree, which a�ects 1 in 10 000 neonates. Its etiology is unknown; possible causes include viral infection, ischaemic injury, abnormal bile–acid metabolism, pancreatic–biliary maljunction, genetic e�ects and development anomaly (Fig. 5.27).
Biliary atresia is o�en confused with neonatal hepatitis syndrome, a disease that develops secondarily to conditions such as infection (cytomegalovirus, herpes simplex virus, toxoplasmosis, protozoa and syphilis), metabolic defects (α1-antitrypsin de�-ciency, galactosaemia, glycogen storage disease, tyrosinosis) and Alagille syndrome.
Biliary atresia and neonatal hepatitis syndrome are the common causes of conjugated hyperbilirubinaemia, as two overlapping conditions, usually present at 3–4 weeks of life in infants with jaundice. In both conditions, hepatic function tests show elevated serum levels of transaminases and bilirubin. It is important to distin-guish the two, as neonatal hepatitis is managed medically, whereas biliary atresia requires early surgical intervention to prevent biliary cirrhosis.
Man
ual o
f dia
gnos
tic u
ltras
ound
– V
olum
e 2 Fig. 5.27. Anatomical types of biliary atresia. Type I (a), common bile-duct atresia; type II (b),
common hepatic duct atresia with a small gall bladder; type III (c), right and left hepatic duct atresia
978-9241548540-C005 PRF ml YVR ln ml ml-1-Final Proof.indd 246 6/10/13 10:31 AM
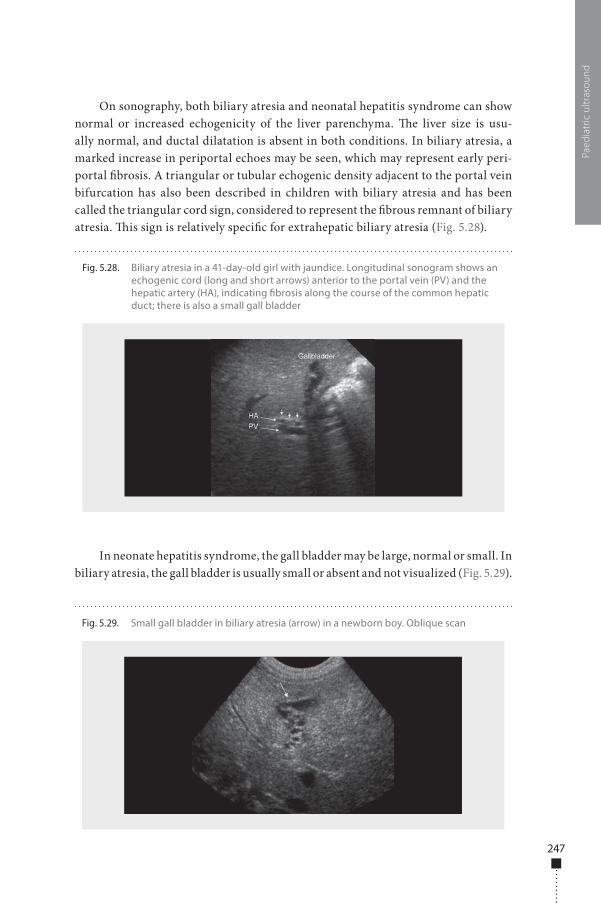
247
On sonography, both biliary atresia and neonatal hepatitis syndrome can show normal or increased echogenicity of the liver parenchyma. �e liver size is usu-ally normal, and ductal dilatation is absent in both conditions. In biliary atresia, a marked increase in periportal echoes may be seen, which may represent early peri-portal �brosis. A triangular or tubular echogenic density adjacent to the portal vein bifurcation has also been described in children with biliary atresia and has been called the triangular cord sign, considered to represent the �brous remnant of biliary atresia. �is sign is relatively speci�c for extrahepatic biliary atresia (Fig. 5.28).
In neonate hepatitis syndrome, the gall bladder may be large, normal or small. In biliary atresia, the gall bladder is usually small or absent and not visualized (Fig. 5.29).
Paed
iatr
ic u
ltras
ound
Fig. 5.28. Biliary atresia in a 41-day-old girl with jaundice. Longitudinal sonogram shows an echogenic cord (long and short arrows) anterior to the portal vein (PV) and the hepatic artery (HA), indicating �brosis along the course of the common hepatic duct; there is also a small gall bladder
Fig. 5.29. Small gall bladder in biliary atresia (arrow) in a newborn boy. Oblique scan
978-9241548540-C005 PRF ml YVR ln ml ml-1-Final Proof.indd 247 6/10/13 10:31 AM
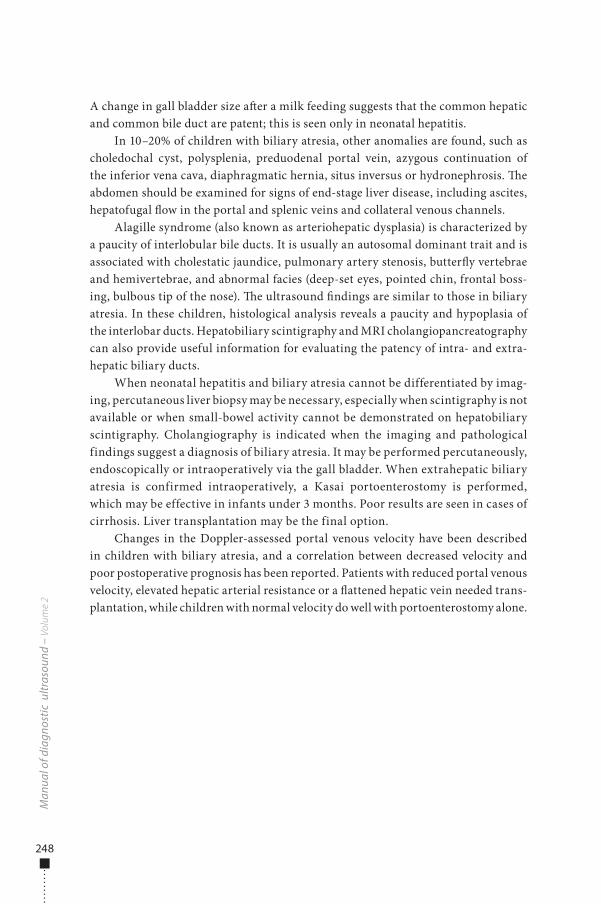
248
A change in gall bladder size a�er a milk feeding suggests that the common hepatic and common bile duct are patent; this is seen only in neonatal hepatitis.
In 10–20% of children with biliary atresia, other anomalies are found, such as choledochal cyst, polysplenia, preduodenal portal vein, azygous continuation of the inferior vena cava, diaphragmatic hernia, situs inversus or hydronephrosis. �e abdomen should be examined for signs of end-stage liver disease, including ascites, hepatofugal �ow in the portal and splenic veins and collateral venous channels.
Alagille syndrome (also known as arteriohepatic dysplasia) is characterized by a paucity of interlobular bile ducts. It is usually an autosomal dominant trait and is associated with cholestatic jaundice, pulmonary artery stenosis, butter�y vertebrae and hemivertebrae, and abnormal facies (deep-set eyes, pointed chin, frontal boss-ing, bulbous tip of the nose). �e ultrasound �ndings are similar to those in biliary atresia. In these children, histological analysis reveals a paucity and hypoplasia of the interlobar ducts. Hepatobiliary scintigraphy and MRI cholangiopancreatography can also provide useful information for evaluating the patency of intra- and extra-hepatic biliary ducts.
When neonatal hepatitis and biliary atresia cannot be differentiated by imag-ing, percutaneous liver biopsy may be necessary, especially when scintigraphy is not available or when small-bowel activity cannot be demonstrated on hepatobiliary scintigraphy. Cholangiography is indicated when the imaging and pathological findings suggest a diagnosis of biliary atresia. It may be performed percutaneously, endoscopically or intraoperatively via the gall bladder. When extrahepatic biliary atresia is confirmed intraoperatively, a Kasai portoenterostomy is performed, which may be effective in infants under 3 months. Poor results are seen in cases of cirrhosis. Liver transplantation may be the final option.
Changes in the Doppler-assessed portal venous velocity have been described in children with biliary atresia, and a correlation between decreased velocity and poor postoperative prognosis has been reported. Patients with reduced portal venous velocity, elevated hepatic arterial resistance or a �attened hepatic vein needed trans-plantation, while children with normal velocity do well with portoenterostomy alone.
Man
ual o
f dia
gnos
tic u
ltras
ound
– V
olum
e 2
978-9241548540-C005 PRF ml YVR ln ml ml-1-Final Proof.indd 248 6/10/13 10:31 AM
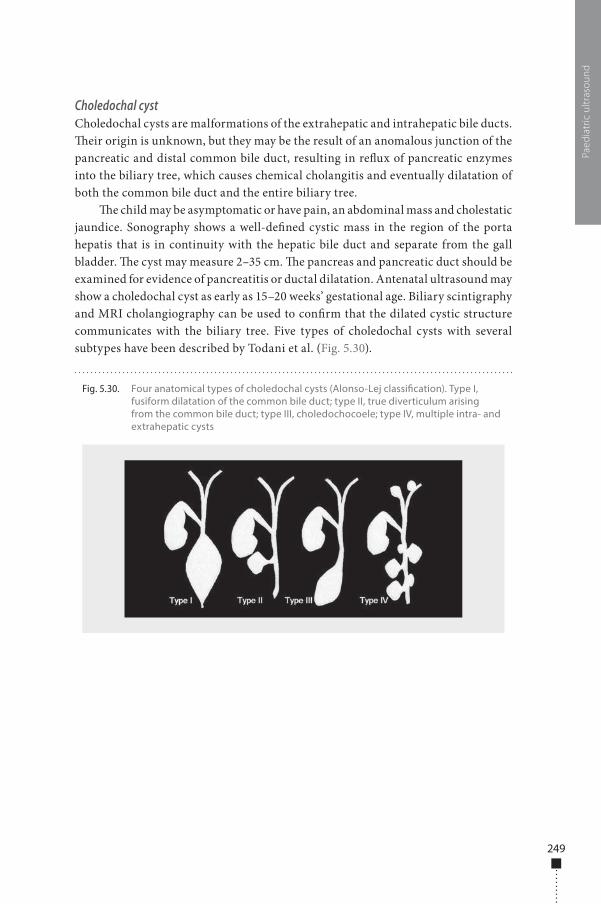
249
Choledochal cystCholedochal cysts are malformations of the extrahepatic and intrahepatic bile ducts. �eir origin is unknown, but they may be the result of an anomalous junction of the pancreatic and distal common bile duct, resulting in re�ux of pancreatic enzymes into the biliary tree, which causes chemical cholangitis and eventually dilatation of both the common bile duct and the entire biliary tree.
�e child may be asymptomatic or have pain, an abdominal mass and cholestatic jaundice. Sonography shows a well-de�ned cystic mass in the region of the porta hepatis that is in continuity with the hepatic bile duct and separate from the gall bladder. �e cyst may measure 2–35 cm. �e pancreas and pancreatic duct should be examined for evidence of pancreatitis or ductal dilatation. Antenatal ultrasound may show a choledochal cyst as early as 15–20 weeks’ gestational age. Biliary scintigraphy and MRI cholangiography can be used to con�rm that the dilated cystic structure communicates with the biliary tree. Five types of choledochal cysts with several subtypes have been described by Todani et al. (Fig. 5.30).
Paed
iatr
ic u
ltras
ound
Fig. 5.30. Four anatomical types of choledochal cysts (Alonso-Lej classi�cation). Type I, fusiform dilatation of the common bile duct; type II, true diverticulum arising from the common bile duct; type III, choledochocoele; type IV, multiple intra- and extrahepatic cysts
978-9241548540-C005 PRF ml YVR ln ml ml-1-Final Proof.indd 249 6/10/13 10:31 AM
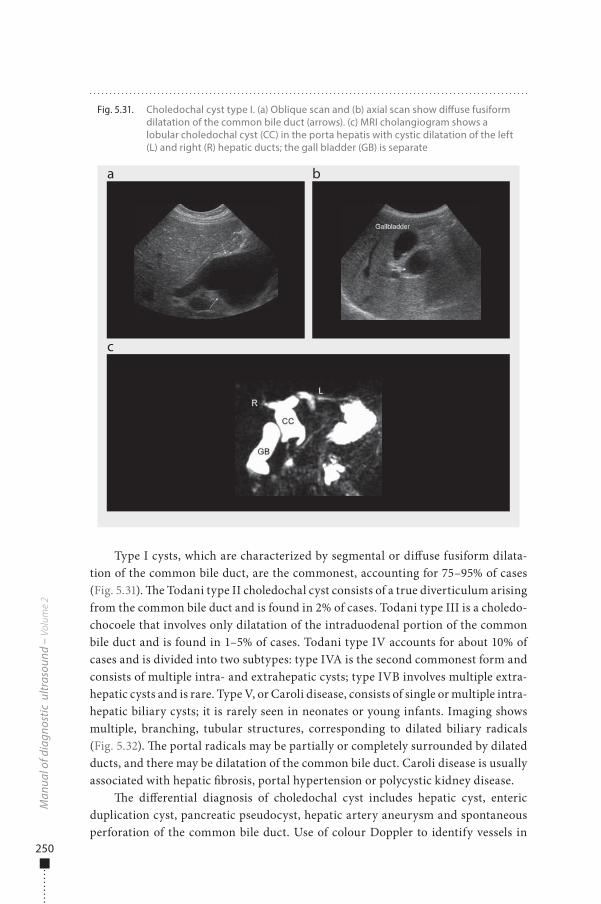
250
Type I cysts, which are characterized by segmental or di�use fusiform dilata-tion of the common bile duct, are the commonest, accounting for 75–95% of cases (Fig. 5.31). �e Todani type II choledochal cyst consists of a true diverticulum arising from the common bile duct and is found in 2% of cases. Todani type III is a choledo-chocoele that involves only dilatation of the intraduodenal portion of the common bile duct and is found in 1–5% of cases. Todani type IV accounts for about 10% of cases and is divided into two subtypes: type IVA is the second commonest form and consists of multiple intra- and extrahepatic cysts; type IVB involves multiple extra-hepatic cysts and is rare. Type V, or Caroli disease, consists of single or multiple intra-hepatic biliary cysts; it is rarely seen in neonates or young infants. Imaging shows multiple, branching, tubular structures, corresponding to dilated biliary radicals (Fig. 5.32). �e portal radicals may be partially or completely surrounded by dilated ducts, and there may be dilatation of the common bile duct. Caroli disease is usually associated with hepatic �brosis, portal hypertension or polycystic kidney disease.
�e di�erential diagnosis of choledochal cyst includes hepatic cyst, enteric duplication cyst, pancreatic pseudocyst, hepatic artery aneurysm and spontaneous perforation of the common bile duct. Use of colour Doppler to identify vessels in
Man
ual o
f dia
gnos
tic u
ltras
ound
– V
olum
e 2
Fig. 5.31. Choledochal cyst type I. (a) Oblique scan and (b) axial scan show di�use fusiform dilatation of the common bile duct (arrows). (c) MRI cholangiogram shows a lobular choledochal cyst (CC) in the porta hepatis with cystic dilatation of the left (L) and right (R) hepatic ducts; the gall bladder (GB) is separate
a
c
b
978-9241548540-C005 PRF ml YVR ln ml ml-1-Final Proof.indd 250 6/10/13 10:31 AM
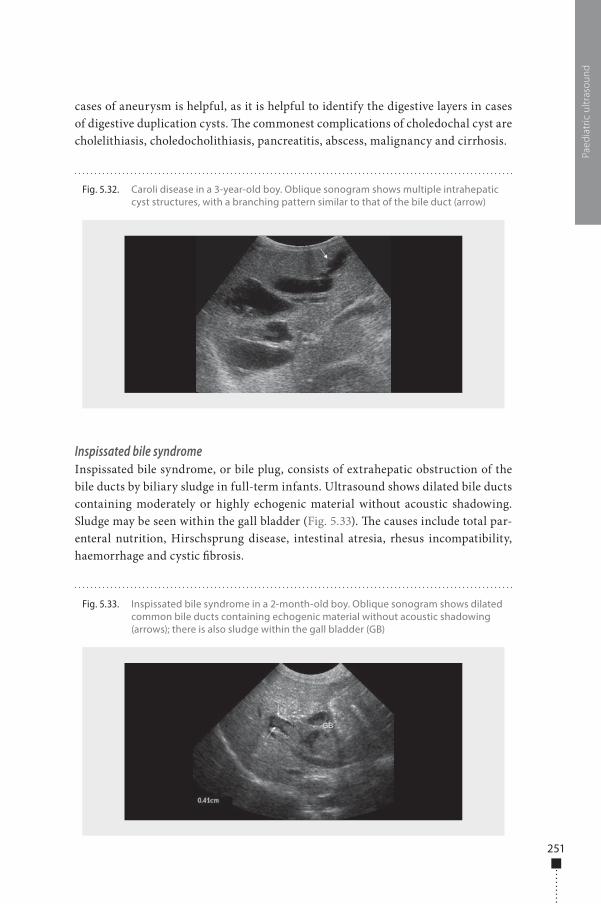
251
cases of aneurysm is helpful, as it is helpful to identify the digestive layers in cases of digestive duplication cysts. �e commonest complications of choledochal cyst are cholelithiasis, choledocholithiasis, pancreatitis, abscess, malignancy and cirrhosis.
Inspissated bile syndromeInspissated bile syndrome, or bile plug, consists of extrahepatic obstruction of the bile ducts by biliary sludge in full-term infants. Ultrasound shows dilated bile ducts containing moderately or highly echogenic material without acoustic shadowing. Sludge may be seen within the gall bladder (Fig. 5.33). �e causes include total par-enteral nutrition, Hirschsprung disease, intestinal atresia, rhesus incompatibility, haemorrhage and cystic �brosis.
Paed
iatr
ic u
ltras
ound
Fig. 5.33. Inspissated bile syndrome in a 2-month-old boy. Oblique sonogram shows dilated common bile ducts containing echogenic material without acoustic shadowing (arrows); there is also sludge within the gall bladder (GB)
Fig. 5.32. Caroli disease in a 3-year-old boy. Oblique sonogram shows multiple intrahepatic cyst structures, with a branching pattern similar to that of the bile duct (arrow)
978-9241548540-C005 PRF ml YVR ln ml ml-1-Final Proof.indd 251 6/10/13 10:31 AM
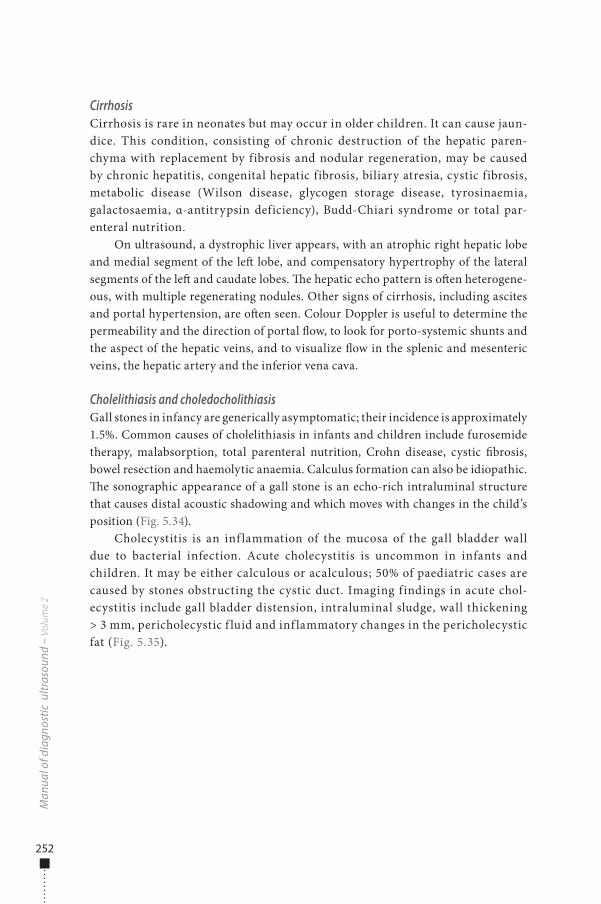
252
CirrhosisCirrhosis is rare in neonates but may occur in older children. It can cause jaun-dice. This condition, consisting of chronic destruction of the hepatic paren-chyma with replacement by fibrosis and nodular regeneration, may be caused by chronic hepatitis, congenital hepatic fibrosis, biliary atresia, cystic fibrosis, metabolic disease (Wilson disease, glycogen storage disease, tyrosinaemia, galactosaemia, α-antitrypsin deficiency), Budd-Chiari syndrome or total par-enteral nutrition.
On ultrasound, a dystrophic liver appears, with an atrophic right hepatic lobe and medial segment of the le� lobe, and compensatory hypertrophy of the lateral segments of the le� and caudate lobes. �e hepatic echo pattern is o�en heterogene-ous, with multiple regenerating nodules. Other signs of cirrhosis, including ascites and portal hypertension, are o�en seen. Colour Doppler is useful to determine the permeability and the direction of portal �ow, to look for porto-systemic shunts and the aspect of the hepatic veins, and to visualize �ow in the splenic and mesenteric veins, the hepatic artery and the inferior vena cava.
Cholelithiasis and choledocholithiasisGall stones in infancy are generically asymptomatic; their incidence is approximately 1.5%. Common causes of cholelithiasis in infants and children include furosemide therapy, malabsorption, total parenteral nutrition, Crohn disease, cystic �brosis, bowel resection and haemolytic anaemia. Calculus formation can also be idiopathic. �e sonographic appearance of a gall stone is an echo-rich intraluminal structure that causes distal acoustic shadowing and which moves with changes in the child’s position (Fig. 5.34).
Cholecystitis is an inf lammation of the mucosa of the gall bladder wall due to bacterial infection. Acute cholecystitis is uncommon in infants and children. It may be either calculous or acalculous; 50% of paediatric cases are caused by stones obstructing the cystic duct. Imaging findings in acute chol-ecystitis include gall bladder distension, intraluminal sludge, wall thickening > 3 mm, pericholecystic f luid and inf lammatory changes in the pericholecystic fat (Fig. 5.35).
Man
ual o
f dia
gnos
tic u
ltras
ound
– V
olum
e 2
978-9241548540-C005 PRF ml YVR ln ml ml-1-Final Proof.indd 252 6/10/13 10:31 AM
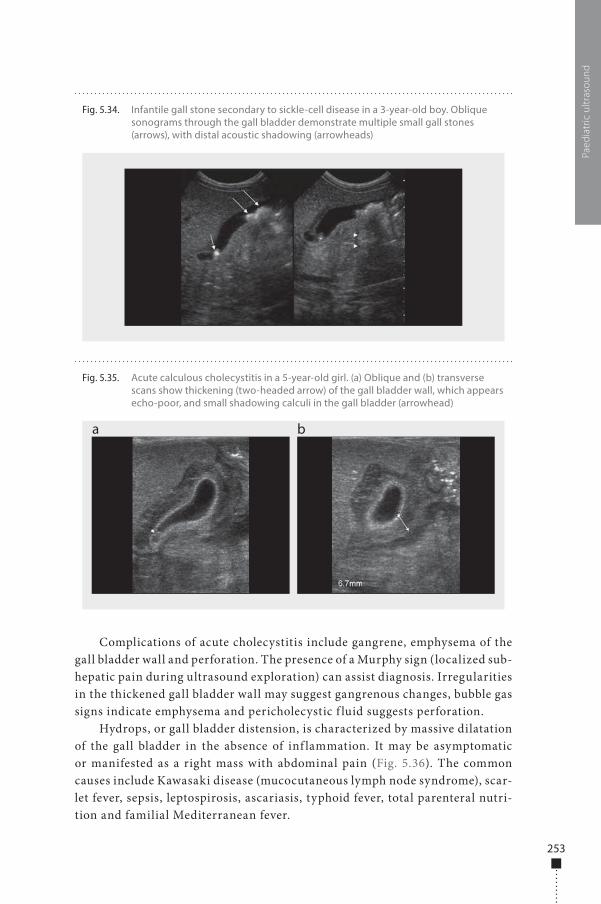
253
Complications of acute cholecystitis include gangrene, emphysema of the gall bladder wall and perforation. The presence of a Murphy sign (localized sub-hepatic pain during ultrasound exploration) can assist diagnosis. Irregularities in the thickened gall bladder wall may suggest gangrenous changes, bubble gas signs indicate emphysema and pericholecystic f luid suggests perforation.
Hydrops, or gall bladder distension, is characterized by massive dilatation of the gall bladder in the absence of inf lammation. It may be asymptomatic or manifested as a right mass with abdominal pain (Fig. 5.36). The common causes include Kawasaki disease (mucocutaneous lymph node syndrome), scar-let fever, sepsis, leptospirosis, ascariasis, typhoid fever, total parenteral nutri-tion and familial Mediterranean fever.
Paed
iatr
ic u
ltras
ound
Fig. 5.35. Acute calculous cholecystitis in a 5-year-old girl. (a) Oblique and (b) transverse scans show thickening (two-headed arrow) of the gall bladder wall, which appears echo-poor, and small shadowing calculi in the gall bladder (arrowhead)
a b
Fig. 5.34. Infantile gall stone secondary to sickle-cell disease in a 3-year-old boy. Oblique sonograms through the gall bladder demonstrate multiple small gall stones (arrows), with distal acoustic shadowing (arrowheads)
978-9241548540-C005 PRF ml YVR ln ml ml-1-Final Proof.indd 253 6/10/13 10:31 AM
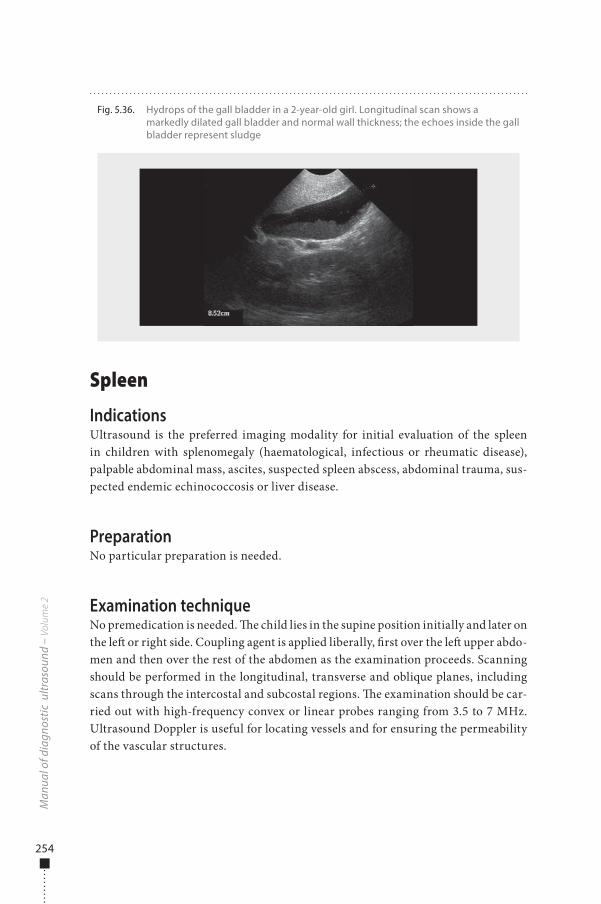
254
Spleen
IndicationsUltrasound is the preferred imaging modality for initial evaluation of the spleen in children with splenomegaly (haematological, infectious or rheumatic disease), palpable abdominal mass, ascites, suspected spleen abscess, abdominal trauma, sus-pected endemic echinococcosis or liver disease.
PreparationNo particular preparation is needed.
Examination techniqueNo premedication is needed. �e child lies in the supine position initially and later on the le� or right side. Coupling agent is applied liberally, �rst over the le� upper abdo-men and then over the rest of the abdomen as the examination proceeds. Scanning should be performed in the longitudinal, transverse and oblique planes, including scans through the intercostal and subcostal regions. �e examination should be car-ried out with high-frequency convex or linear probes ranging from 3.5 to 7 MHz. Ultrasound Doppler is useful for locating vessels and for ensuring the permeability of the vascular structures.
Man
ual o
f dia
gnos
tic u
ltras
ound
– V
olum
e 2
Fig. 5.36. Hydrops of the gall bladder in a 2-year-old girl. Longitudinal scan shows a markedly dilated gall bladder and normal wall thickness; the echoes inside the gall bladder represent sludge
978-9241548540-C005 PRF ml YVR ln ml ml-1-Final Proof.indd 254 6/10/13 10:31 AM
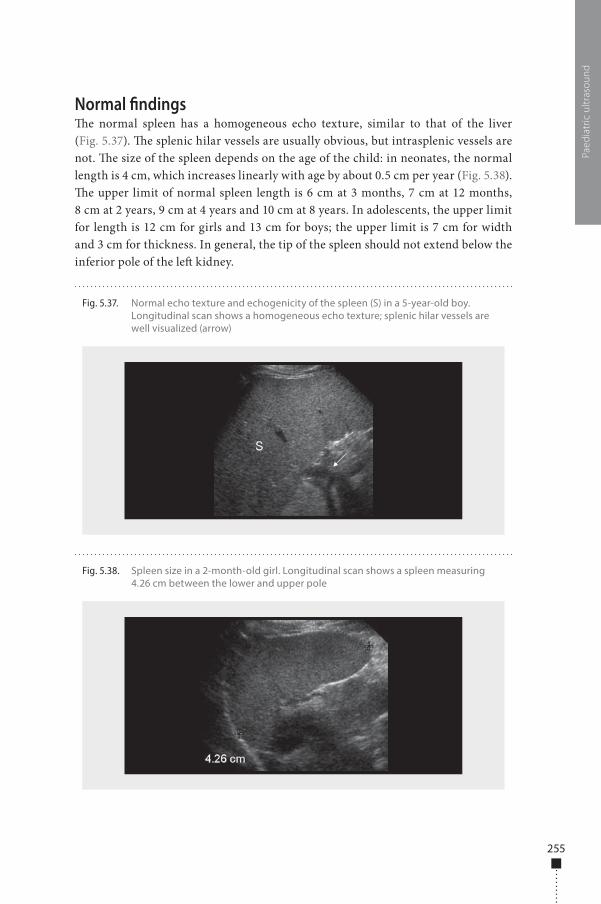
255
Normal �ndings�e normal spleen has a homogeneous echo texture, similar to that of the liver (Fig. 5.37). �e splenic hilar vessels are usually obvious, but intrasplenic vessels are not. �e size of the spleen depends on the age of the child: in neonates, the normal length is 4 cm, which increases linearly with age by about 0.5 cm per year (Fig. 5.38). �e upper limit of normal spleen length is 6 cm at 3 months, 7 cm at 12 months, 8 cm at 2 years, 9 cm at 4 years and 10 cm at 8 years. In adolescents, the upper limit for length is 12 cm for girls and 13 cm for boys; the upper limit is 7 cm for width and 3 cm for thickness. In general, the tip of the spleen should not extend below the inferior pole of the le� kidney.
Paed
iatr
ic u
ltras
ound
Fig. 5.38. Spleen size in a 2-month-old girl. Longitudinal scan shows a spleen measuring 4.26 cm between the lower and upper pole
Fig. 5.37. Normal echo texture and echogenicity of the spleen (S) in a 5-year-old boy. Longitudinal scan shows a homogeneous echo texture; splenic hilar vessels are well visualized (arrow)
978-9241548540-C005 PRF ml YVR ln ml ml-1-Final Proof.indd 255 6/10/13 10:31 AM
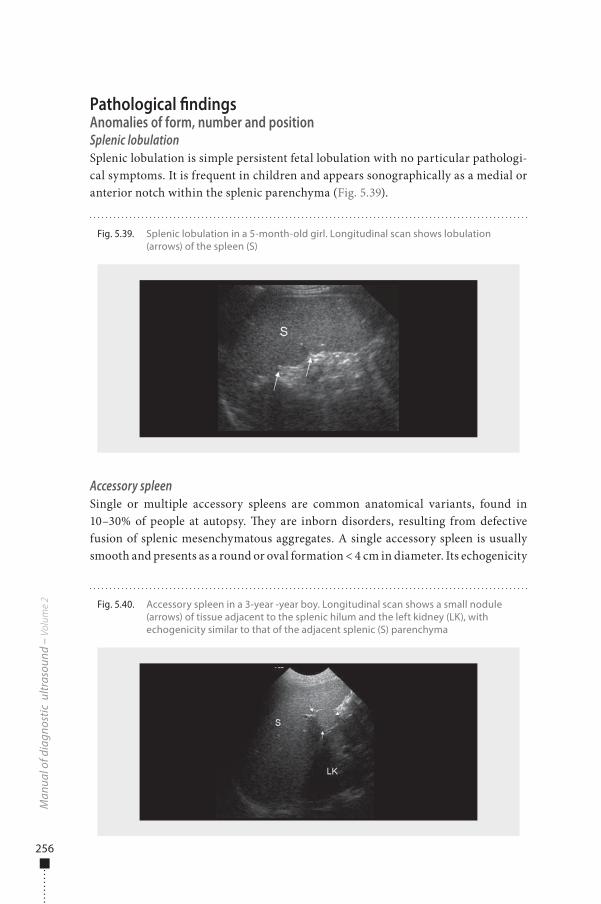
256
Pathological �ndingsAnomalies of form, number and positionSplenic lobulationSplenic lobulation is simple persistent fetal lobulation with no particular pathologi-cal symptoms. It is frequent in children and appears sonographically as a medial or anterior notch within the splenic parenchyma (Fig. 5.39).
Accessory spleenSingle or multiple accessory spleens are common anatomical variants, found in 10–30% of people at autopsy. �ey are inborn disorders, resulting from defective fusion of splenic mesenchymatous aggregates. A single accessory spleen is usually smooth and presents as a round or oval formation < 4 cm in diameter. Its echogenicity
Man
ual o
f dia
gnos
tic u
ltras
ound
– V
olum
e 2
Fig. 5.39. Splenic lobulation in a 5-month-old girl. Longitudinal scan shows lobulation (arrows) of the spleen (S)
Fig. 5.40. Accessory spleen in a 3-year -year boy. Longitudinal scan shows a small nodule (arrows) of tissue adjacent to the splenic hilum and the left kidney (LK), with echogenicity similar to that of the adjacent splenic (S) parenchyma
978-9241548540-C005 PRF ml YVR ln ml ml-1-Final Proof.indd 256 6/10/13 10:31 AM
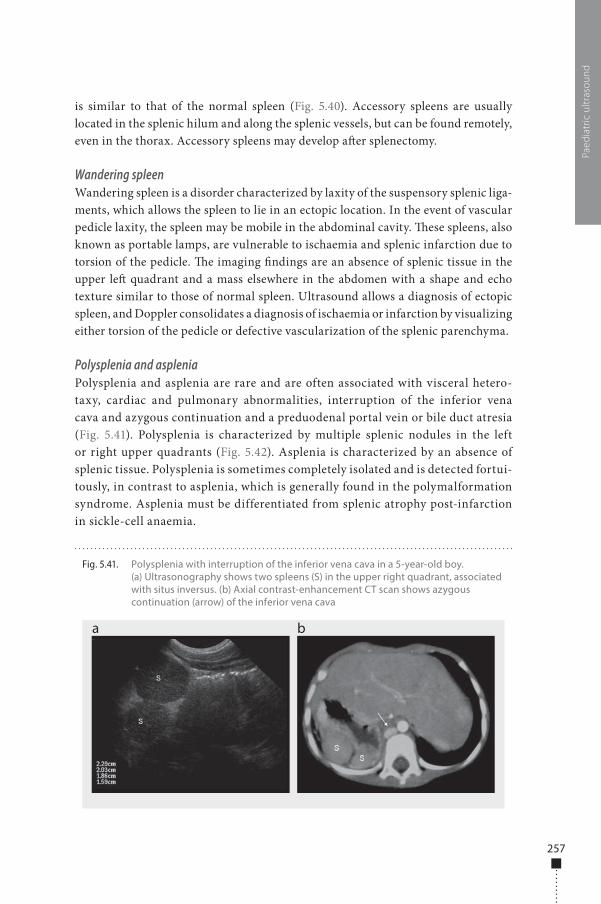
257
is similar to that of the normal spleen (Fig. 5.40). Accessory spleens are usually located in the splenic hilum and along the splenic vessels, but can be found remotely, even in the thorax. Accessory spleens may develop a�er splenectomy.
Wandering spleenWandering spleen is a disorder characterized by laxity of the suspensory splenic liga-ments, which allows the spleen to lie in an ectopic location. In the event of vascular pedicle laxity, the spleen may be mobile in the abdominal cavity. �ese spleens, also known as portable lamps, are vulnerable to ischaemia and splenic infarction due to torsion of the pedicle. �e imaging �ndings are an absence of splenic tissue in the upper le� quadrant and a mass elsewhere in the abdomen with a shape and echo texture similar to those of normal spleen. Ultrasound allows a diagnosis of ectopic spleen, and Doppler consolidates a diagnosis of ischaemia or infarction by visualizing either torsion of the pedicle or defective vascularization of the splenic parenchyma.
Polysplenia and aspleniaPolysplenia and asplenia are rare and are often associated with visceral hetero-taxy, cardiac and pulmonary abnormalities, interruption of the inferior vena cava and azygous continuation and a preduodenal portal vein or bile duct atresia (Fig. 5.41). Polysplenia is characterized by multiple splenic nodules in the left or right upper quadrants (Fig. 5.42). Asplenia is characterized by an absence of splenic tissue. Polysplenia is sometimes completely isolated and is detected fortui-tously, in contrast to asplenia, which is generally found in the polymalformation syndrome. Asplenia must be differentiated from splenic atrophy post-infarction in sickle-cell anaemia.
Paed
iatr
ic u
ltras
ound
Fig. 5.41. Polysplenia with interruption of the inferior vena cava in a 5-year-old boy. (a) Ultrasonography shows two spleens (S) in the upper right quadrant, associated with situs inversus. (b) Axial contrast-enhancement CT scan shows azygous continuation (arrow) of the inferior vena cava
a b
978-9241548540-C005 PRF ml YVR ln ml ml-1-Final Proof.indd 257 6/10/13 10:31 AM
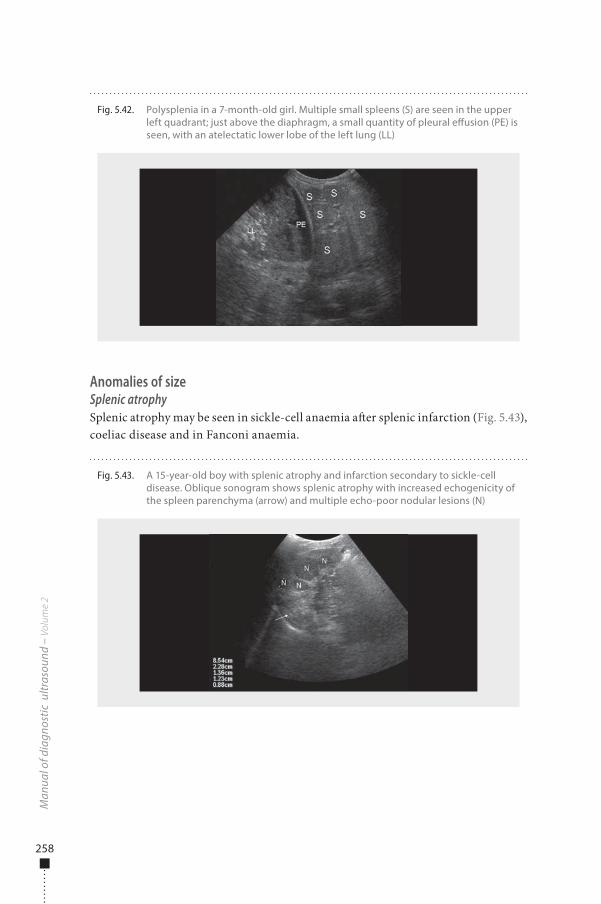
258
Anomalies of sizeSplenic atrophySplenic atrophy may be seen in sickle-cell anaemia a�er splenic infarction (Fig. 5.43), coeliac disease and in Fanconi anaemia.
Man
ual o
f dia
gnos
tic u
ltras
ound
– V
olum
e 2
Fig. 5.42. Polysplenia in a 7-month-old girl. Multiple small spleens (S) are seen in the upper left quadrant; just above the diaphragm, a small quantity of pleural e�usion (PE) is seen, with an atelectatic lower lobe of the left lung (LL)
Fig. 5.43. A 15-year-old boy with splenic atrophy and infarction secondary to sickle-cell disease. Oblique sonogram shows splenic atrophy with increased echogenicity of the spleen parenchyma (arrow) and multiple echo-poor nodular lesions (N)
978-9241548540-C005 PRF ml YVR ln ml ml-1-Final Proof.indd 258 6/10/13 10:31 AM
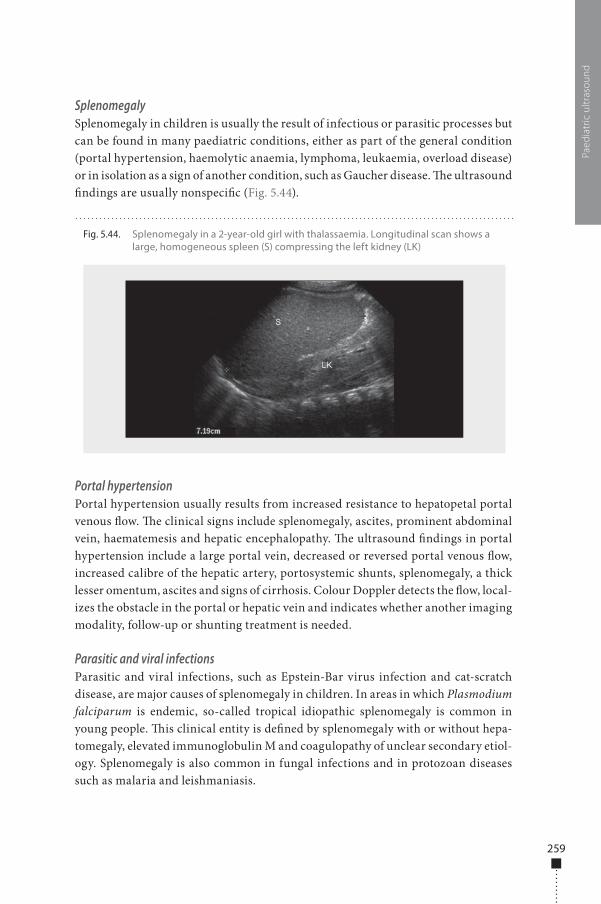
259
SplenomegalySplenomegaly in children is usually the result of infectious or parasitic processes but can be found in many paediatric conditions, either as part of the general condition (portal hypertension, haemolytic anaemia, lymphoma, leukaemia, overload disease) or in isolation as a sign of another condition, such as Gaucher disease. �e ultrasound �ndings are usually nonspeci�c (Fig. 5.44).
Portal hypertensionPortal hypertension usually results from increased resistance to hepatopetal portal venous �ow. �e clinical signs include splenomegaly, ascites, prominent abdominal vein, haematemesis and hepatic encephalopathy. �e ultrasound �ndings in portal hypertension include a large portal vein, decreased or reversed portal venous �ow, increased calibre of the hepatic artery, portosystemic shunts, splenomegaly, a thick lesser omentum, ascites and signs of cirrhosis. Colour Doppler detects the �ow, local-izes the obstacle in the portal or hepatic vein and indicates whether another imaging modality, follow-up or shunting treatment is needed.
Parasitic and viral infectionsParasitic and viral infections, such as Epstein-Bar virus infection and cat-scratch disease, are major causes of splenomegaly in children. In areas in which Plasmodium falciparum is endemic, so-called tropical idiopathic splenomegaly is common in young people. �is clinical entity is de�ned by splenomegaly with or without hepa-tomegaly, elevated immunoglobulin M and coagulopathy of unclear secondary etiol-ogy. Splenomegaly is also common in fungal infections and in protozoan diseases such as malaria and leishmaniasis.
Paed
iatr
ic u
ltras
ound
Fig. 5.44. Splenomegaly in a 2-year-old girl with thalassaemia. Longitudinal scan shows a large, homogeneous spleen (S) compressing the left kidney (LK)
978-9241548540-C005 PRF ml YVR ln ml ml-1-Final Proof.indd 259 6/10/13 10:31 AM
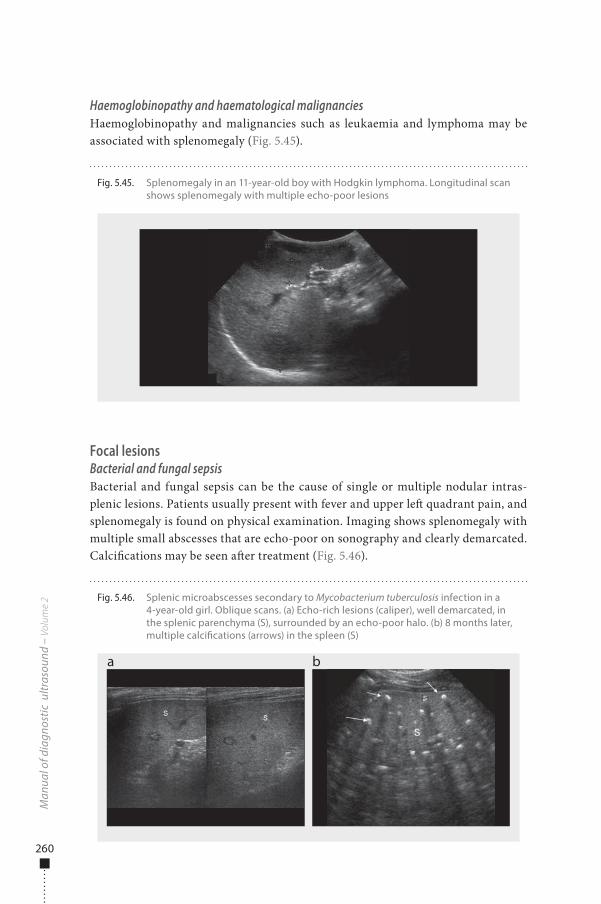
260
Haemoglobinopathy and haematological malignanciesHaemoglobinopathy and malignancies such as leukaemia and lymphoma may be associated with splenomegaly (Fig. 5.45).
Focal lesionsBacterial and fungal sepsisBacterial and fungal sepsis can be the cause of single or multiple nodular intras-plenic lesions. Patients usually present with fever and upper le� quadrant pain, and splenomegaly is found on physical examination. Imaging shows splenomegaly with multiple small abscesses that are echo-poor on sonography and clearly demarcated. Calci�cations may be seen a�er treatment (Fig. 5.46).
Man
ual o
f dia
gnos
tic u
ltras
ound
– V
olum
e 2
Fig. 5.45. Splenomegaly in an 11-year-old boy with Hodgkin lymphoma. Longitudinal scan shows splenomegaly with multiple echo-poor lesions
Fig. 5.46. Splenic microabscesses secondary to Mycobacterium tuberculosis infection in a 4-year-old girl. Oblique scans. (a) Echo-rich lesions (caliper), well demarcated, in the splenic parenchyma (S), surrounded by an echo-poor halo. (b) 8 months later, multiple calci�cations (arrows) in the spleen (S)
a b
978-9241548540-C005 PRF ml YVR ln ml ml-1-Final Proof.indd 260 6/10/13 10:31 AM
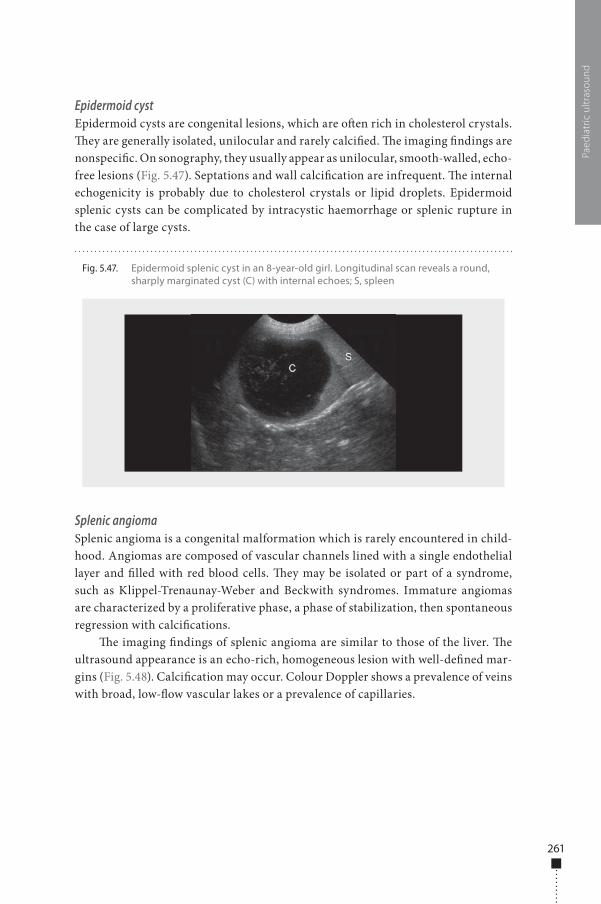
261
Epidermoid cystEpidermoid cysts are congenital lesions, which are o�en rich in cholesterol crystals. �ey are generally isolated, unilocular and rarely calci�ed. �e imaging �ndings are nonspeci�c. On sonography, they usually appear as unilocular, smooth-walled, echo-free lesions (Fig. 5.47). Septations and wall calci�cation are infrequent. �e internal echogenicity is probably due to cholesterol crystals or lipid droplets. Epidermoid splenic cysts can be complicated by intracystic haemorrhage or splenic rupture in the case of large cysts.
Splenic angiomaSplenic angioma is a congenital malformation which is rarely encountered in child-hood. Angiomas are composed of vascular channels lined with a single endothelial layer and �lled with red blood cells. �ey may be isolated or part of a syndrome, such as Klippel-Trenaunay-Weber and Beckwith syndromes. Immature angiomas are characterized by a proliferative phase, a phase of stabilization, then spontaneous regression with calci�cations.
�e imaging �ndings of splenic angioma are similar to those of the liver. �e ultrasound appearance is an echo-rich, homogeneous lesion with well-de�ned mar-gins (Fig. 5.48). Calci�cation may occur. Colour Doppler shows a prevalence of veins with broad, low-�ow vascular lakes or a prevalence of capillaries.
Paed
iatr
ic u
ltras
ound
Fig. 5.47. Epidermoid splenic cyst in an 8-year-old girl. Longitudinal scan reveals a round, sharply marginated cyst (C) with internal echoes; S, spleen
978-9241548540-C005 PRF ml YVR ln ml ml-1-Final Proof.indd 261 6/10/13 10:31 AM
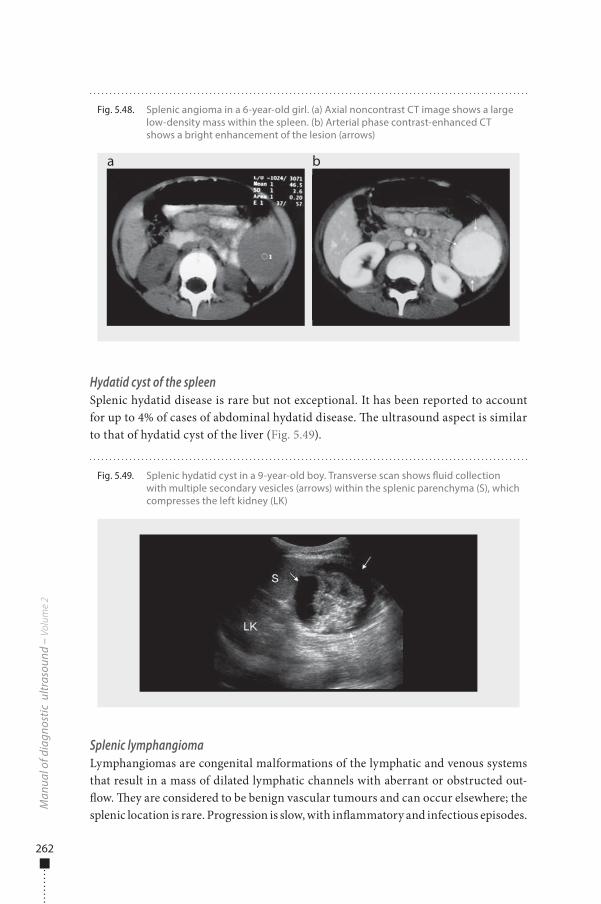
262
Hydatid cyst of the spleenSplenic hydatid disease is rare but not exceptional. It has been reported to account for up to 4% of cases of abdominal hydatid disease. �e ultrasound aspect is similar to that of hydatid cyst of the liver (Fig. 5.49).
Splenic lymphangiomaLymphangiomas are congenital malformations of the lymphatic and venous systems that result in a mass of dilated lymphatic channels with aberrant or obstructed out-�ow. �ey are considered to be benign vascular tumours and can occur elsewhere; the splenic location is rare. Progression is slow, with in�ammatory and infectious episodes.
Man
ual o
f dia
gnos
tic u
ltras
ound
– V
olum
e 2
Fig. 5.48. Splenic angioma in a 6-year-old girl. (a) Axial noncontrast CT image shows a large low-density mass within the spleen. (b) Arterial phase contrast-enhanced CT shows a bright enhancement of the lesion (arrows)
a b
Fig. 5.49. Splenic hydatid cyst in a 9-year-old boy. Transverse scan shows �uid collection with multiple secondary vesicles (arrows) within the splenic parenchyma (S), which compresses the left kidney (LK)
978-9241548540-C005 PRF ml YVR ln ml ml-1-Final Proof.indd 262 6/10/13 10:31 AM
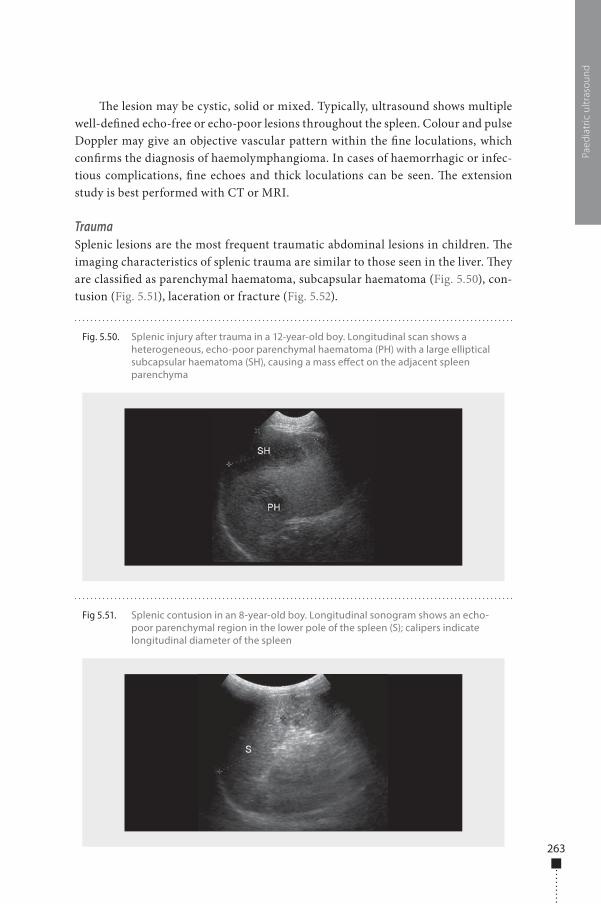
263
�e lesion may be cystic, solid or mixed. Typically, ultrasound shows multiple well-de�ned echo-free or echo-poor lesions throughout the spleen. Colour and pulse Doppler may give an objective vascular pattern within the �ne loculations, which con�rms the diagnosis of haemolymphangioma. In cases of haemorrhagic or infec-tious complications, �ne echoes and thick loculations can be seen. �e extension study is best performed with CT or MRI.
TraumaSplenic lesions are the most frequent traumatic abdominal lesions in children. �e imaging characteristics of splenic trauma are similar to those seen in the liver. �ey are classi�ed as parenchymal haematoma, subcapsular haematoma (Fig. 5.50), con-tusion (Fig. 5.51), laceration or fracture (Fig. 5.52).
Paed
iatr
ic u
ltras
ound
Fig 5.51. Splenic contusion in an 8-year-old boy. Longitudinal sonogram shows an echo-poor parenchymal region in the lower pole of the spleen (S); calipers indicate longitudinal diameter of the spleen
Fig. 5.50. Splenic injury after trauma in a 12-year-old boy. Longitudinal scan shows a heterogeneous, echo-poor parenchymal haematoma (PH) with a large elliptical subcapsular haematoma (SH), causing a mass e�ect on the adjacent spleen parenchyma
978-9241548540-C005 PRF ml YVR ln ml ml-1-Final Proof.indd 263 6/10/13 10:31 AM
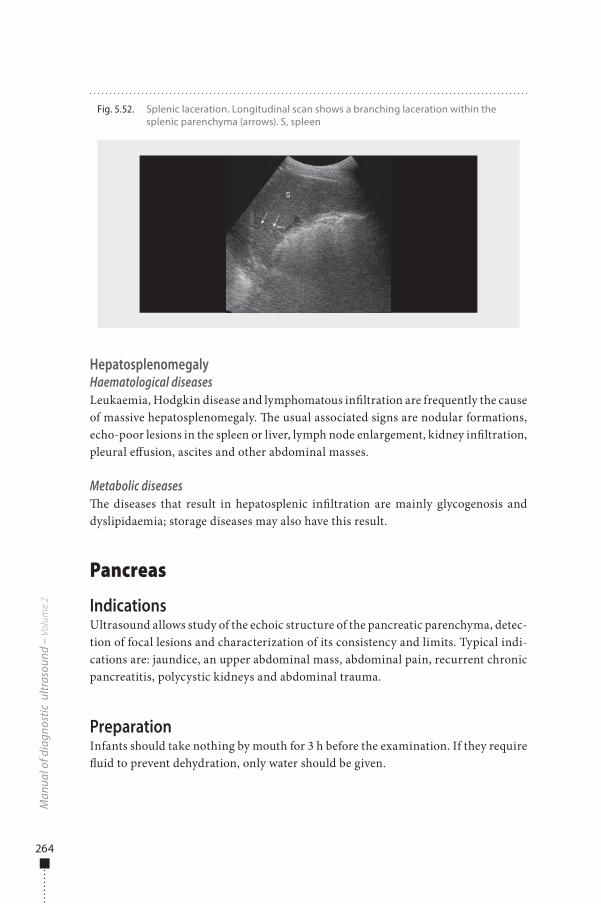
264
HepatosplenomegalyHaematological diseasesLeukaemia, Hodgkin disease and lymphomatous in�ltration are frequently the cause of massive hepatosplenomegaly. �e usual associated signs are nodular formations, echo-poor lesions in the spleen or liver, lymph node enlargement, kidney in�ltration, pleural e�usion, ascites and other abdominal masses.
Metabolic diseases�e diseases that result in hepatosplenic in�ltration are mainly glycogenosis and dyslipidaemia; storage diseases may also have this result.
Pancreas
IndicationsUltrasound allows study of the echoic structure of the pancreatic parenchyma, detec-tion of focal lesions and characterization of its consistency and limits. Typical indi-cations are: jaundice, an upper abdominal mass, abdominal pain, recurrent chronic pancreatitis, polycystic kidneys and abdominal trauma.
PreparationInfants should take nothing by mouth for 3 h before the examination. If they require �uid to prevent dehydration, only water should be given.
Man
ual o
f dia
gnos
tic u
ltras
ound
– V
olum
e 2
Fig. 5.52. Splenic laceration. Longitudinal scan shows a branching laceration within the splenic parenchyma (arrows). S, spleen
978-9241548540-C005 PRF ml YVR ln ml ml-1-Final Proof.indd 264 6/10/13 10:31 AM
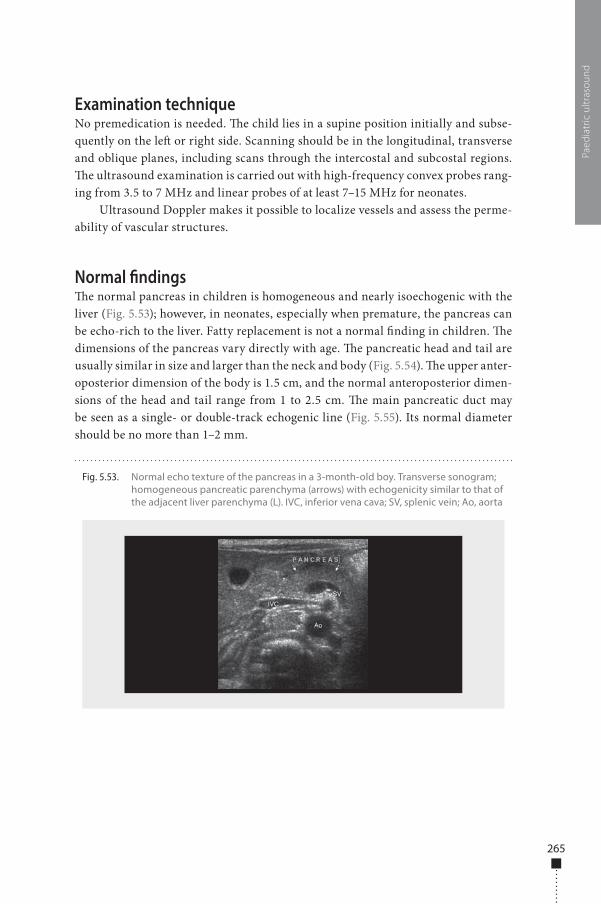
265
Examination techniqueNo premedication is needed. �e child lies in a supine position initially and subse-quently on the le� or right side. Scanning should be in the longitudinal, transverse and oblique planes, including scans through the intercostal and subcostal regions. �e ultrasound examination is carried out with high-frequency convex probes rang-ing from 3.5 to 7 MHz and linear probes of at least 7–15 MHz for neonates.
Ultrasound Doppler makes it possible to localize vessels and assess the perme-ability of vascular structures.
Normal �ndings�e normal pancreas in children is homogeneous and nearly isoechogenic with the liver (Fig. 5.53); however, in neonates, especially when premature, the pancreas can be echo-rich to the liver. Fatty replacement is not a normal �nding in children. �e dimensions of the pancreas vary directly with age. �e pancreatic head and tail are usually similar in size and larger than the neck and body (Fig. 5.54). �e upper anter-oposterior dimension of the body is 1.5 cm, and the normal anteroposterior dimen-sions of the head and tail range from 1 to 2.5 cm. �e main pancreatic duct may be seen as a single- or double-track echogenic line (Fig. 5.55). Its normal diameter should be no more than 1–2 mm.
Paed
iatr
ic u
ltras
ound
Fig. 5.53. Normal echo texture of the pancreas in a 3-month-old boy. Transverse sonogram; homogeneous pancreatic parenchyma (arrows) with echogenicity similar to that of the adjacent liver parenchyma (L). IVC, inferior vena cava; SV, splenic vein; Ao, aorta
978-9241548540-C005 PRF ml YVR ln ml ml-1-Final Proof.indd 265 6/10/13 10:31 AM
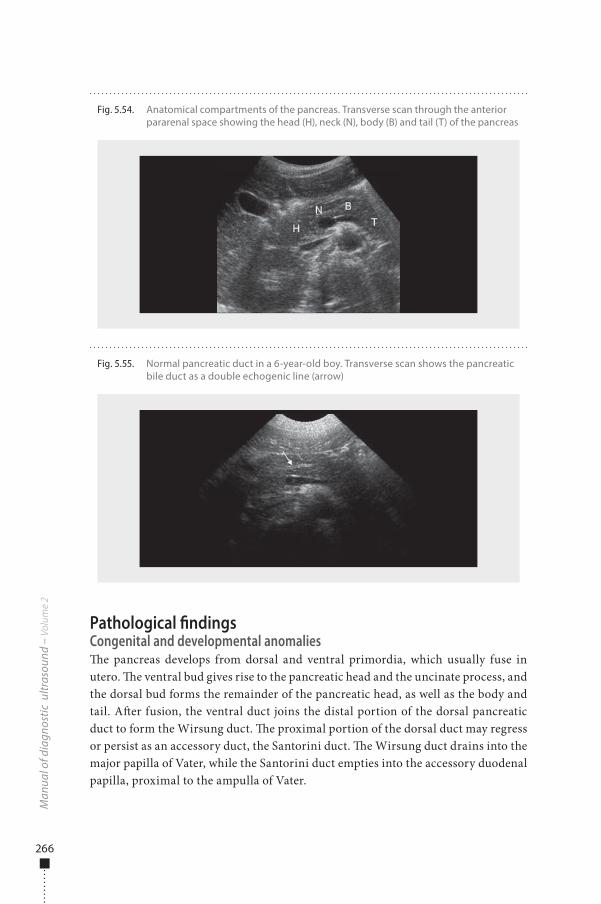
266
Pathological �ndingsCongenital and developmental anomalies�e pancreas develops from dorsal and ventral primordia, which usually fuse in utero. �e ventral bud gives rise to the pancreatic head and the uncinate process, and the dorsal bud forms the remainder of the pancreatic head, as well as the body and tail. A�er fusion, the ventral duct joins the distal portion of the dorsal pancreatic duct to form the Wirsung duct. �e proximal portion of the dorsal duct may regress or persist as an accessory duct, the Santorini duct. �e Wirsung duct drains into the major papilla of Vater, while the Santorini duct empties into the accessory duodenal papilla, proximal to the ampulla of Vater.
Man
ual o
f dia
gnos
tic u
ltras
ound
– V
olum
e 2
Fig. 5.54. Anatomical compartments of the pancreas. Transverse scan through the anterior pararenal space showing the head (H), neck (N), body (B) and tail (T) of the pancreas
Fig. 5.55. Normal pancreatic duct in a 6-year-old boy. Transverse scan shows the pancreatic bile duct as a double echogenic line (arrow)
978-9241548540-C005 PRF ml YVR ln ml ml-1-Final Proof.indd 266 6/10/13 10:31 AM
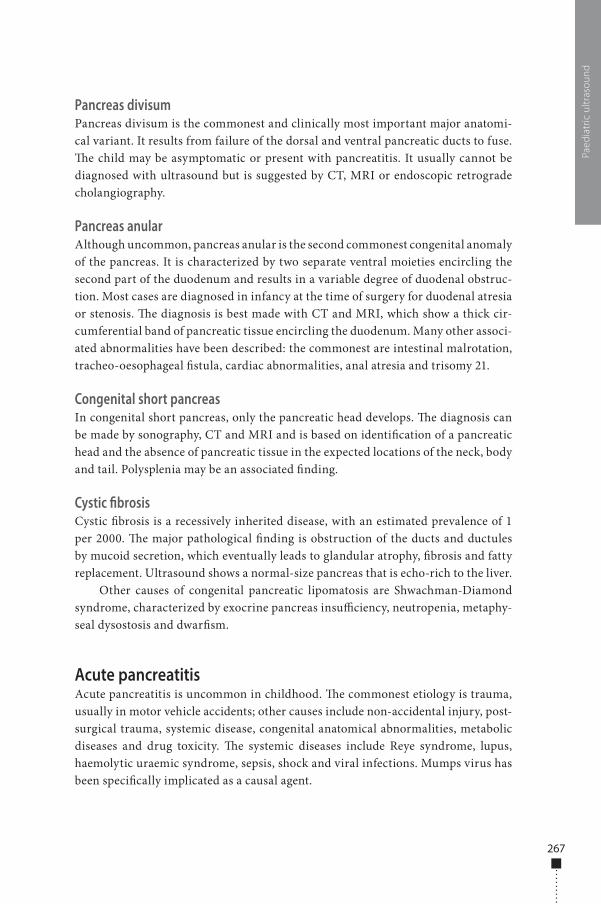
267
Pancreas divisumPancreas divisum is the commonest and clinically most important major anatomi-cal variant. It results from failure of the dorsal and ventral pancreatic ducts to fuse. �e child may be asymptomatic or present with pancreatitis. It usually cannot be diagnosed with ultrasound but is suggested by CT, MRI or endoscopic retrograde cholangiography.
Pancreas anularAlthough uncommon, pancreas anular is the second commonest congenital anomaly of the pancreas. It is characterized by two separate ventral moieties encircling the second part of the duodenum and results in a variable degree of duodenal obstruc-tion. Most cases are diagnosed in infancy at the time of surgery for duodenal atresia or stenosis. �e diagnosis is best made with CT and MRI, which show a thick cir-cumferential band of pancreatic tissue encircling the duodenum. Many other associ-ated abnormalities have been described: the commonest are intestinal malrotation, tracheo-oesophageal �stula, cardiac abnormalities, anal atresia and trisomy 21.
Congenital short pancreasIn congenital short pancreas, only the pancreatic head develops. �e diagnosis can be made by sonography, CT and MRI and is based on identi�cation of a pancreatic head and the absence of pancreatic tissue in the expected locations of the neck, body and tail. Polysplenia may be an associated �nding.
Cystic fibrosisCystic �brosis is a recessively inherited disease, with an estimated prevalence of 1 per 2000. �e major pathological �nding is obstruction of the ducts and ductules by mucoid secretion, which eventually leads to glandular atrophy, �brosis and fatty replacement. Ultrasound shows a normal-size pancreas that is echo-rich to the liver.
Other causes of congenital pancreatic lipomatosis are Shwachman-Diamond syndrome, characterized by exocrine pancreas insu�ciency, neutropenia, metaphy-seal dysostosis and dwar�sm.
Acute pancreatitisAcute pancreatitis is uncommon in childhood. �e commonest etiology is trauma, usually in motor vehicle accidents; other causes include non-accidental injury, post-surgical trauma, systemic disease, congenital anatomical abnormalities, metabolic diseases and drug toxicity. �e systemic diseases include Reye syndrome, lupus, haemolytic uraemic syndrome, sepsis, shock and viral infections. Mumps virus has been speci�cally implicated as a causal agent.
Paed
iatr
ic u
ltras
ound
978-9241548540-C005 PRF ml YVR ln ml ml-1-Final Proof.indd 267 6/10/13 10:31 AM
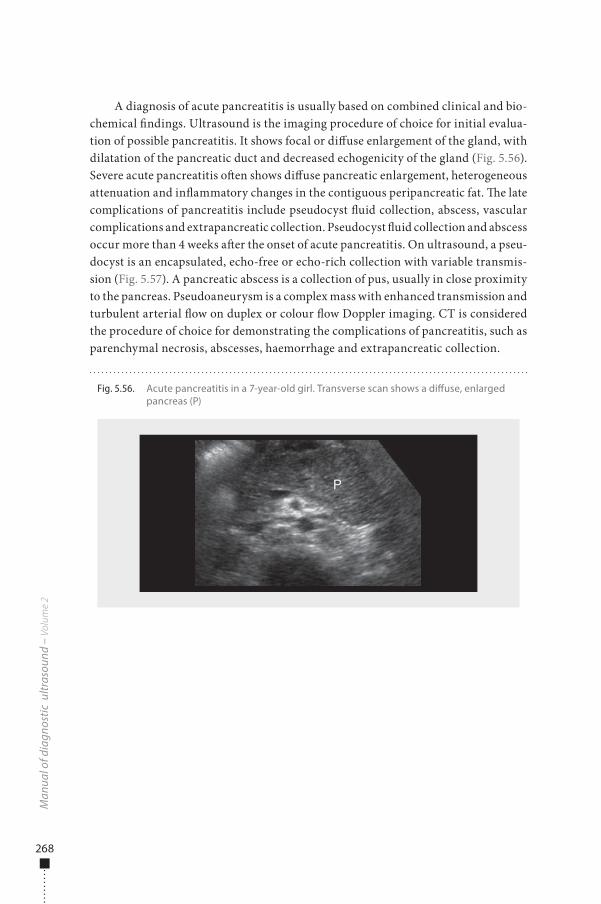
268
A diagnosis of acute pancreatitis is usually based on combined clinical and bio-chemical �ndings. Ultrasound is the imaging procedure of choice for initial evalua-tion of possible pancreatitis. It shows focal or di�use enlargement of the gland, with dilatation of the pancreatic duct and decreased echogenicity of the gland (Fig. 5.56). Severe acute pancreatitis o�en shows di�use pancreatic enlargement, heterogeneous attenuation and in�ammatory changes in the contiguous peripancreatic fat. �e late complications of pancreatitis include pseudocyst �uid collection, abscess, vascular complications and extrapancreatic collection. Pseudocyst �uid collection and abscess occur more than 4 weeks a�er the onset of acute pancreatitis. On ultrasound, a pseu-docyst is an encapsulated, echo-free or echo-rich collection with variable transmis-sion (Fig. 5.57). A pancreatic abscess is a collection of pus, usually in close proximity to the pancreas. Pseudoaneurysm is a complex mass with enhanced transmission and turbulent arterial �ow on duplex or colour �ow Doppler imaging. CT is considered the procedure of choice for demonstrating the complications of pancreatitis, such as parenchymal necrosis, abscesses, haemorrhage and extrapancreatic collection.
Man
ual o
f dia
gnos
tic u
ltras
ound
– V
olum
e 2
Fig. 5.56. Acute pancreatitis in a 7-year-old girl. Transverse scan shows a di�use, enlarged pancreas (P)
978-9241548540-C005 PRF ml YVR ln ml ml-1-Final Proof.indd 268 6/10/13 10:31 AM
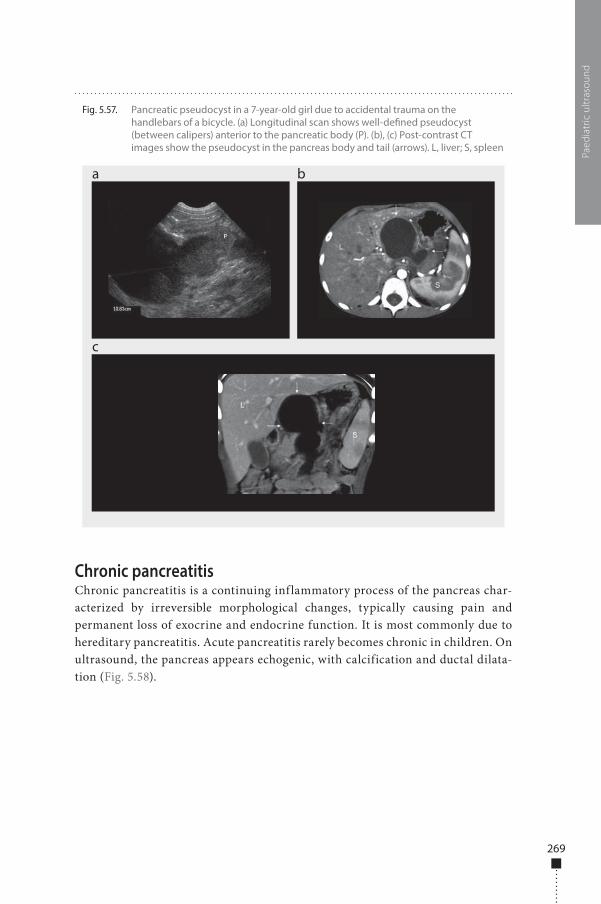
269
Chronic pancreatitisChronic pancreatitis is a continuing inf lammatory process of the pancreas char-acterized by irreversible morphological changes, typically causing pain and permanent loss of exocrine and endocrine function. It is most commonly due to hereditary pancreatitis. Acute pancreatitis rarely becomes chronic in children. On ultrasound, the pancreas appears echogenic, with calcification and ductal dilata-tion (Fig. 5.58).
Paed
iatr
ic u
ltras
ound
Fig. 5.57. Pancreatic pseudocyst in a 7-year-old girl due to accidental trauma on the handlebars of a bicycle. (a) Longitudinal scan shows well-de�ned pseudocyst (between calipers) anterior to the pancreatic body (P). (b), (c) Post-contrast CT images show the pseudocyst in the pancreas body and tail (arrows). L, liver; S, spleen
a
c
b
978-9241548540-C005 PRF ml YVR ln ml ml-1-Final Proof.indd 269 6/10/13 10:31 AM
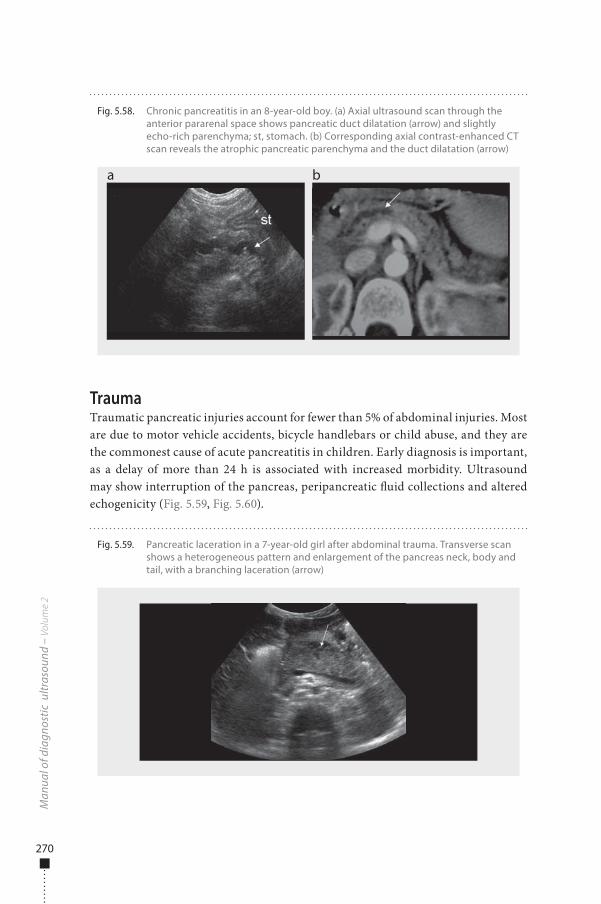
270
TraumaTraumatic pancreatic injuries account for fewer than 5% of abdominal injuries. Most are due to motor vehicle accidents, bicycle handlebars or child abuse, and they are the commonest cause of acute pancreatitis in children. Early diagnosis is important, as a delay of more than 24 h is associated with increased morbidity. Ultrasound may show interruption of the pancreas, peripancreatic �uid collections and altered echogenicity (Fig. 5.59, Fig. 5.60).
Man
ual o
f dia
gnos
tic u
ltras
ound
– V
olum
e 2
Fig. 5.58. Chronic pancreatitis in an 8-year-old boy. (a) Axial ultrasound scan through the anterior pararenal space shows pancreatic duct dilatation (arrow) and slightly echo-rich parenchyma; st, stomach. (b) Corresponding axial contrast-enhanced CT scan reveals the atrophic pancreatic parenchyma and the duct dilatation (arrow)
a b
Fig. 5.59. Pancreatic laceration in a 7-year-old girl after abdominal trauma. Transverse scan shows a heterogeneous pattern and enlargement of the pancreas neck, body and tail, with a branching laceration (arrow)
978-9241548540-C005 PRF ml YVR ln ml ml-1-Final Proof.indd 270 6/10/13 10:31 AM
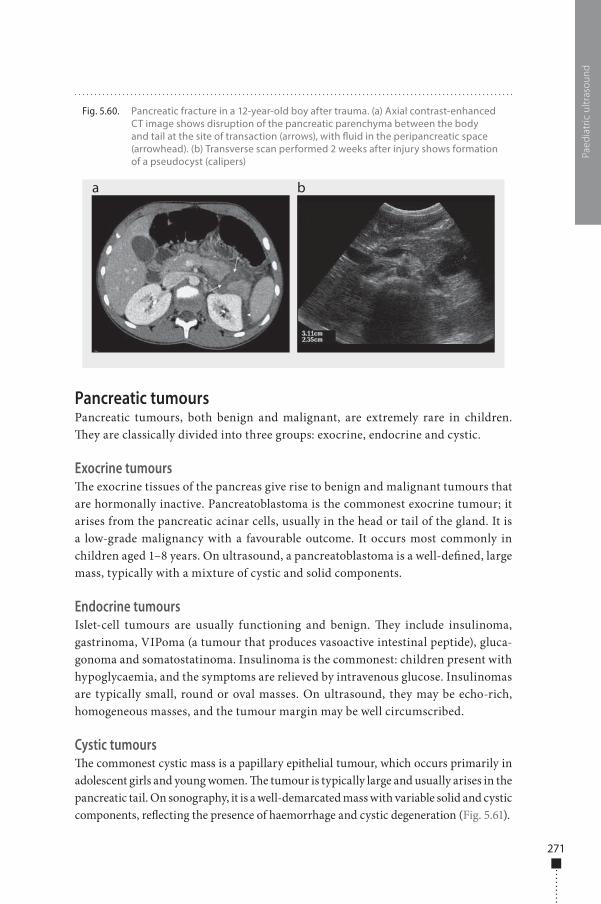
271
Pancreatic tumoursPancreatic tumours, both benign and malignant, are extremely rare in children. �ey are classically divided into three groups: exocrine, endocrine and cystic.
Exocrine tumours�e exocrine tissues of the pancreas give rise to benign and malignant tumours that are hormonally inactive. Pancreatoblastoma is the commonest exocrine tumour; it arises from the pancreatic acinar cells, usually in the head or tail of the gland. It is a low-grade malignancy with a favourable outcome. It occurs most commonly in children aged 1–8 years. On ultrasound, a pancreatoblastoma is a well-de�ned, large mass, typically with a mixture of cystic and solid components.
Endocrine tumoursIslet-cell tumours are usually functioning and benign. �ey include insulinoma, gastrinoma, VIPoma (a tumour that produces vasoactive intestinal peptide), gluca-gonoma and somatostatinoma. Insulinoma is the commonest: children present with hypoglycaemia, and the symptoms are relieved by intravenous glucose. Insulinomas are typically small, round or oval masses. On ultrasound, they may be echo-rich, homogeneous masses, and the tumour margin may be well circumscribed.
Cystic tumours�e commonest cystic mass is a papillary epithelial tumour, which occurs primarily in adolescent girls and young women. �e tumour is typically large and usually arises in the pancreatic tail. On sonography, it is a well-demarcated mass with variable solid and cystic components, re�ecting the presence of haemorrhage and cystic degeneration (Fig. 5.61).
Paed
iatr
ic u
ltras
ound
Fig. 5.60. Pancreatic fracture in a 12-year-old boy after trauma. (a) Axial contrast-enhanced CT image shows disruption of the pancreatic parenchyma between the body and tail at the site of transaction (arrows), with �uid in the peripancreatic space (arrowhead). (b) Transverse scan performed 2 weeks after injury shows formation of a pseudocyst (calipers)
a b
978-9241548540-C005 PRF ml YVR ln ml ml-1-Final Proof.indd 271 6/10/13 10:31 AM
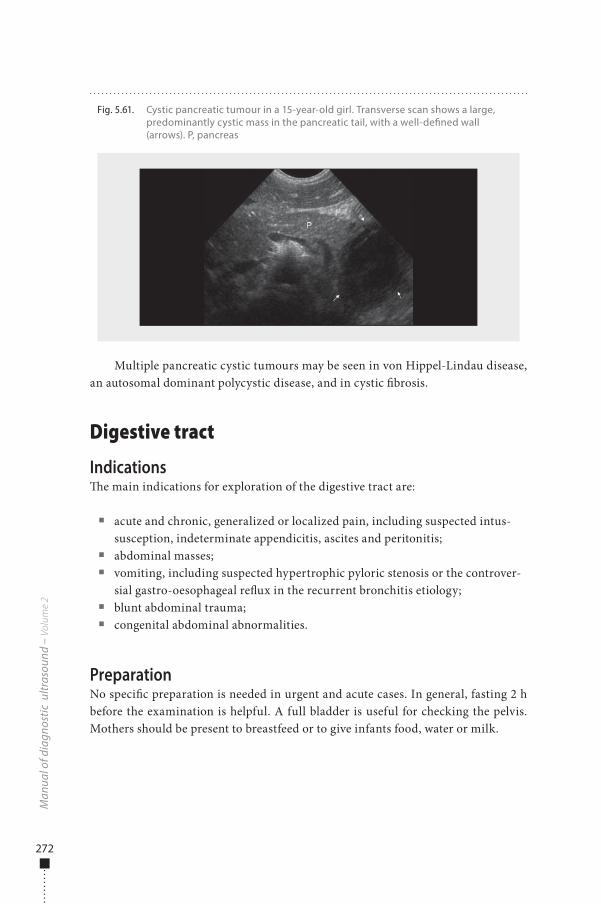
272
Multiple pancreatic cystic tumours may be seen in von Hippel-Lindau disease, an autosomal dominant polycystic disease, and in cystic �brosis.
Digestive tract
Indications�e main indications for exploration of the digestive tract are:
■ acute and chronic, generalized or localized pain, including suspected intus-susception, indeterminate appendicitis, ascites and peritonitis;
■ abdominal masses; ■ vomiting, including suspected hypertrophic pyloric stenosis or the controver-
sial gastro-oesophageal re�ux in the recurrent bronchitis etiology; ■ blunt abdominal trauma; ■ congenital abdominal abnormalities.
PreparationNo speci�c preparation is needed in urgent and acute cases. In general, fasting 2 h before the examination is helpful. A full bladder is useful for checking the pelvis. Mothers should be present to breastfeed or to give infants food, water or milk.
Man
ual o
f dia
gnos
tic u
ltras
ound
– V
olum
e 2
Fig. 5.61. Cystic pancreatic tumour in a 15-year-old girl. Transverse scan shows a large, predominantly cystic mass in the pancreatic tail, with a well-de�ned wall (arrows). P, pancreas
978-9241548540-C005 PRF ml YVR ln ml ml-1-Final Proof.indd 272 6/10/13 10:31 AM
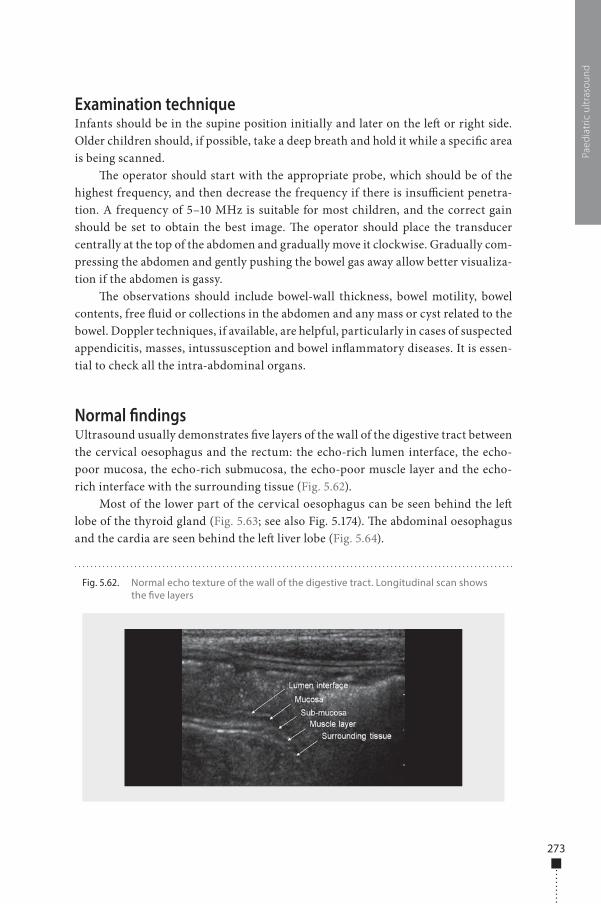
273
Examination techniqueInfants should be in the supine position initially and later on the le� or right side. Older children should, if possible, take a deep breath and hold it while a speci�c area is being scanned.
�e operator should start with the appropriate probe, which should be of the highest frequency, and then decrease the frequency if there is insu�cient penetra-tion. A frequency of 5–10 MHz is suitable for most children, and the correct gain should be set to obtain the best image. �e operator should place the transducer centrally at the top of the abdomen and gradually move it clockwise. Gradually com-pressing the abdomen and gently pushing the bowel gas away allow better visualiza-tion if the abdomen is gassy.
�e observations should include bowel-wall thickness, bowel motility, bowel contents, free �uid or collections in the abdomen and any mass or cyst related to the bowel. Doppler techniques, if available, are helpful, particularly in cases of suspected appendicitis, masses, intussusception and bowel in�ammatory diseases. It is essen-tial to check all the intra-abdominal organs.
Normal �ndingsUltrasound usually demonstrates �ve layers of the wall of the digestive tract between the cervical oesophagus and the rectum: the echo-rich lumen interface, the echo-poor mucosa, the echo-rich submucosa, the echo-poor muscle layer and the echo-rich interface with the surrounding tissue (Fig. 5.62).
Most of the lower part of the cervical oesophagus can be seen behind the le� lobe of the thyroid gland (Fig. 5.63; see also Fig. 5.174). �e abdominal oesophagus and the cardia are seen behind the le� liver lobe (Fig. 5.64).
Paed
iatr
ic u
ltras
ound
Fig. 5.62. Normal echo texture of the wall of the digestive tract. Longitudinal scan shows the �ve layers
978-9241548540-C005 PRF ml YVR ln ml ml-1-Final Proof.indd 273 6/10/13 10:31 AM
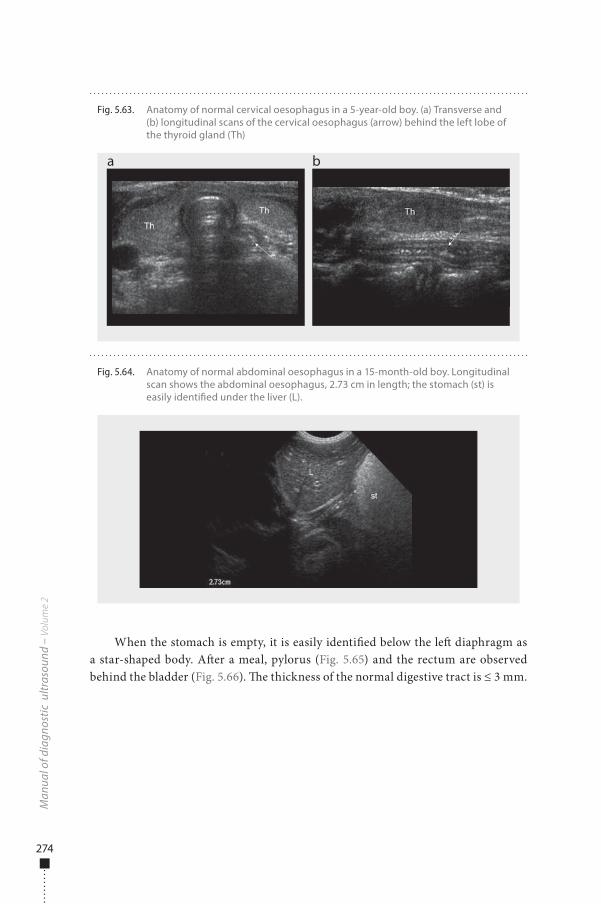
274
When the stomach is empty, it is easily identi�ed below the le� diaphragm as a star-shaped body. A�er a meal, pylorus (Fig. 5.65) and the rectum are observed behind the bladder (Fig. 5.66). �e thickness of the normal digestive tract is ≤ 3 mm.
Man
ual o
f dia
gnos
tic u
ltras
ound
– V
olum
e 2
Fig. 5.64. Anatomy of normal abdominal oesophagus in a 15-month-old boy. Longitudinal scan shows the abdominal oesophagus, 2.73 cm in length; the stomach (st) is easily identi�ed under the liver (L).
Fig. 5.63. Anatomy of normal cervical oesophagus in a 5-year-old boy. (a) Transverse and (b) longitudinal scans of the cervical oesophagus (arrow) behind the left lobe of the thyroid gland (Th)
a b
978-9241548540-C005 PRF ml YVR ln ml ml-1-Final Proof.indd 274 6/10/13 10:31 AM
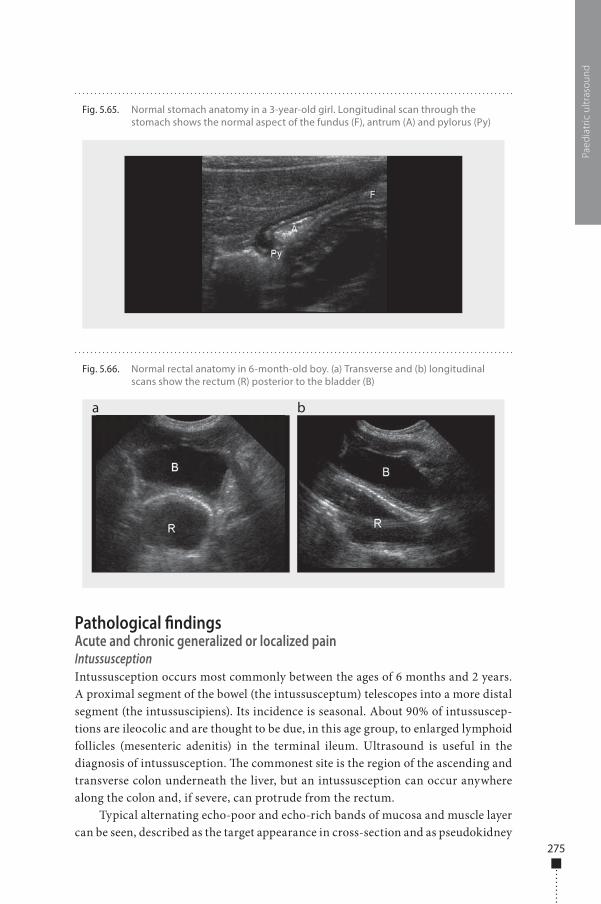
275
Pathological �ndingsAcute and chronic generalized or localized painIntussusceptionIntussusception occurs most commonly between the ages of 6 months and 2 years. A proximal segment of the bowel (the intussusceptum) telescopes into a more distal segment (the intussuscipiens). Its incidence is seasonal. About 90% of intussuscep-tions are ileocolic and are thought to be due, in this age group, to enlarged lymphoid follicles (mesenteric adenitis) in the terminal ileum. Ultrasound is useful in the diagnosis of intussusception. �e commonest site is the region of the ascending and transverse colon underneath the liver, but an intussusception can occur anywhere along the colon and, if severe, can protrude from the rectum.
Typical alternating echo-poor and echo-rich bands of mucosa and muscle layer can be seen, described as the target appearance in cross-section and as pseudokidney
Paed
iatr
ic u
ltras
ound
Fig. 5.65. Normal stomach anatomy in a 3-year-old girl. Longitudinal scan through the stomach shows the normal aspect of the fundus (F), antrum (A) and pylorus (Py)
Fig. 5.66. Normal rectal anatomy in 6-month-old boy. (a) Transverse and (b) longitudinal scans show the rectum (R) posterior to the bladder (B)
a b
978-9241548540-C005 PRF ml YVR ln ml ml-1-Final Proof.indd 275 6/10/13 10:31 AM
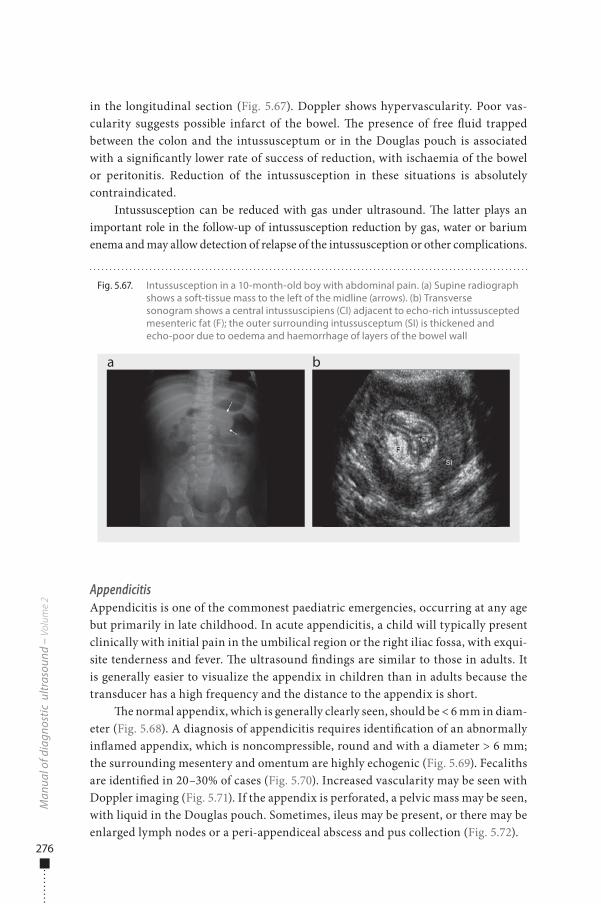
276
in the longitudinal section (Fig. 5.67). Doppler shows hypervascularity. Poor vas-cularity suggests possible infarct of the bowel. �e presence of free �uid trapped between the colon and the intussusceptum or in the Douglas pouch is associated with a signi�cantly lower rate of success of reduction, with ischaemia of the bowel or peritonitis. Reduction of the intussusception in these situations is absolutely contraindicated.
Intussusception can be reduced with gas under ultrasound. �e latter plays an important role in the follow-up of intussusception reduction by gas, water or barium enema and may allow detection of relapse of the intussusception or other complications.
AppendicitisAppendicitis is one of the commonest paediatric emergencies, occurring at any age but primarily in late childhood. In acute appendicitis, a child will typically present clinically with initial pain in the umbilical region or the right iliac fossa, with exqui-site tenderness and fever. �e ultrasound �ndings are similar to those in adults. It is generally easier to visualize the appendix in children than in adults because the transducer has a high frequency and the distance to the appendix is short.
�e normal appendix, which is generally clearly seen, should be < 6 mm in diam-eter (Fig. 5.68). A diagnosis of appendicitis requires identi�cation of an abnormally in�amed appendix, which is noncompressible, round and with a diameter > 6 mm; the surrounding mesentery and omentum are highly echogenic (Fig. 5.69). Fecaliths are identi�ed in 20–30% of cases (Fig. 5.70). Increased vascularity may be seen with Doppler imaging (Fig. 5.71). If the appendix is perforated, a pelvic mass may be seen, with liquid in the Douglas pouch. Sometimes, ileus may be present, or there may be enlarged lymph nodes or a peri-appendiceal abscess and pus collection (Fig. 5.72).
Man
ual o
f dia
gnos
tic u
ltras
ound
– V
olum
e 2
Fig. 5.67. Intussusception in a 10-month-old boy with abdominal pain. (a) Supine radiograph shows a soft-tissue mass to the left of the midline (arrows). (b) Transverse sonogram shows a central intussuscipiens (CI) adjacent to echo-rich intussuscepted mesenteric fat (F); the outer surrounding intussusceptum (SI) is thickened and echo-poor due to oedema and haemorrhage of layers of the bowel wall
a b
978-9241548540-C005 PRF ml YVR ln ml ml-1-Final Proof.indd 276 6/10/13 10:31 AM
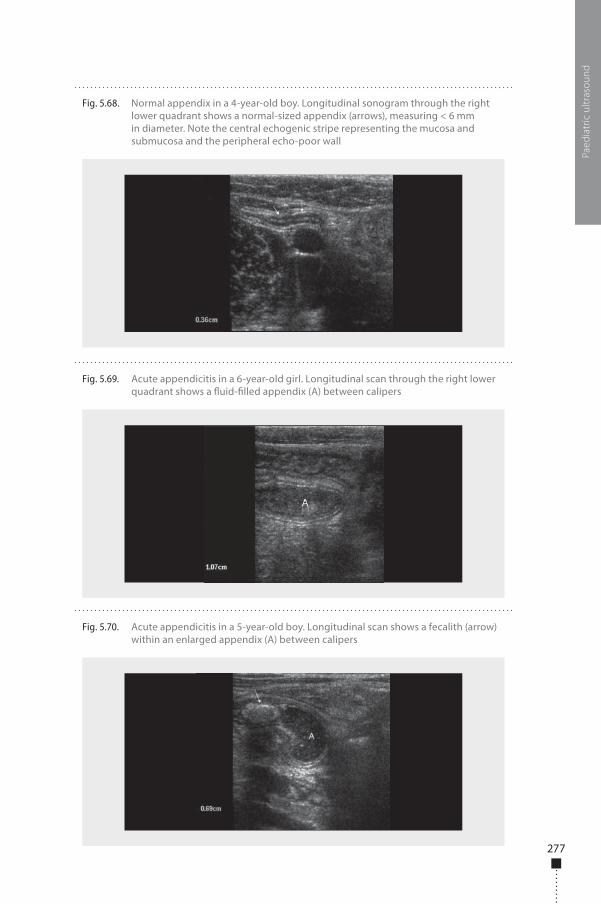
277
Paed
iatr
ic u
ltras
ound
Fig. 5.68. Normal appendix in a 4-year-old boy. Longitudinal sonogram through the right lower quadrant shows a normal-sized appendix (arrows), measuring < 6 mm in diameter. Note the central echogenic stripe representing the mucosa and submucosa and the peripheral echo-poor wall
Fig. 5.69. Acute appendicitis in a 6-year-old girl. Longitudinal scan through the right lower quadrant shows a �uid-�lled appendix (A) between calipers
Fig. 5.70. Acute appendicitis in a 5-year-old boy. Longitudinal scan shows a fecalith (arrow) within an enlarged appendix (A) between calipers
978-9241548540-C005 PRF ml YVR ln ml ml-1-Final Proof.indd 277 6/10/13 10:31 AM
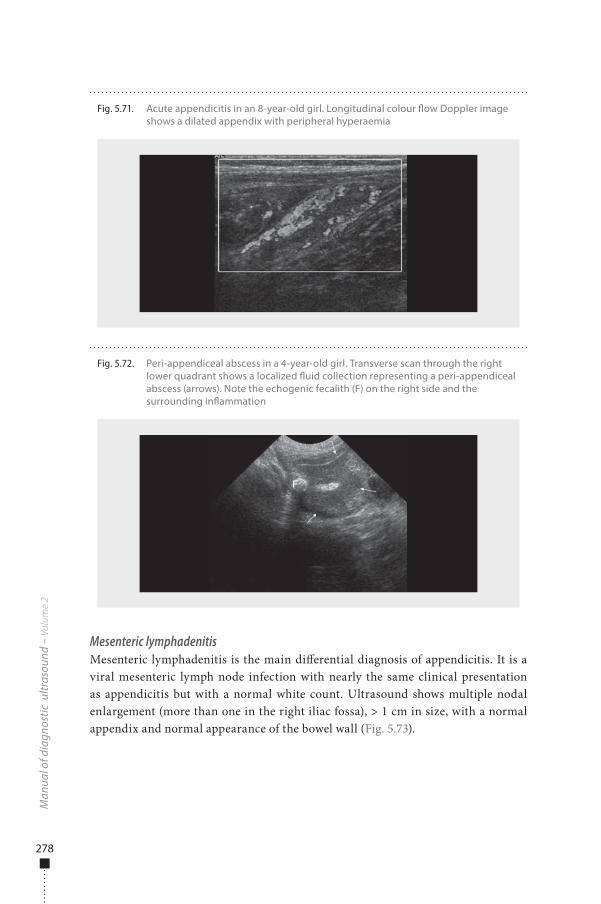
278
Mesenteric lymphadenitisMesenteric lymphadenitis is the main di�erential diagnosis of appendicitis. It is a viral mesenteric lymph node infection with nearly the same clinical presentation as appendicitis but with a normal white count. Ultrasound shows multiple nodal enlargement (more than one in the right iliac fossa), > 1 cm in size, with a normal appendix and normal appearance of the bowel wall (Fig. 5.73).
Man
ual o
f dia
gnos
tic u
ltras
ound
– V
olum
e 2
Fig. 5.72. Peri-appendiceal abscess in a 4-year-old girl. Transverse scan through the right lower quadrant shows a localized �uid collection representing a peri-appendiceal abscess (arrows). Note the echogenic fecalith (F) on the right side and the surrounding in�ammation
Fig. 5.71. Acute appendicitis in an 8-year-old girl. Longitudinal colour �ow Doppler image shows a dilated appendix with peripheral hyperaemia
978-9241548540-C005 PRF ml YVR ln ml ml-1-Final Proof.indd 278 6/10/13 10:31 AM
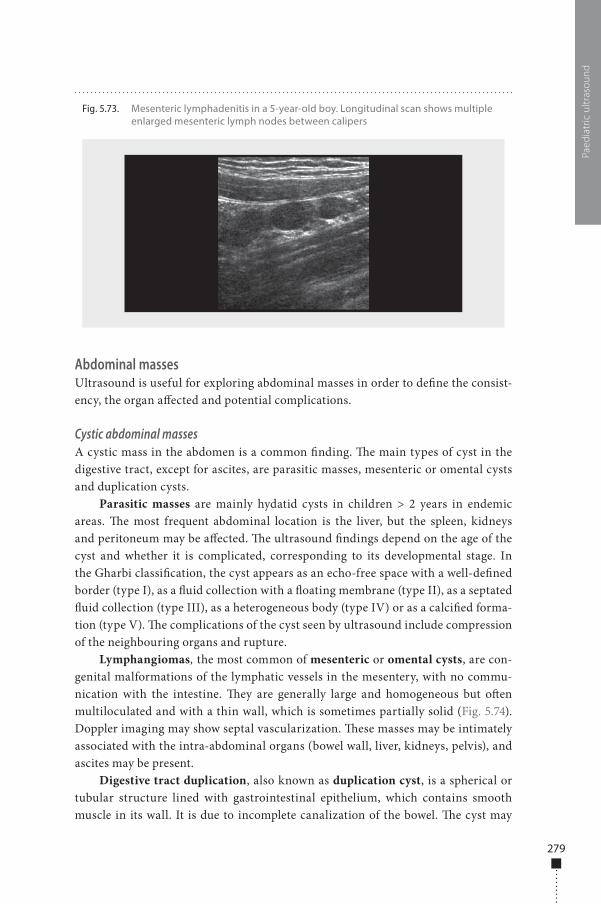
279
Abdominal massesUltrasound is useful for exploring abdominal masses in order to de�ne the consist-ency, the organ a�ected and potential complications.
Cystic abdominal massesA cystic mass in the abdomen is a common �nding. �e main types of cyst in the digestive tract, except for ascites, are parasitic masses, mesenteric or omental cysts and duplication cysts.
Parasitic masses are mainly hydatid cysts in children > 2 years in endemic areas. �e most frequent abdominal location is the liver, but the spleen, kidneys and peritoneum may be a�ected. �e ultrasound �ndings depend on the age of the cyst and whether it is complicated, corresponding to its developmental stage. In the Gharbi classi�cation, the cyst appears as an echo-free space with a well-de�ned border (type I), as a �uid collection with a �oating membrane (type II), as a septated �uid collection (type III), as a heterogeneous body (type IV) or as a calci�ed forma-tion (type V). �e complications of the cyst seen by ultrasound include compression of the neighbouring organs and rupture.
Lymphangiomas, the most common of mesenteric or omental cysts, are con-genital malformations of the lymphatic vessels in the mesentery, with no commu-nication with the intestine. �ey are generally large and homogeneous but o�en multiloculated and with a thin wall, which is sometimes partially solid (Fig. 5.74). Doppler imaging may show septal vascularization. �ese masses may be intimately associated with the intra-abdominal organs (bowel wall, liver, kidneys, pelvis), and ascites may be present.
Digestive tract duplication, also known as duplication cyst, is a spherical or tubular structure lined with gastrointestinal epithelium, which contains smooth muscle in its wall. It is due to incomplete canalization of the bowel. �e cyst may
Paed
iatr
ic u
ltras
ound
Fig. 5.73. Mesenteric lymphadenitis in a 5-year-old boy. Longitudinal scan shows multiple enlarged mesenteric lymph nodes between calipers
978-9241548540-C005 PRF ml YVR ln ml ml-1-Final Proof.indd 279 6/10/13 10:31 AM
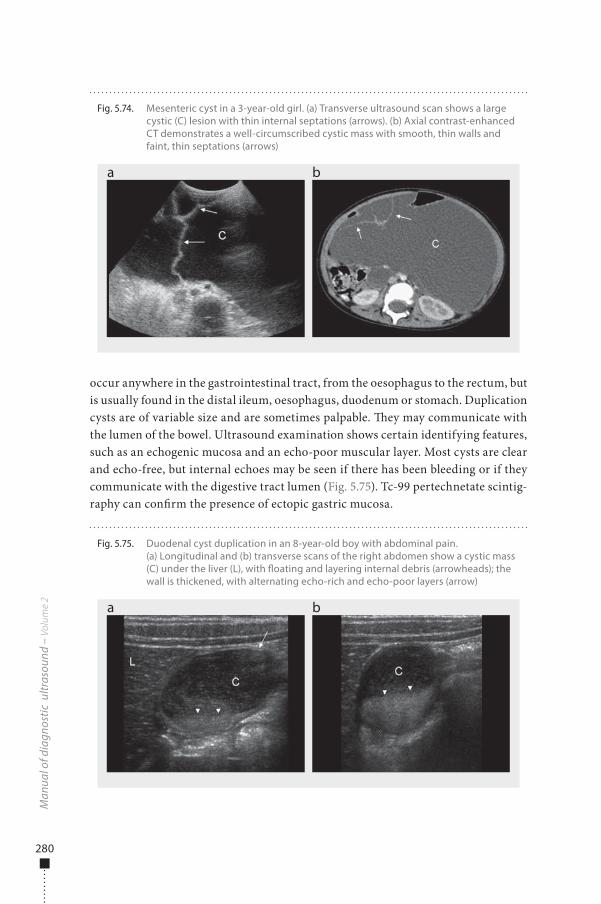
280
occur anywhere in the gastrointestinal tract, from the oesophagus to the rectum, but is usually found in the distal ileum, oesophagus, duodenum or stomach. Duplication cysts are of variable size and are sometimes palpable. �ey may communicate with the lumen of the bowel. Ultrasound examination shows certain identifying features, such as an echogenic mucosa and an echo-poor muscular layer. Most cysts are clear and echo-free, but internal echoes may be seen if there has been bleeding or if they communicate with the digestive tract lumen (Fig. 5.75). Tc-99 pertechnetate scintig-raphy can con�rm the presence of ectopic gastric mucosa.
Man
ual o
f dia
gnos
tic u
ltras
ound
– V
olum
e 2
Fig. 5.74. Mesenteric cyst in a 3-year-old girl. (a) Transverse ultrasound scan shows a large cystic (C) lesion with thin internal septations (arrows). (b) Axial contrast-enhanced CT demonstrates a well-circumscribed cystic mass with smooth, thin walls and faint, thin septations (arrows)
a b
Fig. 5.75. Duodenal cyst duplication in an 8-year-old boy with abdominal pain. (a) Longitudinal and (b) transverse scans of the right abdomen show a cystic mass (C) under the liver (L), with �oating and layering internal debris (arrowheads); the wall is thickened, with alternating echo-rich and echo-poor layers (arrow)
a b
978-9241548540-C005 PRF ml YVR ln ml ml-1-Final Proof.indd 280 6/10/13 10:31 AM
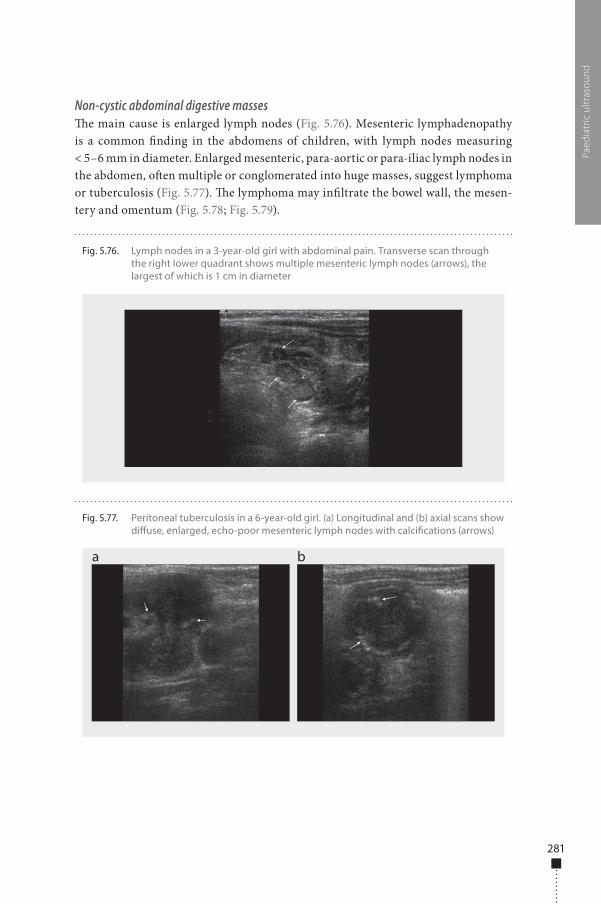
281
Non-cystic abdominal digestive masses�e main cause is enlarged lymph nodes (Fig. 5.76). Mesenteric lymphadenopathy is a common �nding in the abdomens of children, with lymph nodes measuring < 5–6 mm in diameter. Enlarged mesenteric, para-aortic or para-iliac lymph nodes in the abdomen, o�en multiple or conglomerated into huge masses, suggest lymphoma or tuberculosis (Fig. 5.77). �e lymphoma may in�ltrate the bowel wall, the mesen-tery and omentum (Fig. 5.78; Fig. 5.79).
Paed
iatr
ic u
ltras
ound
Fig. 5.77. Peritoneal tuberculosis in a 6-year-old girl. (a) Longitudinal and (b) axial scans show di�use, enlarged, echo-poor mesenteric lymph nodes with calci�cations (arrows)
a b
Fig. 5.76. Lymph nodes in a 3-year-old girl with abdominal pain. Transverse scan through the right lower quadrant shows multiple mesenteric lymph nodes (arrows), the largest of which is 1 cm in diameter
978-9241548540-C005 PRF ml YVR ln ml ml-1-Final Proof.indd 281 6/10/13 10:31 AM
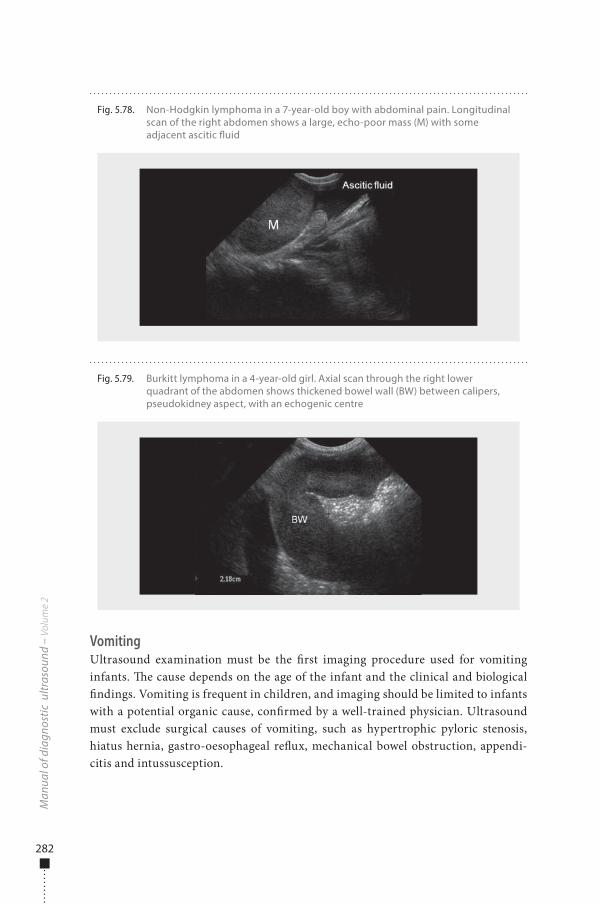
282
VomitingUltrasound examination must be the �rst imaging procedure used for vomiting infants. �e cause depends on the age of the infant and the clinical and biological �ndings. Vomiting is frequent in children, and imaging should be limited to infants with a potential organic cause, con�rmed by a well-trained physician. Ultrasound must exclude surgical causes of vomiting, such as hypertrophic pyloric stenosis, hiatus hernia, gastro-oesophageal re�ux, mechanical bowel obstruction, appendi-citis and intussusception.
Man
ual o
f dia
gnos
tic u
ltras
ound
– V
olum
e 2
Fig. 5.78. Non-Hodgkin lymphoma in a 7-year-old boy with abdominal pain. Longitudinal scan of the right abdomen shows a large, echo-poor mass (M) with some adjacent ascitic �uid
Fig. 5.79. Burkitt lymphoma in a 4-year-old girl. Axial scan through the right lower quadrant of the abdomen shows thickened bowel wall (BW) between calipers, pseudokidney aspect, with an echogenic centre
978-9241548540-C005 PRF ml YVR ln ml ml-1-Final Proof.indd 282 6/10/13 10:31 AM
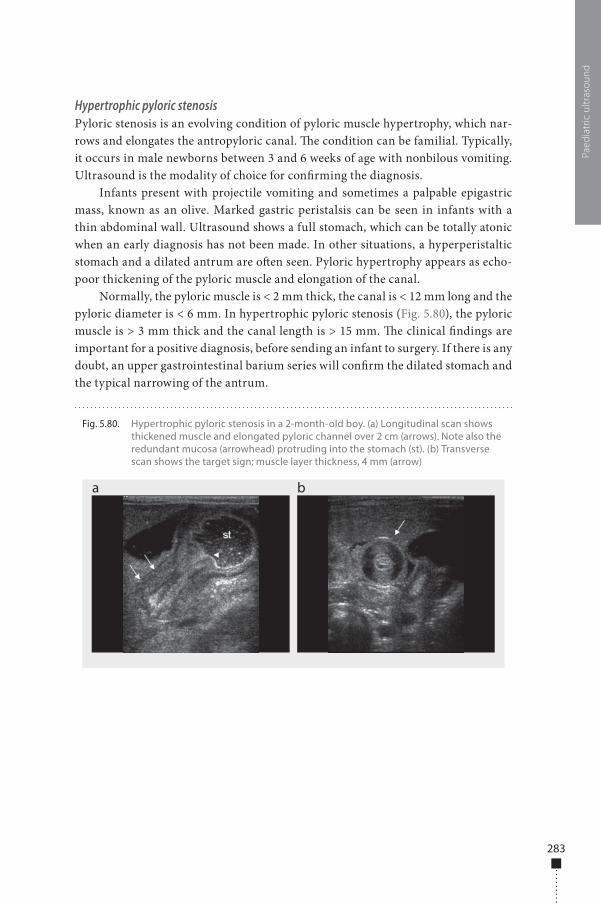
283
Hypertrophic pyloric stenosisPyloric stenosis is an evolving condition of pyloric muscle hypertrophy, which nar-rows and elongates the antropyloric canal. �e condition can be familial. Typically, it occurs in male newborns between 3 and 6 weeks of age with nonbilous vomiting. Ultrasound is the modality of choice for con�rming the diagnosis.
Infants present with projectile vomiting and sometimes a palpable epigastric mass, known as an olive. Marked gastric peristalsis can be seen in infants with a thin abdominal wall. Ultrasound shows a full stomach, which can be totally atonic when an early diagnosis has not been made. In other situations, a hyperperistaltic stomach and a dilated antrum are o�en seen. Pyloric hypertrophy appears as echo-poor thickening of the pyloric muscle and elongation of the canal.
Normally, the pyloric muscle is < 2 mm thick, the canal is < 12 mm long and the pyloric diameter is < 6 mm. In hypertrophic pyloric stenosis (Fig. 5.80), the pyloric muscle is > 3 mm thick and the canal length is > 15 mm. �e clinical �ndings are important for a positive diagnosis, before sending an infant to surgery. If there is any doubt, an upper gastrointestinal barium series will con�rm the dilated stomach and the typical narrowing of the antrum.
Paed
iatr
ic u
ltras
ound
Fig. 5.80. Hypertrophic pyloric stenosis in a 2-month-old boy. (a) Longitudinal scan shows thickened muscle and elongated pyloric channel over 2 cm (arrows). Note also the redundant mucosa (arrowhead) protruding into the stomach (st). (b) Transverse scan shows the target sign; muscle layer thickness, 4 mm (arrow)
a b
978-9241548540-C005 PRF ml YVR ln ml ml-1-Final Proof.indd 283 6/10/13 10:31 AM
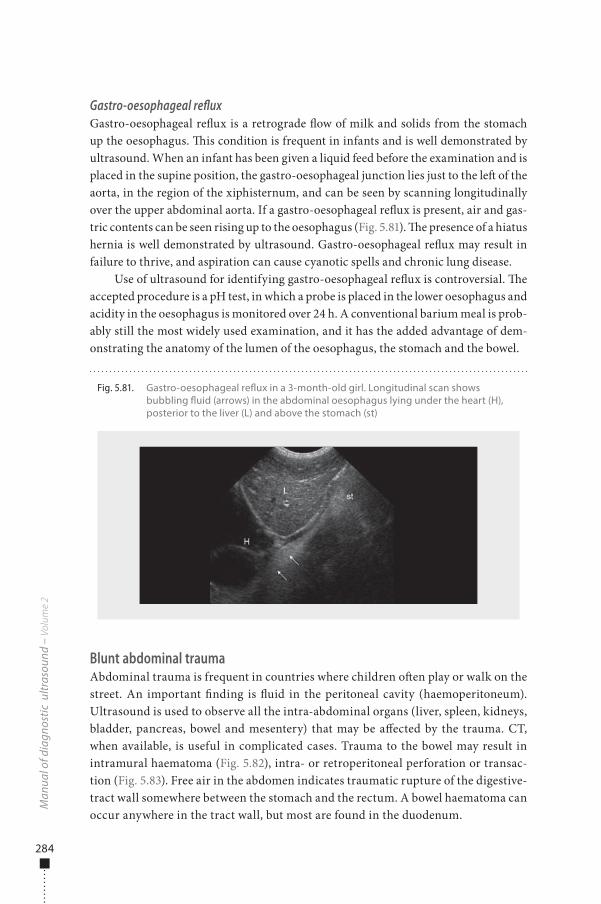
284
Gastro-oesophageal refluxGastro-oesophageal re�ux is a retrograde �ow of milk and solids from the stomach up the oesophagus. �is condition is frequent in infants and is well demonstrated by ultrasound. When an infant has been given a liquid feed before the examination and is placed in the supine position, the gastro-oesophageal junction lies just to the le� of the aorta, in the region of the xiphisternum, and can be seen by scanning longitudinally over the upper abdominal aorta. If a gastro-oesophageal re�ux is present, air and gas-tric contents can be seen rising up to the oesophagus (Fig. 5.81). �e presence of a hiatus hernia is well demonstrated by ultrasound. Gastro-oesophageal re�ux may result in failure to thrive, and aspiration can cause cyanotic spells and chronic lung disease.
Use of ultrasound for identifying gastro-oesophageal re�ux is controversial. �e accepted procedure is a pH test, in which a probe is placed in the lower oesophagus and acidity in the oesophagus is monitored over 24 h. A conventional barium meal is prob-ably still the most widely used examination, and it has the added advantage of dem-onstrating the anatomy of the lumen of the oesophagus, the stomach and the bowel.
Blunt abdominal traumaAbdominal trauma is frequent in countries where children o�en play or walk on the street. An important �nding is �uid in the peritoneal cavity (haemoperitoneum). Ultrasound is used to observe all the intra-abdominal organs (liver, spleen, kidneys, bladder, pancreas, bowel and mesentery) that may be a�ected by the trauma. CT, when available, is useful in complicated cases. Trauma to the bowel may result in intramural haematoma (Fig. 5.82), intra- or retroperitoneal perforation or transac-tion (Fig. 5.83). Free air in the abdomen indicates traumatic rupture of the digestive-tract wall somewhere between the stomach and the rectum. A bowel haematoma can occur anywhere in the tract wall, but most are found in the duodenum.
Man
ual o
f dia
gnos
tic u
ltras
ound
– V
olum
e 2
Fig. 5.81. Gastro-oesophageal re�ux in a 3-month-old girl. Longitudinal scan shows bubbling �uid (arrows) in the abdominal oesophagus lying under the heart (H), posterior to the liver (L) and above the stomach (st)
978-9241548540-C005 PRF ml YVR ln ml ml-1-Final Proof.indd 284 6/10/13 10:31 AM
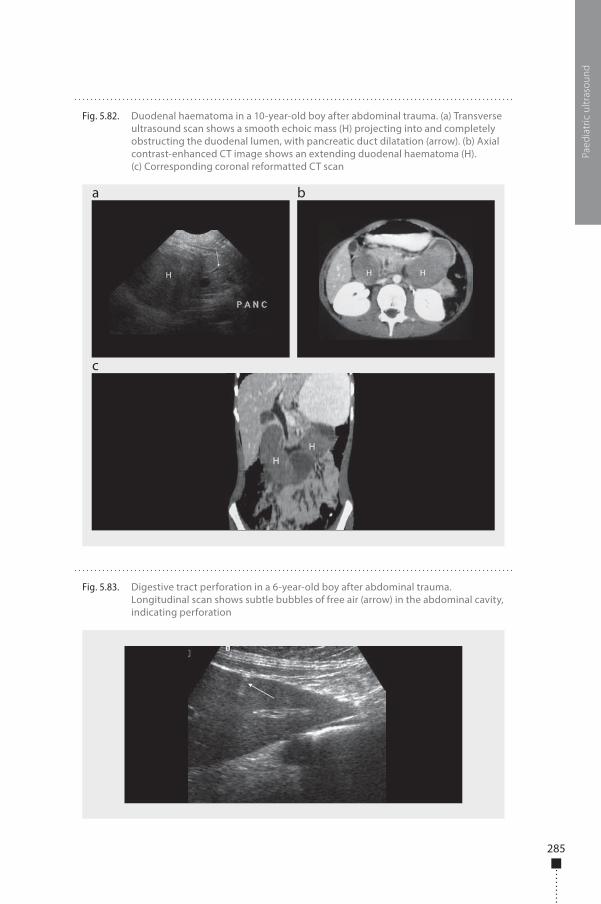
285
Paed
iatr
ic u
ltras
ound
Fig. 5.82. Duodenal haematoma in a 10-year-old boy after abdominal trauma. (a) Transverse ultrasound scan shows a smooth echoic mass (H) projecting into and completely obstructing the duodenal lumen, with pancreatic duct dilatation (arrow). (b) Axial contrast-enhanced CT image shows an extending duodenal haematoma (H). (c) Corresponding coronal reformatted CT scan
a
c
b
Fig. 5.83. Digestive tract perforation in a 6-year-old boy after abdominal trauma. Longitudinal scan shows subtle bubbles of free air (arrow) in the abdominal cavity, indicating perforation
978-9241548540-C005 PRF ml YVR ln ml ml-1-Final Proof.indd 285 6/10/13 10:31 AM
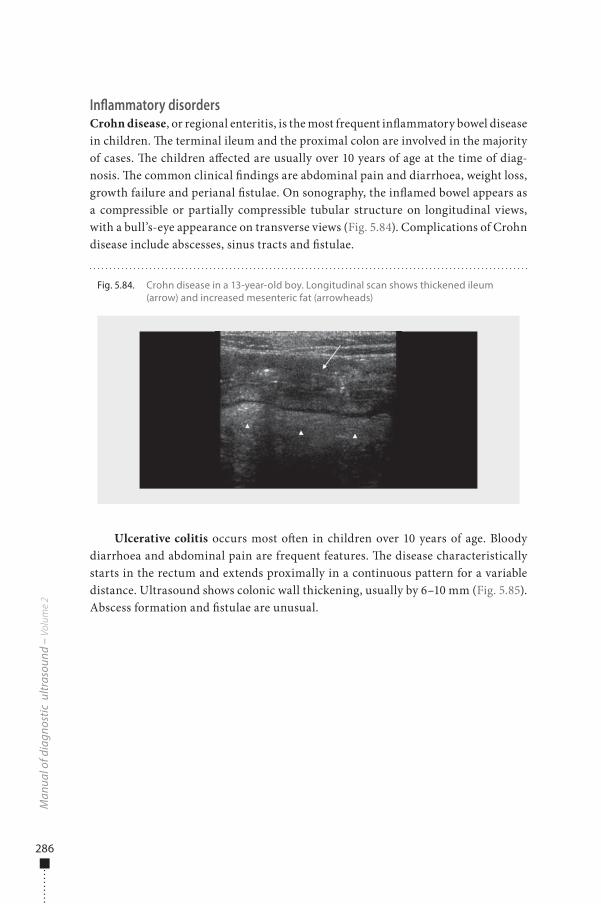
286
Inflammatory disordersCrohn disease, or regional enteritis, is the most frequent in�ammatory bowel disease in children. �e terminal ileum and the proximal colon are involved in the majority of cases. �e children a�ected are usually over 10 years of age at the time of diag-nosis. �e common clinical �ndings are abdominal pain and diarrhoea, weight loss, growth failure and perianal �stulae. On sonography, the in�amed bowel appears as a compressible or partially compressible tubular structure on longitudinal views, with a bull’s-eye appearance on transverse views (Fig. 5.84). Complications of Crohn disease include abscesses, sinus tracts and �stulae.
Ulcerative colitis occurs most o�en in children over 10 years of age. Bloody diarrhoea and abdominal pain are frequent features. �e disease characteristically starts in the rectum and extends proximally in a continuous pattern for a variable distance. Ultrasound shows colonic wall thickening, usually by 6–10 mm (Fig. 5.85). Abscess formation and �stulae are unusual.
Man
ual o
f dia
gnos
tic u
ltras
ound
– V
olum
e 2
Fig. 5.84. Crohn disease in a 13-year-old boy. Longitudinal scan shows thickened ileum (arrow) and increased mesenteric fat (arrowheads)
978-9241548540-C005 PRF ml YVR ln ml ml-1-Final Proof.indd 286 6/10/13 10:31 AM
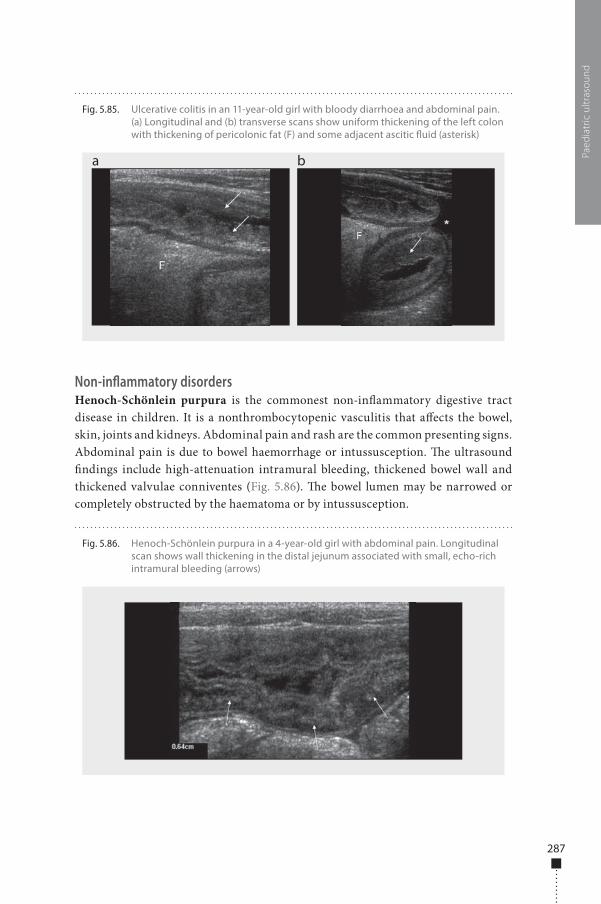
287
Non-inflammatory disordersHenoch-Schönlein purpura is the commonest non-in�ammatory digestive tract disease in children. It is a nonthrombocytopenic vasculitis that a�ects the bowel, skin, joints and kidneys. Abdominal pain and rash are the common presenting signs. Abdominal pain is due to bowel haemorrhage or intussusception. �e ultrasound �ndings include high-attenuation intramural bleeding, thickened bowel wall and thickened valvulae conniventes (Fig. 5.86). �e bowel lumen may be narrowed or completely obstructed by the haematoma or by intussusception.
Paed
iatr
ic u
ltras
ound
Fig. 5.85. Ulcerative colitis in an 11-year-old girl with bloody diarrhoea and abdominal pain. (a) Longitudinal and (b) transverse scans show uniform thickening of the left colon with thickening of pericolonic fat (F) and some adjacent ascitic �uid (asterisk)
a b
Fig. 5.86. Henoch-Schönlein purpura in a 4-year-old girl with abdominal pain. Longitudinal scan shows wall thickening in the distal jejunum associated with small, echo-rich intramural bleeding (arrows)
978-9241548540-C005 PRF ml YVR ln ml ml-1-Final Proof.indd 287 6/10/13 10:31 AM
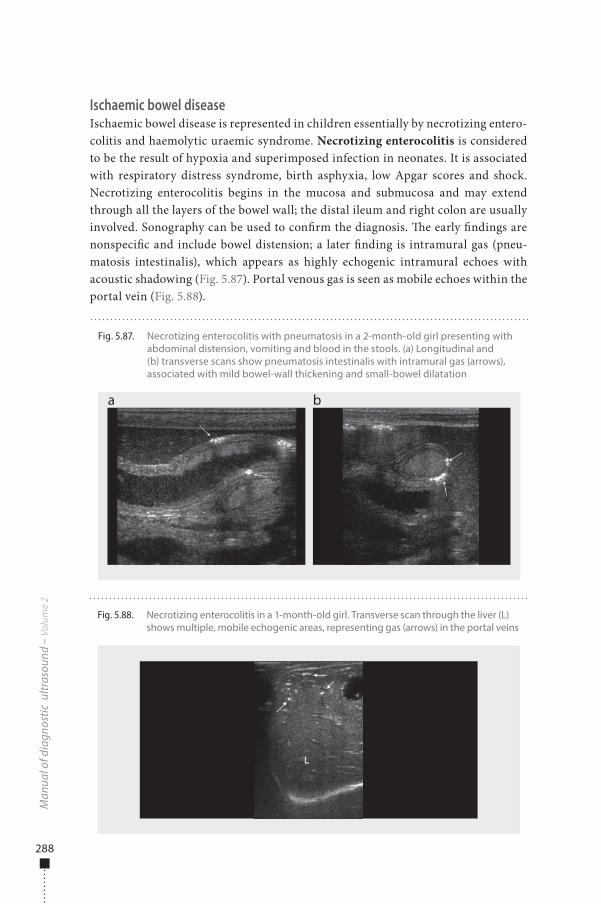
288
Ischaemic bowel diseaseIschaemic bowel disease is represented in children essentially by necrotizing entero-colitis and haemolytic uraemic syndrome. Necrotizing enterocolitis is considered to be the result of hypoxia and superimposed infection in neonates. It is associated with respiratory distress syndrome, birth asphyxia, low Apgar scores and shock. Necrotizing enterocolitis begins in the mucosa and submucosa and may extend through all the layers of the bowel wall; the distal ileum and right colon are usually involved. Sonography can be used to con�rm the diagnosis. �e early �ndings are nonspeci�c and include bowel distension; a later �nding is intramural gas (pneu-matosis intestinalis), which appears as highly echogenic intramural echoes with acoustic shadowing (Fig. 5.87). Portal venous gas is seen as mobile echoes within the portal vein (Fig. 5.88).
Man
ual o
f dia
gnos
tic u
ltras
ound
– V
olum
e 2
Fig. 5.87. Necrotizing enterocolitis with pneumatosis in a 2-month-old girl presenting with abdominal distension, vomiting and blood in the stools. (a) Longitudinal and (b) transverse scans show pneumatosis intestinalis with intramural gas (arrows), associated with mild bowel-wall thickening and small-bowel dilatation
a b
Fig. 5.88. Necrotizing enterocolitis in a 1-month-old girl. Transverse scan through the liver (L) shows multiple, mobile echogenic areas, representing gas (arrows) in the portal veins
978-9241548540-C005 PRF ml YVR ln ml ml-1-Final Proof.indd 288 6/10/13 10:31 AM
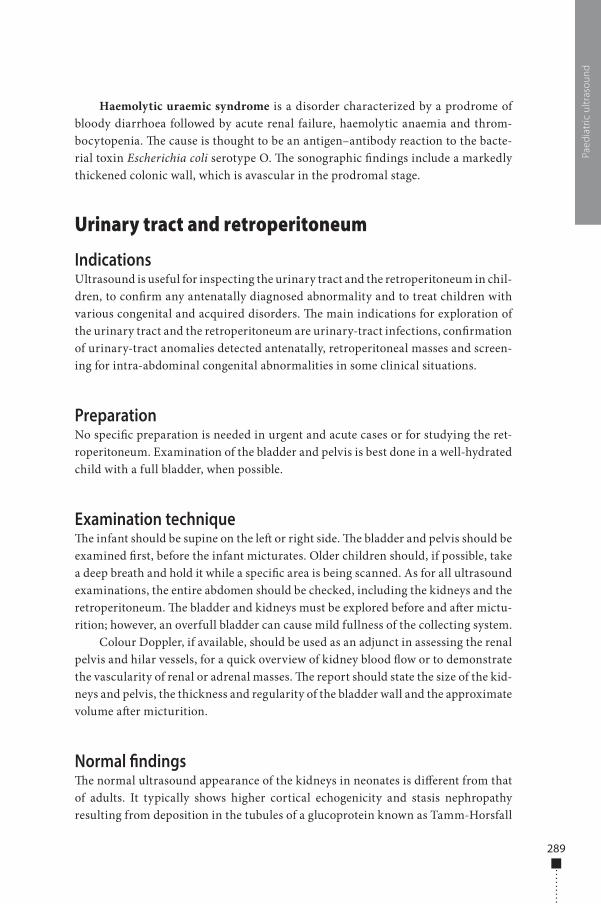
289
Haemolytic uraemic syndrome is a disorder characterized by a prodrome of bloody diarrhoea followed by acute renal failure, haemolytic anaemia and throm-bocytopenia. �e cause is thought to be an antigen–antibody reaction to the bacte-rial toxin Escherichia coli serotype O. �e sonographic �ndings include a markedly thickened colonic wall, which is avascular in the prodromal stage.
Urinary tract and retroperitoneum
IndicationsUltrasound is useful for inspecting the urinary tract and the retroperitoneum in chil-dren, to con�rm any antenatally diagnosed abnormality and to treat children with various congenital and acquired disorders. �e main indications for exploration of the urinary tract and the retroperitoneum are urinary-tract infections, con�rmation of urinary-tract anomalies detected antenatally, retroperitoneal masses and screen-ing for intra-abdominal congenital abnormalities in some clinical situations.
PreparationNo speci�c preparation is needed in urgent and acute cases or for studying the ret-roperitoneum. Examination of the bladder and pelvis is best done in a well-hydrated child with a full bladder, when possible.
Examination technique�e infant should be supine on the le� or right side. �e bladder and pelvis should be examined �rst, before the infant micturates. Older children should, if possible, take a deep breath and hold it while a speci�c area is being scanned. As for all ultrasound examinations, the entire abdomen should be checked, including the kidneys and the retroperitoneum. �e bladder and kidneys must be explored before and a�er mictu-rition; however, an overfull bladder can cause mild fullness of the collecting system.
Colour Doppler, if available, should be used as an adjunct in assessing the renal pelvis and hilar vessels, for a quick overview of kidney blood �ow or to demonstrate the vascularity of renal or adrenal masses. �e report should state the size of the kid-neys and pelvis, the thickness and regularity of the bladder wall and the approximate volume a�er micturition.
Normal �ndings�e normal ultrasound appearance of the kidneys in neonates is di�erent from that of adults. It typically shows higher cortical echogenicity and stasis nephropathy resulting from deposition in the tubules of a glucoprotein known as Tamm-Horsfall
Paed
iatr
ic u
ltras
ound
978-9241548540-C005 PRF ml YVR ln ml ml-1-Final Proof.indd 289 6/10/13 10:31 AM
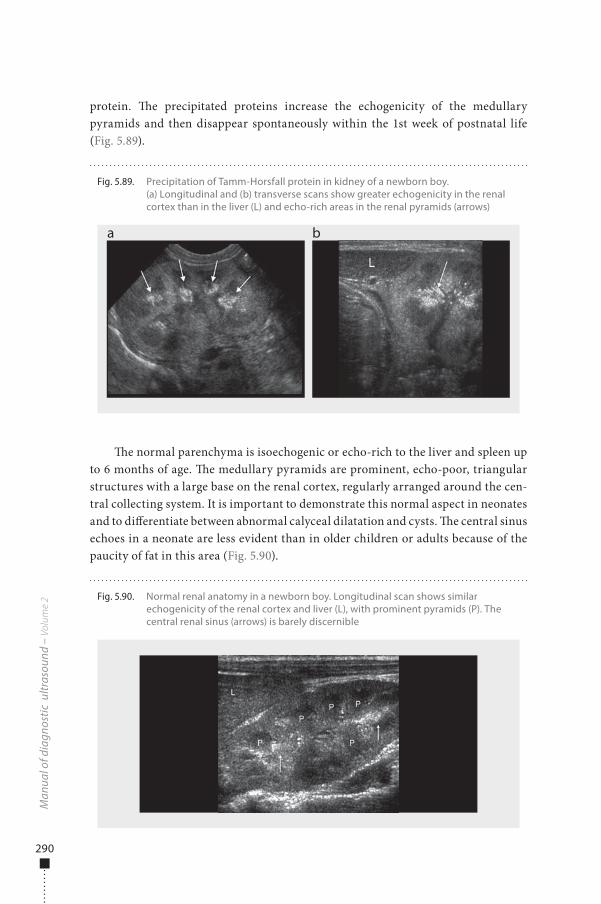
290
protein. �e precipitated proteins increase the echogenicity of the medullary pyramids and then disappear spontaneously within the 1st week of postnatal life (Fig. 5.89).
�e normal parenchyma is isoechogenic or echo-rich to the liver and spleen up to 6 months of age. �e medullary pyramids are prominent, echo-poor, triangular structures with a large base on the renal cortex, regularly arranged around the cen-tral collecting system. It is important to demonstrate this normal aspect in neonates and to di�erentiate between abnormal calyceal dilatation and cysts. �e central sinus echoes in a neonate are less evident than in older children or adults because of the paucity of fat in this area (Fig. 5.90).
Man
ual o
f dia
gnos
tic u
ltras
ound
– V
olum
e 2
Fig. 5.89. Precipitation of Tamm-Horsfall protein in kidney of a newborn boy. (a) Longitudinal and (b) transverse scans show greater echogenicity in the renal cortex than in the liver (L) and echo-rich areas in the renal pyramids (arrows)
a b
Fig. 5.90. Normal renal anatomy in a newborn boy. Longitudinal scan shows similar echogenicity of the renal cortex and liver (L), with prominent pyramids (P). The central renal sinus (arrows) is barely discernible
978-9241548540-C005 PRF ml YVR ln ml ml-1-Final Proof.indd 290 6/10/13 10:31 AM
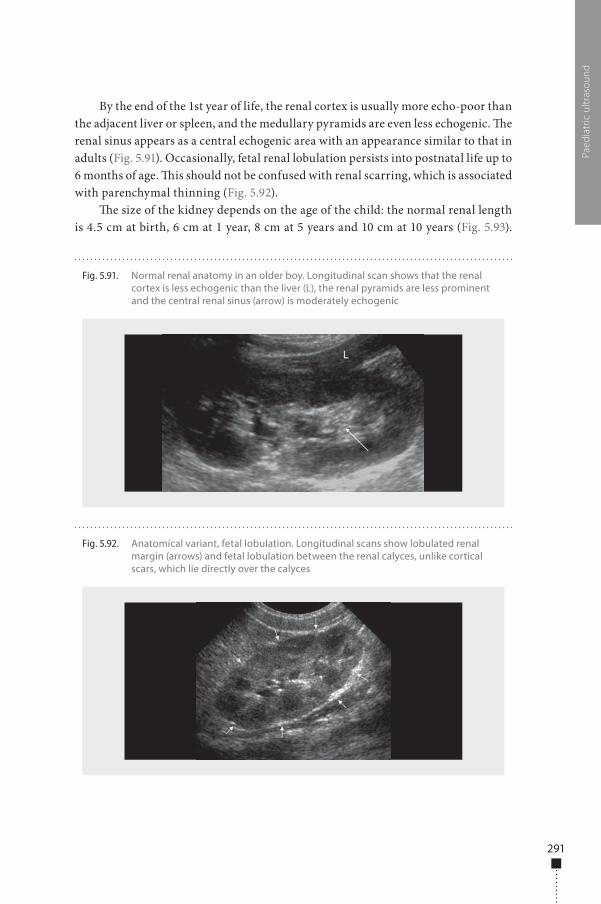
291
By the end of the 1st year of life, the renal cortex is usually more echo-poor than the adjacent liver or spleen, and the medullary pyramids are even less echogenic. �e renal sinus appears as a central echogenic area with an appearance similar to that in adults (Fig. 5.91). Occasionally, fetal renal lobulation persists into postnatal life up to 6 months of age. �is should not be confused with renal scarring, which is associated with parenchymal thinning (Fig. 5.92).
�e size of the kidney depends on the age of the child: the normal renal length is 4.5 cm at birth, 6 cm at 1 year, 8 cm at 5 years and 10 cm at 10 years (Fig. 5.93).
Paed
iatr
ic u
ltras
ound
Fig. 5.92. Anatomical variant, fetal lobulation. Longitudinal scans show lobulated renal margin (arrows) and fetal lobulation between the renal calyces, unlike cortical scars, which lie directly over the calyces
Fig. 5.91. Normal renal anatomy in an older boy. Longitudinal scan shows that the renal cortex is less echogenic than the liver (L), the renal pyramids are less prominent and the central renal sinus (arrow) is moderately echogenic
978-9241548540-C005 PRF ml YVR ln ml ml-1-Final Proof.indd 291 6/10/13 10:31 AM
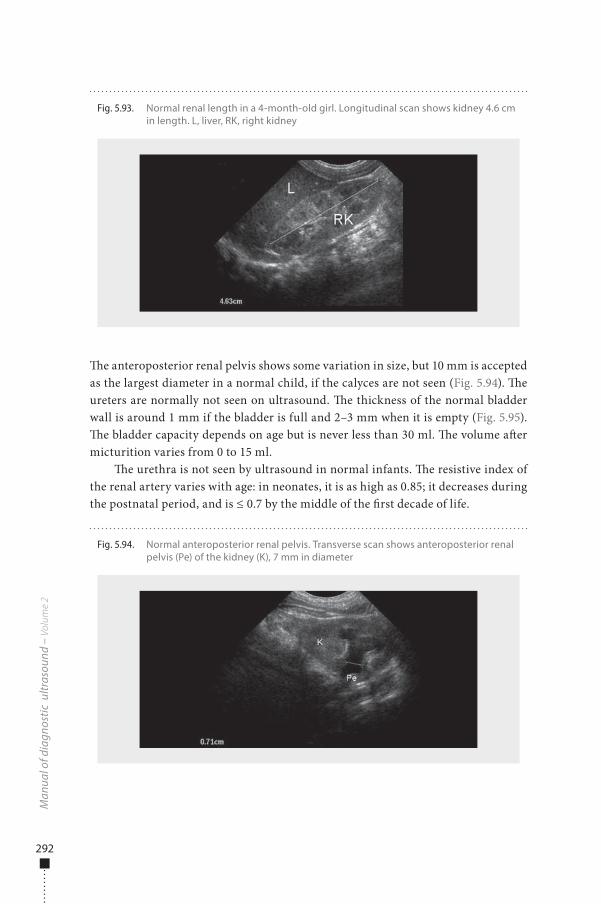
292
�e anteroposterior renal pelvis shows some variation in size, but 10 mm is accepted as the largest diameter in a normal child, if the calyces are not seen (Fig. 5.94). �e ureters are normally not seen on ultrasound. �e thickness of the normal bladder wall is around 1 mm if the bladder is full and 2–3 mm when it is empty (Fig. 5.95). �e bladder capacity depends on age but is never less than 30 ml. �e volume a�er micturition varies from 0 to 15 ml.
�e urethra is not seen by ultrasound in normal infants. �e resistive index of the renal artery varies with age: in neonates, it is as high as 0.85; it decreases during the postnatal period, and is ≤ 0.7 by the middle of the �rst decade of life.
Man
ual o
f dia
gnos
tic u
ltras
ound
– V
olum
e 2
Fig. 5.93. Normal renal length in a 4-month-old girl. Longitudinal scan shows kidney 4.6 cm in length. L, liver, RK, right kidney
Fig. 5.94. Normal anteroposterior renal pelvis. Transverse scan shows anteroposterior renal pelvis (Pe) of the kidney (K), 7 mm in diameter
978-9241548540-C005 PRF ml YVR ln ml ml-1-Final Proof.indd 292 6/10/13 10:31 AM
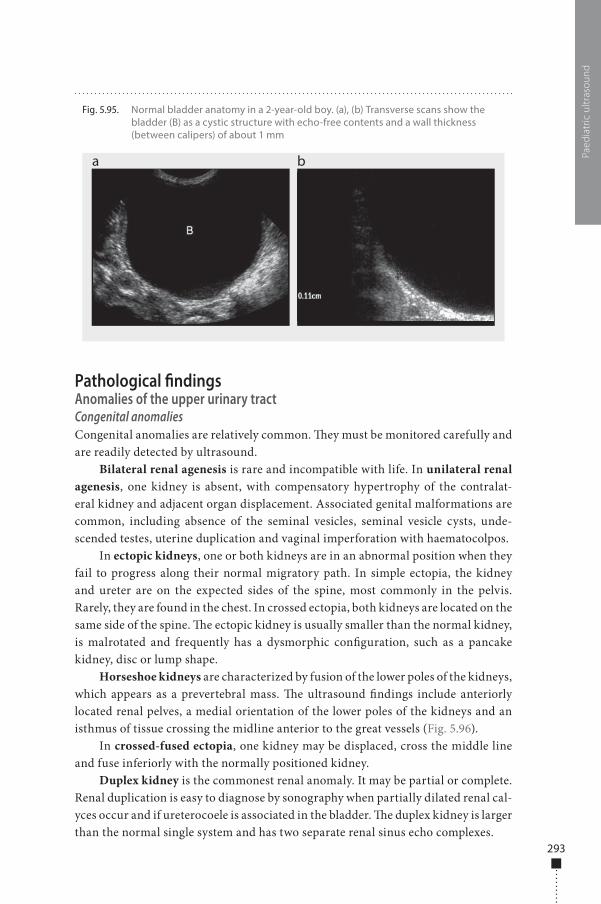
293
Pathological �ndingsAnomalies of the upper urinary tractCongenital anomaliesCongenital anomalies are relatively common. �ey must be monitored carefully and are readily detected by ultrasound.
Bilateral renal agenesis is rare and incompatible with life. In unilateral renal agenesis, one kidney is absent, with compensatory hypertrophy of the contralat-eral kidney and adjacent organ displacement. Associated genital malformations are common, including absence of the seminal vesicles, seminal vesicle cysts, unde-scended testes, uterine duplication and vaginal imperforation with haematocolpos.
In ectopic kidneys, one or both kidneys are in an abnormal position when they fail to progress along their normal migratory path. In simple ectopia, the kidney and ureter are on the expected sides of the spine, most commonly in the pelvis. Rarely, they are found in the chest. In crossed ectopia, both kidneys are located on the same side of the spine. �e ectopic kidney is usually smaller than the normal kidney, is malrotated and frequently has a dysmorphic con�guration, such as a pancake kidney, disc or lump shape.
Horseshoe kidneys are characterized by fusion of the lower poles of the kidneys, which appears as a prevertebral mass. �e ultrasound �ndings include anteriorly located renal pelves, a medial orientation of the lower poles of the kidneys and an isthmus of tissue crossing the midline anterior to the great vessels (Fig. 5.96).
In crossed-fused ectopia, one kidney may be displaced, cross the middle line and fuse inferiorly with the normally positioned kidney.
Duplex kidney is the commonest renal anomaly. It may be partial or complete. Renal duplication is easy to diagnose by sonography when partially dilated renal cal-yces occur and if ureterocoele is associated in the bladder. �e duplex kidney is larger than the normal single system and has two separate renal sinus echo complexes.
Paed
iatr
ic u
ltras
ound
Fig. 5.95. Normal bladder anatomy in a 2-year-old boy. (a), (b) Transverse scans show the bladder (B) as a cystic structure with echo-free contents and a wall thickness (between calipers) of about 1 mm
a b
978-9241548540-C005 PRF ml YVR ln ml ml-1-Final Proof.indd 293 6/10/13 10:31 AM
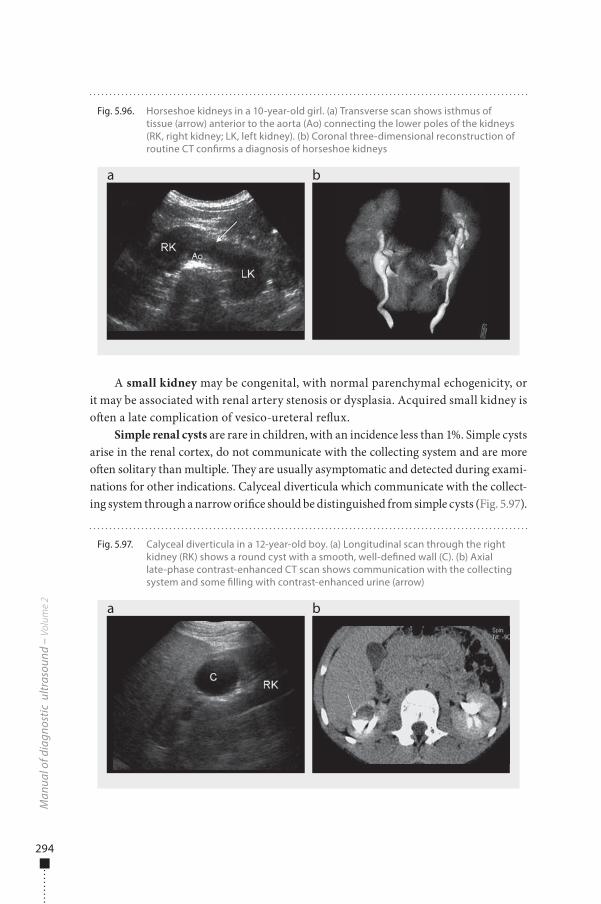
294
A small kidney may be congenital, with normal parenchymal echogenicity, or it may be associated with renal artery stenosis or dysplasia. Acquired small kidney is o�en a late complication of vesico-ureteral re�ux.
Simple renal cysts are rare in children, with an incidence less than 1%. Simple cysts arise in the renal cortex, do not communicate with the collecting system and are more o�en solitary than multiple. �ey are usually asymptomatic and detected during exami-nations for other indications. Calyceal diverticula which communicate with the collect-ing system through a narrow ori�ce should be distinguished from simple cysts (Fig. 5.97).
Man
ual o
f dia
gnos
tic u
ltras
ound
– V
olum
e 2
Fig. 5.96. Horseshoe kidneys in a 10-year-old girl. (a) Transverse scan shows isthmus of tissue (arrow) anterior to the aorta (Ao) connecting the lower poles of the kidneys (RK, right kidney; LK, left kidney). (b) Coronal three-dimensional reconstruction of routine CT con�rms a diagnosis of horseshoe kidneys
a b
Fig. 5.97. Calyceal diverticula in a 12-year-old boy. (a) Longitudinal scan through the right kidney (RK) shows a round cyst with a smooth, well-de�ned wall (C). (b) Axial late-phase contrast-enhanced CT scan shows communication with the collecting system and some �lling with contrast-enhanced urine (arrow)
a b
978-9241548540-C005 PRF ml YVR ln ml ml-1-Final Proof.indd 294 6/10/13 10:31 AM
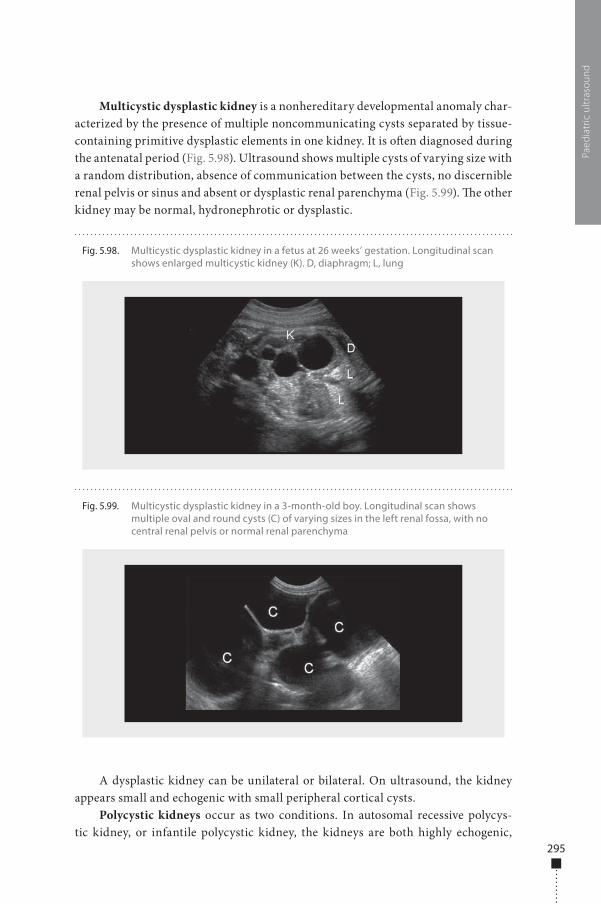
295
Multicystic dysplastic kidney is a nonhereditary developmental anomaly char-acterized by the presence of multiple noncommunicating cysts separated by tissue-containing primitive dysplastic elements in one kidney. It is o�en diagnosed during the antenatal period (Fig. 5.98). Ultrasound shows multiple cysts of varying size with a random distribution, absence of communication between the cysts, no discernible renal pelvis or sinus and absent or dysplastic renal parenchyma (Fig. 5.99). �e other kidney may be normal, hydronephrotic or dysplastic.
A dysplastic kidney can be unilateral or bilateral. On ultrasound, the kidney appears small and echogenic with small peripheral cortical cysts.
Polycystic kidneys occur as two conditions. In autosomal recessive polycys-tic kidney, or infantile polycystic kidney, the kidneys are both highly echogenic,
Paed
iatr
ic u
ltras
ound
Fig. 5.99. Multicystic dysplastic kidney in a 3-month-old boy. Longitudinal scan shows multiple oval and round cysts (C) of varying sizes in the left renal fossa, with no central renal pelvis or normal renal parenchyma
Fig. 5.98. Multicystic dysplastic kidney in a fetus at 26 weeks’ gestation. Longitudinal scan shows enlarged multicystic kidney (K). D, diaphragm; L, lung
978-9241548540-C005 PRF ml YVR ln ml ml-1-Final Proof.indd 295 6/10/13 10:31 AM
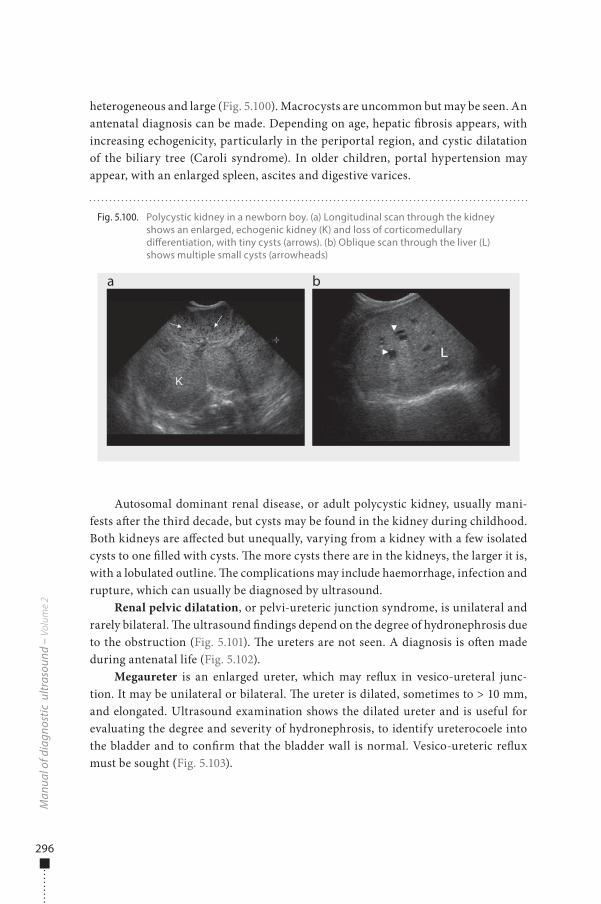
296
heterogeneous and large (Fig. 5.100). Macrocysts are uncommon but may be seen. An antenatal diagnosis can be made. Depending on age, hepatic �brosis appears, with increasing echogenicity, particularly in the periportal region, and cystic dilatation of the biliary tree (Caroli syndrome). In older children, portal hypertension may appear, with an enlarged spleen, ascites and digestive varices.
Autosomal dominant renal disease, or adult polycystic kidney, usually mani-fests a�er the third decade, but cysts may be found in the kidney during childhood. Both kidneys are a�ected but unequally, varying from a kidney with a few isolated cysts to one �lled with cysts. �e more cysts there are in the kidneys, the larger it is, with a lobulated outline. �e complications may include haemorrhage, infection and rupture, which can usually be diagnosed by ultrasound.
Renal pelvic dilatation, or pelvi-ureteric junction syndrome, is unilateral and rarely bilateral. �e ultrasound �ndings depend on the degree of hydronephrosis due to the obstruction (Fig. 5.101). �e ureters are not seen. A diagnosis is o�en made during antenatal life (Fig. 5.102).
Megaureter is an enlarged ureter, which may re�ux in vesico-ureteral junc-tion. It may be unilateral or bilateral. �e ureter is dilated, sometimes to > 10 mm, and elongated. Ultrasound examination shows the dilated ureter and is useful for evaluating the degree and severity of hydronephrosis, to identify ureterocoele into the bladder and to con�rm that the bladder wall is normal. Vesico-ureteric re�ux must be sought (Fig. 5.103).
Man
ual o
f dia
gnos
tic u
ltras
ound
– V
olum
e 2
Fig. 5.100. Polycystic kidney in a newborn boy. (a) Longitudinal scan through the kidney shows an enlarged, echogenic kidney (K) and loss of corticomedullary di�erentiation, with tiny cysts (arrows). (b) Oblique scan through the liver (L) shows multiple small cysts (arrowheads)
a b
978-9241548540-C005 PRF ml YVR ln ml ml-1-Final Proof.indd 296 6/10/13 10:31 AM
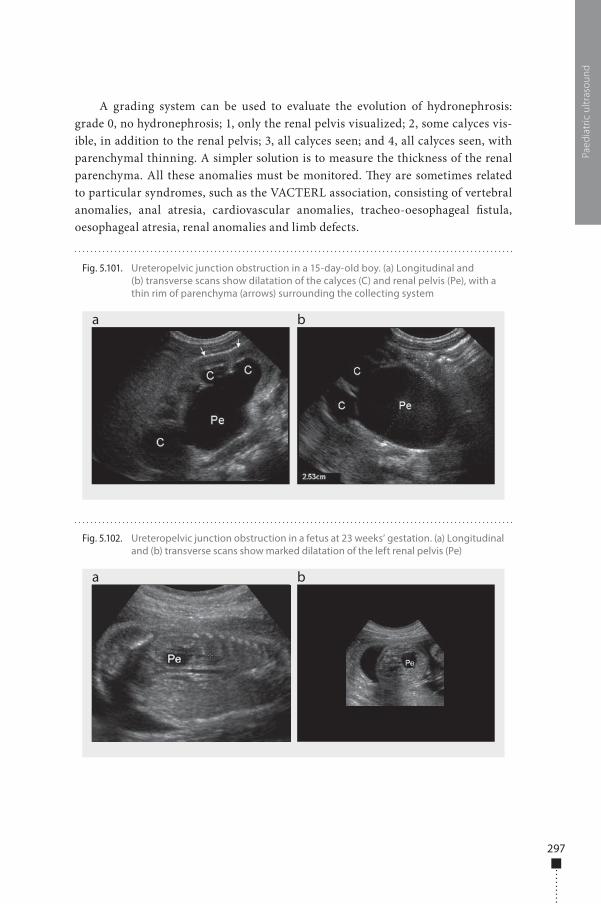
297
A grading system can be used to evaluate the evolution of hydronephrosis: grade 0, no hydronephrosis; 1, only the renal pelvis visualized; 2, some calyces vis-ible, in addition to the renal pelvis; 3, all calyces seen; and 4, all calyces seen, with parenchymal thinning. A simpler solution is to measure the thickness of the renal parenchyma. All these anomalies must be monitored. �ey are sometimes related to particular syndromes, such as the VACTERL association, consisting of vertebral anomalies, anal atresia, cardiovascular anomalies, tracheo-oesophageal �stula, oesophageal atresia, renal anomalies and limb defects.
Paed
iatr
ic u
ltras
ound
Fig. 5.102. Ureteropelvic junction obstruction in a fetus at 23 weeks’ gestation. (a) Longitudinal and (b) transverse scans show marked dilatation of the left renal pelvis (Pe)
a b
Fig. 5.101. Ureteropelvic junction obstruction in a 15-day-old boy. (a) Longitudinal and (b) transverse scans show dilatation of the calyces (C) and renal pelvis (Pe), with a thin rim of parenchyma (arrows) surrounding the collecting system
a b
978-9241548540-C005 PRF ml YVR ln ml ml-1-Final Proof.indd 297 6/10/13 10:31 AM
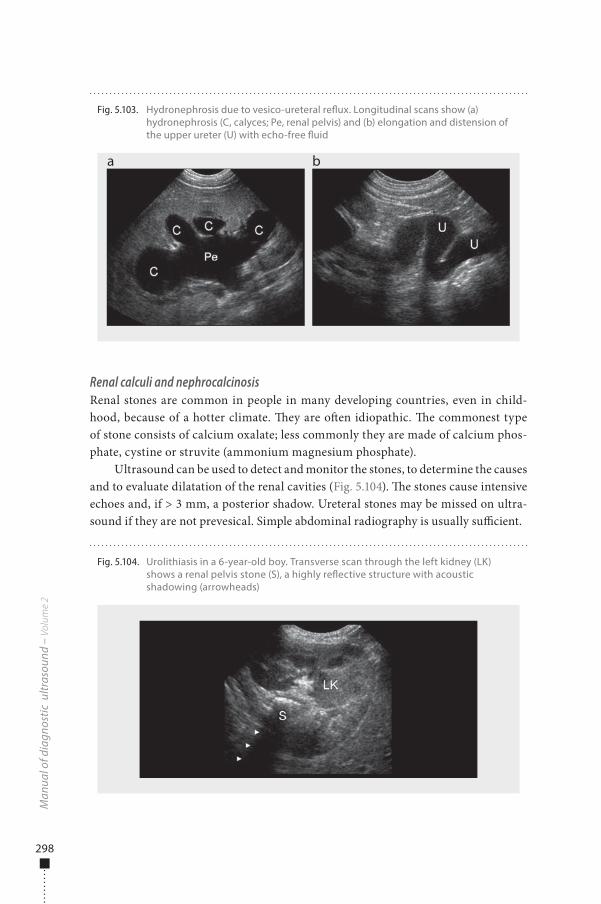
298
Renal calculi and nephrocalcinosisRenal stones are common in people in many developing countries, even in child-hood, because of a hotter climate. �ey are o�en idiopathic. �e commonest type of stone consists of calcium oxalate; less commonly they are made of calcium phos-phate, cystine or struvite (ammonium magnesium phosphate).
Ultrasound can be used to detect and monitor the stones, to determine the causes and to evaluate dilatation of the renal cavities (Fig. 5.104). �e stones cause intensive echoes and, if > 3 mm, a posterior shadow. Ureteral stones may be missed on ultra-sound if they are not prevesical. Simple abdominal radiography is usually su�cient.
Man
ual o
f dia
gnos
tic u
ltras
ound
– V
olum
e 2
Fig. 5.103. Hydronephrosis due to vesico-ureteral re�ux. Longitudinal scans show (a) hydronephrosis (C, calyces; Pe, renal pelvis) and (b) elongation and distension of the upper ureter (U) with echo-free �uid
a b
Fig. 5.104. Urolithiasis in a 6-year-old boy. Transverse scan through the left kidney (LK) shows a renal pelvis stone (S), a highly re�ective structure with acoustic shadowing (arrowheads)
978-9241548540-C005 PRF ml YVR ln ml ml-1-Final Proof.indd 298 6/10/13 10:31 AM
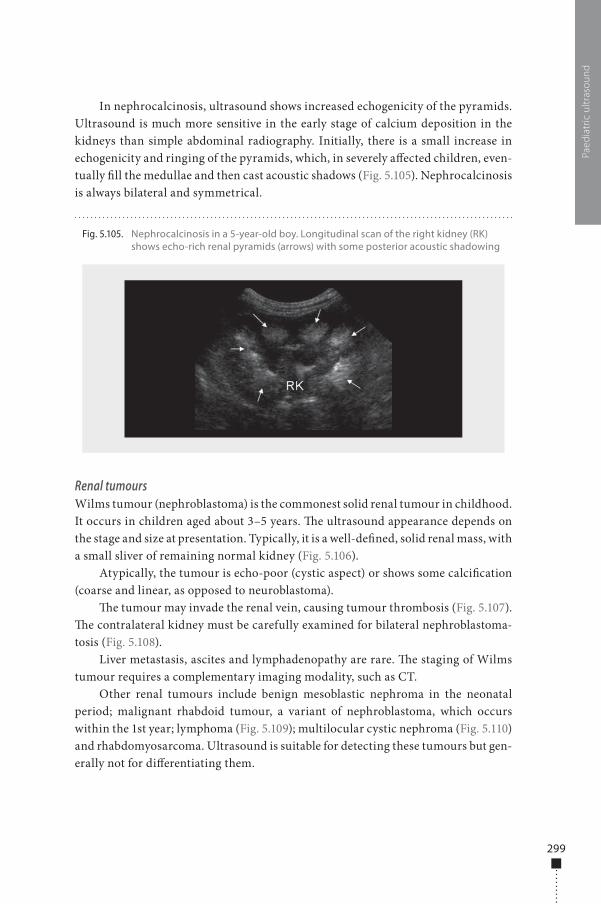
299
In nephrocalcinosis, ultrasound shows increased echogenicity of the pyramids. Ultrasound is much more sensitive in the early stage of calcium deposition in the kidneys than simple abdominal radiography. Initially, there is a small increase in echogenicity and ringing of the pyramids, which, in severely a�ected children, even-tually �ll the medullae and then cast acoustic shadows (Fig. 5.105). Nephrocalcinosis is always bilateral and symmetrical.
Renal tumoursWilms tumour (nephroblastoma) is the commonest solid renal tumour in childhood. It occurs in children aged about 3–5 years. �e ultrasound appearance depends on the stage and size at presentation. Typically, it is a well-de�ned, solid renal mass, with a small sliver of remaining normal kidney (Fig. 5.106).
Atypically, the tumour is echo-poor (cystic aspect) or shows some calci�cation (coarse and linear, as opposed to neuroblastoma).
�e tumour may invade the renal vein, causing tumour thrombosis (Fig. 5.107). �e contralateral kidney must be carefully examined for bilateral nephroblastoma-tosis (Fig. 5.108).
Liver metastasis, ascites and lymphadenopathy are rare. �e staging of Wilms tumour requires a complementary imaging modality, such as CT.
Other renal tumours include benign mesoblastic nephroma in the neonatal period; malignant rhabdoid tumour, a variant of nephroblastoma, which occurs within the 1st year; lymphoma (Fig. 5.109); multilocular cystic nephroma (Fig. 5.110) and rhabdomyosarcoma. Ultrasound is suitable for detecting these tumours but gen-erally not for di�erentiating them.
Paed
iatr
ic u
ltras
ound
Fig. 5.105. Nephrocalcinosis in a 5-year-old boy. Longitudinal scan of the right kidney (RK) shows echo-rich renal pyramids (arrows) with some posterior acoustic shadowing
978-9241548540-C005 PRF ml YVR ln ml ml-1-Final Proof.indd 299 6/10/13 10:31 AM
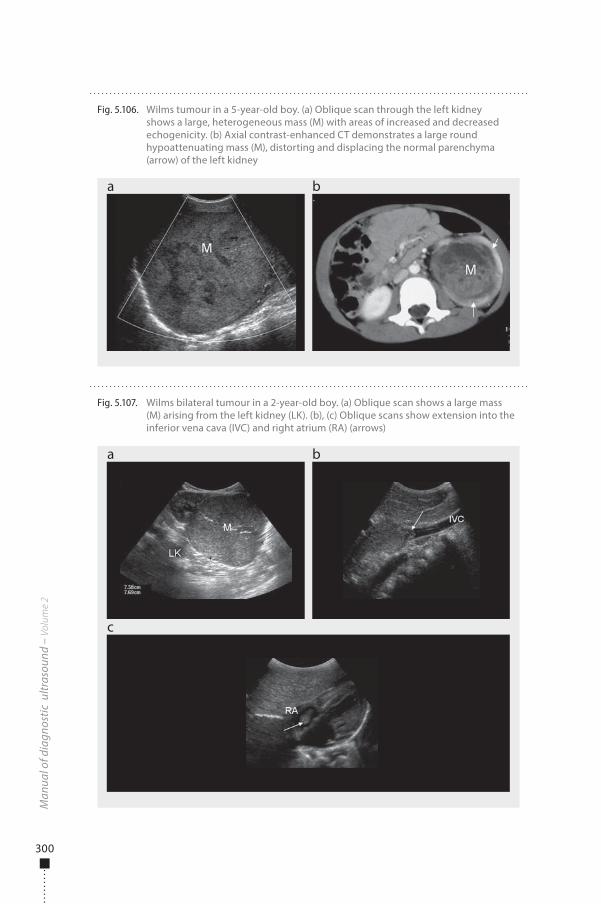
300
Man
ual o
f dia
gnos
tic u
ltras
ound
– V
olum
e 2
Fig. 5.107. Wilms bilateral tumour in a 2-year-old boy. (a) Oblique scan shows a large mass (M) arising from the left kidney (LK). (b), (c) Oblique scans show extension into the inferior vena cava (IVC) and right atrium (RA) (arrows)
a
c
b
Fig. 5.106. Wilms tumour in a 5-year-old boy. (a) Oblique scan through the left kidney shows a large, heterogeneous mass (M) with areas of increased and decreased echogenicity. (b) Axial contrast-enhanced CT demonstrates a large round hypoattenuating mass (M), distorting and displacing the normal parenchyma (arrow) of the left kidney
a b
978-9241548540-C005 PRF ml YVR ln ml ml-1-Final Proof.indd 300 6/10/13 10:31 AM
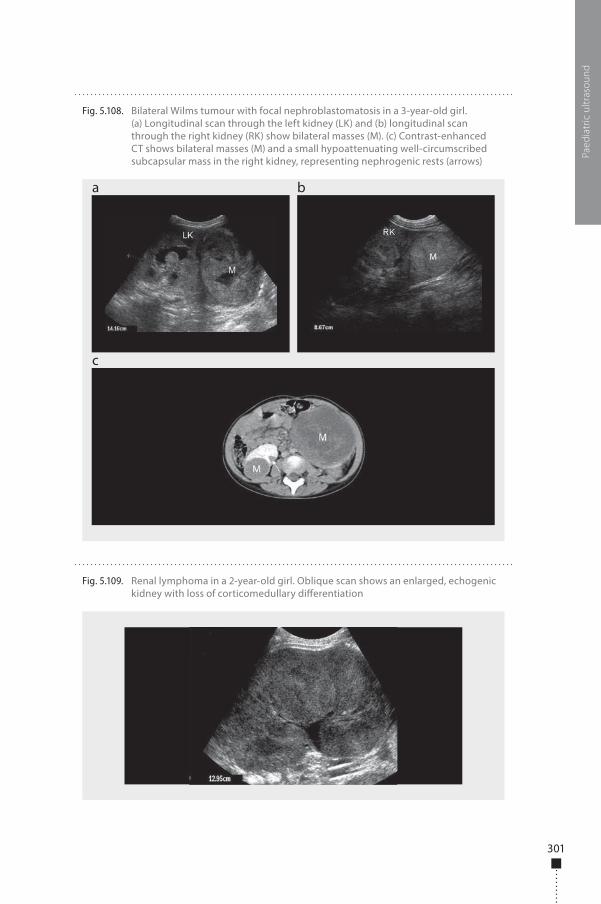
301
Paed
iatr
ic u
ltras
ound
Fig. 5.108. Bilateral Wilms tumour with focal nephroblastomatosis in a 3-year-old girl. (a) Longitudinal scan through the left kidney (LK) and (b) longitudinal scan through the right kidney (RK) show bilateral masses (M). (c) Contrast-enhanced CT shows bilateral masses (M) and a small hypoattenuating well-circumscribed subcapsular mass in the right kidney, representing nephrogenic rests (arrows)
a
c
b
Fig. 5.109. Renal lymphoma in a 2-year-old girl. Oblique scan shows an enlarged, echogenic kidney with loss of corticomedullary di�erentiation
978-9241548540-C005 PRF ml YVR ln ml ml-1-Final Proof.indd 301 6/10/13 10:31 AM
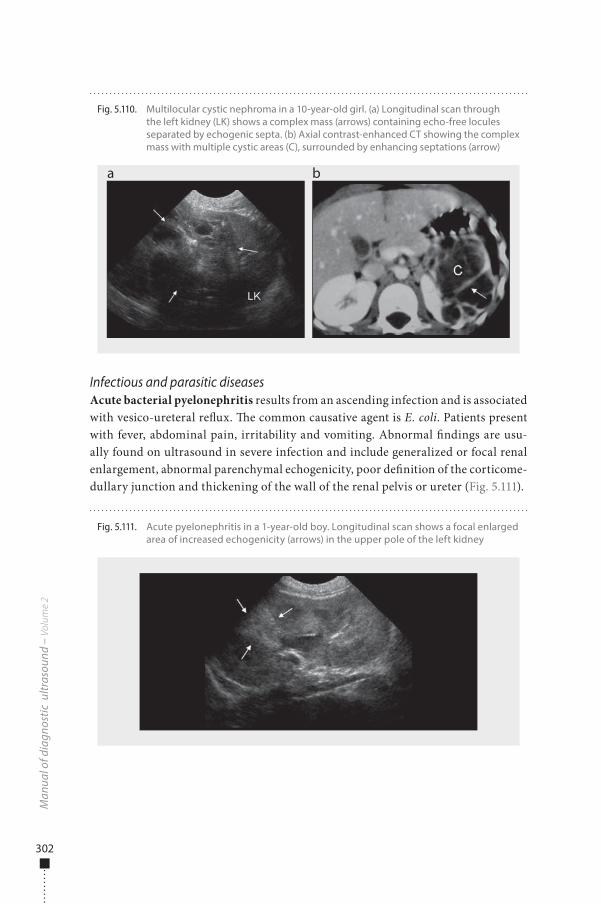
302
Infectious and parasitic diseasesAcute bacterial pyelonephritis results from an ascending infection and is associated with vesico-ureteral re�ux. �e common causative agent is E. coli. Patients present with fever, abdominal pain, irritability and vomiting. Abnormal �ndings are usu-ally found on ultrasound in severe infection and include generalized or focal renal enlargement, abnormal parenchymal echogenicity, poor de�nition of the corticome-dullary junction and thickening of the wall of the renal pelvis or ureter (Fig. 5.111).
Man
ual o
f dia
gnos
tic u
ltras
ound
– V
olum
e 2
Fig. 5.110. Multilocular cystic nephroma in a 10-year-old girl. (a) Longitudinal scan through the left kidney (LK) shows a complex mass (arrows) containing echo-free locules separated by echogenic septa. (b) Axial contrast-enhanced CT showing the complex mass with multiple cystic areas (C), surrounded by enhancing septations (arrow)
a b
Fig. 5.111. Acute pyelonephritis in a 1-year-old boy. Longitudinal scan shows a focal enlarged area of increased echogenicity (arrows) in the upper pole of the left kidney
978-9241548540-C005 PRF ml YVR ln ml ml-1-Final Proof.indd 302 6/10/13 10:31 AM
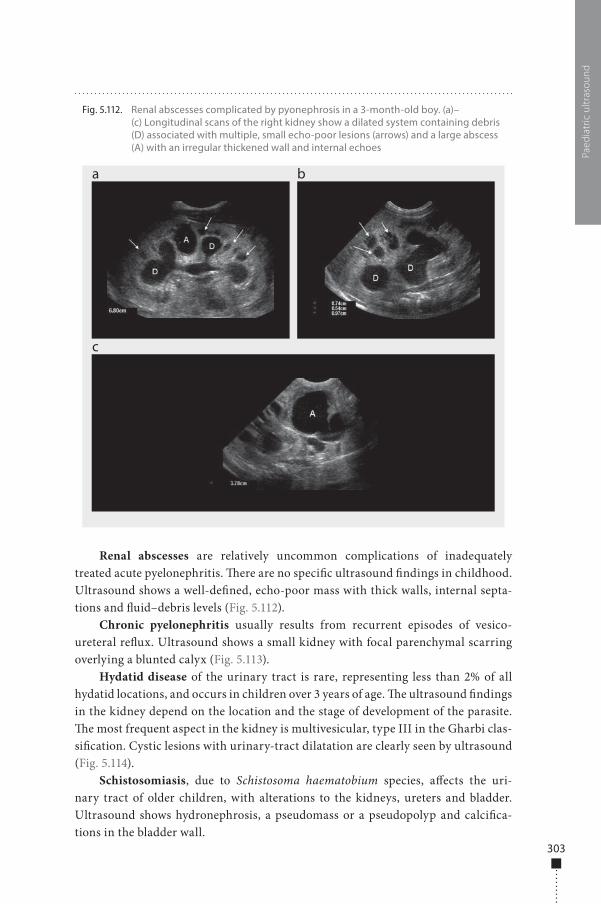
303
Renal abscesses are relatively uncommon complications of inadequately treated acute pyelonephritis. �ere are no speci�c ultrasound �ndings in childhood. Ultrasound shows a well-de�ned, echo-poor mass with thick walls, internal septa-tions and �uid–debris levels (Fig. 5.112).
Chronic pyelonephritis usually results from recurrent episodes of vesico-ureteral re�ux. Ultrasound shows a small kidney with focal parenchymal scarring overlying a blunted calyx (Fig. 5.113).
Hydatid disease of the urinary tract is rare, representing less than 2% of all hydatid locations, and occurs in children over 3 years of age. �e ultrasound �ndings in the kidney depend on the location and the stage of development of the parasite. �e most frequent aspect in the kidney is multivesicular, type III in the Gharbi clas-si�cation. Cystic lesions with urinary-tract dilatation are clearly seen by ultrasound (Fig. 5.114).
Schistosomiasis, due to Schistosoma haematobium species, a�ects the uri-nary tract of older children, with alterations to the kidneys, ureters and bladder. Ultrasound shows hydronephrosis, a pseudomass or a pseudopolyp and calci�ca-tions in the bladder wall.
Paed
iatr
ic u
ltras
ound
Fig. 5.112. Renal abscesses complicated by pyonephrosis in a 3-month-old boy. (a)–(c) Longitudinal scans of the right kidney show a dilated system containing debris (D) associated with multiple, small echo-poor lesions (arrows) and a large abscess (A) with an irregular thickened wall and internal echoes
a
c
b
978-9241548540-C005 PRF ml YVR ln ml ml-1-Final Proof.indd 303 6/10/13 10:31 AM
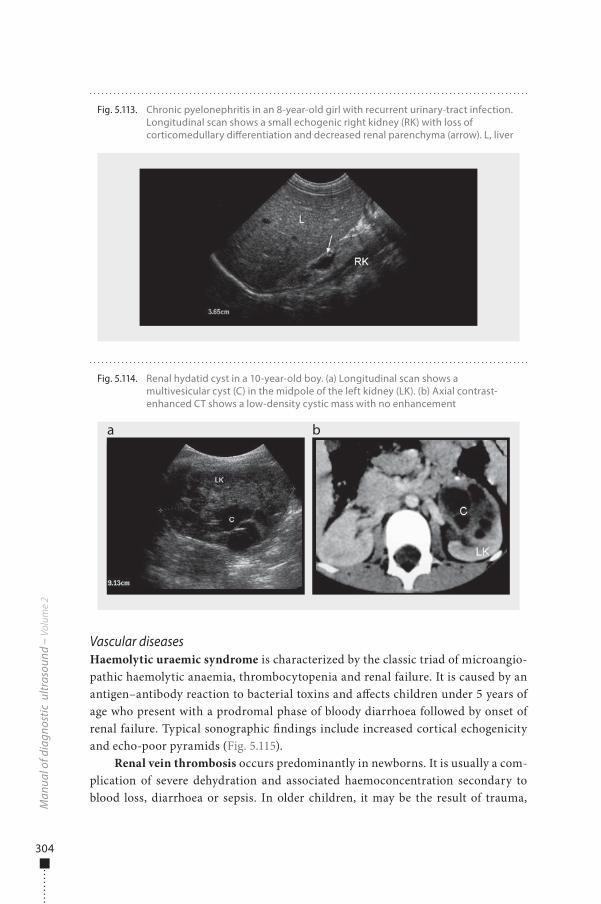
304
Vascular diseasesHaemolytic uraemic syndrome is characterized by the classic triad of microangio-pathic haemolytic anaemia, thrombocytopenia and renal failure. It is caused by an antigen–antibody reaction to bacterial toxins and a�ects children under 5 years of age who present with a prodromal phase of bloody diarrhoea followed by onset of renal failure. Typical sonographic �ndings include increased cortical echogenicity and echo-poor pyramids (Fig. 5.115).
Renal vein thrombosis occurs predominantly in newborns. It is usually a com-plication of severe dehydration and associated haemoconcentration secondary to blood loss, diarrhoea or sepsis. In older children, it may be the result of trauma,
Man
ual o
f dia
gnos
tic u
ltras
ound
– V
olum
e 2
Fig. 5.114. Renal hydatid cyst in a 10-year-old boy. (a) Longitudinal scan shows a multivesicular cyst (C) in the midpole of the left kidney (LK). (b) Axial contrast-enhanced CT shows a low-density cystic mass with no enhancement
a b
Fig. 5.113. Chronic pyelonephritis in an 8-year-old girl with recurrent urinary-tract infection. Longitudinal scan shows a small echogenic right kidney (RK) with loss of corticomedullary di�erentiation and decreased renal parenchyma (arrow). L, liver
978-9241548540-C005 PRF ml YVR ln ml ml-1-Final Proof.indd 304 6/10/13 10:31 AM
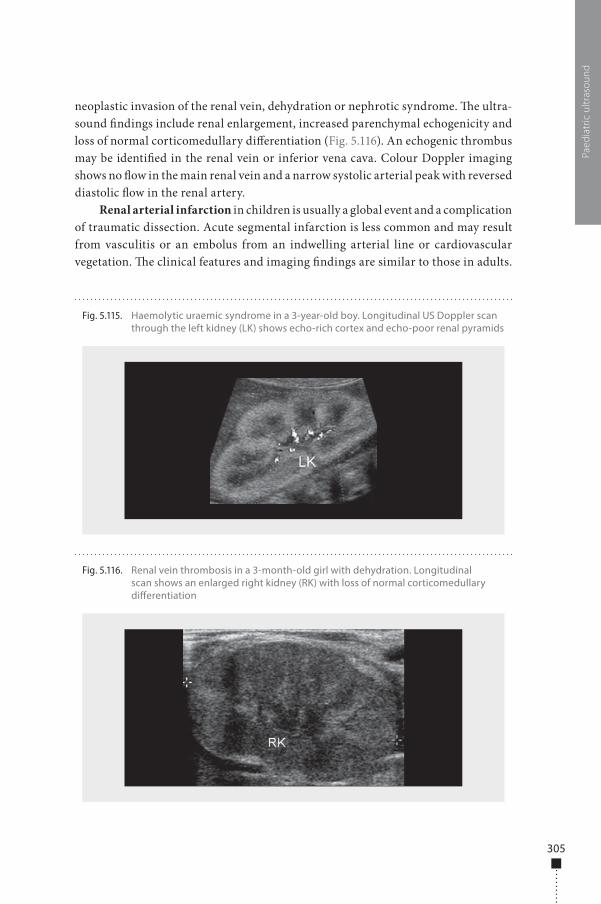
305
neoplastic invasion of the renal vein, dehydration or nephrotic syndrome. �e ultra-sound �ndings include renal enlargement, increased parenchymal echogenicity and loss of normal corticomedullary di�erentiation (Fig. 5.116). An echogenic thrombus may be identi�ed in the renal vein or inferior vena cava. Colour Doppler imaging shows no �ow in the main renal vein and a narrow systolic arterial peak with reversed diastolic �ow in the renal artery.
Renal arterial infarction in children is usually a global event and a complication of traumatic dissection. Acute segmental infarction is less common and may result from vasculitis or an embolus from an indwelling arterial line or cardiovascular vegetation. �e clinical features and imaging �ndings are similar to those in adults.
Paed
iatr
ic u
ltras
ound
Fig. 5.115. Haemolytic uraemic syndrome in a 3-year-old boy. Longitudinal US Doppler scan through the left kidney (LK) shows echo-rich cortex and echo-poor renal pyramids
Fig. 5.116. Renal vein thrombosis in a 3-month-old girl with dehydration. Longitudinal scan shows an enlarged right kidney (RK) with loss of normal corticomedullary di�erentiation
978-9241548540-C005 PRF ml YVR ln ml ml-1-Final Proof.indd 305 6/10/13 10:31 AM
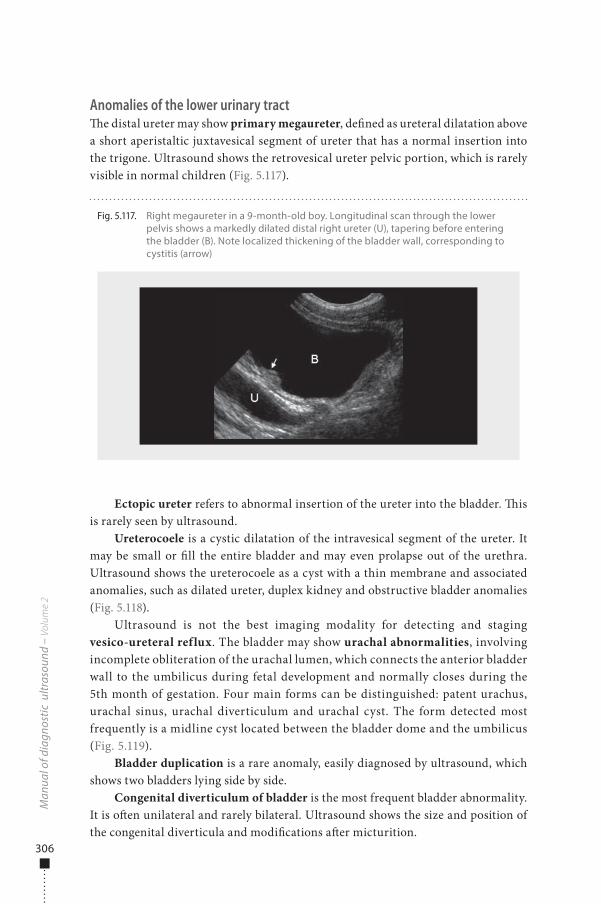
306
Anomalies of the lower urinary tract�e distal ureter may show primary megaureter, de�ned as ureteral dilatation above a short aperistaltic juxtavesical segment of ureter that has a normal insertion into the trigone. Ultrasound shows the retrovesical ureter pelvic portion, which is rarely visible in normal children (Fig. 5.117).
Ectopic ureter refers to abnormal insertion of the ureter into the bladder. �is is rarely seen by ultrasound.
Ureterocoele is a cystic dilatation of the intravesical segment of the ureter. It may be small or �ll the entire bladder and may even prolapse out of the urethra. Ultrasound shows the ureterocoele as a cyst with a thin membrane and associated anomalies, such as dilated ureter, duplex kidney and obstructive bladder anomalies (Fig. 5.118).
Ultrasound is not the best imaging modality for detecting and staging vesico-ureteral reflux. The bladder may show urachal abnormalities, involving incomplete obliteration of the urachal lumen, which connects the anterior bladder wall to the umbilicus during fetal development and normally closes during the 5th month of gestation. Four main forms can be distinguished: patent urachus, urachal sinus, urachal diverticulum and urachal cyst. The form detected most frequently is a midline cyst located between the bladder dome and the umbilicus (Fig. 5.119).
Bladder duplication is a rare anomaly, easily diagnosed by ultrasound, which shows two bladders lying side by side.
Congenital diverticulum of bladder is the most frequent bladder abnormality. It is o�en unilateral and rarely bilateral. Ultrasound shows the size and position of the congenital diverticula and modi�cations a�er micturition.
Man
ual o
f dia
gnos
tic u
ltras
ound
– V
olum
e 2
Fig. 5.117. Right megaureter in a 9-month-old boy. Longitudinal scan through the lower pelvis shows a markedly dilated distal right ureter (U), tapering before entering the bladder (B). Note localized thickening of the bladder wall, corresponding to cystitis (arrow)
978-9241548540-C005 PRF ml YVR ln ml ml-1-Final Proof.indd 306 6/10/13 10:31 AM
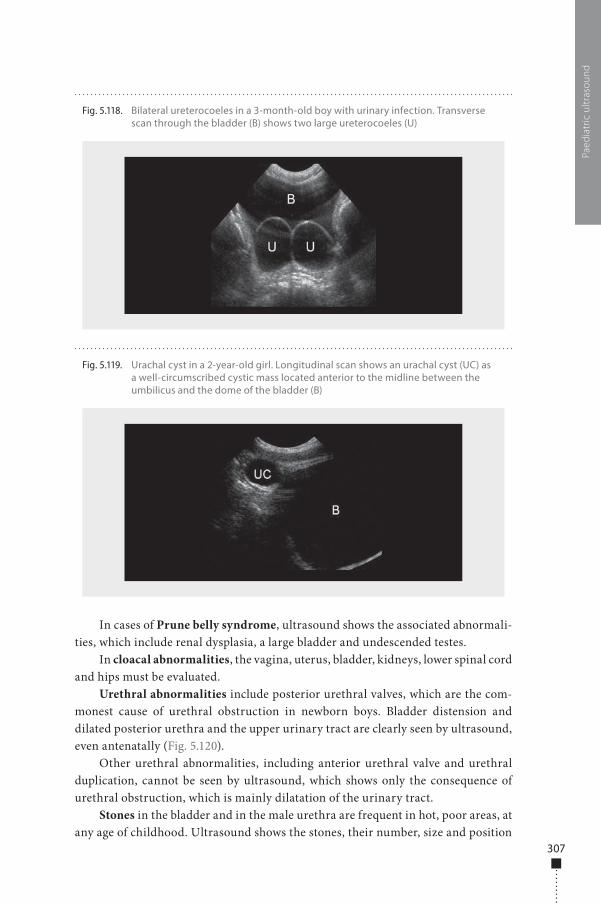
307
In cases of Prune belly syndrome, ultrasound shows the associated abnormali-ties, which include renal dysplasia, a large bladder and undescended testes.
In cloacal abnormalities, the vagina, uterus, bladder, kidneys, lower spinal cord and hips must be evaluated.
Urethral abnormalities include posterior urethral valves, which are the com-monest cause of urethral obstruction in newborn boys. Bladder distension and dilated posterior urethra and the upper urinary tract are clearly seen by ultrasound, even antenatally (Fig. 5.120).
Other urethral abnormalities, including anterior urethral valve and urethral duplication, cannot be seen by ultrasound, which shows only the consequence of urethral obstruction, which is mainly dilatation of the urinary tract.
Stones in the bladder and in the male urethra are frequent in hot, poor areas, at any age of childhood. Ultrasound shows the stones, their number, size and position
Paed
iatr
ic u
ltras
ound
Fig. 5.118. Bilateral ureterocoeles in a 3-month-old boy with urinary infection. Transverse scan through the bladder (B) shows two large ureterocoeles (U)
Fig. 5.119. Urachal cyst in a 2-year-old girl. Longitudinal scan shows an urachal cyst (UC) as a well-circumscribed cystic mass located anterior to the midline between the umbilicus and the dome of the bladder (B)
978-9241548540-C005 PRF ml YVR ln ml ml-1-Final Proof.indd 307 6/10/13 10:31 AM
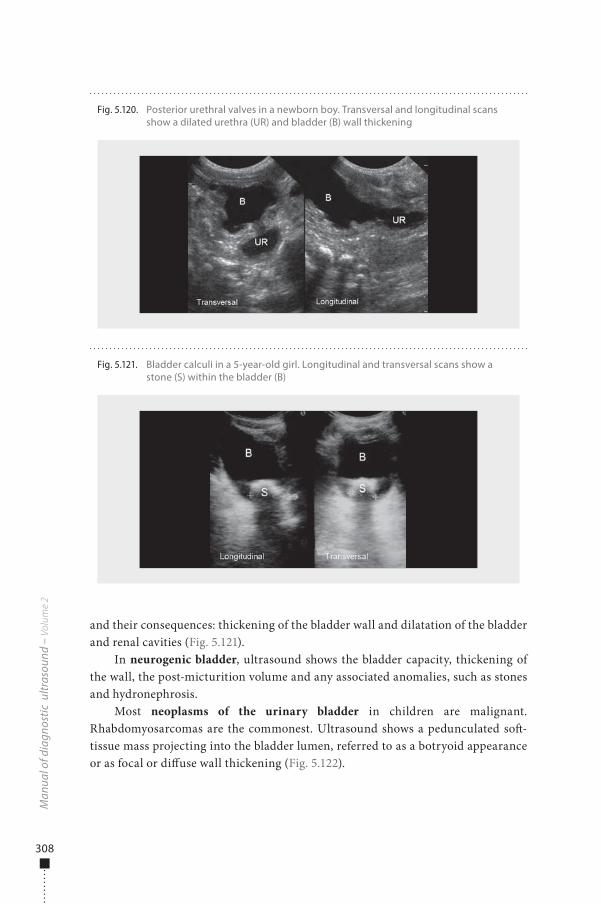
308
and their consequences: thickening of the bladder wall and dilatation of the bladder and renal cavities (Fig. 5.121).
In neurogenic bladder, ultrasound shows the bladder capacity, thickening of the wall, the post-micturition volume and any associated anomalies, such as stones and hydronephrosis.
Most neoplasms of the urinary bladder in children are malignant. Rhabdomyosarcomas are the commonest. Ultrasound shows a pedunculated so�-tissue mass projecting into the bladder lumen, referred to as a botryoid appearance or as focal or di�use wall thickening (Fig. 5.122).
Man
ual o
f dia
gnos
tic u
ltras
ound
– V
olum
e 2
Fig. 5.120. Posterior urethral valves in a newborn boy. Transversal and longitudinal scans show a dilated urethra (UR) and bladder (B) wall thickening
Fig. 5.121. Bladder calculi in a 5-year-old girl. Longitudinal and transversal scans show a stone (S) within the bladder (B)
978-9241548540-C005 PRF ml YVR ln ml ml-1-Final Proof.indd 308 6/10/13 10:31 AM
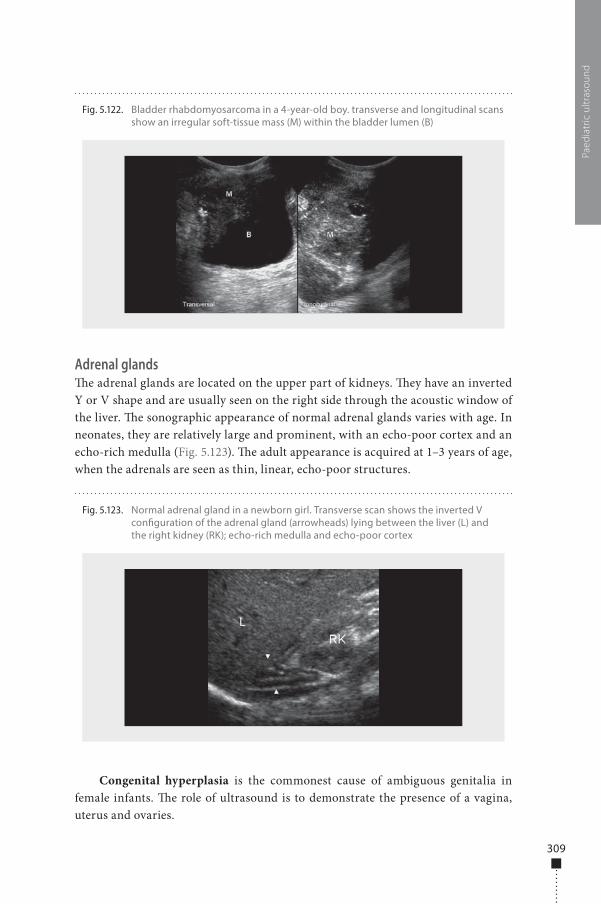
309
Adrenal glands�e adrenal glands are located on the upper part of kidneys. �ey have an inverted Y or V shape and are usually seen on the right side through the acoustic window of the liver. �e sonographic appearance of normal adrenal glands varies with age. In neonates, they are relatively large and prominent, with an echo-poor cortex and an echo-rich medulla (Fig. 5.123). �e adult appearance is acquired at 1–3 years of age, when the adrenals are seen as thin, linear, echo-poor structures.
Congenital hyperplasia is the commonest cause of ambiguous genitalia in female infants. �e role of ultrasound is to demonstrate the presence of a vagina, uterus and ovaries.
Paed
iatr
ic u
ltras
ound
Fig. 5.122. Bladder rhabdomyosarcoma in a 4-year-old boy. transverse and longitudinal scans show an irregular soft-tissue mass (M) within the bladder lumen (B)
Fig. 5.123. Normal adrenal gland in a newborn girl. Transverse scan shows the inverted V con�guration of the adrenal gland (arrowheads) lying between the liver (L) and the right kidney (RK); echo-rich medulla and echo-poor cortex
978-9241548540-C005 PRF ml YVR ln ml ml-1-Final Proof.indd 309 6/10/13 10:31 AM
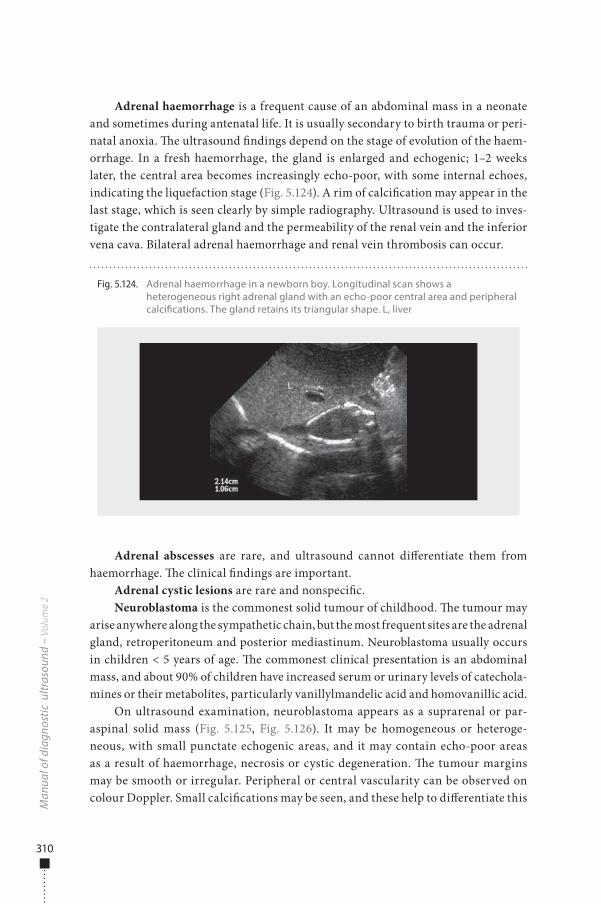
310
Adrenal haemorrhage is a frequent cause of an abdominal mass in a neonate and sometimes during antenatal life. It is usually secondary to birth trauma or peri-natal anoxia. �e ultrasound �ndings depend on the stage of evolution of the haem-orrhage. In a fresh haemorrhage, the gland is enlarged and echogenic; 1–2 weeks later, the central area becomes increasingly echo-poor, with some internal echoes, indicating the liquefaction stage (Fig. 5.124). A rim of calci�cation may appear in the last stage, which is seen clearly by simple radiography. Ultrasound is used to inves-tigate the contralateral gland and the permeability of the renal vein and the inferior vena cava. Bilateral adrenal haemorrhage and renal vein thrombosis can occur.
Adrenal abscesses are rare, and ultrasound cannot di�erentiate them from haemorrhage. �e clinical �ndings are important.
Adrenal cystic lesions are rare and nonspeci�c.Neuroblastoma is the commonest solid tumour of childhood. �e tumour may
arise anywhere along the sympathetic chain, but the most frequent sites are the adrenal gland, retroperitoneum and posterior mediastinum. Neuroblastoma usually occurs in children < 5 years of age. �e commonest clinical presentation is an abdominal mass, and about 90% of children have increased serum or urinary levels of catechola-mines or their metabolites, particularly vanillylmandelic acid and homovanillic acid.
On ultrasound examination, neuroblastoma appears as a suprarenal or par-aspinal solid mass (Fig. 5.125, Fig. 5.126). It may be homogeneous or heteroge-neous, with small punctate echogenic areas, and it may contain echo-poor areas as a result of haemorrhage, necrosis or cystic degeneration. �e tumour margins may be smooth or irregular. Peripheral or central vascularity can be observed on colour Doppler. Small calci�cations may be seen, and these help to di�erentiate this
Man
ual o
f dia
gnos
tic u
ltras
ound
– V
olum
e 2
Fig. 5.124. Adrenal haemorrhage in a newborn boy. Longitudinal scan shows a heterogeneous right adrenal gland with an echo-poor central area and peripheral calci�cations. The gland retains its triangular shape. L, liver
978-9241548540-C005 PRF ml YVR ln ml ml-1-Final Proof.indd 310 6/10/13 10:31 AM
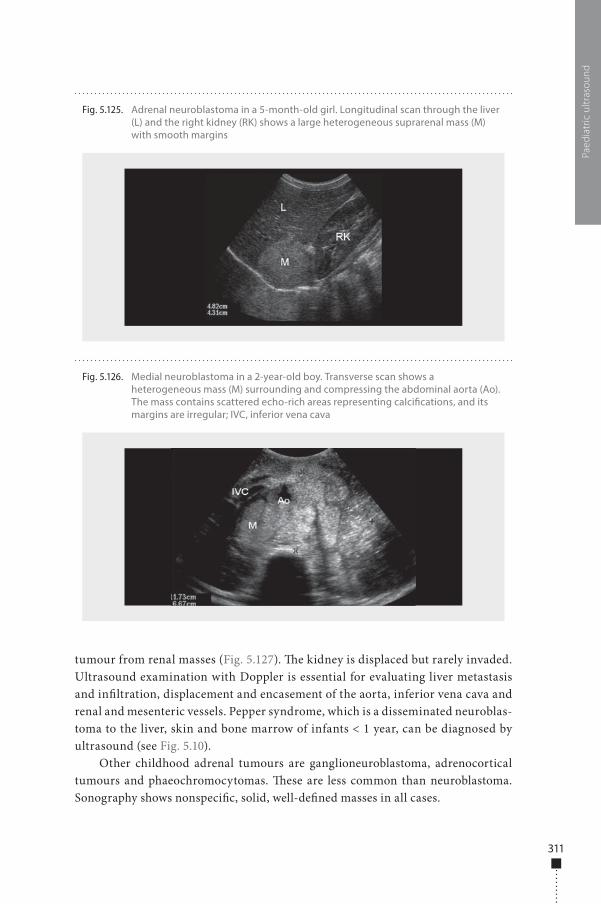
311
tumour from renal masses (Fig. 5.127). �e kidney is displaced but rarely invaded. Ultrasound examination with Doppler is essential for evaluating liver metastasis and in�ltration, displacement and encasement of the aorta, inferior vena cava and renal and mesenteric vessels. Pepper syndrome, which is a disseminated neuroblas-toma to the liver, skin and bone marrow of infants < 1 year, can be diagnosed by ultrasound (see Fig. 5.10).
Other childhood adrenal tumours are ganglioneuroblastoma, adrenocortical tumours and phaeochromocytomas. �ese are less common than neuroblastoma. Sonography shows nonspeci�c, solid, well-de�ned masses in all cases.
Paed
iatr
ic u
ltras
ound
Fig. 5.125. Adrenal neuroblastoma in a 5-month-old girl. Longitudinal scan through the liver (L) and the right kidney (RK) shows a large heterogeneous suprarenal mass (M) with smooth margins
Fig. 5.126. Medial neuroblastoma in a 2-year-old boy. Transverse scan shows a heterogeneous mass (M) surrounding and compressing the abdominal aorta (Ao). The mass contains scattered echo-rich areas representing calci�cations, and its margins are irregular; IVC, inferior vena cava
978-9241548540-C005 PRF ml YVR ln ml ml-1-Final Proof.indd 311 6/10/13 10:31 AM
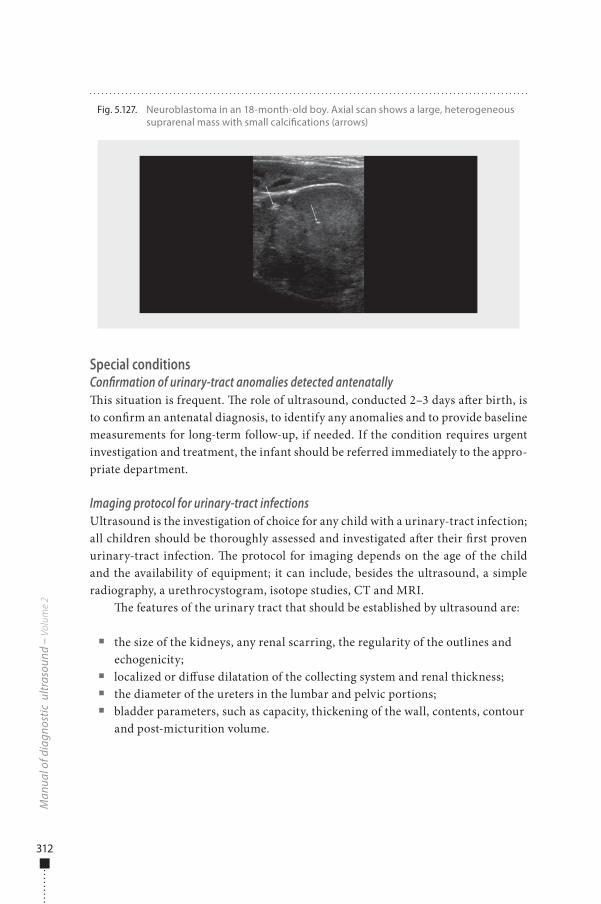
312
Special conditionsConfirmation of urinary-tract anomalies detected antenatally�is situation is frequent. �e role of ultrasound, conducted 2–3 days a�er birth, is to con�rm an antenatal diagnosis, to identify any anomalies and to provide baseline measurements for long-term follow-up, if needed. If the condition requires urgent investigation and treatment, the infant should be referred immediately to the appro-priate department.
Imaging protocol for urinary-tract infectionsUltrasound is the investigation of choice for any child with a urinary-tract infection; all children should be thoroughly assessed and investigated a�er their �rst proven urinary-tract infection. �e protocol for imaging depends on the age of the child and the availability of equipment; it can include, besides the ultrasound, a simple radiography, a urethrocystogram, isotope studies, CT and MRI.
�e features of the urinary tract that should be established by ultrasound are:
■ the size of the kidneys, any renal scarring, the regularity of the outlines and echogenicity;
■ localized or di�use dilatation of the collecting system and renal thickness; ■ the diameter of the ureters in the lumbar and pelvic portions; ■ bladder parameters, such as capacity, thickening of the wall, contents, contour
and post-micturition volume.
Man
ual o
f dia
gnos
tic u
ltras
ound
– V
olum
e 2
Fig. 5.127. Neuroblastoma in an 18-month-old boy. Axial scan shows a large, heterogeneous suprarenal mass with small calci�cations (arrows)
978-9241548540-C005 PRF ml YVR ln ml ml-1-Final Proof.indd 312 6/10/13 10:31 AM
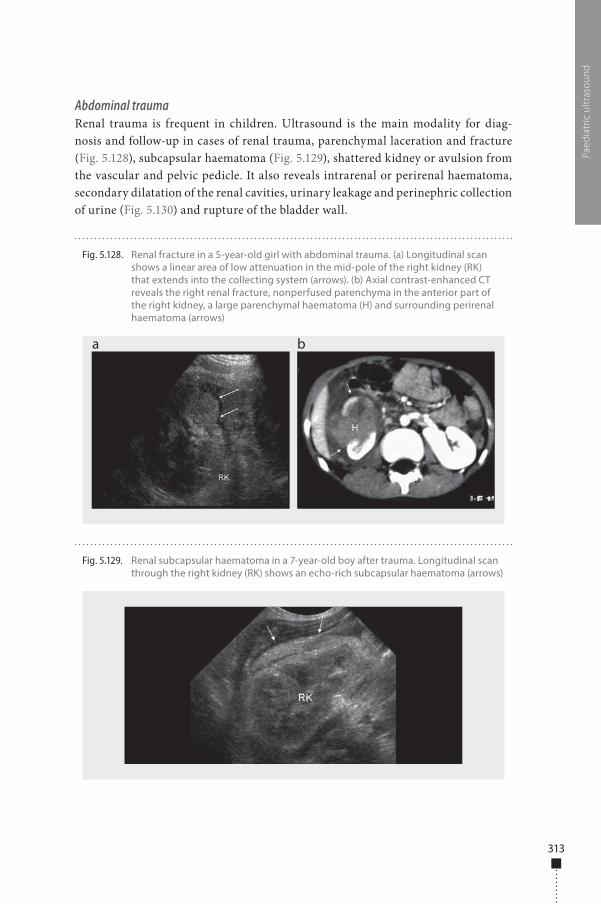
313
Abdominal traumaRenal trauma is frequent in children. Ultrasound is the main modality for diag-nosis and follow-up in cases of renal trauma, parenchymal laceration and fracture (Fig. 5.128), subcapsular haematoma (Fig. 5.129), shattered kidney or avulsion from the vascular and pelvic pedicle. It also reveals intrarenal or perirenal haematoma, secondary dilatation of the renal cavities, urinary leakage and perinephric collection of urine (Fig. 5.130) and rupture of the bladder wall.
Paed
iatr
ic u
ltras
ound
Fig. 5.128. Renal fracture in a 5-year-old girl with abdominal trauma. (a) Longitudinal scan shows a linear area of low attenuation in the mid-pole of the right kidney (RK) that extends into the collecting system (arrows). (b) Axial contrast-enhanced CT reveals the right renal fracture, nonperfused parenchyma in the anterior part of the right kidney, a large parenchymal haematoma (H) and surrounding perirenal haematoma (arrows)
a b
Fig. 5.129. Renal subcapsular haematoma in a 7-year-old boy after trauma. Longitudinal scan through the right kidney (RK) shows an echo-rich subcapsular haematoma (arrows)
978-9241548540-C005 PRF ml YVR ln ml ml-1-Final Proof.indd 313 6/10/13 10:31 AM
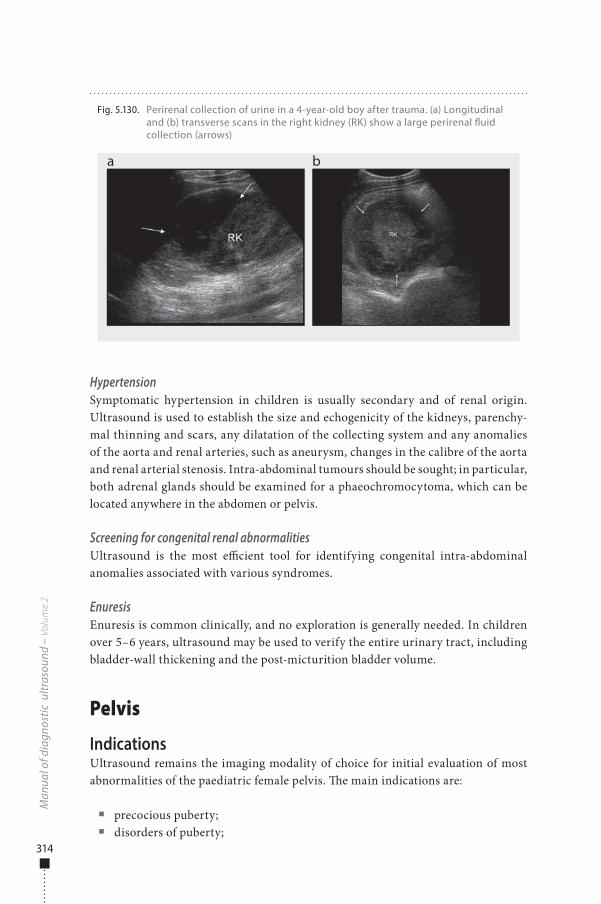
314
HypertensionSymptomatic hypertension in children is usually secondary and of renal origin. Ultrasound is used to establish the size and echogenicity of the kidneys, parenchy-mal thinning and scars, any dilatation of the collecting system and any anomalies of the aorta and renal arteries, such as aneurysm, changes in the calibre of the aorta and renal arterial stenosis. Intra-abdominal tumours should be sought; in particular, both adrenal glands should be examined for a phaeochromocytoma, which can be located anywhere in the abdomen or pelvis.
Screening for congenital renal abnormalitiesUltrasound is the most e�cient tool for identifying congenital intra-abdominal anomalies associated with various syndromes.
EnuresisEnuresis is common clinically, and no exploration is generally needed. In children over 5–6 years, ultrasound may be used to verify the entire urinary tract, including bladder-wall thickening and the post-micturition bladder volume.
Pelvis
IndicationsUltrasound remains the imaging modality of choice for initial evaluation of most abnormalities of the paediatric female pelvis. �e main indications are:
■ precocious puberty; ■ disorders of puberty;
Man
ual o
f dia
gnos
tic u
ltras
ound
– V
olum
e 2
Fig. 5.130. Perirenal collection of urine in a 4-year-old boy after trauma. (a) Longitudinal and (b) transverse scans in the right kidney (RK) show a large perirenal �uid collection (arrows)
a b
978-9241548540-C005 PRF ml YVR ln ml ml-1-Final Proof.indd 314 6/10/13 10:31 AM
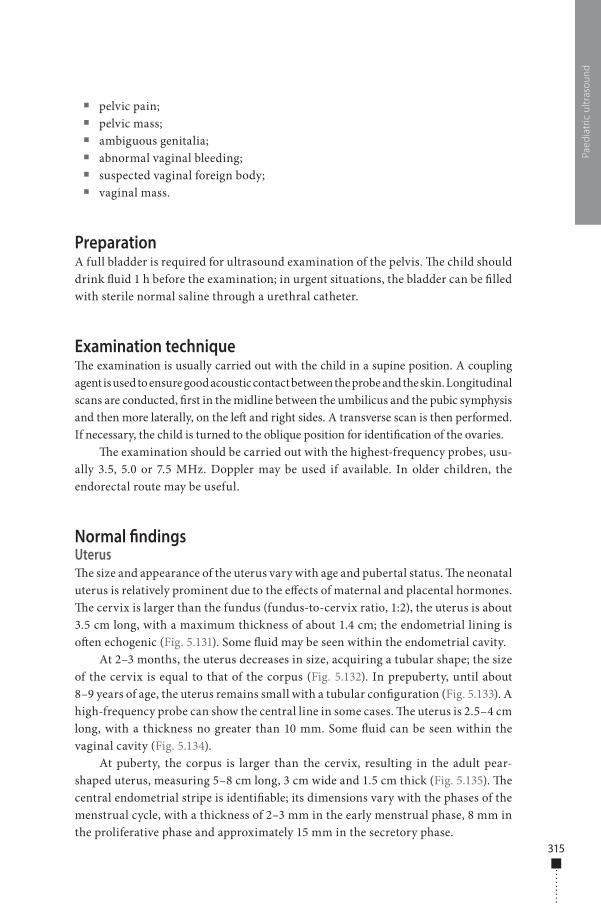
315
■ pelvic pain; ■ pelvic mass; ■ ambiguous genitalia; ■ abnormal vaginal bleeding; ■ suspected vaginal foreign body; ■ vaginal mass.
PreparationA full bladder is required for ultrasound examination of the pelvis. �e child should drink �uid 1 h before the examination; in urgent situations, the bladder can be �lled with sterile normal saline through a urethral catheter.
Examination technique�e examination is usually carried out with the child in a supine position. A coupling agent is used to ensure good acoustic contact between the probe and the skin. Longitudinal scans are conducted, �rst in the midline between the umbilicus and the pubic symphysis and then more laterally, on the le� and right sides. A transverse scan is then performed. If necessary, the child is turned to the oblique position for identi�cation of the ovaries.
�e examination should be carried out with the highest-frequency probes, usu-ally 3.5, 5.0 or 7.5 MHz. Doppler may be used if available. In older children, the endorectal route may be useful.
Normal �ndingsUterus�e size and appearance of the uterus vary with age and pubertal status. �e neonatal uterus is relatively prominent due to the e�ects of maternal and placental hormones. �e cervix is larger than the fundus (fundus-to-cervix ratio, 1:2), the uterus is about 3.5 cm long, with a maximum thickness of about 1.4 cm; the endometrial lining is o�en echogenic (Fig. 5.131). Some �uid may be seen within the endometrial cavity.
At 2–3 months, the uterus decreases in size, acquiring a tubular shape; the size of the cervix is equal to that of the corpus (Fig. 5.132). In prepuberty, until about 8–9 years of age, the uterus remains small with a tubular con�guration (Fig. 5.133). A high-frequency probe can show the central line in some cases. �e uterus is 2.5–4 cm long, with a thickness no greater than 10 mm. Some �uid can be seen within the vaginal cavity (Fig. 5.134).
At puberty, the corpus is larger than the cervix, resulting in the adult pear-shaped uterus, measuring 5–8 cm long, 3 cm wide and 1.5 cm thick (Fig. 5.135). �e central endometrial stripe is identi�able; its dimensions vary with the phases of the menstrual cycle, with a thickness of 2–3 mm in the early menstrual phase, 8 mm in the proliferative phase and approximately 15 mm in the secretory phase.
Paed
iatr
ic u
ltras
ound
978-9241548540-C005 PRF ml YVR ln ml ml-1-Final Proof.indd 315 6/10/13 10:31 AM
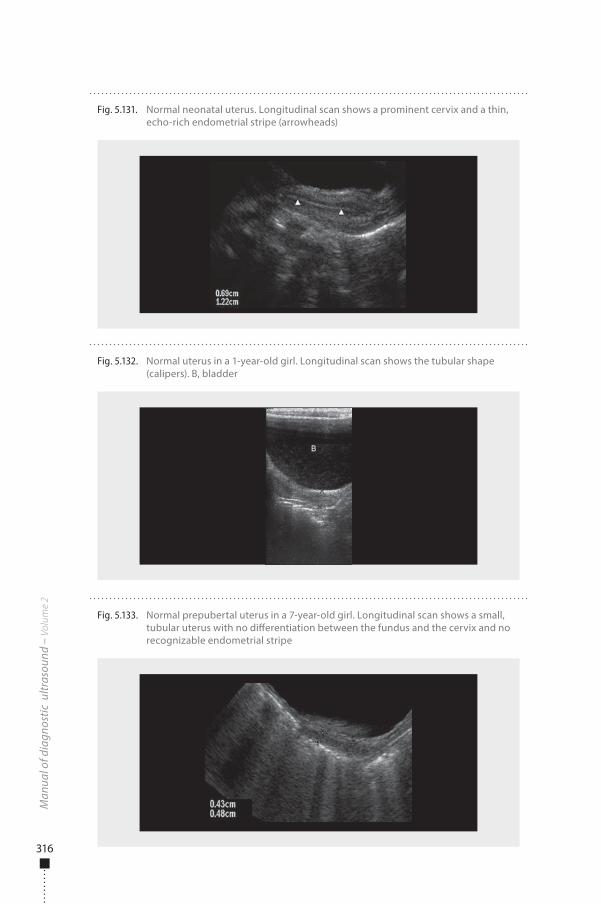
316
Man
ual o
f dia
gnos
tic u
ltras
ound
– V
olum
e 2
Fig. 5.133. Normal prepubertal uterus in a 7-year-old girl. Longitudinal scan shows a small, tubular uterus with no di�erentiation between the fundus and the cervix and no recognizable endometrial stripe
Fig. 5.132. Normal uterus in a 1-year-old girl. Longitudinal scan shows the tubular shape (calipers). B, bladder
Fig. 5.131. Normal neonatal uterus. Longitudinal scan shows a prominent cervix and a thin, echo-rich endometrial stripe (arrowheads)
978-9241548540-C005 PRF ml YVR ln ml ml-1-Final Proof.indd 316 6/10/13 10:31 AM
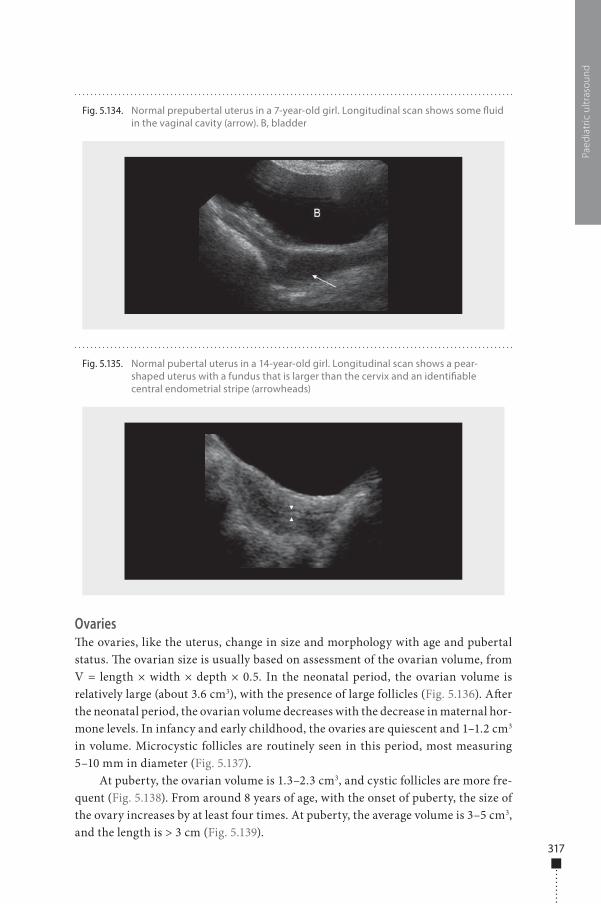
317
Ovaries�e ovaries, like the uterus, change in size and morphology with age and pubertal status. �e ovarian size is usually based on assessment of the ovarian volume, from V = length × width × depth × 0.5. In the neonatal period, the ovarian volume is relatively large (about 3.6 cm3), with the presence of large follicles (Fig. 5.136). A�er the neonatal period, the ovarian volume decreases with the decrease in maternal hor-mone levels. In infancy and early childhood, the ovaries are quiescent and 1–1.2 cm3 in volume. Microcystic follicles are routinely seen in this period, most measuring 5–10 mm in diameter (Fig. 5.137).
At puberty, the ovarian volume is 1.3–2.3 cm3, and cystic follicles are more fre-quent (Fig. 5.138). From around 8 years of age, with the onset of puberty, the size of the ovary increases by at least four times. At puberty, the average volume is 3–5 cm3, and the length is > 3 cm (Fig. 5.139).
Paed
iatr
ic u
ltras
ound
Fig. 5.134. Normal prepubertal uterus in a 7-year-old girl. Longitudinal scan shows some �uid in the vaginal cavity (arrow). B, bladder
Fig. 5.135. Normal pubertal uterus in a 14-year-old girl. Longitudinal scan shows a pear-shaped uterus with a fundus that is larger than the cervix and an identi�able central endometrial stripe (arrowheads)
978-9241548540-C005 PRF ml YVR ln ml ml-1-Final Proof.indd 317 6/10/13 10:31 AM
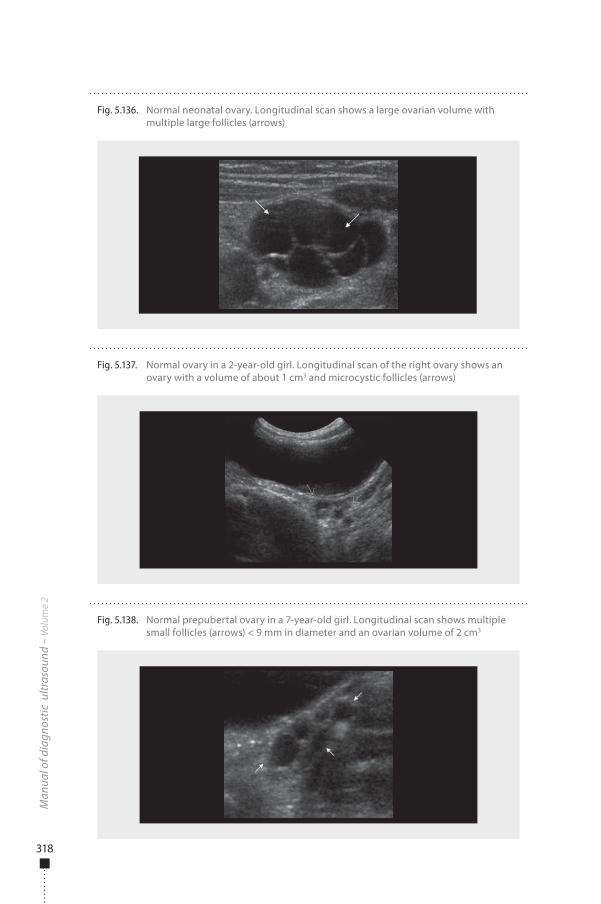
318
Man
ual o
f dia
gnos
tic u
ltras
ound
– V
olum
e 2
Fig. 5.137. Normal ovary in a 2-year-old girl. Longitudinal scan of the right ovary shows an ovary with a volume of about 1 cm3 and microcystic follicles (arrows)
Fig. 5.138. Normal prepubertal ovary in a 7-year-old girl. Longitudinal scan shows multiple small follicles (arrows) < 9 mm in diameter and an ovarian volume of 2 cm3
Fig. 5.136. Normal neonatal ovary. Longitudinal scan shows a large ovarian volume with multiple large follicles (arrows)
978-9241548540-C005 PRF ml YVR ln ml ml-1-Final Proof.indd 318 6/10/13 10:31 AM
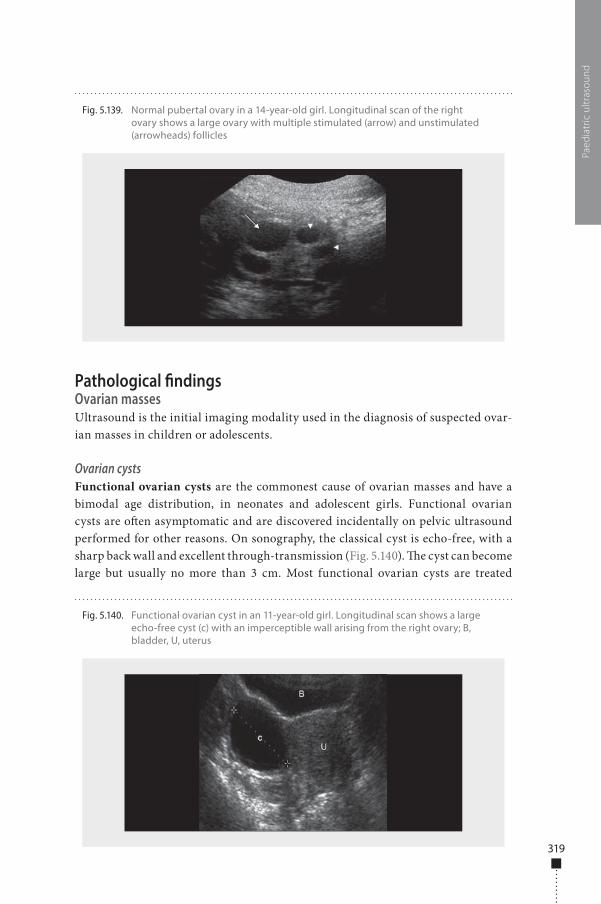
319
Pathological �ndingsOvarian massesUltrasound is the initial imaging modality used in the diagnosis of suspected ovar-ian masses in children or adolescents.
Ovarian cystsFunctional ovarian cysts are the commonest cause of ovarian masses and have a bimodal age distribution, in neonates and adolescent girls. Functional ovarian cysts are o�en asymptomatic and are discovered incidentally on pelvic ultrasound performed for other reasons. On sonography, the classical cyst is echo-free, with a sharp back wall and excellent through-transmission (Fig. 5.140). �e cyst can become large but usually no more than 3 cm. Most functional ovarian cysts are treated
Paed
iatr
ic u
ltras
ound
Fig. 5.139. Normal pubertal ovary in a 14-year-old girl. Longitudinal scan of the right ovary shows a large ovary with multiple stimulated (arrow) and unstimulated (arrowheads) follicles
Fig. 5.140. Functional ovarian cyst in an 11-year-old girl. Longitudinal scan shows a large echo-free cyst (c) with an imperceptible wall arising from the right ovary; B, bladder, U, uterus
978-9241548540-C005 PRF ml YVR ln ml ml-1-Final Proof.indd 319 6/10/13 10:31 AM
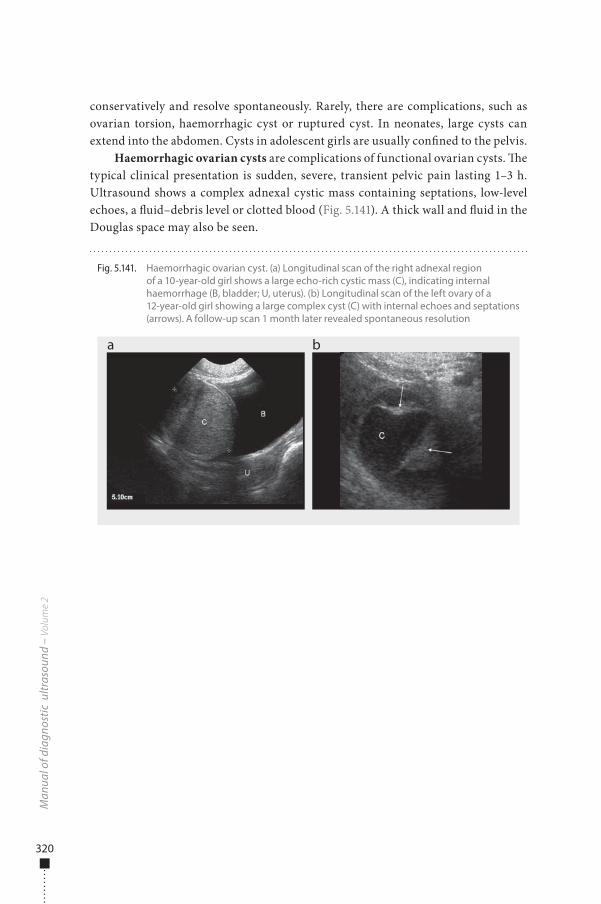
320
conservatively and resolve spontaneously. Rarely, there are complications, such as ovarian torsion, haemorrhagic cyst or ruptured cyst. In neonates, large cysts can extend into the abdomen. Cysts in adolescent girls are usually con�ned to the pelvis.
Haemorrhagic ovarian cysts are complications of functional ovarian cysts. �e typical clinical presentation is sudden, severe, transient pelvic pain lasting 1–3 h. Ultrasound shows a complex adnexal cystic mass containing septations, low-level echoes, a �uid–debris level or clotted blood (Fig. 5.141). A thick wall and �uid in the Douglas space may also be seen.
Man
ual o
f dia
gnos
tic u
ltras
ound
– V
olum
e 2
Fig. 5.141. Haemorrhagic ovarian cyst. (a) Longitudinal scan of the right adnexal region of a 10-year-old girl shows a large echo-rich cystic mass (C), indicating internal haemorrhage (B, bladder; U, uterus). (b) Longitudinal scan of the left ovary of a 12-year-old girl showing a large complex cyst (C) with internal echoes and septations (arrows). A follow-up scan 1 month later revealed spontaneous resolution
a b
978-9241548540-C005 PRF ml YVR ln ml ml-1-Final Proof.indd 320 6/10/13 10:31 AM
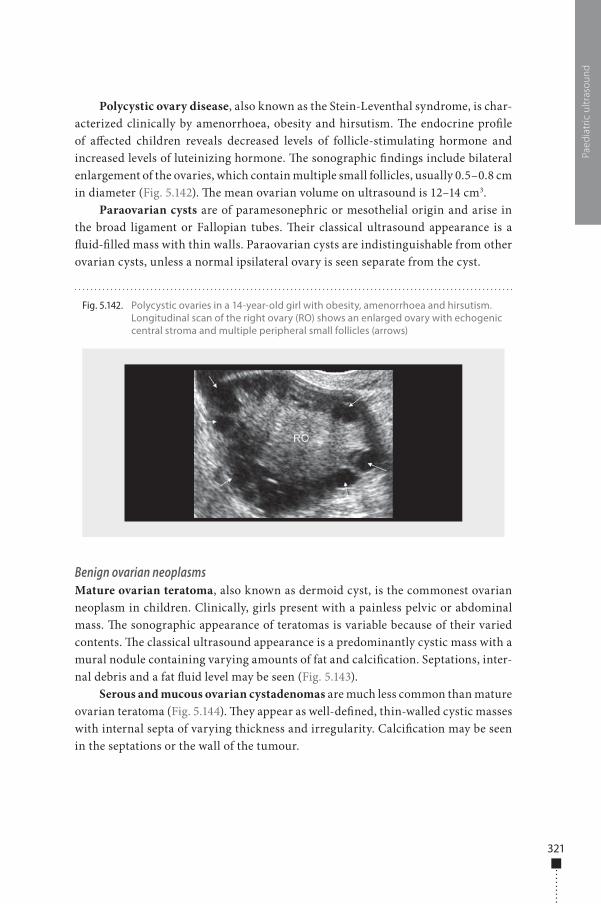
321
Polycystic ovary disease, also known as the Stein-Leventhal syndrome, is char-acterized clinically by amenorrhoea, obesity and hirsutism. �e endocrine pro�le of a�ected children reveals decreased levels of follicle-stimulating hormone and increased levels of luteinizing hormone. �e sonographic �ndings include bilateral enlargement of the ovaries, which contain multiple small follicles, usually 0.5–0.8 cm in diameter (Fig. 5.142). �e mean ovarian volume on ultrasound is 12–14 cm3.
Paraovarian cysts are of paramesonephric or mesothelial origin and arise in the broad ligament or Fallopian tubes. �eir classical ultrasound appearance is a �uid-�lled mass with thin walls. Paraovarian cysts are indistinguishable from other ovarian cysts, unless a normal ipsilateral ovary is seen separate from the cyst.
Benign ovarian neoplasmsMature ovarian teratoma, also known as dermoid cyst, is the commonest ovarian neoplasm in children. Clinically, girls present with a painless pelvic or abdominal mass. �e sonographic appearance of teratomas is variable because of their varied contents. �e classical ultrasound appearance is a predominantly cystic mass with a mural nodule containing varying amounts of fat and calci�cation. Septations, inter-nal debris and a fat �uid level may be seen (Fig. 5.143).
Serous and mucous ovarian cystadenomas are much less common than mature ovarian teratoma (Fig. 5.144). �ey appear as well-de�ned, thin-walled cystic masses with internal septa of varying thickness and irregularity. Calci�cation may be seen in the septations or the wall of the tumour.
Paed
iatr
ic u
ltras
ound
Fig. 5.142. Polycystic ovaries in a 14-year-old girl with obesity, amenorrhoea and hirsutism. Longitudinal scan of the right ovary (RO) shows an enlarged ovary with echogenic central stroma and multiple peripheral small follicles (arrows)
978-9241548540-C005 PRF ml YVR ln ml ml-1-Final Proof.indd 321 6/10/13 10:31 AM
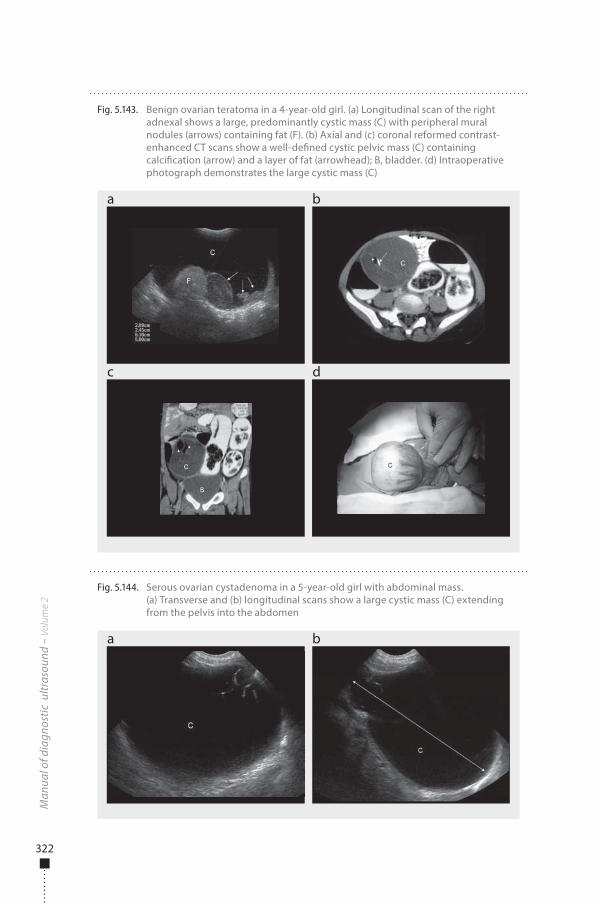
322
Man
ual o
f dia
gnos
tic u
ltras
ound
– V
olum
e 2
Fig. 5.143. Benign ovarian teratoma in a 4-year-old girl. (a) Longitudinal scan of the right adnexal shows a large, predominantly cystic mass (C) with peripheral mural nodules (arrows) containing fat (F). (b) Axial and (c) coronal reformed contrast-enhanced CT scans show a well-de�ned cystic pelvic mass (C) containing calci�cation (arrow) and a layer of fat (arrowhead); B, bladder. (d) Intraoperative photograph demonstrates the large cystic mass (C)
a
c d
b
Fig. 5.144. Serous ovarian cystadenoma in a 5-year-old girl with abdominal mass. (a) Transverse and (b) longitudinal scans show a large cystic mass (C) extending from the pelvis into the abdomen
a b
978-9241548540-C005 PRF ml YVR ln ml ml-1-Final Proof.indd 322 6/10/13 10:31 AM
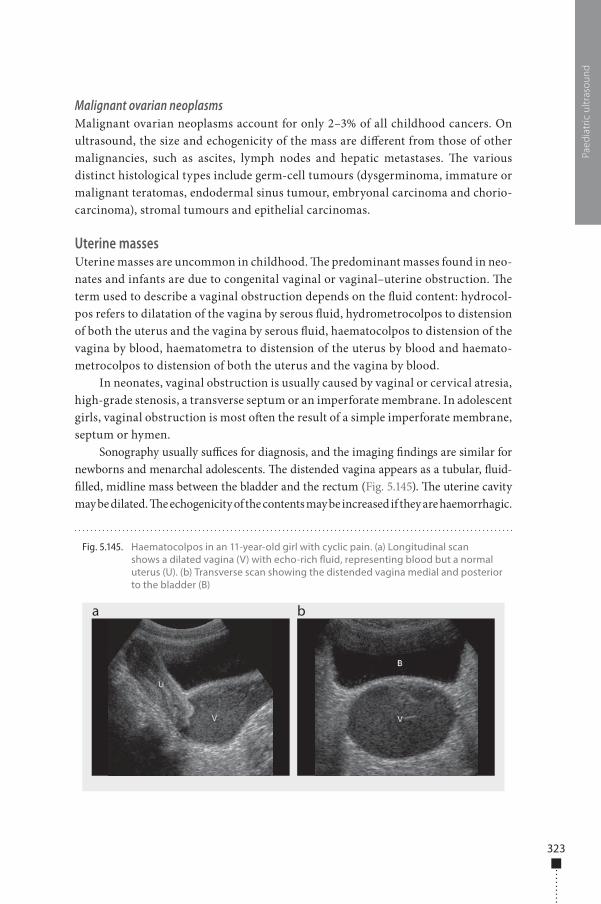
323
Malignant ovarian neoplasmsMalignant ovarian neoplasms account for only 2–3% of all childhood cancers. On ultrasound, the size and echogenicity of the mass are di�erent from those of other malignancies, such as ascites, lymph nodes and hepatic metastases. �e various distinct histological types include germ-cell tumours (dysgerminoma, immature or malignant teratomas, endodermal sinus tumour, embryonal carcinoma and chorio-carcinoma), stromal tumours and epithelial carcinomas.
Uterine massesUterine masses are uncommon in childhood. �e predominant masses found in neo-nates and infants are due to congenital vaginal or vaginal–uterine obstruction. �e term used to describe a vaginal obstruction depends on the �uid content: hydrocol-pos refers to dilatation of the vagina by serous �uid, hydrometrocolpos to distension of both the uterus and the vagina by serous �uid, haematocolpos to distension of the vagina by blood, haematometra to distension of the uterus by blood and haemato-metrocolpos to distension of both the uterus and the vagina by blood.
In neonates, vaginal obstruction is usually caused by vaginal or cervical atresia, high-grade stenosis, a transverse septum or an imperforate membrane. In adolescent girls, vaginal obstruction is most o�en the result of a simple imperforate membrane, septum or hymen.
Sonography usually su�ces for diagnosis, and the imaging �ndings are similar for newborns and menarchal adolescents. �e distended vagina appears as a tubular, �uid-�lled, midline mass between the bladder and the rectum (Fig. 5.145). �e uterine cavity may be dilated. �e echogenicity of the contents may be increased if they are haemorrhagic.
Paed
iatr
ic u
ltras
ound
Fig. 5.145. Haematocolpos in an 11-year-old girl with cyclic pain. (a) Longitudinal scan shows a dilated vagina (V) with echo-rich �uid, representing blood but a normal uterus (U). (b) Transverse scan showing the distended vagina medial and posterior to the bladder (B)
a b
978-9241548540-C005 PRF ml YVR ln ml ml-1-Final Proof.indd 323 6/10/13 10:31 AM
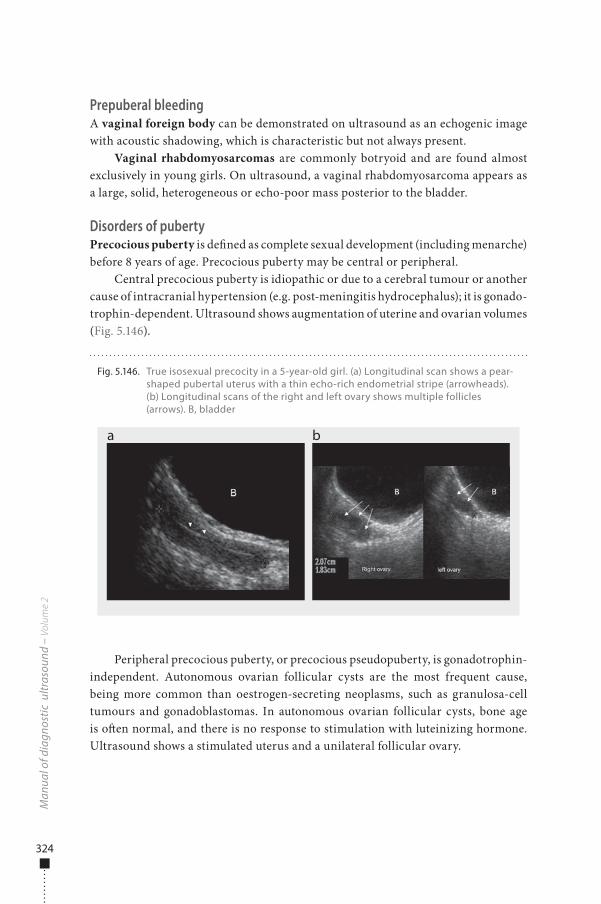
324
Prepuberal bleedingA vaginal foreign body can be demonstrated on ultrasound as an echogenic image with acoustic shadowing, which is characteristic but not always present.
Vaginal rhabdomyosarcomas are commonly botryoid and are found almost exclusively in young girls. On ultrasound, a vaginal rhabdomyosarcoma appears as a large, solid, heterogeneous or echo-poor mass posterior to the bladder.
Disorders of pubertyPrecocious puberty is de�ned as complete sexual development (including menarche) before 8 years of age. Precocious puberty may be central or peripheral.
Central precocious puberty is idiopathic or due to a cerebral tumour or another cause of intracranial hypertension (e.g. post-meningitis hydrocephalus); it is gonado-trophin-dependent. Ultrasound shows augmentation of uterine and ovarian volumes (Fig. 5.146).
Peripheral precocious puberty, or precocious pseudopuberty, is gonadotrophin-independent. Autonomous ovarian follicular cysts are the most frequent cause, being more common than oestrogen-secreting neoplasms, such as granulosa-cell tumours and gonadoblastomas. In autonomous ovarian follicular cysts, bone age is o�en normal, and there is no response to stimulation with luteinizing hormone. Ultrasound shows a stimulated uterus and a unilateral follicular ovary.
Man
ual o
f dia
gnos
tic u
ltras
ound
– V
olum
e 2
Fig. 5.146. True isosexual precocity in a 5-year-old girl. (a) Longitudinal scan shows a pear-shaped pubertal uterus with a thin echo-rich endometrial stripe (arrowheads). (b) Longitudinal scans of the right and left ovary shows multiple follicles (arrows). B, bladder
a b
978-9241548540-C005 PRF ml YVR ln ml ml-1-Final Proof.indd 324 6/10/13 10:31 AM
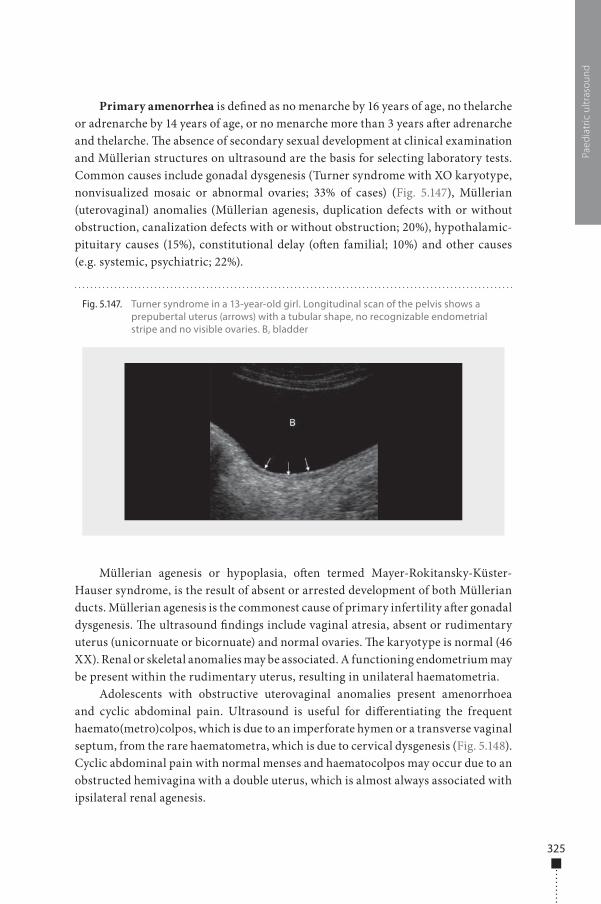
325
Primary amenorrhea is de�ned as no menarche by 16 years of age, no thelarche or adrenarche by 14 years of age, or no menarche more than 3 years a�er adrenarche and thelarche. �e absence of secondary sexual development at clinical examination and Müllerian structures on ultrasound are the basis for selecting laboratory tests. Common causes include gonadal dysgenesis (Turner syndrome with XO karyotype, nonvisualized mosaic or abnormal ovaries; 33% of cases) (Fig. 5.147), Müllerian (uterovaginal) anomalies (Müllerian agenesis, duplication defects with or without obstruction, canalization defects with or without obstruction; 20%), hypothalamic-pituitary causes (15%), constitutional delay (o�en familial; 10%) and other causes (e.g. systemic, psychiatric; 22%).
Müllerian agenesis or hypoplasia, o�en termed Mayer-Rokitansky-Küster-Hauser syndrome, is the result of absent or arrested development of both Müllerian ducts. Müllerian agenesis is the commonest cause of primary infertility a�er gonadal dysgenesis. �e ultrasound �ndings include vaginal atresia, absent or rudimentary uterus (unicornuate or bicornuate) and normal ovaries. �e karyotype is normal (46 XX). Renal or skeletal anomalies may be associated. A functioning endometrium may be present within the rudimentary uterus, resulting in unilateral haematometria.
Adolescents with obstructive uterovaginal anomalies present amenorrhoea and cyclic abdominal pain. Ultrasound is useful for di�erentiating the frequent haemato(metro)colpos, which is due to an imperforate hymen or a transverse vaginal septum, from the rare haematometra, which is due to cervical dysgenesis (Fig. 5.148). Cyclic abdominal pain with normal menses and haematocolpos may occur due to an obstructed hemivagina with a double uterus, which is almost always associated with ipsilateral renal agenesis.
Paed
iatr
ic u
ltras
ound
Fig. 5.147. Turner syndrome in a 13-year-old girl. Longitudinal scan of the pelvis shows a prepubertal uterus (arrows) with a tubular shape, no recognizable endometrial stripe and no visible ovaries. B, bladder
978-9241548540-C005 PRF ml YVR ln ml ml-1-Final Proof.indd 325 6/10/13 10:31 AM
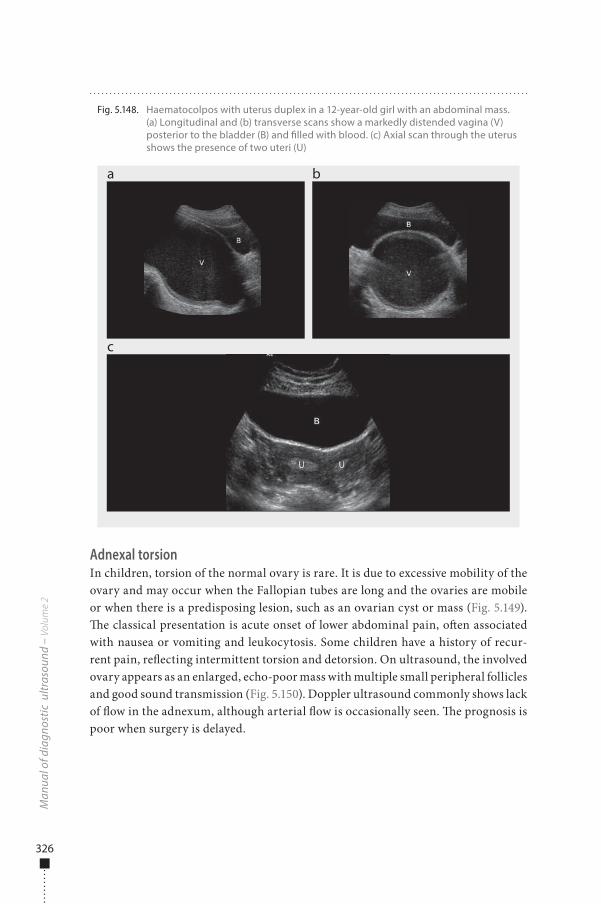
326
Adnexal torsionIn children, torsion of the normal ovary is rare. It is due to excessive mobility of the ovary and may occur when the Fallopian tubes are long and the ovaries are mobile or when there is a predisposing lesion, such as an ovarian cyst or mass (Fig. 5.149). �e classical presentation is acute onset of lower abdominal pain, o�en associated with nausea or vomiting and leukocytosis. Some children have a history of recur-rent pain, re�ecting intermittent torsion and detorsion. On ultrasound, the involved ovary appears as an enlarged, echo-poor mass with multiple small peripheral follicles and good sound transmission (Fig. 5.150). Doppler ultrasound commonly shows lack of �ow in the adnexum, although arterial �ow is occasionally seen. �e prognosis is poor when surgery is delayed.
Man
ual o
f dia
gnos
tic u
ltras
ound
– V
olum
e 2
Fig. 5.148. Haematocolpos with uterus duplex in a 12-year-old girl with an abdominal mass. (a) Longitudinal and (b) transverse scans show a markedly distended vagina (V) posterior to the bladder (B) and �lled with blood. (c) Axial scan through the uterus shows the presence of two uteri (U)
a
c
b
978-9241548540-C005 PRF ml YVR ln ml ml-1-Final Proof.indd 326 6/10/13 10:31 AM
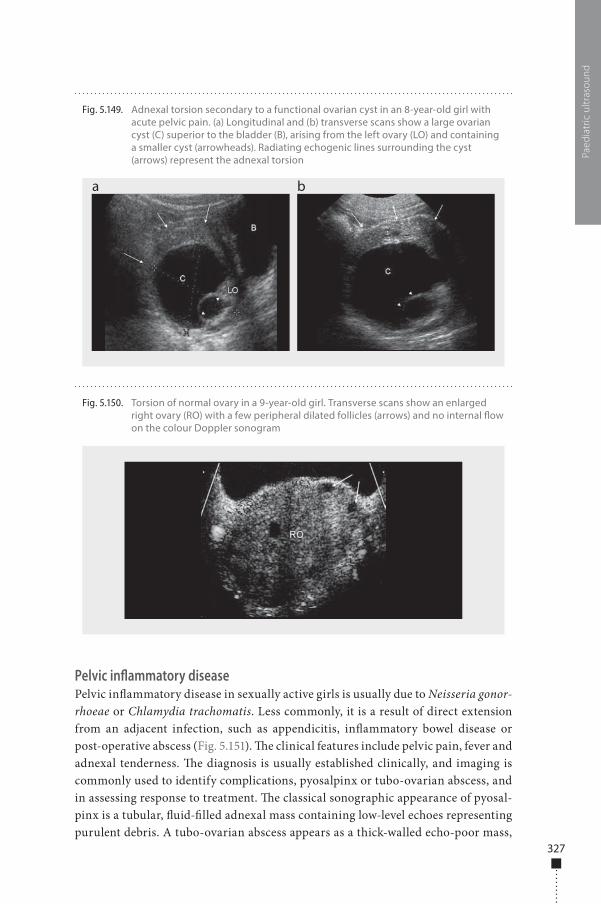
327
Pelvic inflammatory diseasePelvic in�ammatory disease in sexually active girls is usually due to Neisseria gonor-rhoeae or Chlamydia trachomatis. Less commonly, it is a result of direct extension from an adjacent infection, such as appendicitis, in�ammatory bowel disease or post-operative abscess (Fig. 5.151). �e clinical features include pelvic pain, fever and adnexal tenderness. �e diagnosis is usually established clinically, and imaging is commonly used to identify complications, pyosalpinx or tubo-ovarian abscess, and in assessing response to treatment. �e classical sonographic appearance of pyosal-pinx is a tubular, �uid-�lled adnexal mass containing low-level echoes representing purulent debris. A tubo-ovarian abscess appears as a thick-walled echo-poor mass,
Paed
iatr
ic u
ltras
ound
Fig. 5.149. Adnexal torsion secondary to a functional ovarian cyst in an 8-year-old girl with acute pelvic pain. (a) Longitudinal and (b) transverse scans show a large ovarian cyst (C) superior to the bladder (B), arising from the left ovary (LO) and containing a smaller cyst (arrowheads). Radiating echogenic lines surrounding the cyst (arrows) represent the adnexal torsion
a b
Fig. 5.150. Torsion of normal ovary in a 9-year-old girl. Transverse scans show an enlarged right ovary (RO) with a few peripheral dilated follicles (arrows) and no internal �ow on the colour Doppler sonogram
978-9241548540-C005 PRF ml YVR ln ml ml-1-Final Proof.indd 327 6/10/13 10:31 AM
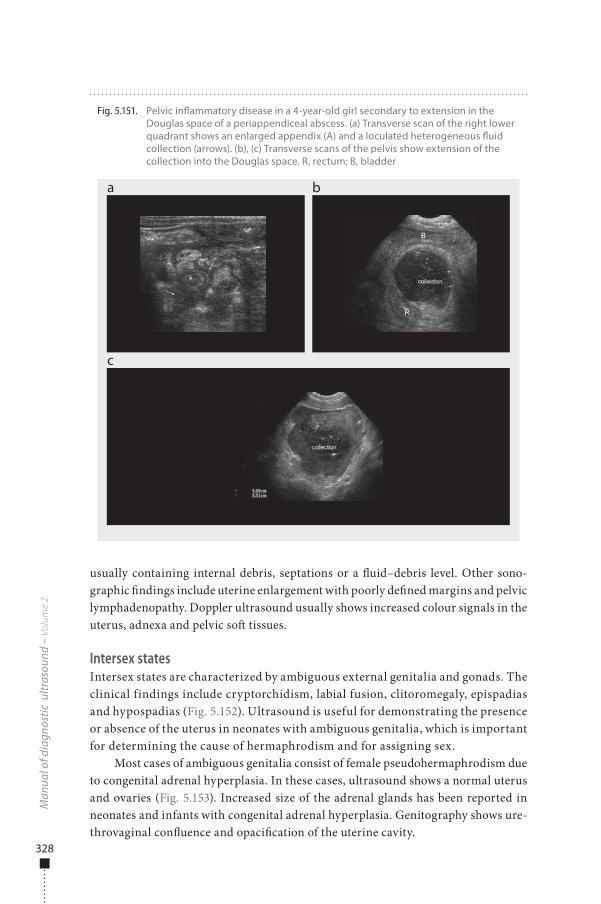
328
usually containing internal debris, septations or a �uid–debris level. Other sono-graphic �ndings include uterine enlargement with poorly de�ned margins and pelvic lymphadenopathy. Doppler ultrasound usually shows increased colour signals in the uterus, adnexa and pelvic so� tissues.
Intersex statesIntersex states are characterized by ambiguous external genitalia and gonads. The clinical findings include cryptorchidism, labial fusion, clitoromegaly, epispadias and hypospadias (Fig. 5.152). Ultrasound is useful for demonstrating the presence or absence of the uterus in neonates with ambiguous genitalia, which is important for determining the cause of hermaphrodism and for assigning sex.
Most cases of ambiguous genitalia consist of female pseudohermaphrodism due to congenital adrenal hyperplasia. In these cases, ultrasound shows a normal uterus and ovaries (Fig. 5.153). Increased size of the adrenal glands has been reported in neonates and infants with congenital adrenal hyperplasia. Genitography shows ure-throvaginal con�uence and opaci�cation of the uterine cavity.
Man
ual o
f dia
gnos
tic u
ltras
ound
– V
olum
e 2
Fig. 5.151. Pelvic in�ammatory disease in a 4-year-old girl secondary to extension in the Douglas space of a periappendiceal abscess. (a) Transverse scan of the right lower quadrant shows an enlarged appendix (A) and a loculated heterogeneous �uid collection (arrows). (b), (c) Transverse scans of the pelvis show extension of the collection into the Douglas space. R, rectum; B, bladder
a
c
b
978-9241548540-C005 PRF ml YVR ln ml ml-1-Final Proof.indd 328 6/10/13 10:31 AM
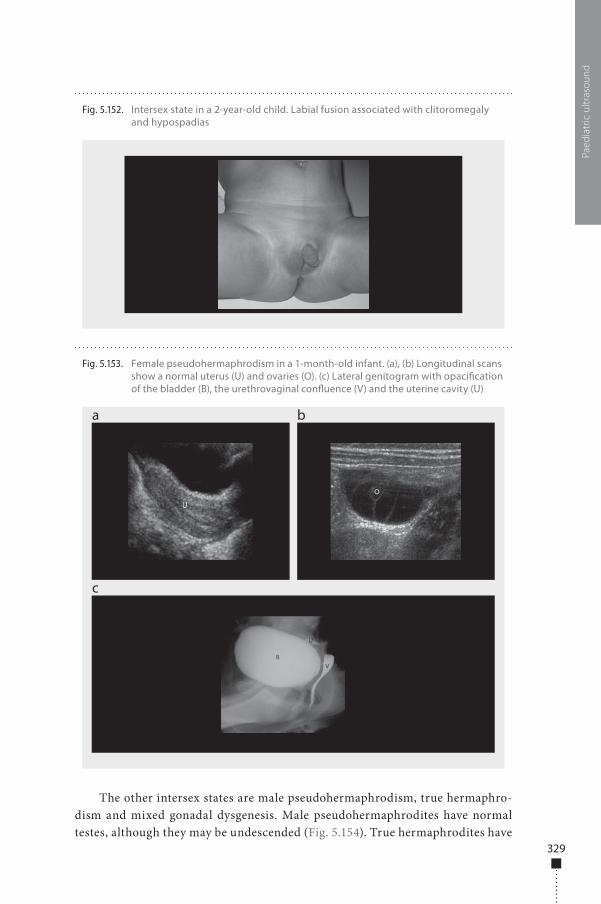
329
The other intersex states are male pseudohermaphrodism, true hermaphro-dism and mixed gonadal dysgenesis. Male pseudohermaphrodites have normal testes, although they may be undescended (Fig. 5.154). True hermaphrodites have
Paed
iatr
ic u
ltras
ound
Fig. 5.153. Female pseudohermaphrodism in a 1-month-old infant. (a), (b) Longitudinal scans show a normal uterus (U) and ovaries (O). (c) Lateral genitogram with opaci�cation of the bladder (B), the urethrovaginal con�uence (V) and the uterine cavity (U)
a
c
b
Fig. 5.152. Intersex state in a 2-year-old child. Labial fusion associated with clitoromegaly and hypospadias
978-9241548540-C005 PRF ml YVR ln ml ml-1-Final Proof.indd 329 6/10/13 10:31 AM
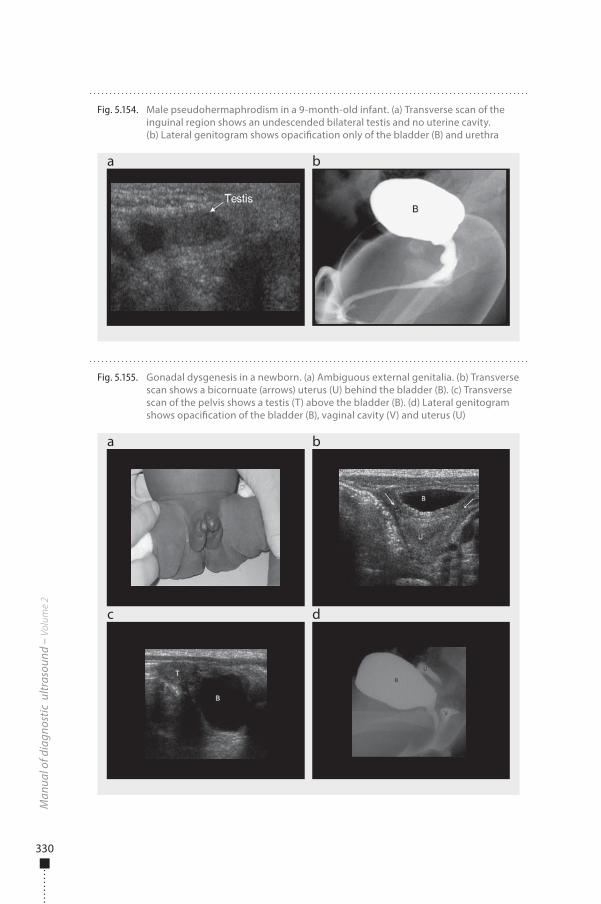
330
Man
ual o
f dia
gnos
tic u
ltras
ound
– V
olum
e 2
Fig. 5.154. Male pseudohermaphrodism in a 9-month-old infant. (a) Transverse scan of the inguinal region shows an undescended bilateral testis and no uterine cavity. (b) Lateral genitogram shows opaci�cation only of the bladder (B) and urethra
a b
Fig. 5.155. Gonadal dysgenesis in a newborn. (a) Ambiguous external genitalia. (b) Transverse scan shows a bicornuate (arrows) uterus (U) behind the bladder (B). (c) Transverse scan of the pelvis shows a testis (T) above the bladder (B). (d) Lateral genitogram shows opaci�cation of the bladder (B), vaginal cavity (V) and uterus (U)
a
c
b
d
978-9241548540-C005 PRF ml YVR ln ml ml-1-Final Proof.indd 330 6/10/13 10:31 AM
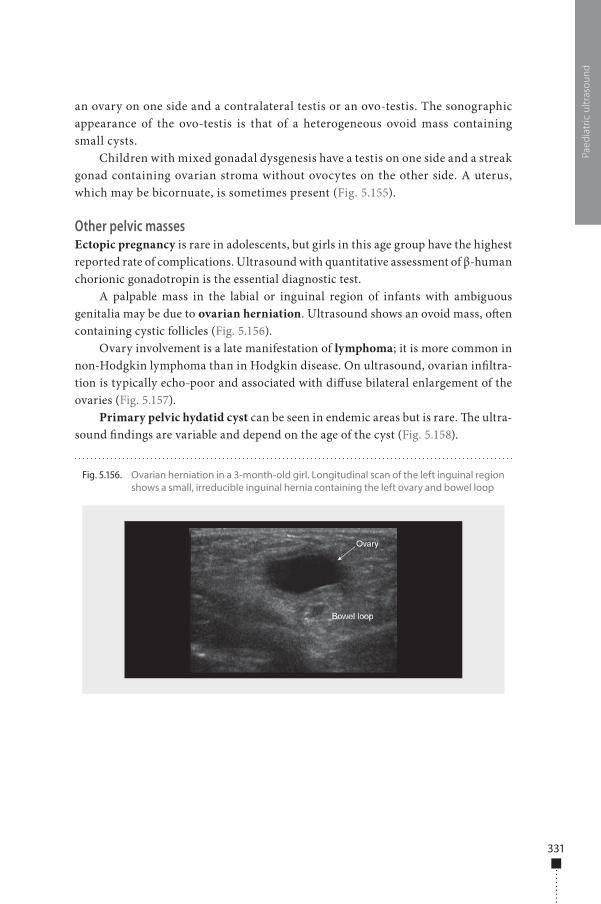
331
an ovary on one side and a contralateral testis or an ovo-testis. The sonographic appearance of the ovo-testis is that of a heterogeneous ovoid mass containing small cysts.
Children with mixed gonadal dysgenesis have a testis on one side and a streak gonad containing ovarian stroma without ovocytes on the other side. A uterus, which may be bicornuate, is sometimes present (Fig. 5.155).
Other pelvic massesEctopic pregnancy is rare in adolescents, but girls in this age group have the highest reported rate of complications. Ultrasound with quantitative assessment of β-human chorionic gonadotropin is the essential diagnostic test.
A palpable mass in the labial or inguinal region of infants with ambiguous genitalia may be due to ovarian herniation. Ultrasound shows an ovoid mass, o�en containing cystic follicles (Fig. 5.156).
Ovary involvement is a late manifestation of lymphoma; it is more common in non-Hodgkin lymphoma than in Hodgkin disease. On ultrasound, ovarian in�ltra-tion is typically echo-poor and associated with di�use bilateral enlargement of the ovaries (Fig. 5.157).
Primary pelvic hydatid cyst can be seen in endemic areas but is rare. �e ultra-sound �ndings are variable and depend on the age of the cyst (Fig. 5.158).
Paed
iatr
ic u
ltras
ound
Fig. 5.156. Ovarian herniation in a 3-month-old girl. Longitudinal scan of the left inguinal region shows a small, irreducible inguinal hernia containing the left ovary and bowel loop
978-9241548540-C005 PRF ml YVR ln ml ml-1-Final Proof.indd 331 6/10/13 10:31 AM
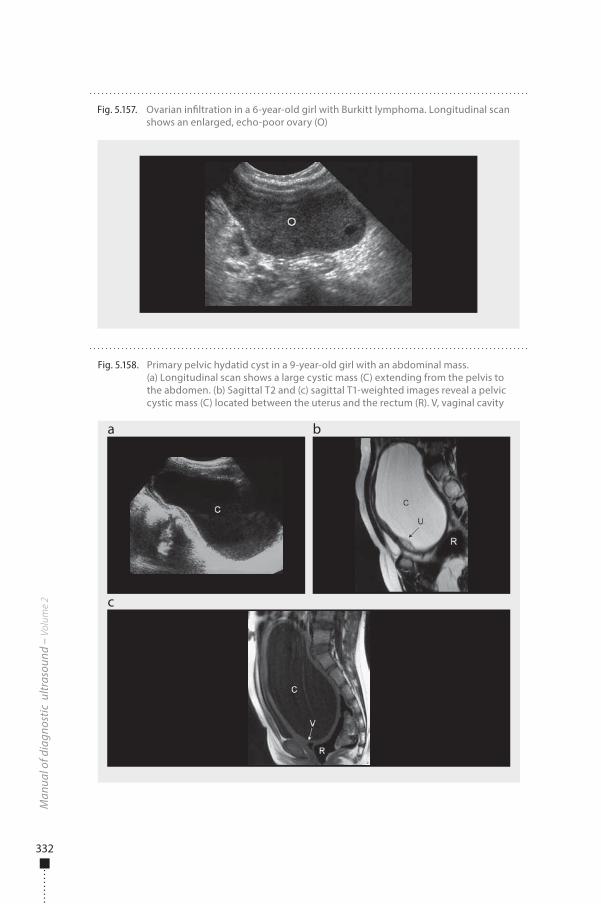
332
Man
ual o
f dia
gnos
tic u
ltras
ound
– V
olum
e 2
Fig. 5.157. Ovarian in�ltration in a 6-year-old girl with Burkitt lymphoma. Longitudinal scan shows an enlarged, echo-poor ovary (O)
Fig. 5.158. Primary pelvic hydatid cyst in a 9-year-old girl with an abdominal mass. (a) Longitudinal scan shows a large cystic mass (C) extending from the pelvis to the abdomen. (b) Sagittal T2 and (c) sagittal T1-weighted images reveal a pelvic cystic mass (C) located between the uterus and the rectum (R). V, vaginal cavity
a
c
b
978-9241548540-C005 PRF ml YVR ln ml ml-1-Final Proof.indd 332 6/10/13 10:31 AM
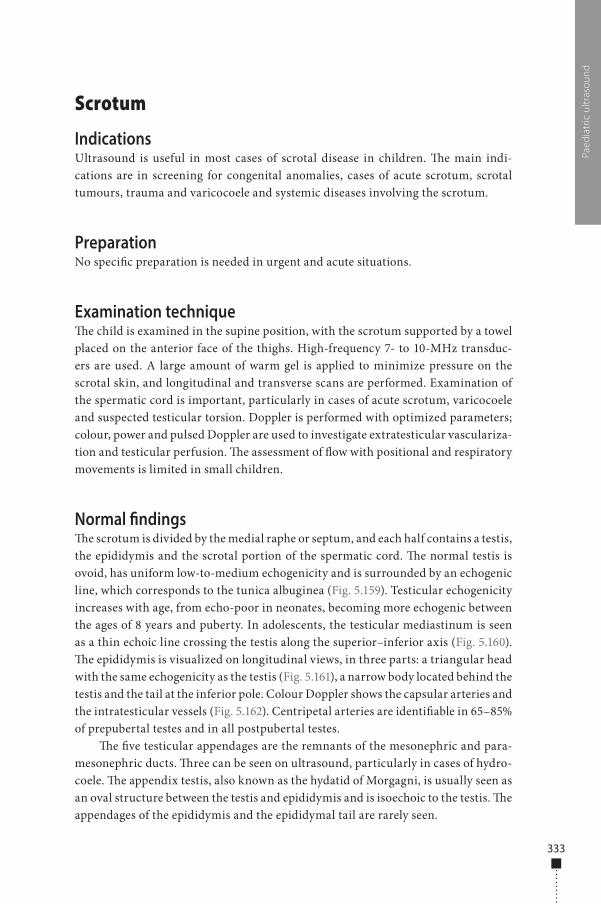
333
Scrotum
IndicationsUltrasound is useful in most cases of scrotal disease in children. �e main indi-cations are in screening for congenital anomalies, cases of acute scrotum, scrotal tumours, trauma and varicocoele and systemic diseases involving the scrotum.
PreparationNo speci�c preparation is needed in urgent and acute situations.
Examination technique�e child is examined in the supine position, with the scrotum supported by a towel placed on the anterior face of the thighs. High-frequency 7- to 10-MHz transduc-ers are used. A large amount of warm gel is applied to minimize pressure on the scrotal skin, and longitudinal and transverse scans are performed. Examination of the spermatic cord is important, particularly in cases of acute scrotum, varicocoele and suspected testicular torsion. Doppler is performed with optimized parameters; colour, power and pulsed Doppler are used to investigate extratesticular vasculariza-tion and testicular perfusion. �e assessment of �ow with positional and respiratory movements is limited in small children.
Normal �ndings�e scrotum is divided by the medial raphe or septum, and each half contains a testis, the epididymis and the scrotal portion of the spermatic cord. �e normal testis is ovoid, has uniform low-to-medium echogenicity and is surrounded by an echogenic line, which corresponds to the tunica albuginea (Fig. 5.159). Testicular echogenicity increases with age, from echo-poor in neonates, becoming more echogenic between the ages of 8 years and puberty. In adolescents, the testicular mediastinum is seen as a thin echoic line crossing the testis along the superior–inferior axis (Fig. 5.160). �e epididymis is visualized on longitudinal views, in three parts: a triangular head with the same echogenicity as the testis (Fig. 5.161), a narrow body located behind the testis and the tail at the inferior pole. Colour Doppler shows the capsular arteries and the intratesticular vessels (Fig. 5.162). Centripetal arteries are identi�able in 65–85% of prepubertal testes and in all postpubertal testes.
�e �ve testicular appendages are the remnants of the mesonephric and para-mesonephric ducts. �ree can be seen on ultrasound, particularly in cases of hydro-coele. �e appendix testis, also known as the hydatid of Morgagni, is usually seen as an oval structure between the testis and epididymis and is isoechoic to the testis. �e appendages of the epididymis and the epididymal tail are rarely seen.
Paed
iatr
ic u
ltras
ound
978-9241548540-C005 PRF ml YVR ln ml ml-1-Final Proof.indd 333 6/10/13 10:31 AM
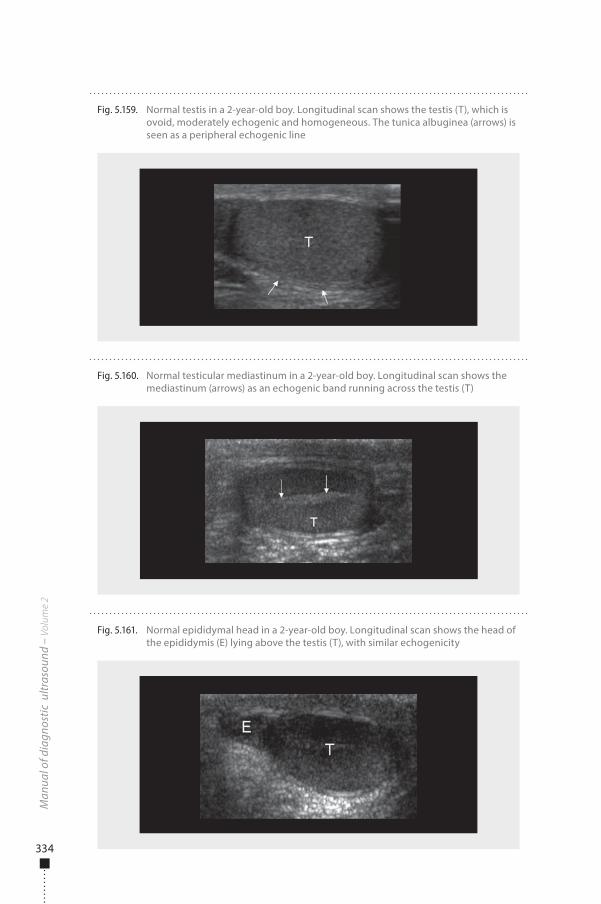
334
Man
ual o
f dia
gnos
tic u
ltras
ound
– V
olum
e 2
Fig. 5.161. Normal epididymal head in a 2-year-old boy. Longitudinal scan shows the head of the epididymis (E) lying above the testis (T), with similar echogenicity
Fig. 5.159. Normal testis in a 2-year-old boy. Longitudinal scan shows the testis (T), which is ovoid, moderately echogenic and homogeneous. The tunica albuginea (arrows) is seen as a peripheral echogenic line
Fig. 5.160. Normal testicular mediastinum in a 2-year-old boy. Longitudinal scan shows the mediastinum (arrows) as an echogenic band running across the testis (T)
978-9241548540-C005 PRF ml YVR ln ml ml-1-Final Proof.indd 334 6/10/13 10:31 AM
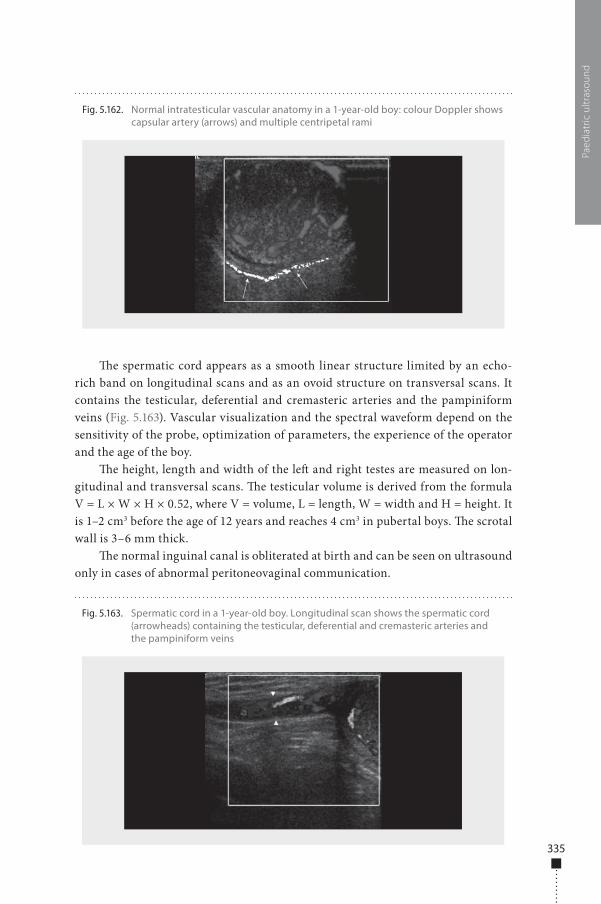
335
�e spermatic cord appears as a smooth linear structure limited by an echo-rich band on longitudinal scans and as an ovoid structure on transversal scans. It contains the testicular, deferential and cremasteric arteries and the pampiniform veins (Fig. 5.163). Vascular visualization and the spectral waveform depend on the sensitivity of the probe, optimization of parameters, the experience of the operator and the age of the boy.
�e height, length and width of the le� and right testes are measured on lon-gitudinal and transversal scans. �e testicular volume is derived from the formula V = L × W × H × 0.52, where V = volume, L = length, W = width and H = height. It is 1–2 cm3 before the age of 12 years and reaches 4 cm3 in pubertal boys. �e scrotal wall is 3–6 mm thick.
�e normal inguinal canal is obliterated at birth and can be seen on ultrasound only in cases of abnormal peritoneovaginal communication.
Paed
iatr
ic u
ltras
ound
Fig. 5.162. Normal intratesticular vascular anatomy in a 1-year-old boy: colour Doppler shows capsular artery (arrows) and multiple centripetal rami
Fig. 5.163. Spermatic cord in a 1-year-old boy. Longitudinal scan shows the spermatic cord (arrowheads) containing the testicular, deferential and cremasteric arteries and the pampiniform veins
978-9241548540-C005 PRF ml YVR ln ml ml-1-Final Proof.indd 335 6/10/13 10:31 AM
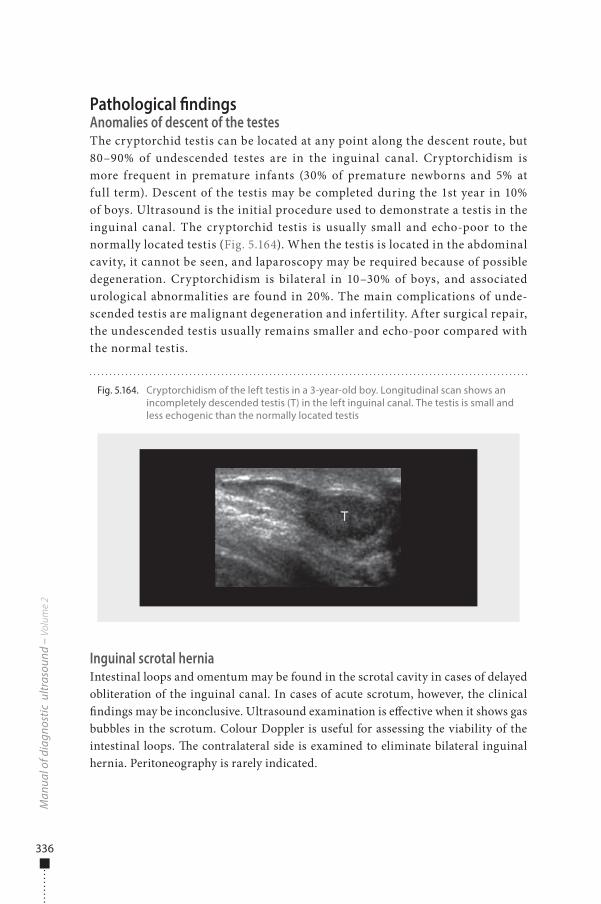
336
Pathological �ndingsAnomalies of descent of the testesThe cryptorchid testis can be located at any point along the descent route, but 80–90% of undescended testes are in the inguinal canal. Cryptorchidism is more frequent in premature infants (30% of premature newborns and 5% at full term). Descent of the testis may be completed during the 1st year in 10% of boys. Ultrasound is the initial procedure used to demonstrate a testis in the inguinal canal. The cryptorchid testis is usually small and echo-poor to the normally located testis (Fig. 5.164). When the testis is located in the abdominal cavity, it cannot be seen, and laparoscopy may be required because of possible degeneration. Cryptorchidism is bilateral in 10–30% of boys, and associated urological abnormalities are found in 20%. The main complications of unde-scended testis are malignant degeneration and infertility. After surgical repair, the undescended testis usually remains smaller and echo-poor compared with the normal testis.
Inguinal scrotal herniaIntestinal loops and omentum may be found in the scrotal cavity in cases of delayed obliteration of the inguinal canal. In cases of acute scrotum, however, the clinical �ndings may be inconclusive. Ultrasound examination is e�ective when it shows gas bubbles in the scrotum. Colour Doppler is useful for assessing the viability of the intestinal loops. �e contralateral side is examined to eliminate bilateral inguinal hernia. Peritoneography is rarely indicated.
Man
ual o
f dia
gnos
tic u
ltras
ound
– V
olum
e 2
Fig. 5.164. Cryptorchidism of the left testis in a 3-year-old boy. Longitudinal scan shows an incompletely descended testis (T) in the left inguinal canal. The testis is small and less echogenic than the normally located testis
978-9241548540-C005 PRF ml YVR ln ml ml-1-Final Proof.indd 336 6/10/13 10:31 AM
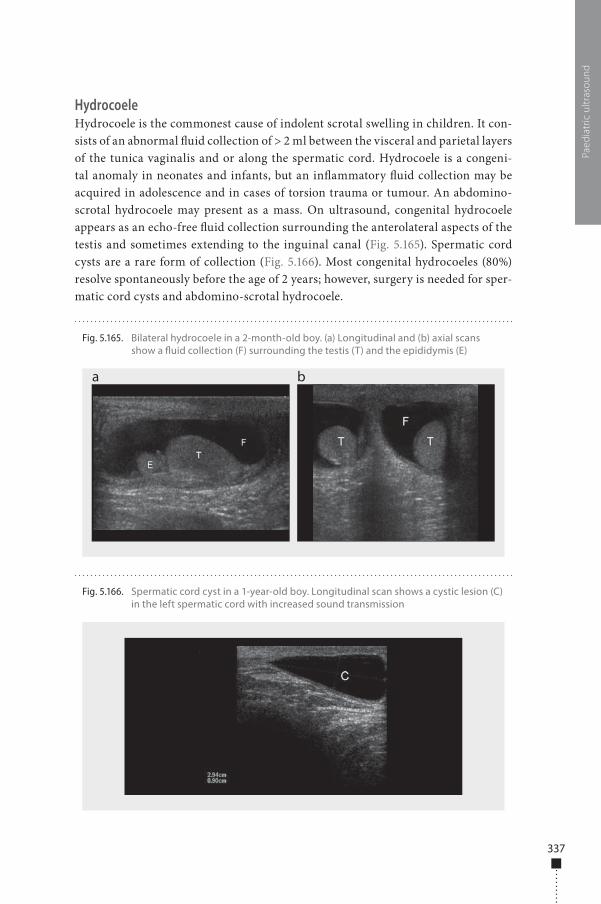
337
HydrocoeleHydrocoele is the commonest cause of indolent scrotal swelling in children. It con-sists of an abnormal �uid collection of > 2 ml between the visceral and parietal layers of the tunica vaginalis and or along the spermatic cord. Hydrocoele is a congeni-tal anomaly in neonates and infants, but an in�ammatory �uid collection may be acquired in adolescence and in cases of torsion trauma or tumour. An abdomino-scrotal hydrocoele may present as a mass. On ultrasound, congenital hydrocoele appears as an echo-free �uid collection surrounding the anterolateral aspects of the testis and sometimes extending to the inguinal canal (Fig. 5.165). Spermatic cord cysts are a rare form of collection (Fig. 5.166). Most congenital hydrocoeles (80%) resolve spontaneously before the age of 2 years; however, surgery is needed for sper-matic cord cysts and abdomino-scrotal hydrocoele.
Paed
iatr
ic u
ltras
ound
Fig. 5.165. Bilateral hydrocoele in a 2-month-old boy. (a) Longitudinal and (b) axial scans show a �uid collection (F) surrounding the testis (T) and the epididymis (E)
a b
Fig. 5.166. Spermatic cord cyst in a 1-year-old boy. Longitudinal scan shows a cystic lesion (C) in the left spermatic cord with increased sound transmission
978-9241548540-C005 PRF ml YVR ln ml ml-1-Final Proof.indd 337 6/10/13 10:31 AM
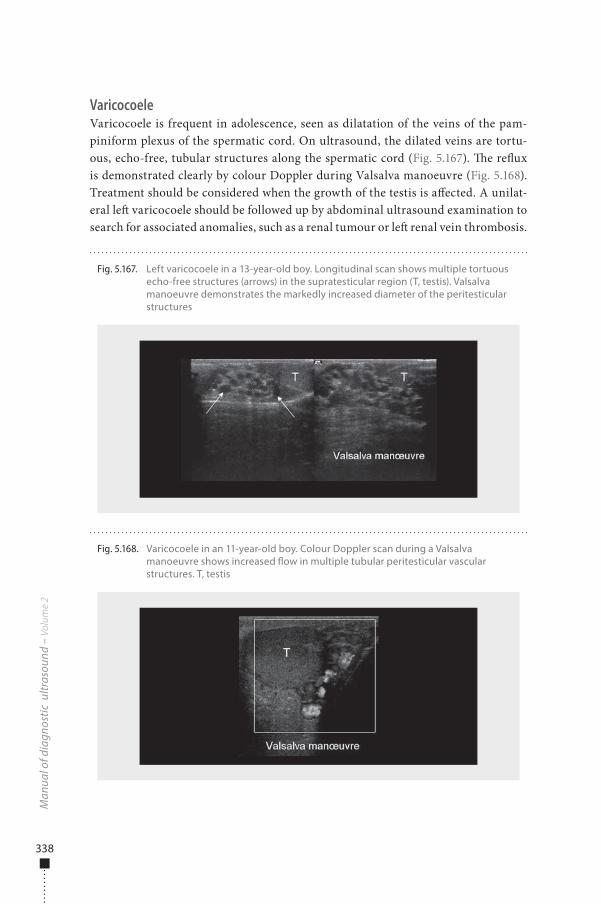
338
VaricocoeleVaricocoele is frequent in adolescence, seen as dilatation of the veins of the pam-piniform plexus of the spermatic cord. On ultrasound, the dilated veins are tortu-ous, echo-free, tubular structures along the spermatic cord (Fig. 5.167). �e re�ux is demonstrated clearly by colour Doppler during Valsalva manoeuvre (Fig. 5.168). Treatment should be considered when the growth of the testis is a�ected. A unilat-eral le� varicocoele should be followed up by abdominal ultrasound examination to search for associated anomalies, such as a renal tumour or le� renal vein thrombosis.
Man
ual o
f dia
gnos
tic u
ltras
ound
– V
olum
e 2
Fig. 5.167. Left varicocoele in a 13-year-old boy. Longitudinal scan shows multiple tortuous echo-free structures (arrows) in the supratesticular region (T, testis). Valsalva manoeuvre demonstrates the markedly increased diameter of the peritesticular structures
Fig. 5.168. Varicocoele in an 11-year-old boy. Colour Doppler scan during a Valsalva manoeuvre shows increased �ow in multiple tubular peritesticular vascular structures. T, testis
978-9241548540-C005 PRF ml YVR ln ml ml-1-Final Proof.indd 338 6/10/13 10:31 AM
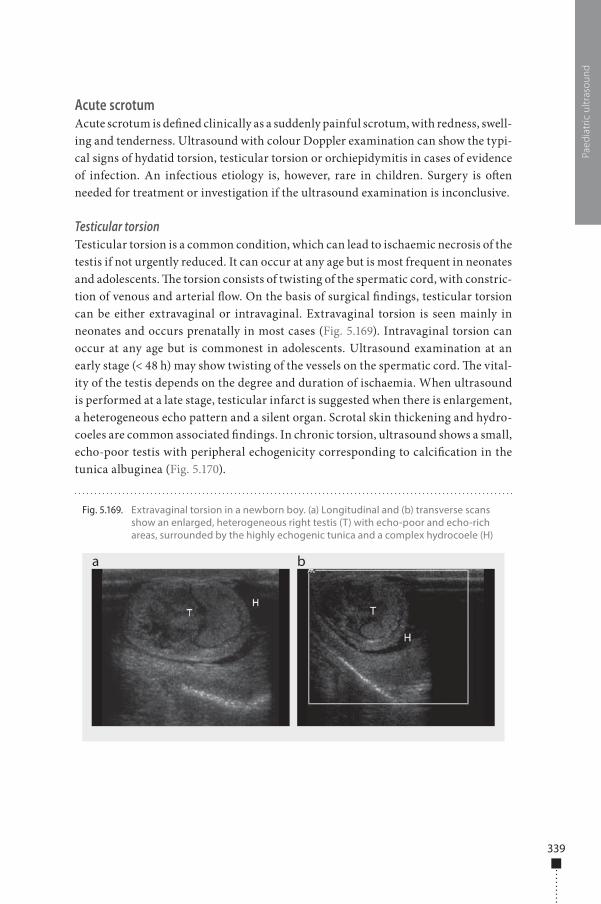
339
Acute scrotumAcute scrotum is de�ned clinically as a suddenly painful scrotum, with redness, swell-ing and tenderness. Ultrasound with colour Doppler examination can show the typi-cal signs of hydatid torsion, testicular torsion or orchiepidymitis in cases of evidence of infection. An infectious etiology is, however, rare in children. Surgery is o�en needed for treatment or investigation if the ultrasound examination is inconclusive.
Testicular torsionTesticular torsion is a common condition, which can lead to ischaemic necrosis of the testis if not urgently reduced. It can occur at any age but is most frequent in neonates and adolescents. �e torsion consists of twisting of the spermatic cord, with constric-tion of venous and arterial �ow. On the basis of surgical �ndings, testicular torsion can be either extravaginal or intravaginal. Extravaginal torsion is seen mainly in neonates and occurs prenatally in most cases (Fig. 5.169). Intravaginal torsion can occur at any age but is commonest in adolescents. Ultrasound examination at an early stage (< 48 h) may show twisting of the vessels on the spermatic cord. �e vital-ity of the testis depends on the degree and duration of ischaemia. When ultrasound is performed at a late stage, testicular infarct is suggested when there is enlargement, a heterogeneous echo pattern and a silent organ. Scrotal skin thickening and hydro-coeles are common associated �ndings. In chronic torsion, ultrasound shows a small, echo-poor testis with peripheral echogenicity corresponding to calci�cation in the tunica albuginea (Fig. 5.170).
Paed
iatr
ic u
ltras
ound
Fig. 5.169. Extravaginal torsion in a newborn boy. (a) Longitudinal and (b) transverse scans show an enlarged, heterogeneous right testis (T) with echo-poor and echo-rich areas, surrounded by the highly echogenic tunica and a complex hydrocoele (H)
a b
978-9241548540-C005 PRF ml YVR ln ml ml-1-Final Proof.indd 339 6/10/13 10:31 AM
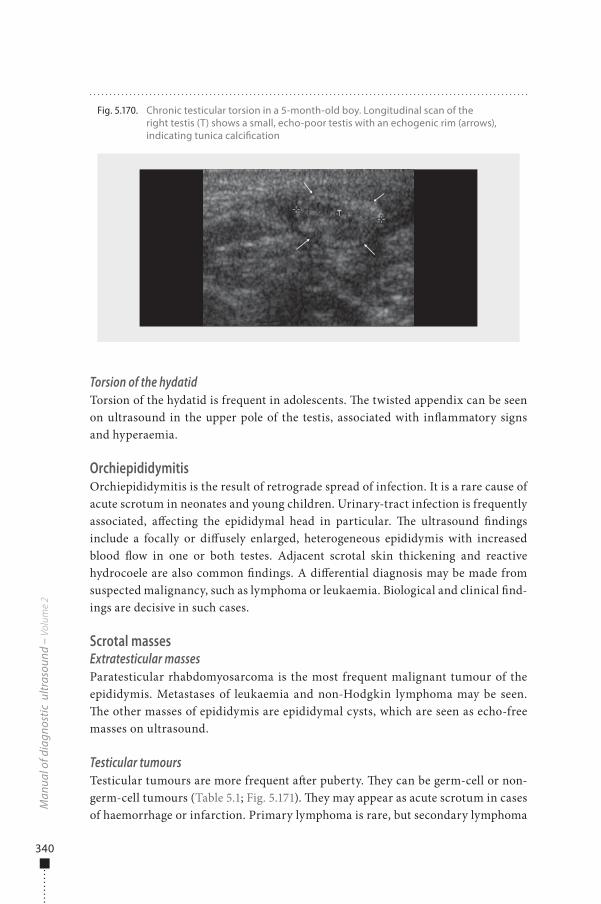
340
Torsion of the hydatidTorsion of the hydatid is frequent in adolescents. �e twisted appendix can be seen on ultrasound in the upper pole of the testis, associated with in�ammatory signs and hyperaemia.
OrchiepididymitisOrchiepididymitis is the result of retrograde spread of infection. It is a rare cause of acute scrotum in neonates and young children. Urinary-tract infection is frequently associated, a�ecting the epididymal head in particular. �e ultrasound �ndings include a focally or di�usely enlarged, heterogeneous epididymis with increased blood �ow in one or both testes. Adjacent scrotal skin thickening and reactive hydrocoele are also common �ndings. A di�erential diagnosis may be made from suspected malignancy, such as lymphoma or leukaemia. Biological and clinical �nd-ings are decisive in such cases.
Scrotal massesExtratesticular massesParatesticular rhabdomyosarcoma is the most frequent malignant tumour of the epididymis. Metastases of leukaemia and non-Hodgkin lymphoma may be seen. �e other masses of epididymis are epididymal cysts, which are seen as echo-free masses on ultrasound.
Testicular tumoursTesticular tumours are more frequent a�er puberty. �ey can be germ-cell or non-germ-cell tumours (Table 5.1; Fig. 5.171). �ey may appear as acute scrotum in cases of haemorrhage or infarction. Primary lymphoma is rare, but secondary lymphoma
Man
ual o
f dia
gnos
tic u
ltras
ound
– V
olum
e 2
Fig. 5.170. Chronic testicular torsion in a 5-month-old boy. Longitudinal scan of the right testis (T) shows a small, echo-poor testis with an echogenic rim (arrows), indicating tunica calci�cation
978-9241548540-C005 PRF ml YVR ln ml ml-1-Final Proof.indd 340 6/10/13 10:31 AM
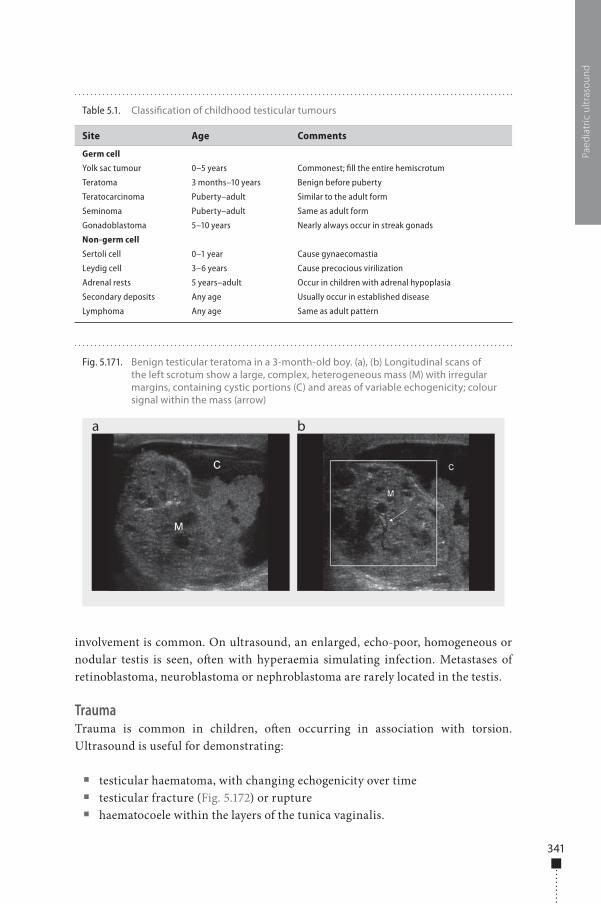
341
involvement is common. On ultrasound, an enlarged, echo-poor, homogeneous or nodular testis is seen, o�en with hyperaemia simulating infection. Metastases of retinoblastoma, neuroblastoma or nephroblastoma are rarely located in the testis.
TraumaTrauma is common in children, o�en occurring in association with torsion. Ultrasound is useful for demonstrating:
■ testicular haematoma, with changing echogenicity over time ■ testicular fracture (Fig. 5.172) or rupture ■ haematocoele within the layers of the tunica vaginalis.
Paed
iatr
ic u
ltras
ound
Fig. 5.171. Benign testicular teratoma in a 3-month-old boy. (a), (b) Longitudinal scans of the left scrotum show a large, complex, heterogeneous mass (M) with irregular margins, containing cystic portions (C) and areas of variable echogenicity; colour signal within the mass (arrow)
a b
Table 5.1. Classi�cation of childhood testicular tumours
Site Age Comments
Germ cell
Yolk sac tumour 0–5 years Commonest; fill the entire hemiscrotum
Teratoma 3 months–10 years Benign before puberty
Teratocarcinoma Puberty–adult Similar to the adult form
Seminoma Puberty–adult Same as adult form
Gonadoblastoma 5–10 years Nearly always occur in streak gonads
Non-germ cell
Sertoli cell 0–1 year Cause gynaecomastia
Leydig cell 3–6 years Cause precocious virilization
Adrenal rests 5 years–adult Occur in children with adrenal hypoplasia
Secondary deposits Any age Usually occur in established disease
Lymphoma Any age Same as adult pattern
978-9241548540-C005 PRF ml YVR ln ml ml-1-Final Proof.indd 341 6/10/13 10:31 AM
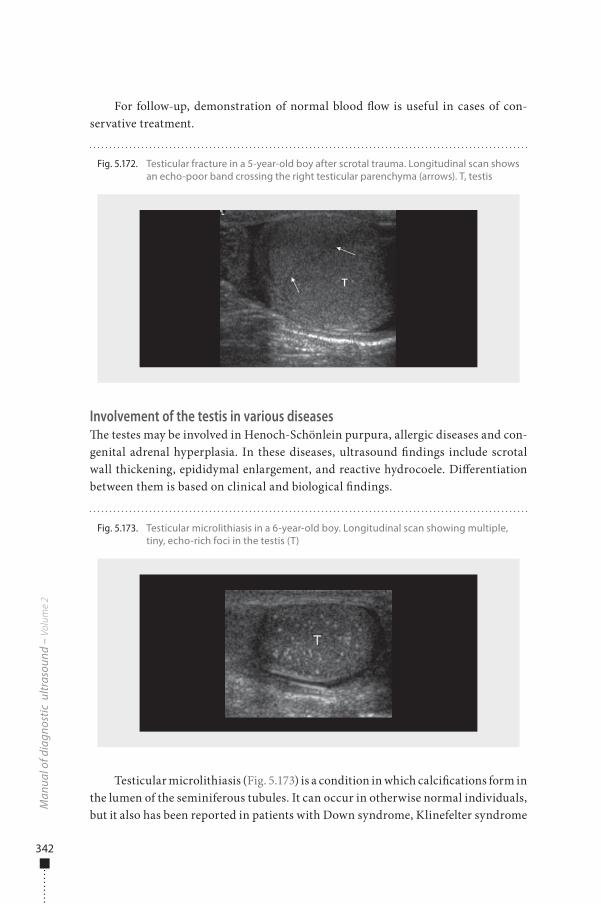
342
For follow-up, demonstration of normal blood �ow is useful in cases of con-servative treatment.
Involvement of the testis in various diseases�e testes may be involved in Henoch-Schönlein purpura, allergic diseases and con-genital adrenal hyperplasia. In these diseases, ultrasound �ndings include scrotal wall thickening, epididymal enlargement, and reactive hydrocoele. Di�erentiation between them is based on clinical and biological �ndings.
Testicular microlithiasis (Fig. 5.173) is a condition in which calci�cations form in the lumen of the seminiferous tubules. It can occur in otherwise normal individuals, but it also has been reported in patients with Down syndrome, Klinefelter syndrome
Man
ual o
f dia
gnos
tic u
ltras
ound
– V
olum
e 2
Fig. 5.172. Testicular fracture in a 5-year-old boy after scrotal trauma. Longitudinal scan shows an echo-poor band crossing the right testicular parenchyma (arrows). T, testis
Fig. 5.173. Testicular microlithiasis in a 6-year-old boy. Longitudinal scan showing multiple, tiny, echo-rich foci in the testis (T)
978-9241548540-C005 PRF ml YVR ln ml ml-1-Final Proof.indd 342 6/10/13 10:31 AM
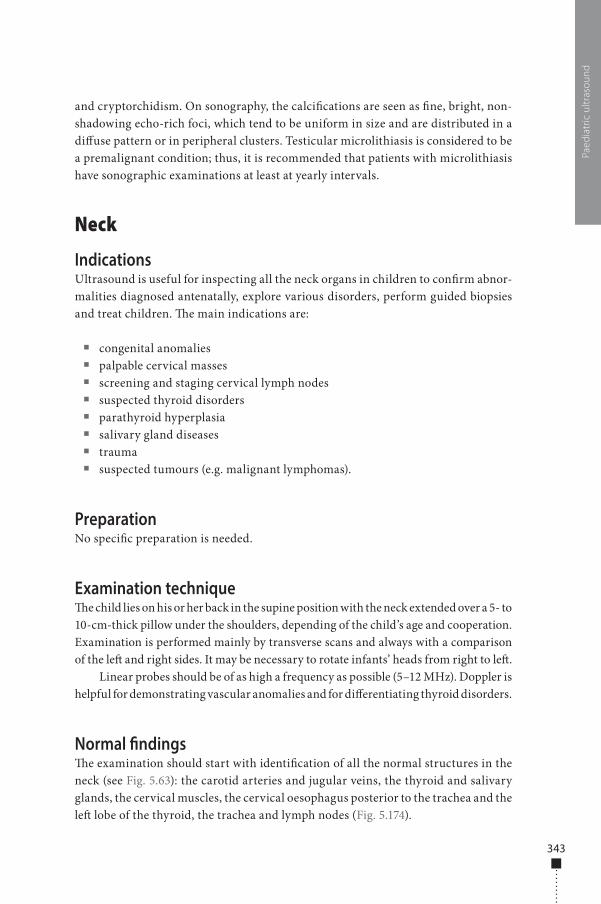
343
and cryptorchidism. On sonography, the calci�cations are seen as �ne, bright, non-shadowing echo-rich foci, which tend to be uniform in size and are distributed in a di�use pattern or in peripheral clusters. Testicular microlithiasis is considered to be a premalignant condition; thus, it is recommended that patients with microlithiasis have sonographic examinations at least at yearly intervals.
Neck
IndicationsUltrasound is useful for inspecting all the neck organs in children to con�rm abnor-malities diagnosed antenatally, explore various disorders, perform guided biopsies and treat children. �e main indications are:
■ congenital anomalies ■ palpable cervical masses ■ screening and staging cervical lymph nodes ■ suspected thyroid disorders ■ parathyroid hyperplasia ■ salivary gland diseases ■ trauma ■ suspected tumours (e.g. malignant lymphomas).
PreparationNo speci�c preparation is needed.
Examination technique�e child lies on his or her back in the supine position with the neck extended over a 5- to 10-cm-thick pillow under the shoulders, depending of the child’s age and cooperation. Examination is performed mainly by transverse scans and always with a comparison of the le� and right sides. It may be necessary to rotate infants’ heads from right to le�.
Linear probes should be of as high a frequency as possible (5–12 MHz). Doppler is helpful for demonstrating vascular anomalies and for di�erentiating thyroid disorders.
Normal �ndings�e examination should start with identi�cation of all the normal structures in the neck (see Fig. 5.63): the carotid arteries and jugular veins, the thyroid and salivary glands, the cervical muscles, the cervical oesophagus posterior to the trachea and the le� lobe of the thyroid, the trachea and lymph nodes (Fig. 5.174).
Paed
iatr
ic u
ltras
ound
978-9241548540-C005 PRF ml YVR ln ml ml-1-Final Proof.indd 343 6/10/13 10:31 AM
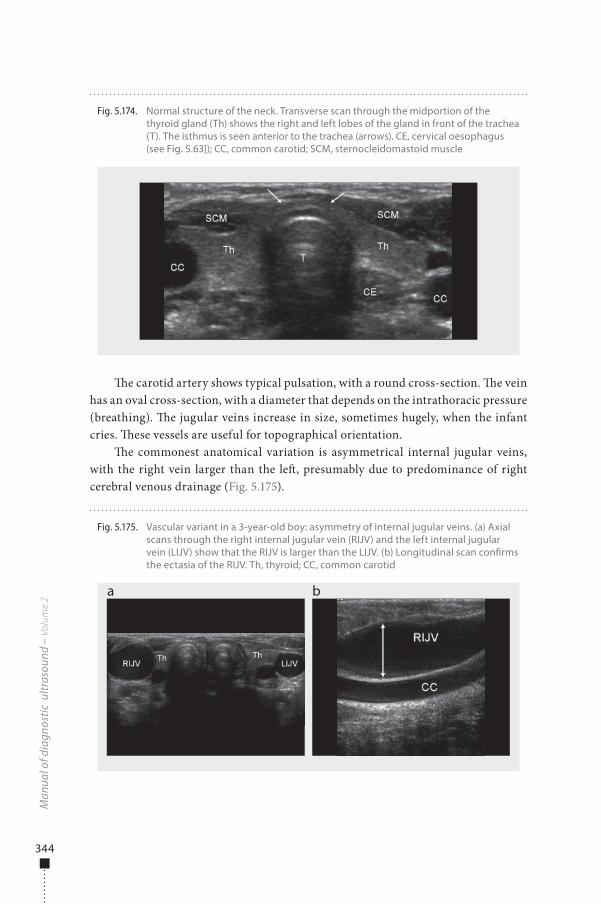
344
�e carotid artery shows typical pulsation, with a round cross-section. �e vein has an oval cross-section, with a diameter that depends on the intrathoracic pressure (breathing). �e jugular veins increase in size, sometimes hugely, when the infant cries. �ese vessels are useful for topographical orientation.
�e commonest anatomical variation is asymmetrical internal jugular veins, with the right vein larger than the le�, presumably due to predominance of right cerebral venous drainage (Fig. 5.175).
Man
ual o
f dia
gnos
tic u
ltras
ound
– V
olum
e 2
Fig. 5.174. Normal structure of the neck. Transverse scan through the midportion of the thyroid gland (Th) shows the right and left lobes of the gland in front of the trachea (T). The isthmus is seen anterior to the trachea (arrows). CE, cervical oesophagus (see Fig. 5.63]); CC, common carotid; SCM, sternocleidomastoid muscle
Fig. 5.175. Vascular variant in a 3-year-old boy: asymmetry of internal jugular veins. (a) Axial scans through the right internal jugular vein (RIJV) and the left internal jugular vein (LIJV) show that the RIJV is larger than the LIJV. (b) Longitudinal scan con�rms the ectasia of the RIJV. Th, thyroid; CC, common carotid
a b
978-9241548540-C005 PRF ml YVR ln ml ml-1-Final Proof.indd 344 6/10/13 10:31 AM
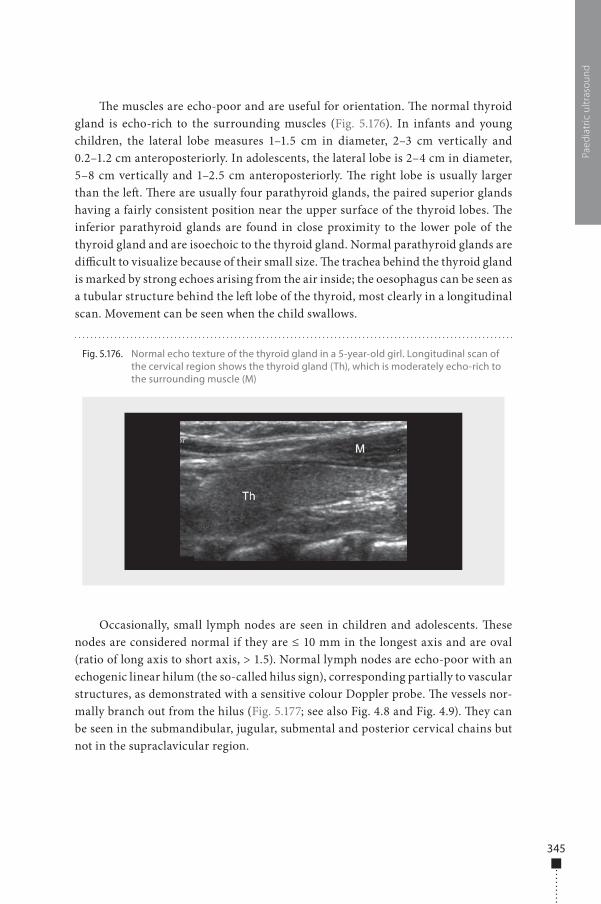
345
�e muscles are echo-poor and are useful for orientation. �e normal thyroid gland is echo-rich to the surrounding muscles (Fig. 5.176). In infants and young children, the lateral lobe measures 1–1.5 cm in diameter, 2–3 cm vertically and 0.2–1.2 cm anteroposteriorly. In adolescents, the lateral lobe is 2–4 cm in diameter, 5–8 cm vertically and 1–2.5 cm anteroposteriorly. �e right lobe is usually larger than the le�. �ere are usually four parathyroid glands, the paired superior glands having a fairly consistent position near the upper surface of the thyroid lobes. �e inferior parathyroid glands are found in close proximity to the lower pole of the thyroid gland and are isoechoic to the thyroid gland. Normal parathyroid glands are di�cult to visualize because of their small size. �e trachea behind the thyroid gland is marked by strong echoes arising from the air inside; the oesophagus can be seen as a tubular structure behind the le� lobe of the thyroid, most clearly in a longitudinal scan. Movement can be seen when the child swallows.
Occasionally, small lymph nodes are seen in children and adolescents. �ese nodes are considered normal if they are ≤ 10 mm in the longest axis and are oval (ratio of long axis to short axis, > 1.5). Normal lymph nodes are echo-poor with an echogenic linear hilum (the so-called hilus sign), corresponding partially to vascular structures, as demonstrated with a sensitive colour Doppler probe. �e vessels nor-mally branch out from the hilus (Fig. 5.177; see also Fig. 4.8 and Fig. 4.9). �ey can be seen in the submandibular, jugular, submental and posterior cervical chains but not in the supraclavicular region.
Paed
iatr
ic u
ltras
ound
Fig. 5.176. Normal echo texture of the thyroid gland in a 5-year-old girl. Longitudinal scan of the cervical region shows the thyroid gland (Th), which is moderately echo-rich to the surrounding muscle (M)
978-9241548540-C005 PRF ml YVR ln ml ml-1-Final Proof.indd 345 6/10/13 10:31 AM
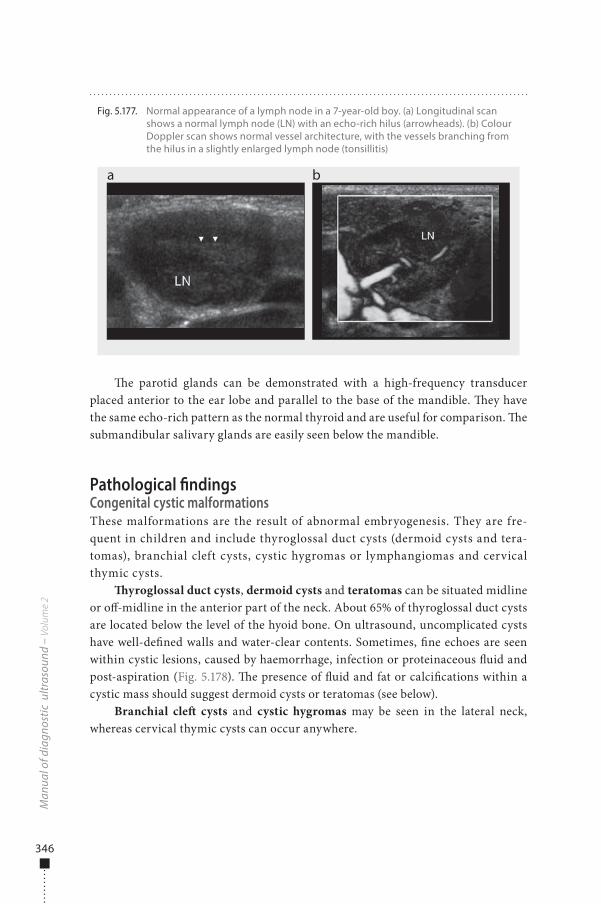
346
�e parotid glands can be demonstrated with a high-frequency transducer placed anterior to the ear lobe and parallel to the base of the mandible. �ey have the same echo-rich pattern as the normal thyroid and are useful for comparison. �e submandibular salivary glands are easily seen below the mandible.
Pathological �ndingsCongenital cystic malformationsThese malformations are the result of abnormal embryogenesis. They are fre-quent in children and include thyroglossal duct cysts (dermoid cysts and tera-tomas), branchial cleft cysts, cystic hygromas or lymphangiomas and cervical thymic cysts.
�yroglossal duct cysts, dermoid cysts and teratomas can be situated midline or o�-midline in the anterior part of the neck. About 65% of thyroglossal duct cysts are located below the level of the hyoid bone. On ultrasound, uncomplicated cysts have well-de�ned walls and water-clear contents. Sometimes, �ne echoes are seen within cystic lesions, caused by haemorrhage, infection or proteinaceous �uid and post-aspiration (Fig. 5.178). �e presence of �uid and fat or calci�cations within a cystic mass should suggest dermoid cysts or teratomas (see below).
Branchial cle� cysts and cystic hygromas may be seen in the lateral neck, whereas cervical thymic cysts can occur anywhere.
Man
ual o
f dia
gnos
tic u
ltras
ound
– V
olum
e 2
Fig. 5.177. Normal appearance of a lymph node in a 7-year-old boy. (a) Longitudinal scan shows a normal lymph node (LN) with an echo-rich hilus (arrowheads). (b) Colour Doppler scan shows normal vessel architecture, with the vessels branching from the hilus in a slightly enlarged lymph node (tonsillitis)
a b
978-9241548540-C005 PRF ml YVR ln ml ml-1-Final Proof.indd 346 6/10/13 10:31 AM
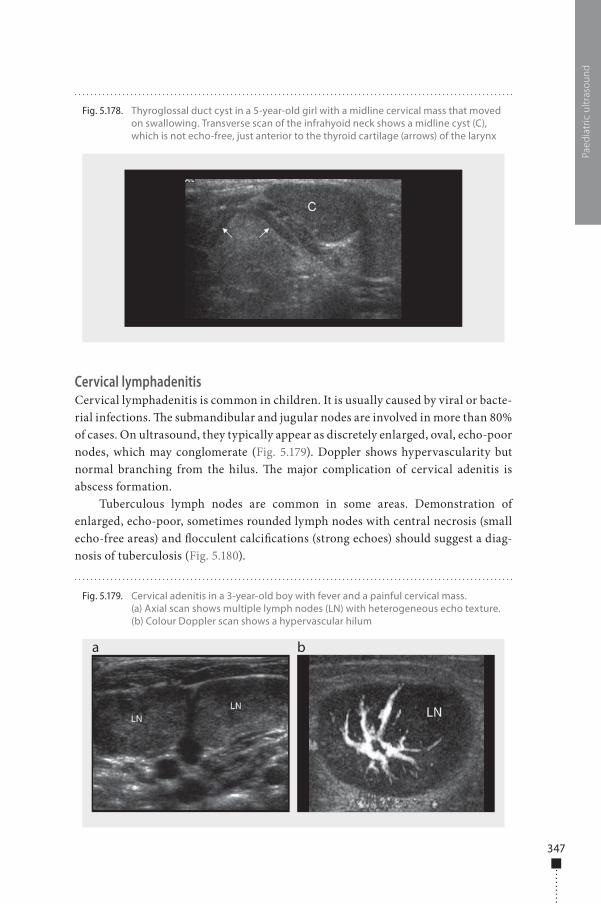
347
Cervical lymphadenitisCervical lymphadenitis is common in children. It is usually caused by viral or bacte-rial infections. �e submandibular and jugular nodes are involved in more than 80% of cases. On ultrasound, they typically appear as discretely enlarged, oval, echo-poor nodes, which may conglomerate (Fig. 5.179). Doppler shows hypervascularity but normal branching from the hilus. �e major complication of cervical adenitis is abscess formation.
Tuberculous lymph nodes are common in some areas. Demonstration of enlarged, echo-poor, sometimes rounded lymph nodes with central necrosis (small echo-free areas) and �occulent calci�cations (strong echoes) should suggest a diag-nosis of tuberculosis (Fig. 5.180).
Paed
iatr
ic u
ltras
ound
Fig. 5.178. Thyroglossal duct cyst in a 5-year-old girl with a midline cervical mass that moved on swallowing. Transverse scan of the infrahyoid neck shows a midline cyst (C), which is not echo-free, just anterior to the thyroid cartilage (arrows) of the larynx
Fig. 5.179. Cervical adenitis in a 3-year-old boy with fever and a painful cervical mass. (a) Axial scan shows multiple lymph nodes (LN) with heterogeneous echo texture. (b) Colour Doppler scan shows a hypervascular hilum
a b
978-9241548540-C005 PRF ml YVR ln ml ml-1-Final Proof.indd 347 6/10/13 10:31 AM
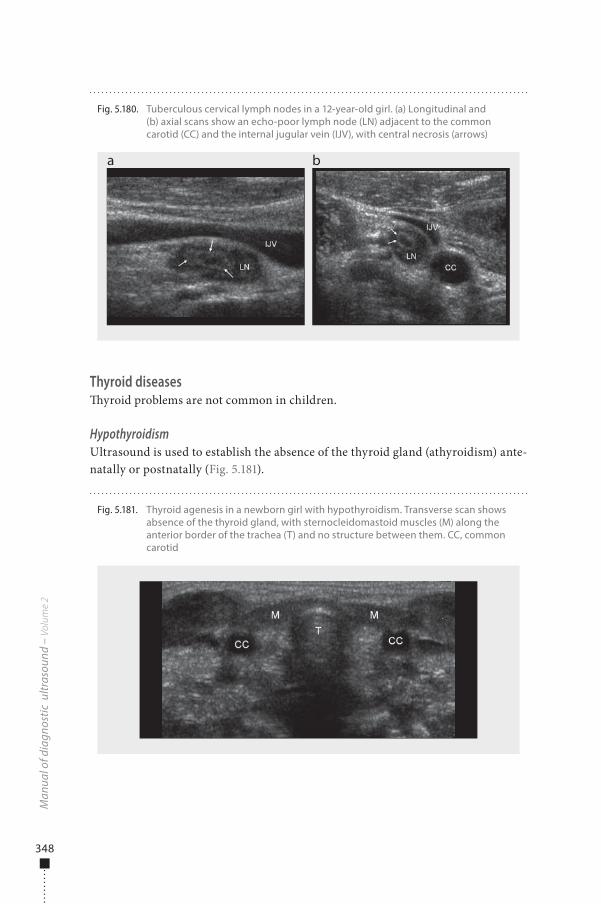
348
Thyroid diseases�yroid problems are not common in children.
HypothyroidismUltrasound is used to establish the absence of the thyroid gland (athyroidism) ante-natally or postnatally (Fig. 5.181).
Man
ual o
f dia
gnos
tic u
ltras
ound
– V
olum
e 2
Fig. 5.180. Tuberculous cervical lymph nodes in a 12-year-old girl. (a) Longitudinal and (b) axial scans show an echo-poor lymph node (LN) adjacent to the common carotid (CC) and the internal jugular vein (IJV), with central necrosis (arrows)
a b
Fig. 5.181. Thyroid agenesis in a newborn girl with hypothyroidism. Transverse scan shows absence of the thyroid gland, with sternocleidomastoid muscles (M) along the anterior border of the trachea (T) and no structure between them. CC, common carotid
978-9241548540-C005 PRF ml YVR ln ml ml-1-Final Proof.indd 348 6/10/13 10:31 AM
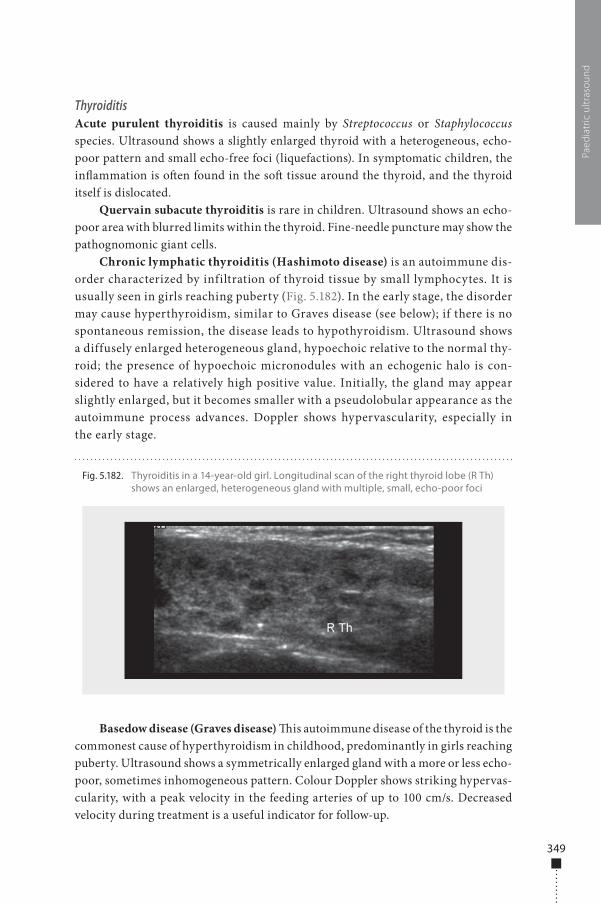
349
ThyroiditisAcute purulent thyroiditis is caused mainly by Streptococcus or Staphylococcus species. Ultrasound shows a slightly enlarged thyroid with a heterogeneous, echo-poor pattern and small echo-free foci (liquefactions). In symptomatic children, the in�ammation is o�en found in the so� tissue around the thyroid, and the thyroid itself is dislocated.
Quervain subacute thyroiditis is rare in children. Ultrasound shows an echo-poor area with blurred limits within the thyroid. Fine-needle puncture may show the pathognomonic giant cells.
Chronic lymphatic thyroiditis (Hashimoto disease) is an autoimmune dis-order characterized by infiltration of thyroid tissue by small lymphocytes. It is usually seen in girls reaching puberty (Fig. 5.182). In the early stage, the disorder may cause hyperthyroidism, similar to Graves disease (see below); if there is no spontaneous remission, the disease leads to hypothyroidism. Ultrasound shows a diffusely enlarged heterogeneous gland, hypoechoic relative to the normal thy-roid; the presence of hypoechoic micronodules with an echogenic halo is con-sidered to have a relatively high positive value. Initially, the gland may appear slightly enlarged, but it becomes smaller with a pseudolobular appearance as the autoimmune process advances. Doppler shows hypervascularity, especially in the early stage.
Basedow disease (Graves disease) �is autoimmune disease of the thyroid is the commonest cause of hyperthyroidism in childhood, predominantly in girls reaching puberty. Ultrasound shows a symmetrically enlarged gland with a more or less echo-poor, sometimes inhomogeneous pattern. Colour Doppler shows striking hypervas-cularity, with a peak velocity in the feeding arteries of up to 100 cm/s. Decreased velocity during treatment is a useful indicator for follow-up.
Paed
iatr
ic u
ltras
ound
Fig. 5.182. Thyroiditis in a 14-year-old girl. Longitudinal scan of the right thyroid lobe (R Th) shows an enlarged, heterogeneous gland with multiple, small, echo-poor foci
978-9241548540-C005 PRF ml YVR ln ml ml-1-Final Proof.indd 349 6/10/13 10:31 AM
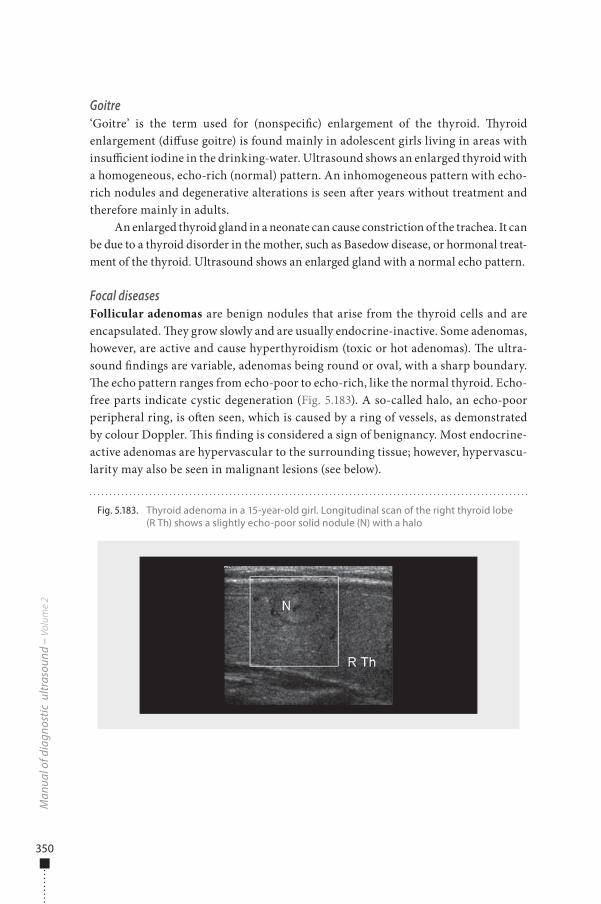
350
Goitre‘Goitre’ is the term used for (nonspeci�c) enlargement of the thyroid. �yroid enlargement (di�use goitre) is found mainly in adolescent girls living in areas with insu�cient iodine in the drinking-water. Ultrasound shows an enlarged thyroid with a homogeneous, echo-rich (normal) pattern. An inhomogeneous pattern with echo-rich nodules and degenerative alterations is seen a�er years without treatment and therefore mainly in adults.
An enlarged thyroid gland in a neonate can cause constriction of the trachea. It can be due to a thyroid disorder in the mother, such as Basedow disease, or hormonal treat-ment of the thyroid. Ultrasound shows an enlarged gland with a normal echo pattern.
Focal diseasesFollicular adenomas are benign nodules that arise from the thyroid cells and are encapsulated. �ey grow slowly and are usually endocrine-inactive. Some adenomas, however, are active and cause hyperthyroidism (toxic or hot adenomas). �e ultra-sound �ndings are variable, adenomas being round or oval, with a sharp boundary. �e echo pattern ranges from echo-poor to echo-rich, like the normal thyroid. Echo-free parts indicate cystic degeneration (Fig. 5.183). A so-called halo, an echo-poor peripheral ring, is o�en seen, which is caused by a ring of vessels, as demonstrated by colour Doppler. �is �nding is considered a sign of benignancy. Most endocrine-active adenomas are hypervascular to the surrounding tissue; however, hypervascu-larity may also be seen in malignant lesions (see below).
Man
ual o
f dia
gnos
tic u
ltras
ound
– V
olum
e 2
Fig. 5.183. Thyroid adenoma in a 15-year-old girl. Longitudinal scan of the right thyroid lobe (R Th) shows a slightly echo-poor solid nodule (N) with a halo
978-9241548540-C005 PRF ml YVR ln ml ml-1-Final Proof.indd 350 6/10/13 10:31 AM
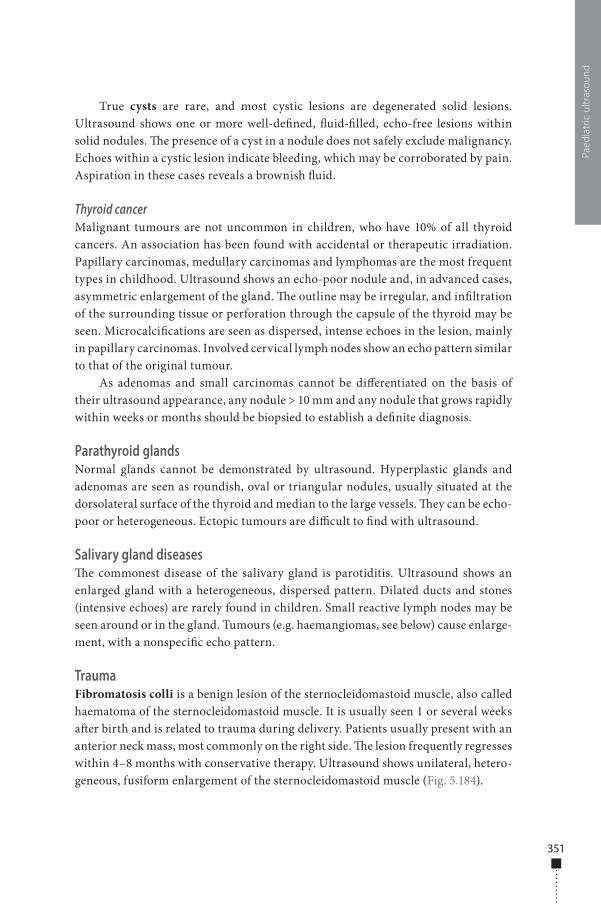
351
True cysts are rare, and most cystic lesions are degenerated solid lesions. Ultrasound shows one or more well-de�ned, �uid-�lled, echo-free lesions within solid nodules. �e presence of a cyst in a nodule does not safely exclude malignancy. Echoes within a cystic lesion indicate bleeding, which may be corroborated by pain. Aspiration in these cases reveals a brownish �uid.
Thyroid cancerMalignant tumours are not uncommon in children, who have 10% of all thyroid cancers. An association has been found with accidental or therapeutic irradiation. Papillary carcinomas, medullary carcinomas and lymphomas are the most frequent types in childhood. Ultrasound shows an echo-poor nodule and, in advanced cases, asymmetric enlargement of the gland. �e outline may be irregular, and in�ltration of the surrounding tissue or perforation through the capsule of the thyroid may be seen. Microcalci�cations are seen as dispersed, intense echoes in the lesion, mainly in papillary carcinomas. Involved cervical lymph nodes show an echo pattern similar to that of the original tumour.
As adenomas and small carcinomas cannot be di�erentiated on the basis of their ultrasound appearance, any nodule > 10 mm and any nodule that grows rapidly within weeks or months should be biopsied to establish a de�nite diagnosis.
Parathyroid glandsNormal glands cannot be demonstrated by ultrasound. Hyperplastic glands and adenomas are seen as roundish, oval or triangular nodules, usually situated at the dorsolateral surface of the thyroid and median to the large vessels. �ey can be echo-poor or heterogeneous. Ectopic tumours are di�cult to �nd with ultrasound.
Salivary gland diseases�e commonest disease of the salivary gland is parotiditis. Ultrasound shows an enlarged gland with a heterogeneous, dispersed pattern. Dilated ducts and stones (intensive echoes) are rarely found in children. Small reactive lymph nodes may be seen around or in the gland. Tumours (e.g. haemangiomas, see below) cause enlarge-ment, with a nonspeci�c echo pattern.
TraumaFibromatosis colli is a benign lesion of the sternocleidomastoid muscle, also called haematoma of the sternocleidomastoid muscle. It is usually seen 1 or several weeks a�er birth and is related to trauma during delivery. Patients usually present with an anterior neck mass, most commonly on the right side. �e lesion frequently regresses within 4–8 months with conservative therapy. Ultrasound shows unilateral, hetero-geneous, fusiform enlargement of the sternocleidomastoid muscle (Fig. 5.184).
Paed
iatr
ic u
ltras
ound
978-9241548540-C005 PRF ml YVR ln ml ml-1-Final Proof.indd 351 6/10/13 10:31 AM
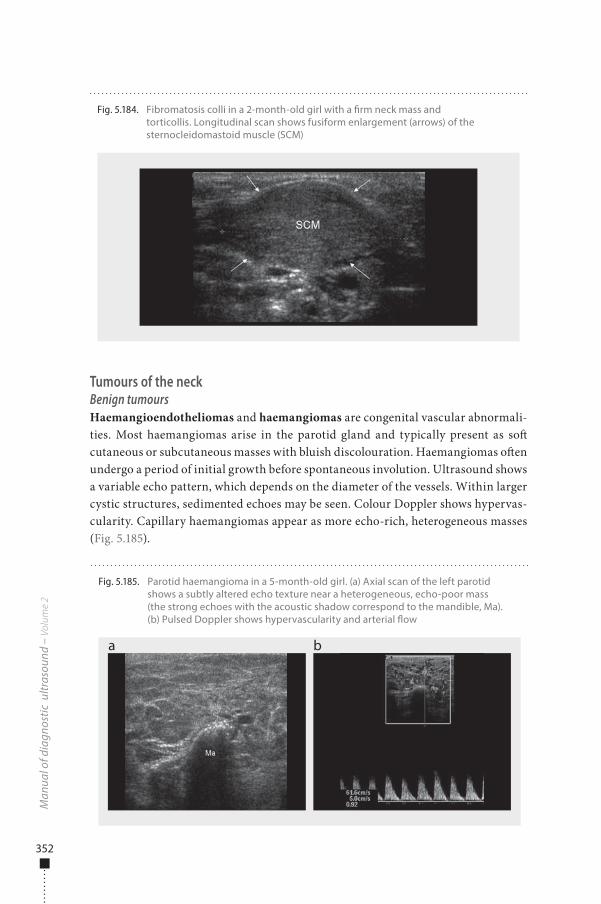
352
Tumours of the neckBenign tumoursHaemangioendotheliomas and haemangiomas are congenital vascular abnormali-ties. Most haemangiomas arise in the parotid gland and typically present as so� cutaneous or subcutaneous masses with bluish discolouration. Haemangiomas o�en undergo a period of initial growth before spontaneous involution. Ultrasound shows a variable echo pattern, which depends on the diameter of the vessels. Within larger cystic structures, sedimented echoes may be seen. Colour Doppler shows hypervas-cularity. Capillary haemangiomas appear as more echo-rich, heterogeneous masses (Fig. 5.185).
Man
ual o
f dia
gnos
tic u
ltras
ound
– V
olum
e 2
Fig. 5.184. Fibromatosis colli in a 2-month-old girl with a �rm neck mass and torticollis. Longitudinal scan shows fusiform enlargement (arrows) of the sternocleidomastoid muscle (SCM)
Fig. 5.185. Parotid haemangioma in a 5-month-old girl. (a) Axial scan of the left parotid shows a subtly altered echo texture near a heterogeneous, echo-poor mass (the strong echoes with the acoustic shadow correspond to the mandible, Ma). (b) Pulsed Doppler shows hypervascularity and arterial �ow
a b
978-9241548540-C005 PRF ml YVR ln ml ml-1-Final Proof.indd 352 6/10/13 10:31 AM
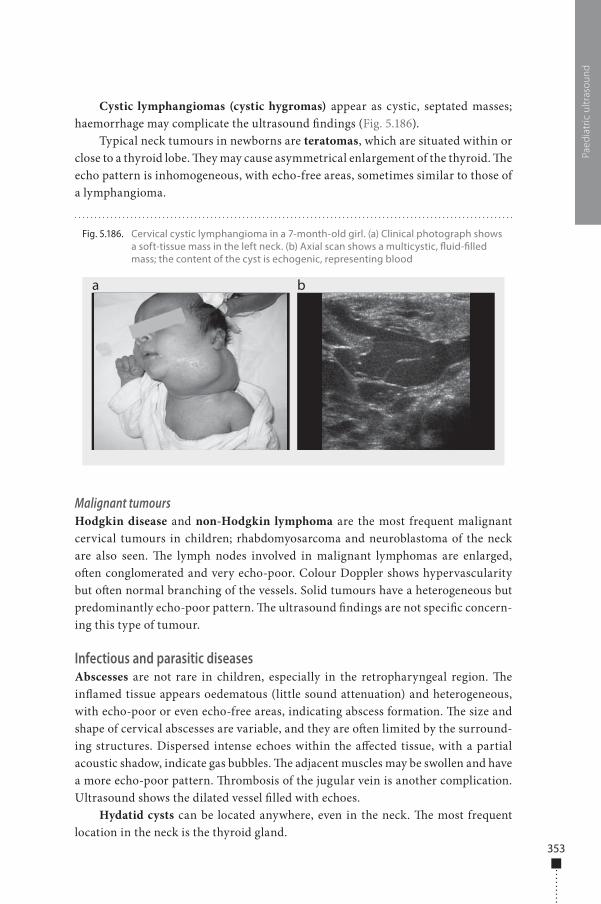
353
Cystic lymphangiomas (cystic hygromas) appear as cystic, septated masses; haemorrhage may complicate the ultrasound �ndings (Fig. 5.186).
Typical neck tumours in newborns are teratomas, which are situated within or close to a thyroid lobe. �ey may cause asymmetrical enlargement of the thyroid. �e echo pattern is inhomogeneous, with echo-free areas, sometimes similar to those of a lymphangioma.
Malignant tumoursHodgkin disease and non-Hodgkin lymphoma are the most frequent malignant cervical tumours in children; rhabdomyosarcoma and neuroblastoma of the neck are also seen. �e lymph nodes involved in malignant lymphomas are enlarged, o�en conglomerated and very echo-poor. Colour Doppler shows hypervascularity but o�en normal branching of the vessels. Solid tumours have a heterogeneous but predominantly echo-poor pattern. �e ultrasound �ndings are not speci�c concern-ing this type of tumour.
Infectious and parasitic diseasesAbscesses are not rare in children, especially in the retropharyngeal region. �e in�amed tissue appears oedematous (little sound attenuation) and heterogeneous, with echo-poor or even echo-free areas, indicating abscess formation. �e size and shape of cervical abscesses are variable, and they are o�en limited by the surround-ing structures. Dispersed intense echoes within the a�ected tissue, with a partial acoustic shadow, indicate gas bubbles. �e adjacent muscles may be swollen and have a more echo-poor pattern. �rombosis of the jugular vein is another complication. Ultrasound shows the dilated vessel �lled with echoes.
Hydatid cysts can be located anywhere, even in the neck. �e most frequent location in the neck is the thyroid gland.
Paed
iatr
ic u
ltras
ound
Fig. 5.186. Cervical cystic lymphangioma in a 7-month-old girl. (a) Clinical photograph shows a soft-tissue mass in the left neck. (b) Axial scan shows a multicystic, �uid-�lled mass; the content of the cyst is echogenic, representing blood
a b
978-9241548540-C005 PRF ml YVR ln ml ml-1-Final Proof.indd 353 6/10/13 10:31 AM
354
Chest
IndicationsUltrasound exploration of the thoracic cavity is more useful in children than in adults. �e main indications are chest wall abnormalities, pleural e�usion, periph-eral lung lesions, diaphragm abnormalities and mediastinal lesions. Ultrasound is increasingly used in intensive care units to guide interventions and to follow up pleural e�usion and chest wall diseases.
PreparationBefore an ultrasound examination, it is important to review the child’s chest radio-graph to locate the area of interest.
Examination technique�e child lies supine or prone or stands erect, depending on the clinical problem. Having the arm raised above the head increases the rib space distance and facilitates parietal and pleural examination. �e posterior chest is best imaged with the child sitting up, while the anterior and lateral chest can be assessed with the child in the lat-eral supine position. �e transdiaphragmatic acoustic window is used, as well as the intercostal spaces and a supraclavicular approach. Views of the upper mediastinum should be obtained in the sagittal and axial planes. Transthoracic chest ultrasound can be performed with high-frequency linear or curved 5- to 10-MHz probes. Colour Doppler is useful for assessing mediastinal vascular and parenchymal abnormalities and for distinguishing the great vessels from a mediastinal mass. �e gain and veloc-ity range of colour Doppler should be adapted to the region of interest.
Normal �ndings�e normal chest wall has cutaneous and subcutaneous layers, muscles and fascia. Below the so� tissue of the chest wall, the ribs appear as curvilinear structures on transverse scans, associated with posterior acoustic shadowing. When the ribs are scanned along the long axis, the anterior cortex should appear as a continuous, smooth, echoic line (Fig. 5.187).
�e pleura is easily recognized as an echoic line deep to the ribs. It may not be possible to di�erentiate the visceral and parietal portions in healthy infants, and echoic air reverberation artefacts at the pleura–lung interface prevent further visu-alization of the normal parenchyma. �e aorta, great vessels and superior vena cava can be seen in the suprasternal view of the mediastinum.
�e thymus is commonly prominent in children under 3 years of age. Ultrasound shows a characteristic appearance of echogenic foci or septae within echo-poor parenchyma (Fig. 5.188). �e thickness of the thymic lobe decreases with
Man
ual o
f dia
gnos
tic u
ltras
ound
– V
olum
e 2
978-9241548540-C005 PRF ml YVR ln ml ml-1-Final Proof.indd 354 6/10/13 10:31 AM
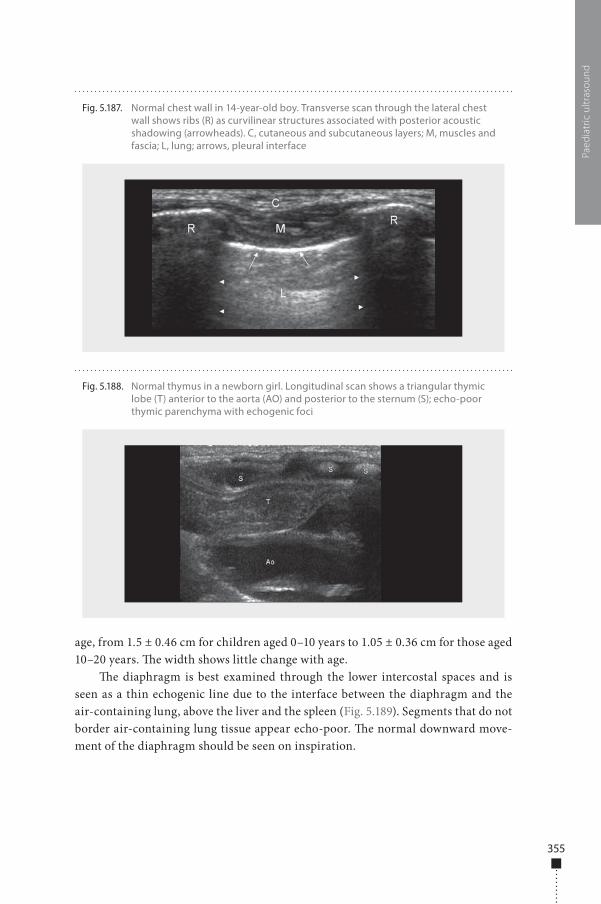
355
age, from 1.5 ± 0.46 cm for children aged 0–10 years to 1.05 ± 0.36 cm for those aged 10–20 years. �e width shows little change with age.
�e diaphragm is best examined through the lower intercostal spaces and is seen as a thin echogenic line due to the interface between the diaphragm and the air-containing lung, above the liver and the spleen (Fig. 5.189). Segments that do not border air-containing lung tissue appear echo-poor. �e normal downward move-ment of the diaphragm should be seen on inspiration.
Paed
iatr
ic u
ltras
ound
Fig. 5.188. Normal thymus in a newborn girl. Longitudinal scan shows a triangular thymic lobe (T) anterior to the aorta (AO) and posterior to the sternum (S); echo-poor thymic parenchyma with echogenic foci
Fig. 5.187. Normal chest wall in 14-year-old boy. Transverse scan through the lateral chest wall shows ribs (R) as curvilinear structures associated with posterior acoustic shadowing (arrowheads). C, cutaneous and subcutaneous layers; M, muscles and fascia; L, lung; arrows, pleural interface
978-9241548540-C005 PRF ml YVR ln ml ml-1-Final Proof.indd 355 6/10/13 10:31 AM
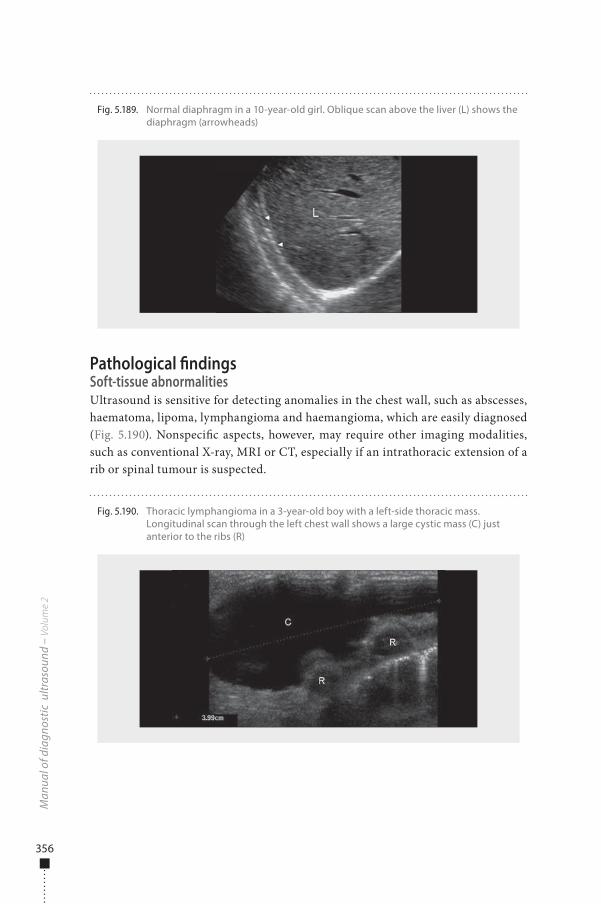
356
Pathological �ndingsSoft-tissue abnormalitiesUltrasound is sensitive for detecting anomalies in the chest wall, such as abscesses, haematoma, lipoma, lymphangioma and haemangioma, which are easily diagnosed (Fig. 5.190). Nonspeci�c aspects, however, may require other imaging modalities, such as conventional X-ray, MRI or CT, especially if an intrathoracic extension of a rib or spinal tumour is suspected.
Man
ual o
f dia
gnos
tic u
ltras
ound
– V
olum
e 2
Fig. 5.189. Normal diaphragm in a 10-year-old girl. Oblique scan above the liver (L) shows the diaphragm (arrowheads)
Fig. 5.190. Thoracic lymphangioma in a 3-year-old boy with a left-side thoracic mass. Longitudinal scan through the left chest wall shows a large cystic mass (C) just anterior to the ribs (R)
978-9241548540-C005 PRF ml YVR ln ml ml-1-Final Proof.indd 356 6/10/13 10:31 AM
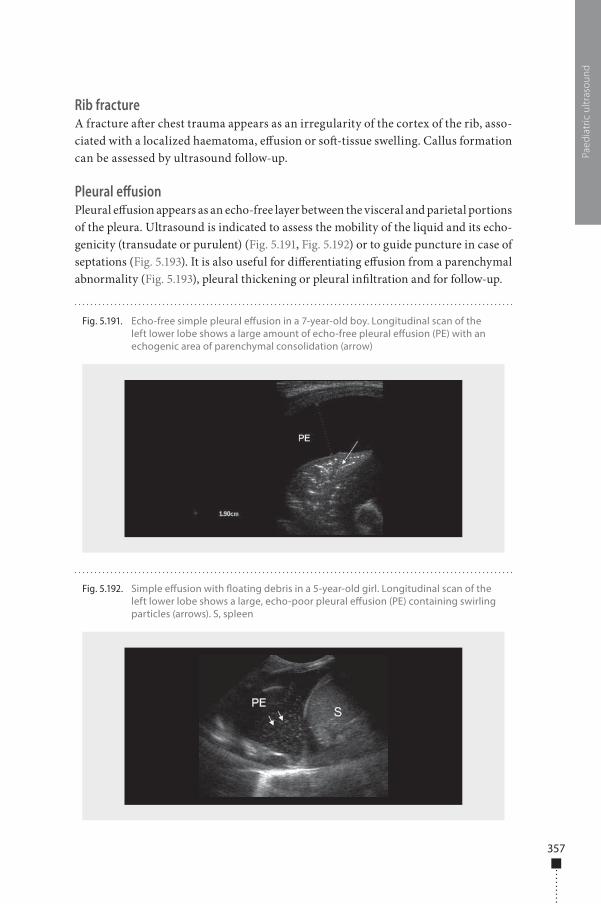
357
Rib fractureA fracture a�er chest trauma appears as an irregularity of the cortex of the rib, asso-ciated with a localized haematoma, e�usion or so�-tissue swelling. Callus formation can be assessed by ultrasound follow-up.
Pleural effusionPleural e�usion appears as an echo-free layer between the visceral and parietal portions of the pleura. Ultrasound is indicated to assess the mobility of the liquid and its echo-genicity (transudate or purulent) (Fig. 5.191, Fig. 5.192) or to guide puncture in case of septations (Fig. 5.193). It is also useful for di�erentiating e�usion from a parenchymal abnormality (Fig. 5.193), pleural thickening or pleural in�ltration and for follow-up.
Paed
iatr
ic u
ltras
ound
Fig. 5.191. Echo-free simple pleural e�usion in a 7-year-old boy. Longitudinal scan of the left lower lobe shows a large amount of echo-free pleural e�usion (PE) with an echogenic area of parenchymal consolidation (arrow)
Fig. 5.192. Simple e�usion with �oating debris in a 5-year-old girl. Longitudinal scan of the left lower lobe shows a large, echo-poor pleural e�usion (PE) containing swirling particles (arrows). S, spleen
978-9241548540-C005 PRF ml YVR ln ml ml-1-Final Proof.indd 357 6/10/13 10:31 AM
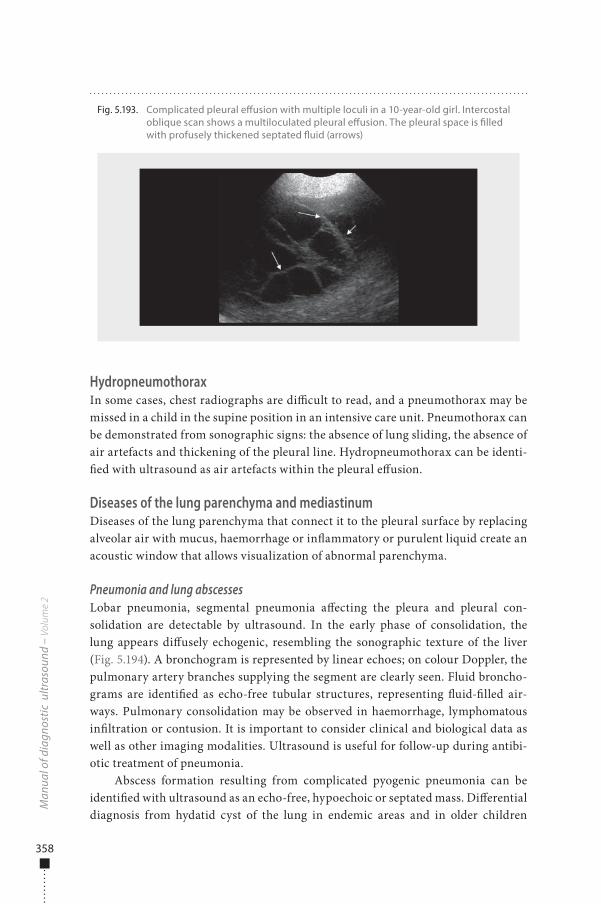
358
HydropneumothoraxIn some cases, chest radiographs are di�cult to read, and a pneumothorax may be missed in a child in the supine position in an intensive care unit. Pneumothorax can be demonstrated from sonographic signs: the absence of lung sliding, the absence of air artefacts and thickening of the pleural line. Hydropneumothorax can be identi-�ed with ultrasound as air artefacts within the pleural e�usion.
Diseases of the lung parenchyma and mediastinumDiseases of the lung parenchyma that connect it to the pleural surface by replacing alveolar air with mucus, haemorrhage or in�ammatory or purulent liquid create an acoustic window that allows visualization of abnormal parenchyma.
Pneumonia and lung abscessesLobar pneumonia, segmental pneumonia a�ecting the pleura and pleural con-solidation are detectable by ultrasound. In the early phase of consolidation, the lung appears di�usely echogenic, resembling the sonographic texture of the liver (Fig. 5.194). A bronchogram is represented by linear echoes; on colour Doppler, the pulmonary artery branches supplying the segment are clearly seen. Fluid broncho-grams are identi�ed as echo-free tubular structures, representing �uid-�lled air-ways. Pulmonary consolidation may be observed in haemorrhage, lymphomatous in�ltration or contusion. It is important to consider clinical and biological data as well as other imaging modalities. Ultrasound is useful for follow-up during antibi-otic treatment of pneumonia.
Abscess formation resulting from complicated pyogenic pneumonia can be identi�ed with ultrasound as an echo-free, hypoechoic or septated mass. Di�erential diagnosis from hydatid cyst of the lung in endemic areas and in older children
Man
ual o
f dia
gnos
tic u
ltras
ound
– V
olum
e 2
Fig. 5.193. Complicated pleural e�usion with multiple loculi in a 10-year-old girl. Intercostal oblique scan shows a multiloculated pleural e�usion. The pleural space is �lled with profusely thickened septated �uid (arrows)
978-9241548540-C005 PRF ml YVR ln ml ml-1-Final Proof.indd 358 6/10/13 10:31 AM
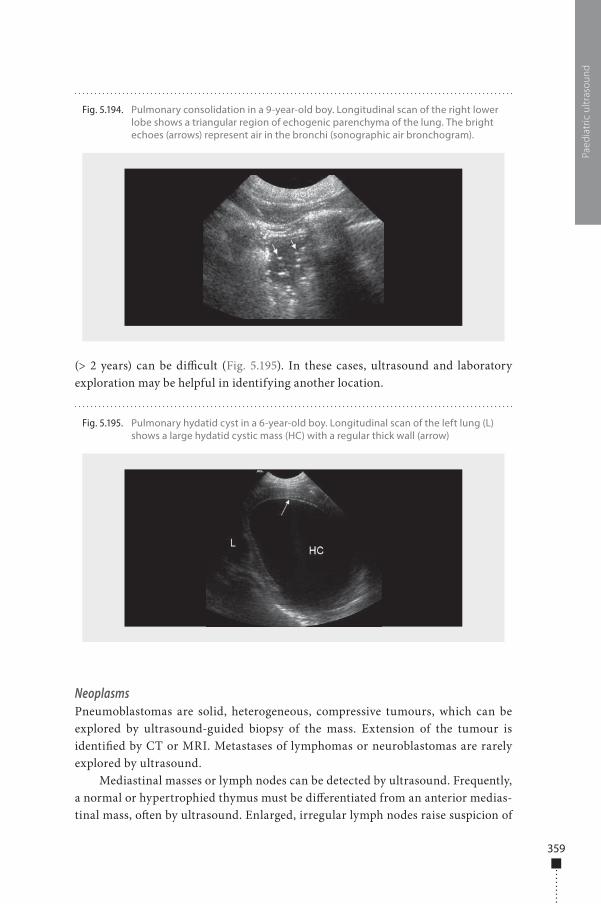
359
(> 2 years) can be di�cult (Fig. 5.195). In these cases, ultrasound and laboratory exploration may be helpful in identifying another location.
NeoplasmsPneumoblastomas are solid, heterogeneous, compressive tumours, which can be explored by ultrasound-guided biopsy of the mass. Extension of the tumour is identi�ed by CT or MRI. Metastases of lymphomas or neuroblastomas are rarely explored by ultrasound.
Mediastinal masses or lymph nodes can be detected by ultrasound. Frequently, a normal or hypertrophied thymus must be di�erentiated from an anterior medias-tinal mass, o�en by ultrasound. Enlarged, irregular lymph nodes raise suspicion of
Paed
iatr
ic u
ltras
ound
Fig. 5.194. Pulmonary consolidation in a 9-year-old boy. Longitudinal scan of the right lower lobe shows a triangular region of echogenic parenchyma of the lung. The bright echoes (arrows) represent air in the bronchi (sonographic air bronchogram).
Fig. 5.195. Pulmonary hydatid cyst in a 6-year-old boy. Longitudinal scan of the left lung (L) shows a large hydatid cystic mass (HC) with a regular thick wall (arrow)
978-9241548540-C005 PRF ml YVR ln ml ml-1-Final Proof.indd 359 6/10/13 10:31 AM
360
malignancy. Colour Doppler can be used to guide biopsy of mediastinal masses and lymph nodes in the anterior and upper mediastinum.
Diaphragmatic abnormalities�e diaphragm normally moves down on inspiration and up on expiration. In diaphragmatic paralysis, it either remains high and �xed or may show paradoxi-cal movements, so that it moves upwards during inspiration. Movement of the dia-phragm is usually observed by �uoroscopic screening during respiration; however, careful ultrasound examination of both hemidiaphragms can provide information on diaphragmatic movement.
Diaphragmatic and hiatus hernia can be demonstrated by ultrasound, as can discrete masses of variable echogenicity. Joining with intra-abdominal organs, Brownian movement and duplicated digestive wall in hernia of the digestive tract can also be seen.
Neonatal cranial ultrasound
Indications�e main indications for exploration of the neonatal brain are haemorrhage, ischae-mia, convulsions, malformation, infection or a tumour.
PreparationNo speci�c preparation is needed. �e infant lies in the supine position; one of the parents should be present to calm the infant if necessary.
Examination techniqueEquipmentA high-resolution, real-time, two-dimensional machine with dedicated settings for cranial ultrasound and Doppler and colour �ow capability should be available. High-frequency transducers (5–10 MHz) with a small footprint to match the size of the fontanelle should be used. Depending on the manufacturer, two probes may be needed: one 5-MHz probe for full-term infants and examination of the posterior fossa and one 7.5-MHz probe for pre-mature infants and examination of periventricular areas. Ideally, a high-frequency (7- to 10-MHz) linear probe should be available to scan the extracranial �uid space and superior sagittal sinus. A hand-held colour ultrasound device is required in intensive care units.
Man
ual o
f dia
gnos
tic u
ltras
ound
– V
olum
e 2
978-9241548540-C005 PRF ml YVR ln ml ml-1-Final Proof.indd 360 6/10/13 10:31 AM
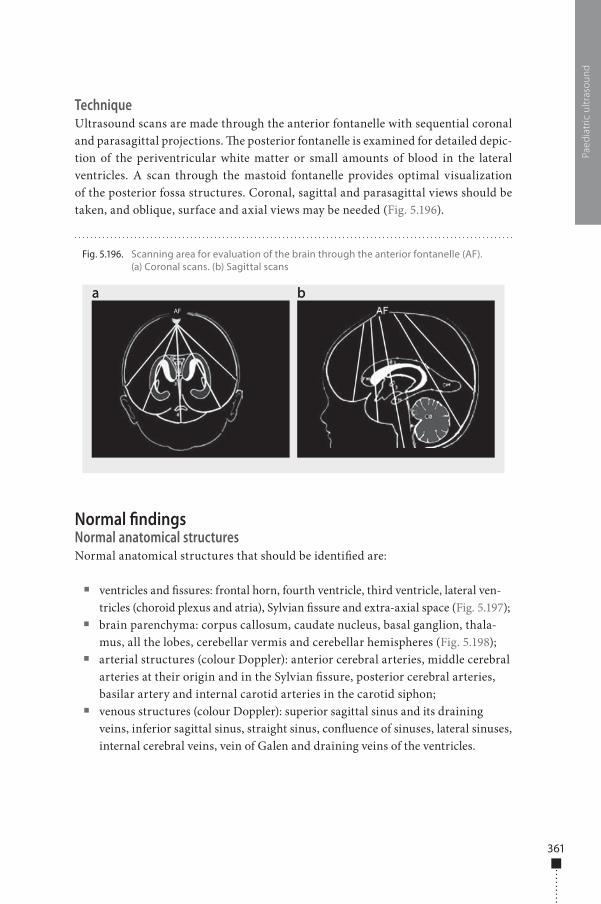
361
TechniqueUltrasound scans are made through the anterior fontanelle with sequential coronal and parasagittal projections. �e posterior fontanelle is examined for detailed depic-tion of the periventricular white matter or small amounts of blood in the lateral ventricles. A scan through the mastoid fontanelle provides optimal visualization of the posterior fossa structures. Coronal, sagittal and parasagittal views should be taken, and oblique, surface and axial views may be needed (Fig. 5.196).
Normal �ndingsNormal anatomical structuresNormal anatomical structures that should be identi�ed are:
■ ventricles and �ssures: frontal horn, fourth ventricle, third ventricle, lateral ven-tricles (choroid plexus and atria), Sylvian �ssure and extra-axial space (Fig. 5.197);
■ brain parenchyma: corpus callosum, caudate nucleus, basal ganglion, thala-mus, all the lobes, cerebellar vermis and cerebellar hemispheres (Fig. 5.198);
■ arterial structures (colour Doppler): anterior cerebral arteries, middle cerebral arteries at their origin and in the Sylvian �ssure, posterior cerebral arteries, basilar artery and internal carotid arteries in the carotid siphon;
■ venous structures (colour Doppler): superior sagittal sinus and its draining veins, inferior sagittal sinus, straight sinus, con�uence of sinuses, lateral sinuses, internal cerebral veins, vein of Galen and draining veins of the ventricles.
Paed
iatr
ic u
ltras
ound
Fig. 5.196. Scanning area for evaluation of the brain through the anterior fontanelle (AF). (a) Coronal scans. (b) Sagittal scans
a ba bAF
978-9241548540-C005 PRF ml YVR ln ml ml-1-Final Proof.indd 361 6/10/13 10:31 AM
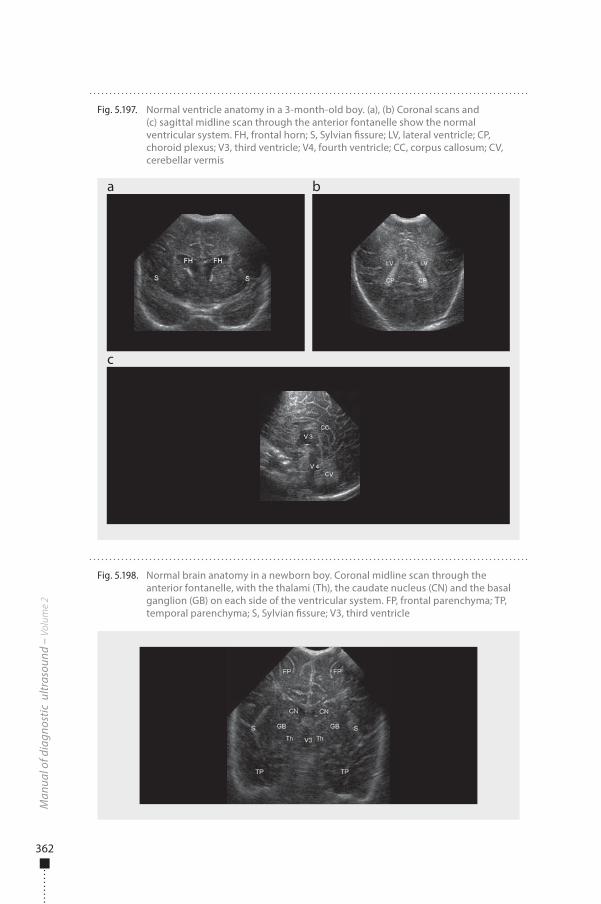
362
Man
ual o
f dia
gnos
tic u
ltras
ound
– V
olum
e 2
Fig. 5.198. Normal brain anatomy in a newborn boy. Coronal midline scan through the anterior fontanelle, with the thalami (Th), the caudate nucleus (CN) and the basal ganglion (GB) on each side of the ventricular system. FP, frontal parenchyma; TP, temporal parenchyma; S, Sylvian �ssure; V3, third ventricle
Fig. 5.197. Normal ventricle anatomy in a 3-month-old boy. (a), (b) Coronal scans and (c) sagittal midline scan through the anterior fontanelle show the normal ventricular system. FH, frontal horn; S, Sylvian �ssure; LV, lateral ventricle; CP, choroid plexus; V3, third ventricle; V4, fourth ventricle; CC, corpus callosum; CV, cerebellar vermis
a
c
b
978-9241548540-C005 PRF ml YVR ln ml ml-1-Final Proof.indd 362 6/10/13 10:32 AM
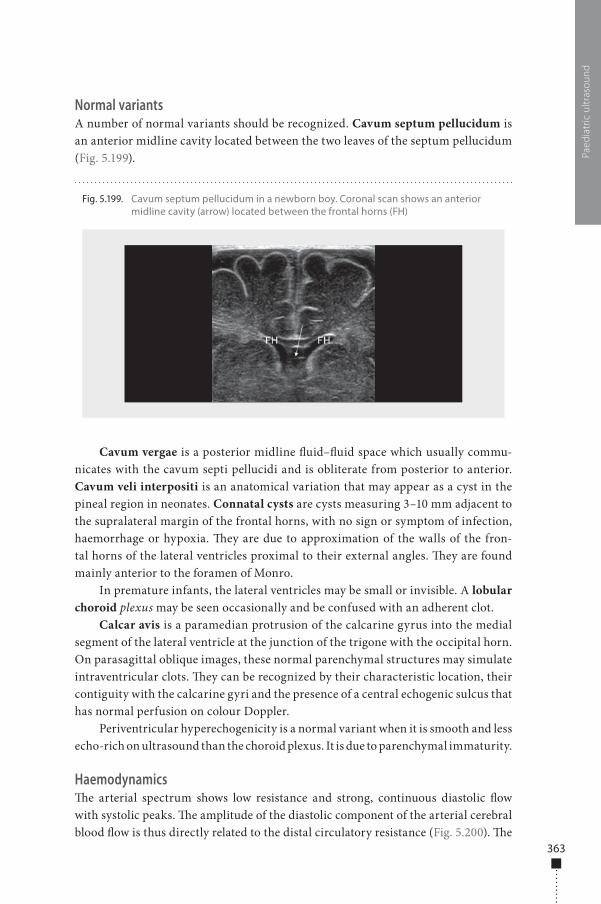
363
Normal variantsA number of normal variants should be recognized. Cavum septum pellucidum is an anterior midline cavity located between the two leaves of the septum pellucidum (Fig. 5.199).
Cavum vergae is a posterior midline �uid–�uid space which usually commu-nicates with the cavum septi pellucidi and is obliterate from posterior to anterior. Cavum veli interpositi is an anatomical variation that may appear as a cyst in the pineal region in neonates. Connatal cysts are cysts measuring 3–10 mm adjacent to the supralateral margin of the frontal horns, with no sign or symptom of infection, haemorrhage or hypoxia. �ey are due to approximation of the walls of the fron-tal horns of the lateral ventricles proximal to their external angles. �ey are found mainly anterior to the foramen of Monro.
In premature infants, the lateral ventricles may be small or invisible. A lobular choroid plexus may be seen occasionally and be confused with an adherent clot.
Calcar avis is a paramedian protrusion of the calcarine gyrus into the medial segment of the lateral ventricle at the junction of the trigone with the occipital horn. On parasagittal oblique images, these normal parenchymal structures may simulate intraventricular clots. �ey can be recognized by their characteristic location, their contiguity with the calcarine gyri and the presence of a central echogenic sulcus that has normal perfusion on colour Doppler.
Periventricular hyperechogenicity is a normal variant when it is smooth and less echo-rich on ultrasound than the choroid plexus. It is due to parenchymal immaturity.
Haemodynamics�e arterial spectrum shows low resistance and strong, continuous diastolic �ow with systolic peaks. �e amplitude of the diastolic component of the arterial cerebral blood �ow is thus directly related to the distal circulatory resistance (Fig. 5.200). �e
Paed
iatr
ic u
ltras
ound
Fig. 5.199. Cavum septum pellucidum in a newborn boy. Coronal scan shows an anterior midline cavity (arrow) located between the frontal horns (FH)
978-9241548540-C005 PRF ml YVR ln ml ml-1-Final Proof.indd 363 6/10/13 10:32 AM
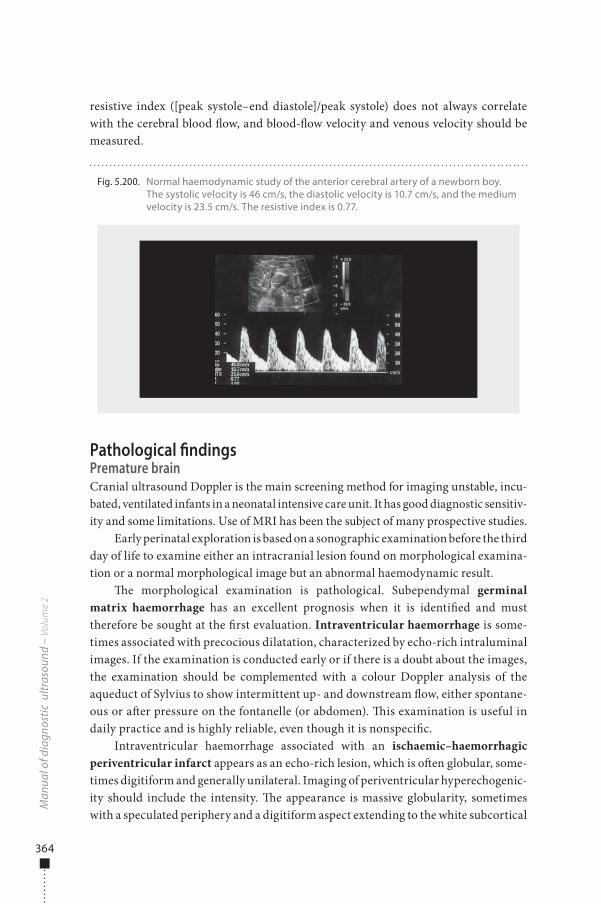
364
resistive index ([peak systole–end diastole]/peak systole) does not always correlate with the cerebral blood �ow, and blood-�ow velocity and venous velocity should be measured.
Pathological �ndingsPremature brainCranial ultrasound Doppler is the main screening method for imaging unstable, incu-bated, ventilated infants in a neonatal intensive care unit. It has good diagnostic sensitiv-ity and some limitations. Use of MRI has been the subject of many prospective studies.
Early perinatal exploration is based on a sonographic examination before the third day of life to examine either an intracranial lesion found on morphological examina-tion or a normal morphological image but an abnormal haemodynamic result.
�e morphological examination is pathological. Subependymal germinal matrix haemorrhage has an excellent prognosis when it is identi�ed and must therefore be sought at the �rst evaluation. Intraventricular haemorrhage is some-times associated with precocious dilatation, characterized by echo-rich intraluminal images. If the examination is conducted early or if there is a doubt about the images, the examination should be complemented with a colour Doppler analysis of the aqueduct of Sylvius to show intermittent up- and downstream �ow, either spontane-ous or a�er pressure on the fontanelle (or abdomen). �is examination is useful in daily practice and is highly reliable, even though it is nonspeci�c.
Intraventricular haemorrhage associated with an ischaemic–haemorrhagic periventricular infarct appears as an echo-rich lesion, which is o�en globular, some-times digitiform and generally unilateral. Imaging of periventricular hyperechogenic-ity should include the intensity. �e appearance is massive globularity, sometimes with a speculated periphery and a digitiform aspect extending to the white subcortical
Man
ual o
f dia
gnos
tic u
ltras
ound
– V
olum
e 2
Fig. 5.200. Normal haemodynamic study of the anterior cerebral artery of a newborn boy. The systolic velocity is 46 cm/s, the diastolic velocity is 10.7 cm/s, and the medium velocity is 23.5 cm/s. The resistive index is 0.77.
978-9241548540-C005 PRF ml YVR ln ml ml-1-Final Proof.indd 364 6/10/13 10:32 AM
365
matter, usually containing echo-rich nodules, which are rarely microcystic at this age. �e topography is uni- or bilateral and may be limited to the frontal regions or behind the atria or extend to other regions, including the temporal area. Some periventricular hyperechogenicity seen during initial exploration may be transitory.
An echo-rich basal ganglion or thalamus is a rare lesion but can occur in prema-ture infants. Lesions of the basal ganglion seen on initial sonographic examination may be attenuated on follow-up and then recon�rmed.
When analysis of the posterior region of the brain is technically di�cult because of a small fontanelle, an overlapping suture or respiratory ventilation that makes access to the anterior fontanelle di�cult, or when there is doubt about the normality of the posterior regions of the brain, the examination should be complemented by exploration through the posterior fontanelle, which gives direct access to regions behind the atria and the occipital horns. �e temporal regions can also be studied through the temporal bone (mastoid view).
If the morphological examination appears normal but the haemodynamic anal-ysis is pathological, a special pulsed Doppler study should be conducted. �e data to be sought include �uctuations of Doppler spectra, usually contemporaneous with haemodynamic instability; low �ow, characterized by systolic and average speeds lower than normal; high �ow, with high systolic and average speeds; and anomalies of vascular resistance.
Early follow-upEarly follow-up (before 10 days of life) is also based on sonography. �is examination is performed to screen for intraventricular haemorrhage in an infant with normal morphology but pathological haemodynamics or secondary clinical complications (respiratory complications, ductus arteriosus or enterocolitis) that could lead to haemorrhage. Ultrasound is also used to screen for ischaemic–haemorrhagic infarct in an infant with intraventricular haemorrhage. Early follow-up is necessary to con-�rm the existence and persistence of periventricular hyperechogenicity, to screen for heterogeneity in the echogenicity and to con�rm the existence of another lesion (e.g. in the basal ganglion).
Follow-up of a haemorrhagic lesionUltrasound will show the classical evolution of an intraventricular clot and is used to screen for ventricular dilatation and its morphological evolution (Fig. 5.201). Complementary pulsed Doppler can show an increase in the resistive index due to intracranial hypertension. The sensitivity of the technique can be increased by fontanelle compression for determination of [resistive index after compres-sion – basal resistive index] / basal resistive index, which indicates progression of ventricular dilatation. Doppler analysis is particularly useful when cerebrospinal f luid is to be removed, because it can show the efficacy of the therapy and guide the frequency of punctures.
Paed
iatr
ic u
ltras
ound
978-9241548540-C005 PRF ml YVR ln ml ml-1-Final Proof.indd 365 6/10/13 10:32 AM
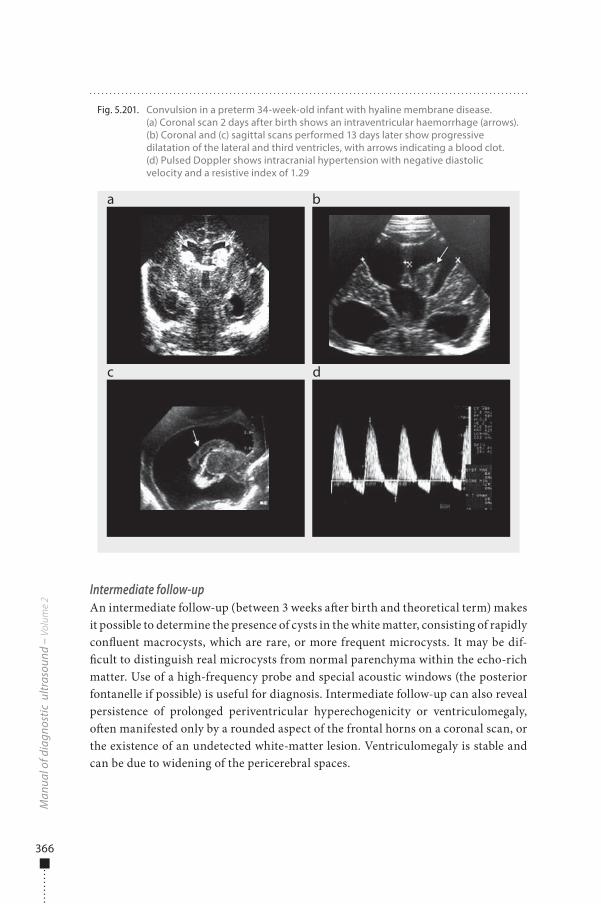
366
Intermediate follow-upAn intermediate follow-up (between 3 weeks a�er birth and theoretical term) makes it possible to determine the presence of cysts in the white matter, consisting of rapidly con�uent macrocysts, which are rare, or more frequent microcysts. It may be dif-�cult to distinguish real microcysts from normal parenchyma within the echo-rich matter. Use of a high-frequency probe and special acoustic windows (the posterior fontanelle if possible) is useful for diagnosis. Intermediate follow-up can also reveal persistence of prolonged periventricular hyperechogenicity or ventriculomegaly, o�en manifested only by a rounded aspect of the frontal horns on a coronal scan, or the existence of an undetected white-matter lesion. Ventriculomegaly is stable and can be due to widening of the pericerebral spaces.
Man
ual o
f dia
gnos
tic u
ltras
ound
– V
olum
e 2
Fig. 5.201. Convulsion in a preterm 34-week-old infant with hyaline membrane disease. (a) Coronal scan 2 days after birth shows an intraventricular haemorrhage (arrows). (b) Coronal and (c) sagittal scans performed 13 days later show progressive dilatation of the lateral and third ventricles, with arrows indicating a blood clot. (d) Pulsed Doppler shows intracranial hypertension with negative diastolic velocity and a resistive index of 1.29
a
c d
b
978-9241548540-C005 PRF ml YVR ln ml ml-1-Final Proof.indd 366 6/10/13 10:32 AM
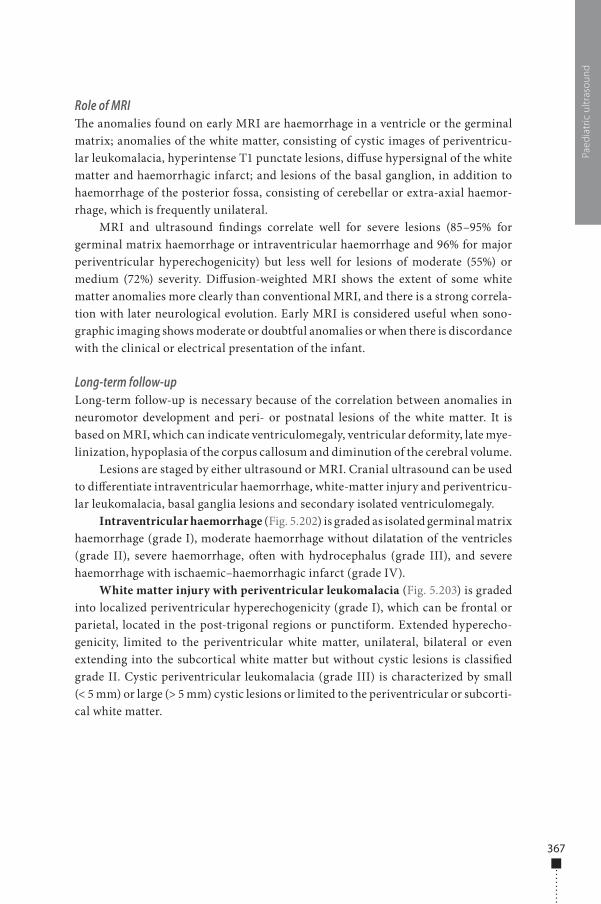
367
Role of MRI�e anomalies found on early MRI are haemorrhage in a ventricle or the germinal matrix; anomalies of the white matter, consisting of cystic images of periventricu-lar leukomalacia, hyperintense T1 punctate lesions, di�use hypersignal of the white matter and haemorrhagic infarct; and lesions of the basal ganglion, in addition to haemorrhage of the posterior fossa, consisting of cerebellar or extra-axial haemor-rhage, which is frequently unilateral.
MRI and ultrasound �ndings correlate well for severe lesions (85–95% for germinal matrix haemorrhage or intraventricular haemorrhage and 96% for major periventricular hyperechogenicity) but less well for lesions of moderate (55%) or medium (72%) severity. Di�usion-weighted MRI shows the extent of some white matter anomalies more clearly than conventional MRI, and there is a strong correla-tion with later neurological evolution. Early MRI is considered useful when sono-graphic imaging shows moderate or doubtful anomalies or when there is discordance with the clinical or electrical presentation of the infant.
Long-term follow-upLong-term follow-up is necessary because of the correlation between anomalies in neuromotor development and peri- or postnatal lesions of the white matter. It is based on MRI, which can indicate ventriculomegaly, ventricular deformity, late mye-linization, hypoplasia of the corpus callosum and diminution of the cerebral volume.
Lesions are staged by either ultrasound or MRI. Cranial ultrasound can be used to di�erentiate intraventricular haemorrhage, white-matter injury and periventricu-lar leukomalacia, basal ganglia lesions and secondary isolated ventriculomegaly.
Intraventricular haemorrhage (Fig. 5.202) is graded as isolated germinal matrix haemorrhage (grade I), moderate haemorrhage without dilatation of the ventricles (grade II), severe haemorrhage, o�en with hydrocephalus (grade III), and severe haemorrhage with ischaemic–haemorrhagic infarct (grade IV).
White matter injury with periventricular leukomalacia (Fig. 5.203) is graded into localized periventricular hyperechogenicity (grade I), which can be frontal or parietal, located in the post-trigonal regions or punctiform. Extended hyperecho-genicity, limited to the periventricular white matter, unilateral, bilateral or even extending into the subcortical white matter but without cystic lesions is classi�ed grade II. Cystic periventricular leukomalacia (grade III) is characterized by small (< 5 mm) or large (> 5 mm) cystic lesions or limited to the periventricular or subcorti-cal white matter.
Paed
iatr
ic u
ltras
ound
978-9241548540-C005 PRF ml YVR ln ml ml-1-Final Proof.indd 367 6/10/13 10:32 AM
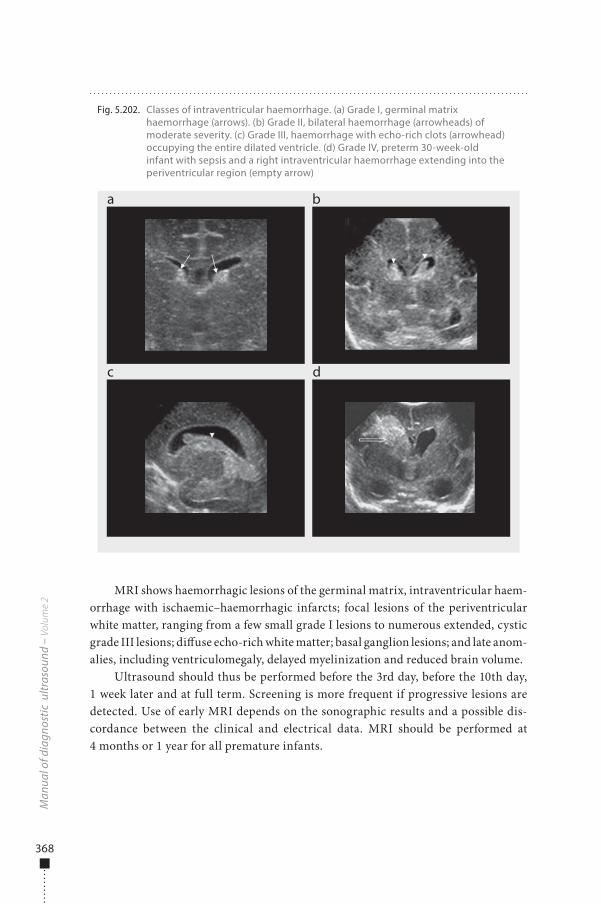
368
MRI shows haemorrhagic lesions of the germinal matrix, intraventricular haem-orrhage with ischaemic–haemorrhagic infarcts; focal lesions of the periventricular white matter, ranging from a few small grade I lesions to numerous extended, cystic grade III lesions; di�use echo-rich white matter; basal ganglion lesions; and late anom-alies, including ventriculomegaly, delayed myelinization and reduced brain volume.
Ultrasound should thus be performed before the 3rd day, before the 10th day, 1 week later and at full term. Screening is more frequent if progressive lesions are detected. Use of early MRI depends on the sonographic results and a possible dis-cordance between the clinical and electrical data. MRI should be performed at 4 months or 1 year for all premature infants.
Man
ual o
f dia
gnos
tic u
ltras
ound
– V
olum
e 2
Fig. 5.202. Classes of intraventricular haemorrhage. (a) Grade I, germinal matrix haemorrhage (arrows). (b) Grade II, bilateral haemorrhage (arrowheads) of moderate severity. (c) Grade III, haemorrhage with echo-rich clots (arrowhead) occupying the entire dilated ventricle. (d) Grade IV, preterm 30-week-old infant with sepsis and a right intraventricular haemorrhage extending into the periventricular region (empty arrow)
a
c d
b
978-9241548540-C005 PRF ml YVR ln ml ml-1-Final Proof.indd 368 6/10/13 10:32 AM
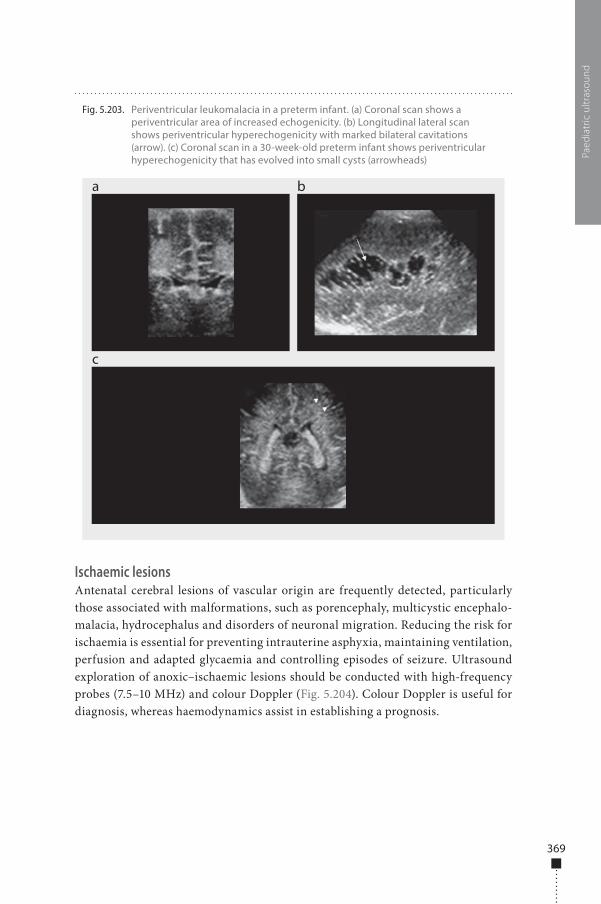
369
Ischaemic lesionsAntenatal cerebral lesions of vascular origin are frequently detected, particularly those associated with malformations, such as porencephaly, multicystic encephalo-malacia, hydrocephalus and disorders of neuronal migration. Reducing the risk for ischaemia is essential for preventing intrauterine asphyxia, maintaining ventilation, perfusion and adapted glycaemia and controlling episodes of seizure. Ultrasound exploration of anoxic–ischaemic lesions should be conducted with high-frequency probes (7.5–10 MHz) and colour Doppler (Fig. 5.204). Colour Doppler is useful for diagnosis, whereas haemodynamics assist in establishing a prognosis.
Paed
iatr
ic u
ltras
ound
Fig. 5.203. Periventricular leukomalacia in a preterm infant. (a) Coronal scan shows a periventricular area of increased echogenicity. (b) Longitudinal lateral scan shows periventricular hyperechogenicity with marked bilateral cavitations (arrow). (c) Coronal scan in a 30-week-old preterm infant shows periventricular hyperechogenicity that has evolved into small cysts (arrowheads)
a
c
b
978-9241548540-C005 PRF ml YVR ln ml ml-1-Final Proof.indd 369 6/10/13 10:32 AM
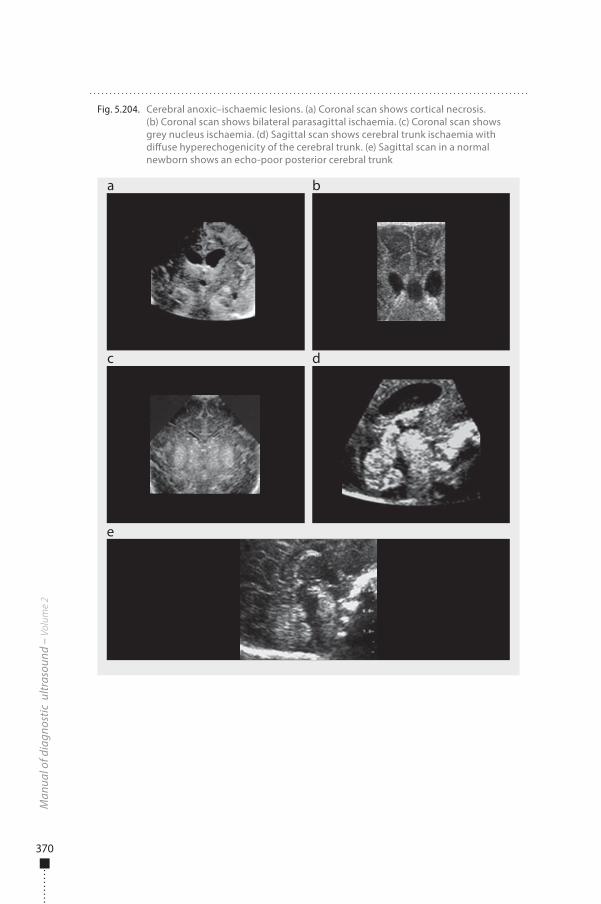
370
Man
ual o
f dia
gnos
tic u
ltras
ound
– V
olum
e 2
Fig. 5.204. Cerebral anoxic–ischaemic lesions. (a) Coronal scan shows cortical necrosis. (b) Coronal scan shows bilateral parasagittal ischaemia. (c) Coronal scan shows grey nucleus ischaemia. (d) Sagittal scan shows cerebral trunk ischaemia with di�use hyperechogenicity of the cerebral trunk. (e) Sagittal scan in a normal newborn shows an echo-poor posterior cerebral trunk
a
c
e
b
d
978-9241548540-C005 PRF ml YVR ln ml ml-1-Final Proof.indd 370 6/10/13 10:32 AM
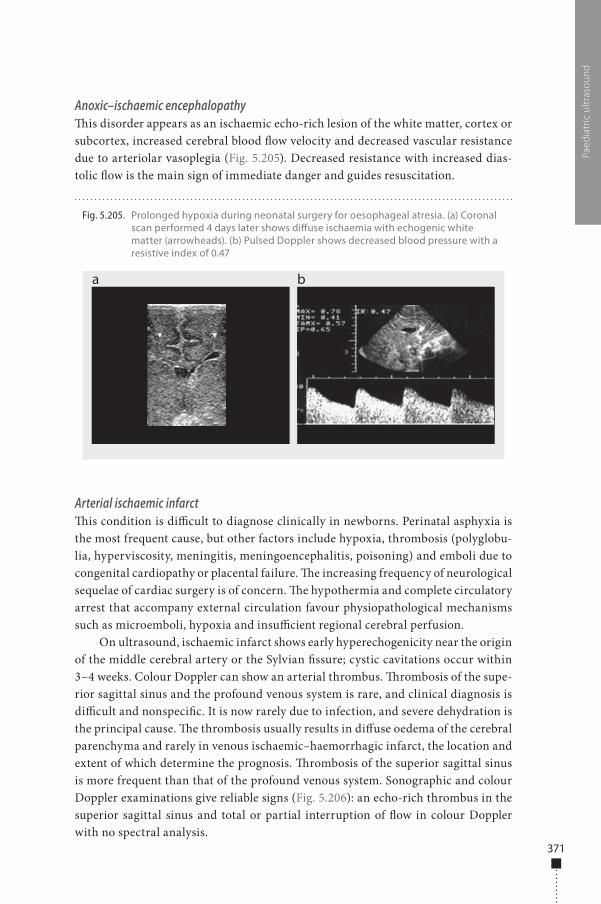
371
Anoxic–ischaemic encephalopathy�is disorder appears as an ischaemic echo-rich lesion of the white matter, cortex or subcortex, increased cerebral blood �ow velocity and decreased vascular resistance due to arteriolar vasoplegia (Fig. 5.205). Decreased resistance with increased dias-tolic �ow is the main sign of immediate danger and guides resuscitation.
Arterial ischaemic infarct�is condition is di�cult to diagnose clinically in newborns. Perinatal asphyxia is the most frequent cause, but other factors include hypoxia, thrombosis (polyglobu-lia, hyperviscosity, meningitis, meningoencephalitis, poisoning) and emboli due to congenital cardiopathy or placental failure. �e increasing frequency of neurological sequelae of cardiac surgery is of concern. �e hypothermia and complete circulatory arrest that accompany external circulation favour physiopathological mechanisms such as microemboli, hypoxia and insu�cient regional cerebral perfusion.
On ultrasound, ischaemic infarct shows early hyperechogenicity near the origin of the middle cerebral artery or the Sylvian �ssure; cystic cavitations occur within 3–4 weeks. Colour Doppler can show an arterial thrombus. �rombosis of the supe-rior sagittal sinus and the profound venous system is rare, and clinical diagnosis is di�cult and nonspeci�c. It is now rarely due to infection, and severe dehydration is the principal cause. �e thrombosis usually results in di�use oedema of the cerebral parenchyma and rarely in venous ischaemic–haemorrhagic infarct, the location and extent of which determine the prognosis. �rombosis of the superior sagittal sinus is more frequent than that of the profound venous system. Sonographic and colour Doppler examinations give reliable signs (Fig. 5.206): an echo-rich thrombus in the superior sagittal sinus and total or partial interruption of �ow in colour Doppler with no spectral analysis.
Paed
iatr
ic u
ltras
ound
Fig. 5.205. Prolonged hypoxia during neonatal surgery for oesophageal atresia. (a) Coronal scan performed 4 days later shows di�use ischaemia with echogenic white matter (arrowheads). (b) Pulsed Doppler shows decreased blood pressure with a resistive index of 0.47
a b
978-9241548540-C005 PRF ml YVR ln ml ml-1-Final Proof.indd 371 6/10/13 10:32 AM
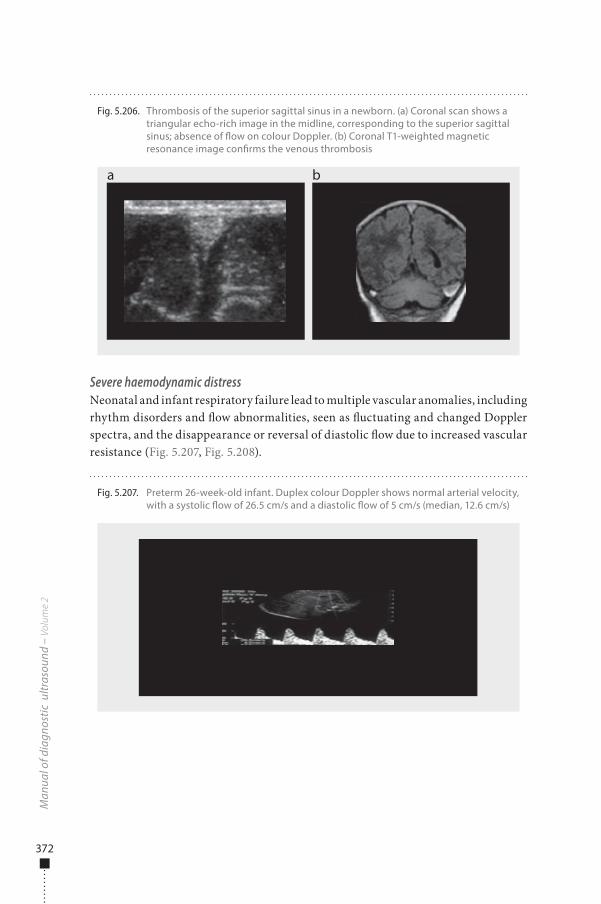
372
Severe haemodynamic distressNeonatal and infant respiratory failure lead to multiple vascular anomalies, including rhythm disorders and �ow abnormalities, seen as �uctuating and changed Doppler spectra, and the disappearance or reversal of diastolic �ow due to increased vascular resistance (Fig. 5.207, Fig. 5.208).
Man
ual o
f dia
gnos
tic u
ltras
ound
– V
olum
e 2
Fig. 5.206. Thrombosis of the superior sagittal sinus in a newborn. (a) Coronal scan shows a triangular echo-rich image in the midline, corresponding to the superior sagittal sinus; absence of �ow on colour Doppler. (b) Coronal T1-weighted magnetic resonance image con�rms the venous thrombosis
a b
Fig. 5.207. Preterm 26-week-old infant. Duplex colour Doppler shows normal arterial velocity, with a systolic �ow of 26.5 cm/s and a diastolic �ow of 5 cm/s (median, 12.6 cm/s)
978-9241548540-C005 PRF ml YVR ln ml ml-1-Final Proof.indd 372 6/10/13 10:32 AM
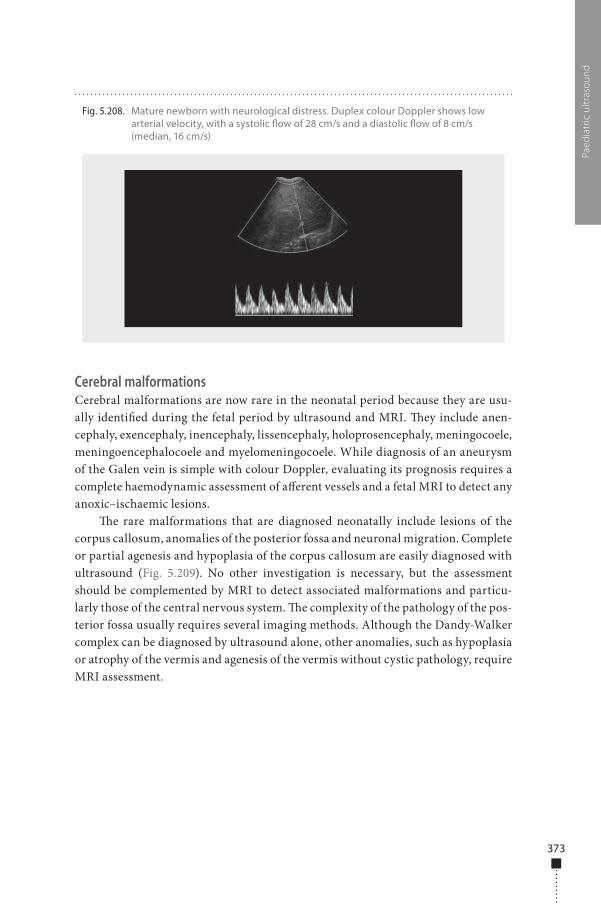
373
Cerebral malformationsCerebral malformations are now rare in the neonatal period because they are usu-ally identi�ed during the fetal period by ultrasound and MRI. �ey include anen-cephaly, exencephaly, inencephaly, lissencephaly, holoprosencephaly, meningocoele, meningoencephalocoele and myelomeningocoele. While diagnosis of an aneurysm of the Galen vein is simple with colour Doppler, evaluating its prognosis requires a complete haemodynamic assessment of a�erent vessels and a fetal MRI to detect any anoxic–ischaemic lesions.
�e rare malformations that are diagnosed neonatally include lesions of the corpus callosum, anomalies of the posterior fossa and neuronal migration. Complete or partial agenesis and hypoplasia of the corpus callosum are easily diagnosed with ultrasound (Fig. 5.209). No other investigation is necessary, but the assessment should be complemented by MRI to detect associated malformations and particu-larly those of the central nervous system. �e complexity of the pathology of the pos-terior fossa usually requires several imaging methods. Although the Dandy-Walker complex can be diagnosed by ultrasound alone, other anomalies, such as hypoplasia or atrophy of the vermis and agenesis of the vermis without cystic pathology, require MRI assessment.
Paed
iatr
ic u
ltras
ound
Fig. 5.208. Mature newborn with neurological distress. Duplex colour Doppler shows low arterial velocity, with a systolic �ow of 28 cm/s and a diastolic �ow of 8 cm/s (median, 16 cm/s)
978-9241548540-C005 PRF ml YVR ln ml ml-1-Final Proof.indd 373 6/10/13 10:32 AM
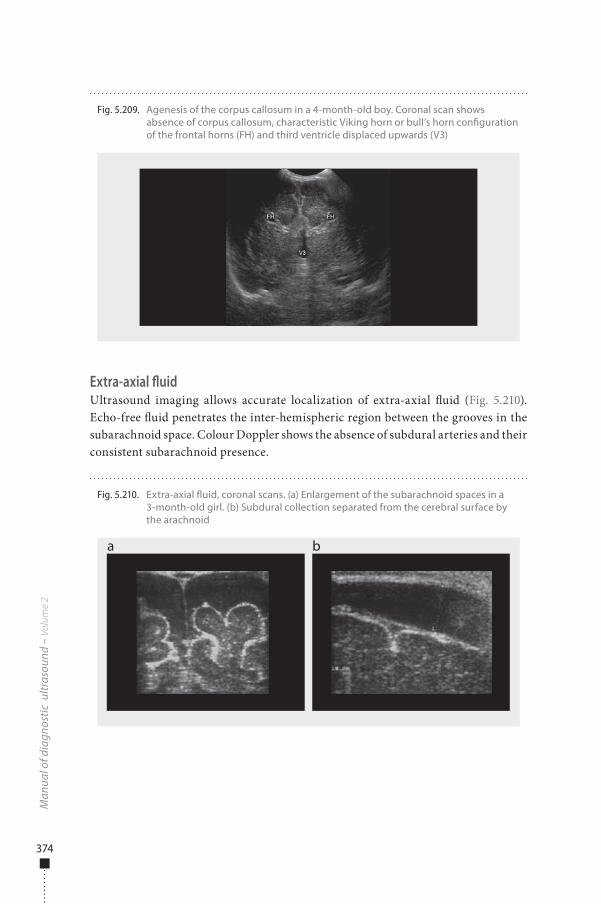
374
Extra-axial fluidUltrasound imaging allows accurate localization of extra-axial �uid (Fig. 5.210). Echo-free �uid penetrates the inter-hemispheric region between the grooves in the subarachnoid space. Colour Doppler shows the absence of subdural arteries and their consistent subarachnoid presence.
Man
ual o
f dia
gnos
tic u
ltras
ound
– V
olum
e 2
Fig. 5.209. Agenesis of the corpus callosum in a 4-month-old boy. Coronal scan shows absence of corpus callosum, characteristic Viking horn or bull’s horn con�guration of the frontal horns (FH) and third ventricle displaced upwards (V3)
Fig. 5.210. Extra-axial �uid, coronal scans. (a) Enlargement of the subarachnoid spaces in a 3-month-old girl. (b) Subdural collection separated from the cerebral surface by the arachnoid
a b
978-9241548540-C005 PRF ml YVR ln ml ml-1-Final Proof.indd 374 6/10/13 10:32 AM
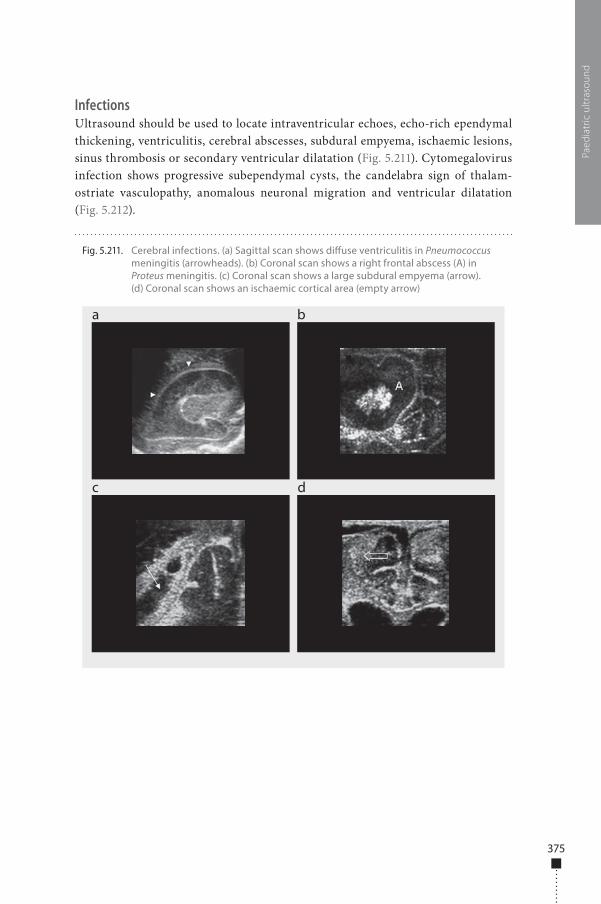
375
InfectionsUltrasound should be used to locate intraventricular echoes, echo-rich ependymal thickening, ventriculitis, cerebral abscesses, subdural empyema, ischaemic lesions, sinus thrombosis or secondary ventricular dilatation (Fig. 5.211). Cytomegalovirus infection shows progressive subependymal cysts, the candelabra sign of thalam-ostriate vasculopathy, anomalous neuronal migration and ventricular dilatation (Fig. 5.212).
Paed
iatr
ic u
ltras
ound
Fig. 5.211. Cerebral infections. (a) Sagittal scan shows di�use ventriculitis in Pneumococcus meningitis (arrowheads). (b) Coronal scan shows a right frontal abscess (A) in Proteus meningitis. (c) Coronal scan shows a large subdural empyema (arrow). (d) Coronal scan shows an ischaemic cortical area (empty arrow)
a
c d
b
978-9241548540-C005 PRF ml YVR ln ml ml-1-Final Proof.indd 375 6/10/13 10:32 AM
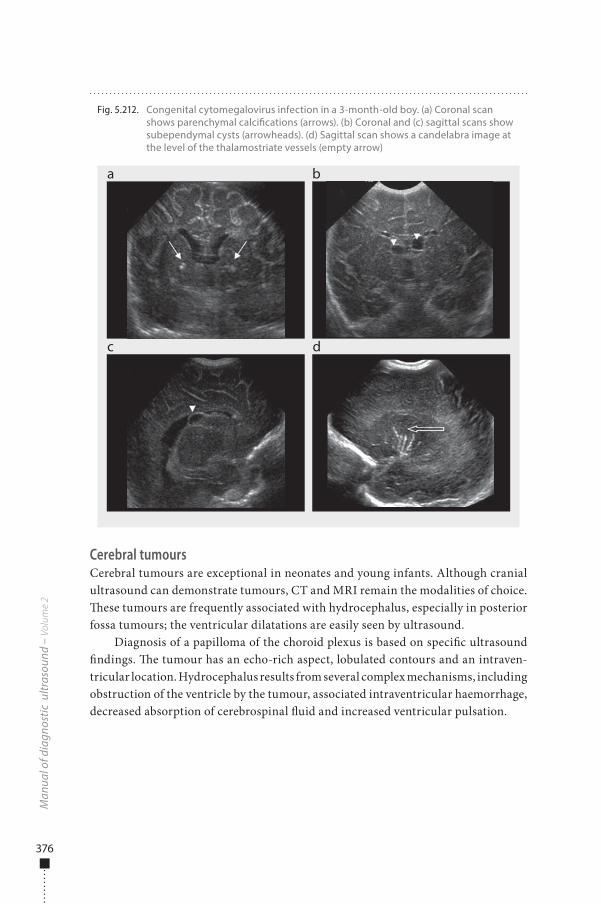
376
Cerebral tumoursCerebral tumours are exceptional in neonates and young infants. Although cranial ultrasound can demonstrate tumours, CT and MRI remain the modalities of choice. �ese tumours are frequently associated with hydrocephalus, especially in posterior fossa tumours; the ventricular dilatations are easily seen by ultrasound.
Diagnosis of a papilloma of the choroid plexus is based on speci�c ultrasound �ndings. �e tumour has an echo-rich aspect, lobulated contours and an intraven-tricular location. Hydrocephalus results from several complex mechanisms, including obstruction of the ventricle by the tumour, associated intraventricular haemorrhage, decreased absorption of cerebrospinal �uid and increased ventricular pulsation.
Man
ual o
f dia
gnos
tic u
ltras
ound
– V
olum
e 2
Fig. 5.212. Congenital cytomegalovirus infection in a 3-month-old boy. (a) Coronal scan shows parenchymal calci�cations (arrows). (b) Coronal and (c) sagittal scans show subependymal cysts (arrowheads). (d) Sagittal scan shows a candelabra image at the level of the thalamostriate vessels (empty arrow)
a
c d
b
978-9241548540-C005 PRF ml YVR ln ml ml-1-Final Proof.indd 376 6/10/13 10:32 AM
377
Spine
Indications�e spinal cord is examined by ultrasound in neonates and infants less than 6 months of age with signs of spinal disease. Typical indications are:
■ midline skin masses on the back; ■ midline cutaneous malformations on the back, such as a dimple or a haeman-
giomatous or hairy lesion; ■ deformities of the spinal column; ■ neurological disturbances; ■ spinal cord injury due to traumatic birth or meningeal tear; ■ syndromes with associated spinal cord compression.
Ultrasound can be used in the antenatal period to predict the anatomical level of spinal dysraphism in most cases. As sonography can show the entire spectrum of intraspinal anatomy and pathological conditions with high resolution, it should be considered the initial imaging modality of choice for investigating the spinal cord in neonates and for deciding whether CT or MRI should be performed.
Preparation�ere is no speci�c preparation.
Examination techniqueInfants are usually examined in the prone position, curved over a pillow. For exami-nation of the craniocervical junction, the neck must be �exed. Sagittal and axial planes of the spinal canal and cord can be examined, from the craniocervical junc-tion to the sacrum. In older children, progressive ossi�cation of the posterior ele-ments of the vertebrae obviates useful examination, and paramedian scans may be su�cient.
Movement of the spinal cord and cauda equina can be evaluated with real-time ultrasound in M-mode. �e brain is examined systematically through the fontanelle. Examinations should be performed with high-frequency linear transducers (5–12 MHz).
Normal �ndings�e normal spinal cord appears on ultrasound as an echo-poor tubular structure containing �ne, homogeneous internal echoes, surrounded by a nearly echo-free area corresponding to the cerebrospinal �uid. A well-de�ned echogenic interface highlights the boundaries of the cord, with a change in acoustic impedance between the spinal cord and surrounding cerebrospinal �uid (Fig. 5.213). �e diameter of the
Paed
iatr
ic u
ltras
ound
978-9241548540-C005 PRF ml YVR ln ml ml-1-Final Proof.indd 377 6/10/13 10:32 AM
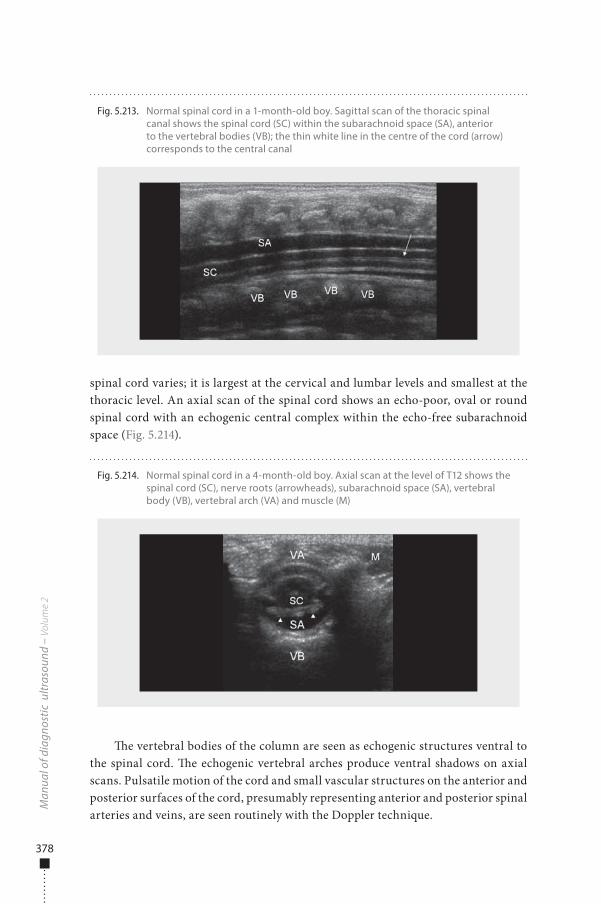
378
spinal cord varies; it is largest at the cervical and lumbar levels and smallest at the thoracic level. An axial scan of the spinal cord shows an echo-poor, oval or round spinal cord with an echogenic central complex within the echo-free subarachnoid space (Fig. 5.214).
�e vertebral bodies of the column are seen as echogenic structures ventral to the spinal cord. �e echogenic vertebral arches produce ventral shadows on axial scans. Pulsatile motion of the cord and small vascular structures on the anterior and posterior surfaces of the cord, presumably representing anterior and posterior spinal arteries and veins, are seen routinely with the Doppler technique.
Man
ual o
f dia
gnos
tic u
ltras
ound
– V
olum
e 2
Fig. 5.213. Normal spinal cord in a 1-month-old boy. Sagittal scan of the thoracic spinal canal shows the spinal cord (SC) within the subarachnoid space (SA), anterior to the vertebral bodies (VB); the thin white line in the centre of the cord (arrow) corresponds to the central canal
Fig. 5.214. Normal spinal cord in a 4-month-old boy. Axial scan at the level of T12 shows the spinal cord (SC), nerve roots (arrowheads), subarachnoid space (SA), vertebral body (VB), vertebral arch (VA) and muscle (M)
978-9241548540-C005 PRF ml YVR ln ml ml-1-Final Proof.indd 378 6/10/13 10:32 AM
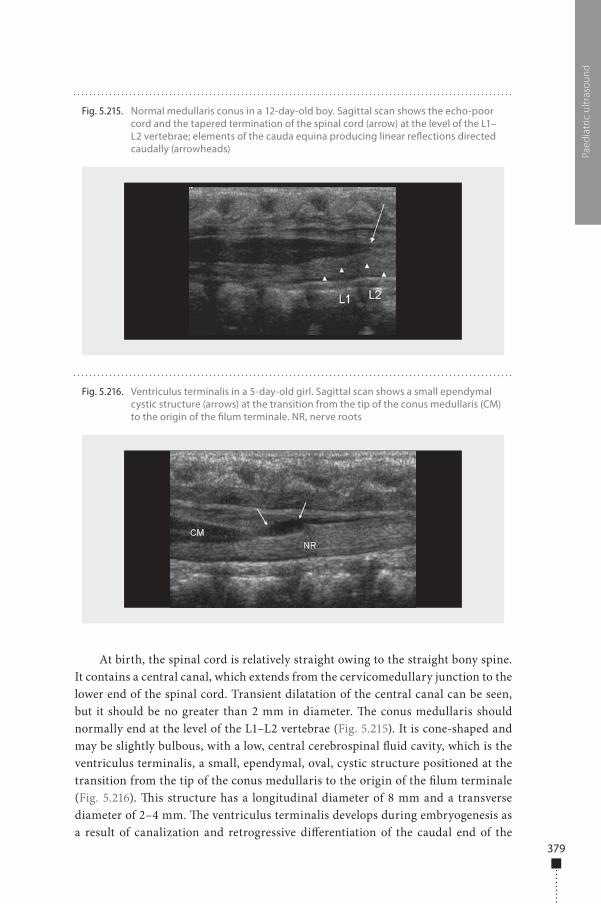
379
At birth, the spinal cord is relatively straight owing to the straight bony spine. It contains a central canal, which extends from the cervicomedullary junction to the lower end of the spinal cord. Transient dilatation of the central canal can be seen, but it should be no greater than 2 mm in diameter. �e conus medullaris should normally end at the level of the L1–L2 vertebrae (Fig. 5.215). It is cone-shaped and may be slightly bulbous, with a low, central cerebrospinal �uid cavity, which is the ventriculus terminalis, a small, ependymal, oval, cystic structure positioned at the transition from the tip of the conus medullaris to the origin of the �lum terminale (Fig. 5.216). �is structure has a longitudinal diameter of 8 mm and a transverse diameter of 2–4 mm. �e ventriculus terminalis develops during embryogenesis as a result of canalization and retrogressive di�erentiation of the caudal end of the
Paed
iatr
ic u
ltras
ound
Fig. 5.215. Normal medullaris conus in a 12-day-old boy. Sagittal scan shows the echo-poor cord and the tapered termination of the spinal cord (arrow) at the level of the L1–L2 vertebrae; elements of the cauda equina producing linear re�ections directed caudally (arrowheads)
Fig. 5.216. Ventriculus terminalis in a 5-day-old girl. Sagittal scan shows a small ependymal cystic structure (arrows) at the transition from the tip of the conus medullaris (CM) to the origin of the �lum terminale. NR, nerve roots
978-9241548540-C005 PRF ml YVR ln ml ml-1-Final Proof.indd 379 6/10/13 10:32 AM
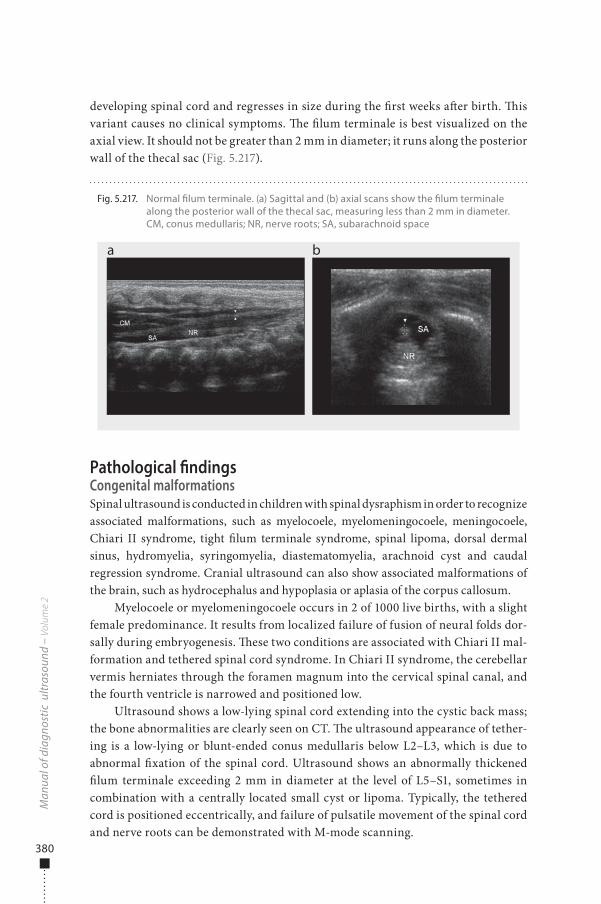
380
developing spinal cord and regresses in size during the �rst weeks a�er birth. �is variant causes no clinical symptoms. �e �lum terminale is best visualized on the axial view. It should not be greater than 2 mm in diameter; it runs along the posterior wall of the thecal sac (Fig. 5.217).
Pathological �ndingsCongenital malformationsSpinal ultrasound is conducted in children with spinal dysraphism in order to recognize associated malformations, such as myelocoele, myelomeningocoele, meningocoele, Chiari II syndrome, tight �lum terminale syndrome, spinal lipoma, dorsal dermal sinus, hydromyelia, syringomyelia, diastematomyelia, arachnoid cyst and caudal regression syndrome. Cranial ultrasound can also show associated malformations of the brain, such as hydrocephalus and hypoplasia or aplasia of the corpus callosum.
Myelocoele or myelomeningocoele occurs in 2 of 1000 live births, with a slight female predominance. It results from localized failure of fusion of neural folds dor-sally during embryogenesis. �ese two conditions are associated with Chiari II mal-formation and tethered spinal cord syndrome. In Chiari II syndrome, the cerebellar vermis herniates through the foramen magnum into the cervical spinal canal, and the fourth ventricle is narrowed and positioned low.
Ultrasound shows a low-lying spinal cord extending into the cystic back mass; the bone abnormalities are clearly seen on CT. �e ultrasound appearance of tether-ing is a low-lying or blunt-ended conus medullaris below L2–L3, which is due to abnormal �xation of the spinal cord. Ultrasound shows an abnormally thickened �lum terminale exceeding 2 mm in diameter at the level of L5–S1, sometimes in combination with a centrally located small cyst or lipoma. Typically, the tethered cord is positioned eccentrically, and failure of pulsatile movement of the spinal cord and nerve roots can be demonstrated with M-mode scanning.
Man
ual o
f dia
gnos
tic u
ltras
ound
– V
olum
e 2
Fig. 5.217. Normal �lum terminale. (a) Sagittal and (b) axial scans show the �lum terminale along the posterior wall of the thecal sac, measuring less than 2 mm in diameter. CM, conus medullaris; NR, nerve roots; SA, subarachnoid space
a b
978-9241548540-C005 PRF ml YVR ln ml ml-1-Final Proof.indd 380 6/10/13 10:32 AM
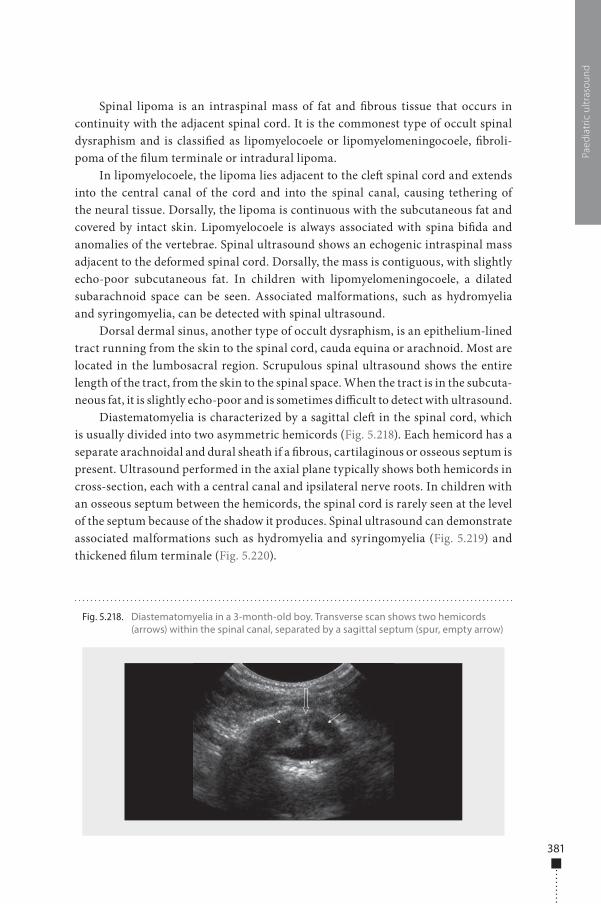
381
Spinal lipoma is an intraspinal mass of fat and �brous tissue that occurs in continuity with the adjacent spinal cord. It is the commonest type of occult spinal dysraphism and is classi�ed as lipomyelocoele or lipomyelomeningocoele, �broli-poma of the �lum terminale or intradural lipoma.
In lipomyelocoele, the lipoma lies adjacent to the cle� spinal cord and extends into the central canal of the cord and into the spinal canal, causing tethering of the neural tissue. Dorsally, the lipoma is continuous with the subcutaneous fat and covered by intact skin. Lipomyelocoele is always associated with spina bi�da and anomalies of the vertebrae. Spinal ultrasound shows an echogenic intraspinal mass adjacent to the deformed spinal cord. Dorsally, the mass is contiguous, with slightly echo-poor subcutaneous fat. In children with lipomyelomeningocoele, a dilated subarachnoid space can be seen. Associated malformations, such as hydromyelia and syringomyelia, can be detected with spinal ultrasound.
Dorsal dermal sinus, another type of occult dysraphism, is an epithelium-lined tract running from the skin to the spinal cord, cauda equina or arachnoid. Most are located in the lumbosacral region. Scrupulous spinal ultrasound shows the entire length of the tract, from the skin to the spinal space. When the tract is in the subcuta-neous fat, it is slightly echo-poor and is sometimes di�cult to detect with ultrasound.
Diastematomyelia is characterized by a sagittal cle� in the spinal cord, which is usually divided into two asymmetric hemicords (Fig. 5.218). Each hemicord has a separate arachnoidal and dural sheath if a �brous, cartilaginous or osseous septum is present. Ultrasound performed in the axial plane typically shows both hemicords in cross-section, each with a central canal and ipsilateral nerve roots. In children with an osseous septum between the hemicords, the spinal cord is rarely seen at the level of the septum because of the shadow it produces. Spinal ultrasound can demonstrate associated malformations such as hydromyelia and syringomyelia (Fig. 5.219) and thickened �lum terminale (Fig. 5.220).
Paed
iatr
ic u
ltras
ound
Fig. 5.218. Diastematomyelia in a 3-month-old boy. Transverse scan shows two hemicords (arrows) within the spinal canal, separated by a sagittal septum (spur, empty arrow)
978-9241548540-C005 PRF ml YVR ln ml ml-1-Final Proof.indd 381 6/10/13 10:32 AM
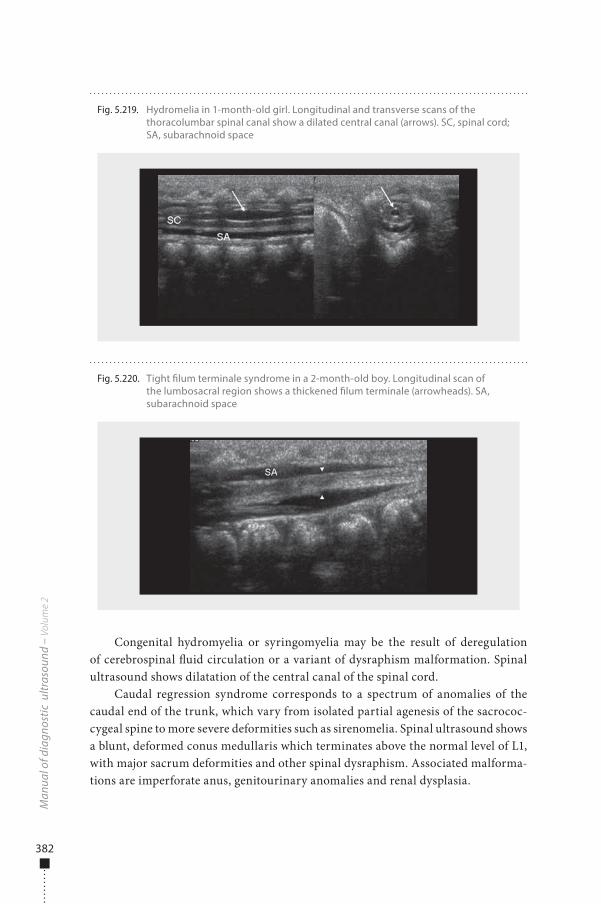
382
Congenital hydromyelia or syringomyelia may be the result of deregulation of cerebrospinal �uid circulation or a variant of dysraphism malformation. Spinal ultrasound shows dilatation of the central canal of the spinal cord.
Caudal regression syndrome corresponds to a spectrum of anomalies of the caudal end of the trunk, which vary from isolated partial agenesis of the sacrococ-cygeal spine to more severe deformities such as sirenomelia. Spinal ultrasound shows a blunt, deformed conus medullaris which terminates above the normal level of L1, with major sacrum deformities and other spinal dysraphism. Associated malforma-tions are imperforate anus, genitourinary anomalies and renal dysplasia.
Man
ual o
f dia
gnos
tic u
ltras
ound
– V
olum
e 2
Fig. 5.219. Hydromelia in 1-month-old girl. Longitudinal and transverse scans of the thoracolumbar spinal canal show a dilated central canal (arrows). SC, spinal cord; SA, subarachnoid space
Fig. 5.220. Tight �lum terminale syndrome in a 2-month-old boy. Longitudinal scan of the lumbosacral region shows a thickened �lum terminale (arrowheads). SA, subarachnoid space
978-9241548540-C005 PRF ml YVR ln ml ml-1-Final Proof.indd 382 6/10/13 10:32 AM
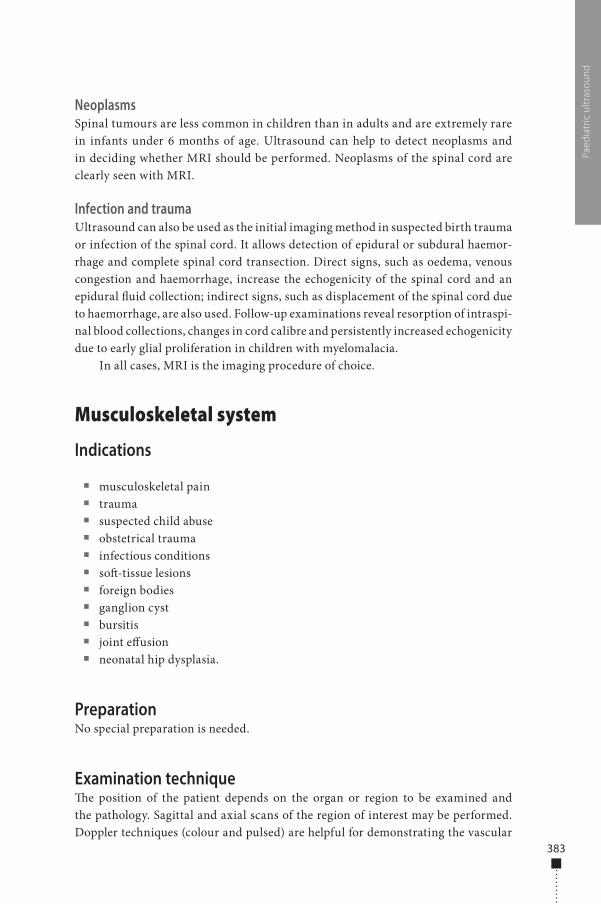
383
NeoplasmsSpinal tumours are less common in children than in adults and are extremely rare in infants under 6 months of age. Ultrasound can help to detect neoplasms and in deciding whether MRI should be performed. Neoplasms of the spinal cord are clearly seen with MRI.
Infection and traumaUltrasound can also be used as the initial imaging method in suspected birth trauma or infection of the spinal cord. It allows detection of epidural or subdural haemor-rhage and complete spinal cord transection. Direct signs, such as oedema, venous congestion and haemorrhage, increase the echogenicity of the spinal cord and an epidural �uid collection; indirect signs, such as displacement of the spinal cord due to haemorrhage, are also used. Follow-up examinations reveal resorption of intraspi-nal blood collections, changes in cord calibre and persistently increased echogenicity due to early glial proliferation in children with myelomalacia.
In all cases, MRI is the imaging procedure of choice.
Musculoskeletal system
Indications
■ musculoskeletal pain ■ trauma ■ suspected child abuse ■ obstetrical trauma ■ infectious conditions ■ so�-tissue lesions ■ foreign bodies ■ ganglion cyst ■ bursitis ■ joint e�usion ■ neonatal hip dysplasia.
PreparationNo special preparation is needed.
Examination technique�e position of the patient depends on the organ or region to be examined and the pathology. Sagittal and axial scans of the region of interest may be performed. Doppler techniques (colour and pulsed) are helpful for demonstrating the vascular
Paed
iatr
ic u
ltras
ound
978-9241548540-C005 PRF ml YVR ln ml ml-1-Final Proof.indd 383 6/10/13 10:32 AM
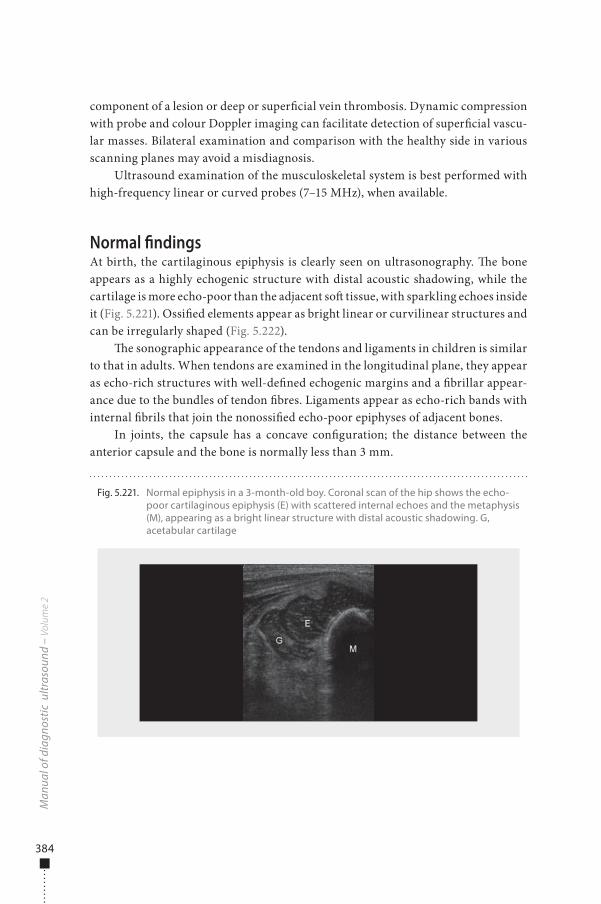
384
component of a lesion or deep or super�cial vein thrombosis. Dynamic compression with probe and colour Doppler imaging can facilitate detection of super�cial vascu-lar masses. Bilateral examination and comparison with the healthy side in various scanning planes may avoid a misdiagnosis.
Ultrasound examination of the musculoskeletal system is best performed with high-frequency linear or curved probes (7–15 MHz), when available.
Normal �ndingsAt birth, the cartilaginous epiphysis is clearly seen on ultrasonography. �e bone appears as a highly echogenic structure with distal acoustic shadowing, while the cartilage is more echo-poor than the adjacent so� tissue, with sparkling echoes inside it (Fig. 5.221). Ossi�ed elements appear as bright linear or curvilinear structures and can be irregularly shaped (Fig. 5.222).
�e sonographic appearance of the tendons and ligaments in children is similar to that in adults. When tendons are examined in the longitudinal plane, they appear as echo-rich structures with well-de�ned echogenic margins and a �brillar appear-ance due to the bundles of tendon �bres. Ligaments appear as echo-rich bands with internal �brils that join the nonossi�ed echo-poor epiphyses of adjacent bones.
In joints, the capsule has a concave con�guration; the distance between the anterior capsule and the bone is normally less than 3 mm.
Man
ual o
f dia
gnos
tic u
ltras
ound
– V
olum
e 2
Fig. 5.221. Normal epiphysis in a 3-month-old boy. Coronal scan of the hip shows the echo-poor cartilaginous epiphysis (E) with scattered internal echoes and the metaphysis (M), appearing as a bright linear structure with distal acoustic shadowing. G, acetabular cartilage
978-9241548540-C005 PRF ml YVR ln ml ml-1-Final Proof.indd 384 6/10/13 10:32 AM
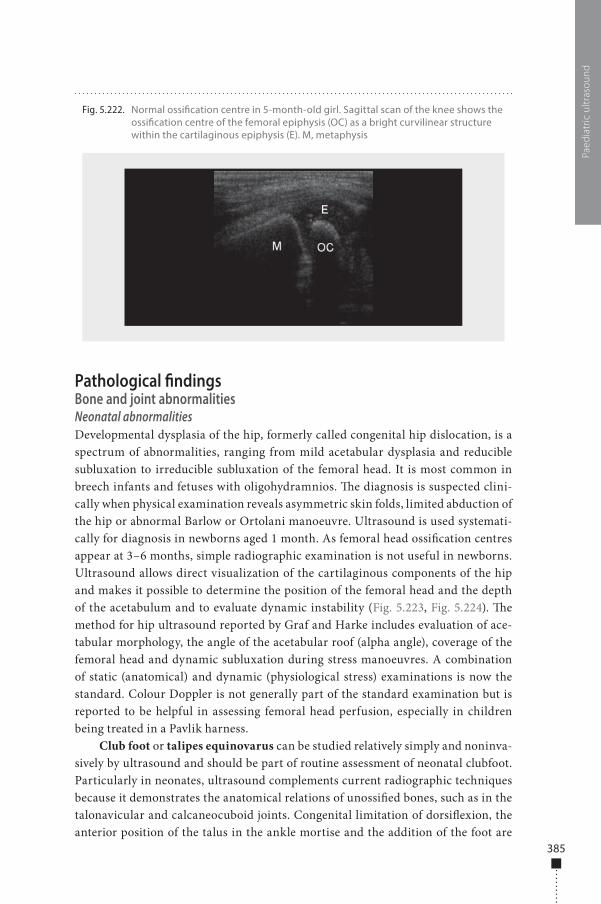
385
Pathological �ndingsBone and joint abnormalitiesNeonatal abnormalitiesDevelopmental dysplasia of the hip, formerly called congenital hip dislocation, is a spectrum of abnormalities, ranging from mild acetabular dysplasia and reducible subluxation to irreducible subluxation of the femoral head. It is most common in breech infants and fetuses with oligohydramnios. �e diagnosis is suspected clini-cally when physical examination reveals asymmetric skin folds, limited abduction of the hip or abnormal Barlow or Ortolani manoeuvre. Ultrasound is used systemati-cally for diagnosis in newborns aged 1 month. As femoral head ossi�cation centres appear at 3–6 months, simple radiographic examination is not useful in newborns. Ultrasound allows direct visualization of the cartilaginous components of the hip and makes it possible to determine the position of the femoral head and the depth of the acetabulum and to evaluate dynamic instability (Fig. 5.223, Fig. 5.224). �e method for hip ultrasound reported by Graf and Harke includes evaluation of ace-tabular morphology, the angle of the acetabular roof (alpha angle), coverage of the femoral head and dynamic subluxation during stress manoeuvres. A combination of static (anatomical) and dynamic (physiological stress) examinations is now the standard. Colour Doppler is not generally part of the standard examination but is reported to be helpful in assessing femoral head perfusion, especially in children being treated in a Pavlik harness.
Club foot or talipes equinovarus can be studied relatively simply and noninva-sively by ultrasound and should be part of routine assessment of neonatal clubfoot. Particularly in neonates, ultrasound complements current radiographic techniques because it demonstrates the anatomical relations of unossi�ed bones, such as in the talonavicular and calcaneocuboid joints. Congenital limitation of dorsi�exion, the anterior position of the talus in the ankle mortise and the addition of the foot are
Paed
iatr
ic u
ltras
ound
Fig. 5.222. Normal ossi�cation centre in 5-month-old girl. Sagittal scan of the knee shows the ossi�cation centre of the femoral epiphysis (OC) as a bright curvilinear structure within the cartilaginous epiphysis (E). M, metaphysis
978-9241548540-C005 PRF ml YVR ln ml ml-1-Final Proof.indd 385 6/10/13 10:32 AM
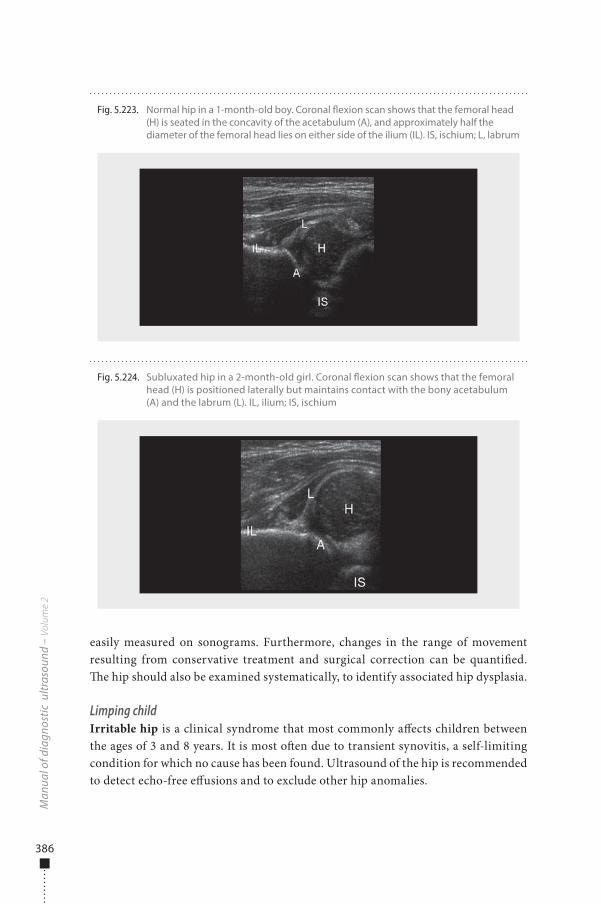
386
easily measured on sonograms. Furthermore, changes in the range of movement resulting from conservative treatment and surgical correction can be quanti�ed. �e hip should also be examined systematically, to identify associated hip dysplasia.
Limping childIrritable hip is a clinical syndrome that most commonly a�ects children between the ages of 3 and 8 years. It is most o�en due to transient synovitis, a self-limiting condition for which no cause has been found. Ultrasound of the hip is recommended to detect echo-free e�usions and to exclude other hip anomalies.
Man
ual o
f dia
gnos
tic u
ltras
ound
– V
olum
e 2
Fig. 5.223. Normal hip in a 1-month-old boy. Coronal �exion scan shows that the femoral head (H) is seated in the concavity of the acetabulum (A), and approximately half the diameter of the femoral head lies on either side of the ilium (IL). IS, ischium; L, labrum
Fig. 5.224. Subluxated hip in a 2-month-old girl. Coronal �exion scan shows that the femoral head (H) is positioned laterally but maintains contact with the bony acetabulum (A) and the labrum (L). IL, ilium; IS, ischium
978-9241548540-C005 PRF ml YVR ln ml ml-1-Final Proof.indd 386 6/10/13 10:32 AM
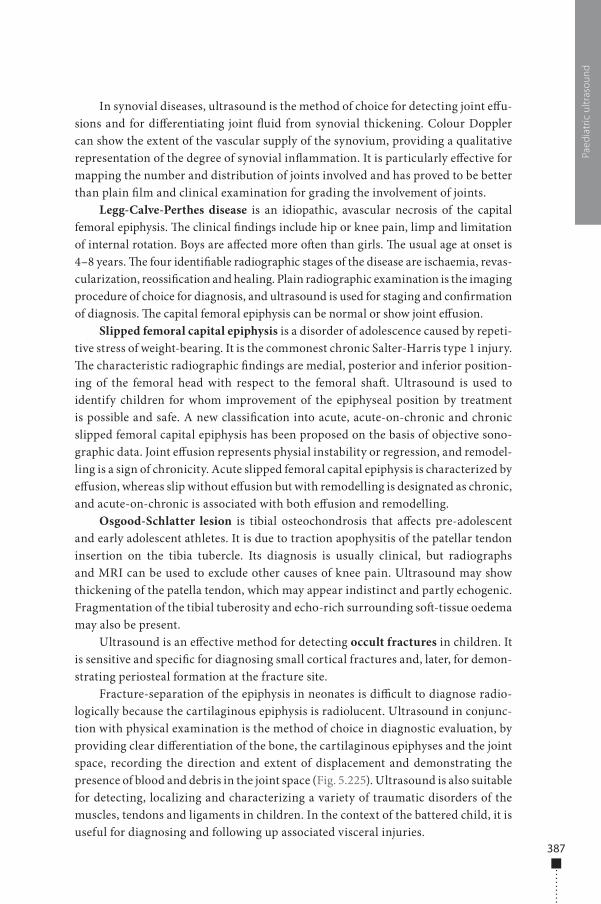
387
In synovial diseases, ultrasound is the method of choice for detecting joint e�u-sions and for di�erentiating joint �uid from synovial thickening. Colour Doppler can show the extent of the vascular supply of the synovium, providing a qualitative representation of the degree of synovial in�ammation. It is particularly e�ective for mapping the number and distribution of joints involved and has proved to be better than plain �lm and clinical examination for grading the involvement of joints.
Legg-Calve-Perthes disease is an idiopathic, avascular necrosis of the capital femoral epiphysis. �e clinical �ndings include hip or knee pain, limp and limitation of internal rotation. Boys are a�ected more o�en than girls. �e usual age at onset is 4–8 years. �e four identi�able radiographic stages of the disease are ischaemia, revas-cularization, reossi�cation and healing. Plain radiographic examination is the imaging procedure of choice for diagnosis, and ultrasound is used for staging and con�rmation of diagnosis. �e capital femoral epiphysis can be normal or show joint e�usion.
Slipped femoral capital epiphysis is a disorder of adolescence caused by repeti-tive stress of weight-bearing. It is the commonest chronic Salter-Harris type 1 injury. �e characteristic radiographic �ndings are medial, posterior and inferior position-ing of the femoral head with respect to the femoral sha�. Ultrasound is used to identify children for whom improvement of the epiphyseal position by treatment is possible and safe. A new classi�cation into acute, acute-on-chronic and chronic slipped femoral capital epiphysis has been proposed on the basis of objective sono-graphic data. Joint e�usion represents physial instability or regression, and remodel-ling is a sign of chronicity. Acute slipped femoral capital epiphysis is characterized by e�usion, whereas slip without e�usion but with remodelling is designated as chronic, and acute-on-chronic is associated with both e�usion and remodelling.
Osgood-Schlatter lesion is tibial osteochondrosis that a�ects pre-adolescent and early adolescent athletes. It is due to traction apophysitis of the patellar tendon insertion on the tibia tubercle. Its diagnosis is usually clinical, but radiographs and MRI can be used to exclude other causes of knee pain. Ultrasound may show thickening of the patella tendon, which may appear indistinct and partly echogenic. Fragmentation of the tibial tuberosity and echo-rich surrounding so�-tissue oedema may also be present.
Ultrasound is an e�ective method for detecting occult fractures in children. It is sensitive and speci�c for diagnosing small cortical fractures and, later, for demon-strating periosteal formation at the fracture site.
Fracture-separation of the epiphysis in neonates is di�cult to diagnose radio-logically because the cartilaginous epiphysis is radiolucent. Ultrasound in conjunc-tion with physical examination is the method of choice in diagnostic evaluation, by providing clear di�erentiation of the bone, the cartilaginous epiphyses and the joint space, recording the direction and extent of displacement and demonstrating the presence of blood and debris in the joint space (Fig. 5.225). Ultrasound is also suitable for detecting, localizing and characterizing a variety of traumatic disorders of the muscles, tendons and ligaments in children. In the context of the battered child, it is useful for diagnosing and following up associated visceral injuries.
Paed
iatr
ic u
ltras
ound
978-9241548540-C005 PRF ml YVR ln ml ml-1-Final Proof.indd 387 6/10/13 10:32 AM
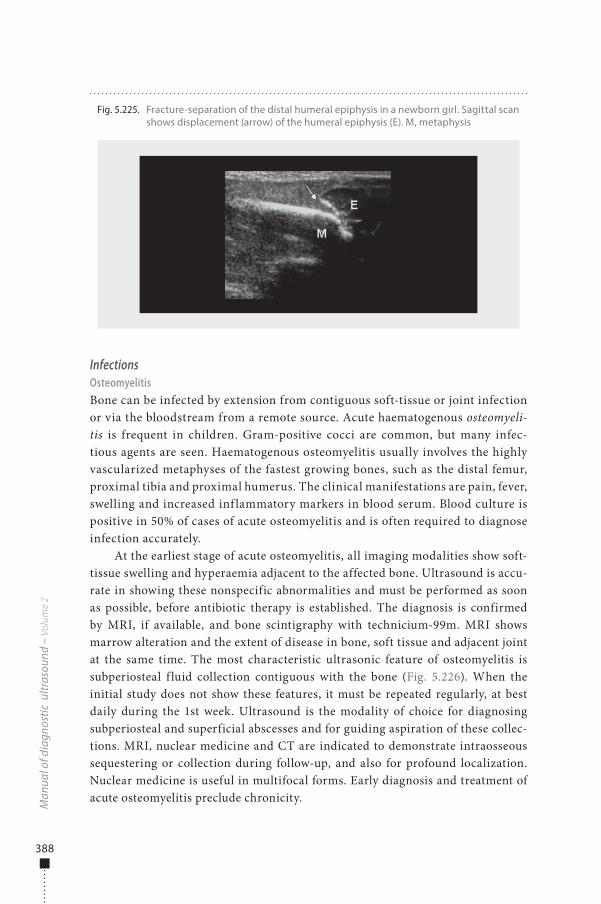
388
InfectionsOsteomyelitisBone can be infected by extension from contiguous soft-tissue or joint infection or via the bloodstream from a remote source. Acute haematogenous osteomyeli-tis is frequent in children. Gram-positive cocci are common, but many infec-tious agents are seen. Haematogenous osteomyelitis usually involves the highly vascularized metaphyses of the fastest growing bones, such as the distal femur, proximal tibia and proximal humerus. The clinical manifestations are pain, fever, swelling and increased inf lammatory markers in blood serum. Blood culture is positive in 50% of cases of acute osteomyelitis and is often required to diagnose infection accurately.
At the earliest stage of acute osteomyelitis, all imaging modalities show soft-tissue swelling and hyperaemia adjacent to the affected bone. Ultrasound is accu-rate in showing these nonspecific abnormalities and must be performed as soon as possible, before antibiotic therapy is established. The diagnosis is confirmed by MRI, if available, and bone scintigraphy with technicium-99m. MRI shows marrow alteration and the extent of disease in bone, soft tissue and adjacent joint at the same time. The most characteristic ultrasonic feature of osteomyelitis is subperiosteal f luid collection contiguous with the bone (Fig. 5.226). When the initial study does not show these features, it must be repeated regularly, at best daily during the 1st week. Ultrasound is the modality of choice for diagnosing subperiosteal and superficial abscesses and for guiding aspiration of these collec-tions. MRI, nuclear medicine and CT are indicated to demonstrate intraosseous sequestering or collection during follow-up, and also for profound localization. Nuclear medicine is useful in multifocal forms. Early diagnosis and treatment of acute osteomyelitis preclude chronicity.
Man
ual o
f dia
gnos
tic u
ltras
ound
– V
olum
e 2
Fig. 5.225. Fracture-separation of the distal humeral epiphysis in a newborn girl. Sagittal scan shows displacement (arrow) of the humeral epiphysis (E). M, metaphysis
978-9241548540-C005 PRF ml YVR ln ml ml-1-Final Proof.indd 388 6/10/13 10:32 AM
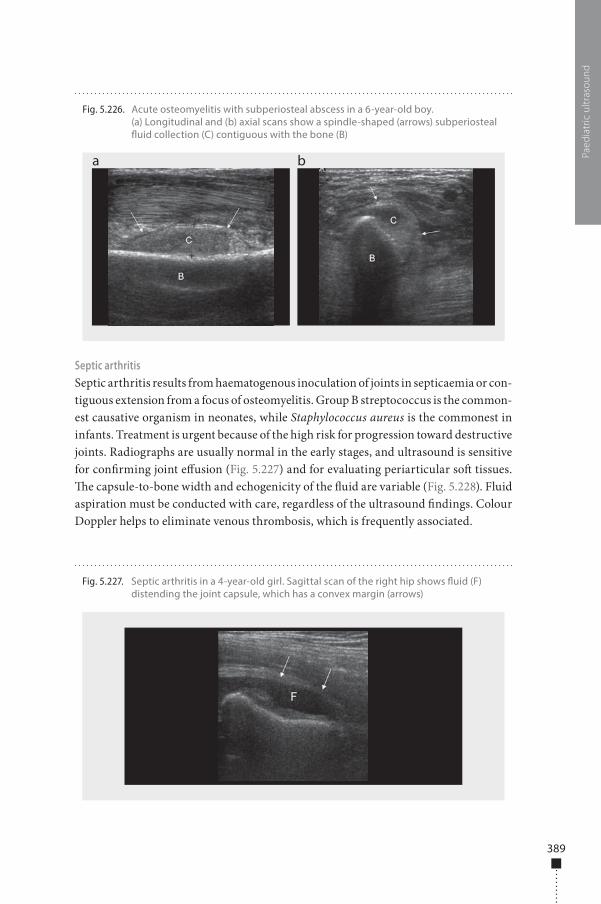
389
Septic arthritisSeptic arthritis results from haematogenous inoculation of joints in septicaemia or con-tiguous extension from a focus of osteomyelitis. Group B streptococcus is the common-est causative organism in neonates, while Staphylococcus aureus is the commonest in infants. Treatment is urgent because of the high risk for progression toward destructive joints. Radiographs are usually normal in the early stages, and ultrasound is sensitive for con�rming joint e�usion (Fig. 5.227) and for evaluating periarticular so� tissues. �e capsule-to-bone width and echogenicity of the �uid are variable (Fig. 5.228). Fluid aspiration must be conducted with care, regardless of the ultrasound �ndings. Colour Doppler helps to eliminate venous thrombosis, which is frequently associated.
Paed
iatr
ic u
ltras
ound
Fig. 5.226. Acute osteomyelitis with subperiosteal abscess in a 6-year-old boy. (a) Longitudinal and (b) axial scans show a spindle-shaped (arrows) subperiosteal �uid collection (C) contiguous with the bone (B)
a b
Fig. 5.227. Septic arthritis in a 4-year-old girl. Sagittal scan of the right hip shows �uid (F) distending the joint capsule, which has a convex margin (arrows)
978-9241548540-C005 PRF ml YVR ln ml ml-1-Final Proof.indd 389 6/10/13 10:32 AM
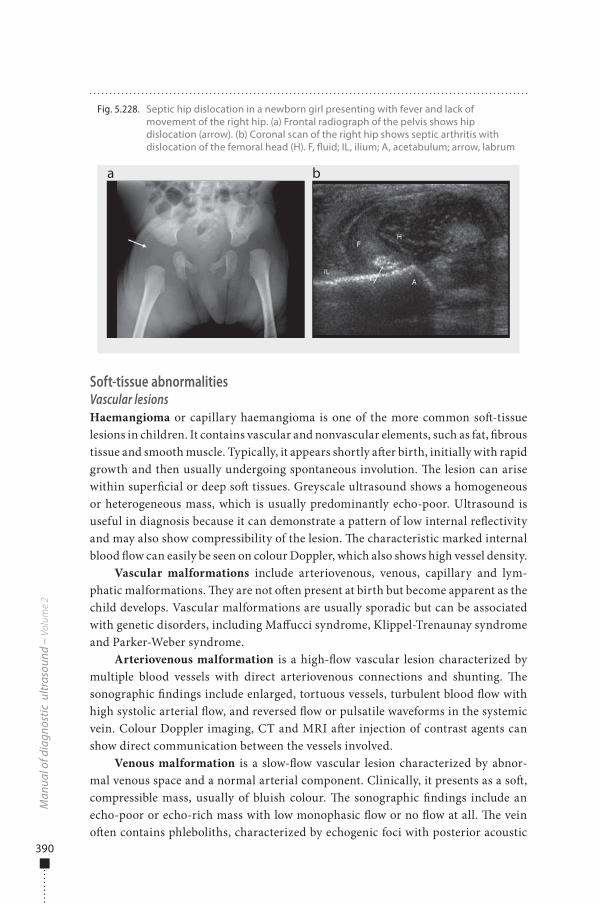
390
Soft-tissue abnormalitiesVascular lesionsHaemangioma or capillary haemangioma is one of the more common so�-tissue lesions in children. It contains vascular and nonvascular elements, such as fat, �brous tissue and smooth muscle. Typically, it appears shortly a�er birth, initially with rapid growth and then usually undergoing spontaneous involution. �e lesion can arise within super�cial or deep so� tissues. Greyscale ultrasound shows a homogeneous or heterogeneous mass, which is usually predominantly echo-poor. Ultrasound is useful in diagnosis because it can demonstrate a pattern of low internal re�ectivity and may also show compressibility of the lesion. �e characteristic marked internal blood �ow can easily be seen on colour Doppler, which also shows high vessel density.
Vascular malformations include arteriovenous, venous, capillary and lym-phatic malformations. �ey are not o�en present at birth but become apparent as the child develops. Vascular malformations are usually sporadic but can be associated with genetic disorders, including Ma�ucci syndrome, Klippel-Trenaunay syndrome and Parker-Weber syndrome.
Arteriovenous malformation is a high-�ow vascular lesion characterized by multiple blood vessels with direct arteriovenous connections and shunting. �e sonographic �ndings include enlarged, tortuous vessels, turbulent blood �ow with high systolic arterial �ow, and reversed �ow or pulsatile waveforms in the systemic vein. Colour Doppler imaging, CT and MRI a�er injection of contrast agents can show direct communication between the vessels involved.
Venous malformation is a slow-�ow vascular lesion characterized by abnor-mal venous space and a normal arterial component. Clinically, it presents as a so�, compressible mass, usually of bluish colour. �e sonographic �ndings include an echo-poor or echo-rich mass with low monophasic �ow or no �ow at all. �e vein o�en contains phleboliths, characterized by echogenic foci with posterior acoustic
Man
ual o
f dia
gnos
tic u
ltras
ound
– V
olum
e 2
Fig. 5.228. Septic hip dislocation in a newborn girl presenting with fever and lack of movement of the right hip. (a) Frontal radiograph of the pelvis shows hip dislocation (arrow). (b) Coronal scan of the right hip shows septic arthritis with dislocation of the femoral head (H). F, �uid; IL, ilium; A, acetabulum; arrow, labrum
a b
978-9241548540-C005 PRF ml YVR ln ml ml-1-Final Proof.indd 390 6/10/13 10:32 AM
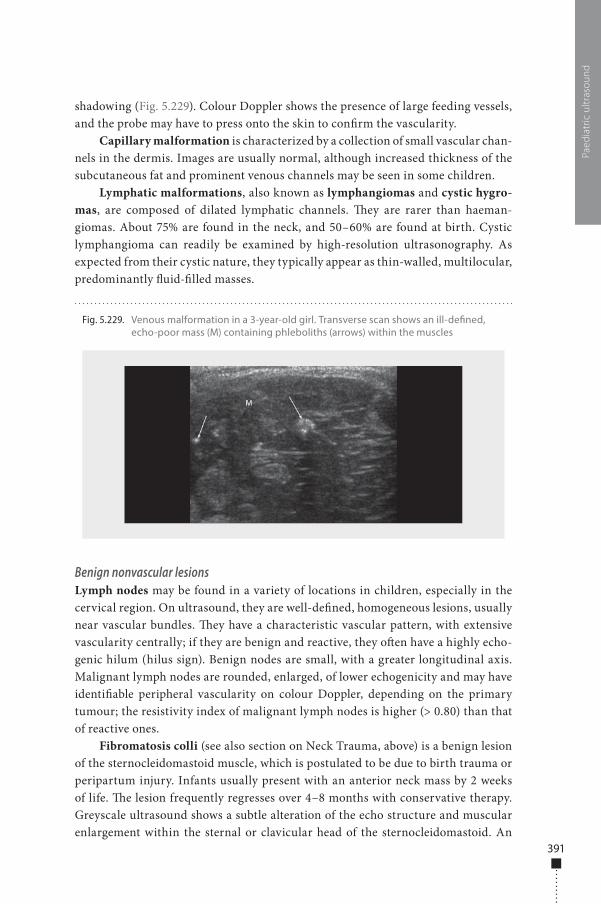
391
shadowing (Fig. 5.229). Colour Doppler shows the presence of large feeding vessels, and the probe may have to press onto the skin to con�rm the vascularity.
Capillary malformation is characterized by a collection of small vascular chan-nels in the dermis. Images are usually normal, although increased thickness of the subcutaneous fat and prominent venous channels may be seen in some children.
Lymphatic malformations, also known as lymphangiomas and cystic hygro-mas, are composed of dilated lymphatic channels. �ey are rarer than haeman-giomas. About 75% are found in the neck, and 50–60% are found at birth. Cystic lymphangioma can readily be examined by high-resolution ultrasonography. As expected from their cystic nature, they typically appear as thin-walled, multilocular, predominantly �uid-�lled masses.
Benign nonvascular lesionsLymph nodes may be found in a variety of locations in children, especially in the cervical region. On ultrasound, they are well-de�ned, homogeneous lesions, usually near vascular bundles. �ey have a characteristic vascular pattern, with extensive vascularity centrally; if they are benign and reactive, they o�en have a highly echo-genic hilum (hilus sign). Benign nodes are small, with a greater longitudinal axis. Malignant lymph nodes are rounded, enlarged, of lower echogenicity and may have identi�able peripheral vascularity on colour Doppler, depending on the primary tumour; the resistivity index of malignant lymph nodes is higher (> 0.80) than that of reactive ones.
Fibromatosis colli (see also section on Neck Trauma, above) is a benign lesion of the sternocleidomastoid muscle, which is postulated to be due to birth trauma or peripartum injury. Infants usually present with an anterior neck mass by 2 weeks of life. �e lesion frequently regresses over 4–8 months with conservative therapy. Greyscale ultrasound shows a subtle alteration of the echo structure and muscular enlargement within the sternal or clavicular head of the sternocleidomastoid. An
Paed
iatr
ic u
ltras
ound
Fig. 5.229. Venous malformation in a 3-year-old girl. Transverse scan shows an ill-de�ned, echo-poor mass (M) containing phleboliths (arrows) within the muscles
978-9241548540-C005 PRF ml YVR ln ml ml-1-Final Proof.indd 391 6/10/13 10:32 AM
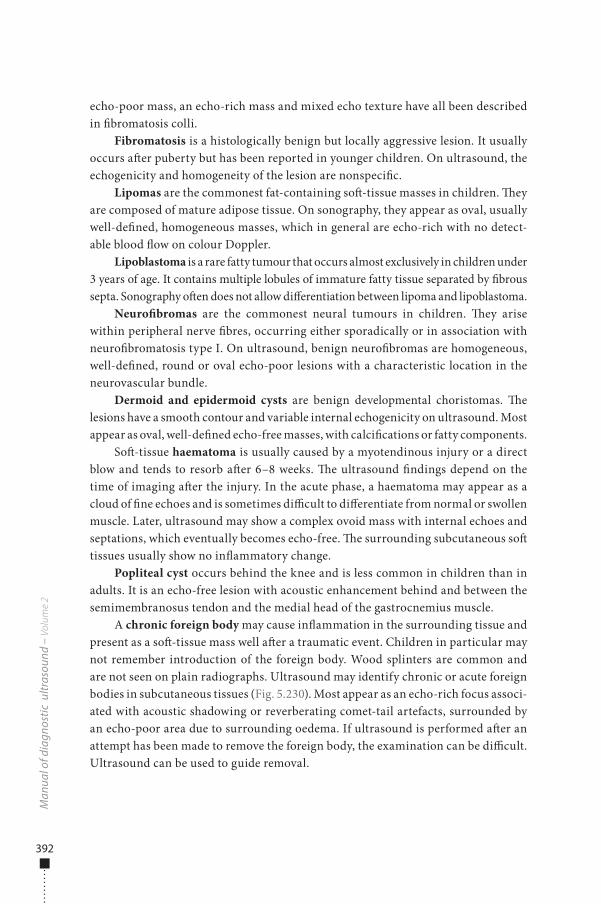
392
echo-poor mass, an echo-rich mass and mixed echo texture have all been described in �bromatosis colli.
Fibromatosis is a histologically benign but locally aggressive lesion. It usually occurs a�er puberty but has been reported in younger children. On ultrasound, the echogenicity and homogeneity of the lesion are nonspeci�c.
Lipomas are the commonest fat-containing so�-tissue masses in children. �ey are composed of mature adipose tissue. On sonography, they appear as oval, usually well-de�ned, homogeneous masses, which in general are echo-rich with no detect-able blood �ow on colour Doppler.
Lipoblastoma is a rare fatty tumour that occurs almost exclusively in children under 3 years of age. It contains multiple lobules of immature fatty tissue separated by �brous septa. Sonography o�en does not allow di�erentiation between lipoma and lipoblastoma.
Neuro�bromas are the commonest neural tumours in children. �ey arise within peripheral nerve �bres, occurring either sporadically or in association with neuro�bromatosis type I. On ultrasound, benign neuro�bromas are homogeneous, well-de�ned, round or oval echo-poor lesions with a characteristic location in the neurovascular bundle.
Dermoid and epidermoid cysts are benign developmental choristomas. �e lesions have a smooth contour and variable internal echogenicity on ultrasound. Most appear as oval, well-de�ned echo-free masses, with calci�cations or fatty components.
So�-tissue haematoma is usually caused by a myotendinous injury or a direct blow and tends to resorb a�er 6–8 weeks. �e ultrasound �ndings depend on the time of imaging a�er the injury. In the acute phase, a haematoma may appear as a cloud of �ne echoes and is sometimes di�cult to di�erentiate from normal or swollen muscle. Later, ultrasound may show a complex ovoid mass with internal echoes and septations, which eventually becomes echo-free. �e surrounding subcutaneous so� tissues usually show no in�ammatory change.
Popliteal cyst occurs behind the knee and is less common in children than in adults. It is an echo-free lesion with acoustic enhancement behind and between the semimembranosus tendon and the medial head of the gastrocnemius muscle.
A chronic foreign body may cause in�ammation in the surrounding tissue and present as a so�-tissue mass well a�er a traumatic event. Children in particular may not remember introduction of the foreign body. Wood splinters are common and are not seen on plain radiographs. Ultrasound may identify chronic or acute foreign bodies in subcutaneous tissues (Fig. 5.230). Most appear as an echo-rich focus associ-ated with acoustic shadowing or reverberating comet-tail artefacts, surrounded by an echo-poor area due to surrounding oedema. If ultrasound is performed a�er an attempt has been made to remove the foreign body, the examination can be di�cult. Ultrasound can be used to guide removal.
Man
ual o
f dia
gnos
tic u
ltras
ound
– V
olum
e 2
978-9241548540-C005 PRF ml YVR ln ml ml-1-Final Proof.indd 392 6/10/13 10:32 AM
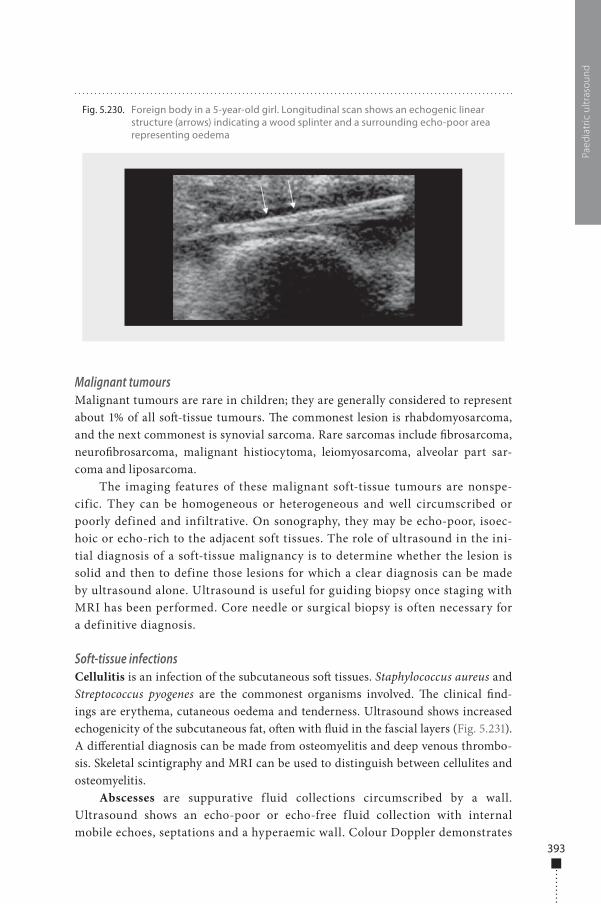
393
Malignant tumoursMalignant tumours are rare in children; they are generally considered to represent about 1% of all so�-tissue tumours. �e commonest lesion is rhabdomyosarcoma, and the next commonest is synovial sarcoma. Rare sarcomas include �brosarcoma, neuro�brosarcoma, malignant histiocytoma, leiomyosarcoma, alveolar part sar-coma and liposarcoma.
The imaging features of these malignant soft-tissue tumours are nonspe-cific. They can be homogeneous or heterogeneous and well circumscribed or poorly defined and infiltrative. On sonography, they may be echo-poor, isoec-hoic or echo-rich to the adjacent soft tissues. The role of ultrasound in the ini-tial diagnosis of a soft-tissue malignancy is to determine whether the lesion is solid and then to define those lesions for which a clear diagnosis can be made by ultrasound alone. Ultrasound is useful for guiding biopsy once staging with MRI has been performed. Core needle or surgical biopsy is often necessary for a definitive diagnosis.
Soft-tissue infectionsCellulitis is an infection of the subcutaneous so� tissues. Staphylococcus aureus and Streptococcus pyogenes are the commonest organisms involved. �e clinical �nd-ings are erythema, cutaneous oedema and tenderness. Ultrasound shows increased echogenicity of the subcutaneous fat, o�en with �uid in the fascial layers (Fig. 5.231). A di�erential diagnosis can be made from osteomyelitis and deep venous thrombo-sis. Skeletal scintigraphy and MRI can be used to distinguish between cellulites and osteomyelitis.
Abscesses are suppurative f luid collections circumscribed by a wall. Ultrasound shows an echo-poor or echo-free f luid collection with internal mobile echoes, septations and a hyperaemic wall. Colour Doppler demonstrates
Paed
iatr
ic u
ltras
ound
Fig. 5.230. Foreign body in a 5-year-old girl. Longitudinal scan shows an echogenic linear structure (arrows) indicating a wood splinter and a surrounding echo-poor area representing oedema
978-9241548540-C005 PRF ml YVR ln ml ml-1-Final Proof.indd 393 6/10/13 10:32 AM
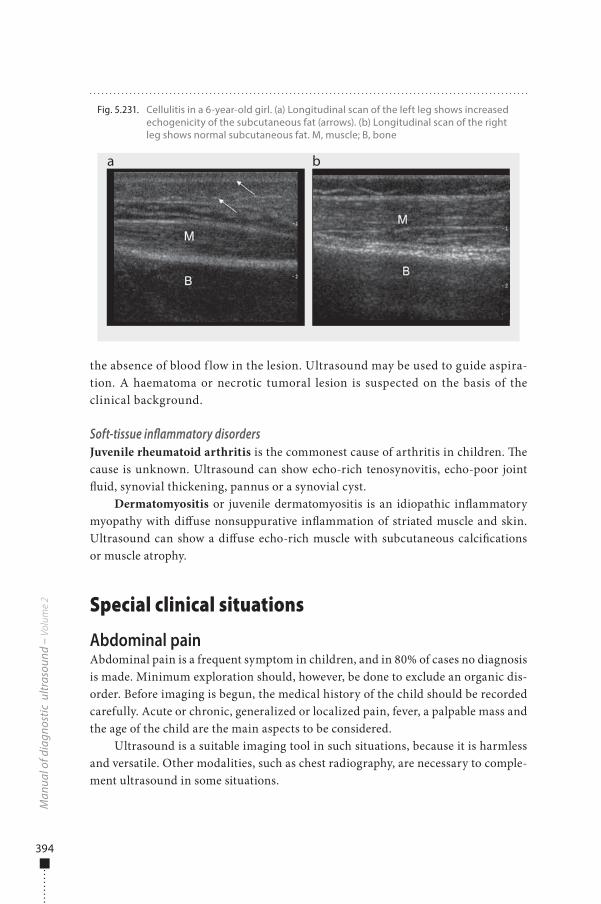
394
the absence of blood f low in the lesion. Ultrasound may be used to guide aspira-tion. A haematoma or necrotic tumoral lesion is suspected on the basis of the clinical background.
Soft-tissue inflammatory disordersJuvenile rheumatoid arthritis is the commonest cause of arthritis in children. �e cause is unknown. Ultrasound can show echo-rich tenosynovitis, echo-poor joint �uid, synovial thickening, pannus or a synovial cyst.
Dermatomyositis or juvenile dermatomyositis is an idiopathic in�ammatory myopathy with di�use nonsuppurative in�ammation of striated muscle and skin. Ultrasound can show a di�use echo-rich muscle with subcutaneous calci�cations or muscle atrophy.
Special clinical situations
Abdominal painAbdominal pain is a frequent symptom in children, and in 80% of cases no diagnosis is made. Minimum exploration should, however, be done to exclude an organic dis-order. Before imaging is begun, the medical history of the child should be recorded carefully. Acute or chronic, generalized or localized pain, fever, a palpable mass and the age of the child are the main aspects to be considered.
Ultrasound is a suitable imaging tool in such situations, because it is harmless and versatile. Other modalities, such as chest radiography, are necessary to comple-ment ultrasound in some situations.
Man
ual o
f dia
gnos
tic u
ltras
ound
– V
olum
e 2
Fig. 5.231. Cellulitis in a 6-year-old girl. (a) Longitudinal scan of the left leg shows increased echogenicity of the subcutaneous fat (arrows). (b) Longitudinal scan of the right leg shows normal subcutaneous fat. M, muscle; B, bone
a b
978-9241548540-C005 PRF ml YVR ln ml ml-1-Final Proof.indd 394 6/10/13 10:32 AM
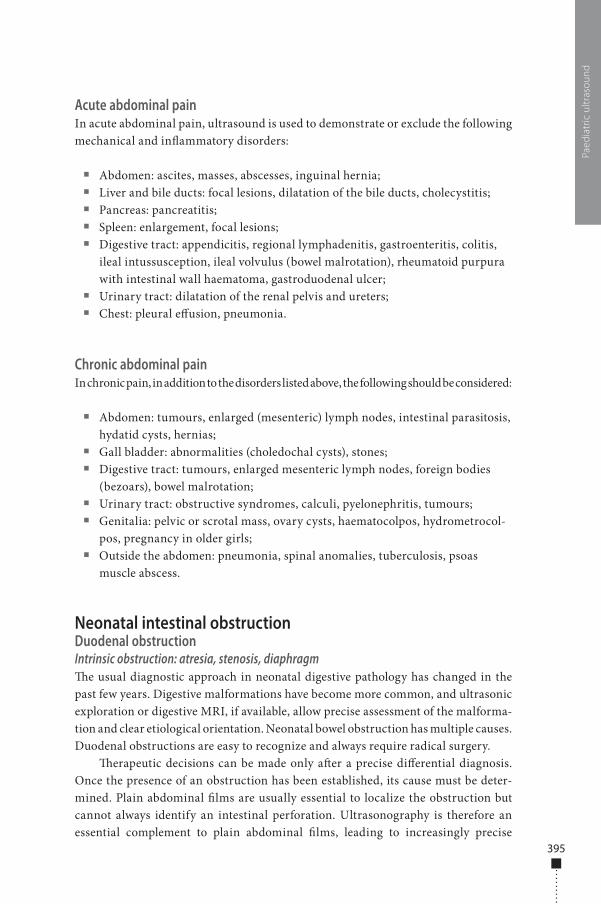
395
Acute abdominal painIn acute abdominal pain, ultrasound is used to demonstrate or exclude the following mechanical and in�ammatory disorders:
■ Abdomen: ascites, masses, abscesses, inguinal hernia; ■ Liver and bile ducts: focal lesions, dilatation of the bile ducts, cholecystitis; ■ Pancreas: pancreatitis; ■ Spleen: enlargement, focal lesions; ■ Digestive tract: appendicitis, regional lymphadenitis, gastroenteritis, colitis,
ileal intussusception, ileal volvulus (bowel malrotation), rheumatoid purpura with intestinal wall haematoma, gastroduodenal ulcer;
■ Urinary tract: dilatation of the renal pelvis and ureters; ■ Chest: pleural e�usion, pneumonia.
Chronic abdominal painIn chronic pain, in addition to the disorders listed above, the following should be considered:
■ Abdomen: tumours, enlarged (mesenteric) lymph nodes, intestinal parasitosis, hydatid cysts, hernias;
■ Gall bladder: abnormalities (choledochal cysts), stones; ■ Digestive tract: tumours, enlarged mesenteric lymph nodes, foreign bodies
(bezoars), bowel malrotation; ■ Urinary tract: obstructive syndromes, calculi, pyelonephritis, tumours; ■ Genitalia: pelvic or scrotal mass, ovary cysts, haematocolpos, hydrometrocol-
pos, pregnancy in older girls; ■ Outside the abdomen: pneumonia, spinal anomalies, tuberculosis, psoas
muscle abscess.
Neonatal intestinal obstructionDuodenal obstructionIntrinsic obstruction: atresia, stenosis, diaphragm�e usual diagnostic approach in neonatal digestive pathology has changed in the past few years. Digestive malformations have become more common, and ultrasonic exploration or digestive MRI, if available, allow precise assessment of the malforma-tion and clear etiological orientation. Neonatal bowel obstruction has multiple causes. Duodenal obstructions are easy to recognize and always require radical surgery.
�erapeutic decisions can be made only a�er a precise di�erential diagnosis. Once the presence of an obstruction has been established, its cause must be deter-mined. Plain abdominal �lms are usually essential to localize the obstruction but cannot always identify an intestinal perforation. Ultrasonography is therefore an essential complement to plain abdominal �lms, leading to increasingly precise
Paed
iatr
ic u
ltras
ound
978-9241548540-C005 PRF ml YVR ln ml ml-1-Final Proof.indd 395 6/10/13 10:32 AM
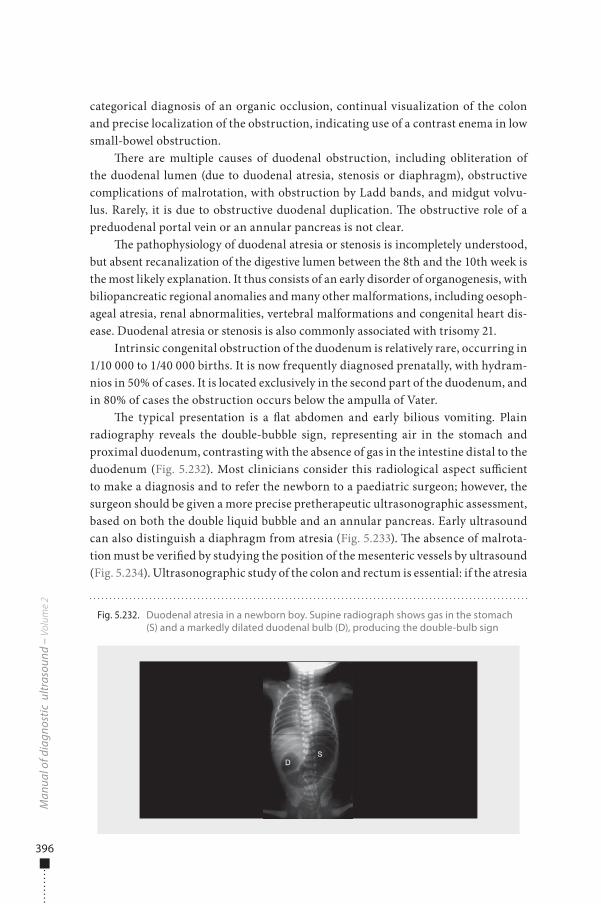
396
categorical diagnosis of an organic occlusion, continual visualization of the colon and precise localization of the obstruction, indicating use of a contrast enema in low small-bowel obstruction.
�ere are multiple causes of duodenal obstruction, including obliteration of the duodenal lumen (due to duodenal atresia, stenosis or diaphragm), obstructive complications of malrotation, with obstruction by Ladd bands, and midgut volvu-lus. Rarely, it is due to obstructive duodenal duplication. �e obstructive role of a preduodenal portal vein or an annular pancreas is not clear.
�e pathophysiology of duodenal atresia or stenosis is incompletely understood, but absent recanalization of the digestive lumen between the 8th and the 10th week is the most likely explanation. It thus consists of an early disorder of organogenesis, with biliopancreatic regional anomalies and many other malformations, including oesoph-ageal atresia, renal abnormalities, vertebral malformations and congenital heart dis-ease. Duodenal atresia or stenosis is also commonly associated with trisomy 21.
Intrinsic congenital obstruction of the duodenum is relatively rare, occurring in 1/10 000 to 1/40 000 births. It is now frequently diagnosed prenatally, with hydram-nios in 50% of cases. It is located exclusively in the second part of the duodenum, and in 80% of cases the obstruction occurs below the ampulla of Vater.
�e typical presentation is a �at abdomen and early bilious vomiting. Plain radiography reveals the double-bubble sign, representing air in the stomach and proximal duodenum, contrasting with the absence of gas in the intestine distal to the duodenum (Fig. 5.232). Most clinicians consider this radiological aspect su�cient to make a diagnosis and to refer the newborn to a paediatric surgeon; however, the surgeon should be given a more precise pretherapeutic ultrasonographic assessment, based on both the double liquid bubble and an annular pancreas. Early ultrasound can also distinguish a diaphragm from atresia (Fig. 5.233). �e absence of malrota-tion must be veri�ed by studying the position of the mesenteric vessels by ultrasound (Fig. 5.234). Ultrasonographic study of the colon and rectum is essential: if the atresia
Man
ual o
f dia
gnos
tic u
ltras
ound
– V
olum
e 2
Fig. 5.232. Duodenal atresia in a newborn boy. Supine radiograph shows gas in the stomach (S) and a markedly dilated duodenal bulb (D), producing the double-bulb sign
978-9241548540-C005 PRF ml YVR ln ml ml-1-Final Proof.indd 396 6/10/13 10:32 AM
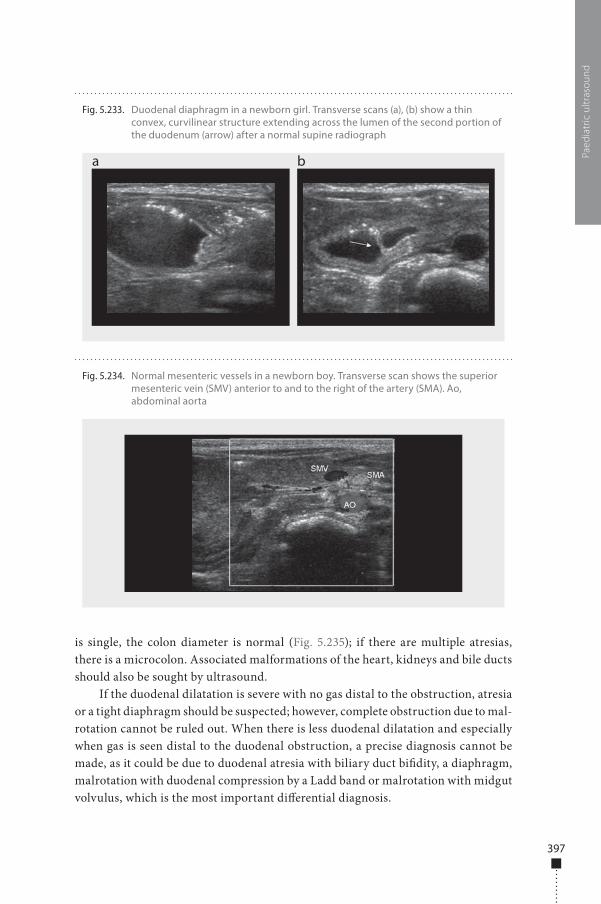
397
is single, the colon diameter is normal (Fig. 5.235); if there are multiple atresias, there is a microcolon. Associated malformations of the heart, kidneys and bile ducts should also be sought by ultrasound.
If the duodenal dilatation is severe with no gas distal to the obstruction, atresia or a tight diaphragm should be suspected; however, complete obstruction due to mal-rotation cannot be ruled out. When there is less duodenal dilatation and especially when gas is seen distal to the duodenal obstruction, a precise diagnosis cannot be made, as it could be due to duodenal atresia with biliary duct bi�dity, a diaphragm, malrotation with duodenal compression by a Ladd band or malrotation with midgut volvulus, which is the most important di�erential diagnosis.
Paed
iatr
ic u
ltras
ound
Fig. 5.234. Normal mesenteric vessels in a newborn boy. Transverse scan shows the superior mesenteric vein (SMV) anterior to and to the right of the artery (SMA). Ao, abdominal aorta
Fig. 5.233. Duodenal diaphragm in a newborn girl. Transverse scans (a), (b) show a thin convex, curvilinear structure extending across the lumen of the second portion of the duodenum (arrow) after a normal supine radiograph
a b
978-9241548540-C005 PRF ml YVR ln ml ml-1-Final Proof.indd 397 6/10/13 10:32 AM
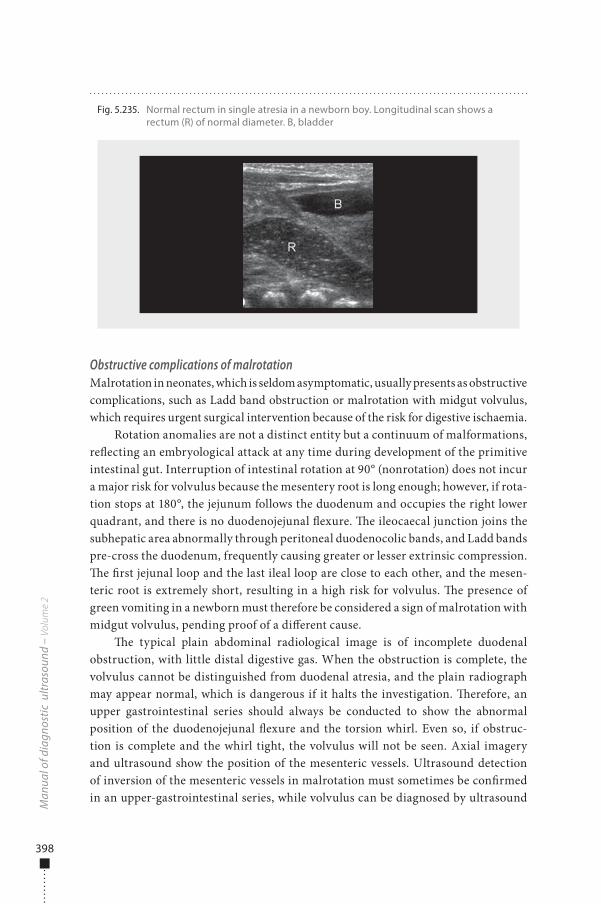
398
Obstructive complications of malrotationMalrotation in neonates, which is seldom asymptomatic, usually presents as obstructive complications, such as Ladd band obstruction or malrotation with midgut volvulus, which requires urgent surgical intervention because of the risk for digestive ischaemia.
Rotation anomalies are not a distinct entity but a continuum of malformations, re�ecting an embryological attack at any time during development of the primitive intestinal gut. Interruption of intestinal rotation at 90° (nonrotation) does not incur a major risk for volvulus because the mesentery root is long enough; however, if rota-tion stops at 180°, the jejunum follows the duodenum and occupies the right lower quadrant, and there is no duodenojejunal �exure. �e ileocaecal junction joins the subhepatic area abnormally through peritoneal duodenocolic bands, and Ladd bands pre-cross the duodenum, frequently causing greater or lesser extrinsic compression. �e �rst jejunal loop and the last ileal loop are close to each other, and the mesen-teric root is extremely short, resulting in a high risk for volvulus. �e presence of green vomiting in a newborn must therefore be considered a sign of malrotation with midgut volvulus, pending proof of a di�erent cause.
�e typical plain abdominal radiological image is of incomplete duodenal obstruction, with little distal digestive gas. When the obstruction is complete, the volvulus cannot be distinguished from duodenal atresia, and the plain radiograph may appear normal, which is dangerous if it halts the investigation. �erefore, an upper gastrointestinal series should always be conducted to show the abnormal position of the duodenojejunal �exure and the torsion whirl. Even so, if obstruc-tion is complete and the whirl tight, the volvulus will not be seen. Axial imagery and ultrasound show the position of the mesenteric vessels. Ultrasound detection of inversion of the mesenteric vessels in malrotation must sometimes be con�rmed in an upper-gastrointestinal series, while volvulus can be diagnosed by ultrasound
Man
ual o
f dia
gnos
tic u
ltras
ound
– V
olum
e 2
Fig. 5.235. Normal rectum in single atresia in a newborn boy. Longitudinal scan shows a rectum (R) of normal diameter. B, bladder
978-9241548540-C005 PRF ml YVR ln ml ml-1-Final Proof.indd 398 6/10/13 10:32 AM
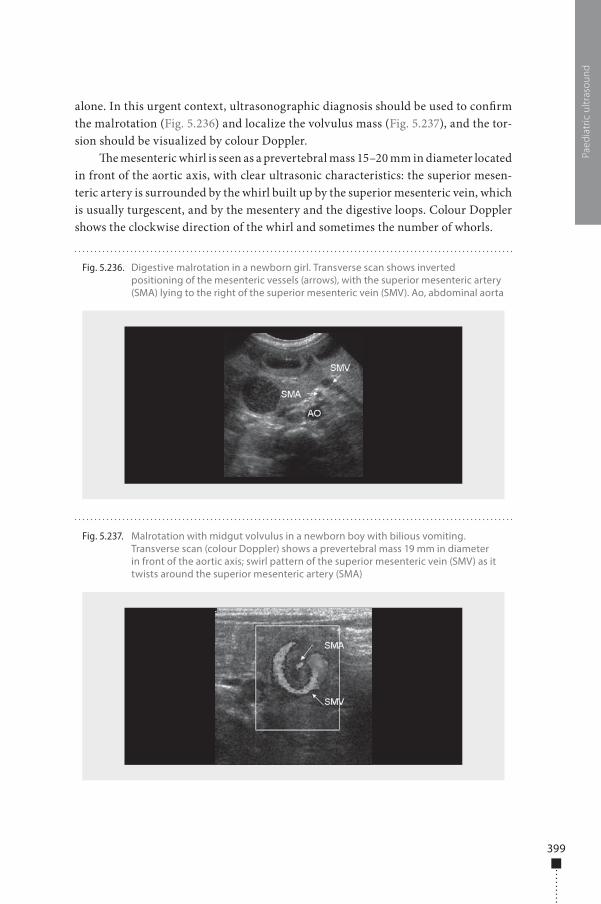
399
Paed
iatr
ic u
ltras
ound
alone. In this urgent context, ultrasonographic diagnosis should be used to con�rm the malrotation (Fig. 5.236) and localize the volvulus mass (Fig. 5.237), and the tor-sion should be visualized by colour Doppler.
�e mesenteric whirl is seen as a prevertebral mass 15–20 mm in diameter located in front of the aortic axis, with clear ultrasonic characteristics: the superior mesen-teric artery is surrounded by the whirl built up by the superior mesenteric vein, which is usually turgescent, and by the mesentery and the digestive loops. Colour Doppler shows the clockwise direction of the whirl and sometimes the number of whorls.
Fig. 5.236. Digestive malrotation in a newborn girl. Transverse scan shows inverted positioning of the mesenteric vessels (arrows), with the superior mesenteric artery (SMA) lying to the right of the superior mesenteric vein (SMV). Ao, abdominal aorta
Fig. 5.237. Malrotation with midgut volvulus in a newborn boy with bilious vomiting. Transverse scan (colour Doppler) shows a prevertebral mass 19 mm in diameter in front of the aortic axis; swirl pattern of the superior mesenteric vein (SMV) as it twists around the superior mesenteric artery (SMA)
978-9241548540-C005 PRF ml YVR ln ml ml-1-Final Proof.indd 399 6/10/13 10:32 AM
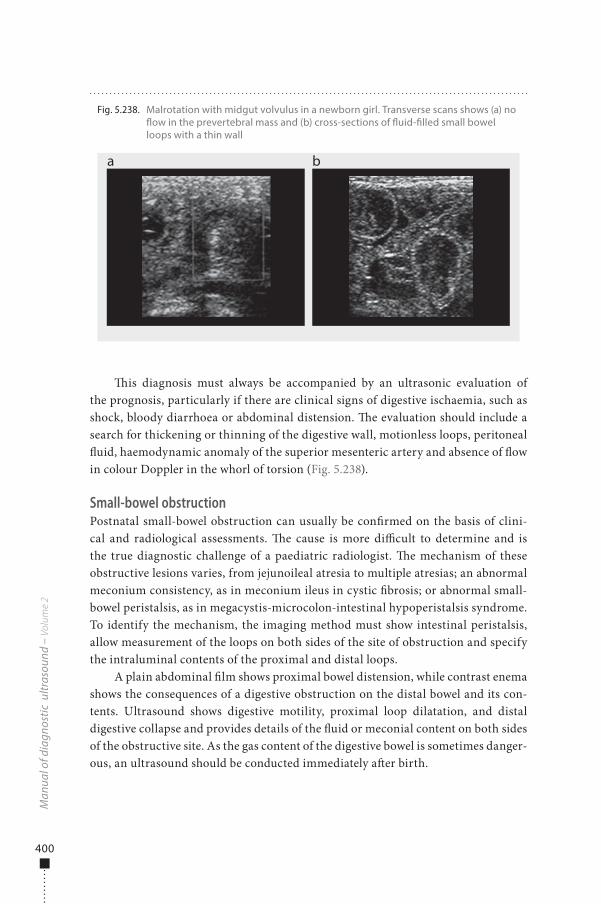
400
Man
ual o
f dia
gnos
tic u
ltras
ound
– V
olum
e 2
�is diagnosis must always be accompanied by an ultrasonic evaluation of the prognosis, particularly if there are clinical signs of digestive ischaemia, such as shock, bloody diarrhoea or abdominal distension. �e evaluation should include a search for thickening or thinning of the digestive wall, motionless loops, peritoneal �uid, haemodynamic anomaly of the superior mesenteric artery and absence of �ow in colour Doppler in the whorl of torsion (Fig. 5.238).
Small-bowel obstructionPostnatal small-bowel obstruction can usually be con�rmed on the basis of clini-cal and radiological assessments. �e cause is more di�cult to determine and is the true diagnostic challenge of a paediatric radiologist. �e mechanism of these obstructive lesions varies, from jejunoileal atresia to multiple atresias; an abnormal meconium consistency, as in meconium ileus in cystic �brosis; or abnormal small-bowel peristalsis, as in megacystis-microcolon-intestinal hypoperistalsis syndrome. To identify the mechanism, the imaging method must show intestinal peristalsis, allow measurement of the loops on both sides of the site of obstruction and specify the intraluminal contents of the proximal and distal loops.
A plain abdominal �lm shows proximal bowel distension, while contrast enema shows the consequences of a digestive obstruction on the distal bowel and its con-tents. Ultrasound shows digestive motility, proximal loop dilatation, and distal digestive collapse and provides details of the �uid or meconial content on both sides of the obstructive site. As the gas content of the digestive bowel is sometimes danger-ous, an ultrasound should be conducted immediately a�er birth.
Fig. 5.238. Malrotation with midgut volvulus in a newborn girl. Transverse scans shows (a) no �ow in the prevertebral mass and (b) cross-sections of �uid-�lled small bowel loops with a thin wall
a b
978-9241548540-C005 PRF ml YVR ln ml ml-1-Final Proof.indd 400 6/10/13 10:32 AM
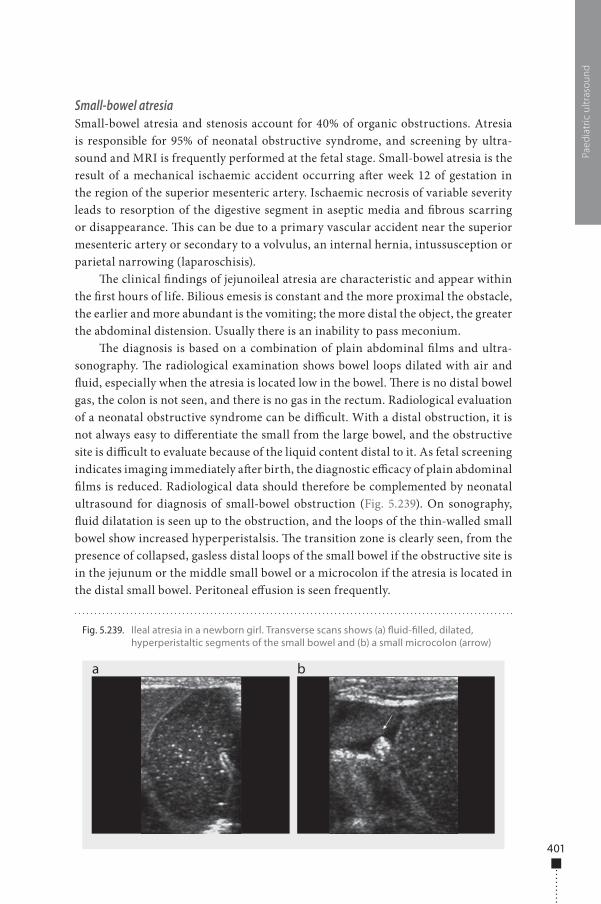
401
Paed
iatr
ic u
ltras
ound
Small-bowel atresiaSmall-bowel atresia and stenosis account for 40% of organic obstructions. Atresia is responsible for 95% of neonatal obstructive syndrome, and screening by ultra-sound and MRI is frequently performed at the fetal stage. Small-bowel atresia is the result of a mechanical ischaemic accident occurring a�er week 12 of gestation in the region of the superior mesenteric artery. Ischaemic necrosis of variable severity leads to resorption of the digestive segment in aseptic media and �brous scarring or disappearance. �is can be due to a primary vascular accident near the superior mesenteric artery or secondary to a volvulus, an internal hernia, intussusception or parietal narrowing (laparoschisis).
�e clinical �ndings of jejunoileal atresia are characteristic and appear within the �rst hours of life. Bilious emesis is constant and the more proximal the obstacle, the earlier and more abundant is the vomiting; the more distal the object, the greater the abdominal distension. Usually there is an inability to pass meconium.
�e diagnosis is based on a combination of plain abdominal �lms and ultra-sonography. �e radiological examination shows bowel loops dilated with air and �uid, especially when the atresia is located low in the bowel. �ere is no distal bowel gas, the colon is not seen, and there is no gas in the rectum. Radiological evaluation of a neonatal obstructive syndrome can be di�cult. With a distal obstruction, it is not always easy to di�erentiate the small from the large bowel, and the obstructive site is di�cult to evaluate because of the liquid content distal to it. As fetal screening indicates imaging immediately a�er birth, the diagnostic e�cacy of plain abdominal �lms is reduced. Radiological data should therefore be complemented by neonatal ultrasound for diagnosis of small-bowel obstruction (Fig. 5.239). On sonography, �uid dilatation is seen up to the obstruction, and the loops of the thin-walled small bowel show increased hyperperistalsis. �e transition zone is clearly seen, from the presence of collapsed, gasless distal loops of the small bowel if the obstructive site is in the jejunum or the middle small bowel or a microcolon if the atresia is located in the distal small bowel. Peritoneal e�usion is seen frequently.
Fig. 5.239. Ileal atresia in a newborn girl. Transverse scans shows (a) �uid-�lled, dilated, hyperperistaltic segments of the small bowel and (b) a small microcolon (arrow)
a b
978-9241548540-C005 PRF ml YVR ln ml ml-1-Final Proof.indd 401 6/10/13 10:32 AM
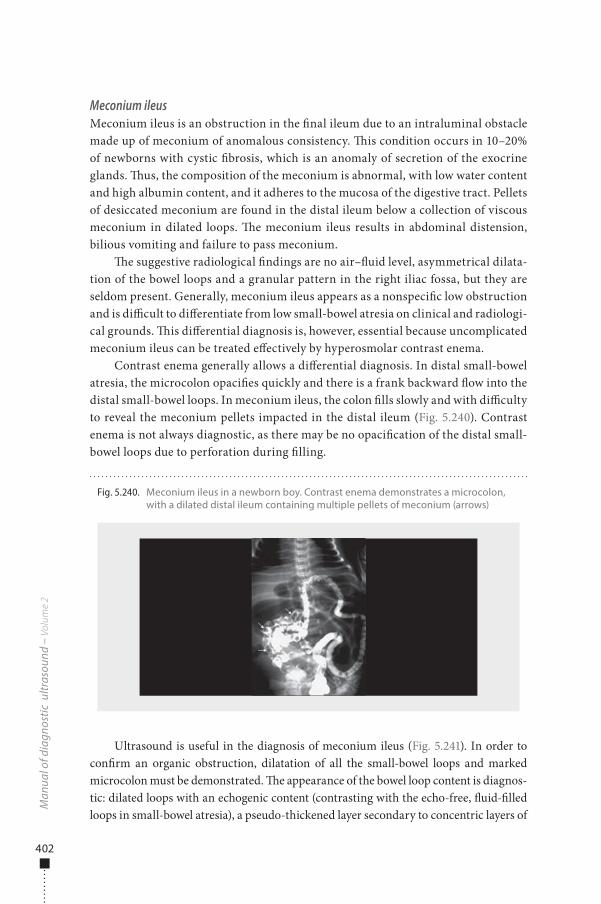
402
Man
ual o
f dia
gnos
tic u
ltras
ound
– V
olum
e 2
Meconium ileusMeconium ileus is an obstruction in the �nal ileum due to an intraluminal obstacle made up of meconium of anomalous consistency. �is condition occurs in 10–20% of newborns with cystic �brosis, which is an anomaly of secretion of the exocrine glands. �us, the composition of the meconium is abnormal, with low water content and high albumin content, and it adheres to the mucosa of the digestive tract. Pellets of desiccated meconium are found in the distal ileum below a collection of viscous meconium in dilated loops. �e meconium ileus results in abdominal distension, bilious vomiting and failure to pass meconium.
�e suggestive radiological �ndings are no air–�uid level, asymmetrical dilata-tion of the bowel loops and a granular pattern in the right iliac fossa, but they are seldom present. Generally, meconium ileus appears as a nonspeci�c low obstruction and is di�cult to di�erentiate from low small-bowel atresia on clinical and radiologi-cal grounds. �is di�erential diagnosis is, however, essential because uncomplicated meconium ileus can be treated e�ectively by hyperosmolar contrast enema.
Contrast enema generally allows a di�erential diagnosis. In distal small-bowel atresia, the microcolon opaci�es quickly and there is a frank backward �ow into the distal small-bowel loops. In meconium ileus, the colon �lls slowly and with di�culty to reveal the meconium pellets impacted in the distal ileum (Fig. 5.240). Contrast enema is not always diagnostic, as there may be no opaci�cation of the distal small-bowel loops due to perforation during �lling.
Ultrasound is useful in the diagnosis of meconium ileus (Fig. 5.241). In order to con�rm an organic obstruction, dilatation of all the small-bowel loops and marked microcolon must be demonstrated. �e appearance of the bowel loop content is diagnos-tic: dilated loops with an echogenic content (contrasting with the echo-free, �uid-�lled loops in small-bowel atresia), a pseudo-thickened layer secondary to concentric layers of
Fig. 5.240. Meconium ileus in a newborn boy. Contrast enema demonstrates a microcolon, with a dilated distal ileum containing multiple pellets of meconium (arrows)
978-9241548540-C005 PRF ml YVR ln ml ml-1-Final Proof.indd 402 6/10/13 10:32 AM
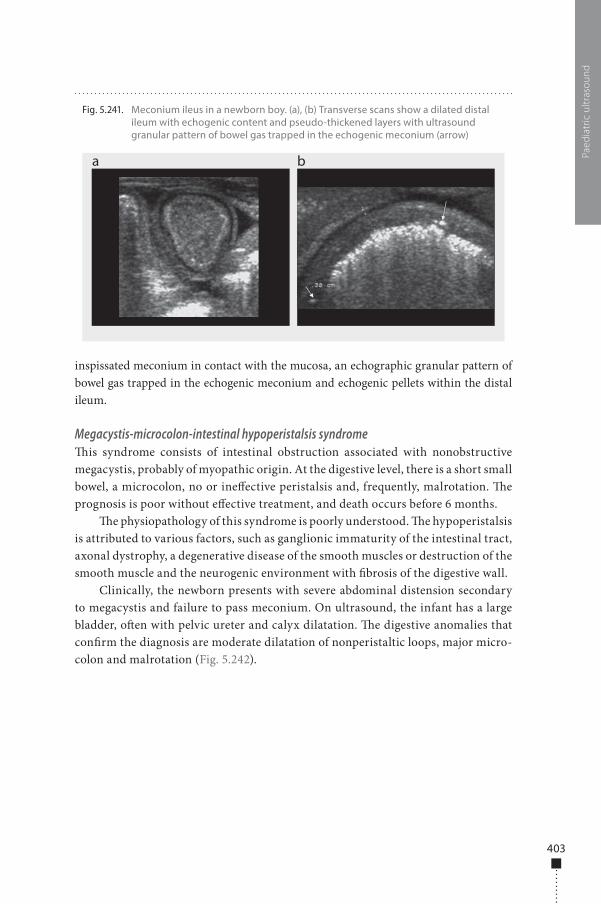
403
Paed
iatr
ic u
ltras
ound
inspissated meconium in contact with the mucosa, an echographic granular pattern of bowel gas trapped in the echogenic meconium and echogenic pellets within the distal ileum.
Megacystis-microcolon-intestinal hypoperistalsis syndrome�is syndrome consists of intestinal obstruction associated with nonobstructive megacystis, probably of myopathic origin. At the digestive level, there is a short small bowel, a microcolon, no or ine�ective peristalsis and, frequently, malrotation. �e prognosis is poor without e�ective treatment, and death occurs before 6 months.
�e physiopathology of this syndrome is poorly understood. �e hypoperistalsis is attributed to various factors, such as ganglionic immaturity of the intestinal tract, axonal dystrophy, a degenerative disease of the smooth muscles or destruction of the smooth muscle and the neurogenic environment with �brosis of the digestive wall.
Clinically, the newborn presents with severe abdominal distension secondary to megacystis and failure to pass meconium. On ultrasound, the infant has a large bladder, o�en with pelvic ureter and calyx dilatation. �e digestive anomalies that con�rm the diagnosis are moderate dilatation of nonperistaltic loops, major micro-colon and malrotation (Fig. 5.242).
Fig. 5.241. Meconium ileus in a newborn boy. (a), (b) Transverse scans show a dilated distal ileum with echogenic content and pseudo-thickened layers with ultrasound granular pattern of bowel gas trapped in the echogenic meconium (arrow)
a b
978-9241548540-C005 PRF ml YVR ln ml ml-1-Final Proof.indd 403 6/10/13 10:32 AM
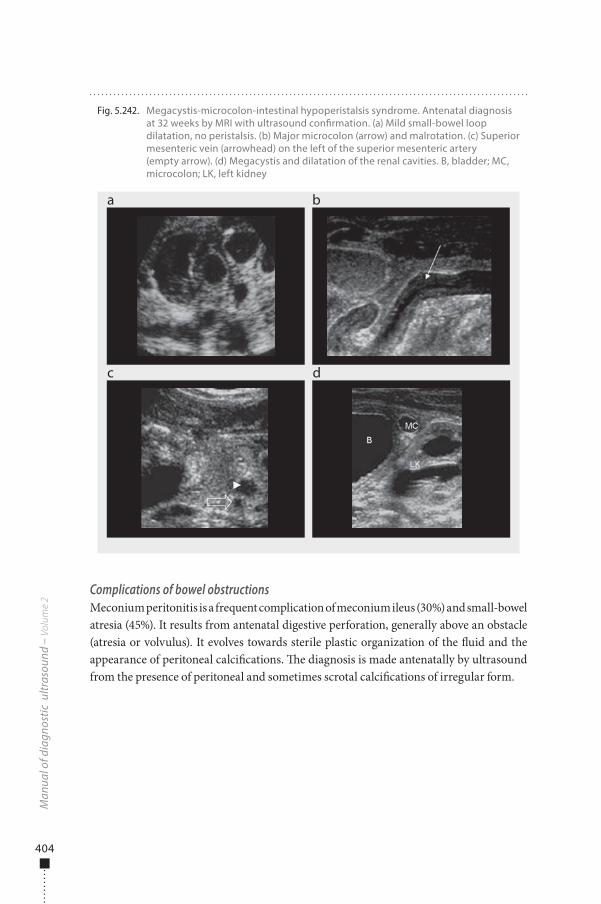
404
Man
ual o
f dia
gnos
tic u
ltras
ound
– V
olum
e 2
Complications of bowel obstructionsMeconium peritonitis is a frequent complication of meconium ileus (30%) and small-bowel atresia (45%). It results from antenatal digestive perforation, generally above an obstacle (atresia or volvulus). It evolves towards sterile plastic organization of the �uid and the appearance of peritoneal calci�cations. �e diagnosis is made antenatally by ultrasound from the presence of peritoneal and sometimes scrotal calci�cations of irregular form.
Fig. 5.242. Megacystis-microcolon-intestinal hypoperistalsis syndrome. Antenatal diagnosis at 32 weeks by MRI with ultrasound con�rmation. (a) Mild small-bowel loop dilatation, no peristalsis. (b) Major microcolon (arrow) and malrotation. (c) Superior mesenteric vein (arrowhead) on the left of the superior mesenteric artery (empty arrow). (d) Megacystis and dilatation of the renal cavities. B, bladder; MC, microcolon; LK, left kidney
a
c d
b
978-9241548540-C005 PRF ml YVR ln ml ml-1-Final Proof.indd 404 6/10/13 10:32 AM
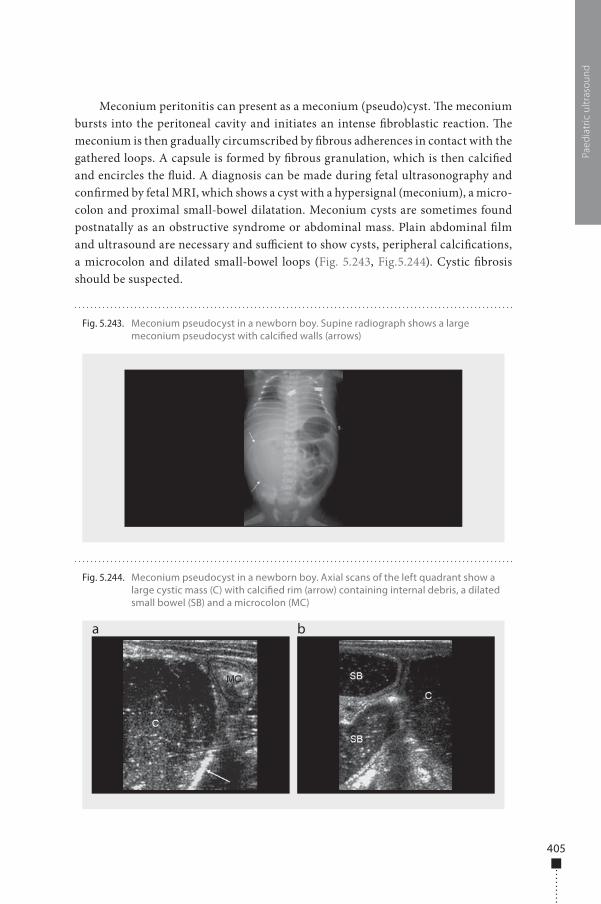
405
Paed
iatr
ic u
ltras
ound
Meconium peritonitis can present as a meconium (pseudo)cyst. �e meconium bursts into the peritoneal cavity and initiates an intense �broblastic reaction. �e meconium is then gradually circumscribed by �brous adherences in contact with the gathered loops. A capsule is formed by �brous granulation, which is then calci�ed and encircles the �uid. A diagnosis can be made during fetal ultrasonography and con�rmed by fetal MRI, which shows a cyst with a hypersignal (meconium), a micro-colon and proximal small-bowel dilatation. Meconium cysts are sometimes found postnatally as an obstructive syndrome or abdominal mass. Plain abdominal �lm and ultrasound are necessary and su�cient to show cysts, peripheral calci�cations, a microcolon and dilated small-bowel loops (Fig. 5.243, Fig.5.244). Cystic �brosis should be suspected.
Fig. 5.243. Meconium pseudocyst in a newborn boy. Supine radiograph shows a large meconium pseudocyst with calci�ed walls (arrows)
Fig. 5.244. Meconium pseudocyst in a newborn boy. Axial scans of the left quadrant show a large cystic mass (C) with calci�ed rim (arrow) containing internal debris, a dilated small bowel (SB) and a microcolon (MC)
a b
978-9241548540-C005 PRF ml YVR ln ml ml-1-Final Proof.indd 405 6/10/13 10:32 AM

978-9241548540-C005 PRF ml YVR ln ml ml-1-Final Proof.indd 406 6/10/13 10:32 AM
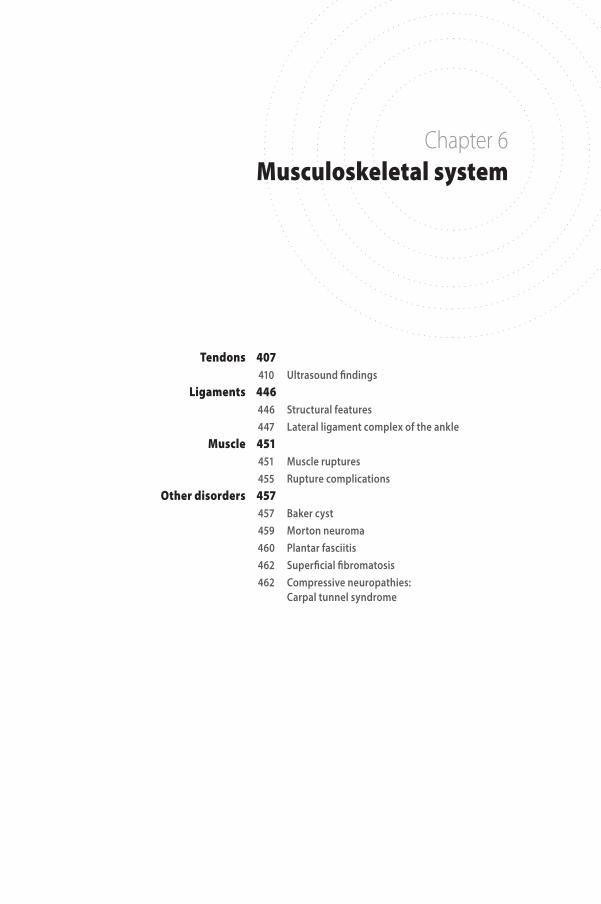
Tendons 407410 Ultrasound �ndings
Ligaments 446446 Structural features447 Lateral ligament complex of the ankle
Muscle 451451 Muscle ruptures455 Rupture complications
Other disorders 457457 Baker cyst459 Morton neuroma460 Plantar fasciitis462 Super�cial �bromatosis462 Compressive neuropathies:
Carpal tunnel syndrome
Chapter 6 Musculoskeletal system
978-9241548540-C006 PRF ml YVR ln ml ml-1-Final Proof.indd 407 6/10/13 10:30 AM

978-9241548540-C006 PRF ml YVR ln ml ml-1-Final Proof.indd 408 6/10/13 10:30 AM
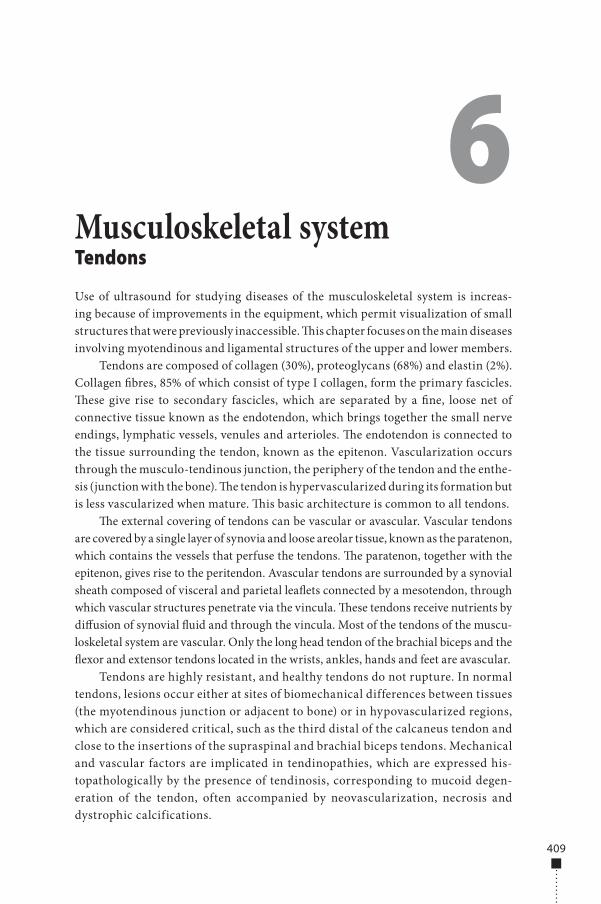
Tendons
Use of ultrasound for studying diseases of the musculoskeletal system is increas-ing because of improvements in the equipment, which permit visualization of small structures that were previously inaccessible. �is chapter focuses on the main diseases involving myotendinous and ligamental structures of the upper and lower members.
Tendons are composed of collagen (30%), proteoglycans (68%) and elastin (2%). Collagen �bres, 85% of which consist of type I collagen, form the primary fascicles. �ese give rise to secondary fascicles, which are separated by a �ne, loose net of connective tissue known as the endotendon, which brings together the small nerve endings, lymphatic vessels, venules and arterioles. �e endotendon is connected to the tissue surrounding the tendon, known as the epitenon. Vascularization occurs through the musculo-tendinous junction, the periphery of the tendon and the enthe-sis (junction with the bone). �e tendon is hypervascularized during its formation but is less vascularized when mature. �is basic architecture is common to all tendons.
�e external covering of tendons can be vascular or avascular. Vascular tendons are covered by a single layer of synovia and loose areolar tissue, known as the paratenon, which contains the vessels that perfuse the tendons. �e paratenon, together with the epitenon, gives rise to the peritendon. Avascular tendons are surrounded by a synovial sheath composed of visceral and parietal lea�ets connected by a mesotendon, through which vascular structures penetrate via the vincula. �ese tendons receive nutrients by di�usion of synovial �uid and through the vincula. Most of the tendons of the muscu-loskeletal system are vascular. Only the long head tendon of the brachial biceps and the �exor and extensor tendons located in the wrists, ankles, hands and feet are avascular.
Tendons are highly resistant, and healthy tendons do not rupture. In normal tendons, lesions occur either at sites of biomechanical differences between tissues (the myotendinous junction or adjacent to bone) or in hypovascularized regions, which are considered critical, such as the third distal of the calcaneus tendon and close to the insertions of the supraspinal and brachial biceps tendons. Mechanical and vascular factors are implicated in tendinopathies, which are expressed his-topathologically by the presence of tendinosis, corresponding to mucoid degen-eration of the tendon, often accompanied by neovascularization, necrosis and dystrophic calcifications.
6Musculoskeletal system
409
978-9241548540-C006 PRF ml YVR ln ml ml-1-Final Proof.indd 409 6/10/13 10:30 AM
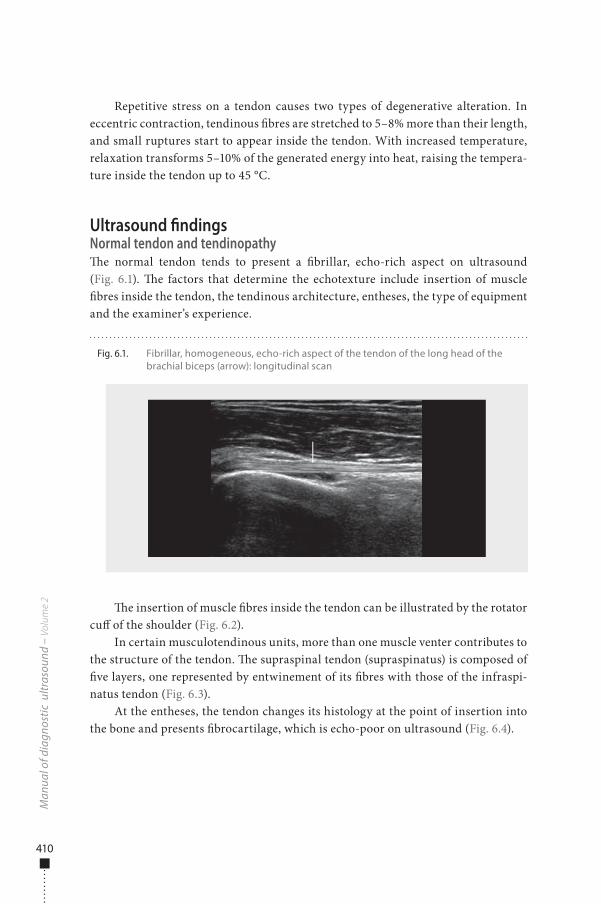
410
Repetitive stress on a tendon causes two types of degenerative alteration. In eccentric contraction, tendinous �bres are stretched to 5–8% more than their length, and small ruptures start to appear inside the tendon. With increased temperature, relaxation transforms 5–10% of the generated energy into heat, raising the tempera-ture inside the tendon up to 45 °C.
Ultrasound �ndingsNormal tendon and tendinopathy�e normal tendon tends to present a �brillar, echo-rich aspect on ultrasound (Fig. 6.1). �e factors that determine the echotexture include insertion of muscle �bres inside the tendon, the tendinous architecture, entheses, the type of equipment and the examiner’s experience.
�e insertion of muscle �bres inside the tendon can be illustrated by the rotator cu� of the shoulder (Fig. 6.2).
In certain musculotendinous units, more than one muscle venter contributes to the structure of the tendon. �e supraspinal tendon (supraspinatus) is composed of �ve layers, one represented by entwinement of its �bres with those of the infraspi-natus tendon (Fig. 6.3).
At the entheses, the tendon changes its histology at the point of insertion into the bone and presents �brocartilage, which is echo-poor on ultrasound (Fig. 6.4).
Man
ual o
f dia
gnos
tic u
ltras
ound
– V
olum
e 2
Fig. 6.1. Fibrillar, homogeneous, echo-rich aspect of the tendon of the long head of the brachial biceps (arrow): longitudinal scan
978-9241548540-C006 PRF ml YVR ln ml ml-1-Final Proof.indd 410 6/10/13 10:30 AM
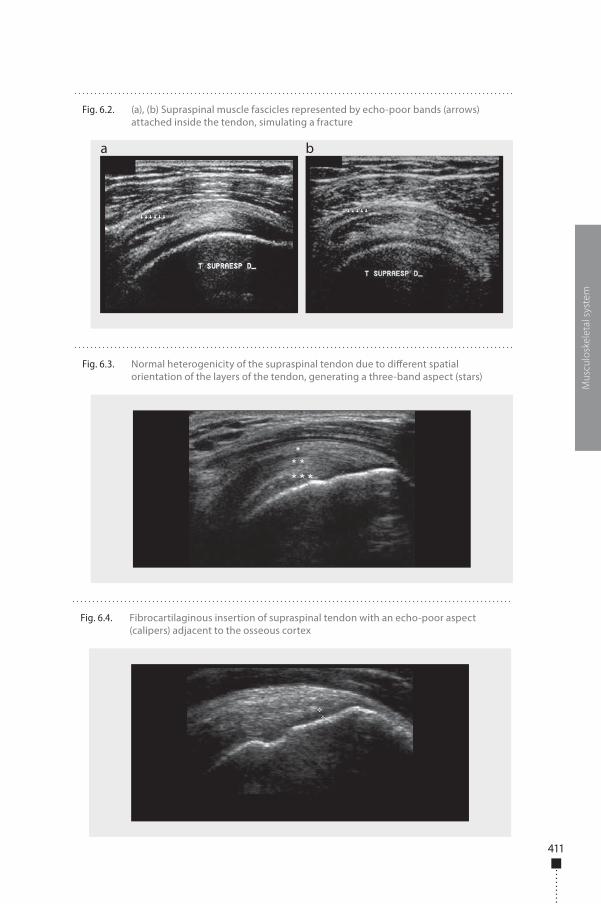
411
Mus
culo
skel
etal
sys
tem
Fig. 6.2. (a), (b) Supraspinal muscle fascicles represented by echo-poor bands (arrows) attached inside the tendon, simulating a fracture
a b
Fig. 6.3. Normal heterogenicity of the supraspinal tendon due to di�erent spatial orientation of the layers of the tendon, generating a three-band aspect (stars)
Fig. 6.4. Fibrocartilaginous insertion of supraspinal tendon with an echo-poor aspect (calipers) adjacent to the osseous cortex
978-9241548540-C006 PRF ml YVR ln ml ml-1-Final Proof.indd 411 6/10/13 10:30 AM
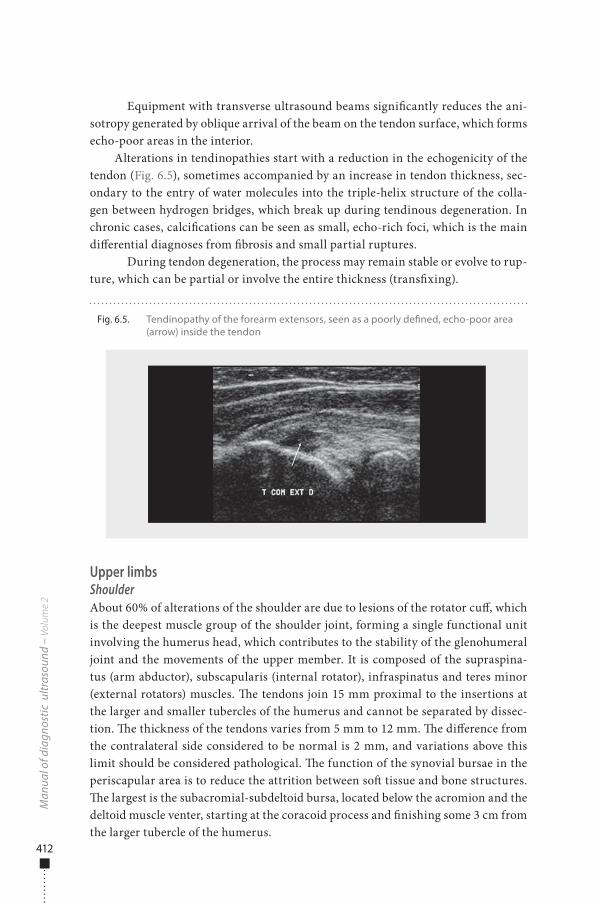
412
Equipment with transverse ultrasound beams signi�cantly reduces the ani-sotropy generated by oblique arrival of the beam on the tendon surface, which forms echo-poor areas in the interior.
Alterations in tendinopathies start with a reduction in the echogenicity of the tendon (Fig. 6.5), sometimes accompanied by an increase in tendon thickness, sec-ondary to the entry of water molecules into the triple-helix structure of the colla-gen between hydrogen bridges, which break up during tendinous degeneration. In chronic cases, calci�cations can be seen as small, echo-rich foci, which is the main di�erential diagnoses from �brosis and small partial ruptures.
During tendon degeneration, the process may remain stable or evolve to rup-ture, which can be partial or involve the entire thickness (trans�xing).
Upper limbsShoulderAbout 60% of alterations of the shoulder are due to lesions of the rotator cu�, which is the deepest muscle group of the shoulder joint, forming a single functional unit involving the humerus head, which contributes to the stability of the glenohumeral joint and the movements of the upper member. It is composed of the supraspina-tus (arm abductor), subscapularis (internal rotator), infraspinatus and teres minor (external rotators) muscles. �e tendons join 15 mm proximal to the insertions at the larger and smaller tubercles of the humerus and cannot be separated by dissec-tion. �e thickness of the tendons varies from 5 mm to 12 mm. �e di�erence from the contralateral side considered to be normal is 2 mm, and variations above this limit should be considered pathological. �e function of the synovial bursae in the periscapular area is to reduce the attrition between so� tissue and bone structures. �e largest is the subacromial-subdeltoid bursa, located below the acromion and the deltoid muscle venter, starting at the coracoid process and �nishing some 3 cm from the larger tubercle of the humerus.
Man
ual o
f dia
gnos
tic u
ltras
ound
– V
olum
e 2
Fig. 6.5. Tendinopathy of the forearm extensors, seen as a poorly de�ned, echo-poor area (arrow) inside the tendon
978-9241548540-C006 PRF ml YVR ln ml ml-1-Final Proof.indd 412 6/10/13 10:30 AM
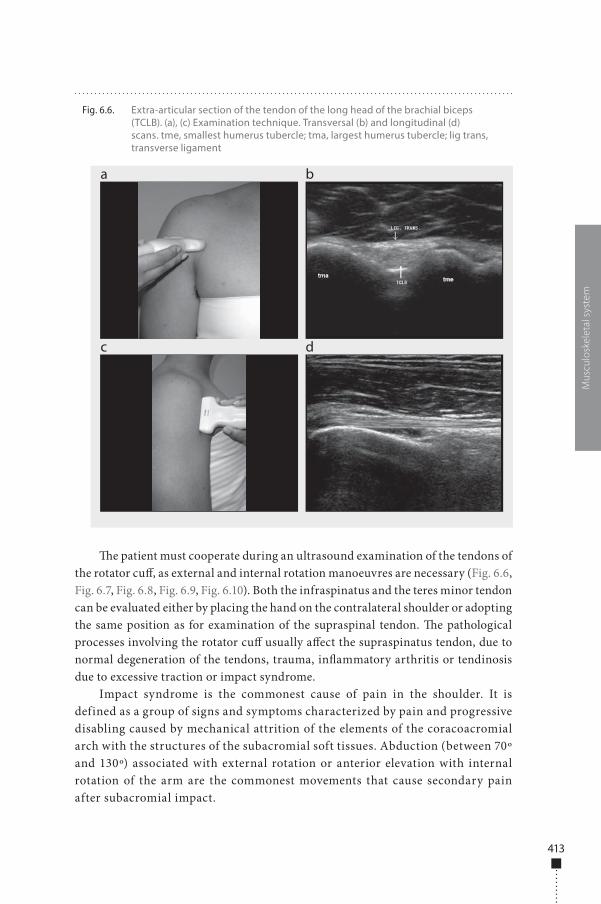
413
�e patient must cooperate during an ultrasound examination of the tendons of the rotator cu�, as external and internal rotation manoeuvres are necessary (Fig. 6.6, Fig. 6.7, Fig. 6.8, Fig. 6.9, Fig. 6.10). Both the infraspinatus and the teres minor tendon can be evaluated either by placing the hand on the contralateral shoulder or adopting the same position as for examination of the supraspinal tendon. �e pathological processes involving the rotator cu� usually a�ect the supraspinatus tendon, due to normal degeneration of the tendons, trauma, in�ammatory arthritis or tendinosis due to excessive traction or impact syndrome.
Impact syndrome is the commonest cause of pain in the shoulder. It is defined as a group of signs and symptoms characterized by pain and progressive disabling caused by mechanical attrition of the elements of the coracoacromial arch with the structures of the subacromial soft tissues. Abduction (between 70º and 130º) associated with external rotation or anterior elevation with internal rotation of the arm are the commonest movements that cause secondary pain after subacromial impact.
Mus
culo
skel
etal
sys
tem
Fig. 6.6. Extra-articular section of the tendon of the long head of the brachial biceps (TCLB). (a), (c) Examination technique. Transversal (b) and longitudinal (d) scans. tme, smallest humerus tubercle; tma, largest humerus tubercle; lig trans, transverse ligament
a
c
b
d
978-9241548540-C006 PRF ml YVR ln ml ml-1-Final Proof.indd 413 6/10/13 10:30 AM
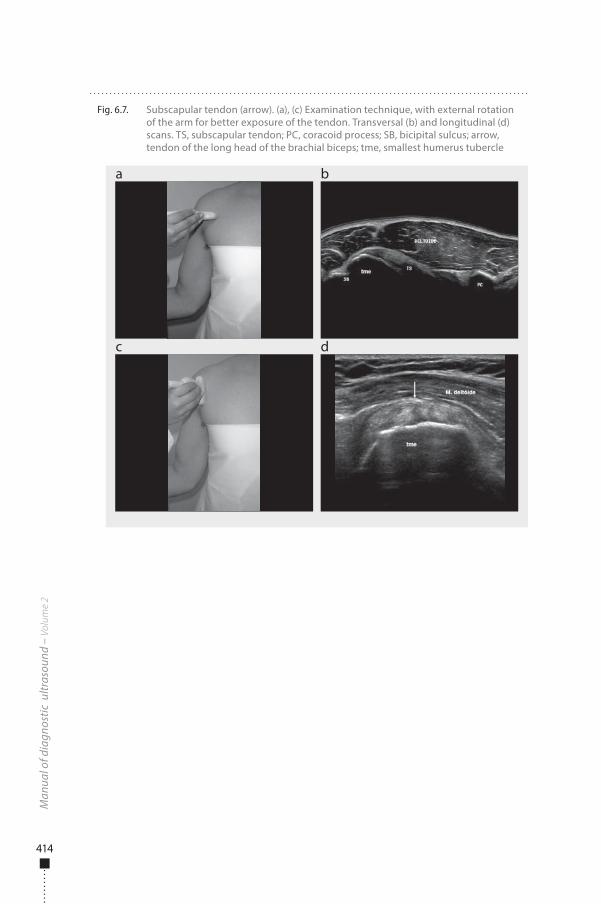
414
Man
ual o
f dia
gnos
tic u
ltras
ound
– V
olum
e 2
Fig. 6.7. Subscapular tendon (arrow). (a), (c) Examination technique, with external rotation of the arm for better exposure of the tendon. Transversal (b) and longitudinal (d) scans. TS, subscapular tendon; PC, coracoid process; SB, bicipital sulcus; arrow, tendon of the long head of the brachial biceps; tme, smallest humerus tubercle
a
c
b
d
978-9241548540-C006 PRF ml YVR ln ml ml-1-Final Proof.indd 414 6/10/13 10:30 AM
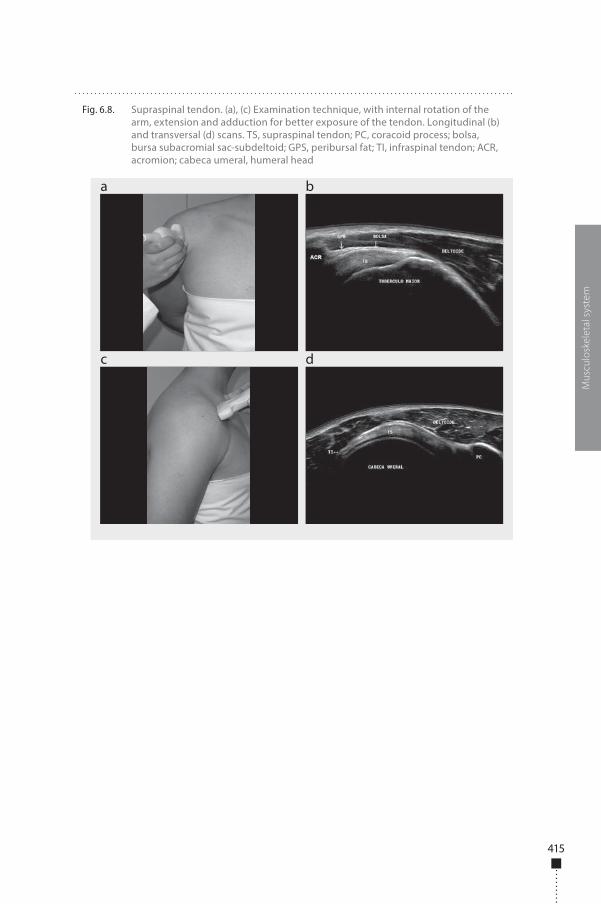
415
Mus
culo
skel
etal
sys
tem
Fig. 6.8. Supraspinal tendon. (a), (c) Examination technique, with internal rotation of the arm, extension and adduction for better exposure of the tendon. Longitudinal (b) and transversal (d) scans. TS, supraspinal tendon; PC, coracoid process; bolsa, bursa subacromial sac-subdeltoid; GPS, peribursal fat; TI, infraspinal tendon; ACR, acromion; cabeca umeral, humeral head
a
c
b
d
978-9241548540-C006 PRF ml YVR ln ml ml-1-Final Proof.indd 415 6/10/13 10:30 AM
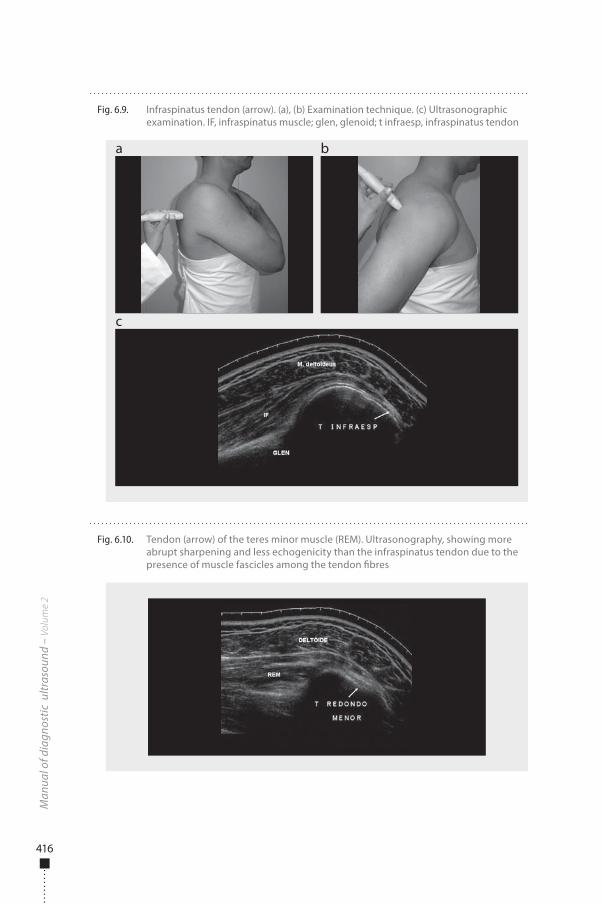
416
Man
ual o
f dia
gnos
tic u
ltras
ound
– V
olum
e 2
Fig. 6.9. Infraspinatus tendon (arrow). (a), (b) Examination technique. (c) Ultrasonographic examination. IF, infraspinatus muscle; glen, glenoid; t infraesp, infraspinatus tendon
a
c
b
Fig. 6.10. Tendon (arrow) of the teres minor muscle (REM). Ultrasonography, showing more abrupt sharpening and less echogenicity than the infraspinatus tendon due to the presence of muscle fascicles among the tendon �bres
978-9241548540-C006 PRF ml YVR ln ml ml-1-Final Proof.indd 416 6/10/13 10:30 AM
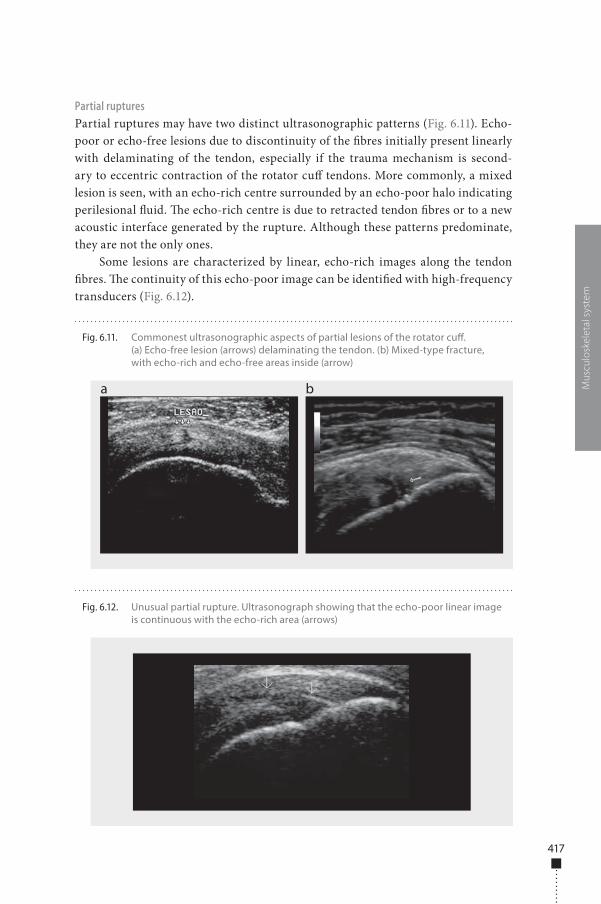
417
Partial rupturesPartial ruptures may have two distinct ultrasonographic patterns (Fig. 6.11). Echo-poor or echo-free lesions due to discontinuity of the �bres initially present linearly with delaminating of the tendon, especially if the trauma mechanism is second-ary to eccentric contraction of the rotator cu� tendons. More commonly, a mixed lesion is seen, with an echo-rich centre surrounded by an echo-poor halo indicating perilesional �uid. �e echo-rich centre is due to retracted tendon �bres or to a new acoustic interface generated by the rupture. Although these patterns predominate, they are not the only ones.
Some lesions are characterized by linear, echo-rich images along the tendon �bres. �e continuity of this echo-poor image can be identi�ed with high-frequency transducers (Fig. 6.12).
Mus
culo
skel
etal
sys
tem
Fig. 6.11. Commonest ultrasonographic aspects of partial lesions of the rotator cu�. (a) Echo-free lesion (arrows) delaminating the tendon. (b) Mixed-type fracture, with echo-rich and echo-free areas inside (arrow)
a b
Fig. 6.12. Unusual partial rupture. Ultrasonograph showing that the echo-poor linear image is continuous with the echo-rich area (arrows)
978-9241548540-C006 PRF ml YVR ln ml ml-1-Final Proof.indd 417 6/10/13 10:30 AM
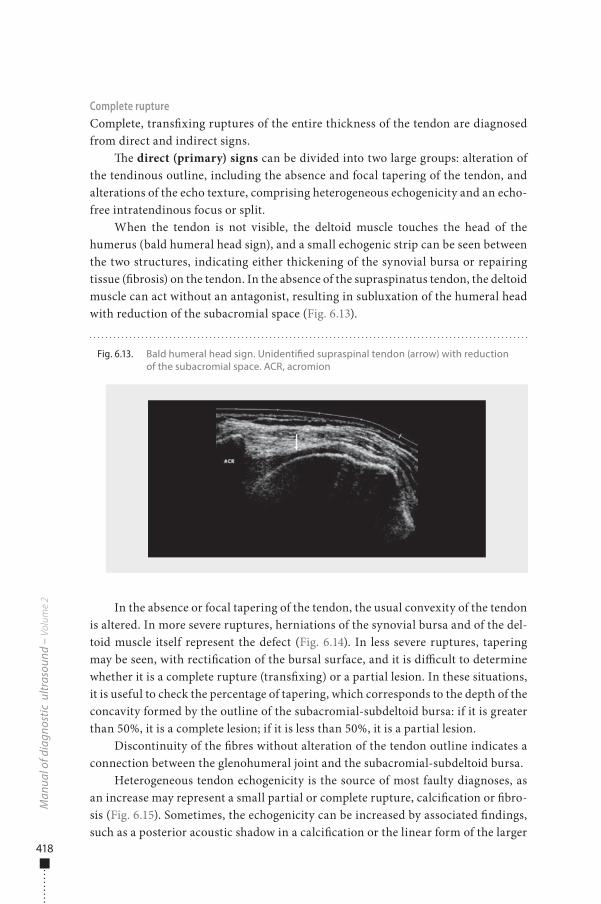
418
Complete ruptureComplete, trans�xing ruptures of the entire thickness of the tendon are diagnosed from direct and indirect signs.
�e direct (primary) signs can be divided into two large groups: alteration of the tendinous outline, including the absence and focal tapering of the tendon, and alterations of the echo texture, comprising heterogeneous echogenicity and an echo-free intratendinous focus or split.
When the tendon is not visible, the deltoid muscle touches the head of the humerus (bald humeral head sign), and a small echogenic strip can be seen between the two structures, indicating either thickening of the synovial bursa or repairing tissue (�brosis) on the tendon. In the absence of the supraspinatus tendon, the deltoid muscle can act without an antagonist, resulting in subluxation of the humeral head with reduction of the subacromial space (Fig. 6.13).
In the absence or focal tapering of the tendon, the usual convexity of the tendon is altered. In more severe ruptures, herniations of the synovial bursa and of the del-toid muscle itself represent the defect (Fig. 6.14). In less severe ruptures, tapering may be seen, with recti�cation of the bursal surface, and it is di�cult to determine whether it is a complete rupture (trans�xing) or a partial lesion. In these situations, it is useful to check the percentage of tapering, which corresponds to the depth of the concavity formed by the outline of the subacromial-subdeltoid bursa: if it is greater than 50%, it is a complete lesion; if it is less than 50%, it is a partial lesion.
Discontinuity of the �bres without alteration of the tendon outline indicates a connection between the glenohumeral joint and the subacromial-subdeltoid bursa.
Heterogeneous tendon echogenicity is the source of most faulty diagnoses, as an increase may represent a small partial or complete rupture, calci�cation or �bro-sis (Fig. 6.15). Sometimes, the echogenicity can be increased by associated �ndings, such as a posterior acoustic shadow in a calci�cation or the linear form of the larger
Man
ual o
f dia
gnos
tic u
ltras
ound
– V
olum
e 2
Fig. 6.13. Bald humeral head sign. Unidenti�ed supraspinal tendon (arrow) with reduction of the subacromial space. ACR, acromion
978-9241548540-C006 PRF ml YVR ln ml ml-1-Final Proof.indd 418 6/10/13 10:30 AM
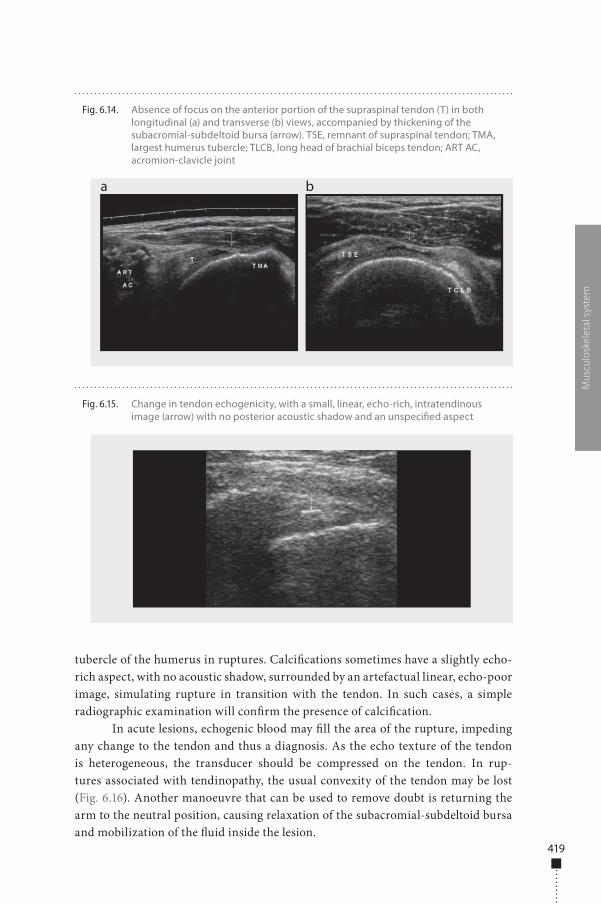
419
tubercle of the humerus in ruptures. Calci�cations sometimes have a slightly echo-rich aspect, with no acoustic shadow, surrounded by an artefactual linear, echo-poor image, simulating rupture in transition with the tendon. In such cases, a simple radiographic examination will con�rm the presence of calci�cation.
In acute lesions, echogenic blood may �ll the area of the rupture, impeding any change to the tendon and thus a diagnosis. As the echo texture of the tendon is heterogeneous, the transducer should be compressed on the tendon. In rup-tures associated with tendinopathy, the usual convexity of the tendon may be lost (Fig. 6.16). Another manoeuvre that can be used to remove doubt is returning the arm to the neutral position, causing relaxation of the subacromial-subdeltoid bursa and mobilization of the �uid inside the lesion.
Mus
culo
skel
etal
sys
tem
Fig. 6.14. Absence of focus on the anterior portion of the supraspinal tendon (T) in both longitudinal (a) and transverse (b) views, accompanied by thickening of the subacromial-subdeltoid bursa (arrow). TSE, remnant of supraspinal tendon; TMA, largest humerus tubercle; TLCB, long head of brachial biceps tendon; ART AC, acromion-clavicle joint
a b
Fig. 6.15. Change in tendon echogenicity, with a small, linear, echo-rich, intratendinous image (arrow) with no posterior acoustic shadow and an unspeci�ed aspect
978-9241548540-C006 PRF ml YVR ln ml ml-1-Final Proof.indd 419 6/10/13 10:30 AM
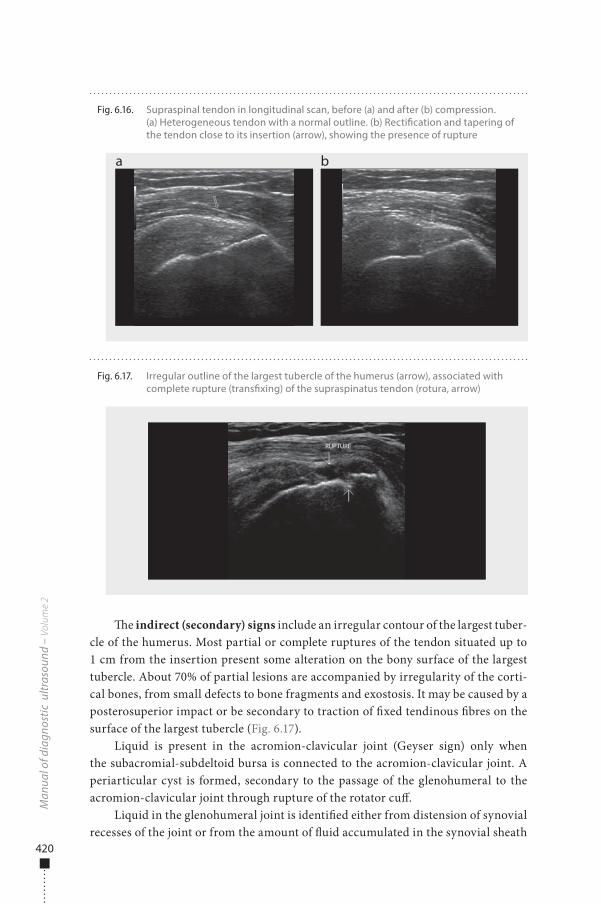
420
�e indirect (secondary) signs include an irregular contour of the largest tuber-cle of the humerus. Most partial or complete ruptures of the tendon situated up to 1 cm from the insertion present some alteration on the bony surface of the largest tubercle. About 70% of partial lesions are accompanied by irregularity of the corti-cal bones, from small defects to bone fragments and exostosis. It may be caused by a posterosuperior impact or be secondary to traction of �xed tendinous �bres on the surface of the largest tubercle (Fig. 6.17).
Liquid is present in the acromion-clavicular joint (Geyser sign) only when the subacromial-subdeltoid bursa is connected to the acromion-clavicular joint. A periarticular cyst is formed, secondary to the passage of the glenohumeral to the acromion-clavicular joint through rupture of the rotator cu�.
Liquid in the glenohumeral joint is identi�ed either from distension of synovial recesses of the joint or from the amount of �uid accumulated in the synovial sheath
Man
ual o
f dia
gnos
tic u
ltras
ound
– V
olum
e 2
Fig. 6.16. Supraspinal tendon in longitudinal scan, before (a) and after (b) compression. (a) Heterogeneous tendon with a normal outline. (b) Recti�cation and tapering of the tendon close to its insertion (arrow), showing the presence of rupture
a b
Fig. 6.17. Irregular outline of the largest tubercle of the humerus (arrow), associated with complete rupture (trans�xing) of the supraspinatus tendon (rotura, arrow)
RUPTURE
978-9241548540-C006 PRF ml YVR ln ml ml-1-Final Proof.indd 420 6/10/13 10:30 AM
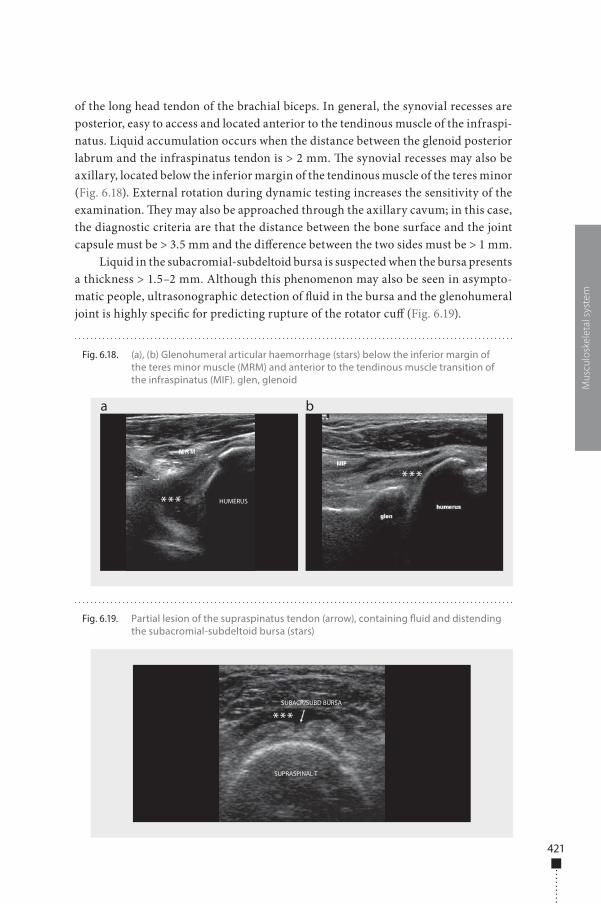
421
of the long head tendon of the brachial biceps. In general, the synovial recesses are posterior, easy to access and located anterior to the tendinous muscle of the infraspi-natus. Liquid accumulation occurs when the distance between the glenoid posterior labrum and the infraspinatus tendon is > 2 mm. �e synovial recesses may also be axillary, located below the inferior margin of the tendinous muscle of the teres minor (Fig. 6.18). External rotation during dynamic testing increases the sensitivity of the examination. �ey may also be approached through the axillary cavum; in this case, the diagnostic criteria are that the distance between the bone surface and the joint capsule must be > 3.5 mm and the di�erence between the two sides must be > 1 mm.
Liquid in the subacromial-subdeltoid bursa is suspected when the bursa presents a thickness > 1.5–2 mm. Although this phenomenon may also be seen in asympto-matic people, ultrasonographic detection of �uid in the bursa and the glenohumeral joint is highly speci�c for predicting rupture of the rotator cu� (Fig. 6.19).
Mus
culo
skel
etal
sys
tem
Fig. 6.18. (a), (b) Glenohumeral articular haemorrhage (stars) below the inferior margin of the teres minor muscle (MRM) and anterior to the tendinous muscle transition of the infraspinatus (MIF). glen, glenoid
a b
HUMERUS***
***
Fig. 6.19. Partial lesion of the supraspinatus tendon (arrow), containing �uid and distending the subacromial-subdeltoid bursa (stars)
SUBACR/SUBD BURSA
SUPRASPINAL T
***
978-9241548540-C006 PRF ml YVR ln ml ml-1-Final Proof.indd 421 6/10/13 10:30 AM
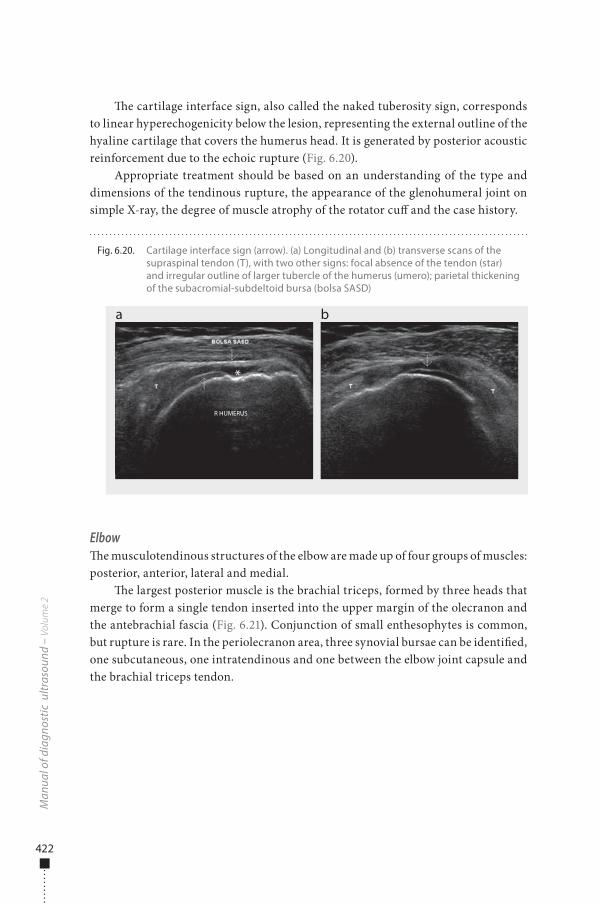
422
�e cartilage interface sign, also called the naked tuberosity sign, corresponds to linear hyperechogenicity below the lesion, representing the external outline of the hyaline cartilage that covers the humerus head. It is generated by posterior acoustic reinforcement due to the echoic rupture (Fig. 6.20).
Appropriate treatment should be based on an understanding of the type and dimensions of the tendinous rupture, the appearance of the glenohumeral joint on simple X-ray, the degree of muscle atrophy of the rotator cu� and the case history.
Elbow�e musculotendinous structures of the elbow are made up of four groups of muscles: posterior, anterior, lateral and medial.
�e largest posterior muscle is the brachial triceps, formed by three heads that merge to form a single tendon inserted into the upper margin of the olecranon and the antebrachial fascia (Fig. 6.21). Conjunction of small enthesophytes is common, but rupture is rare. In the periolecranon area, three synovial bursae can be identi�ed, one subcutaneous, one intratendinous and one between the elbow joint capsule and the brachial triceps tendon.
Man
ual o
f dia
gnos
tic u
ltras
ound
– V
olum
e 2
Fig. 6.20. Cartilage interface sign (arrow). (a) Longitudinal and (b) transverse scans of the supraspinal tendon (T), with two other signs: focal absence of the tendon (star) and irregular outline of larger tubercle of the humerus (umero); parietal thickening of the subacromial-subdeltoid bursa (bolsa SASD)
a b
R HUMERUS
*
978-9241548540-C006 PRF ml YVR ln ml ml-1-Final Proof.indd 422 6/10/13 10:30 AM
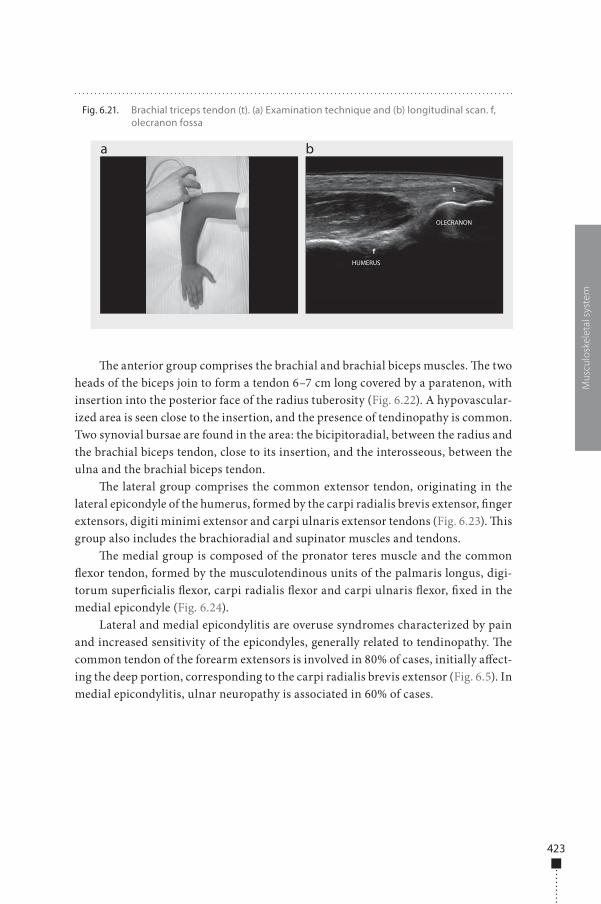
423
�e anterior group comprises the brachial and brachial biceps muscles. �e two heads of the biceps join to form a tendon 6–7 cm long covered by a paratenon, with insertion into the posterior face of the radius tuberosity (Fig. 6.22). A hypovascular-ized area is seen close to the insertion, and the presence of tendinopathy is common. Two synovial bursae are found in the area: the bicipitoradial, between the radius and the brachial biceps tendon, close to its insertion, and the interosseous, between the ulna and the brachial biceps tendon.
�e lateral group comprises the common extensor tendon, originating in the lateral epicondyle of the humerus, formed by the carpi radialis brevis extensor, �nger extensors, digiti minimi extensor and carpi ulnaris extensor tendons (Fig. 6.23). �is group also includes the brachioradial and supinator muscles and tendons.
�e medial group is composed of the pronator teres muscle and the common �exor tendon, formed by the musculotendinous units of the palmaris longus, digi-torum super�cialis �exor, carpi radialis �exor and carpi ulnaris �exor, �xed in the medial epicondyle (Fig. 6.24).
Lateral and medial epicondylitis are overuse syndromes characterized by pain and increased sensitivity of the epicondyles, generally related to tendinopathy. �e common tendon of the forearm extensors is involved in 80% of cases, initially a�ect-ing the deep portion, corresponding to the carpi radialis brevis extensor (Fig. 6.5). In medial epicondylitis, ulnar neuropathy is associated in 60% of cases.
Mus
culo
skel
etal
sys
tem
Fig. 6.21. Brachial triceps tendon (t). (a) Examination technique and (b) longitudinal scan. f, olecranon fossa
a b
OLECRANON
HUMERUS
978-9241548540-C006 PRF ml YVR ln ml ml-1-Final Proof.indd 423 6/10/13 10:30 AM
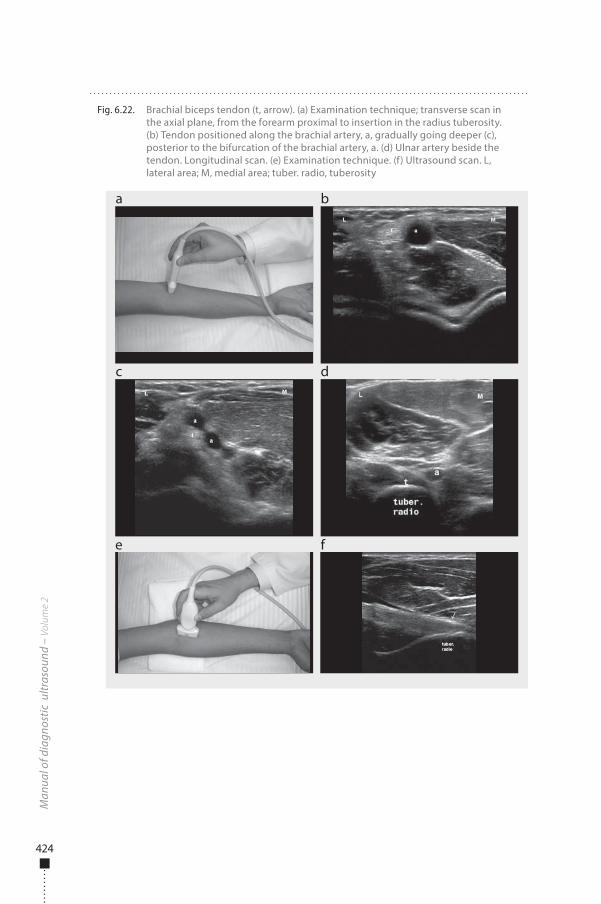
424
Man
ual o
f dia
gnos
tic u
ltras
ound
– V
olum
e 2
Fig. 6.22. Brachial biceps tendon (t, arrow). (a) Examination technique; transverse scan in the axial plane, from the forearm proximal to insertion in the radius tuberosity. (b) Tendon positioned along the brachial artery, a, gradually going deeper (c), posterior to the bifurcation of the brachial artery, a. (d) Ulnar artery beside the tendon. Longitudinal scan. (e) Examination technique. (f) Ultrasound scan. L, lateral area; M, medial area; tuber. radio, tuberosity
a
c
e f
b
d
978-9241548540-C006 PRF ml YVR ln ml ml-1-Final Proof.indd 424 6/10/13 10:30 AM
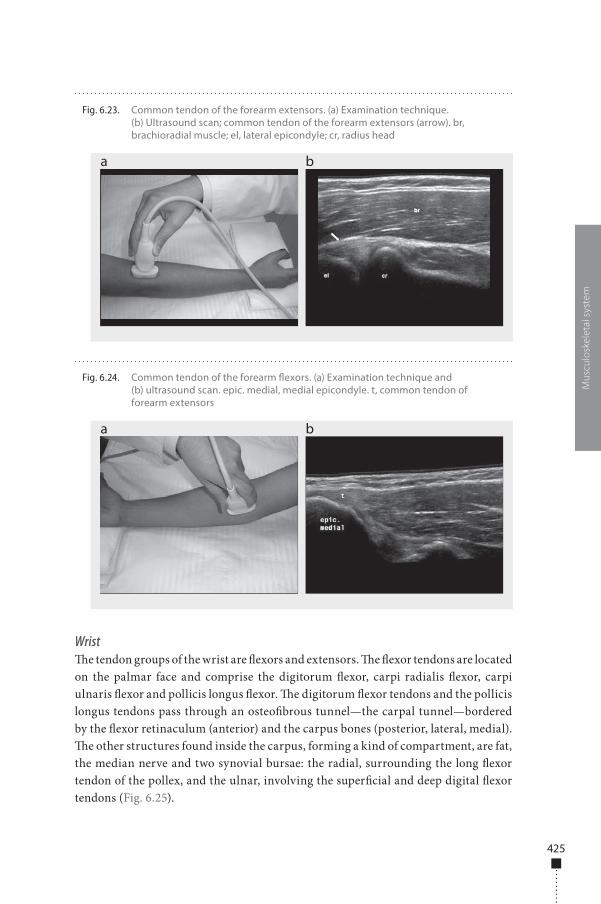
425
Wrist�e tendon groups of the wrist are �exors and extensors. �e �exor tendons are located on the palmar face and comprise the digitorum �exor, carpi radialis �exor, carpi ulnaris �exor and pollicis longus �exor. �e digitorum �exor tendons and the pollicis longus tendons pass through an osteo�brous tunnel—the carpal tunnel—bordered by the �exor retinaculum (anterior) and the carpus bones (posterior, lateral, medial). �e other structures found inside the carpus, forming a kind of compartment, are fat, the median nerve and two synovial bursae: the radial, surrounding the long �exor tendon of the pollex, and the ulnar, involving the super�cial and deep digital �exor tendons (Fig. 6.25).
Mus
culo
skel
etal
sys
tem
Fig. 6.23. Common tendon of the forearm extensors. (a) Examination technique. (b) Ultrasound scan; common tendon of the forearm extensors (arrow). br, brachioradial muscle; el, lateral epicondyle; cr, radius head
a b
Fig. 6.24. Common tendon of the forearm �exors. (a) Examination technique and (b) ultrasound scan. epic. medial, medial epicondyle. t, common tendon of forearm extensors
a b
978-9241548540-C006 PRF ml YVR ln ml ml-1-Final Proof.indd 425 6/10/13 10:30 AM
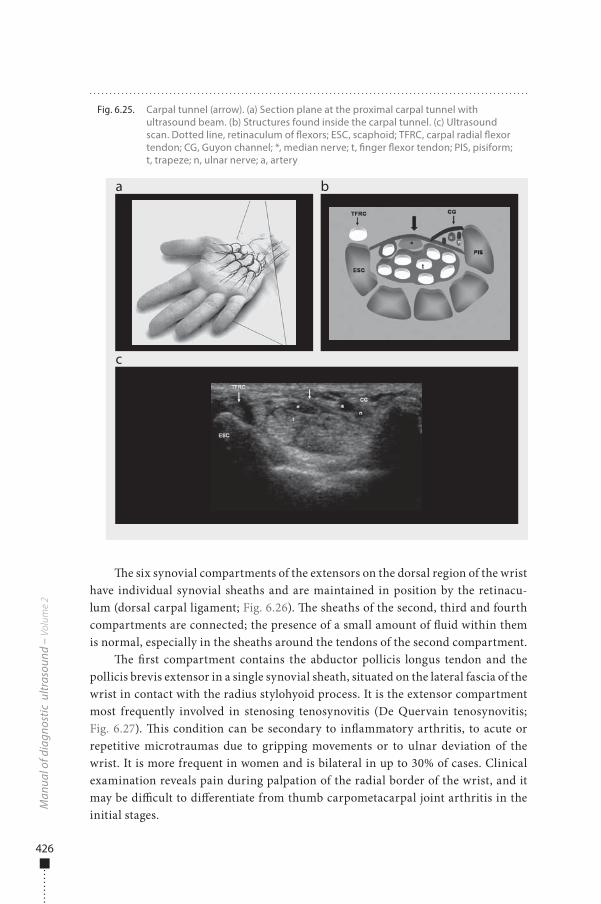
426
�e six synovial compartments of the extensors on the dorsal region of the wrist have individual synovial sheaths and are maintained in position by the retinacu-lum (dorsal carpal ligament; Fig. 6.26). �e sheaths of the second, third and fourth compartments are connected; the presence of a small amount of �uid within them is normal, especially in the sheaths around the tendons of the second compartment.
�e �rst compartment contains the abductor pollicis longus tendon and the pollicis brevis extensor in a single synovial sheath, situated on the lateral fascia of the wrist in contact with the radius stylohyoid process. It is the extensor compartment most frequently involved in stenosing tenosynovitis (De Quervain tenosynovitis; Fig. 6.27). �is condition can be secondary to in�ammatory arthritis, to acute or repetitive microtraumas due to gripping movements or to ulnar deviation of the wrist. It is more frequent in women and is bilateral in up to 30% of cases. Clinical examination reveals pain during palpation of the radial border of the wrist, and it may be di�cult to di�erentiate from thumb carpometacarpal joint arthritis in the initial stages.
Man
ual o
f dia
gnos
tic u
ltras
ound
– V
olum
e 2
Fig. 6.25. Carpal tunnel (arrow). (a) Section plane at the proximal carpal tunnel with ultrasound beam. (b) Structures found inside the carpal tunnel. (c) Ultrasound scan. Dotted line, retinaculum of �exors; ESC, scaphoid; TFRC, carpal radial �exor tendon; CG, Guyon channel; *, median nerve; t, �nger �exor tendon; PIS, pisiform; t, trapeze; n, ulnar nerve; a, artery
a
c
b
d
978-9241548540-C006 PRF ml YVR ln ml ml-1-Final Proof.indd 426 6/10/13 10:30 AM
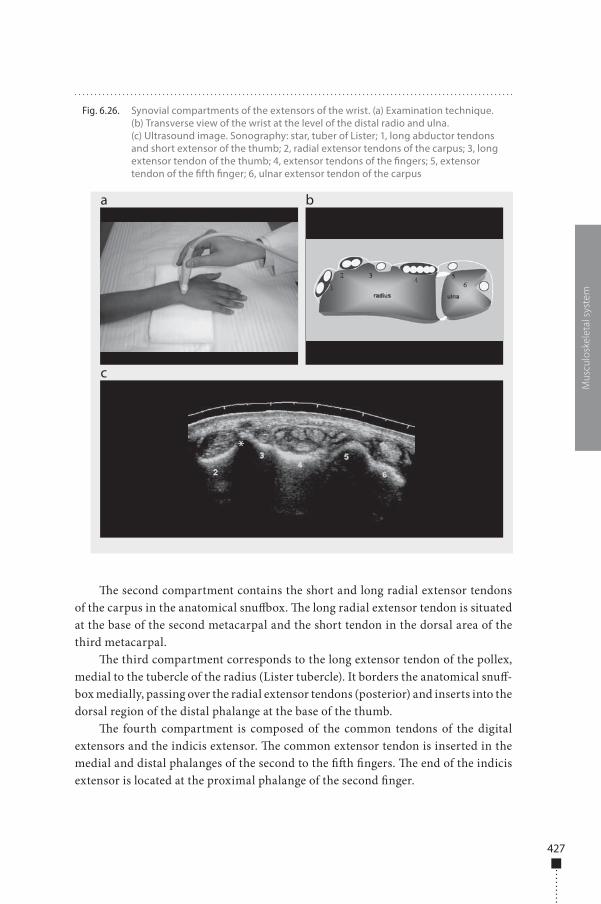
427
�e second compartment contains the short and long radial extensor tendons of the carpus in the anatomical snu�ox. �e long radial extensor tendon is situated at the base of the second metacarpal and the short tendon in the dorsal area of the third metacarpal.
�e third compartment corresponds to the long extensor tendon of the pollex, medial to the tubercle of the radius (Lister tubercle). It borders the anatomical snu�-box medially, passing over the radial extensor tendons (posterior) and inserts into the dorsal region of the distal phalange at the base of the thumb.
�e fourth compartment is composed of the common tendons of the digital extensors and the indicis extensor. �e common extensor tendon is inserted in the medial and distal phalanges of the second to the ��h �ngers. �e end of the indicis extensor is located at the proximal phalange of the second �nger.
Mus
culo
skel
etal
sys
tem
Fig. 6.26. Synovial compartments of the extensors of the wrist. (a) Examination technique. (b) Transverse view of the wrist at the level of the distal radio and ulna. (c) Ultrasound image. Sonography: star, tuber of Lister; 1, long abductor tendons and short extensor of the thumb; 2, radial extensor tendons of the carpus; 3, long extensor tendon of the thumb; 4, extensor tendons of the �ngers; 5, extensor tendon of the �fth �nger; 6, ulnar extensor tendon of the carpus
a
c
b
d*
978-9241548540-C006 PRF ml YVR ln ml ml-1-Final Proof.indd 427 6/10/13 10:30 AM
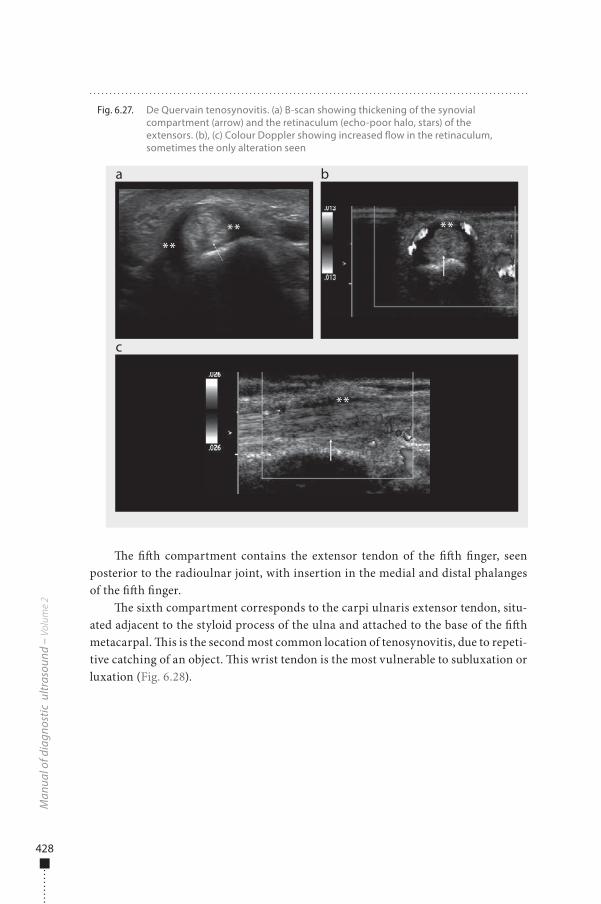
428
�e ��h compartment contains the extensor tendon of the ��h �nger, seen posterior to the radioulnar joint, with insertion in the medial and distal phalanges of the ��h �nger.
�e sixth compartment corresponds to the carpi ulnaris extensor tendon, situ-ated adjacent to the styloid process of the ulna and attached to the base of the ��h metacarpal. �is is the second most common location of tenosynovitis, due to repeti-tive catching of an object. �is wrist tendon is the most vulnerable to subluxation or luxation (Fig. 6.28).
Man
ual o
f dia
gnos
tic u
ltras
ound
– V
olum
e 2
Fig. 6.27. De Quervain tenosynovitis. (a) B-scan showing thickening of the synovial compartment (arrow) and the retinaculum (echo-poor halo, stars) of the extensors. (b), (c) Colour Doppler showing increased �ow in the retinaculum, sometimes the only alteration seen
a
c
b
d
**** **
**
978-9241548540-C006 PRF ml YVR ln ml ml-1-Final Proof.indd 428 6/10/13 10:30 AM
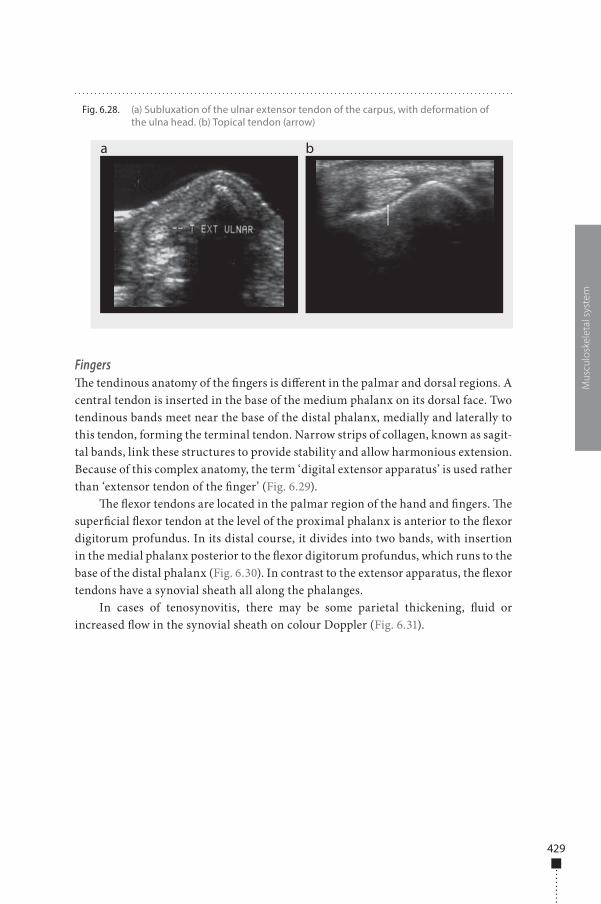
429
Fingers�e tendinous anatomy of the �ngers is di�erent in the palmar and dorsal regions. A central tendon is inserted in the base of the medium phalanx on its dorsal face. Two tendinous bands meet near the base of the distal phalanx, medially and laterally to this tendon, forming the terminal tendon. Narrow strips of collagen, known as sagit-tal bands, link these structures to provide stability and allow harmonious extension. Because of this complex anatomy, the term ‘digital extensor apparatus’ is used rather than ‘extensor tendon of the �nger’ (Fig. 6.29).
�e �exor tendons are located in the palmar region of the hand and �ngers. �e super�cial �exor tendon at the level of the proximal phalanx is anterior to the �exor digitorum profundus. In its distal course, it divides into two bands, with insertion in the medial phalanx posterior to the �exor digitorum profundus, which runs to the base of the distal phalanx (Fig. 6.30). In contrast to the extensor apparatus, the �exor tendons have a synovial sheath all along the phalanges.
In cases of tenosynovitis, there may be some parietal thickening, �uid or increased �ow in the synovial sheath on colour Doppler (Fig. 6.31).
Mus
culo
skel
etal
sys
tem
Fig. 6.28. (a) Subluxation of the ulnar extensor tendon of the carpus, with deformation of the ulna head. (b) Topical tendon (arrow)
a b
978-9241548540-C006 PRF ml YVR ln ml ml-1-Final Proof.indd 429 6/10/13 10:30 AM
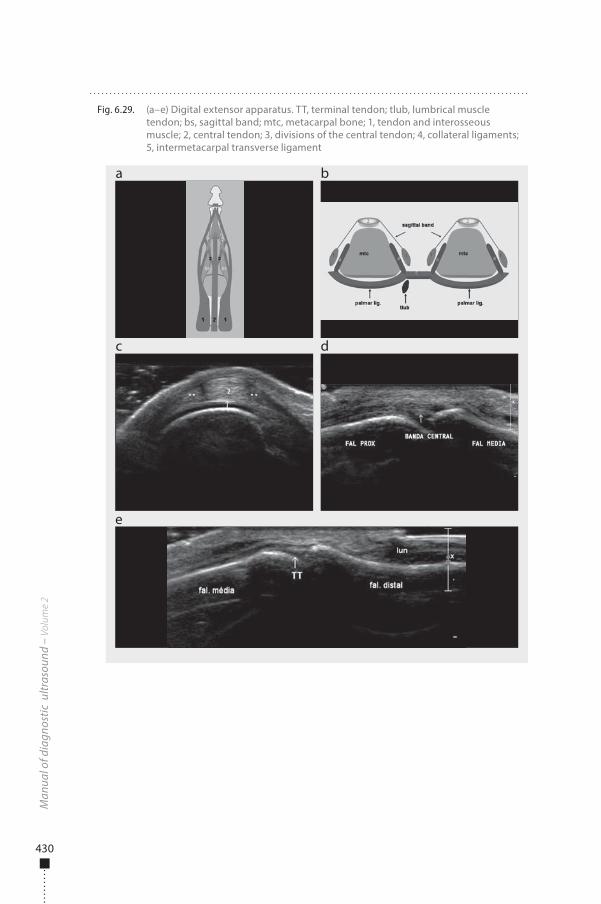
430
Man
ual o
f dia
gnos
tic u
ltras
ound
– V
olum
e 2
Fig. 6.29. (a–e) Digital extensor apparatus. TT, terminal tendon; tlub, lumbrical muscle tendon; bs, sagittal band; mtc, metacarpal bone; 1, tendon and interosseous muscle; 2, central tendon; 3, divisions of the central tendon; 4, collateral ligaments; 5, intermetacarpal transverse ligament
a
c
e
b
d
978-9241548540-C006 PRF ml YVR ln ml ml-1-Final Proof.indd 430 6/10/13 10:30 AM
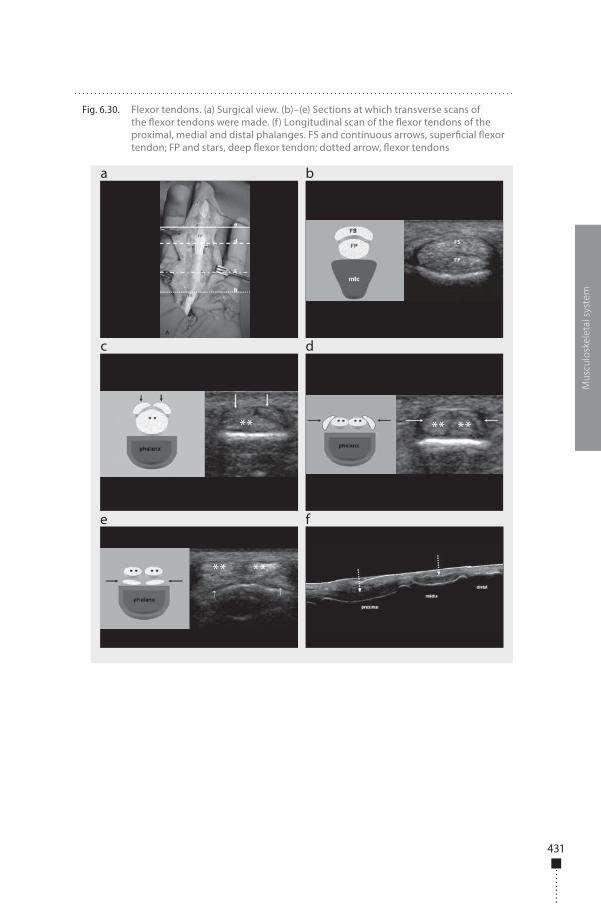
431
Mus
culo
skel
etal
sys
tem
Fig. 6.30. Flexor tendons. (a) Surgical view. (b)–(e) Sections at which transverse scans of the �exor tendons were made. (f) Longitudinal scan of the �exor tendons of the proximal, medial and distal phalanges. FS and continuous arrows, super�cial �exor tendon; FP and stars, deep �exor tendon; dotted arrow, �exor tendons
a
c
e f
b
d
** ** **
** **
978-9241548540-C006 PRF ml YVR ln ml ml-1-Final Proof.indd 431 6/10/13 10:30 AM
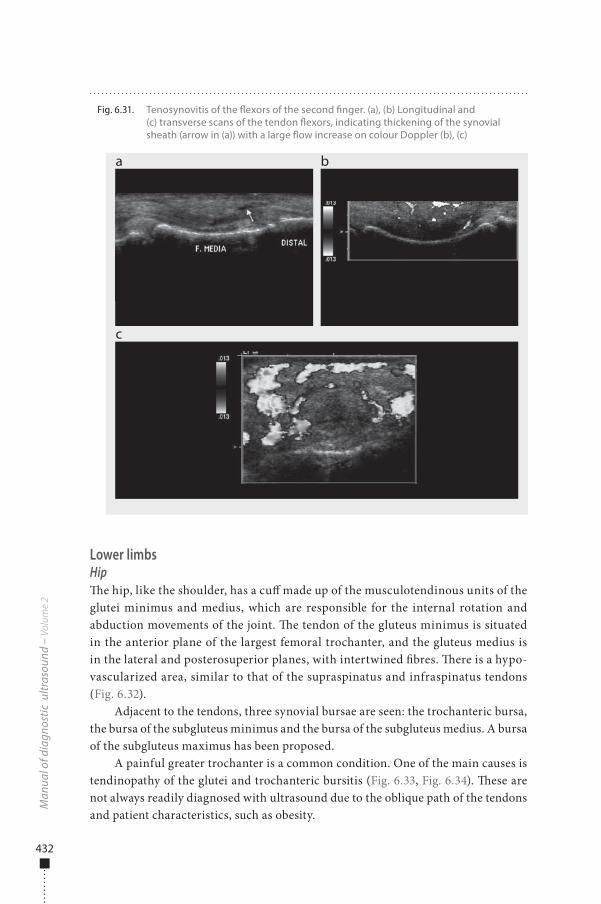
432
Lower limbsHip�e hip, like the shoulder, has a cu� made up of the musculotendinous units of the glutei minimus and medius, which are responsible for the internal rotation and abduction movements of the joint. �e tendon of the gluteus minimus is situated in the anterior plane of the largest femoral trochanter, and the gluteus medius is in the lateral and posterosuperior planes, with intertwined �bres. �ere is a hypo-vascularized area, similar to that of the supraspinatus and infraspinatus tendons (Fig. 6.32).
Adjacent to the tendons, three synovial bursae are seen: the trochanteric bursa, the bursa of the subgluteus minimus and the bursa of the subgluteus medius. A bursa of the subgluteus maximus has been proposed.
A painful greater trochanter is a common condition. One of the main causes is tendinopathy of the glutei and trochanteric bursitis (Fig. 6.33, Fig. 6.34). �ese are not always readily diagnosed with ultrasound due to the oblique path of the tendons and patient characteristics, such as obesity.
Man
ual o
f dia
gnos
tic u
ltras
ound
– V
olum
e 2
Fig. 6.31. Tenosynovitis of the �exors of the second �nger. (a), (b) Longitudinal and (c) transverse scans of the tendon �exors, indicating thickening of the synovial sheath (arrow in (a)) with a large �ow increase on colour Doppler (b), (c)
a
c
b
978-9241548540-C006 PRF ml YVR ln ml ml-1-Final Proof.indd 432 6/10/13 10:30 AM
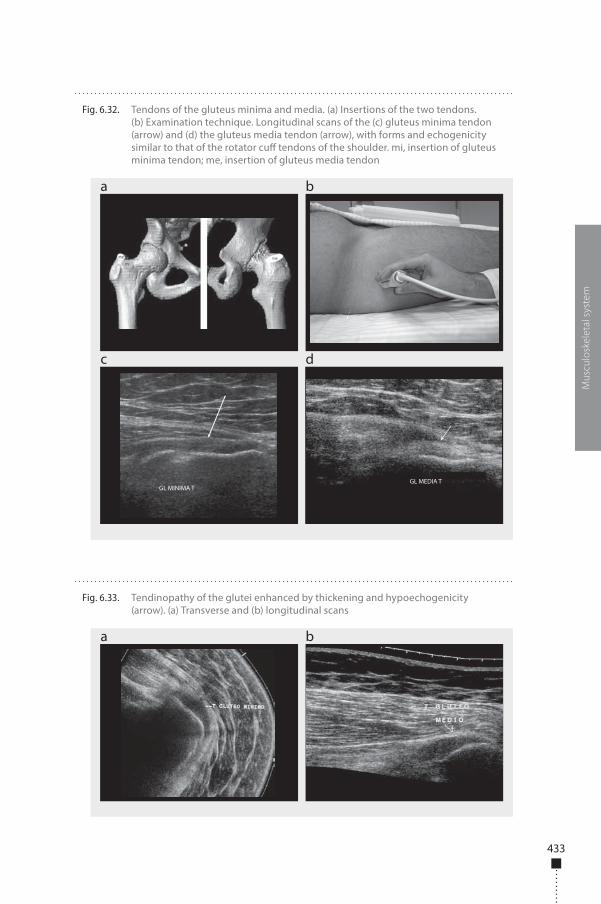
433
Mus
culo
skel
etal
sys
tem
Fig. 6.32. Tendons of the gluteus minima and media. (a) Insertions of the two tendons. (b) Examination technique. Longitudinal scans of the (c) gluteus minima tendon (arrow) and (d) the gluteus media tendon (arrow), with forms and echogenicity similar to that of the rotator cu� tendons of the shoulder. mi, insertion of gluteus minima tendon; me, insertion of gluteus media tendon
a
c d
b
GL MINIMA TGL MEDIA T
Fig. 6.33. Tendinopathy of the glutei enhanced by thickening and hypoechogenicity (arrow). (a) Transverse and (b) longitudinal scans
a b
978-9241548540-C006 PRF ml YVR ln ml ml-1-Final Proof.indd 433 6/10/13 10:30 AM
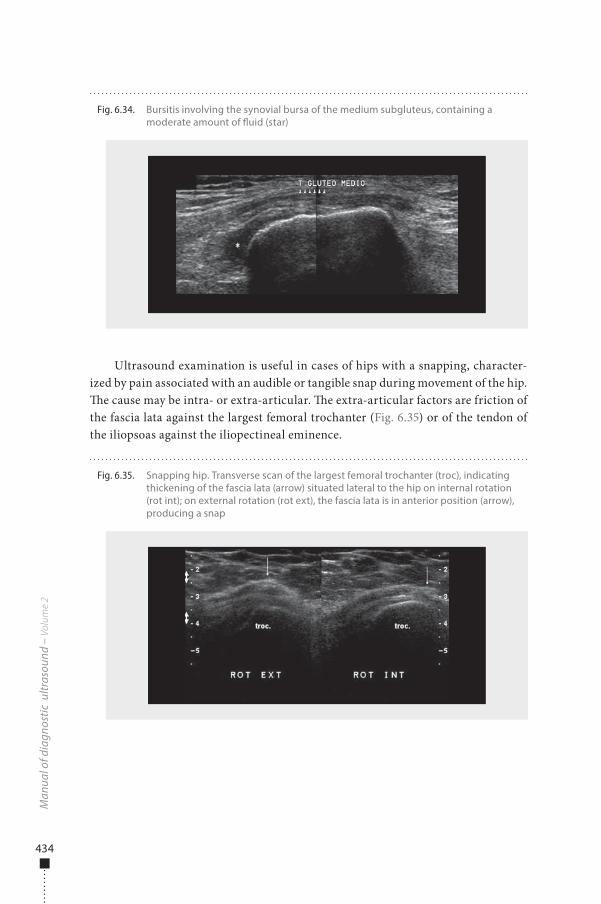
434
Ultrasound examination is useful in cases of hips with a snapping, character-ized by pain associated with an audible or tangible snap during movement of the hip. �e cause may be intra- or extra-articular. �e extra-articular factors are friction of the fascia lata against the largest femoral trochanter (Fig. 6.35) or of the tendon of the iliopsoas against the iliopectineal eminence.
Man
ual o
f dia
gnos
tic u
ltras
ound
– V
olum
e 2
Fig. 6.34. Bursitis involving the synovial bursa of the medium subgluteus, containing a moderate amount of �uid (star)
Fig. 6.35. Snapping hip. Transverse scan of the largest femoral trochanter (troc), indicating thickening of the fascia lata (arrow) situated lateral to the hip on internal rotation (rot int); on external rotation (rot ext), the fascia lata is in anterior position (arrow), producing a snap
978-9241548540-C006 PRF ml YVR ln ml ml-1-Final Proof.indd 434 6/10/13 10:30 AM
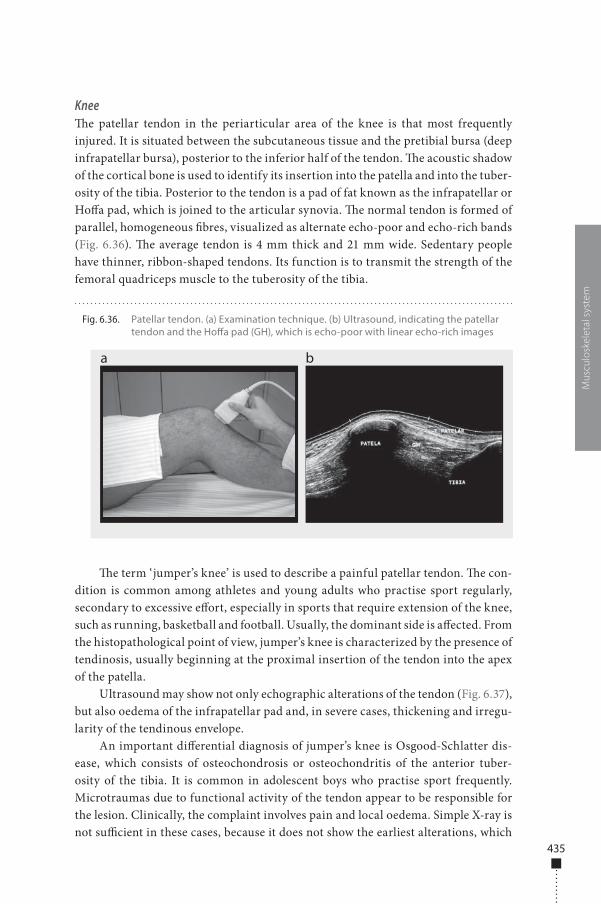
435
Knee�e patellar tendon in the periarticular area of the knee is that most frequently injured. It is situated between the subcutaneous tissue and the pretibial bursa (deep infrapatellar bursa), posterior to the inferior half of the tendon. �e acoustic shadow of the cortical bone is used to identify its insertion into the patella and into the tuber-osity of the tibia. Posterior to the tendon is a pad of fat known as the infrapatellar or Ho�a pad, which is joined to the articular synovia. �e normal tendon is formed of parallel, homogeneous �bres, visualized as alternate echo-poor and echo-rich bands (Fig. 6.36). �e average tendon is 4 mm thick and 21 mm wide. Sedentary people have thinner, ribbon-shaped tendons. Its function is to transmit the strength of the femoral quadriceps muscle to the tuberosity of the tibia.
�e term ‘jumper’s knee’ is used to describe a painful patellar tendon. �e con-dition is common among athletes and young adults who practise sport regularly, secondary to excessive e�ort, especially in sports that require extension of the knee, such as running, basketball and football. Usually, the dominant side is a�ected. From the histopathological point of view, jumper’s knee is characterized by the presence of tendinosis, usually beginning at the proximal insertion of the tendon into the apex of the patella.
Ultrasound may show not only echographic alterations of the tendon (Fig. 6.37), but also oedema of the infrapatellar pad and, in severe cases, thickening and irregu-larity of the tendinous envelope.
An important di�erential diagnosis of jumper’s knee is Osgood-Schlatter dis-ease, which consists of osteochondrosis or osteochondritis of the anterior tuber-osity of the tibia. It is common in adolescent boys who practise sport frequently. Microtraumas due to functional activity of the tendon appear to be responsible for the lesion. Clinically, the complaint involves pain and local oedema. Simple X-ray is not su�cient in these cases, because it does not show the earliest alterations, which
Mus
culo
skel
etal
sys
tem
Fig. 6.36. Patellar tendon. (a) Examination technique. (b) Ultrasound, indicating the patellar tendon and the Ho�a pad (GH), which is echo-poor with linear echo-rich images
a b
978-9241548540-C006 PRF ml YVR ln ml ml-1-Final Proof.indd 435 6/10/13 10:30 AM
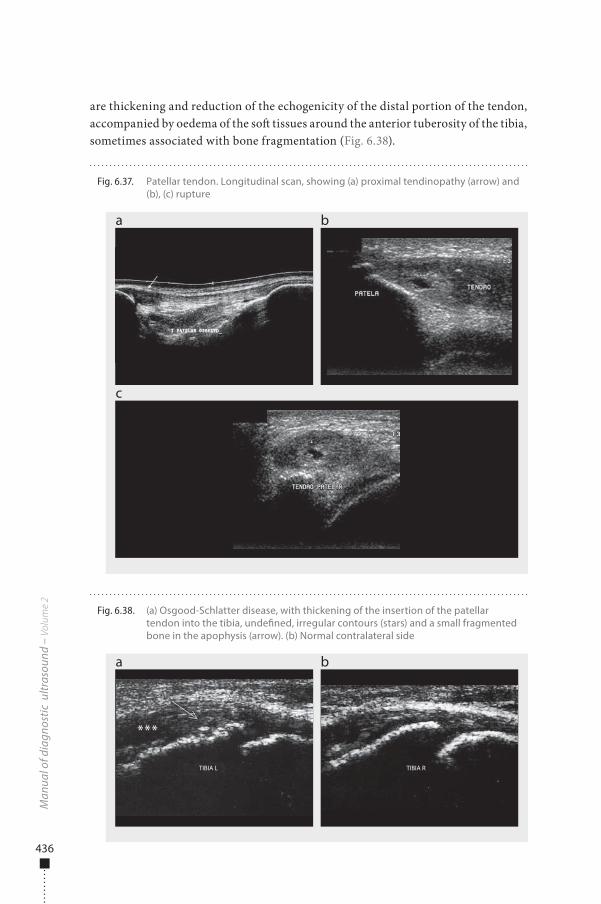
436
are thickening and reduction of the echogenicity of the distal portion of the tendon, accompanied by oedema of the so� tissues around the anterior tuberosity of the tibia, sometimes associated with bone fragmentation (Fig. 6.38).
Man
ual o
f dia
gnos
tic u
ltras
ound
– V
olum
e 2
Fig. 6.37. Patellar tendon. Longitudinal scan, showing (a) proximal tendinopathy (arrow) and (b), (c) rupture
a
c
b
Fig. 6.38. (a) Osgood-Schlatter disease, with thickening of the insertion of the patellar tendon into the tibia, unde�ned, irregular contours (stars) and a small fragmented bone in the apophysis (arrow). (b) Normal contralateral side
a b
TIBIA L TIBIA R
***
978-9241548540-C006 PRF ml YVR ln ml ml-1-Final Proof.indd 436 6/10/13 10:30 AM
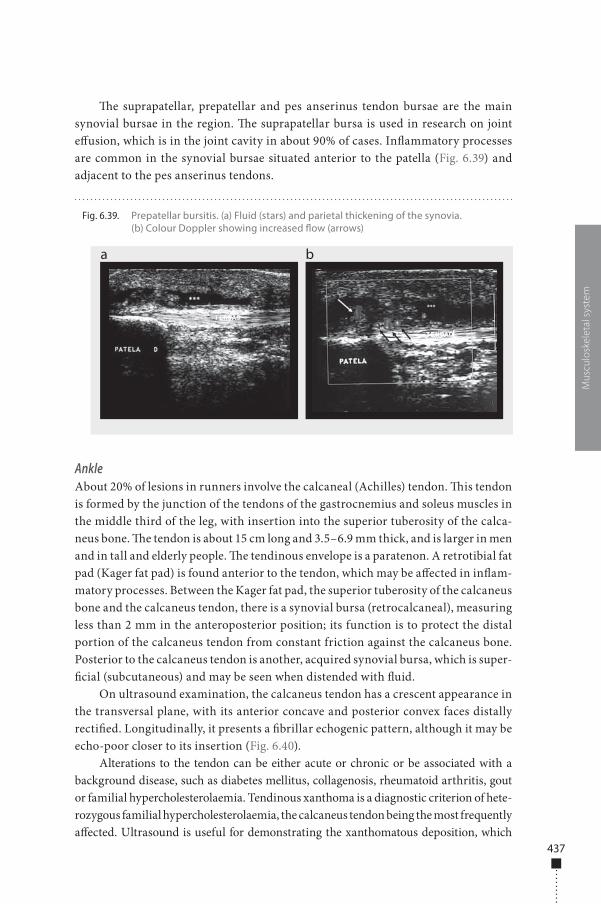
437
�e suprapatellar, prepatellar and pes anserinus tendon bursae are the main synovial bursae in the region. �e suprapatellar bursa is used in research on joint e�usion, which is in the joint cavity in about 90% of cases. In�ammatory processes are common in the synovial bursae situated anterior to the patella (Fig. 6.39) and adjacent to the pes anserinus tendons.
AnkleAbout 20% of lesions in runners involve the calcaneal (Achilles) tendon. �is tendon is formed by the junction of the tendons of the gastrocnemius and soleus muscles in the middle third of the leg, with insertion into the superior tuberosity of the calca-neus bone. �e tendon is about 15 cm long and 3.5–6.9 mm thick, and is larger in men and in tall and elderly people. �e tendinous envelope is a paratenon. A retrotibial fat pad (Kager fat pad) is found anterior to the tendon, which may be a�ected in in�am-matory processes. Between the Kager fat pad, the superior tuberosity of the calcaneus bone and the calcaneus tendon, there is a synovial bursa (retrocalcaneal), measuring less than 2 mm in the anteroposterior position; its function is to protect the distal portion of the calcaneus tendon from constant friction against the calcaneus bone. Posterior to the calcaneus tendon is another, acquired synovial bursa, which is super-�cial (subcutaneous) and may be seen when distended with �uid.
On ultrasound examination, the calcaneus tendon has a crescent appearance in the transversal plane, with its anterior concave and posterior convex faces distally recti�ed. Longitudinally, it presents a �brillar echogenic pattern, although it may be echo-poor closer to its insertion (Fig. 6.40).
Alterations to the tendon can be either acute or chronic or be associated with a background disease, such as diabetes mellitus, collagenosis, rheumatoid arthritis, gout or familial hypercholesterolaemia. Tendinous xanthoma is a diagnostic criterion of hete-rozygous familial hypercholesterolaemia, the calcaneus tendon being the most frequently a�ected. Ultrasound is useful for demonstrating the xanthomatous deposition, which
Mus
culo
skel
etal
sys
tem
Fig. 6.39. Prepatellar bursitis. (a) Fluid (stars) and parietal thickening of the synovia. (b) Colour Doppler showing increased �ow (arrows)
a b
978-9241548540-C006 PRF ml YVR ln ml ml-1-Final Proof.indd 437 6/10/13 10:30 AM
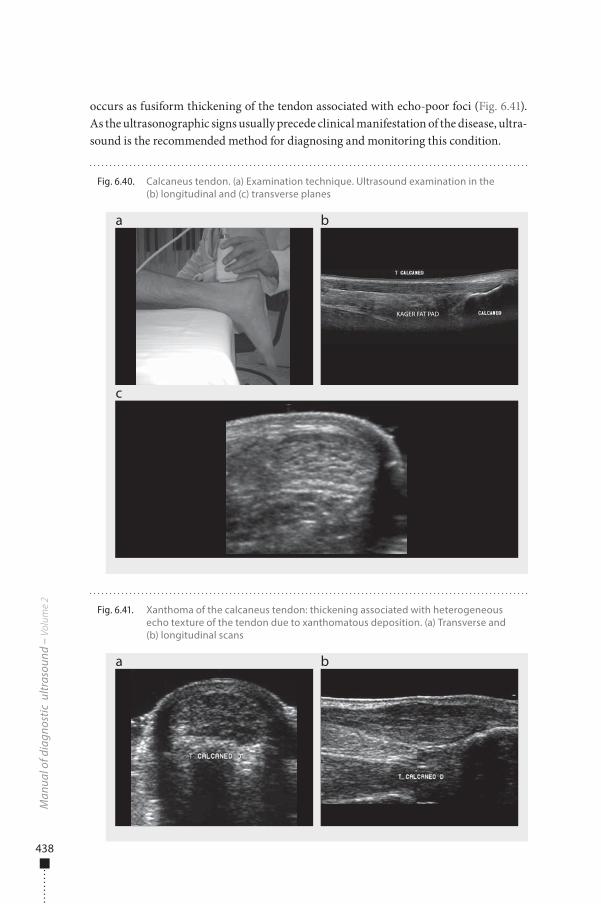
438
occurs as fusiform thickening of the tendon associated with echo-poor foci (Fig. 6.41). As the ultrasonographic signs usually precede clinical manifestation of the disease, ultra-sound is the recommended method for diagnosing and monitoring this condition.
Man
ual o
f dia
gnos
tic u
ltras
ound
– V
olum
e 2
Fig. 6.41. Xanthoma of the calcaneus tendon: thickening associated with heterogeneous echo texture of the tendon due to xanthomatous deposition. (a) Transverse and (b) longitudinal scans
a b
Fig. 6.40. Calcaneus tendon. (a) Examination technique. Ultrasound examination in the (b) longitudinal and (c) transverse planes
a
c
b
KAGER FAT PAD
978-9241548540-C006 PRF ml YVR ln ml ml-1-Final Proof.indd 438 6/10/13 10:30 AM
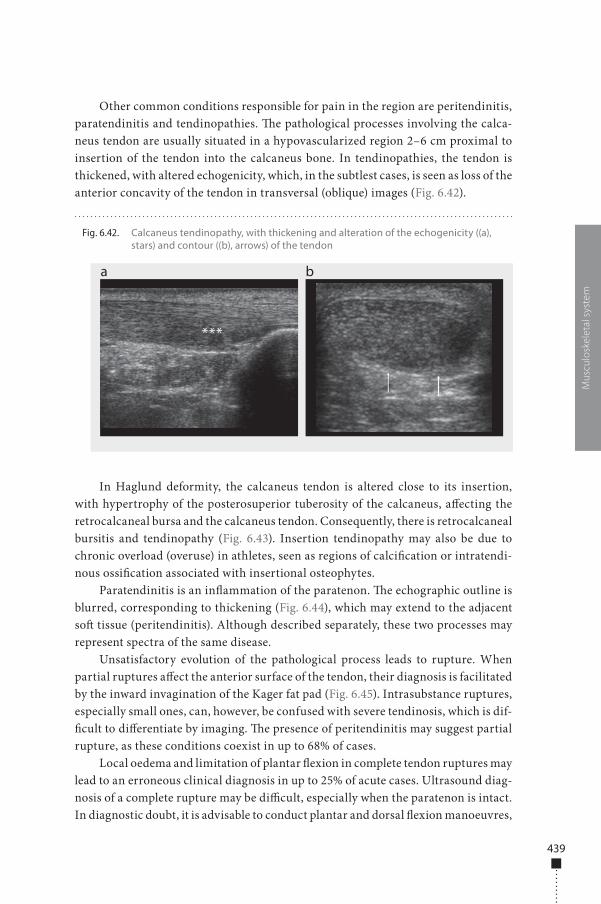
439
Other common conditions responsible for pain in the region are peritendinitis, paratendinitis and tendinopathies. �e pathological processes involving the calca-neus tendon are usually situated in a hypovascularized region 2–6 cm proximal to insertion of the tendon into the calcaneus bone. In tendinopathies, the tendon is thickened, with altered echogenicity, which, in the subtlest cases, is seen as loss of the anterior concavity of the tendon in transversal (oblique) images (Fig. 6.42).
In Haglund deformity, the calcaneus tendon is altered close to its insertion, with hypertrophy of the posterosuperior tuberosity of the calcaneus, a�ecting the retrocalcaneal bursa and the calcaneus tendon. Consequently, there is retrocalcaneal bursitis and tendinopathy (Fig. 6.43). Insertion tendinopathy may also be due to chronic overload (overuse) in athletes, seen as regions of calci�cation or intratendi-nous ossi�cation associated with insertional osteophytes.
Paratendinitis is an in�ammation of the paratenon. �e echographic outline is blurred, corresponding to thickening (Fig. 6.44), which may extend to the adjacent so� tissue (peritendinitis). Although described separately, these two processes may represent spectra of the same disease.
Unsatisfactory evolution of the pathological process leads to rupture. When partial ruptures a�ect the anterior surface of the tendon, their diagnosis is facilitated by the inward invagination of the Kager fat pad (Fig. 6.45). Intrasubstance ruptures, especially small ones, can, however, be confused with severe tendinosis, which is dif-�cult to di�erentiate by imaging. �e presence of peritendinitis may suggest partial rupture, as these conditions coexist in up to 68% of cases.
Local oedema and limitation of plantar �exion in complete tendon ruptures may lead to an erroneous clinical diagnosis in up to 25% of acute cases. Ultrasound diag-nosis of a complete rupture may be di�cult, especially when the paratenon is intact. In diagnostic doubt, it is advisable to conduct plantar and dorsal �exion manoeuvres,
Mus
culo
skel
etal
sys
tem
Fig. 6.42. Calcaneus tendinopathy, with thickening and alteration of the echogenicity ((a), stars) and contour ((b), arrows) of the tendon
a b
***
978-9241548540-C006 PRF ml YVR ln ml ml-1-Final Proof.indd 439 6/10/13 10:30 AM
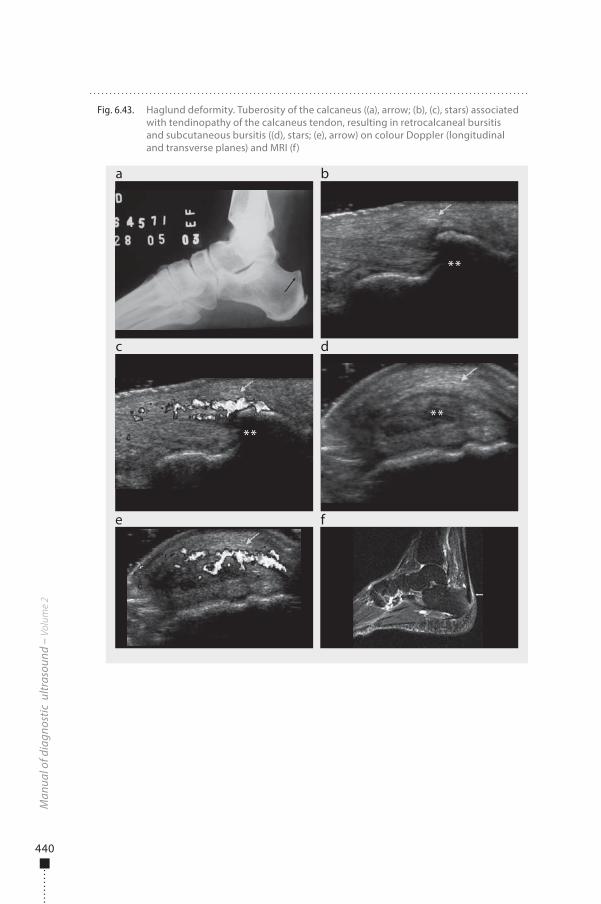
440
Man
ual o
f dia
gnos
tic u
ltras
ound
– V
olum
e 2
Fig. 6.43. Haglund deformity. Tuberosity of the calcaneus ((a), arrow; (b), (c), stars) associated with tendinopathy of the calcaneus tendon, resulting in retrocalcaneal bursitis and subcutaneous bursitis ((d), stars; (e), arrow) on colour Doppler (longitudinal and transverse planes) and MRI (f)
a
c
e f
b
d
****
**
978-9241548540-C006 PRF ml YVR ln ml ml-1-Final Proof.indd 440 6/10/13 10:30 AM
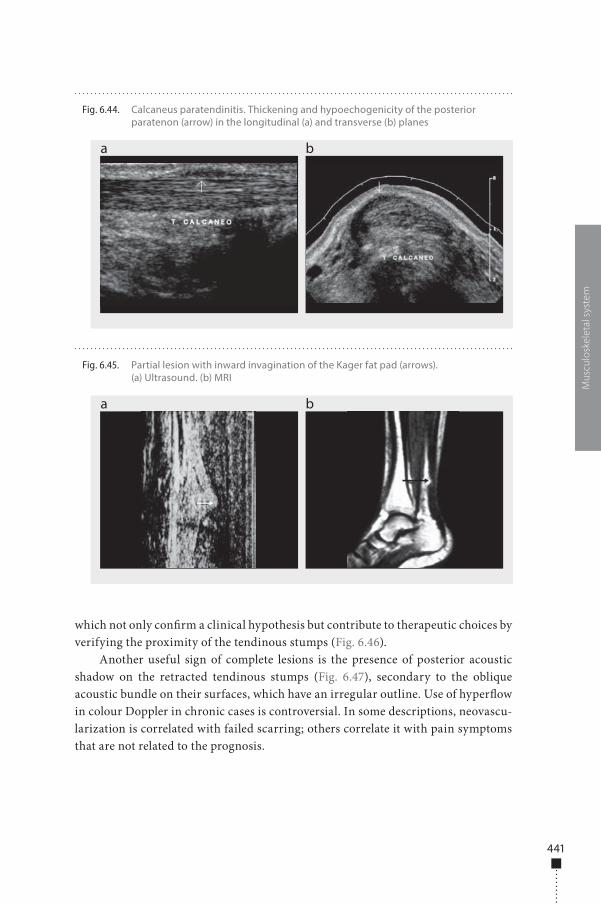
441
which not only con�rm a clinical hypothesis but contribute to therapeutic choices by verifying the proximity of the tendinous stumps (Fig. 6.46).
Another useful sign of complete lesions is the presence of posterior acoustic shadow on the retracted tendinous stumps (Fig. 6.47), secondary to the oblique acoustic bundle on their surfaces, which have an irregular outline. Use of hyper�ow in colour Doppler in chronic cases is controversial. In some descriptions, neovascu-larization is correlated with failed scarring; others correlate it with pain symptoms that are not related to the prognosis.
Mus
culo
skel
etal
sys
tem
Fig. 6.44. Calcaneus paratendinitis. Thickening and hypoechogenicity of the posterior paratenon (arrow) in the longitudinal (a) and transverse (b) planes
a b
Fig. 6.45. Partial lesion with inward invagination of the Kager fat pad (arrows). (a) Ultrasound. (b) MRI
a b
978-9241548540-C006 PRF ml YVR ln ml ml-1-Final Proof.indd 441 6/10/13 10:30 AM
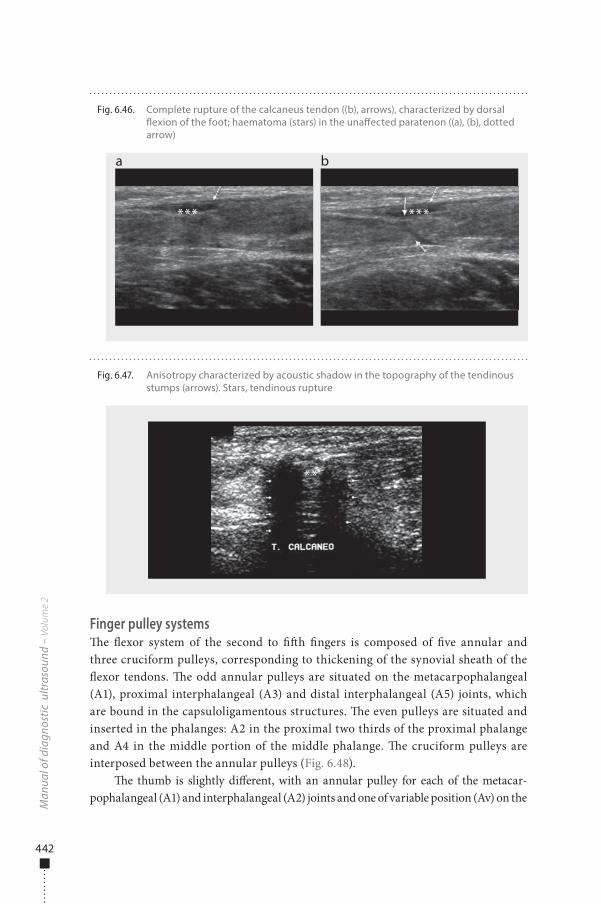
442
Finger pulley systems�e �exor system of the second to ��h �ngers is composed of �ve annular and three cruciform pulleys, corresponding to thickening of the synovial sheath of the �exor tendons. �e odd annular pulleys are situated on the metacarpophalangeal (A1), proximal interphalangeal (A3) and distal interphalangeal (A5) joints, which are bound in the capsuloligamentous structures. �e even pulleys are situated and inserted in the phalanges: A2 in the proximal two thirds of the proximal phalange and A4 in the middle portion of the middle phalange. �e cruciform pulleys are interposed between the annular pulleys (Fig. 6.48).
�e thumb is slightly di�erent, with an annular pulley for each of the metacar-pophalangeal (A1) and interphalangeal (A2) joints and one of variable position (Av) on the
Man
ual o
f dia
gnos
tic u
ltras
ound
– V
olum
e 2
Fig. 6.46. Complete rupture of the calcaneus tendon ((b), arrows), characterized by dorsal �exion of the foot; haematoma (stars) in the una�ected paratenon ((a), (b), dotted arrow)
a b
*** ***
Fig. 6.47. Anisotropy characterized by acoustic shadow in the topography of the tendinous stumps (arrows). Stars, tendinous rupture
**
978-9241548540-C006 PRF ml YVR ln ml ml-1-Final Proof.indd 442 6/10/13 10:30 AM
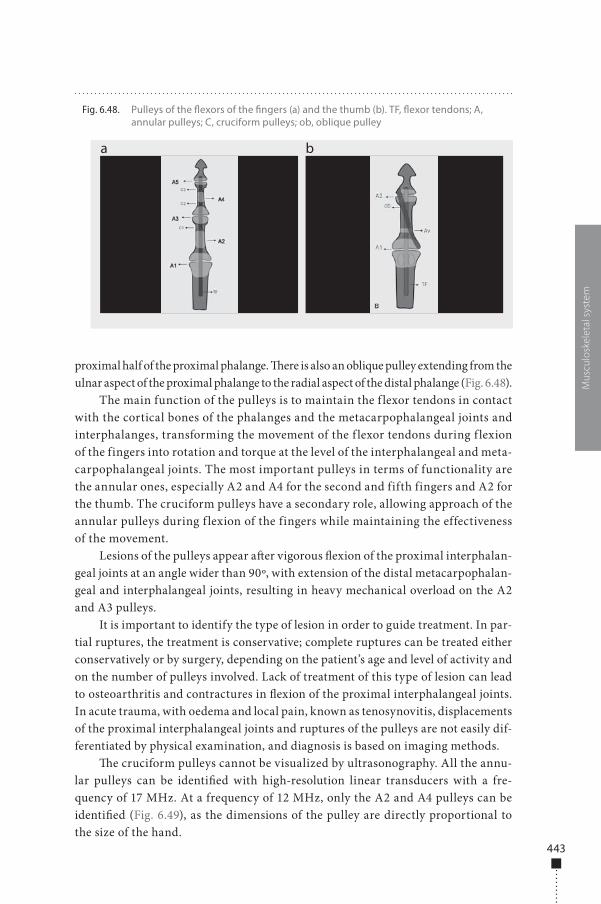
443
proximal half of the proximal phalange. �ere is also an oblique pulley extending from the ulnar aspect of the proximal phalange to the radial aspect of the distal phalange (Fig. 6.48).
The main function of the pulleys is to maintain the f lexor tendons in contact with the cortical bones of the phalanges and the metacarpophalangeal joints and interphalanges, transforming the movement of the f lexor tendons during f lexion of the fingers into rotation and torque at the level of the interphalangeal and meta-carpophalangeal joints. The most important pulleys in terms of functionality are the annular ones, especially A2 and A4 for the second and fifth fingers and A2 for the thumb. The cruciform pulleys have a secondary role, allowing approach of the annular pulleys during f lexion of the fingers while maintaining the effectiveness of the movement.
Lesions of the pulleys appear a�er vigorous �exion of the proximal interphalan-geal joints at an angle wider than 90º, with extension of the distal metacarpophalan-geal and interphalangeal joints, resulting in heavy mechanical overload on the A2 and A3 pulleys.
It is important to identify the type of lesion in order to guide treatment. In par-tial ruptures, the treatment is conservative; complete ruptures can be treated either conservatively or by surgery, depending on the patient’s age and level of activity and on the number of pulleys involved. Lack of treatment of this type of lesion can lead to osteoarthritis and contractures in �exion of the proximal interphalangeal joints. In acute trauma, with oedema and local pain, known as tenosynovitis, displacements of the proximal interphalangeal joints and ruptures of the pulleys are not easily dif-ferentiated by physical examination, and diagnosis is based on imaging methods.
�e cruciform pulleys cannot be visualized by ultrasonography. All the annu-lar pulleys can be identi�ed with high-resolution linear transducers with a fre-quency of 17 MHz. At a frequency of 12 MHz, only the A2 and A4 pulleys can be identi�ed (Fig. 6.49), as the dimensions of the pulley are directly proportional to the size of the hand.
Mus
culo
skel
etal
sys
tem
Fig. 6.48. Pulleys of the �exors of the �ngers (a) and the thumb (b). TF, �exor tendons; A, annular pulleys; C, cruciform pulleys; ob, oblique pulley
a b
978-9241548540-C006 PRF ml YVR ln ml ml-1-Final Proof.indd 443 6/10/13 10:30 AM
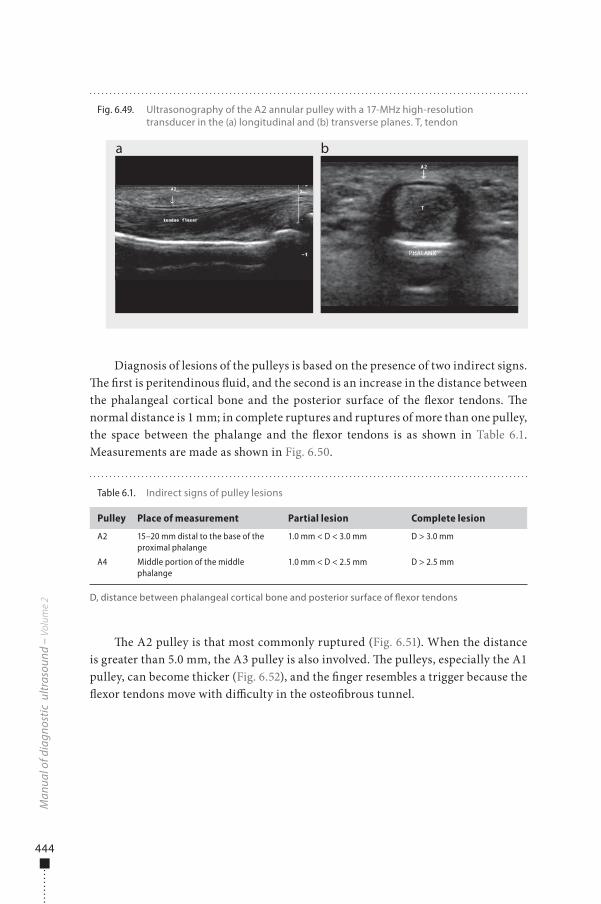
444
Diagnosis of lesions of the pulleys is based on the presence of two indirect signs. �e �rst is peritendinous �uid, and the second is an increase in the distance between the phalangeal cortical bone and the posterior surface of the �exor tendons. �e normal distance is 1 mm; in complete ruptures and ruptures of more than one pulley, the space between the phalange and the �exor tendons is as shown in Table 6.1. Measurements are made as shown in Fig. 6.50.
�e A2 pulley is that most commonly ruptured (Fig. 6.51). When the distance is greater than 5.0 mm, the A3 pulley is also involved. �e pulleys, especially the A1 pulley, can become thicker (Fig. 6.52), and the �nger resembles a trigger because the �exor tendons move with di�culty in the osteo�brous tunnel.
Man
ual o
f dia
gnos
tic u
ltras
ound
– V
olum
e 2
Fig. 6.49. Ultrasonography of the A2 annular pulley with a 17-MHz high-resolution transducer in the (a) longitudinal and (b) transverse planes. T, tendon
a b
PHALANX
Table 6.1. Indirect signs of pulley lesions
Pulley Place of measurement Partial lesion Complete lesion
A2 15–20 mm distal to the base of the proximal phalange
1.0 mm < D < 3.0 mm D > 3.0 mm
A4 Middle portion of the middle phalange
1.0 mm < D < 2.5 mm D > 2.5 mm
D, distance between phalangeal cortical bone and posterior surface of �exor tendons
978-9241548540-C006 PRF ml YVR ln ml ml-1-Final Proof.indd 444 6/10/13 10:30 AM
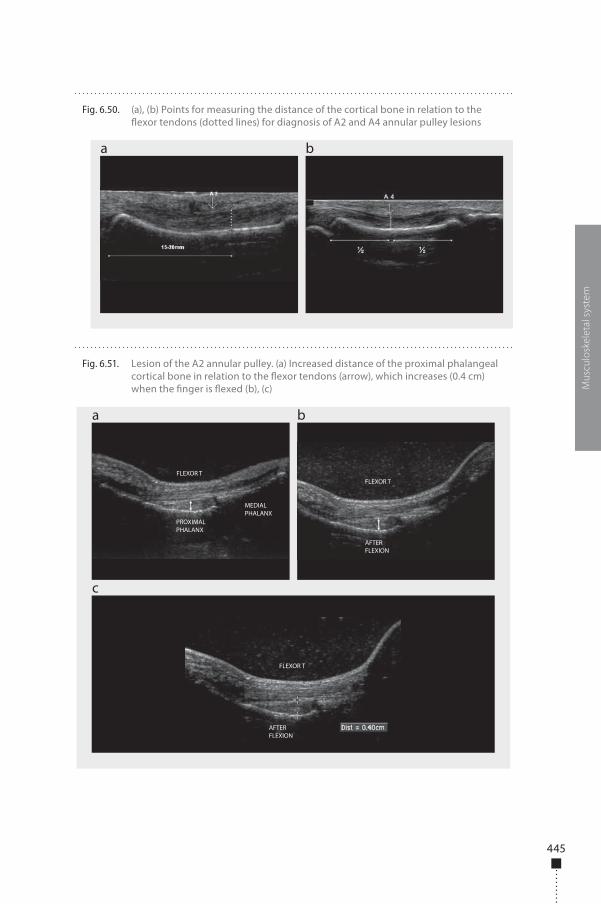
445
Mus
culo
skel
etal
sys
tem
Fig. 6.50. (a), (b) Points for measuring the distance of the cortical bone in relation to the �exor tendons (dotted lines) for diagnosis of A2 and A4 annular pulley lesions
a b
Fig. 6.51. Lesion of the A2 annular pulley. (a) Increased distance of the proximal phalangeal cortical bone in relation to the �exor tendons (arrow), which increases (0.4 cm) when the �nger is �exed (b), (c)
a
c
b
FLEXOR T
FLEXOR T
FLEXOR T
AFTER FLEXION
AFTER FLEXION
PROXIMAL PHALANX
MEDIAL PHALANX
978-9241548540-C006 PRF ml YVR ln ml ml-1-Final Proof.indd 445 6/10/13 10:30 AM
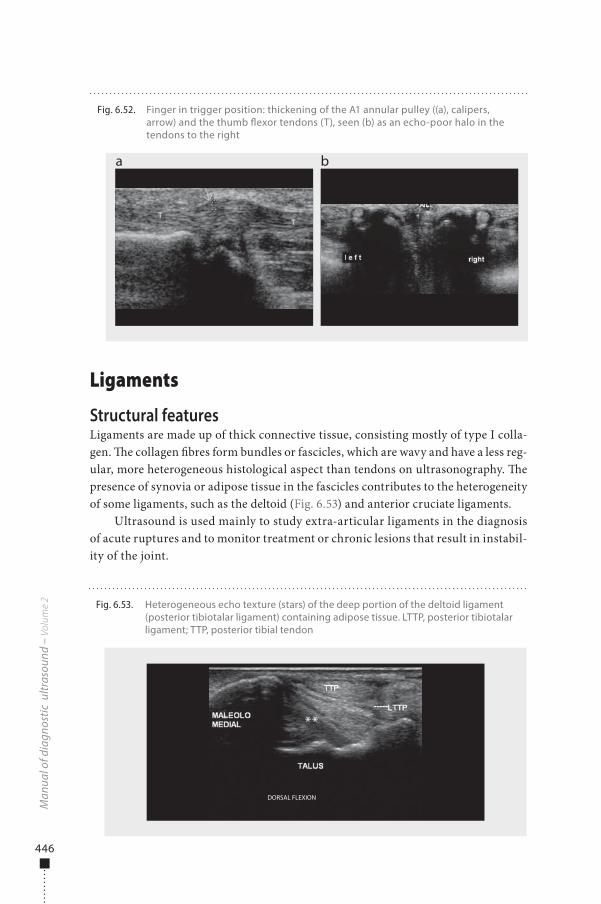
446
Ligaments
Structural featuresLigaments are made up of thick connective tissue, consisting mostly of type I colla-gen. �e collagen �bres form bundles or fascicles, which are wavy and have a less reg-ular, more heterogeneous histological aspect than tendons on ultrasonography. �e presence of synovia or adipose tissue in the fascicles contributes to the heterogeneity of some ligaments, such as the deltoid (Fig. 6.53) and anterior cruciate ligaments.
Ultrasound is used mainly to study extra-articular ligaments in the diagnosis of acute ruptures and to monitor treatment or chronic lesions that result in instabil-ity of the joint.
Man
ual o
f dia
gnos
tic u
ltras
ound
– V
olum
e 2
Fig. 6.52. Finger in trigger position: thickening of the A1 annular pulley ((a), calipers, arrow) and the thumb �exor tendons (T), seen (b) as an echo-poor halo in the tendons to the right
a b
Fig. 6.53. Heterogeneous echo texture (stars) of the deep portion of the deltoid ligament (posterior tibiotalar ligament) containing adipose tissue. LTTP, posterior tibiotalar ligament; TTP, posterior tibial tendon
DORSAL FLEXION
**
978-9241548540-C006 PRF ml YVR ln ml ml-1-Final Proof.indd 446 6/10/13 10:30 AM
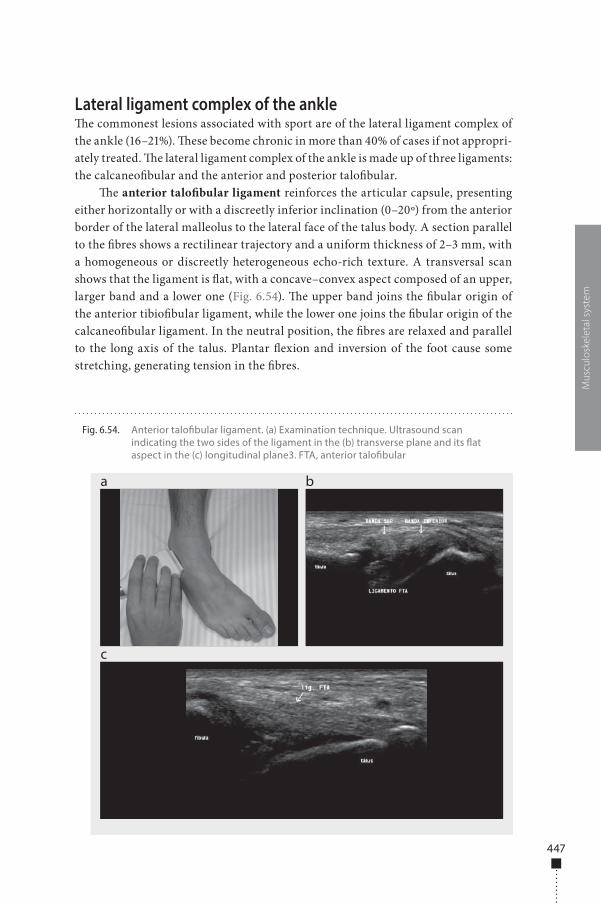
447
Lateral ligament complex of the ankle�e commonest lesions associated with sport are of the lateral ligament complex of the ankle (16–21%). �ese become chronic in more than 40% of cases if not appropri-ately treated. �e lateral ligament complex of the ankle is made up of three ligaments: the calcaneo�bular and the anterior and posterior talo�bular.
�e anterior talo�bular ligament reinforces the articular capsule, presenting either horizontally or with a discreetly inferior inclination (0–20º) from the anterior border of the lateral malleolus to the lateral face of the talus body. A section parallel to the �bres shows a rectilinear trajectory and a uniform thickness of 2–3 mm, with a homogeneous or discreetly heterogeneous echo-rich texture. A transversal scan shows that the ligament is �at, with a concave–convex aspect composed of an upper, larger band and a lower one (Fig. 6.54). �e upper band joins the �bular origin of the anterior tibio�bular ligament, while the lower one joins the �bular origin of the calcaneo�bular ligament. In the neutral position, the �bres are relaxed and parallel to the long axis of the talus. Plantar �exion and inversion of the foot cause some stretching, generating tension in the �bres.
Mus
culo
skel
etal
sys
tem
Fig. 6.54. Anterior talo�bular ligament. (a) Examination technique. Ultrasound scan indicating the two sides of the ligament in the (b) transverse plane and its �at aspect in the (c) longitudinal plane3. FTA, anterior talo�bular
a
c
b
978-9241548540-C006 PRF ml YVR ln ml ml-1-Final Proof.indd 447 6/10/13 10:30 AM
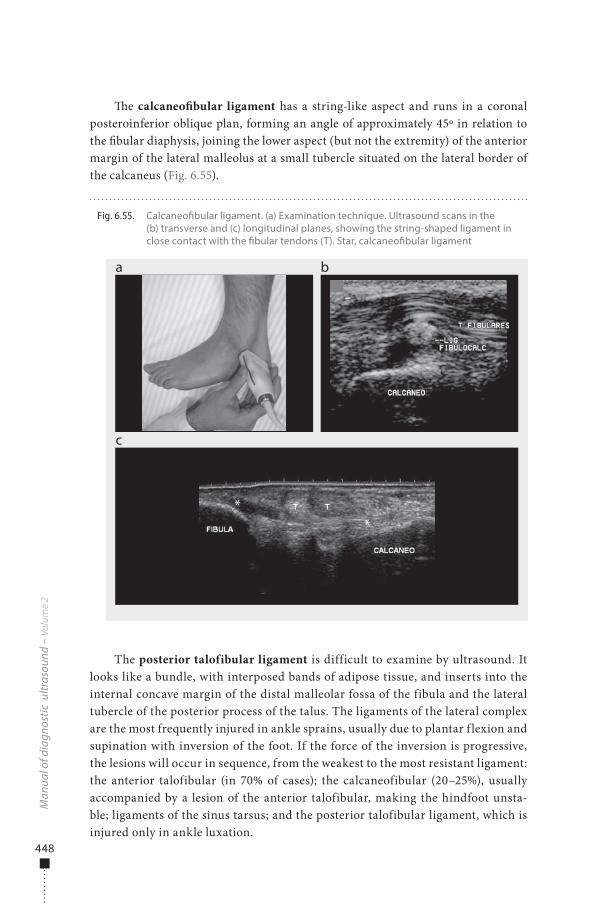
448
�e calcaneo�bular ligament has a string-like aspect and runs in a coronal posteroinferior oblique plan, forming an angle of approximately 45º in relation to the �bular diaphysis, joining the lower aspect (but not the extremity) of the anterior margin of the lateral malleolus at a small tubercle situated on the lateral border of the calcaneus (Fig. 6.55).
The posterior talofibular ligament is difficult to examine by ultrasound. It looks like a bundle, with interposed bands of adipose tissue, and inserts into the internal concave margin of the distal malleolar fossa of the fibula and the lateral tubercle of the posterior process of the talus. The ligaments of the lateral complex are the most frequently injured in ankle sprains, usually due to plantar f lexion and supination with inversion of the foot. If the force of the inversion is progressive, the lesions will occur in sequence, from the weakest to the most resistant ligament: the anterior talofibular (in 70% of cases); the calcaneofibular (20–25%), usually accompanied by a lesion of the anterior talofibular, making the hindfoot unsta-ble; ligaments of the sinus tarsus; and the posterior talofibular ligament, which is injured only in ankle luxation.
Man
ual o
f dia
gnos
tic u
ltras
ound
– V
olum
e 2
Fig. 6.55. Calcaneo�bular ligament. (a) Examination technique. Ultrasound scans in the (b) transverse and (c) longitudinal planes, showing the string-shaped ligament in close contact with the �bular tendons (T). Star, calcaneo�bular ligament
a
c
b
**
978-9241548540-C006 PRF ml YVR ln ml ml-1-Final Proof.indd 448 6/10/13 10:30 AM
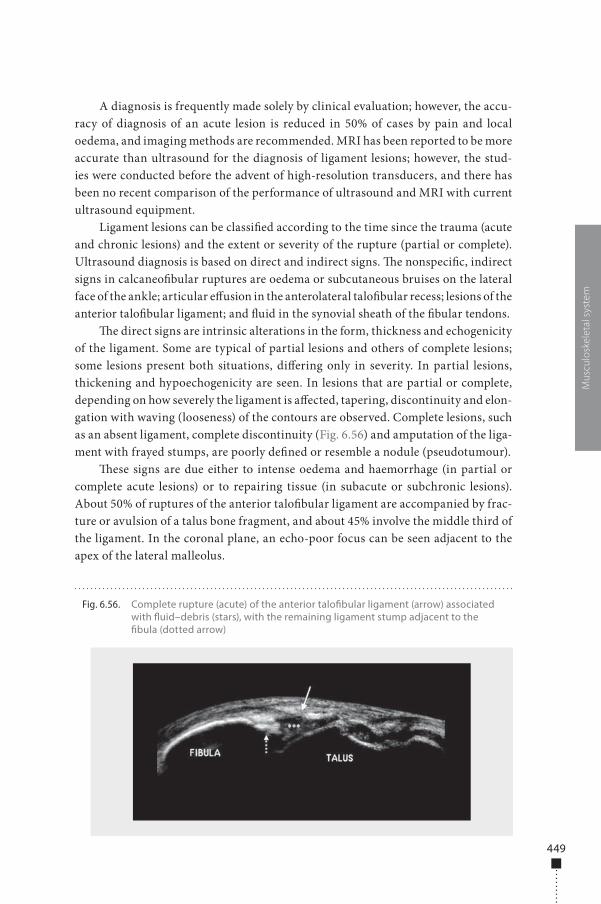
449
A diagnosis is frequently made solely by clinical evaluation; however, the accu-racy of diagnosis of an acute lesion is reduced in 50% of cases by pain and local oedema, and imaging methods are recommended. MRI has been reported to be more accurate than ultrasound for the diagnosis of ligament lesions; however, the stud-ies were conducted before the advent of high-resolution transducers, and there has been no recent comparison of the performance of ultrasound and MRI with current ultrasound equipment.
Ligament lesions can be classi�ed according to the time since the trauma (acute and chronic lesions) and the extent or severity of the rupture (partial or complete). Ultrasound diagnosis is based on direct and indirect signs. �e nonspeci�c, indirect signs in calcaneo�bular ruptures are oedema or subcutaneous bruises on the lateral face of the ankle; articular e�usion in the anterolateral talo�bular recess; lesions of the anterior talo�bular ligament; and �uid in the synovial sheath of the �bular tendons.
�e direct signs are intrinsic alterations in the form, thickness and echogenicity of the ligament. Some are typical of partial lesions and others of complete lesions; some lesions present both situations, di�ering only in severity. In partial lesions, thickening and hypoechogenicity are seen. In lesions that are partial or complete, depending on how severely the ligament is a�ected, tapering, discontinuity and elon-gation with waving (looseness) of the contours are observed. Complete lesions, such as an absent ligament, complete discontinuity (Fig. 6.56) and amputation of the liga-ment with frayed stumps, are poorly de�ned or resemble a nodule (pseudotumour).
�ese signs are due either to intense oedema and haemorrhage (in partial or complete acute lesions) or to repairing tissue (in subacute or subchronic lesions). About 50% of ruptures of the anterior talo�bular ligament are accompanied by frac-ture or avulsion of a talus bone fragment, and about 45% involve the middle third of the ligament. In the coronal plane, an echo-poor focus can be seen adjacent to the apex of the lateral malleolus.
Mus
culo
skel
etal
sys
tem
Fig. 6.56. Complete rupture (acute) of the anterior talo�bular ligament (arrow) associated with �uid–debris (stars), with the remaining ligament stump adjacent to the �bula (dotted arrow)
978-9241548540-C006 PRF ml YVR ln ml ml-1-Final Proof.indd 449 6/10/13 10:30 AM
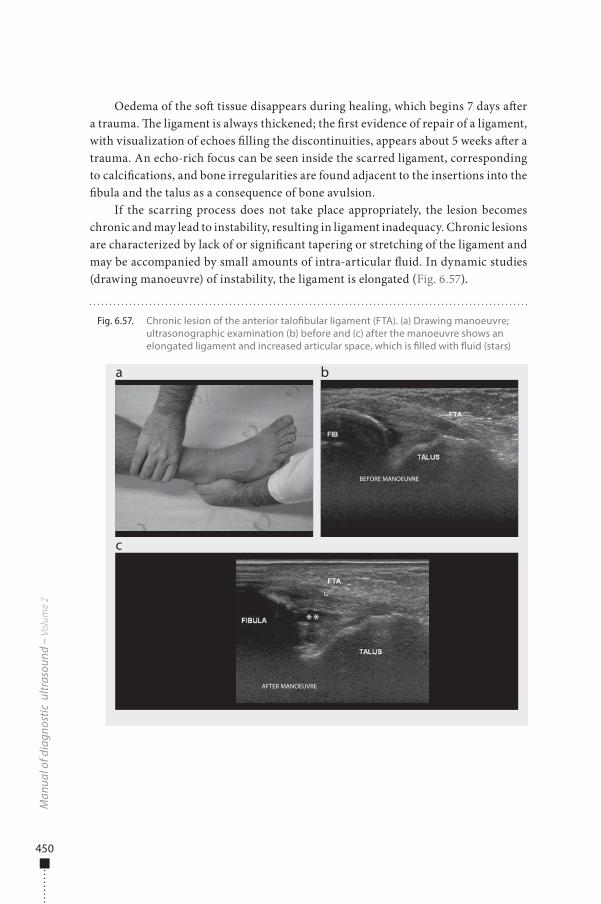
450
Oedema of the so� tissue disappears during healing, which begins 7 days a�er a trauma. �e ligament is always thickened; the �rst evidence of repair of a ligament, with visualization of echoes �lling the discontinuities, appears about 5 weeks a�er a trauma. An echo-rich focus can be seen inside the scarred ligament, corresponding to calci�cations, and bone irregularities are found adjacent to the insertions into the �bula and the talus as a consequence of bone avulsion.
If the scarring process does not take place appropriately, the lesion becomes chronic and may lead to instability, resulting in ligament inadequacy. Chronic lesions are characterized by lack of or signi�cant tapering or stretching of the ligament and may be accompanied by small amounts of intra-articular �uid. In dynamic studies (drawing manoeuvre) of instability, the ligament is elongated (Fig. 6.57).
Man
ual o
f dia
gnos
tic u
ltras
ound
– V
olum
e 2
Fig. 6.57. Chronic lesion of the anterior talo�bular ligament (FTA). (a) Drawing manoeuvre; ultrasonographic examination (b) before and (c) after the manoeuvre shows an elongated ligament and increased articular space, which is �lled with �uid (stars)
a
c
b
BEFORE MANOEUVRE
AFTER MANOEUVRE
**
978-9241548540-C006 PRF ml YVR ln ml ml-1-Final Proof.indd 450 6/10/13 10:30 AM
451
Muscle
Muscle is the largest individual mass of corporal tissue, corresponding to 40–45% of a person’s weight. It is classi�ed as elastic or nonelastic. Elastic muscle tissue is made up of muscle �bres joined into fascicles, which form the muscle. Nonelastic struc-tures are made up of muscle surrounded by sheaths formed by connective tissues and muscle fasciae. �e endomysium is an extensive network of capillaries and nerves involving all muscle �bres. Muscle �bres are bound into fascicles by perimysium, a �broadipose septum made up of vessels, nerves and conjunctive and fat tissue. �e epimysium, composed of dense conjunctive tissue, separates muscle venters and dif-ferent muscles, such as the semimembranosus and the femoral biceps in the posterior thigh. �e fascia is situated externally to the epimysium and contains a whole muscle.
Muscles may contain slow-twitch (type I) �bres rich in oxygen or fast-twitch (type II) �bres, with anaerobic metabolism. �e proportion of each type of �bre inside the muscle venter is determined genetically, by type of physical training and by the location, form and function of the muscle. Posture muscles have linearly arranged fascicles, a prevalence of type I �bres and many mitochondria, allowing sustained low-energy contraction. �e muscles in the super�cial areas of the extremities, usu-ally passing over more than one joint, have �bres with a pennate distribution and contain predominantly type II �bres. Muscles with these characteristics give more vigorous contractions and have a propensity to rupture.
Muscle contractions can be divided into isotonic and isometric. In isometric con-tractions, the length of the muscle �bre remains constant with changes in the applied load on the muscle. In isotonic contractions, the length of the muscle �bre changes, either shortening (concentric contraction) or lengthening (eccentric contraction). Usually, agonist muscles involved in a certain movement undergo concentric contraction due to the stability of the closest joint, which is determined by the eccentric contraction of the antagonist muscle, which is also responsible for slowing down the movement. �is occurs, for instance, during a kick, when the stability of the knee joint is maintained by contraction of the ischiotibials, so that the femoral quadriceps can execute the movement.
Muscle rupturesMuscle ruptures are secondary to direct or indirect trauma. Direct traumas, or con-tusions, involve compression of the muscle against a bone structure, so that the lesion is due to crushing. Indirect traumas are due to stretching of muscle �bres and can be generated by passive hyperextension of the fascicles, although they usually occur during eccentric contraction of the muscle.
�us, both morphological and functional factors increase the risk for muscle lesion, the main ones being passing over more than one joint, eccentric contraction, predominance of type II �bres (quick contraction) and a super�cial location at the extremities, mainly in the lower limbs. �e site of the lesion depends on age and physical condition and is due to biomechanical particularities that determine weaker
Mus
culo
skel
etal
sys
tem
978-9241548540-C006 PRF ml YVR ln ml ml-1-Final Proof.indd 451 6/10/13 10:30 AM
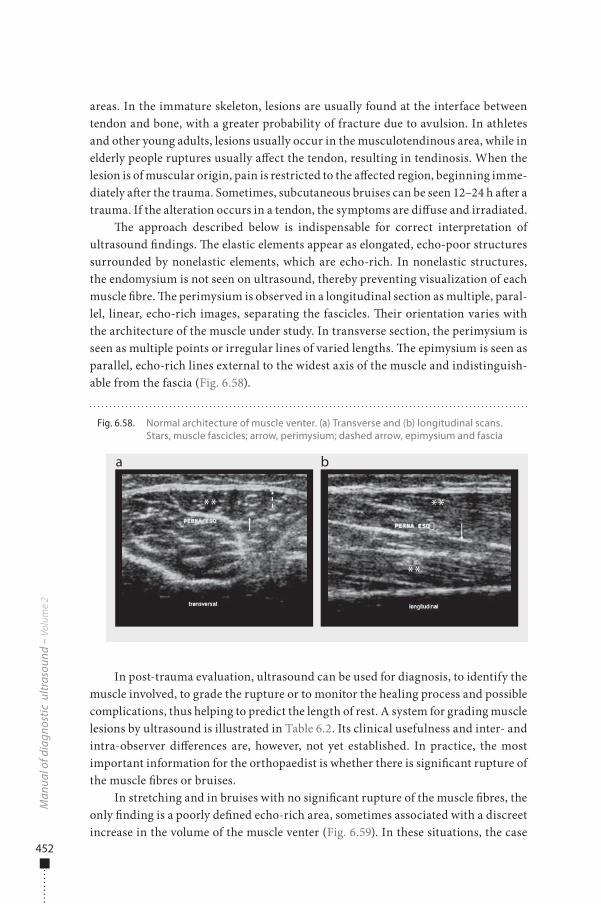
452
areas. In the immature skeleton, lesions are usually found at the interface between tendon and bone, with a greater probability of fracture due to avulsion. In athletes and other young adults, lesions usually occur in the musculotendinous area, while in elderly people ruptures usually a�ect the tendon, resulting in tendinosis. When the lesion is of muscular origin, pain is restricted to the a�ected region, beginning imme-diately a�er the trauma. Sometimes, subcutaneous bruises can be seen 12–24 h a�er a trauma. If the alteration occurs in a tendon, the symptoms are di�use and irradiated.
�e approach described below is indispensable for correct interpretation of ultrasound �ndings. �e elastic elements appear as elongated, echo-poor structures surrounded by nonelastic elements, which are echo-rich. In nonelastic structures, the endomysium is not seen on ultrasound, thereby preventing visualization of each muscle �bre. �e perimysium is observed in a longitudinal section as multiple, paral-lel, linear, echo-rich images, separating the fascicles. �eir orientation varies with the architecture of the muscle under study. In transverse section, the perimysium is seen as multiple points or irregular lines of varied lengths. �e epimysium is seen as parallel, echo-rich lines external to the widest axis of the muscle and indistinguish-able from the fascia (Fig. 6.58).
In post-trauma evaluation, ultrasound can be used for diagnosis, to identify the muscle involved, to grade the rupture or to monitor the healing process and possible complications, thus helping to predict the length of rest. A system for grading muscle lesions by ultrasound is illustrated in Table 6.2. Its clinical usefulness and inter- and intra-observer di�erences are, however, not yet established. In practice, the most important information for the orthopaedist is whether there is signi�cant rupture of the muscle �bres or bruises.
In stretching and in bruises with no signi�cant rupture of the muscle �bres, the only �nding is a poorly de�ned echo-rich area, sometimes associated with a discreet increase in the volume of the muscle venter (Fig. 6.59). In these situations, the case
Man
ual o
f dia
gnos
tic u
ltras
ound
– V
olum
e 2
Fig. 6.58. Normal architecture of muscle venter. (a) Transverse and (b) longitudinal scans. Stars, muscle fascicles; arrow, perimysium; dashed arrow, epimysium and fascia
a b
** **
**
978-9241548540-C006 PRF ml YVR ln ml ml-1-Final Proof.indd 452 6/10/13 10:30 AM
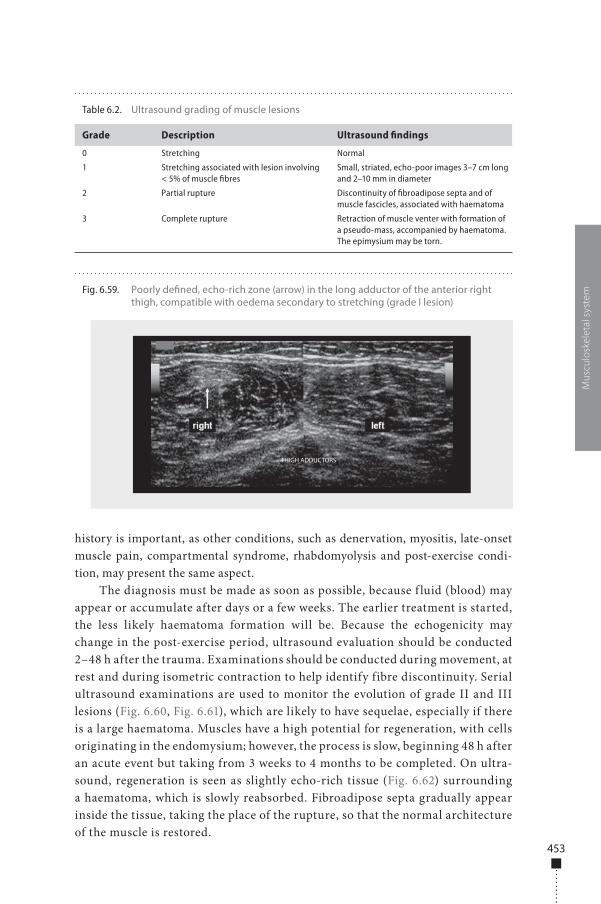
453
history is important, as other conditions, such as denervation, myositis, late-onset muscle pain, compartmental syndrome, rhabdomyolysis and post-exercise condi-tion, may present the same aspect.
The diagnosis must be made as soon as possible, because f luid (blood) may appear or accumulate after days or a few weeks. The earlier treatment is started, the less likely haematoma formation will be. Because the echogenicity may change in the post-exercise period, ultrasound evaluation should be conducted 2–48 h after the trauma. Examinations should be conducted during movement, at rest and during isometric contraction to help identify fibre discontinuity. Serial ultrasound examinations are used to monitor the evolution of grade II and III lesions (Fig. 6.60, Fig. 6.61), which are likely to have sequelae, especially if there is a large haematoma. Muscles have a high potential for regeneration, with cells originating in the endomysium; however, the process is slow, beginning 48 h after an acute event but taking from 3 weeks to 4 months to be completed. On ultra-sound, regeneration is seen as slightly echo-rich tissue (Fig. 6.62) surrounding a haematoma, which is slowly reabsorbed. Fibroadipose septa gradually appear inside the tissue, taking the place of the rupture, so that the normal architecture of the muscle is restored.
Mus
culo
skel
etal
sys
temFig. 6.59. Poorly de�ned, echo-rich zone (arrow) in the long adductor of the anterior right
thigh, compatible with oedema secondary to stretching (grade I lesion)
THIGH ADDUCTORS
Table 6.2. Ultrasound grading of muscle lesions
Grade Description Ultrasound findings
0 Stretching Normal
1 Stretching associated with lesion involving < 5% of muscle fibres
Small, striated, echo-poor images 3–7 cm long and 2–10 mm in diameter
2 Partial rupture Discontinuity of fibroadipose septa and of muscle fascicles, associated with haematoma
3 Complete rupture Retraction of muscle venter with formation of a pseudo-mass, accompanied by haematoma. The epimysium may be torn.
978-9241548540-C006 PRF ml YVR ln ml ml-1-Final Proof.indd 453 6/10/13 10:30 AM
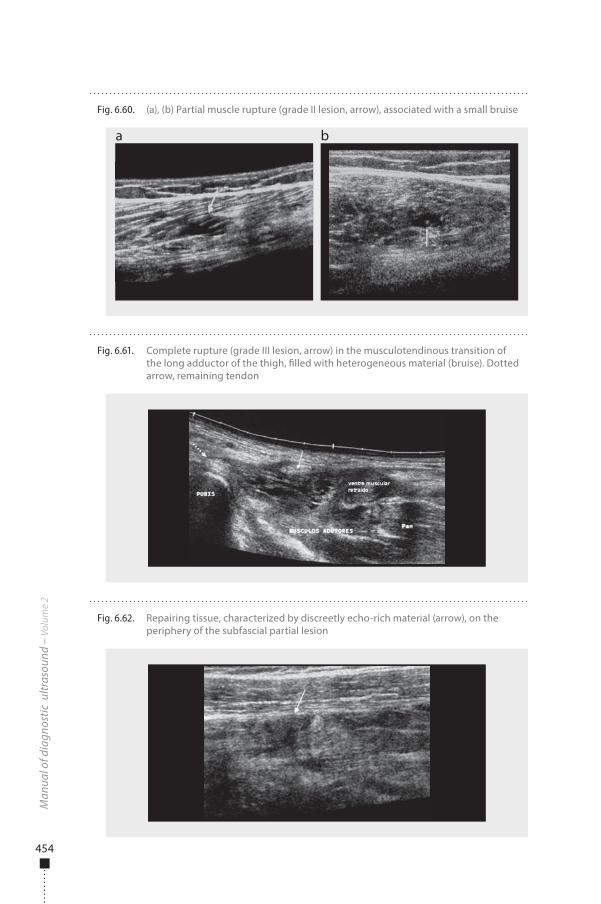
454
Man
ual o
f dia
gnos
tic u
ltras
ound
– V
olum
e 2
Fig. 6.60. (a), (b) Partial muscle rupture (grade II lesion, arrow), associated with a small bruise
a b
Fig. 6.61. Complete rupture (grade III lesion, arrow) in the musculotendinous transition of the long adductor of the thigh, �lled with heterogeneous material (bruise). Dotted arrow, remaining tendon
Fig. 6.62. Repairing tissue, characterized by discreetly echo-rich material (arrow), on the periphery of the subfascial partial lesion
978-9241548540-C006 PRF ml YVR ln ml ml-1-Final Proof.indd 454 6/10/13 10:30 AM
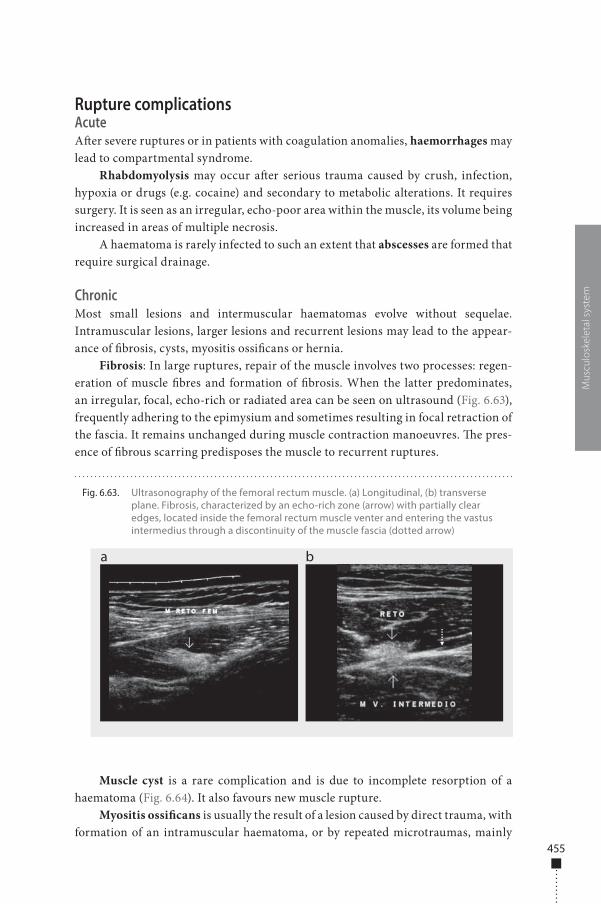
455
Rupture complicationsAcuteA�er severe ruptures or in patients with coagulation anomalies, haemorrhages may lead to compartmental syndrome.
Rhabdomyolysis may occur a�er serious trauma caused by crush, infection, hypoxia or drugs (e.g. cocaine) and secondary to metabolic alterations. It requires surgery. It is seen as an irregular, echo-poor area within the muscle, its volume being increased in areas of multiple necrosis.
A haematoma is rarely infected to such an extent that abscesses are formed that require surgical drainage.
ChronicMost small lesions and intermuscular haematomas evolve without sequelae. Intramuscular lesions, larger lesions and recurrent lesions may lead to the appear-ance of �brosis, cysts, myositis ossi�cans or hernia.
Fibrosis: In large ruptures, repair of the muscle involves two processes: regen-eration of muscle �bres and formation of �brosis. When the latter predominates, an irregular, focal, echo-rich or radiated area can be seen on ultrasound (Fig. 6.63), frequently adhering to the epimysium and sometimes resulting in focal retraction of the fascia. It remains unchanged during muscle contraction manoeuvres. �e pres-ence of �brous scarring predisposes the muscle to recurrent ruptures.
Muscle cyst is a rare complication and is due to incomplete resorption of a haematoma (Fig. 6.64). It also favours new muscle rupture.
Myositis ossi�cans is usually the result of a lesion caused by direct trauma, with formation of an intramuscular haematoma, or by repeated microtraumas, mainly
Mus
culo
skel
etal
sys
tem
Fig. 6.63. Ultrasonography of the femoral rectum muscle. (a) Longitudinal, (b) transverse plane. Fibrosis, characterized by an echo-rich zone (arrow) with partially clear edges, located inside the femoral rectum muscle venter and entering the vastus intermedius through a discontinuity of the muscle fascia (dotted arrow)
a b
978-9241548540-C006 PRF ml YVR ln ml ml-1-Final Proof.indd 455 6/10/13 10:30 AM
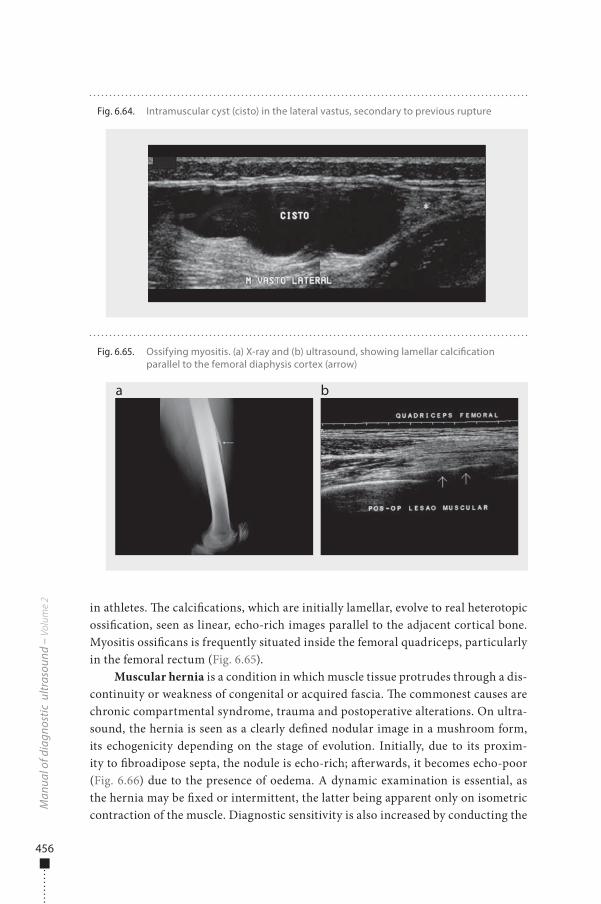
456
in athletes. �e calci�cations, which are initially lamellar, evolve to real heterotopic ossi�cation, seen as linear, echo-rich images parallel to the adjacent cortical bone. Myositis ossi�cans is frequently situated inside the femoral quadriceps, particularly in the femoral rectum (Fig. 6.65).
Muscular hernia is a condition in which muscle tissue protrudes through a dis-continuity or weakness of congenital or acquired fascia. �e commonest causes are chronic compartmental syndrome, trauma and postoperative alterations. On ultra-sound, the hernia is seen as a clearly de�ned nodular image in a mushroom form, its echogenicity depending on the stage of evolution. Initially, due to its proxim-ity to �broadipose septa, the nodule is echo-rich; a�erwards, it becomes echo-poor (Fig. 6.66) due to the presence of oedema. A dynamic examination is essential, as the hernia may be �xed or intermittent, the latter being apparent only on isometric contraction of the muscle. Diagnostic sensitivity is also increased by conducting the
Man
ual o
f dia
gnos
tic u
ltras
ound
– V
olum
e 2
Fig. 6.64. Intramuscular cyst (cisto) in the lateral vastus, secondary to previous rupture
Fig. 6.65. Ossifying myositis. (a) X-ray and (b) ultrasound, showing lamellar calci�cation parallel to the femoral diaphysis cortex (arrow)
a b
978-9241548540-C006 PRF ml YVR ln ml ml-1-Final Proof.indd 456 6/10/13 10:30 AM
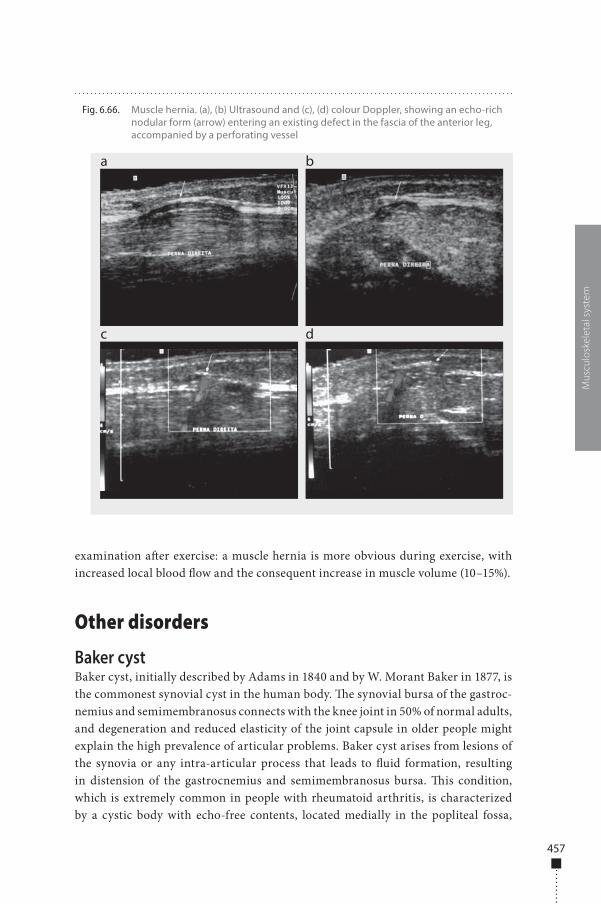
457
examination a�er exercise: a muscle hernia is more obvious during exercise, with increased local blood �ow and the consequent increase in muscle volume (10–15%).
Other disorders
Baker cystBaker cyst, initially described by Adams in 1840 and by W. Morant Baker in 1877, is the commonest synovial cyst in the human body. �e synovial bursa of the gastroc-nemius and semimembranosus connects with the knee joint in 50% of normal adults, and degeneration and reduced elasticity of the joint capsule in older people might explain the high prevalence of articular problems. Baker cyst arises from lesions of the synovia or any intra-articular process that leads to �uid formation, resulting in distension of the gastrocnemius and semimembranosus bursa. �is condition, which is extremely common in people with rheumatoid arthritis, is characterized by a cystic body with echo-free contents, located medially in the popliteal fossa,
Mus
culo
skel
etal
sys
tem
Fig. 6.66. Muscle hernia. (a), (b) Ultrasound and (c), (d) colour Doppler, showing an echo-rich nodular form (arrow) entering an existing defect in the fascia of the anterior leg, accompanied by a perforating vessel
a
c
b
d
978-9241548540-C006 PRF ml YVR ln ml ml-1-Final Proof.indd 457 6/10/13 10:30 AM
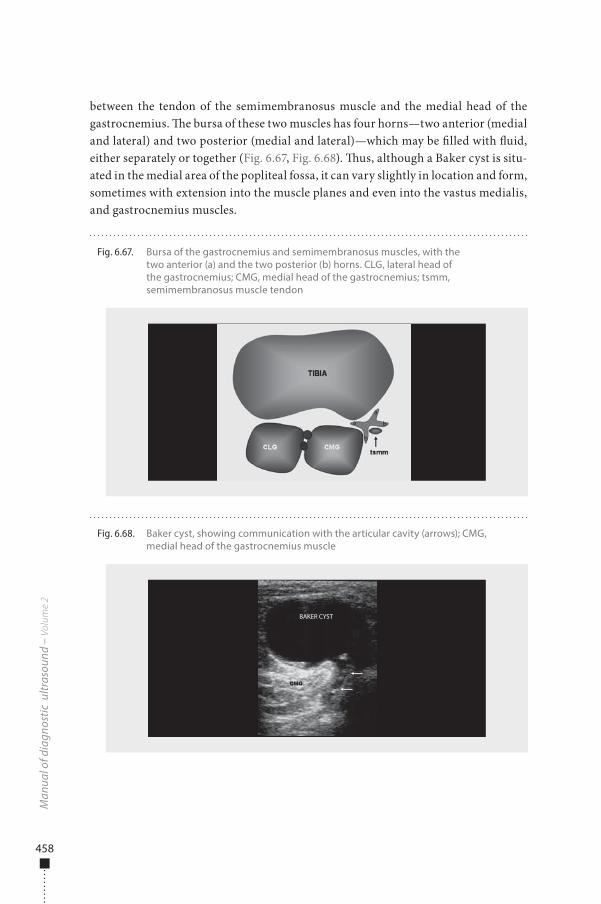
458
between the tendon of the semimembranosus muscle and the medial head of the gastrocnemius. �e bursa of these two muscles has four horns—two anterior (medial and lateral) and two posterior (medial and lateral)—which may be �lled with �uid, either separately or together (Fig. 6.67, Fig. 6.68). �us, although a Baker cyst is situ-ated in the medial area of the popliteal fossa, it can vary slightly in location and form, sometimes with extension into the muscle planes and even into the vastus medialis, and gastrocnemius muscles.
Man
ual o
f dia
gnos
tic u
ltras
ound
– V
olum
e 2
Fig. 6.67. Bursa of the gastrocnemius and semimembranosus muscles, with the two anterior (a) and the two posterior (b) horns. CLG, lateral head of the gastrocnemius; CMG, medial head of the gastrocnemius; tsmm, semimembranosus muscle tendon
a
a
b
b
Fig. 6.68. Baker cyst, showing communication with the articular cavity (arrows); CMG, medial head of the gastrocnemius muscle
BAKER CYST
978-9241548540-C006 PRF ml YVR ln ml ml-1-Final Proof.indd 458 6/10/13 10:30 AM
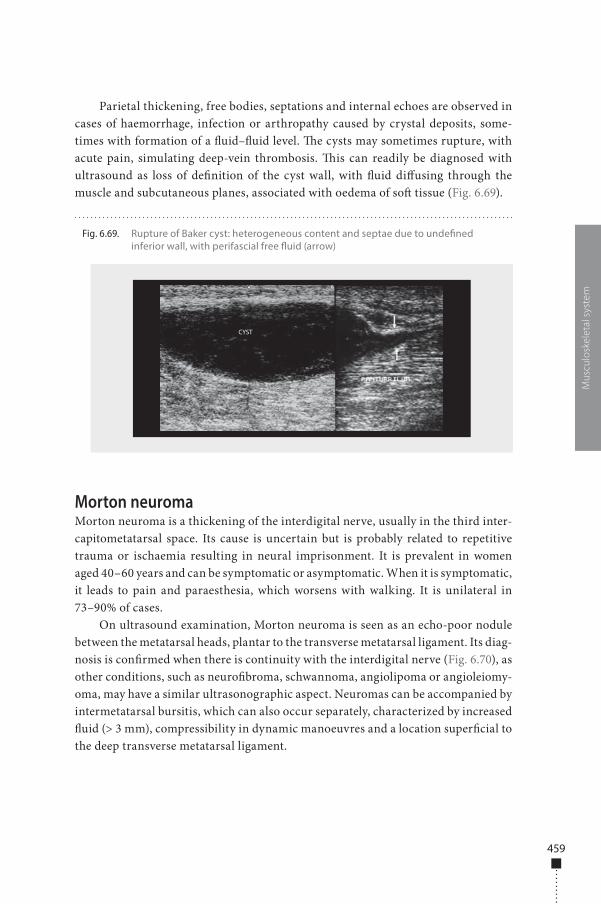
459
Parietal thickening, free bodies, septations and internal echoes are observed in cases of haemorrhage, infection or arthropathy caused by crystal deposits, some-times with formation of a �uid–�uid level. �e cysts may sometimes rupture, with acute pain, simulating deep-vein thrombosis. �is can readily be diagnosed with ultrasound as loss of de�nition of the cyst wall, with �uid di�using through the muscle and subcutaneous planes, associated with oedema of so� tissue (Fig. 6.69).
Morton neuromaMorton neuroma is a thickening of the interdigital nerve, usually in the third inter-capitometatarsal space. Its cause is uncertain but is probably related to repetitive trauma or ischaemia resulting in neural imprisonment. It is prevalent in women aged 40–60 years and can be symptomatic or asymptomatic. When it is symptomatic, it leads to pain and paraesthesia, which worsens with walking. It is unilateral in 73–90% of cases.
On ultrasound examination, Morton neuroma is seen as an echo-poor nodule between the metatarsal heads, plantar to the transverse metatarsal ligament. Its diag-nosis is con�rmed when there is continuity with the interdigital nerve (Fig. 6.70), as other conditions, such as neuro�broma, schwannoma, angiolipoma or angioleiomy-oma, may have a similar ultrasonographic aspect. Neuromas can be accompanied by intermetatarsal bursitis, which can also occur separately, characterized by increased �uid (> 3 mm), compressibility in dynamic manoeuvres and a location super�cial to the deep transverse metatarsal ligament.
Mus
culo
skel
etal
sys
tem
Fig. 6.69. Rupture of Baker cyst: heterogeneous content and septae due to unde�ned inferior wall, with perifascial free �uid (arrow)
CYST
978-9241548540-C006 PRF ml YVR ln ml ml-1-Final Proof.indd 459 6/10/13 10:30 AM
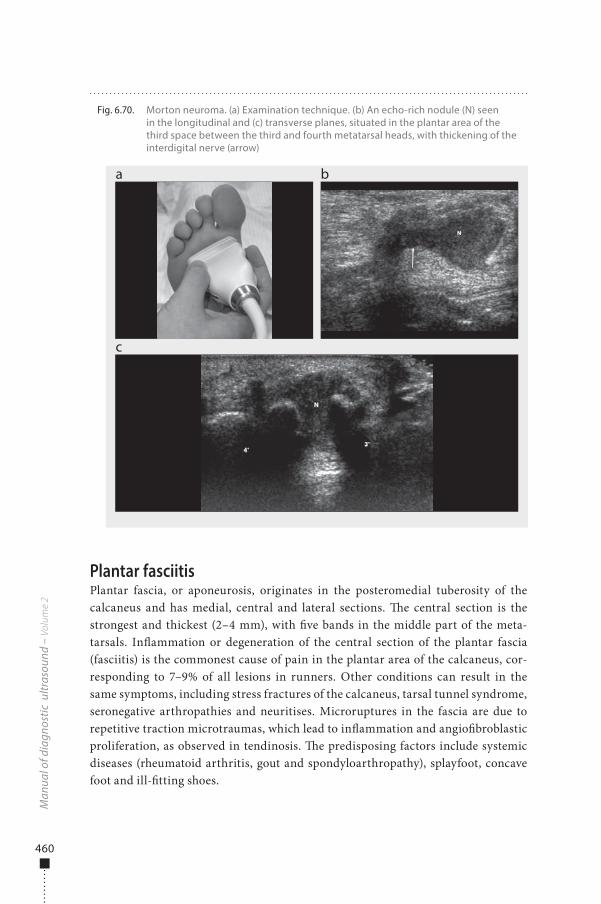
460
Plantar fasciitisPlantar fascia, or aponeurosis, originates in the posteromedial tuberosity of the calcaneus and has medial, central and lateral sections. �e central section is the strongest and thickest (2–4 mm), with �ve bands in the middle part of the meta-tarsals. In�ammation or degeneration of the central section of the plantar fascia (fasciitis) is the commonest cause of pain in the plantar area of the calcaneus, cor-responding to 7–9% of all lesions in runners. Other conditions can result in the same symptoms, including stress fractures of the calcaneus, tarsal tunnel syndrome, seronegative arthropathies and neuritises. Microruptures in the fascia are due to repetitive traction microtraumas, which lead to in�ammation and angio�broblastic proliferation, as observed in tendinosis. �e predisposing factors include systemic diseases (rheumatoid arthritis, gout and spondyloarthropathy), splayfoot, concave foot and ill-�tting shoes.
Man
ual o
f dia
gnos
tic u
ltras
ound
– V
olum
e 2
Fig. 6.70. Morton neuroma. (a) Examination technique. (b) An echo-rich nodule (N) seen in the longitudinal and (c) transverse planes, situated in the plantar area of the third space between the third and fourth metatarsal heads, with thickening of the interdigital nerve (arrow)
a
c
b
978-9241548540-C006 PRF ml YVR ln ml ml-1-Final Proof.indd 460 6/10/13 10:30 AM
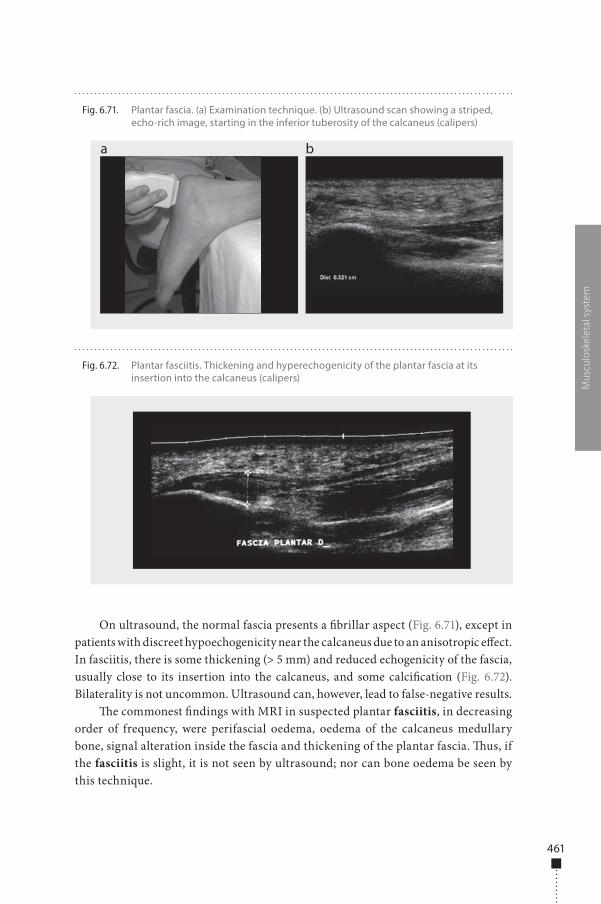
461
On ultrasound, the normal fascia presents a �brillar aspect (Fig. 6.71), except in patients with discreet hypoechogenicity near the calcaneus due to an anisotropic e�ect. In fasciitis, there is some thickening (> 5 mm) and reduced echogenicity of the fascia, usually close to its insertion into the calcaneus, and some calci�cation (Fig. 6.72). Bilaterality is not uncommon. Ultrasound can, however, lead to false-negative results.
�e commonest �ndings with MRI in suspected plantar fasciitis, in decreasing order of frequency, were perifascial oedema, oedema of the calcaneus medullary bone, signal alteration inside the fascia and thickening of the plantar fascia. �us, if the fasciitis is slight, it is not seen by ultrasound; nor can bone oedema be seen by this technique.
Mus
culo
skel
etal
sys
tem
Fig. 6.71. Plantar fascia. (a) Examination technique. (b) Ultrasound scan showing a striped, echo-rich image, starting in the inferior tuberosity of the calcaneus (calipers)
a b
Fig. 6.72. Plantar fasciitis. Thickening and hyperechogenicity of the plantar fascia at its insertion into the calcaneus (calipers)
978-9241548540-C006 PRF ml YVR ln ml ml-1-Final Proof.indd 461 6/10/13 10:30 AM
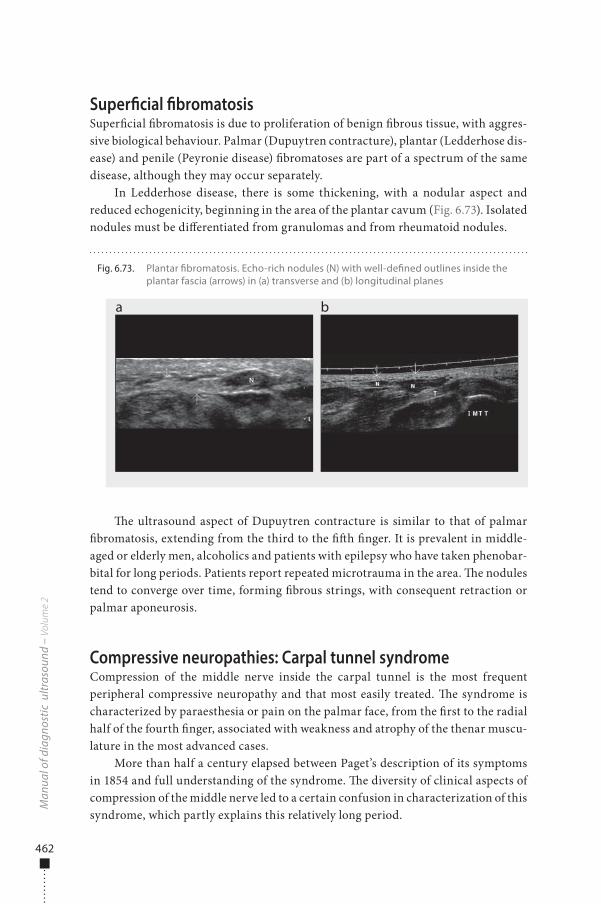
462
Super�cial �bromatosisSuper�cial �bromatosis is due to proliferation of benign �brous tissue, with aggres-sive biological behaviour. Palmar (Dupuytren contracture), plantar (Ledderhose dis-ease) and penile (Peyronie disease) �bromatoses are part of a spectrum of the same disease, although they may occur separately.
In Ledderhose disease, there is some thickening, with a nodular aspect and reduced echogenicity, beginning in the area of the plantar cavum (Fig. 6.73). Isolated nodules must be di�erentiated from granulomas and from rheumatoid nodules.
�e ultrasound aspect of Dupuytren contracture is similar to that of palmar �bromatosis, extending from the third to the ��h �nger. It is prevalent in middle-aged or elderly men, alcoholics and patients with epilepsy who have taken phenobar-bital for long periods. Patients report repeated microtrauma in the area. �e nodules tend to converge over time, forming �brous strings, with consequent retraction or palmar aponeurosis.
Compressive neuropathies: Carpal tunnel syndromeCompression of the middle nerve inside the carpal tunnel is the most frequent peripheral compressive neuropathy and that most easily treated. �e syndrome is characterized by paraesthesia or pain on the palmar face, from the �rst to the radial half of the fourth �nger, associated with weakness and atrophy of the thenar muscu-lature in the most advanced cases.
More than half a century elapsed between Paget’s description of its symptoms in 1854 and full understanding of the syndrome. �e diversity of clinical aspects of compression of the middle nerve led to a certain confusion in characterization of this syndrome, which partly explains this relatively long period.
Man
ual o
f dia
gnos
tic u
ltras
ound
– V
olum
e 2
Fig. 6.73. Plantar �bromatosis. Echo-rich nodules (N) with well-de�ned outlines inside the plantar fascia (arrows) in (a) transverse and (b) longitudinal planes
a b
978-9241548540-C006 PRF ml YVR ln ml ml-1-Final Proof.indd 462 6/10/13 10:30 AM
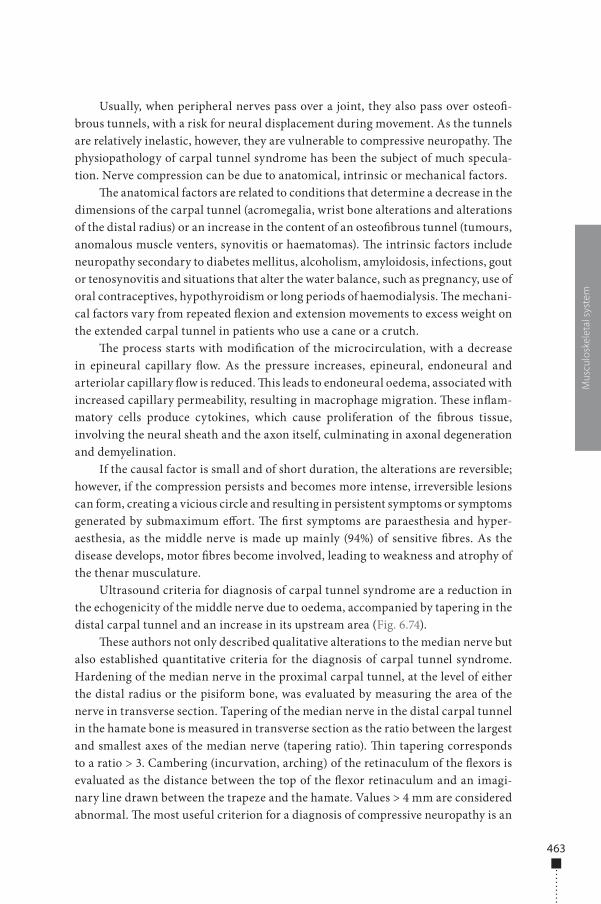
463
Mus
culo
skel
etal
sys
tem
Usually, when peripheral nerves pass over a joint, they also pass over osteo�-brous tunnels, with a risk for neural displacement during movement. As the tunnels are relatively inelastic, however, they are vulnerable to compressive neuropathy. �e physiopathology of carpal tunnel syndrome has been the subject of much specula-tion. Nerve compression can be due to anatomical, intrinsic or mechanical factors.
�e anatomical factors are related to conditions that determine a decrease in the dimensions of the carpal tunnel (acromegalia, wrist bone alterations and alterations of the distal radius) or an increase in the content of an osteo�brous tunnel (tumours, anomalous muscle venters, synovitis or haematomas). �e intrinsic factors include neuropathy secondary to diabetes mellitus, alcoholism, amyloidosis, infections, gout or tenosynovitis and situations that alter the water balance, such as pregnancy, use of oral contraceptives, hypothyroidism or long periods of haemodialysis. �e mechani-cal factors vary from repeated �exion and extension movements to excess weight on the extended carpal tunnel in patients who use a cane or a crutch.
�e process starts with modi�cation of the microcirculation, with a decrease in epineural capillary �ow. As the pressure increases, epineural, endoneural and arteriolar capillary �ow is reduced. �is leads to endoneural oedema, associated with increased capillary permeability, resulting in macrophage migration. �ese in�am-matory cells produce cytokines, which cause proliferation of the �brous tissue, involving the neural sheath and the axon itself, culminating in axonal degeneration and demyelination.
If the causal factor is small and of short duration, the alterations are reversible; however, if the compression persists and becomes more intense, irreversible lesions can form, creating a vicious circle and resulting in persistent symptoms or symptoms generated by submaximum e�ort. �e �rst symptoms are paraesthesia and hyper-aesthesia, as the middle nerve is made up mainly (94%) of sensitive �bres. As the disease develops, motor �bres become involved, leading to weakness and atrophy of the thenar musculature.
Ultrasound criteria for diagnosis of carpal tunnel syndrome are a reduction in the echogenicity of the middle nerve due to oedema, accompanied by tapering in the distal carpal tunnel and an increase in its upstream area (Fig. 6.74).
�ese authors not only described qualitative alterations to the median nerve but also established quantitative criteria for the diagnosis of carpal tunnel syndrome. Hardening of the median nerve in the proximal carpal tunnel, at the level of either the distal radius or the pisiform bone, was evaluated by measuring the area of the nerve in transverse section. Tapering of the median nerve in the distal carpal tunnel in the hamate bone is measured in transverse section as the ratio between the largest and smallest axes of the median nerve (tapering ratio). �in tapering corresponds to a ratio > 3. Cambering (incurvation, arching) of the retinaculum of the �exors is evaluated as the distance between the top of the �exor retinaculum and an imagi-nary line drawn between the trapeze and the hamate. Values > 4 mm are considered abnormal. �e most useful criterion for a diagnosis of compressive neuropathy is an
978-9241548540-C006 PRF ml YVR ln ml ml-1-Final Proof.indd 463 6/10/13 10:30 AM
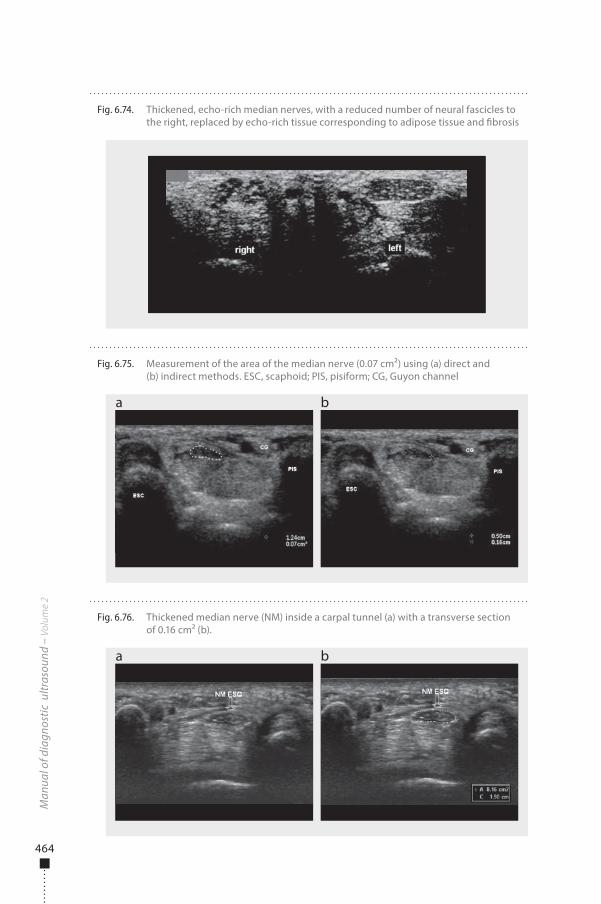
464
Man
ual o
f dia
gnos
tic u
ltras
ound
– V
olum
e 2
Fig. 6.74. Thickened, echo-rich median nerves, with a reduced number of neural fascicles to the right, replaced by echo-rich tissue corresponding to adipose tissue and �brosis
Fig. 6.75. Measurement of the area of the median nerve (0.07 cm²) using (a) direct and (b) indirect methods. ESC, scaphoid; PIS, pisiform; CG, Guyon channel
a b
Fig. 6.76. Thickened median nerve (NM) inside a carpal tunnel (a) with a transverse section of 0.16 cm² (b).
a b
978-9241548540-C006 PRF ml YVR ln ml ml-1-Final Proof.indd 464 6/10/13 10:30 AM
465
Mus
culo
skel
etal
sys
tem
increase in the cross-sectional area of the median nerve. Distal tapering of the nerve and incurvation of the retinaculum of the �exors showed poor reproducibility in subsequent studies.
�e cross-sectional area of the median nerve can be measured either indirectly or directly. In the indirect method, the formula for the area of the ellipse [p(D1 × D2) / 4] is used, in which D1 and D2 represent the transverse and anteroposterior diameters of the median nerve (Fig. 6.75 a). In the direct method, the area is calculated by ultrasound, from a continuous trace around the nerve (Fig. 6.75 b). Regardless of the method used, the neural sheath must always be excluded from the measure.
�e cut-o� point of the cross-sectional area for di�erentiating between normal and thickened nerves has been the subject of controversy in the literature, sugges-tions varying from 9 to 15 mm2. �is wide variation is due to the use of di�erent equipment, inclusion of people of both sexes in the same study, studies of people of di�erent ages, di�erent severity of disease and imprecise measurement area. Each unit should establish its own value on the basis of the population being studied. For women, we have adopted cross-sectional area cut-o� points of 9 mm2 measured by the indirect and 10 mm2 measured by the direct method (Fig. 6.76).
978-9241548540-C006 PRF ml YVR ln ml ml-1-Final Proof.indd 465 6/10/13 10:30 AM

978-9241548540-C006 PRF ml YVR ln ml ml-1-Final Proof.indd 466 6/10/13 10:30 AM
467
Recommended reading
Safety of diagnostic ultrasound
• AbramowiczJSetal.Fetalthermaleffectsofdiagnosticultrasound.AmericanInstituteofUltrasoundinMedicine.
Journal of Ultrasound in Medicine,2008,27:541-559.PMID:18359908
• BarnettSB.Safeuseofultrasoundcontrastagents.Ultrasound in Medicine & Biology,2007,33:171-172.doi:10.1016/j.
ultrasmedbio.2006.07.001PMID:17239523
• Basic physics of ultrasonographic imaging.Geneva,WorldHealthOrganization,2005.
• BioeffectsCommitteeoftheAmericanInstituteofUltrasoundinMedicineAmericanInstituteofUltrasoundinMedicine
consensusreportonpotentialbioeffectsofdiagnosticultrasound:executivesummary.Journal of Diagnostic Medical
Sonography,2011,27:3-13.doi:10.1177/8756479310394986
• BlyS,VandenHofMC.Obstetricultrasoundbiologicaleffectsandsafety,SOGCClinicalPracticeGuidelines.Journal of
Obstetrics and Gynaecology Canada,2005,27:572-580.PMID:16100635
• ClaudonMetal.Guidelinesandgoodclinicalpracticerecommendationsforcontrast-enhancedultrasound(CEUS)
–update2008.Ultraschall in der Medizin (Stuttgart, Germany : 1980),2008,29:28-44.doi:10.1055/s-2007-963785
PMID:18270887
• DuckFA.Hazards,risksandsafetyofdiagnosticultrasound.Medical Engineering & Physics,2008,30:1338-1348.
doi:10.1016/j.medengphy.2008.06.002PMID:18635388
• FowlkesJB.AmericanInstituteofUltrasoundinMedicineconsensusreportonpotentialbioeffectsofdiagnostic
ultrasound:executivesummary.Journal of Ultrasound in Medicine,2008,27:503-515.PMID:18359906
• Guidelines for the safe use of diagnostic ultrasound equipment.London,BritishMedicalUltrasoundSociety,2009.http://
www.bmus.org/policies-guides/BMUS-Safety-Guidelines-2009-revision-FINAL-Nov-2009.pdf
• Manual of diagnostic ultrasound.Geneva,WorldHealthOrganization,1995.
• Effectsofultrasoundandinfrasoundrelevanttohumanhealth.Progress in Biophysics and Molecular Biology,
2007,93:1-420.
• StratmeyerMEetal.Fetalultrasound:mechanicaleffects,AmericanInstituteofUltrasoundinMedicine.Journal of
Ultrasound in Medicine,2008,27:597-605.PMID:18359910
• WhitworthM,BrickerL,NeilsonJPetal.Routinecomparedwithselectiveultrasoundinearlypregnancy.Cochrane
Summaries,14April2010.
978-9241548540-Recommended -Final Proof.indd 467 6/10/13 10:29 AM
468
Obstetrics
• AcharyaGetal.Referencerangesforserialmeasurementsofbloodvelocityandpulsatilityindexattheintra-abdominal
portion,andfetalandplacentalendsoftheumbilicalartery.Ultrasound in Obstetrics & Gynecology,2005,26:162-169.
doi:10.1002/uog.1902PMID:15883983
• AmericanCollegeofObstetriciansandGynecologistsACOGPracticeBulletinNo.101:Ultrasonographyinpregnancy.
Obstetrics and Gynecology,2009,113:451-461.PMID:19155920
• ArduiniD,RizzoG.Predictionoffetaloutcomeinsmallforgestationalagefetuses:comparisonofDopplermeasure-
mentsobtainedfromdifferentfetalvessels.Journal of Perinatal Medicine,1992,20:29-38.doi:10.1515/jpme.1992.20.1.29
PMID:1608021
• BenacerrafB.Ultrasound of fetal syndromes.Philadelphia,ChurchillLivingstone,2007
• BenacerrafBR.Thehistoryofthesecond-trimestersonographicmarkersfordetectingfetalDownsyndrome,andtheir
currentroleinobstetricpractice.Prenatal Diagnosis,2010,30:644-652.doi:10.1002/pd.2531PMID:20572106
• BerghellaVetal.Cerclageforshortcervixonultrasonography:meta-analysisoftrialsusingindividualpatient-leveldata.
Obstetrics and Gynecology,2005,106:181-189.doi:10.1097/01.AOG.0000168435.17200.53PMID:15994635
• BerghellaV,BegaG.Ultrasoundevaluationofthecervix.In:CallenPW,ed..Ultrasonography in obstetrics and gynecology,
5thed.Philadelphia,Saunders-Elsevier,2008:698–720
• BirnholzJC.Analgorithmicapproachtoaccurateultrasonicfetalweightestimation.Investigative Radiology,1986,21:571-
576.doi:10.1097/00004424-198607000-00010PMID:3525451
• BrickerL,NeilsonJP,DowswellT.Routineultrasoundinlatepregnancy(after24weeks’gestation).Cochrane Database of
Systematic Reviews,2008,4:CD001451-doi:10.1002/14651858.CD001451.pub3
• CallenPW.Ultrasonography in obstetrics and gynecology,5thed.Philadelphia,Saunders-Elsevier,2008
• CampbellS,ThomsA.Ultrasoundmeasurementofthefetalheadtoabdomencircumferenceratiointheassessment
ofgrowthretardation.British Journal of Obstetrics and Gynaecology,1977,84:165-174.doi:10.1111/j.1471-0528.1977.
tb12550.xPMID:843490
• CampbellS,WilkinD.Ultrasonicmeasurementoffetalabdomencircumferenceintheestimationoffetalweight.British
Journal of Obstetrics and Gynaecology,1975,82:689-697.doi:10.1111/j.1471-0528.1975.tb00708.xPMID:1101942
• ChamberlainPFetal.Ultrasoundevaluationofamnioticfluidvolume.I.Therelationshipofmarginalanddecreased
amnioticfluidvolumestoperinataloutcome.American Journal of Obstetrics and Gynecology,1984,150:245-249.
PMID:6385713
• ChenMetal.Ultrasoundscreeningforfetalstructuralabnormalitiesperformedbytrainedmidwivesinthesecond
trimesterinalow-riskpopulation–anappraisal.Acta Obstetricia et Gynecologica Scandinavica,2009,88:713-719.
doi:10.1080/00016340902934688PMID:19412800
• DigheMetal.Sonographyinfirsttrimesterbleeding.Journal of Clinical Ultrasound,2008,36:352-366.doi:10.1002/
jcu.20451PMID:18335508
978-9241548540-Recommended -Final Proof.indd 468 6/10/13 10:29 AM
469
• Eik-NesSH.The18-weekfetalexaminationanddetectionofanomalies.Prenatal Diagnosis,2010,30:624-630.
doi:10.1002/pd.2576PMID:20572118
• Eik-NesSH,GrøttumP.Estimationoffetalweightbyultrasoundmeasurement.I.Developmentofanewformula.Acta
Obstetricia et Gynecologica Scandinavica,1982,61:299-305.PMID:7148403
• Eik-NesSH,GrøttumP,AnderssonNJ.Predictionoffetalgrowthdeviationbyultrasonicbiometry:I.Methodology.Acta
Obstetricia et Gynecologica Scandinavica,1982,61:307-312.doi:10.3109/00016348209156952PMID:7148404
• HadlockFPetal.Sonographicestimationoffetalweight.Thevalueoffemurlengthinadditiontoheadandabdomen
measurements.Radiology,1984,150:535-540.PMID:6691115
• HadlockFPetal.Estimationoffetalweightwiththeuseofhead,body,andfemurmeasurements–aprospectivestudy.
American Journal of Obstetrics and Gynecology,1985,151:333-337.PMID:3881966
• HarmanCR,BaschatAA.ArterialandvenousDopplersinIUGR.Clinical Obstetrics and Gynecology,2003,46:931-946.
doi:10.1097/00003081-200312000-00025PMID:14595236
• HillLM,BreckleR,GehrkingWC,O’BrienPC.Useoffemurlengthinestimationoffetalweight.American Journal of
Obstetrics and Gynecology,1985,152:847-852.PMID:3895952
• InternationalSocietyofUltrasoundinObstetrics&GynecologyCardiacscreeningexaminationofthefetus:guidelinesfor
performingthe‘basic’and‘extendedbasic’cardiacscan.Ultrasound in Obstetrics & Gynecology: the official journal of the
International Society of Ultrasound in Obstetrics and Gynecology,2006,27:107-113.PMID:16374757
• InternationalSocietyofUltrasoundinObstetrics&GynecologyEducationCommitteeSonographicexaminationof
thefetalcentralnervoussystem:guidelinesforperformingthe‘basicexamination’andthe‘fetalneurosonogram’.
Ultrasound in Obstetrics & Gynecology: the official journal of the International Society of Ultrasound in Obstetrics and
Gynecology,2007,29:109-116.doi:10.1002/uog.3909PMID:17200992
• NicolaidesKH,RizzoG,HecherK.Placental and fetal Doppler.Nashville,ParthenonPublishingEd.,2000
• NzehDA,RimmerS,MooreWMO,HuntL.Predictionofbirthweightbyfetalultrasoundbiometry.The British Journal of
Radiology,1992,65:987-989.doi:10.1259/0007-1285-65-779-987PMID:1450836
• OttWJ,DoyleS,FlammS.Accurateultrasonicestimationoffetalweight.Effectofheadshape,growthpatterns,and
amnioticfluidvolume.American Journal of Perinatology,1986,3:193-197.doi:10.1055/s-2007-999866PMID:3718640
• Practice guidelines for the performance of obstetric ultrasound examination.AmericanInstituteforUltrasoundinMedicine
(AIUM),2007.www.aium.org
• RoseBI,McCallumWD.Asimplifiedmethodforestimatingfetalweightusingultrasoundmeasurements.Obstetrics and
Gynecology,1987,69:671-675.PMID:3547218
• RumackCM,WilsonSR,CharboneauJW,JohnsonJAM.Diagnostic ultrasound.StLouis,Elsevier-Mosby,2005
• SabbaghaRE,MinogueJ,TamuraRK,HungerfordSA.Estimationofbirthweightbyuseofultrasonographicformulas
targetedtolarge-,appropriate-,andsmall-for-gestational-agefetuses.American Journal of Obstetrics and Gynecology,
1989,160:854-860,discussion860–862.PMID:2653039
978-9241548540-Recommended -Final Proof.indd 469 6/10/13 10:29 AM
470
• SalomonLJetal.InternationalSocietyofUltrasoundinObstetrics&Gynecology(ISUOG).Practiceguidelinesforper-
formanceoftheroutinemid-trimesterfetalultrasound.Ultrasound in Obstetrics & Gynecology: the official journal of the
International Society of Ultrasound in Obstetrics and Gynecology,2011,37:116-126.doi:10.1002/uog.8831PMID:20842655
• ShepardMJetal.Anevaluationoftwoequationsforpredictingfetalweightbyultrasound.American Journal of
Obstetrics and Gynecology,1982,142:47-54.PMID:7055171
• VintzileosAMetal.Fetalweightestimationformulaswithhead,abdominal,femur,andthighcircumferencemeasure-
ments.American Journal of Obstetrics and Gynecology,1987,157:410-414.PMID:3618691
• WarsofSL,GohariP,BerkowitzRL,HobbinsJC.Theestimationoffetalweightbycomputer-assistedanalysis.American
Journal of Obstetrics and Gynecology,1977,128:881-892.PMID:888868
Gynaecology
• CallenPW.Ultrasonography in obstetrics and gynecology,5thed.Philadelphia,Saunders-Elsevier,2008.
• FulghesuAMetal.Ultrasoundinpolycysticovarysyndrome–themeasuringofovarianstromaandrelationshipwith
circulatingandrogens:resultsofamulticentricstudy.Human Reproduction (Oxford, England),2007,22:2501-2508.
doi:10.1093/humrep/dem202PMID:17635847
• ChangHC,BhattS,Dogra.VS.Pearlsandpitfallsindiagnosisofovariantorsion.Radiographics,2008,28:1355-1368.
doi:10.1148/rg.285075130PMID:18794312
• JunqueiraBLPetal.Müllerianductanomaliesandmimicsinchildrenandadolescents:correlativeintraoperativeassess-
mentwithclinicalimaging.Radiographics,2009,29:1085-1103.doi:10.1148/rg.294085737PMID:19605658
• TimmermanDetal.Logisticregressionmodeltodistinguishbetweenthebenignandmalignantadnexalmass
beforesurgery:amulticenterstudybytheInternationalOvarianTumorAnalysisGroup.Journal of Clinical Oncology,
2005,23:8794-8801.doi:10.1200/JCO.2005.01.7632PMID:16314639
• RumackCM,WilsonSR,CharboneauJW,JohnsonJ-AM,eds.Diagnostic ultrasound.StLouis,ElsevierMosby,2005.
• SavelliL,CacciatoreB.Salpinges.In:Gynecological and early pregnancy ultrasound[ISUOGEducationalseries].London,
InternationalSocietyofUltrasoundinObstetricsandGynecology,2003.
• TwicklerDM,MoschosE.Ultrasoundandassessmentofovariancancerrisk.AJR. American Journal of Roentgenology,
2010,194:322-329.doi:10.2214/AJR.09.3562PMID:20093591
• VarrasMetal.Tubo-ovarianabscesses:spectrumofsonographicfindingswithsurgicalandpathologicalcorrelations.
Clinical and Experimental Obstetrics & Gynecology,2003,30:117-121.PMID:12854857
Breast
• AthanasiouAetal.Howtooptimizebreastultrasound.European Journal of Radiology,2009,69:6-13.doi:10.1016/j.
ejrad.2008.07.034PMID:18818037
• Boisserie-LacroixMetal.Breastultrasonography:anoverview.Gynecologie, Obstetrique & Fertilite,2006,34:1170-1177.
doi:10.1016/j.gyobfe.2006.10.015PMID:17140836
978-9241548540-Recommended -Final Proof.indd 470 6/10/13 10:29 AM
471
• ChenSCetal.Analysisofsonographicfeaturesforthedifferentiationofbenignandmalignantbreasttumorsofdifferent
sizes.Ultrasound in Obstetrics & Gynecology,2004,23:188-193.doi:10.1002/uog.930PMID:14770402
• CollD.Breasttumorimaging.Cancer Treatment and Research,2008,143:515-546.doi:10.1007/978-0-387-75587-8_20
PMID:18619231
• CostantiniMetal.Characterizationofsolidbreastmasses:useofthesonographicbreastimagingreportinganddata
systemlexicon.Journal of Ultrasound in Medicine,2006,25:649-659.PMID:16632790
• CostantiniMetal.L.Solidbreastmasscharacterisation:useofthesonographicBI-RADSclassification.La Radiologia
Medica,2007,112:877-894.doi:10.1007/s11547-007-0189-6PMID:17885742
• GokalpG,TopalU,KizilkayaE..PowerDopplersonography:anythingtoaddtoBI-RADSUSinsolidbreastmasses?
European Journal of Radiology,2009,70:77-85.doi:10.1016/j.ejrad.2007.12.007PMID:18243623
• Heywang-KoebrunnerS,SchreerD,DershawI.Diagnostic breast imaging mammography, sonography, magnetic
resonance imaging, and interventional procedures, 2ndedition.Stuttgart,Thieme,2001.
• HinesN,SlanetzPJ,EisenbergRL.Cysticmassesofthebreast.AJR. American Journal of Roentgenology,2010,194:W122-
W133.doi:10.2214/AJR.09.3688PMID:20093563
• HongASetal.BI-RADSforsonography:positiveandnegativepredictivevaluesofsonographicfeatures.AJR. American
Journal of Roentgenology,2005,184:1260-1265.PMID:15788607
• McCavertMetal.Ultrasoundisausefuladjuncttomammographyintheassessmentofbreasttumoursinallpatients.
International Journal of Clinical Practice,2009,63:1589-1594.doi:10.1111/j.1742-1241.2009.02102.xPMID:19686337
• MoonHJetal.Probablybenignbreastlesionsonultrasonography:aretrospectivereviewofultrasonographicfeatures
andclinicalfactorsaffectingtheBI-RADScategorization.Acta radiologica (Stockholm, Sweden: 1987),2010,51:375-382.
doi:10.3109/02841851003662780PMID:20350247
• NicholsonBTetal.Nipple–areolarcomplex:normalanatomyandbenignandmalignantprocesses.Radiographics,
2009,29:509-523.doi:10.1148/rg.292085128PMID:19325062
• RazaSetal.USofbreastmassescategorizedasBI-RADS3,4,and5:pictorialreviewoffactorsinfluencingclinical
management.Radiographics,2010,30:1199-1213.doi:10.1148/rg.305095144PMID:20833845
• RinaldiPetal.Cysticbreastlesions:sonographicfindingsandclinicalmanagement.Journal of Ultrasound in Medicine,
2010,29:1617-1626.PMID:20966473
• SmithGE,BurrowsP.Ultrasounddiagnosisoffibroadenoma–isbiopsyalwaysnecessary?Clinical Radiology,
2008,63:511-515.doi:10.1016/j.crad.2007.10.015PMID:18374713
• StavrosATetal.Solidbreastnodules:useofsonographytodistinguishbetweenbenignandmalignantlesions.
Radiology,1995,196:123-134.PMID:7784555
• YangW,DempseyPJ.Diagnosticbreastultrasound:currentstatusandfuturedirections.In:SicklesEA,ed.Breastimag-
ing.Radiologic Clinics of North America,2007,45:845-861.doi:10.1016/j.rcl.2007.06.009PMID:17888773
978-9241548540-Recommended -Final Proof.indd 471 6/10/13 10:29 AM
472
Paediatric ultrasound
• BianchiS,MartinoliC.Ultrasound of the Musculoskeletal system.Berlin,Springer-Verlag,2007.
• BruynR.Paediatric ultrasound: how, why and when.Philadelphia,ChurchillLivingstone,2005.
• ChateilJ,BrisseH,DacherJ.Ultrasoundinpediatricurology.Journal de Radiologie,2001,82:781-800.PMID:11443296
• DevredP,TréguierC,Ducou-Le-PointeH.Echographyofthehipandotherimagingtechniquesinpediatrics.Journal de
Radiologie,2001,82:803-816.PMID:11443297
• DonnellyLF.Pediatric Imaging: the fundamentals.Saunders-Elsevier,2009.
• Effective choices for diagnostic imaging in clinical practice[WHOTechnicalReportSeries795].Geneva,WorldHealth
Organization,1990:144.
• GarelLetal.USofthepediatricfemalepelvis:aclinicalperspective.Radiographics,2001,21:1393-1407.PMID:11706212
• GervaisDAetal.Percutaneousimaging-guidedabdominalandpelvicabscessdrainageinchildren.Radiographics,
2004,24:737-754.doi:10.1148/rg.243035107PMID:15143225
• KuhnJP,SlovisTL,HallerJO.Caffey’s Pediatric Diagnostic Imaging,10thed.Philadelphia,Elsevier/Mosby,2003.
• LevyJA,NobleVE.Bedsideultrasoundinpediatricemergencymedicine.Pediatrics,2008,121:e1404-1412.doi:10.1542/
peds.2007-1816PMID:18450883
• LoweLH,JohanekAJ,MooreCW.Sonographyoftheneonatalspine:part1,Normalanatomy,imagingpitfalls,andvari-
ationsthatmaysimulatedisorders.AJR. American Journal of Roentgenology,2007,188:733-738.doi:10.2214/AJR.05.2159
PMID:17312061
• LoweLH,JohanekAJ,MooreCW.Sonographyoftheneonatalspine:part2,Spinaldisorders.AJR. American Journal of
Roentgenology,2007,188:739-744.doi:10.2214/AJR.05.2160PMID:17312062
• LucayaJ,StrifeJL.Paediatric chest imaging.Berlin,Springer2002.
• PetitP,PracrosJ.Roleofultrasoundinchildrenwithemergencygastrointestinaldiseases.Journal de Radiologie,
2001,82:764-778.PMID:11443295
• Rational use of diagnostic imaging in paediatrics[WHOTechnicalReportSeries757].Geneva,
WorldHealthOrganization,1987
• RosenbergHK.Sonographyofpediatricneckmasses.Ultrasound Quarterly,2009,25:111-127.doi:10.1097/
RUQ.0b013e3181b6720bPMID:19730051
• SivitCJ.Imagingchildrenwithabdominaltrauma.AJR. American Journal of Roentgenology,2009,192:1179-1189.
doi:10.2214/AJR.08.2163PMID:19380540
• StringerDA,BabynPS,eds.Pediatric gastrointestinal imaging and intervention,2nded.London,
BCDeckerIncHamilton,2000
• Training in diagnostic ultrasound: essentials, principles and standards [WHOTechnicalReportSeries875].Geneva,
WorldHealthOrganization,1998
978-9241548540-Recommended -Final Proof.indd 472 6/10/13 10:29 AM
473
Musculoskeletal system
• Al-ShawiAetal.Thedetectionoffullthicknessrotatorcufftearsusingultrasound.The Journal of Bone and Joint Surgery.
British Volume,2008,90:889-892.doi:10.1302/0301-620X.90B7.20481PMID:18591598
• BeggsI.Ultrasoundoftheshoulderandelbow.The Orthopedic Clinics of North America,2006,37:277-285.doi:10.1016/j.
ocl.2006.03.004PMID:16846761
• BlumA,CarillonY,RailhacJetal.Instability[Chapter10].In:DaviesAM,HodlerJ.Imaging of the shoulder: techniques &
applications.Heidelberg,Springler-Verlag,2005.
• DaviesAM,WhitehouseRW,JenkinsJPR.Imaging of the foot & ankle. Heidelberg,Springer,2003:179–199.
• DeMaeseneerMetal.Sonographyofthenormalankle:atargetapproachusingskeletalreferencepoints.AJR. American
Journal of Roentgenology,2009,192:487-495.doi:10.2214/AJR.08.1316PMID:19155415
• DongQ,FessellDP.Achillestendonultrasoundtechnique.AJR. American Journal of Roentgenology,2009,193:W173-
doi:10.2214/AJR.09.3111PMID:19696253
• FessellDP,JacobsonJA.Ultrasoundofthehindfootandmidfoot.Radiologic Clinics of North America,2008,46:1027-1043.
doi:10.1016/j.rcl.2008.08.006PMID:19038611
• FinlayK,FriedmanL.Ultrasonographyofthelowerextremity.The Orthopedic Clinics of North America,2006,37:245-275.
doi:10.1016/j.ocl.2006.03.002PMID:16846760
• IlaslanH,SundaramM.Advancesinmusculoskeletaltumorimaging.The Orthopedic Clinics of North America,
2006,37:375-391.doi:10.1016/j.ocl.2006.05.003PMID:16846768
• JamadarDAetal.Musculoskeletalsonographytechnique:focusedversuscomprehensiveevaluation.AJR. American
Journal of Roentgenology,2008,190:5-9.doi:10.2214/AJR.07.2433PMID:18094286
• KhouryVetal.Musculoskeletalsonography:adynamictoolforusualandunusualdisorders.AJR. American Journal of
Roentgenology,2007,188:W63-73.doi:10.2214/AJR.06.0579PMID:17179329
• McNallyE.Practical musculoskeletal ultrasonography.Philadelphia,PA,ChurchillLivingstone,2005.
• MeyersPRetal.Shoulderultrasound.AJR. American Journal of Roentgenology,2009,193:W174-doi:10.2214/AJR.09.3229
PMID:19542411
• NazarianLN.Thetop10reasonsmusculoskeletalsonographyisanimportantcomplementaryoralternativetechniqueto
MRI.AJR. American Journal of Roentgenology,2008,190:1621-1626.doi:10.2214/AJR.07.3385PMID:18492916
• RobinsonP.Sonographyofcommontendoninjuries.AJR. American Journal of Roentgenology,2009,193:607-618.
doi:10.2214/AJR.09.2808PMID:19696272
• ZlatkinMB.Shoulderinstability[Chapter7].In:ZlatkinMB.MRI of the shoulder,2nded.Philadelphia,PA,Lippincott
Williams&Wilkins,2003.
978-9241548540-Recommended -Final Proof.indd 473 6/10/13 10:29 AM

978-9241548540-Recommended -Final Proof.indd 474 6/10/13 10:29 AM
475
Index
Notes
Pages numbers ending in f refer to fi gures
Pages numbers ending in t refer to tables
[A]
Abdomen (fetal)
abnormal shape 108
measurements in third trimester 44–45, 45f
second trimester assessment 40, 40f, 41f
subcutaneous tissue thickness 51
Abdominal aorta 311f, 397f, 399f
Abdominal cavity
formation in fetus 16
free air in (paediatric) 284, 285f
Abdominal circumference (fetal)
birth weight prediction 48
fetal weight estimation 48, 49t
increased, in ascites 108
intrauterine growth restriction
diagnosis 55, 84
multiple pregnancy 81, 84
second trimester 40, 40f
third trimester 44–45, 45f
Abdominal masses (paediatric) 279–281
adrenal haemorrhage causing 310, 310f
cystic 279–280, 280f
haematocolpos 325, 326f
non-cystic 281, 281f, 310
primary pelvic hydatid cyst 331, 332f
Abdominal pain (paediatric) 275–278, 394–395
acute, or chronic 395
adnexal torsion 326, 327f
appendicitis 276, 277f, 278f
cyclical 325
Henoch–Schönlein purpura 287, 287f
indications for ultrasound 394, 395
infl ammatory disorders 286, 287f
intussusception 275–276, 276f
mesenteric lymphadenitis 278, 279f
Abdominal trauma (paediatric)
blunt 284, 285f
liver 240, 240f, 241f
pancreatic 267, 270, 270f, 271f
renal 313, 313f, 314f
splenic 263, 263f, 264f
Abortion (spontaneous) 23, 24f, 148
absent intrauterine sac 23
‘complete’ or ‘incomplete’ 23
conjoined twins 33
intrauterine sac with embryo without cardiac
activity 24f, 25
intrauterine sac without embryo/yolk sac
23–25, 25f
‘missed’ 23, 25
recurrent 23
threatened 22, 23
twin 24f
Abscess(es) 393–394
adrenal 310
amoebic liver 240
breast 205–206, 207f
cervical 353
hepatic 239, 239f, 240
lung 358–359
muscle rupture complication 455
pancreas 267
peri-appendiceal 278f, 328f
978-9241548540-INDEX PRF ml ln ml ml-1-Final Proof.indd 475 6/10/13 10:29 AM
476
pyogenic liver 239, 239f
renal 303, 303f
subperiosteal 389f
Acardiac twin syndrome 88
Acetabular cartilage (paediatric) 384, 384f
Acetabular dysplasia 385
Achilles tendon see Calcaneus (Achilles) tendon
Achondrogenesis 117f
Acoustic inertial cavitation 5
Acoustic working frequency 5
Acrania 31, 32f
Acromelia 114
Acromion-clavicular joint, liquid in 420
Adenitis see Lymphadenitis
Adenoma
follicular (thyroid) 350, 350f
hepatic 239
lactating 214, 214f
nipple 214
parathyroid 351
tubular, of breast 214–215, 214f
Adenomyosis 154–155, 155f
Adhesions
acute pelvic inflammatory disease 185
endometrial 152
Fallopian tube 177–178, 177f
Adnexal lesions 163–174
cysts 176–177, 176f, 177f
paraovarian cysts 173–174
see also Fallopian tubes; Ovarian masses;
Ovarian tumours; Ovaries
Adnexal torsion 326, 327f
Adnexal tumours 169–175
Adolescents
bone and joint abnormalities 387
ectopic pregnancy 331
goitre 350
ovarian cysts 319–320, 319f
spleen size 255, 255f
testis (normal) 333
uterovaginal anomalies 325
see also Paediatric ultrasound
Adrenal glands (fetal) 110
Adrenal glands (paediatric) 309–311
abscess 310
age-related changes 309
congenital hyperplasia 309, 328, 342
cystic lesions 310
haemorrhage 310, 310f
neuroblastoma 310, 311f
normal sonographic appearance 309, 309f
tumours 311
Alagille syndrome 246, 248
Allantoic duct 15
Alobar holoprosencephaly 31, 32f, 93, 94f
Alonso-Lej classification 249
Alpha angle 385
α-fetoprotein 234, 235
Amenorrhea, primary 325
Amino acids, fetal growth and 53
Amniocentesis, fetal loss, risk 83
Amniotic cavity 14–15
Amniotic fluid 69–70
measurement methods 47
third trimester 47, 47f
volume
decline near term 47
multiple pregnancies 70
normal 42, 47f
reduced, fetal growth restriction
55–56, 61
volume assessment 42, 69
intrauterine growth restriction diagnosis
55–56
multiple pregnancies 70
single deepest pocket method 42, 47, 69
third trimester 47, 47f
two-diameter pocket method 70
see also Amniotic fluid index
Amniotic fluid index 42, 47, 69
measurement method 69–70
pitfalls in measurement 47
range/mean and distribution 69
use in preterm pregnancies 69
978-9241548540-INDEX PRF ml ln ml ml-1-Final Proof.indd 476 6/10/13 10:29 AM
477
Amniotic fluid pocket, deepest, measurement 42, 47, 69
Amniotic membrane 15f
formation, gestational age 14
twin pregnancies 78, 80, 81
Amniotic sac 16
multiple pregnancies 78, 81
Amoebic liver abscess 240
Anamnestic gestational age see Menstrual age
Anatomical snuffbox 427
Anencephaly 31, 91, 91f
Aneuploidy
first-trimester screening 20–21
hydatidiform moles and 29
risk in multiple pregnancies 82
Angioma, splenic 261, 262f
Anisotropy 412, 442f
Ankle
injuries 447, 448
ligaments see Lateral ligament complex
(ankle)
soft tissue oedema 450
sprains 448
tendons 437–442
see also Calcaneus (Achilles) tendon
Anoxic–ischaemic encephalopathy 371, 371f
Antenatal diagnosis
congenital anomalies see Congenital
anomalies
twin–twin transfusion syndrome 86
urinary tract anomalies 312
Anterior talofibular ligament 447, 447f
chronic lesions 450, 450f
complete rupture 449, 449f
Aorta, abdominal 311f, 397f, 399f
Aorta (fetal) 100, 101f, 111f
coarctation 104f
overriding 105, 105f
second trimester assessment 41f
transposition of great vessels 105, 105f
Aortic stenosis 106
Aponeurosis (plantar fascia) 460, 461f
Appendicitis 276, 277f, 278f
Appendix
dilated 278f
fluid-filled 276, 277f
inflammation 276, 277f, 278f
normal 276, 277f
perforated 276
Arachnoid cyst 92f
Arterial ischaemic infarct (neonatal) 371
Arteriohepatic dysplasia (Alagille syndrome) 246, 248
Arteriovenous malformation 390
Arthritis
juvenile rheumatoid 394
septic 389, 389f, 390f
Ascites
fetal 108, 109f
paediatric, in lymphoma 282f
Asphyxia, perinatal 371
Aspirin, intrauterine growth restriction prevention 62
Asplenia 257
Athletes/sports
ankle injuries 447
insertion tendinopathy 439
knee injuries 435
muscle lesions 452, 456
Athyroidism 348
Atrial anomalies (fetal) 102, 102f
Atrioventricular canal, complete 102, 102f
Atrioventricular valve, single 102, 102f
Atrium, single 102, 102f
Atrium thickness (atrial width) of lateral ventricles 35, 36f, 37, 93
Axillary lymph nodes 199, 199f
metastatic carcinoma 225–226, 226f
Axillary regions, ultrasound examination 194
[B]
Baker cyst 457–458, 458f
rupture 459, 459f
978-9241548540-INDEX PRF ml ln ml ml-1-Final Proof.indd 477 6/10/13 10:29 AM
478
Bald humeral head sign 418, 418f
Banana sign 96, 98
Basal ganglion 362f, 365
Basedow disease 349
Beads-on-a-string sign 178, 180f, 184f, 185
Beckwith-Wiedemann syndrome 234
Benign mammary dysplasia 211, 212f
Biceps see Brachial biceps
Bile ducts (extrahepatic) see Biliary tree (extrahepatic)
Bile ducts (intrahepatic)
choledochal cysts 249, 250, 251f
hydatid disease 242, 242f, 243f, 244f
interlobular, paucity 248
normal sonographic features 231, 232, 233f
Bile plug 251, 251f
Biliary atresia 234, 246–248
anomalies associated 248
neonatal hepatitis syndrome vs 246, 247
types 246, 246f
Biliary cyst 244, 245f
Biliary sludge 251, 251f, 254f
Biliary tract
embryonal rhabdomyosarcoma 235, 235f
in hydatid disease 242
paediatric ultrasound see Liver and biliary
tract
Biliary tree (extrahepatic)
calculi 252, 253f
choledochal cysts 249
deficient see Biliary atresia
embryonal rhabdomyosarcoma 235, 235f
hydatid disease 242, 244f
inspissated bile syndrome 251, 251f
normal 231, 232f
obstruction 251, 251f
Biloma, hepatic 240, 241f
Biometry, fetal see Fetus, biometric parameters
Biovular twins see Twin pregnancies, dizygotic
Biparietal diameter of head (fetus)
birth weight prediction 48
embryo/fetal size in first trimester 11–12
fetal weight estimation 48, 49t
intrauterine growth restriction diagnosis 55
measurement 11–12, 43, 44f
accuracy limitations 13
first trimester 11–12, 13f
second trimester 35–36, 36f, 90, 90f
third trimester 43, 44f
multiple pregnancy 81
Birth weight
multiple pregnancies 83
prediction 48, 49t
Bladder
fetal 68f
diameter in megacystis 32
dilatation 112–113, 114f
length 32
normal 110f
twin–twin transfusion syndrome 85f, 86
volume in monochorionic, diamniotic
twins 85f
hyperdistension, avoidance 134
involvement in cervical carcinoma 160
paediatric
capacity 292
congenital diverticulum 306
distension 307
duplication 306
examination technique 289
in gonadal dysgenesis 330f
neoplasms 308
neurogenic 308
normal anatomy 292, 293f
rhabdomyosarcoma 308, 309f
stones 307–308, 308f
thickness 292
urachal abnormalities 306
wall thickening 306f, 307, 308f
transabdominal ultrasound preparation 10,
71, 72, 134
placenta praevia diagnosis 65
transvaginal ultrasound preparation 10,
135–136
978-9241548540-INDEX PRF ml ln ml ml-1-Final Proof.indd 478 6/10/13 10:29 AM
479
Blake pouch cyst 94
‘Blighted ovum’ 23
Blood flow velocity
cerebral (neonatal) 363–364, 364f
Doppler, measurement 119–120, 119f, 121
waveform analysis 121–122, 122f
see also Doppler ultrasound
reversal, intrauterine growth restriction
57–58, 57f, 58f, 59f, 126
B-mode ultrasound scanning, safety 5
Bone
abnormalities (paediatric) 385–390
infections (paediatric) 388, 389f
mineralization 116, 118f
normal paediatric findings 384, 384f
ultrasound-induced heating 4–5
Borderline ventriculomegaly 93, 93f
Botryoid appearance 308, 324
Bowel (fetal) 106, 107f
obstruction 106
physiological herniation (normal) 32
Bowel (paediatric)
air in 396, 396f, 400, 401
haematoma 284, 285f
herniation 32, 34f, 108, 109f
infarction 276
intussusception 275–276
ischaemic disease 288, 288f
obstruction (neonatal) see Intestinal obstruc-
tion (neonatal)
trauma 284, 285f
see also Small bowel
Brachial artery 424f
Brachial biceps 423
long head, tendon of 409, 410, 410f, 414f
examination technique 413, 413f
fluid in synovial sheath 420–421
Brachial biceps tendon, examination/normal findings 424f
Brachial triceps 422, 423f
Brachial triceps tendon 423f
Brachioradialis muscle 425f
Brain
anoxic–ischaemic lesions (neonatal)
369, 370f
arterial ischaemic infarct 371
fetal
assessment 36
malformations 91
middle cerebral artery see Cerebral artery,
middle
teratoma 92f
ischaemic lesions (neonatal) 369–372,
370f, 371f
malformations (neonatal period) 373, 374f
parenchyma
calcifications 376f
normal neonatal ultrasound 361, 362f
posterior regions (premature brain) 365
premature 364–368, 366f, 368f, 369f
cysts in white matter 366, 369f
early follow-up 365
haemorrhagic lesion follow-up 365, 366f
intermediate follow-up 366
long-term follow-up 367, 368f
MRI role 367
normal cranial variants 363
timing of scans 368
tumours (neonatal/infant) 376
white matter injury, premature brain,
follow-up 367
Brain-sparing effect 57, 58f, 124–125
Branchial cleft cysts 346
Breast 193–226
age-related changes 195
anatomy 195, 195f
benign lesions 202–216, 218
abscesses 205–206, 207f
acute mastitis 205–206, 206f
adenoma 214–215, 214f
cysts see Breast, cysts
fibroadenoma 207–208, 208f
fibrocystic changes 211–212, 212f
fibrolipoadenoma 213, 213f
978-9241548540-INDEX PRF ml ln ml ml-1-Final Proof.indd 479 6/10/13 10:29 AM
480
galactocoele 213, 214f
haematoma 207, 207f
hamartoma 213, 213f
intraductal papilloma 209, 210f
intraparenchymal lymph nodes 210, 211f
liponecrosis 215, 215f
in males 216, 216f
phyllodes tumour 209, 209f
biopsy 193, 201
complications/risks 201
preoperative needle localization 201
techniques 201
cancer/carcinoma see Breast carcinoma
Cooper ligaments see Cooper ligaments
cysts 202–204
calcifications 203
complex 203, 204f
intracystic cancer 203, 205f
liponecrosis vs 215
sebaceous 203
simple 202–203, 203f
dense 195, 197f
ducts 195f, 198, 199f
epithelial cancers see Breast carcinoma
fatty 197f
lobes 195
lumps 193
lymph nodes in 199, 200f, 210, 211f
male, disease see Male breast disease
malignant lesions see Breast carcinoma
microcalcifications 218, 219, 220f
palpation 194–195
parenchyma 197, 197f
sclerosing adenosis 212, 212f
skin over 196, 196f
subcutaneous fat 196, 196f
tumours 218
carcinoma see Breast carcinoma
fibroepithelial (phyllodes) 209, 209f
Paget disease of nipple 221
ultrasound
accuracy 199–200
biopsy guided by 193, 201
diagnostic algorithm 200
examination technique 194–195
indications 193, 218
lexicon 199–200, 200t
new techniques 201–202
normal findings 195–200, 196f
preparation 193–194
Breast carcinoma 217–226
central necrosis 203, 205f
ductal carcinoma in situ 218
fibroadenoma vs 208
incidence and risk factors 217–218
intracystic 203, 205f
local staging 225–226, 226f
lymph node involvement 225–226, 226f
recording ultrasound criteria 218
sonographic features 218–225
good prognosis carcinomas 222–224
in situ carcinoma 218
inflammatory cancer 223, 224f
invasive ductal carcinoma 219–221, 219f,
220f, 225
invasive lobular carcinoma 222, 222f
male carcinoma 225, 225f
medullar carcinoma 223, 223f
metastatic cancer 225
microcalcifications 218, 219, 220f
mucinous carcinoma 222, 222f
papillary invasive carcinoma 223
premalignant lesions 218
rare tumours 225
size of lesion 219
skin and subcutaneous tissue 220–221, 221f
ultrasound role 218
Breast Imaging Reporting and Data System 199–200, 200t
Breathing movements
fetal, umbilical artery Doppler waveform 123
paediatric 360
Brenner tumours 172
Bruises 454f
subcutaneous 452
see also Contusions
978-9241548540-INDEX PRF ml ln ml ml-1-Final Proof.indd 480 6/10/13 10:29 AM
481
Budd-Chiari syndrome 242, 252
Burkitt lymphoma
abdominal mass 282f
ovary involvement 331, 332f
Bursae
ankle 437
elbow 422, 423
hip 432
knee 437, 457, 458, 458f
retrocalcaneal 437
subacromial-subdeltoid 412
Bursitis
intermetatarsal 459
prepatellar 437f
retrocalcaneal 439, 440f
trochanteric 432, 434f
[C]
Caesarean delivery, cervical length and 75
Calcaneofibular ligament 448, 448f
Calcaneus
plantar fasciitis and 460, 461, 461f
tuberosity, Haglund deformity 439, 440f
Calcaneus (Achilles) tendon 437
disorders/conditions affecting 437–439
examination technique 438f
normal dimensions/anatomy 437
normal ultrasound findings 437, 438f
paratendinitis 439, 441f
rupture 439
complete 439, 441, 442f
partial 439, 441f
tendinous stumps 441, 442f
tendinopathy 439, 439f
xanthoma 437, 438f
Calcar avis 363
Calcarine gyrus 363
Calculi
biliary tree (extrahepatic) 252, 253f
lower urinary tract 307–308, 308f
renal 298–299, 298f
Calvaria, abnormal shape 95f, 96
Calyceal diverticula 294, 294f
Candelabra sign 375, 376f
Capillary malformation 391
Cardiac activity (fetal)
absent in abortion diagnosis 25
first trimester 16
recording 26
Cardiac afterload, intrauterine growth restriction 57
Cardiac anomalies (fetal) 100–106, 101f, 102f, 103f, 104f, 105f
atrial 102, 102f
detected with four-chamber view 102,
103f, 104f
detection in first trimester 33
number 102
outflow tract 105–106, 105f, 106f
screening 100
Cardiac chambers (fetal) 98f
first trimester 18
screening for anomalies 100
second trimester 38, 38f, 39f
Cardiac output (fetal) 57, 125
in severe hypoxaemia 126
Cardiac rate (fetal)
first trimester 16, 26
normal 26
umbilical artery Doppler waveform 123
Caroli disease 250, 251f, 296
Carotid artery, normal 344
Carpal tunnel 425, 426f, 463
dimension decrease, mechanism 463
Carpal tunnel syndrome 462–465
causative factors 463
ultrasound findings 463, 464f, 465
Carpi ulnaris extensor tendon 428, 429f
Cartilage interface sign 422, 422f
Cartilaginous epiphysis 384, 384f, 385f
Cauda equina 379f
Caudal regression syndrome 382
Caudate nucleus 362f
Cavum septum pellucidum 36, 37f, 44, 363, 363f
Cavum veli interpositi 363
978-9241548540-INDEX PRF ml ln ml ml-1-Final Proof.indd 481 6/10/13 10:29 AM
482
Cavum vergae 363
Cellulitis 393
Central nervous system
abnormalities in first trimester 31, 32f
see also Brain; Spinal cord (paediatric)
Central renal sinus 290f, 291f
Cephalocoele 92, 92f
Cerebellar vermis, hypoplastic 94
Cerebellum
first trimester 18f
small, Chiari II malformation 95f, 96, 98
transverse diameter 35–36, 37, 37f
Cerebral anoxic–ischaemic lesions 369, 370f
Cerebral artery, anterior, normal haemodynamics 363–364, 364f
Cerebral artery, middle 125
Doppler velocimetry 124, 125, 127
fetal hypoxaemia prediction 124–125, 125t
intrauterine growth restriction 58f
ischaemic infarct 371, 372f
pulsatility index 124, 125t
Cerebral blood flow, neonatal 363–364, 364f
Cerebral hemispheres, alobar holoprosencephaly 31
Cerebral palsy 76
Cerebral vasodilatation, fetal growth restriction 57, 124–125
Cerebroplacental ratio 125
Cerebrospinal fluid (CSF) 377
Cervical abscess 353
Cervical carcinoma 158–160, 159f, 160f, 161f
Cervical cerclage 72f, 74
follow-up after 74–75, 75f
Cervical lymphadenitis 347, 348f
Cervical pregnancy 27f
Cervix 70–75, 137
endometrial carcinoma invasion 156–157
examination technique 71–73, 72f
funnelling 73, 74f
indications for ultrasound 70, 71
length
from 19-31 weeks 73, 74f
after cervical cerclage 74–75
children 315
gestational age at delivery 75
multiple pregnancy 82
normal 73
preterm birth prediction 73, 74, 82
shortening for labour 73, 74f
in multiple pregnancies 73, 82
neonatal 315, 316f
normal findings 72f, 73
pathological findings 73–75
cerclage, follow-up after 74–75, 75f
labour induction success prediction 71, 75
mode of delivery investigation 71, 75
preterm birth and risk of 73–74, 74f
preparation for ultrasound 71
Chest
cystic mass 356, 356f
hypoplastic 116, 117f, 118t
paediatric ultrasound 354–360
examination technique 354
indications 354
normal findings 354–355, 355f, 356f
pathological findings 356–360
preparation 354
second trimester assessment 38, 38f, 39f,
98, 99f
soft tissue abnormalities 356, 356f
Chest wall
anomalies 356, 356f
normal 354, 355f
Chiari II malformations 95f, 96, 98, 380
Chiari II syndrome 380
Child abuse 270, 387
Children, ultrasound see Paediatric ultrasound
Chlamydia trachomatis 327
Cholangiography 248, 250f
Cholecystitis (paediatric) 252
acute calculous 252, 253f
complications 253
Choledochal cyst (paediatric) 249–251
anatomical types 249, 249f
complications 251
differential diagnosis 250–251
978-9241548540-INDEX PRF ml ln ml ml-1-Final Proof.indd 482 6/10/13 10:29 AM
483
type I 249f, 250, 250f
types II-V 249f, 250
Choledocholithiasis 252, 253f
Cholelithiasis 252, 253f
Chorioangioma 66
Chorioncarcinoma 31, 161
Chorionic cavity 15
Chorionic membrane, twin pregnancies 19, 78, 80, 81
Chorionic plate 62
Chorionic villi 122
Chorionicity, determination 18–19, 77–78
Choroid plexus
cysts 93, 94f
lobular 363
papilloma 376
Cirrhosis, in children 252
Cisterna magna 37
anteroposterior diameter 36f
enlarged (mega) 94, 95f
Cleft palate 94f
Clitoromegaly 329f
Cloacal abnormalities 307
Cloverleaf skull 116, 117f
Club foot 116, 116f, 385–386
Coarctation of aorta 104f
Coelomic cavity 14, 15f
Cogwheel sign 178, 179f, 183
Collecting system 297f, 313f
Colon
intussusception 275
microcolon see Microcolon
see also Bowel; Intestinal obstruction
Colour Doppler 121, 126
appendicitis 278f
cervical lymphadenitis 347f
chest 354
cirrhosis of liver 252
De Quervain tenosynovitis 428f
endometrial carcinoma 157f
endometrial polyps 150, 151f
fibroids 152
finger tendons 432f
haemangioendothelioma 236
intratesticular vascular anatomy 333, 335f
invasive ductal carcinoma (breast) 221
lymph nodes of neck 346f, 391
muscle hernia 457f
neonatal cranial examination
ischaemic lesions 369
normal findings 361
severe haemodynamic distress 372,
372f, 373f
polycystic ovary syndrome 145
portal hypertension 259
premature brain 364
prepatellar bursitis 437f
renal vein thrombosis 305
splenic angioma 261
splenic lymphangioma 263
synovial diseases (paediatric) 387
tubal patency evaluation 187
twin reversed arterial perfusion sequence 88
urinary tract examination 289
uterus 136, 137f
varicocele 338, 338f
Common bile duct 232f
size, children/infants 231
Common carotid artery 348f
normal 344, 344f
Common hepatic duct 231
fibrosis 247f
Compartment syndrome 455
Compressive neuropathies 462–465
diagnostic criteria 463, 465
see also Carpal tunnel syndrome
Computed tomography (CT)
calyceal diverticula 294f
cystic mesenchymal hamartoma 238f
duodenal haematoma 285f
fatty hepatic infiltration 245f
hepatoblastoma 234f
horseshoe kidneys 294f
mature ovarian teratoma 322f
mesenteric cyst 280f
multilocular cystic nephroma 302f
978-9241548540-INDEX PRF ml ln ml ml-1-Final Proof.indd 483 6/10/13 10:29 AM
484
pancreatic fracture 271f
pancreatic pseudocyst 268, 269f
polysplenia 257f
renal fracture 313f
renal hydatid cyst 304f
splenic angioma 262f
Wilms tumour 300f, 301f
Concentric contraction, muscle 451
Congenital adrenal hyperplasia 309, 328, 342
Congenital anomalies
antenatal diagnosis 89
multiple pregnancy 82–83
cystic, neck 346, 347f
digestive tract 279
duodenal malrotation 398
hydrocele 337, 337f
liver 237
lower urinary tract 306–307
lymphatic vessels 279, 391
pancreas 266–267
spine 380–382, 381f, 382f
splenic 261, 262
upper urinary tract 293–297, 314
uterine disorders 146–148
see also Fetal malformations; specific organs
Congenital hip dislocation 385
Conjoined twins 33, 34f, 76, 88–89, 89f
frequency 88
point of union 88
Connatal cysts 363
Contrast enema, meconium ileus 402, 402f
Contusions
hepatic 240, 240f, 241f
spleen 263, 263f
see also Bruises
Conus medullaris 379, 379f, 380f
normal 379f, 380f
tethered cord and 380
Cooper ligaments 195, 195f, 196f, 197
invasive ductal carcinoma 220
Core-needle biopsy, breast 201
Corpus callosum
agenesis and hypoplasia 373, 374f
neonatal cranial ultrasound 362f
Corpus luteum 143, 143f, 168, 169f
vascular ring 168, 169f
Cranial circumference, measurement, second trimester 35, 36, 36f
Cranial ultrasound
congenital anomalies 380
neonatal see Neonatal cranial ultrasound
normal variants, premature infant 363
see also Brain
Crohn disease (paediatric) 286, 286f
Crown–rump length 11–12
gestational age relationship 17t
increase in, rate 16
measurement 11–12, 12f
accuracy limitations 13
Cryptorchidism 336, 336f
Cyclopia 96, 96f
Cyst(s)
arachnoid 92f
Baker see Baker cyst
biliary 244, 245f
Blake pouch 94
branchial cleft 346
breast see Breast, cysts
choledochal see Choledochal cyst
choroid plexus 93, 94f
connatal 363
dermoid see Dermoid cyst
duodenal duplication 280, 280f
duplication 279–280, 280f
endometriotic 170, 170f
ependymal 379f
epidermoid see Epidermoid cysts
hydatid see Hydatid cyst
mesenteric 279, 280f
muscle 455, 456f
Naboth 140
omental 279
978-9241548540-INDEX PRF ml ln ml ml-1-Final Proof.indd 484 6/10/13 10:29 AM
485
ovarian see Ovarian cysts
paraovarian 173–174, 176, 176f, 321
paratubal 176, 177, 177f
pelvic inclusion 174
periarticular 420
peritoneal inclusion 178, 180
placental 63, 63f
popliteal 392
renal see Renal cysts
retropharyngeal 353
sebaceous, breast 203
spermatic cord 337, 337f
splenic, epidermoid 261, 261f
subependymal 376f
theca lutein 29, 30f, 67
thyroglossal duct 346, 347f
thyroid gland 351
urachal 306, 307f
Cystadenoma
mucous ovarian 321
serous ovarian 321, 322f
Cystic adenomatoid malformation 98, 99f
Cystic duct 231
Cystic fibrosis 244f, 267
meconium ileus 402
meconium pseudocyst 405, 405f
pancreas in 267
Cystic hygroma 31, 33f
paediatric 346, 353, 353f, 391
Cystic lymphangiomas, cervical 353, 353f
Cystic masses, abdominal 279–280, 280f
Cystic mesenchymal hamartoma 237, 238f
Cystic teratoma 171–172
Cystic tumours, pancreatic 271–272, 272f
Cystitis 306f
Cystography 229
Cytomegalovirus (CMV), cerebral infection (neonatal) 375, 376f
Cytotrophoblast 122, 123
[D]
Dandy-Walker complex 94, 95f, 373
Dating of pregnancy see Gestational age
De Quervain tenosynovitis 426, 428f
Deltoid ligament 446, 446f
Deltoid muscle 418
Dermal sinus, dorsal 381
Dermatomyositis 394
Dermoid cyst 392
neck 346
ovarian 171–172, 172f
girls 321, 322f
Desmoplastic reaction 219
Developmental dysplasia of hip 385
Diabetes, maternal 50, 51
Diamniotic pregnancy 78
Diandry 29
Diaphragm
abnormalities 360
normal 355, 356f
paralysis 360
Diaphragmatic hernia, fetus 99, 100f
Diarrhoea, bloody 286, 289, 304
Diastematomyelia 381, 381f
Dichorionic twins see Twin pregnancies, dichorionic
Digestive tract (fetal)
malformations 106–108, 107f, 108f, 109f
normal 106, 107f
Digestive tract (paediatric) 272–289
abdominal masses see Abdominal masses
abdominal pain see Abdominal pain
(paediatric)
blunt trauma to 284, 285f
congenital anomalies 279
duplication 279–280, 280f
inflammatory disorders 286, 286f, 287f
intramural bleeding 287, 287f
ischaemic bowel disease 288, 288f
neonatal, ultrasound 395
non-inflammatory disorders 287–289,
287f, 288f
978-9241548540-INDEX PRF ml ln ml ml-1-Final Proof.indd 485 6/10/13 10:29 AM
486
normal thickness 274
paediatric ultrasound
examination technique 273
indications 272
normal findings 273–274, 273f, 274f, 275f
pathological findings 275–289
preparation 272
perforation 285f
vomiting 282–284
wall, normal 273, 273f
Digital extensor apparatus 429, 430f
Dizygotic twin pregnancies see Twin pregnancies, dizygotic
Dolichocephaly 81
Doppler effect 119, 119f
Doppler frequency 119, 120
pulse repetition 120
Doppler shift data 120, 122
Doppler transducer 119, 119f, 120
Doppler ultrasound
aliasing effect 120–121
colour flow imaging see Colour Doppler
continuous wave 120
endometrial carcinoma 157f
flow waveform analysis 121–122, 122f
intrauterine growth restriction 56
magnitude of signal 120
modes 121–122
paediatric
adrenal neuroblastoma 311
appendicitis 276
liver and biliary tract 230
premature brain 364, 365
scrotum examination 333
power Doppler see Power Doppler
practice 120–121
principles 119–120, 119f
pulsed wave see Pulsed Doppler
spectral see Spectral Doppler
use in obstetrics 118–129
fetal hypoxaemia prediction (cerebral
artery) 124–125, 125t
fetal hypoxaemia prediction (venous
Doppler) 126–127, 127t
placental function assessment (umbilical
artery) 122–124, 124t
recommendations for 127
reporting recommendations (by trimes-
ter) 128–129
venous 56, 126–127
Dorsal dermal sinus 381
Double decidual sac 13, 24
Double-bubble sign 106, 108f, 396, 396f
Douglas, pouch of
fluid 167, 175, 175f, 177f, 186
intussusception 276
Drawing manoeuvre 450, 450f
Ductus venosus 122, 126, 127
fetal hypoxaemia 57, 58, 59f, 126
normal flow waveform 59f
pulsatility index 61, 126–127, 127t
reversal of blood flow 57–58, 59f, 126
Duodenal atresia 106, 108f, 396
Duodenal bulb, dilated 396, 396f
Duodenal diaphragm 396, 397, 397f
Duodenal dilatation 397
Duodenal duplication, obstructive 396
Duodenal duplication cyst 280, 280f
Duodenal haematoma 285f
Duodenal obstruction (neonatal) 395–400
causes, frequency, features 396
intrinsic (atresia, stenosis) 395–397
malrotation complication 396, 398–400,
399f, 400f
Duodenal stenosis 396
Duodenojejunal flexure 398
Duplication cyst 279–280, 280f
Dupuytren contracture 462
Duret crests 195, 220
[E]
Ebstein anomaly 102, 103f
Eccentric contraction of muscle 451
978-9241548540-INDEX PRF ml ln ml ml-1-Final Proof.indd 486 6/10/13 10:29 AM
487
Echinococcus granulosus 242
Echocardiography, fetal 33, 102
Ectopic pregnancy 26, 27f
concomitant intrauterine pregnancy with 26
diagnostic accuracy of ultrasound 27
differential diagnosis 27
direct and indirect signs 27
in girls 331
incidence and risk factors 26
interstitial 27f
pseudogestational sac 23–24, 27
tubal 26, 28f
Elastography, breast 202
Elbow
muscles 422, 423
synovial bursae 422, 423
tendons 422–423, 423f, 424f
Embryo 9
first trimester 15–16
size measurement 11–12
intrauterine sac without 23–24
linear growth 12
shape change 16
Embryo–fetal anomalies, first trimester 31–34
Embryogenesis 15–16, 18
pancreas 266
spine 379–380, 380f
Embryonal rhabdomyosarcoma of biliary tree 235, 235f
Embryonal sarcoma, undifferentiated 235, 235f
Embryonic demise 23, 25, 25f, 27f, 29
Embryonic disc 15–16
Embryonic splitting 18–19
Encephalomeningocoele 92
Encephalopathy, anoxic–ischaemic 371, 371f
End-diastolic flow
intrauterine growth restriction 58, 58f,
124–125
peak systolic velocity ratio 57, 58
reduced/reverse 59f, 124, 126
intrauterine growth restriction 57, 57f,
58, 58f, 124–125
velocity, middle cerebral artery Doppler
waveform 124–125
chronic hypoxia effect 124
factors affecting 123, 125
velocity, umbilical artery Doppler waveform
123, 124
absent, perinatal mortality 126
reduced 124
Endocervical canal 174f
widening 73
Endometrial carcinoma 156–158, 157f, 158f
differential diagnosis 158
recurrences 161, 162f
Endometrial disease, benign 148–152
Endometrial hyperplasia 149–150, 149f
Endometrial polyps 150, 150f, 151f
Endometrial–myometrial junction 140, 148, 150, 154, 155f
in endometrial carcinoma 156, 157f
Endometriotic cysts 170, 170f
Endometritis 148, 149f
Endometrium 139, 140
adhesions (synechiae) 152
atrophic 140
cystic atrophy 151
factors affecting appearance 148
increased thickness in disease 148
hyperplasia 149–150, 149f
neoplasms 156
postmenopausal state 140, 156
stroma, in myometrium 154–155, 155f
stromal proliferation 149–150, 149f
tamoxifen effect 150, 151–152
thickness changes in menstrual cycle 140,
140t, 141f, 315
in tuberculosis 148
tumours 156–158
Endomysium 451, 452
Endotendon 409
Entamoeba histolytica 242
Enterocolitis, necrotizing 288, 288f
Entheses 410, 411f
978-9241548540-INDEX PRF ml ln ml ml-1-Final Proof.indd 487 6/10/13 10:29 AM
488
Enuresis 314
Ependymal cyst 379f
Epicondylitis 423
Epidermoid cysts 392
splenic 261, 261f
Epididymal head, normal 333, 334f
Epididymis (paediatric)
malignant tumours 340
normal 333, 334f
Epimysium 451, 452, 452f
Epiphysis (paediatric)
fracture-separation (neonatal) 387, 388f
normal 384, 384f
Escherichia coli 239, 289, 302
Exomphalos 32
Extensor tendons
fingers 429, 430f
forearm 425f
wrist see Wrist
External os 72f, 174f
Extra-axial fluid 374, 374f
Extrahepatic ducts see Biliary tree (extrahepatic)
[F]
Fallopian tubes 174–189
adhesions 177–178, 177f
anatomical segments 174f
carcinoma 186
convoluted, retort-shaped 183, 183f, 184f
diseases 178–189
inflammatory see Tubal inflammatory
disease
distal (ampulla) extremity 174, 174f, 175,
175f, 176f, 177f
ectopic pregnancy 26, 28f
hyperechoic septa 178
hysterosalpingo-contrast sonography
186–189
incomplete septum 178, 179f, 183, 183f
inflammation see Tubal
inflammatory disease
infundibular section 174, 174f, 175,
175f, 177f
interstitial part 174–175, 174f, 175f
isthmic part 174, 174f, 175
normal 174–176
occlusion 183, 186, 189f
patency 186, 189f
evaluation see Hysterosalpingo-contrast
sonography (HyCoSy)
salpingitis with incomplete septa 178, 179f,
183, 183f
spasm 187
tortuous 189f
wall structure/thickness, inflammatory
disease 178, 182, 183
Fallot’s tetralogy 105, 105f, 106f
Familial polyposis coli 234
Fasting 230, 272
Fatty deposits, pancreas 267
Fatty liver 245, 245f
Fecaliths 276, 277f
Female pseudohermaphrodism 328, 329f
Femoral head, paediatric abnormalities 385, 386f
Femoral rectum muscle 455f
myositis ossificans 456, 456f
Femur
abnormal shape and hypoplastic 116, 116f
normal 115f
Femur length (fetal)
fetal weight estimation 48, 49t
intrauterine growth restriction diagnosis 55
measurement
second trimester 41, 42f
third trimester 45, 45f, 46, 46f
variability 46
Fetal malformations 89–118
detection, first trimester 18
gastrointestinal tract 106–108, 107f,
108f, 109f
head 90–96, 91f, 92f, 93f, 94f, 95f, 96f
heart 100–106, 101f, 102f, 103f, 104f,
105f, 106f
978-9241548540-INDEX PRF ml ln ml ml-1-Final Proof.indd 488 6/10/13 10:29 AM
489
lungs 98–99, 98f, 99f, 100f
skeletal system 114–118, 115f, 116f,
117f, 118f
spine 96–98, 97f
urinary tract 110–113, 110f, 111f, 112f,
113f, 114f
see also Congenital anomalies
Fetal membranes 14–15
Fetus 9
anomalies see Fetal malformations
biometric parameters (third trimester) 43–46
abdominal measurements 44–45, 45f
head measurements 43–44, 44f
intrauterine growth restriction diagnosis
54, 55–56, 56f
limb measurements 45–46, 45f, 46f
bladder see Bladder, fetal
body composition 50
body configuration, macrosomia 51
brain see Brain
breathing movements, umbilical artery
Doppler 123
chest see Chest
circulation assessment 118
Doppler 122–126
death
causes 87
conjoined twins 88, 89f
fetus papyraceus 89
monoamniotic pregnancies 87
partial hydatidiform mole vs 29
severe hypoxaemia/placental insuf-
ficiency 58, 126–127
twin 87–88
twin–twin transfusion syndrome 86,
86f, 87
first trimester 15–16
growth and development 40, 53
assessment, reference ranges 40, 48
first trimester 16, 18, 18f
individualized models 48
multiple pregnancies 81, 83
normal 43
regulation 53
requirements for 53
restriction see Intrauterine fetal growth
restriction
second trimester see Fetus, morphology
third trimester 43–46
see also Fetus, biometric parameters
growth rate 43, 53
head see Head (fetal)
heart see Heart (fetal)
hypoxaemia prediction see Hypoxaemia (fetal)
hypoxic 55
lungs see Lung (fetal)
macrosomia 50–51
morphology assessment in second trimester
35–42, 89
abdomen 40, 40f, 41f
chest 38, 38f, 39f
extremities 41, 42f
head 35–37, 36f, 37f
sensitivity 90
timing, reasons for 89
vertebral column 38, 38f
movements, first trimester 16
nuchal translucency see Nuchal translucency
thickness
pleural effusion 99, 99f
size charts 43
size measurement, first trimester 11–12
spine see Spine (fetal)
weight
discordance in twin pregnancies 83, 84
estimation 40, 48, 49t, 50
excessive 48
growth restriction diagnosis 54, 55
increase, rate of 53
macrosomia, weight prediction 50
multiple pregnancies 81, 83, 84
optimum 48
prediction 50
twin pregnancies 83
978-9241548540-INDEX PRF ml ln ml ml-1-Final Proof.indd 489 6/10/13 10:29 AM
490
Fetus in fetu 89
Fetus papyraceus 89
Fibroadenoma 207–208, 208f
differential diagnosis 208
Fibroadipose septa 451, 453
Fibrocartilage 410, 411f
Fibrocystic changes, breast 211–212, 212f
Fibrocystic mastopathy 211, 212f
Fibroids (uterine) 152–154
calcified 151f, 152
changes in size, factors affecting 152
intramural 153, 154f
pedunculated 153
submucosal 153, 153f, 154f
subserosal 12f, 153
Fibrolipoadenoma 213, 213f
Fibroma, ovarian 172
Fibromatosis 392
superficial 462, 462f
Fibromatosis colli 351, 352f, 391–392
Fibrosis, muscle rupture complication 455, 455f
Fibrothecoma 172
Filum terminale 379–380, 379f, 380f
thickened, tight syndrome 381, 382f
Fine-needle aspiration, breast 201
Finger(s), tendons 429, 430f, 431f, 432f
extensor apparatus 429, 430f
flexor 429, 431f, 442, 443f, 444
see also Finger pulley systems
tenosynovitis 429, 432f
Finger pulley systems 442–446, 443f
annular pulleys 442, 443, 443f, 444f
A1, thickening 444, 446f
A2, rupture 444, 445f
cruciform pulleys 442, 443, 443f
distance from tendon to cortical bone 444,
444t, 445f
functions 443
indirect signs of lesions 444, 444t
lesions 443, 444, 445f
Flexor retinaculum 425, 426f, 463
Flexor tendons
fingers see Finger(s), tendons
hands 429, 431f
wrist 425
Fluid, drinking before transabdominal ultrasound 10, 71, 134
Focal nodular hyperplasia 237, 238f
Fontanelle, anterior, examination technique 361, 361f
access difficulties 365
normal anatomy 362f
Fontanelle, mastoid 361
Fontanelle, posterior 361, 365
Foot, fetal 115f
Forearm extensors, common tendon
examination, normal findings 425f
tendinopathy 412f, 423
Forearm flexors, common tendon, examination, normal findings 425f
Foreign body
chronic, inflammation 392
soft-tissue 392, 393f
vaginal 324
Fourier spectrum analyser 121
Fractures, occult, in children 387
Frontal bossing 116, 117f
Frontal horns 363f
atrial width 37
bull’s horn configuration 374f
fused 93
Frontal–occipital diameter (fetus)
second trimester 36f
third trimester 44, 44f
Fungal microabscesses, liver 240
[G]
Galactocoele 213, 214f
Galen vein, aneurysm 373
Gall bladder
fetal 106, 107f
paediatric
biliary sludge in 251, 251f, 254f
calculi in 252, 253f
distension (hydrops) 253, 254f
978-9241548540-INDEX PRF ml ln ml ml-1-Final Proof.indd 490 6/10/13 10:29 AM
491
inflammation 252
neonatal hepatitis syndrome 247
normal 231, 232f
small, in biliary atresia 247, 247f
Gall stones 252, 253f
Gastrocnemius muscle, bursa 457, 458f
Gastrointestinal tract see Digestive tract
Gastro-oesophageal reflux 284, 284f
Gastroschisis 32, 34f, 108, 109f
Genitalia, ambiguous 309, 328, 329f, 330f
Genitography 328, 329f, 330f
Germ cell tumours
ovarian see Ovarian tumours
testicular 340, 341t
Germinal matrix haemorrhage 367
subependymal 364
Gestational age
accuracy, crown–rump length
measurement 12
calculation, gestational sac diameter 11
at delivery, cervical length and 75
estimation by ultrasound
anamnestic (menstrual) discrepancy 35, 55
crown–rump length relationship 17t
first trimester 9, 11, 12, 14t
guidelines/landmarks 14t
second trimester 35
importance, fetal growth restriction
diagnosis 55
umbilical artery Doppler waveform 123
Gestational sac 13, 14f, 24f
absent 23
diameter, measurement 11, 12f
ectopic pregnancy and 26
embryo in, but cardiac activity absent 25
empty 23–25, 25f
gestational age at visualization 13, 23
multiple pregnancies 81
normal growth rate 24
normal vs abnormal 24
spontaneous expulsion 25f
tubal 28f
without embryo or yolk sac 23–24
Gestational trophoblastic disease 29–31, 66–67
see also Hydatidiform mole (molar
pregnancy)
Geyser sign 420
Gharbi’s classification, hydatid cysts 242, 242f, 243f, 244f, 279, 303
Glenohumeral joint
complete rotator cuff rupture 418
haemorrhage 420, 421f
liquid in 420–421, 421f
Glucose, fetal growth and 53
Gluteus medius tendon 432, 433f
tendinopathy 432, 433f
Gluteus minimus tendon 432, 433f
tendinopathy 432, 433f
Goitre 350
Gonadal dysgenesis 325, 330f
mixed 331
Granuloma, lipophagic 215
Granulosa-cell tumours 172–173
Graves’ disease 349
Greater trochanter, painful 432, 433f
Gynaecological ultrasound 133–189
adnexal lesions see Adnexal lesions
artefacts 134
choice of technique 133
Fallopian tubes 174–189
see also Fallopian tubes
normal findings 137–144
ovaries 141–144
uterus 137–141
see also Ovaries; Uterus
pelvic structures 135f, 136f
preparation and techniques 134–137
transabdominal 134–135
transvaginal 133–134, 135–137
uses/indications 133, 163
uterine disorders see Uterus, disorders
Gynaecomastia 216, 216f
dendritic 216, 217f
glandular 216
nodular 216, 216f
978-9241548540-INDEX PRF ml ln ml ml-1-Final Proof.indd 491 6/10/13 10:29 AM
492
[H]
Haemangioendothelioma 236–237, 237f
neck 352
Haemangioma 390
capillary 352, 390
cavernous 237
cutaneous 236
liver, in children 237
parotid 352, 352f
placental 66
Haematocolpos 146, 323, 323f, 325, 326f
Haematological malignancies
hepatosplenomegaly 264
spleen 260
see also Leukaemia; Lymphoma
Haematoma(s)
bowel 284, 285f
breast 207, 207f
intermuscular 455
intrahepatic 240, 241f
intramural (bowel) 284, 285f
intrauterine 22–23, 22f
perirenal 313f
placental 64
renal parenchymal 313f
renal subcapsular 313f
soft-tissue 392
splenic parenchymal 263, 263f
sternocleidomastoid muscle (fibromatosis
colli) 351, 352f, 391–392
testicular 341
Haematometra 323
Haematometrocolpos 323, 325
Haemodynamic changes
after intrauterine twin death 87
intrauterine growth restriction 56–58, 57f,
58f, 59f
Haemodynamic distress, severe (neonates) 372, 372f, 373f
Haemodynamics, neonatal cranial ultrasound 363–364, 364f
Haemoglobinopathy 260
Haemolymphangioma 263
Haemolytic uraemic syndrome 289, 304, 305f
Haemorrhage
adrenal 310, 310f
germinal matrix 364, 367
glenohumeral joint 420, 421f
intraventricular see Intraventricular
haemorrhage
muscle rupture complication 455
premature brain, follow-up 365, 366f
retroplacental 64
subchorionic 22, 22f
Haemosiderin, endometriotic 170, 170f
Haglund deformity 439, 440f
Hamartoma
breast 213, 213f
cystic mesenchymal 237, 238f
Hand
fetal 18f, 115f
second trimester assessment 41, 42f
see also Finger(s), tendons
Harmonic imaging, breast 201–202
Hashimoto disease 349, 349f
Head (embryo) 16, 18f
Head (fetal)
abnormal shape 116
anencephaly 31
biparietal diameter see Biparietal diameter
of head
circumference see Head circumference
first trimester 18f
malformations 90–96, 91f, 92f, 93f, 94f, 95f,
96f
normal 90f
second trimester assessment 35–36, 90
third trimester measurements 43–44, 44f
variability 46
Head circumference (fetal)
fetal weight estimation 48, 49t
intrauterine growth restriction diagnosis 55
measurement
second trimester 35–36, 90f
third trimester 44, 44f
978-9241548540-INDEX PRF ml ln ml ml-1-Final Proof.indd 492 6/10/13 10:29 AM
493
Heart (fetal)
four-chamber view 100, 101f
anomalies detected by 102, 103f, 104f
left outflow 38, 39f, 100, 101f
malformations see Cardiac anomalies
outflow tract anomalies 105–106, 105f, 106f
right outflow 38, 39f, 100, 101f
three-vessel view 100, 101f
Heart beat, first trimester 16
Heart chambers see Cardiac chambers
Heart rate see Cardiac rate
Heat generation by ultrasound 4–5
Henoch–Schönlein purpura 287, 287f, 342
Hepatic contusions 240, 240f, 241f
Hepatic disorders see under Liver
Hepatic vein (paediatric) 232, 233f
thrombosis 233–234
Hepatitis 246
chronic 246
neonatal see Neonatal hepatitis syndrome
Hepatoblastoma 234, 234f
Hepatocellular carcinoma 234
Hepatomegaly 246
Hepatosplenomegaly 264
Hermaphroditism 328
true 329–330
Hernia
hiatus 360
inguinal scrotal 336
muscle 456–457, 457f
Heterotopic pregnancies 26
Hiatus hernia 360
Hilus sign 345, 346f, 391
Hip
anatomy 432
bursae 432
irritable 386
normal (paediatric) 386f
septic dislocation 389, 390f
snapping 434, 434f
subluxation 385, 386f
Hodgkin lymphoma 260f, 353
hepatosplenomegaly 264
Hoffa pad 435, 435f
Holoprosencephaly 31, 32f, 93
alobar 31, 32f, 93, 94f
lobar 93
semilobar 93
Human chorionic gonadotropin (hCG)
absent intrauterine sac 22
chorioncarcinoma 31
ectopic pregnancy diagnosis 26
spontaneous abortion diagnosis 23
Humerus
largest tubercle 419f
irregular outline 420, 420f
measurement, third trimester 45, 46f
Hyaline membrane disease 366f
HyCoSy see Hysterosalpingo-contrast sonography (HyCoSy)
Hydatid cyst(s) 279
abdominal masses due to 279
liver 242, 242f, 243f, 244f, 279
neck 353
primary pelvic 331, 332f
pulmonary 358, 359f
spleen 262, 262f
urinary tract 303, 304f
Hydatid disease 242, 262, 303
Hydatid of Morgagni 333
torsion 340
Hydatidiform mole (molar pregnancy) 29, 66, 67f
benign 29, 66
coexisting fetus with 67
complete 29, 30f
differential diagnosis 67
invasive 31
partial 29, 30f, 67
sonographic features 29, 30f, 66–67, 67f
Hydramnios 69, 70
Hydranencephaly 31
Hydrocephalus/hydrocephaly
first trimester 31, 32f
macrocephaly due to 91, 92f
neonates 376
Hydrocoele 337, 337f
complex 339
978-9241548540-INDEX PRF ml ln ml ml-1-Final Proof.indd 493 6/10/13 10:29 AM
494
Hydrocolpos 323
Hydrometrocolpos 146, 147f, 323
Hydromyelia 381, 382, 382f
Hydronephrosis 112, 113, 113f, 296
evolution, grading system 297
vesico-ureteral reflux causing 296, 298f
Hydropneumothorax 358
Hydrops, fetal 20f, 33f, 108
twin–twin transfusion syndrome and 86
Hydrops, of gall bladder (paediatric) 253, 254f
Hydrosactosalpinx 27
Hydrosalpinx 28f, 179f, 180f, 183, 184f, 185
chronic 184f
Hyperaesthesia, carpal tunnel syndrome 463
Hyperbilirubinaemia, conjugated 246
Hypercholesterolaemia, familial 437
Hyperhydration 134
Hyperperistalsis 401, 401f
Hypertension 314
intracranial 365, 366f
maternal 53
renal origin 314
Hyperthyroidism 350
Hypertrophic pyloric stenosis 283, 283f
Hypogastric arteries 110f, 134
Hypomineralization of bone 116, 118f
Hypoperistalsis 403
Hypoplastic left heart syndrome 102, 104f
Hypospadias 329f
Hypotelorism 96, 96f
Hypothermia, neonatal 61
Hypothyroidism, infants 348, 348f
Hypoxaemia (fetal)
prediction from middle cerebral artery
124–125, 125t
prediction with venous Doppler 126–127
umbilical venous blood redistribution 126
Hypoxia
fetal 55
neonatal 371, 371f
Hysterosalpingo-contrast sonography (HyCoSy) 186–189
advantages 188–189
air and saline 186, 187, 188
contrast media 187, 188, 189
criteria for tubal patency 187–188
method 187, 188
results 189f
safety and advantages 188
Hysterosalpingography 186
[I]
Ileocaecal junction 398
Ileojejunal obstruction 106, 108f
Ileum, terminal
Crohn disease 286, 286f
obstruction 402–403, 402f
Ileus 276
Imbalanced fetus–fetus transfusion see Twin–twin transfusion syndrome
Impact syndrome 413
Implantation, intrauterine blood association 22
Infant(s)
gastro-oesophageal reflux 284, 284f
vomiting 282–284
see also Neonates; Paediatric ultrasound
Infantile polycystic kidney 295–296
Infections/infectious diseases (paediatric)
bone/joints 388, 389f, 390f
cerebral, in neonates 375, 375f, 376f
kidneys 302–303, 302f, 303f
neck 353
soft-tissue 393–394, 394f
spinal cord 383
spine 383
spleen 259
urinary tract 302–303, 302f, 303f, 312
Inferior vena cava (fetal) 57, 126
Inferior vena cava (paediatric) 233f
interruption, polysplenia with 257, 257f
Wilms tumour extension 300f
Infertility, female 186, 188
Inflammatory bowel disorders 286, 286f, 287f
Inflammatory disease, tubal see Tubal inflammatory disease
978-9241548540-INDEX PRF ml ln ml ml-1-Final Proof.indd 494 6/10/13 10:29 AM
495
Informed consent, breast biopsy 201
Infraspinatus tendon 412, 421f
examination technique 413, 416f
normal ultrasound findings 416f
Inguinal canal
delayed obliteration 336
normal 335
undescended testes in 336, 336f
Inguinal scrotal hernia 336
Inspissated bile syndrome 251, 251f
Insulinoma 271
Interamniotic septum, thickness 78
Inter-decidual sign 13
Interdigital nerve thickening 459, 460f
Intermetatarsal bursitis 459
Internal cervical os 72f, 73
placental location and 52, 65, 70, 71f
Internal jugular veins 348f
anatomical variant 344, 344f
Intersex states 328–331, 329f, 330f
Interventricular defect 102, 103f, 105
Intestinal obstruction (fetal) 106
Intestinal obstruction (neonatal) 395–403
complications 404–405, 405f
duodenal see Duodenal obstruction
malrotation complication 396, 398–400,
399f, 400f
small bowel 400–403
Intestinal volvulus 398, 399f
Intracranial hypertension 365, 366f
Intraductal papilloma, breast 209, 210f
Intrahepatic vessels/ducts 232, 233f
Intraperitoneal fluid, ectopic pregnancy 27, 28f
Intrauterine blood, first trimester 22–23
Intrauterine death 58
see also Fetus, death
Intrauterine fetal growth see Fetus, growth and development
Intrauterine fetal growth restriction 47, 53–62
biometry (ultrasound) 55–56, 56f
brain-sparing effect 57, 58f, 124–125
causes 53–54, 54t
definitions 54, 55
diagnosis 54–55, 55–56, 56f, 61
future prospects and prevention 62
haemodynamic modifications 56–58, 57f,
58f, 59f
incidence 54
management and delivery planning 59–60
monitoring strategy 59, 60–61
multiple pregnancies 83–84
outcome/prognosis 56, 58, 61
perinatal and long-term sequelae 61
symmetric vs asymmetric 54–55, 56f
twin pregnancies 81
Intrauterine fluid collections 22, 152
Intrauterine haematoma 22–23, 22f
Intrauterine sac 23–24, 24f
see also Gestational sac
Intraventricular haemorrhage (paediatric) 364, 365, 366f, 367
grading 367, 368f
long-term follow-up 367, 368f
premature infants 364
Intussusception 275–276, 276f, 287
Ischaemic bowel disease 288, 288f
Ischaemic lesions, neonatal brain see Neonatal cranial ultrasound
Ischaemic–haemorrhagic periventricular infarct 364–365
Ischiopagus 88
Islet-cell tumours 271
Isometric contraction, muscle 451
Isotonic contraction, muscle 451
[J]
Jaundice 235, 246, 249
Jejunal obstruction 106, 108f
Jejunoileal atresia 401
Joints (paediatric)
abnormalities 385–390
infections 389, 389f, 390f
normal findings 384
978-9241548540-INDEX PRF ml ln ml ml-1-Final Proof.indd 495 6/10/13 10:29 AM
496
Jugular veins
normal 344
thrombosis 353
see also Internal jugular veins
Jumper’s knee 435
Juvenile dermatomyositis 394
Juvenile rheumatoid arthritis 394
[K]
Kager fat pad 437, 438f, 439, 441f
Kidney(s) (fetal)
absent 110, 111f
dysplastic 113, 114f
ectopic 110
examination 110
normal, third trimester 46f, 110, 110f
polycystic disease 110, 112f
second trimester 40, 41f, 110
unilateral multicystic disease 112, 112f
volume, third trimester 46, 46f
Kidney(s) (paediatric)
abscesses 303, 303f
absent (unilateral) 293
anatomical variants 291, 291f
calculi 298–299, 298f, 299f
calyceal diverticula 294, 294f
calyces 291f
hydronephrosis evolution and 297
central sinus 290, 290f, 291f
congenital anomalies, screening 314
cortex 231f, 291, 291f
neonates 289–290, 290f
crossed-fused ectopia 293
cysts see Renal cysts
duplex 293
duplication 293
dysplastic 295, 295f
ectopic 293
examination 289
fetal lobulation persistence 291, 291f
haematoma 313f
horseshoe 293, 294f
hydatid cyst 303, 304f
infectious/parasitic diseases 302–303, 302f,
303f
lymphoma 299, 301f
macrocysts 296
medullary pyramids 290, 290f, 291
stones 299, 299f
multicystic dysplastic 295, 295f
parenchyma 290, 290f, 303
parenchymal haematoma 313f
polycystic disease 295–296, 296f
scarring 291, 303
size, children 291–292, 292f
small 294
trauma 313, 313f, 314f
tumours 299, 300f, 301f, 302f
ultrasound examination see under Urinary
tract
see also entries beginning renal
Knee 435–437, 435f, 436f
bursae 437, 457, 458, 458f
stability 451
Krukenberg tumour 173, 173f
[L]
Labial fusion 329f
Labour induction, prediction of success 71, 75
Laceration(s)
liver 240, 241f
pancreas 270, 270f
spleen 263, 264f
Ladd band 396, 397, 398
Lambda sign 19, 78
Lap-and-dye test 186, 188
Large bowel see Bowel
Lateral epicondylitis 423
Lateral ligament complex (ankle) 447–450, 447f, 448f
chronic lesions 450, 450f
direct signs 449
injuries 448
lesion classification 449
978-9241548540-INDEX PRF ml ln ml ml-1-Final Proof.indd 496 6/10/13 10:29 AM
497
Lateral ventricles, atrial width 35, 36f, 37, 93
Ledderhose disease 462, 462f
Left internal jugular vein 344, 344f
Left ventricular dilatation 102, 104f
Legg-Calve-Perthes disease 387
Leiomyosarcoma 161
Lemon sign 95f, 96, 98
Leukaemia
hepatosplenomegaly 264
metastases, of epididymis 340
splenomegaly 260
Leukomalacia, periventricular 367, 369f
Ligament(s) 446–450
normal paediatric findings 384
structural features 446
Limb buds 16
Limbs (fetal)
abnormal contractions 118
hypoplasia 114
malformations 114, 115f, 116, 116f
normal 115f
second trimester assessment 41, 42f
third trimester measurements 45–46,
45f, 46f
see also Lower limbs
Limp, in child 386–387
Lipoblastoma 392
Lipoma 392
spinal 381
Lipomyelocoele 381
Lipomyelomeningocoele 381
Liponecrosis 215, 215f
Lipophagic granuloma 215
Lister tubercle 427
Liver (paediatric)
abscess 239–240
amoebic 240
pyogenic 239, 239f
adenoma 239
cirrhosis 252
congenital anomalies 237
contusions 240, 240f, 241f
fatty infiltration (steatosis) 245, 245f
focal nodular hyperplasia 237, 238f
fractures 240
haematomas 240, 241f
hydatid cyst 242, 242f, 243f, 244f, 279
rupture 242
lacerations 240, 241f
measurement 230, 231f
normal dimensions 230
non-neoplastic diseases 239–253
parenchyma
destruction, cirrhosis 252
normal 230
trauma 240, 240f, 241f
tumours 233–239
benign 236–239
metastases 236, 236f
primary malignant 233–235
Liver (fetal), size, third trimester 44
Liver and biliary tract, paediatric ultrasound 229–253
examination technique 230
indications 229–230
normal findings 230–232, 231f, 232f, 233f,
290f, 291f
pathological findings 233–253
preparation 230
see also specific diseases under ‘liver’
Long bones
fetal malformation 114, 115f, 116, 116f
see also Femur
Low birth weight 48
Lower limbs
micromelia 114, 115f
normal, second trimester 115f
tendons 432–442
Lung (fetal) 98f
cystic adenomatoid malformation 98, 99f
hypoplasia 99, 116
malformations 98–99, 98f, 99f, 100f
second trimester assessment 38, 38f
Lung (paediatric)
abscesses 358–359
atelectasia 258f
978-9241548540-INDEX PRF ml ln ml ml-1-Final Proof.indd 497 6/10/13 10:29 AM
498
consolidation 358, 359f
hydatid cyst 358, 359f
parenchymal diseases 358–360
tumours 359–360
Lymph nodes (paediatric)
axillary 199, 199f
metastatic carcinoma 225–226, 226f
cervical (neck) 391
inflammation 347, 347f
malignant tumours 353
normal 345, 346f
tuberculous 347, 348f
intramammary 199, 200f
intraparenchymal, of breast 210, 211f
jugular 347
malignant, appearance 391
mediastinal 359–360
mesenteric 278, 279f
enlarged 281, 281f
para-aortic 281
para-iliac 281
submandibular 347
tuberculous 347, 348f
Lymphadenitis
cervical 347, 348f
mesenteric 275, 278, 279f
Lymphadenopathy 391
mesenteric 281, 281f
Lymphangioma(s) 391
abdominal masses 279
cervical cystic 353, 353f
cystic (soft-tissue) 391
splenic 262–263
thoracic 356, 356f
Lymphatic vessels, congenital malformations 279, 391
Lymphoma
Burkitt see Burkitt lymphoma
hepatosplenomegaly 264
Hodgkin see Hodgkin lymphoma
non-cystic abdominal masses 281
ovary involvement 331, 332f
renal 299, 301f
splenomegaly 260, 260f
testicular 340–341
see also Non-Hodgkin lymphoma
[M]
Macrocephaly 91, 92f
Macrosomia, fetal 50–51
Magnetic resonance imaging (MRI)
calcaneus tendon rupture 441f
cerebral malformations (neonates) 373
choledochal cyst 250f
embryonal rhabdomyosarcoma of biliary
tree 235f
endometrial carcinoma 156–157, 158
lateral ligament complex of ankle,
injuries 449
osteomyelitis 388
plantar fasciitis 461
premature brain examination 367, 368
primary pelvic hydatid cyst 332f
Male breast disease 216, 216f
carcinoma 225, 225f
Male pseudohermaphroditism 329–330, 330f
Mammography 193, 218
Mastitis
acute 205–206, 206f
uncomplicated 205, 206f
Mastopathy, fibrocystic 211, 212f
Maternal age 82
Maternal floor infarct 64
Maternal nutrition 53
Mayer-Rokitansky-Küster-Hauser syndrome 146, 325
Mechanical index 5
Meckel-Gruber syndrome 110
Meconium 402
failure to pass 402, 403
Meconium ileus 402–403, 402f, 403f
Meconium peritonitis 404, 405, 405f
Meconium pseudocyst 405, 405f
Medial epicondylitis 423
978-9241548540-INDEX PRF ml ln ml ml-1-Final Proof.indd 498 6/10/13 10:29 AM
499
Median nerve
compression see Carpal tunnel syndrome
hardening 463
measurement methods 463, 464f, 465
tapering 463, 465
thickened 463, 464f, 465
Mediastinum, diseases 358–360
masses 359–360
Medullar carcinoma, breast 223, 223f
Medullaris conus see Conus medullaris
Mega cisterna magna 94, 95f
Megacystis 32, 34f
Megacystis-microcolon-intestinal hypoperistalsis syndrome 403, 404f
Megaureter 112, 296
primary 306, 306f
Melanoma, malignant, metastatic breast lesions 225
Meningitis, neonates 375, 375f
Meningocoele 92, 96, 97f
Meningo-encephalocele 31
Menopause/postmenopausal state
bleeding (postmenopausal) 156
endometrial thickness 140, 156
fibroid size and 152
ovarian follicles and 144, 144f
ovarian volume 141
uterine measurements 138
Menstrual age
crown–rump length measurements and
11–12
prediction from abdominal circumference
45, 45f
prediction from biparietal diameter 43–44
prediction from femur length 46
prediction from head circumference 44
ultrasound gestational age discrepancy
35, 55
Menstrual cycle
congenital anomalies of uterus and 146, 147
endometrial thickness changes 140, 140t,
141f, 315
ovarian structural changes 142, 142f, 143
Mesenchymal hamartoma, cystic 237, 238f
Mesenteric cyst 279, 280f
Mesenteric fat 286f
Mesenteric lymphadenitis (adenitis) 275, 278, 279f
Mesenteric lymphadenopathy 281, 281f
calcifications 281f
Mesenteric vessels
malrotation of midgut 398, 399, 399f
normal 397f
Mesomelia 114
Mesotendon 409
Metabolic diseases, hepatosplenomegaly 264
Metaphysis, paediatric 384f, 385f
Microabscess
fungal, in liver 240
splenic 260f
Microbubbles 5
Microcephaly 91, 91f
Microcolon 397, 401f, 404f, 405f
megacystis-microcolon-intestinal hypoperi-
stalsis syndrome 403, 404f
Microlithiasis, testicular 342–343, 342f
Micromelia 114, 115f, 118t
Microphthalmia, unilateral 96, 96f
Midgut herniation 16, 17f
Miscarriage, spontaneous, frequency 21
Misdiagnosis risk 4
Mitral atresia 104f
Mixed gonadal dysgenesis 331
M-mode ultrasound, spinal cord and cauda equina 377
Molar pregnancy see Hydatidiform mole (molar pregnancy)
Monoamniotic twins see Twin pregnancies, monoamniotic
Monochorionic diamniotic twins 18, 78, 79f, 80, 85f
Monochorionic monoamniotic twins 18, 78, 87, 88
Monochorionic pregnancy 18, 19, 33, 76, 78
complications 84–87
fetal loss risk 84
intrauterine growth restriction 84
monitoring frequency 82
stuck twin 84
978-9241548540-INDEX PRF ml ln ml ml-1-Final Proof.indd 499 6/10/13 10:29 AM
500
twin death, and outcome for surviving twin
87–88
twin reversed arterial perfusion sequence 88
twin–twin transfusion syndrome 84
Monozygotic twins see Twin pregnancies, monozygotic
Morton neuroma 459, 460f
Mucinous carcinoma, breast 222, 222f
Müllerian agenesis/hypoplasia 325
Müllerian duct 176
anomalies 146, 325
Multicystic dysplastic kidneys 295, 295f
Multicystic kidney disease (fetal) 112, 112f
Multilocular cystic nephroma 299, 302f
Multiple pregnancies 76–89
amniotic fluid volume 70
cervical length 73
diagnosis 76–77
fetal and maternal risks 76
fetal growth and weight 81
first trimester 78, 79f, 80, 80f, 81
aims of/indications for ultrasound 76, 77
incidence 76
indications for ultrasound 76–77
monitoring frequency 82
normal findings 77–81
pathological findings 82–89
congenital anomalies 82–83
fetal growth differences 83, 84
intrauterine growth restriction 83–84
intrauterine twin death 86, 87–88
monochorionicity complications 84–87
twin reversed arterial perfusion
sequence 88
preparation for ultrasound 77
second trimester 81
aims of ultrasound 77
see also Twin pregnancies
Murphy sign 253
Muscle 451–457
contractions 451
cyst 455, 456f
grading of lesions 452, 453, 453t
hernia 456–457, 457f
normal architecture 451, 452f
regeneration 453, 454f
ruptures 451–455
acute complications 455
chronic complications 455–457
complete 453t, 454f
partial 453t, 454f
ultrasound findings 452
stretching injury 452, 453f, 453t
structure and composition 451, 452f
trauma 451, 452, 453
post-trauma evaluation 452
types 451
Musculoskeletal system 409–465
disorders 457–465
foreign bodies 392, 393f
paediatric ultrasound 383–394
bones and joints 385–390
examination technique 383–384
indications 383
infections 388, 389f
normal findings 384, 384f, 385f
pathological findings 385–394
soft-tissues see Soft-tissue abnormalities
(paediatric)
trauma 387
see also Ligament(s); Muscle; Tendon(s)
Musculo-tendinous junction 409, 454f
Musculo-tendinous units 410, 411
Myelocoele 380
Myelomeningocoele 380
Myomas see Fibroids (uterine)
Myometrium 139–140
benign disease 152–155
adenomyosis 154–155, 155f
fibroids see Fibroids
invasion, endometrial carcinoma 156
involvement in cervical carcinoma 160
placental villi invading 66
Myositis ossificans 455–456, 456f
978-9241548540-INDEX PRF ml ln ml ml-1-Final Proof.indd 500 6/10/13 10:29 AM
501
[N]
Naboth cysts 140
Naked tuberosity sign 422, 422f
Nasal bone (fetal)
absent 20, 21
examination 21
normal 20f
visualization, gestational age 21
Neck (paediatric) 343–353
congenital cystic malformations 346, 347f
infectious and parasitic diseases 353
lymph nodes
abnormal 347, 391
normal 345, 346f
lymphadenitis 347, 348f
midline cyst 346, 347f
muscles, normal 345
normal anatomy 343, 344f
paediatric ultrasound
examination technique 343
indications 343
normal findings 343–346, 344f, 345f, 346f
pathological findings 346–353
trauma 351, 352f
tumours 352–353
benign 352–353, 352f, 353f
malignant 353
see also specific anatomical structures
Necrotizing enterocolitis 288, 288f
Neisseria gonorrhoeae 327
Neonatal cranial ultrasound 360–376
arterial blood flow 363–364, 364f
arterial/venous structures 361
examination technique 360–361
indications and preparation 360
normal findings 361–364
anatomical structures 361, 362f
haemodynamics 363–364, 364f
normal variants 363, 363f
pathological findings 364–376
brain tumours 376
cerebral malformations 373, 374f
extra-axial fluid 374, 374f
infections 375, 375f, 376f
ischaemic lesions 369–372, 370f, 371f
premature brain see Brain, premature
Neonatal hepatitis syndrome 246, 248
biliary atresia vs 246, 247
Neonates
adrenal glands (normal) 309, 309f
adrenal haemorrhage 310, 310f
anoxic–ischaemic encephalopathy 371, 371f
arterial ischaemic infarct 371, 371f
bone and joint abnormalities 385–386, 386f,
387, 387f
enlarged thyroid gland 350
fibromatosis colli 351, 352f
gonadal dysgenesis 330f
hypothyroidism 348, 348f
intestinal malrotation 396, 398–400, 399f,
400f
intestinal obstruction see Intestinal obstruc-
tion (neonatal)
ischaemic lesions 369–372, 370f, 371f
kidney, normal 289–290, 290f
necrotizing enterocolitis 288, 288f
neurological distress 372, 373f
ovaries 317, 318f
pancreas, normal 265
renal vein thrombosis 304
severe haemodynamic distress 372,
372f, 373f
superior sagittal sinus thrombosis 371, 372f
teratoma of neck 353
testicular torsion 339, 339f
thyroid diseases 348f
uterine masses 323
uterus 315, 316f
vomiting 396, 398
Nephroblastoma (Wilms tumour) 299, 300f, 301f
Nephroblastomatosis, focal 301f
Nephrocalcinosis 298–299, 299f
Nephrogenic rests 301f
978-9241548540-INDEX PRF ml ln ml ml-1-Final Proof.indd 501 6/10/13 10:29 AM
502
Nephroma, multilocular cystic 299, 302f
Neural tube defects, screening 96, 98
Neuroblastoma
adrenal 310–311, 311f
liver metastases 236, 236f
medial 310, 311f
Neurofibroma 392
Neuroma, Morton 459, 460f
Nipple 195f, 198, 199f
adenoma 214
bleeding, male breast carcinoma 225, 225f
normal anatomy 195, 195f, 198, 199f
Paget disease 221
Non-Hodgkin lymphoma
abdominal mass 282f
cervical lymph nodes 353
metastases, of epididymis 340
ovary involvement 331
see also Lymphoma
Nonthermal biological effects 5
Nuchal translucency thickness 20
abnormal/increased 20, 20f
cardiac defects and 33
trisomy 21 33f
measurement 20, 20f
method 21
upper limit 20
normal 20f
twin pregnancies 83
[O]
Obstetrics scanning 9–129
Doppler, use see Doppler
first trimester 9–34
abortion see Abortion (spontaneous)
aneuploidy screening 20–21
conditions diagnosed by 9–10
definition 9
ectopic pregnancy see Ectopic pregnancy
embryo–fetal anomalies 31–34
end-points 11–13
examination technique 10–13
gestational trophoblastic disease see
Gestational trophoblastic disease
indications and purposes 9–10
intrauterine blood 22–23
normal findings 13–19
pathological findings 21–34
preparation 10, 77
reporting recommendations 128
twin pregnancies 18–19, 77
heating induced by 4
second trimester 35–43
amniotic fluid volume 42
fetal morphology see under Fetus
gestational age estimation 35
indications 35
placenta 42, 43f
reporting recommendations 128–129
third trimester 43–53
amniotic fluid 47, 47f
fetal biometry see Fetus, biometric
parameters
fetal weight estimation 48, 49t
indications 51–53
macrosomia 50–51
placenta accreta 52–53, 52f
placenta praevia 51–52
reporting recommendations 129
Occipital cephalocoele 32f
Oedema, ankle 450
Oesophagus
abdominal
bubbling fluid in 284, 284f
normal 273, 274f
atresia 106, 107f
cervical, normal 273, 274f, 344f
dilated (proximal) 107f
Oligohydramnios 42, 56, 69
bilateral renal agenesis 110, 111f
definition, amniotic fluid volume 69, 70
monochorionic, diamniotic twins 84, 85f
multiple pregnancies 70
Omental cyst 279
Omphalocoele 32, 34f, 108, 109f
978-9241548540-INDEX PRF ml ln ml ml-1-Final Proof.indd 502 6/10/13 10:29 AM
503
Omphalomesenteric duct 14
Omphalopagus 88
Orbits, measurement (fetal) 36, 37, 37f, 90
Orchiepididymitis 340
Osgood-Schlatter disease 387, 435, 436f
Ossification centre 385, 385f
Osteogenesis imperfecta 116, 118f
Osteomyelitis (paediatric) 388, 389f
acute haematogenous 388
Ovarian carcinoma 171
Ovarian cystadenomas, serous and mucous 321, 322f
Ovarian cysts 163f, 169–170
contents 166, 166f
endometriotic 170, 170f
functional 319–320, 319f
adnexal torsion associated 327f
haemorrhagic 320, 320f
neonates/children/adolescents 319–320,
319f
septa 164, 165f
solid papillary projections 164, 165f
types 163, 164t
unilocular 164t, 169
Ovarian fibromas 172
Ovarian follicles 142, 168
central precocious puberty 324f
cysts, autonomous 324
dominant 142, 142f, 143
menopause and 144, 144f
microcystic, in children 317, 318f
microfollicles 145f
multifollicular ovaries 142, 142f, 145
neonatal 317, 318f
polycystic ovary syndrome 144
Ovarian masses 164
acoustic shadows 166, 167f
benign/malignant rules for prediction
167, 168t
children/adolescents 319–323
benign neoplasms 321, 322f
cysts 319–321, 320f, 321f
malignant neoplasms 323
classification 163–168
cystic contents 166, 166f
functional lesions 168
malignant see Ovarian tumours
morphology 163, 164t, 167
physiological structures vs 168
septum/septa 164, 165f
solid papillary projections 164, 165f
specific diagnosis 168
vascularization 167
see also Ovarian cysts; Ovarian tumours
Ovarian parenchyma 169
Ovarian teratoma, mature 321, 322f
Ovarian tumours
benign, in children 321, 322f
borderline 170
mucinous 170, 171f
serous 170, 171f
carcinoma 171
germinal 171–172, 323
benign 171–172
malignant 172
malignant
children 323
prediction, rules for 167, 168t
risk factors 167
metastatic 173
stromal 172–173
tubal inflammatory disease vs 185–186
Ovaries
in acute salpingitis 180, 181f, 182
in congenital adrenal hyperplasia 328
cortex 142, 144
development 146
dysfunction 144–145
epithelium 169
benign neoformations 169–170
borderline transformations 170–171
invasive carcinomas 171
germinal cells 169
herniation 331, 331f
landmarks for transabdominal
ultrasound 134
978-9241548540-INDEX PRF ml ln ml ml-1-Final Proof.indd 503 6/10/13 10:29 AM
504
lymphoma involving 331, 332f
medulla 142
micropolycystic 145f
multifollicular 142, 142f, 145
normal ultrasound findings 141–144,
168, 169f
anatomy 141
changes in menstrual cycle 142, 142f, 143
children 317, 318f, 319f
measurements 141, 163f
structural features 142–144
pelvic inflammatory disease involving 180,
181f, 182
polycystic 144–145, 321, 321f
size 317
stroma 169
stromal volume 145
torsion 326, 327f
transabdominal ultrasound 134, 135f, 137
transvaginal ultrasound 135f
volume 141
neonatal/children 317, 318f
polycystic ovary syndrome 145
at puberty 317, 319f
Ovulation 142, 143, 183
Oxygen, fetal growth and 53
fetal growth restriction and 53, 57,
124–125, 126
[P]
Paediatric ultrasound 229–405
chest 354–360
digestive tract 272–314
liver and biliary tract 229–253
musculoskeletal system 383–394
neck 343–353
neonatal cranial see Neonatal cranial
ultrasound
pancreas 264–272
pelvis 314–331
scrotum 333–343
spine 377–383
spleen 254–264
urinary tract and retroperitoneum 289–314
see also individual anatomical structures
Paget disease of nipple 221
Palmar fibromatosis 462
Pampiniform plexus, dilatation of veins 338, 338f
Pancreas (paediatric) 264–272
abscess 267
anatomical compartments 265, 266f
calcifications 245f
choledochal cyst and 249
congenital short 267
congenital/developmental anomalies
266–267
cystic fibrosis 267
development 266
dimensions 265
enlarged, acute pancreatitis 267, 267f
fracture 271f
laceration 270, 270f
lipomatosis 267
paediatric ultrasound 264–272
examination technique 265
indications 264
normal findings 265, 265f, 266f
pathological findings 266–272
preparation 264
parenchyma 265, 270f
atrophic 270f
trauma 267, 269f, 270, 271f
tumours 271–272
cystic 271–272, 272f
endocrine 271
exocrine 271
Pancreas anular 267
Pancreas divisum 267
Pancreatic duct
dilatation 270f, 285f
paediatric, normal 265, 266f
Pancreatic pseudocyst 267, 268f, 271f
Pancreatitis
acute 267–268
causes 267, 270
978-9241548540-INDEX PRF ml ln ml ml-1-Final Proof.indd 504 6/10/13 10:29 AM
505
complications 267
chronic 269, 270f
hereditary 269
Pancreatoblastoma 271
Papilloma, intraductal (breast) 209, 210f
Paraesthesia, carpal tunnel syndrome 462, 463
Paraovarian cysts 173–174, 176, 176f
children 321
Parasitic infections
abdominal masses 279
neck 353
urinary tract 302–303, 302f, 303f
see also Hydatid cyst(s)
Paratendinitis 439
calcaneus 439, 441f
Paratenon 409, 437
inflammation 439
Paratesticular rhabdomyosarcoma 340
Parathyroid glands
adenoma 351
hyperplastic 351
normal 345
Paratubal cysts 176, 177, 177f
Parotid glands
haemangioma 352, 352f
normal 346
Parotiditis 351
Patellar tendon 435, 435f, 436f
Pectoral muscle 195f, 198
Pelvic abscess 180
Pelvic fluid 177, 177f
Pelvic hydatid cyst, primary 331, 332f
Pelvic inflammatory disease
in girls 327–328, 328f
see also Tubal inflammatory disease
Pelvic masses 331, 331f, 332f
Pelvic ultrasound, polycystic ovary syndrome 144–145
Pelvis (paediatric ultrasound) 314–331
examination technique 315
indications 314–315
normal findings 315–318, 316f, 317f,
318f, 319f
pathological findings 319–331
adnexal torsion 326, 327f
intersex states 328–331, 329f, 330f
ovarian masses see Ovarian masses
pelvic inflammatory disease 327–328, 328f
pelvic masses 331, 331f, 332f
prepubertal bleeding 324
puberty disorders 324–326
uterine masses 323
preparation 315
Pelvi-ureteric junction syndrome 296, 297f
Pepper syndrome 311
Peri-appendiceal abscess 278f, 328f
Pericolonic fat 287f
Perimysium 451, 452, 452f
Peripancreatic fat 267
Peripancreatic fluid 270, 271f
Peripheral vascular resistance, intrauterine growth restriction 57, 124
Perirenal fluid collection 313, 314f
Peritendinitis 439
Peritendinous fluid 444
Peritoneal carcinomatosis 186
Peritoneal inclusion cyst 178, 180
Peritoneal pseudocysts 174
Peritoneal tuberculosis 281f
Peritonitis, meconium 404, 405, 405f
Periventricular hyperechogenicity 363, 364–365, 366, 369f
Periventricular infarct, ischaemic–haemorrhagic 364–365
Periventricular leukomalacia 367, 369f
Peyronie disease 462
pH test 284
Phaeochromocytoma 314
Phleboliths 391f
Phyllodes tumour 209, 209f
Placenta 62–67
abnormalities 51–53, 62–63
adherence to uterus (placenta accreta)
52–53, 52f, 65–66, 66f
assessment, second trimester 42, 43f
calcifications 63
978-9241548540-INDEX PRF ml ln ml ml-1-Final Proof.indd 505 6/10/13 10:29 AM
506
changes during pregnancy 62
first trimester 15
second trimester 42, 43f
third trimester 51
chorioallantoic 122
cystic degeneration 30f
cysts 63, 63f
development 123
fetal growth restriction due to 53, 55
focal lesions 63
functional assessment, by Doppler 122–124
growth rate 53
haematomas 64
hydropic degeneration 29
infarction 62, 64
lacunae 52, 52f, 62
localization 35, 35f
location, internal cervical os, distance 52,
56, 70, 71f
low-lying 51–52, 70
mono-/dichorionic 76
size, thickness and volume 62
spontaneous expulsion (first trimester) 25f
tumours 66–67
umbilical cord insertion 68
vascular abnormalities 64
vascular resistance 123, 124, 126
villi 123
Placenta accreta 52–53, 52f, 65–66, 66f
Placenta bilobata 62, 63f
Placenta bipartita 62, 63f
Placenta circummarginata 62–63
Placenta circumvallata 62, 63
Placenta increta 65–66
Placenta percreta 65–66
Placenta praevia 51–52, 64–65, 65f, 70, 71f
diagnosis 65
low-lying 51, 65
total, partial, marginal 64
Placenta succenturiata 62
Placental abruption 64
Placental edge, internal cervical os, distance 52, 56, 65, 70, 71f
Placental insufficiency 47, 56, 122
classification 124
detection by Doppler ultrasound 122
haemodynamic changes, phases 57–58,
126–127
see also End-diastolic flow
Placental pseudomole 29
Plantar fascia 460, 461f
microruptures 460
normal 461, 461f
Plantar fasciitis 460–461, 461f
Plantar fibromatosis 462, 462f
Plasmodium falciparum 259
Pleura, normal 354
normal findings, breast ultrasound 195f,
196f, 198
Pleural effusion 258f
fetal 99, 99f
paediatric 357, 357f, 358f
complicated 358f
simple 357, 357f
Pneumatosis intestinalis 288, 288f
Pneumoblastoma 359
Pneumococcus meningitis 375, 375f
Pneumonia 358–359
Pneumothorax 358
Polychorionic pregnancy 18
Polycystic kidney disease
autosomal dominant 296
autosomal recessive 295–296
fetal 110, 112f
neonates and children 295–296, 296f
Polycystic ovary syndrome 144–145
children 321, 321f
Polyhydramnios 42
gastrointestinal anomalies associated 106
monochorionic, diamniotic twins 84, 85f, 86f
twin pregnancies 81
Polyps, endometrial 150, 150f, 151f
Polysplenia 257, 257f, 258f
Popliteal cyst 392
Porta hepatis, cystic mass in region of 249
Portal hypertension 259
978-9241548540-INDEX PRF ml ln ml ml-1-Final Proof.indd 506 6/10/13 10:29 AM
507
Portal vein (fetal)
second trimester 40, 40f
third trimester 44
Portal vein (paediatric) 232, 232f, 233f
biliary atresia 247, 247f
diameter 232, 233f
gas 288, 288f
thrombosis 233–234
velocity, in biliary atresia 248
Positioning of patient
breast ultrasound 193–194
child, examination
chest 354
liver and biliary tract 230
neck 343
pelvic 315
spinal 377
urinary tract 265
gynaecological ultrasound 136
obstetric ultrasound 10
Posterior fossa, neonatal, examination 360, 361
Posterior talofibular ligament 448
Postmenopausal bleeding 156
Postmenopausal women see Menopause/postmenopausal state
Power Doppler 121
fibroids 154f
tubal patency evaluation 187
Precocious pseudopuberty 324
Precocious puberty 324
Pre-eclampsia 29
Pregnancy
dating see Gestational age
fetal and maternal risks 76
molar see Hydatidiform mole (molar
pregnancy)
multiple see Multiple pregnancies
outcome, intrauterine haematoma 22–23
screening in see Obstetrics scanning
Premature infants, brain see Brain, premature
Prepatellar bursitis 437f
Prepubertal bleeding 324
Preterm birth
cervical changes 73–74, 74f
cervical length as predictor 73, 82
prediction after cervical cerclage 74–75
Preterm birth weight 48
Preterm infants, brain see Brain, premature
Preterm labour 48, 70
risk, cervical evaluation indication 70, 71
Probes see Transducers
Proteus meningitis 375, 375f
Prune belly syndrome 307
Pseudoaneurysms
hepatic 240
pancreatic 267
Pseudocyst
meconium 405, 405f
pancreatic 267, 268f, 271f
peritoneal 174
Pseudogestational sac 23–24, 27, 28f, 148
Pseudogynaecomastia 216
Pseudohermaphrodism
female 328, 329f
male 329–330, 330f
Psychological effects, of routine ultrasound 51
Puberty, disorders 324–326
precocious 324
Pulmonary artery (fetal) 100, 101f
dilatation 105, 106, 106f
transposition of great vessels 105, 105f
Pulmonary atresia 106
Pulmonary consolidation 358, 359f
Pulmonary sequestration (fetal) 98
Pulsatility index (PI) 121–122
ductus venosus 126–127, 127t
middle cerebral artery 124, 125t
umbilical arteries 124, 124t
Pulsed Doppler 120, 121
corpus luteum 143f
disadvantage (aliasing) 120–121
gynaecological examination 137f
parotid haemangioma 352, 352f
premature brain, examination 365, 366f
umbilical artery waveforms 123
978-9241548540-INDEX PRF ml ln ml ml-1-Final Proof.indd 507 6/10/13 10:29 AM
508
Pulsed spectral Doppler ultrasound, heating induced by 4–5
Pyelonephritis
acute bacterial 302, 302f
chronic 303, 304f
Pygopagus 88
Pyloric canal 283
Pyloric muscle 283
Pyloric stenosis, hypertrophic 283, 283f
Pylorus, normal 274, 275f
Pyometra 148
Pyosalpinx 183, 327
[Q]
Quadruplet pregnancy 19f
Quervain subacute thyroiditis 349
[R]
Racial effects, dizygotic twins 76
Rectum, normal 275f
Regional enteritis 286, 286f
Renal abscesses 303, 303f
Renal agenesis
bilateral 110, 111f, 293
unilateral 110, 111f, 293
Renal arteries 111f
infarction 305
resistive index 292
Renal calculi 298–299, 298f
Renal calyces 291f, 297
Renal cortex see Kidney(s) (paediatric)
Renal cysts 295f, 296f
polycystic disease 295, 296, 296f
simple 294
Renal duplication 293
Renal dysplasia 113, 114f
Renal fracture 313, 313f
Renal lymphoma 299, 301f
Renal pelvis (fetal) 110, 110f, 113f
Renal pelvis (paediatric) 292, 292f
calculus 298f
dilatation 296, 297f
dimensions 292, 292f
ureteropelvic junction obstruction 297f
Renal pyramids 290, 290f, 291
calculi 299, 299f
Renal trauma 313, 313f, 314f
Renal tumours 299, 300f, 301f, 302f
Renal vein thrombosis 304–305, 305f
in Wilms tumour 299
Renal vessels, second trimester assessment 41f
Repetitive stress 410
Reporting recommendations, obstetrical ultrasound 128–129
Resistance/resistive index (RI) 121–122
anterior cerebral artery 363–364, 364f, 365
renal arteries 292
Retinaculum 426, 427f
flexor 425, 426f
Retroareolar ducts, papilloma 210f
Retrocalcaneal bursitis 439, 440f
Retromammary fat 198
Retroperitoneum, paediatric ultrasound 289–314
indications and technique 289
Retropharyngeal cysts 353
Retroplacental haematoma 64
Rhabdomyolysis 455
Rhabdomyosarcoma 393
bladder 308, 309f
embryonal, biliary tree 235, 235f
paratesticular 340
vaginal 324
Rhizomelia 114, 118t
Ribs 195f, 198, 198f
calcification in cartilaginous element
198, 198f
fractures 357
normal 354, 355f
978-9241548540-INDEX PRF ml ln ml ml-1-Final Proof.indd 508 6/10/13 10:29 AM
509
Right internal jugular vein 344, 344f
Right ventricle
double outlet 105
hypertrophy 102, 104f
Rokitansky nucleus 171–172
Rotator cuff 410, 411f, 412–422
complete rupture 418–422, 418f
blood release 419
direct (primary) signs 418–419
heterogeneous echogenicity 418–419, 419f
indirect (secondary) signs 420–422,
420f, 421f
examination technique 413, 413f, 414f, 415f
muscles involved 412
partial ruptures 417, 417f, 420
treatment 422
[S]
Safety of ultrasound 4–6
Sagittal bands 429, 430f
Saline, hysterosalpingo-contrast sonography 186, 187
Salivary gland diseases 351
Salpingitis, acute 179f, 181f
ovary involvement 181f
Santorini duct 266
Sarcoma
embryonal, undifferentiated 235, 235f
uterine 161
Schistosomiasis 303
Sclerosing adenosis 212, 212f
Screening ultrasound
breast 202
see also Three-dimensional ultrasound
Scrotum (paediatric ultrasound) 333–343
anatomy 333
examination technique 333
indications 333
normal findings 333–335, 334f, 335f
pathological findings 336–343
acute scrotum 339–340, 339f, 340f
hydrocoele 337, 337f, 339
inguinal scrotal hernia 336
scrotal masses 340–341, 341f
trauma 341–342, 342f
varicocoele 338, 338f
see also Testes
skin thickening 339, 340
Sebaceous cysts, breast 203
Semimembranosus muscle, bursa 457, 458f
Septic arthritis 389, 389f, 390f
Sertoli-Leydig tumours 172–173
Sexual development, secondary
absent 325
early 324
Shoulder, impact syndrome 413
Shoulder tendons 412–422
see also Rotator cuff
Siamese twins 88
Sickle-cell disease 253f, 257, 258
Situs inversus 257f
Skeletal dysplasia 116, 118
Skeletal system, fetal malformations 114–118, 115f, 116f, 117f, 118f
Skin
breast 196, 196f
invasive ductal carcinoma 220, 221f
thickening, of scrotum 339, 340
Skull (fetal)
abnormal shape 116, 117f
defects, first trimester 31
ossification 18
Slater-Harris type 1 injury 387
Slipped femoral capital epiphysis 387
Small bowel
atresia 400, 401, 401f, 404
gastroschisis (fetal) 32, 34f
meconium ileus and 402–403, 402f, 403f
megacystis-microcolon-intestinal
hypoperistalsis syndrome 403, 404f
obstruction 400–403
stenosis 401
see also entries beginning duodenal
Small-for-gestational age fetus 48, 54, 59
see also Intrauterine fetal growth restriction
978-9241548540-INDEX PRF ml ln ml ml-1-Final Proof.indd 509 6/10/13 10:29 AM
510
Snapping hip 434, 434f
Soft-tissue abnormalities (paediatric) 390–394
benign nonvascular lesions 391–392
infections 393–394, 394f
inflammatory disorders 394
malignant tumours 393
vascular lesions 390–391, 391f
Sonohysterography 148, 186
endometrial adhesions 152
endometrial polyps 150
tamoxifen effect on endometrium 151
Spatial compound imaging, breast 202
Spectral Doppler 121
multiple pregnancies and fetal weight
discordance 83
pulsed, heating induced by 4–5
Spermatic cord 333
cysts 337, 337f
normal 335f
Spina bifida 96, 97f, 98
lipomyelocoele and 381
Spinal canal, hemicords 381, 381f
Spinal cord (paediatric)
at birth and development 379–380
diameter 377–378
indications for ultrasound 377
normal findings 377–378, 378f
pulsatile motion 377, 378
tethered 380
Spinal dysraphism 377, 380
occult 381
Spine (fetal) 116
malformations 96–98, 97f
normal 97f
second trimester assessment 38, 38f
Spine (paediatric)
congenital malformations 380–382, 381f, 382f
infection 383
lipoma 381
neoplasms 383
paediatric ultrasound 377–383
examination technique 377
indications 377
normal findings 377–380, 378f, 379f,
380f
pathological findings 380–383, 381f, 382f
trauma 383
Spiral arteries 123
Spleen (children/infant) 254–264
accessory 256–257, 256f
angioma 261, 262f
anomalies of form, number, position
256–258, 256f, 257f, 258f
anomalies of size 258–260, 258f, 259f
atrophy 257, 258, 258f
bacterial sepsis 260
calcifications 260f, 261
congenital anomalies 261, 262
contusion 263, 263f
ectopic 257
epidermoid cysts 261, 261f
focal lesions 260–263
fungal sepsis 260
haematological malignancies 260
hydatid cyst 262, 262f
infarction 258, 258f
laceration 263, 264f
lobulation 256, 256f
lymphangioma 262–263
mobile 257
paediatric ultrasound 254–264
examination 254
indications 254
normal findings 255, 255f
pathological findings 256–264
parasitic infections 259
parenchyma 256, 260f
parenchymal haematoma 263, 263f
polysplenia 257, 257f, 258f
size (normal) 255, 255f
978-9241548540-INDEX PRF ml ln ml ml-1-Final Proof.indd 510 6/10/13 10:29 AM
511
trauma 263, 263f, 264f
viral infections 259
wandering 257
Splenomegaly 259, 259f, 260f
infections associated 259, 260
tropical idiopathic 259
Sports see Athletes/sports
Spotting, first trimester 21–22
Staphylococcus aureus 239, 389, 393
Steatosis 245, 245f
Stein-Leventhal syndrome see Polycystic ovary syndrome
Stenosing tenosynovitis 426
Sternocleidomastoid muscle 348f
haematoma (fibromatosis colli) 351, 352f,
391–392
normal 344f
Stomach
atonic (paediatric) 283
gas in (paediatric) 396, 396f
hyperperistaltic (paediatric) 283
normal (paediatric) 274, 274f, 275f
second trimester 40, 40f
Streptococcus pyogenes 393
Subacromial-subdeltoid bursa 412, 418, 419f, 420
fluid in 421, 421f
Subarachnoid space
fluid 374, 374f
spinal cord 378f
Subchorionic haemorrhage 22, 22f
Subcutaneous fat, breast 196, 196f
Subcutaneous tissue, invasive ductal carcinoma (breast) 220–221, 221f
Subdural empyema 375, 375f
Subdural space, fluid 374, 374f
Subendometrial halo 139
Subependymal cysts 376f
Subperiosteal abscess 389f
Subperiosteal fluid collection 388, 389f
Subscapularis tendon 412
examination method 414f
normal ultrasound findings 414f
Superficial fibromatosis 462, 462f
Superior mesenteric artery 399f, 404f
ischaemia, small bowel atresia 401
Superior mesenteric vein 397f, 399f, 404f
whirl pattern 399, 399f
Superior sagittal sinus, thrombosis 371, 372f
Superior vena cava (fetal) 100, 101f
Suprapatellar bursa 437
Suprapubic sonography see Transabdominal ultrasound
Suprarenal mass 310, 311f, 312f
Supraspinal tendon (supraspinatus) 410, 412
absence/rupture 418, 418f
cartilage interface sign and 422, 422f
complete rupture 418–419, 420f
examination technique 413, 415f
focal tapering 418, 419f, 420f
normal ultrasound findings 410, 411f, 415f
partial lesion 421f
rupture with tendinopathy 419, 420f
Sylvian fissure 361, 362f, 371
Sylvius, aqueduct 364
Synechiae, endometrial 152
Synovial diseases, paediatric 387
Synovial recesses 420, 421
Synovitis, transient in child 386
Syringomyelia 381, 382
Systolic:diastolic flow, umbilical artery resistance 56–57
[T]
Talipes equinovarus 385–386
Talofibular ligaments 447, 447f, 448
Tamm-Horsfall protein 289–290, 290f
Tamoxifen 150, 151–152
Target sign 283f
Techniques see Ultrasound, examination techniques
Temperature, elevated
tendons 410
ultrasound-induced 4–5
978-9241548540-INDEX PRF ml ln ml ml-1-Final Proof.indd 511 6/10/13 10:29 AM
512
Tendinopathies 409, 412, 412f
calcaneus (Achilles) tendon 439, 439f
gluteus medius/minimum tendons
432, 433f
patellar tendon 436f
supraspinal tendon rupture 419, 420f
Tendinosis 410, 452
Tendinous xanthoma 437, 438f
Tendon(s)
avascular 409
biomechanics and function 409
calcifications 412
composition 409
degeneration 410, 412
eccentric contraction 410
increased thickness 412
lower limbs 432–442
normal ultrasound findings 410–412,
410f, 411f
children/infants 384
repetitive stress 410
rupture 410, 452
rotator cuff see Rotator cuff
temperature 410
thickness, rotator cuff 412
upper limbs 412–431
vascular 409
vascularization 409
Tenosynovitis
De Quervain 426, 428f
fingers and hand 429, 432f
wrist 426, 428, 429f
Teratoma
benign testicular 341f
brain 92f
cystic (ovarian) 171–172
mature ovarian, in girls 321, 322f
neck 346, 353
Teres minor, tendon 412, 416f
Teres minor muscle 421f
Testes
anomalies of descent 336
benign teratoma 341f
descent 336
fracture 341, 342f
haematoma 341
infarction 339
involvement in systemic disease
342–343
lymphoma 340–341
microlithiasis 342–343, 342f
paediatric ultrasound
age-related changes 333
height, weight and length 335
normal 333, 334f
vascular anatomy 333, 335f
torsion 339, 339f
chronic 339, 340f
extravaginal, in neonate 339, 339f
trauma 341–342, 342f
tumours 340–341, 341f
classification 341t
germ cell 341t
non-germ cell 341t
undescended 336, 336f
male pseudohermaphrodism
329, 330f
see also Scrotum (paediatric ultrasound)
Testicular appendages 333
Testicular mediastinum 333
normal 334f
Tetralogy of Fallot 105, 105f, 106f
Tetraploidy 29
Thanatophoric dysplasia 116, 117f
Theca lutein cysts 29, 30f, 67
Thoracopagus 88
Three-dimensional ultrasound
breast 202
fetal macrosomia prediction 51
uterine anomalies 147
Thrombosis
hepatic vein 233–234
jugular veins 353
renal veins 299, 304–305, 305f
superior sagittal sinus 371, 372f
Thumb, pulley system 442–443
978-9241548540-INDEX PRF ml ln ml ml-1-Final Proof.indd 512 6/10/13 10:29 AM
513
Thymus
hypertrophy 359
normal 354–355, 355f
Thyroglossal duct cysts 346, 347f
Thyroid agenesis 348, 348f
Thyroid gland (paediatric) 274f
age-related size changes 345
autoimmune disease 349
benign, halo feature of 350, 350f
cysts 351
diseases 348–351
enlargement (goitre) 350
focal diseases 350–351
follicular adenoma 350, 350f
nodules 351
normal 344f, 345, 345f
teratomas in/close 353
thyroiditis 349, 349f
tumours (malignant) 351
Thyroiditis (paediatric) 349, 349f
acute purulent 349
chronic lymphatic (Hashimoto’s) 349, 349f
Tibia, tuberosity 435
Tibial osteochondrosis 387, 435
Todani classification 249f, 250
Torticollis 352f
Trachea, normal 344f, 345
Tracheo-oesophageal fistula 106
Transabdominal ultrasound
first trimester 10
biparietal diameter 13, 13f
crown–rump length 11
ectopic pregnancy 27f, 28f
fetal abnormalities 34f
gestational sac diameter 11, 13
hydatidiform moles 30f
multiple pregnancies 77
nuchal translucency measurement 20–21
spontaneous abortion 24, 25f
twin pregnancy 19f
yolk sac 14
gynaecological 133, 134, 135f
cervical carcinoma 159, 160, 160f
cervix, after cervical cerclage 75, 75f
cervix examination 71–72
endometrial carcinoma 157f
fibroids 153f
procedure 134
recurrent neoplasms 161, 162f
see also Ovaries; Uterus
pelvic structures 135f
preparation
gynaecological studies 134, 135
obstetrical examination 10, 71
probes, technical characteristics 10
technique and position for 10, 11f,
71–72, 134
third trimester
placenta praevia 65
placental position 52
Transcerebellar scanning, second trimeter 37, 37f, 90f
Transducers
breast ultrasound 194
Doppler 119, 119f, 120
finger pulley system 443
high-frequency, neonatal cranial ultrasound
360
musculoskeletal examination (paediatric)
384
neonatal cranial ultrasound 360
obstetric screening
transabdominal 10, 11f
transvaginal 10, 11f
scrotum examination 333
spinal examination 377
sterilization/cleaning 136
transabdominal ultrasound 10, 134
transperineal ultrasound 72
transvaginal ultrasound 10, 72, 136
Translabial (transperineal) ultrasound, technique 71, 72
Transorbital scanning, second trimeter 37, 37f, 90f
Transperineal ultrasound, technique 71, 72
978-9241548540-INDEX PRF ml ln ml ml-1-Final Proof.indd 513 6/10/13 10:29 AM
514
Transposition of great vessels 105, 105f
Transrectal ultrasound, gynaecological 134
cervical carcinoma 159, 159f, 160
recurrent neoplasms 161, 162f
Transthalamic scanning, second trimester 36, 36f, 90f
Transthoracic chest ultrasound 354
Transvaginal ultrasound
cervical examination 71, 72–73, 72f
after cervical cerclage 74–75, 75f
cervical carcinoma 159, 159f, 160
recommendations 72–73
first trimester 10
abdominal development 17f
biparietal diameter 13, 13f
crown–rump length 11, 12f
ectopic pregnancy 27f, 28f
fetal abnormalities 34f
gestational sac 14f, 24, 26
gestational sac diameter 11, 12f, 13
head, brain and fingers 18f
hydatidiform moles 30f
multiple pregnancies 77
pregnancy dating 14t
spontaneous abortion 23, 24f
twin pregnancy 19, 19f
umbilical cord and placenta 15, 16f
yolk sac visualization 13–14, 14f
gynaecological 133–134, 135–137, 135f
cervical see above
endometrial carcinoma 158f
endometrial polyps 150, 150f, 151f
fibroids 152, 153f, 154f
limitations 137
ovarian masses 163
pelvic inflammatory disease 178
polycystic ovary syndrome 145
procedure 135–137
tubal patency assessment 186, 188
see also Ovaries; Uterus
pelvic structures 136f
preparation 10, 71, 135
probes, technical characteristics 10
technique and position for 10, 11f, 71,
72–73, 72f
third trimester, placenta praevia 51–52, 65,
70, 71f
Transventricular scanning, second trimester 37, 90f
Trauma
abdominal see Abdominal trauma
(paediatric)
acute pancreatitis due to 267
bowel 284, 285f
finger pulleys 443
liver 240, 240f, 241f
muscle 451, 452, 453
musculoskeletal (children) 387
neck 351, 352f
pancreas 267, 269f, 270, 271f
renal 313, 313f, 314f
scrotal 341–342, 342f
spinal 383
spleen 263, 263f, 264f
Triangular cord sign 247
Tricuspid atresia 102
Tricuspid valve dysplasia 102, 103f
Trigger finger 444, 446f
Triplet pregnancy 19f
Triploidy 29, 67
Trisomy, screening 82–83
Trisomy 13, anomalies associated 31, 93
Trisomy 18, anomalies associated 31, 32, 93
Trisomy 21
cystic hygroma 31, 33f
duodenal atresia/stenosis 396
first trimester, absent nasal bone 21
Trochanteric bursitis 432, 434f
Tubal inflammatory disease 148, 178–186
acute 180, 183, 185
ultrasound image correlation 182
chronic 185
ultrasound image correlation 182
cul-de-sac fluid 182, 183
fluid presence 180
natural course 183–184
ovarian involvement 180
978-9241548540-INDEX PRF ml ln ml ml-1-Final Proof.indd 514 6/10/13 10:29 AM
515
ovarian lesions vs 185–186
sonographic markers 178, 179f, 180, 180f
see also Fallopian tubes
Tubal ring 27, 28f
Tuberculosis
genital 148
peritoneal 281f
splenic microabscesses 260f
Tuberculous lymph nodes 347, 348f
Tubo-ovarian abscess 180, 182, 182f
in girls 327
pathogenesis 183–185
tubo-ovarian complex vs 182–183
Tubo-ovarian complex 180, 181f, 182
tubo-ovarian abscess vs 182–183
Tunica albuginea 339f
normal 334f
Turner syndrome 31, 325, 325f
Twin peak sign (lambda sign) 19, 78
Twin pregnancies 19f
abortion 24f
acardiac syndrome 88
birth weight 83, 84
congenital anomalies 82–83
conjoined twins see Conjoined twins
death of twin 86, 87–88
risk to surviving twin 87
diagnosis, timing 76, 77
dichorionic 19, 19f, 76, 77, 78
first trimester 78
growth and weight discordance 83
management after twin death 87
dichorionic, diamniotic 18, 19, 78, 79f
dizygotic (nonidentical) 18, 67, 76, 78, 80
anomaly risk 82
examination by ultrasound
aims 77
first trimester 18–19, 76, 77
second trimester 77
third trimester 77
growth discordance 83, 84
incidence 76
intrauterine growth restriction 83–84
molar transformation and 67
monitoring frequency 82
monoamniotic 78, 80f
conjoined twins 33, 34f
mortality 87
monochorionic see Monochorionic
pregnancy
monochorionic diamniotic 18, 78, 79f, 80,
85f
monochorionic monoamniotic 18, 78, 87, 88
monozygotic (identical) 18, 76, 78, 80
aneuploidy risk 82
conjoined 88
partial hydatidiform mole vs 29
polyhydramnios 81
twin reversed arterial perfusion sequence 88
types 18–19, 76
first trimester determination 78
weight (birth) discordance 83, 84
see also Multiple pregnancies
Twin reversed arterial perfusion sequence 88
Twin–twin transfusion syndrome 81, 82, 84, 85f
antenatal diagnosis 86
death of twin 86, 86f, 87
features and outcome 84, 85f, 86
management 86–87
[U]
Ulcerative colitis 286, 287f
Ulnar artery 424f
Ulnar extensor tendon, of carpus 429f
Ultrasound
adverse effects 4, 5
entertainment/social scanning 4
equipment
neonatal cranial examination 360
tendon examination 412
examination techniques 10–13, 71–72,
134–137
Achilles tendon 438f
brachial biceps long head tendon 413, 413f
brachial biceps tendon 424f
978-9241548540-INDEX PRF ml ln ml ml-1-Final Proof.indd 515 6/10/13 10:29 AM
516
brachial triceps 423f
breast ultrasound 194–195
chest (paediatric) 354
digestive tract (paediatric) 273
forearm tendons 425f
hip tendons 433f
infraspinatus tendon 413, 416f
lateral ligament complex of ankle
447f, 448f
liver and biliary tract (paediatric) 230
Morton neuroma 460f
musculoskeletal (paediatric) 383–384
neck (paediatric) 343
neonatal cranial examination 360–361
pancreatic (paediatric) 265
pelvic (paediatric) 315
plantar fascia 461f
scrotum (paediatric) 333
spinal (paediatric) 377
spleen (paediatric) 254
subscapular tendon 413, 414f
supraspinatus tendon 413, 415f
wrist extensors 427f
see also Transabdominal ultrasound;
Transvaginal ultrasound
flow, images see Doppler ultrasound
frequency
breast ultrasound 194
Doppler signal magnitude 120
gynaecological see Gynaecological
ultrasound
heat generation 4–5
mechanical index 5
misdiagnosis risk 4
nonthermal biological effects 5
output display 5, 6
preparation
breast examination 193–194
chest examination (paediatric) 354
digestive tract (paediatric) 272
liver/biliary tract examination
(paediatric) 230
pancreatic ultrasound (paediatric) 264
pelvic examination (paediatric) 315
in pregnancy see Obstetrics scanning
urinary tract examination (paediatric) 289
uterus/ovary studies 134–137
requirements, for safety 5
safety 4–6
Umbilical arteries 67, 68f, 123
Doppler velocimetry 122–124, 127
Doppler waveforms and factors affecting
123, 127
high-risk pregnancy 124
pulsatility index 124, 124t
resistance 56–57, 57f
single artery, abnormality 68
twin reversed arterial perfusion sequence 88
Umbilical cord 15, 67–68
abnormalities 68
blood vessels 67, 68f
diameter 67
first trimester 15, 67
insertion into placenta 68
length 67–68
second trimester 43f
twisting 87
velamentous insertion 68f
Umbilical vein 67, 107f, 126
blood redistribution to ductus venosus
57, 126
pulsations 58, 126
third trimester 44
twin reversed arterial perfusion sequence 88
Umbilical-placental vascular resistance 123
Uniparental disomy 29
Upper limb
normal, second trimester 115f
second trimester assessment 41, 42f
tendons 412–431
978-9241548540-INDEX PRF ml ln ml ml-1-Final Proof.indd 516 6/10/13 10:29 AM
517
Urachal abnormalities 306
Urachal cyst 306, 307f
Ureter (fetal), dilated 112, 113f
Ureter (paediatric)
dilatation 306, 306f
ectopic 306
enlarged 296
intravesical segment, cystic dilatation 306
stones 298, 298f
Ureterocoele 306
bilateral 307
Ureteropelvic junction obstruction 296, 297f
fetal 297f
Ureteropelvic stenosis 112
Ureteroplacental arteries 123
Ureterovaginal anomalies 325
Urethra
abnormalities (paediatric) 307
dilatation (fetal) 113, 114f
normal (paediatric) 292
stones 307–308
Urethral atresia 112
Urethral valves 112, 113, 114f
posterior 307, 308f
Urinary tract (fetal)
malformations 110–113, 110f, 111f, 112f,
113f, 114f
ureteropelvic junction obstruction 297f
morphology, second trimester 40, 41f
obstruction 112, 113f
Urinary tract (paediatric)
anomalies detected antenatally,
confirmation 312
dilatation, hydatid disease 303
hydatid disease 303
infections, imaging protocol 312
lower, anomalies 306–309
paediatric ultrasound 289–314
examination technique 289
features to be established 312
indications 289
normal findings 289–292, 290f, 291f, 292f
pathological findings 293–314
preparation 289
upper, anomalies 293–305
calculi and nephrocalcinosis 298–299,
298f, 299f
congenital anomalies 293–297
congenital anomaly screening 314
infectious/parasitic diseases 302–303,
302f, 303f
tumours 299, 300f, 301f
vascular diseases 304–305, 305f
Urine, perinephric collection 313, 314f
Urolithiasis 298f
Uterine arteries, pulsatility, polycystic ovary syndrome 145
Uterine bleeding, ultrasound examination 133
Uterine cervix see Cervix
Uteroplacental insufficiency 56, 57
Uterovaginal canal 146, 147
Uterus 133–140
absence, ambiguous genitalia 328
adenomyosis 154–155, 155f
agenesis/hypoplasia 146
age-related changes 315
air pockets 148, 149f
anteverted 138, 139f
bicornuate 146, 330f, 331
congenital abnormalities 146–148
in congenital adrenal hyperplasia 328
congenital obstructive malformations 152
corpus 137, 315
development 146
diameters 138, 138t
dimensions in children 138, 138t, 315
disorders 146–158
benign endometrial disease 148–152,
149f, 150f, 151f
978-9241548540-INDEX PRF ml ln ml ml-1-Final Proof.indd 517 6/10/13 10:29 AM
518
benign myometrial disease 152–155,
153f, 154f, 155f
congenital abnormalities 146–148
neoplasms 156–161, 157f, 158f, 159f,
160f, 161f, 162f
recurrent neoplasms 161, 162f
empty, ectopic pregnancy 27
enlarged 157f
fluid collection 22, 146, 152
fundus 138, 315
leiomyomas see Fibroids (uterine)
masses (infants/children) 323
neoplasms 156–158
normal ultrasound findings 137–141
anatomy 137–138
in children 315, 316f, 317f
endometrium 139, 140, 140t, 141f
measurements 138, 138t
myometrium 139–140
neonatal 315, 316f
structural features 139–140
orientation, bladder state and 138
in precocious puberty 324, 324f
prepubertal
normal 315, 316f, 317f
Turner syndrome 325f
at puberty 315, 317f
retroflexed 139f
retroversion 134, 151f
septate 146, 147f
transabdominal ultrasound 134
transvaginal ultrasound 133, 135, 136
unicornuate 146
Uterus didelphys 146
[V]
VACTERL association 297
Vagina
agenesis/hypoplasia 146
congenital obstructive malformations 152
dilated, girls 323, 323f, 326f
foreign body 324
involvement in cervical carcinoma 160
Müllerian duct anomalies and 146, 147f
recurrent endometrial carcinoma 162f
Vaginal bleeding
atypical, in endometrial carcinoma 156
endometrial polyps causing 150
first trimester 21–22, 29
placenta praevia 51
prepubertal 324
threatened abortion 23
Vaginal rhabdomyosarcoma 324
Valsalva manoeuvre 338, 338f
Varicocoele 338, 338f
Vascular diseases, urinary tract 304–305, 305f
Vascular lesions, musculoskeletal (paediatric) 390–391
Vascular malformations, paediatric 390
Vasoplegia, arteriolar 371, 371f
Velamentous insertion, umbilical cord 68f
Vena cava
inferior see Inferior vena cava
superior (fetal) 100, 101f
Venous Doppler 126–127
intrauterine growth restriction 56
Venous malformation 390–391, 391f
Ventricles (brain)
neonatal, normal anatomy 361, 362f
size (fetal) 93, 93f
Ventricular disproportion 102
Ventricular septal defect 102, 102f
Ventriculomegaly 31, 93, 93f, 366
Ventriculus terminalis 379, 379f
Vertebral arch 378f
Vertebral bodies, normal findings 378, 378f
Vertebral column, second trimester assessment 38, 38f
Vesico-ureteral junction, reflux 296, 298f
Vesico-ureteral obstruction 112, 113f
Vesico-ureteral reflux 306
Vesico-ureteric reflux 296, 298f
Vincula 409
978-9241548540-INDEX PRF ml ln ml ml-1-Final Proof.indd 518 6/10/13 10:29 AM
519
Vitelline duct 14, 15, 15f
Volvulus 398, 399f, 400f
Vomiting 282–284
green, in neonate 398
neonates 396, 398
small bowel atresia 401
projectile 283
Von Hippel-Lindau disease 272
[W]
Wandering spleen 257
WFUMB (World Federation for Ultrasound in Medicine and Biology) 3, 4, 5
Wharton jelly 15, 68
White matter injury, premature brain, follow-up 367
Wilms tumour (nephroblastoma) 299, 300f, 301f
Wirsung duct 266
Wolffian ducts 176
Wood splinter foreign body 392, 393f
World Health Organization (WHO) 3
Wrist 425–428
anatomy 425
extensor tendons 426, 427f
synovial compartments 426–428
flexor tendons 425
tendons 425–428
tenosynovitis 426, 428, 429f
[X]
Xanthoma 437, 438f
[Y]
Yolk sac 12f, 13–14, 14f, 15f
bright, in abortion 24f
development 122
diameter 14
failure to detect in gestational sac 24
intrauterine sac without 23–24
twin pregnancies 19
[Z]
Zygosity 19, 76, 78
anomalies and 82
determination 18–19
978-9241548540-INDEX PRF ml ln ml ml-1-Final Proof.indd 519 6/10/13 10:29 AM

978-9241548540-INDEX PRF ml ln ml ml-1-Final Proof.indd 520 6/10/13 10:29 AM


Related Documents