Manual for creating Walking Time Buffers with barriers based on a Digital Elevation Model in ArcGIS by Jorn Seubers (University of Groningen) Version 2 nd of January 2014 This document is a personal file recording the steps needed to create a continuous cost raster that represents (cumulative) walking time over undulating terrain from a single point on the basis of a DEM. It can be used to regard the accessibility of natural landscapes and to give an indication of travelling cost (on foot) through a landscape. In the current case it is used in support of the reconstruction of the territory of an archaeological site. I have placed this manual online for educational purposes, it is not intended for publication. Though the steps of this analysis are not very complex, there are many that have to be performed in a certain sequence. I assume that you know your way around ArcGIS to follow this manual. I have used ArcGIS 10.2. Jorn Seubers (archaeologist at the Groningen Institute of Archaeology) This manual is intended for experienced ArcGIS users! Starting requirements: Digital Elevation Model (with desired resolution for the extent of analysis) Point shapefile (single point of departure) Classification of walking speed (determine the used algorithm) Additional cost layer (shapefile or raster) (i.e. land use, water, barriers) This procedure will create a lot of different rasters. Set your default GeoDB in “Map Document Properties”. Think of a filename policy to know which is which at a later stage. DEM Start with a DEM. Preferably of high resolution, depending on the extent of your analysis. A smaller research area needs higher resolution to be sensible. Bigger cell size means the use of more average elevation values, creating a “flatter” terrain (for example a 80m DEM means you have only one elevation value for an area of 1600m 2 ) The inclusion of slope in a walking time analysis is not very meaningful in with a coarse raster, because the values of all cells will be very similar. Without mountains or barriers the resulting model will be almost round. This means you could just as well create circular buffers of Euclidian distance (As the crow flies). Take note of the cell size, for you will need it later.

Welcome message from author
This document is posted to help you gain knowledge. Please leave a comment to let me know what you think about it! Share it to your friends and learn new things together.
Transcript
Manual for creating Walking Time Buffers with barriers based on a Digital Elevation Model in ArcGIS by Jorn Seubers (University of Groningen) Version 2nd of January 2014
This document is a personal file recording the steps needed to create a continuous cost raster that represents (cumulative) walking time over undulating terrain from a single point on the basis of a DEM. It can be used to regard the accessibility of natural landscapes and to give an indication of travelling cost (on foot) through a landscape. In the current case it is used in support of the reconstruction of the territory of an archaeological site. I have placed this manual online for educational purposes, it is not intended for publication. Though the steps of this analysis are not very complex, there are many that have to be performed in a certain sequence. I assume that you know your way around ArcGIS to follow this manual. I have used ArcGIS 10.2. Jorn Seubers (archaeologist at the Groningen Institute of Archaeology)
This manual is intended for experienced ArcGIS users!
Starting requirements: Digital Elevation Model (with desired resolution for the extent of analysis) Point shapefile (single point of departure) Classification of walking speed (determine the used algorithm) Additional cost layer (shapefile or raster) (i.e. land use, water, barriers) This procedure will create a lot of different rasters. Set your default GeoDB in “Map Document Properties”. Think of a filename policy to know which is which at a later stage.
DEM Start with a DEM. Preferably of high resolution, depending on the extent of your analysis. A smaller research area needs higher resolution to be sensible. Bigger cell size means the use of more average elevation values, creating a “flatter” terrain (for example a 80m DEM means you have only one elevation value for an area of 1600m2) The inclusion of slope in a walking time analysis is not very meaningful in with a coarse raster, because the values of all cells will be very similar. Without mountains or barriers the resulting model will be almost round. This means you could just as well create circular buffers of Euclidian distance (As the crow flies). Take note of the cell size, for you will need it later.
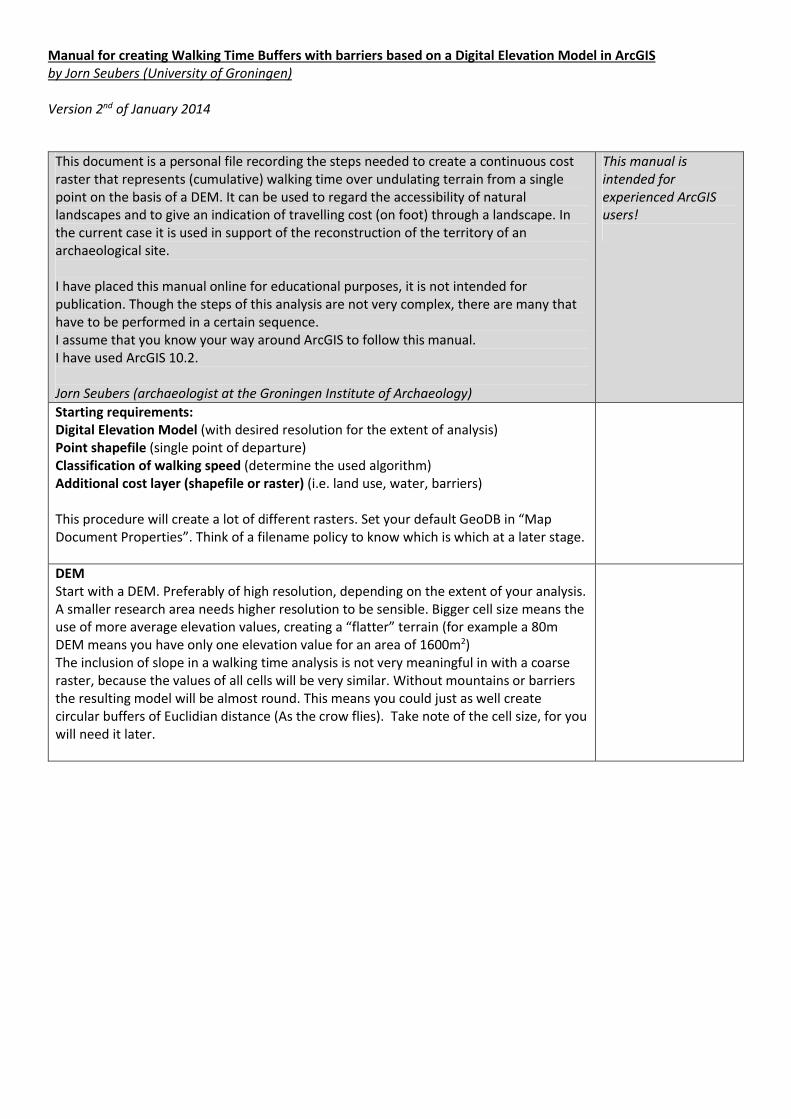
Base DEM with 2m cell size and point of departure indicated
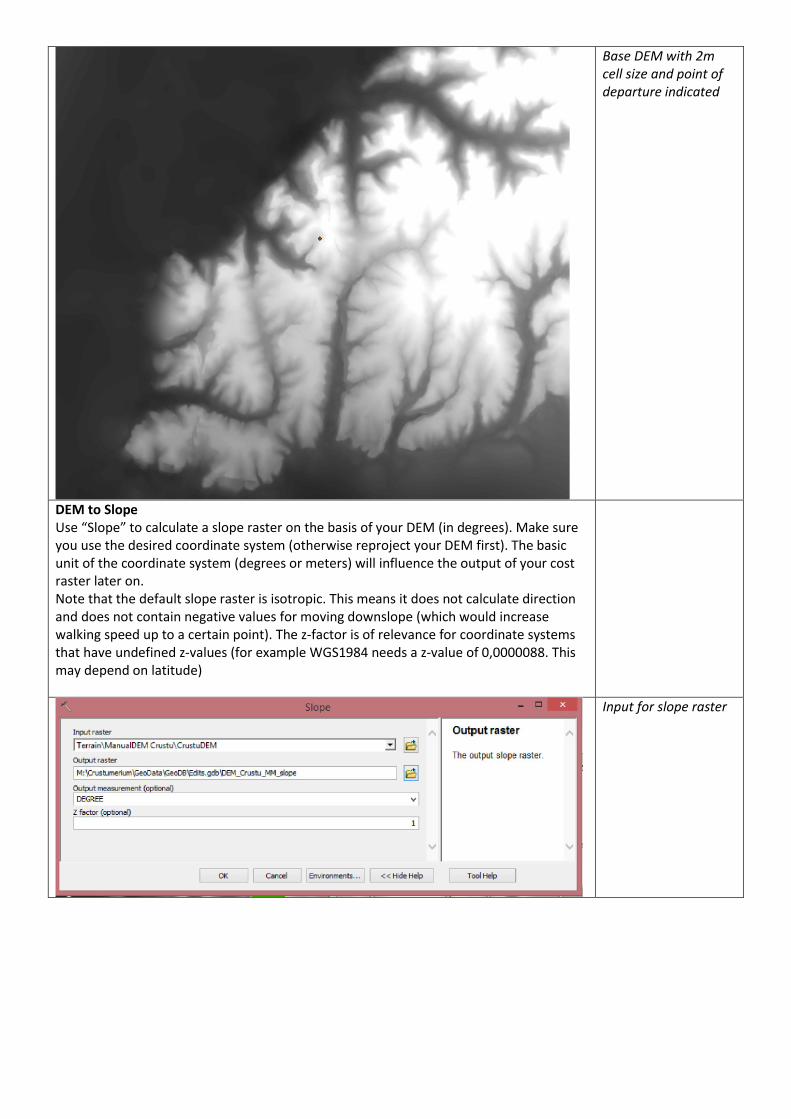
DEM to Slope Use “Slope” to calculate a slope raster on the basis of your DEM (in degrees). Make sure you use the desired coordinate system (otherwise reproject your DEM first). The basic unit of the coordinate system (degrees or meters) will influence the output of your cost raster later on. Note that the default slope raster is isotropic. This means it does not calculate direction and does not contain negative values for moving downslope (which would increase walking speed up to a certain point). The z-factor is of relevance for coordinate systems that have undefined z-values (for example WGS1984 needs a z-value of 0,0000088. This may depend on latitude)
Input for slope raster
Resulting slope raster
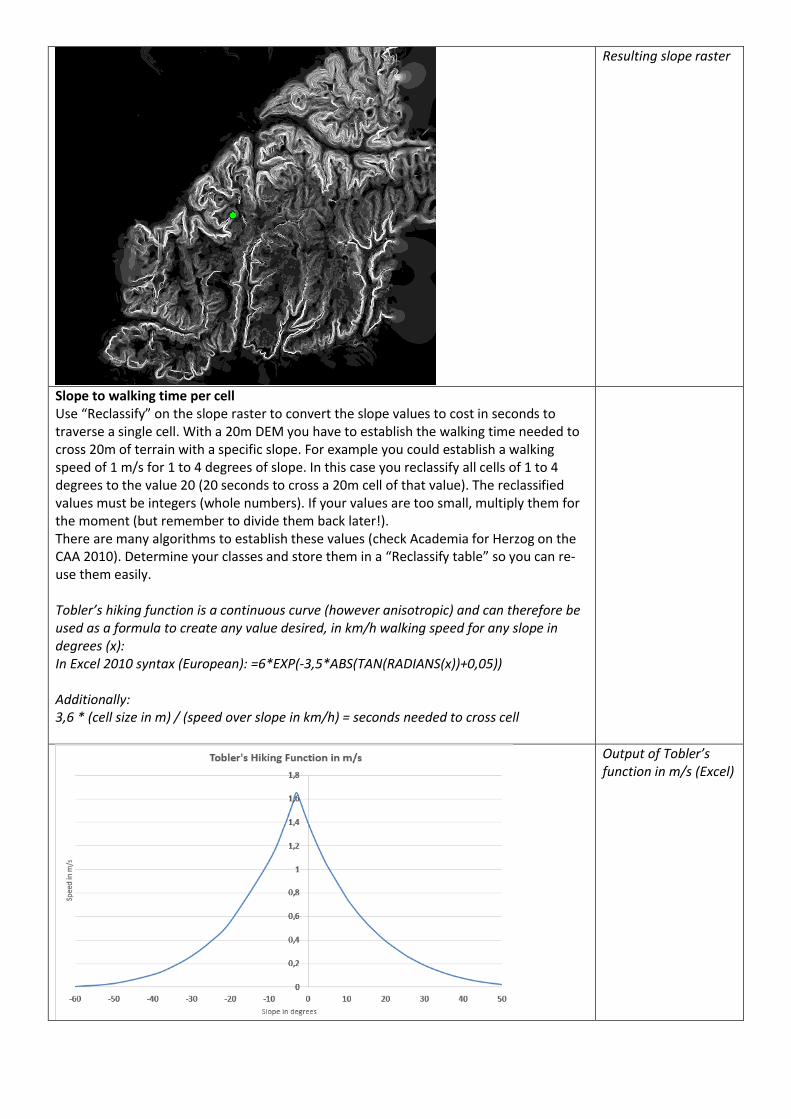
Slope to walking time per cell Use “Reclassify” on the slope raster to convert the slope values to cost in seconds to traverse a single cell. With a 20m DEM you have to establish the walking time needed to cross 20m of terrain with a specific slope. For example you could establish a walking speed of 1 m/s for 1 to 4 degrees of slope. In this case you reclassify all cells of 1 to 4 degrees to the value 20 (20 seconds to cross a 20m cell of that value). The reclassified values must be integers (whole numbers). If your values are too small, multiply them for the moment (but remember to divide them back later!). There are many algorithms to establish these values (check Academia for Herzog on the CAA 2010). Determine your classes and store them in a “Reclassify table” so you can re-use them easily. Tobler’s hiking function is a continuous curve (however anisotropic) and can therefore be used as a formula to create any value desired, in km/h walking speed for any slope in degrees (x): In Excel 2010 syntax (European): =6*EXP(-3,5*ABS(TAN(RADIANS(x))+0,05)) Additionally: 3,6 * (cell size in m) / (speed over slope in km/h) = seconds needed to cross cell
Output of Tobler’s function in m/s (Excel)
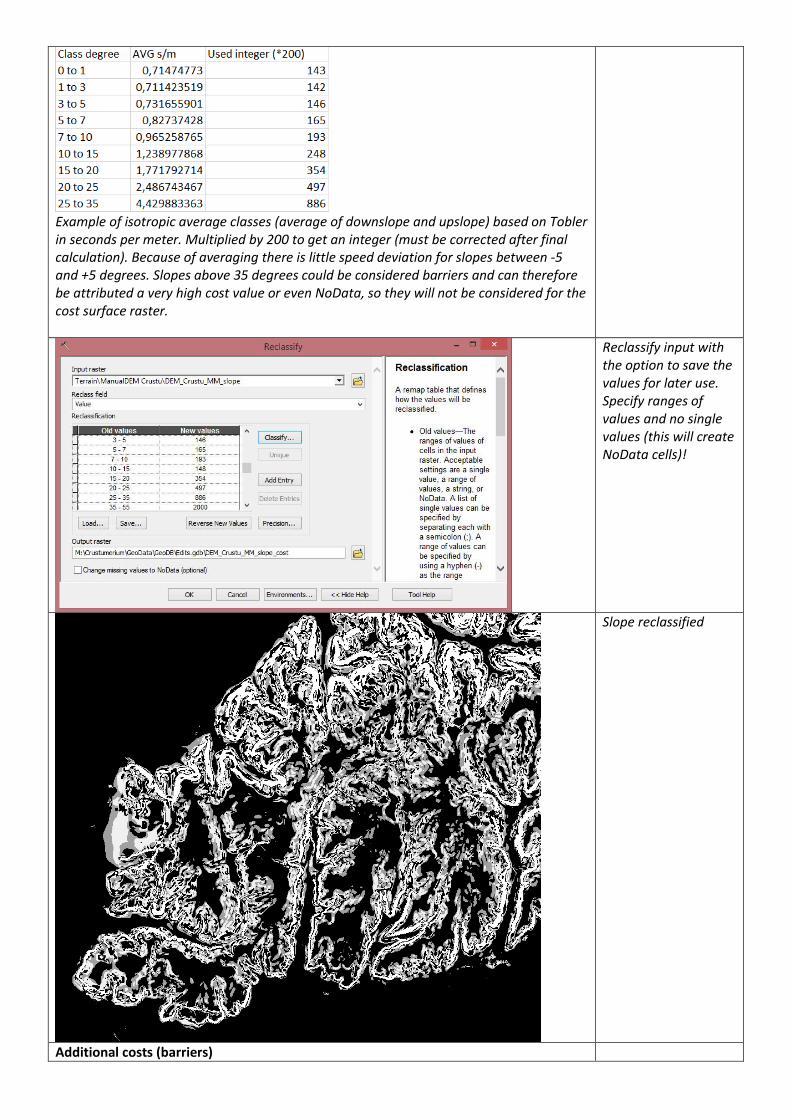
Example of isotropic average classes (average of downslope and upslope) based on Tobler in seconds per meter. Multiplied by 200 to get an integer (must be corrected after final calculation). Because of averaging there is little speed deviation for slopes between -5 and +5 degrees. Slopes above 35 degrees could be considered barriers and can therefore be attributed a very high cost value or even NoData, so they will not be considered for the cost surface raster.
Reclassify input with the option to save the values for later use. Specify ranges of values and no single values (this will create NoData cells)!
Slope reclassified
Additional costs (barriers)
You can now add a raster with additional costs. For example extra cost for crossing streams, certain types of terrain or to create barriers that one has to go around (= NoData) or obstacles (passable at high cost). For streams you can create a raster from polylines by calculating “buffers” and using “Feature to raster”, after which the values can be reclassified. Now add this raster to your cost raster with the function “Plus” or with “Raster Calculator”. Please note that merging rasters is specific, because in GIS “no data + data = no data”. This means empty cells will overwrite cells with a value. You can fix this by always setting your raster to the extent of the original DEM (set at Environment) and reclassifying the cells with “NoData” to “0”, before merging.
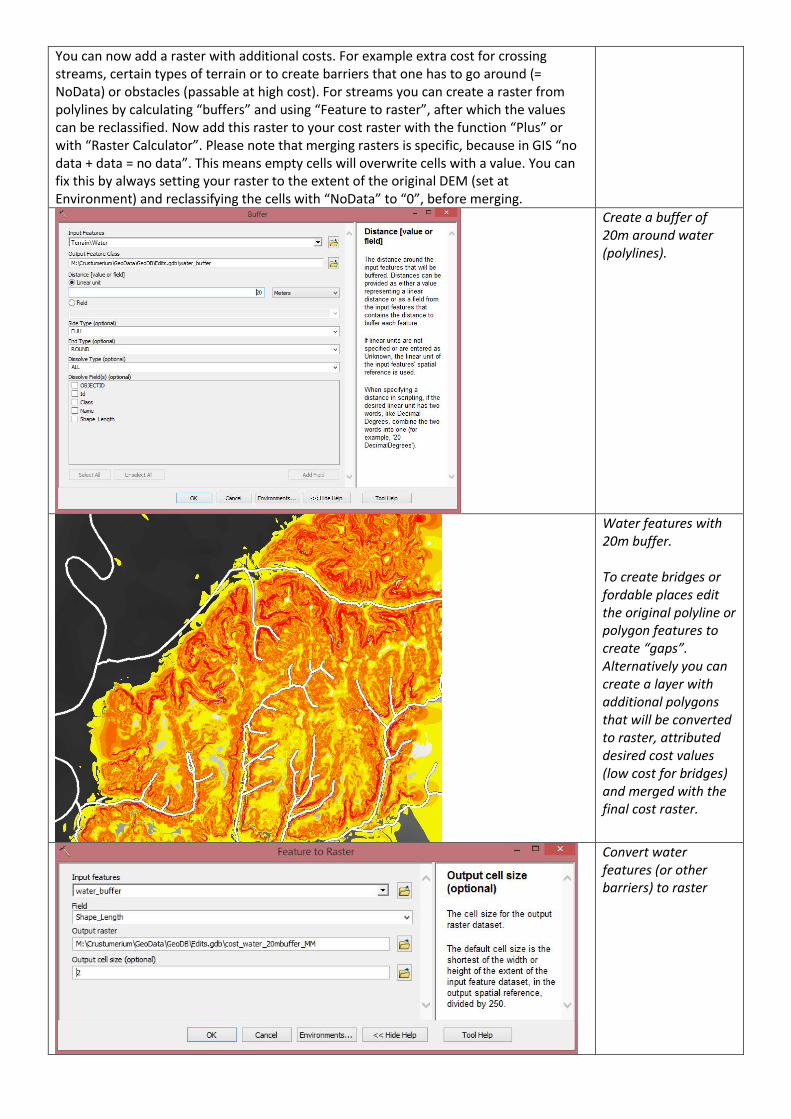
Create a buffer of 20m around water (polylines).
Water features with 20m buffer. To create bridges or fordable places edit the original polyline or polygon features to create “gaps”. Alternatively you can create a layer with additional polygons that will be converted to raster, attributed desired cost values (low cost for bridges) and merged with the final cost raster.
Convert water features (or other barriers) to raster
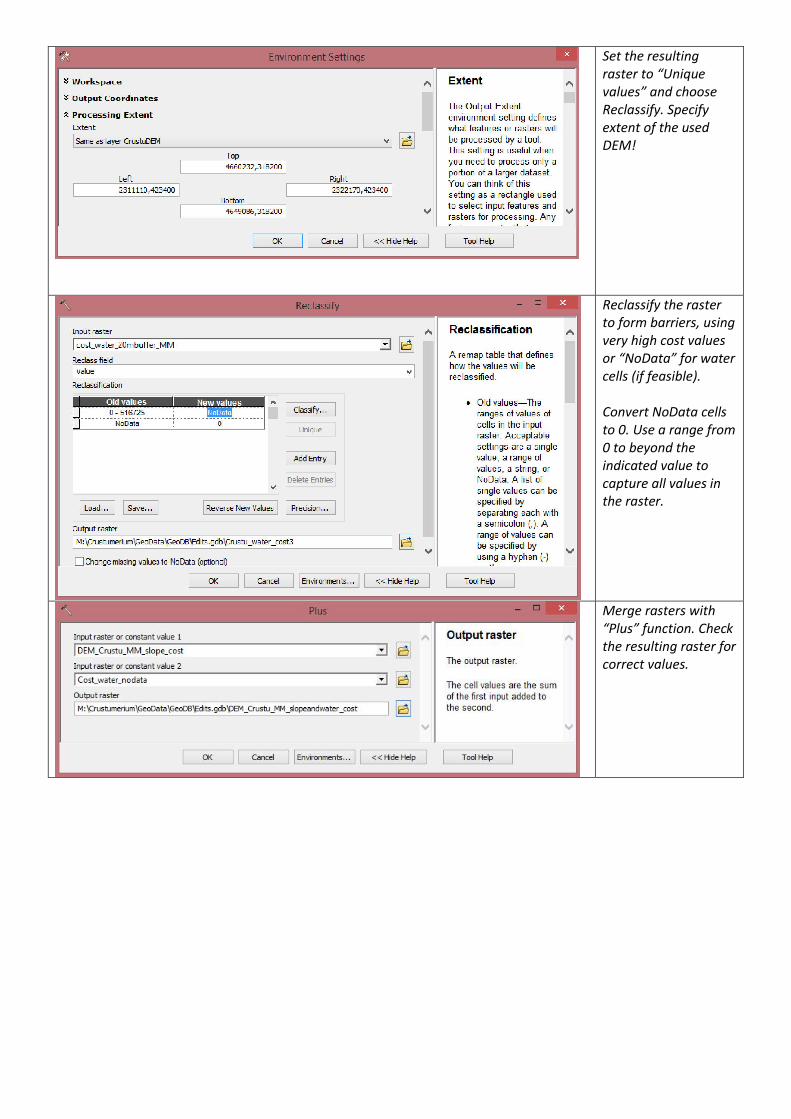
Set the resulting raster to “Unique values” and choose Reclassify. Specify extent of the used DEM!
Reclassify the raster to form barriers, using very high cost values or “NoData” for water cells (if feasible). Convert NoData cells to 0. Use a range from 0 to beyond the indicated value to capture all values in the raster.
Merge rasters with “Plus” function. Check the resulting raster for correct values.
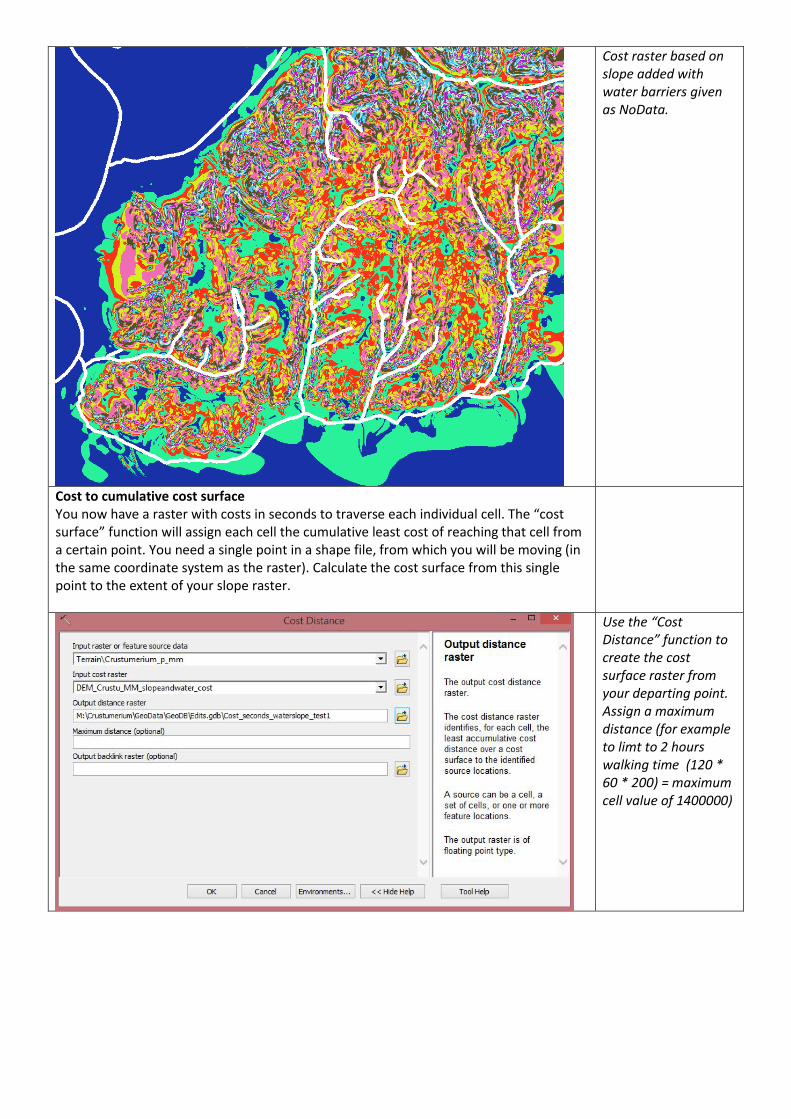
Cost raster based on slope added with water barriers given as NoData.
Cost to cumulative cost surface You now have a raster with costs in seconds to traverse each individual cell. The “cost surface” function will assign each cell the cumulative least cost of reaching that cell from a certain point. You need a single point in a shape file, from which you will be moving (in the same coordinate system as the raster). Calculate the cost surface from this single point to the extent of your slope raster.
Use the “Cost Distance” function to create the cost surface raster from your departing point. Assign a maximum distance (for example to limt to 2 hours walking time (120 * 60 * 200) = maximum cell value of 1400000)
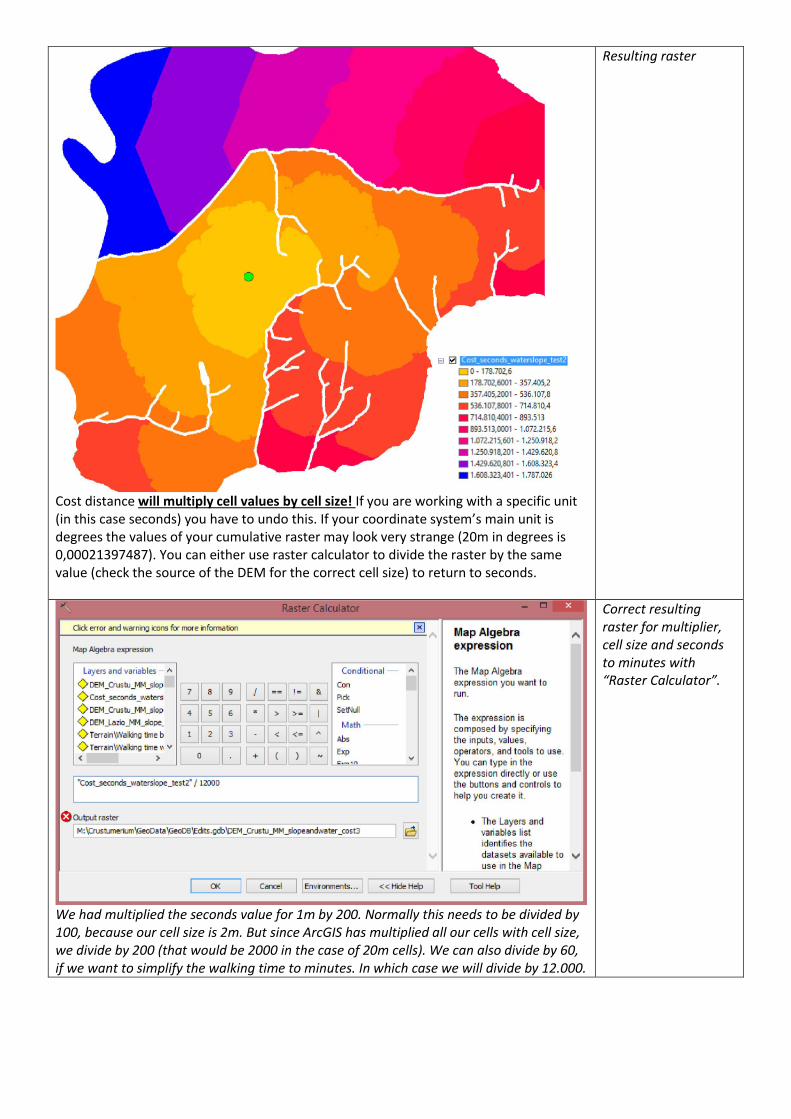
Cost distance will multiply cell values by cell size! If you are working with a specific unit (in this case seconds) you have to undo this. If your coordinate system’s main unit is degrees the values of your cumulative raster may look very strange (20m in degrees is 0,00021397487). You can either use raster calculator to divide the raster by the same value (check the source of the DEM for the correct cell size) to return to seconds.
Resulting raster
We had multiplied the seconds value for 1m by 200. Normally this needs to be divided by 100, because our cell size is 2m. But since ArcGIS has multiplied all our cells with cell size, we divide by 200 (that would be 2000 in the case of 20m cells). We can also divide by 60, if we want to simplify the walking time to minutes. In which case we will divide by 12.000.
Correct resulting raster for multiplier, cell size and seconds to minutes with “Raster Calculator”.
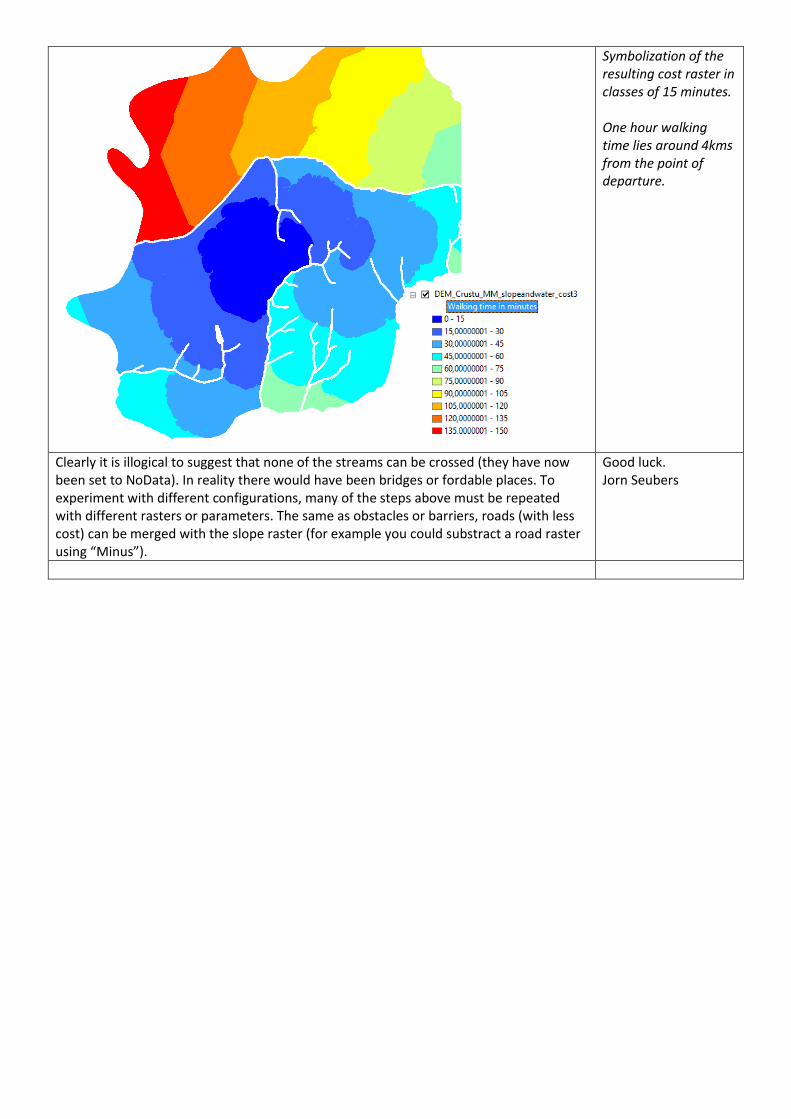
Symbolization of the resulting cost raster in classes of 15 minutes. One hour walking time lies around 4kms from the point of departure.
Clearly it is illogical to suggest that none of the streams can be crossed (they have now been set to NoData). In reality there would have been bridges or fordable places. To experiment with different configurations, many of the steps above must be repeated with different rasters or parameters. The same as obstacles or barriers, roads (with less cost) can be merged with the slope raster (for example you could substract a road raster using “Minus”).
Good luck. Jorn Seubers
Related Documents