MANSOUR SHARAHILI 1 Modelling and optimising the sport and exercise training process With thanks to professor Philip Scarf

MANSOUR SHARAHILI 1 Modelling and optimising the sport and exercise training process With thanks to professor Philip Scarf.
Dec 24, 2015
Welcome message from author
This document is posted to help you gain knowledge. Please leave a comment to let me know what you think about it! Share it to your friends and learn new things together.
Transcript

1
MANSOUR SHARAHILI
Modelling and optimising the sport and exercise training process
With thanks to professor Philip Scarf

2
The aim of the study
Our aim is to relate training to performance and provide a quantitative model that can be used to optimize training in advance of a major competition using power output-heart rate data collected every 5 seconds.

3
The general structure of the thesis
• Performance measurement.• Training measurement.• Relate performance to training using a statistical
model.

4
The relationship between training and performance
•Highly individualised. (genetic factors, individual training background, technical factors).•The amount and type of training.•Level of performance at the beginning of training.•Random increase in training may lead to over-training which increase the likelihood of injury.

5
The components of training
Fitness (benefit) Fatigue (dis-benefit)

6
The study data
RiderAge
(years)
Height
(m)
Weight
(kg)Rider
Age
(years)
Height
(m)
Weight
(kg)
1 45 183.0 74.3 6 27 183.7 71.8
2 52 175.0 74.5 7 40 177.5 75.5
3 35 181.0 71.0 8 34 182.0 77.0
4 42 178.5 78.2 9 34 185.5 88.2
5 21 171.4 60.9 10 29 174.5 71.5

7
The study data

8
The study data
The number of sessions and the period in day for each rider’s training schedule

9
Power output and heart rate monitors
A
B
C

10
Power output and heart rate monitors calculate:
•Power output (watts).•Heart rate (beat per minute).•Cadence (revolutions per minute).•Speed (miles or kilometres per hour).•Temperature (Fahrenheit or Celsius).

11
The measurement of training
Banister, et al. (1975) proposed a measure of training that calculates the accumulative effect of all training sessions carried out up to time t. This measure had a number of components. The first one is the measurement of the amount of training for a single session, called the training load of that session. The second component is how training accumulates for a sequence of sessions over time.

12
Measurement for a single session
The accumulation of training (ATE) for all sessions
The measurement of training

13
The measurement for a single sessiontraining impulse (TRIMP)
The training impulse (TRIMP) is a measure that calculates how hard a rider trains in a single session. This measure is based on heart rate measurements during training. The concept of training impulse was first presented by Banister, et al. (1975) as follows
Where is the training time in minutes of the session is the average heart rate of the session (bpm).

14
The original formula of TRIMP was modified by Morton, et al. (1990) as follows
Where
the duration of the session in minute.
the average heart rate during the session.
the resting heart rate.
the maximal heart rate.
is taken to be 0.64 for males and 0.86 for females.
is taken to be 1.92 for males and 1.67 for females.
15
Rider Max(HR) Rest (HR) Rider Max(HR) Rest (HR)
1 180 45 6 187 39
2 203 48 7 187 49
3 182 45 8 173 42
4 192 42 9 192 53
5 184 42 10 174 42
Maximum and resting heart rate (beats per minute) for each rider.

16
ewkewkw fi
t
i
ai
t
i
sn
ssn
stW
t
if
t
ia
/)(
1
/)(
10
)(
The accumulated training effect (ATE)Banister model
Where:
is the accumulated training effect (ATE) at time t.
is the known training load during session i.
is the number of sessions up to time t.
corresponds to net training effect at time t=0 of sessions in
and are the fitness and fatigue decay time constants,
respectively.
is the benefit scale parameter and is the disbenefit scale
parameter
)(tW
wsi
nt
w0
a f
k a k f
].0,(

17
Banister model

18
An example of the Banister curve for a single session (A) and for a progressive training schedule of 200 days (B) with unit training load for each session, and with default parameters as:
A B
𝜏𝑎=3𝑑𝑎𝑦𝑠 ,𝜏 𝑓=2𝑑𝑎𝑦𝑠 ,𝑘𝑎=1𝑎𝑛𝑑𝑘 𝑓=1 .3

19
Measuring performancePerformance can be measured in a standard way by asking an athlete to swim or ride or run (depending on the type of sport) a particular specified distance. A difficulty with this approach is that performance measurements may underestimate the actual capability or readiness-to-perform.

20
Some performance measures:
•Average power (AP)
•Normalised power (NP)
•Critical power (CP)

21
The relationship between power output and heart rate
The relationship between power output and heart rate is strongly linear Grazzi et al. (1999). However, There is also a delay or time lag between the change in power output and the heart rate response. We investigate different lags of some seconds (0, 10, 15, 20, 25 and 30 seconds) between power output and heart rate and find the strongest relationship when the lag is 15 seconds for almost all sessions.
22
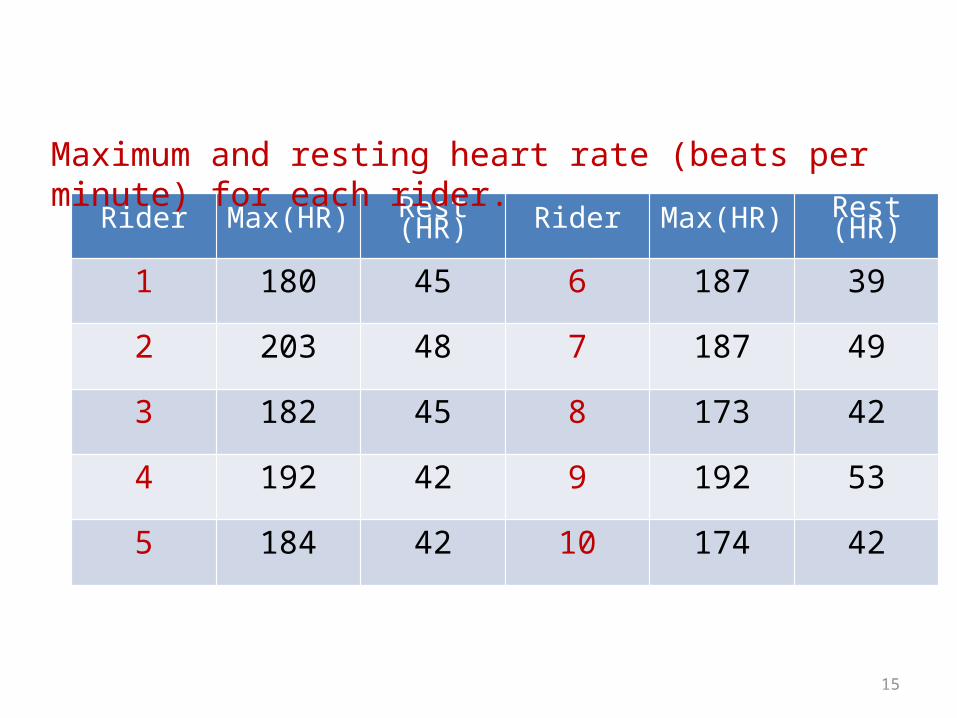
A new measure of performance
The histogram of polling power output for one rider (rider 3)

23
A new measure of performance
Power output versus heart rate for a single session

24
Performance measure for all sessions for one rider

25
Determining the Banister model parameters
If the Banister model parameters are known, training can be optimised.

26
The statistical model
where
and
h𝑃 75 , 𝑖 𝑁 (𝛼+𝛽 . 𝐴𝑇𝐸 𝑖 ,𝜎2+ ��𝑖)
𝜆 𝑖=1
��2𝑣𝑎𝑟 (�� )+
(𝑃75− �� )2
��4𝑣𝑎𝑟 (�� )+ 2 (𝑃75− �� )
��3𝑐𝑜𝑣 ( �� , ��)
log 𝐿=¿−𝑛2
log (2𝜋 )− 12∑𝑖=1
𝑛
log (¿ ��𝑖+𝜎2)−
12∑𝑖=1
𝑛 ( h𝑃 75, 𝑖−𝛼− 𝛽( 𝐴𝑇𝐸𝑖))2
( ��𝑖+𝜎2)
¿¿

27
ResultsRider
1 5.7(0.97)
23(13.5)
2.6(4.2)
2(3.8)
149(3.1)
-0.0033(0.0019)
-1.74
2 4.5(1.5)
5.7(3)
2.8(28)
0.4(1.4)
174(4.0)
-0.0250(0.0100)
-2.50
3 4.6(1.3)
8(32)
3.2(16)
2.2(4.7)
156(3.4)
-0.0140(0.0900)
-0.16
4 4.8(1.6)
228(791)
0.93(1.2)
67(144)
164(3.4)
-0.0011(0.0004)
-2.75
5 38(5.8)
89(139)
7.2(13)
57(18)
168(10.0)
-0.0010(0.0020)
-0.50
6 8.3(1.1)
74(14)
1.2(0.2)
43(14)
186(4.4)
-0.0230(0.0100)
-2.30
7 4.1(1.1)
13(7)
1.9(1.1)
7(3.7)
159(2.2)
-0.0210(0.0200)
-1.05
8 5.3(0.7)
6.3(7)
2.1(1.7)
0.12(0.07)
145(2.3)
-0.0100(0.0050)
-2.00
9 4.6(0.7)
9(3)
1.1(0.4)
6(3.6)
156(2.0)
-0.0100(0.0100)
-1.00
10 6(0.6)
96(72)
1.4(1.2)
42(50)
142(2.4)
-0.0013(0.0030)
-0.43
a k f f t

28
Performance measure and the accumulated training effect versus days for one rider (rider 6)

29
The statistical significance of the training effect
𝐻0 :𝛽=0𝑣𝑠𝐻1 :𝛽<0
𝑡��= ��
𝑠 .𝑒 . ( �� )
30
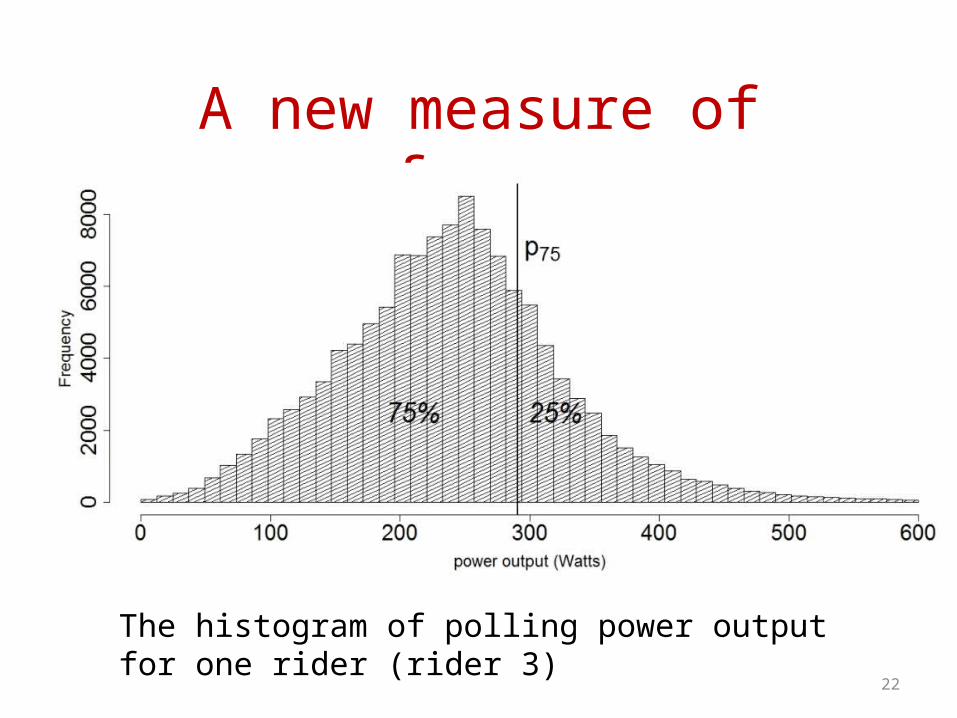
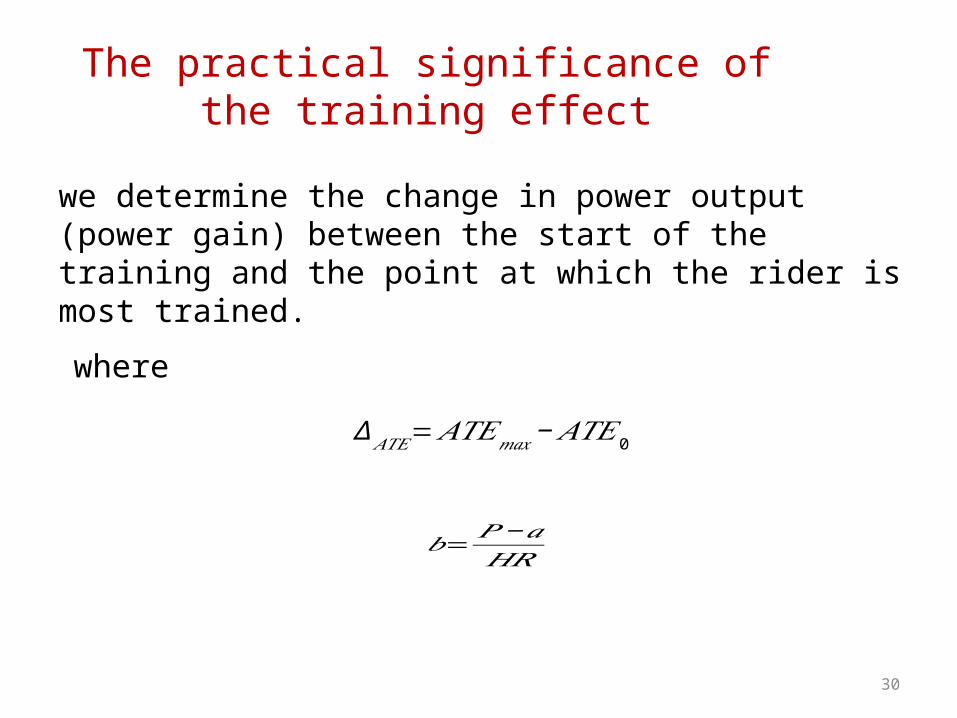
The practical significance of the training effect
we determine the change in power output (power gain) between the start of the training and the point at which the rider is most trained.
where
∆ 𝐴𝑇𝐸=𝐴𝑇𝐸𝑚𝑎𝑥− 𝐴𝑇𝐸0
𝑏=𝑃−𝑎𝐻𝑅

31
To judge the value of the power gain we look at it as a proportion where is the percentile of the power output using the entire training history of the rider. Thus when
we would accept that there is a significant practical effect of the accumulated training effect (ATE) on performance.
∆p q
Pq
>0 .05(5 %)

32
Rider
1 2.31 -0.0030 3290 23 291 0.08
2 2.45 -0.0250 786 48 307 0.16
3 1.61 -0.0140 430 10 291 0.03
4 1.11 -0.0011 7355 9 246 0.04
5 1.83 -0.0010 0 0 280 0
6 3.35 -0.0230 1510 116 384 0.30
7 1.85 -0.0020 7376 27 323 0.08
8 3.11 -0.0100 798 25 274 0.09
9 2.34 -0.0100 692 16 214 0.08
10 2.43 -0.0010 4937 12 260 0.05
b ATE 75P P75 P75P75
Practical significance

33
Limitations of the study
• Many parameters in the Banister model• The data are very noisy• No training diaries were recorded• Monitoring a young rider for a period of
time (e.g. 2 years) may give better estimates for our model

34
Conclusion
In conclusion, there is much work that remains to be done. This thesis makes a start at optimising training schedules, and in cycling in particular. We have suggested some key points which should be taken into account to develop this work and contribute to the knowledge.

35
Future work
• To obtain new data on a developing rider.• To study the effect of temperature on the
relationship between power output and heart rate.

36
Thank you
Related Documents