Ocean Engineering 33 (2006) 2381–2434 Manoeuvring behaviour of ships in extreme astern seas Zafer Ayaz a, , Dracos Vassalos a , Kostas J. Spyrou b a Department of Naval Architecture and Marine Engineering, Universities of Glasgow and Strathclyde, Henry Dyer Building, 100 Montrose Street, Glasgow, Scotland, G4 OLZ UK b School of Naval Architecture and Marine Engineering, National Technical University of Athens, 9 Iroon Polytechneiou, Zographou, Athens 15773, Greece Received 14 February 2005; accepted 25 October 2005 Available online 9 March 2006 Abstract In an attempt to contribute to efforts for a robust and effective numerical tool addressing ship motion in astern seas, this paper presents the development of a coupled non-linear 6-DOF model with frequency dependent coefficients, incorporating memory effects and random waves. A new axes system that allows straightforward combination between seakeeping and manoeuvring, whilst accounting for extreme motions, is proposed. Validation of the numerical model with the results of benchmark tests commissioned by ITTC’s Specialist Group on Stability demonstrated qualitative, yet not fully satisfactory agreement between numerical and experimental results in line with other predictive tools. The numerical results indicate that the inclusion of frequency coefficients definitely affects the accuracy of the predictions. In order to enhance further the numerical model and obtain useful information on motion coupling, extensive captive and free running model tests were carried out. Good agreement with the experimental results was achieved. These studies provide convincing evidence of the capability of the developed numerical model to predict the dangerous conditions that a ship could encounter in extreme astern seas. As a result, it could offer new insights towards establishing relationships linking ship behaviour to design, environmental and operational parameters. r 2006 Elsevier Ltd. All rights reserved. Keywords: Following/quartering seas; Extreme ship motions; Manoeuvring; Stability; Broaching; Surf- riding; Parametric rolling ARTICLE IN PRESS www.elsevier.com/locate/oceaneng 0029-8018/$ - see front matter r 2006 Elsevier Ltd. All rights reserved. doi:10.1016/j.oceaneng.2005.10.023 Corresponding author. Fax: +44 141 5484784. E-mail address: [email protected] (Z. Ayaz).

Welcome message from author
This document is posted to help you gain knowledge. Please leave a comment to let me know what you think about it! Share it to your friends and learn new things together.
Transcript

ARTICLE IN PRESS
Ocean Engineering 33 (2006) 2381–2434
0029-8018/$ -
doi:10.1016/j
�CorrespoE-mail ad
www.elsevier.com/locate/oceaneng
Manoeuvring behaviour of ships inextreme astern seas
Zafer Ayaza,�, Dracos Vassalosa, Kostas J. Spyroub
aDepartment of Naval Architecture and Marine Engineering, Universities of Glasgow and Strathclyde,
Henry Dyer Building, 100 Montrose Street, Glasgow, Scotland, G4 OLZ UKbSchool of Naval Architecture and Marine Engineering, National Technical University of Athens,
9 Iroon Polytechneiou, Zographou, Athens 15773, Greece
Received 14 February 2005; accepted 25 October 2005
Available online 9 March 2006
Abstract
In an attempt to contribute to efforts for a robust and effective numerical tool addressing
ship motion in astern seas, this paper presents the development of a coupled non-linear 6-DOF
model with frequency dependent coefficients, incorporating memory effects and random
waves. A new axes system that allows straightforward combination between seakeeping and
manoeuvring, whilst accounting for extreme motions, is proposed. Validation of the numerical
model with the results of benchmark tests commissioned by ITTC’s Specialist Group on
Stability demonstrated qualitative, yet not fully satisfactory agreement between numerical and
experimental results in line with other predictive tools. The numerical results indicate that the
inclusion of frequency coefficients definitely affects the accuracy of the predictions. In order to
enhance further the numerical model and obtain useful information on motion coupling,
extensive captive and free running model tests were carried out. Good agreement with the
experimental results was achieved. These studies provide convincing evidence of the capability
of the developed numerical model to predict the dangerous conditions that a ship could
encounter in extreme astern seas. As a result, it could offer new insights towards establishing
relationships linking ship behaviour to design, environmental and operational parameters.
r 2006 Elsevier Ltd. All rights reserved.
Keywords: Following/quartering seas; Extreme ship motions; Manoeuvring; Stability; Broaching; Surf-
riding; Parametric rolling
see front matter r 2006 Elsevier Ltd. All rights reserved.
.oceaneng.2005.10.023
nding author. Fax: +44141 5484784.
dress: [email protected] (Z. Ayaz).

ARTICLE IN PRESS
Nomenclature
a amplitude of wave (m)aH interaction factor between hull and rudderai, component wave amplitude (m)B beam (m)c phase velocity of wave (m/s)Cb block coefficientC _j damping force (Nt)df draught at fore (m)d mean draught (m)da draught at aftD depth (m)DP propeller diameter (m)FN rudder normal forces (Nt)Fn nominal Froude numberg gravitational acceleration (m/s2)GM metacentric height (m)H wave height (m)Hs significant wave height (m)Ixx roll moment of inertia (kgm2)Iyy pitch moment of inertia (kgm2)Izz yaw moment of inertia (kgm2)Jp advance coefficientk wave numberki component wave numberK0 roll external moment (Ntm)KG vertical position of centre of gravity from keel line (m)KP proportional gain (s)KR differential gain (s)KT thrust coefficientLBP length between perpendiculars (m)LCG longitudinal position of centre of gravity from the amidships (m)m ship mass (kg)M0 pitch external moment (Ntm)n propeller rate of rotation (rpm)N0 yaw external moment (Ntm)Nj normal Vectorp pressure (N/m2)ps static wave pressure (N/m2)pd dynamic wave pressure (N/m2)P angular roll velocity (deg/s)Q angular pitch velocity (deg/s)R angular yaw velocity (deg/s)
Z. Ayaz et al. / Ocean Engineering 33 (2006) 2381–24342382

ARTICLE IN PRESS
RT(u) total resistance force (Nt)S propeller slip ratioTp thrust deduction in forward motion and during a turn at the propellertr thrust deduction in forward motion and during a turn at the rudder
positiontD time constant (s)Tj roll period (s)Tz modal period (s)U surge velocity (m/s)Urw effective wind speed (m/s)UR rudder inflow velocity (m/s), and angleV sway velocity (m/s)VR mean rudder inflow velocity (m/s)Wp wake fraction in forward motion and during a turn at the propellerwr wake fraction in forward motion and during a turn at the rudder
positionW heave velocity (m/s)X0 surge external force (Nt)xH longitudinal position of the point of action of the to hull interaction
force (m)xR longitudinal position of the rudder’s centre of pressure (m)Y0 sway external force (Nt)Z0 heave external force (Nt)zR vertical position of the rudder’s centre of pressure (m)zy vertical coordinate of the centre of action of lateral force (m)
Greek symbols
w heading angle (deg)wc autopilot course from the wave direction (deg)d rudder Angle (deg)dR actual rudder angle (deg)f heel angle (deg)l wave length (m)y pitch angle (deg)r density (kg/m3 )si random phase angle (deg)t Hanaoka parametero wave frequency (rad/s)oe wave encounter frequency (rad/s)owi component circular frequency (rad/s)oG angular velocity (deg/s)x position of ship on the wave (m)c autopilot course (deg)cR the desired heading angle (deg)
Z. Ayaz et al. / Ocean Engineering 33 (2006) 2381–2434 2383

ARTICLE IN PRESS
z vertical position of ship (m)z(t) irregular wave elevation (m)za wave amplitude (m)D displacement (kg)FI potential associated with the incoming wave potentialFD potential of disturbed wave
Hydrodynamic coefficients
X _u surge acceleration coefficientXvr surge velocity coefficientY _vY _r sway acceleration coefficientsYv,Yr linear sway velocity coefficientsY vjvj;Y rjrj higher order sway velocity coefficientsZ _q;Z _w heave acceleration coefficientsZq,Zw heave velocity coefficientsK _p roll acceleration coefficientM _q;M _w pitch acceleration coefficientsMq, Mwpitch velocity coefficientsNv,Nr linear yaw velocity coefficientsNrjrj;Nvjvjr;Nrjrjv Higher order yaw velocity coefficients
Z. Ayaz et al. / Ocean Engineering 33 (2006) 2381–24342384
1. Introduction
Ship motions in extreme astern seas have been of great scientific interest for thelast 40 years or so. The highly non-linear and unpredictable nature of thephenomena has motivated several studies with different theoretical and experimentalapproaches. Yet, the number of studies concerning coupled ship motion stabilitycould still be seen as limited compared to the vast number of studies in the other twoimportant areas of hydrodynamics to which these motions are assumed to be related:seakeeping and manoeuvring. However, due to the unique character of phenomenathat involve two areas of hydrodynamics, study of these motions could be a catalystfor achieving the long overdue marriage of seakeping and manoeuvring. Moreover,the strong requirement from the maritime community and academia for establishingadequate and robust stability and safety rules covering ship motions in extremeastern seas has motivated further the development of reliable numerical codes forperformance-based assessment of ship stability in extreme seas. Notably, the stabilitycriteria issued by IMO have limited relevance to the as following sea environmentwhere a ship is most vulnerable.
The need for more theoretical and experimental investigations to study thesemotions were emphasised by both the manoeuvring Committee (1999) and theSpecialist Committee on Stability (1999) of the International Towing TankConference in 1999 (ITTC, 1999a,b). Based on this background, there has been an

ARTICLE IN PRESS
Z. Ayaz et al. / Ocean Engineering 33 (2006) 2381–2434 2385
upsurge in efforts to establish reliable numerical models to simulate manoeuvring ofships in extreme astern seas and to identify dangerous situations or other interestingphenomena occurring during those motions.
The nature of dangerous conditions occurring in extreme astern seas has beenevaluated through extensive experimental and theoretical studies. In broad terms,combination of direct steep waves and energy concentration in a narrow range offollowing and quartering waves could lead to dangerous conditions which mayultimately lead to capsizing: The semi-static mode so-called ‘‘pure loss of stability ona wave crest’’ occurs when there is not enough buoyancy to keep the vessel uprightand capsize happens suddenly and abruptly. The dynamic mode known as low-cycleresonance (parametric resonance) is caused by a Mathieu-type built-up of large rollmotion. This large roll motion arises when a number of factors are combined, suchas: the roll natural frequency is multiple of half the encounter frequency, rolldamping is low and wave length is comparable to ship length. The third modeinvolves hydrodynamic lift forces and directional instability of the ship and is knownas broaching. Broaching is usually preceded by the so-called ‘‘surf-riding’’ behaviourwhere the ship appears to be carried along by a single wave. In this unsafe conditionthe yaw restoring force provided by the rudder could be inadequate to impede theincreasing oscillatory yawing motion and this leads to ‘‘loss of heading’’ or‘‘broaching-to’’, which in turn could result in capsizing. In astern seas, couplingbetween surge and lateral motions cannot be avoided therefore it is essential to takeboth surf riding and broaching into account. However, broaching could also occur atlower speeds with oscillatory build-up of yaw motion but the required waves aresteeper than in the previous broaching condition. Whilst this second mode mightseem to relate to horizontal plane motions only, capsize may also occur due to strongcoupling between roll and sway–yaw motions. Spyrou (1995,1996) has described indetail the interesting dynamics of the various type of broaching. A fourth mode isusually observed for high-speed craft having small bow height. It is referred-to as‘‘bow-diving’’: with increasing nominal speed, in conditions similar to those leadingto surf riding, the bow submerges into the preceding wave slope because there theship achieves a condition of static equilibrium in the surge direction. Matsuda et al.(2003) confirmed these phenomena with experimental results.
As mentioned earlier, the interesting dynamics of these phenomena has attractedmany researchers and a great amount of experience and knowledge have been gainedthrough experimental and theoretical studies. By being the most dynamic modeamongst dangerous conditions, broaching-to has gained particular attention. Somewell-known early studies such as Davidson (1948), Grim (1963) investigateddirectional stability and steering behaviour in following seas and developed non-linear mathematical models. Meanwhile,Du Cane and Goodrich (1962) and Conolly(1972) extensively investigated broaching and related aspects in a quantitative way.Since the pioneering study of Davidson (1948), manoeuvring-type models are used inorder to study the motions of ships in astern seas. This is due to the fact thathydrodynamic forces acting on a ship which travels in astern seas consist mainly oflift components, wave-making components being negligibly small. In the past, anumber of researchers such as Abkowitz (1969) stated the differences on approaches

ARTICLE IN PRESS
Z. Ayaz et al. / Ocean Engineering 33 (2006) 2381–24342386
between manoeuvring and seakeeping which are reflected in the evolution of twodifferent types of mathematical models. Manoeuvring usually deals with steady stateand transient (or zero and low frequency) motions in calm water, while seakeepingdeals only with higher frequency wave-induced motions. However, those manoeuvr-ing models, which are based on calm water conditions, cannot describe dynamicsencountered in a wave environment. As a result, time domain models used todescribe motions in astern seas and capsizing take into account manoeuvring forcesand wave forces and they follow a modular approach.
Motora et al. (1982) carried out numerical simulations of surge, sway, yaw androll motions of a ship travelling in following waves by making use of the results ofcaptive model tests. Based on those investigations, it was concluded that ‘‘waveexciting yaw moment which exceeds the course-keeping ability of the rudder resultsin broaching-to phenomena’’. This finding was in contrast to previous opinions thatthe extreme yaw motion comes from hydrodynamic moments as a result of theunsymmetrical underwater volume following large heeling.
Following the aforementioned findings, Hamamoto and Akiyoshi (1988),Hamamoto and Shirai (1989), Hamamoto and Kim (1992), and Hamamcoto andSaito (1992) developed a six degrees of freedom mathematical model. Thecalculation of incident wave forces was based on analytical approximations anddiffraction forces were not included. A quasi-steady theory under the assumption oflow encounter frequency was incorporated and hydrodynamic forces were evaluatedusing practical formulae. The influence of wave height and length, relative positionof ship to wave, heading angle and loading condition (GM) were examined.Capsizing due to parametric excitation and pure loss of stability were simulated.Similarly, De Kat and Paulling (1989) presented a numerical model for simulatinglarge amplitude motions in severe waves and capsizing. Linear potential theorywas used for determining the wave induced pressures and the body radiationand diffraction forces. Froude–Krylov forces were calculated up to instantaneousfree surface. Manoeuvring derivatives associated with viscous flow affecting thesway force and yaw moment were incorporated. Low cycle resonance, loss ofstatic stability and broaching phenomenon were realized, the latter not by one waveaction but when subsequent steep quartering waves were striking the vessel.Hamamoto et al. (1994) also used a similar mathematical approach to studycombined motions of sway, roll and a yaw in following seas. The mathematicalmodel was linearized and numerical simulations were carried out to showunstable behaviour in limiting situations at zero frequency of encounter and inovertaking waves of low frequency of encounter. In a similar way, Umeda andRenilson (1992a,b) introduced a practical method for calculating the wave forceson a ship running in quartering seas. It was claimed to be a limiting case of astrip theory method where the effect of encounter frequency was ignored since it isvery low for this case. The experimental and numerical studies revealedthat Froude–Krylov forces alone cannot predict wave forces with sufficientaccuracy and by utilizing the Ohkusu (1986)’s study, it was found that the methodcould be useful if broaching only is investigated for a transient period. Vassalos andMaimun (1994), giving a brief review of individual mechanisms likely to contribute

ARTICLE IN PRESS
Z. Ayaz et al. / Ocean Engineering 33 (2006) 2381–2434 2387
to broaching, confirmed, using numerical and experimental investigations, thatcoupling between longitudinal and lateral motions are of paramount importance forbroaching as well as the ensuing extreme vessel behaviour. Bailey et al. (1998)developed a unified mathematical model to study dynamical behaviour andmanoeuvring of a ship travelling in seaway, encapsulating theories of seakeepingand manoeuvring. The relations between fluid actions defined in manoeuvringanalyses using a body fixed frame of reference and those for seakeeping analysisusing an equilibrium frame of reference were presented. Munif and Umeda (2000)developed a fully non-linear six degrees of freedom numerical model in whichlarge angles were taken into account. It was concluded after extensive numericalsimulations that capsizing due to parametric resonance occurs only forlower metacentric height and lower speed with the ship running with encounterangles of 30–451 is more dangerous for capsizing than when the encounter angle isbetween 0 and 151.
In the calculation of ship motions in astern seas since the frequency of encounter isquite low, it is quite common to use ‘‘zero-frequency’’ constant hydrodynamiccoefficients as in calm-water manoeuvring calculations to use ‘‘zero-frequency’’constant hydrodynamic coefficients. However, some studies such as Ankudinov(1983) argued that wave effects associated with unsteady motion of the hull at thefree surface and vortices which are shed from the oscillating hull indicate that theconvolution terms (‘‘memory effects’’) do have considerable effects. In Ankudinov’s(1983) 6 DOF non-linear model, heave and pitch were decoupled from surge as wellas from the lateral plane motions. The mathematical model was applied todeterministic calculation of seakeeping and manoeuvring prediction in irregular seas.McCreight (1986), using state space approximation, studied manoeuvring in wavesalthough the effect of frequency on large amplitude ship motions in astern seas wasnot a focus of the study. Following similar approaches, Rhee et al. (1990), Lee (2000)investigated the effect of frequency for simple manoeuvring motions in waves.Hamamoto and Saito (1992) presented a practical method for the time-domaindescription of ship motions in following waves. In the calculation of heave and pitchmotions they compared hydrodynamic forces described a fixed frequency withconvolution methods. However, the model is not exact even for the small amplitudemotion problem since the frequency of motion cannot be determined when non-linear equations are involved in the equation.
Since the development of numerical tools in astern seas focused on motions inregular waves, irregular seas studies mostly consisted of experimental results.Takaishi (1982) showed an example of encountered waves measured in followingseas and stated that the ship travelling in irregular seas could be successively attackedby large waves long enough time to undergo large rolling motion. De Kat andPaulling (1989) found that in the following and quartering sea conditions, the waveelevation observed amidships appears to be regular over certain periods of time inspite of the randomness of the sea. Therefore, they suggested characterizing therandom wave process by superposition of only two regular wave systems whichwould yield an equivalent wave system. Hamamoto et al. (1996) further evaluatedTakaishi’s s work incorporating GM fluctuation. It was found that the encountered

ARTICLE IN PRESS
Z. Ayaz et al. / Ocean Engineering 33 (2006) 2381–24342388
wave spectrum band is very narrow at a frequency range that could coincide with theship roll natural frequency ensuing with GM fluctuations was considered.
In the light of the results of the benchmark studies commissioned in its first term(1999), the ITTC Specialist Committee on Prediction of Extreme Ship Motions andCapsizing (2002) has targeted in its second term the elements affecting the accuracyof the numerical models. Amongst these, degrees of freedom and frequency effect orso called ‘‘memory effect’’ were seen to be the most important. Concerning waveirregularity, the report mentioned that the applicability of numerical models torealistic seaways, that is, short-crested seaways, should be examined. It referred toexperimental results indicating that capsizing danger is least in short-crestedirregular waves, followed by long-crested and finally regular waves.
State-of-the-art time domain numerical codes now employ 6 DOF non-linearnumerical models incorporating the memory effects in regular and irregular wavesdirectly or by using hydrodynamic coefficients provided by experiments. Couplingeffects between modes of motion, despite not being yet completely understood, aretaken into account. Especially, the effect of vertical motions is not yet fullyinvestigated. Therefore, in the light of all these drawbacks, it is not surprising thatnumerical models are still not fully reliable for drawing stability and safetyguidelines. However, they can prove very useful when combined with the modelexperiments. Due to the practical limitations experimental studies have been usedless for irregular waves.
Deriving from this background, a research study has been undertaken to develop acoupled non-linear 6-DOF model with frequency dependent coefficients, incorpor-ating memory effects in random waves with a new axis system that allowsstraightforward combination between seakeeping and manoeuvring models whilstaccounting for extreme motions. This paper presents details of this mathematical/numerical model and its validation using experimental results from the ITTCBenchmark tests. This is followed by analysis of the captive model tests carried outto investigate the effect of encounter frequency and coupling effects as well as freerunning model tests in irregular waves to investigate those effects in more realisticenvironmental conditions. The findings of these studies are presented and discussed,based on which conclusions are drawn and recommendations made.
2. Mathematical model
The numerical model incorporates non-linear six-degrees-of-freedom coupledmotion equations in the time-domain, with no restrictions on motion amplitude. Inorder to provide a meaningful combination of seakeeping and manoeuvring, theequations of motions are expressed in terms of a horizontal body axes system. Thehorizontal body axes, which are closely related to, but not a special case of generalbody axes, is quite a common system which has been used in many other studies ofship manoeuvring that include roll (Chislett, 1990), in studies of manoeuvringmotion of ships in waves especially for studying capsizing, (Hamamoto and Kim,

ARTICLE IN PRESS
Z. Ayaz et al. / Ocean Engineering 33 (2006) 2381–2434 2389
1993), and for studies of dynamic stability of ships in following and quartering seas,(Hamamoto et al., 1996).
In deriving the basic equations of motion, three different coordinate systems areused as shown in Fig. 1. The first is an earth fixed system, defined by 0-xZz Thesecond is a general body axes which is fixed in the ship with the origin G beinglocated at the centre of gravity of the ship defined by G-xyz. The third is thehorizontal body axes fixed in the ship with the origin at G and defined by G-x0y0z0.Notice that in contrast with conventional methods, no assumptions are made of asmall pitch angle and the motions are solved for large amplitudes. Thus results areobtained from the non-linear equations. In light of the above facts, from Newton’ssecond law of motions, equations of motion are obtained. Here, considering forceand moment components, the force and moment can individually be divided into
Fig. 1. Existing axes systems and horizontal body axis system (Hamamoto and Kim, 1992).

ARTICLE IN PRESS
Z. Ayaz et al. / Ocean Engineering 33 (2006) 2381–24342390
components:
m _VG þ oG � V G
� �¼ XF;
_HG þ oG �HG ¼ XM;(1)
where m is the mass of a ship, HG the angular momentum about the centre of gravity,o the angular velocity, VG the linear velocity, XF the external force vector and XM
the moment vector. The first term of right-hand side of Eq. (1) is the reactive forcesacting on the hull and it will be divided into two parts: hydrostatic andhydrodynamic forces. In order to describe the situation of the ship in the earthfixed axes, it is normal to use a transformation of Eq. (1) in terms of Eulerian anglesf,y,c which are defined as the rotations about the body fixed axes (Fig. 1). Here, Eq.(2) instead of Eq. (1), in which the only one rotation about the absolutely verticalaxis is considered, is used and this is called here as the Horizontal body axes, G-x0y0z0
in Fig. 1
m _V G þ k _c� VG
� �¼ �
ZZs
pn ds;
_HG þ k _c�HG ¼ �
ZZs
p r� nð Þ ds; ð2Þ
Vg ¼ iU þ jV þ kW HG ¼ iHx0 þ jHy0 þ kHz0 , (3)
where U, V and W are the linear velocities, Hx’, Hy’ and Hz’ the components ofmoment vector with respect to the Horizontal body axes. The transformationbetween body axes and horizontal body axes in terms of the Eulerian angles is asfollows:
x0
y0
z0
264
375 ¼
cos y sinj sin y cosj sin y
0 cos y � sinj
� sin y sinj cos y cosj cos y
264
375
x
y
z
264375. (4)
The angular velocity is described for the horizontal body axis system as
o ¼ i _Fþ j _Yþ k _C. (5)
The transformation between the angular velocity of the horizontal system and thebody axis system is shown as
_F_Y_C
264
375 ¼
cos y 0 0
0 1 0
� sin y 0 1
264
375
_j_y_c
264
375. (6)

ARTICLE IN PRESS
Z. Ayaz et al. / Ocean Engineering 33 (2006) 2381–2434 2391
The components of the moment vector in terms of the angular velocity and momentsof inertia can be defined as
Hx0
Hy0
Hz0
264
375 ¼
Ix0x0 �Ix0y0 �Ix0z0
�Iy0x0 Iy0y0 �Iy0z0
�Iz0x0 �Iz0y0 Iz0z0
264
375
_F_Y_C
264
375. (7)
In (7), prime (0) indicates moments of inertia for the horizontal body axis system.In order to derive the equations of motion some approximations are made. First,
because of symmetry and since the origin is located at the centre of gravity, it isassumed that Iyz ¼ 0, Ixy ¼ 0, Ixz ¼ 0 and in the horizontal system IyyffiIzz.Furthermore, using Eqs. (4) and (7), the moments of inertia and product moments ofinertia are obtained as
Ix0x0 ¼ Ixx cos2 yþ Izz cos
2 fþ Iyy sin2 f
� �sin2 y
� �;
Iy0y0 ¼ Iyy cos2 fþ Izz sin
2 f ¼ Iyy ¼ Izz;
Iz0z0 ¼ Ixx sin2 yþ Izz cos
2 fþ Iyy sin2 f
� �cos2y
� �;
(8)
Ix0y0 ¼ 0;
Iy0z0 ¼ 0;
Iz0x0 ¼ ðIxx � Izzcos2 f� Iyy sin
2 fÞ sin y cos y:(9)
Considering force and moment components, the force and moment willindividually be divided into components. Further expansion of Newton’s equationsin Eq. (2) will yield final form of modified equation of motions in Horizontal BodyAxis system. Here, substituting P for _F, Q for _Y and R for _C the moment equationswill be
mð _U � VRÞ ¼ X 0;
mð _V þURÞ ¼ Y 0;
m _W ¼ Z0 þmg;
(10)
ðIyy � IxxÞ sin 2 y QPþ 12_R
� �þ cos 2 yQR
� �þ ðIxx cos
2 yþ Iyy sin2 yÞ _P� Iyy RQ ¼ K 0,
ðIyy � IxxÞ sin 2 y 12R
2� �� �
þ ðIxx cos2 yþ sin2 yÞRPþ Iyy
_Q ¼M 0,
ðIxx � IzzÞ sin 2 y QR� 12_P
� �� cos 2yQP
� �þ ðIxx sin
2 yþ Izz cos2 yÞ _R ¼ N 0,ð11Þ
where X0,Y0,Z0,K0,M0,N0 are surge, sway, heave, roll, pitch, yaw external forces andmoments. U, V, R are surge, sway, heave linear velocities, Q, P, R are roll, pitch, yawangular velocities in horizontal body axes system and Ixx, Iyy, Izz are roll, pitch, yawmoments of inertias, respectively. It can be written in terms of variable as follows:
X : State Vector x 2 jR00;
X : za; xG; x0; y0; z0;U ;V ;W ;P;Q;R;f; y;c; dð Þ
T;(12)

ARTICLE IN PRESS
Z. Ayaz et al. / Ocean Engineering 33 (2006) 2381–24342392
where x0, y0, z0 are kinematics, d denotes rudder angle xG and za represent horizontaland vertical component of wave amplitude, respectively. In a more common way,from general seakeeping models, equations of motions in Eqs. (10) and (11) can bewritten as
ðM þ AÞ €X þ B ðX Þ _X þ C ðX ÞX ¼ F ðzw;X ; _X ; €X Þ, (13)
where M is inertia matrix, A is added inertia matrix, B is damping coefficient matrix,C is restoring coefficient matrix, F is external force vector and zw is wave amplitude.
2.1. External forces
When the ship travels in following and quartering seas, several external factorshave an influence on the dynamic behaviour. However in this study, wave forces,manoeuvring (hull) forces, rudder and propeller and wind forces will be taken intoaccount in the estimation of the external forces, since they represent the mostimportant components of the excitation. External forces are estimated usingconventional modular approach. The aforementioned external forces in modularform can be given as follows:
X 0 ¼ X W þ X H þ X RD þ X P;
Y 0 ¼ Y W þ Y H þ Y RD þ Y P;
Z0 ¼ ZW þ ZH ;
K 0 ¼ KW þ KH þ KRD þ KP;
M 0 ¼MW þMH ;
N 0 ¼ NW þNH þNRD þNP:
(14)
Here, W indicates wave forces and moments, H indicates hull (manoeuvring) forcesincluding the resistance force in surge motion and moments and radiation forces andmoments for vertical motions, RD indicates rudder forces and moments and P
indicates propeller forces and moments, respectively.
2.1.1. Wave forces
As well as being an important factor in identifying the safety of a vessel andsometimes a major cause in dangerous situations and capsizing, waves can have asignificant effect on coursekeeping and manoeuvring of a ship in following andquartering seas. A ship, attempting a steady course in rough seas, experiences wave-induced oscillatory motions in all six degrees of freedom. According to classicallinear theory fluid is assumed to be inviscid and incompressible and the flow isirrotational. Surface tension is neglected and infinite water depth is assumed. Fromthe classical seakeeping theory, wave forces will be considered in two parts; forcesinduced by incident waves or so-called ‘‘Froude-Krylov’’ forces and forces inducedby diffracted waves.
2.1.1.1. Froude– Krylov including hydrostatic forces on a ship. Both experimentaland numerical studies confirmed that Froude–Krylov forces acting on surge

ARTICLE IN PRESS
Z. Ayaz et al. / Ocean Engineering 33 (2006) 2381–2434 2393
direction in following and quartering seas can be significant, especially, forinvestigating dangerous phenomenon such as surf-riding. Furthermore, theintroduction of the wave profile into the simulation of such motion was found tobe crucial. It is known very well that when motions in extreme followingand quartering seas are concerned, there is significant change in restoring momentof vessel due to the wave, also the occurrence of large trim and sinkageduring the extreme seas condition would require certain coupling of vertical andhorizontal motions and this is done in the form of instantaneous wavesurface modelling. For instance, De Kat and Paulling (1989) pointed out thatlinear wave theory applied to large amplitude waves in deep water has been found toyield very adequate results as regards wave profile, water particle kinematics andpressure and in case of the aforementioned important surge forces obtained fromintegration of pressure gradient over the wetted volume. In steep waves however,pressure gradient may be reduced below the one predicted by Froude–Krylov andthis generally leads to lower stability in real motions. Hence, the integration ofpressure over instantaneous wave surface is a very common method in theinvestigation of ship motions in extreme astern seas conditions. Therefore, this isfollowed in the present study as well.
The generalized Froude–Krylov force vector is given by integration of pressure inthe undisturbed wave system up to the instantaneous wetted surface
ZZS
pndS ¼
ZZS
pðH:S:ÞndS þ
ZZS
pðH:D:Þn dS: (15)
The former is static, the latter is dynamic wave pressure, and may be written as
ps ¼ �rgB;
pd ¼ �rqFI
qt;
(16)
where r is density and FI is the potential associated with the incoming wavepotential. Froude–Krylov forces and moment are written as
FF :K ¼ �
ZZS
pn dS
MF :K ¼ �
ZZS
pðr� nÞdS; ð17Þ
where n is normal vector and r� n is vector fixed with respect to centre of gravity.In order to evaluate the Froude-Krylov forces two different methods are used. First,
pressure is integrated using 3D panel method and the second is Gauss theorem,(Hamamoto and Kim, 1992) while hull is modelled in 2D. The idea behind the firstmethod is to form the ship hull by panels and calculate the pressure on those panels.The method first introduced to marine studies by Hess and Smith (1964), has gainedgreat importance in recent years thanks to high-speed computers. The hull is modelledby plane quadrilateral surface elements. Using quadrilateral or triangular elementscannot make a significant difference however Hess and Smith (1964) pointed out that

ARTICLE IN PRESS
Z. Ayaz et al. / Ocean Engineering 33 (2006) 2381–24342394
the use of triangular elements eliminates the so-called ‘‘edge-effects’’ and the choice ofpoint where velocity and pressure are to be evaluated is not obvious for triangularelement. However, as it is mentioned earlier, one important requirement of the panelmethod is to use geometrically equally distributed panels. Sometimes it can be difficultto obtain such a hull mesh and for very curved forms, like fishing vessels, inaccuracy ofthe results obtained from panels may rise due to unequal or sometimes overlappingpanels of the hull mesh. Therefore, Froude–Krylov forces calculations are carried outusing 2D Gauss theorem following the method used in Hamamoto and Kim (1992).
2.1.1.2. Diffraction forces. When a ship is running in the following waves, sheencounters the wave crests with very long period. Traditionally, the strip theory withforward speed has been used for calculation of wave forces and loads in these waves.However, due to now well-established fact of low encounter frequency in thissituation, strip theory could be inadequate to calculate those motions. Based on theabove background, this study follows the method proposed by Ohkusu (1986). In thismethod effort is focussed on taking into account the effect of waves resulting from thedisturbance of the incident waves by the ship. Those waves are supposed to be ofhigher order than the incident waves and their effect is naturally of higher order thanthe Froude–Krylov forces. The terms include the effect between the disturbed incidentwaves and the stationary waves generated when the ship runs on otherwise calm water.
In the light of the above statements using the dynamic pressure on the hull, generalwave force equations are obtained. For the purpose of the study, only thedisturbance equation is used which can be written as follows (Ohkusu, 1986):
FDIF ¼ rU
ZGX
FDNj ds: (18)
Here, j ¼ 1,2,3 denotes sway, heave, roll respectively FD indicates the disturbanceof waves, and Nj is the normal vector. For the pitch and yaw, values of the heave andsway at each cross-section are multiplied by the distance between the cross sectionand centre of gravity of the ship. However, as Umeda et al. (1995) indicate again, thisapproximation is straightforward for a ship with transom stern while it is not for aship with other stern type. It is due to the fact that if the aft end has no breath anddraught, the strength of trailing vortices will be zero in the Ohkusu’s theory eventhough in reality they exist. The strength of trailing vortices could be calculatedeasily for a ship with transom stern because the aft end term will be too small andtherefore, Ohkusu’s assumption will be almost adequate. However, if a substantialarea exists behind the aft perpendicular, Ohkusu’s theory will ignore the trailingvortices occurring in that part. In this work, the aft end was also geometricallymodelled. However, it is not a proper solution to the real problem of shedding oftrailing vortices from a hull surface.
2.2. Manoeuvring (hull) forces
As it is given previously, manoeuvring and seakeeping usually deal with differentlymotivated situations in terms of steadiness and frequency, however when ship

ARTICLE IN PRESS
Z. Ayaz et al. / Ocean Engineering 33 (2006) 2381–2434 2395
motions in astern seas are concerned, the hydrodynamic matters arise in this uniquephenomena and directional stability or more generally course-keeping problemsrequire combined approach of manoeuvring and seakeeping. A manoeuvringmathematical model focusing on lift components can be used in this situation.Having stated those facts, the main question here is what type of manoeuvringmathematical model that employs hydrodynamic reaction forces can be used in thenumerical model? In the context of manoeuvring hydrodynamic reaction forcesconsist of ideal fluid forces associated with potential flow theory, first-order viscousforces in the presence of hydrodynamic lift forces and second-order or higher viscousflow forces associated with cross-flow and separation effects (Spyrou, 1990). In termsof the accuracy of a manoeuvring mathematical model, the most crucial element isthe accuracy of the hydrodynamic reaction forces.
Current numerical model follows the semi-empirical methodology where it isassumed that the fluid forces are uniquely determined at any instant and independentof any other details of the motion except for the geometrical properties of the shipand physical properties of the fluid. The fluid forces can be expanded as Taylor seriesin powers of displacements, velocity and accelerations and this leads directly to a setof linear and non-linear terms in the equation of motion. The force coefficients aredetermined either through analytical or experimental technique. Therefore, for thecalculation of the hull or manoeuvring forces, equations based on the MMG(Japanese manoeuvring Group) model (1981) and Tasai (1961) formulations wereused. Surge, sway, roll and yaw, manoeuvring coefficients were obtained from themodel experiments in Japan for the vessels used in numerical tests in Sections 4 and5. The heave and pitch radiation coefficients were found using Tasai’s (1961)empirical formulae
XH ¼ X _u _u� Y _vvr�u
uj jY _rrrþ X vrvr�RT ðuÞ,
YH ¼ Y _v _vþ Y _r _rþ Y vvþu
uj jY rrþ Y v vj jv vj j þ Y r rj jr rj j,
ZH ¼ Z _w _wþ Zwwþ Z _q _qþ Zqq,
KH ¼ K _p€fþ Cð _fÞ � zyY H ,
MH ¼M _q _qþMqqþM _w _wþMww,
NH ¼ N _r _rþN _v _vþNrrþu
uj jNvvþNr rj jr rj j þNr rj jvrrvþNv vj jrvvr, ð19Þ
where XH, YH, ZH, KH, NH, MH are surge, sway, heave, roll, pitch, yaw hull forces,respectively, RT (u) is total resistance force, C _jð Þ is damping moment, zy is verticalcoordinate of the centre of action of lateral force. Others represent the accelerationand velocity coefficients. As it can be seen above formulations include accelerationterms, first-second- and third- order linear and non-linear velocity terms. The addedmass and moment terms are taken into left hand side of the equation in Eqs. (10) and(11) for the solution matrix of Eq. (13). Here, acceleration and velocity terms areestimated independent of frequency, however when frequency dependent added massand damping terms are incorporated to the motions with convolution integrals, the

ARTICLE IN PRESS
Z. Ayaz et al. / Ocean Engineering 33 (2006) 2381–24342396
left-hand side of the Eqs. (10) and (11) will be linearized. This will be explainedin the next chapter. Furthermore, Eq. (19) does not include coupling betweenvertical and horizontal motions. However hydrodynamic terms which result fromcombined sinkage and rotation occur during heeling and are added to sway forceand yaw moment in Eq. (19) if experimental values are available. These terms arerepresented in the first-order on the basis of linear sway and yaw velocity coefficientsas follows:
YH ¼ Yjjþ Y v jj jv j�� ��þ Y r jj jr j
�� ��;NH ¼ NjjþNv jj jv j
�� ��þNr jj jr j�� ��: (20)
It should be noted that this model is only valid for small heeling angles and it doesnot include the effect on the acceleration and higher order velocity coefficients. Thiscould seem to be contradicting with the purpose of this study which aims to developa numerical tool for the simulation of extreme motions. However, since wave effectsespecially restoring terms will play dominant factors in such cases, the assumption ofsmall heeling angles in (20) does not expect to be causing significant error in thesimulation of the real phenomena in extreme astern seas.
2.3. Rudder forces
As an important element of the excitation for ship motions in following andquartering seas, the forces on a rudder, when considered as a separate individualelement, can be obtained with the derivation of the lift and drag generated from therudder. Performance of rudder is greatly influenced by the interactions betweenrudder to hull and rudder to propeller, due to the change of the lift.
Based on the above background, for calculation of rudder forces, Japanese MMG’s (Japanese manoeuvring Group) model, Inoue et al. (1981), was adopted, includingthe aforementioned interactions. The rudder forces and moments including rudder-to-hull interaction are as follows:
XR ¼ �FN sin d;
YR ¼ �ð1þ aHÞFN cos d;
NR ¼ �ð1þ aHÞðxH=xRÞÞxRFN cos d;
KR ¼ ð1þ aHÞzRFN cos d;
(21)
where XR, YR, NR, KR are surge, sway, yaw, roll rudder forces, respectively, FN,rudder normal force, aH, rudder–to-hull interaction coefficient, xH, longitudinalcoordinate of the point of action of the rudder to hull interaction force, xR, zR,longitudinal and vertical coordinates of the rudder’s centre of pressure.
2.4. Propulsive forces
Calculation of propulsive forces is modelled with respect to the thrust system usedin the ship whether it is propeller, water jet or the brand new azimuthing pod system.

ARTICLE IN PRESS
Z. Ayaz et al. / Ocean Engineering 33 (2006) 2381–2434 2397
The calculation of propulsive forces therefore is dependent upon accuraterepresentation of wake, lifting and drag or more generally in the context ofpropeller–hull–rudder interaction as it is mentioned in the previous section. In thecurrent model, propulsive forces are calculated using formulations in Inoue et al.(1981) and Spyrou (1990) for the propeller system. All the dependents were obtainedfrom model tests results.
XP ¼ ð1� tpÞrn2D4KT� ;
YP ¼ rn2D4YP� ;
NP ¼ rn2D5NP� ;
(22)
where XP, YP, NP are surge, sway, yaw propulsive forces, respectively, tP, thrustdeduction at the propeller in forward motion, KT, thrust coefficient, D, propellerdiameter, n, propeller rate of rotation. YPn and NPn are generally dependent upon u/
(nP) where P is propeller pitch.
2.5. Resistance forces
Resistance force is calculated from the model tests results. However, if the modelexperiments are not available, it could be calculated with the methods such asHoltrop and Mennen (1982) or if the certain regression coefficients exist from themodel data it could be calculated with below formulation
RT ðuÞ ¼ a0uþ a1u uj j þ a2u3, (23)
where a0, a1, a2 are regression coefficients.
2.6. Autopilot control
Although, automatic control systems can be regarded as parameter of shipsteering and control, as it is well known, the steering mechanism of the ships alsoprovides another external force. Following the previous research and experimentalset-up used in this study, the standard proportional–differential (PD) autopilot isemployed in order to keep the vessel on course
dR þ tr_dR ¼ KRðc� cRÞ þ KP
_c (24)
dR is the actual rudder angle, cRis the desired heading angle, KR is yaw gain
constant, KP is a yaw rate gain constant and tr is the time constant in rudderactivation.
3. Impulse response functions (memory effects)
Following the research background on the effect of frequency dependentterms, convolution terms are incorporated in the numerical model inorder to improve the prediction of the behaviour of the vessel at encounter

ARTICLE IN PRESS
Z. Ayaz et al. / Ocean Engineering 33 (2006) 2381–24342398
frequencies which are not approximately zero. Impulse-response tests are requiredfor this, while for a purely theoretical prediction, at this stage, the frequency-dependent coefficients are derived within the limits of potential theory. Based on thetheory of linear system, the hydrodynamic force due to an arbitrary motion can bedescribed with the convolution integral of the motion and the impulse responsefunction for hydrodynamic force, as far as linearity of hydrodynamic force isassured. This would give rise to argument because the motions this study is dealingwith have most significantly high amplitudes and are of non-linear nature. Thesuitability of the above approach for extreme motions will need, therefore, to beexplored.
When a body performs an irregular motion around its mean position, it isappropriate to express the hydrodynamic force acting on the body in the timedomain. Following the work by Cummins (1962), the radiation force in the timedomain is written as
Fij ¼ � aij 1ð Þ _V j �
Z 10
ZKij tð ÞVjðt� tÞdt,
i; j ¼ 1; 2; 3; 4; 5; 6, ð25Þ
where the first term is the infinite frequency added mass and the secondterm is the impulse response function or the so-called ‘‘memory effect’’. It shouldbe noted that this formulation is based on linear theory. The retardation (Kernel)function of Eq. (25) is the real part of Fourier transform of the frequencydomain damping function. In addition, the retardation can be described in terms ofdamping as
KijðtÞ ¼2
p
Z 10
Bij oð Þ cosotdo, (26)
where Bij are damping coefficients . These equations are standard relations in linearsystem theory. The impulse response function (Kij) will be solved from added massand damping data and the convolution integral (25) then evaluated for each term inthe equations of motion at each time step during the simulation.
3.1. Numerical solution of Kernel functions
To solve Kernel functions, use is made of Discrete Fourier transforms (DFT). TheDFT is particularly suitable for describing phenomena related to a discrete timeseries. It can be developed from the Fourier transform of the continuing waveform,samples of which are taken to form the time series. Hence, the retardation (Kernel)function for any number of sample values is shown as
KijðtÞ ¼PN�1
n
BðoÞ cosðotÞdo;
0 � n � N � 1;
(27)

ARTICLE IN PRESS
-0.04
-0.03
-0.02
-0.01
0
0.01
0.02
0.03
0.04
0 4 10
Time (sec)
Impu
lse
resp
onse
func
tion
6 82
Fig. 2. Non-dimensional Kernel function of sway-roll coupled motion for Purse Seiner.
Z. Ayaz et al. / Ocean Engineering 33 (2006) 2381–2434 2399
where B(o) is damping coefficient, do is frequency range. Note that the ot
expression can be written by means of general physical description as
ot ¼2
Np n tðnÞ, (28)
where t(N) indicates each time step.The Kernel function is presented in Fig. 2 for a Purse Seiner fishing vessel which
will be explained in detail in the following sections. Damping values were obtainedby using 2D strip theory (Jasionowski, 2001) in 52 different frequencies with 0.07range of frequency.
3.2. Implementation of convolution terms
Frequency dependent excitation forces (radiation) are calculated by usingconvolution terms. The impulse response terms are calculated for radiation forcesin terms of excitation as it is given in Eq. (24) and its effect on numerical calculationis shown in the next section.
For the calculation of radiation forces as mentioned above, 2D strip theory isused. Although, strip theory has certain disadvantages for motions in astern seas(Ayaz, 2003), its practicality and availability during the course of the study havemade usage of this numerical tool inevitable. Furthermore, as it is stated in theprevious section impulse response functions given in Eq. (25) are calculated based onlinear theory. Therefore, the radiation forces are calculated using a linear approach.In the numerical tool (Jasionowski, 2001) the radiation forces are evaluated by astrip theory formulation.
The radiation force terms computed in numerical model are given in a body fixedaxis system while the hydrodynamic coefficients are evaluated for stationary shipattitude which follows the assumption that ship motions are the small amplitude.However, as it is stated earlier, the ship amplitude can be very high for the motionsin extreme astern seas therefore those radiation forces are transformed into thehorizontal body axis system.

ARTICLE IN PRESS
Z. Ayaz et al. / Ocean Engineering 33 (2006) 2381–24342400
With the inclusion of frequency dependent coefficients, Eq. (13) can be written asfollows:
M þ Að Þ €X þ B ðX Þ _X þ C ðX ÞX þ
Z 10
ZKij tð ÞVjðt� tÞdt
¼ F zw;X ; _X ; €X� �
. ð29Þ
The Kernel functions are based on these coefficients for each station so thatradiation forces in the time domain are subject to the same limitations of the striptheory. As it is well known surge is not considered with slender body theory as surgeforces are of higher order. However, radiation effects associated with surge could beof importance when considering motions in following seas. In this study consideringthat Froude–Krylov forces are most likely to be dominant forces in this case, theradiation forces are omitted. However, surge added mass and damping coefficientscould be obtained for slender type of ships by means of a full three-dimensionalmethod. These coefficients are then used to generate Kernel functions related tosurge. In Eq. (29) in contrast to Eqs. (10) and (11), frequency dependent added mass(at infinite frequency) and potential damping terms are calculated, again using thenumerical tool (Jasionowski, 2001) which includes the ‘‘end’’ terms as it is statedbefore. Therefore, the damping coefficients in Eq. (26) might include the linearmanoeuvring components given in Eq. (19) inevitably resulting in overlapping ofthese terms in the calculation with memory effects. Due to the nature of using linearradiation forces by memory effects or ‘‘linear filter’’ the left-hand side of Eq. (29) islinearized. The added mass term calculated at infinite frequency and damping termscalculated for each encounter frequency are taken into the solution matrix. Howeverthis results in the removal of non-linear coupled terms described in Eqs. (10) and(11). Furthermore, those added mass and damping terms are stored for every 101heading angles between 0 and 3601 and they need to be interpolated for particularwave headings during the simulation of ship motions. Then, the response (Kernel)functions are accounted for in predictions to motion continuously during the specificencounter frequency therefore assuming unsteady characteristics of motion eventhough ship might have steady motion when reaching certain speed in following andquartering seas.
4. Verification of numerical model
In order to validate the numerical code, a time-domain simulation program‘‘Simurg’’ has been developed. To validate of this numerical program two differentmodel ships were tested. A 23,720 tonnes displacement containership, investigatedusing systematic model experiments at Osaka University in Japan (Hamamoto et al.,1995) and a 712 tonnes displacement fishing vessel, investigated using systematicmodel experiments at National Institute of Fisheries Engineering in Japan (Umedaet al., 1994). The models are tested in different speeds, wave steepnesses, wave heightto ship length ratios and heading angles. The description of test methods,

ARTICLE IN PRESS
Fig. 3. Lines of the container vessel.
Table 1
Principal particulars of the full scale and the model scale container
Parameter Vessel Model (1/60)
LBP 150m 2.5m
B 27.2m 0.453m
D 13.5m 0.225m
df 8.5m 0.142m
da 8.5m 0.142m
Cb 0.667 0.667
D 23.720 t 110 kg
LCG �1.01m �0.0168m
KG 11.48m 0.1913m
GM 0.15m 0.0025
Tj 43.3 s 5.59 s
Table 2
Control parameters of capsizing model runs
Nominal Froude number Fn 0.2 0.2 0.4
Autopilot course from the wave direction wc (degree) 0.0 45.0 30.0
Wave steepness H/l 1/25 1/25 1/25
Wave length to ship length ratio l/Lpp 1.5 1.5 1.5
Proportional gain KP 1.2 1.2 0.5
Differential gain KR (s) 6.84 6.84 2.85
Z. Ayaz et al. / Ocean Engineering 33 (2006) 2381–2434 2401
instrumentation and all other details in the experiments are given by (Ayaz, 2003;Hamamoto et al., 1995; Umeda et al., 1994). The full results of experiments andcomparison between numerical test with model tests according to the guidance givenby the ITTC for both vessels are also presented in (Ayaz, 2003; Ayaz et al., 2001;Vassalos et al., 2003). Here, the effect of impulse response functions or so-called‘‘memory effects’’ in the numerical model will be presented. For this purpose, twoaforementioned approaches in the numerical model (with and without memoryeffect) have been tested against the experimental results for the container ship. Thefirst approach represented in Eqs. (12) and (13) was used in the numerical model for6 DOF and the results presented in Figs. 3–6. The second approach represented inEq. (29) and with the methods explained in the previous section was employed in the

ARTICLE IN PRESS
-15
-10
-5
0
5
10
15
Rud
der
angl
e (d
eg)
Experiment
Experiment
Experiment
Experiment
-100
-50
0
50
100
0 10 20 30
0 10 20 30
0 10 20 30
0 10 20 30
Time (sec)
Time (sec)
Time (sec)
Time (sec)
Rol
l ang
le (
deg)
-15
-10
-5
0
5
10
Yaw
ang
le (
deg)
-10
-5
0
5
10
Pitc
h an
gle
(deg
)
Fig. 4. Experimental simulation for the containership model in H/l¼ 1=25, l/Lpp ¼ 1.5, Fn ¼ 0.2,
wc ¼ 01.
Z. Ayaz et al. / Ocean Engineering 33 (2006) 2381–24342402

ARTICLE IN PRESS
-15
-10
-5
0
5
10
15
Rud
der
angl
e (d
eg)
-100
-50
0
50
100
0 10 20 30
0 10 20 30
0 10 20 30
0 10 20 30
Time (sec)
Time (sec)
Time (sec)
Time (sec)
Rol
l ang
le (
deg)
Num.1 Num.2
Num.1 Num.2
Num.1 Num.2
Num.1 Num.2
-10
-5
0
5
10
Pitc
h an
gle
(deg
)
-15
-10
-5
0
5
10
Yaw
ang
le (
deg)
Fig. 5. Numerical simulation for the containership model in H=l ¼ 1=25, l=Lpp ¼ 1.5, Fn ¼ 0.2, wc ¼ 01
(Num. 1—without memory effects, Num. 2—with memory effects).
Z. Ayaz et al. / Ocean Engineering 33 (2006) 2381–2434 2403
numerical model for 6 DOF and the results are presented in Figs. 7–10. Lines andparticulars of containership and its model are given in Fig. 3 and Table 1. The GMselected is not the design GM value, but one that only just satisfies the IMOregulations. Environmental and control parameters are the same for each case andthe results for the runs considered are given in the same order (Table 2).
4.1. Discussion on results
Herein, the models are tested in different speeds, wave steepnesses, wave height toship length ratios and heading angles (Table 2). The graphs presented (Figs. 4–9),

ARTICLE IN PRESS
Experiment
Experiment
Experiment
Experiment
-100
-50
0
50
0 20 40 60
Time (sec)
Time (sec)
Time (sec)
Time (sec)
Rol
l ang
le (
deg)
-10
-5
0
5
10
Pitc
hl a
ngle
(de
g)
0
20
40
60
0 20 40 60
0 20 40 60
0 20 40 60
Yaw
ang
le (
deg)
-15
-10
-5
0
5
10
15
Rud
der
angl
e (d
eg)
Fig. 6. Experimental simulation for the containership model in H=l ¼ 1=25, l=Lpp ¼ 1.5, Fn ¼ 0.2,
wc ¼ 451.
Z. Ayaz et al. / Ocean Engineering 33 (2006) 2381–24342404

ARTICLE IN PRESS
-100
-50
0
50
Rol
l ang
le (
deg)
Num.1 Num.2
Num.2
Num.2
Num.2
-10
-5
0
5
10
Pitc
hl a
ngle
(de
g)
Num.1
Num.1
Num.1
0
20
40
60
0 20 40 60
0 20 40 60
0 20 40 60
0 20 40 60
Yaw
ang
le (
deg)
-15-10
-505
1015
Time (sec)
Time (sec)
Time (sec)
Time (sec)R
udde
r an
gle
(deg
)
Fig. 7. Numerical simulation for the containership model in H=l ¼ 1=25, l=Lpp ¼ 1.5, Fn ¼ 0.2, wc ¼ 451
(Num. 1—without memory effects, Num. 2—with memory effects).
Z. Ayaz et al. / Ocean Engineering 33 (2006) 2381–2434 2405
show the comparison between the results of experiment and numerical method forroll, pitch, yaw and rudder angles. In Figs. 4 and 5, the model was run in 0.2 Froudenumber and 01 (pure following sea) autopilot course from the wave direction. Thesecond test (Figs. 6 and 7) was carried out in 0.2 Froude number and 451 autopilotcourse from the wave direction. The third test (Figs. 8 and 9) was conducted for 301autopilot course and 0.4 Froude numbers, respectively.
For numerical model runs, the 6 DOF model is used in aforementioned twoapproaches, with and without memory effects. For the first approach, in the first run(Fig. 4) the model experiences a wave crest at amidships for a while and this leads to

ARTICLE IN PRESS
Experiment
Experiment
Experiment
Experiment
-100
-50
0
50
0 5 10 15
0 5 10 15
0 5 10 15
0 5 10 15
Time (sec)
Time (sec)
Time (sec)
Time (sec)
Rol
l ang
le (
deg)
0
10
20
30
40
50
Yaw
ang
le (
deg)
-15
-10
-5
0
5
10
15
Rud
der
angl
e (d
eg)
-5
0
5
10
Pitc
h an
gle
(deg
)
Fig. 8. Experimental simulation for the containership model in H=l ¼ 1=25, l=Lpp ¼ 1.5, Fn ¼ 0.2,
wc ¼ 451.
Z. Ayaz et al. / Ocean Engineering 33 (2006) 2381–24342406

ARTICLE IN PRESS
-100
-50
0
50
0 10 15
Time (sec)R
oll a
ngle
(de
g)
Num.1 Num.2
Num.1 Num.2
Num.1 Num.2
Num.1 Num.2
01020304050
0 5 10 15
0 5 10 15
Yaw
ang
le(d
eg)
-15
-10
-5
0
5
10
15
0 5 10 15
Rud
der
angl
e (d
eg)
-5
0
5
10
Time (sec)
Time (sec)
Time (sec)
Pitc
h an
gle
(deg
)
5
Fig. 9. Numerical simulation for the containership model in H=l ¼ 1=25, l=Lpp ¼ 1.5, Fn ¼ 0.4, wc ¼ 301
(Num. 1—without memory effects, Num. 2—with memory effects).
Z. Ayaz et al. / Ocean Engineering 33 (2006) 2381–2434 2407
significantly large roll angle. After 15 s, the model cannot find enough buoyancy tokeep herself upright and it eventually capsizes. In the numerical model (Fig. 5), themodel reaches capsizing limit after a large jump in roll angle, instead of parametricbuild up as it happened in the experiment.
On the other hand, the very large rudder deflection, first to port and then to thestarboard, is seen before capsizing. The numerical model seems to be havingproblems in simulating rudder and yaw motions. The model proves to be too stiff.
Here ‘‘stiffness’’ means that deviations in yaw or rudder amplitudes are small orthe motion attitude is very rigid in contrast to large deviations in the experiments.

ARTICLE IN PRESS
Fig. 10. Body plan of the Purse Seiner.
Z. Ayaz et al. / Ocean Engineering 33 (2006) 2381–24342408
This leads to smaller roll angles in the numerical model despite the fact that largeangles are fully taken into account in the numerical model. The numerical modelcatches up satisfactorily the pitch angle, which is important in calculating theinstantaneous wave surface.
When the second approach was used in the same case (Fig. 5), the roll motion issimulated with better accuracy in terms of amplitude. Problems are encounteredagain, however, in simulating rudder motion and yaw motions. The model proves tobe too stiff again. However, this time yaw and rudder characteristics are highlyaffected by frequency dependent terms and coupling between yaw and roll motionleads to large roll periods and amplitude in the numerical model. The pitch angle isalmost identical to the first approach.
In the second run (Fig. 6) the model yet again experiences wave crest atamidships and large roll angle after the autopilot course is set to 451, howeverthis time the model finds enough buoyancy to keep herself eventuallyupright. The numerical model (Fig. 7) displays rudder and yaw motions ratherwell, despite the same ‘‘stiffness’’ problem as in the first run still exists. Also, the rollmotion displays behaviour similar to sub-harmonic roll motion observed in theexperiment.
After the speed is further increased (Fig. 8), the model experiences very large rollangle and ultimately capsizes. The numerical model (Fig. 9) satisfactorily displaysthe roll and pitch motions and estimates the rudder and yaw angles with reasonableaccuracy.
When the second numerical approach is adopted (Fig. 9), this time, similar rolland pitch characteristics to the first approach are found. However this numericalmodel predicts the rudder and yaw behaviour with more reasonable accuracy.
An overview for the simulations of container ship indicates that there is a betteragreement with experiments for the second approach in which impulse responsefunctions are included in numerical model, than for the first approach in whichimpulse response functions are not included, in terms of roll amplitude.

ARTICLE IN PRESS
Z. Ayaz et al. / Ocean Engineering 33 (2006) 2381–2434 2409
The second approach estimates larger roll amplitude and harmonic motions whichare closer to experiments. It could be a result of better estimated damping forceswhen the effect of encounter frequency is included. However, this difference could bemore realistically explained in terms of changes in the yaw and rudder motions. Thecoupling between roll and yaw–rudder motions seems to create the aforementionedlarger roll amplitudes. The change in yaw and rudder characteristics indicates theeffect of frequency to the control systems. However, concerning these experiments,the ITTC benchmark review committee (ITTC, 2002) urged that the exactcalculation of memory effects should be carried out from the start of the waves.Therefore, this benchmark testing, which does not specify initial conditions of fluidmotions, is not appropriate for this purpose. Based on this finding, the effect offrequency or so-called ‘‘memory effects’’ will be looked at in detail in the nextsection.
5. Benchmark study of ITTC vessel
Following the current knowledge in the literature and the outcome of validation ofthe new mathematical model which were presented in previous sections, extensivecaptive and free running model experiments were carried out at National ResearchInstitute of Fisheries Engineering, Japan for the aforementioned 712 tonnesJapanese fishing vessel in all 6 DOF and extreme random seas. The captive modelexperiments were carried out while the model was fixed for all 6 DOF. Hence, it wasaimed to observe the manoeuvring and course-keeping behaviour of the vessel inlarge vertical motions. The free running model experiments were also carried out inrandom seas using both ITTC and JONSWAP spectra. The captive modelexperiments were carried out for different speed, heading angle, sinkage, trim andfor some cases with different wave steepness, while the free running modelexperiments were carried out in different significant wave heights, modal frequencies,speeds and wave directions. Extremity of the conditions of captive model runs weredefined within limits and strength of model that was used in these experiments.
The experiments were carried out in the seakeeping and manoeuvring basin named‘‘Marin Dynamics Basin’’ of the National Research Institutes of FisheriesEngineering, Japan. The basin is 60m long, 25m wide and 3.2m deep. It has anX–Y towing carriage consisting of two carriages: a main carriage runs in thelongitudinal direction of the basin and a sub-carriage which runs in the transversedirection of the basin. The maximum velocities of the main and sub carriages are 3and 1.5m/s, respectively. The basin is equipped with an 80-segments wave maker.The carriages and wave maker are controlled by a digital feedback system.
5.1. Captive Model Tests
For these tests, a 2m length (1/17.25 scale) model is used (Fig. 10). This vessel hasbeen tested as part of a series of the benchmark tests commissioned by the ITTCSpecialist Group on Ship Stability (ITTC, 1999b). Its principal particulars are given in

ARTICLE IN PRESS
χ
G
y
x
ξζ
ηO
O
η
G
y
z
ξG/λ
Fig. 11. Coordinate system of model basin (Umeda et al., 1995).
Table 3
Principal particulars of fishing vessel and model
Parameter Vessel Model (1/17.5)
LBP 34.50m 2m
B 7.60m 0.441m
D 3.07m 0.178m
df 2.50m 0.145m
da 2.80m 0.162m
Cb 0.597 0.597
D 425.18 t 81.08Kg
LCG �1.31m �0.076m
KG 3.36m 0.195m
GM 1.0m 0.058m
Tj 7.4 s 1.6 s
Z. Ayaz et al. / Ocean Engineering 33 (2006) 2381–24342410
Table 3. The model is equipped with rudder but without propeller and bilge keels.Being fixed in all 6 DOF, it was fitted to a turning table on the sub-carriage. Previously,the model is weighted and balanced with a 6 components loadcell on the rightdisplacement. The 6 DOF forces and moments (surge, sway, heave forces, roll, pitchand yaw moments) are measured by a dynamometer, which is placed on the loadcell.

ARTICLE IN PRESS
Z. Ayaz et al. / Ocean Engineering 33 (2006) 2381–2434 2411
The centre of yaw moment is taken as longitudinal centre of buoyancy, L.C.B., andthat of the roll moment is distance of the vertical position of centre of gravity to stillwater surface. The centres of heave and pitch are defined from the centre of X–Y axeson the loadcell. A servo-needle wave probe was also fitted with the sub carriage. Basedon the coordinate systems shown in Fig. 11, the sign convention is as follows.
The positive surge force acts towards the bow, the positive sway force actsstarboard, the positive yaw moment induces a starboard turn, the positive rollmoment results in a downward moment inducing a starboard turn, and positive waveelevation is downwards. The positive heave force is upwards and positive pitchmoment is aft downwards. The details of those procedure and measurement methodsare also explained in Ayaz (2003) and Umeda et al. (1994).
The experimental procedure is as follows. First, the wave maker generated aregular wave train propagating in the longitudinal direction of the basin. Next,combining movements of the two carriages, the model was towed with a certainangle from the wave direction. Since the centre line of the model had been adjustedto this towing direction, the model runs with a specified heading angle relative to thewaves without drift angle.
Test matrix for the aforementioned conditions is given in Table 4. Here the vesselsare tested for different combination of sinkage, trim and heel. The resistance force issubtracted from the surge wave force and the additional roll moment created fromthe vertical distance of the dynamometer to the water surface is also accounted forthe calculation of the wave roll moment. Results are also presented as function of therelative position on the wave as it is explained above. The mathematical model in thelight of captive model tests can be written as follows:
Recalling from Eq. (13)
ðM þ AÞ €X þ B ðX Þ _X þ C ðX ÞX ¼ F 00ðzwÞ þ F01ðzw;X Þ þ F02ðzw; _X Þ
þ F03ðzw; €X Þ. ð30Þ
Here, F00 and F01 are force components from captive model experiments, F02, F03 arenon-linear terms and Bð _X Þ,C(X) are obtained from forced tests in calm water orfrom hydrodynamics calculations.
Table 4
Test matrix for l/L ¼ 1.5, nominal GM
H/l Fn w (deg) Sinkage (m) y (deg) f(deg)
0 45 60 �0.2 0 0.2 �1.43 0 1.43 �10 0 10
1/25 0.2 O O O O0.3 O O O O O O O0.4 O O O O0.3 O O O O O O O O O O O O
1/20 0.4 O O O O O O O O O O O0.3 O O O O O O O
1/15 0.4 O O O O O O O

ARTICLE IN PRESS
0
0.02
0.04
0.06
0.08
0.1
0.12
0.04 0.05 0.06 0.07
X′
Exp.
Num.
0
0.25
0.5
0.75
1
0.04 0.05 0.06 0.07H/λ
ξ/λ
H/λ
Exp.
Num.
Fig. 12. Wave induced surge force with respect to wave steepness (Fn ¼ 0.3, l/L ¼ 1.5, w ¼ 01, f ¼ 01,
y ¼ 01, sinkage ¼ 0m).
Z. Ayaz et al. / Ocean Engineering 33 (2006) 2381–24342412
Based on the above outcome, the challenge will be to identify the first two terms onthe right-hand side of Eq. (30) with respect to various parameters such as wavesteepness, heading angle and encounter frequency and as it is explained in the previoussection, relative position of the ship on the wave. Therefore, a number of figures wereplotted (Figs. 12–18) for this purpose and experimental results were compared againstnumerical model explained in Sections 2 and 3. The presentation method of the resultsis similar to Umeda et al. (1995), except, this time the experiments were carried out forfully captive model with different heel, sinkage and trim. Following the abovestatement, the presentation of the results was divided into two parts, first the case forzero heel angle, sinkage and trim angle were plotted with respect to wave steepness,heading angle and encounter frequency (Figs. 12–20) and in the second part the casesfor whole heading angle, sinkage and trim angle changes were taken into account as itcan be seen from the test matrix in Table 4 (Figs. 21–26). The effect of encounterfrequency was shown both in respect to heading angle and also t, Hanaoka parameter,as described in Umeda et al. (1995). The Hanaoka parameter, t, is defined by
t ¼Uoe
g. (31)
Here U is ship velocity, oe, is encounter frequency and g is gravitational acceleration.The Hanaoka parameter governs wave patterns from an oscillating obstacle with

ARTICLE IN PRESS
0
0.05
0.1
0.15
0.04 0.05 0.06 0.07
0.04 0.05 0.06 0.07
Exp.
Num.
0
0.25
0.5
0.75
1
Exp.
Num.Z
′
H/λ
H/λ
ξ/λ
Fig. 13. Wave induced heave force with respect to wave steepness (Fn ¼ 0.3, l/L ¼ 1.5, w ¼ 01, f ¼ 01,
y ¼ 01, sinkage ¼ 0m).
Z. Ayaz et al. / Ocean Engineering 33 (2006) 2381–2434 2413
forward velocity. The relative position of centre of ship gravity to a wave troughbehind the ship is non-dimensionalized with respect to wave length. This non-dimensional value, xG/l, of 0.0 indicates that the ship is situated on a wave trough.Hydrodynamic forces and moments are non-dimensionalized as follows:
X 0 ¼ X W=ðrgzwBLÞ;
Y 0 ¼ Y W=ðrgzwBLÞ;
Z0 ¼ ZW=ðrgzwBLÞ;
K 0 ¼ KW=ðrgzwB2LÞ;
M 0 ¼MW=ðrgzwBL2Þ;
N 0 ¼ NW=ðrgzwBL2Þ;
(32)
where prime superscript, ‘‘0’’, refers to non-dimensionalized quantities and zw is thewave amplitude.
5.1.1. Discussion on captive model test results
Here, the results obtained will be of interest for the first two terms in Eq. (30). It isstated previously that one of the aims of this study is to obtain a fully coupled(6 DOF) numerical model for the accurate representation of the ship motions inextreme astern seas.

ARTICLE IN PRESS
0
0.02
0.04
0.06
0.08
0.1
0
0.25
0.5
0.75
1
0.04 0.05 0.06 0.07
Exp.
Num.
Exp.
Num.
M′
H/λ
0.04 0.05 0.06 0.07H/λ
ξ/λ
Fig. 14. Wave induced pitch moment with respect to wave steepness (Fn ¼ 0.3, l/L ¼ 1.5, w ¼ 01, f ¼ 01,
y ¼ 01, sinkage ¼ 0m).
Z. Ayaz et al. / Ocean Engineering 33 (2006) 2381–24342414
The requirement of obtaining those terms was accomplished through the waveforce values obtained in captive model tests. Since the aim was to carry out this studyin a full 6 DOF numerical model, the vertical motions were given special attention.Therefore, the above results were demonstrated in two different conditions. The firstgroup is the zero heel, sinkage and trim (Figs. 12–20) and the second group with themaximum roll, sinkage and trim values the model allowed (Figs. 21–26). Here, theresults are represented in terms of amplitude and phase angle. The results are givenin terms of wave steepness, encounter frequency and heading angle in order to assessthe fully captive results and the accuracy of numerical model for the sameconditions. In the first group, the effect of wave steepness, encounter frequency andheading angle were investigated. In the second group the results were represented interms of wave forces and moments with respect to heading angle. The aforemen-tioned Hanaoka parameter represents the effect of encounter frequency.
There are other major points that are required to be mentioned here. In thecalculation of wave force, while surge force includes Froude–Krylov forces only,others are also included such as diffraction forces calculated from Ohkusu’s theoryas it is explained in Section 2.1.1.2.
Figs. 12–14 show the effect of wave steepness on the vertical wave forces andmoments for Fn ¼ 0.3 and zero sinkage, trim and heel angle condition. For theexperimental and numerical simulations in Fn ¼ 0.3 (Figs. 12 and 13) it could be seen

ARTICLE IN PRESS
0
0.02
0.04
0.06
0.08
0.1
X′
Exp.
Num.
Calm
0
0.25
0.5
0.75
1
0 15 30 45 60
0 15 30 45 60
χ (deg)
χ (deg)
Exp.
Num.
ξ/λ
Fig. 15. Wave induced surge force with respect to heading angle (Fn ¼ 0.3, l/L ¼ 1.5, H/l ¼ 1/20,
f ¼ 01, y ¼ 01, sinkage ¼ 0m).
Z. Ayaz et al. / Ocean Engineering 33 (2006) 2381–2434 2415
that non-dimensionalized surge and heave forces and pitch moment are almostconstant up to wave steepness, 1/15 which is highest wave steepness in thecalculations. In the numerical simulations, there is reasonably satisfactory agreementin terms of amplitude and phase angle despite some deviations of pitch moment insway and yaw values for higher wave steepness (Fig. 14).
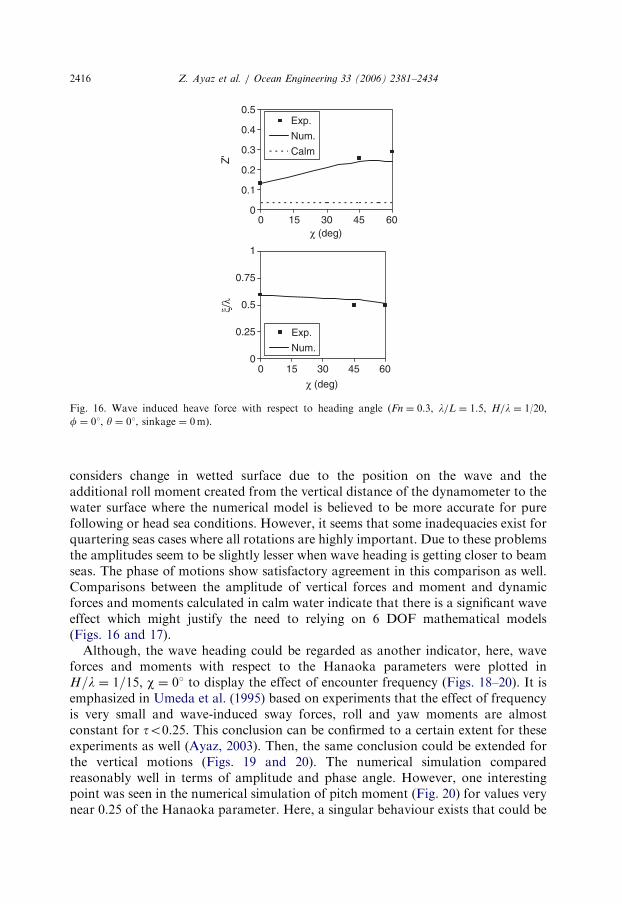
As a second criterion, the wave forces and moment were plotted with respect to thewave heading (Figs. 15–17) for Fn ¼ 0.3, H=l ¼ 1=20 and zero sinkage, trim andheel angles. Here, the calm water values for wave forces and moments are also addedto show the difference between wave motions and calm water values especially interms of vertical motions. As it can be seen from the figures there is linear increasefor wave force and moment values. The agreement is again reasonably satisfactory.For the surge forces, although the experiments show increase in amplitude whenwave heading is getting closer to 601, in accordance with Froude–Krylov assumptionthe numerical model shows linear decrease (Fig. 15). For other motions the biggestdeviation is seen in 601. Therefore, this could be attributed to the diffractionmodelling. Yet, the Hanaoka parameter which will be investigated later, indicatesthat the encounter frequency does not significantly differ, therefore other factorsshould be considered. One of these could be the calculation of the wave forces which
ARTICLE IN PRESS
0 15 30 45 60
χ (deg)
0
0.1
0.2
0.3
0.4
0.5
0 15 30 45 60χ (deg)
Z'
Exp.
Num.
Calm
Exp.
Num.0
0.25
0.5
0.75
1
ξ/λ
Fig. 16. Wave induced heave force with respect to heading angle (Fn ¼ 0.3, l/L ¼ 1.5, H/l ¼ 1/20,
f ¼ 01, y ¼ 01, sinkage ¼ 0m).
Z. Ayaz et al. / Ocean Engineering 33 (2006) 2381–24342416
considers change in wetted surface due to the position on the wave and theadditional roll moment created from the vertical distance of the dynamometer to thewater surface where the numerical model is believed to be more accurate for purefollowing or head sea conditions. However, it seems that some inadequacies exist forquartering seas cases where all rotations are highly important. Due to these problemsthe amplitudes seem to be slightly lesser when wave heading is getting closer to beamseas. The phase of motions show satisfactory agreement in this comparison as well.Comparisons between the amplitude of vertical forces and moment and dynamicforces and moments calculated in calm water indicate that there is a significant waveeffect which might justify the need to relying on 6 DOF mathematical models(Figs. 16 and 17).
Although, the wave heading could be regarded as another indicator, here, waveforces and moments with respect to the Hanaoka parameters were plotted inH=l ¼ 1=15, w ¼ 01 to display the effect of encounter frequency (Figs. 18–20). It isemphasized in Umeda et al. (1995) based on experiments that the effect of frequencyis very small and wave-induced sway forces, roll and yaw moments are almostconstant for to0.25. This conclusion can be confirmed to a certain extent for theseexperiments as well (Ayaz, 2003). Then, the same conclusion could be extended forthe vertical motions (Figs. 19 and 20). The numerical simulation comparedreasonably well in terms of amplitude and phase angle. However, one interestingpoint was seen in the numerical simulation of pitch moment (Fig. 20) for values verynear 0.25 of the Hanaoka parameter. Here, a singular behaviour exists that could be

ARTICLE IN PRESS
0
0.02
0.04
0.06
0.08
0.1Exp.
Num.
Calm
0
0.25
0.5
0.75
1
0 15 30 45 60
0 15 30 45 60
χ (deg)
χ (deg)
Exp.
Num.
M′
ξ/λ
Fig. 17. Wave induced pitch moment with respect to heading angle (Fn ¼ 0.3, l/L ¼ 1.5, H/l ¼ 1/20,
f ¼ 01, y ¼ 01, sinkage ¼ 0m).
Z. Ayaz et al. / Ocean Engineering 33 (2006) 2381–2434 2417
explained by a 3D wave making theory. Such theory is not employed in this study,however the effect of 3D correction terms given in Ohkusu’s theory (Ohkusu, 1986)is believed to be the likely source of this behaviour in the numerical simulation.
In the second part of the experiments, results for the model runs with maximumheel angle, trim angle and sinkage are shown. In the first part (Figs. 21–23) theresults for wave forces and moments with respect to wave heading inH=l ¼ 1=20;Fn ¼ 0:3y ¼ �1:431 and sinkage ¼ �0.2m are presented.
For the model runs with sinkage ¼ �0.2 m there is no significant difference withthe results in zero values in vertical force and moment amplitudes. Yet, this time thenumerical model overestimates the amplitudes for vertical motions in heading angles45 and 601 (Figs. 22–23). However, this cannot be seen as significant difference.Similar problems to the previous case persist in the calculation of wave forces andmoments in these motions as well. Furthermore, in the case of negative trim angle,the model overestimates the amplitudes of vertical motions (Figs. 22 and 23) fornegative sinkage values. In case of positive trim angle they seem to be similar(Figs. 24–26) although the phase angles of force and moment amplitudes change.Similar discrepancies with zero sinkage and trim cases exist.

ARTICLE IN PRESS
0
0.02
0.04
0.06
0.08
0.1
0.1 0.15 0.2 0.25τ
0.1 0.15 0.2 0.25τ
Exp.
Num.
0
0.5
0.75
0.25
1
Exp.
Num.
X′
ξ/λ
Fig. 18. Wave induced surge force with respect to Hanaoka parameter (l/L ¼ 1.5, H/l ¼ 1/15, w ¼ 01,
f ¼ 01, y ¼ 01, sinkage ¼ 0m).
Z. Ayaz et al. / Ocean Engineering 33 (2006) 2381–24342418
Overall, the numerical model gives reasonably satisfactory agreement withexperimental results. Although, the effect of each individual wave force componentshas not been shown, the differences occurring between numerical and experimentalresults can be attributed to calculation of incident wave forces due to position on thewave. The detailed results of captive model tests for all 6 DOF can be found in Ayaz(2003).
5.2. Free running model tests
In the free running model tests, a 2.3m model (1/15 scale) of a Purse Seiner fishingvessel, which was previously mentioned in ITTC Benchmark testing (ITTC, 2002),was used. The principal particulars of the model are given in Table 5. The model wasequipped with bilge keels, rudder and propeller. The model was propelled withelectric motors, with power supplied by batteries on board with feedback controls ofpropeller revolution. Roll, pitch, and yaw angles were measured by fibreopticalgyroscopes. The measured signals as well as the rudder angle and propellerrevolutions were recorded by on-board computers in digital form. The measured yaw

ARTICLE IN PRESS
0
0.05
0.1
0.15
0.2
0.25
0.3
0
0.25
0.5
0.75
1
0.1 0.15 0.2 0.25τ
0.1 0.15 0.2 0.25τ
Exp.
Num.
Exp.
Num.
Z′
ξ/λ
Fig. 19. Wave induced heave force with respect to Hanaoka parameter (l/L ¼ 1.5, H/l ¼ 1/15, w ¼ 01,
f ¼ 01, y ¼ 01, sinkage ¼ 0m).
Z. Ayaz et al. / Ocean Engineering 33 (2006) 2381–2434 2419
angle was also used for the autopilot control. More details on procedure andmeasurement methods are also explained in Ayaz (2003) and Umeda et al. (1994).
5.2.1. Numerical method for random waves
In the numerical calculation of motions in random seas, the model developed byJasionowski (2001) and Letizia (1996) was used. The total incident wave excitationand diffraction forces due to the action of confused seas can be written according tohorizontal body axes system as
Fwave_excðtÞ ¼XN
i
aiðFAFKþDIFÞi cosðowit� kiðxG þ x0 cosc� y0 sinci þ siÞ
þ ðF dFKþDIFÞiÞ, ð33Þ
where FAFK+DIF is the amplitude of the force in random seas and Fd
FK+DIF is thephase lag of the force. However, it should be noted that since the Froude–Krylovforces are not linear, Eq. (33) is an approximate solution. This is the approach

ARTICLE IN PRESS
0
0.02
0.04
0.06
0.08
0.1
0
0.25
0.5
0.75
1
0.1 0.15 0.2 0.25τ
0.1 0.15 0.2 0.25τ
Exp.
Num.
Exp.
Num.
M′
ξ/λ
Fig. 20. Wave induced pitch moment with respect to Hanaoka parameter (l/L ¼ 1.5, H/l ¼ 1/15, w ¼ 01,
f ¼ 01, y ¼ 01, sinkage ¼ �0m).
Z. Ayaz et al. / Ocean Engineering 33 (2006) 2381–24342420
followed in this study in accordance with the numerical tool employed for randomwave calculations (Jasionowski, 2001; Letizia, 1996). Similar to regular waves, speedas well as heading of the vessel can change and this inevitably affects the forces.Therefore, once the ship changes its mean speed and heading, Froude–Krylov anddiffraction forces are updated. The amplitude, ai, and phase angles, si, of eachharmonic component is usually found from a given wave energy spectrum andthrough digital random number generators, a procedure widely discussed inliterature. As for the effect of encounter frequency in random waves, the samemethod (Jasionowski, 2001; Letizia, 1996) has been employed for random wavesapplying the procedure given in Section 3.1 and 3.2.
5.2.2. Discussion on free running model tests
From the free running tests point of view, the priority was to have a healthy wavespectrum to lay foundations to the numerical models in the effort of determining theboundaries of capsize. The model was run for different speeds and heading angles inboth ITTC and JONSWAP wave spectra.

ARTICLE IN PRESS
0
0.02
0.04
0.06
0.08
0.1
0 15 30 45 60χ (deg)
0 15 30 45 60χ (deg)
Exp.
Num.
Calm
0
0.25
0.5
0.75
1
Exp.
Num.
X′
ξ/λ
Fig. 21. Wave induced surge force with respect to heading angle (Fn ¼ 0.3, l/L ¼ 1.5, H/l ¼ 1/20,
f ¼ 101, y ¼ �1.431, sinkage ¼ �0.2m).
Z. Ayaz et al. / Ocean Engineering 33 (2006) 2381–2434 2421
The model was run for three different heading angles (51, 451 and 601) in 3different modal periods, Tp (4.7, 5.76, 6.48 at full scale) for three different significantwave heights Hs (1.725, 2.5875, 3.45m at full scale) at two different speeds (Fn ¼ 0.3and 0.4) in both ITTC and JONSWAP spectra.
In order to simulate the motions of ships in random following and quartering seasnumerically, the aforementioned numerical tool (Jasionowski, 2001) was employed.The wave history of motions is taken based on the inertial co-ordinate of the shipwith respect to point in which the waves are measured. Although the ship travelsalong the model tank therefore the encounter wave history will be different withtime, the numerical model calculates the ship motions for the point wave historymeasured in the experiments. In other words, the ship is always fixed to the one pointin which the wave history is measured.
The numerical model described in Section 5.2.1 was also used to carry out thesimulations for the above conditions and they are verified against some of theexperimental results. In order to test the accuracy of the numerical model twodifferent conditions of two spectra were chosen and the numerical simulations wereverified against the experimental results in those conditions for roll, pitch and yaw.
In Figs. 27–29, the simulations were carried out for Tp ¼ 5.76 (1.487 sec at modelscale), and H4 ¼ 2.588m (0.1725m at model scale) at two different speeds Fn ¼ 0.3

ARTICLE IN PRESS
0
0.1
0.2
0.3
0.4
0.5
0 15 30 45 60χ (deg)
0 15 30 45 60χ (deg)
Exp.
Num.
Calm
0
0.25
0.5
0.75
1
Exp.
Num.
Z′
ξ/λ
Fig. 22. Wave induced heave force with respect to heading angle (Fn ¼ 0.3, l/L ¼ 1.5, H/l ¼ 1/20,
f ¼ 101, y ¼ �1.431, sinkage ¼ �0.2m).
Z. Ayaz et al. / Ocean Engineering 33 (2006) 2381–24342422
and 0.4 for the ITTC spectrum. In Figs. 30–32 the model was simulated andcompared against experiments Tp ¼ 6.48 s (1.717 s at model scale), and Hs ¼ 3.45m(0.23m at model scale) at two different speeds Fn ¼ 0.3 and 0.4 for the JONSWAPspectrum. Both simulations were carried out in heading angle w, 51, 451, 601,respectively. For the simulations, the initial conditions, propeller revolution andautopilot parameters were modelled according to the experiment results.
In order to assess the overall results, in Figs. 33–36, single amplitude significantroll and pitch angles for both spectra with respect to heading angle in Fn ¼ 0.3 and0.4 were plotted for experiments and numerical results.
As it can be seen from the graphs time simulation is filtered for 100 s by applyingthe method described in Section 5.2.1. Incident and diffraction wave excitation termsand radiation terms are also expressed following the same methodology.
In general, these experiments have not been carried out to find boundaries ofcapsizing for dangerous situations that occur in the extreme astern seas, it wasintended to verify the accuracy of the numerical model which could be used for suchpurpose. Therefore, the amplitude of the experimental results and the accuracy of

ARTICLE IN PRESS
0
0.02
0.04
0.06
0.08
0.1Exp.
Num.
Calm
0
0.25
0.5
0.75
1
0 15 30 45 60χ (deg)
0 15 30 45 60χ (deg)
Exp.
Num.
M′
ξ/λ
Fig. 23. Wave induced pitch moment with respect to heading angle (Fn ¼ 0.3, l/L ¼ 1.5, H/l ¼ 1/20,
f ¼ 101, y ¼ �1.431, sinkage ¼ �0.2m).
Z. Ayaz et al. / Ocean Engineering 33 (2006) 2381–2434 2423
numerical model to predict those values will be regarded as an indicator for furtherstudies.
In Figs. 27–29, some of the simulations for the Tp ¼ 1.487 s (5.76 s at full scale),and Hs ¼ 0.1725m (2.588m at full scale) at two different speeds Fn ¼ 0.3 and 0.4 forthe ITTC spectrum were shown at 51 initial heading angle. It could be seen in thesefigures that best agreement is provided in simulation of yaw motion in contrast toprevious regular wave motions. In the numerical models, initial conditions andvalues are taken from experiments using the actual rudder and autopilot parameters.Since the motions do not have the same extreme amplitudes and transient behaviouras in the regular wave motions, accuracy of the simulations for yaw motions can beexpected. Therefore, it can be assumed that coupling effects of those motions arepredicted with reasonably satisfactory agreement.
For the roll and pitch motions, the best indictor can be seen in the graphsillustrated in Figs. 33 and 34. Here, the single amplitude significant roll and pitchangles are plotted versus the wave heading. As for the roll motion, it is usuallyconsidered that, since viscous effects play a major part, the amplitude is usually lessthan for the numerical simulations which ignore viscous effects.

ARTICLE IN PRESS
0
0.02
0.04
0.06
0.08
0.1
0 15 30 45 60χ (deg)
0 15 30 45 60χ (deg)
Exp.
Num.
Calm
0
0.25
0.5
0.75
1
Exp.
Num.
X′
ξ/λ
Fig. 24. Wave induced surge force with respect to heading angle (Fn ¼ 0.3, l/L ¼ 1.5, H/l ¼ 1/20,
f ¼ 101, y ¼ 1.431, sinkage ¼ 0.2m).
Z. Ayaz et al. / Ocean Engineering 33 (2006) 2381–24342424
However, when the ship motions in astern seas are concerned, the rapid change inthe restoring and numerical modelling of restoring could be a major factor in theresults as it was seen in Section 4. Here, too, the roll amplitude was found to belarger than that in the experiment because of, presumably, the same reason. InFig. 33, it is seen that the roll amplitude is better predicted for the high-speed range,as the change of restoring is less than at the slower speed. The accuracy of thenumerical model for the high-speed range has been seen throughout the simulationsin this study. The difference, however, in the experimental results are insignificant.For the pitch motions, however, the accuracy is not as good as the roll motion. Asimilar problem has been seen in the amplitude for the Purse Seiner trawler in regularwave tests as well (Ayaz, 2003). Therefore, it could be attributed to geometrical formof this particular vessel. The pitch motions for the container vessel Section 4, forinstance, had shown a good agreement. The agreement between numerical andexperimental results is similar to that of roll motion, although there is significantdifference in the amplitude for 451 wave heading in Fn ¼ 0.3 (Fig. 34).
In Figs. 30–32 the model was simulated and compared against experimentsTp ¼ 1.717 s (6.48 s at full scale), and Hs ¼ 0.23m (3.45m at full scale) at two

ARTICLE IN PRESS
0
0.1
0.2
0.3
0.4
0.5
Exp.
Num.
Calm
0
0.25
0.5
0.75
1
604530150χ (deg)
604530150χ (deg)
Exp.
Num.
Z′
ξ/λ
Fig. 25. Wave induced heave force with respect to heading angle (Fn ¼ 0.3, l/L ¼ 1.5, H/l ¼ 1/20,
f ¼ 101, y ¼ 1.431, sinkage ¼ 0.2m).
Z. Ayaz et al. / Ocean Engineering 33 (2006) 2381–2434 2425
different speeds Fn ¼ 0.3 and 0.4 for the JONSWAP spectrum. When the significantwave height increases with longer modal period, the overall characteristics of themotions do not show significant difference. The yaw and rudder motions yet againwere predicted with good agreement. Similar to the first case, single amplitudesignificant roll and pitch angles were plotted with respect to wave heading in Figs. 35and 36. Here, there is a better agreement for both motions especially in Fn ¼ 0.4.However, the same difference in significant pitch angle amplitude for Fn ¼ 0.3 and451 wave direction exists for this motion as well. The amplitude of the motions isslightly less than the previous case despite the higher significant wave height. Thisshows the important effect of the frequency in the motions.
Overall, the results indicate that motions with higher amplitudes occur closer topure following seas. This verifies the common knowledge in the motions of ships inextreme astern seas. Concerning the effect of frequency, the numerical model showssimilarly good agreement for motions in 601 as in the following and quartering seas.
However, the difference between the motion attitudes is not significantly different.The diffraction model based on the low encounter frequency may contribute to the

ARTICLE IN PRESS
0
0.02
0.04
0.06
0.08
0.1
0 15 30 45 60χ (deg)
0 15 30 45 60
χ (deg)
Exp.
Num.
Calm
0
0.25
0.5
0.75
1
Exp.
Num.
M′
ξ/λ
Fig. 26. Wave induced pitch moment with respect to heading angle (Fn ¼ 0.3, l/L ¼ 1.5, H/l ¼ 1/20,
f ¼ 101, y ¼ 1.431, sinkage ¼ 0.2m).
Table 5
Principal particulars of fishing vessel and model of free running tests
Parameter Vessel Model (1/15)
LBP 34.50m 2.3m
B 7.60m 0.507m
D 3.07m 0.205m
df 2.50m 0.166m
da 2.80m 0.186m
Cb 0.597 0.597
D 425.18 t 125.588 kg
LCG �1.31m �0.087 m
KG 3.36m 0.224m
GM 1.0m 0.0667m
Tj 7.4 s 1.9 s
Z. Ayaz et al. / Ocean Engineering 33 (2006) 2381–24342426
difference in wave headings near to beam quartering seas. Phase angle and otherparameters are obtained from the wave spectra and the simulations display goodagreement.

ARTICLE IN PRESS
Exp.
-30
-20
-10
0
10
20
30
-20
-10
0
10
20
30
0 20 40 60 80 100
Time (sec)
Rol
l Ang
le (
deg)
Num.
0 20 40 60 80
Time (sec)
Rol
l Ang
le (
deg)
100
Fig. 27. Roll angle, ITTC spectrum, Fn ¼ 0.3, w ¼ �51, Hs ¼ 0.1725m, Tp ¼ 1.487 s.
Num.
-10
-5
0
5
10
Time (sec)
Pitc
h A
ngle
(de
g)
Exp.
-10
-5
0
5
10
0 20 40 60 80 100
0 20 40 60 80
Time (sec)
Pitc
h A
ngle
(de
g)
100
Fig. 28. Pitch angle, ITTC spectrum, Fn ¼ 0.3, w ¼ �51, Hs ¼ 0.1725m, Tp ¼ 1.487 s.
Z. Ayaz et al. / Ocean Engineering 33 (2006) 2381–2434 2427

ARTICLE IN PRESS
Exp.
-60
-40
-20
0
20
40
60
0 20 40 60 80 100
Time (sec)
Yaw
Ang
le (
deg)
Num.
-60
-40
-20
0
20
40
60
0 20 40 60 80 100
Time (sec)
Yaw
Ang
le (
deg)
Fig. 29. Yaw angle, ITTC spectrum, Fn ¼ 0.3, w ¼ �51, Hs ¼ 0.1725m, Tp ¼ 1.487 s.
Exp.
-20
-10
0
10
20
30
Time (sec)
Rol
l Ang
le (
deg)
Num.
-20
-10
0
10
20
30
0 20 40 60 80 100
0 20 40 60 80 100
Time (sec)
Rol
l Ang
le (
deg)
Fig. 30. Roll angle, JONSWAP spectrum, Fn ¼ 0.4, w ¼ �601, Hs ¼ 0.235m, Tp ¼ 1.717 s.
Z. Ayaz et al. / Ocean Engineering 33 (2006) 2381–24342428

ARTICLE IN PRESS
Num.
-10
-5
0
5
10
0 20 40 60 80 100
0 20 40 60 80 100
Time (sec)
Pitc
h A
ngle
(de
g)
Exp.
-10
-5
0
5
10
Time (sec)
Pitc
h A
ngle
(de
g)
Fig. 31. Pitch angle, JONSWAP spectrum, Fn ¼ 0.4, w ¼ �601, Hs ¼ 0.235m, Tp ¼ 1.717 s.
Z. Ayaz et al. / Ocean Engineering 33 (2006) 2381–2434 2429
6. Conclusions
The main aim of this study was to develop a coupled non-linear 6-DOF modelwith frequency dependent coefficients, incorporating memory effects in randomwaves with a new axis system that allows straightforward combination betweenseakeeping and manoeuvring models whilst accounting for extreme motions.
In order to achieve this goal a new mathematical model was developed which allowedmeaningful combination of manoeuvring and seakeeping motions in the prediction ofextreme ship motions. It is enhanced by incorporating convolution terms (so-called‘‘memory effects’’) that improve the prediction of the behaviour of the vessel in non-zeroencounter frequencies. Furthermore, the numerical model is expressed for randomwaves, thus it is suitable for simulating ship behaviour in a realistic environment.
Validation of the numerical model indicates that the numerical model couldprovide reasonably adequate predictions of behaviour in extreme astern seas,especially qualitatively, and it could identify the dangerous situations that may leadto capsizing. The coupling between vertical motions and other motions should betaken into account in an attempt to improve the accuracy of numerical calculations.For certain initial conditions and wave conditions the frequency dependent termscould affect the accuracy of the numerical model and there is a considerable effect ofthe encounter frequency on ship controllability. However, these numericalsimulations showed that this effect cannot be justified as an ‘‘improvement’’.

ARTICLE IN PRESS
Exp.
-120
-90
-60
-30
0
30
60
90
0 20 40 60 80 100
0 20 40 60 80 100
Time (sec)
Yaw
Ang
le(d
eg)
Num.
-120
-90
-60
-30
0
30
60
90
Time (sec)
Yaw
Ang
le (
deg)
Fig. 32. Yaw angle, JONSWAP spectrum, Fn ¼ 0.4, w ¼ �601, Hs ¼ 0.235m, Tp ¼ 1.717 s.
Hs=0.1725 m; Tp=1.487 sec.
0
5
10
15
20
0 20 40 60 80χ (deg)
Sig
n. r
oll (
deg)
, sin
gle
ampl
.
Exp. (Fn=0.3)Exp. (Fn=0.4)Num. (Fn=0.3)Num. (Fn=0.4)
Fig. 33. Single amplitude significant roll angle with respect to wave direction for Fn ¼ 0.3 and 0.4 in ITTC
spectrum.
Z. Ayaz et al. / Ocean Engineering 33 (2006) 2381–24342430
In an attempt to enhance the knowledge regarding the effect of vertical motionsand to assess the reliability of the numerical model in a random waves environment,captive and free running model experiments were conducted. The numerical modelprovides good agreement for fully captive model and difference between wave and

ARTICLE IN PRESS
Hs=0.1725 m; Tp=1.487 sec.
0123456789
10
0 10 20 30 40 50 60 70χ (deg)
Sig
n. p
itch
(deg
), s
ingl
e am
pl.
Exp. (Fn=0.3)
Exp. (Fn=0.4)
Num. (Fn=0.3)
Num. (Fn=0.4)
Fig. 34. Single amplitude significant pitch angle with respect to wave direction for Fn ¼ 0.3 and 0.4 in
ITTC spectrum.
Hs=0.23 m; Tp=1.717 sec.
0
5
10
15
20
0 20 40 60 80χ (deg)
Sig
n. r
oll (
deg)
, sin
gle
ampl
. Exp. (Fn=0.3)
Exp. (Fn=0.4)
Num. (Fn=0.3)
Num. (Fn=0.4)
Fig. 35. Single amplitude significant roll angle with respect to wave direction for Fn ¼ 0.3 and 0.4 in
JONSWAP spectrum.
Z. Ayaz et al. / Ocean Engineering 33 (2006) 2381–2434 2431
calm water values indicate the importance of vertical forces and moments, yetdifferences in terms of wave steepness, heading angle and encounter frequency arenot so significant when the maximum heeling, sinkage and trim values used in theseexperiments are concerned.
The agreement of the numerical model in random astern waves is reasonablysatisfactory and it is believed that this model could be a useful tool for identifyingdangerous situations that the ship might face in extreme random seas conditions.The pure following seas conditions was seen to be most dangerous situation based onthe motion amplitudes and quartering to beam seas are safer compared to aft toquartering seas.
Further efforts should be concerned with both theoretical and experimentalstudies. For the calculation of the frequency dependent coefficients, due to the

ARTICLE IN PRESS
Hs=0.23 m; Tp=1.717 sec.
0123456789
10
0 10 20 30 40 50 60 70χ (deg)
Sig
n. p
itch
(deg
), s
ingl
e am
pl.
Exp. (Fn=0.3)
Exp. (Fn=0.4)
Num. (Fn=0.3)
Num. (Fn=0.4)
Fig. 36. Single amplitude significant pitch angle with respect to wave direction for Fn ¼ 0.3 and 0.4 in
JONSWAP spectrum.
Z. Ayaz et al. / Ocean Engineering 33 (2006) 2381–24342432
inadequacy of the strip theory approaches, a 3D including the aft effect couldimprove the accuracy of the numerical model. Also, shedding of trailing vorticesfrom hull sources should be taken into account and this could be achieved by usingCFD flow solvers. Following the importance of hydrodynamic lift and viscouseffects in ship motions in astern seas, CFD tools can also be employed usingboundary layer theory and Navier–Stokes equations. Furthermore, the couplingbetween vertical and horizontal motions in the manoeuvring models could be fullytaken into account. As a result of current developments into new hull forms andpropulsion systems, the effect of design parameters for different hull forms at thevery high speed range and directional stability of these vessels can be investigated.The effect of control parameters on vessel motions is also important. Use of moresophisticated autopilot models could be attempted. Studies focusing on theaforementioned aspects are currently underway.
For experimental research, the focus should be on the effect of vertical motions inmore extreme conditions, with more extensive environmental and operationsparameters. The same approach could be applied to random wave tests, in order todevelop insights into the behaviour of ship in a realistic following/quartering seaway.
Acknowledgments
The authors would like to thank Dr. Naoya Umeda of Osaka University, Mr.Akihiko Matsuda and members of the National Research Institute of FisheriesEngineering of Japan (NRIFE). for providing the opportunity to carry out theexperiments and technical support during first author’s stay in Japan. Thanks arealso due to Mr. David Clelland of NA-ME, Universities of Strathclyde and Glasgowfor his help in the design of the experiments. Finally, the authors would like toexpress their sincere gratitude to the Ministry of Education of Japan for theircollaboration in funding the experimental studies at NRIFE.

ARTICLE IN PRESS
Z. Ayaz et al. / Ocean Engineering 33 (2006) 2381–2434 2433
References
Abkowitz, M.A., 1969. Stability and Motion Control of Ocean Vehicles. MIT Press, Cambridge, MA,
USA.
Ankudinov, V., 1983. Simulation analysis of ship motions. In: The Proceedings of International
Workshop on Ship and Platform Motions, Berkeley, CA, USA, October 26–28, pp. 384–403.
Ayaz, Z., 2003. Manoeuvring behaviour of ships in extreme astern seas. Ph.D. Thesis, University of
Strathclyde, Glasgow, UK.
Ayaz, Z., Spyrou, K.J., Vassalos, D., 2001. An improved numerical model for the study of controlled ship
motions in extreme following and quartering seas. In: The Proceedings of IFAC Conference on
Control Applications in Marine Systems. Glasgow, UK, July.
Bailey, P.A., Price, W.G., Temarel, P., 1998. A unified mathematical model describing the manoeuvring of
a ship travelling in a seaway. Transactions of RINA 140, 131–149.
Chislett, M.S., 1990. The addition of a hell-roll servo mechanism to the DMI horizontal planar motion
mechanism. In: Proceedings of International Conference on Marine Simulation and Ship Manoeuvr-
ability. Tokyo, Japan, pp. 349–359.
Conolly, J.E., 1972. Stability and control in waves: a survey of the problem. Proceedings of International
Symposium on Directional Stability and Control of Bodies Moving In Water. Journal of Mechanical
Science 14(7), (Supplementary Issue), 186–193.
Cummins, W.E., 1962. The impulse response function and ship motions. Schiffstechnik 9 (47), 101–109.
Davidson, K.S.M., 1948. The steering of ships in following seas. In: Proceedings of Sixth International
Conference for Applied Mechanics, vol. 2, pp. 554–568.
De Kat, J., Paulling, J.R., 1989. The simulation of ship motions and capsizing in severe seas. SNAME
Transactions 97, 139–168.
Du Cane, P., Goodrich, G.J., 1962. The following sea, broaching and surging. RINA Quarterly
Transactions 104 (2), 109–140.
Grim, O., 1963. Surging Motion and Broaching Tendencies in A Severe Irregular Sea. Davidson
Laboratory Report, R-929, USA.
Hamamoto, M., Akiyoshi, T., 1988. Study on ship motions and capsizing in following seas (1st Report —
Equation of Motion for Numerical Simulation). Journal of The Society of Naval Architects of Japan
163, 173–180.
Hamamoto, M., Kim, Y., 1992. Study on ship motions and capsizing in following waves (Final Report).
Journal of The Society of Naval Architects of Japan 170, 173–182.
Hamamoto, M., Saito, K., 1992. Time domain analysis of ship motions in following waves. In: 11th
Australasian Fluid Mechanics Conference,. University of Tasmania. Hobart, Australia, pp. 355–358.
Hamamoto, M., Kim, Y., 1993. A new coordinate system and the equations describing manoeuvring
motion of a ship in waves. Journal of the Society of Naval Architectures of Japan 173, 209–220.
Hamamoto, M., Shirai, T., 1989. Study on ship motions and capsizing in following seas (2nd Report—
Simulation of Capsizing). Journal of The Society of Naval Architects of Japan 165, 123–130.
Hamamoto, M., Fujino, M., Kim, Y.S., 1994. Dynamic stability of a ship in quartering seas. In:
Proceedings of International Conference on Stability on Ships in Ocean Vehicles. Florida, USA.
Hamamoto, M., et al., 1995. Model experiments of ships capsize in astern seas (Second Report). Journal of
the Society of Naval Architects of Japan 179, 77–87.
Hamamoto, M., Sera, W., Panjaitan, J.P., 1996. Analyses on low cycle resonance of ships in irregular
astern Seas. Journal of the Society of Naval Architects of Japan 178, 137–145.
Hess, J.L., Smith, A.M.O., 1964. Calculation of nonlifting potential flow about arbitrary three-
dimensional bodies. Journal of Ship Research 8, 22–44.
Holtrop, J., Mennen, G.G.J., 1982. An approximate power prediction method. International Shipbuilding
Progress 29 (335), 166–170.
Inoue, S., Hirano, M., Kijima, K., Takashina, J., 1981. A practical calculation method of ship
manoeuvring. International Shipbuilding Progress 28 (324), 207–222.
ITTC, 1999a. Report of the manoeuvring Committee. Proceedings of 22nd ITTC, vol 1, Seoul, Korea, pp.
71–118.

ARTICLE IN PRESS
Z. Ayaz et al. / Ocean Engineering 33 (2006) 2381–24342434
ITTC, 1999b. Report of The Specialist Committee on Stability. Proceedings of 22nd ITTC, vol 2, Seoul,
Korea, pp. 399–431.
ITTC, 2002. Report of The Specialist Committee on Prediction of Extreme Ship Motions and Capsizing.
Proceedings of 23rd ITTC, vol 2, Italy, pp. 611–649.
Jasionowski, A., 2001. An integrated approach to damage stability survivability assessment. Ph.D. Thesis,
University of Strathclyde, Glasgow, UK.
Lee, S.-K., 2000. The calculation of zig-zag manoeuvre in regular waves with use of the impulse response
functions. Ocean Engineering 27 (1), 87–96.
Letizia, L., 1996. Damage survivability of passenger ships in a seaway. Ph.D. Thesis, University of
Strathclyde, Glasgow, UK.
Matsuda, A., Hashimoto, H., Umeda, N., 2003. Capsizing due to Bow diving. In: Proceedings of 8th
International Conference on the Stability of Ships and Ocean Vehicles. Madrid, Spain, pp. 563–570.
McCreight, W.R., 1986. Ship manoeuvring in waves. In: Proceedings of Sixteenth Symposium on Naval
Hydrodynamics. Berkeley, CA, USA.
Motora, S., Fujino, M., Fuwa, T., 1982. On the mechanism of broaching-to phenomena. In: Proceedings
of International Conference of Ships and Ocean Vehicles. Tokyo, Japan.
Munif, A., Umeda, N., 2000. Modelling extreme roll motions and capsizing of moderate-speed ship in
astern waves. Journal of Naval Architects of Japan 187, 51–58.
Ohkusu, M., 1986. Prediction of wave forces on a ship running in following waves with very low
encountered frequency. Journal of the Society of Naval Architects of Japan 159, 129–138.
Rhee, K.P., Kim, C.K., Lee, C.M., 1990. The manoeuvring motion of the marad type ship in waves. In:
International Conference on Marine Simulation and Ship Manoeuvrability. Tokyo, Japan, pp.
413–419.
Spyrou, K.J., 1990. A new approach for assessing ship manoeuvrability based on dynamical systems
theory. Ph.D. Thesis, University of Strathclyde, Glasgow, UK.
Spyrou, K., 1995. Surf-riding and oscillations of a ship in quartering seas. Journal of Marine Science and
Technology 1, 24–36.
Spyrou, K., 1996. Dynamic instability in quartering seas: the behaviour of a ship during broaching.
Journal of Ship Research 40 (1), 46–59.
Tasai, F., 1961. Damping force and added mass of ships in heaving pitching. Transactions of the West
Japan Society of Naval Architects 21, 109–132.
Takaishi, Y., 1982. Consideration on the dangerous situations leading to capsize of ships in waves. In:
Proceedings of Second International Conference on Stability on Ships in Ocean Vehicles. Tokyo,
Japan, pp. 243–253.
Umeda, N., Renilson, M., 1992a. Broaching—a dynamic analysis of yaw behaviour of a vessel in a
following sea. In: Manoeuvrability and Control of Marine Craft. Computational Mechanics
Publications, Southampton, UK, pp. 533–543.
Umeda, N., Renilson, M., 1992b. Wave forces on a ship running in quartering seas—a simplified
calculation method. In: 11th Australasian Fluid Mechanics Conference. University of Tasmania,
Hobart, p. Australia.
Umeda, N., et al., 1994. Model experiments of ships capsize in astern seas. Journal of the Society of Naval
Architects of Japan 177, 207–217.
Umeda, N., Yamakoshi, Y., Suzuki, S., 1995. Experimental study for wave forces on a ship running
quartering seas with very low encountering frequency. In: , Proceedings of The Sevastianov
Symposium, The International Symposium Ship Safety in a Seaway,, vol 1(14). Kaliningrad, Russia,
pp. 1–18.
Vassalos, D., Maimun, A., 1994. Broaching-to: thirty years on. In: Proceedings of International
Conference on Stability on Ships in Ocean Vehicles. Florida, USA.
Vassalos, D., Ayaz, Z., Umeda, N., Renilson, M., 2003. Benchmark testing of numerical prediction on the
capsizing of intact container vessels in astern seas. In: Proceedings of RINA Conference. Design &
Operation of Container Ships, London, UK.
Related Documents