Manganese Enhanced MRI Reveals Functional Circuitry in Response to Odorant Stimuli Kai-Hsiang Chuang 1 , Jung Hee Lee 1,3 , Afonso C. Silva 1 , Leonardo Belluscio 2 , and Alan P. Koretsky 1 1 Laboratory of Functional and Molecular Imaging, National Institute of Neurological Disorders and Stroke, NIH, Bethesda, MD 20892, USA 2 Developmental Neural Plasticity Unit, National Institute of Neurological Disorders and Stroke, NIH, Bethesda, MD 20892, USA 3 Department of Radiology, Samsung Medical Center, Sungkyunkwan University School of Medicine, Korea Abstract To investigate the circuitry involved in detecting odorants in the rodent brain, we developed a method using manganese-enhanced MRI (MEMRI) to map the flow of neural information from the olfactory sensory neurons (OSNs) to the central layers of the olfactory bulb. Studies have shown that Mn 2+ enters active neurons and is transported anterogradely to axon terminals where it can cross synapses to functionally trace neural networks. Thus, by delivering MnCl 2 directly into the nasal cavity of mice and then exposing them to defined odorants, Mn 2+ is preferentially taken up by activated OSNs. Using the time course of the MRI signal, we generated maps of Mn 2+ accumulation in the olfactory bulb for both glomerular and mitral cell layers. Results demonstrated that overlapping yet distinct enhancement patterns were produced by exposure to either octanal, acetophenone, or carvone. Notably, areas of Mn 2+ accumulation in the mitral cell layer were similar to those in the glomerular layer consistent with neural information that passes from specific OSNs to specific mitral cells. Finally, by correlating specific Mn 2+ signal peaks to genetically labeled glomeruli that are known to be activated by the odorant octanal, we show that MEMRI maps can be resolved at the level of individual glomeruli. Introduction Olfaction plays important roles in reproduction and learning in many mammalian species and understanding how odorants are processed and encoded in the central nervous system is critical to determine the neural basis of these behaviors. The olfactory system of mammals represents a challenge for brain imaging because it is sensitive to many odorant molecules. A given odorant is selectively recognized by a subset of about 1000 different odor receptors (ORs) in Correspondence to: Kai-Hsiang Chuang, Ph.D.*, Laboratory of Functional and Molecular Imaging, National Institute of Neurological Disorders and Stroke, NIH, 10 Center Drive, 10/3D17, MSC 1488, Bethesda, MD 20892, Telephone: (301) 594-7314, Fax: (301) 435-8228, Email: [email protected]. * Current address: Laboratory of Molecular Imaging, Singapore Bioimaging Consortium, 11 Biopolis Way, #02-02, Singapore 138667. Email: [email protected] part of the results had been presented in the International Society for Magnetic Resonance in Medicine 14th Scientific Meeting & Exhibition, Seattle, Washington, USA, 6-12 May 2006 Publisher's Disclaimer: This is a PDF file of an unedited manuscript that has been accepted for publication. As a service to our customers we are providing this early version of the manuscript. The manuscript will undergo copyediting, typesetting, and review of the resulting proof before it is published in its final citable form. Please note that during the production process errors may be discovered which could affect the content, and all legal disclaimers that apply to the journal pertain. NIH Public Access Author Manuscript Neuroimage. Author manuscript; available in PMC 2010 January 15. Published in final edited form as: Neuroimage. 2009 January 15; 44(2): 363–372. doi:10.1016/j.neuroimage.2008.08.046. NIH-PA Author Manuscript NIH-PA Author Manuscript NIH-PA Author Manuscript

Welcome message from author
This document is posted to help you gain knowledge. Please leave a comment to let me know what you think about it! Share it to your friends and learn new things together.
Transcript
Manganese Enhanced MRI Reveals Functional Circuitry inResponse to Odorant Stimuli
Kai-Hsiang Chuang1, Jung Hee Lee1,3, Afonso C. Silva1, Leonardo Belluscio2, and Alan P.Koretsky1
1 Laboratory of Functional and Molecular Imaging, National Institute of Neurological Disorders and Stroke,NIH, Bethesda, MD 20892, USA
2 Developmental Neural Plasticity Unit, National Institute of Neurological Disorders and Stroke, NIH,Bethesda, MD 20892, USA
3 Department of Radiology, Samsung Medical Center, Sungkyunkwan University School of Medicine, Korea
AbstractTo investigate the circuitry involved in detecting odorants in the rodent brain, we developed a methodusing manganese-enhanced MRI (MEMRI) to map the flow of neural information from the olfactorysensory neurons (OSNs) to the central layers of the olfactory bulb. Studies have shown that Mn2+
enters active neurons and is transported anterogradely to axon terminals where it can cross synapsesto functionally trace neural networks. Thus, by delivering MnCl2 directly into the nasal cavity ofmice and then exposing them to defined odorants, Mn2+ is preferentially taken up by activated OSNs.Using the time course of the MRI signal, we generated maps of Mn2+ accumulation in the olfactorybulb for both glomerular and mitral cell layers. Results demonstrated that overlapping yet distinctenhancement patterns were produced by exposure to either octanal, acetophenone, or carvone.Notably, areas of Mn2+ accumulation in the mitral cell layer were similar to those in the glomerularlayer consistent with neural information that passes from specific OSNs to specific mitral cells.Finally, by correlating specific Mn2+ signal peaks to genetically labeled glomeruli that are known tobe activated by the odorant octanal, we show that MEMRI maps can be resolved at the level ofindividual glomeruli.
IntroductionOlfaction plays important roles in reproduction and learning in many mammalian species andunderstanding how odorants are processed and encoded in the central nervous system is criticalto determine the neural basis of these behaviors. The olfactory system of mammals representsa challenge for brain imaging because it is sensitive to many odorant molecules. A givenodorant is selectively recognized by a subset of about 1000 different odor receptors (ORs) in
Correspondence to: Kai-Hsiang Chuang, Ph.D.*, Laboratory of Functional and Molecular Imaging, National Institute of NeurologicalDisorders and Stroke, NIH, 10 Center Drive, 10/3D17, MSC 1488, Bethesda, MD 20892, Telephone: (301) 594-7314, Fax: (301)435-8228, Email: [email protected].*Current address: Laboratory of Molecular Imaging, Singapore Bioimaging Consortium, 11 Biopolis Way, #02-02, Singapore 138667.Email: [email protected] of the results had been presented in the International Society for Magnetic Resonance in Medicine 14th Scientific Meeting &Exhibition, Seattle, Washington, USA, 6-12 May 2006Publisher's Disclaimer: This is a PDF file of an unedited manuscript that has been accepted for publication. As a service to our customerswe are providing this early version of the manuscript. The manuscript will undergo copyediting, typesetting, and review of the resultingproof before it is published in its final citable form. Please note that during the production process errors may be discovered which couldaffect the content, and all legal disclaimers that apply to the journal pertain.
NIH Public AccessAuthor ManuscriptNeuroimage. Author manuscript; available in PMC 2010 January 15.
Published in final edited form as:Neuroimage. 2009 January 15; 44(2): 363–372. doi:10.1016/j.neuroimage.2008.08.046.
NIH
-PA Author Manuscript
NIH
-PA Author Manuscript
NIH
-PA Author Manuscript

the nasal epithelium (Buck and Axel, 1991) and is thus encoded by a combination of activitiesinitiated through those ORs (Malnic et al., 1999). Since olfactory sensory neurons (OSNs)expressing the same ORs form synapses with mitral/tufted (M/T) cells and interneurons inolfactory glomeruli in the glomerular layer of the main olfactory bulb (MOB) in a stereotypicfashion (Mombaerts et al., 1996; Ressler et al., 1994), activation of OSNs elicited by odorantsis transformed to a spatial pattern, i.e., an odor map, in the glomerular layer (Buck, 1996).Information is refined by M/T cells involving lateral and feedback inhibitions and thentransmitted to the primary olfactory cortex where it is relayed to deeper brain structures suchas amygdala (Shipley et al., 1995).
To fully understand coding of odorants in these higher-order brain regions, methods forrevealing odorant representation in MOB and olfactory cortex must be improved (for reviews,see Kauer and White, 2001; Korsching, 2002). Several imaging methods have been pursuedto map odorant activation in the glomerular layer, such as, 2-deoxyglucose (2-DG)autoradiography (Sharp et al., 1975), c-Fos mRNA expression (Guthrie et al., 1993), opticalimaging of intrinsic signals (Rubin and Katz, 1999), calcium indicator dye (Friedrich andKorsching, 1997), voltage-sensitive dye (Friedrich and Korsching, 1998), and functional MRI(Xu et al., 2003; Yang et al., 1998). However, due to the limited spatial resolution and/or field-of-view, these methods either cannot resolve responses of individual glomeruli or cannot detectactivity throughout the olfactory system such as in deeper layers beyond the glomerular layer.
Manganese-enhanced MRI (MEMRI) is a new method to map neuronal function andconnections (for review, see Koretsky and Silva, 2004). Manganese ion (Mn2+)enters neuronsthrough voltage-gated calcium channels (Drapeau and Nachshen, 1984; Narita et al., 1990)and can be transported anterogradely along axons and can cross synapses (Pautler et al.,2003; Pautler et al., 1998; Sloot and Gramsbergen, 1994; Tjalve et al., 1995). Mn2+ transportacross a synapse relies on presynaptic release and postsynaptic uptake, therefore, the amountof Mn2+ transported may change depending on the strength of connections if there is plasticityin a neural system (Van der Linden et al., 2004; van der Zijden et al., 2006). If so, it should bepossible to produce quantitative indices of Mn2+ movement through a neural system after anactivity-based representation is initiated, and hence map the strongest functional connectionsthrough that system. This would supply unique information about neural circuits. A first stepin this direction was taken when it was demonstrated that Mn2+ can be transported from thenose of a rodent to the olfactory bulb and the tracing to the olfactory bulb could be modulatedby odorants (Pautler and Koretsky, 2002).
Here, we have developed a method using MEMRI which capitalizes on the activity dependentuptake and trans-synaptic transport of Mn2+ to generate maps of functional circuitry. Thesemaps are shown to be specific for different odorants and can be generated simultaneously fromthe glomerular and mitral cell layers of the mouse MOB. Through comparison with opticalimages of green fluorescent protein (GFP)-labeled glomeruli we show that this Mn2+ mappingtechnique can detect individual glomeruli. These results demonstrate the potential of using theunique properties of MEMRI to produce maps at layer and column specific resolution.
Materials and methodsTransgenic mouse line
To test the sensitivity to individual glomeruli, a genetically altered mouse strain, rI7→M71,was used because the rI7 odorant receptor is known to respond to the odorant octanal. Themouse was created by replacing the mouse M71 odorant receptor coding sequence with the ratI7 odorant receptor coding sequence and engineered to co-express both GFP and β-galactosidase as markers using tandem IRES sequences (for details see Bozza et al., 2002). All
Chuang et al. Page 2
Neuroimage. Author manuscript; available in PMC 2010 January 15.
NIH
-PA Author Manuscript
NIH
-PA Author Manuscript
NIH
-PA Author Manuscript

mice were of mixed (129 x C57BL/6) background. The mice were bred in-house with malesremoved from breeder cages prior to parturition.
Animal preparationAll animal experiments followed the NIH guidelines and were approved by the Animal Careand Use Committee of the National Institute of Neurological Disorders and Stroke, NationalInstitutes of Heath (Bethesda, MD, USA). Adult male C57BL/6 mice and rI7→M71 transgenicmice (body weights 20 – 32 g) were used. The C57BL/6 mice were divided into four groups:control (N = 7), octanal stimulation (N = 8), carvone stimulation (N = 5) and acetophenonestimulation (N = 6). The rI7→M71 transgenic mice (N = 6) were only stimulated by octanal.
The animal was anesthetized by 5% isoflurane (in 1:1:1 mixture of air: nitrogen: oxygen),removed from the induction chamber, and fixed in an upright position. Before it woke up, 7-μL aqueous solution of 10 mM MnCl2 (Sigma-Aldrich Co, MO, USA) was rapidly injectedinto each nostril using a 20-μL micropipette. After the mouse awoke (usually about 20 sec afterMn2+ injection), it was put into an empty clean cage. For the odor stimulation groups, 7-μL of1:10 diluted octanal, carvone, or acetophenone were dropped at each of the four corners in thecage. For the control group, nothing was given in the clean cage. After exposure to the odoror air for 20 min, the mouse was removed from the cage and anesthetized by isoflurane forMRI.
For better visualization and segmentation of the glomerular and mitral cell layers of the MOB,120-mM isotonic MnCl2 solution was infused into the tail veins by a syringe pump (Cole-Parmer Instrument, IL, USA) in 2 mice with a dosage of 88 mg/kg and an infusion rate of 250μL/h (Aoki et al., 2004; Lee et al., 2005). After that, mice were returned to their cages withfree access to food and water. High-resolution MRI was performed 24 h after MnCl2 infusion.
MRI data acquisitionImages were acquired on an 11.7 T/31 cm horizontal magnet (Magnex Scientific Ltd.,Abingdon, UK) equipped with a 9-cm gradient set (Resonance Research Inc, Billerica, MA,USA) that can provide 60-G/cm strength and 80-μs rise time, and interfaced to a Bruker Avanceconsole (Bruker BioSpin, Billerica, MA, USA). A homemade 9-cm birdcage volume coil wasused for RF transmission and a 1-cm surface coil, which was placed right above the MOB, wasused for signal reception. The mouse was placed in a custom designed plastic stereotaxic holderwith a tooth bar and ear bars to immobilize the head. The anesthesia (1 – 1.5% isoflurane mixedwith air) was delivered through a nose-cone and the body temperature was maintained by atemperature-controlled water bath. Time series, T1-weighted MRI covering the MOB wereacquired by 3D rapid acquisition with relaxation enhancement (RARE) sequence. With arepetition time/echo time = 300/10 ms, matrix size = 128 × 128 × 64, and RARE factor of 2,3D volumes of 100-μm isotropic spatial resolution were obtained every 20 min 30 s. The 3Dimaging usually began 40 to 60 min after MnCl2 injection and lasted for 1.5 to 2.5 h,corresponding to 4 to 8 volumetric images in each mouse. The mice received systemicMnCl2 infusion were imaged by T1-weighted 3D RARE (TR/TE = 450/11 ms) with 60-μmisotropic resolution.
Fluorescent imagingFluorescent images were collected using a Zeiss LSM-510-Meta confocal attached to anAxioscope 2 microscope (Carl Zeiss Inc., NY, USA). Olfactory epithelium and bulb sectionswere imaged with an Achroplan 20X/0.45 objective. Fluorophores used were: GFP, excitation488, emission 507; Alexa-488, excitation 495, emission 519; Cy3, excitation 552, emission570. Brightfield whole mount images were collected using a Leica MZFL3 microscope (Leica
Chuang et al. Page 3
Neuroimage. Author manuscript; available in PMC 2010 January 15.
NIH
-PA Author Manuscript
NIH
-PA Author Manuscript
NIH
-PA Author Manuscript
Microsystems Inc., IL, USA) equipped with a Spot-RT cooled CCD camera (DiagnosticInstruments Inc., MI, USA).
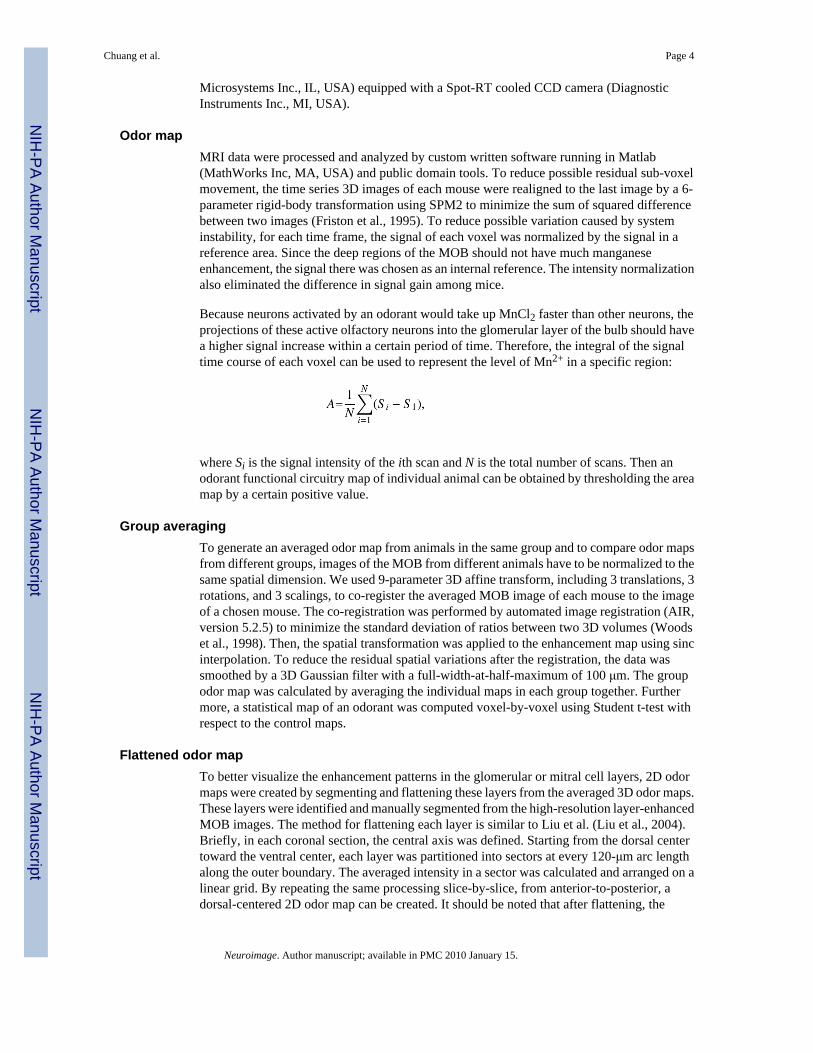
Odor mapMRI data were processed and analyzed by custom written software running in Matlab(MathWorks Inc, MA, USA) and public domain tools. To reduce possible residual sub-voxelmovement, the time series 3D images of each mouse were realigned to the last image by a 6-parameter rigid-body transformation using SPM2 to minimize the sum of squared differencebetween two images (Friston et al., 1995). To reduce possible variation caused by systeminstability, for each time frame, the signal of each voxel was normalized by the signal in areference area. Since the deep regions of the MOB should not have much manganeseenhancement, the signal there was chosen as an internal reference. The intensity normalizationalso eliminated the difference in signal gain among mice.
Because neurons activated by an odorant would take up MnCl2 faster than other neurons, theprojections of these active olfactory neurons into the glomerular layer of the bulb should havea higher signal increase within a certain period of time. Therefore, the integral of the signaltime course of each voxel can be used to represent the level of Mn2+ in a specific region:
where Si is the signal intensity of the ith scan and N is the total number of scans. Then anodorant functional circuitry map of individual animal can be obtained by thresholding the areamap by a certain positive value.
Group averagingTo generate an averaged odor map from animals in the same group and to compare odor mapsfrom different groups, images of the MOB from different animals have to be normalized to thesame spatial dimension. We used 9-parameter 3D affine transform, including 3 translations, 3rotations, and 3 scalings, to co-register the averaged MOB image of each mouse to the imageof a chosen mouse. The co-registration was performed by automated image registration (AIR,version 5.2.5) to minimize the standard deviation of ratios between two 3D volumes (Woodset al., 1998). Then, the spatial transformation was applied to the enhancement map using sincinterpolation. To reduce the residual spatial variations after the registration, the data wassmoothed by a 3D Gaussian filter with a full-width-at-half-maximum of 100 μm. The groupodor map was calculated by averaging the individual maps in each group together. Furthermore, a statistical map of an odorant was computed voxel-by-voxel using Student t-test withrespect to the control maps.
Flattened odor mapTo better visualize the enhancement patterns in the glomerular or mitral cell layers, 2D odormaps were created by segmenting and flattening these layers from the averaged 3D odor maps.These layers were identified and manually segmented from the high-resolution layer-enhancedMOB images. The method for flattening each layer is similar to Liu et al. (Liu et al., 2004).Briefly, in each coronal section, the central axis was defined. Starting from the dorsal centertoward the ventral center, each layer was partitioned into sectors at every 120-μm arc lengthalong the outer boundary. The averaged intensity in a sector was calculated and arranged on alinear grid. By repeating the same processing slice-by-slice, from anterior-to-posterior, adorsal-centered 2D odor map can be created. It should be noted that after flattening, the
Chuang et al. Page 4
Neuroimage. Author manuscript; available in PMC 2010 January 15.
NIH
-PA Author Manuscript
NIH
-PA Author Manuscript
NIH
-PA Author Manuscript

resolution was anisotropic with 100-μm in anterior-posterior and 120-μm in dorsal-ventraldirections.
Comparison of odor mapsTo compare the enhancement patterns of different odors, the flattened odor maps werethresholded at p < 0.005 (one-tail, uncorrected for multiple comparison). The boundaries ofthe enhancement were drawn. The distinct enhancement regions between odors were alsoidentified by t-test between the odor maps. Additionally, the flattened glomerular and mitralcell layers were divided into various clusters in a serpentine way from anterior-to-posterior.The averaged signal integral and t-score in each cluster were calculated. To compare thesimilarity of enhancement patterns between the glomerular and mitral cell layers, thecorrelation coefficient of the averaged signal enhancement and t-scores between thecorresponding clusters in the two layers were calculated. Since the shape and location ofclusters in the two layers were slightly different, in a few regions, two clusters were mergedto match the closest cluster in the other layer.
ResultsDetecting Odorant Responses in the MOB by MEMRI
Figure 1A shows time-series images of a coronal section of a mouse MOB acquired afterMnCl2 injection and exposure to 10% octanal for 20 min. The signal intensity in certain regionsof the glomerular layer increased continuously from 1 to 2 h and then remained elevated. Afterenhancement was seen in the glomerular layer, the mitral cell layer also became enhanced.Comparing the signal time courses in the glomerular layer and the central region of the MOBshows that the signal intensity in the glomerular layer increased during the first 2 h after theinjection (Figure 1B) while the signal in the center of MOB stayed at a constant level, showingno Mn2+ enhancement in this interval in deep layers of the MOB. Hence its signal can be usedas an internal reference for signal intensity normalization. When maps were generated lookingfor pixels that had significant negative going signal, very few pixels (data not shown) abovestatistical significance were detected indicating excellent stability of the MRI images and thatthe reference normalization was working.
Figure 1C shows the functional circuitry maps calculated from four mice that were exposed toacetophenone, carvone, octanal, and control, respectively. While few enhancement was seenin the control, all three odorants induced high enhancements at the interface between theolfactory nerve layer and olfactory turbinates (arrow in Figure 1C). This is where axons fromOSNs enter the MOB. The different odorants elicited a variation in the pattern of glomerularlayer enhancement. For example, as shown in Figure 1C, acetophenone enhanced more dorsalmedial and lateral areas; carvone enhanced more lateral and ventral medial areas; and octanalenhanced more lateral areas.
Comparison of Odorant Responses in the Glomerular LayerFigure 2 demonstrates the steps that were taken to register to a common template, segment theglomerular and mitral layers based on anatomical MEMRI, flatten each layer, and generategroup average functional circuitry maps. The affine transform effectively reduced thedifferences in positions and sizes of the MOBs among mice. The glomerular and mitral celllayers enhanced at 24 hours after intravenous administration of MnCl2 was readily detected(Figure 2B) to enable segmentation either manually or semi-automatically.
Figure 3A shows the dorsal-centered (indicated by dashed lines), group-averaged enhancementmaps in the glomerular layer under acetophenone, carvone, octanal, and clean air (control),respectively. The generally low signal increase in the control group indicates that without
Chuang et al. Page 5
Neuroimage. Author manuscript; available in PMC 2010 January 15.
NIH
-PA Author Manuscript
NIH
-PA Author Manuscript
NIH
-PA Author Manuscript
odorant stimulation, Mn2+ uptake and transport to the bulb was at a much lower level. Thesmall signal change detected on the lateral side of the control bulbs was likely due to the factthat this is where most of the axons from the OSNs enter into the bulb causing a detectibleelevation in Mn2+. By comparison with the control group, the three odorants produced signalchanges in different regions, mainly in the anterior, dorsal, lateral, and medial parts of theglomerular layer.
To eliminate possible bias in the averaged odor map, the t-score between odorant stimulationand the control was calculated (Figure 3B). These maps clearly showed patterns specific toeach odorant: acetophenone enhanced more dorsal and medial regions; carvone enhanced moreventral and anteriolateral regions; and octanal enhanced more lateral, medial posterior andsome dorsal posterior regions. Furthermore, the symmetrical enhancement patterns in themedial and lateral sides are consistent with the bilateral arrangement of similar glomeruli basedupon the molecular map (Lodovichi et al., 2003).
The spatial extents of the significantly enhanced regions (p < 0.005; one-tail, uncorrected) bythe three odorants were compared (Figure 4A). Acetophenone enhanced a smaller area thanthe other two odorants. Acetophenone and octanal had significant overlap in the dorsal regions.Carvone and octanal shared a similar distribution of enhancement pattern in the medial area.Carvone was the only odorant that enhanced a large portion of the ventral area. Comparing theaveraged t-score in the clusters in the glomerular layer (Figure 4B) showed that, in general,the enhancement levels of these odorants decreased gradually from anterior toward posteriorregions. Acetophenone and octanal had similar enhancement patterns in most of the anteriorclusters but with different signal changes. In contrast, carvone had higher enhancements inventral and posterior regions.
The distinctly enhanced regions by each odorant were also identified by t-test between the odormaps (Figure 4C). By thresholding the between-odor t-maps at p < 0.05 (one-tail, uncorrected),the area sizes of the significantly enhanced regions are: 12.0% (carvone > octanal), 9.6%(octanal > carvone), 6.0% (carvone > acetophenone), 0.5% (acetophenone > carvone), 12.3%(octanal > acetophenone), and 0.3% (acetophenone > octanal) of the area of the glomerularlayer.
MEMRI Detects Single GlomeruliFigure 5 shows a side-by-side comparison of individual MEMRI maps overlaid onto aprojection of the anatomical images with the fluorescent images obtained from excised bulbsafter the MRI experiments in three rI7→M71 mice. Due to the expression of GFP, two or threeectopic glomeruli can be identified on the dorsal surface of the MOB (Belluscio et al.,2002;Bozza et al., 2002). Since rI7→M71 glomeruli are not the only glomeruli that respondto octanal, more glomeruli were detected with MEMRI than fluorescence. Arrows indicate theexcellent correspondence between glomeruli detected with MEMRI and those that expressGFP. 79% (11 out of 14) of the GFP-expressing glomeruli in six rI7→M71 mice studied weredetected in the MEMRI maps. This indicates that MEMRI mapping of functional circuitry canbe performed at the level of single glomeruli.
Odorant Representation in the Mitral Cell Layer could be Mapped by MEMRIMn2+ can cross synapses and be transported into post-synaptic neurons, hence output neuronsassociated with enhanced glomeruli will also accumulate a larger quantity of Mn2+ enablingthe detection of functional circuitry into the mitral cell layer. Figure 6A shows examples ofMEMRI enhancement maps collected from three of the rI7→M71 transgenic mice. A focalenhancement was clearly observed at about 200 to 300 μm beneath the identified rI7→M71
Chuang et al. Page 6
Neuroimage. Author manuscript; available in PMC 2010 January 15.
NIH
-PA Author Manuscript
NIH
-PA Author Manuscript
NIH
-PA Author Manuscript
glomerulus (arrows in Figure 6A). The location and one-to-one correspondence suggest thatthe pattern of Mn2+ enhancement represents neural information flow into the mitral cell layer.
The flattened t-score maps of the odorants in the mitral cell layer in the wild-type mice (Figure6B) shows that although the signal change in the mitral cell layer was generally lower than thatin the glomerular layer, the two layers shared similar patterns of enhancement: acetophenoneenhanced more anterior dorsal and medial portions; carvone enhanced more laterally andventrally; and octanal enhanced dorsal and lateral areas. Detailed regional differences betweenodorants were compared in clusters (Figure 6C).Acetophenone and octanal had similardistributions while octanal had higher signal change in the anterior and dorsal regions. Carvonehad less enhancement in regions where octanal showed higher enhancements such as the dorsalregions, while causing greater enhancement in the ventral and posterior area.
The similarity between the glomerular layer and mitral cell layer maps was further evaluatedby correlating the profiles in the corresponding clusters shown in Figure 4B and 6C. Highcorrelation coefficients between the two layers were found under the same odorant (0.56, 0.63,and 0.53 for acetophenone, carvone, and octanal, respectively (p < 0.008)), but not betweendifferent odorants. In addition, the enhancement between the corresponding clusters of the twolayers showed similar linear trend among all the groups (Figure 7) with a fitted slope of 0.29(R2 = 0.60).
DiscussionDetection of Individual Glomeruli with MEMRI Functional Circuitry Maps
In this study, we demonstrated that Mn2+ can be used as a functional contrast agent for MRIto generate detailed maps of functional circuitry from both the glomerular and mitral cell layersof the mouse MOB non-invasively. Mn2+ enhanced loci detected after exposure to octanal werehighly co-localized with the GFP-expressing rI7→M71 glomeruli. These data clearly showthat MEMRI maps can be obtained at the resolution of specific layers and individual glomeruliin the mouse MOB. This represents the first direct comparison, within the same brain, of anMRI functional map with a marked anatomical structure that is known to be activated.
A single glomerulus, which is only about 50 – 100 μm in diameter in mice, is the smallestfunctional unit to be detected by MRI techniques. Previously, it was shown that fMRI canresolve activation of a single whisker barrel in rats (Yang et al., 1996), orientation columns incat visual cortex (Kim et al., 2000), ocular dominance columns in human visual cortex (Chenget al., 2001; Menon et al., 1997), and layers in rat somatosensory cortex (Silva and Koretsky,2002). However, because of the relatively low resolution and low contrast to noise combinedwith limitations on resolution associated with vascular regulation, none of these studies havesuccessfully resolved neural structures below ~200 μm isotropic resolution. Moreover, theyall relied on averaging the spatial extent of a neural structure either across the entire cortex oralong a specific layer.
Many imaging methods have been pursued to detect glomerular activity in rodents while onlya few of them can identify single glomeruli (Guthrie et al., 1993; Wachowiak and Cohen,2001). Studies using fMRI reported the detection of glomerular layer activation (Xu et al.,2000; Xu et al., 2003) but the resolution of these maps and extent of activation indicated thatinformation was from groups of glomeruli. Using the known responding odorant, octanal, ofrI7→M71 glomeruli and their known loci under fluorescent microscope in the transgenic mice,we validated the detection of single glomeruli and the detection sensitivity was estimated tobe about 0.8. The specificity was not estimated because many other glomeruli were alsoactivated by octanal (for example, it was estimated that 40–90 different receptors can respondto an odorant (Ma and Shepherd, 2000)) but their loci could not be identified. In some maps,
Chuang et al. Page 7
Neuroimage. Author manuscript; available in PMC 2010 January 15.
NIH
-PA Author Manuscript
NIH
-PA Author Manuscript
NIH
-PA Author Manuscript
only one of the paired rI7→M71 glomeruli was detected. This could be due to difficulties indisplaying the curved surface of the bulb as horizontal slices and simply missing the enhancedrI7→M71 glomerulus. Alternatively, it may be that the odorant presentation did not activateall glomeruli. The ability to image functional information form individual glomeruli from theentire bulb raises the very challenging problem of how to analyze and compare this informationfrom animal to animal. It is well known that glomeruli shift from animal to animal and thiswas clearly seen from the GFP labeled glomeruli in the rI7→M71 mice. Therefore, for furtheranalysis of group averaged maps smoothed data were used.
Implications of Glomerular EnhancementResults of the MEMRI odor mapping indicate many aspects of olfactory processing.Distributed but similar signal enhancement patterns were observed in the glomerular layer ofdifferent animals after exposure to the same odorant while different kinds of odorants enhanceddifferent glomerular patterns, showing that groups of glomeruli responded to individualodorants. This agrees with current understanding that individual odorants are coded by sets ofglomeruli and odorants with similar chemical structure activate similar glomeruli (Korsching,2002; Meister and Bonhoeffer, 2001; Rubin and Katz, 1999). The relatively symmetricenhancement between the medial and lateral sides of the glomerular layer is also in accordancewith the symmetric, stereotypic arrangement of glomerular pairs that receive projections fromOSNs expressing the same receptor gene (Lodovichi et al., 2003).
Detection of Enhancement in the Mitral Cell LayerBy receiving excitatory inputs from OSNs and inhibitory inputs from periglomerular cells, M/T cells refine and project odorant information to the primary olfactory cortex. Therefore, theactivity in the mitral cell layer represents the output of the MOB and is likely quite differentfrom the glomerular activity. Measuring activity to map odor representations in the mitral celllayer has been very challenging. For example, optical imaging-based methods are limited bylight penetration depth as well as interference from the glomerular layer which lies above themitral cell layer. As shown in Figure 6A, the corresponding foci in the mitral cell layer beneaththe rI7→M71 glomeruli indicates that Mn2+ moves very specifically into mitral cells in amanner consistent with the flow of neural information into the mitral cell layer. Inspecting thesignal time courses in those foci, the signal in the mitral cells increased almost at the same timeas the glomeruli. Mn2+ moves at rates consistent with it being transported by fast axonaltransport (Pautler et al., 1998), therefore, the time for Mn2+ to move the short distance fromthe glomerular layer to mitral cell layer is faster than the temporal resolution used. Fasterimaging methods will be needed to resolve the transport between layers.
There was excellent correlation between areas enhanced in the glomerular maps and areasenhanced in the mitral maps. Many specific glomeruli sending manganese to specific portionsof the mitral cell layer could be detected. However, it will require higher temporal and spatialmapping to make quantitative conclusions about the specific flow of Mn2+ at this level ofresolution. The data indicates that we can detect single glomeruli and the evidence of focalenhancement in the mitral cell layer has us optimistic this can be achieved. Furthermore, it hasbeen shown in olfactory tract tracing experiments that Mn2+ can be transported to the granulecell layer as well as the olfactory cortex when applied locally to the bulb (Chuang and Koretsky,2006; Pautler et al., 1998). Hence, it should be possible to map the representation beyond themitral cell layer.
Flow of Manganese Could Indicate Flow of Neural InformationThe process used in producing MEMRI odor maps represents an innovative way to makefunctional maps of neural systems. The ability to load a tract tracer into a specific neuralrepresentation based on activity is unique. The ability to quantify the flow of the tracer into
Chuang et al. Page 8
Neuroimage. Author manuscript; available in PMC 2010 January 15.
NIH
-PA Author Manuscript
NIH
-PA Author Manuscript
NIH
-PA Author Manuscript

anterograde regions and across synapses in a noninvasive manner is also unique. This new typeof functional connectivity map leads to several interesting questions about interpretation. Wepropose that the mapping strategy shows the most probable pathway of neural informationeven though the stimulus is not continuously applied throughout the mapping period. This isaccomplished using odorant induced activity to control where Mn2+ initially enters the system.Once introduced, the assumption is that Mn2+ accumulation in the anterograde direction willpreferentially highlight downstream pathways that are most strongly connected. Thisinterpretation is based on the fact that Mn2+ transport requires active synapses and theassumption that this transport will follow the flow of activity. Therefore, the maps neitherrepresent purely anatomical information nor moment-to-moment neural activity but rather acombination of both. Future work will be critical to relate what aspects of neural activity/neuroanatomy control the flow of Mn2+.
A major challenge in neuroscience is the ability to follow the path of information flowthroughout a specific neural system. For instance, electrodes can be used to measure localaction potentials and conventional tract tracers can be used to infer the paths of neuralinformation flow; however, it is very difficult to identify and record from neurons that areconnected even across one synapse in vivo (Sommer and Wurtz, 2004). Molecular genetictechniques can be envisioned that will accomplish some aspects of the MEMRI neuralinformation flow maps by combining techniques like c-Fos-driven fluorescent imaging ofactivity (Barth et al., 2004) and transneuronal tracer (Zou et al., 2001) under control of specificpromoters. However, an advantage of Mn2+ is that it requires functioning synapses to crossand thus has added information about functional neuronal connectivity and can be used in anyanimal model without requiring genetic manipulation.
Advantages of MEMRI Odor MappingUntil now, all other imaging methods for mapping glomerular activation typically involvefairly invasive procedures making it difficult to examine the same animal across a long periodof time. In this study, injected Mn2+ was easily absorbed by OSNs in the olfactory epithelium.Hence, there is no need to disturb the blood-brain barrier as in previous activity-inducedMEMRI experiments (Aoki et al., 2002; Lin and Koretsky, 1997). This noninvasive protocolwill provide many possibilities to study the progression of learning and development. Althoughthe temporal information of neural dynamics can not be resolved due to the slow transport andaccumulation of Mn2+, the detection of on-going signal enhancement after stimulation hasceased allows experiments to be performed in awake, normal behaving animals outside theMRI magnet. While there are some caveats associated with repeated imaging experiments suchas the lifetime of the Mn2+ in the bulb (2 to 3 weeks; data not shown), adjustments can be madeto reduce Mn2+ concentrations and shorten this period.
By comparing odorant-exposed groups and controls with a group t-test, the confounding effectsof background odorants that are common to both groups, such as anesthetic odor, can bereduced. Isoflurane has a very strong odor even at the low level (1%) used for this study. Thesmell of the anesthetic will likely activate OSNs and change Mn2+ uptake and enhancementpatterns in the bulb. However, since the anesthetic is similar in both the control and stimulationgroups, this confounding effect was removed by performing a t-test between groups.
Potential Shortcoming of MEMRI Functional Circuitry MapsOne major concern of using free Mn2+ as a contrast agent is its possible neurotoxicity (Barbeau,1984). Although the concentration used is low and produced no observable behavioralabnormalities, it is still possible that Mn2+ in the nostrils may cause damage to the OSNsthereby changing the resulting map. One way to ameliorate this problem is to use a lowerconcentration of Mn2+ together with a more sensitive T1 mapping sequence to compensate for
Chuang et al. Page 9
Neuroimage. Author manuscript; available in PMC 2010 January 15.
NIH
-PA Author Manuscript
NIH
-PA Author Manuscript
NIH
-PA Author Manuscript

the reduced signal contrast (Chuang and Koretsky, 2006). Another problem is the way ofdelivering Mn2+ may affect the observed maps because variations in the spread of Mn2+ in theconvoluted turbinates make it difficult to ensure that the Mn2+ solution reaches each zoneequally. One solution to this issue is to vaporize Mn2+ solution and allow the animal to breathethe contrast agent into the nose (Pautler and Koretsky, 2002).
ConclusionUsing the unique properties of Mn2+ which is taken up preferentially in active neurons andthen transported anterogradely across synapses, enables MRI to produce functionalconnectivity maps that are consistent with the flow of neural information from the OSNs tothe glomerular and mitral cell layers. These maps have sensitivity at the level of singleglomeruli and should allow tracing neural representations through different brain structures ina noninvasive manner in individual animals before and after manipulations that effect learning,plasticity, development, or degeneration.
AcknowledgementsWe would like to thank Dr. Peter Mombaerts for the rI7→M71 mice. Dr. Hellmut Merkle and Dr. Stephen J. Doddfor MRI hardware support. This research was supported by the Intramural Research Program of the NINDS, NIH.
ReferencesAoki I, Tanaka C, Takegami T, Ebisu T, Umeda M, Fukunaga M, Fukuda K, Silva AC, Koretsky AP,
Naruse S. Dynamic activity-induced manganese-dependent contrast magnetic resonance imaging(DAIM MRI). Magn Reson Med 2002;48:927–933. [PubMed: 12465100]
Aoki I, Wu YJ, Silva AC, Lynch RM, Koretsky AP. In vivo detection of neuroarchitecture in the rodentbrain using manganese-enhanced MRI. Neuroimage 2004;22:1046–1059. [PubMed: 15219577]
Barbeau A. Manganese and extrapyramidal disorders (a critical review and tribute to Dr. George C.Cotzias). Neurotoxicology 1984;5:13–35. [PubMed: 6538948]
Barth AL, Gerkin RC, Dean KL. Alteration of neuronal firing properties after in vivo experience in aFosGFP transgenic mouse. J Neurosci 2004;24:6466–6475. [PubMed: 15269256]
Belluscio L, Lodovichi C, Feinstein P, Mombaerts P, Katz LC. Odorant receptors instruct functionalcircuitry in the mouse olfactory bulb. Nature 2002;419:296–300. [PubMed: 12239567]
Bozza T, Feinstein P, Zheng C, Mombaerts P. Odorant receptor expression defines functional units inthe mouse olfactory system. J Neurosci 2002;22:3033–3043. [PubMed: 11943806]
Buck L, Axel R. A novel multigene family may encode odorant receptors: a molecular basis for odorrecognition. Cell 1991;65:175–187. [PubMed: 1840504]
Buck LB. Information coding in the vertebrate olfactory system. Annu Rev Neurosci 1996;19:517–544.[PubMed: 8833453]
Cheng K, Waggoner RA, Tanaka K. Human ocular dominance columns as revealed by high-fieldfunctional magnetic resonance imaging. Neuron 2001;32:359–374. [PubMed: 11684004]
Chuang KH, Koretsky A. Improved neuronal tract tracing using manganese enhanced magnetic resonanceimaging with fast T(1) mapping. Magn Reson Med 2006;55:604–611. [PubMed: 16470592]
Drapeau P, Nachshen DA. Manganese fluxes and manganese-dependent neurotransmitter release inpresynaptic nerve endings isolated from rat brain. J Physiol 1984;348:493–510. [PubMed: 6325673]
Friedrich RW, Korsching SI. Combinatorial and chemotopic odorant coding in the zebrafish olfactorybulb visualized by optical imaging. Neuron 1997;18:737–752. [PubMed: 9182799]
Friedrich RW, Korsching SI. Chemotopic, combinatorial, and noncombinatorial odorant representationsin the olfactory bulb revealed using a voltage-sensitive axon tracer. J Neurosci 1998;18:9977–9988.[PubMed: 9822753]
Friston KJ, Ashburner J, Frith CD, Poline JB, Heather JD, Frackowiak RSJ. Spatial registration andnormalization of images. Human Brain Mapping 1995;3:165–189.
Chuang et al. Page 10
Neuroimage. Author manuscript; available in PMC 2010 January 15.
NIH
-PA Author Manuscript
NIH
-PA Author Manuscript
NIH
-PA Author Manuscript

Guthrie KM, Anderson AJ, Leon M, Gall C. Odor-induced increases in c-fos mRNA expression revealan anatomical “unit” for odor processing in olfactory bulb. Proc Natl Acad Sci U S A 1993;90:3329–3333. [PubMed: 8475076]
Kauer JS, White J. Imaging and coding in the olfactory system. Annu Rev Neurosci 2001;24:963–979.[PubMed: 11520924]
Kim DS, Duong TQ, Kim SG. High-resolution mapping of iso-orientation columns by fMRI. NatNeurosci 2000;3:164–169. [PubMed: 10649572]
Koretsky AP, Silva AC. Manganese-enhanced magnetic resonance imaging (MEMRI). NMR Biomed2004;17:527–531. [PubMed: 15617051]
Korsching S. Olfactory maps and odor images. Curr Opin Neurobiol 2002;12:387–392. [PubMed:12139985]
Lee JH, Silva AC, Merkle H, Koretsky AP. Manganese-enhanced magnetic resonance imaging of mousebrain after systemic administration of MnCl2: dose-dependent and temporal evolution of T1 contrast.Magn Reson Med 2005;53:640–648. [PubMed: 15723400]
Lin YJ, Koretsky AP. Manganese ion enhances T1-weighted MRI during brain activation: an approachto direct imaging of brain function. Magn Reson Med 1997;38:378–388. [PubMed: 9339438]
Liu N, Xu F, Marenco L, Hyder F, Miller P, Shepherd GM. Informatics approaches to functional MRIodor mapping of the rodent olfactory bulb: OdorMapBuilder and OdorMapDB. Neuroinformatics2004;2:3–18. [PubMed: 15067166]
Lodovichi C, Belluscio L, Katz LC. Functional topography of connections linking mirror-symmetricmaps in the mouse olfactory bulb. Neuron 2003;38:265–276. [PubMed: 12718860]
Ma M, Shepherd GM. Functional mosaic organization of mouse olfactory receptor neurons. Proc NatlAcad Sci U S A 2000;97:12869–12874. [PubMed: 11050155]
Malnic B, Hirono J, Sato T, Buck LB. Combinatorial receptor codes for odors. Cell 1999;96:713–723.[PubMed: 10089886]
Meister M, Bonhoeffer T. Tuning and topography in an odor map on the rat olfactory bulb. J Neurosci2001;21:1351–1360. [PubMed: 11160406]
Menon RS, Ogawa S, Strupp JP, Ugurbil K. Ocular dominance in human V1 demonstrated by functionalmagnetic resonance imaging. J Neurophysiol 1997;77:2780–2787. [PubMed: 9163392]
Mombaerts P, Wang F, Dulac C, Chao SK, Nemes A, Mendelsohn M, Edmondson J, Axel R. Visualizingan olfactory sensory map. Cell 1996;87:675–686. [PubMed: 8929536]
Narita K, Kawasaki F, Kita H. Mn and Mg influxes through Ca channels of motor nerve terminals areprevented by verapamil in frogs. Brain Res 1990;510:289–295. [PubMed: 2158851]
Pautler RG, Koretsky AP. Tracing odor-induced activation in the olfactory bulbs of mice usingmanganese-enhanced magnetic resonance imaging. Neuroimage 2002;16:441–448. [PubMed:12030829]
Pautler RG, Mongeau R, Jacobs RE. In vivo trans-synaptic tract tracing from the murine striatum andamygdala utilizing manganese enhanced MRI (MEMRI). Magn Reson Med 2003;50:33–39.[PubMed: 12815676]
Pautler RG, Silva AC, Koretsky AP. In vivo neuronal tract tracing using manganese-enhanced magneticresonance imaging. Magn Reson Med 1998;40:740–748. [PubMed: 9797158]
Ressler KJ, Sullivan SL, Buck LB. Information coding in the olfactory system: evidence for a stereotypedand highly organized epitope map in the olfactory bulb. Cell 1994;79:1245–1255. [PubMed:7528109]
Rubin BD, Katz LC. Optical imaging of odorant representations in the mammalian olfactory bulb. Neuron1999;23:499–511. [PubMed: 10433262]
Sharp FR, Kauer JS, Shepherd GM. Local sites of activity-related glucose metabolism in rat olfactorybulb during olfactory stimulation. Brain Res 1975;98:596–600. [PubMed: 1182541]
Shipley, MT.; McLean, JH.; Ennis, M. Olfactory System. In: Paxions, G., editor. The Rat NervousSystem. Academic Press; 1995. p. 899-926.
Silva AC, Koretsky AP. Laminar specificity of functional MRI onset times during somatosensorystimulation in rat. Proc Natl Acad Sci U S A 2002;99:15182–15187. [PubMed: 12407177]
Chuang et al. Page 11
Neuroimage. Author manuscript; available in PMC 2010 January 15.
NIH
-PA Author Manuscript
NIH
-PA Author Manuscript
NIH
-PA Author Manuscript

Sloot WN, Gramsbergen JB. Axonal transport of manganese and its relevance to selective neurotoxicityin the rat basal ganglia. Brain Res 1994;657:124–132. [PubMed: 7820609]
Sommer MA, Wurtz RH. What the brain stem tells the frontal cortex. I. Oculomotor signals sent fromsuperior colliculus to frontal eye field via mediodorsal thalamus. J Neurophysiol 2004;91:1381–1402.[PubMed: 14573558]
Tjalve H, Mejare C, Borg-Neczak K. Uptake and transport of manganese in primary and secondaryolfactory neurones in pike. Pharmacol Toxicol 1995;77:23–31. [PubMed: 8532608]
Van der Linden A, Van Meir V, Tindemans I, Verhoye M, Balthazart J. Applications of manganese-enhanced magnetic resonance imaging (MEMRI) to image brain plasticity in song birds. NMRBiomed 2004;17:602–612. [PubMed: 15761949]
van der Zijden JP, Wu O, van der Toorn A, Roeling TP, Bleys RL, Dijkhuizen RM. Changes in neuronalconnectivity after stroke in rats as studied by serial manganese-enhanced MRI. Neuroimage. 2006inpress
Wachowiak M, Cohen LB. Representation of odorants by receptor neuron input to the mouse olfactorybulb. Neuron 2001;32:723–735. [PubMed: 11719211]
Woods RP, Grafton ST, Watson JD, Sicotte NL, Mazziotta JC. Automated image registration: II.Intersubject validation of linear and nonlinear models. J Comput Assist Tomogr 1998;22:153–165.[PubMed: 9448780]
Xu F, Kida I, Hyder F, Shulman RG. Assessment and discrimination of odor stimuli in rat olfactory bulbby dynamic functional MRI. Proc Natl Acad Sci U S A 2000;97:10601–10606. [PubMed: 10973488]
Xu F, Liu N, Kida I, Rothman DL, Hyder F, Shepherd GM. Odor maps of aldehydes and esters revealedby functional MRI in the glomerular layer of the mouse olfactory bulb. Proc Natl Acad Sci U S A2003;100:11029–11034. [PubMed: 12963819]
Yang X, Hyder F, Shulman RG. Activation of single whisker barrel in rat brain localized by functionalmagnetic resonance imaging. Proc Natl Acad Sci U S A 1996;93:475–478. [PubMed: 8552664]
Yang X, Renken R, Hyder F, Siddeek M, Greer CA, Shepherd GM, Shulman RG. Dynamic mapping atthe laminar level of odor–elicited responses in rat olfactory bulb by functional MRI. Proc Natl AcadSci U S A 1998;95:7715–7720. [PubMed: 9636216]
Zou Z, Horowitz LF, Montmayeur JP, Snapper S, Buck LB. Genetic tracing reveals a stereotyped sensorymap in the olfactory cortex. Nature 2001;414:173–179. [PubMed: 11700549]
Chuang et al. Page 12
Neuroimage. Author manuscript; available in PMC 2010 January 15.
NIH
-PA Author Manuscript
NIH
-PA Author Manuscript
NIH
-PA Author Manuscript
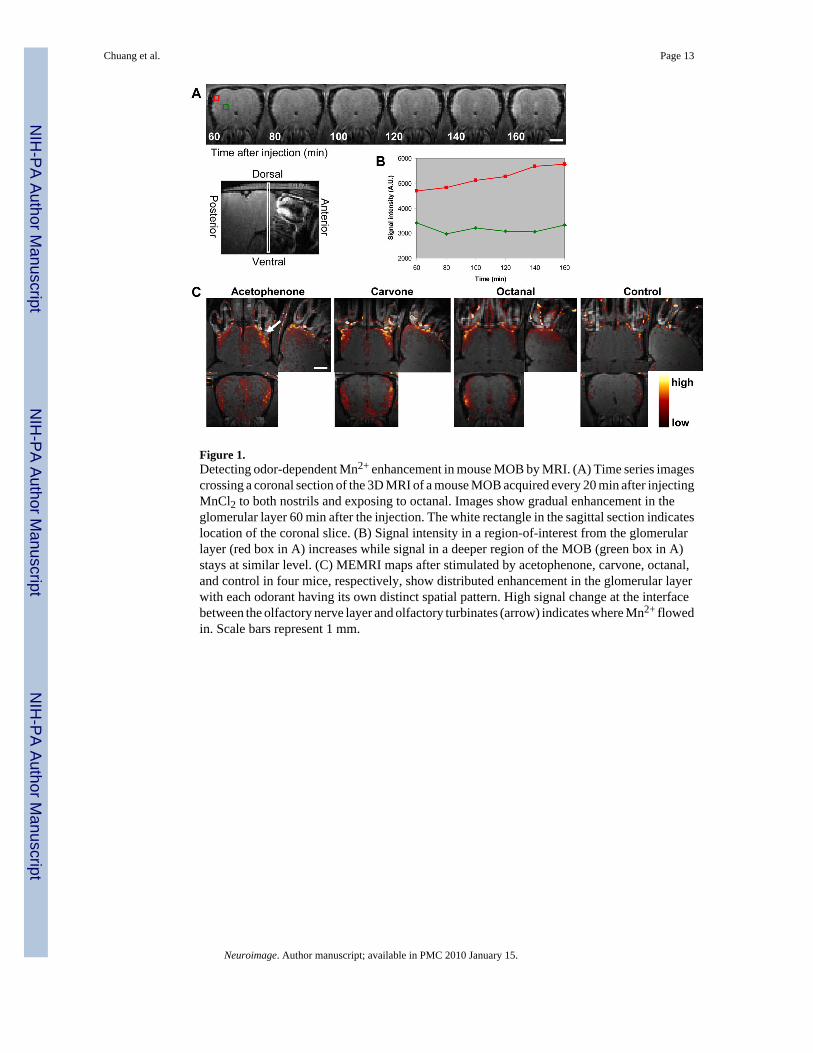
Figure 1.Detecting odor-dependent Mn2+ enhancement in mouse MOB by MRI. (A) Time series imagescrossing a coronal section of the 3D MRI of a mouse MOB acquired every 20 min after injectingMnCl2 to both nostrils and exposing to octanal. Images show gradual enhancement in theglomerular layer 60 min after the injection. The white rectangle in the sagittal section indicateslocation of the coronal slice. (B) Signal intensity in a region-of-interest from the glomerularlayer (red box in A) increases while signal in a deeper region of the MOB (green box in A)stays at similar level. (C) MEMRI maps after stimulated by acetophenone, carvone, octanal,and control in four mice, respectively, show distributed enhancement in the glomerular layerwith each odorant having its own distinct spatial pattern. High signal change at the interfacebetween the olfactory nerve layer and olfactory turbinates (arrow) indicates where Mn2+ flowedin. Scale bars represent 1 mm.
Chuang et al. Page 13
Neuroimage. Author manuscript; available in PMC 2010 January 15.
NIH
-PA Author Manuscript
NIH
-PA Author Manuscript
NIH
-PA Author Manuscript

Figure 2.Procedures for creating a flattened odor map in the glomerular layer: (A) co-registration, (B)segmentation, and (C) flattening of the segmented layer (Liu et al., 2004). The glomerular layerwas manually segmented from high-resolution MRI after systemic infusion of Mn2+ to enhancethe layers in the MOB. Both the glomerular layer (Gl) and mitral cell layer (Mi) were enhancedwhile other layers such as olfactory nerve layer (ON), external plexiform layer (EPl), and,granular cell layer (GrO) were darker. Please see materials and methods for details on creationof a dorsal centered map in the glomerular layer.
Chuang et al. Page 14
Neuroimage. Author manuscript; available in PMC 2010 January 15.
NIH
-PA Author Manuscript
NIH
-PA Author Manuscript
NIH
-PA Author Manuscript

Figure 3.Group odor maps in the glomerular layer. (A) The dorsal-centered (black dashed lines)glomerular maps of acetophenone (n = 6), carvone (n = 5), octanal (n = 8), and control (n = 7)by averaging the maps in each group. (B) T-score maps of acetophenone, carvone, octanalshow significantly enhanced regions common to each odorant.
Chuang et al. Page 15
Neuroimage. Author manuscript; available in PMC 2010 January 15.
NIH
-PA Author Manuscript
NIH
-PA Author Manuscript
NIH
-PA Author Manuscript

Figure 4.Distributed manganese enhancement in the glomerular layer. (A) Contours of the significantlyenhanced regions (p < 0.005, one-tailed t-test) by acetophenone (red), carvone (green), andoctanal (blue). (B) For better comparing regional differences between odorants, the glomerularlayer was divided into about 30 clusters that were arranged from anterior-to-posterior in aserpentine way. The averaged t-score in each cluster was plotted against the cluster number.(C) The between-odor t-score maps show significant differences between odorants. (AP:acetophenone; CV: carvone; OCT: octanal.)
Chuang et al. Page 16
Neuroimage. Author manuscript; available in PMC 2010 January 15.
NIH
-PA Author Manuscript
NIH
-PA Author Manuscript
NIH
-PA Author Manuscript

Figure 5.Detection of single glomeruli confirmed by rI7→M71 mice. (A) Horizontal sections ofMEMRI maps of rI7→M71 mice overlaid on the projection of the T1-weighted images tomimic the view of the optical images. (B) Fluorescent images acquired in the same animalsshow the GFP-labeled rI7→M71 glomeruli. Usually two rI7→M71 glomeruli were observed,with one on each MOB. Images from three mice are shown and each row is from the samemouse. The scale bar represents 1 mm.
Chuang et al. Page 17
Neuroimage. Author manuscript; available in PMC 2010 January 15.
NIH
-PA Author Manuscript
NIH
-PA Author Manuscript
NIH
-PA Author Manuscript

Figure 6.Odor maps in the mitral cell layer. (A) Coronal and sagittal sections of MEMRI maps fromthree rI7→M71 mice (the top two views are from one mouse, the lower left view from another,and the lower right view from the other). Focal enhancements were identified at about 300μm beneath the rI7→M71 glomeruli (arrows). (B) Dorsal-centered, flattened t-score maps inthe mitral cell layer comparing the odorant stimulation groups (acetophenone, carvone, andoctanal) with the control group in the wild-type mice. (C) Averaged t-scores in clusters arrangedfrom anterior to posterior. The scale bar represents 1 mm.
Chuang et al. Page 18
Neuroimage. Author manuscript; available in PMC 2010 January 15.
NIH
-PA Author Manuscript
NIH
-PA Author Manuscript
NIH
-PA Author Manuscript

Figure 7.The scatter plot of average signal integrals (SI) in the corresponding clusters between theglomerular layer and mitral cell layer.
Chuang et al. Page 19
Neuroimage. Author manuscript; available in PMC 2010 January 15.
NIH
-PA Author Manuscript
NIH
-PA Author Manuscript
NIH
-PA Author Manuscript
Related Documents