Manchester Monitor Quarterly Decline in unemployment continues Increase in business start-ups Service sector expected to drive growth Visitor economy buoyant House prices on the rise Crime volumes increase www.neweconomymanchester.com [email protected] January 2015 Forecasting Greater Manchester’s Future Prospects

Welcome message from author
This document is posted to help you gain knowledge. Please leave a comment to let me know what you think about it! Share it to your friends and learn new things together.
Transcript

Manchester Monitor Quarterly
Decline in unemployment continues
Increase in business start-ups
Service sector expected to drive growth
Visitor economy buoyant
House prices on the rise
Crime volumes increase
January 2015
Forecasting Greater Manchester’s
Future Prospects

1 | Manchester Monitor – January 2015
This issue of the Manchester Monitor Quarterly includes a
detailed feature on the latest results from the 2014 edition
of the Greater Manchester Forecasting Model (GMFM). The
focus is on which sectors are expected to lead Greater
Manchester’s (GM) employment growth over the next
decade, which industries will contribute towards increased
economic output and how the conurbation’s occupational
structure will change up to 2024.
From an employment perspective, business, financial &
professional services and the cultural & creative industries
are expected to be the largest contributors to jobs growth in
GM over the next decade – with almost 88,000 new
opportunities being created in the these sectors. The long-
term decline in manufacturing employment is still evident,
although manufacturing’s contribution towards economic
output is expected to grow considerably up to 2024 as the
sector becomes ever more productive in order to remain
globally competitive. Analysis of GM’s sector specialisation
reveals that it is performing well in traditional industries, and
also in a number of sub-sectors associated with business,
financial and professional services.
The latest Business Demography dataset released by the
Office for National Statistics (ONS) shows there was a sharp
rise in the number of start-ups in GM between 2012 and
2013. There were 14,705 new businesses started in GM in
2013, a substantial increase of 3,850 (35.5%) on the 10,855
business births in 2012. Business deaths in GM were
recorded at 10,005 in 2013, an annual decline of 510 (4.9%).
For the third year in succession, the number of births
exceeded the number of deaths and this means that net
change in GM in 2013 was 4,700. GM’s business start-up
rate has increased over time. In 2013 there were 84 new
business starts per 10,000 resident working age population,
up from 55 in 2009. The 2013 figure was also virtually in line
with the UK average of 85 new starts per 10,000 working
age residents.
Turning to look at the regular data on the labour market, the
latest unemployment figures from the Department for Work
and Pensions (DWP) show further reductions in the number
of people claiming Jobseeker’s Allowance (JSA) in GM.
Current JSA data show that around 38,100 people – or 2.2%
of the working age population – were claiming JSA in GM in
November 2014. This represents a decrease of 27,300
(41.7%) when compared with the figure 12 months
previously. Looking at a combined estimate for both JSA and
Universal Credit (UC) claimants, the number of people
claiming JSA or UC in GM in November 2014 was 45,400,
representing an annual decline of 32.9%. This is less than
the 41.7% decline for JSA claimants, although it still
represents a substantial fall over 12 months and highlights
the ongoing economic recovery.
The visitor economy in GM continues to perform well, with
hotel occupancy rates recorded at 83.6% for GM and 87.1%
for Manchester city centre for November 2014. When
December figures are released, they are expected to show
that 2014 was the strongest performing year to date in terms
of occupancy levels. There are also encouraging signs for
2015, with Manchester hosting 40 national and international
conferences that are expected to bring 34,000 delegates to
the city and generate £61million for the local economy.
Manchester Airport handled more than 2 million passengers
in October 2014, 128,200 (6.8%) more than 12 months
previously. With passenger numbers close to reaching 22
million on a rolling 12 month basis, a figure not achieved
since 2007, it was reported in December that the Airport is
aiming to double the annual number of passengers by 2036.
The latest data from the Land Registry show that the average
house in GM cost £108,400 in November 2014, an increase
of 4.5% (£4,600) from this time last year, but slightly below
the annual rise of 7.1% (£11,700) in house prices for England
& Wales. In terms of properties sold, house sales in GM grew
by 16.4% (418) between September 2013 and 2014. This is
proportionally more than in the North West and nationally,
where house sales have risen 10.0% and 5.0% respectively
on an annual basis.
On the crime front, the latest data from GM Police show an
increase of 8.2% (14,800) in the number of reported crimes
in the year ending December 2014, to 194,400 reported
offences. Within this total, victim-based crimes (stealing,
criminal damage & arson, violence and sexual offences) saw
175,200 cases recorded over the same period, representing
an annual increase of 8.3%. The latest figures from GM Fire
& Rescue Service show a 24.3% reduction in the total
volume of deliberate fires in GM for the 12 months to
December 2014.
Monitor FocusForecasting Greater Manchester’s Future Prospects

Manchester Monitor – January 2015 | 2
Monitor Dashboard
Jobseeker’s Allowance (JSA) claimants
41.7%since last year
Number of businesses started in GM in 2013
14,705new jobs forecast to be
created over next ten years
House Prices
4.5%
since November 2013
Airport Passengers
6.8%
since October 2013
Hotel Occupancy
1.0%pts
since November 2013
Crime
8.2%
since December 2013
3 | Manchester Monitor – January 2015
JSA Claimants
Around 2.2% of the resident working age population in GM
were claiming JSA in November. The rate remains marginally
higher than the North West (2.1%) and Great Britain (2.0%).
The number of male JSA claimants in GM fell on a monthly
basis by 8.3% (2,200) to 24,200, and similarly, female
claimants fell by 9.5% (1,500) over the month to 13,900. On
an annual basis both male and female claimants continue to
decrease – down by 18,500 (43.3%) and 8,700 (38.6%)
respectively.
Long-term JSA claimants (6 months+) in GM in November
2014 were 17,400, representing an annual decline of 42.8%
(13,000). This was above the regional (38.8%) and national
falls (36.2%).
Youth unemployment (JSA claimants aged 16-24) in GM fell
on an annual basis between November 2013 and 2014,
decreasing by approximately 8,900 (54.0%) to 7,600.
Universal Credit
Data sourced from the Department for Work and Pensions
(DWP) show that there were 10,400 people claiming UC in
November 2014. These people are not included in JSA
claimant count statistics, meaning that analysing the
unemployment outlook based purely on trends in JSA
claimants may look more flattering than it actually is.
At a UK level, the DWP data show that around 70.0% of
people claiming UC are not in employment. Assuming similar
trend in GM and that these people would otherwise be
claiming JSA in the absence of UC would add 7,300 people
to the JSA figure for GM. This gives a combined JSA/UC
total of over 45,400 in November 2014.
People MonitorDecline in unemployment continues
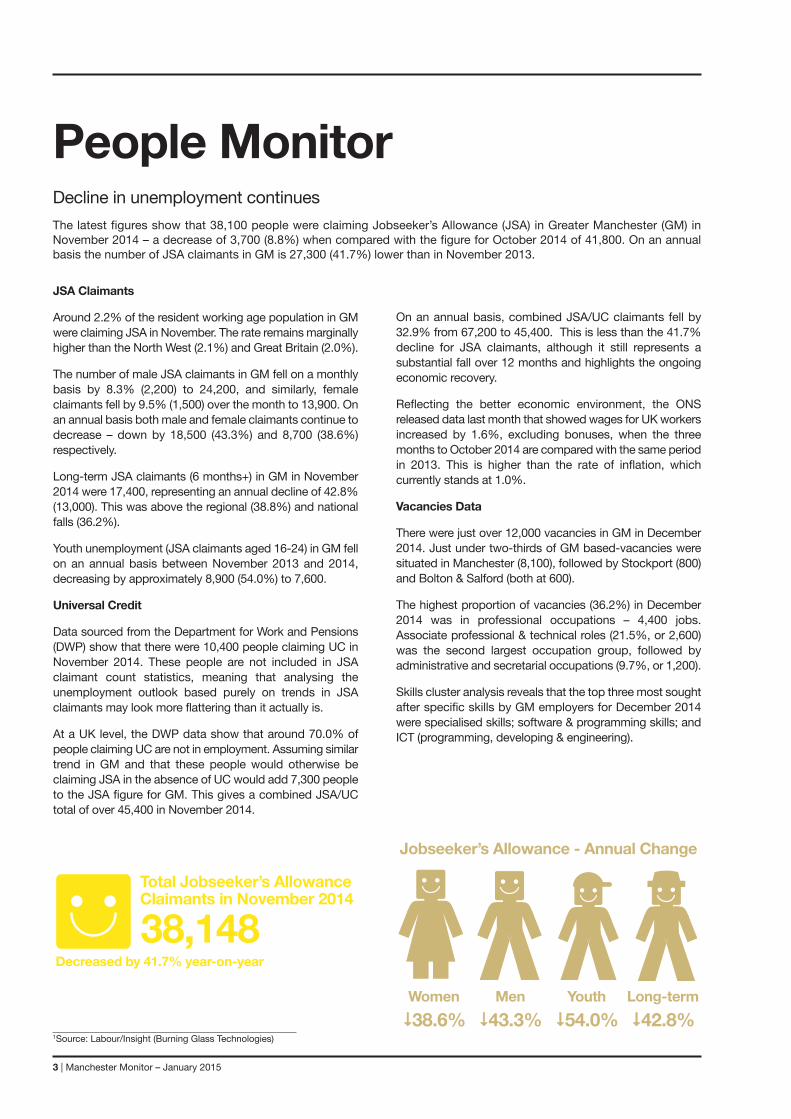
The latest figures show that 38,100 people were claiming Jobseeker’s Allowance (JSA) in Greater Manchester (GM) inNovember 2014 – a decrease of 3,700 (8.8%) when compared with the figure for October 2014 of 41,800. On an annualbasis the number of JSA claimants in GM is 27,300 (41.7%) lower than in November 2013.
Total Jobseeker’s Allowance Claimants in November 2014
38,148Decreased by 41.7% year-on-year
Jobseeker’s Allowance - Annual Change
Women
$38.6%
Men
$43.3%
Youth
$54.0%
Long-term
$42.8%1Source: Labour/Insight (Burning Glass Technologies)
On an annual basis, combined JSA/UC claimants fell by
32.9% from 67,200 to 45,400. This is less than the 41.7%
decline for JSA claimants, although it still represents a
substantial fall over 12 months and highlights the ongoing
economic recovery.
Reflecting the better economic environment, the ONS
released data last month that showed wages for UK workers
increased by 1.6%, excluding bonuses, when the three
months to October 2014 are compared with the same period
in 2013. This is higher than the rate of inflation, which
currently stands at 1.0%.
Vacancies Data
There were just over 12,000 vacancies in GM in December
2014. Just under two-thirds of GM based-vacancies were
situated in Manchester (8,100), followed by Stockport (800)
and Bolton & Salford (both at 600).
The highest proportion of vacancies (36.2%) in December
2014 was in professional occupations – 4,400 jobs.
Associate professional & technical roles (21.5%, or 2,600)
was the second largest occupation group, followed by
administrative and secretarial occupations (9.7%, or 1,200).
Skills cluster analysis reveals that the top three most sought
after specific skills by GM employers for December 2014
were specialised skills; software & programming skills; and
ICT (programming, developing & engineering).

Manchester Monitor – January 2015 | 4
There were 14,705 new businesses started in GM in 2013, a
substantial increase of 3,850 (35.5%) on the 10,855 business
births in 2012. At a UK level, the number of business births
increased by 28.5% from 270,000 to 346,000.
As noted by ONS, the rise coincides with the new Pay As
You Earn (PAYE) Real Time Information (RTI) system, which
was rolled out across businesses during 2013. Nonetheless,
the increase in start-ups is a positive sign that the economy
is continuing in its recovery from the downturn.
Business deaths in GM were recorded at 10,005 in 2013, an
annual decline of 510 (4.9%). For the third year in
succession, the number of births exceeded the number
of deaths and this means that net change in GM in 2013
was 4,700.
GM’s business start-up rate has increased over time. In 2013
there were 84 new business starts per 10,000 resident
working age population, up from 55 in 2009. The 2013 figure
was also virtually in line with the UK average of 85 new starts
per 10,000 resident working age population.
The ONS Business Demography dataset also provides
information on survival rates of firms and this reveals that:
• The 1-year survival rate of firms started in 2012 in GM is
91.9%, slightly above the UK average of 91.2% and
also London (89.7%).
• The 5-year survival rate for companies in GM (those
started in 2008) is 38.7%, which is below the UK average
of 41.3%, but higher than London (37.1%).
Increase in business start-ups
The latest Business Demography dataset released by the Office for National Statistics (ONS) shows there was a sharp rise in thenumber of start-ups in GM between 2012 and 2013. The number of business failures in the conurbation in recent years has remainedbroadly consistent, while start-ups have been increasing over the last three years.
9,520 9,310 10,595 10,855
14,705
12,070 10,605
9,595 10,515 10,005
-2,550 -1,295
1,000 340
4,700
-4,000
0
4,000
8,000
12,000
16,000
2009 2010 2011 2012 2013
Births Deaths Net Change
Business MonitorBusiness births and deaths in GM, 2009-13
5 | Manchester Monitor – January 2015
Results from the latest release of the GM Forecasting Model
(GMFM – December 2014) give an indication of expected
long-term trends in the economy. GMFM is produced by
Oxford Economics for New Economy on behalf of the 10 GM
local authorities, and this month’s quarterly feature provides
more detailed analysis of the forecasts. The focus is on
identifying sectors which are expected to lead employment
growth, the industries which will contribute towards
increased economic output and how the conurbation’s
occupational structure will change up to 2024.
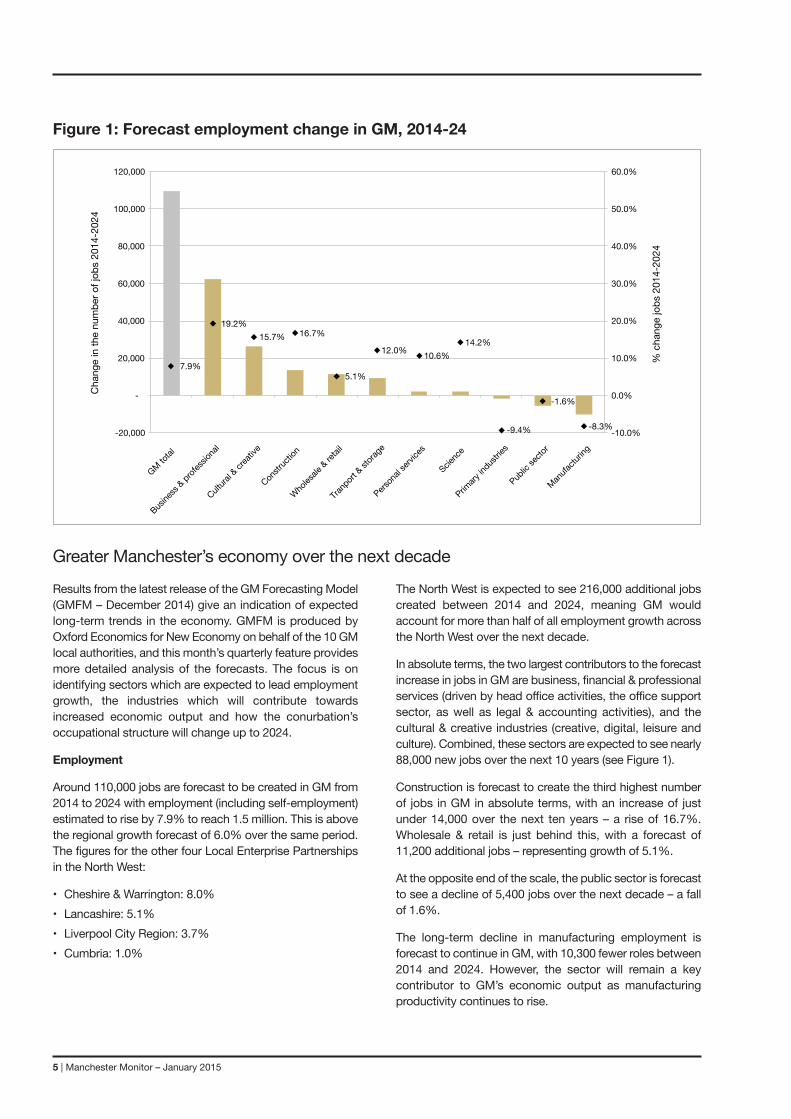
Employment
Around 110,000 jobs are forecast to be created in GM from
2014 to 2024 with employment (including self-employment)
estimated to rise by 7.9% to reach 1.5 million. This is above
the regional growth forecast of 6.0% over the same period.
The figures for the other four Local Enterprise Partnerships
in the North West:
• Cheshire & Warrington: 8.0%
• Lancashire: 5.1%
• Liverpool City Region: 3.7%
• Cumbria: 1.0%
The North West is expected to see 216,000 additional jobs
created between 2014 and 2024, meaning GM would
account for more than half of all employment growth across
the North West over the next decade.
In absolute terms, the two largest contributors to the forecast
increase in jobs in GM are business, financial & professional
services (driven by head office activities, the office support
sector, as well as legal & accounting activities), and the
cultural & creative industries (creative, digital, leisure and
culture). Combined, these sectors are expected to see nearly
88,000 new jobs over the next 10 years (see Figure 1).
Construction is forecast to create the third highest number
of jobs in GM in absolute terms, with an increase of just
under 14,000 over the next ten years – a rise of 16.7%.
Wholesale & retail is just behind this, with a forecast of
11,200 additional jobs – representing growth of 5.1%.
At the opposite end of the scale, the public sector is forecast
to see a decline of 5,400 jobs over the next decade – a fall
of 1.6%.
The long-term decline in manufacturing employment is
forecast to continue in GM, with 10,300 fewer roles between
2014 and 2024. However, the sector will remain a key
contributor to GM’s economic output as manufacturing
productivity continues to rise.
Greater Manchester’s economy over the next decade
7.9%
19.2% 15.7% 16.7%
5.1%
12.0% 10.6% 14.2%
-9.4%
-1.6%
-8.3% -10.0%
0.0%
10.0%
20.0%
30.0%
40.0%
50.0%
60.0%
-20,000
-
20,000
40,000
60,000
80,000
100,000
120,000
GM total
Busines
s & prof
ession
al
Cultural
& creat
ive
Constr
uction
Wholes
ale & re
tail
Tranp
ort & sto
rage
Person
al serv
ices
Science
Primary
indust
ries
Public
sector
Manufac
turing
% c
hang
e jo
bs 2
014-
2024
Chan
ge in
the
num
ber o
f job
s 201
4-20
24
Figure 1: Forecast employment change in GM, 2014-24

Manchester Monitor – January 2015 | 6
Gross Value Added
GM’s gross value added (GVA) currently stands at £54.7bn
and is forecast to grow by 31.6% (£17.3bn) to £72bn in
2024. The forecasts suggest that business, financial and
professional services will experience the largest rise in
economic output from 2014 to 2024 at £7.3bn – growing
from £15.5bn to £22.9bn.
It is important to note that while manufacturing is forecast
to see a fall in total employment, its importance to GM in
terms of economic output is still expected to grow, with its
GVA contribution increasing by £2bn from 2014 to 2024.
In order to establish GM’s economic strengths, Figure 2
looks at sectors in more detail and provides a specialisation
index (SI), which is calculated by dividing the share of GVA
in a particular sector in GM by the UK share. A value below
1 for a sector means that relatively, its GVA in GM is
lower than in the UK, while a value of above 1 shows
a concentration. High values on the index can be
regarded as a potential indication for the existence of
agglomeration/urbanisation economies, i.e. external benefits
to firms based on their geographic co-location in an area.
The highest degree of specialisation is observed in the
textiles sector, with an SI of 3.5 (not shown on the chart),
meaning the sector’s GVA in GM is 3.5 times higher than UK
average. Textiles falls within the wider manufacturing sector,
which has an SI of 1.2. Legal & accounting (1.4), office
support (1.3), water & air transport (1.3), postal services (1.3),
insurance (1.2), and employment services (1.2) also exhibit
stronger concentrations in GM than in the national average.
Manufacturing
Construction
Wholesale Retail
Water & air transport Postal & courier
Accommodation
Food & beverage services Publishing & Broadcasting
ICT
Financial services
Insurance
Real estate
Legal and accounting Head offices
Advertising & market research
Employment activities Office support
Public administration
Education
Health
Culture & Sports
0.0%
2.0%
4.0%
6.0%
8.0%
10.0%
12.0%
14.0%
0.5 0.6 0.7 0.8 0.9 1.0 1.1 1.2 1.3 1.4 1.5
Sect
oral
% o
f GM
's GV
A
Index of Specialisation
Architecture & Engineering
Figure 2: Specialisation Index for Greater Manchester 2014

7 | Manchester Monitor – January 2015
Occupational Structure
In line with results from the 2013 GMFM, the forecasts for
2014 again suggest that an increasing number of roles will
be created at both the high and low ends of the skills
spectrum in GM over the next 10 years.
For higher-skilled roles, managerial & senior official roles in
GM are forecast to grow by 6.7% over the next 10 years, as
well as for associate professional & technical occupations.
This is followed by professional roles at 5.9% (see Figure 3).
At the lower end of the skills spectrum, personal services are
forecast to rise by 7.3%, followed by elementary
occupations (5.5%) and then sales & customer roles (5.3%).
Intermediate level occupations are expected to either show
a smaller increase or decline between 2014 and 2024.
Skilled trades as well as administrative and secretarial roles
are forecast to grow by 1.5%, while process, plant &
machine operative roles are forecast to decline by 1.7%,
which is consistent with the forecast for a decline in the
numbers of jobs in manufacturing.
The trends suggested by GMFM continue to indicate that
the GM labour market is being reshaped and that jobs are
being created at the top and bottom of the skills scale, while
those in the middle tier are being squeezed. This could have
implications for the distribution of income of the GM working
population.
5.5%
5.3%
7.3%
-1.7%
1.5%
1.5%
6.7%
5.9%
6.7%
Elementary
Sales & customer service
Personal service
Process, plant & machine operatives
Skilled trades
Administrative & secretarial
Associate professional & technical
Professional
Managers and senior officials
Fore
cast
Cha
nge
in Oc
cupa
tions
in G
M, 2
014-
24 (%
)
Intermediate Skill
High Skill
Low Skill
Figure 3: Forecast Change in GM’s Occupational Structure, 2014–24
Summary
From an employment perspective, business, financial and
professional services (driven both by head office activities,
the office support sector as well as legal & accounting), and
the cultural & creative industries are expected to be the
largest contributors to jobs growth in GM over the next 10
years – with almost 88,000 new opportunities being created
in the two sectors. In addition, they are expected to see GVA
grow by more than £9.6bn over the next decade.
Analysis of GM’s sector specialisation reveals that while it is
performing well in traditional industries, and also in a number
of sub-sectors associated with business, financial and
professional services.
The long-term decline in manufacturing employment is still
evident, although the sector’s contribution towards
economic output is expected to grow considerably to 2024,
due to increases in productivity.
The 2014 GMFM results also suggest that an increasing
number of roles in the conurbation will be created at the
higher and lower ends of the skills ladder in GM over the next
10 years, with fewer at intermediate levels. This is likely to
impact on the type of job opportunities that become
available in GM and significantly, on the level of qualifications
people need in order to access them.

Manchester Monitor – January 2015 | 8
Place MonitorVisitor economy remains buoyant
The hotel occupancy indicator continues to perform well and with one set of figures still to come for December, 2014 is
looking like it will be the strongest performing year on record. In addition to strong hotel occupancy levels, the latest monthly
data from the Civil Aviation Authority show passenger numbers are still growing at Manchester Airport.
% represents year-on-year change
Airport passenger numbers (+6.8%)
2,007,549
Hotel Occupancy
The average hotel occupancy rate in Manchester city centre
was recorded at 87.1% in November 2014, consistent with
the same month last year.
Weekend occupancy in the city centre reached the highest
on record for the month at 93.9%, a 1.2 percentage point
increase on the November 2013 figure of 92.7%. The
weekday average occupancy in the city centre was 83.0%,
comparable with the 83.2% recorded for November 2013.
For GM as a whole, average occupancy rates in November
were 83.6%, a rise of 1 percentage point compared to 2013.
Key dates for hotel occupancy in the city centre during
November were:
• 15 November – occupancy of 99% was achieved on the
opening weekend of the Christmas markets, John Bishop
performed at the Manchester Arena and a number of
exhibitions were hosted in the city.
• 29 November – 99% occupancy was also recorded when
Manchester United played at Old Trafford, Enrique Iglesias
performed at the Manchester Arena and the National
Cycling Centre hosted a BMX track event.
• 25 November – 99% was reached when the Etihad
Stadium hosted a UEFA Champions League match and
Manchester Central hosted a 900-delegate conference
relating to the energy sector.
When December figures are released, they are expected to
show that 2014 was the strongest performing year to date
in terms of occupancy levels. There are also encouraging
signs for 2015, with Manchester hosting 40 national and
international conferences that are expected to bring 34,000
delegates to the city and generate £61million for the local
economy. Events include the Conservative Party Conference
and Soccerex Global Convention.
Airport Passenger Numbers
Manchester Airport handled more than 2 million passengers
in October 2014, 128,200 (6.8%) more than 12 months
previously. The annual growth was higher than that
experienced by Birmingham (5.8%) and Heathrow (0.4%),
while Stansted (16.8%) and Gatwick (7.8%) experienced
higher year-on-year rises in passenger numbers.
With passengers numbers close to reaching 22 million on a
rolling 12 month basis, a figure not achieved since 2007, it
was reported in December that the Airport is aiming to
double the annual number of passengers by 2036.
In the shorter term, a number of new routes should help
support growth at the Airport. This includes the launch of the
first non-stop direct flight to China (Hong Kong), operated
by Cathay Pacific, which began last month.
Increased frequencies on existing routes have also been
announced, including:
• An increased capacity of 8,000 seats in the summer
between Manchester and North America on Virgin routes
to and from Orlando and Las Vegas.
• An increased number of flights per week from February on
the Manchester to Doha route operated by Qatar Airways.
• An increased capacity of 48,000 seats per year on the
Emirates service to Dubai
IMPORTANT NOTE: The source of the hotel occupancy data referenced in this newsletter is STR Global Ltd.
Republication or other reuse of this data without the express written permission of STR Global is strictly prohibited.
Hotel occupancy (city centre) (0% pts)
87.1%Flights (1.5%)
14,803Hotel occupancy (GM) (+1.0% pts)
83.6%

9 | Manchester Monitor – January 2015
Housing Monitor
House prices on the rise again
House prices in GM have grown year-on-year, based on analysis of the latest data sourced from the Land Registry. The
cost of a property in GM increased more than in the North West as a whole, but at a lower rate than in England & Wales.
The average property in GM cost £108,400 in October 2014,
up slightly on the previous month’s figure of £108,300. On
an annual basis, the average cost of a property in GM is
4.5% (£4,600) higher than it was in October 2013. This
means that year-on-year prices in GM have now risen for 13
consecutive months.
The annual increase in GM was above the 3.1% rise in the
North West, however it was below the increase for England
and Wales of 7.1%. Nationally, the cost of an average
property now stands at £176,600.
All GM districts except for Tameside recorded annual
increases in house prices from November 2013-14. On a
relative basis, Trafford (9.8%) and Salford (7.8%)
experienced the highest rises.
House sales data from the Land Registry show that there
were a total of 2,964 properties sold in GM in September
2014, an increase of 418 units (16.4%) over the same period
a year earlier. This was a higher figure than across England
and Wales (5.0%), and well above the regional increase of
10.0%.
Nationally, figures released by Halifax reveal that the number
of first-time buyers climbing on to the property ladder rose
by more than a fifth in 2014 to a seven-year high. In its
review, Halifax said the number of buyers joining the UK
property market for the first time jumped by 22% to 326,500
in 2014, following a 23% increase in 2013.
Looking ahead, the Centre for Economics and Business
Research (CEBR) has forecast that house prices will fall by
0.6% across Britain this year. CEBR said factors such as the
threat of higher interest rates, the May general election will
send the market into reverse in 2015 – including in London.
9.8%
5.0%
3.6% 4.5%
2.8%
7.8%
3.5% 4.5%
-1.2%
3.0% 3.3%
-2.0%
0.0%
2.0%
4.0%
6.0%
8.0%
10.0%
12.0%
£-
£50,000
£100,000
£150,000
£200,000
£250,000
Traffo
rd
Stockp
ort
Bury
GM
Manches
ter
Salford
Wigan
Rochd
ale
Tamesi
de Bolt
on
Oldham
Average House Price, November 2014 % change, November 2013-November 2014
Average house prices and % change in GM boroughs, 2013-14
Manchester Monitor – January 2015 | 10
Crime Monitor
28,211
3,105
27,834
38,027
4,455
28,956
0
5,000
10,000
15,000
20,000
25,000
30,000
35,000
40,000
Violence Sexual Offences Criminal Damage & Arson
Sep-13 Sep-14
+24.8%
+43.5%
+4.0%
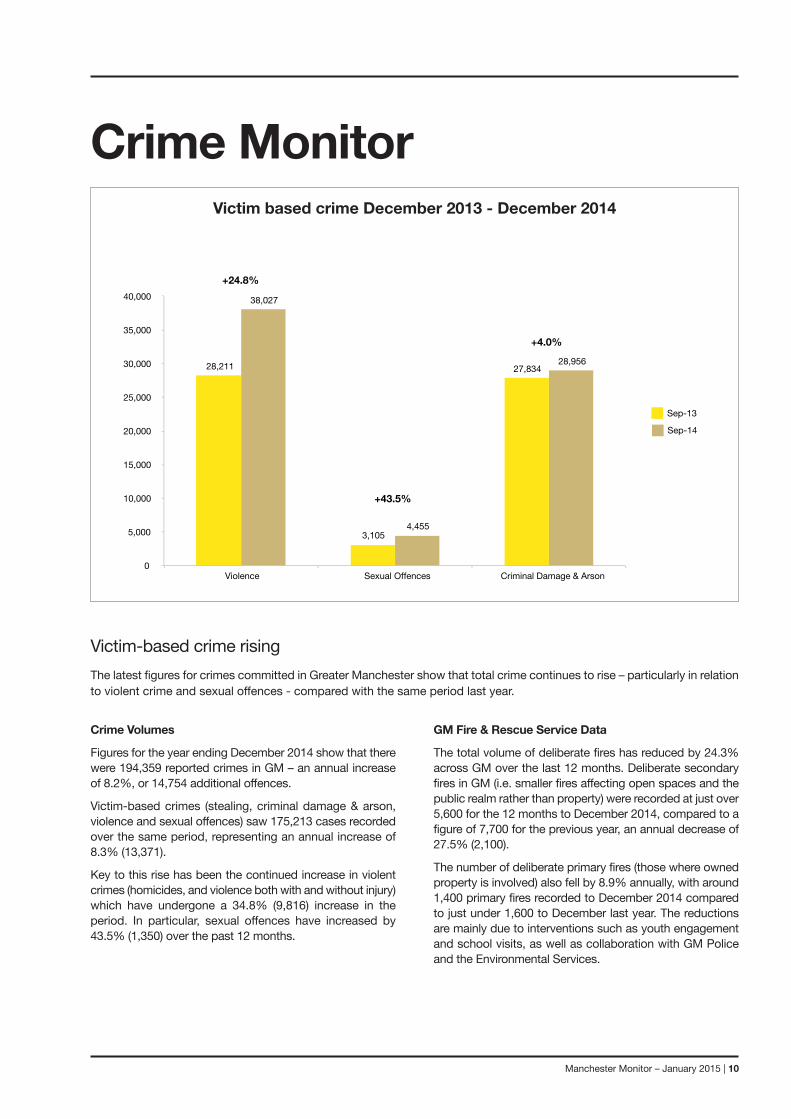
Victim based crime December 2013 - December 2014
Victim-based crime rising
The latest figures for crimes committed in Greater Manchester show that total crime continues to rise – particularly in relation
to violent crime and sexual offences - compared with the same period last year.
Crime Volumes
Figures for the year ending December 2014 show that there
were 194,359 reported crimes in GM – an annual increase
of 8.2%, or 14,754 additional offences.
Victim-based crimes (stealing, criminal damage & arson,
violence and sexual offences) saw 175,213 cases recorded
over the same period, representing an annual increase of
8.3% (13,371).
Key to this rise has been the continued increase in violent
crimes (homicides, and violence both with and without injury)
which have undergone a 34.8% (9,816) increase in the
period. In particular, sexual offences have increased by
43.5% (1,350) over the past 12 months.
GM Fire & Rescue Service Data
The total volume of deliberate fires has reduced by 24.3%
across GM over the last 12 months. Deliberate secondary
fires in GM (i.e. smaller fires affecting open spaces and the
public realm rather than property) were recorded at just over
5,600 for the 12 months to December 2014, compared to a
figure of 7,700 for the previous year, an annual decrease of
27.5% (2,100).
The number of deliberate primary fires (those where owned
property is involved) also fell by 8.9% annually, with around
1,400 primary fires recorded to December 2014 compared
to just under 1,600 to December last year. The reductions
are mainly due to interventions such as youth engagement
and school visits, as well as collaboration with GM Police
and the Environmental Services.

11 | Manchester Monitor – January 2015
T: +44 (0)161 237 4446 [email protected]
New EconomyChurchgate House56 Oxford StreetManchester M1 6EU
A company limited by guarantee registered in England no. 5678007.
Registered Office MPSL, PO Box 532, Manchester Town Hall, M60 2LA
Related Documents