TRANSPORT RESEARCH CENTRE EUROPEAN CONFERENCE OF MINISTERS OF TRANSPORT MANAGING URBAN TRAFFIC CONGESTION

Welcome message from author
This document is posted to help you gain knowledge. Please leave a comment to let me know what you think about it! Share it to your friends and learn new things together.
Transcript

TR
AN
SP
OR
T
RE
SE
AR
CH
C
EN
TR
E
2007
EUROPEAN CONFERENCEOF MINISTERS OF TRANSPORT
MANAGINGURBANTRAFFICCONGESTION
MA
NA
GIN
G U
RBAN
TRAFFIC CO
NG
ESTION
-:HSTCSC=VUVW]Z:(77 2007 01 1 P)ISBN 978-92-821-0128-5
MANAGING URBANTRAFFIC CONGESTION
Road congestion is a maddening feature of many large and growing urban areas. National
estimates of the cost of congestion often point to losses equivalent to around 1% of GDP in more congested countries. However, congestion is also
the result of one of the most beneficial aspects of urban development – agglomeration and its
positive contribution to GDP. How can urban regions balance the benefits of agglomeration
and the disadvantages of congestion?
This report seeks to answer key questions in managing urban traffic congestion. What
exactly is congestion, and when is it excessive?What are the costs and other impacts of
congestion? What strategic vision should guide congestion management policies?
What technology and operational optionsare available? What should a reasonableand effective congestion management
strategy look like?
The report was prepared by an international Working Group of the Joint OECD/ECMT Transport Research Centre and provides
a thorough overview of the nature, scope and measurement of congestion, necessary for any effective management policy. It offers policy-
oriented, research-based recommendations for effectively managing traffic and cutting
excess congestion in large urban areas.
www.oecd.org/publishing

TR
AN
SP
OR
T
RE
SE
AR
CH
C
EN
TR
E
EUROPEAN CONFERENCEOF MINISTERS OF TRANSPORT
MANAGINGURBANTRAFFICCONGESTION

ORGANISATION FOR ECONOMIC CO-OPERATIONAND DEVELOPMENT
The OECD is a unique forum where the governments of 30 democracies work together to
address the economic, social and environmental challenges of globalisation. The OECD is also at
the forefront of efforts to understand and to help governments respond to new developments and
concerns, such as corporate governance, the information economy and the challenges of an
ageing population. The Organisation provides a setting where governments can compare policy
experiences, seek answers to common problems, identify good practice and work to co-ordinate
domestic and international policies.
The OECD member countries are: Australia, Austria, Belgium, Canada, the Czech Republic,
Denmark, Finland, France, Germany, Greece, Hungary, Iceland, Ireland, Italy, Japan, Korea,
Luxembourg, Mexico, the Netherlands, New Zealand, Norway, Poland, Portugal, the Slovak Republic,
Spain, Sweden, Switzerland, Turkey, the United Kingdom and the United States. The Commission of
the European Communities takes part in the work of the OECD.
OECD Publishing disseminates widely the results of the Organisation’s statistics gathering and
research on economic, social and environmental issues, as well as the conventions, guidelines and
standards agreed by its members.
© OECD/ECMT 2007
No reproduction, copy, transmission or translation of this publication may be made without written permission. Applications should be sent to
OECD Publishing [email protected] or by fax 33 1 45 24 99 30. Permission to photocopy a portion of this work should be addressed to the Centre français
d’exploitation du droit de copie (CFC), 20, rue des Grands-Augustins, 75006 Paris, France, fax 33 1 46 34 67 19, [email protected] or (for US only) to
Copyright Clearance Center (CCC), 222 Rosewood Drive Danvers, MA 01923, USA, fax 1 978 646 8600, [email protected].
This work is published on the responsibility of the Secretary-General of the OECD. The
opinions expressed and arguments employed herein do not necessarily reflect the official views of the Organisation or of the governments of its member countries.
EUROPEAN CONFERENCE OF MINISTERS OF TRANSPORT (ECMT)
The European Conference of Ministers of Transport (ECMT) is an inter-governmental organisation established by a Protocol signed in Brussels on 17 October 1953. It comprises the Ministers of Transport of 44 full Member countries: Albania, Armenia, Austria, Azerbaijan, Belarus, Belgium, Bosnia-Herzegovina, Bulgaria, Croatia, the Czech Republic, Denmark, Estonia, Finland, France, FRY Macedonia, Georgia, Germany, Greece, Hungary, Iceland, Ireland, Italy, Latvia, Liechtenstein, Lithuania, Luxembourg, Malta, Moldova, Montenegro, Netherlands, Norway, Poland, Portugal, Romania, Russia, Serbia, Slovakia, Slovenia, Spain, Sweden, Switzerland, Turkey, Ukraine and the United Kingdom. There are seven Associate member countries (Australia, Canada, Japan, Korea, Mexico, New Zealand and the United States) and one Observer country (Morocco).
The ECMT is a forum in which Ministers responsible for transport, and more specifically inland transport, can co-operate on policy. Within this forum, Ministers can openly discuss current problems and agree upon joint approaches aimed at improving the use and ensuring the rational development of European transport systems.
At present, ECMT has a dual role. On one hand it helps to create an integrated transport system throughout the enlarged Europe that is economically efficient and meets environmental and safety standards. In order to achieve this, ECMT assists in building bridges between the European Union and the rest of the European continent at a political level. On the other hand, ECMT also develops reflections on long-term trends in the transport sector and, more specifically, studies the implications of globalisation on transport.
In January 2004, the ECMT and the Organisation for Economic Co-operation and Development (OECD) brought together their transport research capabilities by establishing the Joint Transport Research Centre. The Centre conducts co-operative research programmes that address all modes of inland transport and their intermodal linkages to support policy-making throughout Member countries.
Ministers at their Dublin Council in May 2006 agreed a major reform of ECMT designed to transform the organisation into a more global body covering all modes of transport. This new international transport Forum will aim to attract greater attention to transport policy issues, and will hold one major annual event involving Ministers and key sectoral actors on themes of strategic importance. 2007 is a transitional year for the setting up of the Forum. The new structure will be fully operational as of 2008.
Also available in French under the title:
Gérer la congestion urbaine
Photo credit: with the kind permission of John Eden
Further information about the ECMT is available on Internet at the following address: www.cemt.org
© OECD/ECMT 2007 – ECMT Publications are distributed by: OECD Publishing 2, rue André-Pascal, 75775 PARIS CEDEX 16, France

FOREWORD – 5
MANAGING URBAN TRAFFIC CONGESTION – ISBN 978-92-821-0128-5 - © ECMT, 2007
FOREWORD
Cities and traffic have developed hand-in-hand since the earliest large human settlements. The same forces that draw inhabitants to congregate in large urban areas also lead to sometimes intolerable levels of traffic congestion on urban streets and thoroughfares. Effective urban governance requires a careful balancing between the benefits of agglomeration and the dis-benefits of excessive congestion.
This report puts forward policy-oriented, research-based recommendations for effectively managing traffic congestion and eliminating excessive congestion in large urban areas. It also provides a fundamental overview of the nature, scope and measurement of congestion necessary for any effective congestion management policy.
The report on Managing Urban Traffic Congestion is the result of two years of work by a group of expert researchers in traffic operations, transport economics and urban transport from many Organisation for Economic Co-operation and Development (OECD) and European Conference of Transport Ministers (ECMT) countries. Working Group members from Australia, Canada, the Czech Republic, France, Germany, Greece, Japan, the Netherlands, New Zealand, the Russian Federation, Spain, the United Kingdom and the United States all contributed to the project (see appendix for a complete list of participants).
Road traffic congestion poses a challenge for all large and growing urban areas. This report aims to provide policymakers and technical staff with the strategic vision, conceptual frameworks and guidance on some of the practical tools necessary to manage congestion in such a way as to reduce its overall impact on individuals, families, communities and societies.

6 – ACKNOWLEDGEMENTS
MANAGING URBAN TRAFFIC CONGESTION – ISBN 978-92-821-0128-5 - © ECMT, 2007
ACKNOWLEDGEMENTS
The task of the Working Group was greatly facilitated by the people and institutes that
generously hosted and organised various meetings in support of the project and provided specific expertise. In particular, the Working Group would like to warmly thank the following:
• The Service Interdépartemental de la Sécurité et de l'Exploitation de la Route (SISER) of the Ile de France Région.
• The National Technical University of Athens.
• The Czech Transport Research Centre (CDV).
• The Dresden University of Technology.
• The Abertis Foundation.
• The Polytechnic University of Catalonia.
• Ajuntament de Barcelona.
• The Greater Manchester Passenger Transport Executive (GMPTE).
• Rémy PRUD’HOMME.
• Jacques NOUVIER.

KEY MESSAGES – 7
MANAGING URBAN TRAFFIC CONGESTION – ISBN 978-92-821-0128-5 - © ECMT, 2007
MANAGING URBAN TRAFFIC CONGESTION
KEY MESSAGES
1. Much can be done to reduce the worst traffic congestion
Dynamic, affordable, liveable and attractive urban regions will never be free of congestion. Road transport policies, however, should seek to manage congestion on a cost-effective basis with the aim of reducing the burden that excessive congestion imposes upon travellers and urban dwellers throughout the urban road network.
2. Effective land use planning and appropriate levels of public transport service are essential for delivering high quality access in congested urban areas
Integrated land use and transport planning and coordinated transport development involving all transport modes - including appropriate levels of public transport – are fundamentally important to the high quality access needed in large urban areas.
3. Road users want reliable door-to-door trips that are free of stress
Road users generally accept a degree of road congestion but attach a high value to the reliability and predictability of road travel conditions. Reliability needs to be given greater weight in assessing options and prioritising congestion mitigation measures.
4. Targeting travel time variability and the most extreme congestion incidents can deliver rapid, tangible and cost-effective improvements
Unreliable and extremely variable travel times impose the greatest “misery” on road users. An increase in the reliability and predictability of travel times can rapidly reduce the cost associated with excessive congestion levels.
5. The age of unmanaged access to highly-trafficked urban roads is coming to an end
Most traditional congestion relief measures either free up existing capacity or deliver new road capacity, which is likely to be rapidly swamped with previously suppressed and new demand, at least in economically dynamic cities. In future, demand for use of highly trafficked roads will need to be managed. Demand management strategies should take full account of how residents and roadway users wish to see their community develop as well as their longer term mobility preferences.
6. Transport authorities will inevitably need to employ a combination of access, parking and road pricing measures to lock in the benefits from operational and infrastructure measures aimed at mitigating traffic congestion.
By comparison with non-road infrastructure managers, road administrations generally have much less of a role – if they are assigned any role at all – in managing overall levels of demand. Often little consideration is given to the question of whether overall demand for use of the roadway system should be managed at all. Management of roadway demand is increasingly likely to be required in large urban areas.


TABLE OF CONTENTS – 9
MANAGING URBAN TRAFFIC CONGESTION – ISBN 978-92-821-0128-5 - © ECMT, 2007
TABLE OF CONTENTS
EXECUTIVE SUMMARY AND POLICY CONSIDERATIONS................................................. 11
1. DEFINING AND CHARACTERISING CONGESTION....................................................... 27
1.1 Introduction ........................................................................................................................ 27 1.2 What is Congestion? .......................................................................................................... 27 1.3 Defining Congestion .......................................................................................................... 28 1.4 Excessive Congestion: When is there too much traffic? .................................................... 30 1.5 What is it that congestion prevents us from accomplishing? ............................................. 30 1.6 Congestion and Agglomeration.......................................................................................... 32 1.7 Characterising Congestion: Key Factors to Consider ........................................................ 34
2. MEASURING CONGESTION: METHODS AND INDICATORS....................................... 43
2.1 Performance Measurement and Observational Bias .......................................................... 43 2.2 Congestion Indicators......................................................................................................... 47
3. CAUSES OF CONGESTION IN URBAN AREAS................................................................. 61
3.1 Introduction ........................................................................................................................ 61 3.2 Patterns of Congestion: Recurrent vs. Non-recurrent, Predictable vs. Random................. 62 3.3 Sources of Congestion: Congestion “Triggers” ................................................................. 65 3.4 Sources of Congestion: Congestion “Drivers”................................................................... 74
4. OVERVIEW OF TRAFFIC CONGESTION AND CONGESTION APPROACHES IN MEMBER COUNTRIES ......................................................................... 91
4.1 Introduction ........................................................................................................................ 91 4.2 Overview of Congestion in Selected Countries ................................................................. 92 4.3 Review of Congestion Management Frameworks ........................................................... 107
5. CONCEPTUAL FRAMEWORKS FOR ASSESSING CONGESTION AND ITS IMPACTS................................................................................................................. 121
5.1 Traditional Approaches to the Assessment of Congestion............................................... 122 5.2 Further Economic Contributions to the Assessment of Congestion................................. 125 5.3 Gaps between Traditional Approaches, Theory and Practice. ......................................... 129 5.4 Improving the approaches used to assess congestion and its impacts.............................. 135 5.5 Total estimates of Congestion costs ................................................................................. 160
6. CONGESTION MANAGEMENT STRATEGIC PRINCIPLES ........................................ 167
6.1 Strategic Planning, Strategies and Congestion Management Policy................................ 167 6.2 Strategic Framework for Congestion Management.......................................................... 168 6.3 Strategic Planning and Congestion Management............................................................. 168 6.4 Strategic Principles for Congestion Management Policy................................................. 171 6.5 No Managing Congestion without Managing Demand.................................................... 173
10 – TABLE OF CONTENTS
MANAGING URBAN TRAFFIC CONGESTION – ISBN 978-92-821-0128-5 - © ECMT, 2007
7. INTEGRATED TRANSPORT PLANNING.......................................................................... 177
7.1 Integrated Transport Planning.......................................................................................... 177 7.2 Addressing the Fundamental Drivers of Congestion: Measures Linking Land Use
and Traffic Growth and Development ............................................................................. 177
8. IMPROVING THE RELIABILITY OF URBAN ROAD SYSTEM PERFORMANCE ................................................................................................... 183
8.1 Incident Management....................................................................................................... 184 8.2 Roadwork Management ................................................................................................... 187 8.3 Urban Freight Management: Better Managing Goods Distribution
in Urban Areas ................................................................................................................. 188
9. LOCKING IN THE BENEFITS OF AVAILABLE CAPACITY: ACCESS CONTROL, PARKING MANAGEMENT AND ROAD CONGESTION................................................ 195
9.1 Introduction ...................................................................................................................... 195 9.2 Demand Management Policies......................................................................................... 197 9.3 Access Management and Control..................................................................................... 197 9.4 Parking Management and Control.................................................................................... 203 9.5 Road / Congestion Pricing................................................................................................ 211 9.6 Which Demand Management Strategy to Choose? Access Management,
Parking Policies or Road / Congestion Pricing? .............................................................. 223
10. CONGESTION MANAGEMENT MEASURES THAT RELEASE OR PROVIDE NEW CAPACITY ................................................................................................. 229
10.1 Operational Traffic Management ..................................................................................... 229 10.2 Promoting Public Transport ............................................................................................. 236 10.3 Mobility Management ...................................................................................................... 241 10.4 Modifying Existing Infrastructure.................................................................................... 246 10.5 Building New Infrastructure............................................................................................. 249 10.6 Packages of Measures ...................................................................................................... 252
11. CONGESTION RESPONSE STRATEGIES: GETTING THE DECISION PROCESS ON TRACK ........................................................................................................... 255
11.1 Key Problems that threaten decision making processes................................................... 255 11.2 Common elements of decision-making processes............................................................ 257 11.3 Decision making approaches and context ........................................................................ 258 11.4 Achieving shared views about objectives and problems.................................................. 263 11.5 About scope...................................................................................................................... 264 11.6 How will institutional (framework) conditions influence
strategies and solutions?................................................................................................... 267 11.7 Priorities ........................................................................................................................... 269
BIBLIOGRAPHY ............................................................................................................................ 271
WORKING GROUP MEMBERS .................................................................................................. 295
EXECUTIVE SUMMARY AND POLICY CONSIDERATIONS – 11
MANAGING URBAN TRAFFIC CONGESTION – ISBN 978-92-821-0128-5 - © ECMT, 2007
EXECUTIVE SUMMARY AND POLICY CONSIDERATIONS
This summary sets out the conclusions and recommendations of the OECD/ECMT Joint Transport Research Centre’s Working Group on Tackling Traffic Congestion in Large Urban Areas. The report is aimed at those in charge of preparing congestion management policies and also those responsible for improving congestion management operations. It aims to provide a better understanding of the phenomenon of congestion and provide guidance in relating this understanding to local circumstances.
Congestion is one of the major pre-occupation of urban decision-makers. A quick scan of policy statements from across OECD/ECMT cities highlights the importance of congestion to the public, elected officials and road and transport administrations in many urban areas. Yet, there is little consensus across the OECD/ECMT member countries on the types of policies that are best suited to tackling congestion in cities. There is perhaps even less consensus on what precisely congestion is, whether or not it is a “solvable” problem and, in some locations and cases, whether it is problem at all.
Faced with such a divergence of views on approaches and policies for dealing with congestion, what advice can be given to policy-makers seeking to ensure the best possible transport policy outcomes?
Congestion takes on many faces, occurs in many different contexts and is caused by many different processes. Because of this, there is no single best approach to managing congestion – and the report is therefore not prescriptive about specific congestion management measures. However, there are many things that congestion management policies should take into account if they are to achieve the goals they set themselves.
This report seeks to help the reader find their own answers to a series of fundamentally important questions1:
• What is congestion, how should it be measured and is it getting worse?
• What should policy-makers know about the causes of congestion?
• What are the costs and impacts of congestion and are we measuring them correctly?
• What can we do now to manage congestion better?
• How can we be more effective in tackling congestion than in the past?
• Are institutional arrangements encouraging or discouraging appropriate responses to congestion?
The following pages address each of these questions in turn.

12 – EXECUTIVE SUMMARY AND POLICY CONSIDERATIONS
MANAGING URBAN TRAFFIC CONGESTION – ISBN 978-92-821-0128-5 - © ECMT, 2007
What is congestion2
There is no single, broadly accepted definition of traffic congestion. One of the principal reasons for this lack of consensus is that congestion is both:
• A physical phenomenon relating to the manner in which vehicles impede each others’ progression as demand for limited road space approaches full capacity.
• A relative phenomenon relating to user expectations vis-à-vis road system performance.
Both operational and user perspectives are important in understanding congestion and its impacts. This report does not seek to select one approach to defining congestion over the other; they clearly both have uses when seeking to develop congestion management strategies. Ideally, urban transport policies should be developed on the basis that congestion is related to both:
• The behaviour of traffic as it nears the physical capacity of the road system.
• The difference between road users’ expectations of the system’s performance and how the system actually performs.
Urban traffic congestion must be understood in the wider context of city dynamics and agglomeration benefits. Traffic congestion in urban areas is often the outcome of successful urban economic development, employment, housing and cultural, policies that make people want to live and work relatively close to each other and attract firms to benefit from the gains in productivity thus derived. There are many indications that, even though they may not be thrilled by the prospect, urban road users are prepared to live with crowded roads so long as they derive other benefits from living and working in their cities.
Congestion prevents us from moving freely and it slows and otherwise disrupts the conduct of business within urban areas. However, it is important to note that unfettered movement is not the primary benefit we derive from living in urban areas. Cities provide access to a wide range of activities, people, services, goods, markets, opportunities, ideas and networks. These benefits can be delivered either through speed or through greater proximity. Congestion may affect travel speed but in some circumstances, such as dense urban cores, congestion may both be expected and, to some degree, accepted. In these cases, cities have come to accept a degree of congestion and continue to get along relatively well as long as overall accessibility is high.
In this context, it is difficult to see how congestion can or should be eradicated in economically buoyant urban areas nor is there any indication that urban road users expect to travel in congestion-free conditions at peak hours. This is not to say that cities should not proactively and vigorously address growing congestion – they should, especially in cases where congestion can be linked to specific traffic bottlenecks and cost-effective measures are available. However, in the long run, what matters most for policy is how congestion can be managed such that the beneficial outcomes of agglomeration are not eroded unacceptably by the negative impacts of congestion.
The question is not how should policies eradicate congestion but rather, how can authorities best avoid excessive congestion – for this is really what lies at the heart of congestion management policies.

EXECUTIVE SUMMARY AND POLICY CONSIDERATIONS – 13
MANAGING URBAN TRAFFIC CONGESTION – ISBN 978-92-821-0128-5 - © ECMT, 2007
When is Congestion Excessive?
There are two ways of answering this question.
The first is to say that congestion is excessive when people say it is … but this does not account for what it would cost to bring congestion back down to levels that are tolerable. It may very well be that the cost of reducing congestion to these levels may be much greater than the costs imposed by congestion itself.
A better way of defining excessive congestion is: when the marginal costs to society of congestion exceed the marginal costs of efforts to reduce congestion (such as adding to road or other transport infrastructure3), congestion is excessive and action to manage it better is warranted. 4
How should Congestion be Measured?
Measuring congestion is a necessary step in order to deliver better congestion outcomes. However, congestion should not be described using a single metric for policy purposes. Such an approach is sure to obscure either the quantitative aspects of congestion or its relative and qualitative aspects. These two aspects can not be disassociated and progress in managing congestion should be based on sets of indicators that capture both of these aspects.
Good indicators can be based on a wide network of roadway sensors but simple indicators based on less elaborate monitoring can sometimes adequately guide policy. What is important is to select metrics that are relevant to both road managers (e.g. speed and flow, queue length and duration, etc.) and road users (e.g. predictability of travel times, system reliability, etc).
Indicators should be neutral in that they do not contain implied policy goals. In this context, the use of free-flow speeds should not be used as a direct benchmark to measure congestion policy outcomes as such an approach implicitly suggests that successful policies deliver free-flow speeds – an unaffordable goal for peak hour traffic in most OECD/ECMT cities. Free-flow speeds might be used as a benchmark of technical system performance but a better alternative might be to use median speeds or to use some other benchmark or set of benchmark values such as percentage of maximum legal speed or different speed bands.
Congestion has an impact on both the speed of travel and on the reliability of travel conditions. It is the latter that may be of greatest concern to individuals and businesses. Thus congestion management policies should keep track of travel reliability indicators. These may capture the variance in travel times or, alternatively, communicate the amount of time buffers road users have to include in their travel plans to make their trips “on time”. Insofar as these reliability indicators give an understanding of the quality of travel conditions, they are important to policymakers seeking to address the qualitative aspects of congestion.
Equally important, but more difficult to measure, is the task of identifying who is adversely affected by congestion. In cities where citizens have available (and use) quality public transport, road congestion may not concern as high a percentage of the travelling public as in cities with low quality alternatives to car use. Congestion can also have indirect impacts not captured by “on-road”-based assessments (e.g. increased inventory holdings by manufacturing and retail businesses in response to increased unreliability of travel conditions). Many non-road users are also exposed to the negative impacts of congestion. Developing a common framework for measuring the indirect impacts of congestion, the exposure of urban travellers to congestion across modes as well as including the impacts of congestion to non-road users remains a significant challenge.
14 – EXECUTIVE SUMMARY AND POLICY CONSIDERATIONS
MANAGING URBAN TRAFFIC CONGESTION – ISBN 978-92-821-0128-5 - © ECMT, 2007
Is Congestion Getting Worse?
Congestion is increasing in many urban areas across the OECD/ECMT regions (and elsewhere) and in locations where populations and city economies are growing it is likely to continue to increase. However, it is not clear that congestion is rising equally fast across all areas in these countries; nor that the rise in traffic has followed the same patterns and has been caused by the same phenomena. In many cases, congestion has grown as cities have grown and as economic activity has expanded. Cities have grown as they attracted more people and activities, they have produced more wealth and, as a by-product, their roads have become more crowded. Congestion has grown in absolute terms in many areas but in some cases, it may not necessarily have grown in relative terms as measured by unit of economic output or per capita. This may partly explain why some countries view urban congestion and its growth as an issue impacting on city growth and productivity and therefore of critical national importance while others see urban congestion as a “problem” that is to a degree self-regulating – especially in cases where travel alternatives are available and system performance is reliable.
In some cases, national statistics clearly indicate a significant growth in congestion as measured by a degradation of average travel speeds during peak hours (as in many areas of the United States), however, in other areas average speeds have remained constant or even increased (as in France). What is clear is that in many cases, urban congestion has spread in the sense that the period of time that roads are congested during the day has lengthened – “peak-spreading” is a common phenomenon in many cities – and in the geographic extent of congestion within urban areas. Likewise, many, but certainly not all, urban areas seem to have experienced degraded travel conditions in that the predictability and reliability of travel times have decreased.
In one respect, the relative rise in congestion can also be seen as a “natural” consequence of the “lumpy” nature of infrastructure provision. New road capacity can only be provided in large increments leading to a situation where new infrastructure is oftentimes underused in the short-term, well-used in the medium term and over-used in the longer term. New infrastructure provided in the 1950s through the 1980s is now often saturated with traffic and the possibilities for further large-scale expansion are often seriously constrained by the scarcity of available urban land and its costs. In some areas where there remain opportunities to expand or otherwise complete insufficient regional road infrastructure, as in the case of the greater Tokyo region or in Moscow, one can expect that a similar pattern of congestion relief, followed by traffic growth and saturation will occur - absent of any pro-active traffic management policy.
What Should Policy-makers Know about the Causes of Congestion?
The proximate causes of congestion are numerous, e.g. too many vehicles for a given road’s design or intersection capacity, dynamic changes in roadway capacity caused by lane-switching and car-following behaviour. They are also invariably linked to other indirect factors such as land-use patterns, employment patterns, income levels, car ownership trends, infrastructure investment, regional economic dynamics, etc…
Generally, however, we can identify two principal, broad categories of causal factors; micro-level factors (e.g. those that relate to traffic “on the road”) and macro-level factors that relate to overall demand for road use. In this context, congestion is “triggered” at the “micro” level (e.g. on the road), and “driven” at the “macro” level by factors that contribute to the incidence of congestion and its severity. This has important implication for policy since – while congestion takes place on the roads, it is not only, nor necessarily primarily, a traffic engineering problem.
Congestion is typically categorized as either recurrent or non-recurrent.
EXECUTIVE SUMMARY AND POLICY CONSIDERATIONS – 15
MANAGING URBAN TRAFFIC CONGESTION – ISBN 978-92-821-0128-5 - © ECMT, 2007
Recurrent congestion is generally the consequence of factors that act regularly or periodically on the transportation system, such as daily commuting or weekend trips. However, even recurrent congestion can display a large degree of randomness, especially in its duration and severity.
What is also clear from an examination of the causes of “recurrent” congestion across different types of road networks is the extreme vulnerability of traffic to sudden breakdowns as demand approaches the technical maximum throughput capacity on a link or in the network. When roads are operated at or near their maximum capacity, small changes in available capacity due to such factors as differential vehicle speeds, lane changes, and acceleration and deceleration cycles can trigger a sudden switch from flowing to stop-and-go traffic. Likewise, saturated intersections can quickly give rise to queues whose upstream propagation can swamp local roads and intersections.
Non-recurrent congestion is the effect of unexpected, unplanned or large events (e.g. road works, crashes, special events and so on) that affect parts of the transportation system more or less randomly and, as such, cannot be easily predicted. The share of non-recurrent congestion varies from road network to road network and is linked to the presence and effectiveness of incident response strategies, roadwork scheduling and prevailing atmospheric conditions (snow, rain, fog, etc.).
While most non-recurrent incidents have the same negative impact on roadway performance, not all incidents are purely random nor are they equally difficult to plan for. While most crashes are unpredictable by their very nature, accident–prone segments of the roadway can be identified via statistical analysis and specific geometric or other safety treatments applied.
Likewise, roadworks can be managed in such a way as to minimise their impacts on traffic (e.g. by undertaking major road works at night). Even weather, while impossible to change, can be better managed on the roads with active speed management and can be prepared-for with contingency planning that can lessen its impact on traffic.
The specific mechanisms relating to the triggering of congestion are different according to different classes of roadways. Congestion on uninterrupted flow facilities such as motorways does not occur in the same manner nor for the same proximate causes as congestion arising on interrupted flow facilities such as those found in dense urban cores.
One key relationship for policy-makers to keep in mind is the relationship between the release of existing capacity or the provision of new capacity - and the subsequent demand for use of that newly available capacity. This relationship is captured in the price-elasticity of travel and has an impact in how quickly newly available capacity is filled. In particular, there is broad evidence that newly available capacity does attract new travel on the road in question. This is not necessarily a bad thing since travellers are able to undertake trips that they otherwise could not on those routes or at those times. What matters however, from a policy perspective, is the likely ex-post demand for travel and not the existing level of demand. The impact of induced and/or diverted traffic should not be underestimated – not only for road-building projects but also for policies whose practical result is to free up capacity.
Finally, effective congestion management policies should seek to understand the nature of travel demand in congested conditions. While commuting trips may be a key factor, it is important not to overlook other types of peak-hour trips including school runs, leisure travel and freight travel that often make a substantial contribution to traffic in peak periods.
16 – EXECUTIVE SUMMARY AND POLICY CONSIDERATIONS
MANAGING URBAN TRAFFIC CONGESTION – ISBN 978-92-821-0128-5 - © ECMT, 2007
What are the impacts of congestion and are we measuring them accurately?
Congestion Impacts
Congestion involves queuing, slower speeds and increased travel times, which impose costs on the economy and generate multiple impacts on urban regions and their inhabitants. Congestion also has a range of indirect impacts including the marginal environmental and resource impacts of congestion, impacts on quality of life, stress, safety as well as impacts on non-vehicular roadspace users such as the users of sidewalks and road frontage properties. Policy-makers should ensure that cost-benefit evaluations or other policy evaluation methodologies include an assessment of these impacts as well as take into account broader considerations such as the type of cities people want.
Conceptual Frameworks Used to Assess Congestion and its Impacts
There is rarely a uniform conceptual framework for addressing congestion and appraising congestion management policies across the variety and scope of actors involved. Furthermore, there exists a real tension between different conceptual models underlying congestion cost and impact calculations which in turn can influence congestion management approaches. Economic models can lead to the formulation of quite different congestion management objectives from physical models.
Generally speaking, traditional approaches used by road administrations have focused on managing road systems in urban areas in ways that maximise their ability to handle current and expected future traffic demand. Such flow-based approaches seek to maximise the physical usage of available road capacity, taking into account other road management goals such as safety. Roads are rated at a set capacity as expressed in flow, density or, synthetically, as “levels of service”. Achieving higher flows, higher densities and higher levels of service in keeping with the rated capacity of the roadway has traditionally been seen as performance “improvement”. Likewise, street networks are operated with an eye to reaching maximum intersection clearing capacities during peak hours.
Such operational approaches are well adapted to identifying the locations where bottlenecks exist. They aim to minimise traffic delays and the associated personal, business and resource impacts including personal and productive time lost, fuel wasted and adverse air quality. They allow administrations to highlight locations where action may need to be taken to respond to the delays experienced by users on a regular basis. However, approaches that seek to maximise vehicle throughput along major links inevitably take traffic levels into unstable zones and heighten the risks of recurrent and unpredictable congestion.
Economic assessments of congestion and its impacts have led to alternative approaches that seek to define an “optimal” level of traffic for a given road, intersection, network, etc. These define the cost of congestion as those costs incurred when traffic levels are beyond the “optimum” level. In particular, they account for the costs imposed by each additional user of the road on other road users and on society as a whole. Optimal congestion approaches consider demand for road space as well as supply and seek an “optimal” balance between the two. Economically optimal levels of congestion take into consideration not only the cost of road provision but also what people are ready to pay in order to use the road. Economically “optimal” levels of traffic not only entail a certain degree of congestion – as the term is commonly understood by roadway managers and users – but this “optimal” level of traffic can also vary i.e. it is not related solely to the capacity of the infrastructure under consideration.
One benefit of using an economic framework for describing and analysing congestion is that these approaches allow policies to take into account the heterogeneity of road users and, in particular, the variability in users’ value of time. Well constructed economic approaches can also inform
EXECUTIVE SUMMARY AND POLICY CONSIDERATIONS – 17
MANAGING URBAN TRAFFIC CONGESTION – ISBN 978-92-821-0128-5 - © ECMT, 2007
policy-makers when it makes sense to invest in certain forms of congestion relief measures – including the provision of new infrastructure.
There are differences between the outcomes that result from the conceptual frameworks traditionally used and optimal congestion approaches. There are also gaps between the theory and the practice in determining the “optimum” levels of traffic that policy-makers should be aware of when adopting conceptual models to describe congestion and prescribe policy actions. For instance, simplified economic approaches based on speed-flow relationships inadequately capture the manner in which the formation and discharge of queues impact roadway users. Likewise they are not necessarily well adapted to the description of congestion behaviour on dense street networks where intersection clearance times (and not link performance) are the key variables. There are other approaches, such as bottleneck-based models that better capture the spatial and temporal impacts of congestion in these circumstances.
Another gap exists between the design of many congestion management policies and road users’ concerns relating to the reliability and predictability of travel times and not just their average duration. Unreliable travel times impose real costs on individual road users and can have significant downstream impacts on productivity (e.g. as in the case of increased inventory holdings by businesses). These impacts and costs should not be neglected when formulating congestion policy responses.
Overall Costs of Congestion
Many congestion response strategies have been motivated by misguided, erroneous or misleading overall congestion cost estimates.
Congestion cost calculations have often incorporated unrealistic assumptions relating to baseline travel conditions. Often, such estimates have sought to determine a total “cost of congestion” by assigning a value to the difference between free-flow travel speeds and speeds actually realised on the transport network – a difference that has alternatively been labelled “lost” time or travel “delay”. However, in order to experience such time losses, there must have been a reference situation in which the same volume of travellers undertaking the same activities in the same city could have travelled without any delay at all, including in peak periods i.e. they must have had the additional time in the first place.
It is clear that most cities cannot afford nor would desire the types of transportation networks that would allow for free and unencumbered travel at all hours of the day. In other words, users have never had the time which these estimates assume they have “lost”. Roads in major metropolitan areas are never built to allow free-flow travel at all times of the day, including in particular peak periods.
Such “cost of congestion” approaches are also misleading when they neglect the fact that congestion is the outcome of crowding in urban areas – itself the successful result of other urban policies. Empty cities are not generally considered successful cities; nor should empty roads.
The impacts of congestion are not abstract – they must be linked to roadway users’ experiences and expectations. Instead of attempting to calculate the “overall cost” of congestion, from an analytical viewpoint, it may be more productive to estimate the relative changes in levels and costs of congestion. By comparing current levels with past (and expected future) levels, it is possible to assess the extent to which congestion is reducing the potential benefits - e.g. in overall accessibility to urban facilities and services. Where the costs are increasing a key question is whether the costs of mitigating congestion are likely to be less than the current cost to road users and the city at large of present levels

18 – EXECUTIVE SUMMARY AND POLICY CONSIDERATIONS
MANAGING URBAN TRAFFIC CONGESTION – ISBN 978-92-821-0128-5 - © ECMT, 2007
of congestion? Robust benefit-cost assessments are necessary to ensure that the benefits of congestion management strategies exceed their costs.
While benefit-cost assessments are normally employed to assess major expenditures (e.g. new roads or other infrastructure), they are not always employed for lesser interventions that nevertheless can have a cumulative impact on congestion levels. These might include specific bottleneck or congestion hotspot treatments, investments in non-road interventions (accident clearing, parking policies, work-time rules) and generally situations where full cost benefit analysis is viewed as too burdensome for the scale of intervention at hand or where congestion impacts are not considered. In some cases, simplified flow-based assessments for small projects or interventions may be running concurrently with more complex and benefit-cost assessments for major investments and the outcomes of these processes might be working at cross-purposes. In the case of simplified assessment methodologies, care should be taken to explicitly state what has been covered in the assessment and what has been omitted.
What can we do now to better manage congestion?
Fully eradicating roadway congestion is neither an affordable, nor feasible goal in economically dynamic urban areas. However, much can be done to reduce its occurrence and to lessen its impacts on roadway users within large cities – congestion is a phenomenon that can be better and more effectively managed. Effectively managing congestion requires both a holistic and integrated strategy that goes beyond the visible incidence of congestion “on the road” and extends to the management of the urban region as a whole.
While there are many possible measures that can be deployed to “treat” or mitigate congestion, there is no single perfect solution. Congestion mitigation actions are part of the broad and complex land use, urban planning and general transport master planning process unique to each urban region. Roadway congestion impacts not only road users but all urban inhabitants. Congestion management requires an integrated strategy equal to the scope and scale of the challenge.
This report does not prescribe specific congestion management measures since the appropriateness and applicability of these depends largely on the local context. Instead, the report suggests three strategic congestion management principles that should serve to guide policies in this field.
1. Ensure that land use planning, and the community objectives it embodies, is coordinated with congestion management policies.
2. Deliver predictable travel times.
3. Manage highly trafficked roadways to preserve adequate system performance.
Ensure that Land Use Planning, and the Community Objectives it Embodies, is Coordinated with Congestion Management Policies
Many urban regions have found that strongly coordinated transport and land use policies allow them to proactively and beneficially manage the scope and nature of urban travel demand and thus reduce the incidence and severity of congestion. These two fields are quite closely linked in reality – land uses give rise to trip generation and the interplay between spatially distant origins and destinations gives rise to regional trip patterns. However, in practice, many regions fail to co-ordinate long term land-use and transport planning.
EXECUTIVE SUMMARY AND POLICY CONSIDERATIONS – 19
MANAGING URBAN TRAFFIC CONGESTION – ISBN 978-92-821-0128-5 - © ECMT, 2007
Experience from a number of countries and regions has shown that well-thought out land-use policies that explicitly link community expectations relating to the long-term development of the city to transport outcomes can have a positive impact on a number of outcomes – including traffic and congestion management.
Deliver Predictable Travel Times
Congestion has an impact on both average travel speed and travel time reliability – and there is much evidence that the latter may be more important than the former in that people can plan around reliably congested travel but are frustrated by unpredictable travel conditions. Unreliable and extremely variable travel times conceivably impose the greatest “misery” on roadway users – “misery” which can rapidly be relieved by an increase in the reliability and predictability of travel times and travel conditions. This finding has been supported by studies that have found that the value to road users of reliability is in many cases higher than their values for travel time.
Typical measures include planning and coordination of roadworks, speedy response to defective traffic signals and to disruptions caused by accidents and debris. From the perspective of urban policy-makers, these approaches can be very attractive in that they can rapidly deliver perceivable benefits to road users for a relatively small investment – especially when compared to the cost of new infrastructure whose impacts on overall travel times may not always be perceived by road users.
Manage Congestion on Main Roads
At present access to roads is generally unconstrained by everything but congestion itself. Indeed, congestion is a powerful rationing mechanism but one that few would agree is efficient. How might signals of relative road space scarcity other than low travel speeds and unreliable traffic conditions be incorporated into road management and travel decisions?
There are many potential congestion management strategies but most fall into one of two categories – those that provide new capacity or free up existing capacity and those that cap, limit or otherwise manage traffic levels on the new or freed-up capacity.
The latter category of measures broadly encompasses three different but related approaches:
• Directly managing the physical access to the roadway through access policies.
• Indirectly managing access to the roadway network and directly influencing road travel to particular areas through parking policies.
• Managing the level of traffic through road pricing policies that target the use of, or access to, roads or urban areas.
Access Management
Access policies seek to restrict vehicle access to certain zones (e.g. historical centres) or to certain road links (ramp metering).
In the case of zone-based access restrictions, traffic may be blocked through the use of physical breaks and barriers in the urban road network (e.g. through the use of one-way streets and road networks that are structured in such a way as to prevent through traffic) or through traffic bans or
20 – EXECUTIVE SUMMARY AND POLICY CONSIDERATIONS
MANAGING URBAN TRAFFIC CONGESTION – ISBN 978-92-821-0128-5 - © ECMT, 2007
permit-based systems. The latter require consistent implementation and clear and robust enforcement to bring good results. Traffic restriction zones should be linked to a set of complementary measures to ensure that one single measure does not bear the full brunt of the traffic reduction effort – the provision of high quality public transport, parking controls and pricing come to mind as complements to access restrictions. Access restrictions can be de-facto as in the case where road space is re-allocated for use by public transport and/or public space (e.g. Paris). The reduced capacity serves to deter access to those links or zones.
A ramp metering approach ensures that road users already on the system are partially protected from the delays that all road users would experience if all vehicles arriving at the ramp were allowed to try to enter the freeway flow. It also ensures that new users presenting themselves for access to the major road network, through delays on the ramp, bear a greater share of the delay costs involved in their access to an already congested roadway system. However, particular attention should be paid to the upstream and downstream impacts that can manifest themselves as queues back up at ramps and as greater traffic volumes are released downstream of the metered links. Also, ramp metering, by increasing travel speeds on the metered roadway links, can encourage longer distance commuting trips.
Parking Management
Parking management and control is a policy lever that is potentially very effective but relatively under-used. Parking management and control is important because it has the potential to modify demand on an area-wide basis yet, despite being readily available to authorities, often seems under-utilised to tackle traffic congestion.
Like road-pricing and other demand-side approaches, parking management and control can assist the task of tackling traffic congestion by reducing the demand for travel to the area encompassed. Due to the considerable policy and operational flexibility available, parking control can also be quite specifically targeted, in the sense that it can be applied on the basis of location and time.
Controlling parking may be very effective in restricting terminating traffic demand but any capacity on the roads that is freed-up will likely be filled by through traffic attracted from alternative routes by the improved travel conditions. Parking control will be of little assistance in circumstances where the current demand is to drop off or pick up passengers – e.g. parents taking children to and from school. For these reasons, parking management as a tool for tackling traffic congestion needs to be supplemented by other measures (e.g. access control or pricing) to ensure the desired outcomes. It is also important that clear incentives and dis-incentives exist to ensure the effective enforcement of parking policies.
In terms of public acceptability, parking control to tackle traffic congestion is not likely to be universally supported. Parking control is likely to be seen as a restriction of current “rights” and entitlements by some parties, such as private property owners – and a threat to the commercial viability of businesses currently dependent on convenient customer parking. However, if parking control policies seek to price parking or increase the prices for parking, there will potentially be revenues available to further reduce congestion or to provide for complementary transport improvements such as in public transport.
Pricing Policies
Pricing policies include cordon charges such as those implemented in Singapore, London and Stockholm, link-based pricing systems such as have been put in place on certain urban tollways, and

EXECUTIVE SUMMARY AND POLICY CONSIDERATIONS – 21
MANAGING URBAN TRAFFIC CONGESTION – ISBN 978-92-821-0128-5 - © ECMT, 2007
mixed-use toll roads (e.g. HOT Lanes in the United States). All have proven to be effective measures to reduce congestion and manage traffic. While their effectiveness is difficult to question, implementation has proven to be challenging.
Equity is a very important consideration. Even if the proceeds of the congestion charges are redistributed to road users, in the form of lower fuel taxes for instance, a congestion charge is likely to benefit people as a function of their values of time. Road users as a group gain but some gain much more than others.
Another issue is that road/congestion pricing raises similar concerns as access control policies about the loss of “rights” to use the road system without charge. Experience has shown that the level of support for road and congestion pricing generally hinges on the use of the funds raised. If the funding arrangements provide for revenues to go to general budget expenditures, road congestion pricing schemes are generally opposed. If the funding arrangements provide for the funds raised to be used for transport improvements (e.g. public transport or road improvements), experience shows support levels increase considerably.
A further advantage to congestion pricing is that the charges and revenues that result provide market signals as to where and when consideration needs to be given to infrastructure investments. Where the revenues raised are channelled into transport investments, congestion charging can help provide funds for undertaking priority transport investments (e.g. in public transport, ITS infrastructure or road expansion).
On highly congested facilities, infrastructure has the potential to be self financing with marginal cost pricing. However, it is essential to account for the costs associated with the collection of the charge – if these are elevated, they can reduce the potential benefits derived from charging for access to roads.
In the case of link-based pricing, there is a risk that pricing policies will transfer traffic flows onto free roads and so create new congestion in other areas. It is therefore important to plan complementary measures such as the modification of road infrastructure and traffic operations management. Parallel measures such as investments in public transport can also be employed to make pricing more acceptable and also fairer for people who cannot afford the charges or tolls and thus contribute to acceptability.
Access management, parking management and road pricing can have a strong impact on total levels of traffic on urban road networks. However, the level of effort necessary to manage demand if any one of these policies is implemented alone is likely to be quite high – high enough to lesson the chances of its implementation. In order to reduce the burden of these policies in tackling excessive congestion, urban areas should consider deploying a mix of all three demand measures – in conjunction with the operational and infrastructure measures called for by the local context.
How can we be more effective in tackling congestion than in the past?
Many strategies can help to improve travel speeds, increase system reliability and mitigate the impacts of congestion. Traditional congestion management strategies can be divided into four broad classes: those that seek to improve traffic operations, those that seek to shift urban traffic to public transport or otherwise reduce the demand for urban road travel, those that seek to modify existing infrastructure so as to increase its capacity and those that seek to provide new infrastructure. Insofar as any of these policies are successful, the practical outcome will be to increase the available capacity of roads (either by freeing up existing capacity or by providing new capacity). This capacity will
22 – EXECUTIVE SUMMARY AND POLICY CONSIDERATIONS
MANAGING URBAN TRAFFIC CONGESTION – ISBN 978-92-821-0128-5 - © ECMT, 2007
typically rapidly be filled in most dynamic urban areas unless these strategies are paired with pricing, parking or access management policies. Thus, while all of these policies are important and can deliver sometimes significant improvements in urban traffic conditions, they will likely not be sufficient, alone, to deliver desired long-term reductions in congestion.
Improving Traffic Operations
Proactive traffic operations management has much potential. Road traffic information systems, pre-trip guidance, coordinated traffic signal systems and the implementation of dynamic speed and incident management policies have often proven to be cost-effective ways to deliver better travel conditions, allowing users to reschedule their trips away from traffic peaks and/or select other travel modes. These strategies all allow road managers to get more out of roads – e.g. to allow for greater flows than could otherwise be realised. They should not be deployed with an eye to bringing traffic up to the limit of the physical capacity of the roadway as this inherently leads to major instabilities in traffic flow and increased probabilities of sudden breakdowns. In fact, many of these strategies can be helpful in managing traffic such that flows are held below these unstable threshold zones.
Improving Public Transport
Public transport has the potential to transport more people than individual cars for a given amount of road space (in the case of on-street systems such as buses and trams) or without consuming any road space at all (in the case of off-road systems such as metros and surface rail systems). The promotion of public transport remains a fundamentally important congestion management strategy. When public transport provides a quality of service that approximates that which car drivers have previously been used to, it can maintain a high level of access throughout urban areas with a drop in overall car usage.
For the congestion mitigation potential of public transport to be realised, travellers must feel that the extent and quality of service provided are sufficient for them to forego using their cars for certain trips – especially those in peak periods. Thus, actions taken to encourage a mode shift to public transport should address the perceived costs by the user, ease and comfort of travelling by public transport as well as its reliability, safety and security.
There are many measures that can improve the attractiveness and performance of public transport systems (e.g. extending services, adapting fee structures, operational improvements, public transport information provision, etc…) but these measures come at a cost and, alone, will likely not be a sufficient congestion management response. Urban areas with high levels of public transport use often also have high levels of road traffic as well. In this context, public transport is not so much a congestion mitigation measure as a way of providing in certain locations a better level of service than users can find on the road network. Public transport services, even when augmented by paratransit services, will likely not be able to provide the level of service that car users enjoy in many lower density or peripheral urban areas. Some road congestion measures e.g. road pricing can only be undertaken if there is sufficient public transport capacity at a acceptable level of service to accommodate travellers displaced from the roads.
Implementing Mobility Management
There are numerous mobility management strategies that can, when successful, reduce car use in urban areas. These include ride-sharing, promoting bicycling and pedestrian travel or supporting mobility management efforts targeting large trip generators such as companies.
EXECUTIVE SUMMARY AND POLICY CONSIDERATIONS – 23
MANAGING URBAN TRAFFIC CONGESTION – ISBN 978-92-821-0128-5 - © ECMT, 2007
Modifying Existing Infrastructure
There are many approaches that can squeeze additional capacity out of existing infrastructure. These include adding lanes, re-allocating road space, modifying intersections, modifying the geometric design of roads or creating one-way streets. These approaches can benefit either car users or public transport; however as with operational management policies – these interventions should not seek to bring traffic flows so close to the maximum capacity of the roadway that the probability of sudden traffic breakdowns becomes unacceptable. While these types of measures are ideally suited for treating bottlenecks, care should be given to consider the downstream impacts of releasing greater traffic flows through previously contained bottlenecks. Great care should be taken to at least address what the network effects will be over the mid- to long-term of such bottleneck treatments.
Building New Infrastructure
Building new road infrastructure is often constrained by a lack of space in dense urban cores and is nearly always an expensive proposition even in the outlying peripheries of urban areas. Many cities now view infrastructure expansion only as a last resort. The effectiveness of providing new road capacity as a congestion management “solution” is oftentimes eroded by new traffic demand. However, there are instances where the provision of new infrastructure is an effective policy – especially when subsequent demand for the infrastructure in question is actively managed as in the case of toll roads and HOT lanes.
The decision to invest in new road capacity (or parking capacity) should be motivated by a thorough cost-benefit exercise that addresses the wide range of congestion impacts detailed earlier. These should also include costs such as environmental costs and impacts on non-road users. When the benefits of providing new infrastructure outweigh the costs of not providing it, then an argument exists for new construction. However, when the cost-benefit exercise is limited in scope (e.g. internal to the roads authority), other less-costly policies that could potentially deliver the same or greater benefits may be overlooked. There are also sometimes real biases, especially in funding, that promote new construction over operational or demand management measures.
Are institutional arrangements encouraging or discouraging appropriate responses to congestion?
Tackling congestion requires an integrated multi-level approach and therefore a multi-level framework of planning and decision making. The more complex the congestion problem, the higher the levels that need to be incorporated and the broader the scope of planning and decision making required.
Tackling congestion requires a plan that encompasses the complexities of the congestion problem and addresses the spatial extent of the region’s travel patterns and the relevant institutional and private actors across the urban area.
There is no single approach best-suited to addressing congestion. But when the scope of institutional decision-making is well-matched to the region’s travel to work area, vision or plan-led approaches work well. Conversely, when there is a mis-match between the scope of jurisdictions’ reach, powers and funding and the geographical scale of the problem, consensus-based approaches make better sense. Consensus-based approaches may also make sense when there is a mis-match between decision-making authority and availability and/or conditioning of external funds.

24 – EXECUTIVE SUMMARY AND POLICY CONSIDERATIONS
MANAGING URBAN TRAFFIC CONGESTION – ISBN 978-92-821-0128-5 - © ECMT, 2007
There are pitfalls to be avoided. A consensus-led approach may lead to delay and inaction unless agreement can be reached quickly and sustained. A plan-led approach can become unduly dependent on professional planners, who may lose sight of the needs of politicians and some stakeholders. And a vision-led approach is critically dependent on the individual with the vision. If he or she leaves office, it may prove very difficult to avoid abandoning the strategy.
Typically, congestion cuts across jurisdictional boundaries and therefore the design and implementation of congestion management policies will require collaboration between different authorities. At the national level, it is important that policies make coordination between regional transport and urban planning bodies legally possible, and encouraged. This includes the design of funding mechanisms.
Implementing a congestion management strategy requires the collaboration of many different actors. Achieving consensus, commitment and public support for the formulation of the strategy requires even wider. Wide participation can ensure that the full range of objectives is considered. It can provide a better understanding of transport problems, help generate innovative solutions and be a key factor in gaining public support and acceptability for the final mix of policies. Early participation can save time and money later in the process, particularly at the implementation stage, as potential objections should have been minimised by taking stockholder’s concerns into account. Best practice shows that involving actors who have a “stake” in achieving adequate solutions for the congestion problem often helps prevent breakdowns in the process.
What then to do about Congestion?
Excessive congestion and degraded road traffic conditions are not an unavoidable outcome of city life. This report highlights that much can and should be done to better manage congestion in large urban areas.
Tackling congestion can deliver lasting benefits for the entire urban region. However, mitigating congestion in urban areas requires much more than selecting one or two “silver bullets”. There are no “miracle” solutions – long-term congestion outcomes will only be delivered through a well-framed process that addresses congestion in all its aspects at the metropolitan level in ways that include:
• Understanding what congestion is and how it affects the urban region.
• Developing and monitoring relevant congestion indicators.
• Intervening to improve the reliability of urban travel, to release existing capacity or to provide new infrastructure and, perhaps most importantly.
• Managing demand for road and parking space consistent with a shared vision on how the city should develop.
The success or failure cities experience in tackling congestion will ultimately depend on how well they organise themselves to carry out the task they set for themselves. This report seeks to provide decision-makers and transport system managers evidence from experience around the world to help them acquire the tools they will need to implement effective congestion management policies.

EXECUTIVE SUMMARY AND POLICY CONSIDERATIONS – 25
MANAGING URBAN TRAFFIC CONGESTION – ISBN 978-92-821-0128-5 - © ECMT, 2007
NOTES
1. This list of questions is based on a similar list in the Victoria (Australia) Competition and Efficiency
Commission’s draft report “Making the Right Choices: Options for Managing Traffic Congestion” released in April 2006. (VCEC, 2006).
2. Congestion can describe the performance of traffic on roads, of public transport systems, of rail networks, of airport slots, etc. This report, however, will focus principally on road traffic congestion – while recognizing that congestion management policy must account for the performance of alternate modes such as public transport and rail.
3. It does not follow, however, that action should be taken to reduce congestion based solely on the travel-time savings that might result to existing users … given the impact of newly available capacity on use, policies should account for travel-time savings for users of the newly available capacity after the expansion and thus account for induced/generated demand effects.
4. Adapted from VCEC (2006), p. xvi.

DEFINING AND CHARACTERISING CONGESTION – 27
MANAGING URBAN TRAFFIC CONGESTION – ISBN 978-92-821-0128-5 - © ECMT, 2007
1. DEFINING AND CHARACTERISING CONGESTION
This chapter provides an important and often missed first step in developing congestion management policies – defining and understanding the nature of congestion in urban areas. It explores the nature of traffic congestion, how it has been defined and characterised and how it affects urban areas. It encourages broadening the perception of the scope and nature of traffic congestion in order to adopt a more holistic and effective approach to its management.
1.1 Introduction
Many a politician has been elected on the promise to do away with traffic congestion and many civil engineers and transport planners have spent their career attempting to carry out that promise. However, remarkably few have succeeded and where they have, their successes have been surprisingly limited in scope and short-lived.
Why such persistent failures and timid advances in the fight against congestion?
Congestion is typically described as a condition that arises when there is too much traffic for the road on which it travels. This seemingly straightforward definition, however, serves more to cloud the reality of congestion than to aid understanding. Traffic congestion is a complex outcome of an exceedingly complex system.
As with other complex systems, understanding the proximate causes of the phenomenon rarely provides enough insight into the overall system. While many studies of congestion approach the phenomenon intuitively “at the roadside” using measures of physical flow (capacity, speed, density, etc), this approach may not ultimately be very productive as it glosses over how congestion affects overall transport system performance and interacts with non-transport societal objectives (desired urban form, employment, land prices, etc…).
This chapter will take a step back and seek to outline a number of important factors that must be considered when seeking to address urban traffic congestion from a policy perspective. In particular, what should be considered when seeking to label and define congestion and what should be considered when seeking to understand how it is perceived. It re-examines the definition of congestion to widen the scope for understanding the phenomenon.
1.2 What is Congestion?
Most people know what congestion is and likely have their own definition of the phenomenon. However, when pressed, precise definitions of congestion rapidly give way to descriptive terms (e.g. “stopped traffic”) and causal explanations (e.g. “too much traffic”). These have resonance with those experiencing congestion but only contribute marginally to understanding the phenomenon. In a qualitative survey regarding road users’ perception of congestion, the UK’s Department for Transport found indeed that perceptions varied widely across users:
28 – DEFINING AND CHARACTERISING CONGESTION
MANAGING URBAN TRAFFIC CONGESTION – ISBN 978-92-821-0128-5 - © ECMT, 2007
The most important difference in usage is that some people apply the term congestion fairly narrowly to stationary or near-jam conditions, while others use it more broadly to describe any loss of speed due to weight of traffic. The narrower definition corresponds to what is usually seen as the most important type of congestion there is a widespread feeling that the situation is more bearable if you "keep rolling", but stop-start conditions and outright jams are often found hard to cope with.1
There is still no universally accepted definition of what exactly “congestion” is. This situation is further complicated by the fact that congestion is as much a physical phenomenon that can be quantitatively described as a subjectively experienced situation that varies from person to person and from place to place. While many people instinctively “know” what congestion is, few are able to say with any precision when a road starts to be “congested” and where it stops being so. This lack of precision complicates matters for transport policy since any effort to manage congestion should ideally be based on a shared understanding as to what it is that is being managed.
1.3 Defining Congestion
Congestion is both a physical phenomenon relating to the manner in which vehicles impede each others’ progression as demand for limited road space approaches full capacity … as well as a relative phenomenon relating to user expectations vis-à-vis road system performance.
Congestion in a vernacular sense is the inability to reach a destination in, or at, a satisfactory time due to slow or unpredictable travel speeds. But what then can be said about the precise meaning of the term “congestion”?
As noted, a quick review of most popular and/or research-oriented treatments of roadway congestion will reveal some permutation of the following phrase in the opening paragraphs:
Congestion is a situation in which demand for road space exceeds supply.
This is a correct definition as it identifies the central characteristic of congestion: e.g. the inadequacy of supply of road space vs. demand. However, it leaves much to be desired as an operational definition as it provides little insight into the multiple, complex and interconnected factors that lead to this mismatch of supply vs. demand. This definition has underpinned many efforts by transportation engineers to “solve” the problem of congestion by increasing supply – that is, by doing away with bottlenecks or expanding the capacity of the roadway network. In some circumstances, this has proven to be an effective response. Yet can it be said that roadway expansion – as a stand-alone policy – has “solved” much of anything vis-à-vis overall levels of congestion? Indeed there is solid evidence now that increases in roadway capacity may in many (but not all) circumstances lead to more roadway usage without alleviating overall congestion and/or impacting general accessibility2.
Furthermore neither demand nor capacity – nor even the definition of congestion itself – are “fixed” variables. Traffic demand varies significantly by time of day, day of the week, and season of the year, and is also subject to significant fluctuations due to recreational travel, special events, and emergencies. Available capacity, which is often viewed as being fixed, also varies constantly; being frequently reduced by lane-changing behaviour, speed differentials between vehicles, incidents (e.g. crashes and disabled vehicles), work zones, adverse weather, and other causes.3
Another approach to characterising congestion reduced the phenomenon to simple problem of hydraulic engineering. In this analogy, larger pipes allow for greater flows – e.g. by increasing the capacity of the roadway, more vehicles are able to pass and queues are eliminated. However, this
DEFINING AND CHARACTERISING CONGESTION – 29
MANAGING URBAN TRAFFIC CONGESTION – ISBN 978-92-821-0128-5 - © ECMT, 2007
approach ignores the essential nature of the system at hand; people – unlike water – adaptively choose where to go. Moreover, roads, unlike pipes, serve several functions in urban areas – many of which are not necessarily linked to transport activity.
A more sophisticated definition was formulated in a 1999 ECMT Round Table report. Here, J.M. Dargay and P.B. Goodwin and state that:
Congestion is the impedance vehicles impose on each other, due to the speed-flow relationship, in conditions where the use of a transport system approaches its capacity.
This definition highlights two defining attributes of congested roads. The first is that vehicles, and in particular, each new vehicle on the roadway, impose constraints on those already circulating. Congestion is both caused by vehicular traffic (for a given segment of road) and impacts that same traffic. The second attribute is encapsulated in the concept of the “speed-flow relationship”. This concept has served as the basis for understanding the mechanics of congestion and queue formation and has underpinned most operational responses to the problem. The definition above also highlights the fact that, because of inherent instability in the speed-flow relationship as demand nears roadway capacity, congestion can be said to exist before the physical capacity of the network is attained. However, as discussed later in this report, the speed-flow relationship referenced in this definition primarily describes traffic behaviour on links in uninterrupted flow facilities such as urban motorways – its relevance to understanding congestion on dense urban networks where flow is interrupted by signalised intersections and frequent access/egress points is somewhat limited.
Furthermore, the above definition still focuses on the proximate causes of congestion, i.e. too much demand for a particular segment and/or segments of the road network. This explanation begs a greater question: Why is the volume of traffic swamping the road infrastructure at that/those particular time(s) and place(s)?
This is a question to which there are no easy and/or obvious answers. This report examines many of the contributing factors but, in some ways, the answer may be more important from a strategic and longer term perspective rather than be of relevance for the day-to-day management of roadway networks.
This is not to say that the answer isn’t important – it is – but rather that developing a congestion-management policy based on one specific answer to the question posed above may not be as helpful as developing a congestion management policy that can effectively and flexibly address a rapidly changing environment where today’s answer to the above question is quickly supplanted by tomorrow’s reality – a reality which includes the changing expectations of roadway users.
User expectations are not static and these heterogeneous and changing expectations can influence how congestion is perceived and experienced. What passes for intolerable congestion in rural communities (where expectations of free-flow travel conditions are high) may not even register as an annoyance in a large metropolitan area. Likewise, while roadway users may tolerate relatively high levels of congestion during the weekday commute, they may find the same level – or any level – of congestion completely intolerable on a Sunday morning. The inherent difficulty in capturing user expectations renders the precise quantitative definition of congestion a difficult, if not impossible, task. In this respect, as the U.S. Federal Highway Administration notes:
Congestion is essentially a relative phenomenon that is linked to the difference between the roadway system performance that users expect and how the system actually performs.”4

30 – DEFINING AND CHARACTERISING CONGESTION
MANAGING URBAN TRAFFIC CONGESTION – ISBN 978-92-821-0128-5 - © ECMT, 2007
Users’ expectations regarding road system performance, therefore, are central to understanding how congestion is perceived and defined. The same levels of traffic might be perceived as either intolerably congested or acceptably slow according to where and by whom it is experienced. Road users in rapidly expanding cities might share the former view while those travelling on the roads of large mature conurbations might share the latter.
1.4 Excessive Congestion: When is there too much traffic?
Is all congestion excessive? If not, when, is the amount of congestion experienced on the transport network too much?
There are two ways of answering this question. The first is to say that congestion is excessive when people say it is so … but this does not account for what it would cost to bring congestion back down to levels that are tolerable. It may very well be that the cost of reducing congestion to these levels may be much greater than the costs imposed by congestion itself. A better way of defining excessive congestion has been formulated by the Victorian Competition and Efficiency Commission in Australia:
Congestion could be defined as being excessive when the marginal costs to society of congestion exceed the marginal costs of efforts to reduce congestion (such as adding to road or other transport infrastructure)56.
The notion of excessive congestion is centrally linked to the notion of “optimal” traffic levels (and, conversely, “optimal” levels of congestion). These are discussed later in the report.
1.5 What is it that congestion prevents us from accomplishing?
An alternative approach to characterising congestion for urban transport policy might start by asking the fundamental question: “What is it that congestion prevents us from accomplishing?”
Transport systems facilitate the rapid and predictable movement of people, vehicles and goods. Congestion, on the other hand, prevents traffic from moving freely, quickly and/or predictably. However, the benefits afforded to us by transport activity stem not from mobility itself, but, rather from what that mobility allows us to accomplish.
Most daily travel is not undertaken for its own sake. Rather, in almost all cases, people travel to access activities, people and services and goods travel to reach markets. Mobility, by itself, is generally considered not to have an intrinsic value but, rather, is often viewed as a derived demand. What value (and benefits) mobility delivers lies in the activities that mobility enables.
The transport system delivers first-order benefits through the access it grants individuals and firms to people, places, services and jobs and through the consumption possibilities it makes possible for goods rather than through the physical movement (or mobility) it facilitates. In the present case, it is therefore important to evaluate the impact of congestion with respect to access. Congestion’s impacts on mobility, while important, need to be seen in the context of whether they are consistent with the best overall accessibility outcomes.
A first answer therefore to the question “what is it that congestion prevents us from accomplishing?”, is that it prevents us from moving freely. This answer, however, says nothing about the manner in which congestion limits or reduces access.
DEFINING AND CHARACTERISING CONGESTION – 31
MANAGING URBAN TRAFFIC CONGESTION – ISBN 978-92-821-0128-5 - © ECMT, 2007
Areas that are characterised by low congestion may also have low accessibility whereas areas with high congestion may have high accessibility – and vice versa7. If one accepts that the demand for transport is derived from the demand for access, then one must also accept that mobility improvement and/or congestion relief per se cannot stand as independent goals for transport policy. These strategies must be linked to policies that deliver greater access for people.
Under such a framework, for example, it becomes clear that congestion is not a problem of too many people in one place at one time, but rather too many vehicles in one place at one time. Such a re-definition of the congestion problem may lead to a shift away from policies focused exclusively on providing more room for vehicles to flow freely to those providing for more options for people to get to their preferred destinations. In many instances, the former may still be the most appropriate policy, but without the framework of accessibility, the latter strategy might not even be considered.
Likewise, for those areas where it makes sense, strategies targeting land use management rather than infrastructure expansion or more efficient management of traffic operations may represent more cost-effective congestion reduction strategies. Finally, it should be noted that urban transport system performance writ large depends not only on travel conditions for cars and trucks but also for travel conditions for public transport. The role of public transport in delivering high levels of urban accessibility should not be underestimated since this mode of transport was expressly designed to move large numbers of people in a minimum amount of space thus reducing travellers’ impacts on limited infrastructure capacity.
There are however, two principal difficulties in using accessibility, rather than mobility, as a transport system performance benchmark. The first is that accessibility is a function of both a network (that falls under the jurisdiction of transport authorities) and a pattern of land use (that typically falls under the jurisdiction of other government agencies). The second is that the metrics of mobility (speed, flow, etc.) are much more developed, standardised and may be more familiar to transport authorities than the metrics of accessibility.
These two barriers are not insurmountable and many transport agencies have begun to investigate the manner in which accessibility can be operationalised as a transport system performance measure (box: access metrics, connectivity, resilience, examples). However, a third and more intractable difficulty remains. This difficulty has to do with what it is exactly people (as opposed to firms) are trying gain access to, and the influence this has on the mix of origins and destinations in a given region.
The conventional listing of people, places, goods, services and jobs generally relates to the universe of possible destinations that people might wish to access. Transport authorities and planners typically assume that policies that reduce the cost of access to destinations (e.g. by increasing travel speed or, alternatively, by allowing for greater density) deliver greater welfare benefits. However, people do not make household location choices solely in relation to the costs of access to preferred destinations (and therefore the cost of travel this implies). People also make household location choices based property costs, lifestyle choices and more generally what can be “accessed” at the “origin” – that is, at and in the home. These values may include more living space, detached housing, like neighbours, bucolic surroundings, better schools, etc… Transport policy that ignores in situ “access” as opposed to destination access will likely miss out on key factors to be considered when managing regional congestion.
Despite these caveats, it is important for transport authorities to keep in mind how transport system performance goals are formulated and the extent to which these communicate how well the
32 – DEFINING AND CHARACTERISING CONGESTION
MANAGING URBAN TRAFFIC CONGESTION – ISBN 978-92-821-0128-5 - © ECMT, 2007
system delivers better overall access as opposed to simply tracking the physical throughput of the system as measured through mobility.
A second answer to the question “what is it that congestion prevents us from accomplishing?” is that it reduces the time those affected have available to undertake other activities – including “productive” activities. It reduces the time we have to undertake other activities by either making travel longer through queuing or by imposing additional time “buffers” to ensure that scheduled activities are not impacted by unpredictable travel times. The complex issues of “time loss”, travel delay and schedule delay have an important bearing on our understanding of how it is that congestion negatively impacts society and will be discussed later in this report in Chapter 4.
1.6 Congestion and Agglomeration
Is all congestion always a bad outcome? Obviously – if one takes the amount and tone of public and policy discourse surrounding the topic – all congestion is bad and many have concluded that it is a sensible and desirable policy goal to eliminate it altogether. Kilometres of traffic slowed and stopped traffic, hours lost unproductively waiting in queues, frustration, stress, increased pollution – all of these are the result of what many feel to be one the most important dysfunctions faced by urban areas today.
Most roadway users view congestion as bad, most transport planners view it as bad and most elected officials equally view it as bad… who could possibly argue the contrary – e.g. that it is not all bad!
Economists could… and they have – as have any number of observers from such diverse fields as urban planning, sociology, etc. What these specialists share in common is that they have spent much time seeking to understand how urban regions function as a whole – and not just at how transport systems function within urban regions. So can congestion be explained away as something that is not necessarily all bad? – or, at least, as something that is less bad than people generally agree it to be?
Economists generally operate under the assumption that most people seek to maximise their welfare at the least possible cost. In this context, if crowded roads experience congestion, and people are crowding these roads, it must be because somehow those people derive some net welfare gain from being on the network, in their vehicle and at that time. Most queues should be seen as a trade-off between reaching a desired outcome and the time it takes to do so8. This is certainly true for queues for movie openings, popular attraction parks, renowned restaurants, sporting events, etc. so why should it not be for queues on roads?
Indeed, congestion is not so different – as noted by Anthony Downs of the Washington DC-based Brookings Institute:
“…congestion is the balancing mechanism that allows [people] to pursue certain goals that they strongly desire – goals other than rapid movement during peak hours.”9
People derive benefits from proximity to others and cities derive benefit from agglomeration10. These benefits accrue to creative, commercial, productive, leisure and other ventures and have been the principal motor behind the remarkable resilience of urban structure throughout history. Economists have sought to quantify these gains by investigating the impacts of agglomeration on productivity and have sought to describe the mechanisms by which these gains are delivered. There is a “buzz”11 about urban areas – be they low-density peripheries, new “edge” cities and/or dense city cores – that attracts

DEFINING AND CHARACTERISING CONGESTION – 33
MANAGING URBAN TRAFFIC CONGESTION – ISBN 978-92-821-0128-5 - © ECMT, 2007
people and firms and it is in the context of this that the losses imposed by congestion should be viewed. Congestion may not so much impose net losses as much as it reduces overall gains12.
So is congestion bad? The answer is nuanced. Congestion is a rationing of the existing transport network in order to allow users to achieve desired goals that may only be fulfilled in “crowded” urban areas. Congestion, while often regarded as a sign of transport policy shortcomings, is the outcome of successful economic development, employment, housing and cultural policies that make people want to live and work relatively close to each other and attract firms to benefit from the gains in productivity thus derived.13
Congestion and the Urban Economy
Most governments want to promote policies aimed at increasing the rate of economic growth. A prime interest of transport administrations is the contribution that investment in transport infrastructure and policies to manage congestion can make to a Government’s GDP target.
In most countries productivity tends to be higher in the major conurbations than in other parts of the country. Rents are higher because of the accessibility benefits that an urban location offers, wages are higher because jobs in these central locations are more productive and so output per head is higher. Policies which reduce travel delays and help to increase the number of jobs in these high productivity conurbations can therefore contribute to an increase in overall productivity.
Many high productivity conurbations experience high levels of congestion. As noted in this Chapter, congestion is, among other things, a sign of a successful economy. Indeed, a lack of adequate transport capacity, resulting in overcrowded conditions on public transport and slow and unreliable travel times by road is oftentimes typical of otherwise successful conurbations. People travelling in the course of their work to attend meetings or for other purposes and drivers of commercial vehicles making deliveries and servicing offices and shops are unproductive while travelling in overly crowded conditions. In addition, these conditions act as a constraint on employment growth as employees are reluctant to accept increasingly difficult commute trips. Policies aimed at managing congestion can help to provide for more efficient use of the road network and increase productivity by reducing the amount of time employees spend while travelling for business purposes. In addition, the funds raised in road user charging or parking charges provide the finance needed to increase the capacity of public transport.
The increase in capacity and the more efficient use of road space makes it possible for central area firms to increase overall employment levels. This results in an increase in overall productivity as employment shifts to high productivity locations from low and medium productivity jobs elsewhere in the country or attracts high income professionals from other countries. In addition, the dense patterns of employment that are typical of successful conurbations enable labour markets to function efficiently, with low costs associated with searching for and changing jobs.
While there is a well established theoretical foundation to explain the process whereby policies aimed at better managing or increasing the capacity of urban transport networks increase productivity and hence GDP, quantification of these effects is less well advanced. The UK’s Department for Transport has commissioned research on these impacts14 and has drawn up advice for local authorities bidding for transport funding to enable them to take account of transport’s contribution to GDP.
34 – DEFINING AND CHARACTERISING CONGESTION
MANAGING URBAN TRAFFIC CONGESTION – ISBN 978-92-821-0128-5 - © ECMT, 2007
Nonetheless, some forms of congestion are the direct outcome of poor or failed planning and/or system management in response to “outside” forces such as demographic and economic growth and/or land use patterns. In these cases, much can be done to better balance the specific disadvantages accruing from bottlenecks and overall traffic volumes with the benefits of dynamic, growing and prosperous urban areas.
1.7 Characterising Congestion: Key factors to consider
As noted previously, traffic congestion is a factor of the level of traffic, itself a function of how routes are selected by specific roadway users on a road network at a particular time.
1.7.1 Roadway Users and Congestion
It is important to bear in mind that congestion is not solely a physical phenomenon. At a micro level, billions of decisions are made by millions of individuals and/or firms resulting in hundreds of thousands of trips every day in urban areas. Congestion management policy should not lose focus on these users – not only because they are at the heart of the trips that flood the road network at certain times, but also because any successful policy must deliver benefits that are perceivable to these users.
Congestion management policy has often reflected the point of view of the network manager with the assumption that the latter’s performance criteria centred on speeds and link-based travel times closely mirrored those of roadway users. This assumption has led to policies that have sought to increase speeds and reduce delays. However, it is not at all clear that users are exclusively focused on travel speeds and delay – or that when they are, they share the same reference points as network managers. Furthermore, not all users are alike; they value time savings, schedule delay, travel speed improvements each in various degrees15.
The perceived impact of congestion experienced by users may be different from its “objective” impact as physically measured by network managers. This is especially so when considering the perception of time. Travel time, even when spent in congestion, is not necessarily viewed as a “burden” by many users. Users form expectations based on first-hand experience regarding the amount of time it takes for “normal” trips. When this experience routinely includes travel within congested conditions, expected travel times include congested travel. While expecting and accepting are two different things, many researches have pointed out that many travellers do accept routine levels of congestion. Many transport economists have also pointed out that “optimal” congestion charges – that is those charges that users are willing to pay in order to maximise the utility they derive from using the roadways accounting for the full range of costs their travel imposes – lead not to the disappearance of congestion, but rather to its reduction to “tolerable” levels.
Increasing the predictability of travel times is important when seeking to prioritise congestion policies – unexpected congestion is often perceived much more negatively and experienced much more strongly by users than “normal” background levels of congestion16. Figure 1.1 provides a conceptual illustration of this point. Here, two reference cases are considered. The first on the left has more evenly distributed travel speeds but the average speed is lower than in the second case to the right where travel speeds are more variable but average speed (for the week) is higher. In the first case, users are likely to view travel conditions as predictable and therefore tolerable since they can plan around consistent trip times. In the second case, the disutility of being unexpectedly caught in traffic and the repercussions unpredictable travel times may have on individuals engenders stress and imposes a burden on roadway users. However, if only weekly average travel speeds were used as a system performance yardstick, the first case may be seen as “worse” off than the second.

DEFINING AND CHARACTERISING CONGESTION – 35
MANAGING URBAN TRAFFIC CONGESTION – ISBN 978-92-821-0128-5 - © ECMT, 2007
Figure 1.1. Average Speed, Specific Speeds and the Perception of the Congestion Burden
0
10
20
30
40
50
Monday Tuesday Wednesday Thursday Friday
Average speed =33.8 km/hrUser perception = Tolerable conditionsOperator perception based on average speed= worse
Average speed= 35.2 km/hrUser perception = intolerable/stress conditionsOperator perception based on average speed=better
Ave
rage
spe
ed
Source: ECMT, 2007.
Figure 1.2. Road User Perception of System Performance
annual averageTraveltime
Jan. Jul. Dec.
How traffic conditions have beencommunicated to users
Traveltime
Jan. Jul. Dec.
How users experience traffic…… and what they remember
II. Road user perception of improvements: travel time vs. travel reliability
I. Average vs. real system performance
Small improvement inaverage travel times
Traveltime
2003 2004 2005
Average day
2003 2004 2005
Traveltime
Avg. worst dayof the month
Large improvement in reliability
annual averageTraveltime
Jan. Jul. Dec.
How traffic conditions have beencommunicated to users
annual averageannual averageTraveltime
Jan. Jul. Dec.
How traffic conditions have beencommunicated to users
Traveltime
Jan. Jul. Dec.
How users experience traffic…… and what they remember
II. Road user perception of improvements: travel time vs. travel reliability
I. Average vs. real system performance
Small improvement inaverage travel times
Traveltime
2003 2004 2005
Average dayTraveltime
2003 2004 2005
Average day
2003 2004 2005
Traveltime
Avg. worst dayof the month
Large improvement in reliability
2003 2004 2005
Traveltime
Avg. worst dayof the month
Large improvement in reliability
Source: USFHWA, “Travel time reliability: Making it there on time, all the time”, 2006.

36 – DEFINING AND CHARACTERISING CONGESTION
MANAGING URBAN TRAFFIC CONGESTION – ISBN 978-92-821-0128-5 - © ECMT, 2007
Figure 1.3. Main Problems Caused by Congestion: Survey by the United Kingdom Office for National Statistics (2001)
Being late/missed appointment
Having to allow extra time
Unpredictable journey times
Stress/anger
Having to travel at another time
Wasting fuel
Breathing in exhaust fumes
Tiredness
Road rage (other drivers)
Not making some journeys at all
0 20 40 60 80
Unprompted
Prompted
Being late/missed appointment
Having to allow extra time
Unpredictable journey times
Stress/anger
Having to travel at another time
Wasting fuel
Breathing in exhaust fumes
Tiredness
Road rage (other drivers)
Not making some journeys at all
0 20 40 60 80
Unprompted
Prompted
Source. UK DFT, 2001.
Another way to understand the road user perspective in relation to travel time variability is to understand that most road users do not retain average travel times when considering their travel experiences but, rather, remember principally the worst days where their travel was unexpectedly delayed.17 Figure 1.2 illustrates this point and shows how a small improvement in average travel times may indeed be much less important than the large improvement in reliability (and related large improvement in travel conditions experienced by users) that may have resulted.
Research in a number of countries points to the importance of predictable travel times to road users. For example, a survey carried out by the United Kingdom Office for National Statistics revealed that most drivers surveyed felt that some of the most important problems relating to congestion were those that resulted from missed appointments and unpredictable travel times (see Figure 1.3). In the former case, one can assume that missed appointments are also a function of unpredictable travel times since if travel time predictions by the drivers had held true, one can assume that most appointments would have been made on time.
While unpredictable travel is almost always perceived negatively, overall travel time – even in routinely congested conditions is not always regarded in the same manner. In fact, time spent in traffic is even seen as a positive experience by some roadway users. University of California Davis researcher P. Mohktarian has pointed out that the only two places where adults are fully in control of their immediate environment is while in their car alone or in the bathroom. On-board entertainment systems, advances in vehicular comfort, mobile communications and computing have all contributed top making the drive-alone experience something that many look forward to, rather than dread. If transport authorities ignore this factor, they may find themselves puzzled at the remarkable resilience of demand for car-travel even in consistently congested conditions.
Another point to bear in mind is that time is not perceived uniformly by all roadway users in all instances. There is evidence of a disparity between objective “clock” time and the passage of time as perceived by roadway users. Time spent waiting or spent while in a state of frustration (as when expectations of travel times are not met) is often perceived by individuals as lasting longer than real “clock” time. Five minutes spent in unexpected congestion may be perceived by those caught in it as
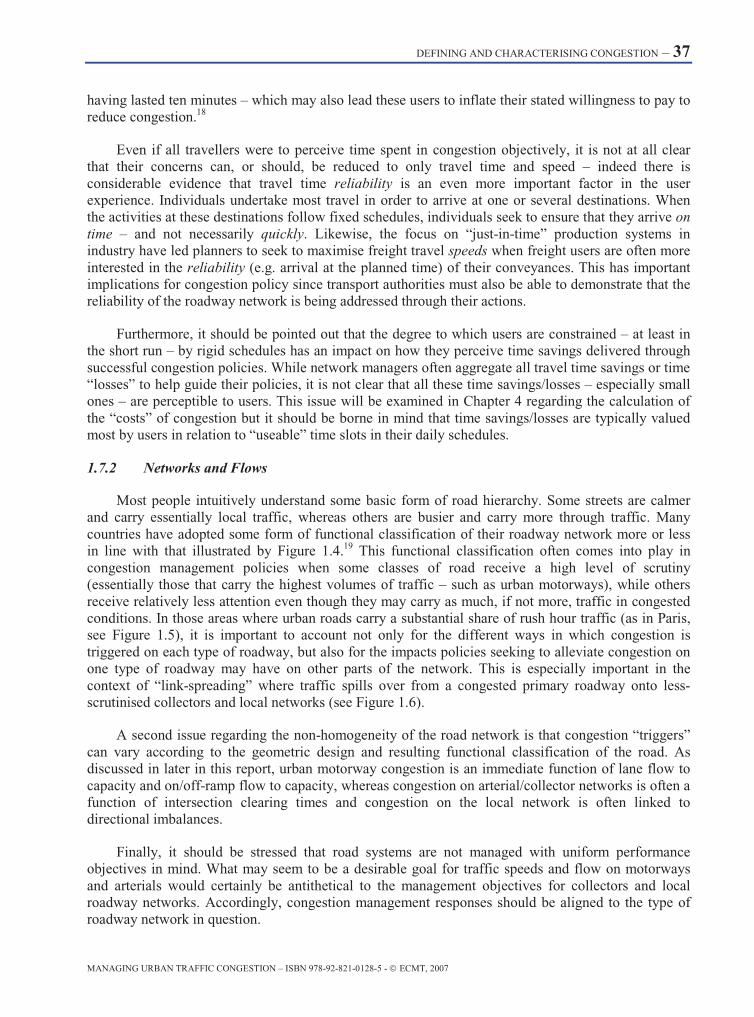
DEFINING AND CHARACTERISING CONGESTION – 37
MANAGING URBAN TRAFFIC CONGESTION – ISBN 978-92-821-0128-5 - © ECMT, 2007
having lasted ten minutes – which may also lead these users to inflate their stated willingness to pay to reduce congestion.18
Even if all travellers were to perceive time spent in congestion objectively, it is not at all clear that their concerns can, or should, be reduced to only travel time and speed – indeed there is considerable evidence that travel time reliability is an even more important factor in the user experience. Individuals undertake most travel in order to arrive at one or several destinations. When the activities at these destinations follow fixed schedules, individuals seek to ensure that they arrive on time – and not necessarily quickly. Likewise, the focus on “just-in-time” production systems in industry have led planners to seek to maximise freight travel speeds when freight users are often more interested in the reliability (e.g. arrival at the planned time) of their conveyances. This has important implications for congestion policy since transport authorities must also be able to demonstrate that the reliability of the roadway network is being addressed through their actions.
Furthermore, it should be pointed out that the degree to which users are constrained – at least in the short run – by rigid schedules has an impact on how they perceive time savings delivered through successful congestion policies. While network managers often aggregate all travel time savings or time “losses” to help guide their policies, it is not clear that all these time savings/losses – especially small ones – are perceptible to users. This issue will be examined in Chapter 4 regarding the calculation of the “costs” of congestion but it should be borne in mind that time savings/losses are typically valued most by users in relation to “useable” time slots in their daily schedules.
1.7.2 Networks and Flows
Most people intuitively understand some basic form of road hierarchy. Some streets are calmer and carry essentially local traffic, whereas others are busier and carry more through traffic. Many countries have adopted some form of functional classification of their roadway network more or less in line with that illustrated by Figure 1.4.19 This functional classification often comes into play in congestion management policies when some classes of road receive a high level of scrutiny (essentially those that carry the highest volumes of traffic – such as urban motorways), while others receive relatively less attention even though they may carry as much, if not more, traffic in congested conditions. In those areas where urban roads carry a substantial share of rush hour traffic (as in Paris, see Figure 1.5), it is important to account not only for the different ways in which congestion is triggered on each type of roadway, but also for the impacts policies seeking to alleviate congestion on one type of roadway may have on other parts of the network. This is especially important in the context of “link-spreading” where traffic spills over from a congested primary roadway onto less-scrutinised collectors and local networks (see Figure 1.6).
A second issue regarding the non-homogeneity of the road network is that congestion “triggers” can vary according to the geometric design and resulting functional classification of the road. As discussed in later in this report, urban motorway congestion is an immediate function of lane flow to capacity and on/off-ramp flow to capacity, whereas congestion on arterial/collector networks is often a function of intersection clearing times and congestion on the local network is often linked to directional imbalances.
Finally, it should be stressed that road systems are not managed with uniform performance objectives in mind. What may seem to be a desirable goal for traffic speeds and flow on motorways and arterials would certainly be antithetical to the management objectives for collectors and local roadway networks. Accordingly, congestion management responses should be aligned to the type of roadway network in question.

38 – DEFINING AND CHARACTERISING CONGESTION
MANAGING URBAN TRAFFIC CONGESTION – ISBN 978-92-821-0128-5 - © ECMT, 2007
Figure 1.4. Typical Road Network Hierarchy
4. Motorways
2. Collecters
3. Arterials
1. Local network
Source: ECMT, 2007.
Figure 1.5. Ile de France Traffic on an “Average” Work Day: Allocation of Daily Vehicle Kilometres Travelled between Urban Motorways and City Streets
1 2 3 4 5 6 7 8 9 10 11 12 13 14 15 16 17 18 19 20 21 22 23 24
Time of day
Num
ber
of v
ehic
le/k
m (
mill
ion)
1
2
3
4
5
6
Urban motorways (36% of total V/km)
Urban roads (36% of total V/km)
1 2 3 4 5 6 7 8 9 10 11 12 13 14 15 16 17 18 19 20 21 22 23 24
Time of day
Num
ber
of v
ehic
le/k
m (
mill
ion)
1
2
3
4
5
6
Urban motorways (36% of total V/km)
Urban roads (36% of total V/km)
Urban motorways (36% of total V/km)
Urban roads (36% of total V/km)
Source: AirPARIF (2001).
The non-homogeneity of the road network also comes into play when congestion policies succeed in improving vehicle travel speeds on the urban roads. A fundamental tenet of urban planning is that roads in cities are not only “links” between places but also “spaces” in their own right extending from frontage buildings, across the sidewalk and onto the carriageway proper. In dense urban settings, the non-carriageway component of road space can be quite important (e.g. in the city of Paris, the

DEFINING AND CHARACTERISING CONGESTION – 39
MANAGING URBAN TRAFFIC CONGESTION – ISBN 978-92-821-0128-5 - © ECMT, 2007
carriageway accounts for 13.5 million m2 and sidewalks 10 million m2). Non-traffic use of road space includes parking, pedestrian travel, urban green space (when sidewalks are planted with trees or other vegetation), social space for residents, an extension of school facilities, commercial space for businesses (e.g. sidewalk cafés or cinema waiting lines) and an extension of roadside homes/apartments. The management of the roadway network to optimise the transport function of these spaces often ignores significant non-transport uses and users of roads.
Congestion policies that fail to recognise the non-transport functions of roads, can result in fluid traffic but poorly liveable urban neighbourhoods. Some countries have sought to refine their roadway classification scheme in order to capture some of the diversity of roadway uses and integrate these into the transport planning process. Table 1.1 illustrates the German roadway classification matrix.
Figure 1.6. “Link Spreading”: Spatial Spread of Rush-hour Traffic
time Source: ECMT, 2007.
Table 1.1. German Road Classification (According to RAS-N)
Outside of developed
areas Inside of developed areas
Non built-up Built-up Groups of Categories
Connecting Accessing
Providing space for non-
transport activities
Connection-Function level
A B C D E
Connecting primary cities I A I B I C I
Connecting supra-regional / regional II A II B II C II D II
Connecting municipalities III A III B III C III D III E III
Accessing areas IV A IV B IV C IV D IV E IV
Accessing local sections V A V – – D V E V
Accessing plots VI A VI – – – E VI
Usually not used –
Problematic
Very problematic
Not usable
Source: Forschungsgesellschaft für Straßen - und Verkehrswesen FGSV (Ed.) (1988): Richtlinien für die Anlagevon Straßen, Teil: Leitfaden für die funktionale Gliederung des Straßennetzes (RAS-N); Köln: FGSV-Verlag.

40 – DEFINING AND CHARACTERISING CONGESTION
MANAGING URBAN TRAFFIC CONGESTION – ISBN 978-92-821-0128-5 - © ECMT, 2007
1.7.3 Time
Finally, time is an important factor to consider when acting on congestion since road networks do not operate at capacity all of the time. It follows that congestion is a temporal phenomenon, affecting some periods more than others and some not at all. Which periods are affected is linked to the temporal scale (daily, weekly, monthly and/or yearly) and the timing of urban activities which is linked to decisions made by individuals and firms relating to the purpose of their trips.
Most people are acutely aware that space is “timed”. Shops operate on fixed schedules, children’s activities commence and end at fixed intervals and most work activity, despite all the discourse surrounding the long-awaited emancipation from the industrial age time-keeper, still takes place following a remarkably regimented schedule. Production systems depend also on fixed and reliable schedules in order to minimise “down” time and maximise productivity. Observed congestion follows a daily cyclical pattern that reflects activities that are constrained in time. For individuals, these timing decisions are taken in the context of household time budgets whereas logistical systems dictate the timing of production activities– including freight delivery – for firms. Typically, these cycles of traffic peaks and troughs have been principally influenced by the rigid and recurrent timing of the work day. Traffic has flowed to areas where jobs are concentrated in the morning and flowed back after the work day is completed in the early evening.
However, the “timing” of urban areas is not what it used to be. For one, congestion has had an impact on temporal travel patterns.
Most large urban areas experience some form of “peak” spreading of the rush hour as illustrated in Figures 4.2 and 4.3. Indeed, the “rush hour” has now become “rush hours” as congestion delays and trip departure re-scheduling have lead to a prolongation of congested road conditions. Congestion – or more precisely, congestion avoidance – is not the only factor in the observed peak hour spreading.
The timing of urban space has become more complex and while the rigid timing described above still is a major factor, its influence has somewhat become eroded. Shops are open longer, public services operate more flexibly and some work patterns have shifted away from the conventional “9-to5” schedule. There are a number of reasons for this including the shift from production activities to service-oriented urban economies, the massive influx of women in the workforce and the move towards globalised “24-hour” cities. 20 Congestion policies must account for these new and emerging temporal demands placed on the road network if they are to be effective.
Equally important is the observation that to some degree, congestion mitigation policies can themselves influence the “timing” of urban space. This is especially true for wider urban and sometimes national policies that have an impact on scheduled activities and services such as working hours, shop-opening hours and rules concerning the scheduling of freight delivery, removals, etc.
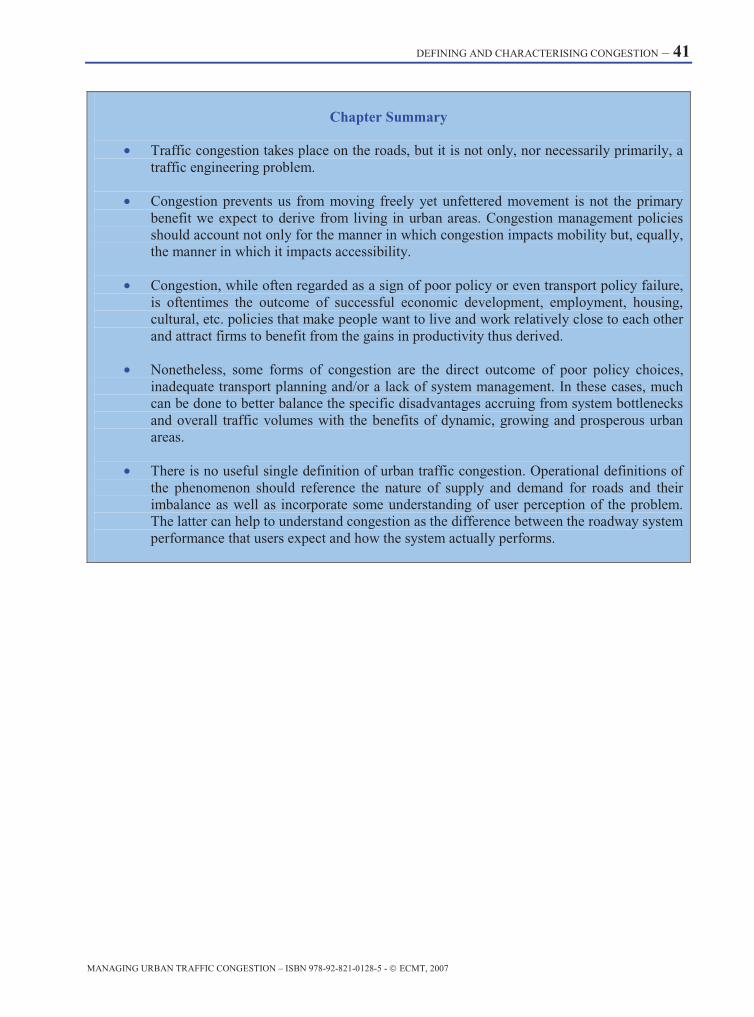
DEFINING AND CHARACTERISING CONGESTION – 41
MANAGING URBAN TRAFFIC CONGESTION – ISBN 978-92-821-0128-5 - © ECMT, 2007
Chapter Summary
• Traffic congestion takes place on the roads, but it is not only, nor necessarily primarily, a traffic engineering problem.
• Congestion prevents us from moving freely yet unfettered movement is not the primary benefit we expect to derive from living in urban areas. Congestion management policies should account not only for the manner in which congestion impacts mobility but, equally, the manner in which it impacts accessibility.
• Congestion, while often regarded as a sign of poor policy or even transport policy failure, is oftentimes the outcome of successful economic development, employment, housing, cultural, etc. policies that make people want to live and work relatively close to each other and attract firms to benefit from the gains in productivity thus derived.
• Nonetheless, some forms of congestion are the direct outcome of poor policy choices, inadequate transport planning and/or a lack of system management. In these cases, much can be done to better balance the specific disadvantages accruing from system bottlenecks and overall traffic volumes with the benefits of dynamic, growing and prosperous urban areas.
• There is no useful single definition of urban traffic congestion. Operational definitions of the phenomenon should reference the nature of supply and demand for roads and their imbalance as well as incorporate some understanding of user perception of the problem. The latter can help to understand congestion as the difference between the roadway system performance that users expect and how the system actually performs.

42 – DEFINING AND CHARACTERISING CONGESTION
MANAGING URBAN TRAFFIC CONGESTION – ISBN 978-92-821-0128-5 - © ECMT, 2007
NOTES 1. DFT (2005b).
2. See SACTRA (1994), Goodwin, P. (2006) and CPRE (2006) as well as discussion in Chapter 3.
3. This is addressed in more detail in Chapter 3.
4. “Is Congestion the Same Everywhere?” U.S. Federal Highway Administration. http://www.fhwa.dot.gov/congestion/congsame.htm.
5. Adapted from VCEC (2006), pg. xvi.
6. It does not follow, however, that action should be taken to reduce congestion based solely on the travel-time savings that might result to existing users … given the impact of newly available capacity on use, policies should account for travel-time savings for users of the newly available capacity after the expansion and thus account for induced/generated demand effects.
7. Levine, J. and Garb, Y. (2002).
8. This begs the question as to whether “time” is the only or best currency for rationing scarce road space. In many other areas where resources are scarce and demand is high, markets seem to be the preferred mechanism for achieving efficient outcomes.
9. Downs, T. (2004), p. 6.
10. Indeed, crowding is one of the most important qualities of cities and has given rise to their importance over the millennia. For a review of the discussion on agglomeration impacts, see OECD, 2006.
11. Storper, M. and Venables, J. (2004).
12. There is some evidence that the “break-point” between cities that benefit from agglomeration and cities who suffer from too many of the downsides of agglomeration (including congestion) is somewhere 6 to 7 m inhabitants. (OECD, 2006).
13. For example, many German cities in the nineties experienced decreasing traffic densities and congestion on radial streets leading to the city centres. This of course was seen as a sign of successful traffic management policy by transport engineers. However, city planners and chambers of commerce viewed this trend with great trepidation as it clearly signalled to them the loss of jobs -- and the vitality and attraction of -- within the hearts of their cities.
14. DFT (2004d).
15. See Chapter 5.
16. NCHRP (2001b) and Levinson, et al (2004).
17. FHWA (2006b).
18. Small, K. and Brownstone, D. (2005), NCHRP (2001b) and Levinson, et al (2004).
19. In addition, many countries also employ some form of administrative classification in order to define management responsibilities for roadway infrastructure.
20. Drewe, P. (2004).

MEASURING CONGESTION: METHODS AND INDICATORS - 43
MANAGING URBAN TRAFFIC CONGESTION – ISBN 978-92-821-0128-5 - © ECMT, 2007
2. MEASURING CONGESTION: METHODS AND INDICATORS
This chapter discusses how congestion has been measured and explores the use of various indicators that can serve to guide congestion management policies. The methods and indicators outlined are relevant not only for policy appraisal purposes but also for determining the impacts and costs of congestion (Ch. 5).
2.1 Performance Measurement and Observational Bias
The manner in which congestion is measured has a fundamental impact on the manner in which congestion is defined and managed. Measures of congestion based alternately on speed, access, user costs, delay, reliability, etc. will give rise to different problem statements regarding congestion and will motivate sometimes radically different policy interventions. When incomplete or ill-adapted metrics are used to address congestion, policy-makers may find themselves wondering why it is that that the results fall well below their expectations.
Congestion impacts how the transport system facilitates high quality access. It does so by reducing mobility and thus, it is understandable that most congestion indicators relate to the manner in which either speeds are affected and/or delay is imposed by congestion. However, the measurement of congestion can take place at several levels, is carried out for different purposes and may be requested by, or target, different audiences. Table 2.1 illustrates those categories of people most typically interested by congestion and the specific concerns they may have regarding performance measurement.
Table 2.1. Congestion Indicators: Typical Audiences and their Concerns
At a micro level, roadway managers need congestion metrics that allow them to address operational concerns on specific roadway links. These may relate to road traffic density vs. capacity, to average speeds vs. rated and/or posted speeds and/or to speed/flow relationships on network links. This information is necessary in order to diagnose specific bottlenecks and compare link performance to overall performance.
However, these metrics are relatively difficult to aggregate and do not directly address the concerns of roadway system managers and/or roadway users. Furthermore, it is not at all certain that measuring traffic speeds on discrete network links provides a good basis for understanding overall
Speed Flow/Density Delay Reliability/Variability
Roadway Manager
Transport System Manager
Roadway User
Elected Official

44 – MEASURING CONGESTION: METHODS AND INDICATORS
MANAGING URBAN TRAFFIC CONGESTION – ISBN 978-92-821-0128-5 - © ECMT, 2007
traffic conditions in dense urban networks where most congestion and the “delay” it causes are generated at and by roadway access points and intersections.1
System managers need to understand how well the entire network – as opposed to individual links – is operating. System managers are typically concerned with how large volumes of vehicles on the network impact travel time – thus the importance of the measurement of delay.
Roadway users are most often concerned with trip-based metrics. “How much time should I plan for to have a reasonable chance of arriving at my destination on time?” is a recurrent and central question for trip decision-making for both individuals and firms and highlights the need for information regarding travel time reliability and variability of travel conditions.
Elected officials, while primarily concerned with the issues that are of concern to their electorate (e.g. travel time reliability and variability) also must be able to demonstrate in an easily comprehensible manner how they have (hopefully) had a positive impact on congestion. Elected officials must also have access to indicators that allow them to gauge the cost-effectiveness of their interventions.
There is no “simple” measure of congestion that is good for all purposes and all situations. The rating of a specific roadway segment’s performance as translated by hourly vehicle counts against rated capacity will mean little to a user even if they travel over that link every day. Conversely, knowing the amount of time one must plan for to get from one suburb to another at peak hours in order to arrive before 09:30 will not necessarily help an engineer better time traffic signals in the central business district. There are not necessarily “better” indicators of congestion than others, but there may exist a better fit between those indicators selected and specific outcomes desired. In this respect, it is important not to simply use a specific congestion indicator because it is available (others might be as well), but because it allows one to measure progress towards a specific goal (e.g. link performance, system operation, user experience, etc…)
Finally, when measuring congestion – with any indicator – one must keep in mind another form of observational bias. It is a truism in the literature regarding transport system performance measurement that “what gets measured, gets done”.2 However, the following corollary could easily be appended to that useful maxim: “what is seen, gets measured”. How congestion is observed – and especially where one looks for congestion – are fundamentally important issues.
There are several techniques for gathering the raw data necessary for measuring congestion (see box). These can be characterised as being based either on human observation (traffic management centres, police, news/private sector observers, etc) or some form of remote sensing (embedded magnetic loop detectors, automatic video feed-based counts, etc). While it may be conceptually possible to do so, none of these observation systems has yet been extended to the entire transport network of an urban region. What traffic managers see – and what indicators are communicated to different audiences – is only one part of the picture. The risk of bias lies in the temptation to interpret what one can see and measure as an easy, but not necessarily accurate, representation of the entire system. This is especially true for automatic remote sensing-based systems – e.g. just because performance on a “wired” motorway network shows improvement, it doesn’t necessarily follow that congestion is diminishing. It may have simply moved “out of sight” onto unmonitored local networks.

MEASURING CONGESTION: METHODS AND INDICATORS - 45
MANAGING URBAN TRAFFIC CONGESTION – ISBN 978-92-821-0128-5 - © ECMT, 2007
Traffic Surveillance Techniques
Point detection involves placing surveillance equipment at a specific location and using the measures of traffic performance at that location to estimate traffic performance over a segment of roadway. Point detectors generally report data on vehicle volume and lane occupancy (which when combined can be used to estimate vehicle speed), and when deployed in a "dual loop" configuration can also directly measure and report vehicle speed and vehicle classification (by length.) The primary limitation of point detectors is that they provide information about the performance about a single location, and that location may not be an accurate representation of the performance of the rest of the roadway segment to which those data are associated. This problem becomes less of a concern, the more closely spaced the point detectors. The main point detection methodologies are:
• Inductance loops are inexpensive to purchase, and are generally considered a robust, well known, reliable technology. However, inductance loops require lane closures for installation and for maintenance of the wire loop itself. In freeze/thaw climates, in pavements in poor condition, and if installation is poorly done, the wire can break, meaning that additional lane closures are required to replace the failed loop. In addition, because loops are physically "cut" into the pavement, they are not moveable, and thus must be replaced if lane lines are moved as a result of new construction activities or other geometric and operational changes.
• Video image detection technology was designed in part to deal directly with the limitations in loop technology. Because cameras are above ground, in many (but not all) instances, traffic lanes need not be closed to place, repair, maintain, or adjust the data collection devices. If lane lines are changed, detection zones in the camera image can often be "redrawn" without physically moving the camera system, thus allowing continued data collection without roadway closures or other significant disruptions to the facility or data collection system. However, video image detection techniques also have limitations. Most of these problems stem from the fact that video systems can only measure "what they see." Thus video systems tend to work poorly in low-visibility weather conditions (e.g., heavy snow and thick fog.) and at night. Thus, they are often not recommended for implementation in climates where these conditions occur frequently. Finally, cameras frequently require more routine maintenance than loop detectors, as dirt and water can reduce image clarity, thus degrading system performance.
• Microwave radar technology was developed, in part, in response to the limitations in loop and video technology. In particular, Microwave radar detection is not impacted by weather or low light conditions. Microwave radar does, however, have other minor limitations that generally result in slightly less accurate volume count information than obtained with loops and/or video detection. Like video detection, microwave radar can work from sensor positions either above the traffic lanes, or from beside the roadway. And also like video, the "above" locations provide more accurate data (less chance of occlusion) than the "side-fired" positions. Unfortunately, the "side fired" positions are usually less expensive to install, maintain, and repair because they do not require working within the constraints of moving traffic.
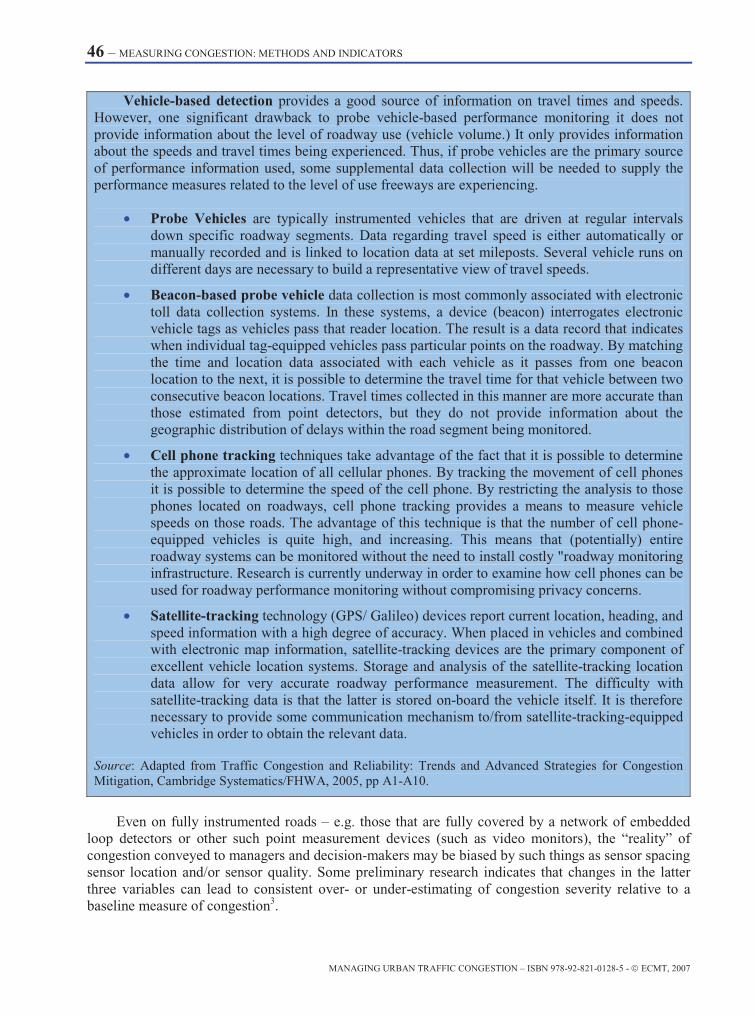
46 – MEASURING CONGESTION: METHODS AND INDICATORS
MANAGING URBAN TRAFFIC CONGESTION – ISBN 978-92-821-0128-5 - © ECMT, 2007
Even on fully instrumented roads – e.g. those that are fully covered by a network of embedded loop detectors or other such point measurement devices (such as video monitors), the “reality” of congestion conveyed to managers and decision-makers may be biased by such things as sensor spacing sensor location and/or sensor quality. Some preliminary research indicates that changes in the latter three variables can lead to consistent over- or under-estimating of congestion severity relative to a baseline measure of congestion3.
Vehicle-based detection provides a good source of information on travel times and speeds. However, one significant drawback to probe vehicle-based performance monitoring it does not provide information about the level of roadway use (vehicle volume.) It only provides information about the speeds and travel times being experienced. Thus, if probe vehicles are the primary source of performance information used, some supplemental data collection will be needed to supply the performance measures related to the level of use freeways are experiencing.
• Probe Vehicles are typically instrumented vehicles that are driven at regular intervals down specific roadway segments. Data regarding travel speed is either automatically or manually recorded and is linked to location data at set mileposts. Several vehicle runs on different days are necessary to build a representative view of travel speeds.
• Beacon-based probe vehicle data collection is most commonly associated with electronic toll data collection systems. In these systems, a device (beacon) interrogates electronic vehicle tags as vehicles pass that reader location. The result is a data record that indicates when individual tag-equipped vehicles pass particular points on the roadway. By matching the time and location data associated with each vehicle as it passes from one beacon location to the next, it is possible to determine the travel time for that vehicle between two consecutive beacon locations. Travel times collected in this manner are more accurate than those estimated from point detectors, but they do not provide information about the geographic distribution of delays within the road segment being monitored.
• Cell phone tracking techniques take advantage of the fact that it is possible to determine the approximate location of all cellular phones. By tracking the movement of cell phones it is possible to determine the speed of the cell phone. By restricting the analysis to those phones located on roadways, cell phone tracking provides a means to measure vehicle speeds on those roads. The advantage of this technique is that the number of cell phone-equipped vehicles is quite high, and increasing. This means that (potentially) entire roadway systems can be monitored without the need to install costly "roadway monitoring infrastructure. Research is currently underway in order to examine how cell phones can be used for roadway performance monitoring without compromising privacy concerns.
• Satellite-tracking technology (GPS/ Galileo) devices report current location, heading, and speed information with a high degree of accuracy. When placed in vehicles and combined with electronic map information, satellite-tracking devices are the primary component of excellent vehicle location systems. Storage and analysis of the satellite-tracking location data allow for very accurate roadway performance measurement. The difficulty with satellite-tracking data is that the latter is stored on-board the vehicle itself. It is therefore necessary to provide some communication mechanism to/from satellite-tracking-equipped vehicles in order to obtain the relevant data.
Source: Adapted from Traffic Congestion and Reliability: Trends and Advanced Strategies for Congestion Mitigation, Cambridge Systematics/FHWA, 2005, pp A1-A10.

MEASURING CONGESTION: METHODS AND INDICATORS - 47
MANAGING URBAN TRAFFIC CONGESTION – ISBN 978-92-821-0128-5 - © ECMT, 2007
Another matter to consider is that deploying comprehensive sensor arrays entails both costs and time. Typically, the expansion of a sensor-instrumented road network takes place slowly and incrementally with the most problematic portions of the network getting sensors first. In order to complete the picture of “reality” on the urban road network, increasingly sophisticated models have been combined with inputs from partially instrumented roads to create a satisfactory portrayal of traffic conditions and behaviour. Of course, the very deployment and maintenance of sensors responsible for monitoring road system performance can give rise to congestion. The roadwork associated with installing and repairing embedded loops entails the partial closure of the roadway which can trigger congestion if the work takes place during heavily travelled periods. In this respect, gantry-based systems can reduce these work-related costs and impacts.
2.2 Congestion Indicators
Table 2.2 inventories a broad set of indicators used across OECD/ECMT regions to track congestion. There are two general approaches for measuring congestion; an operational approach that has had the favour of those responsible for constructing and managing road networks and an economic-based approach that has generally been used to prioritise public expenditures for transport. The former is typically concerned with observable features of roadway performance (speed, flow, density, queue length and duration), whereas the latter has typically focused on extrapolating physical measures into monetary values that can then serve to guide policy through cost-benefit analysis.
In the former context, engineers have sought to deliver technically “optimal” roadway performance whereas economists have attempted to determine economically “optimal” levels of congestion. A review of national and regional practice among Working Group countries highlighted that the former approach – measuring physical and technical system performance – seems to be the overwhelmingly dominant approach.
Indicators that refer to time, service level or delay typically incorporate some arbitrary definition of the reference travel speed (e.g. free-flow as determined by design, legal operating speeds, or an arbitrary percentage of the free flow travel speed) that make no reference to what users may consider an economically optimal speed. Of course these indicators can be used as inputs to generalised cost calculations to derive economically optimal traffic levels. The use of such economically optimal traffic levels was surveyed as part of this study but most respondents confirmed that physical indicators and link flow maximisation were the main features of congestion measurement used in their experience. Furthermore, it seems that relatively few jurisdictions seem to track or otherwise monitor the variability of traffic performance via reliability indicators.
The manner in which these indicators are actually derived can be broken down into three broad approaches; those derived from point-related measurements (vehicle count, flow), temporal/speed indicators extrapolated or derived from the former (link travel time and delay) or spatial indicators (density, queue length, congested lane kilometres, etc). There is some evidence (see box), supported by the Working Group’s informal survey, that point-related measurements of travel time (delay, speed, travel time and Level of Service) dominate the measurement of congestion. There also seems to be mixed views on the accuracy of these indicators, alone, to deliver an accurate understanding of congestion on the roadway network.4
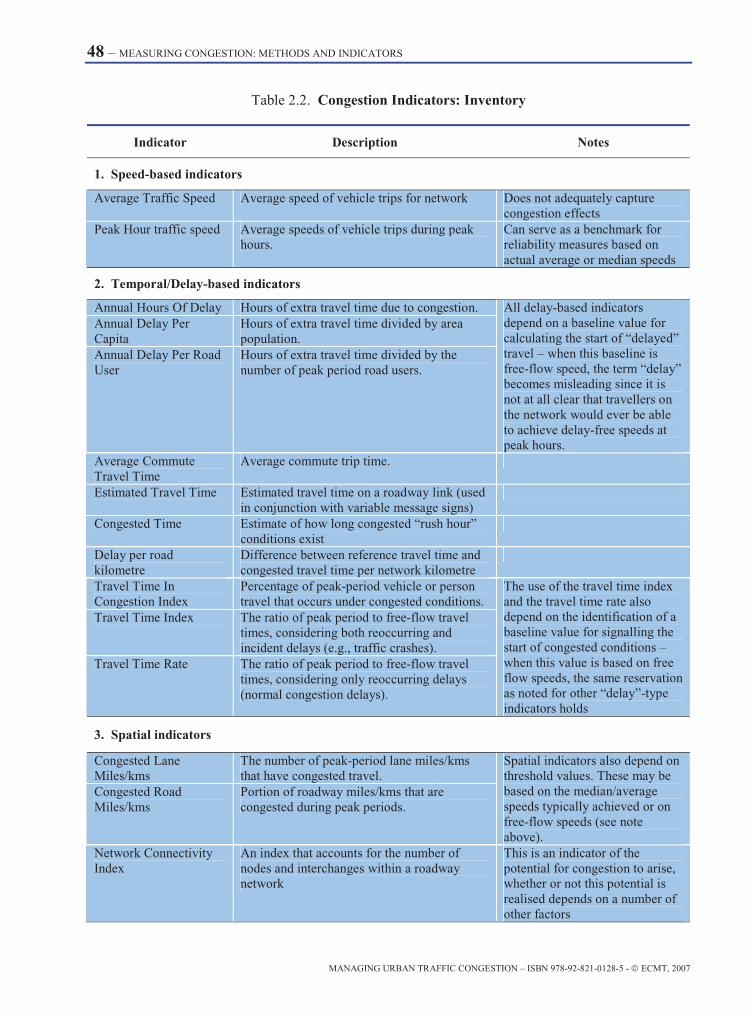
48 – MEASURING CONGESTION: METHODS AND INDICATORS
MANAGING URBAN TRAFFIC CONGESTION – ISBN 978-92-821-0128-5 - © ECMT, 2007
Table 2.2. Congestion Indicators: Inventory
Indicator Description Notes
1. Speed-based indicators
Average Traffic Speed Average speed of vehicle trips for network Does not adequately capture congestion effects
Peak Hour traffic speed Average speeds of vehicle trips during peak hours.
Can serve as a benchmark for reliability measures based on actual average or median speeds
2. Temporal/Delay-based indicators
Annual Hours Of Delay Hours of extra travel time due to congestion. Annual Delay Per Capita
Hours of extra travel time divided by area population.
Annual Delay Per Road User
Hours of extra travel time divided by the number of peak period road users.
All delay-based indicators depend on a baseline value for calculating the start of “delayed” travel – when this baseline is free-flow speed, the term “delay” becomes misleading since it is not at all clear that travellers on the network would ever be able to achieve delay-free speeds at peak hours.
Average Commute Travel Time
Average commute trip time.
Estimated Travel Time Estimated travel time on a roadway link (used in conjunction with variable message signs)
Congested Time Estimate of how long congested “rush hour” conditions exist
Delay per road kilometre
Difference between reference travel time and congested travel time per network kilometre
Travel Time In Congestion Index
Percentage of peak-period vehicle or person travel that occurs under congested conditions.
Travel Time Index The ratio of peak period to free-flow travel times, considering both reoccurring and incident delays (e.g., traffic crashes).
Travel Time Rate The ratio of peak period to free-flow travel times, considering only reoccurring delays (normal congestion delays).
The use of the travel time index and the travel time rate also depend on the identification of a baseline value for signalling the start of congested conditions – when this value is based on free flow speeds, the same reservation as noted for other “delay”-type indicators holds
3. Spatial indicators
Congested Lane Miles/kms
The number of peak-period lane miles/kms that have congested travel.
Congested Road Miles/kms
Portion of roadway miles/kms that are congested during peak periods.
Spatial indicators also depend on threshold values. These may be based on the median/average speeds typically achieved or on free-flow speeds (see note above).
Network Connectivity Index
An index that accounts for the number of nodes and interchanges within a roadway network
This is an indicator of the potential for congestion to arise, whether or not this potential is realised depends on a number of other factors
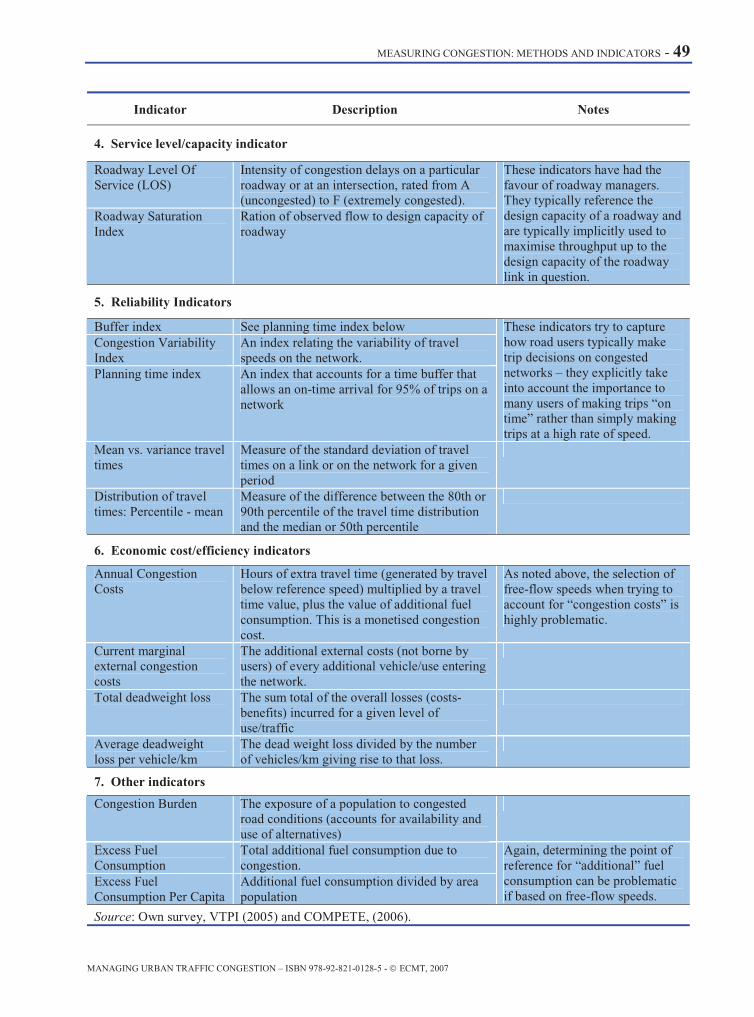
MEASURING CONGESTION: METHODS AND INDICATORS - 49
MANAGING URBAN TRAFFIC CONGESTION – ISBN 978-92-821-0128-5 - © ECMT, 2007
Indicator Description Notes
4. Service level/capacity indicator
Roadway Level Of Service (LOS)
Intensity of congestion delays on a particular roadway or at an intersection, rated from A (uncongested) to F (extremely congested).
Roadway Saturation Index
Ration of observed flow to design capacity of roadway
These indicators have had the favour of roadway managers. They typically reference the design capacity of a roadway and are typically implicitly used to maximise throughput up to the design capacity of the roadway link in question.
5. Reliability Indicators
Buffer index See planning time index below Congestion Variability Index
An index relating the variability of travel speeds on the network.
Planning time index An index that accounts for a time buffer that allows an on-time arrival for 95% of trips on a network
These indicators try to capture how road users typically make trip decisions on congested networks – they explicitly take into account the importance to many users of making trips “on time” rather than simply making trips at a high rate of speed.
Mean vs. variance travel times
Measure of the standard deviation of travel times on a link or on the network for a given period
Distribution of travel times: Percentile - mean
Measure of the difference between the 80th or 90th percentile of the travel time distribution and the median or 50th percentile
6. Economic cost/efficiency indicators
Annual Congestion Costs
Hours of extra travel time (generated by travel below reference speed) multiplied by a travel time value, plus the value of additional fuel consumption. This is a monetised congestion cost.
As noted above, the selection of free-flow speeds when trying to account for “congestion costs” is highly problematic.
Current marginal external congestion costs
The additional external costs (not borne by users) of every additional vehicle/use entering the network.
Total deadweight loss The sum total of the overall losses (costs-benefits) incurred for a given level of use/traffic
Average deadweight loss per vehicle/km
The dead weight loss divided by the number of vehicles/km giving rise to that loss.
7. Other indicators
Congestion Burden The exposure of a population to congested road conditions (accounts for availability and use of alternatives)
Excess Fuel Consumption
Total additional fuel consumption due to congestion.
Excess Fuel Consumption Per Capita
Additional fuel consumption divided by area population
Again, determining the point of reference for “additional” fuel consumption can be problematic if based on free-flow speeds.
Source: Own survey, VTPI (2005) and COMPETE, (2006).
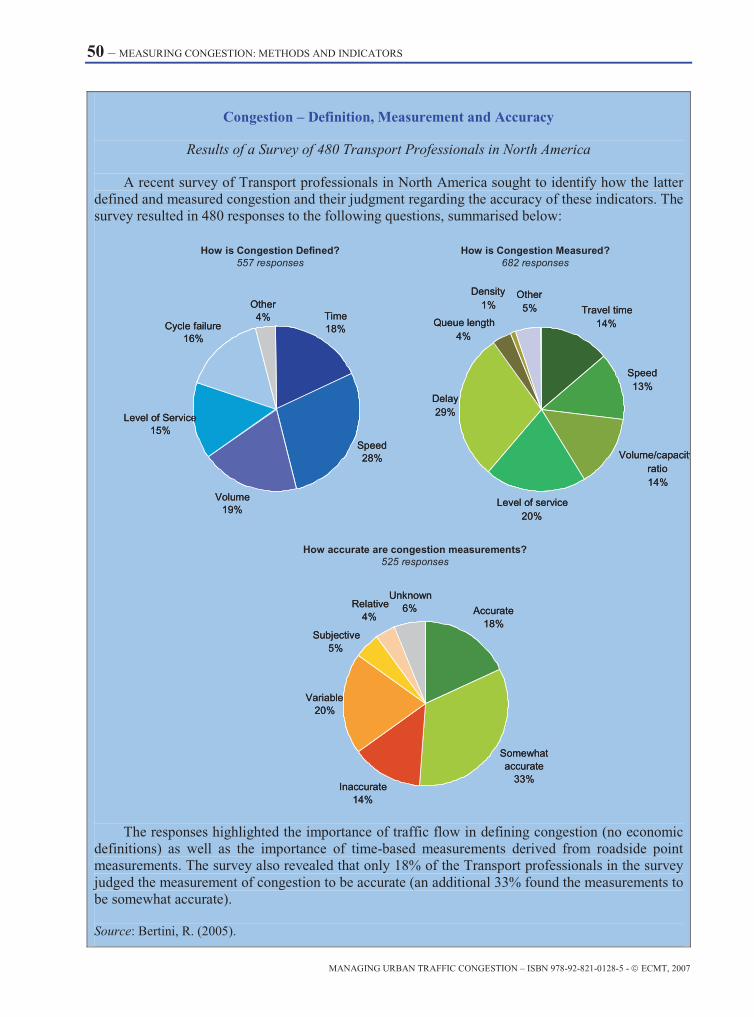
50 – MEASURING CONGESTION: METHODS AND INDICATORS
MANAGING URBAN TRAFFIC CONGESTION – ISBN 978-92-821-0128-5 - © ECMT, 2007
Congestion – Definition, Measurement and Accuracy
Results of a Survey of 480 Transport Professionals in North America
A recent survey of Transport professionals in North America sought to identify how the latter defined and measured congestion and their judgment regarding the accuracy of these indicators. The survey resulted in 480 responses to the following questions, summarised below:
Time18%
Speed28%
Volume19%
Level of Service15%
Cycle failure16%
Other4% Time
18%
Speed28%
Volume19%
Level of Service15%
Cycle failure16%
Other4%
Travel time14%
Speed13%
Volume/capacityratio14%
Level of service20%
Delay29%
Queue length4%
Density1%
Other5% Travel time
14%
Speed13%
Volume/capacityratio14%
Level of service20%
Delay29%
Queue length4%
Density1%
Other5%
Accurate18%
Somewhat accurate
33%Inaccurate
14%
Variable20%
Subjective5%
Relative4%
Unknown6% Accurate
18%
Somewhat accurate
33%Inaccurate
14%
Variable20%
Subjective5%
Relative4%
Unknown6%
How is Congestion Defined?557 responses
How is Congestion Measured?682 responses
How accurate are congestion measurements?525 responses
The responses highlighted the importance of traffic flow in defining congestion (no economic definitions) as well as the importance of time-based measurements derived from roadside point measurements. The survey also revealed that only 18% of the Transport professionals in the survey judged the measurement of congestion to be accurate (an additional 33% found the measurements to be somewhat accurate).
Source: Bertini, R. (2005).

MEASURING CONGESTION: METHODS AND INDICATORS - 51
MANAGING URBAN TRAFFIC CONGESTION – ISBN 978-92-821-0128-5 - © ECMT, 2007
Among the multitude of available indicators, one can discern three broad families of primary indicators and performance measurements that could usefully transmit a more accurate picture of congestion and its burden. These primary indicators of congestion could be used to track both system performance as well as to derive the economic impacts of congestion. These indicators relate to system performance in relation to:
1. Travel time (and thus the average speeds experienced on the roadway at peak hours).
2. Travel quality (and primarily to trip reliability and predictability).
3. The exposure of urban peak-hour travellers to roadway congestion (e.g. roadway users travelling on congested roads vs. all urban travellers in peak hours).
2.2.1 Travel Time Indicators
Of this triptych of indicator “families”, the first is most developed and most widespread. These measures of system performance can either only reference average speeds or can go one step further and try to relate these average speeds to some benchmark figure – typically free-flow speeds. Free flow speeds are those speeds which drivers self-select on what are commonly considered “empty” roads – e.g. roads with so few vehicles on them that vehicles do not impede each others progress. These speeds tend to gravitate around the maximum legal speeds posted for each road type although on urban roads these speeds might be less due to stops at intersections.
The use of free-flow speeds as a benchmark is understandable since it can be seen as a replicable and readily useable “objective” figure. Problems arise, however, when the difference between free-flow speeds and experienced speeds are labelled “delay”. Delay is the technically correct term for the difference but is often semantically misconstrued as referring to an attainable target for peak hour travel – e.g. “zero-delay”. As noted in the previous chapter, most dynamic cities cannot afford to deliver free-flow speeds at peak hours, nor would they want to live with a road network that could deliver these speeds at peak hours. Discourse based on delay as measured in reference to free-flow travel times can thus be biased towards an unattainable and likely undesirable congestion management goal (e.g. zero delay). In this case, the use of a outcome neutral indicators or indices are preferable.
Alternatives to Free-Flow baselines for Congestion Indicators: Examples from Canada
While many experts have argued that the use of free-flow speeds as a baseline measure for determining congestion levels leads to biased outcomes – especially for the calculation of congestion “costs”, finding easy to understand and use alternatives has been difficult. One interesting approach employed by the Ministère des Transports du Québec (MTQ) uses the notion of congestion acceptability “thresholds”. The MTQ argues that users expect and accept peak-hour congestion for their normal routes but view this congestion as “unacceptable” when it surpasses a threshold value.
For the purposes of a study investigating the impact of congestion in the greater Montréal region, this threshold was set at 60% of the posted speed limit (e.g. 60km/hr for a urban motorway posted at 100 km/hr or 30km/hr for an arterial posted at 50km/hr. This notion of thresholds was also taken up in a recent Canadian Federal government study investigating the costs of congestion in that country’s larger cities. The study employed three threshold values (50%, 60% and 70% of free-flow speeds) in its approach. This study stressed that while these speed bands give indicative values for congestion costs, there is no single “acceptable threshold” for all municipalities and for a given network. Local threshold values depend on local conditions (quantitatively) and local perceptions (qualitatively). Source: Transport Canada (2006).

52 – MEASURING CONGESTION: METHODS AND INDICATORS
MANAGING URBAN TRAFFIC CONGESTION – ISBN 978-92-821-0128-5 - © ECMT, 2007
Another way of side-stepping the issue of involuntarily biasing congestion management policies towards the delivery of free-flow travel speeds is to select speeds other than free-flow to serve as the benchmark value. These may be the legally posted speed or some manifestation of “normal” or “expected” travel speeds on the particular type of road type5. Such selected benchmarks can more realistically convey the deviation from expected travel speeds but make it difficult to compare different regions. Canada provides one example of how free-flow indicators can be nuanced for policy purposes (see box).
The average travel speed for a given road link and for a given representative period may seem to be a natural candidate for such a benchmark – but average speeds can hide the impact of extraordinary non-recurring congestion-causing events. Therefore, it may make more sense to select the median speed as opposed to the mean average speed as a reasonable proxy for use as an “expected” or “normal” travel time performance benchmark.
2.2.2 Travel Quality / Travel Time Variability Indicators
By travel quality, we mean principally those elements that contribute to smooth and predictable travel conditions. Travel-time variability and its converse, travel time predictability, are at the heart of this family of indicators. These metrics are important in order to provide system managers, roadway users and policy-makers with a realistic assessment of how well traffic and congestion management policies are delivering consistent and therefore “plan-able” travel times. Success in delivering such dependable travel conditions is important since these can greatly contribute to reduced traveller stress – even in light of relatively slow average travel speeds.
While travel times can vary according to departure time for different vehicles travelling at roughly the same time period on the same road (vehicle-to-vehicle variability), most travel-time variability indicators seek, rather, to capture the change in travel times for vehicles travelling during the same time periods on the same roads but on different days.
While habitual roadway users are likely to make a rough heuristic determination as to how much time they should account for in order to make a reasonable percentage of their trips on time based on their past experiences, this is not true for the large minority of those who have not sufficient experience to make such judgements. Research into roadway traffic composition has underscored that up to 20-40% of roadway users during peak hours are not habitual travellers for any given road.6 Congestion indicators that effectively relate the variability of travel times can allow non-habitual users to make realistic assessments of their travel time requirements (and the “time buffers” necessary to allow for in order to have a good chance of arriving on time) as well as provide more realistic assessments of habitual users’ travel and buffer time requirements.
Travel time variability can refer to the difference in travel time between different vehicles undertaking the same trip with the same departure and arrival times, the difference between the same trip undertaken at different departure and arrival times and/or the difference between the same trip undertaken at the same time on different days. It is the latter definition that will be the focus of this section.
In this context, the measure of variability is related to the frequency distribution, and the standard deviation, of the same trips started at the same time, but on different days – that is the day-to-day variation in travel times. The distribution provides insight into what is hidden by average speed data – namely, if the average is composed of more uniform and predictable trips or by highly diverse and unpredictable trips. Consider the distribution of travel times in Figure 2.1. The afternoon rush hour

MEASURING CONGESTION: METHODS AND INDICATORS - 53
MANAGING URBAN TRAFFIC CONGESTION – ISBN 978-92-821-0128-5 - © ECMT, 2007
times portrayed on the left are much more unpredictable than the tightly grouped distribution of evening travel times illustrated on the right.
Figure 2.1. Speed Distribution for Afternoon vs. Evening Travel Northbound I-5/I-45 in Orange County, California
Source: Oh, J-S and Chung, Y., 2006.
Figure 2.2. Distribution of Travel Times: State Route 520 Seattle, Eastbound, 4:00-7:00 p.m. Weekdays (11.5 Miles Long)
Source: FHWA, 2005.
Travel time/trip speed distributions often display a long right-hand “tail” indicating the presence of a few disproportionately long trip durations or low travel speeds as illustrated in Figure 2.2. . Targeting the causes behind the longest travel times and mitigating their impacts can significantly shift the distribution to the left (reducing average travel times) while at the same time tightening the distribution around the mean (making travel times more predictable) – thus delivering tangible benefits to road users (as illustrated figuratively in Figure 2.3).

54 – MEASURING CONGESTION: METHODS AND INDICATORS
MANAGING URBAN TRAFFIC CONGESTION – ISBN 978-92-821-0128-5 - © ECMT, 2007
Figure 2.3. Hypothetical Impacts on the Distribution of Travel Times and Total Travel Time of Eliminating the Worst 25th Percentile Travel Times
Deriving Reliability Indicators
Three principal approaches are used to determine reliability indicators. These are:
The mean versus variance approach. Unreliability is measured as the standard deviation (or variance) of the travel time distribution. Data for the valuation of the standard deviation can be obtained by including in a stated preference survey both a representation of the variance and the mean travel time as attributes.
Percentiles of the travel time distribution. Unreliability is measured as the difference between the 80th or 90th percentile of the travel time distribution and the median or 50th percentile. Again the valuation can be derived from stated preference experiments among travelers.
Scheduling models. Unreliability is measured as the number of minutes that one will depart or arrive earlier or later than preferred (schedule delay). This can also be offered as an attribute in a stated preference experiment, together with other attributes such as journey duration and travel cost.
Source: from Hamer, R et al. (2005).
It is the difference between the number of “long” trips and the “average” trip that conveys the variability of travel for the roadway in question. This can be expressed either in terms of standard deviations or in terms of travel times/speeds for the xth percentile of the distribution (see Figure 2.4). Work investigating the suitability of reliability indicators seems to suggest that using the median value of the travel time distribution is better than using the mean and the 90th percentile value is a better reference than the standard deviation.7
Administrations communicating information on travel time variability to users have often done so by converting information relative to the travel time distribution into more intuitively understood concepts such as “buffer” or “planning” time. In the former instance, managers select a percentile value that reflects the most extreme travel times that users are likely to encounter and communicate this as either a “buffer-time” value that users should use in their trip planning. In the latter instance, the roadway managers derive an indicator of “planning time” by comparing the selected extreme percentile value to the mean/median travel time value. Thus, if the 95th percentile travel time along a corridor takes 20 minutes, users should plan on taking that long to travel in order to make 19 out of 20 (95%) of trips on time – even if the average travel time is much shorter. Large differences between the upper travel time percentiles and the mean travel time values indicate unstable and unpredictable travel conditions whereas small differences indicate relatively stable and predictable travel conditions.
System Reliability Indicators: The UK example
The UK Department for Transport has set a public service agreement (PSA) target for reducing the unreliability of inter-urban journeys on the trunk road network, for which the Department has direct responsibility. By 2007-08, journeys on the strategic road network should be made more reliable such that:
• The target will be achieved if the average vehicle delay on the Strategic Road Network's 10% slowest journeys is less in 2007-08 than in the baseline period.
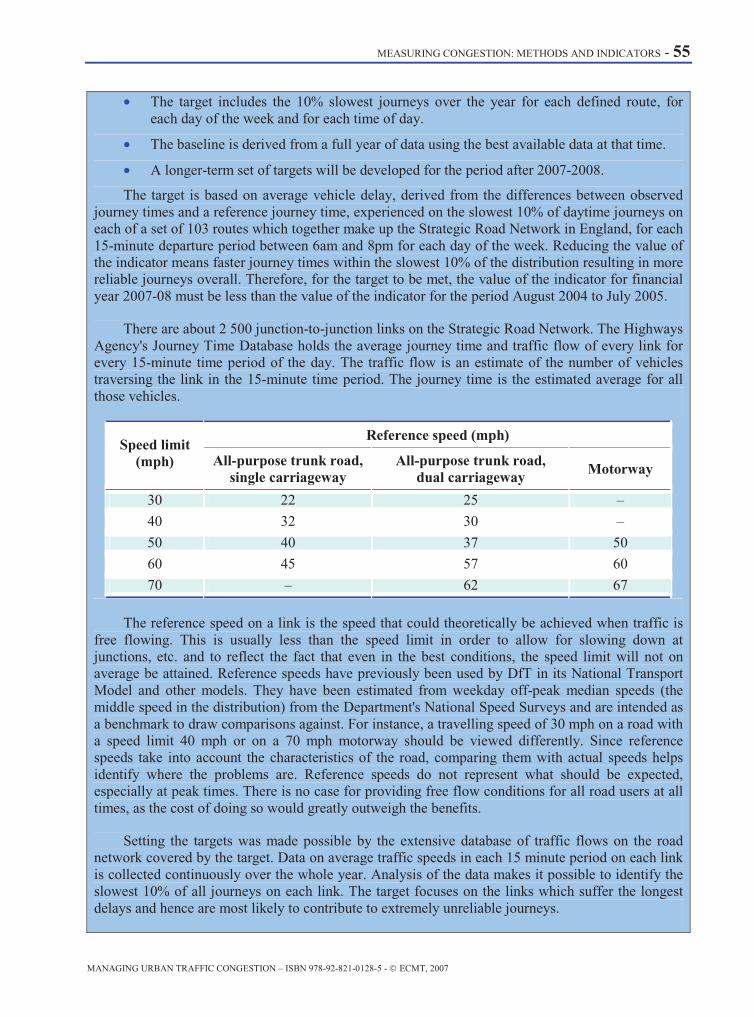
MEASURING CONGESTION: METHODS AND INDICATORS - 55
MANAGING URBAN TRAFFIC CONGESTION – ISBN 978-92-821-0128-5 - © ECMT, 2007
• The target includes the 10% slowest journeys over the year for each defined route, for each day of the week and for each time of day.
• The baseline is derived from a full year of data using the best available data at that time.
• A longer-term set of targets will be developed for the period after 2007-2008.
The target is based on average vehicle delay, derived from the differences between observed journey times and a reference journey time, experienced on the slowest 10% of daytime journeys on each of a set of 103 routes which together make up the Strategic Road Network in England, for each 15-minute departure period between 6am and 8pm for each day of the week. Reducing the value of the indicator means faster journey times within the slowest 10% of the distribution resulting in more reliable journeys overall. Therefore, for the target to be met, the value of the indicator for financial year 2007-08 must be less than the value of the indicator for the period August 2004 to July 2005.
There are about 2 500 junction-to-junction links on the Strategic Road Network. The Highways Agency's Journey Time Database holds the average journey time and traffic flow of every link for every 15-minute time period of the day. The traffic flow is an estimate of the number of vehicles traversing the link in the 15-minute time period. The journey time is the estimated average for all those vehicles.
Reference speed (mph) Speed limit
(mph) All-purpose trunk road, single carriageway
All-purpose trunk road, dual carriageway Motorway
30 22 25 –
40 32 30 –
50 40 37 50
60 45 57 60
70 – 62 67
The reference speed on a link is the speed that could theoretically be achieved when traffic is free flowing. This is usually less than the speed limit in order to allow for slowing down at junctions, etc. and to reflect the fact that even in the best conditions, the speed limit will not on average be attained. Reference speeds have previously been used by DfT in its National Transport Model and other models. They have been estimated from weekday off-peak median speeds (the middle speed in the distribution) from the Department's National Speed Surveys and are intended as a benchmark to draw comparisons against. For instance, a travelling speed of 30 mph on a road with a speed limit 40 mph or on a 70 mph motorway should be viewed differently. Since reference speeds take into account the characteristics of the road, comparing them with actual speeds helps identify where the problems are. Reference speeds do not represent what should be expected, especially at peak times. There is no case for providing free flow conditions for all road users at all times, as the cost of doing so would greatly outweigh the benefits.
Setting the targets was made possible by the extensive database of traffic flows on the road network covered by the target. Data on average traffic speeds in each 15 minute period on each link is collected continuously over the whole year. Analysis of the data makes it possible to identify the slowest 10% of all journeys on each link. The target focuses on the links which suffer the longest delays and hence are most likely to contribute to extremely unreliable journeys.
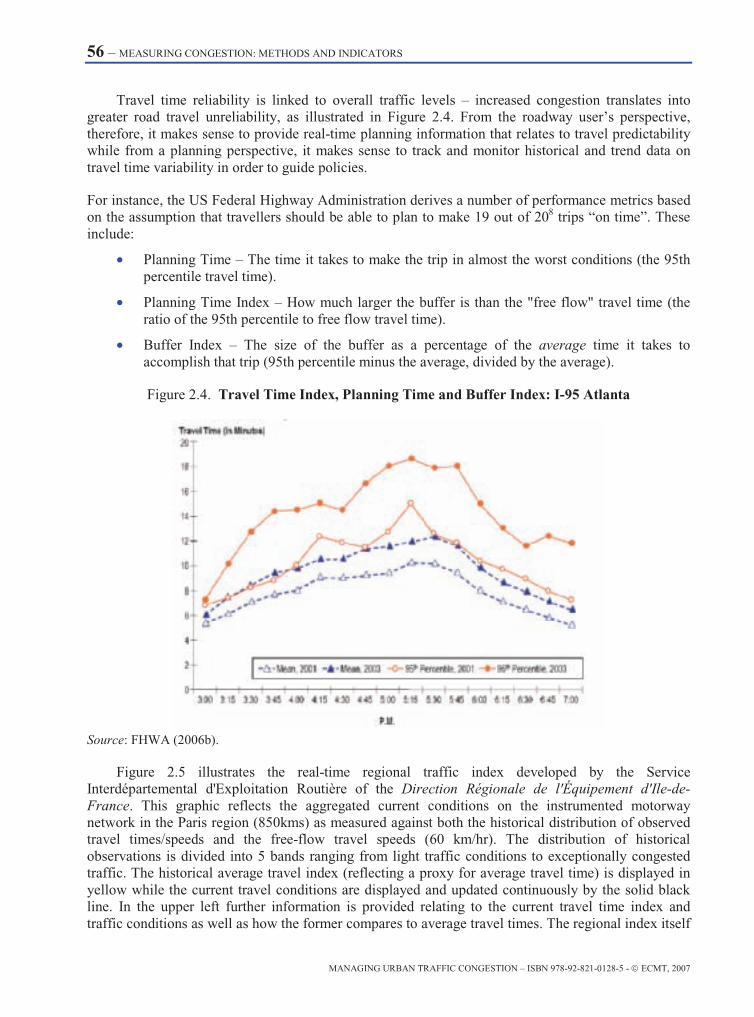
56 – MEASURING CONGESTION: METHODS AND INDICATORS
MANAGING URBAN TRAFFIC CONGESTION – ISBN 978-92-821-0128-5 - © ECMT, 2007
Travel time reliability is linked to overall traffic levels – increased congestion translates into greater road travel unreliability, as illustrated in Figure 2.4. From the roadway user’s perspective, therefore, it makes sense to provide real-time planning information that relates to travel predictability while from a planning perspective, it makes sense to track and monitor historical and trend data on travel time variability in order to guide policies.
For instance, the US Federal Highway Administration derives a number of performance metrics based on the assumption that travellers should be able to plan to make 19 out of 208 trips “on time”. These include:
• Planning Time – The time it takes to make the trip in almost the worst conditions (the 95th percentile travel time).
• Planning Time Index – How much larger the buffer is than the "free flow" travel time (the ratio of the 95th percentile to free flow travel time).
• Buffer Index – The size of the buffer as a percentage of the average time it takes to accomplish that trip (95th percentile minus the average, divided by the average).
Figure 2.4. Travel Time Index, Planning Time and Buffer Index: I-95 Atlanta
Source: FHWA (2006b).
Figure 2.5 illustrates the real-time regional traffic index developed by the Service Interdépartemental d'Exploitation Routière of the Direction Régionale de l'Équipement d'Ile-de-France. This graphic reflects the aggregated current conditions on the instrumented motorway network in the Paris region (850kms) as measured against both the historical distribution of observed travel times/speeds and the free-flow travel speeds (60 km/hr). The distribution of historical observations is divided into 5 bands ranging from light traffic conditions to exceptionally congested traffic. The historical average travel index (reflecting a proxy for average travel time) is displayed in yellow while the current travel conditions are displayed and updated continuously by the solid black line. In the upper left further information is provided relating to the current travel time index and traffic conditions as well as how the former compares to average travel times. The regional index itself
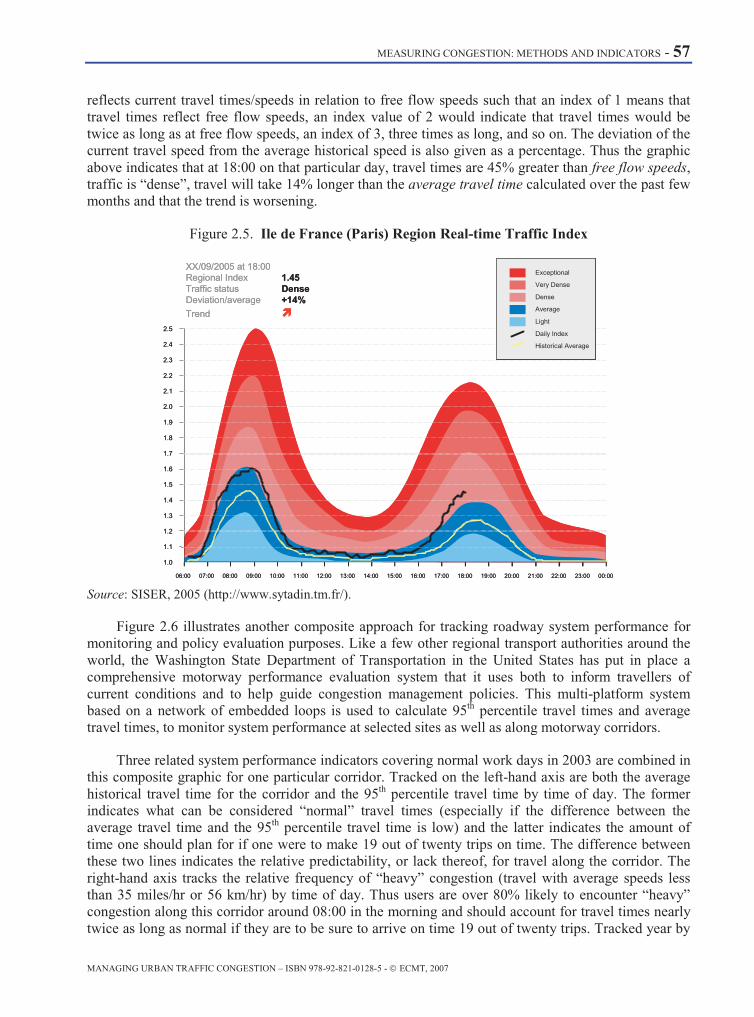
MEASURING CONGESTION: METHODS AND INDICATORS - 57
MANAGING URBAN TRAFFIC CONGESTION – ISBN 978-92-821-0128-5 - © ECMT, 2007
reflects current travel times/speeds in relation to free flow speeds such that an index of 1 means that travel times reflect free flow speeds, an index value of 2 would indicate that travel times would be twice as long as at free flow speeds, an index of 3, three times as long, and so on. The deviation of the current travel speed from the average historical speed is also given as a percentage. Thus the graphic above indicates that at 18:00 on that particular day, travel times are 45% greater than free flow speeds, traffic is “dense”, travel will take 14% longer than the average travel time calculated over the past few months and that the trend is worsening.
Figure 2.5. Ile de France (Paris) Region Real-time Traffic Index
1.1
1.2
1.0
1.3
1.4
1.5
1.9
2.0
2.1
2.2
2.3
2.4
2.5
1.8
1.6
1.7
06:00 07:00 08:00 09:00 10:00 11:00 12:00 13:00 14:00 15:00 16:00 17:00 18:00 19:00 20:00 21:00 22:00 23:00 00:00
XX/09/2005 at 18:00Regional Index 1.45Traffic status DenseDeviation/average +14%Trend
Exceptional
Very Dense
Dense
Average
Light
Daily Index
Historical Average
Exceptional
Very Dense
Dense
Average
Light
Daily Index
Historical Average
Source: SISER, 2005 (http://www.sytadin.tm.fr/).
Figure 2.6 illustrates another composite approach for tracking roadway system performance for monitoring and policy evaluation purposes. Like a few other regional transport authorities around the world, the Washington State Department of Transportation in the United States has put in place a comprehensive motorway performance evaluation system that it uses both to inform travellers of current conditions and to help guide congestion management policies. This multi-platform system based on a network of embedded loops is used to calculate 95th percentile travel times and average travel times, to monitor system performance at selected sites as well as along motorway corridors.
Three related system performance indicators covering normal work days in 2003 are combined in this composite graphic for one particular corridor. Tracked on the left-hand axis are both the average historical travel time for the corridor and the 95th percentile travel time by time of day. The former indicates what can be considered “normal” travel times (especially if the difference between the average travel time and the 95th percentile travel time is low) and the latter indicates the amount of time one should plan for if one were to make 19 out of twenty trips on time. The difference between these two lines indicates the relative predictability, or lack thereof, for travel along the corridor. The right-hand axis tracks the relative frequency of “heavy” congestion (travel with average speeds less than 35 miles/hr or 56 km/hr) by time of day. Thus users are over 80% likely to encounter “heavy” congestion along this corridor around 08:00 in the morning and should account for travel times nearly twice as long as normal if they are to be sure to arrive on time 19 out of twenty trips. Tracked year by
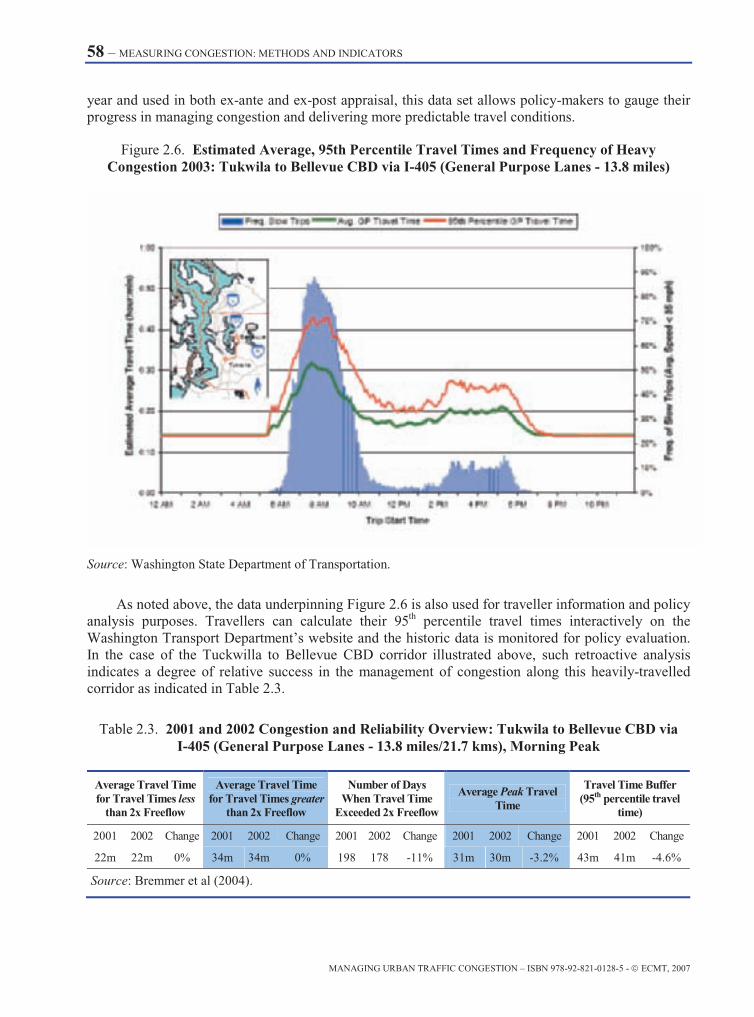
58 – MEASURING CONGESTION: METHODS AND INDICATORS
MANAGING URBAN TRAFFIC CONGESTION – ISBN 978-92-821-0128-5 - © ECMT, 2007
year and used in both ex-ante and ex-post appraisal, this data set allows policy-makers to gauge their progress in managing congestion and delivering more predictable travel conditions.
Figure 2.6. Estimated Average, 95th Percentile Travel Times and Frequency of Heavy Congestion 2003: Tukwila to Bellevue CBD via I-405 (General Purpose Lanes - 13.8 miles)
Source: Washington State Department of Transportation.
As noted above, the data underpinning Figure 2.6 is also used for traveller information and policy analysis purposes. Travellers can calculate their 95th percentile travel times interactively on the Washington Transport Department’s website and the historic data is monitored for policy evaluation. In the case of the Tuckwilla to Bellevue CBD corridor illustrated above, such retroactive analysis indicates a degree of relative success in the management of congestion along this heavily-travelled corridor as indicated in Table 2.3.
Table 2.3. 2001 and 2002 Congestion and Reliability Overview: Tukwila to Bellevue CBD via I-405 (General Purpose Lanes - 13.8 miles/21.7 kms), Morning Peak
Average Travel Time for Travel Times less
than 2x Freeflow
Average Travel Time for Travel Times greater
than 2x Freeflow
Number of Days When Travel Time
Exceeded 2x Freeflow
Average Peak Travel Time
Travel Time Buffer (95th percentile travel
time)
2001 2002 Change 2001 2002 Change 2001 2002 Change 2001 2002 Change 2001 2002 Change
22m 22m 0% 34m 34m 0% 198 178 -11% 31m 30m -3.2% 43m 41m -4.6%
Source: Bremmer et al (2004).
MEASURING CONGESTION: METHODS AND INDICATORS - 59
MANAGING URBAN TRAFFIC CONGESTION – ISBN 978-92-821-0128-5 - © ECMT, 2007
From 2001 to 2002 during the morning peak period on the Tuckwilla to Bellevue corridor reliability increased thus allowing travellers to cut 2 minutes from their 95th percentile travel times, peak period travel speeds increased slightly and the number of days travellers could expect to encounter heavy traffic reduced significantly (-11%). These improvements might otherwise have been masked if only average travel times had been monitored since the average travel time for both light and heavy traffic experienced no change over the same period.
2.2.3 Indicators of Exposure to Roadway Congestion
The final leg of the trio of congestion indicator families relates to how roadway congestion impacts total transport system performance. This is an underdeveloped indicator “family” and would ideally seek to provide a relative measure of how many urban travellers are affected by congestion. As noted earlier, roadway congestion is a still a temporal phenomenon and thus, ideally, policy-makers might seek to understand what percentage of travel takes place in congested conditions. For commuter travel, it seems obvious that the bulk of road travel will take place during the morning and evening peak periods. Less obvious, however, is the importance of peak period travel for other travel purposes. For instance, the United States Federal Highway Administration reports that “most motor carriers work aggressively to schedule and route their truck moves outside of peak periods and around known bottlenecks. Truck volumes typically peak during the midday, especially on urban Interstate highways, and are relatively high in the early morning and at night compared to automobile volumes”9. Thus, it might be surmised that truck travel is relatively less exposed than commuter traffic to congested travel conditions.
Another form of exposure to congestion relates to the number of travellers caught on congested roads versus the total number of travellers during daily peak periods. This type of indicator would seem to be potentially useful as it could guide policy interventions seeking to improve total transport system performance. Obviously, the policy importance of roadway congestion in a city where 98% of peak hour travel takes place upon the roads is different from that of a city where only 60% of peak hour travel takes place upon the road. For such an indicator to be helpful it must also seek to capture the relative quality of road vs. public transport. This necessarily would have to seek to compare travel times and travel predictability among the different modes – along with some measure of road vs. public transport accessibility to desired destinations. Much travel by public transport (non-separated tramway and bus travel) employs the same congested roads as cars and is therefore exposed to the same congestion as the latter. Despite trends in some countries to separate bus and tram traffic from car travel, and in particular to implement Bus Rapid Transit systems (BRT) running rail-like services on fully separated corridors, any measure of relative exposure to congestion will have to account for road congestion impacts on bus and tram services.
While elements of such a composite indicator exist within various road and public transport administrations, operational holistic indicators of traffic congestion exposure across modes are still to be developed. This is an area where further innovation and research is required.
60 – MEASURING CONGESTION: METHODS AND INDICATORS
MANAGING URBAN TRAFFIC CONGESTION – ISBN 978-92-821-0128-5 - © ECMT, 2007
Chapter Summary
• Measuring congestion is a necessary step in order to deliver better congestion outcomes. Good indicators can be based on a wide network of roadway sensors yet simple indicators based on less elaborate monitoring can adequately guide policy.
• Free-flow speeds should not be used as a direct benchmark for system performance.
• It is important to track indicators that are of relevance to road users (predictability of travel times and system reliability) as well as those that are of relevance to road systems operators (e.g. speed and flow).
• Sets of indicators should be used to communicate both the extent and relative scale and evolution of congestion.
• A basic set of congestion indicators should communicate for the entire network or for specific network links:
− a measure of travel time,
− a measure of reliability/travel time predictability and, if possible,
− some measure of traveller exposure to congestion.
NOTES
1. Newbery, D. and Santos, G. (2003).
2. OECD (1997), p.45.
3. Fujito, I. et al (2006).
4. Bertini, R. (2005a) and Bertini, R. (2005b).
5. The Department of Transportation in Minnesota, USA states that travel at peak-hour motorway speeds beneath 45 miles per hour (72 km/hr) are considered “congested”, whereas for California, the figure is 35 miles per hour (56 km/hr) for “15 minutes or more on a typical weekday” (Bertini, 2005a). In the Ile de France region of France, covering the greater Paris area, speeds of over 60 km/hr are considered to be “flowing traffic” (SYTADIN, 2006). In the same IDF region, traffic blockages are said to occur when travel speeds on motorways falls below 30 km/hr and are considered to have disappeared only when speeds increase to 60kms/hr.
6. Cherrett T., McDonald M. (2002).
7. Brownstone, D. and Small, K. (2005).
8. The 95th percentile.
9. http://www.fhwa.dot.gov/policy/otps/bottlenecks/chap4.htm.

CAUSES OF CONGESTION IN URBAN AREAS – 61
MANAGING URBAN TRAFFIC CONGESTION – ISBN 978-92-821-0128-5 - © ECMT, 2007
3. CAUSES OF CONGESTION IN URBAN AREAS
This chapter provides insight both into the micro “triggers” and the macro “drivers” of congestion. Understanding how these act independently as well as in relation to one another is an necessary first step in developing effective congestion management strategies. The chapter also examines the characteristics of congestion on urban motorways and uninterrupted flow facilities in contrast with congestion on urban street networks or interrupted flow facilities. These differences matter not only for policy but also for the assessment of the costs of congestion that will be covered in Chapter 4. This Chapter also investigates the fundamentally important relationship between the supply of road infrastructure and demand for its use – a relationship which must be accounted for in congestion management strategies.
3.1 Introduction
Congestion is a complex and multidimensional phenomenon that is difficult to uncover and, even more difficult, to mitigate. Researchers and network managers have experienced difficulty in breaking the phenomenon down into a set of discrete causal factors. The proximate causes of congestion are numerous (e.g. too many vehicles for a given roadway’s design, dynamic changes in roadway capacity caused by lane-switching and car-following behaviour, etc…) and are invariably linked to further-removed factors (land-use patterns, employment patterns, car ownership trends, infrastructure investment, regional economic dynamics, etc…).
We can, however, identify three broad categories of causal factors that impact road traffic congestion; micro-level factors (e.g. those that relate to traffic on the roadway), macro-level factors that relate to demand for road use and a set of exogenous factors that relate to patterns and volumes of trip-making. There are also “random” variables such as weather and visibility that can play a role in the onset of congestion. Generally, however, we distinguish in this chapter between congestion “triggers” that immediately give rise to traffic congestion at the micro level, and congestion “drivers” that operate at the macro level and contribute to the incidence of congestion and its severity. Figure 3.1 illustrates how these different factors are related to each other and to user experiences which, in turn, feeds back into the system1.
Figure 3.1 tells the following story about congestion:
1. Activity patterns – themselves determined by demographic, social and economic factors along with land-use patterns – have an impact on travel behaviour for individuals, households and firms.
2. Travel behaviour, in turn, gives rise to a level of travel demand which is spread out in time and space.
3. This travel demand leads both to a general level of traffic flow on the roadway network and to specific mixes of vehicles and drivers on discrete segments of the roadway network
62 – CAUSES OF CONGESTION IN URBAN AREAS
MANAGING URBAN TRAFFIC CONGESTION – ISBN 978-92-821-0128-5 - © ECMT, 2007
- e.g. at the micro level. It is at this level that the dynamic capacity of the roadway is set through the interaction of such factors as the mix of vehicle types/lengths, traffic speeds, ingress and egress patterns, lane switching and car following behaviour, etc. all under the influence of atmospheric conditions and the prevailing type of roadway pattern.
4. When the general flow on the network surpasses the dynamic capacity of specific network links, congestion arises and is propagated upstream.
5. Feedback into the system occurs as roadway users use their experience with congestion to adapt their travel behaviour and/or congestion leads to longer-term changes in activity patterns, which in turn further influence travel behaviour, demand, etc …
This figure, and the “story” it tells, illustrates the need for multi-pronged congestion management strategies. Traffic management strategies focusing on the micro level will ultimately have limited impact if congestion management strategies do not also take into account causal and contributing factors on the macroscopic scale and outside of the transport environment.
3.2. Patterns of Congestion: Recurrent vs. Non-recurrent, Predictable vs. Random
Congestion is typically categorized as either recurrent or non-recurrent. Recurrent congestion is generally the result of factors that act periodically on the transportation system, such as daily commuting or weekend trips. Non-recurrent congestion is caused by unexpected, unplanned or large events (e.g. road works, crashes, special events and so on) that affect parts of the transportation system more or less randomly and, as such, cannot be easily predicted or modelled. The share of non-recurrent congestion varies from network to network and is linked to the presence and effectiveness of incident response strategies and roadwork scheduling as well as prevailing atmospheric conditions (snow, rain, fog, etc.). While some estimates put the share of non-recurrent congestion as high as 55% of total congestion2, urban regions with pro-active congestion management policies have reduced this to as low as 14% to 25% of total congestion3 as illustrated in Figure 3.2.
Incidents have a major role to play in generating non-recurring congestion. Crashes, vehicle breakdowns, bad weather, special events and work zones are all examples of incidents that can give rise to sometimes extreme congestion events. A vehicle breakdown may close down part of a freeway and create a bottleneck. A work zone or bad weather can shut down transportation corridors and divert traffic elsewhere, causing congestion to alternative routes. A natural disaster may damage transportation infrastructure and produce congestion, but may also increase demand because of panic. As for special events, these generate increased demand by their nature. These incidents can be classified as local, affecting only a small part of the roadway network or system-wide when they generate congestion in a larger part, or the whole, of the network.
While most non-recurrent incidents have the same negative impact on roadway performance, not all incidents are purely random nor are they equally difficult to plan for. While most crashes are unpredictable by their very nature, crash–prone segments of the roadway can be identified via statistical analysis and specific geometric or other safety treatments applied.
Likewise, roadworks can be managed in such a way as to minimise their impacts on traffic. Even the impacts of weather4, which itself is impossible to change, can be reduced through the provision of appropriate driver information, the imposition of adaptive speed limits and through effective contingency planning.
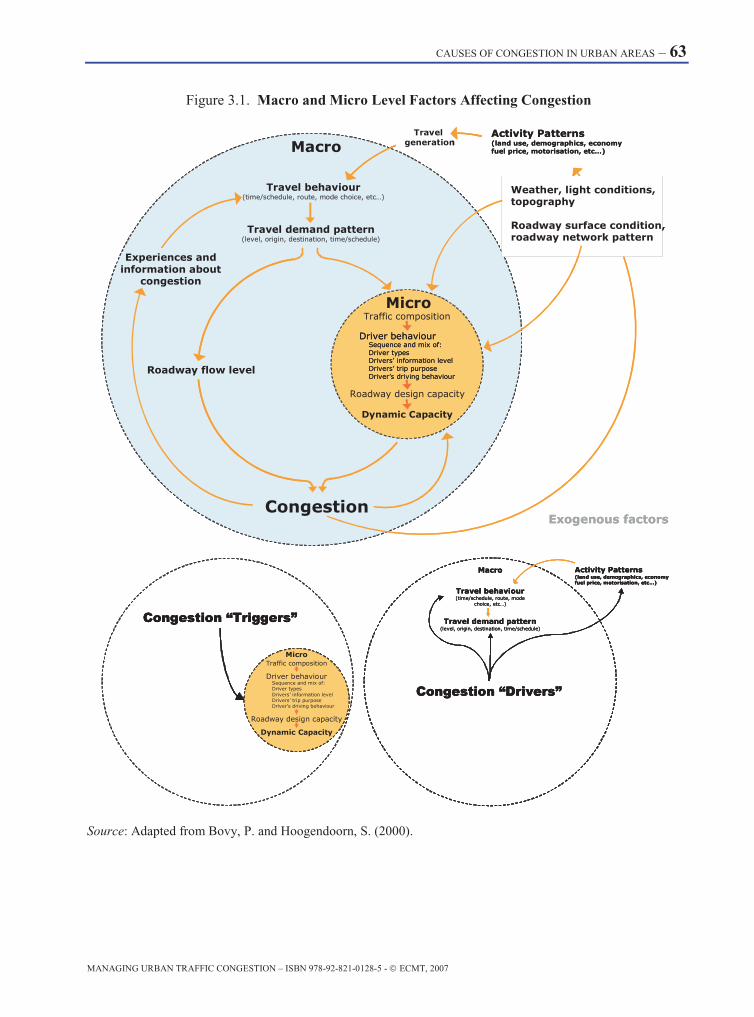
CAUSES OF CONGESTION IN URBAN AREAS – 63
MANAGING URBAN TRAFFIC CONGESTION – ISBN 978-92-821-0128-5 - © ECMT, 2007
Figure 3.1. Macro and Micro Level Factors Affecting Congestion
Activity Patterns(land use, demographics, economyfuel price, motorisation, etc…)
Exogenous factors
Weather, light conditions,topography
Roadway surface condition, roadway network pattern
Macro
Travel demand pattern(level, origin, destination, time/schedule)
Congestion
Travel behaviour(time/schedule, route, mode choice, etc…)
MicroTraffic composition
Roadway design capacity
Driver behaviourSequence and mix of:Driver typesDrivers’ information levelDrivers’ trip purposeDriver’s driving behaviour
Roadway flow level
Experiences and information about
congestion
Dynamic Capacity
Travel generation
Activity Patterns(land use, demographics, economyfuel price, motorisation, etc…)
Exogenous factors
Weather, light conditions,topography
Roadway surface condition, roadway network pattern
Macro
Travel demand pattern(level, origin, destination, time/schedule)
Congestion
Travel behaviour(time/schedule, route, mode choice, etc…)
MicroTraffic composition
Roadway design capacity
Driver behaviourSequence and mix of:Driver typesDrivers’ information levelDrivers’ trip purposeDriver’s driving behaviour
Driver behaviourSequence and mix of:Driver typesDrivers’ information levelDrivers’ trip purposeDriver’s driving behaviour
Roadway flow level
Experiences and information about
congestion
Dynamic Capacity
Travel generation
Congestion “Triggers”
MicroTraffic composition
Roadway design capacity
Driver behaviourSequence and mix of:Driver typesDrivers’ information levelDrivers’ trip purposeDriver’s driving behaviour
Dynamic Capacity
Activity Patterns(land use, demographics, economyfuel price, motorisation, etc…)
Macro
Travel behaviour(time/schedule, route, mode
choice, etc…)
Travel demand pattern(level, origin, destination, time/schedule)
Congestion “Drivers”
Source: Adapted from Bovy, P. and Hoogendoorn, S. (2000).
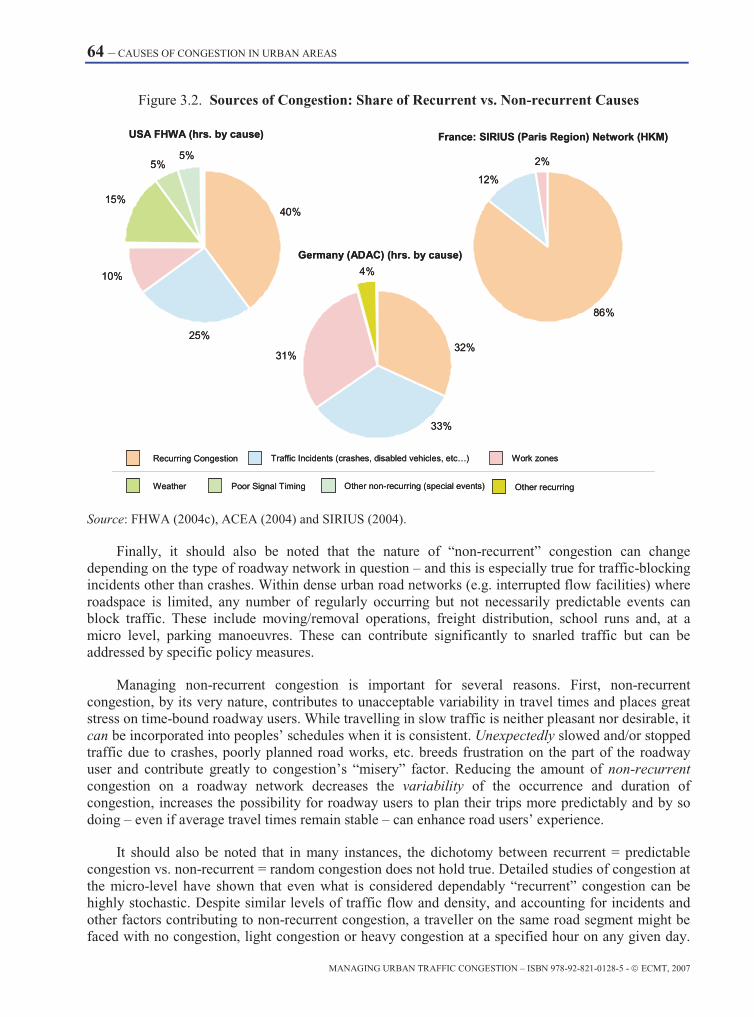
64 – CAUSES OF CONGESTION IN URBAN AREAS
MANAGING URBAN TRAFFIC CONGESTION – ISBN 978-92-821-0128-5 - © ECMT, 2007
Figure 3.2. Sources of Congestion: Share of Recurrent vs. Non-recurrent Causes
Recurring Congestion Traffic Incidents (crashes, disabled vehicles, etc…) Work zones
Weather Poor Signal Timing Other non-recurring (special events)
15%
5%5%
USA FHWA (hrs. by cause) France: SIRIUS (Paris Region) Network (HKM)
40%
25%
10%
86%
12%
2%
32%
33%
31%
Other recurring
4%
Germany (ADAC) (hrs. by cause)
Source: FHWA (2004c), ACEA (2004) and SIRIUS (2004).
Finally, it should also be noted that the nature of “non-recurrent” congestion can change depending on the type of roadway network in question – and this is especially true for traffic-blocking incidents other than crashes. Within dense urban road networks (e.g. interrupted flow facilities) where roadspace is limited, any number of regularly occurring but not necessarily predictable events can block traffic. These include moving/removal operations, freight distribution, school runs and, at a micro level, parking manoeuvres. These can contribute significantly to snarled traffic but can be addressed by specific policy measures.
Managing non-recurrent congestion is important for several reasons. First, non-recurrent congestion, by its very nature, contributes to unacceptable variability in travel times and places great stress on time-bound roadway users. While travelling in slow traffic is neither pleasant nor desirable, it can be incorporated into peoples’ schedules when it is consistent. Unexpectedly slowed and/or stopped traffic due to crashes, poorly planned road works, etc. breeds frustration on the part of the roadway user and contribute greatly to congestion’s “misery” factor. Reducing the amount of non-recurrent congestion on a roadway network decreases the variability of the occurrence and duration of congestion, increases the possibility for roadway users to plan their trips more predictably and by so doing – even if average travel times remain stable – can enhance road users’ experience.
It should also be noted that in many instances, the dichotomy between recurrent = predictable congestion vs. non-recurrent = random congestion does not hold true. Detailed studies of congestion at the micro-level have shown that even what is considered dependably “recurrent” congestion can be highly stochastic. Despite similar levels of traffic flow and density, and accounting for incidents and other factors contributing to non-recurrent congestion, a traveller on the same road segment might be faced with no congestion, light congestion or heavy congestion at a specified hour on any given day.

CAUSES OF CONGESTION IN URBAN AREAS – 65
MANAGING URBAN TRAFFIC CONGESTION – ISBN 978-92-821-0128-5 - © ECMT, 2007
Despite a tendency for roadway users to experience recurrent congestion during week-day rush hour periods, sometimes queues fail to materialize. Likewise queues may materialize in areas where sufficient capacity is available (“phantom jams”). When detailed data is available, it highlights the random nature of even the most “dependable” congestion. For example, Figure 3.3 shows that despite the predictability of the recurrent afternoon queue at the Crooswijk on-ramp in Rotterdam, travellers have a good chance of finding no queue at least once per week. A major factor in this randomness lies in the instability in traffic flows as demand approaches capacity (as discussed later).
Figure 3.3. Afternoon Queue Length at the Croosjwik On-ramp, Rotterdam, by Day of Week in June, 1992-1995
Mon
day
Tue
sday
Wed
nesd
ay
Thu
rsda
y
Frid
ay
Mon
day
Tue
sday
Wed
nesd
ay
Thu
rsda
y
Frid
ay
Mon
day
Tue
sday
Wed
nesd
ay
Thu
rsda
y
Frid
ay
Mon
day
Tue
sday
Wed
nesd
ay
Thu
rsda
y
Frid
ay
Mon
day
Tue
sday
Wed
nesd
ay
Thu
rsda
y
Frid
ay
1992
1993
1994
1995
0
2000
4000
6000
8000
Mon
day
Tue
sday
Wed
nesd
ay
Thu
rsda
y
Frid
ay
Mon
day
Tue
sday
Wed
nesd
ay
Thu
rsda
y
Frid
ay
Mon
day
Tue
sday
Wed
nesd
ay
Thu
rsda
y
Frid
ay
Mon
day
Tue
sday
Wed
nesd
ay
Thu
rsda
y
Frid
ay
Mon
day
Tue
sday
Wed
nesd
ay
Thu
rsda
y
Frid
ay
1992
1993
1994
1995Days with no Queue
Mon
day
Tue
sday
Wed
nesd
ay
Thu
rsda
y
Frid
ay
Mon
day
Tue
sday
Wed
nesd
ay
Thu
rsda
y
Frid
ay
Mon
day
Tue
sday
Wed
nesd
ay
Thu
rsda
y
Frid
ay
Mon
day
Tue
sday
Wed
nesd
ay
Thu
rsda
y
Frid
ay
Mon
day
Tue
sday
Wed
nesd
ay
Thu
rsda
y
Frid
ay
1992
1993
1994
1995
0
2000
4000
6000
8000
Mon
day
Tue
sday
Wed
nesd
ay
Thu
rsda
y
Frid
ay
Mon
day
Tue
sday
Wed
nesd
ay
Thu
rsda
y
Frid
ay
Mon
day
Tue
sday
Wed
nesd
ay
Thu
rsda
y
Frid
ay
Mon
day
Tue
sday
Wed
nesd
ay
Thu
rsda
y
Frid
ay
Mon
day
Tue
sday
Wed
nesd
ay
Thu
rsda
y
Frid
ay
1992
1993
1994
1995Days with no Queue
Source: Adapted from: Bovy, P. and Hoogendoorn, S. (2000).
The following sections will examine these various factors illustrated in Figure 3.1 with an eye to highlighting where these are relevant from the perspective of congestion management strategies. It will first examine what “triggers” congestion on the road before looking at the wider “drivers” of congestion that contribute to its occurrences and severity.
3.3 Sources of Congestion: Congestion “Triggers”
Congestion does not arise in the same manner on all roads. Vehicles travelling on a road in the same direction constitute a traffic flow. Depending on the type of roadway concerned, this flow can be uninterrupted (e.g. limited access roads such as urban motorways) or interrupted by intersections and access/egress points (e.g. such as can be found on arterials, collectors and local roads). In many fundamental aspects, congestion on uninterrupted flow facilities arises, behaves and dissipates differently than on interrupted flow networks. While congestion on these two types of roadway behaves differently, road transport networks typically include a mix of these facilities and thus it is not only important to understand the nature of congestion for each of these two types of roadway, but also
66 – CAUSES OF CONGESTION IN URBAN AREAS
MANAGING URBAN TRAFFIC CONGESTION – ISBN 978-92-821-0128-5 - © ECMT, 2007
how congestion on uninterrupted flow facilities impacts and interacts with congestion on interrupted flow roads.
3.3.1. Congestion “Triggers” on Uninterrupted Flow Facilities
Uninterrupted flow facilities such as urban motorways and/or grade-separated and/or limited access arterials are characterised by and designed for high throughput and relatively high speeds. These serve as major traffic conduits linking local networks to each other and to regional networks. The relationship between speed and flow, or, alternatively, between density and flow on uninterrupted road networks is one that has focused much of the theoretical analysis of traffic congestion by engineers, mathematicians and physicists – primarily because of the strong and relatively chaotic discontinuities that are observed when roadways approach their saturation level.
The Fundamental Diagram of Traffic: Speed and Flow
The dynamic relationship between traffic speeds and flows on uninterrupted flow facilities – also known as the fundamental diagram of traffic flow – is illustrated in Figure 3.4. Reading the diagram in a clockwise direction from point A to point D, we can see the following typical parabolic traffic pattern emerge:
A. In free-flow/unbound traffic5 conditions, drivers self-select speeds (which are generally constant) and to some extent, inter-vehicle spacing. Speed selection by drivers can be influenced by regulatory speed limits and in some cases, safe following distances are also suggested to drivers via roadway messages. Here, traffic conditions are characterised by high speeds and low throughput.
B. As more vehicles enter the roadway, drivers can no longer select their preferred speeds. They can, however, control the spacing between themselves and the vehicle ahead. This phase is characterised by decreasing vehicle speeds, closer vehicle spacing (e.g. increasing density) yet still rising throughput.
C. As more vehicles enter the roadway the system approaches saturation. It is important to stress that there is no single point at which “saturation” can be said to have been reached or breached – or at least no readily operational manner of precisely defining this point (hence the great difficulty roadway managers have in developing detailed congestion predictions). Rather, the system enters into a “critical” unstable zone where crashes and/or other incidents impacting the dynamic capacity of the roadway such as small variances in speeds, following distances, and erratic lane changes can suddenly switch the system from one state to another – e.g. from decreasing speeds and increasing throughput to decreasing speeds and decreasing throughput. This is illustrated by the backward-bending curve that underpins most speed-flow plots of actual traffic conditions on urban motorways (see Figure 3.5).
D. Finally, as more and more vehicles enter the congested roadway, vehicle speeds drop dramatically, travel times leap upwards and ultimately traffic snarls advancing in stops and starts – if it advances at all. The system has entered a zone of increasing congestion and queue formation (labelled “hypercongestion” by economists) where speeds and throughput decrease together. Because of the very nature of uninterrupted flow facilities (few ingress/egress points), the natural persistence of congestion is greatly amplified and the system will only return to points A or B some time after the rate of vehicles entering the roadway has decreased.
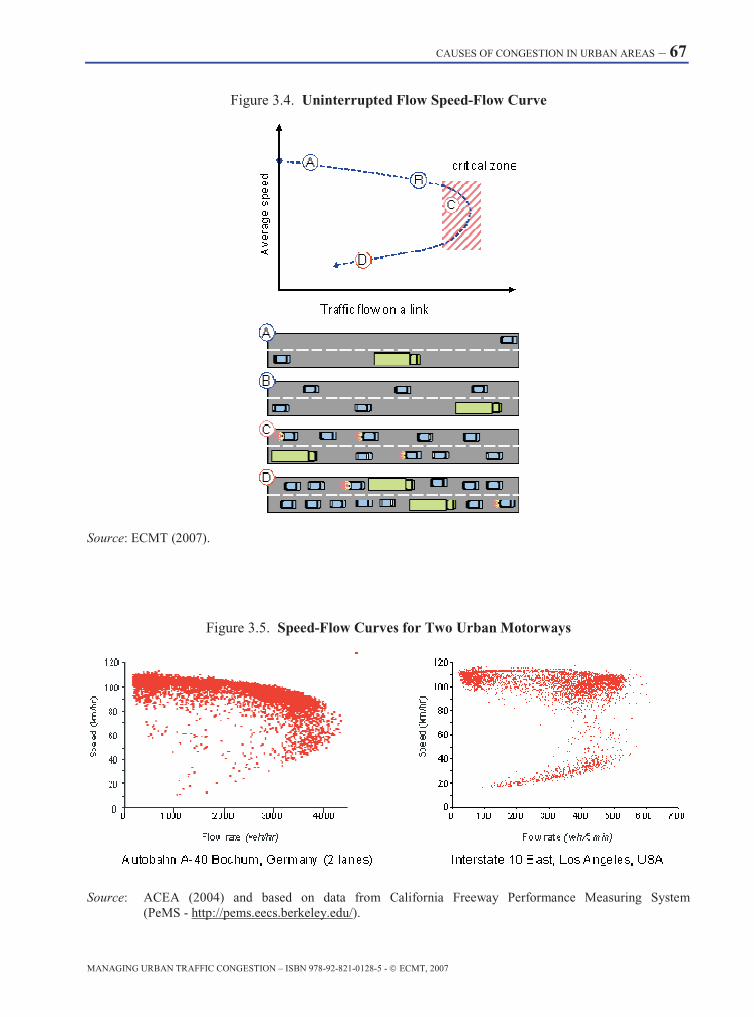
CAUSES OF CONGESTION IN URBAN AREAS – 67
MANAGING URBAN TRAFFIC CONGESTION – ISBN 978-92-821-0128-5 - © ECMT, 2007
Figure 3.4. Uninterrupted Flow Speed-Flow Curve
Source: ECMT (2007).
Figure 3.5. Speed-Flow Curves for Two Urban Motorways
Source: ACEA (2004) and based on data from California Freeway Performance Measuring System (PeMS - http://pems.eecs.berkeley.edu/).

68 – CAUSES OF CONGESTION IN URBAN AREAS
MANAGING URBAN TRAFFIC CONGESTION – ISBN 978-92-821-0128-5 - © ECMT, 2007
Traffic engineers, roadway managers and transport economists are all keenly interested in the area surrounding the apex of the speed/flow curve. It is here that breakdowns occur (sometimes quite drastically as illustrated in the Los Angeles example in Figure 3.5) on uninterrupted flow facilities.
The speed flow curve discussed above represents the average characteristics of traffic flow for a given link or set of links and for a given population of vehicles – themselves with different acceleration/deceleration characteristics related to their type and size (e.g. cars vs. trucks vs. vehicle/trailer combinations, etc). However, it is a generally accepted and widely popular method of representation for traffic flows on uninterrupted facilities. It is also important because it underlies a large part of the economic analysis relating to congestion costs as discussed in Chapter 5. It is not, however, the only fundamental diagram possible and other reports have discussed the advantages of other forms of traffic flow representation including space-mean speed vs. average space headway and flow vs. density.6
Three Phase Theory of Traffic Flow
Another representation of traffic behaviour emerged in the mid-1990’s resulting from an extensive and detailed set of empirical measurements along German motorways7. These researchers uncovered complex and varied time-space patterns in the empirical traffic data that did not conform to the mono-dimensional equilibrium conditions described in the speed-flow and speed-density diagrams. They proposed an alternative conceptual model for understanding traffic flow on uninterrupted facilities which characterises traffic as operating under one of three possible regimes; free-flow, synchronized flow and wide-moving jam (see Figure 3.6). Within each of these states there are numerous patterns relating to growth or decay of the pattern, to its localisation, the existence of strong vs. weak congestion and its relation to other patterns. This approach is a qualitative one that limits itself to describe what is happening on the roadway but not why it is happening – however, by allowing the identification of important and recurrent patterns in traffic, this approach has the advantage of being a useful to track and predict or forecast congestion8.
Capacity Drop
One feature of heavy traffic flows on uninterrupted flow facilities is the observed discontinuities in measurements of flow as these near the “maximum” design capacity. There is an observable sudden “loss” of capacity as revealed by the speed flow plot from California in Figure 3.5. The schematic representation of this relationship – also called the reverse lambda shape fundamental diagram – is illustrated in Figure 3.6 for both two-phase and three phase representations of traffic flow and density. As illustrated in the Figure, this hysteretic behaviour suggests an overlap between free-flow and congested regimes. One possible reason for this “loss” of capacity may lie with the asymmetry between accelerating and decelerating traffic – the former displaying larger headways (and thus reduced capacity) and the latter displaying smaller headways (and thus higher capacity)9. This implies that for flow to recover, traffic density must be reduced not to the last point before the regime switch (kmax) but to a point significantly below the maximum capacity.
“Dynamic” Capacity
Further to the notion of “unstable” capacity discussed above is the notion of “dynamic” capacity. A consistent finding in recent road traffic research is that roadway capacity, long thought to be a static feature of roadway design and construction, becomes highly variable within the critical zone approaching the apex of the speed/flow curve. There are several analytical frameworks for describing traffic behaviour near the apex of the speed-flow curve but they all point to a set of convergent circumstances responsible for setting off congestion.
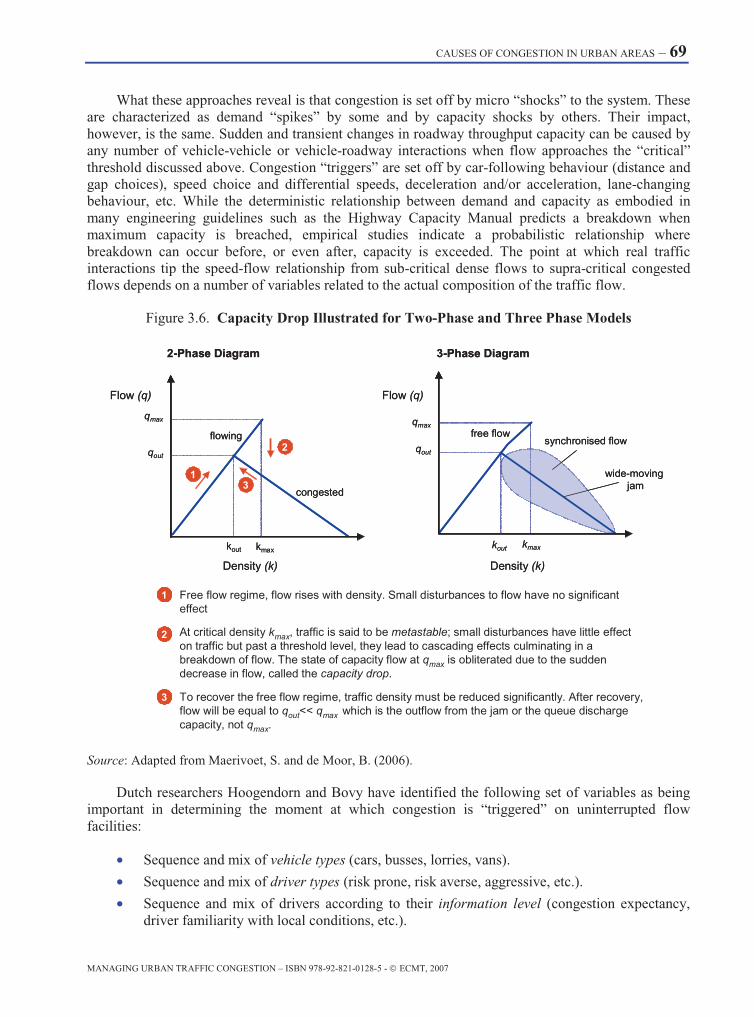
CAUSES OF CONGESTION IN URBAN AREAS – 69
MANAGING URBAN TRAFFIC CONGESTION – ISBN 978-92-821-0128-5 - © ECMT, 2007
What these approaches reveal is that congestion is set off by micro “shocks” to the system. These are characterized as demand “spikes” by some and by capacity shocks by others. Their impact, however, is the same. Sudden and transient changes in roadway throughput capacity can be caused by any number of vehicle-vehicle or vehicle-roadway interactions when flow approaches the “critical” threshold discussed above. Congestion “triggers” are set off by car-following behaviour (distance and gap choices), speed choice and differential speeds, deceleration and/or acceleration, lane-changing behaviour, etc. While the deterministic relationship between demand and capacity as embodied in many engineering guidelines such as the Highway Capacity Manual predicts a breakdown when maximum capacity is breached, empirical studies indicate a probabilistic relationship where breakdown can occur before, or even after, capacity is exceeded. The point at which real traffic interactions tip the speed-flow relationship from sub-critical dense flows to supra-critical congested flows depends on a number of variables related to the actual composition of the traffic flow.
Figure 3.6. Capacity Drop Illustrated for Two-Phase and Three Phase Models
Flow (q)Flow (q)
Density (k) Density (k)
qmax
qout
qmax
qout
kout kmaxkmaxkout
2-Phase Diagram 3-Phase Diagram
flowing
congested
free flowsynchronised flow
wide-moving jam
Flow (q)Flow (q)
Density (k) Density (k)
qmax
qout
qmax
qout
kout kmaxkmaxkout
2-Phase Diagram 3-Phase Diagram
flowing
congested
free flowsynchronised flow
wide-moving jam
1
Free flow regime, flow rises with density. Small disturbances to flow have no significant effect
At critical density kmax, traffic is said to be metastable; small disturbances have little effect on traffic but past a threshold level, they lead to cascading effects culminating in a breakdown of flow. The state of capacity flow at qmax is obliterated due to the sudden decrease in flow, called the capacity drop.
2
3
To recover the free flow regime, traffic density must be reduced significantly. After recovery, flow will be equal to qout<< qmax which is the outflow from the jam or the queue discharge capacity, not qmax.
11
22
33
Source: Adapted from Maerivoet, S. and de Moor, B. (2006).
Dutch researchers Hoogendorn and Bovy have identified the following set of variables as being important in determining the moment at which congestion is “triggered” on uninterrupted flow facilities:
• Sequence and mix of vehicle types (cars, busses, lorries, vans).
• Sequence and mix of driver types (risk prone, risk averse, aggressive, etc.).
• Sequence and mix of drivers according to their information level (congestion expectancy, driver familiarity with local conditions, etc.).

70 – CAUSES OF CONGESTION IN URBAN AREAS
MANAGING URBAN TRAFFIC CONGESTION – ISBN 978-92-821-0128-5 - © ECMT, 2007
• Sequence and mix of trip purposes (commuters, commercial/business-related traffic, recreational traffic, through-traffic, etc.).
• Sequence and mix of driver moods.
Addressing how these factors influence the dynamic throughput capacity at specific bottlenecks is a fundamentally important factor to consider when looking at congestion formation on uninterrupted flow facilities. Bottlenecks represent particularly vulnerable components of the road system and deserve priority treatment in congestion mitigation policies. Bottlenecks may be physical (e.g. bridges, tunnels) or virtual “dynamic” constrictions in available supply (see box). The behaviour of traffic entering a bottleneck at or near capacity, however, is the same. When more vehicles arrive than the specific capacity of the road at the bottleneck can absorb, queues form and propagate themselves upstream while, meanwhile, the downstream flow out of the bottleneck is typically below the technical capacity of that section.
The research findings related to the traffic flow at or near capacity have important implications for congestion management policy. As the design capacity of a roadway is approached, actual throughput capacity begins to vary within the dense flow and the probability of a traffic breakdown increases. Policies that address the factors (mix of vehicle types, mix of driver types, information level, trip purposes, driver moods) that cause capacity to vary in the critical zone near the apex of the speed-flow curve can influence the point at which a traffic breakdown occurs – or possibly hold it off long enough until demand starts to slacken.
Traffic Bottlenecks
Traffic bottlenecks are important, and perhaps the most important contributing factors to the formation of queues. While congestion is often seen as “too much traffic for the road” (see Chapter 2), the specific incidence of traffic can be linked to too many vehicles for the specific section of roadway in question. This restriction of roadway capacity may be a physical characteristic of the roadway (e.g. two lanes merging into one) or the result of a transient event. Thus, in formal terms, a bottleneck is an event on or near the roadway, or a physical restriction of the roadway, which causes throughput capacity to be reduced from what it is both upstream and downstream of the location in question10. The American Highway Users Alliance identifies four principal types of bottlenecks:
Type 1. Bottlenecks: Visual Effects on Drivers
Driver behaviour in this case is influenced by some sort of a visual cue and can include:
• Roadside distractions – unusual or atypical events that cause drivers to become distracted from driving.
• Limited lateral clearance – drivers will usually slow down in areas where barriers get too close to travel lanes or if a vehicle has broken down on the shoulder.
• Incident “rubbernecking” –most drivers will slow down to get a glimpse of a crash scene, even when the crash has occurred in the opposite direction of travel or there is plenty of clearance with the travel lane.

CAUSES OF CONGESTION IN URBAN AREAS – 71
MANAGING URBAN TRAFFIC CONGESTION – ISBN 978-92-821-0128-5 - © ECMT, 2007
Type 2. Bottlenecks: Abrupt Changes in Highway Alignment
Sharp curves and hills can cause drivers to slow down either because of safety concerns or because their vehicles cannot maintain speed on upgrades. Another example of this type of bottleneck is in work zones where lanes may be redirected or “shifted” during construction. Both Type I and Type II bottlenecks are usually short-lived and have a limited effect on traffic flow.
Type 3. Bottlenecks: Intended Interruption to Flow
“Bottlenecks on purpose” are sometimes necessary in order to manage flow. Traffic signals, freeway ramp meters and tollbooths are all examples of this type of bottleneck.
Type 4. Bottlenecks: Vehicle Merging Manoeuvres
This form of bottleneck has the most severe effect on traffic flow. Type IV bottlenecks are caused by some sort of physical restriction or blockage of the road, which in turn causes vehicles to merge into other lanes of traffic. How severely a bottleneck influences traffic flow is related to how many vehicles must merge in a given space over a given time. Type IV bottlenecks include:
• Areas where a traffic lane is lost – a “lanedrop” which sometimes occurs at bridge crossings and in work zones.
• Lane-blocking incidents (e.g. crashes, debris, etc).
• Areas where traffic must merge across several lanes to get to and from entry and exit points (called “weaving areas”).
• Freeway on-ramps – merging areas where traffic from local streets can join a freeway.
• Freeway-to-freeway interchanges – a special case of on-ramps where flow from one freeway is directed to another.
To this list compiled by the AHUA, one might add the following form of Type 4 bottleneck:
• “Micro-bottlenecks” caused by lane changing behaviour and speed differentials between passing vehicles (e.g. one lorry passing another on a uphill two-lane roadway).
Source: American Highway Users Alliance, 2004, p. 7.
3.3.2. Congestion “Triggers” on Interrupted Flow Facilities.
In contrast to freeways, traffic flow on urban roads is interrupted by intersections - signalised or unsignalised - and by roundabouts (see Figure 3.7). Interacting and conflicting traffic streams on urban roads are both more complex and more difficult to manage than traffic on urban motorways. In addition multiple types of road users must be accommodated on urban streets: pedestrians, bicyclists, car and delivery traffic as well as public transport all share the same road space.
Intersections play a key role in determining the quality and volume of traffic flow on urban street networks. Not only do intersections arbitrate among conflicting road traffic streams, they also allow for road and non-road users (and particularly pedestrians) to share the same road space sequentially. It

72 – CAUSES OF CONGESTION IN URBAN AREAS
MANAGING URBAN TRAFFIC CONGESTION – ISBN 978-92-821-0128-5 - © ECMT, 2007
is intersection capacity, and not link capacity, that is the most important factor in determining the operational thresholds of urban roads – and intersection capacity is typically much smaller than link capacity on urban networks. However, because of the multiple and conflicting road and non-road streams coming into play at intersections, and because of the upstream and downstream impacts of other intersections and links, it is extremely difficult to define fundamental capacities.
The amount of vehicular traffic that can approach and pass through an intersection depends on various physical and operating characteristics of the links leading into and away from the intersection. Furthermore, the geometric disposition of the intersection and the nature of the built environment, signage, view sheds, etc. contiguous to the intersection all affect driver behaviour at the intersection. This behaviour determines vehicle speed, following distance, spacing and timing decisions which all have an impact on the effective capacity of the intersection in question. Compared to uninterrupted flow on freeways, the analysis of flow processes at intersections and within an urban street network requires a completely different methodology.
Figure 3.7. Interrupted Flow Facilities
Source: Technische Universität München, 2006.
In particular, analysis of capacity constraints faced at intersections must account for the width of approaching and departing road lanes, the configuration of on-street parking at or near the intersection as well as the specific geometric design of the intersection. The latter includes the treatment of left-turn lanes (right-turn lanes for countries driving on the left) within the intersection itself and the space allowance for right turn lanes upstream of the intersection. Other features such as the use and disposition of surrounding buildings, the particular signage leading to the intersection as well as the signage within the intersection and possible visual impediments (e.g. all those aspects that cannot be changed by design or control features of the intersection) are important in ultimately determining the operational capacity of an intersection.
For interrupted-flow conditions the most commonly used indicator for congestion is delay. Delay involves movements at slower speeds and stops at intersections, as vehicles move up in the queue or slow down upstream of an intersection.
The most significant triggers of fixed interruptions on an interrupted-flow facility are traffic lights. Stops and queuing of vehicles are unavoidable during the red-light phase. Figure 3.8 shows average speeds, 5th percentile and 95th percentile speeds for traffic moving along a approximately 3 kilometre section of urban roads. The five traffic lights’ impact on average speeds is quite clear since

CAUSES OF CONGESTION IN URBAN AREAS – 73
MANAGING URBAN TRAFFIC CONGESTION – ISBN 978-92-821-0128-5 - © ECMT, 2007
not all traffic is able to clear the light during a green phase. In this case, an inadequate coordination of traffic signal control leads to longer travel times and increased vehicle emissions and fuel consumption due to repeated acceleration cycles.
Traffic signal coordination provides a means for alleviating these problems. Coordinated traffic lights provide a greater opportunity for motorists to travel through adjacent traffic signals without unnecessary stops (e.g. through a progression of green lights – the “green wave—or through intersection-clearing algorithms). This is an attempt to utilize the existing roadway infrastructure to the maximum by insuring optimum travel speeds while reducing delay. Traffic coordination may delay or even eliminate the need for roadway widening. The goal of traffic signal coordination is to establish platoons or tight groups of vehicles that can move easily from one intersection through another without stopping. Ideal conditions are traffic signals uniformly spaced. When signals are spaced too far apart, uneven or closely they can also reduce the effectiveness of platoon formation.
Figure 3.8. Aggregated Floating Car Data for a Section of a Signalized 2-lane Major-Road in Munich
average
5%
95%
0
10
20
30
40
50
60
70
80
90
100
20 220 420 620 820 1020 1220 1420 1620 1820 2020 2220 2420 2620 2820
Distance [m]
Vel
ocity
[km
/h]
average
5%
95%
0
10
20
30
40
50
60
70
80
90
100
20 220 420 620 820 1020 1220 1420 1620 1820 2020 2220 2420 2620 2820
Distance [m]
Vel
ocity
[km
/h]
Source: Technische Universität München, 2006.
On unsignalised intersections drivers have to select gaps in the priority flow to execute the desired movement. Gap refers to the space between vehicles on the priority flow. So the capacity of a minor street approach depends on the distribution of available gaps in the major-street traffic stream and the required gap-sizes by minor-street drivers. The distribution of available gaps depends, among other things, on the total volume on the major-street or the number of lanes. The required gap sizes depend e.g. on the type of manoeuvre (left, through, right), the number of lanes and the speed of the major-street or sight distances.

74 – CAUSES OF CONGESTION IN URBAN AREAS
MANAGING URBAN TRAFFIC CONGESTION – ISBN 978-92-821-0128-5 - © ECMT, 2007
When demand exceeds the capacity queuing starts. A queue also forms when arrivals wait at a service area. This can be the waiting for green times or an acceptable gap in a major-street traffic stream, the payment of tolls or parking fees, and so forth.
A wide range of methods to assess the performance of both signalized and unsignalised intersections is available.11
Traffic quality within urban networks depends not only on intersections. Other intermediate links affect the quality of traffic flow on the network depending on their function and design. In particular parking manoeuvres, delivery traffic or e.g. public transport stops act as systematic interruptions for vehicular traffic as well as turning movements that also serve to temporarily reduce available roadway capacity.
In some cases, the type of speed-flow relationship characteristic of uninterrupted flow facilities may be mirrored in aggregate for longer distance trips across urban street networks – especially for lower average travel speeds (~30 km/hr). However, this type of analysis requires an extensive amount of data that is difficult to gather at the urban level – thus explaining why this relationship is not widely documented.12 Furthermore, the definition of congestion at a network-wide level remains highly problematic.
3.4 Sources of Congestion: Congestion “Drivers”
3.4.1 Demand for Transportation
Increases in demand for transportation play a leading role in producing congestion in urban areas. Economic growth and social development increase mobility in cities and promote the use of private vehicles. People need or desire access to numerous activities in more complex and sprawled urban environments, so an increase in demand is inevitable. However, transportation infrastructure is limited and is not always used in an optimal fashion. There are a number of factors influencing demand for travel and result to congestion in the short or long run, such as:
• Socioeconomic Growth.
• Increase in Urban Population.
• Car Ownership and Dependency.
• Land Uses.
• Travel Patterns.
• Public Transport Operations.
• Urban Freight Transport and Goods Delivery.
• Parking.
Socioeconomic Growth
Growth in the economy and society occurs mainly in large urban areas, where most of the activities, money and knowledge are located and can interact. Such conditions affect transportation needs, which consequently increase transportation demand and the possibility for congestion to occur on urban transport networks. However, while mobility in urban areas is increasing along with population growth, not all cities share the same pattern of mobility growth.

CAUSES OF CONGESTION IN URBAN AREAS – 75
MANAGING URBAN TRAFFIC CONGESTION – ISBN 978-92-821-0128-5 - © ECMT, 2007
Car Ownership and Dependency
Since car dependency is linked to accessibility and mobility, it is highly related to the structure of the urban environment. Urban form plays an important and sometimes preponderant role in generating and maintaining the need for automobile usage. Conversely, car use in cities can also have a deterministic role in shaping the urban area’s physiognomy. The relationship between automobiles and the city is truly bi-directional. In principle, the benefits of automobile such as comfort, speed, and convenience, are numerous and go far to explain the popularity of that mode. In practise, however, automobiles and certain parts of the urban environment may not be wholly compatible. It is sometimes a fine line between the positive role cars have in making urban agglomerations as a whole liveable and the negative impact these same cars can have on the liveability and attractiveness of certain parts of the city.
Urban form and the availability of alternative modes of transport both play a large role in determining the extent to which cities are “automobile” dependent. When cars are used for more than 75% of trips, such a dependency is considered high.13 In the United States, in 2001, 88% of the passengers used cars for their commuting trips.14 In addition to interaction of urban form and the quality of non-car alternatives, several intangible factors have been identified by researchers as having a contributing role to play in making cities “automobile dependent”. These include the prevalence of cars as wealth and status symbols and the commoditisation of the car reinforced by advertising campaigns focusing on their non-material attributes.
Worldwide, car ownership has increased dramatically in recent decades. According to Pemberton (2004), the number of cars in western countries has increased by around 50% during the last 20 years. In the European Union, the number of privately owned vehicles per 1 000 inhabitants grew from 393 to 460 between 1990 and 1999, an average of 1.8% per year (larger than the increase in the income per capita, which was on average 1.6% per year, over the same period). The largest increases in car ownership over the last 20 years were experienced in Portugal (241%), Greece (185%), and Spain (102%). In Athens, according to mid-90s estimates, circulating vehicles will increase by 42% until 2010 and by 83% until 2020.15 In Great Britain, from 1972 up to 2002, households owning a car increased by 21%.16 As for the United States, despite the fact that car ownership was already high since the early 1950s, in the period between 1977 and 1995, cars increased by 12%.17
In general, the most important factors influencing car ownership in urban areas are the following:
1. Population Increase: There is a constant increase of population in urban areas that results to a higher car ownership in these areas.
− In developed countries, while population remains more or less constant in the cities’ downtown areas (or even decreasing), as a result of suburbanization, suburbs are expanded and attract new inhabitants. Given the nature of suburbs (where sprawl is mostly encountered), car dependency is higher.
− On the other hand, developing countries face the fact of population increase in urban areas. While in 1975, only 27% of the population in developing countries lived in cities, it is estimated that by 2030, this percentage will increase to 58% (John Hopkins Bloomberg School of Public Health, 2002).
2. Personal Income Growth: An increase in personal income stimulates increases in car usage and ownership.

76 – CAUSES OF CONGESTION IN URBAN AREAS
MANAGING URBAN TRAFFIC CONGESTION – ISBN 978-92-821-0128-5 - © ECMT, 2007
3. Need for a Flexible Workforce within the Urban Environment: Car ownership provides independency to an individual regarding mobility and thus promotes flexibility in various professions not based continuously on the same location.
4. Complex Urban Mobility Patterns.
5. Urban Growth in the City Suburbs.
6. Infrastructure Under-pricing: The price actually paid by car and commercial vehicle users is often relatively low. In some countries, road infrastructure is supported financially as its provision is considered a public service. Consequently, in these cases, drivers do not bear the full cost of car usage.
7. Planning and Investment Practices: Planning and public funds aim towards improving road and parking facilities in an ongoing attempt to avoid congestion. Other means of transportation tend to be disregarded.
Car dependency and ownership and their effects in congestion can be explained as follows: Road infrastructure is usually limited and costly or difficult to expand. A typical private vehicle carries up to 5 passengers (although, on average the ratio of passengers per vehicle is between 1 and 2) and covers 15 m2 of limited urban space. Therefore each passenger transported by a private vehicle occupies around 10 m2 of the road network. Figure 3.9 indicates space usage of private vehicles compared to that of a typical public transport mode (bus).
Figure 3.9. Space Usage of Private Vehicles and Buses
0
10
20
30
40
50
60
70
80
90
100
Car Bus
MovingParking
Relative space consumption, expressed in m2 x hours(10 km return home-work journey by car or by bus)
0
10
20
30
40
50
60
70
80
90
100
Car Bus
MovingParking
Relative space consumption, expressed in m2 x hours(10 km return home-work journey by car or by bus)
Source: UITP, 2001.
Given the very high volume of daily passenger and freight trips in large urban areas, it is obvious that cars are not necessarily best suited for getting around in these cities nor is it always feasible to find more space for additional road infrastructure. The combination of limitations in road infrastructure, increasing private vehicle usage, and low load factors of private vehicles, unavoidably lead to congestion.
CAUSES OF CONGESTION IN URBAN AREAS – 77
MANAGING URBAN TRAFFIC CONGESTION – ISBN 978-92-821-0128-5 - © ECMT, 2007
Land Uses
Urban transportation aims at enhancing accessibility and supporting transport demands generated by the diversity of activities in the urban environment. In urban areas, the mixed effect of spatial development and circulation of passengers and goods in cities creates several contradictory issues, such as:
• Spatial Complexity: More complex land use patterns are characterised by more complex trip-making patterns. Moreover, especially in Europe, the historical development of cities has led to mixed uses and even more complex (although shorter) trips in downtown areas. Of course, shorter trips offer the possibility of using other modes (walking, cycling). On the contrary, U.S. cities and European suburbs, affected by urban sprawl, have seemed to promote longer trips and increases in both traffic and congestion. However, recent studies from the United States have found that contrary to expectations, in the periphery of some urban centres, commuting times have actually decreased reflecting perhaps a move by households to residences closer to their place of work in these suburbs.
• Spatial Aggregation: Cities benefit from activities aggregated in the same area, since that aggregation leads to decreases in transportation costs. However, aggregating mobility in a limited area may lead to congestion. After all, locations of facilities are selected based upon real-estate criteria and not cost for goods transportation or user costs approaching a facility (since the latter costs seem marginal compared to the real – estate costs).
• Spatial Imprint: Transportation, like any urban activity, consumes space and thus has a spatial imprint. While space is limited in urban areas, transportation needs are usually at their highest levels.
Land uses affect travel patterns as will discussed later on. In addition, they may attract, limit or aggregate trips in parts of the urban environment, leading to increased demand and inability of transportation systems to facilitate it.
Travel Patterns
Travel demand patterns – often implicitly related to land uses - have a serious effect on congestion. Since travel patterns are a product of the need for mobility (which is highly affected by changes in the society of an urban area or a country), they have a great influence on a city’s transportation system and therefore congestion. In urban areas with many activity centres (typical conditions for modern metropolitan areas), travel patterns tend to be very complex leading to a great number of trips. These trips may be critical in forcing a transportation system into congested conditions. In general, urban travel patterns are influenced by a city’s activities and its associated trips, which are:
• Daily Commuting Trips: Trips for accessing work. They are highly cyclic, predictable and recurring on a regular basis.
• The School Run: children and young adults are increasingly being brought to school in personal vehicles rather than by walking, cycling or collective transport. These trips are also highly cyclic, predictable and can lead to congestion around school facilities.
• Professional Activity Trips: Trips for professional, work-based purposes (meetings, customer services etc).

78 – CAUSES OF CONGESTION IN URBAN AREAS
MANAGING URBAN TRAFFIC CONGESTION – ISBN 978-92-821-0128-5 - © ECMT, 2007
• Personal Trips: Trips for recreational, shopping or personal affairs purposes.
• Tourist Trips: Important for cities having historical and recreational features. They are seasonal in nature or occur at specific time periods.
• Freight Trips: Trips related to the distribution of freight.
It has to be noted that changes in the spatial distribution of activities in urban areas cause changes to trip destinations, notably those related to work. Especially downtown areas, which used to be the primary destinations for different kinds of trips, today share a decreasing number of trips ending there, while suburbs now account for most of the origins and destinations in urban areas. Obviously, apart from a city’s activities and its associated trips, travel patterns are also related to the selection and availability of routes (trip assignments).
The type, extent, spatial and time distribution of activities have an impact on travel patterns and demand. Parts of urban areas with large number of activities have increased transportation needs. Different types of activities occur in different places and times and consequently face different requirements for transportation. Cities with many activity centres have demand scattered around the urban environment while cities with a major activity centre have demand for transportation concentrated to that. As a result, a high level of demand may practically occur anywhere anytime in large cities. Transportation systems cannot be always on their peak operation for economic, practical and other reasons, so congestion is possible.
Public Transport Operations
The characteristics and operation of a transportation system in an urban environment influence demand in such a way that can lead the transportation system itself in congestion. The way a transportation system affects demand is strongly related to the usage, performance and availability of the different modes serving a city. Mode choice and traveller behaviour reflect the availability, use and quality of different modes.
In general, public transport is considered an essential component in the management of congestion in urban areas. However, in some cases, unattractiveness of public transport contributes to congestion, since it turns passengers away from public transport and into private vehicles. The reasons for not preferring public transportation include a real or perceived level of poor performance, a real or perceived lack of network coverage, a real or perceived level of personal security and comfort and a real or perceived low level of reliability. Even if there is significant demand for public transportation, this may lead to a congested public transportation system which detracts from its ability to develop its market share. In addition, public transportation can only serve scattered and sprawled urban areas with difficulty, and then only in a limited capacity and in a few niche markets. As a result, the role of public transportation in providing a viable transport alternative for the whole of an urban area is often limited.
Furthermore, new or extended public transport operations can generate demand. Construction of a new interchange or metro line, establishment of a new bus line, or even changing their capacity is usually followed by an increase in demand along the corridor served by the specific transport service. Potentially, this increase could lead to congested conditions in the corridor served by the new transport operation. Indeed many urban corridors that have a high level of public transport use also have congested roads – this situation is reflective of the overall level of demand for the corridor and not necessarily of specific demand for public transport or car use.
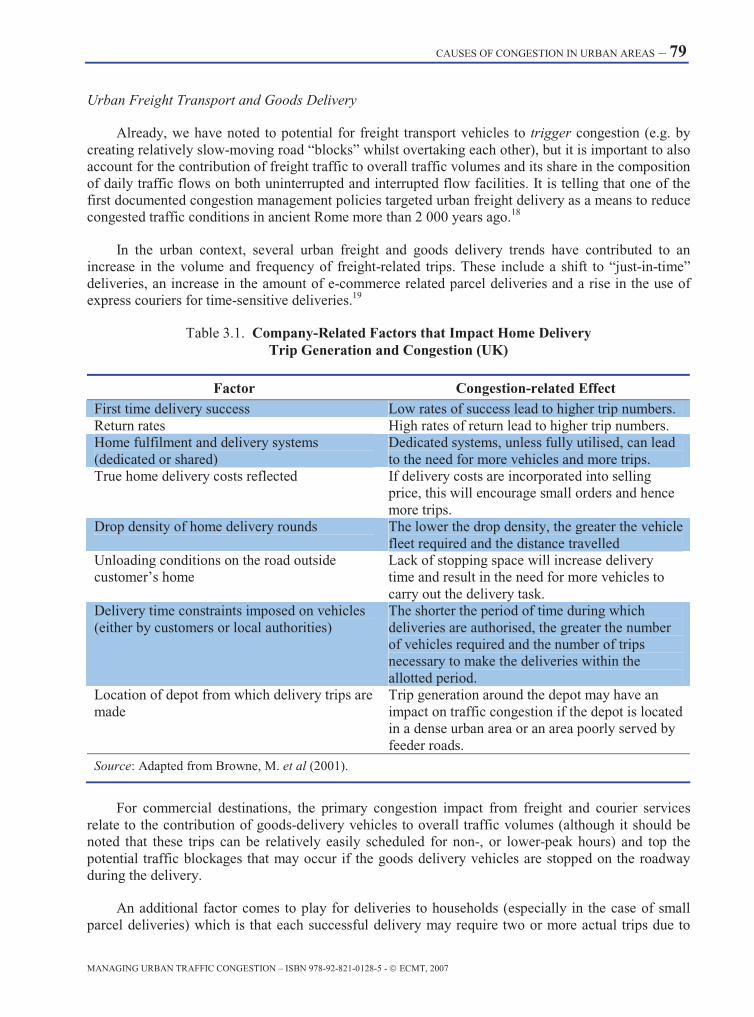
CAUSES OF CONGESTION IN URBAN AREAS – 79
MANAGING URBAN TRAFFIC CONGESTION – ISBN 978-92-821-0128-5 - © ECMT, 2007
Urban Freight Transport and Goods Delivery
Already, we have noted to potential for freight transport vehicles to trigger congestion (e.g. by creating relatively slow-moving road “blocks” whilst overtaking each other), but it is important to also account for the contribution of freight traffic to overall traffic volumes and its share in the composition of daily traffic flows on both uninterrupted and interrupted flow facilities. It is telling that one of the first documented congestion management policies targeted urban freight delivery as a means to reduce congested traffic conditions in ancient Rome more than 2 000 years ago.18
In the urban context, several urban freight and goods delivery trends have contributed to an increase in the volume and frequency of freight-related trips. These include a shift to “just-in-time” deliveries, an increase in the amount of e-commerce related parcel deliveries and a rise in the use of express couriers for time-sensitive deliveries.19
Table 3.1. Company-Related Factors that Impact Home Delivery Trip Generation and Congestion (UK)
Factor Congestion-related Effect First time delivery success Low rates of success lead to higher trip numbers. Return rates High rates of return lead to higher trip numbers. Home fulfilment and delivery systems (dedicated or shared)
Dedicated systems, unless fully utilised, can lead to the need for more vehicles and more trips.
True home delivery costs reflected If delivery costs are incorporated into selling price, this will encourage small orders and hence more trips.
Drop density of home delivery rounds The lower the drop density, the greater the vehicle fleet required and the distance travelled
Unloading conditions on the road outside customer’s home
Lack of stopping space will increase delivery time and result in the need for more vehicles to carry out the delivery task.
Delivery time constraints imposed on vehicles (either by customers or local authorities)
The shorter the period of time during which deliveries are authorised, the greater the number of vehicles required and the number of trips necessary to make the deliveries within the allotted period.
Location of depot from which delivery trips are made
Trip generation around the depot may have an impact on traffic congestion if the depot is located in a dense urban area or an area poorly served by feeder roads.
Source: Adapted from Browne, M. et al (2001).
For commercial destinations, the primary congestion impact from freight and courier services relate to the contribution of goods-delivery vehicles to overall traffic volumes (although it should be noted that these trips can be relatively easily scheduled for non-, or lower-peak hours) and top the potential traffic blockages that may occur if the goods delivery vehicles are stopped on the roadway during the delivery.
An additional factor comes to play for deliveries to households (especially in the case of small parcel deliveries) which is that each successful delivery may require two or more actual trips due to
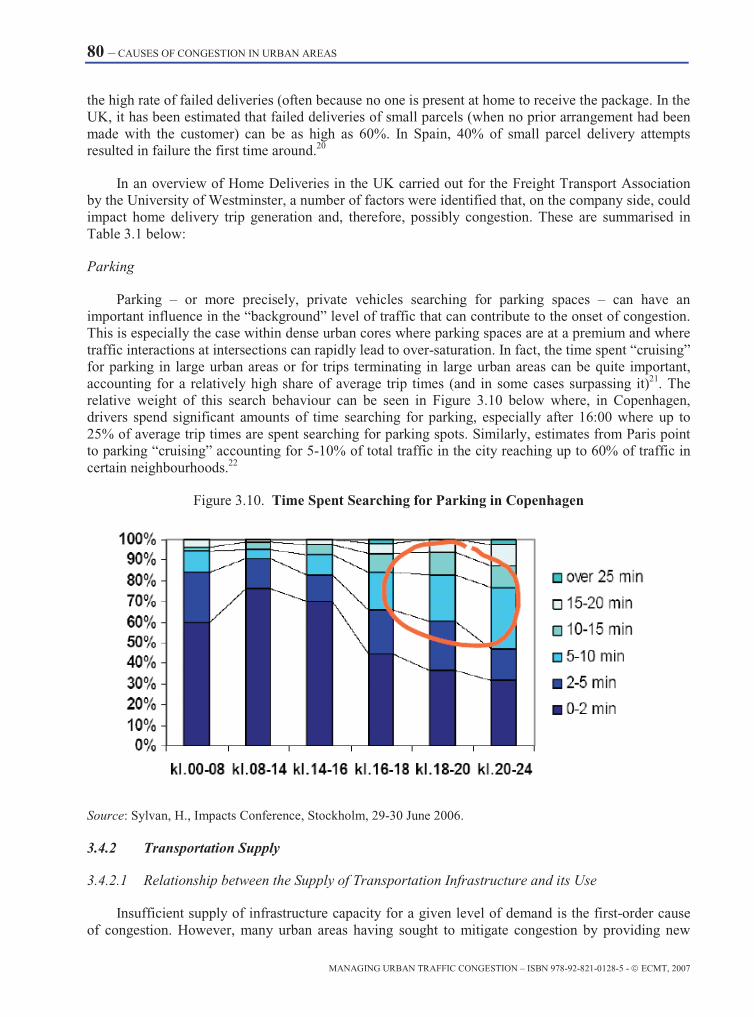
80 – CAUSES OF CONGESTION IN URBAN AREAS
MANAGING URBAN TRAFFIC CONGESTION – ISBN 978-92-821-0128-5 - © ECMT, 2007
the high rate of failed deliveries (often because no one is present at home to receive the package. In the UK, it has been estimated that failed deliveries of small parcels (when no prior arrangement had been made with the customer) can be as high as 60%. In Spain, 40% of small parcel delivery attempts resulted in failure the first time around.20
In an overview of Home Deliveries in the UK carried out for the Freight Transport Association by the University of Westminster, a number of factors were identified that, on the company side, could impact home delivery trip generation and, therefore, possibly congestion. These are summarised in Table 3.1 below:
Parking
Parking – or more precisely, private vehicles searching for parking spaces – can have an important influence in the “background” level of traffic that can contribute to the onset of congestion. This is especially the case within dense urban cores where parking spaces are at a premium and where traffic interactions at intersections can rapidly lead to over-saturation. In fact, the time spent “cruising” for parking in large urban areas or for trips terminating in large urban areas can be quite important, accounting for a relatively high share of average trip times (and in some cases surpassing it)21. The relative weight of this search behaviour can be seen in Figure 3.10 below where, in Copenhagen, drivers spend significant amounts of time searching for parking, especially after 16:00 where up to 25% of average trip times are spent searching for parking spots. Similarly, estimates from Paris point to parking “cruising” accounting for 5-10% of total traffic in the city reaching up to 60% of traffic in certain neighbourhoods.22
Figure 3.10. Time Spent Searching for Parking in Copenhagen
Source: Sylvan, H., Impacts Conference, Stockholm, 29-30 June 2006.
3.4.2 Transportation Supply
3.4.2.1 Relationship between the Supply of Transportation Infrastructure and its Use
Insufficient supply of infrastructure capacity for a given level of demand is the first-order cause of congestion. However, many urban areas having sought to mitigate congestion by providing new
CAUSES OF CONGESTION IN URBAN AREAS – 81
MANAGING URBAN TRAFFIC CONGESTION – ISBN 978-92-821-0128-5 - © ECMT, 2007
roadway capacity have noted the emergence of the “vicious” cycle illustrated in Figure 3.11 where the supply of new infrastructure capacity leads to changes in travel patterns (and in particular to longer travel distances for a given trip duration). Another change in travel patterns involves the response in the volume of traffic on a link or throughout a network in response to increased travel speeds (and thus reduced generalised travel costs). This relationship is an important one to consider for congestion management policies since it conditions the effectiveness of policies delivering newly available capacity in urban areas.
Historically, the early stages of road infrastructure expansion have delivered considerable benefits, both within and between urban areas. Indeed, current generations of users, decision-makers and planners have experienced first-hand how new capacity built in the 1950s through the 1970s oftentimes dramatically improved traffic conditions at a time when many countries were experiencing dramatic increases in prosperity and car ownership. These same patterns may be seen in the 1990s and 2000s in many former eastern bloc countries where roadway expansion may provide large initial congestion benefits. However, it does not follow that because roadway expansion has in the past delivered substantial benefits, that it will forever do so. T. Litman notes that “the first highways in an area often provide large economic returns but marginal benefits diminish as more capacity is added”.23 He explains why:
• The first highways projects are generally the most cost effective, because planners are smart enough to prioritize investments. For example, if there are several possible highway alignments on a corridor, those with the greatest benefits and lowest costs are generally built first, leaving less cost effective options for subsequent implementation.
• Interregional highways (those connecting cities) are generally constructed first. They tend to provide greater economic benefits and have lower unit costs than local highway expansion, due to numerous conflicts and high land costs in urban areas.
• Adding capacity tends to provide declining user benefits, since consumers are smart enough to prioritize trips. For example, if highways are congested consumers organize their lives to avoid peak automobile period trips. As highway capacity increases they travel more during peak periods, perhaps driving across town during rush hour for an errand that would be deferred, or moving further away from their worksite. Each additional vehicle mile provides smaller user benefits, since the most valued vehicle-miles are already taken.24
While roadway expansion and new construction remains an effective response in certain circumstances, and especially for the treatment of bottlenecks, it no longer seems suited as a generalised response to regional increases in congestion – in large part because the evidence indicates that new roads not only absorb existing travel demand, they also induce traffic – or more precisely – allow for un-realised travel demand to express itself. The notion of induced travel and its corollary, repressed demand deserves a bit more discussion as its existence has important ramifications for congestion management policies.
Induced Travel, Generated Traffic, Latent Demand, Triple Convergence (see box) are all terms that seek to address the basic nature of the relationship between the supply of roadway capacity and the demand for travel.

82 – CAUSES OF CONGESTION IN URBAN AREAS
MANAGING URBAN TRAFFIC CONGESTION – ISBN 978-92-821-0128-5 - © ECMT, 2007
Figure 3.11. Vicious Cycle of Congestion
Source: Personal communication, Axel Ahrens, 2005.
In areas experiencing high and growing levels of demand for road usage, e.g. most dynamic urban regions, an increase in available capacity on a highly travelled link or set of links will allow as an immediate effect higher travel speeds along that link or set of links due to reduced impedance amongst vehicles currently using the links. This increase in travel speeds translates into a simultaneous reduction in the generalised costs of travel. Travellers can use these “savings” either to travel further for the same “cost” or use these time/money savings elsewhere. Either way, those travellers already using the links in question benefit – at least initially. Indeed, the benefits accruing to existing road users from added capacity have typically formed the bulk of the benefits identified in benefit-cost
Traffic Induced or Generated by Increases in Available Roadway Capacity, Definitions:
Generated Traffic: Additional trips on a particular roadway or area that occur when roadway capacity is increased, or travel conditions are improved in other ways. This may consist of shifts in travel time, route, mode, destination and/or frequency
Induced Travel: An increase in total vehicle travel due to increased motor vehicle trip frequency, longer trip distances or shifts from other modes but excludes travel shifted from other times and routes.
Latent Demand: Additional trips that would be made if travel conditions improved (less congestion, higher design speeds, lower vehicle costs or tolls).
Triple Convergence: Increased peak-period vehicle traffic volumes that result when roadway capacity increases due to shifts from other routes, times and/or modes
Source: VTPI, 2005.

CAUSES OF CONGESTION IN URBAN AREAS – 83
MANAGING URBAN TRAFFIC CONGESTION – ISBN 978-92-821-0128-5 - © ECMT, 2007
assessments for road projects and so they have largely served to justify road expansion even in crowded urban areas.
The Flipside of Induced/Suppressed Demand: Dwindling or Disappearing Traffic
The notion of induced/suppressed demand explains how increases in available capacity can trigger increases in specific demand for a roadway link or overall demand for travel within an urban area. Several researchers, notably Atkins, Cairns and Goodwin, have investigated if the converse is true – that is if reductions in available capacity decrease specific or overall levels of traffic. In two phases of research, they have reviewed approximately 100 case studies of road closures/capacity reductions from around the world and have collated specific and detailed data on 60 of these where high quality monitoring was carried out both before and after the reduction in capacity. They found that:
• When roadspace for vehicles is re-allocated, traffic problems are usually far less serious than predicted.
• Overall levels of traffic can reduce by significant amounts.
• Traffic reduction is partly explained by recognising that people react to change in road conditions in much more complex ways than has traditionally been assumed in traffic models.
In the cases studied, the mean traffic change for both the altered route/area as well as the parallel or alternative routes was -21.9% and the median traffic change was close to -11%. Although 11 out of 63 case studies revealed post closure increases in traffic, the study found that the overwhelming tendency was for traffic to dwindle or disappear in the affected area. It also noted that the degree to which these reductions were sustained over the long term depended largely on the cumulative impact of several concordant policies. Irrespective of whether or not traffic reduction is a desirable policy outcome in urban areas, this study highlights that reductions in available roadspace do not necessarily lead to increased congestion.
Distribution of Recorded Changes in Traffic for Individual Case Studies
Source: adapted from Cairns et al, 2002.
-150
-100
-50
0
50
Mean traffic change = -21.9% Median traffic change value = -10.6%

84 – CAUSES OF CONGESTION IN URBAN AREAS
MANAGING URBAN TRAFFIC CONGESTION – ISBN 978-92-821-0128-5 - © ECMT, 2007
Dwindling or Disappearing Traffic: Cheonggye Stream Restoration in Seoul
Not studied in the Cairns et al. study cited is the recent restoration of Cheonggye Stream in downtown Seoul. The notion of decreasing/disappearing traffic was central to this scheme pioneered by the municipal government of Seoul that ambitiously sought to remove the 5.8 kilometres of the Cheonggye elevated highway and four of eight lanes of the adjacent Cheonggye street in order to restore the stream that had been covered by the urban expressway and to revitalize the neighbourhood through the creation of an urban park. The results of both pre- and post restoration monitoring on roads in downtown Seoul have been consistent with the findings of the Cairns et al. study in that the bulk of the traffic formerly travelling along the Cheonggye corridor has failed to materialise on adjacent streets or in the greater urban area. Evidence points to a shift in departure times and to a significant increase usage of the Metro as being the principal outcomes of the loss of roadway capacity. It should also be noted that the amenity of the Cheonggye Stream park and the increase in adjacent property values are also non negligible outcomes of the project.
Cheonggye Stream: Before restoration Cheonggye Stream: After restoration
Source: Lee et al (2004), Hwang, K-Y. and Lee, S. (2004) and Seoul Metropolitan Government (pictures)
However, the balance of evidence supports the somewhat intuitive notion that congestion policies that provide new capacity (or that free up existing capacity – e.g. better signal timing, public transport policies that successfully draw car users from the road, etc…) induce additional travel on the facility in question. The reduced travel times made possible by the new or newly available capacity attracts new trips, traffic from other facilities, travel from other modes and/or travel that had previously occurred at other times. In practice, it has often been assumed that such newly expressed demand was finite in nature and thus adding new or newly available “old” capacity would generate lasting congestion benefits. Numerous studies have confirmed that this has proven to be at best an overly optimistic and generally erroneous assessment25 – at least as concerns demand for travel along the particular corridor in question.
Elasticity measurements are used to capture the effect of changes in use of one good or service in response to changes in the price of another. In this case, the induced travel effect can be captured either by trying to isolate changes in travel volumes that can be linked either to changes in travel time or changes in capacity. A number of reviews of travel time or supply elasticities have been undertaken26 and the results detailed in Table 3.2 are illustrative of their findings. While some of the elasticities reviewed by researchers only reference physical capacity additions (e.g. lane-km or lane-miles) rather than travel-time and its cost, and thus are an indirect measurement of how travellers react
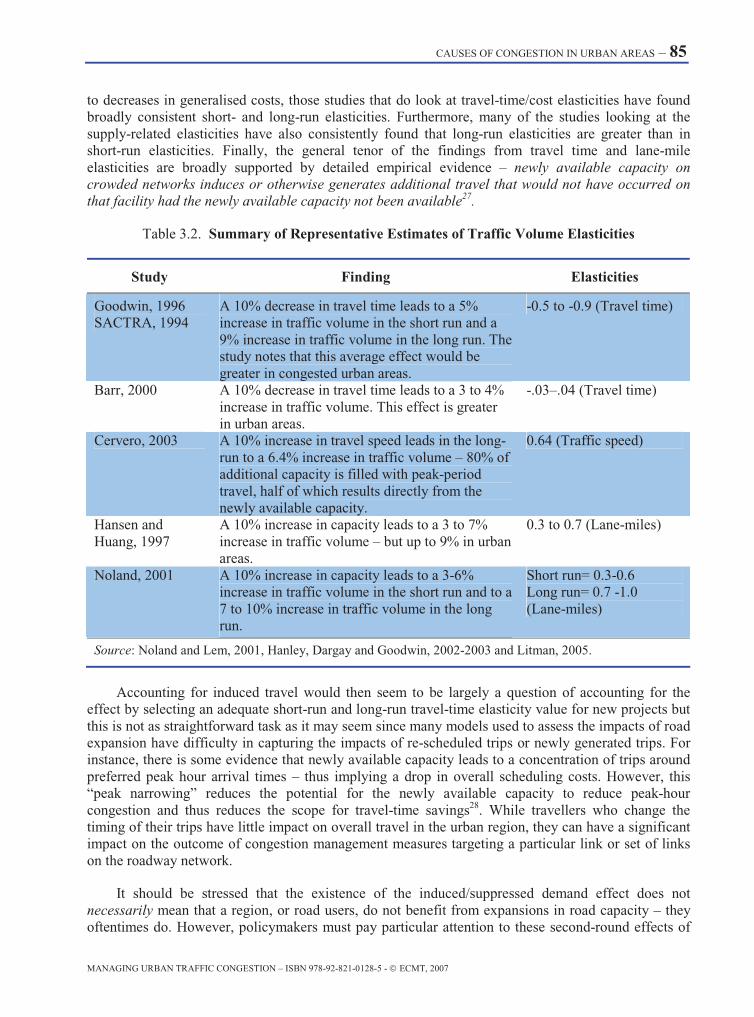
CAUSES OF CONGESTION IN URBAN AREAS – 85
MANAGING URBAN TRAFFIC CONGESTION – ISBN 978-92-821-0128-5 - © ECMT, 2007
to decreases in generalised costs, those studies that do look at travel-time/cost elasticities have found broadly consistent short- and long-run elasticities. Furthermore, many of the studies looking at the supply-related elasticities have also consistently found that long-run elasticities are greater than in short-run elasticities. Finally, the general tenor of the findings from travel time and lane-mile elasticities are broadly supported by detailed empirical evidence – newly available capacity on crowded networks induces or otherwise generates additional travel that would not have occurred on that facility had the newly available capacity not been available27.
Table 3.2. Summary of Representative Estimates of Traffic Volume Elasticities
Study Finding Elasticities
Goodwin, 1996 SACTRA, 1994
A 10% decrease in travel time leads to a 5% increase in traffic volume in the short run and a 9% increase in traffic volume in the long run. The study notes that this average effect would be greater in congested urban areas.
-0.5 to -0.9 (Travel time)
Barr, 2000 A 10% decrease in travel time leads to a 3 to 4% increase in traffic volume. This effect is greater in urban areas.
-.03–.04 (Travel time)
Cervero, 2003 A 10% increase in travel speed leads in the long-run to a 6.4% increase in traffic volume – 80% of additional capacity is filled with peak-period travel, half of which results directly from the newly available capacity.
0.64 (Traffic speed)
Hansen and Huang, 1997
A 10% increase in capacity leads to a 3 to 7% increase in traffic volume – but up to 9% in urban areas.
0.3 to 0.7 (Lane-miles)
Noland, 2001 A 10% increase in capacity leads to a 3-6% increase in traffic volume in the short run and to a 7 to 10% increase in traffic volume in the long run.
Short run= 0.3-0.6 Long run= 0.7 -1.0 (Lane-miles)
Source: Noland and Lem, 2001, Hanley, Dargay and Goodwin, 2002-2003 and Litman, 2005.
Accounting for induced travel would then seem to be largely a question of accounting for the effect by selecting an adequate short-run and long-run travel-time elasticity value for new projects but this is not as straightforward task as it may seem since many models used to assess the impacts of road expansion have difficulty in capturing the impacts of re-scheduled trips or newly generated trips. For instance, there is some evidence that newly available capacity leads to a concentration of trips around preferred peak hour arrival times – thus implying a drop in overall scheduling costs. However, this “peak narrowing” reduces the potential for the newly available capacity to reduce peak-hour congestion and thus reduces the scope for travel-time savings28. While travellers who change the timing of their trips have little impact on overall travel in the urban region, they can have a significant impact on the outcome of congestion management measures targeting a particular link or set of links on the roadway network.
It should be stressed that the existence of the induced/suppressed demand effect does not necessarily mean that a region, or road users, do not benefit from expansions in road capacity – they oftentimes do. However, policymakers must pay particular attention to these second-round effects of

86 – CAUSES OF CONGESTION IN URBAN AREAS
MANAGING URBAN TRAFFIC CONGESTION – ISBN 978-92-821-0128-5 - © ECMT, 2007
capacity provision in order to realistically assess the benefits of roadway expansion. What matters most is not the level of traffic on the roads before congestion management policies are implemented but what, realistically, are likely to be the levels of traffic on the roads after congestion management measures have been deployed – and how these will likely evolve over the short to medium term. And the answer to the latter question seems to be more quickly than many projects plan or account for.
In particular, transport modelling methods used to assess the benefits of the policies for dealing with congestion described in Chapter 5 must take specific account of these second round effects of the additional capacity. When the design of the scheme and its evaluation fail to recognise such effects, the reduction in congestion delivered will not meet policy makers’ high expectations about the performance of such policies. As noted above, this phenomenon of induced traffic is not necessarily negative; it indicates that new activities are being undertaken and that travellers are acting on newly available opportunities. New capacity construction policies can still be beneficial and deliver value for money. But in congested conditions the demand that they generate reduces the benefits that would be delivered in absence of traffic generation. This is especially important in light of congestion management policies since many studies have highlighted that it is precisely in highly congested urban areas that induced/suppressed demand is most likely to quickly erode the benefits of road expansion projects!29
Furthermore the reality of induced travel begs a somewhat philosophical and yet very pragmatic question: If traffic on a facility will nearly always grow to meet and surpass capacity – what is the limit to new road construction?
Obviously, cities and urban regions can and should continue to expand their transport infrastructure where it makes best sense to do so, however, what signals are incorporated in the present dominant paradigm of predict-and-provide policies to guide such infrastructure provision in light of “free” (from the traveller’s immediate perspective) roads and induced travel?
The answer to that question serves to frame the discussion in Chapter 6 regarding strategic principles for congestion management policy.
Chapter Summary
• Effective congestion management policies should be based on a location and context-specific diagnosis of the scale and scope of the congestion problem faced by an urban region.
• We can identify three broad categories of causal factors that impact road traffic congestion; micro-level factors (e.g. those that relate to traffic “on the road”), macro-level factors that relate to first-order demand for roadway usage and a set of exogenous factors that relate to second-order demand for roadway usage along with “random” variables such as weather and visibility. It is important to keep in mind that congestion is a result of “triggers” that immediately give rise to traffic congestion at the “micro” level (e.g. on the road), and “drivers” that operate at the “macro” level and contribute to the incidence of congestion and its severity.
• Congestion is typically categorized as either recurrent or non-recurrent. Recurrent congestion is generally caused by factors that act periodically on the transportation system, such as daily commuting or weekend trips. However, even recurrent congestion can display a large degree of randomness, especially in its duration and severity.
CAUSES OF CONGESTION IN URBAN AREAS – 87
MANAGING URBAN TRAFFIC CONGESTION – ISBN 978-92-821-0128-5 - © ECMT, 2007
• What is also clear from an examination of the causes of “recurrent” congestion across different types of road networks is the extreme vulnerability of traffic to sudden breakdowns as demand approaches the technically maximum throughput capacity on a link or in the network. When roads are operated at or near their maximum capacity, small changes in available capacity due to such factors as differential vehicle speeds, lane changes, acceleration and deceleration cycles can trigger a sudden switch from flowing to stop-and-go traffic.
• Non-recurrent congestion is the effect of unexpected, unplanned or large events (e.g. road works, crashes, special events and so on) that affect parts of the transportation system more or less randomly and, as such, cannot be easily predicted, modelled or mitigated. The share of non-recurrent congestion varies from road network to road network and is linked to the presence and effectiveness of incident response strategies, roadwork scheduling and prevailing atmospheric conditions (snow, rain, fog, etc.).
• While most non-recurrent incidents have the same negative impact on roadway performance, not all incidents are purely random nor are they equally difficult to plan for. While most crashes are unpredictable by their very nature, crash–prone segments of the roadway can be identified via statistical analysis and specific geometric or other safety treatments applied.
• Likewise, roadworks can be managed in such a way as to minimise their impacts on traffic. Even weather, while impossible to change, can be prepared for with contingency planning that can lessen its impact on traffic.
• Furthermore, the specific mechanisms relating to the triggering of congestion are different according to different classes of roadways. Congestion on uninterrupted flow facilities such as motorways does not occur in the same manner nor for the same proximate causes as congestion arising on interrupted flow facilities such as those found in dense urban cores.
• Additionally, the level of demand for roads and the formation of congestion is not a static one-off phenomenon. The freeing-up of road space or the provision of new capacity is likely to attract new traffic to the road in question. The impact of induced and/or diverted traffic should not be underestimated.
• Finally, effective congestion management policies should seek to understand the nature of travel demand in congested conditions. While commuting trips may be an important factor at play, it is important not to overlook other types of peak-hour trips including school runs, leisure travel, parking search behaviour and urban freight and goods delivery.

88 – CAUSES OF CONGESTION IN URBAN AREAS
MANAGING URBAN TRAFFIC CONGESTION – ISBN 978-92-821-0128-5 - © ECMT, 2007
NOTES 1. Bovy, P. and Hoogendoorn, S. (2000).
2. Generally, both in Europe and the U.S.A., 55% of non-recurring congestion is attributed to random incidents and work zones; on German motorways, workzones and crashes account for 60% of congestion causes; in Switzerland, the figures are 33% and 19%, respectively for crashes and work zones.
3. Bovy, P. and Hoogendoorn, S., 2000 and SYTADIN, 2004.
4. The impacts of inclement weather on roadway capacity can be important. One study -- Chin, S.M. et al (2004) -- from the United States gives the following estimates:
Light rain reduces speed by roughly 10%, decreasing capacity by approximately 4%.
Heavy rain decreases speed by about 16%, lowering capacity by roughly 8%.
Light snow reduces capacity by 5% to 10%, depending upon accumulation. Urban freeways
In heavy snow, speeds decline by nearly 38% suggesting a 25–30% reduction in capacity.
Rain reduces speed by 10% and capacity by 6%.
Snowfall and wet pavement conditions decrease speed by 13% and capacity by 11%.
When "wet and slushy" conditions exist, speed declines by 25% and capacity drops by 18%.
When travel lanes are "slushy," speed is reduced by 30% and capacity decreases by 18%.
Arterials
Snowfall and snow-covered pavement conditions reduce capacity by 20%.
5. Transport engineers refer to flows at point A and B in the diagram as uncongested, unrestricted, unbound or
free-flow. Economists, however, label these flows as congested.
6. See Leurent, F. (2006) and Maerivoet, S. and de Moor, B. (2006) for a discussion of these.
7. Kerner, B. (2004).
8. Kerner, B. et al (2001).
9. Zhang H. (1999) and Maerivoet, S. and de Moor, B. (2006).
10. AHUA (2004), p. 7.
11. see, for example, Highway Capacity Manual, 2000.
12. See e.g. Brilon, Schnabel, 2003.
13. Newman and Kenworthy, 1999.
14. CLF, 2004.
15. Athens METRO, 1996.
16. UK National Statistics Office, 2004.
17. Pickrel and Schimek, 1995.
18. Augustus Caesar and then Emperor Hadrian both sought to relieve congestion in Rome by banning day-time freight and goods delivery in the ancient capital. Hadrian noted: "I reduced the insolent crowd of carriages which cumber our streets, for this luxury of speed destroys its own aim; a pedestrian makes more headway than a hundred conveyances jammed end to end along the twists and turns of the Sacred Way” However, in a telling policy reversal, the daytime bans were soon reversed due to the complaints of Roman citizens kept awake by night-time deliveries. Wachs, M. (2002), and Encyclopaedia Britannica.
19. OECD (2003).
20. Browne, M. et al (2001).
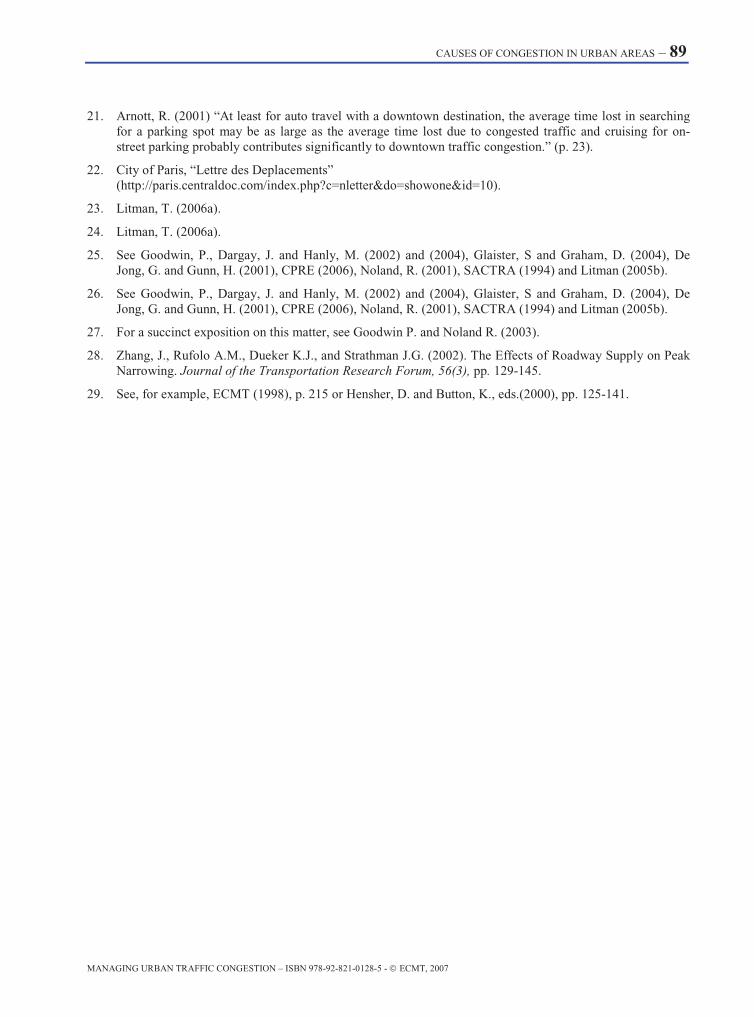
CAUSES OF CONGESTION IN URBAN AREAS – 89
MANAGING URBAN TRAFFIC CONGESTION – ISBN 978-92-821-0128-5 - © ECMT, 2007
21. Arnott, R. (2001) “At least for auto travel with a downtown destination, the average time lost in searching
for a parking spot may be as large as the average time lost due to congested traffic and cruising for on-street parking probably contributes significantly to downtown traffic congestion.” (p. 23).
22. City of Paris, “Lettre des Deplacements” (http://paris.centraldoc.com/index.php?c=nletter&do=showone&id=10).
23. Litman, T. (2006a).
24. Litman, T. (2006a).
25. See Goodwin, P., Dargay, J. and Hanly, M. (2002) and (2004), Glaister, S and Graham, D. (2004), De Jong, G. and Gunn, H. (2001), CPRE (2006), Noland, R. (2001), SACTRA (1994) and Litman (2005b).
26. See Goodwin, P., Dargay, J. and Hanly, M. (2002) and (2004), Glaister, S and Graham, D. (2004), De Jong, G. and Gunn, H. (2001), CPRE (2006), Noland, R. (2001), SACTRA (1994) and Litman (2005b).
27. For a succinct exposition on this matter, see Goodwin P. and Noland R. (2003).
28. Zhang, J., Rufolo A.M., Dueker K.J., and Strathman J.G. (2002). The Effects of Roadway Supply on Peak Narrowing. Journal of the Transportation Research Forum, 56(3), pp. 129-145.
29. See, for example, ECMT (1998), p. 215 or Hensher, D. and Button, K., eds.(2000), pp. 125-141.

OVERVIEW OF TRAFFIC CONGESTION AND CONGESTION APPOACHES IN MEMBER COUNTRIES – 91
MANAGING URBAN TRAFFIC CONGESTION – ISBN 978-92-821-0128-5 - © ECMT, 2007
4. OVERVIEW OF TRAFFIC CONGESTION AND CONGESTION APPROACHES IN MEMBER COUNTRIES
This chapter provides an overview of inputs provided by member countries about traffic congestion in their metropolitan areas. The country inputs include advice on current congestion levels and the congestion outlook. There is also summary of the different frameworks used by countries to address congestion at the urban level.
4.1 Introduction
Transport policy perspectives on traffic congestion are generally formed in the context of political and community concerns about increasing levels of congestion. Many government transport administrations have responded to adverse congestion trends and community concerns by adopting national or regional/local policy objectives related to traffic congestion.
Congestion-related policies, where they exist, often target reducing congestion costs and its impacts (such as travel time “losses”, unacceptable travel time variability and wasted fuel, adverse impacts on air quality, etc). Transport planning processes in turn are generally aligned with and provide support for the broad policy objectives that have been established.
Of course there are strong interactions between transport policy and transport planning. What is planned and how it is planned will depend on the overall policy objectives that have been established. If transport policies are intended, for example, to respond to community demands for more compact, liveable and less resource intensive cities, what is planned is more likely to favour higher density development (and re-development), public transport and walking.
In cities or locations where transport policies respond more to demands for location choice, motor vehicle travel and living in lower cost, decentralized locations with more space, what is planned is likely to be quite different. In other words, the outcome of planning processes will to some extent depend on the overall national and regional/metropolitan policy framework.
This chapter summarises input from Working Group members relating to the current level and outlook for congestion in the following countries:
• Australia
• Canada
• Czech Republic
• France
• Germany
• Greece

92 – OVERVIEW OF TRAFFIC CONGESTION AND CONGESTION APPOACHES IN MEMBER COUNTRIES
MANAGING URBAN TRAFFIC CONGESTION – ISBN 978-92-821-0128-5 - © ECMT, 2007
• Japan
• The Netherlands
• New Zealand
• The Russian Federation (Moscow Region)
• Spain
• The United Kingdom
• The United States
As noted previously, there are different approaches in use for defining and measuring congestion and there are also different approaches for assessing the actions needed. The country overviews provided in this chapter reflect the definitions and approaches in use in each country.
4.2 Overview of Congestion in Selected Countries
4.2.1 Australia
4.2.1.1 Location and Extent of Congestion
Total passenger-kilometres in urban areas have been driven by increases in population and per capita vehicle ownership, increasing incomes and urban decentralisation. Demand for both passenger and freight is directly linked to economic growth, with passenger travel growing faster than population growth. The national freight task has been found to grow at about 1.21 times the rate of economic growth.1 The Australian economy has experienced historically low interest rates and strong economic growth, which has been contributing to the growth in freight movements, including in urban areas.
While Australia’s two fastest growing cities – Brisbane and Perth – are also increasingly facing congested road conditions, Sydney and Melbourne account for the bulk of the supra-optimal congestion.
Melbourne is characterised by a high but concentrated level of congestion—around a relatively small central area near the CBD. (Figure 4.1). The total cost of congestion in Melbourne is estimated to be around $3 bn a year. At peak times, approximately 640 km of the arterial road network operates under congested conditions. The majority of congestion currently occurs in the inner to middle suburbs – within 15 km of the Central Business District. (DOI 2005).
Metropolitan Melbourne has a population of over 3.6 m people and covers nearly 9 000 square km. Congestion is concentrated in the inner to middle suburbs – within 15 km of the central business district. However, heavy traffic is also experienced on Melbourne’s freeway system, particularly the east-west corridor and around the port of Melbourne, and on freeways that provide access to and from the central business district. At peak times approximately 88 km of the arterial road network operates under congested conditions.2
In Melbourne, the variability of travel time (percentage difference in travel times experienced due to delay) in the morning peak has increased from 17.4% to 25.3% over the full five year period. The variability of travel time in the evening peak increased from 15.8% in 1999-2000 to 18.8% in 2003-2004, and then registered a fall to 17.7% in 2004–2005.3
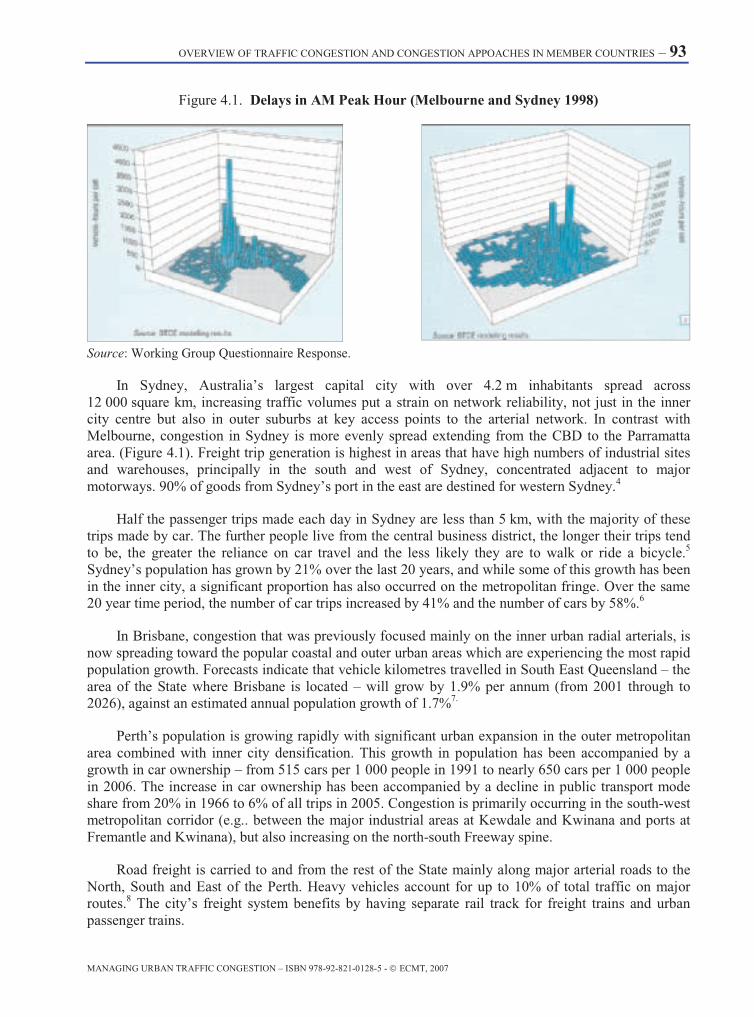
OVERVIEW OF TRAFFIC CONGESTION AND CONGESTION APPOACHES IN MEMBER COUNTRIES – 93
MANAGING URBAN TRAFFIC CONGESTION – ISBN 978-92-821-0128-5 - © ECMT, 2007
Figure 4.1. Delays in AM Peak Hour (Melbourne and Sydney 1998)
Source: Working Group Questionnaire Response.
In Sydney, Australia’s largest capital city with over 4.2 m inhabitants spread across 12 000 square km, increasing traffic volumes put a strain on network reliability, not just in the inner city centre but also in outer suburbs at key access points to the arterial network. In contrast with Melbourne, congestion in Sydney is more evenly spread extending from the CBD to the Parramatta area. (Figure 4.1). Freight trip generation is highest in areas that have high numbers of industrial sites and warehouses, principally in the south and west of Sydney, concentrated adjacent to major motorways. 90% of goods from Sydney’s port in the east are destined for western Sydney.4
Half the passenger trips made each day in Sydney are less than 5 km, with the majority of these trips made by car. The further people live from the central business district, the longer their trips tend to be, the greater the reliance on car travel and the less likely they are to walk or ride a bicycle.5 Sydney’s population has grown by 21% over the last 20 years, and while some of this growth has been in the inner city, a significant proportion has also occurred on the metropolitan fringe. Over the same 20 year time period, the number of car trips increased by 41% and the number of cars by 58%.6
In Brisbane, congestion that was previously focused mainly on the inner urban radial arterials, is now spreading toward the popular coastal and outer urban areas which are experiencing the most rapid population growth. Forecasts indicate that vehicle kilometres travelled in South East Queensland – the area of the State where Brisbane is located – will grow by 1.9% per annum (from 2001 through to 2026), against an estimated annual population growth of 1.7%7.
Perth’s population is growing rapidly with significant urban expansion in the outer metropolitan area combined with inner city densification. This growth in population has been accompanied by a growth in car ownership – from 515 cars per 1 000 people in 1991 to nearly 650 cars per 1 000 people in 2006. The increase in car ownership has been accompanied by a decline in public transport mode share from 20% in 1966 to 6% of all trips in 2005. Congestion is primarily occurring in the south-west metropolitan corridor (e.g.. between the major industrial areas at Kewdale and Kwinana and ports at Fremantle and Kwinana), but also increasing on the north-south Freeway spine.
Road freight is carried to and from the rest of the State mainly along major arterial roads to the North, South and East of the Perth. Heavy vehicles account for up to 10% of total traffic on major routes.8 The city’s freight system benefits by having separate rail track for freight trains and urban passenger trains.
94 – OVERVIEW OF TRAFFIC CONGESTION AND CONGESTION APPOACHES IN MEMBER COUNTRIES
MANAGING URBAN TRAFFIC CONGESTION – ISBN 978-92-821-0128-5 - © ECMT, 2007
4.2.1.2 Outlook for Congestion
Across Australia, total metropolitan vehicle kilometres (freight and passenger) travelled are forecast to grow on average by 40% between 2002 and 2020. Cars are the dominant transport mode for domestic passenger travel, accounting for approximately 80% of total metropolitan vehicle kilometres travelled. Road is also the dominant mode for urban freight. Urban road freight is expected to increase by over 70% between 2002 and 2020. Domestic non-bulk freight is expected to grow at a faster rate than overall traffic, including cars. However, even with the rapid growth of light commercial vehicle freight traffic, it is expected that car traffic will comprise 75% of total metropolitan vehicle kilometres in 2020.9
The rate of vehicle kilometres travelled is growing more rapidly in Perth and Brisbane, with growth rates exceeding those for Sydney and Melbourne.
In Sydney, the expected growth in passenger transport demand coupled with growth in road freight movements is likely to lead to increasing competition for road space. A similar phenomenon is expected on the partly-shared metropolitan rail network where additional rail passenger services will reduce availability for freight services..10 In Melbourne, traffic congestion in the inner city is forecast to increase substantially, while traffic congestion is also expected to migrate to the outer suburbs. If changes are not made, congestion will spread to over 385 km of the arterial road network by 2021.11
Traditional traffic congestion performance measures, such as average travel speeds and other speed-based congestion measures, do not always give an accurate picture of how congestion is changing at the transport corridor level and the extent to which network reliability has become an issue. Such measures are more useful when congestion is beginning to emerge, but not as useful where periods of heavy congestion are the norm.
In Sydney and Melbourne, measures of weighted aggregate average travel speed during the morning and evening peak period for the urban road network have not changed significantly over the last five years despite significant investments in road infrastructure.12 This result reflects that the surveyed arterial roads have largely reached capacity. In these situations, travel speed measures may not pick up an increase in duration of congestion or the geographic spread of congestion, for example through traffic diversion, to other less attractive routes that are not part of the survey.
Peak spreading is a common phenomenon in areas where transport congestion is high. Current collection methods for congestion data in Australia hide this phenomenon. In Melbourne however, this phenomenon can be clearly measured. The Victorian road authority, VicRoads, has employed new technology to enable it to continuously collect freeway performance data. Figure 4.2 shows the extent of peak spreading in Melbourne from 2001 to 2005. The orange area represents the overall increase in traffic volume between the morning and afternoon peak and also highlights the growth in duration of peak periods.
4.2.2. Canada
4.2.2.1 Location and Extent of Congestion
Road congestion continues to be stimulated in Canada by rapid growth in population, urbanisation, and related growth in car ownership and use. In the decade from 1993 to 2003, Canada’s population grew by 2.7 m. Growth was particularly rapid in the metropolitan areas of Vancouver, at 23% and Calgary at 27% during the period. By far the largest absolute increase in population took
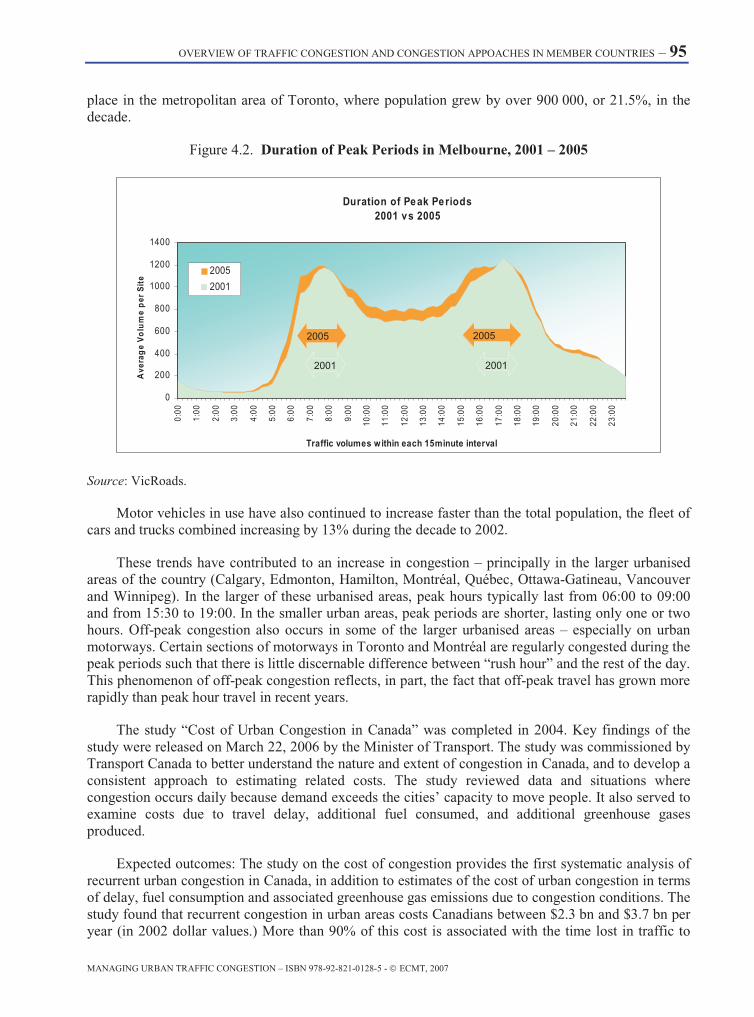
OVERVIEW OF TRAFFIC CONGESTION AND CONGESTION APPOACHES IN MEMBER COUNTRIES – 95
MANAGING URBAN TRAFFIC CONGESTION – ISBN 978-92-821-0128-5 - © ECMT, 2007
place in the metropolitan area of Toronto, where population grew by over 900 000, or 21.5%, in the decade.
Figure 4.2. Duration of Peak Periods in Melbourne, 2001 – 2005
Source: VicRoads.
Motor vehicles in use have also continued to increase faster than the total population, the fleet of cars and trucks combined increasing by 13% during the decade to 2002.
These trends have contributed to an increase in congestion – principally in the larger urbanised areas of the country (Calgary, Edmonton, Hamilton, Montréal, Québec, Ottawa-Gatineau, Vancouver and Winnipeg). In the larger of these urbanised areas, peak hours typically last from 06:00 to 09:00 and from 15:30 to 19:00. In the smaller urban areas, peak periods are shorter, lasting only one or two hours. Off-peak congestion also occurs in some of the larger urbanised areas – especially on urban motorways. Certain sections of motorways in Toronto and Montréal are regularly congested during the peak periods such that there is little discernable difference between “rush hour” and the rest of the day. This phenomenon of off-peak congestion reflects, in part, the fact that off-peak travel has grown more rapidly than peak hour travel in recent years.
The study “Cost of Urban Congestion in Canada” was completed in 2004. Key findings of the study were released on March 22, 2006 by the Minister of Transport. The study was commissioned by Transport Canada to better understand the nature and extent of congestion in Canada, and to develop a consistent approach to estimating related costs. The study reviewed data and situations where congestion occurs daily because demand exceeds the cities’ capacity to move people. It also served to examine costs due to travel delay, additional fuel consumed, and additional greenhouse gases produced.
Expected outcomes: The study on the cost of congestion provides the first systematic analysis of recurrent urban congestion in Canada, in addition to estimates of the cost of urban congestion in terms of delay, fuel consumption and associated greenhouse gas emissions due to congestion conditions. The study found that recurrent congestion in urban areas costs Canadians between $2.3 bn and $3.7 bn per year (in 2002 dollar values.) More than 90% of this cost is associated with the time lost in traffic to
Duration of Peak Periods 2001 vs 2005
0
200
400
600
800
1000
1200
1400
0:00
1:00
2:00
3:00
4:00
5:00
6:00
7:00
8:00
9:00
10:0
0
11:0
0
12:0
0
13:0
0
14:0
0
15:0
0
16:0
0
17:0
0
18:0
0
19:0
0
20:0
0
21:0
0
22:0
0
23:0
0
Traffic volumes within each 15minute interval
Ave
rag
e Vo
lum
e pe
r Site
2005
2001
2001
2005 2005
2001

96 – OVERVIEW OF TRAFFIC CONGESTION AND CONGESTION APPOACHES IN MEMBER COUNTRIES
MANAGING URBAN TRAFFIC CONGESTION – ISBN 978-92-821-0128-5 - © ECMT, 2007
drivers and passengers; 7% occurs because of fuel consumed; and 3% is from increased greenhouse gas emissions. Estimates of cost of congestion of this study will be used in the full cost investigation of transportation activities that Transport Canada is currently conducting.
4.2.1.2 Outlook for Congestion
Population is expected to continue to grow at its recent pace, notably through continued immigration. Recent forecasts anticipate population growth of about 0.75% p.a. to 2020. Greater urbanisation is expected as well, as population expansion continues to be concentrated in urban areas.
All the underlying trends suggest road traffic will continue to expand rapidly, in the absence of major economic shocks or policy changes. GDP growth is anticipated to be greater than 2% p.a., and if recent trends continue, car ownership and use will rise by more than that, or approaching 3% p.a. While some might argue that such growth is unlikely, as car ownership and use must be nearing “saturation”, the comparison with the United States is very instructive. In 2002, the average vehicle ownership rate per 1,000 people in the U.S. was 830, over 40% greater than the rate in Canada, according to official statistics. At the same time, GDP per capita was 27% greater than in Canada (estimated by purchasing power parity). The proportional difference in vehicle ownership has been close to 40% for at least the last four decades, while growth has been substantial. U.S. vehicle ownership was as high 30 years ago as the current Canadian rate. Furthermore, annual usage per vehicle has also increased throughout these decades in the U.S.
Given the similarity in the economies and geography, it can be anticipated that Canada will continue to follow the same growth path of vehicle ownership and use with population and GDP as has the U.S. Given the exponential relationship between congestion and traffic, in the absence of major capacity expansion, congestion delays can therefore be expected to increase substantially in Canada in coming decades.
4.2.3 Czech Republic:
4.2.3.1 Location and Extent of Congestion [Focus on Prague]
Over the past decade, the number of cars in the Czech Republic has increased significantly. The rate of motor vehicle registration per capita has already reached the level of more developed European countries and, in Prague, has even surpassed most west European cities. Traffic has also been growing, rising more in the period from 1990 to present than in the previous 100 years combined. While this trend has somewhat slowed recently, traffic is still growing.
Congestion is a daily feature of major cities such as Prague and Brno It is also experienced to a lesser extent in Ostrava, Plzeň and Olomouc. In Prague, 75% of daily traffic volume occurs between 6 a.m. and 6 p.m. Daily urban travel is characterised by peak period congestion on roads which can lead to delays of up to 30-35 min for every 10 km of travel in comparison to free-flow travel times.
240 000 cars and 440 000 people enter Prague daily. This volume of traffic cannot be adequately absorbed by the available urban road capacity and degraded traffic performance prevails on trunk roads and some feeder networks during peak periods. Peak period traffic intensity in Prague exceeds the traffic intensity of the most heavily used roads and motorways elsewhere in the country.
An increase in car use for commuting is one of the main factors behind the rise of congestion in Czech cities. The share of daily travel by public transport has decreased from 75% to 60% since 1990 in all the major Czech cities. Passenger cars now represent 80% of the vehicle fleet and passenger car

OVERVIEW OF TRAFFIC CONGESTION AND CONGESTION APPOACHES IN MEMBER COUNTRIES – 97
MANAGING URBAN TRAFFIC CONGESTION – ISBN 978-92-821-0128-5 - © ECMT, 2007
traffic accounts for 90% of daily traffic flows in all principal Czech cities. Average vehicle occupancy is currently at 1.4 persons per car.
4.2.3.2 Outlook for Congestion
Future traffic trends in Prague will be conditioned by the deployment and success of congestion-detection and management measures. These include providing traffic information (VMS, broadcast, Internet, mobile-phone) and travel time information and forecasts as well as by an increased offer of high quality public transport in conjunction with “park-and-ride” facilities. The uptake of in-vehicle dynamic navigation is also hoped to play a role in reducing excessive congestion.
4.2.4 France
Congestion cannot be said to be a major national political concern in France, though it is frequently alluded to by nation-wide media, especially during the holiday periods. Nonetheless, congestion is a durable feature of urban life in France and the national government as well as regional governments have paid an increasing amount of attention to the subject. In policy discourse, urban congestion is often treated as one of several issues to be addressed at the greater urban regional level – other issues include urban liveability, equity, environment and access to efficient public transport networks.
4.2.4.1 Location and Extent of Congestion
In absolute terms, the greater Paris region dominates the distribution of urban congestion impacts. In terms of total time loss, the Paris region accounts for 2/3 of total time loss across France, with congestion spreading 14 hours per day on the Paris first ring road (the “boulevard périphérique de Paris”). In Paris the morning peak lasts 2 hours and the evening peak lasts 3 hours. Other major cities (e.g. Lyon, Marseille, Bordeaux, Toulouse, Grenoble, etc…) typically experience much shorter peak periods – although in quickly growing cities, the duration and severity of peak hour traffic has also risen rapidly.
4.2.4.2 Outlook for Congestion
Although congestion severely impairs the use of some transport infrastructure, the overall perception (as verified in studies) is that average trip speeds have increased regularly due to network development (motorways, high speed rail, public transport) as well as self-demand management (destination choice) which allow to counter-balance the steady increase of traffic.
While historically, many French cities sought to adapt themselves to car traffic from the 1950’s to the 1980’s, there has been a relatively widespread backlash with cities seeking to “tame” rather than facilitate further car use – especially in dense urban cores. At present, many cities have embarked on traffic restraint policies and have subordinated, or at least rendered equal, road traffic development with other urban policy objectives such as the promotion of public transport, walking and cycling.
4.2.5 Germany
4.2.5.1. Location and Extent of Congestion
On the motorway network, congestion occurs rather frequently, especially in metropolitan areas like Hamburg, Berlin, Rhine-Ruhr-Area (Dortmund-Essen-Düsseldorf-Cologne), Frankfurt, Stuttgart and Munich. The German motorway network grew from about 3 400 km in 1950 to 12 200 km in

98 – OVERVIEW OF TRAFFIC CONGESTION AND CONGESTION APPOACHES IN MEMBER COUNTRIES
MANAGING URBAN TRAFFIC CONGESTION – ISBN 978-92-821-0128-5 - © ECMT, 2007
2005. The increase of motorisation and kilometres travelled in passenger transport as well as in freight transport could not be met by the provision of an adequate road infrastructure. The growth was too rapid and too demanding. Furthermore, the improved road supply induced additional road traffic.
Because of the absence of a uniform definition of congestion, statistics differ concerning severity and frequency of congestion in Germany. But it is assumed that the total congestion length averages around 200 km per day and reaches up to 1 000 km on peak days. Congestion causes can be divided between road works, incidents and high traffic volumes which accounts for approximately one third each.
Especially when regional, long-distance and transit trips overlap, congestion occurs during peak hours (6 to 10 am and 4 to 6 pm). 60% of traffic jams on highways have a length of approximately 3 km.
Figure 4.3. Evolution of Daily Travel in Eastern German Cities 1991-2003 (Weighted Average of 15 cities, Percent of Trips Per Day)
Source: Working Group Questionnaire Response.
Many cities in Germany have also seen an extension in the duration of peak hour traffic. Figure 4.3 illustrates the case of the 15 largest cities in the Eastern part of Germany, where a growing share of trips are made on the shoulders of the peak periods while the share of trips taking place at the traditional rush hour has decreased over the years
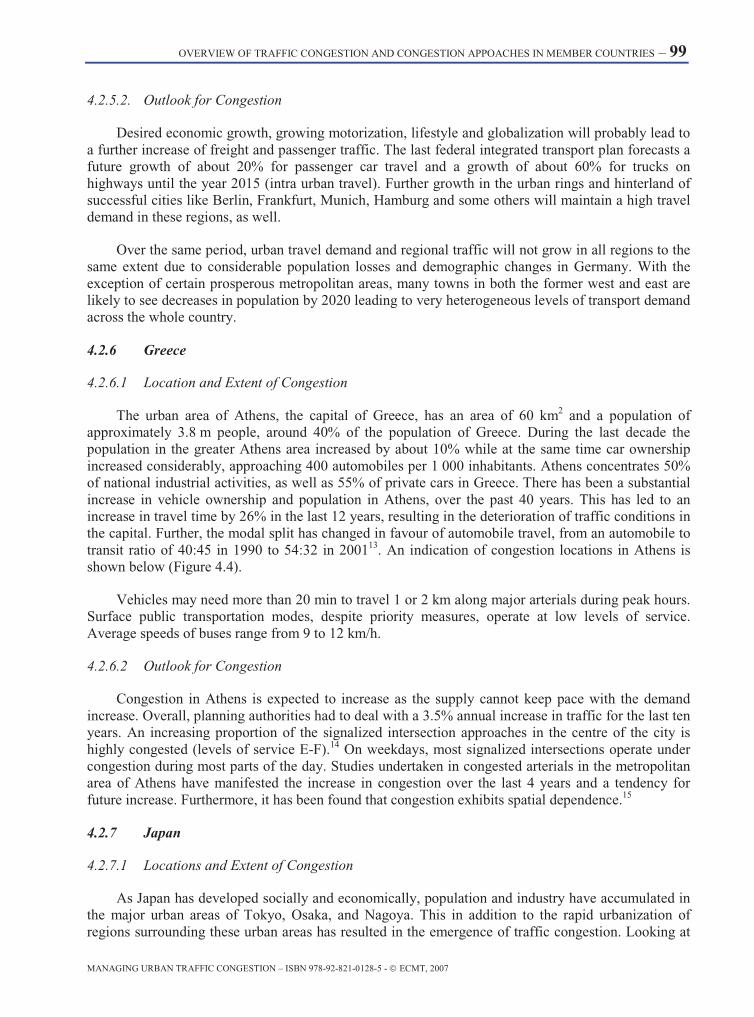
OVERVIEW OF TRAFFIC CONGESTION AND CONGESTION APPOACHES IN MEMBER COUNTRIES – 99
MANAGING URBAN TRAFFIC CONGESTION – ISBN 978-92-821-0128-5 - © ECMT, 2007
4.2.5.2. Outlook for Congestion
Desired economic growth, growing motorization, lifestyle and globalization will probably lead to a further increase of freight and passenger traffic. The last federal integrated transport plan forecasts a future growth of about 20% for passenger car travel and a growth of about 60% for trucks on highways until the year 2015 (intra urban travel). Further growth in the urban rings and hinterland of successful cities like Berlin, Frankfurt, Munich, Hamburg and some others will maintain a high travel demand in these regions, as well.
Over the same period, urban travel demand and regional traffic will not grow in all regions to the same extent due to considerable population losses and demographic changes in Germany. With the exception of certain prosperous metropolitan areas, many towns in both the former west and east are likely to see decreases in population by 2020 leading to very heterogeneous levels of transport demand across the whole country.
4.2.6 Greece
4.2.6.1 Location and Extent of Congestion
The urban area of Athens, the capital of Greece, has an area of 60 km2 and a population of approximately 3.8 m people, around 40% of the population of Greece. During the last decade the population in the greater Athens area increased by about 10% while at the same time car ownership increased considerably, approaching 400 automobiles per 1 000 inhabitants. Athens concentrates 50% of national industrial activities, as well as 55% of private cars in Greece. There has been a substantial increase in vehicle ownership and population in Athens, over the past 40 years. This has led to an increase in travel time by 26% in the last 12 years, resulting in the deterioration of traffic conditions in the capital. Further, the modal split has changed in favour of automobile travel, from an automobile to transit ratio of 40:45 in 1990 to 54:32 in 200113. An indication of congestion locations in Athens is shown below (Figure 4.4).
Vehicles may need more than 20 min to travel 1 or 2 km along major arterials during peak hours. Surface public transportation modes, despite priority measures, operate at low levels of service. Average speeds of buses range from 9 to 12 km/h.
4.2.6.2 Outlook for Congestion
Congestion in Athens is expected to increase as the supply cannot keep pace with the demand increase. Overall, planning authorities had to deal with a 3.5% annual increase in traffic for the last ten years. An increasing proportion of the signalized intersection approaches in the centre of the city is highly congested (levels of service E-F).14 On weekdays, most signalized intersections operate under congestion during most parts of the day. Studies undertaken in congested arterials in the metropolitan area of Athens have manifested the increase in congestion over the last 4 years and a tendency for future increase. Furthermore, it has been found that congestion exhibits spatial dependence.15
4.2.7 Japan
4.2.7.1 Locations and Extent of Congestion
As Japan has developed socially and economically, population and industry have accumulated in the major urban areas of Tokyo, Osaka, and Nagoya. This in addition to the rapid urbanization of regions surrounding these urban areas has resulted in the emergence of traffic congestion. Looking at
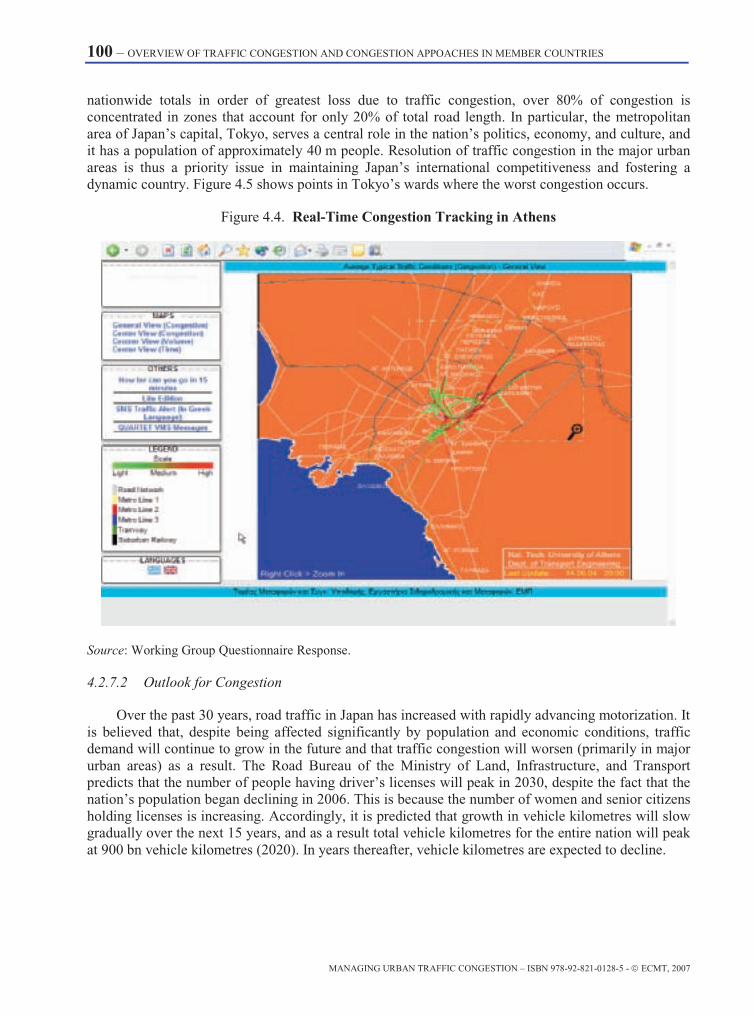
100 – OVERVIEW OF TRAFFIC CONGESTION AND CONGESTION APPOACHES IN MEMBER COUNTRIES
MANAGING URBAN TRAFFIC CONGESTION – ISBN 978-92-821-0128-5 - © ECMT, 2007
nationwide totals in order of greatest loss due to traffic congestion, over 80% of congestion is concentrated in zones that account for only 20% of total road length. In particular, the metropolitan area of Japan’s capital, Tokyo, serves a central role in the nation’s politics, economy, and culture, and it has a population of approximately 40 m people. Resolution of traffic congestion in the major urban areas is thus a priority issue in maintaining Japan’s international competitiveness and fostering a dynamic country. Figure 4.5 shows points in Tokyo’s wards where the worst congestion occurs.
Figure 4.4. Real-Time Congestion Tracking in Athens
Source: Working Group Questionnaire Response.
4.2.7.2 Outlook for Congestion
Over the past 30 years, road traffic in Japan has increased with rapidly advancing motorization. It is believed that, despite being affected significantly by population and economic conditions, traffic demand will continue to grow in the future and that traffic congestion will worsen (primarily in major urban areas) as a result. The Road Bureau of the Ministry of Land, Infrastructure, and Transport predicts that the number of people having driver’s licenses will peak in 2030, despite the fact that the nation’s population began declining in 2006. This is because the number of women and senior citizens holding licenses is increasing. Accordingly, it is predicted that growth in vehicle kilometres will slow gradually over the next 15 years, and as a result total vehicle kilometres for the entire nation will peak at 900 bn vehicle kilometres (2020). In years thereafter, vehicle kilometres are expected to decline.

OVERVIEW OF TRAFFIC CONGESTION AND CONGESTION APPOACHES IN MEMBER COUNTRIES – 101
MANAGING URBAN TRAFFIC CONGESTION – ISBN 978-92-821-0128-5 - © ECMT, 2007
Figure 4.5. Main Traffic Congestion Point of the Tokyo Metropolitan Area
Source: Working Group Questionnaire RESPONSE
4.2.8 The Netherlands
4.2.8.1 Location and Extent of Congestion
The map below (Figure 4.6) shows the geographical dispersion of travel time loss due to structural congestion on the national motorway network as estimated for the year 2000.
The color code refers to a qualitative assessment of the ‘degree of seriousness’:
• Grey = None
• Green = Low
• Yellow = Moderate
• Orange = Substantial
• Red = Serious
Congestion on the motorway network is mostly concentrated in and around the conurbations in the western part of the country that together form the so-called Randstad conurbation, with main cities Amsterdam, Rotterdam, The Hague and Utrecht, but also on the corridors towards the southern and eastern part of the country and to the neighbouring countries Belgium and Germany.
4.2.8.2 Outlook for Congestion
As car mobility, but also road freight is expected to increase substantially in the next years, so will congestion. Increasing urbanisation and commercialisation will result in additional mobility. Road traffic is expected to grow by 40% ( in vehicle kilometres) between 2000 and 2020, both on the trunk road system and the secondary road network. The total amount of lost vehicle hours is expected to nearly have doubled in the year 2020 without further policy measures.
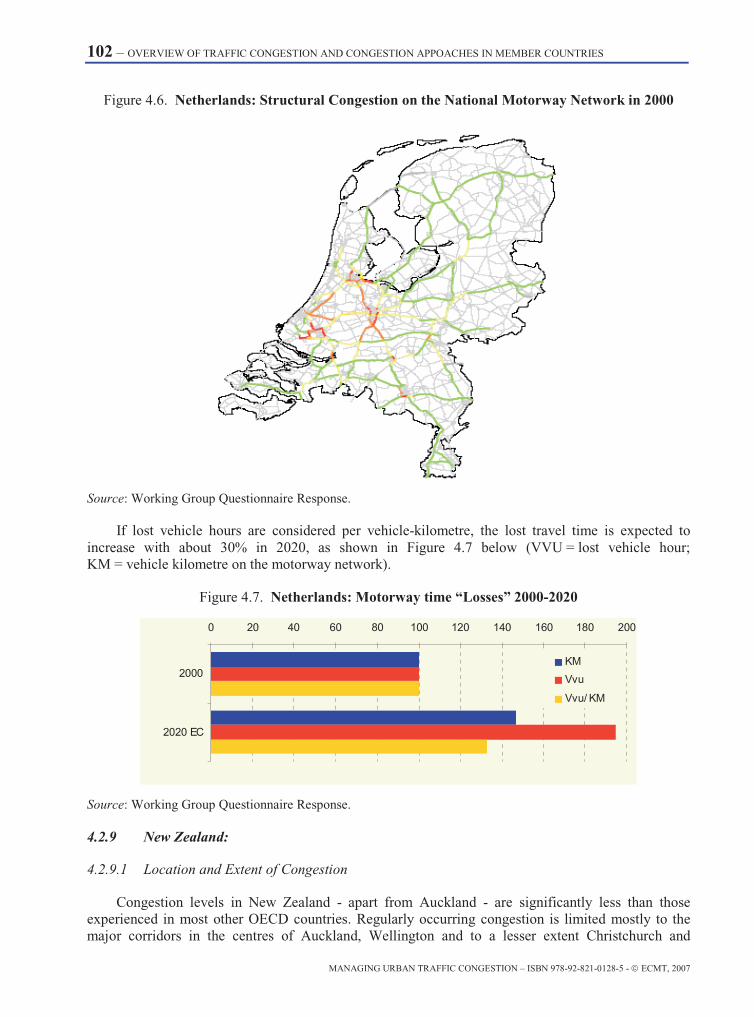
102 – OVERVIEW OF TRAFFIC CONGESTION AND CONGESTION APPOACHES IN MEMBER COUNTRIES
MANAGING URBAN TRAFFIC CONGESTION – ISBN 978-92-821-0128-5 - © ECMT, 2007
Figure 4.6. Netherlands: Structural Congestion on the National Motorway Network in 2000
Source: Working Group Questionnaire Response.
If lost vehicle hours are considered per vehicle-kilometre, the lost travel time is expected to increase with about 30% in 2020, as shown in Figure 4.7 below (VVU = lost vehicle hour; KM = vehicle kilometre on the motorway network).
Figure 4.7. Netherlands: Motorway time “Losses” 2000-2020
0 20 40 60 80 100 120 140 160 180 200
2000
2020 EC
KM
Vvu
Vvu/ KM
Source: Working Group Questionnaire Response.
4.2.9 New Zealand:
4.2.9.1 Location and Extent of Congestion
Congestion levels in New Zealand - apart from Auckland - are significantly less than those experienced in most other OECD countries. Regularly occurring congestion is limited mostly to the major corridors in the centres of Auckland, Wellington and to a lesser extent Christchurch and
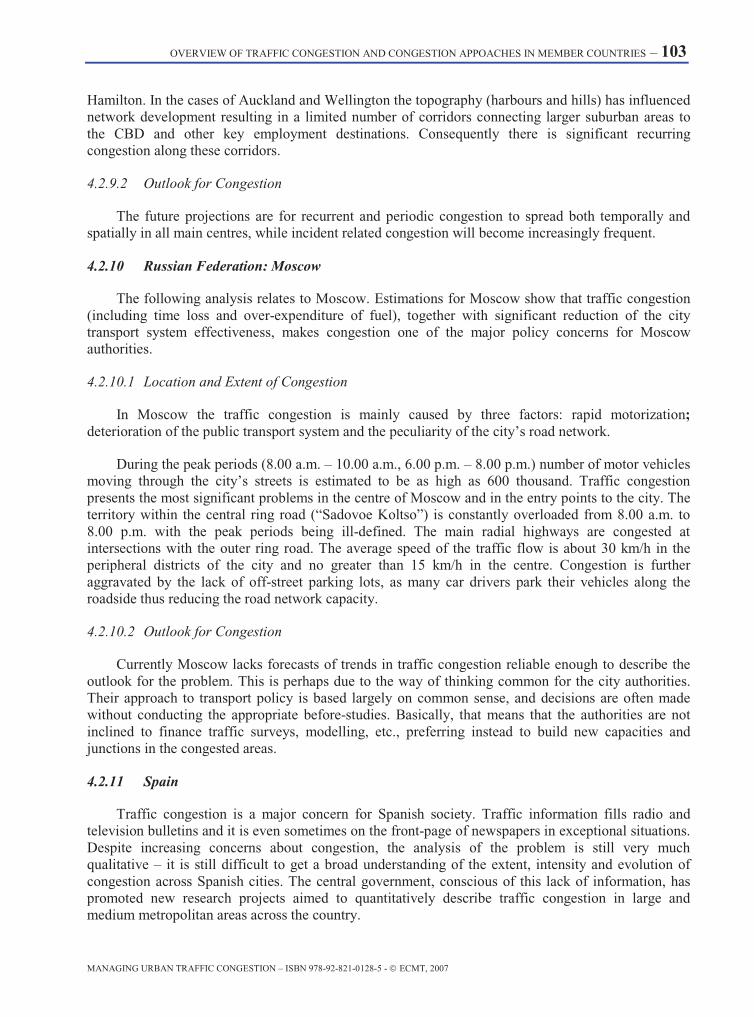
OVERVIEW OF TRAFFIC CONGESTION AND CONGESTION APPOACHES IN MEMBER COUNTRIES – 103
MANAGING URBAN TRAFFIC CONGESTION – ISBN 978-92-821-0128-5 - © ECMT, 2007
Hamilton. In the cases of Auckland and Wellington the topography (harbours and hills) has influenced network development resulting in a limited number of corridors connecting larger suburban areas to the CBD and other key employment destinations. Consequently there is significant recurring congestion along these corridors.
4.2.9.2 Outlook for Congestion
The future projections are for recurrent and periodic congestion to spread both temporally and spatially in all main centres, while incident related congestion will become increasingly frequent.
4.2.10 Russian Federation: Moscow
The following analysis relates to Moscow. Estimations for Moscow show that traffic congestion (including time loss and over-expenditure of fuel), together with significant reduction of the city transport system effectiveness, makes congestion one of the major policy concerns for Moscow authorities.
4.2.10.1 Location and Extent of Congestion
In Moscow the traffic congestion is mainly caused by three factors: rapid motorization; deterioration of the public transport system and the peculiarity of the city’s road network.
During the peak periods (8.00 a.m. – 10.00 a.m., 6.00 p.m. – 8.00 p.m.) number of motor vehicles moving through the city’s streets is estimated to be as high as 600 thousand. Traffic congestion presents the most significant problems in the centre of Moscow and in the entry points to the city. The territory within the central ring road (“Sadovoe Koltso”) is constantly overloaded from 8.00 a.m. to 8.00 p.m. with the peak periods being ill-defined. The main radial highways are congested at intersections with the outer ring road. The average speed of the traffic flow is about 30 km/h in the peripheral districts of the city and no greater than 15 km/h in the centre. Congestion is further aggravated by the lack of off-street parking lots, as many car drivers park their vehicles along the roadside thus reducing the road network capacity.
4.2.10.2 Outlook for Congestion
Currently Moscow lacks forecasts of trends in traffic congestion reliable enough to describe the outlook for the problem. This is perhaps due to the way of thinking common for the city authorities. Their approach to transport policy is based largely on common sense, and decisions are often made without conducting the appropriate before-studies. Basically, that means that the authorities are not inclined to finance traffic surveys, modelling, etc., preferring instead to build new capacities and junctions in the congested areas.
4.2.11 Spain
Traffic congestion is a major concern for Spanish society. Traffic information fills radio and television bulletins and it is even sometimes on the front-page of newspapers in exceptional situations. Despite increasing concerns about congestion, the analysis of the problem is still very much qualitative – it is still difficult to get a broad understanding of the extent, intensity and evolution of congestion across Spanish cities. The central government, conscious of this lack of information, has promoted new research projects aimed to quantitatively describe traffic congestion in large and medium metropolitan areas across the country.

104 – OVERVIEW OF TRAFFIC CONGESTION AND CONGESTION APPOACHES IN MEMBER COUNTRIES
MANAGING URBAN TRAFFIC CONGESTION – ISBN 978-92-821-0128-5 - © ECMT, 2007
Figure 4.8. Moscow Road Network
Source: Working Group Questionnaire Response.
4.2.11.1 Location and Extent of Congestion
The basic structure of the national road network is radial, with its centre in Madrid. From the capital start six main corridors, articulating most of the territory. Moreover, there are also four important peripheral corridors following the Mediterranean Sea coast, the Portuguese border, the Cantabric Sea coast and the Ebro river valley.
From the relation between the measured traffic flow and the capacity of the road link, the congested interurban road stretches can be determined on a national basis. From this analysis, performed in PEIT (Ministry of Public Works, 2005), it can be concluded that congested roadway links are located basically in the Mediterranean corridor, and in the access to the metropolitan areas of Madrid, Barcelona, Valencia, Bilbao, Sevilla and Malaga, in addition to the Granada – Motril link and Lleida’s access.
Most large and medium cities have urban congestion problems. These problems are especially intense in Madrid and Barcelona, where the congestion costs were estimated at 263 €/inhabitant-year in Barcelona and 486 €/inhabitant-year in Madrid (Robusté and Monzón, 1995). These estimations were made in 1995 with data from 1993; congestion costs in Barcelona were unusually low due to the new urban road supply after the Summer Olympics of 1992; there is evidence that these costs doubled in 1993-1998 period (see details in Robusté, 1998).
4.2.11.2 Outlook for Congestion
The Spanish population is continuously growing, mainly due to immigration. Economic studies have shown that mobility has increased at a greater rate than GDP in Spain, which itself is growing more rapidly than in many other EU countries. In addition, the largest urban areas such as Madrid,

OVERVIEW OF TRAFFIC CONGESTION AND CONGESTION APPOACHES IN MEMBER COUNTRIES – 105
MANAGING URBAN TRAFFIC CONGESTION – ISBN 978-92-821-0128-5 - © ECMT, 2007
Barcelona, Bilbao, Valencia, Sevilla, etc. are experiencing a shift in population from dense urban cores to more diffuse patterns of development on the peripheries. This trend is in part a result of high housing prices in central areas and causes an increase in average trip lengths for commuting as well as for other trip purposes (e.g. education).
Moreover, in the outer area of these cities, low density urban planning, with terraced houses typical of the northern countries of Europe, is becoming increasingly common. This contrasts with the compact cities that used to be typical of Mediterranean countries where a good public transportation system was easier to implement. Such urban planning not only will promote the use of private cars but also will make the implementation of efficient public transportation systems more difficult. This perception is supported by a continuous increase in the total number of cars, reaching an increase of 4.6% between 2003 and 2004.
An increase of the interurban mobility is expected in the next twenty years. Despite vigorous policies in favour of public transportation systems and territorial development policies preventing urban dispersion and low density settlements, it will be difficult for this mode to achieve annual increases of less than 2 or 2.5%.
The increase in traffic flows will lead to a rise in congestion of the roadway network which will be a great burden for the economic development of the country and be problematic from an environmental perspective as well. An evaluation of the transportation externalities and especially focused on congestion referred to the Catalonia region can be found at (DPTOP, 2003).
4.2.12 United Kingdom
4.2.12.1 Location and Extent of Congestion
Congestion is the outcome of the inter-relationship between demand and supply factors. Since these factors vary considerably across and within UK metropolitan areas, the characterisation of congestion also varies considerably.
On the demand side key considerations include:
• Level of economic activity – uniformly strong (few urban areas outside of the south east of England), mix of strong and weak (e.g. Greater Manchester), and weak (e.g. Merseyside).
• Degree to which the built-up area is multi-centred (e.g. Greater Manchester) or has a dominant central business district (e.g. the Leeds conurbation); and, an inter-related issue.
• Degree of isolation from other regional centres of economic activity.
On the supply side, significant sources of variation arise from:
• The configuration of the road network – level of capacity, balance of radial and orbital provision, extent of motorway network.
• The existence or otherwise of a high quality, high capacity public transport network.
The outcome of these demand and supply relationships for metropolitan areas in the UK is therefore highly diverse. Across and within conurbations, congestion may be severe, mild but rising, or a relatively insignificant issue.

106 – OVERVIEW OF TRAFFIC CONGESTION AND CONGESTION APPOACHES IN MEMBER COUNTRIES
MANAGING URBAN TRAFFIC CONGESTION – ISBN 978-92-821-0128-5 - © ECMT, 2007
4.2.12.2 Outlook for Congestion
Congestion forecasts derived using the Department's National Transport Model methods are given in Table 1 below. The table shows in the first rows the forecast growth in road traffic in the 'base case' without the Department's Ten Year Plan and the forecast in the 'with Plan' scenario.
The Ten Year Plan is made up of a combination of measures, including investment in trunk and local road capacity and in rail services, improved buses services and local transport improvements and land use planning aimed at reducing the need to travel. The second part of the table shows the changes in congestion, when compared with the 2000 base, resulting from traffic growth and policy unchanged scenario in the base case without the Plan, and the impact of the Plan on congestion.
The Plan has a greater impact on congestion than on traffic because the measures it contains are targeted on the places where congestion is worst.
Progress Report Forecasts of Traffic Growth and Congestion (England)
All Roads
% change 2010 on 2000 All areas London
Conurbations and Large
Urban
OtherUrban Other
Inter-urban Trunk Roads
Report without Plan 23 to 26 19 to 22 20 to 23 19 to 22 26 to 30 30 to 35 Traffic Report with Plan 20 to 25 11 to 18 15 to 21 16 to 20 24 to 29 9 to 34
Report without Plan 27 to 32 26 to 30 26 to 30 29 to 33 44 to 52 52 to 67 Congestion Report with Plan 11 to 20 10 to 20 11 to 21 20 to 26 21 to 30 1 to 15
Source: Working Group Questionnaire Response.
4.2.13 United States
4.2.13.1 Location and Extent of Congestion
Over the past several decades, the United States has seen explosive growth in personal travel. According to 2000 U.S. Census, approximately 89.7% of the United States population has access to a private vehicle. (1) As a result of heavy reliance on personal vehicles as means of transportation and correspondingly increased levels of traffic and congestion on major roadways, the amount of time individuals spend in cars has increased dramatically and continues to rise.
The costs of the dramatic increase in congestion are significant in terms of both time and resources. The Texas Transportation Institute has been monitoring levels of traffic congestion in 75 cities throughout the United States since 1982. In order to quantify the effect congestion has on individuals, the Texas Transportation Institute has developed two primary measures to help provide estimates for mobility levels and extra travel time for drivers and their passengers. These measures are:
• The Travel Time Index (TTI), which measures the amount of extra time expended travelling during a peak travel period versus during off-peak hours.
• Travel delay per person.

OVERVIEW OF TRAFFIC CONGESTION AND CONGESTION APPOACHES IN MEMBER COUNTRIES – 107
MANAGING URBAN TRAFFIC CONGESTION – ISBN 978-92-821-0128-5 - © ECMT, 2007
The Texas Transportation Institute estimates the average TTI for all 75 urban areas it examined to be around 1.39, meaning that a trip that takes one hour (60 minutes) during off-peak hours would take nearly an hour and a half (83.4 minutes) during peak travel times. In a large urban area the average TTI is 1.52.
4.2.13.2 Outlook for Congestion
In the United States, the transportation network has not increased at a rate commensurate with growth in travel and commerce. In the highway sector, vehicle-miles travelled (VMT) increased by 80% while lane-miles of public roads increased by only 2% between 1980 and 2000. Growth in truck-miles travelled was even more dramatic, exceeding the growth in passenger VMT over the last few years. Clearly, more traffic is moving over essentially the same highway infrastructure. In this context, travel times have been steadily increasing. Over the past twenty years congestion has become increasingly worse; there has been a major shift in urban areas from the majority of travel conditions being uncongested (58%) to a majority being congested (76%). This is not an issue unique to large cities such as New York and Los Angeles. Figure 4.9 shows travel time indices for different U.S. urban areas as they have evolved from 1982 to 2001.
Figure 4.9. Travel Time Index Trends for U.S. Cities of Different Sizes
0 0.5 1 1.5 2
75 Areas average
Very Large Areaaverage
Large Areaaverage
Medium Areaaverage
Small Areaaverage
Travel Time Index
2001
2000
1996
1992
1986
1982
Source: Schrank, D. and Lomax, T. (2003), Texas Transportation Institute 2002 Urban Mobility Report.
Forecasts of future traffic on the National Highway System demonstrate the impact of this growth upon traffic congestion, assuming that the existing highway system is not improved by 2020. Specifically, by comparing the figures below side-by-side, it is apparent that the congestion-causing potential for trucks is great. Without trucks, most congestion would reside within major metropolitan areas (as shown in the figure 4.10). When trucks are added to the highway system, congestion spreads into what are now essentially rural corridors (as shown in the Figure 4.11).
Analysis of major urban bottlenecks with regard to trucks is also revealing (as shown in figure 4.12). This analysis used the bottleneck locations identified in the recent American Highway Users Alliance study along with the same truck forecasts used in [the figures above] at these locations. When trucks are removed from these bottlenecks, delay is substantially reduced, but is still present at
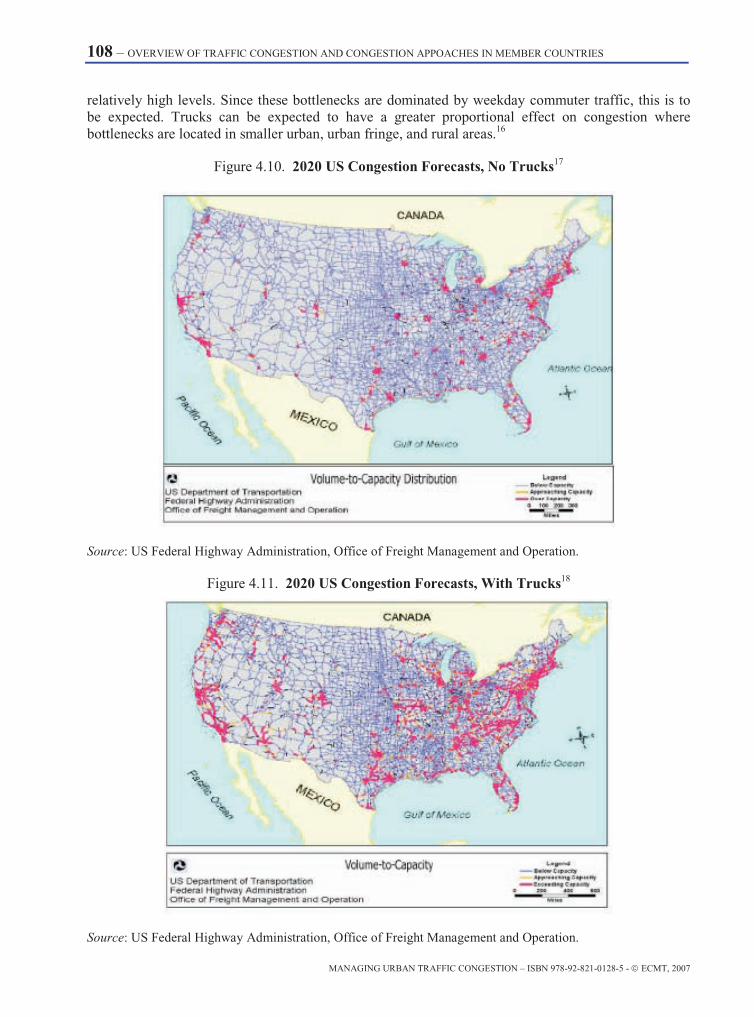
108 – OVERVIEW OF TRAFFIC CONGESTION AND CONGESTION APPOACHES IN MEMBER COUNTRIES
MANAGING URBAN TRAFFIC CONGESTION – ISBN 978-92-821-0128-5 - © ECMT, 2007
relatively high levels. Since these bottlenecks are dominated by weekday commuter traffic, this is to be expected. Trucks can be expected to have a greater proportional effect on congestion where bottlenecks are located in smaller urban, urban fringe, and rural areas.16
Figure 4.10. 2020 US Congestion Forecasts, No Trucks17
Source: US Federal Highway Administration, Office of Freight Management and Operation.
Figure 4.11. 2020 US Congestion Forecasts, With Trucks18
Source: US Federal Highway Administration, Office of Freight Management and Operation.

OVERVIEW OF TRAFFIC CONGESTION AND CONGESTION APPOACHES IN MEMBER COUNTRIES – 109
MANAGING URBAN TRAFFIC CONGESTION – ISBN 978-92-821-0128-5 - © ECMT, 2007
Figure 4.12. Effect of Trucks on Delay at the 50 Worst US Urban Bottlenecks
Source: FHWA (2005b), Traffic Congestion and Reliability Final Report: Trends and Advanced Strategies for Congestion Mitigation.
4.3 Review of Congestion Management Frameworks
4.3.1 Australia
In Australia, State and Territory Governments are primarily responsible for developing and implementing measures to tackle congestion. However, over time the Australian Government has become increasingly interested in congestion alleviation issues through its commitment to the efficient operation of the AusLink National Network, parts of which pass through urban areas.
Governments have recognised that increasing transport system capacity through road building programs alone cannot solve traffic congestion. Across Australia, State Governments are proposing a range of complementary transport policy and planning approaches to address congestion. These include better management of the existing road system, improving the performance of the public transport system, initiatives to manage the competition for road space between freight and passenger traffic, and actively promoting public transport, walking and cycling. Each State has a strategic plan that addresses transport within a broader metropolitan planning context.
Sydney, Melbourne, Brisbane and Perth all have either existing metropolitan transport plans or plans under development. Key features in common to these plans include strategies to alleviate congestion. These plans take a multi-pronged approach to city transport planning, incorporating better management of existing road and rail capacity, targeted infrastructure expansion, investments in improved public transport systems, measures to change passenger and freight travel behaviour, better integration of transport and land-use planning, parking fees, improved information to travellers on travel conditions, and the use of intelligent traffic management systems to improve traffic flow.
One of the features of Melbourne’s and Perth’s 2030 urban strategic plans is the focus of development in and around activity centres – which are connected by means of the Principal Public Transport Network and fed by local public transport services. This strategy aims to manage congestion

110 – OVERVIEW OF TRAFFIC CONGESTION AND CONGESTION APPOACHES IN MEMBER COUNTRIES
MANAGING URBAN TRAFFIC CONGESTION – ISBN 978-92-821-0128-5 - © ECMT, 2007
by making jobs, community services and other activities more accessible, particularly by walking, cycling and public transport.
The Melbourne Metropolitan Transport Plan, which complements the Melbourne 2030 city plan, outlines the Victorian Government’s key strategies for managing road congestion in Melbourne. A key initiative outlined in this plan is the aim to achieve a public transport mode-share target of 20%, by 2020. Strategies to achieve this objective include measures to reduce delays to trams and buses to improve their reliability. Strategies to reduce car use also include the creation of ‘high occupancy lanes’ (such as exists on the Eastern Freeway), that can be used only by vehicles with more than one occupant in peak hour, provides an incentive for pooling in the form of faster commuting times.
Sydney has a similar strategic plan - City of Cities – A Plan for Sydney’s Future was released in December 2005. The Metropolitan Strategy, a plan to guide Sydney’s growth and development over 25 years, is made up of seven inter-related strategies including a Transports Strategy which recognises that people need access to activities in different locations and at different scales – within their local neighbourhood, in centres and corridors within their region, and to activities an places across the metropolitan area. The Transport Strategy has a series of actions to manage congestion including extending rail and bus networks, improving the existing transport system, influencing travel choices and improving efficiency of freight movements in Sydney.
4.3.2 Canada
Provincial and municipal governments undertake a great variety of conventional programs of transport network and operations management that have congestion management and mitigation as part of their objectives, and a number of specific and recent programs to encourage alternatives to private vehicle use and ease the flow of remaining traffic, in order to approach goals for sustainability and reductions of greenhouse gases.
The Federal Government’s major effort is support for infrastructure investments, managed by Infrastructure Canada. The primary program is the Canada Strategic Investment Fund, allocated $4 bn since 2001 for investments in municipal infrastructure of all kinds, of which to date urban transit projects have been the target of about 40% and highway projects another 20% of total spending. Transport Canada has a Sustainable Transportation Strategy, and is responsible for transport components of the National Climate Change Strategy. Two specific programs are aimed at sustainable transportation and greenhouse gas reductions, in which congestion reduction is a major objective:
4.3.3 Czech Republic
The Ministry of Transport of the Czech Republic and local authorities have launched various studies and plans aimed to tackle traffic congestion. These projects are based on promotion of alternatives to private vehicles, parking management and telematics.
The policy document on municipal traffic development, "The principles of traffic policy in the Capital of Prague", contains political guidelines for the planning, management and operation of traffic in accordance with other urban functions and the environment. Its principal focus is on urban development issues, public transportation priority and improving the quality of the Prague Integrated Transport system. The municipal public transport authority is to extend underground tram and railroad lines creating new links in the intermodal public transport network. The road traffic system policy is articulated in the land use plan for the City of Prague and emphasises the completion of a ring road outside of the densely populated urban area in the next few years to relieve the core of the urban region.

OVERVIEW OF TRAFFIC CONGESTION AND CONGESTION APPOACHES IN MEMBER COUNTRIES – 111
MANAGING URBAN TRAFFIC CONGESTION – ISBN 978-92-821-0128-5 - © ECMT, 2007
4.3.4 France
A major step towards a unified national framework for the economic valuation of roadway congestion on the national routes will be achieved in France in 2006 with the production of annual congestion indicators19 in order to ground the government expense on roads, as imposed by the recent Orientation Law for Finance Laws. Legislation in France establishes a right for people and goods to move freely on, and have access to, transport networks; the Orientation Law for Internal Transportation (1982) even establishes a right for travellers to choose amongst transport modes – which implies that multimodal access to networks should be provided.
Current infrastructure development plans are developed under the framework of “structural networks” as elaborated by an inter-ministerial group for land development and regional competition. Specific infrastructure projects emerging from this framework are implemented jointly between the national government and regional or municipal governments under the aegis of specific infrastructure development contracts.
At the urban level, different levels of governments have different responsibilities: The National government is responsible for non-concessionary motorways (principally those of the Paris region) and roads of national importance. Regional governments are responsible for regional passenger rail transport, the Départements are responsible for inter-city bus services and the “départementale” road network and municipalities or urban regional governments for the larger communities are responsible for local roads. In some instances, the latter are also responsible for overseeing local public transport operators within an explicitly defined urban public transport zone.
The principal policy issues related to congestion in France are:
• The accessibility of activities throughout the country, with an acceptable point-to-point quality of service for the transport of passengers and goods. It is believed that this accessibility is a key factor of economic efficiency and growth, as well as for social relationships.
• The reliability of public transport, both at the national and the regional level. The contracts between local agencies and transport operators do integrate some financial mechanisms to favour the reliability of train and bus services.
• Environmental impacts: energy consumption, noise and pollutant emitted by traffic flows.
• An emerging issue is that of economic efficiency, as mentioned in the introduction. At the national level, a new framework for statement and evaluation of policies has been implemented in 2006 and this may increase the focus on congestion on the national road network (as of now, around 20 000 km of motorways).
4.3.5 Germany
The Federal Government is responsible for the federal highway network and its improvement through extension, equipment (traffic control, information) and maintenance. On the local level, cities and metropolitan areas develop specific plans, organisations and control facilities to manage and operate traffic flows, increasingly with multimodal traffic control centres and the introduction of mobility management.

112 – OVERVIEW OF TRAFFIC CONGESTION AND CONGESTION APPOACHES IN MEMBER COUNTRIES
MANAGING URBAN TRAFFIC CONGESTION – ISBN 978-92-821-0128-5 - © ECMT, 2007
Transport and land use planning levels in Germany are divided between the federal, state, and local and regional levels. At each level, integrated transport plans are developed and used as basis for design and implementation of policies. These plans must include or consider all transport modes, the plans of higher and lower levels, the plans of neighbouring administrative units, the plans and goals of other sectors (economic development, environment, culture, land-use etc.) as well as the interests of different stakeholders, residents etc.
During these planning processes, the impacts of road traffic congestion are regularly reviewed from a number of different perspectives (e. g. the user of transport facilities, the general public, the operator etc). At the federal level, standardised evaluation methods are used for cost-benefit analysis considering the following aspects:
• Transport costs. • Costs to maintain infrastructure. • Traffic safety. • Accessibility. • Spatial effects. • Environmental effects. • Improvement of accessibility of airports and harbours. • Consideration of induced traffic. • Inter- and intra-modal interdependencies.
Similar analyses are used on the other planning levels. Cities that try to obtain federal funds for public transportation must also conform to the standardised cost benefit evaluation. Despite standardised evaluation processes, the selection and implementation of transport policies are generally guided by political goals and objectives. These may change according to the prevailing party or coalition
4.3.6 Japan
Until now, Japan has worked to promote a national road network that includes major urban areas based on the Comprehensive National Development Plans (Nos. 1 to 5)—which were themselves based on the Comprehensive National Development Law, a national upper level policy plan—as well as the Five-year Road Improvement Programs (Nos. 1 to 12) and the Key Plan for Infrastructure Development (2003-2007). Meanwhile, concerned personnel in the central and local governments formulated and promoted the Third Action Program on Alleviating Traffic Congestion (1998-2002), which included transport expansion strategies (construction of bypasses, improvement of intersections, etc) as well as multi-modal measures, with focus on major congestion points.
In the context of the Kyoto Protocol, the government has outlined an “action programme” that also addresses congestion insofar as the latter contributes to increased CO2 emissions. The congestion-related component of the action programme calls for completing the radial road network in Tokyo and other major urban areas, balancing the volume of traffic between ordinary roads and motorways, removing major bottlenecks, implementing road pricing, providing traffic information through ITS, and elimination of congestion caused by illegal parking. It is hoped that the combined effect of these measures will be the reduction of CO2 emissions by 8 m tons per year by 2010 due to increased traffic speeds and smoother traffic flows.
A new Comprehensive Program of Logistics Policies (2005 to 2009) was established in order to reinforce international distribution and to realize comprehensive distribution that is both efficient and speedy.
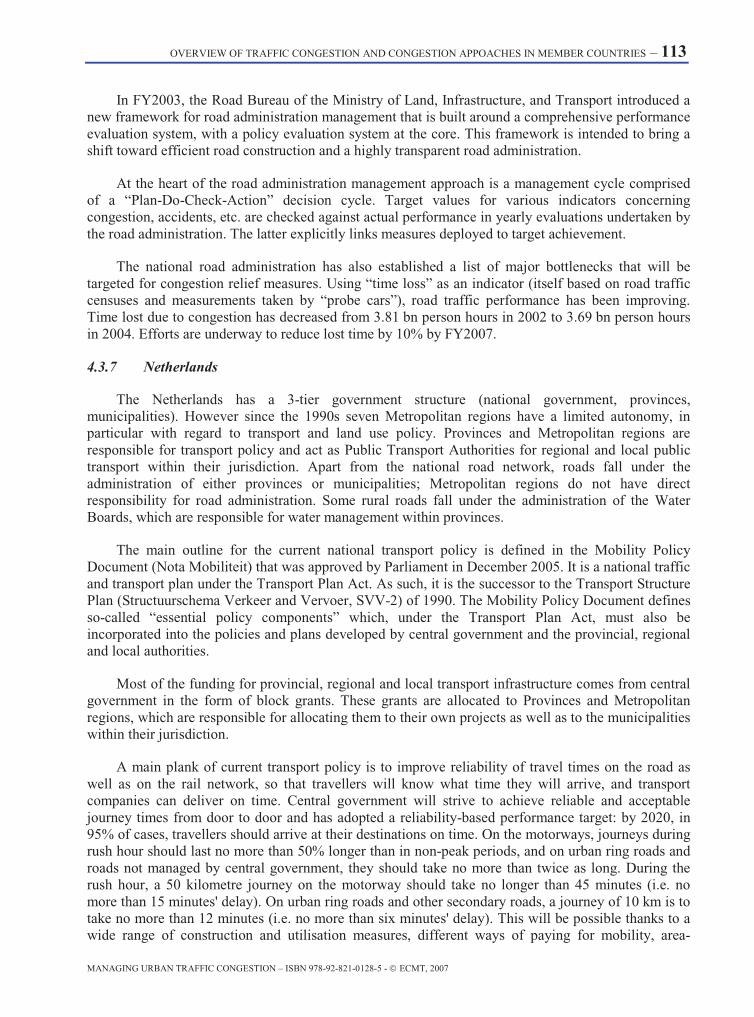
OVERVIEW OF TRAFFIC CONGESTION AND CONGESTION APPOACHES IN MEMBER COUNTRIES – 113
MANAGING URBAN TRAFFIC CONGESTION – ISBN 978-92-821-0128-5 - © ECMT, 2007
In FY2003, the Road Bureau of the Ministry of Land, Infrastructure, and Transport introduced a new framework for road administration management that is built around a comprehensive performance evaluation system, with a policy evaluation system at the core. This framework is intended to bring a shift toward efficient road construction and a highly transparent road administration.
At the heart of the road administration management approach is a management cycle comprised of a “Plan-Do-Check-Action” decision cycle. Target values for various indicators concerning congestion, accidents, etc. are checked against actual performance in yearly evaluations undertaken by the road administration. The latter explicitly links measures deployed to target achievement.
The national road administration has also established a list of major bottlenecks that will be targeted for congestion relief measures. Using “time loss” as an indicator (itself based on road traffic censuses and measurements taken by “probe cars”), road traffic performance has been improving. Time lost due to congestion has decreased from 3.81 bn person hours in 2002 to 3.69 bn person hours in 2004. Efforts are underway to reduce lost time by 10% by FY2007.
4.3.7 Netherlands
The Netherlands has a 3-tier government structure (national government, provinces, municipalities). However since the 1990s seven Metropolitan regions have a limited autonomy, in particular with regard to transport and land use policy. Provinces and Metropolitan regions are responsible for transport policy and act as Public Transport Authorities for regional and local public transport within their jurisdiction. Apart from the national road network, roads fall under the administration of either provinces or municipalities; Metropolitan regions do not have direct responsibility for road administration. Some rural roads fall under the administration of the Water Boards, which are responsible for water management within provinces.
The main outline for the current national transport policy is defined in the Mobility Policy Document (Nota Mobiliteit) that was approved by Parliament in December 2005. It is a national traffic and transport plan under the Transport Plan Act. As such, it is the successor to the Transport Structure Plan (Structuurschema Verkeer and Vervoer, SVV-2) of 1990. The Mobility Policy Document defines so-called “essential policy components” which, under the Transport Plan Act, must also be incorporated into the policies and plans developed by central government and the provincial, regional and local authorities.
Most of the funding for provincial, regional and local transport infrastructure comes from central government in the form of block grants. These grants are allocated to Provinces and Metropolitan regions, which are responsible for allocating them to their own projects as well as to the municipalities within their jurisdiction.
A main plank of current transport policy is to improve reliability of travel times on the road as well as on the rail network, so that travellers will know what time they will arrive, and transport companies can deliver on time. Central government will strive to achieve reliable and acceptable journey times from door to door and has adopted a reliability-based performance target: by 2020, in 95% of cases, travellers should arrive at their destinations on time. On the motorways, journeys during rush hour should last no more than 50% longer than in non-peak periods, and on urban ring roads and roads not managed by central government, they should take no more than twice as long. During the rush hour, a 50 kilometre journey on the motorway should take no longer than 45 minutes (i.e. no more than 15 minutes' delay). On urban ring roads and other secondary roads, a journey of 10 km is to take no more than 12 minutes (i.e. no more than six minutes' delay). This will be possible thanks to a wide range of construction and utilisation measures, different ways of paying for mobility, area-
114 – OVERVIEW OF TRAFFIC CONGESTION AND CONGESTION APPOACHES IN MEMBER COUNTRIES
MANAGING URBAN TRAFFIC CONGESTION – ISBN 978-92-821-0128-5 - © ECMT, 2007
specific cooperation and maintenance work. Priority will go to the main arteries, in particular the A2, A4 and A12 corridors. Incident management, traffic management and route and travel information will be improved.
Central government, the local and regional authorities, and the transport operators are responsible for providing realistic, attractive public transport, in particular to, from and within urban networks, and for offering tailor-made solutions where demand is limited, and where people may otherwise be unable to participate in society. Passengers must be able to transfer smoothly and easily from one mode to another, and from public transport to a private vehicle or bicycle. In the urban networks, public transport can also contribute significantly to quality of life.
4.3.8 Russian Federation
There is no well-defined role for national authorities vis-à-vis urban traffic congestion. On the national level, there is no methodological or legislative base for the deployment of congestion management strategies at the urban level. Neither is there a specific policy aiming to facilitate the uptake of congestion management strategies by municipalities – the administrations of the major cities alone must face the task of managing traffic levels within their urban areas. In the case of Moscow, as in the case of several other cities, the main thrust of congestion management policies has been to complete ring-roads around the core of the city or otherwise provide new capacity. However, considerable congestion alleviation has been delivered through the coordination of traffic light signals as well.
4.3.9 Spain
In Spain, responsibilities for congestion management are split between different agencies and levels of government. On one the one hand, the Spanish Ministry of Public Works (Ministerio de Fomento) has responsibility for the construction of new infrastructure and management of the main transportation network. On the other hand, the Home Office Ministry (Ministerio del Interior) has responsibility for traffic management. Moreover, some of the autonomous communities in Spain (regions) have their own traffic and public works departments, with local responsibilities.
The Public Works Ministry actions focus on the development of transportation planning and the funding of new transportation infrastructures, while the Traffic Department of the Home Office Ministry (Dirección General de Tráfico) focuses on traffic demand management. With this objective traffic control centres have been implemented in the whole country and specific plans for the most problematic periods (holiday return operations, winter plans, etc.) are prepared and implemented.
More recently, the Spanish Ministry of Work (Ministerio de Trabajo y Asuntos Sociales), appeared to be the key actor in congestion mitigation, because the inflexibility in working hours causes half of the congestion in Spain. This situation prompted the Ministry to soften the working hours of Government employees. This policy also affects very positively to the conciliation of working and family life.
Finally, the Spanish Ministry of Environment (Ministerio de Medio Ambiente) is currently evaluating the feasibility of charging traffic to enter and circulate in the large cities.
The Spanish Government has just launched a Strategic Plan for Infrastructures and Transportation, PEIT (Ministry of Public Works, 2005). PEIT states the medium term guidelines for the Spanish Government policies in infrastructures and transportation. Among the main congestion-related objectives of the PEIT are the improvement of transport system efficiency, the promotion of an

OVERVIEW OF TRAFFIC CONGESTION AND CONGESTION APPOACHES IN MEMBER COUNTRIES – 115
MANAGING URBAN TRAFFIC CONGESTION – ISBN 978-92-821-0128-5 - © ECMT, 2007
integrated transportation system contributing to modal shift and the optimization of the use of existing infrastructure by means of transportation demand management. This top-level strategic plan will serve to frame lower-level regional and municipal plans and will serve to guide national funding for infrastructure and transport system investment.
4.3.10 United Kingdom
Very broadly, the transport policy in relation to congestion management in the UK runs as follows. Congestion is indeed a problem, but it is clear that building new roads will not ‘solve’ the problem – this policy would entail high financial, and environmental costs, leads to traffic generation, and has important implications for land use and urban centres. New roads are built or new capacity is provided on existing roads only where the costs (including environmental costs) are not too high relative to the benefits. In many cases, the congestion response strategy will include a mix of actions – e.g. seeking to improve traffic management and use of the existing network, deliver more reliable roads, better coordinating road policies with other modes and land use planning, etc.
In England the responsibility for tackling congestion in a given metropolitan area lies with a mix of institutions. Each area contains a number of highway authorities, one for each local authority area. Cutting across these clear geographic areas, the Highways Agency has responsibility for all trunk roads in England – motorways and other high volume roads. In Greater Manchester, for instance, as well as the Highways Agency there are 10 highway authorities.
All major transport schemes (those costing in excess of 7 m Euros) are subject to detailed modelling and economic (cost benefit) appraisal. The implications of schemes for travel times and hence their potential to reduce congestion forms a significant part of the benefits of any measure. In general, schemes or policies that do not offer good value for money will not be approved. There has been less analysis of whether measures that have been implemented have delivered the anticipated changes in congestion.
The current national policy relating to congestion management efforts has been largely influenced by a series of reports and initiatives – including the highly successful congestion charging scheme in London – seeking to explore the appropriateness and effectiveness of congestion charging. Better management of the trunk road network is increasingly seen as supplementing or as an alternative to new capacity. Measures include improved junction design, ramp metering, hard shoulder running during peak hours, and reducing the maximum speed limit from 70 mph to 50 mph. Better management is also seen as a means of reducing the variability of journey times. Delays and congestion caused by roads works can also be reduced by effective measures. New capacity is rarely an option in urban areas. Construction costs are many times higher than for rural roads and the environmental and other costs of new construction are often seen as unacceptably high. Policies towards urban roads are mainly concerned with removing through traffic from residential areas and core shopping streets and ensuring that traffic signals and junction design (prohibition of turning movements across the flow of traffic etc) maximise the throughput. Banning parking and loading on key routes can help to increase capacity when these measures are enforced effectively.
The UK Department for Transport commissioned a study of the feasibility of road pricing, completed in July 2004. The study acknowledged that there was a strong economic case for implementing a method of road pricing which was linked to levels of congestion throughout the UK. However, it was clear that it would not be possible to implement comprehensive road user charging which would allow charges to vary by place and time of day for all vehicles on all roads throughout the UK within the next decade. The report noted that while congestion was widespread at busy times throughout the UK, the problem was greatest in urban areas, where solutions such as linking pricing
116 – OVERVIEW OF TRAFFIC CONGESTION AND CONGESTION APPOACHES IN MEMBER COUNTRIES
MANAGING URBAN TRAFFIC CONGESTION – ISBN 978-92-821-0128-5 - © ECMT, 2007
with improved public transport alternatives provided a viable strategy for the effective management of congestion. The Study identified a need for further work on identifying the appropriate technology and on providing a better understanding of how road pricing might be implemented. It proposed the introduction of a number of pilot schemes in order to provide a better knowledge of the technology and of users’ responses.
4.3.11 United States
Congestion is viewed as a major transport policy concern in the United States. In May of 1996, the Federal Department of Transport launched the “National Strategy to Reduce Congestion on America’s Transportation Network” in response to a growing public and business perception of greatly degraded travel conditions both on the road network as well as at ports, border crossings and airports. Motivation for the new programme stems from calculations of growing congestion costs (as measured by the difference between actual travel conditions and free-flow speeds, for the road network) and the repercussions these have on inventory holding and business competitiveness. The strategy outlines 4 major focus areas that relate to urban congestion:
• Relieving urban congestion.
• Unleashing private sector investment resources for infrastructure.
• Promoting operational and technological improvements.
• Targeting major freight bottlenecks.
Successive Federal legislation has established the policy framework for surface transportation. The Intermodal Surface Transportation Efficiency Act (1991) was followed by the Transportation Equity Act for the 21st Century (TEA-21). The new surface transportation legislation (SAFETEA-LU) was passed in 2005.
The main role of the Federal Government is the conditional distribution of the revenues raised by way of federal fuel taxes. The Federal legislation helps State and local governments to develop the right combination of congestion solutions required for their particular circumstances. Funding flexibility enables State and local decision-makers to work to maximize the productivity of their multi-modal transportation systems with congestion mitigation strategies that improve the performance of the transportation system and manage travel demand.
While the U.S. DOT strongly believes that land use decisions are State and local decisions and should remain that way there is much to be gained from more coordination among State and local planning, zoning, and housing authorities, and environmental and transportation officials, in reaching those decisions. In the United States, the principal tool to coordinate transportation policies is the transportation planning process and the principal lever is the conditional disbursement of Federal gas tax revenue.
SAFETEA-LU continues the transportation planning process established by ISTEA and TEA-21 – which require that only projects formally adopted as part of a long-range plans are eligible for federal gas-tax funding from the Department of Transportation. The planning process to be developed in all urban areas, includes a number of major elements: Long Range Plan & Transportation Improvement Program; financial planning and fiscal constraint; public involvement; conformity with air quality standards and the development and implementation of Congestion Management Systems. The latter provides for effective management of new and existing transportation facilities through use of travel demand reduction and operational management strategies.
OVERVIEW OF TRAFFIC CONGESTION AND CONGESTION APPOACHES IN MEMBER COUNTRIES – 117
MANAGING URBAN TRAFFIC CONGESTION – ISBN 978-92-821-0128-5 - © ECMT, 2007
Policy Considerations
Congestion: Extent, Location and Outlook
Comparing congestion patterns across countries and regions is not an easy task since the indicators used and the assumptions used in calculating impacts are often different from country to country and even from city to city within the same country. However, in many instances, congestion is growing. Some national reports clearly indicate a growth in congestion as measured by a degradation of average travel speeds during peak hours – as in many areas of the United States. However, in some other areas average speeds have remained constant or even increased (as in France). In Japan also, for example, time “losses” due to congestion have decreased between 2002 and 2004, although it is not clear if this improvement is due to the direct intervention of road authorities or if it is linked to wider economic trends.
What is clear is that in many cases, urban congestion has spread in the sense that the period of time that roads are congested during the day has lengthened – “peak-spreading” is a common phenomenon in many cities. As cities have grown, so too has the spatial imprint of congestion – congestion is found both at the centre and at the periphery of many large urban areas. Likewise, many, but certainly not all, urban areas seem to be experienced degraded travel conditions in that the predictability and reliability of travel times have decreased.
In many cases, congestion has increased as cities have grown and as economic activity has expanded. Cities have attracted more people and activities, they have produced more wealth and, as a by-product, their roads have become more crowded. Congestion may have grown in absolute terms in many areas but in some cases, it may not necessarily have grown as quickly as in the past (or in comparison to other cities) in relative terms as measured by unit of economic output or per capita. This may explain why some countries view urban congestion and its growth as issues of critical national importance while others see urban congestion as a “problem” that is to some degree self-regulating – especially in cases where travel alternatives are available ( e.g. public transport) and system performance is reliable.
In one respect, the relative rise in congestion can also be seen as an outcome related to the “lumpy” nature of infrastructure provision. New road capacity can only be provided in large increments leading to a situation where new infrastructure is oftentimes underused in the short-term, well-used in the medium term and over-used in the longer term. The level of road performance experienced by users as new infrastructure was provided in the 1950s through the 1980s is not likely to be found again as these roads are now oftentimes saturated with traffic and possibilities for further large-scale expansion are seriously constrained the scarcity of available urban land and its costs. In some areas where there remain opportunities to expand or otherwise complete insufficient regional road infrastructure, as in the case of the greater Tokyo region or in Moscow, one can expect that a similar pattern of congestion relief, followed by traffic growth and saturation will occur absent any pro-active traffic management policy.
Congestion Management Frameworks
Clearly, different countries, and different levels of governments and/or authorities within countries have different approaches to managing urban traffic. There is a real diversity of views regarding urban congestion across government levels and countries. Some view congestion as a major policy concern (e.g. the UK and the United States) while others view it as less important (e.g. the national governments of France and the Russian Federation).
As outlined in the country overviews, in some countries, congestion analysis is undertaken within nationally consistent frameworks. However, in most countries, the frameworks used are established within the various regional, State/provincial and/or metropolitan and local government

118 – OVERVIEW OF TRAFFIC CONGESTION AND CONGESTION APPOACHES IN MEMBER COUNTRIES
MANAGING URBAN TRAFFIC CONGESTION – ISBN 978-92-821-0128-5 - © ECMT, 2007
administrations concerned. There is therefore a great variety of frameworks and approaches in use and, in fact, it is rare to find a uniform conceptual framework across countries or regions for addressing congestion and appraising congestion management policies, strategies and measures.
Despite a lack of uniform frameworks, what is apparent from the diversity of national experiences collected by the Working Group is that many countries and, indeed, many urban regions either explicitly or implicitly reference flow-based parameters when discussing their congestion policy goals (e.g. see Greece-Athens, Japan, the Netherlands, the UK and USA). This may be an area for improvement if these approaches reference flow targets (LOS A-B, maximising throughput, etc) that inherently increase the probability of excessive congestion and sudden breakdowns. Interestingly, very few jurisdictions operate on the basis of defining economically “optimal” levels of congestion and developing policy targets on the basis of reaching this level. Also, only two countries, the Netherlands and the UK, have explicitly defined and created a framework for tracking the reliability of travel times at a national level – this too seems to be an area where progress could be made.
Urban congestion response strategies are primarily the responsibility of municipal governments and/or regional governments when these cover larger urban areas. National governments are rarely actively implicated in the development and deployment of congestion management measures … but the indirect links between National, regional and local governments are numerous.
• National transport administrations usually have a broad transport and modal policy focus but in many cases do not have any overall responsibility or direct involvement in dealing with traffic congestion in urban areas, even large ones. Where national transport administrations are involved, it is quite often though their national road authorities which are likely to be responsible for large infrastructure developments – such as new sections of motorways or national roads. However, national transport administrations are far less likely to involved in metropolitan public transport policy, planning or funding.
• State/provincial/ regional governments generally have a more central role. In many countries, provincial and local authorities are fully responsible for congestion planning and decision-making. State/provincial/ regional governments also generally have policy and funding responsibility for metropolitan public transport authorities as well as funding responsibility for major roads (other than national roads).
• Local governments often have full responsibility for local roads but not for public transport.
• In some countries, Metropolitan Planning Organisations, or their equivalent, have been established to coordinate overall planning and land use and some also have transport planning and operation responsibilities as well. Broadly-based MPOs may come within the responsibilities of State/provincial/regional bodies or alternatively be overseen by a local government or coalition of local governments.
With so many different organisations potentially involved (e.g. over 11 highway agencies in the Greater Manchester area), it is no surprise that many would analyse congestion and its impacts quite differently.
Such a diversity of organisations involved leads to a great diversity in the approaches to congestion and the conceptual frameworks underpinning these approaches. This means that the way in which congestion is assessed and managed may well differ from city to city and from one region or state to another and the variety and scope of actors involved is also likely to differ.
These conceptual frameworks are given further consideration in the next chapter.
OVERVIEW OF TRAFFIC CONGESTION AND CONGESTION APPOACHES IN MEMBER COUNTRIES – 119
MANAGING URBAN TRAFFIC CONGESTION – ISBN 978-92-821-0128-5 - © ECMT, 2007
NOTES
1. Traffic Growth in Australian Cities: Causes, Prevention and Cure, David Gargett & John Gaffney, 2004.
2. Victorian Department of Infrastructure, revised figures, 2006.
3. VicRoads figures provided in Department of Infrastructure submission, ibid.
4. City of Cities – A Plan for Sydney’s Future, December 2005, www.metrostrategy.nsw.gov.au.
5. Less than 60% of household in central Sydney own a car, compared to more than 85% for the wider Sydney metropolitan area. Source: www.cityofsydney.nsw.gov.au.
6. City of Cities – A Plan for Sydney’s Future, December 2005, www.metrostrategy.nsw.gov.au.
7. Smart Travel Choices for South East Queensland: A Transport Green Paper, 2005.
8. Perth Metropolitan Transport Strategy 1995-2029, 1995.
9. Traffic Growth in Australian Cities: Causes, Prevention and Cure, David Gargett & John Gaffney, 2004.
10. City of Cities – A Plan for Sydney’s Future, December 2005, www.metrostrategy.nsw.gov.au.
11. Victorian Department of Infrastructure.
12. Austroads National Performance Indicators, www.austroads.gov.au.
13. Stathopoulos and Karlaftis, 2001.
14. Stathopoulos and Karlaftis, 2001.
15. Stathopoulos and Karlaftis, 2003.
16. “Traffic Congestion and Reliability: Linking Solutions to Problems.” Cambridge Systematics Incorporated (Prepared for U.S. Federal Highway Administration). July 19, 2004. 3-11.
17. “Traffic Congestion and Reliability: Linking Solutions to Problems.” Cambridge Systematics Incorporated (Prepared for U.S. Federal Highway Administration). July 19, 2004. 3-11.
18. Data for this figure came from the US FHWA Freight Analysis Framework.
19. Under consideration are two indicators for urban motorways: Time travelled in congested conditions multiplied by the number of kilometres of congested roadway weighted by the length of vehicle trips and a Flow/speed indicator calculated as the product of flow multiplied by traffic speed (by lane and by link averaged by day and then averaged by year).

CONCEPTUAL FRAMEWORKS FOR ASSESSING CONGESTION AND ITS IMPACTS – 121
MANAGING URBAN TRAFFIC CONGESTION – ISBN 978-92-821-0128-5 - © ECMT, 2007
5. CONCEPTUAL FRAMEWORKS FOR ASSESSING CONGESTION AND ITS IMPACTS
This chapter explores the different perspectives and approaches that have been used to analyse and make assessments of congestion and its impacts. It highlights the importance of the conceptual frameworks and the methodologies used for these assessments. It explores the extent to which the “traditional” frameworks adequately capture the perspective of transport system users and their experiences of congestion. It examines the contributions that economic approaches can make to determining optimal levels of congestion. It also examines impacts of congestion that have often not been captured by traditional assessment methodologies and notes where it is important to account for these.
Most transport administrations decide on their approaches to tackling traffic congestion after a careful analysis of congestion and its impacts. As the previous chapter identifies, there is rarely a uniform conceptual framework for addressing congestion and appraising congestion management policies, given the variety of agencies and scope of responsibilities and actors involved.
However, the manner in which congestion is evaluated and analysed – and in particular, the methodological tools used and their explicit and/or implicit assumptions – have important repercussions for policy. This is because the conceptual frameworks chosen define to a large extent the nature of the policies subsequently pursued – and in particular whether the action finally taken involves doing nothing, pursuing short term projects targeting congestion mitigation “on the road” and other objectives (such as air quality) or undertaking longer term actions such as demand- and mobility- management, land-use planning and/or major infrastructure improvement and/or expansion.
The difficulties and complexities involved in measuring congestion resurface when authorities seek to evaluate the impacts of congestion since this very assessment rests on the use of various congestion indicators that themselves are embedded in specific conceptual models. A review of congestion management policies reveals two broad and sometimes conflicting approaches:
• Those conceptual frameworks that are essentially focused on the physical dimension of congestion – e.g. speed, flow, density, travel time, etc – that have been traditionally been used for road traffic management.
• Those approaches that look at the interplay between road supply and demand, the social costs involved and how users seek to balance the costs imposed by congestion and their own welfare.
In reality, the lines between these two different approaches are no longer as clear cut as they may have historically been. In many instances, open lines of communication and co-operation no doubt exist between transport planners, traffic engineers and transport economists and all three fields inform policy-makers as to the types of congestion mitigation actions to put into place. However, very real

122 – CONCEPTUAL FRAMEWORKS FOR ASSESSING CONGESTION AND ITS IMPACTS
MANAGING URBAN TRAFFIC CONGESTION – ISBN 978-92-821-0128-5 - © ECMT, 2007
tensions exist between the different conceptual approaches and these tensions, to a certain extent, continue to delineate different congestion response policies.
The purpose of this chapter is to go beyond the simple and superficial enumeration of congestion’s impacts that has served as the basis for many congestion management policies. It seeks to place the assessment of congestion within the context of performance evaluation by roadway managers and other concerned parties and describes how the conceptual frameworks relating to the assessment of congestion and its impacts have evolved over time. To do this, the five sections of this chapter address the following questions:
• How have roadway managers traditionally carried out and used assessments of congestion? (Section 5.1).
• How have transport economists sought to build on the above and integrate the notions of congestion costs (Section 5.2).
• What have been the limitations of these approaches? (Section 5.3).
• What can be said about more sophisticated approaches for assessing congestion and its impacts? (Section 5.4).
• How should one approach the issue of measuring the “total” cost of congestion? (Section 5.5).
5.1 Traditional Approaches to the Assessment of Congestion
Road administrations have traditionally focused on assessments and management of the road systems in urban areas in ways that maximised the ability of existing infrastructure to handle current and expected future traffic demand and minimised traffic delays and the associated personal, business and resource impacts including personal and productive time lost, fuel wasted and air quality degradation.
Roadway managers have typically undertaken a programme of actions along the lines set out below:
1. Identification of existing and potential future congestion locations.
2. Identification of possible improvements.
3. Assessment of the priorities amongst possible projects, often with the assistance of benefit cost analysis (BCA) and / or cost-effectiveness analysis.
4. Proposal of congestion-mitigation actions that in the short term may lead to improvements in traffic flows and capacity utilisation of the existing infrastructure, particularly in areas where transport system transport performance is poor or is expected to deteriorate to unacceptable levels, if no action is taken.
5. Where appropriate, identification, prioritisation and proposal of locations and corridors where further improvements may be required in the longer term – including new infrastructure capacity.

CONCEPTUAL FRAMEWORKS FOR ASSESSING CONGESTION AND ITS IMPACTS – 123
MANAGING URBAN TRAFFIC CONGESTION – ISBN 978-92-821-0128-5 - © ECMT, 2007
5.1.1 Identification of Congested Locations
Although it is difficult to generalise, transport administrations tackling traffic congestion often focus initially on identifying congestion locations. The approaches typically involve:
• Measurement of traffic speeds and flows.
• Estimates of maximum achievable speeds and flows during uninterrupted traffic flow conditions (but taking into account speed limits and intersection capacity).
• Assessments of actual speeds and flows in relation to maximum achievable speeds and flows. These are often defined in terms of percent below posted speed (or below off-peak speeds at prevailing flows), roadway volume/capacity ratio, speed-flow charts and intersection levels of service.
• Identification of congested locations throughout the network based on overall Levels of Service (LOS) or another form of categorization.
Figure 5.1. Congestion Severity Mapping (time “loss”/km), Kanto Prefecture, Japan
Con
gest
ion
Loss
Tim
e/km
35,00020,00015,00010,0005,000
1/3 of Japan’s Congestion impacts (measured in time “losses” occur in the Tokyo Metropolitan Area. The Government tracks congestion impacts by road segment (color-coded map above) and targets the worst 20% (see left) of congested road segments for priority action.
Congestion per km (or vehicle-km) by roadway segment.20%
Tokyo
Kanto Prefecture
Source: Working Group Questionnaire Response.
An example from Japan is provided in Figure 5.1. As noted, congestion impacts (as measured in travel time “delay”) are tracked by road segment and the worst 20% of congested road segments are targeted for priority action.

124 – CONCEPTUAL FRAMEWORKS FOR ASSESSING CONGESTION AND ITS IMPACTS
MANAGING URBAN TRAFFIC CONGESTION – ISBN 978-92-821-0128-5 - © ECMT, 2007
Such operational approaches are well adapted to identifying the locations where bottlenecks exist. They allow administrations to highlight locations where action may need to be taken to respond to the actual delays experienced by users on a regular basis.
5.1.2 Identification of Possible Improvements
Having identified specific congestion locations and bottlenecks, the next step is to identify possible operational and other measures that could mitigate this congestion.
Administrations generally take a broad approach to possible measures for mitigating congestion and dealing with congestion impacts. Generally there will be a range of alternatives to consider, including not only road capacity enhancements but also operational changes such as sophisticated traffic signalling systems, real time information systems, better incident detection and response and responses involving management of demand.
It would generally be expected – and in some countries, the legislative framework requires - that congestion solutions include possible contributions from all transport modes (e.g. coordination with public transport improvements). There is likely to be a particular focus on the scope for greater use of alternative modes (e.g. road-based public transport, trams/light rail, heavy rail etc) and low speed transport (e.g. walking and cycling) in central and residential areas and historically sensitive zones. Of course, congestion in non-road modes may also limit the options available for relieving road congestion (e.g. in the case of public transport where it is already heavily congested and delivering poor levels of comfort and service).
In large metropolitan areas in particular, the costs of improvements in alternative modes – such as rail-based public transport - may be very high, the time periods involved very long and the funding of these initiatives constrained and uncertain. In such cases, roadway managers may well see road-based solutions over which they have a degree of control as the only feasible options, at least in the short term.
If roadway managers do retain a relatively narrow focus on travel times and levels of service on the roads concerned and focus on attempts to improve volume to capacity ratios – i.e. throughput on the road systems – the possible improvements identified are likely to favour supply-side options e.g. ones which remove bottlenecks and enhance traffic throughput.
5.1.3 Assessment of Possible Mitigation Measures
Not all congestion management measures are affordable and not all affordable congestion management measures are effective. Administrations generally make assessments as to how best to spend limited funds for the greatest impact. Most make use of some form of economic and operational assessments which consider the possible savings that could be achieved by different congestion measures and compare these benefits with the costs of the measures involved. These assessments typically take into account expected changes in demand and transport system performance over the life of the project. In other words, the assessment frameworks for congestion mitigation are often the same as – or very similar to – those applied in assessing potential transport improvements generally.
Where the projects are complex, road administrations predominantly use Benefit Cost Analysis to assess and compare the mitigation options identified. Such analyses generally make assessments of economic and operational differences between the base case and the project case(s). These differences are identified for each of the future years of the project evaluation period. These can vary from the short term to up to 25 years or more for infrastructure projects. Future costs and benefits are then

CONCEPTUAL FRAMEWORKS FOR ASSESSING CONGESTION AND ITS IMPACTS – 125
MANAGING URBAN TRAFFIC CONGESTION – ISBN 978-92-821-0128-5 - © ECMT, 2007
discounted to the present time to arrive at present values of the benefits and costs. The results are presented as benefit-cost assessments based on the present value of the benefits of the project case over the base case, in comparison with the present value of the levels of the project costs over and above base case costs.
In simplified terms, the project costs and benefits generally include road agency construction costs, agency operating costs, user costs (including personal travel time and commercial time/productivity costs), resource costs (such as fuel use), and emissions and other impacts. Where possible, all known costs are quantified. Where not quantifiable, qualitative assessments are undertaken. For simpler projects, assessments may be based on cost-effectiveness analysis or operational analysis in which case the scale and complexity of the appraisal processes are greatly reduced.
Priority congestion mitigation measures are chosen taking into account these benefit cost analyses or cost effectiveness results. The options favoured by this analysis are generally the ones that generate the greatest net benefits. Other assessment approaches such as multi-criteria analysis may be overlaid over the benefit-cost analyses to help decision-makers. How these findings are treated in the political decision-making process, however, is a matter for the ministers and governments concerned and the outcomes may well reflect other, less analytical considerations.
5.1.4 Infrastructure Development and Expansion
Authorities’ assessment of congestion mitigation options typically cover expanding existing infrastructure and providing new capacity. Ideally, any major new infrastructure options should be considered for their interactions with land use, their likely impacts on demand /traffic generation and expected benefits in the short- and long-term.
Given that proposals for infrastructure expansion are likely to be contentious, they need to be fully researched and appraised in economic, operational, environmental and social terms. As part of such assessments, comparisons are often required with all the other realistic policy options available.
Furthermore, given the density of existing development, and the costs and environmental difficulties of building new road infrastructure in well established large metropolitan areas, proposals for such infrastructure are likely to be relatively limited and require not only extensive assessment – including for example environmental impact statements – but also considerable public and stakeholder consultation.
5.2 Further Economic Contributions to the Assessment of Congestion
Economics has brought a different perspective to bear on the way in which congestion should be assessed, the way in which policy related to congestion should be formulated and the analysis that should be undertaken in assessing congestion and its impacts and identifying possible congestion solutions. While roadway managers have typically been restricted to measures affecting the supply of road space, economists view congestion in terms of demand as well as supply. The task of tackling congestion is seen in terms of moving towards an optimal balance between supply and demand. In particular, a consistent finding of transport economists is that an economically “optimal” level of traffic not only entails a certain degree of congestion – as the term is commonly understood by roadway managers and users – but that this “optimal” level of traffic varies according to demand and other circumstances i.e. it is not related solely to the capacity of the infrastructure under consideration. Adopting such an economic-based approach can lead to a different view of what the objectives should be in relation to traffic congestion.

126 – CONCEPTUAL FRAMEWORKS FOR ASSESSING CONGESTION AND ITS IMPACTS
MANAGING URBAN TRAFFIC CONGESTION – ISBN 978-92-821-0128-5 - © ECMT, 2007
In practice, given the variable nature of both supply and demand and the difficulty in modelling these, transport economists fall back on one of several simplified conceptual models regarding the behaviour of traffic and the impacts imposed by congestion.
In this section we will explore these further economic contributions to assessing and managing the impacts of congestion. We will consider the “simplified” economic approach used in early work to determine optimum traffic levels, an approach that has underlain many theoretical investigations relating to congestion management and has served as the basis for much work related to congestion pricing.
Such simplified approaches provide only the first step in tackling congestion issues. Indeed there are many practical hurdles to overcome in the course of contributing to sound policymaking, as discussed later.
5.2.1 The “Simplified” Average Social Cost/Marginal Cost Approach to Congestion
Economists based much of their early analysis of congestion on the fundamental diagram of traffic flow but translated this into a cost function (see Figure 5.2). Starting from the traditional speed-flow relationship (A), they transformed speed into travel times (B) and then assigned costs to travel times according to users’ values of time (C) to derive average social costs (ASC) – at least for the “normal” (e.g. non-hypercongested) part of the curve.
Figure 5.2. Translation of the Fundamental Speed-Flow Diagram into a Cost Function
Ave
rage
spe
ed k
m/h
Traffic flow on a link (pcu/h)
“hypercongestion”
Traffic flow on a link (pcu/h)
Tra
vel t
ime
h/km
“hypercongestion”
Traffic flow on a link (pcu/h)
Cos
t Eur
o/P
CU
/km
“hypercongestion”
ASC MSC
A B C
qmax qmax qmax
Ave
rage
spe
ed k
m/h
Traffic flow on a link (pcu/h)
“hypercongestion”
Traffic flow on a link (pcu/h)
Tra
vel t
ime
h/km
“hypercongestion”
Traffic flow on a link (pcu/h)
Cos
t Eur
o/P
CU
/km
“hypercongestion”
ASC MSC
A B C
qmax qmax qmax
pcu=passenger car unit
Source: Button, K. in Santos, ed., Road pricing Theory and Evidence, 2006, p. 6.
By adding a demand curve to the upward sloping non-hypercongested portion of the ASC curve, economists have derived a simplified graphical representation of congestion illustrated by Figure 5.3 where the transport operations terms of speed, flow and density are translated into a supply/demand framework.1
Figure 5.3 presents the quantity of road usage (in terms of passenger-car units per hour) along the horizontal axis and the unit costs of road usage on the vertical axis.
The ASC and MSC curves indicate average and marginal costs as traffic flows increase and broadly encompass the time-related and vehicle operation-related costs borne by road users when they make trips. Recent economic literature suggests that these average “social’ costs for road users are equivalent to the marginal private costs faced by every driver entering the road since the latter do not

CONCEPTUAL FRAMEWORKS FOR ASSESSING CONGESTION AND ITS IMPACTS – 127
MANAGING URBAN TRAFFIC CONGESTION – ISBN 978-92-821-0128-5 - © ECMT, 2007
take into account the congestion costs they impose upon others.2 This convention is reflected in Figure 5.3.
The demand curve D(q) represents the demand for the use of the road, as a function of the unit cost of using the road, expressed in monetary units per vehicle-km. This reflects the unit operating cost of driving, of which the most important element is a time cost, the cost of the time needed to drive one kilometre.
When the motorist is alone on the road (i.e. when q=0), this cost is J, which is the operating cost of driving, plus the time cost at the free-flow speed. When there are more vehicles on the road (i.e. when q increases), the speed is reduced, the time needed is increased, and MPC(q) increases.
Figure 5.3. “Simplified” Diagram of Road Congestion
Traffic flow
Cos
t
ASC=MPC* MSC
qmax
Demand D(q)
Marginal social cost MSC(q)
Average social cost (ASC), ASC(q)(equivalent to marginal private cost (MPC), MPCq)
qmaxTraffic flow on a link (pcu/h)=q
Cos
t Eur
o/P
CU
/km
A
B
C
E F
G
H
R
N
M
L
PJ
Y X
Traffic flow
Cos
t
ASC=MPC* MSC
qmax
Demand D(q)
Marginal social cost MSC(q)
Average social cost (ASC), ASC(q)(equivalent to marginal private cost (MPC), MPCq)
qmaxTraffic flow on a link (pcu/h)=q
Cos
t Eur
o/P
CU
/km
A
B
C
E F
G
H
R
N
M
L
PJ
Y X
Source: Adapted from: Button, K. in Santos, ed., Road pricing Theory and Evidence, 2006, p. 6.
An equilibrium between these demand and supply curves will be reached at point A, where the curves intersect with X vehicles on the road at a unit cost of L.
At this equilibrium point, each additional new driver bears a cost of driving equal to the benefit he/she derives from road usage. At higher volumes, he/she would bear a cost greater than the benefit derived, and the marginal users would therefore not use the road.
This “natural equilibrium” is however “suboptimal” in an economic sense as described below.
128 – CONCEPTUAL FRAMEWORKS FOR ASSESSING CONGESTION AND ITS IMPACTS
MANAGING URBAN TRAFFIC CONGESTION – ISBN 978-92-821-0128-5 - © ECMT, 2007
5.2.2 Economically “Optimal” Levels of Congestion
While the “natural equilibrium” point takes into account private costs, it does not take into account marginal social costs associated with each additional vehicle on the road. These costs would include the time delays imposed on others by each new vehicle entering the traffic stream – e.g. when we consider MSC(q), the marginal social cost curve created by a vehicle as a function road usage. This social cost is equal to the marginal private cost MPC(q), plus the cost of the additional time incurred by all other vehicles because the marginal user’s vehicle is on the road. This is shown in diagram 5.3 by the point C.
Economists conclude that, from the viewpoint of society as a whole, the “optimal” level of road traffic on the road occurs at point B, where the demand curve marginal social cost curves intersect. At this point, there are Y vehicles on the road, and the unit cost is M. An additional vehicle would generate a social cost greater than the social benefit it creates.
On the basis of this simplified economic representation and analysis of road traffic, it may be concluded that, if policies are to bring about “optimal” flows, a charge of EB needs to be introduced to close the gap between the marginal private and the marginal social cost. Note that the optimum charge is substantially less than the initial (pre-charging ) level of the externality (AC in the diagram) because the charge results in a movement back down the demand curve to a point where the gap between private and social costs is much smaller. The proceeds of such a charge are equal to the amount of the charge multiplied by the optimal number of vehicles.3
Importantly, such transport economic approaches have as their basis that optimal levels of congestion take into consideration not only the cost of road provision but also what people are ready to pay in order to use the road – that is, the demand curve.
In theory, it is then a simple matter to work out the optimal road user charge from the relationship between marginal social cost and demand shown in figure 5.5. This involves:
• Knowledge of the private costs, quantified in terms of the fuel consumed and time spent by the driver on the road link and of the external costs in terms of the delay and pollution costs caused by that vehicle provides the estimates for points A and C in diagram 5.5.
• In order to work out the optimal tax EB, analysts need information about how road users respond to the imposition of a tax or charge, defined as the elasticity or slope of the demand curve.
• To complete the work, analysts also need to include the road operator’s data on the shape of the speed flow curve for the road link so as to work out the location of point B, the intersection of the marginal social cost and the demand curves, and hence set the optimal price.
Importantly, the economic approach outlined above assumes that:
• On a given road, as demand varies, the desirable level of traffic - and of speed - also varies.
• In particular, as demand increases, the optimal level of traffic on a road will increase.
CONCEPTUAL FRAMEWORKS FOR ASSESSING CONGESTION AND ITS IMPACTS – 129
MANAGING URBAN TRAFFIC CONGESTION – ISBN 978-92-821-0128-5 - © ECMT, 2007
Under normal speed-flow conditions, this increase in traffic may be accompanied by some decrease in average speed. In contrast, if the value of time for some road users increases over time, the optimal level of traffic on a road will decrease, which could be accompanied by an increase in average speed.
Such economic approaches also reflect the common sense view that congestion is relative i.e.:
• The level of congestion that is acceptable varies according to the level of demand.
Economic approaches define congestion costs as the economic cost incurred by society when road usage is above the economically optimal point. In terms of Figure 5.3, it can be defined in two alternative, equal, ways. One is the area BCA. The other is the difference between the surplus associated with B and the surplus associated with A. The definition of congestion costs used by economists therefore takes into consideration both what it costs to build or expand a road and also what people are ready to pay in order to use the road.
5.3 Gaps between Traditional Approaches, Theory and Practice
There are many limitations in both the traditional road operational approaches outlined in Section 5.1 and the further economic contributions outlined in Section 5.2 that need to be examined. This section addresses the following issues and aspects in more detail:
• Gaps in both traditional roadway management and simplified economic approaches:
− Addressing point congestion versus network congestion.
− Further limitations in the use of the speed-flow framework for assessing congestion.
− Implications of maximising throughput on the roads.
− Static versus dynamic contexts for assessment.
• Further shortcomings linked to simplified economic approaches:
− Relevance to interrupted flow facilities.
− Setting appropriate congestion charges.
− Availability of cost-effective charge collection technology.
− Public acceptability.
− Second-best versus first best approaches.
5.3.1 Core Shortcomings in Both Road Operations and Economic Approaches
5.3.1.1 Addressing Point Congestion Versus Link and Network Congestion
Congestion is often measured at the roadside (or more precisely in the road) through the use of embedded loop detectors or some other form of fixed traffic counting station (see Chapter 1). Counts from these detectors generate the speed-flow plots that make up the fundamental speed-flow diagram.
However, counts from these detectors/stations only convey information about traffic flow at a specific point in time and from a single point on the roadway. They convey little about the condition of traffic throughout the roadway system (information sought after by the roadway manager) and/or

130 – CONCEPTUAL FRAMEWORKS FOR ASSESSING CONGESTION AND ITS IMPACTS
MANAGING URBAN TRAFFIC CONGESTION – ISBN 978-92-821-0128-5 - © ECMT, 2007
traffic conditions for a trip that is comprised of travel along diverse but linked roadway segments (information that is relevant to the roadway user). They also convey little information regarding the manner in which counts from different detectors are linked to each other – e.g. they say little about the network congestion effects of queuing, in space and time.
Figure 5.4. Speed/Flow Readings along an Uninterrupted Flow Facility
Traffic flow
Spe
ed
hypercongested
Traffic flow
Spe
ed
hypercongested
Traffic flow
Spe
ed
hypercongested
Loop Detector 1 Loop Detector 2 Loop Detector 3
Traffic flow
Spe
ed
Traffic flow
Spe
ed
hypercongested
Traffic flow
Spe
ed
Traffic flow
Spe
ed
hypercongested
Traffic flow
Spe
ed
Traffic flow
Spe
ed
hypercongested
Loop Detector 1 Loop Detector 2 Loop Detector 3
Source: ECMT, 2007.
For example, as illustrated in Figure 5.4, a trip comprised of a set of links between an origin and a destination will almost never be characterised solely by stop-and-go traffic. Rather, the trip and the links upon which it is taken will be characterised by a succession of single points where speed-flow data might convey freely flowing traffic, bound traffic and/or hypercongested conditions.
Accordingly, many assessments of congestion and its impacts do not sufficiently recognise the network nature of roads in large metropolitan areas. In some instances, road administrations have sought to seek more synthetic indicators that attempt to capture these network effects. For instance, point measures are sometimes combined so as to describe and monitor queue length (as in some cities in France and Germany) but this is far from being the case in most urban areas.
Although metropolitan-wide models generally take network-related effects into account - such as shifts in demand between motorways, arterials and local roads local assessments made using static models may miss such effects. Localised assessments focussed, for example, on intersection and bottleneck treatments may therefore miss changes in route choices that proposed improvements could bring.
As roads in urban areas are dense networks generally presenting multiple and finely balanced mode, route and timing choices, changes in conditions made on a local basis may lead to considerable changes in demand levels, even in the short term. These may not only reflect route switching but also
CONCEPTUAL FRAMEWORKS FOR ASSESSING CONGESTION AND ITS IMPACTS – 131
MANAGING URBAN TRAFFIC CONGESTION – ISBN 978-92-821-0128-5 - © ECMT, 2007
generated/induced traffic, particularly if there has been an effective improvement in network levels of service.
In order to better capture system-wide traffic performance, roadway managers need to complement roadside counts with probe-vehicle data that can better convey traffic conditions for multiple roadway links. Furthermore, the conceptual frameworks used to assess congestion should provide for demand to be properly assessed in terms of network effects and all road network changes to be assessed on the basis of priorities across the metropolitan area. It would no doubt be better if the work was coordinated by a body with responsibilities for transport across the metropolitan area – rather than often being undertaken in isolation by local bodies.
5.3.1.2 Further Limitations in the Use of the Speed-Flow Framework for Assessing Congestion
In addition to the difficulty with which the speed-flow relationship can convey an adequate assessment of network-based congestion, it also faces three other limitations:
1. The speed-flow relationship is better suited to describe traffic effects on a roadway network that is characterized by few interruptions and/or access/egress points – essentially a motorway network.
2. The overlay of a demand curve over a supply function based on speed-flow implies that road users demand travel on the link per unit of time. This is not evident and it seems more likely that road users’ demand is for “trips” – which are better captured using stock-based, and not flow-based, models.4
3. Historically, the speed-flow relationship in the fundamental diagram has been portrayed as an almost symmetrical parabola—indicating that speeds fall rapidly as new traffic enters the roadway. However, as noted in Chapter 3, this symmetry has been challenged by recent empirical studies.
4. Field studies have revealed a much more pronounced two-phase pattern where the top part of the curve is much flatter than previously thought. In general, speeds are only slightly affected by increasing traffic up to a point near the apex of the parabola where traffic flows become unstable, sudden discontinuities occur and the flow can switch rapidly from relatively free-flowing to the “congested” and “hyper-congested” portions of the curve.5
The three phase pattern also described in Chapter 3 further complicates the simple transposition of the speed-flow curve into an economic representation of congestion – as does the phenomenon of capacity drop (see Figure 3.6).
5.3.1.3 Implications of Maximising Throughput on Roads
As outlined in Section 5.1, traditional roadway operational approaches to addressing congestion often focussed explicitly or implicitly on reducing travel times and maximising throughput on the roads, in pursuing the general aim of infrastructure efficiency. But maximising throughput on the roads may not ensure that the infrastructure is used efficiently.
Taking as a hypothetical example a large metropolitan area with a well developed motorway network, supply-side responses such as removing bottlenecks and enhancing traffic throughput would be likely to increase traffic volumes on its limited access roads (i.e. the urban motorways). Eventually, such increasing flows would take traffic to the part of the speed flow curve where flows became
132 – CONCEPTUAL FRAMEWORKS FOR ASSESSING CONGESTION AND ITS IMPACTS
MANAGING URBAN TRAFFIC CONGESTION – ISBN 978-92-821-0128-5 - © ECMT, 2007
unstable. When in this zone, small increases in demand or small interruptions in traffic flows could lead to hyper-congestion and stop-go traffic and even gridlock. In such circumstances, both speeds and flows would fall dramatically, with serious adverse impacts on all road users. Quite simply, the result would be that all users on the affected motorways when this happens would be worse off.
There are also many other circumstances (e.g. on arterial and local roads) where removing bottlenecks and maximising throughput would not be the appropriate response to congestion at all. For example:
• Increasing the use of available capacity might be totally inappropriate on roads leading to environmentally sensitive areas, such as the historic centres of cities (such as Athens). Rather than facilitating increased traffic, the policy objective might be to reduce destination traffic by restricting parking and to prevent through traffic by physical changes which ensure there are no through roads (as in the old centre of Vienna).
• Increasing throughput by alleviating intersection bottlenecks on arterial roads may also be totally inappropriate on arterial roads that directly or via feeders increase traffic through pedestrian zones or sensitive residential areas. The appropriate objective may be to discourage such traffic and divert it to alternative, by-pass roads.
• Increasing traffic flows could also be a poor strategy when this would lead to the emergence of similar problems on roads and at intersections at downstream points that could not be easily or cost-effectively treated.
5.3.1.4 Static Versus Dynamic Context for Assessment
In the longer term, congestion mitigation measures can have significant impacts on demand. Most models make assessments of long term traffic, including generated / induced traffic. However, even over a ten year period, there can be many significant and difficult-to-model changes that could affect the forecasts and operational appraisals.
• Land use can change generally and in key locations in response to either improvements or deterioration in levels of transport service. There are many examples in most cities of land use changing in response to urban motorway development or mass transit improvements.
• Land use can be expected to change in response to increasing speeds in particular. Increasing speeds generally result in greater decentralisation, as they allow people to travel further within their relatively fixed daily travel time budgets. Of course, in time, such decentralisation can be followed by in-fill and increased traffic generation, more traffic, lower speeds and eventually congestion in decentralised locations as well.
• Transport demand can change in response to policy changes that impact on the cost of travel or the value of land – and lead to changes in land use that have not been modelled.
In such ways, demand increases in the longer term can be significantly different from – and often greater than – “static” or 4 step transport models forecast.
5.3.1.5 Relationship to Interrupted Flow Facilities
A further and important issue to consider relating to economic assessments based on the speed-flow relationship is that the economic relationships are derived from observations of traffic on
CONCEPTUAL FRAMEWORKS FOR ASSESSING CONGESTION AND ITS IMPACTS – 133
MANAGING URBAN TRAFFIC CONGESTION – ISBN 978-92-821-0128-5 - © ECMT, 2007
uninterrupted flow facilities such as inter-urban roads. These may provide an accurate understanding of how traffic behaves on motorways but do not necessarily lend themselves to urban road networks, which include arterials with intersections and local roads with access from neighbouring properties.
5.3.2. Shortcomings of Simplified Economic Approaches to Assessing Congestion in Relation to Road Pricing
5.3.2.1 Setting Appropriate Congestion Charges
Economic approaches to managing congestion focus on the charges required to achieve “optimal” levels of congestion. However, imposing those charges in practice is not at all straightforward. The difference between the current level of road usage and the economically optimal level of road usage is the “excess” road usage encountered under normal operating conditions on roads, the amount by which road usage should be cut to take us to the economic optimum.
In reality, using the simplified economic model approach to calculate optimal traffic levels and therefore, optimal road user charges is fraught with theoretical and methodological challenges that are relevant for policy-making.
Some of these are linked to the specification of the speed-flow-inspired static approach outlined above, others with the difficulty in accounting for the temporal and spatial dynamics of congestion and further still are the difficulties in accounting for, and assigning a relative priority to, roadway users’ values of time that form the basis for the generalized cost component of economic analyses of congestion.
As noted in the Victoria Competition and Efficiency Commission draft report on congestion:
[The early economic] representation of congestion is highly simplified. In practice, there will be a different demand function for each period of the day and for different groups of travellers (such as commuters, students, shoppers, businesses, etc.), reflecting the differences in the benefits they derive from travel and their ability to adjust their behaviour. There will also be different speed-flow relationships for different parts of the road network, reflecting the characteristics of different parts of the network..6
5.3.2.2. Availability of Cost-Effective Charge Collection Technology
A simplified economic model takes no account of whether technology exists that could allow location-specific and time-specific congestion taxes or charges to be imposed in the way that the economic model in Figure 5.3 assumes.
In relation to technology decisions need to place great weight on what the technology would cost to operate, how this might affect the financial viability of the approach and the extent to which potential overall benefits would be lost in the transaction costs.
5.3.2.3 Public Acceptability
Whereas the operational approaches to congestion management have been used by roadway managers for many years and are generally accepted by the public, experience has shown that in many large metropolitan areas, the general public is far less - or not yet - convinced about the merits of approaches based on congestion charging. The simplified economic models are neutral on this point.

134 – CONCEPTUAL FRAMEWORKS FOR ASSESSING CONGESTION AND ITS IMPACTS
MANAGING URBAN TRAFFIC CONGESTION – ISBN 978-92-821-0128-5 - © ECMT, 2007
However, one aspect which experience with price-based approaches in different countries has highlighted is that:
• Many people are willing to pay in money rather than in time – and therefore would prefer to have an opportunity to do so.
• Many other people are quite willing to pay in time what they are not willing to pay in money.
In other words, there are sometimes inconsistencies in personal accounting heuristics that render the direct translation of people’s “cost” of time into monetary terms problematic.
The outcome is that there is no certainty that the methodology as presented could actually be applied in practice in particular locations. This will depend in part on whether the public would support the use of location-specific and time-based congestion pricing in the ways proposed across urban road networks.
5.3.2.4. First/Second Best Considerations
Importantly, the analysis outlined above does not provide any indication about how helpful simplified economic models and related indications on optimal congestion levels and congestion charges would be in circumstances where it is not possible to impose taxes or charges that reflect continuously changing demand and congestion throughout the urban network.
5.3.3 Implications of the “Early” Conceptual Frameworks Related to Congestion
Roadway operations approaches have traditionally taken as their reference situation the speed associated with the maximal throughput flow on the road considered. When flows increase and actual speeds fall below this speed, the road is said to be congested. There are two important points.
• First, roadway operations approaches have typically “accepted” speed/flows and traffic which correspond to “natural equilibrium” volumes. They have therefore often in effect “accepted” high throughput volumes in excess of the level that economists would consider an “optimal” traffic volume on the road.
• Secondly, by seeking out maximum throughput volumes, operational approaches have tended to allow and sometimes facilitate traffic volumes increasing to levels where speeds and flows are relatively unstable.
In such cases, while aiming for maximum throughput outcomes has reflected the intention that the infrastructure be used as efficiently as possible, the effect has often been to allow or promote infrastructure use to the point where severe congestion has been very likely.
Economic approaches depend on theories that are illustrative and easily explained in the simplified form presented above - but whose applications in full are generally still seen as not being feasible in most large metropolitan areas at present. The specific limitations relate to the calculation of the appropriate charges, the cost of imposing such a system and the limited analysis of second-best alternatives:
• The calculations are complicated by the specification of the speed-flow-inspired static approach outlined above, the difficulty in accounting for the temporal and spatial dynamics of congestion and in assigning a relative priority to roadway users’ values of time which of
CONCEPTUAL FRAMEWORKS FOR ASSESSING CONGESTION AND ITS IMPACTS – 135
MANAGING URBAN TRAFFIC CONGESTION – ISBN 978-92-821-0128-5 - © ECMT, 2007
course form the basis for the generalized cost component of economic analyses of congestion.
• Though technology that could allow location-specific and time-specific congestion taxes or charges to be imposed in the way that the simple economic model assumes exists at present, systems to charge at a reasonable/acceptable cost have still to be developed.
• The simple economic models provide little assistance with the economic value of alternative approaches which could be pursued in second-best circumstances e.g. with limited charging points and fixed charges rather than continuously variable charges.
In overall terms, an important final implication of the alternative operational and economic approaches to congestion is that they are inconsistent - in the sense that, if applied in full, they would most likely lead to different levels of traffic on the roads.
• Economically-optimal levels of traffic will be less than “natural equilibrium” traffic levels that result when traffic builds up to maximum throughput volumes. Economically-optimal levels of traffic would likely be characterised by lower volumes and acceptable travel conditions that avoid chronic stop/go congestion.
• Maximum throughput approaches would most likely be characterised by a greater incidence of chronic congestion, unreliability and stop-go traffic conditions.
In summary, having considered these contrasting, simplified conceptual frameworks, it is clear that traffic levels below “natural equilibrium” or “maximum throughput” levels are more likely to maximize welfare because they explicitly take into account the additional costs that increasing levels of road usage impose on other users .
This conclusion provides some conceptual support for traffic congestion mitigation measures that either:
• Improve traffic outcomes by charging marginal users for the additional costs they impose on other road users; or otherwise.
• Adopt alternative measures to achieve lower volumes on the roads than would apply under “natural equilibrium” or “maximum throughput” approaches.
5.4 Improving the Approaches Used to Assess Congestion and its Impacts
This section examines how these “early”, simplified approaches to assessing congestion may be improved in order to:
• Better capture the “reality” of congestion in operational and economic approaches.
• Assess congestion and its impacts in dense urban roadway networks.
• Approach the value of time in congestion assessment.
• Approach the value of system performance reliability in congestion assessment.
• Identify what other types of impacts should be included in the assessment process?

136 – CONCEPTUAL FRAMEWORKS FOR ASSESSING CONGESTION AND ITS IMPACTS
MANAGING URBAN TRAFFIC CONGESTION – ISBN 978-92-821-0128-5 - © ECMT, 2007
5.4.1 Beyond Speed-Flow: Better Capturing the Spatial and Temporal Dynamics of Congestion
In order to better capture congestion dynamics and in particular, queue formation and discharge effects, several economists7 have sought to develop models based upon the analysis of traffic behaviour at roadway bottlenecks.
Cumulative count diagrams such as in Figure 5.6 are often used to describe queue formation and decay and these have served to underpin some estimates of congestion costs by economists.
Figure 5.6. Bottleneck Model: Queue Evolution and Equilibrium Trip Timing
tete tn t*0 t**t1(e.g.09:00) t*e
A(t)
D(t)
Cumulative distribution of desired arrival times at
destination within population W(t)
E
F
GK
H
J
Time
Cum
ulat
ive
num
ber
of v
ehic
les
Cumulative arrivals at the end of the queue A(t)
Cumulative departures From the bottleneck D(t),Slope = s
Q(t)
Cum
ulat
ive
num
ber
of v
ehic
les
t0 t te
E
G
Time
Queue
Q(t)/s
A.
B.
tete tn t*0 t**t1(e.g.09:00) t*e
A(t)
D(t)
Cumulative distribution of desired arrival times at
destination within population W(t)
E
F
GK
H
J
Time
Cum
ulat
ive
num
ber
of v
ehic
les
Cumulative arrivals at the end of the queue A(t)
Cumulative departures From the bottleneck D(t),Slope = s
Q(t)
Cum
ulat
ive
num
ber
of v
ehic
les
t0 t te
E
G
Time
Queue
Q(t)/sCumulative arrivals at the end of the queue A(t)
Cumulative departures From the bottleneck D(t),Slope = s
Q(t)
Cum
ulat
ive
num
ber
of v
ehic
les
t0 t te
E
G
Time
Queue
Q(t)/s
A.
B.
Source: ECMT, 2007.
As illustrated in Figure 5.6-A, traffic is assumed to flow at a steady rate up to the point where the arrivals at the bottleneck surpass the physical capacity of the roadway at the bottleneck (E). When traffic flow exceeds this level, traffic continues to pass through the bottleneck at rate D(t), but the excess traffic forms a cumulative backlog/queue which will only dissipate once A(t) falls back under D(t). Queuing costs are represented by EFG in figure 5.6-B.
This approach allows analysts to understand the impacts and costs relating to users trading-off different preferred departure times, although it is important to realise that the model specification is heavily influenced by specific mass points (e.g. 9:00 work-start). In this context, the model represents a good approach to understanding some of the links between travel reliability and different journey departure times.
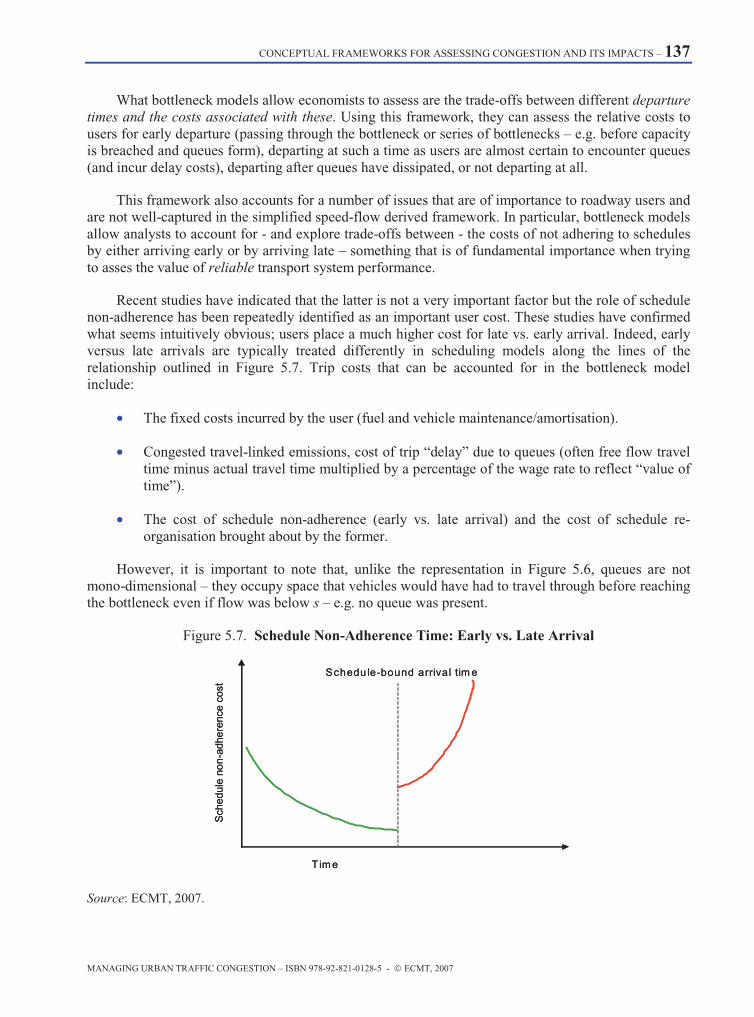
CONCEPTUAL FRAMEWORKS FOR ASSESSING CONGESTION AND ITS IMPACTS – 137
MANAGING URBAN TRAFFIC CONGESTION – ISBN 978-92-821-0128-5 - © ECMT, 2007
What bottleneck models allow economists to assess are the trade-offs between different departure times and the costs associated with these. Using this framework, they can assess the relative costs to users for early departure (passing through the bottleneck or series of bottlenecks – e.g. before capacity is breached and queues form), departing at such a time as users are almost certain to encounter queues (and incur delay costs), departing after queues have dissipated, or not departing at all.
This framework also accounts for a number of issues that are of importance to roadway users and are not well-captured in the simplified speed-flow derived framework. In particular, bottleneck models allow analysts to account for - and explore trade-offs between - the costs of not adhering to schedules by either arriving early or by arriving late – something that is of fundamental importance when trying to asses the value of reliable transport system performance.
Recent studies have indicated that the latter is not a very important factor but the role of schedule non-adherence has been repeatedly identified as an important user cost. These studies have confirmed what seems intuitively obvious; users place a much higher cost for late vs. early arrival. Indeed, early versus late arrivals are typically treated differently in scheduling models along the lines of the relationship outlined in Figure 5.7. Trip costs that can be accounted for in the bottleneck model include:
• The fixed costs incurred by the user (fuel and vehicle maintenance/amortisation).
• Congested travel-linked emissions, cost of trip “delay” due to queues (often free flow travel time minus actual travel time multiplied by a percentage of the wage rate to reflect “value of time”).
• The cost of schedule non-adherence (early vs. late arrival) and the cost of schedule re-organisation brought about by the former.
However, it is important to note that, unlike the representation in Figure 5.6, queues are not mono-dimensional – they occupy space that vehicles would have had to travel through before reaching the bottleneck even if flow was below s – e.g. no queue was present.
Figure 5.7. Schedule Non-Adherence Time: Early vs. Late Arrival
Sch
edul
e no
n-ad
here
nce
cost
T ime
Schedule-bound arrival tim e
Sch
edul
e no
n-ad
here
nce
cost
T ime
Schedule-bound arrival tim e
Source: ECMT, 2007.

138 – CONCEPTUAL FRAMEWORKS FOR ASSESSING CONGESTION AND ITS IMPACTS
MANAGING URBAN TRAFFIC CONGESTION – ISBN 978-92-821-0128-5 - © ECMT, 2007
Vehicles in a queue are still moving forward at a reduced rate of speed. For this reason, when assessing the impacts of congestion, it is important to not confuse the time spent queuing with total delay (since even absent congestion, vehicles would have spent some time covering the space occupied by the queue.) and account for the physical length of queues in order to not overestimate travel time “losses”.
5.4.2. Urban Road Networks with Interrupted Flow Links at-Grade Intersections
In urban areas, road intersections are the main constraint on road capacity and traffic flows do not conform directly to the speed-flow relationship discussed earlier. Capacity per lane on roads with at-grade intersections is typically less than 1 000 vehicles per hour rather than close to 2 000 vehicles per hour per lane on motorways. It is the signal timing and the interplay between each intersection’s clearing rate that determines the formation and duration of congestion. Junctions often differ from each other in their design and throughput. For example, on heavily trafficked roads, where space is available, roads may be widened at intersections to allow an increased number of lanes at the intersection and increased volumes per lane where the road narrows again after the intersection. It is rarely possible to form general conclusions about the relationship between speed and traffic flows on each link of the junction. Models are needed which include detailed information about the throughput of each junction and the interaction between junctions. Examples of these congestion assignment models include AIMSUN, VISUM, CONTRAM and SATURN.
Traffic planners in many congested conurbations have set up congested assignment models to assist in implementing policies such as the re-design of junctions and traffic signals and better traffic management. Many of these models can be run in conjunction with an economic evaluation model to determine whether the benefits of better management, in terms of the time savings and reduced congestion outweigh the costs.
Such models, when combined for example with models of road users’ response to charging, including the effects on the choice of mode, destination and time of travel, can be used in the design of an urban congestion charging scheme. They serve the same purpose as the speed flow curve, although they are considerably more complex in the data that they need and in their function. Charges are optimised through repeated iterations of the model and inspection of the relationship between changes in transport user benefits and changes in the schedule and level of charges.
5.4.3. Capturing the Value of Travel Time: It’s about Time
The overwhelming majority of benefits stemming from congestion mitigation actions are attributed to predicted reductions in travel time.
Predicted travel time “savings” stemming from congestion mitigation measures are multiplied by the wage rate (or a portion thereof) to obtain the total predicted benefit of the scheme. These are then evaluated against the cost of the measure to determine if it produces a net benefit to the community.
Capturing and calculating the value of time in order to better guide transport policy has been the focus of much research in transport economics – it is not the purpose of this section to revisit all of the aspects involved but rather to draw out three issues in particular that are relevant for congestion management policy:
• The heterogeneity in road user values of time.
• The usability of small travel time savings.
• The productivity of travel time.

CONCEPTUAL FRAMEWORKS FOR ASSESSING CONGESTION AND ITS IMPACTS – 139
MANAGING URBAN TRAFFIC CONGESTION – ISBN 978-92-821-0128-5 - © ECMT, 2007
5.4.3.1. The Heterogeneity in Road User Values of Time
Roadway users represent a diverse mix of individuals and businesses travelling for different purposes and at different times of the day. As such, transport economists recognise that when evaluating the predicted benefits of congestion mitigation actions, different user values of time must be taken into account.
One factor to bear in mind is the difference between individuals travelling to work (or for leisure) and individuals travelling for work (including those transporting freight). Typically, the different values are assessed by way of survey and analysis and then assigned according to trip purpose. Business travel is generally assigned a higher value than time spent travelling to work, the latter being regarded as private travel.
Another is that values of time derived from the actual hourly rates of the car occupants in the traffic stream may differ on a geographic and temporal basis. In this respect, average hourly wages rates of people working in the central business district are likely to be higher than those working in decentralised locations. Average hourly rates of people driving during off-peak periods may be lower than those driving during peak periods. Values of time that are assessed as a proportion of average hourly rates will continue to mirror these differences.
These differences may sometimes have important repercussions for congestion policy. For instance, in regions where it is common practice to schedule freight deliveries for specific time windows, transport system reliability may have much greater value than travel time savings per se for freight transporters since early or late delivery must be re-scheduled for 24 hours or more until the next available delivery slot is free.
5.4.3.2. The Usability of Small Travel Time Savings
The question of whether or not roadway users attach different values to travel time “savings” according to the size of these savings is controversial. This is an important question for congestion management policy since in many projects, total predicted time savings are often comprised of the total sum of small time increments. This total is then used to compare projects amongst themselves without necessarily referring to the size or usability of individual user time “savings”.
Figure 5.8 illustrates how two projects, each costing the same, may be assessed on overall time “savings”. In project A, the predicted time “savings” of 10 000 minutes per day are converted into a project benefit of € 400 000 per year. In project B, predicted time “savings of 7 500 minutes per day are converted into a project benefit of €300 000 per year.
Naturally, all other considerations aside, project A would be the preferred option since it delivers a greater benefit/cost ratio. However, when looking at the disaggregate time savings that will be experienced by users, one sees that project B delivers a very tangible relief of 15 minutes to each user of the congested bridge, albeit to fewer overall users - whereas project A only delivers a benefit a 30 seconds per day to each user of the thoroughfare (albeit to a greater number of overall users).
In this case, it would seem possible that project B would deliver much more perceptible congestion relief benefits than project A.
Intuitively, with the alternative projects identified in Figure 5.8, one might understand that small travel time “savings” (especially those on the order of less than 3-5 minutes) may not be easily recognised by roadway users against the background noise of day-to-day variability in travel times

140 – CONCEPTUAL FRAMEWORKS FOR ASSESSING CONGESTION AND ITS IMPACTS
MANAGING URBAN TRAFFIC CONGESTION – ISBN 978-92-821-0128-5 - © ECMT, 2007
whereas large time “savings” are much more easily perceived and valued by a lower number of roadway users.
Figure 5.8. Cost-Benefit and Small vs. Large Travel Time Savings
Project A
20 000 vehicles/daysave 30 secondseach at VOT=7€€ /hr€ .4 million/yr benefit
Project B
500 vehicles/daysave 15 minutes eachat VOT=7€€ /hr€ .3 million/yr benefit
Project A
20 000 vehicles/daysave 30 secondseach at VOT=7€€ /hr€ .4 million/yr benefit
Project B
500 vehicles/daysave 15 minutes eachat VOT=7€€ /hr€ .3 million/yr benefit
Source: ECMT, 2007.
However, many analysts have pointed out that, just because the savings are perceived only with difficultly does not mean they are any less real – indeed, improvements in road safety are routinely made on the basis of small changes in potential risk. Furthermore, in the long run, changes in travel time do accumulate.8
While it may not be easy for road users to make use of small travel time “savings”, given the other scheduling constraints under which they are operate in the short-run, if these are consistent in duration, and over time, users may well modify their schedules to take advantage of them. The caveat of consistency is an important one because, if small travel times “savings” can only be used with difficulty, it is likely that this is because they are unpredictable – or at least are “hidden” by the daily variation in travel duration.
Indeed, the question of whether or not small travel time “savings” should be valued in this way is as much a question of time scale as of context. They may indeed matter from a practical perspective for policies seeking to deliver short-term user-perceivable gains – if this is the goal of the congestion management policy in question. They may also be valued the same as time “savings” composed of larger time increments if transport system performance is relatively predictable and reliable. Conversely, time “saved” in small time increments may be valued less than time “saved” in large increments when transport system performance is unreliable and unpredictable9 – certainly the case in many congested areas.
Another issue to consider related to the value of small vs. large time increments is the impact that these have in the evaluation and appraisal of small vs. large congestion mitigation projects. A position valuing time savings at a constant value irrespective of its increment may lead to a situation where large projects delivering large time savings in small increments are consistently selected over a set of

CONCEPTUAL FRAMEWORKS FOR ASSESSING CONGESTION AND ITS IMPACTS – 141
MANAGING URBAN TRAFFIC CONGESTION – ISBN 978-92-821-0128-5 - © ECMT, 2007
smaller projects delivering fewer overall time savings but in larger increments, e.g. the case illustrated in Figure 5.8.
On a practical level, countries have handled the issue of the value of small travel savings in different ways. Many jurisdictions use the total savings identified. Some discard estimates of the total savings arising from individual savings of less than 3 or 5 minutes per trip.
The United Kingdom, for instance, takes the position that travel time “savings” should be assigned a constant value irrespective of the size of the time increment saved. All other things equal, the value of “saving” 15 minutes for one traveller is equal to the value of “saving” 30 seconds each for thirty travellers.
Canada, however, in its “Guide to Benefit Cost Analysis” nuances this position by recommending slightly different treatment for small time savings:
… to isolate any (perhaps cumulative) travel-time savings of less than five minutes per one-way trip as "small", requiring separate consideration by management. On that basis, the value of small travel-time savings (STS) should be clearly identified but not included in the Net Present Value (NPV) calculation. Instead, the value of STS should be shown separately… enabling management to weigh those effects as it sees fit. The value of STS should be accompanied by a narrative discussing any factors considered relevant in management's assessment of the weight to be given to this category of benefit (e.g., the likelihood of combinability with other STS outside the project, or the average time saving per one-way trip affected).10
5.4.3.3. The Productivity of Travel Time
There are two different types of travel concerned when considering the notion of travel time productivity. There is the productivity of travel undertaken in the context of a remunerated economic activity (e.g. work and/or freight travel) and travel undertaken in the context of un-remunerated “personal” travel. Although the two are quite often linked, especially at peak travel times (where workers are, under their “own time” travelling to a remunerated activity – namely their job), we shall focus on the relative productivity and value of “personal” travel in this section since it is a relatively more straightforward affair to calculate work/freight travel productivity given that the costs and prices for this type of travel are made explicit in the market.
Individual values for time consumed by travel are assumed to be less productive than work time – typically much less productive and in some cases tending to being unproductive. Hence the view that travel time delays (above free flow speeds) represent productivity “losses” that somehow should be recuperated by shortening travel time and converting it into more productive time use. Indeed, the view that travel time “savings” convert non-productive time to productive time is one that underpins many government transport project appraisal schemes.
National and regional governments may take a particular interest is this aspect because they are concerned to ensure that congestion on the roads does not adversely impact on national and regional economies or on potential productivity improvements.
However, while many travellers may find travel time to be unproductive and especially so when it is unexpectedly lengthened, it is not at all clear that all travel time is as unproductive – or as little valued by roadway users – as has often been assumed in the past.

142 – CONCEPTUAL FRAMEWORKS FOR ASSESSING CONGESTION AND ITS IMPACTS
MANAGING URBAN TRAFFIC CONGESTION – ISBN 978-92-821-0128-5 - © ECMT, 2007
For example, work undertaken by a number of researchers11 has underscored the existence of a non-negligible set of travellers who, for various reasons, value travel time positively – or at least not as negatively as has been assumed in the past. The reasons for this are numerous but centre on the fact that travel time is increasingly being used more productively (as viewed by the traveller) than in the past. Such personally rewarding activities or work-productive activities might include listening to the radio (witness the popularity of morning drive-time radio broadcasts), listening to music, mentally preparing for work, grooming, eating, reading, socialising, communicating via telephone or e-mail or undertaking productive work with a laptop computer. Certainly, not all of these activities can be undertaken while driving a car.
Certain researchers, such as Lyons and Urry, postulate that the relative productivity of travel time varies by mode from counterproductive travel time (time use that not only carries no benefit in itself, but also has a negative impact – e.g. through stress – on time use beyond the trip in question), through varying degrees of productivity to ultra-productive travel time (where travel is more beneficial than had the time been used in another manner) (see Figure 5.9).
This hypothesis, if borne out by continued empirical work, could have important repercussions for congestion management policies as it has the potential to greatly reduce the predicted value-of-time related benefits of congestion management measures. This hypothesis also underscores the importance of incorporating some form of economic analysis (e.g. Benefit-Cost Analysis) in developing congestion management policies. Such approaches allow for trading off the benefits derived from travel (even in congested conditions) with the disbenefits congestion imposes, in the determination of “optimal” levels of congestion.
Figure 5.9. Illustrative Frequency Distribution of Travel Time Productivity by Mode: Passenger Travel
Travel time productivity
counter-productive more productiveless productive ultra-productive
bus
car train
Travel time productivity
counter-productive more productiveless productive ultra-productive
bus
car train
Source: Lyons, G. and Urry, J. (2005).
5.4.4. Travel Time Reliability and its Value
The principal goal of many traditional congestion management policies and approaches in the past has been the reduction or even eradication of congestion altogether in order to eliminate the travel time “losses” that occurred when travel speeds dropped below a threshold speed (often speed limits or at or near free-flow speeds). Such goals have led to a natural focus on system performance as measured by average travel speeds.
CONCEPTUAL FRAMEWORKS FOR ASSESSING CONGESTION AND ITS IMPACTS – 143
MANAGING URBAN TRAFFIC CONGESTION – ISBN 978-92-821-0128-5 - © ECMT, 2007
As noted in Chapter 1 however, it is not at all certain that users are singularly focused on travel speeds when judging the quality and performance of transport networks. Faster speeds are consistently valued highly by roadway users but the quality of the travel environment – and especially the predictability of travel times – are also valued as, if not more, highly.
Transport system reliability has emerged as one area where governments can both usefully and affordably address users’ expectations regarding roadway travel and where it is important for them to do so. This is especially true given that as congestion levels rise, reliability of travel may become a more important factor to consider than travel speeds – which in large metropolitan areas are often quite slow anyway.
Furthermore, when contemplating congestion management measures, roadway operators can gain much by considering the cost-effectiveness of policies targeting travel time reliability. As noted by R. Noland:
Policymakers have generally focused on reducing average travel times to benefit travellers and society as a whole. This has resulted in capacity additions to existing highways, which can be a very costly undertaking, especially in congested urban areas. Capacity additions tend not to reduce peak congestion levels, although they do allow commuters to benefit from reduced schedule delay. If highway capacity additions also reduce the variability of travel times, and hence uncertainty, the benefits of highway capacity additions may be substantially greater than when those benefits are measured only from travel time reductions. However, other policies that reduce the variance of travel times may be significantly less costly than adding capacity and may not be as controversial or as damaging to the local environment. For example, increasing the level of detection of incidents that block capacity perhaps through electronic surveillance and rapid removal of those incidents can significantly reduce travel time variance.12
The impact of reduced travel-time predictability is felt primarily through its impacts on road users’ travel time budgets. These are largely conditioned by scheduling constraints imposed by daily activities. While this may be less true for leisure-related trips where scheduling constraints may be weaker, it certainly holds for commuting trips (conditioned by the work day) and freight/business travel (conditioned by work constraints and delivery windows). Given that the economic analysis of congestion shows that in many circumstances the optimal level of traffic on roads might include some travel in “congested”, stop-and-go conditions, what can be done about the quality of travel on the roadway as expressed by the predictability and reliability of traffic conditions?
The negative impact of travel time unpredictability stems from the fact that roadway users must add time buffers to their travel scheduling in order to ensure that they can, even in the worst travel conditions (or at least an acceptable percentage of trips), arrive at their destinations “on time”. This adaptive behaviour makes intuitive sense and has been noted in a number of empirical studies of travel behaviour13. However, because travellers cannot predict when trips will be shorter than their time buffers – and therefore cannot plan for them – realised time “savings” may be difficultly transformed into productive and/or useable time (with the caveat of the relative productivity of travel time outlined in Section 5.4.3.3).
144 – CONCEPTUAL FRAMEWORKS FOR ASSESSING CONGESTION AND ITS IMPACTS
MANAGING URBAN TRAFFIC CONGESTION – ISBN 978-92-821-0128-5 - © ECMT, 2007
Methods for Valuing Travel Time Reliability
Mean versus variance approach. Unreliability is measured as the standard deviation (or variance) of the travel time distribution. Data for the valuation of the standard deviation can be obtained by including in a stated preference survey both a representation of the variance and the mean travel time as attributes.
A utility function is specified that includes the mean journey duration as well as the variance (or the standard deviation) of the journey duration. Parameters for both variables are estimated, usually on stated preference data. In the stated preference interviews, respondents are not shown the variance of travel time as such, because this is recognised as too difficult a concept for a large number of respondents. Instead, each choice alternative contains as attribute, besides average travel time and maybe travel costs, a set of 5-15 possible journey durations (sometimes presented graphically). Average journey time and the variation in travel time presented in the stated preference survey can be constructed such that between observations they are not or only lightly correlated. Because both attributes are presented to the respondents in the stated preference survey and vary more or less independently, no double-counting will occur when in a cost-benefit analysis one would include travel time and reliability gains, with values for both coming from the stated preference survey.
From the estimated model, the ratio of the coefficient for the standard deviation to the coefficient for the mean travel time can be calculated. This gives the disutility of a minute standard deviation of travel time in terms of minutes of mean travel time. A monetary value for unreliability can be derived by combining this with a value of travel time (or directly if travel cost is also in the utility function). For the application of these outcomes in practical CBA’s of transport projects it is necessary that not only the change that the project causes in expected (mean) travel times is predicted, but also the change in the standard deviation of travel time.
Percentiles of the travel time distribution. Unreliability is measured as the difference between the 80th or 90th percentile of the travel time distribution and the median or 50th percentile. Again the valuation can be derived from stated preference experiments among travelers.
This method is closely related to the mean versus variance approach. Unreliability is measured and valued as the 90th percentile of the travel time distribution minus the median (or the 80th percentile minus the median). The left-hand side of the travel time density (shorter than average travel times) is not used, this is regarded as being of little value to the travellers. The 80th or 90th percentile indicates a considerable delay, but the most extreme journey durations are not considered, these are seen as outliers. To obtain a value for unreliability measured like this, models need to be estimated on stated preference, revealed preference or combined stated/revealed preference data, in which travel time and the measure of unreliability are separate variables. Again, use of both values in a CBA will not imply double-counting.
Scheduling models. Unreliability is measured as the number of minutes that one will depart or arrive earlier or later than preferred (schedule delay). This can also be offered as an attribute in a stated preference experiment, together with other attributes such as journey duration and travel cost.
In scheduling models, unreliability is measured as the number of minutes that one will depart or arrive earlier or later than preferred (schedule delay). This can also be offered as an attribute in a stated preference experiment, together with other attributes such as journey duration and travel cost. These models are based on work by Vickrey (1969) and Small (1982). The monetary values obtained for being early or late are very difficult to implement in a CBA framework, because the link to travel time period choice is not made in the CBA (there is no reference to clock time, only to journey durations), and the preferred arrival times are unknown.
Source: From Warffemius, P. (2005).

CONCEPTUAL FRAMEWORKS FOR ASSESSING CONGESTION AND ITS IMPACTS – 145
MANAGING URBAN TRAFFIC CONGESTION – ISBN 978-92-821-0128-5 - © ECMT, 2007
However, for travel time variability to be effectively targeted and accounted for in congestion management policies, variability must be measured and, at least from the perspective of determining what level of variability is acceptable to users, be assigned a value useable in cost-benefit exercises.
As seen in chapter 1, there are no standard measures of reliability as there are for value of time. The main reason for this is that the definition – and measurement – of reliability differs widely across countries and regions ... when it is defined or measured at all. Furthermore, some researchers have sought to capture the value of reliability via different methods leading to difficultly comparable results (e.g. some by explicitly trying to capture value of reliability, others by specifying the value of schedule delay and yet others by seeking to capture the value of generalised scheduling costs – see box for examples of some methods used).
One study seeking to capture the value of reliability for travellers along one particular highway corridor in southern California found that the value of reliability was consistently greater than the value of travel time. Table 5.1 below summarises the findings.
Table 5.1. Value of Travel Time and Value of Reliability
Household Income Value of Travel Time
$/hour $/minute 15 000 2.64 0.04 35 000 3.99 0.07 75 000 5.34 0.09 95 000 6.70 0.11 over 95 000 8.05 0.13
Trip Type and Income Value of Reliability
$/hour of stand. dev. $/minute of stand. dev. Work trip, lower income 13.20 0.22 Work trip, higher income 15.60 0.26 Non-work trip, lower income 10.20 0.17 Non-work trip, higher income 12.60 0.21 Value of travel time for average trip length and median household income = $5.30/hour.
Value of reliability for average trip length and median household income = $12.60/hour of standard deviation.
Source: NCHRP (1999).
Subsequent studies in the United States have been more nuanced partially because of the difficulty in adequately accounting for, and isolating the impacts of, heterogeneity in users’ value for both time savings and reliability.
A follow up study found that reliability on the SR 91 corridor in Southern California (as measured as the difference between the 90th and 50th percentile travel times) was valued at approximately 95-140% of median travel time, depending on the baseline measure14.
Another review of travel reliability/travel time ratios found a value of 1.3 to be a plausible figure15 – a finding contrasted by the estimation of a panel exercise in the Netherlands which suggested a more conservative figure for the value of reliability (as expressed in minute of standard

146 – CONCEPTUAL FRAMEWORKS FOR ASSESSING CONGESTION AND ITS IMPACTS
MANAGING URBAN TRAFFIC CONGESTION – ISBN 978-92-821-0128-5 - © ECMT, 2007
deviation) to be only 80% of the value of travel time – albeit acknowledging that higher values of reliability may be justified in certain cases.16
In the Ile de France (Paris) region of France, a survey undertaken in 2000 found that while average values of time could be estimated at €12.96/hr, values of time for early arrival and late arrival (and thus a proxy for the value of reliability) were found to be €8.61/hr and €30.22/hr, respectively – thus the value of reliability (as measured against late arrivals) can be seen as being more than twice the value of travel time.17
A recent stated choice experiment investigating the value of time and reliability among a sample of Dutch commuters facing congestion found that the value of reliability, expressed by proxy as the monetary value for schedule non-adherence (for both early arrivals and late arrivals) found that reliability is also often valued more than the value of travel time, especially for shorter trips and for lower incomes as illustrated in Table 5.2 below. This finding holds true for both early arrivals and late arrivals, although the latter are typically valued as being more costly to road users.
Table 5.2. Value of Travel Time and Variability: Dutch Commuters Facing Congestion
VOT* (euro/hr)
VSNA-E** (euro/hr)
VSNA-E/VOT
VSNA*** (euro/hr)
VSNA-L/VOT
Trip Length 30km or less 6.31 14.82 2.35 19.80 3.14 Between 30-60km 6.20 9.47 1.53 11.23 1.81 60km or more 10.78 11.18 1.04 9.18 0.85 Income (household/year) 28 500 or less 4.88 14.29 2.93 18.74 3.84 28 500 to 45 000 6.08 11.30 1.86 16.79 2.76 45 000 to 68 000 12.31 9.75 0.79 10.56 0.86 68 000 or more 10.10 12.41 1.23 12.02 1.19 *VOT = Value of Time.
**VSNA-E = Value of schedule non-adherence – early arrival.
***VSNA-L = Value of schedule non-adherence – late arrival.
Source: Tseng, Y-Y., Ubbels, B. and Verhoef, E. (2005), “Value of Time, Schedule Delay and Reliability: Estimation Results of a Stated Choice Experiment Among Dutch Commuters Facing Congestion”.
It is also interesting to note the finding, echoed in other studies18, that both value of time and reliability seem to drop off as distances increase possibly explained by a self-selection of travellers where longer-distance commuters have lower values of times or are willing to put up with longer travel/increased unreliability in return for other amenities such as lower housing costs. Another factor to account for is variability as a function of the base travel time. An increase of 10 minutes on a 10 minute trip is probably regarded as more critical than an extra 10 minutes on a 50 minute trip.
Businesses also value reliability greatly – especially as they face time-bound logistics constraints that can be greatly disrupted by unreliable travel. For instance, one study looking at the value that a group of UK managers place on the variability of travel times found that, on average, these managers would pay €1.26 per minute and per trip to reduce the variability in travel times.19

CONCEPTUAL FRAMEWORKS FOR ASSESSING CONGESTION AND ITS IMPACTS – 147
MANAGING URBAN TRAFFIC CONGESTION – ISBN 978-92-821-0128-5 - © ECMT, 2007
Table 5.3. Value of Travel Time/Operating Costs vs. Delay Costs by Industry Sector
Reliability Costs Industry/ Delivered Product
User Cost per hour. (Value of Time+ Operating Cost) per min per hour
Value of Shipment
Agriculture $25.07 $7.00 $420.00 $16 764.55 Mining $25.04 $0.83 $49.80 $5 469.32 Manufacturing $25.66 $11.20 $672.00 $34 681.55
Source: Weisbrod, G., Vary, D. and Treyz, G. (2003), “Measuring the Economic Costs of Urban Traffic Congestion to Business”.
Another study20 in the US measuring the costs of congestion to businesses calculated composite direct user costs (value of time and operating costs) and reliability costs for truck trips by origin and destination pairs in Chicago (1 669 zones) and Philadelphia (1 510 zones). Table 5.3 shows the composite values found by industry sector as well as composite shipment value for reference. Here again, the importance of reliability is apparent.
5.4.5. What Other Types of Impacts Should be Included in the Assessment Process? Indirect Impacts of Congestion
While many transport policies consider congestion as a purely internal phenomenon of the transport sector, there are many impacts – external impacts – that fall outside of transport. Accordingly, the impacts of congestion on people other than the sole users of the roads (as passengers, drivers or those carrying out some commercial activity) should be integrated into the assessment of the impacts of congestion and the elaboration of congestion management strategies.
From political and policy viewpoints, as well as analytical viewpoints, it is important to understand who is impacted by congestion – and to what extent.
The public’s concerns with congestion are often expressed in terms of travel time and associated restrictions on their daily activities. Businesses often express concerns related to loss of productivity and impacts on their costs and supply reliability. One of the basic problems when determining these impacts comes from the need to account for the marginal burden imposed by congestion over and above what can be considered “normal” or “acceptable” traffic levels. Typically, however, congestion costs are likely to continue to rise in the next 10 to 15 years and thus the relative impact of congestion on non-road users is likely to increase.
The resource costs associated with congestion and the marginal emissions/environmental impacts above and beyond “normal” traffic patterns are also subject to the problem of determining appropriate congestion “thresholds”. For example, in order to evaluate congestion management policies, noise pollution must be accounted for only in the part corresponding to the difference between normal driving conditions and driving conditions in congestion.
However – as seen in the preceding sections – while the physical measures of speed, flow and density can be considered objectively, the cost to individuals and businesses and the “burden” of congestion largely stem from subjective values assigned to the impacts of congestion on them i.e. travel time and travel reliability.

148 – CONCEPTUAL FRAMEWORKS FOR ASSESSING CONGESTION AND ITS IMPACTS
MANAGING URBAN TRAFFIC CONGESTION – ISBN 978-92-821-0128-5 - © ECMT, 2007
Generally, there are those who are directly involved in traffic flow and then there are those are indirectly exposed to the consequences of congestion. It is easy to understand who is represented in the former category, which includes business as well as private users. The latter group includes the rest of the road or street users (road is considered here as the physical space in the city in all its extension: roadways, sidewalks, adjacent buildings, etc.) as well as those impacted through schedule delays and non-adherence triggered by congestion, and in particular those carrying out commercial activities and those providing highly time-sensitive services (police, ambulance and fire).
The range of congestion impacts experienced both directly and indirectly is summarised in Table 5.3, which also provides some qualitative assessment of these impacts.
Table 5.3 qualitatively summarises “who suffers what impacts and in which degree” from congestion. In this framework, those impacted are categorising as either being in the traffic flow or outside of it – which is equivalent to considering a division between directly and indirectly impacted.
The following sections will examine 5 of the principal classes of indirect impacts of congestion with an eye to distinguishing between those impacts attributable to travel generally and those impacts attributable to travel in congested conditions. The five classes of impacts are:
• Congestion impacts relating to environmental quality and resource use.
• Congestion impacts relating to stress and road safety.
• Congestion impacts on regional productivity.
• Congestion impacts on business productivity.
• Congestion impacts on household scheduling.
5.4.5.1. Environmental and Resource Impacts of Congestion
The environmental and resource impacts of congestion are closely linked to the overall environmental impacts of road travel – especially as these are directly concerned with vehicle operation. Thus, determining the marginal environmental impacts of congestion requires some definition of a congestion benchmark (reference situation) which then allows the determination of additional impacts.
Energy Consumption
Congested urban traffic results in an increase of time spent in traffic along with an associated increase of the specific fuel consumption of the vehicles caught in traffic. This increase in fuel consumption can be up to a factor 2 at low speeds given that vehicles have to engage in numerous energy-consuming re-accelerations. Indeed most conventional vehicles have a minimum fuel consumption at intermediate average speeds – around 60-80 km/h - and increased fuel consumption at low and high speeds. This holds true for engines of different capacity ratings as well as for diesel versus petrol vehicles (see Figure 5.11). Thus, congested conditions increase resource usage in terms of fuel consumption.

CONCEPTUAL FRAMEWORKS FOR ASSESSING CONGESTION AND ITS IMPACTS – 149
MANAGING URBAN TRAFFIC CONGESTION – ISBN 978-92-821-0128-5 - © ECMT, 2007
Table 5.3. Qualitative Panorama of Congestion Impacts
Vehicle related impacts
Persons related impacts Business related impacts
CONGESTION IMPACTS
Incr
ease
of
fuel
con
sum
ptio
n
Incr
ease
of
mai
nten
ance
of
the
vehi
cle
Veh
icle
dam
ages
(du
e to
the
incr
ease
of
acci
dent
)
Per
sona
l dam
ages
(du
e to
the
incr
ease
of
acci
dent
)
Incr
ease
of
envi
ronm
enta
l po
lluti
on
Incr
ease
of
nois
e po
lluti
on
Stre
ss
Incr
ease
of t
rave
l tim
e (p
erso
ns)
Lac
k of
pun
ctua
lity
Jour
ney
relia
bilit
y (i
ncre
ase
of s
ched
uled
tim
e)
Incr
ease
of t
rave
l tim
e (g
oods
)
Los
s of
pro
fita
bilit
y of
em
ploy
ees
Car drivers D D D D D D D D D D
Car passengers D D D D D D D
Motorcycle drivers D D D D D D D D D D
Motorcycle passengers D D D D D D D
Pri
vate
veh
icle
s
Non-motorized users (bicycles) D D D D D D D D D
Public transport drivers D D D D Public transport passengers D D D D D D D
Taxi drivers D * D * D D D D Pub
lic
tran
spor
tati
on
Taxi passengers D D D D D D D Employees that earn a salary D D D D Employees that are paid for journey D D D D D D
Autonomous workers D D D D D D D D D D D*
INSI
DE
TH
E T
RA
FF
IC F
LU
X
Bus
ines
s ac
tivi
ties
Drivers of emergency services D D D D D
Roadside residents I I I I
Sidewalk users I I
Per
sona
l ac
tivi
ties
Rest of residents of the city I I
Roadside businesses I* I* I* I I I*
Roadside offices I I
WH
O I
S IM
PA
CT
ED
BY
CO
NG
EST
ION
? O
UT
SID
E T
HE
TR
AF
FIC
F
LU
X
Bus
ines
s ac
tivi
ties
All businesses outside the congested area I* I* I* I I* I
Categories used to evaluate congestion costs Operation costs
Other costs (in most cases considered as transport
externalities) Costs of time loss
Level of impact Null Low Medium High Very high Tipus of impact
D Direct I Indirect
(*) impact that only appears if they use own vehicles
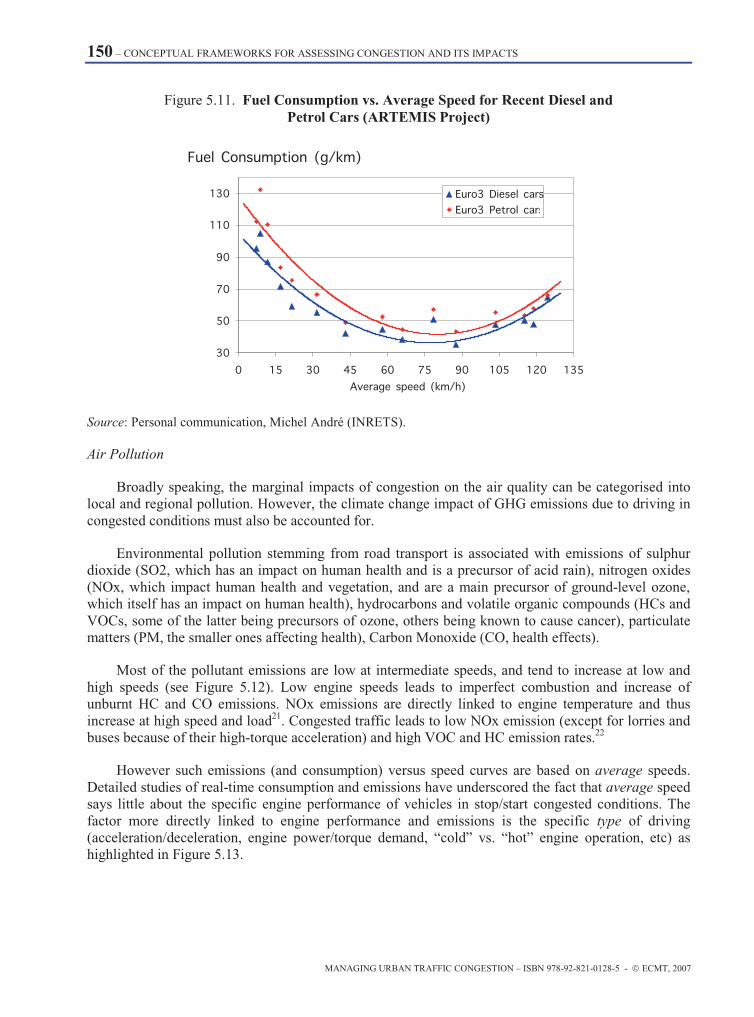
150 – CONCEPTUAL FRAMEWORKS FOR ASSESSING CONGESTION AND ITS IMPACTS
MANAGING URBAN TRAFFIC CONGESTION – ISBN 978-92-821-0128-5 - © ECMT, 2007
Figure 5.11. Fuel Consumption vs. Average Speed for Recent Diesel and Petrol Cars (ARTEMIS Project)
Fuel Consumption (g/km)
30
50
70
90
110
130
0 15 30 45 60 75 90 105 120 135
Average speed (km/h)
Euro3 Diesel cars
Euro3 Petrol cars
Source: Personal communication, Michel André (INRETS).
Air Pollution
Broadly speaking, the marginal impacts of congestion on the air quality can be categorised into local and regional pollution. However, the climate change impact of GHG emissions due to driving in congested conditions must also be accounted for.
Environmental pollution stemming from road transport is associated with emissions of sulphur dioxide (SO2, which has an impact on human health and is a precursor of acid rain), nitrogen oxides (NOx, which impact human health and vegetation, and are a main precursor of ground-level ozone, which itself has an impact on human health), hydrocarbons and volatile organic compounds (HCs and VOCs, some of the latter being precursors of ozone, others being known to cause cancer), particulate matters (PM, the smaller ones affecting health), Carbon Monoxide (CO, health effects).
Most of the pollutant emissions are low at intermediate speeds, and tend to increase at low and high speeds (see Figure 5.12). Low engine speeds leads to imperfect combustion and increase of unburnt HC and CO emissions. NOx emissions are directly linked to engine temperature and thus increase at high speed and load21. Congested traffic leads to low NOx emission (except for lorries and buses because of their high-torque acceleration) and high VOC and HC emission rates.22
However such emissions (and consumption) versus speed curves are based on average speeds. Detailed studies of real-time consumption and emissions have underscored the fact that average speed says little about the specific engine performance of vehicles in stop/start congested conditions. The factor more directly linked to engine performance and emissions is the specific type of driving (acceleration/deceleration, engine power/torque demand, “cold” vs. “hot” engine operation, etc) as highlighted in Figure 5.13.

CONCEPTUAL FRAMEWORKS FOR ASSESSING CONGESTION AND ITS IMPACTS – 151
MANAGING URBAN TRAFFIC CONGESTION – ISBN 978-92-821-0128-5 - © ECMT, 2007
Figure 5.12. Traffic Emissions vs. Average Speed (UK DfT)
UK - 2005 Traffic pollutant emission(10% Heavy duty trucks)
0
1
2
3
4
5
6
0 50 100 150
Average speed (km/h)
emission(g/km)
0
100
200
300
400
500
600
CO2 emissionCO2 emissionCO2 emissionCO2 emission(g/km)(g/km)(g/km)(g/km)
NOx
PM10 x 10
CO
NMHC
CO2
Source: UK Department for Transport.
Figure 5.13. Influence of Different Traffic Conditions on the Pollutant Emissions (ARTEMIS Research Project)
Euro 3 Diesel cars
0,0
0,4
0,8
1,2
1,6
Urban
, Sto
p&go
Urban
, Con
geste
d, sto
ps
Urban
, Con
geste
d, lo
w spee
dsUrb
an, D
ense
Urban
, Fre
e-flo
wing
Rural,
Uns
teady
Rural,
Stea
dy
Rural,
Main
road
s, un
stead
y
Rural,
Main
road
sM
otor
way, U
nstea
dyM
otor
way
Traffic condition
NOx emission (g/km)
Source: Personal communication, Michel André (INRETS).
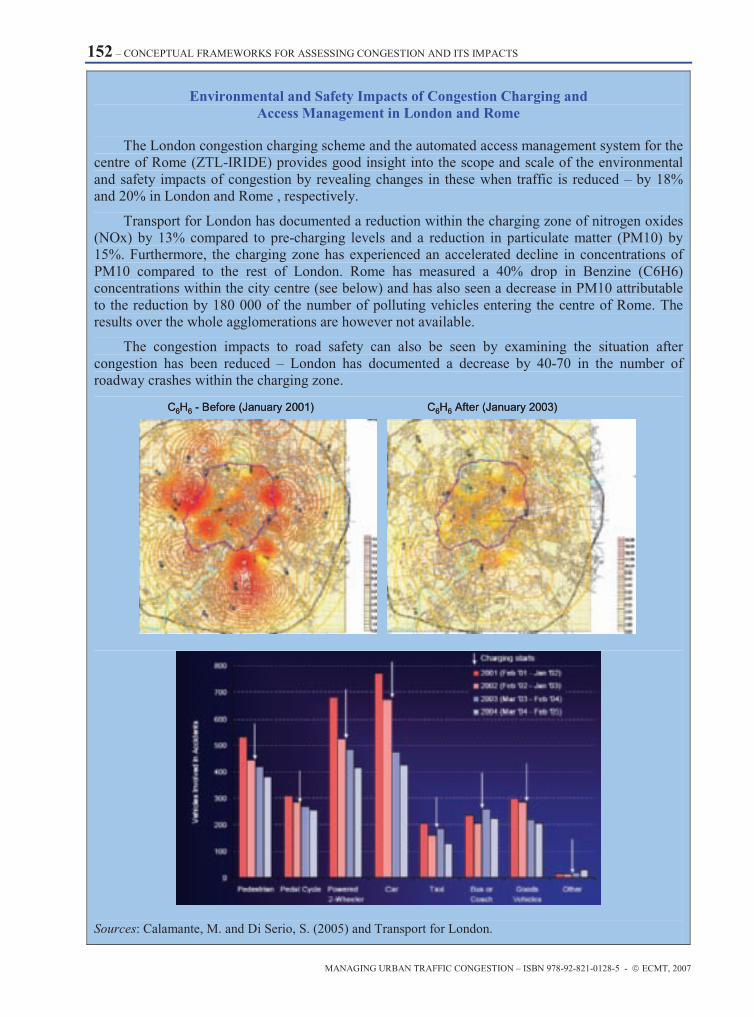
152 – CONCEPTUAL FRAMEWORKS FOR ASSESSING CONGESTION AND ITS IMPACTS
MANAGING URBAN TRAFFIC CONGESTION – ISBN 978-92-821-0128-5 - © ECMT, 2007
Environmental and Safety Impacts of Congestion Charging and Access Management in London and Rome
The London congestion charging scheme and the automated access management system for the centre of Rome (ZTL-IRIDE) provides good insight into the scope and scale of the environmental and safety impacts of congestion by revealing changes in these when traffic is reduced – by 18% and 20% in London and Rome , respectively.
Transport for London has documented a reduction within the charging zone of nitrogen oxides (NOx) by 13% compared to pre-charging levels and a reduction in particulate matter (PM10) by 15%. Furthermore, the charging zone has experienced an accelerated decline in concentrations of PM10 compared to the rest of London. Rome has measured a 40% drop in Benzine (C6H6) concentrations within the city centre (see below) and has also seen a decrease in PM10 attributable to the reduction by 180 000 of the number of polluting vehicles entering the centre of Rome. The results over the whole agglomerations are however not available.
The congestion impacts to road safety can also be seen by examining the situation after congestion has been reduced – London has documented a decrease by 40-70 in the number of roadway crashes within the charging zone.
C6H6 - Before (January 2001) C6H6 After (January 2003)C6H6 - Before (January 2001) C6H6 After (January 2003)
Sources: Calamante, M. and Di Serio, S. (2005) and Transport for London.

CONCEPTUAL FRAMEWORKS FOR ASSESSING CONGESTION AND ITS IMPACTS – 153
MANAGING URBAN TRAFFIC CONGESTION – ISBN 978-92-821-0128-5 - © ECMT, 2007
Thus, to properly estimate the marginal emissions and marginal fuel consumption due to traffic congestion, one must account for factors such as the prevailing type of traffic pattern (stop-and-go driving, stops and accelerations, queue duration), or the localisation (congestion near the trip origin or destination), in addition to travel speed.
Modern gasoline engines are also able to call for extra fuel (enrichment) to ensure peak power during periods of high engine load, to prevent engine knocking when the engine is not sufficiently warmed and to power accessories such as air conditioning. Operation during enriched conditions (e.g. strong acceleration from idle as happens in stop-and-go traffic) results in greater CO emissions as not enough oxygen is available to oxidise the fuel into CO2. Fuel-rich operation also contributes to greater VOC and HC emissions as these are not fully burnt in the cylinder. Short distance driving in urban conditions exacerbates these problems as catalysts are not sufficiently warm to capture these pollutants.23
Another important point to note related to the impact congestion may have on emissions of pollutants is that standard test cycles that serve to homologate and thus to optimize vehicles as regard pollutant emissions do not represent typical urban travel patterns24. Because they tend to over-represent un-bound traffic conditions and under-represent the low-speed acceleration/decelerations patterns that characterise stop-and-go traffic, these test cycles have tended to misrepresent emissions from real urban traffic conditions. HC and VOC emissions are likely to be underestimated and NOx emission rates over-estimated through these cycles.
Traffic flow is also an important factor to consider when seeking to understand the emissions impact of congestion. One study looking at the impact of free flowing versus congested stop-and-go traffic in a constrained “street canyon” found that under flowing traffic conditions (speeds above 50 km/h), higher volumes of vehicles cause increased ambient pollution levels and higher speeds cause an increase in NOx concentrations. Decreased average speeds from 50 km/h to 35-40 km/h along with high traffic volumes also increase NOx concentrations but these concentrations remain stable for speeds under 35 km/hr.25
Climate change is mainly associated to the emission of carbon dioxide (CO2) due to the combustion of hydrocarbons, and to greenhouse gases (such as Methane – CH4 - usually expressed in CO2 equivalents). Again, as the emission of CO2 from the vehicles is directly linked to its fuel consumption, the marginal climate change impacts of driving in congested conditions are a result of the duration of congested travel as well as the engine load characteristics of driving in congested conditions.
Noise Pollution
Noise is known to be one of the most annoying local pollutants. Since traffic is one of the most important sources of noise in urban areas, it is not a surprise that it is mentioned as the main nuisance in most urban surveys. It directly deteriorates the quality of life in the city, especially in the cases of people living in homes close to a roadway.
Noise produced by vehicles comes from two different sources: the motor (which produces noise even if the vehicle is stopped) and the movement of the vehicle (rolling and aerodynamic effects). Some parameters that play a part in vehicle noise emissions are: the road lay-out, its gradient, the pavement condition and characteristics, the type of vehicle and its motor, driving and traffic fluidity.
The rolling and aerodynamic related noise decreases with the driving speed, while the engine noise (although it is also reduced) becomes the main cause of nuisance. Besides, in congestion

154 – CONCEPTUAL FRAMEWORKS FOR ASSESSING CONGESTION AND ITS IMPACTS
MANAGING URBAN TRAFFIC CONGESTION – ISBN 978-92-821-0128-5 - © ECMT, 2007
conditions we must consider the noise due to the successive stops and accelerations of the vehicles, in addition to the noise produced by immoderate use of the car horn.
The negative effects of noise on people vary but as far as congestion is concerned, it is the stress triggered by traffic noise that is most important.
There are also effects on the rest of the systems in the human body: cardiovascular apparatus (alterations related to arterial hypertensions, heart attack, etc.), respiratory apparatus (increase of the respiratory frequency), digestive apparatus (alterations over stomach movements), endocrine system (increase of sugar in blood, etc.), visual apparatus (diminution of visual acuity, etc.) and the nervous system (insomnia, diminution of attention, etc.).
In addition, noise from congestion can also have an indirect impact on property values for land and buildings adjacent to congested roads.
5.4.5.2 Impacts of Congestion: Stress and Road Safety
Congestion Impacts on Stress
Stress can be defined as a pattern of physiological, behavioural, emotional and cognitive responses to “stressors”. Those “stressors” are stimuli that are perceived as blocking a goal (e.g. getting to a destination on time) or endangering or threatening our well-being. In the former case, unreliable traffic can contribute greatly to stress and thus has an important impact on users’ discomfort in unpredictable traffic flows.
Long-term exposure to “stressors” is known to have negative effects on both psychological and physical health. In extreme cases, stress can lead to important psychic and physical trouble such as: headache, depression, irritability, insomnia, digestive problems, etc.
Driving in congested traffic flows is known to be an important “stressor”. Drivers can develop different behaviour patterns due to stress and can increase their own (and others’) stress levels. Some examples are: tailgating, aggressive driving; honking of horns, accelerating and braking abruptly, not concentrating on the road (e.g. looking at the time) or talking to other drivers. Stressful situations can be also dangerous, with drivers breaking road rules and the subject of traffic offences. Congestion may lead to driver behaviour that can disturb traffic and increase stress levels for other roadway users.
The psychological reactions due to prolonged exposure to stress fall basically into three stages:
• Alarm – it can be seen as a positive stage, since all vital functions are increased, however this can also lead to aggressiveness, impatience, reckless driving or low respect for traffic rules.
• Resistance – promotes aggressive behaviour.
• Exhaustion – elevated heart-rate and muscular tension, headache, risk of fatigue, reduced concentration and reduced capacity to perceive information.
Research has consistently found driving in congested conditions to be an important physiological stress factor. A recent review summarising these research findings concluded that driving in congested traffic raises psycho-physiological stress, contributes to absenteeism and low job satisfaction, is associated with negative emotions (irritation, frustration, anxiety and general annoyance), contributes to decreased task motivation after exposure, and increased feelings of helplessness after exposure to uncontrollable circumstances.26 These findings are further supported by investigations and the

CONCEPTUAL FRAMEWORKS FOR ASSESSING CONGESTION AND ITS IMPACTS – 155
MANAGING URBAN TRAFFIC CONGESTION – ISBN 978-92-821-0128-5 - © ECMT, 2007
discovery of increased secretion of stress-related compounds such as salivary cortisol in commuters facing congestion.27
Also, it is worth pointing out that certain persons might be taking medications (to avoid stress effects) that can increase driving risks in certain cases.
Therefore, as one of the important impacts of traffic congestion (even if it is very difficult to evaluate its economic cost), stress can lead to adverse impacts of behaviour in traffic.
Congestion Impacts on Road Safety
Safety is also an important issue to examine in relation to congested traffic in urban areas primarily due to the combination of high vehicle densities (and reduced headways) and the stress engendered by congested driving conditions.
Crashes in congested conditions tend to occur at slower speeds and therefore are characterised by fewer casualties. However, the probability of a crash is higher in congested traffic due to close following distances and unexpected stops and starts of other vehicles. Hence, while the cost declines, the probability increases and the impact on the expected accident cost is difficult to determine.
In order to determine the effects of crashes related to congestion in urban areas, one must first determine the increase in the number of crashes due to the increase in congestion. This is difficult because it implies an exhaustive analysis of all accident reports produced in the studied area, which, apart from the complication of accessing these data (or even its existence), can be inapproachable from an operative point of view.
Once the number of incidents attributable to the increase in congestion is determined, one should consider the different parameters implied in these incidents. These include; the existence (and amount) of casualties in the accident, the existence (and amount) of injured, material damages caused both to vehicles implied and urban infrastructures (if needed), time loses associated to the worsening of traffic conditions in the point of the accident while not having remove all trace of it, the need for the assistance of certain public services (police, emergency medical services, firemen, breakdown vans, cleaning services, etc.) and the need created by the accident of following certain administrative and court procedures. The determination of each one of the mentioned parameters (even qualitatively) is very difficult, due to the subjectivity of effects such as the loss of productive capacity, psychological damages of family members, compensation from insurances, funerals and burials, etc.
5.4.5.3 Congestion Impacts on Regional Productivity
The impact that congestion has on regional economies is somewhat ambiguous. Cities derive advantages from agglomeration and density. However, these factors often contribute to a rise in congestion in urban transport networks that, in turn, erodes the benefits. Urban governance, at the regional level, requires a management approach that views congestion and agglomeration as linked elements in a continuum – urban regions should seek to maximise the benefits of agglomeration while minimising the disbenefits of congestion.
Because these two features of cities are linked, it is difficult to isolate the impact of congestion on regional economies absent some consideration or reference to the benefits of agglomeration.
Ultimately, regional productivity is tightly linked to the respective productivities of individual businesses, commercial sectors and households. The following sections treat each of these separately.
156 – CONCEPTUAL FRAMEWORKS FOR ASSESSING CONGESTION AND ITS IMPACTS
MANAGING URBAN TRAFFIC CONGESTION – ISBN 978-92-821-0128-5 - © ECMT, 2007
5.4.5.4 Congestion Impacts on Business Productivity
Congestion affects businesses not only through the direct impacts of additional fuel, labour and vehicle running costs, but also through downstream impacts on logistics chains. These impacts can be important and can reduce the overall benefits that businesses derive from locating in large urban markets. Tracking these impacts with some precision, however, has been a somewhat challenging exercise across OECD-ECMT urban regions. What then can be said about the economic and other impacts of congestion on businesses in urban areas?
The first thing is to recognise businesses face different types of congestion costs. As noted above, businesses incur additional costs relating directly to travel in congested conditions. This cost comprises the marginal labour and vehicle operating costs that are relatively easy to capture via the market value for hourly rates and pro-rata costs for fuel and vehicle maintenance. As congestion decreases, these costs to individual businesses decrease as well. However, if the decrease in congestion is accompanied by a shift in the scale and structure of the regional economy, the overall impact may be uncertain.
While on-road costs to businesses are relatively easy to capture, additional business costs and productivity impacts that are attributable to schedule delay and non-adherence are more difficult to ascertain.
Surveys of businesses have not been entirely satisfactory since many businesses do not expressly track the impacts of congestion on their own operations. One comprehensive US overview28 of congestion impacts on businesses identifies three reasons for this:
• Hypothetical Congestion Scenarios: Surveys will ask businesses should they face less or even no congestion. However, most businesses do not engage in hypothetical planning around alternative congestion scenarios since they view congestion as an immutable cost of business and certainly one that is out of their control.
• Self-Selection Bias: Surveys interview businesses that are still operating despite increased or increasing levels of congestion. Those businesses that could not adapt their behaviour, activities or otherwise absorb additional costs imposed by congestion have either moved away or failed.
• Differential Sensitivity: Directly related to the previous point is the fact that not all businesses are equally vulnerable to increased costs imposed by congestion. Some businesses that thrive on high-density urban areas may not even register the added costs related to congestion. Alternatively, some businesses may have greater flexibility than others in absorbing or otherwise compensating for these costs. Factors at play include industry structure, shipping and warehousing practices and even ownership patterns.
Because of these limitations relating to survey-based calculations of congestion-related business impacts beyond direct “on-road” costs, one might reasonably assume that these are likely underestimated and under-reported. These impacts can be broken out into three main categories:
• Logistics-related and business process-related productivity impacts.
• Market scale and accessibility impacts.
• Business costs of worker commuting.

CONCEPTUAL FRAMEWORKS FOR ASSESSING CONGESTION AND ITS IMPACTS – 157
MANAGING URBAN TRAFFIC CONGESTION – ISBN 978-92-821-0128-5 - © ECMT, 2007
Logistics-related and Business Process-related Productivity Impacts
The past thirty years have seen the rise of more flexible sourcing, production, and distribution processes that have increasingly shifted goods away from fixed inventory holdings such as on-site stocks and warehouses to more fluid and “just-in-time” delivery practises where the transport vehicle itself serves as a temporary warehouse. Increased inventory holding costs and decreased transport costs have largely been behind this shift that has greatly increased firms’ flexibility in responding to market demands.
While “just-in-time” is often used synonymously with “fast” or “speedy” delivery, the real value of this type of logistics process is that goods are delivered at the “right time” – that is, just as they are needed. This is an important distinction to make with regards to congestion impacts on firms operating “just-in-time” production lines. Travel times that are predictably slow can be accounted for with adequate buffer periods, however, unplanned delays, such as those engendered by unreliable travel conditions, have a significant impact on “just-in-time” processes and cause firms to increase costly on-site inventory holdings. This is especially true for sectors characterised by a large percentage of perishable, expensive or difficult to store goods (e.g. refrigerated foods, high value electronics and seasonal apparel).
Furthermore, certain business processes can exacerbate the impacts of unreliable travel and delayed shipments – in particular the wide-spread adoption by shippers of scheduled delivery “slots”. In effect, when a carrier fails to make a delivery to a shipper in an agreed-upon time window, the carrier will have to re-schedule the delivery for some later time – usually 24 hours later or more. Thus unreliable travel conditions impact carriers, as well as shippers.
There are numerous anecdotal examples of the scope of the impact of unreliable travel on businesses (see box) and several estimates of the cost that unreliable travel imposes upon businesses. One Dutch study of 230 carriers and shippers undertaken by Bozuwa and Hoen in 1995 estimated that the indirect logistics cost of congestion were 8-11% of its direct costs to the businesses concerned. Another study carried out for the International Road Transport Union found that the logistics costs of congestion were equal to 2.2 times the value of travel time for freight.29
It should be noted, however, that the impact of congestion on logistics processes and production cycles is one of several factors for potential delay. A comprehensive survey of food delivery in the UK examining over 3 500 trucks carrying out over 15 000 journey legs over a 48-hour period found that only 9% of all trips were delayed by congestion (see Figure 5.14). However, while congestion is the principal single source of delay (31%) when looking only at the 29% of all trips experiencing some form of delay, most delays are not caused by congestion. Internal or external business process breakdowns or inefficiencies were the principal source of delay in this survey. Congestion delays tend to get lost in the “noise” of other logistical inefficiencies. Thus, many companies can likely absorb increased congestion by improving their own, or their suppliers/partners, business processes. This is not to say that congestion is not important to these businesses – it clearly is a large burden, but only that businesses are likely to react to increased unreliability by focusing on areas where they exert some form of control.
Another factor to consider is the impact of congestion on business sectors that engage in time-based competition. Speed and reliability are two attributes that have become increasingly important in the delivery of goods and services – especially in retail sectors. Home delivery of goods within 24 to 48 hours is seen as a competitive edge for many retailers just as many service providers focus on even faster delivery of services (office machine repair, plumbing, etc.). Overall travel delays arising from congested travel have the potential to impact these sectors although because these businesses often
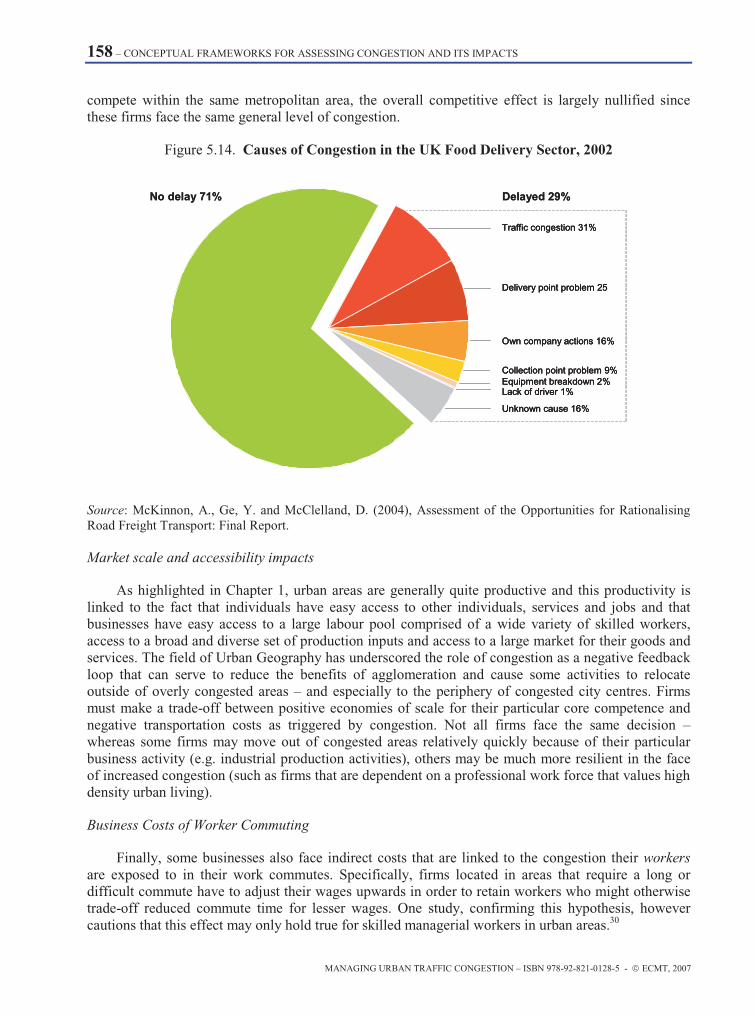
158 – CONCEPTUAL FRAMEWORKS FOR ASSESSING CONGESTION AND ITS IMPACTS
MANAGING URBAN TRAFFIC CONGESTION – ISBN 978-92-821-0128-5 - © ECMT, 2007
compete within the same metropolitan area, the overall competitive effect is largely nullified since these firms face the same general level of congestion.
Figure 5.14. Causes of Congestion in the UK Food Delivery Sector, 2002
No delay 71%
Traffic congestion 31%
Delivery point problem 25
Own company actions 16%
Collection point problem 9%Equipment breakdown 2%Lack of driver 1%
Unknown cause 16%
Delayed 29%No delay 71%
Traffic congestion 31%
Delivery point problem 25
Own company actions 16%
Collection point problem 9%Equipment breakdown 2%Lack of driver 1%
Unknown cause 16%
Traffic congestion 31%
Delivery point problem 25
Own company actions 16%
Collection point problem 9%Equipment breakdown 2%Lack of driver 1%
Unknown cause 16%
Delayed 29%
Source: McKinnon, A., Ge, Y. and McClelland, D. (2004), Assessment of the Opportunities for Rationalising Road Freight Transport: Final Report.
Market scale and accessibility impacts
As highlighted in Chapter 1, urban areas are generally quite productive and this productivity is linked to the fact that individuals have easy access to other individuals, services and jobs and that businesses have easy access to a large labour pool comprised of a wide variety of skilled workers, access to a broad and diverse set of production inputs and access to a large market for their goods and services. The field of Urban Geography has underscored the role of congestion as a negative feedback loop that can serve to reduce the benefits of agglomeration and cause some activities to relocate outside of overly congested areas – and especially to the periphery of congested city centres. Firms must make a trade-off between positive economies of scale for their particular core competence and negative transportation costs as triggered by congestion. Not all firms face the same decision – whereas some firms may move out of congested areas relatively quickly because of their particular business activity (e.g. industrial production activities), others may be much more resilient in the face of increased congestion (such as firms that are dependent on a professional work force that values high density urban living).
Business Costs of Worker Commuting
Finally, some businesses also face indirect costs that are linked to the congestion their workers are exposed to in their work commutes. Specifically, firms located in areas that require a long or difficult commute have to adjust their wages upwards in order to retain workers who might otherwise trade-off reduced commute time for lesser wages. One study, confirming this hypothesis, however cautions that this effect may only hold true for skilled managerial workers in urban areas.30

CONCEPTUAL FRAMEWORKS FOR ASSESSING CONGESTION AND ITS IMPACTS – 159
MANAGING URBAN TRAFFIC CONGESTION – ISBN 978-92-821-0128-5 - © ECMT, 2007
5.4.5.2. Congestion Impacts on Household Scheduling
Households typically operate on relatively constant daily schedules and the activities they undertake are constrained by the 24-hour available to them and the presence of large swaths of “fixed” time (principally sleep and work). All other activities are scheduled in the time that remains and insofar as congestion increases the time devoted to travel, it can reduce the duration or number of other activities in which household members can engage (e.g. spending time with family, food preparation, etc.). Households’ response to congestion (e.g. earlier departure) can also disrupt other household activities (e.g. eating breakfast together).
Anecdotal evidence the impact of increased congestion on household tends to indicate that family time, at least in the short run, is compromised by increased commuting time. For instance, a survey undertaken by the Washington State Family Council in the United States reports that “55% of those surveyed with children at home miss one or more family functions per week due to traffic congestion” and that 85% of those surveyed would spend more time with their families if they could spend less time in traffic.31
The issue of how much time households devote to transport in general and work travel in particular over time – that is, as they face increasing congestion – is not as straightforward as the anecdotal evidence might suggest. There is a long-held and well-supported view that households gravitate towards a steady travel time budget. Surveys in a number of countries have repeatedly uncovered a remarkable stability in the amount of time households devote to travel implying, perhaps, that households – at least in the long run – seem to make decisions that serve to keep their travel times more-or-less constant (e.g. by choosing home and work locations that keep travel constant over time). However, because most housing and work arrangements are fixed in the short run, one can see how increasing commute times may negatively impact time available for other activities. Even in the longer run, the postulated flexibility that households have in changing residence location might not be as straightforward as the theory might suggest – especially in areas with high housing costs, difficult access to real-estate financing, low availability of rental properties and 2-worker households.
Furthermore, there is evidence that while travel times may be constant on average, work-related travel within greater metropolitan areas has increased and/or that households have adjusted their other non-work related trips to account for longer-lasting work trips. Analysis undertaken on commute times in the Washington, DC metropolitan area by Levinson, Wu and Rafferty32 shows that work-related travel times have remained stable between 1988 and 1998 if one considers only the original metropolitan area. However, commute travel times have increased if one accounts for the expanded metropolitan area that characterises the 1998 survey. Likewise, work travel times in the Minneapolis-Saint Paul, also examined by Levinson et al can also be seen to have increased between 1990 and 2000. In both cases, congestion has contributed to the increase in travel times. Similarly, while overall travel time per capita in the Paris region can be seen to have remained relatively stable from 1976 to 2001 the average duration of the home-to-work and work-to-home trip has increased significantly. What has changed is the relative importance of the work trip in the overall mix of travel purposes with shorter non-work trips now dominating the mix.33
Finally, it should be noted that not all households are fully “captive” in the face of congestion. They have many options available to them that allow them to better cope with or avoid the impacts of congestion. Changing work schedules to leave earlier and come home earlier, flex-time work where an increase in daily work hours is compensated–for by an additional day off, other forms of flexible work arrangements and telework all are options that many individuals have available to them before considering a change of residence and/or job in response to longer peak-hour commutes.
160 – CONCEPTUAL FRAMEWORKS FOR ASSESSING CONGESTION AND ITS IMPACTS
MANAGING URBAN TRAFFIC CONGESTION – ISBN 978-92-821-0128-5 - © ECMT, 2007
5.5 Total Estimates of Congestion Costs
There is concern in many countries about the increase in congestion costs on individuals and business, encompassing increasing travel times, decreasing reliability and productivity, increasing pollution at low speeds, and other factors such as stress and vehicle wear and tear.
If policymakers are to do anything about congestion, it is because it is commonly understood that congestion imposes burdens on society and inefficiencies on business and individuals and they accept that congestion should be mitigated, or at least better managed, so that these burdens and inefficiencies are reduced.
A number of researchers and other interested parties have attempted to make total estimates of congestion costs in different cities or nationally. Usually these estimates of congestion cost are published and used to attract attention to a worsening of congestion in cities or to highlight an increase nationally in the level of congestion costs and adverse impacts (e.g. on individuals or business productivity), with the intention of promoting the need for action.
Alternative estimates have also been made which suggest that congestion costs are much lower – particularly in an economic sense – than others have estimated and lower that some lobby groups make them out to be.
The section gives consideration to the differences between the way in which such aggregate estimates are made and the way in which congestion costs are treated in the conceptual frameworks outlined earlier in this chapter and draws attention to some common methodological weaknesses which raise doubts about the validity and accuracy of many of the aggregate estimates which have been published.
5.5.1 Calculating the “Total Cost” of Congestion
Analysts regularly estimate the total costs of congestion. Estimates of up to or around 2% of GDP have been common over recent years. Alternative low estimates are typically well below 1% of GDP. Some observers have pointed out that it makes little sense to compare congestion costs to GDP as much of the cost is not included in GDP. Indeed, one might go further and say that as congestion increases, so too does GDP because of the higher cost of urban commercial travel.34
The first difficulty in making any estimate of the overall cost of congestion is that it requires reference to a benchmark value in order to capture the impacts of congestion. Often, analysts compare present day congested journey times in peak and off-peak periods against the times that would be possible on the same roads without any traffic delays. They then apply a value to these time savings and come up with a cost of congestion.
When such a methodology is used on a national basis, traffic congestion has been estimated to cost up to around 2% of GDP in different countries.
Typically, in the above estimates, by choosing as the reference value travel times without any delays, actual travel times are compared to ideal travel times that have no relevance to actual travel times in peak periods. Such travel times could only have been realised on roadways with no (significant) traffic. The difference between the two is somewhat imprecisely termed “delay” and the extra time taken by travellers to travel on the road segment in question, as time “loss”. These two terms are artificial constructs as explained below.
CONCEPTUAL FRAMEWORKS FOR ASSESSING CONGESTION AND ITS IMPACTS – 161
MANAGING URBAN TRAFFIC CONGESTION – ISBN 978-92-821-0128-5 - © ECMT, 2007
For time to be “lost” (e.g. in peak periods) one must have “had” it to start with. This would only have been the case if there had previously been situations with no traffic delays (in peak periods). For this to have been the case, the goal of transport policy would need to have been to ensure free-flow speeds at all hours of the day and all days of the year. Not only would such a policy because such an outcome would be unliveable (at least in urban areas) but also because such an outcome is simply unaffordable.
P. Goodwin succinctly summarises the problem with such static “total” estimates of congestion costs:
Statements of the form ‘congestion costs the economy £20 billion a year’, updated from time to time for inflation, are good for headlines, in dramatising a large problem. But the implied annual dividend of £1 000 waiting to be distributed to each family is a fiction. It is calculated by comparing the time spent in traffic now, with the reduced time that would apply if the same volume of traffic was all travelling at free flow speed, and then giving all these notional time savings the same cash value that we currently apply to the odd minutes saved by transport improvements.
But this could never exist in the real world – not for reasons of practical difficulty, but because it is internally inconsistent. If all traffic flowed at free flow speed, we can be quite certain there would be more of it, at least part of the time saved would be spent on further travel, and further changes would be triggered whose value is an unexplored quality. It is apparently a precise answer to a phantom question.35
Nevertheless, such an approach remains the mainstay of the calculation of aggregate congestion costs in many countries.
It is important, therefore, that aggregate congestion cost estimates based on congestion monitoring relative to free flow speeds should NOT be used as the basis for absolute estimates of overall congestion-related costs.
Similarly, as such estimates of the costs of congestion are conceptually unsound in an absolute sense, they should not be used as the basis for estimating congestion costs as a proportion of GDP.
In reality, to reinforce the point, differences between actual speeds and travel times on the one hand and “free flow” speeds and travel times, on the other hand, have no relevance in an absolute sense to real world circumstances or situations (e.g. peak periods). Instead, they could probably be seen as reflecting a perception that congestion is an absolute condition - rather than a relative phenomenon.
5.5.2 Use of Relative Congestion Costs
Clearly, it is not necessary to estimate the total costs of congestion in order to manage it better. What matters to policy makers is whether there are policies and measures that can be implemented that deliver benefits in excess of their costs.
The costs and benefits of policies to manage congestion better are no different from those which need to be measured and valued in the evaluation/appraisal of any other urban transport scheme. There
162 – CONCEPTUAL FRAMEWORKS FOR ASSESSING CONGESTION AND ITS IMPACTS
MANAGING URBAN TRAFFIC CONGESTION – ISBN 978-92-821-0128-5 - © ECMT, 2007
will be more attention paid to some of the benefits, such as improvements in reliability, but the general techniques and methods remain the same.
However, there can be additional value in relative comparison of such “total” cost estimates because they can be useful in tracking differences in congestion cost levels over time – as set out above – because the differences between them pick up the real differences in actual travel times, fuel and other resource costs. In such comparisons, the unrealistic free flow bases of the individual calculations disappear when the previous estimate is subtracted from the current estimate of overall congestion costs.
In summary, estimates of congestion costs based on divergences from “free-flow” speeds are of value in relation to assessments of congestion costs only when they are used to establish changes in estimates of congestion costs over time.
Chapter Summary and Policy Considerations
There still exists a tension between the different conceptual approaches used for addressing road congestion: traditional roadway operational approaches; and economically optimal congestion approaches.
Traditional approaches used by road administrations have typically focused on management of the road systems in urban areas in ways that maximise the ability of existing infrastructure to handle current and expected future traffic demand. Such operational approaches are well adapted to identifying the locations where bottlenecks exist. They aim to minimise traffic delays and the associated personal, business and resource impacts including personal and productive time lost, fuel wasted and adverse air quality. They allow administrations to highlight locations where action may need to be taken to respond to the actual delays experienced by users on a regular basis
Optimal congestion approaches consider demand for road space as well as supply and seek an “optimal” balance between the two. Economically optimal levels of congestion take into consideration not only the cost of road provision but also what people are ready to pay in order to use the road. Economically “optimal” levels of traffic not only entail a certain degree of congestion – as the term is commonly understood by roadway managers and users – but this “optimal” level of traffic can vary depending on levels of demand and other circumstances i.e. it is not related solely to the capacity of the infrastructure under consideration.
Importantly, the alternative operational and economic approaches to congestion are inconsistent - in the sense that, if applied in full, they would most likely lead to different levels of traffic on the roads i.e.:
• Where traffic demand is high, “natural equilibrium” traffic levels associated with flow and maximum throughput approaches would most likely be characterised by a high incidence of chronic congestion, unreliability and stop-go traffic conditions.
• Economically-optimal levels of traffic will be less than “natural equilibrium” traffic levels. They would likely be characterised by lower volumes and more acceptable travel conditions that avoid chronic stop/go congestion,
The survey undertaken confirmed that, at present, road administrations overwhelmingly use traditional operational approaches, based on maximising flows, to promote efficient infrastructure use. Economically optimal congestion approaches depend on congestion charges which have only been implemented in a limited number of locations. However, there is clearly increasing interest in price-based approaches. Where being considered, experience with price-based approaches in
CONCEPTUAL FRAMEWORKS FOR ASSESSING CONGESTION AND ITS IMPACTS – 163
MANAGING URBAN TRAFFIC CONGESTION – ISBN 978-92-821-0128-5 - © ECMT, 2007
different countries has highlighted that: many people are willing to pay in money rather than in time – and therefore would prefer to have an opportunity to do so; however, many other people are quite willing to pay in time what they are not willing to pay in money.
Maximising welfare. Having considered these contrasting conceptual frameworks in some depth, it is clear that traffic levels below “natural equilibrium” or “maximum throughput” levels are more likely to maximize welfare, because they explicitly take into account the additional costs that increasing levels of road usage impose on other users. This conclusion provides some conceptual support for traffic congestion mitigation measures that either:
• Improve traffic outcomes by exposing marginal users to the additional costs they impose on other road users; or otherwise.
• Adopt alternative measures to achieve lower volumes on the roads than would apply under “natural equilibrium” or “maximum throughput” approaches.
Congestion cost estimates. Economic approaches define congestion costs as the economic cost incurred by society when road usage is above the economically optimal point. By contrast, estimates of the “total” cost of congestion often have as their basis the “delay” imposed by travel at less-then-free flow speeds. Such estimates are misleading and of little use as they represent an artificial construct. Road systems cannot be affordably built to deliver free flow speeds 24 hours a day, 7 days a week and 52 weeks a year in large, dynamic and growing urban areas. Such bases should therefore NOT be used to make overall estimates of congestion-related costs. Similarly, as such estimates of the total costs of congestion are conceptually unsound, they should not be used as the basis for estimating congestion costs as a proportion of GDP. However, there can be value in tracking the relative changes of such “total” cost estimates because the inappropriate base levels disappear and the comparisons pick up the real differences in actual travel times, fuel and other resource costs, from one period to another.
Assessment of measures to manage congestion. It is important for there to be proper appraisal of the alternatives, taking into account factors such as metropolitan plans and policy objectives. Measures which meet all such requirements are worthwhile if the net present value of their benefits exceed the net present value of their costs. Overall estimates of total congestion costs therefore are not required in order to manage congestion better.
Value of travel time savings. In assessing possible congestion mitigation measures, the bulk of congestion management policy benefits are generally derived from savings in travel time and great care is needed in assessing the scale and scope of travel time savings. Particular attention should be paid to the heterogeneity of travellers’ values of time, the relative productivity of travel time and the role that small vs. large travel time savings play in the final calculation of benefits and costs.
Reliability. Given the importance of the reliability of travel time to roadway users, care should be taken to account properly for road users’ value of reliability in assessing options and prioritising measures. According to recent research, many users value travel time reliability highly, in some instances, more highly than they value average travel time.
Indirect impacts. Policies seeking to manage the impacts of congestion should account for indirect impacts in addition to some of the direct impacts mentioned above. These indirect impacts include impacts on regional and business productivity, environmental impacts, health and safety and household scheduling.
Much work has been done to improve the traditional operations approaches and the simplified economically-optimal approaches outlined early in this chapter. Administrations are encouraged to incorporate such improvements where possible in the conceptual frameworks they are using.

164 – CONCEPTUAL FRAMEWORKS FOR ASSESSING CONGESTION AND ITS IMPACTS
MANAGING URBAN TRAFFIC CONGESTION – ISBN 978-92-821-0128-5 - © ECMT, 2007
NOTES 1. See Walters, A. (1961) and Morrison, S. (1986).
2. “The ASC and MSC curves reflect the average and marginal generalised costs associated with different flows; they show time and vehicle operating costs borne by road users when making trips. They can be seen as representing social costs, in the limited sense that they are costs to the “society” of road users. Any individual driver entering the road will only consider his time and vehicle operating costs, including the congestion costs he will have to bear, which with many users, will be equal to the average cost prevailing at that moment or ASC. Thus the ASC is often referred to as the marginal private cost (MPC), or cost the new user will bear. He will not take into account the costs that he will impose on other vehicles on the road. The difference between the ASC and MPC curves at any flow level reflects the marginal congestion cost.” Button, K (2004), pp. 6-7.
3. It should be noted that the amount of the revenue raised from the charge is not a measure of congestion cost. It reflects the proceeds of the charge required to reduce traffic to the optimal level, to the level that will maximize the economic surplus, and eliminate the congestion externality.
4. See Button, K. (2004), Evans, A (1992) and Hills, P (1993).
5. These findings and updated analysis have been reflected in recent road management guidance documents such as the latest edition of the US Highway Capacity Manual.
6. VCEC, 2006.
7. e.g. Newell, Braid, Arnott, de Palma and Lindsey.
8. For instance, see Mackie, P.; Jara-Diaz, S.and Fowkes, A.(2001).
9. Bates, J. and Whelan, G. (2001).
10. http://www.tc.gc.ca/finance/bca/en/Section7.htm#Small%20Travel-Time%20Savings.
11. See Mokhtarian, P. and Ory, D.T. (2005) and Mokhtarian, P. (2005).
12. Noland, 1995.
13. Although these studies are less clear on the exact manner in which travel time variation – and the ensuing buffer allocation – are calculated by users. Some indicate that travel time perceptions are skewed towards the worst travel conditions and thus buffers are larger than they might objectively had been and others point to simpler mechanisms for calculating buffers – such as users’ retaining average travel times more easily than their variability (Ushikawa, Kikuchi and Kitamura, 2004).
14. Lam, T. and Small, K., (2001) find the ratio of value of Time/value of reliability to be 1.39 when looking at the 90th-50th percentile difference. NCHRP (1999), however, looking at the median value of reliability and the median value of time finds the ratio to be .97.
15. Bates, J. et al (2001).
16. Hamer, R et al. (2005).
17. De Palma, A. and Fontan, C. (2000).
18. See Small, K., Winston, C. and Yan, J. (2005) and Brownstone, D. and Small, K. (2005).
19. McKinnon, 2004 (PPT).
20. Weisbrod, G., Vary, D. and Treyz, G. (2003).
21. http://www.fhwa.dot.gov/environment/freightaq/chapter5.htm.
22. ECMT(2006) and ACEA (2004).
23. Mardsen, G., Bell, M. and Reynolds, S. (2001).
24. ECMT (2006).

CONCEPTUAL FRAMEWORKS FOR ASSESSING CONGESTION AND ITS IMPACTS – 165
MANAGING URBAN TRAFFIC CONGESTION – ISBN 978-92-821-0128-5 - © ECMT, 2007
25. Zickus, M. and Greig, A. (2001).
26. Wener, R., Evans, G. and Boately, P. (2005) and Wener, R. and Evans, G. (2004).
27. Wener, R., Evans, G. and Boately, P. (2005) and Wener, R. and Evans, G. (2004) found this for train commuters traveling in congested conditions.
28. NCHRP (2001a).
29. McKinnon, 2004 PPT.
30. NCHRP (2001a), p. 26 in reference to Zaxc, 1991.
31. USDOT (2006).
32. Levinson, D. and Wu, Y. (2005).
33. Ministere de l’Equipement, http://www.ile-de-france.equipement.gouv.fr/IMG/pdf/partie9_cle2beea8-2.pdf.
34. Personal communication from Lyn Martin, BTRE.
35. Goodwin, P. (2004), p. 14.

CONGESTION MANAGEMENT STRATEGIC PRINCIPLES – 167
MANAGING URBAN TRAFFIC CONGESTION – ISBN 978-92-821-0128-5 - © ECMT, 2007
6. CONGESTION MANAGEMENT STRATEGIC PRINCIPLES
This chapter provides guidance to the policy-maker and practitioner regarding general strategic principles that can guide congestion policy. It does so by addressing the real outcomes of congestion management policies, both expected and unexpected, and investigates how measures can be deployed to most efficiently, effectively and durably manage congestion.
6.1 Strategic Planning, Strategies and Congestion Management Policy
If society is at all interested in better managing congestion –and any reader of the daily news in most of the world’s cities would confirm that it is – it is because many urban inhabitants are affected in some manner or the other by what seems like an intractable problem. And while congestion has historically gone hand-in-hand with the growth and maturity of otherwise dynamic urban areas, citizens certainly feel that much more can and should be done to reduce these impacts. Indeed, much has to be done and transport authorities from around the world have shown great creativity and displayed determination and energy in seeking to minimise the adverse impacts of congestion … unfortunately with few durable successes.
The limited successes and past failures in the struggle to contain congestion have been in part due to the framework in which congestion management policies have been deployed.
Many have sought to eradicate congestion, a well-meaning but nearly unrealisable goal, at least in growing and economically vibrant cities. Others have sought to treat congestion “on the roadway” and have been frustrated when changes in travel patterns and demand (and other “macro” drivers of congestion outlined in Chapter 2) – including those brought about by new infrastructure itself –have thwarted their plans. And in many cases, congestion management policies have been deployed in a relatively limited framework that has sought to treat the most immediate aspects rather than adopting a more holistic and strategic vision of the congestion management process.
While there are many possible measures that can be deployed to “treat” congestion, there is no single perfect solution.
Congestion mitigation actions are part of the broad and complex land use and urban planning and general transport master planning process unique to each urban region. Furthermore, roadway congestion impacts not only road users but all urban inhabitants. The success of the implementation of actions targeting congestion depends on many factors such as place, date, the economic and demographic situation and of course on the type of congestion, evoked in chapter 3.
The challenge, therefore for policymakers is developing the appropriate strategic vision of the congestion management process in order to guide the selection of specific and necessarily varied congestion management measures for their city. This first section of chapter 5 discuss this strategic framework.
168 – CONGESTION MANAGEMENT STRATEGIC PRINCIPLES
MANAGING URBAN TRAFFIC CONGESTION – ISBN 978-92-821-0128-5 - © ECMT, 2007
6.2 Strategic Framework for Congestion Management
Looking across a number of countries and/or regions as reported in Chapter 4, there is a wide range of conceptual frameworks and operational underpinnings for congestion management policies. For instance:
• The United States Federal Highway Administration conditions the disbursement of federal funds for congestion-relief infrastructure projects on the premises that all other options have been addressed (traffic management, demand management, etc).
• Japan has a strong belief that in the context of the greater Tokyo region, infrastructure expansion (or more precisely, the completion of road networks) is the first option for managing congestion (followed and/or accompanied by demand management).
• London (U.K.) believes that cordon pricing has delivered a market-based approach, in which roadway users can rationally act on their travel decisions in response to a price that reflects an approximation of the congestion burden they might impose.
Each of these approaches is based on a national framework, the local and regional context and a set of assumptions. All of these factors, in turn, have an impact on the mix and staging of appropriate congestion management measures.
Addressing the “micro”1 drivers of congestion (as set out in Chapter 3) generally entails more traditional transport and roadway operational responses whereas addressing the “macro” drivers of congestion involves much broader instruments since the latter encompass a broad range of factors such as:
• Land use • Activity patterns • Time patterns • Culture of mobility behaviour • Economic development • Motorisation • Fuel price
The individual traveller with his/her experience, habits and behaviour is the centre of the congestion equation. Mitigating congestion means not only bringing about changes in transport and its environment, but also influencing the potential traveller/driver and his/her decision if, how and when to travel. Further complicating the equation is the fact that there exists a great heterogeneity of travellers and travel purposes, including freight transport, which may not be equally responsive to specific congestion management policies.
6.3 Strategic Planning and Congestion Management
Developing and implementing congestion management approaches that address both the “micro” and “macro” drivers of congestion requires a broad and holistic approach. Measures that only limit themselves to what is taking place on the road (e.g. by focusing on project-by-project piecemeal decision-making) will likely not deliver durable relief from congestion – if they provide any relief at all.

CONGESTION MANAGEMENT STRATEGIC PRINCIPLES – 169
MANAGING URBAN TRAFFIC CONGESTION – ISBN 978-92-821-0128-5 - © ECMT, 2007
Some public authorities have recognised this need for such an approach and have focused on developing a strategic planning framework for congestion management that seeks to address the problem at its multiple sources.
The Australian Transport Council describes the application of strategic planning in transport as setting
“the desired broad direction of the system in which potential projects and investment programmes are developed. It provides the direction necessary to develop transport policies and investment programmes that will deliver the desired outcomes in a range of likely futures…To be realistic and achievable, a strategic plan must also take account of the fundamental trade-off that, given other competing priorities of government, the aggregate transport investment desired by users and the community usually exceeds government’s capacity to fund these proposals… Strategic planning provides an initial opportunity to narrow down the choices about the types of options to be given priority”2.
In this context, the Australian Transport Council has mapped out a series of hierarchical, linked and phased objectives such that the definition of objectives at one level sets the context, informs and guides the objectives set at the following level.
This approach is one that is often found within national and regional land-use planning applications (such as that of France). Figure 2.1 illustrates the hierarchy of transport policy objectives as defined in the Australian approach. The strength of this approach is that policies applying this concept can deliver traceable and coherent strategies at the local, regional and national levels. Furthermore, when this type of strategic framework is linked to conditional funding of specific projects, this approach can ensure the delivery of specific desired outcomes. Such is the case with the United State’s conditional disbursement of gas tax revenue for strategic plan-compliant projects under the Intermodal Surface Transportation Efficiency Act of 1991 and its subsequent iterations.
Figure 6.1. Strategic Planning: Hierarchy of Linked Objectives
Source: Australian Transport Council, 2005.

170 – CONGESTION MANAGEMENT STRATEGIC PRINCIPLES
MANAGING URBAN TRAFFIC CONGESTION – ISBN 978-92-821-0128-5 - © ECMT, 2007
Under this or other similar frameworks of strategic transport policy setting, policy linkages between different levels of transport planning can be made explicit. For instance, Germany uses a framework for planning its congestion management responses that enables policy-makers to link on-road projects to broader areas of policy intervention such as mobility management and land-use planning as illustrated in figure 6.2.
This framework allows policy-makers and roadway operators to understand the linkages between the broadest level of measures (Urban development and Land Use Planning) and the most specific (on-road Congestion Management). A greater application of the linkages between Urban development and Land Use Planning, because they address many of the underlying drivers of congestion, may obviate to some extent the need for the widespread application of road Congestion Management.
This approach also allows transport policy-makers to see where specific congestion management strategies align themselves with longer-term infrastructure development policies falling equally across all axes and with the short-term traffic management policies falling under the rubric of demand oriented “soft” (e.g. non-infrastructure) policies.
Figure 6.2. German Classification Framework for Congestion Mitigation Measures
Source: Based on Road and Transport Research Association: Indications for the strategy development in the dynamic traffic management, Cologne; 2003.
CONGESTION MANAGEMENT STRATEGIC PRINCIPLES – 171
MANAGING URBAN TRAFFIC CONGESTION – ISBN 978-92-821-0128-5 - © ECMT, 2007
These and other such holistic approaches to defining the framework for congestion management policies are useful because they allow policymakers to ensure that they cover the full spectrum of congestion causes and address specific congestion contributing factors in their responses.
Developing a strategic framework for assessing congestion management policies and developing a strategy of action, however, are two different activities. In the latter case, policymakers are seeking guidance on how, and not necessarily at what level to act. What then, can be said about the strategic principles that can guide policy-makers in how to best manage congestion?
6.4 Strategic Principles for Congestion Management Policy
Chapter 3 detailed the interplay between the availability of new or newly freed-up road capacity and traffic levels. This positive feedback loop, strongest in congested urban areas, is essential in framing the strategic approach for congestion management. The relationship is complex but one should retain that, rather than the impact that policies might have on existing levels of demand, what matters most for congestion management efforts is the impact that policies will have on future levels of demand – especially those that evolve after the implementation of congestion management measures. If the latter – e.g. the demand for transport capacity after intervention – represents no real improvement over the existing situation from an operational and/or user perspective (the roads are as congested as before but with more vehicles travelling potentially longer distances), what can be said about the purported benefits of the congestion management policies?
Three types of strategies appear to be useful to address the overall demand for road space and have been embodied in the following congestion management principles
• Coordinate land use and transport planning. This principle relates to the speed with which new capacity is utilised – and the impact that policies might have on the nature and scope of future demand for road travel.
• Deliver reliable transport system performance. This principle addresses how transport authorities can deliver improvements in road travel performance even when it may be difficult to put in place measures that deliver large travel time savings.
• Pro-actively manage demand for road capacity. This principle relates to the necessity to manage capacity such that transport system performance is not negatively impacted.
Principle 1: Ensure that Land Use Planning, and the Community Objectives it Embodies, is Coordinated with Congestion Management Policies.
It has been said that the most certain way to cut congestion is through economic depression. This is because one way to avoid crowding on the roads is to avoid crowding in cities – areas that are losing their population due to unfavourable economic conditions are sure to have less crowded roads. Yet this is anathema to urban regions whose very success is linked to their economic, cultural and human dynamism – and rightly so. Are there not tools and strategies at the disposal of governments to more proactively and beneficially manage the scope and nature of urban travel demand?
Many governments believe so and at the heart of these examples is a strong interlinkage between spatial policies and transport policies. These two fields are intimately linked in reality – land uses give rise to trip generation and the interplay between spatially distant origins and destinations gives rise to regional trip patterns. However, in practice, many regions (with many important exemptions) fail to co-ordinate long term land-use and transport planning. In the framework presented in figure 5.2, the

172 – CONGESTION MANAGEMENT STRATEGIC PRINCIPLES
MANAGING URBAN TRAFFIC CONGESTION – ISBN 978-92-821-0128-5 - © ECMT, 2007
connection between the top two levels of policies (regional policies and urban development/land use planning) and transport and congestion management policies are not explicitly made. In this context, it is essential that policies seeking to provide long-term congestion relief in urban areas be approached as a coordinated and multi-level, multi-actor process.
Experience from a number of countries and regions, however, has shown that well-thought out land-use policies that explicitly make a link between community expectations relating to the long-term development of the city and transport outcomes, can have a positive impact on a number of outcomes – including traffic and congestion management. And on the other hand: policies that do not confront such community expectations with the impacts on congestion will not lead to durable results (though they will sometimes yield short term successes). As noted elsewhere, while congestion arises on the roads, its solution will necessarily involve actors who have responsibilities in other domains. Chapter 10 will address how effective coordinating mechanisms and alliances can support congestion management policies.
The first strategic principle for effective congestion management policies is that urban regions must explicitly link land use policies, and the community expectations that these embody, to congestion management policies.
Principle 2: Deliver Predictable Travel Times
Earlier portions of this report have highlighted the importance of reliability in road transport performance. Congestion impacts both average travel speeds and travel reliability – and there is some evidence that the latter may be more important than the former in that people plan for congested travel but are frustrated by unreliable travel. This suggests a third general strategic principle subordinate to the ones outlined above:
The second strategic principle for effective congestion management policies is to target travel time variability and the most extreme congestion incidents first when prioritizing congestion management measures since unreliable and extremely variable travel times impose the greatest “misery” on roadway users.
An increase in the reliability and predictability of travel times can rapidly relieve this “misery”. Typical measures include planning and coordination of road works, speedy response to defective traffic signals and to blockages caused by accidents.
Principle 3: Highly trafficked Urban Roadways must be Managed to Preserve Adequate System Performance
At present access to urban roads is generally unconstrained by everything but congestion itself. Indeed, congestion by queuing is a powerful rationing mechanism but one that few would agree is efficient.
How might signals of relative road space scarcity in high traffic urban environments, other than low travel speeds and unreliable traffic conditions, be incorporated into the travel-making calculus? The first step would be to recognize that only a very few types of policies can explicitly provide such a signal.
The universe of potential congestion management strategies is vast but most strategies fall into one of two categories – those that either provide new capacity or directly/indirectly free up existing capacity and those that signal scarcity by capping, limiting or otherwise managing traffic levels on the

CONGESTION MANAGEMENT STRATEGIC PRINCIPLES – 173
MANAGING URBAN TRAFFIC CONGESTION – ISBN 978-92-821-0128-5 - © ECMT, 2007
new or recently freed-up capacity. However one cannot expect that newly added or freed up capacity will not eventually fill up to saturation levels in dynamic urban areas unless the usage of the added capacity is managed in some manner:
The third strategic principle for effective congestion management policies is that, in light of induced and/or suppressed demand, capacity-producing measures should always be accompanied by measures that manage traffic levels on highly trafficked urban roads in order to lock in the benefits derived from new capacity.
Generally speaking, there are only three broad sets of such “signal-setting” policies that have the immediate potential to temper the phenomenon of induced traffic. All three work by controlling the amount of travel that can take place on the newly available capacity. These are:
• Managing the physical access to the roadway through access policies.
• Affecting the ability of potential road users to travel by car to their final destination through comprehensive and consistent parking policies applied to high trip density locations.
• Managing the level of traffic seeking to use the available road capacity at different times of the day (e.g. through pricing policies that moderate the use of, or access to, road networks or parts of the city).
6.5 No Managing Congestion without Managing Demand
A fundamental issue related to the principles enumerated above relates to the management of what has previously been an unmanaged entity – demand for roads.
It is not quite fair to say that demand for roads has not been managed in the past – it has – but most often by the queuing triggered by congestion itself. The cumulative energy deployed to address congestion is an eloquent witness to the general dissatisfaction with that type of demand “management”. Also, saying that demand for roads has often not been managed is not the same as saying that roads have not been managed – they have – but the management of roads in many urban areas has not led satisfactory performance at peak hours.
The notion of actively managing access to what has been experienced by current generations as a “free” good raises several fundamental questions, not the least of which is:
“Should transport authorities/roadway operators manage and/or restrict traffic demand?”
Road infrastructure has traditionally been developed, operated and maintained by government transport or roads administrations. Despite a number of important roads projects undertaken with private sector involvement in some countries, the traditional government roads administration role has generally been maintained. Once road infrastructure has been built, road administrations generally have limited involvement in road network management and in most instances focus on improving flows on the network. For example, administrations typically devote considerable resources to:
• Monitoring roadway and intersection performance, where necessary improving local infrastructure and increasing intersection capacity (through measures such as traffic signal coordination, turning lanes etc.
174 – CONGESTION MANAGEMENT STRATEGIC PRINCIPLES
MANAGING URBAN TRAFFIC CONGESTION – ISBN 978-92-821-0128-5 - © ECMT, 2007
• Removing constraints that are impeding traffic flows in congested periods (e.g. restricting on-street parking) etc.
• Attempting to maximize the capacity of the infrastructure to meet traffic demand.
By comparison with managers of infrastructure other than roads, road administrations generally have much less of a role – if they are assigned any role at all – in relation to managing overall demand for use of their infrastructure systems. In fact, there may be little consideration given to whether overall demand for use of the road system should be managed at all.
In other infrastructure sectors (e.g. water, telecommunications, electricity), infrastructure managers are assigned a key role in managing their infrastructure. Fixed and mobile phone operators and electricity distributors place great importance on managing demand for their infrastructure in ways which flatten use of the infrastructure in peak periods and increase usage in off-peak periods. The same is often true for transport sectors other than roads, although both airlines and rail also limit access so that demand does not exceed the capacity of their services. Airline companies often also spread demand across their networks by charging less for indirect services than direct services.
Such management of network infrastructure demand and usage in these other sectors helps maintain the levels of service provided to users at acceptable levels. Although there are generally occasional delays in telecommunications services or occasional electricity blackouts caused by excess demand, an important distinction from road systems is that such delays tend to be relatively rare. A second important distinction from road infrastructure is that when such delays do occur, the infrastructure managers take action to try to ensure they do not occur again.
In most cases involving other infrastructure, the improved outcomes are achieved by using policies and measures that increase resistance to excess demand appearing on their networks by moderating unrestrained levels of demand.
Unless governments give road infrastructure managers the ability to employ similar policies and measures in road system management, many of the congestion mitigation and management measures that can be implemented will be wasted. This is true not only for improvements to existing infrastructure but also new infrastructure built to reduce congestion. Without proper management, all infrastructure is susceptible to eventually being overwhelmed by demand.
The first principle underlines that demand for roads should be managed in reference to how roadway users and urban dwellers wish to see their community develop and to the types of mobility options they wish to have over the long run. Managing demand for roads should not simply be a technocratic top-down process but should be related to how citizens wish their communities to evolve and function.
CONGESTION MANAGEMENT STRATEGIC PRINCIPLES – 175
MANAGING URBAN TRAFFIC CONGESTION – ISBN 978-92-821-0128-5 - © ECMT, 2007
Chapter Summary and Policy Conclusions
• Measures that only limit themselves to what is taking place on the road (e.g. by focusing on project-by-project piecemeal decision-making) will likely not deliver durable relief from congestion – if they provide any relief at all. An integrated and strategic approach to congestion management is a pre-requisite for success.
• Demand for roads should be managed in reference to how roadway users and urban dwellers wish to see their community develop and to the types of mobility options they wish to have over the long run.
• By comparison with managers of infrastructure other than roads, road administrations generally have much less of a role – if they are assigned any role at all – in relation to managing overall demand for use of their infrastructure systems. In fact, there may be little consideration given to the question of whether overall demand for use of the road system should be managed at all.
• In this context, three important strategic principles emerge which should guide congestion management efforts:
1. Urban regions should explicitly link land use policies, and the community expectations that these embody, to congestion management policies.
2. Target travel time variability and the most extreme congestion incidents first when prioritizing congestion management measures – unreliable and extremely variable travel times impose the greatest “misery” on roadway users.
3. The age of un-managed access to urban roads is coming to an end. In light of induced and/or suppressed demand, capacity-producing measures should always be accompanied by measures that manage traffic levels in order to “lock in” the benefits derived from new capacity.
NOTES 1. See discussion in Chapter 3 regarding “micro” triggers vs. “macro” drivers.
2. ATC (2004), p. 15.

INTEGRATED TRANSPORT PLANNING – 177
MANAGING URBAN TRAFFIC CONGESTION – ISBN 978-92-821-0128-5 - © ECMT, 2007
7. INTEGRATED TRANSPORT PLANNING
This chapter discusses the importance of situating congestion management policies within a wider transport and land-use planning strategy in order to account for some of the long-term drivers of transport demand.
7.1 Integrated Transport Planning
The previous chapter opened by addressing the need for transport policy to be nested within a greater framework of strategic planning so that decisions made within the transport sector are coherent with general policy aims of governments at the local, regional and national levels. Such an approach entails identifying and articulating shared goals and then ensuring that appropriate linkages are made with policy objectives within the transport sector as well as outside of the transport sector to other sectors of governments as well as with the private sector.
While the international echelon is not the first one that comes to mind when thinking of governmental or quasi-governmental responsibility for addressing urban congestion, it is important in certain circumstances – most notably within the European Union. While not having a direct responsibility for transport policy or planning at the regional level, the EU does fill an important role by organising and sponsoring common research on the topic.
On the national level projects should be prepared with a more detailed and operational focus with respect to circumstances and needs. National transport policy can be included in a general sustainable growth strategy and might contain for example a national multimodal transport investment plan or study of optimisation of the traffic system.
Within countries, regions and cities, policies should be agreed and implemented in reference to shared goals and principles. Measures that are put into place according to this shared framework for policy need not address transport directly but can focus on other sectors and/or levels of decision-making that have an influence on transport, e.g. fiscal and/or trade policy.
Within the transport sector, some measures may not act on traffic congestion directly, but may still enhance the efficiency of measures targeting transport operations or demand management. Because they can set the right framework conditions for a long-term policy to tackle traffic congestion, they should not be neglected. Among these are those measures that seek to change the fiscal treatment of travel and vehicles and those that seek to address the organisation of working hours.
7.2 Addressing the Fundamental Drivers of Congestion: Measures Linking Land Use and Traffic Growth and Development
The first strategic principle outlined in the previous chapter referred to the need for congestion management policies to address some of the fundamental “drivers” of congestion, and, in particular, to address the linkage between land development patterns and traffic growth.

178 – INTEGRATED TRANSPORT PLANNING
MANAGING URBAN TRAFFIC CONGESTION – ISBN 978-92-821-0128-5 - © ECMT, 2007
Many urban regions face the challenge of balancing growth, impacts on land use and the implications these have on traffic and congestion. Not all regions, however, face the same patterns of land use and land development. Some cities are characterised by a mature, dense and economically powerful core that is surrounded by a growing ring of lower density development, others are formed by a network of lower density urban poles spread loosely across the whole of the urban region and yet others are characterised by a dense core and a dense and very widespread periphery. It is clear that throughout the OECD/ECMT regions, no single form of urban structure dominates although several similar patterns of urban development are shared. In this context, it makes little sense to argue that one form of urban development is inherently “better” than another with regards to congestion management objectives.
What can be said, however, is that given the link between land use patterns and traffic patterns, much should be done to ensure that congestion management strategies address the relationship between the two. A long-term strategic policy to tackle traffic congestion should then include some reference to the coordination of transport policy, urban planning and environmental goals in order to deliver sustainable outcomes. In the specific context of congestion management, some focus should be made on addressing trip generation and its management through urban planning tools. Land use can influence locations of trip generating facilities and activity patterns. Influencing demand through urban planning can therefore contribute to decreased road traffic and help to mitigate congestion.
Land-use planning includes growth management – e.g. regulation of location, density, quality and rate of development. Transport policy, on the other hand, aims to manage existing and future traffic levels that are and will be generated by shifts in trip-making activity, itself linked to land-use decisions. Thus, in order for policy to address the upstream drivers of the traffic that is circulating on a region’s roads, it is necessary to integrate traffic planning with land use planning.
Land-use strategies also embrace urban design. However, it is important to note that “preferences” for urban design patterns may vary from one region to another. Indeed, not only may preferences differ but the impact of urban development patterns may differ as well depending on the context. Communities should have the opportunity to collectively reflect on, and plan for the type of cities and urban areas they wish to live in. This means that the consultation processes identified in Chapter 11 may very well deliver different specific recommendations and objectives relating to the type of urban development communities wish to have.
Furthermore, it is important to account for various underlying factors that may give rise to one pattern of urban development over another. These may fall outside of the realm of transport authorities but their impact can be important and, in many cases, may strongly affect the outcome of combined transport and land-use policies. These factors might include fiscal policies seeking to facilitate home ownership, the tax treatment of commuting travel, or even the manner in which property taxes are assessed. In the latter case, there is both a long-standing theoretical argument and recent concrete evidence that shifting property taxation away from buildings and towards land values may encourage more dense and compact settlement patterns – which may have an incidence on reducing congestion in certain circumstances (see box).
In some cities, citizens have expressed a desire to live in cities characterised by dense mixed-use development with job, housing and leisure all combined in the same areas. Implementing traffic calming measures as well as transit-friendly or pedestrian-friendly areas support this type of development. The goal in these areas has been to promote use of alternative modes, increase use of public transport, decrease the number of kilometres travelled and improve air quality. Such an approach maintains mobility but over shorter distances and by different modes. In these areas, planned

INTEGRATED TRANSPORT PLANNING – 179
MANAGING URBAN TRAFFIC CONGESTION – ISBN 978-92-821-0128-5 - © ECMT, 2007
urban development leads to the development or maintenance of densely populated residential that have minimal traffic needs.
Land Value Taxation
Land value taxation (known also as location benefit levy) can be used in place of conventional local property taxes (residential and business rates, and development taxes). This has been used very successfully in the redevelopment of Harrisburg, Pennsylvania in the US and Denmark uses land value taxation to fund local government expenditure. LVT uses an annual assessment of the value of land (not buildings) to determine the tax to be paid annually by land owners for infrastructure and other services such as sewers, refuse collection, public transport and so on. The value of urban land is to a large extent determined by access to these public services. For example the value of the land on which an office block is located can be multiplied several times over by the opening of a new underground railway station nearby. Under conventional models of taxation and finance for public transport, large windfall cash gains accrue to the owners of buildings on such land whilst finance for urban rail investments is always difficult to find. LVT can be used to enable the beneficiaries to pay for these kinds of investment. The result is an increased and more optimal supply of public transport and substitution of an efficient tax for conventional taxes that impede development of the local economy. Unlike taxes on property development, the system promotes rather than hinders redevelopment of inner city sites. It encourages development where public infrastructure is already in place, as opposed to encouraging sprawl into greenfield sites that government is then obliged to service, and it acts as a powerful incentive to bring derelict sites into productive use as the tax has to be paid what ever the land is used for.
Source: ECMT (2007b), Cutting Transport CO2 Emissions: What Progress?, p. 81
Another example for land-use and urban planning in connection to traffic is the development of urban districts near stations (railway, underground, light rail rapid transit, tram, etc.). The opportunities to use the public transport are more considered; the public transport is encouraged by the urban planning. This is not restricted only to the urban planning but can also apply to regional concepts (e.g. development near a railway station with regional connections).
High density urban areas can also have negative features – one of which is high housing costs. Furthermore, there is evidence that in some urban regions, lower density urban development can result in lower, not higher, travel times in addition to lower housing costs. A recent ECMT Round Table on Urban Sprawl and Economic Growth highlighted that is some urban regions of the United States, commuting times have sometimes decreased in the periphery of cities that have pursued low-density growth. While inhabitants in these cities (and low income inhabitants in particular) have had access to lower-cost housing not all the impacts of low-density growth are well understood. In many countries urban sprawl entails the loss of prime farm land, leading to costs in terms of a loss in agricultural production and productivity and the transport intensity of agricultural supply. Overall, sprawling cities have higher transport intensities, with the suburbs not being properly charged for the higher infrastructure costs. Moreover, despite the reduced costs in terms of CO2 emissions of urban transport due to improvements of vehicle technology, the health costs of the remaining absolute pollution levels are substantial and are not fully account for.1
Despite the importance of linking land use to transport policies, the development and implementation of integrated land-use planning policies is sometimes difficult since this requires support and coordination over the long term. Policy makers have to identify the problems and consider the best solutions and join forces with transport operators, private companies, local administrations

180 – INTEGRATED TRANSPORT PLANNING
MANAGING URBAN TRAFFIC CONGESTION – ISBN 978-92-821-0128-5 - © ECMT, 2007
and public at large. It is also important to consider the environmental context of given area – especially when infrastructure development threatens to fragment sensitive or otherwise valued ecosystems.
Figure 7.2. Messestadt Riem, a new district in the region of Munich
Source: www.messestadt-riem.com.
In Germany, Munich, the ISAR SÜD project stands for the transformation of business premises into an urban area uniting work, accommodation and recreation. While the project mainly aims on increasing the quality of life for people living and working in this area, it will also reduce the number of trips. The existing industrial area is one of the major attractors in the south of Munich and the traffic demand and congestion can be reduced by ISAR SÜD.2
The new district Munich Riem. At the area of the former airport Munich Riem, one of the greatest urban development projects in Europe is realized up to the year 2013. 13 000 inhabitants and about 13 000 jobs will also economically stimulate the new district, which is set only seven kilometres linear distance from the centre of Munich. The combination of the spheres for live, work and education with the necessary infrastructure and a generous green area are created by the provincial capital of Munich and many experts in a long-term planning and development process.3
In the United Kingdom it is now common for land use planning consent for new office buildings to be granted on condition of the firm that wishes to occupy the building adopting a ‘Green Transport Plan’. The Plan sets out the measures to be taken by the future occupant to reduce car use by, for example, limiting the number of parking spaces, providing bus stops and arranging ride sharing.
Land-use planning is best suited to new developments. It can make only a very limited contribution other than at a local level. Over a longer period, if applied consistently, it can work to reduce travel demand in existing settlements. In addition to reducing travel demand, it is often associated with the benefits of improved “liveability” through improved urban design. However, by encouraging more development in dense urban areas and less in rural or suburban areas, while people will travel shorter distances and be less likely to travel by car, the car trips that residents of these areas

INTEGRATED TRANSPORT PLANNING – 181
MANAGING URBAN TRAFFIC CONGESTION – ISBN 978-92-821-0128-5 - © ECMT, 2007
will make (since the aim of the policy is to encourage the more affluent households to live in areas that are at present predominantly inhabited by lower income households, often without cars or jobs) will take place in more congested places. So it’s not necessarily the case that denser settlements through land use planning will reduce congestion.
In addition, higher densities result in households having less living space (no garage, a small garden, if any, smaller rooms etc). A land use planning policy, which prevents developers from building new homes with many private facilities in the outer suburbs and allows only less spacious homes to be built at higher densities and closer to the urban centre, is a policy which places the perceived public good above the private benefit. Such policies tend to be difficult for politicians to make effective. In order to make these policies acceptable, it may be necessary to increase public spending to provide high quality shared facilities, such as local parks to make up for the lack of private gardens.
Chapter Summary
• Within countries, regions and cities, policies should be agreed and implemented in reference to shared goals and principles. Measures that are put into place according to this shared framework for policy need not address transport directly but can focus on other sectors and/or levels of decision-making that have an influence on transport Among these are those measures that seek to change the fiscal treatment of travel and vehicles and those that seek to address the organisation of working hours.
• In order for policy to address the upstream drivers of the traffic that is circulating on a region’s roads, it is necessary to integrate traffic planning with land use planning.
• No single form of urban structure dominates although several similar patterns of urban development are shared. In this context, it makes little sense to argue that one form of urban development is inherently “better” than another with regards to congestion management objectives.
• Communities should have the opportunity to collectively reflect on, and plan for the type of cities and urban areas they wish to live in. This means that the land use/transportation planning consultation processes may very well deliver different specific recommendations and objectives relating to the type of urban development communities wish to have.
• When considering coordinated regional land use and transport planning policies, communities should account for the broad impacts of policies that go beyond the transport sector itself – e.g. distributional impacts linked to housing costs, environmental impacts as well as productivity impacts linked to changes in land use (e.g. farmland).
NOTES 1. Glaisser, E. and Kahn, M. (2003) and ECMT (2007) Round Table on Urban Sprawl and Economic Growth
(forthcoming).
2. Project Isar Süd, Munich, Isar Süd GmbH.
3. www.messestadt-riem.com.

IMPROVING THE RELIABILITY OF URBAN ROAD SYSTEM PERFORMANCE – 183
MANAGING URBAN TRAFFIC CONGESTION – ISBN 978-92-821-0128-5 - © ECMT, 2007
8. IMPROVING THE RELIABILITY OF URBAN ROAD SYSTEM PERFORMANCE
Travel time reliability and more generally, the predictability of transport system performance, has often not been the explicit focus of congestion management policies in the past. Congested roads are generally unreliable roads – research conducted for TRANSFUND1 indicates that while variability of travel times is insignificant under a volume capacity (v/c) ratio of 0.9, it increases sharply to a v/c of 1.3, where it ceases to increase further – thus much of what can be done to reduce excess congestion will also deliver travel time reliability benefits. These other measures are addressed in both the preceding and proceeding chapters, however, there are a few particular strategies that specifically target and deliver travel time reliability improvements. These are explored in this Chapter.
Policies seeking to deliver more predictable and stable travel times on urban roads should account for the following:
• Research into travel time reliability largely supports the findings from recent traffic management and transport economics research – travel time reliability can best be delivered when traffic on the roadways is managed such that actual flows are below the roadway’s physical capacity.
• Given the importance of roadway incidents in contributing to unpredictable travel times, preventing and better managing these can lead to important gains in travel time reliability.
• Research suggests that measures that increase intersection capacity can deliver trip reliability benefits without necessarily improving average travel times. Despite their limited impact on average travel times, the trip reliability benefits derived from these measures deliver tangible benefits to roadway users.
• More generally, small reductions in v/c ratios can deliver large reliability benefits – especially if these bring v/c below 1.0 – even if they do not deliver tangible travel time benefits.
• Finally, the largest benefits in travel time reliability may occur at inter-peak times. Reducing v/c from 1.1 to 0.8 at the inter-peak will have a very large impact on reliability. As well, whereas reducing v/c in highly congested peak hours from 1.0 to 0.9 will have an important impact, reducing from 1.6 to 1.3 will have almost no perceptible impact on reliability at all. This suggests that the greatest benefits stemming from reliability-specific measures would flow to those who can re-schedule their departure times away from the highly congested peak.
The extent to which crashes, roadworks, and other incidents or unplanned events impact traffic flow varies from time of day (peak vs. off peak hours) and by type of road network (dense urban vs. uninterrupted motorway-type facilities. Losses of capacity on untravelled roads or at off peak times obviously have little impact on travellers since roads – but they can have a significant impact at peak hours in urban areas. One research report from the United States2 describes the scope and scale3 of such temporary capacity losses on urban motorways and main arterials (see figure 8.1).
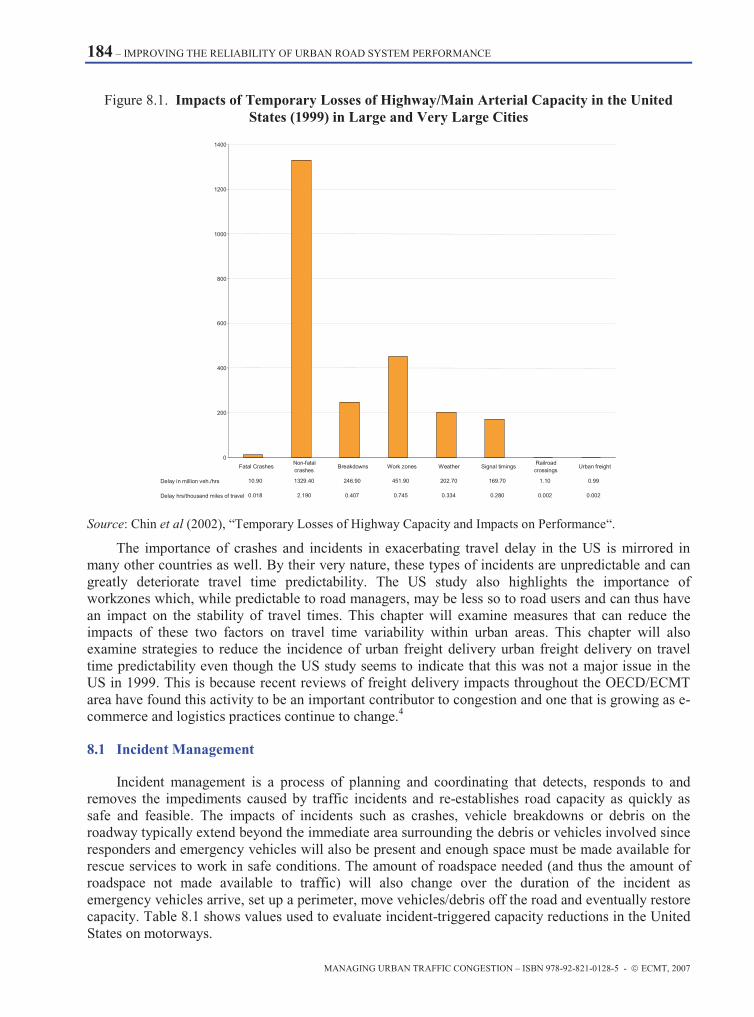
184 – IMPROVING THE RELIABILITY OF URBAN ROAD SYSTEM PERFORMANCE
MANAGING URBAN TRAFFIC CONGESTION – ISBN 978-92-821-0128-5 - © ECMT, 2007
Figure 8.1. Impacts of Temporary Losses of Highway/Main Arterial Capacity in the United States (1999) in Large and Very Large Cities
0
200
400
600
800
1000
1200
1400
Delay in million veh./hrs 10.90 1329.40 246.90 451.90 202.70 169.70 1.10 0.99
Fatal CrashesNon-fatal crashes
Breakdowns Work zones Weather Signal timingsRailroad
crossingsUrban freight
Delay hrs/thousand miles of travel 0.018 2.190 0.407 0.745 0.334 0.280 0.002 0.002
Source: Chin et al (2002), “Temporary Losses of Highway Capacity and Impacts on Performance“.
The importance of crashes and incidents in exacerbating travel delay in the US is mirrored in many other countries as well. By their very nature, these types of incidents are unpredictable and can greatly deteriorate travel time predictability. The US study also highlights the importance of workzones which, while predictable to road managers, may be less so to road users and can thus have an impact on the stability of travel times. This chapter will examine measures that can reduce the impacts of these two factors on travel time variability within urban areas. This chapter will also examine strategies to reduce the incidence of urban freight delivery urban freight delivery on travel time predictability even though the US study seems to indicate that this was not a major issue in the US in 1999. This is because recent reviews of freight delivery impacts throughout the OECD/ECMT area have found this activity to be an important contributor to congestion and one that is growing as e-commerce and logistics practices continue to change.4
8.1 Incident Management
Incident management is a process of planning and coordinating that detects, responds to and removes the impediments caused by traffic incidents and re-establishes road capacity as quickly as safe and feasible. The impacts of incidents such as crashes, vehicle breakdowns or debris on the roadway typically extend beyond the immediate area surrounding the debris or vehicles involved since responders and emergency vehicles will also be present and enough space must be made available for rescue services to work in safe conditions. The amount of roadspace needed (and thus the amount of roadspace not made available to traffic) will also change over the duration of the incident as emergency vehicles arrive, set up a perimeter, move vehicles/debris off the road and eventually restore capacity. Table 8.1 shows values used to evaluate incident-triggered capacity reductions in the United States on motorways.
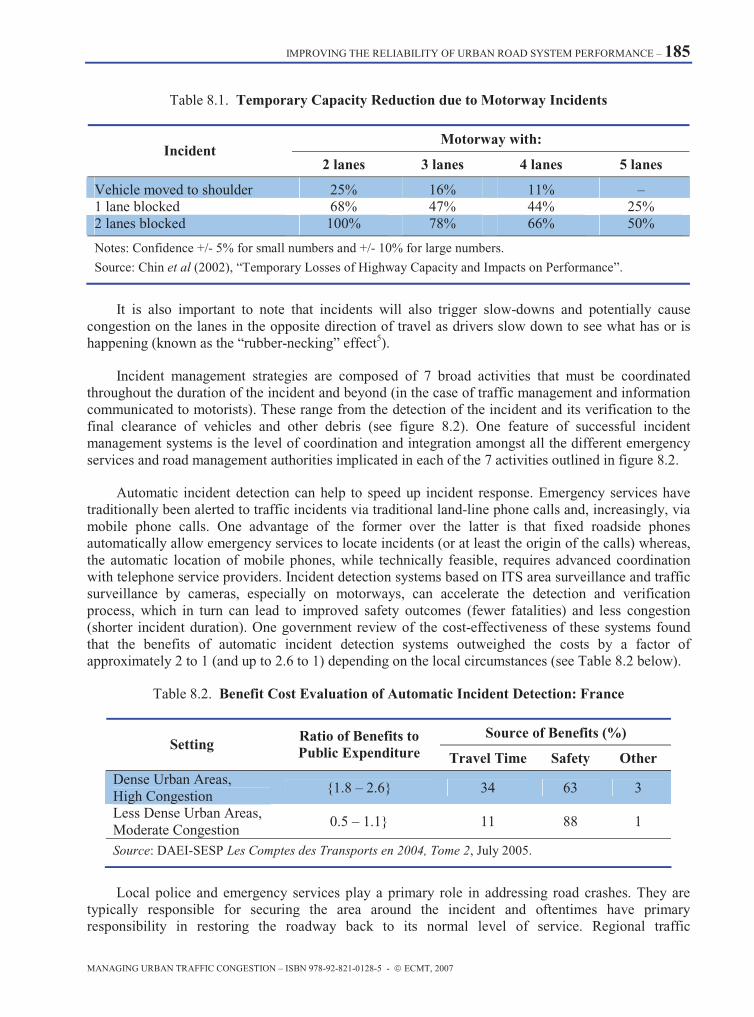
IMPROVING THE RELIABILITY OF URBAN ROAD SYSTEM PERFORMANCE – 185
MANAGING URBAN TRAFFIC CONGESTION – ISBN 978-92-821-0128-5 - © ECMT, 2007
Table 8.1. Temporary Capacity Reduction due to Motorway Incidents
Motorway with: Incident
2 lanes 3 lanes 4 lanes 5 lanes
Vehicle moved to shoulder 25% 16% 11% – 1 lane blocked 68% 47% 44% 25% 2 lanes blocked 100% 78% 66% 50%
Notes: Confidence +/- 5% for small numbers and +/- 10% for large numbers.
Source: Chin et al (2002), “Temporary Losses of Highway Capacity and Impacts on Performance”.
It is also important to note that incidents will also trigger slow-downs and potentially cause congestion on the lanes in the opposite direction of travel as drivers slow down to see what has or is happening (known as the “rubber-necking” effect5).
Incident management strategies are composed of 7 broad activities that must be coordinated throughout the duration of the incident and beyond (in the case of traffic management and information communicated to motorists). These range from the detection of the incident and its verification to the final clearance of vehicles and other debris (see figure 8.2). One feature of successful incident management systems is the level of coordination and integration amongst all the different emergency services and road management authorities implicated in each of the 7 activities outlined in figure 8.2.
Automatic incident detection can help to speed up incident response. Emergency services have traditionally been alerted to traffic incidents via traditional land-line phone calls and, increasingly, via mobile phone calls. One advantage of the former over the latter is that fixed roadside phones automatically allow emergency services to locate incidents (or at least the origin of the calls) whereas, the automatic location of mobile phones, while technically feasible, requires advanced coordination with telephone service providers. Incident detection systems based on ITS area surveillance and traffic surveillance by cameras, especially on motorways, can accelerate the detection and verification process, which in turn can lead to improved safety outcomes (fewer fatalities) and less congestion (shorter incident duration). One government review of the cost-effectiveness of these systems found that the benefits of automatic incident detection systems outweighed the costs by a factor of approximately 2 to 1 (and up to 2.6 to 1) depending on the local circumstances (see Table 8.2 below).
Table 8.2. Benefit Cost Evaluation of Automatic Incident Detection: France
Source of Benefits (%) Setting
Ratio of Benefits to Public Expenditure Travel Time Safety Other
Dense Urban Areas, High Congestion
{1.8 – 2.6} 34 63 3
Less Dense Urban Areas, Moderate Congestion
0.5 – 1.1} 11 88 1
Source: DAEI-SESP Les Comptes des Transports en 2004, Tome 2, July 2005.
Local police and emergency services play a primary role in addressing road crashes. They are typically responsible for securing the area around the incident and oftentimes have primary responsibility in restoring the roadway back to its normal level of service. Regional traffic

186 – IMPROVING THE RELIABILITY OF URBAN ROAD SYSTEM PERFORMANCE
MANAGING URBAN TRAFFIC CONGESTION – ISBN 978-92-821-0128-5 - © ECMT, 2007
management centres (discussed in the next chapter) are an ideal centre where traffic and road management authorities can coordinate with police and other emergency services to ensure the rapid restoration of traffic flows. These centres can also serve as the principal loci for the dissemination of information regarding the incident, travel times and possible detours to motorists who would otherwise be caught unawares. Inter-agency cooperation at the level of traffic control centres is not only effective in clearing crash sites but also in re-establishing traffic flows thus minimising delays, induced congestion and possible further accidents.
Figure 8.2. Incident Management Activities
Detection
Verification
Response
Site management
Clearance
Beginning of incident Road capacity restored
Motorist information
Traffic management
time
DetectionDetection
VerificationVerification
ResponseResponse
Site managementSite management
ClearanceClearance
Beginning of incident Road capacity restored
Motorist informationMotorist information
Traffic managementTraffic management
time
Source: UTCA, 2003.
This system requires a high level of coordination amongst all agents implicated in clearing crashes, vehicles or other temporary blockages – including both specialist and generalist media (especially radios and, increasingly, web portals. Furthermore, for this coordination to be most effective, it should span the entire urban region and cover motorways and major urban arterials.
The SISER traffic management centre of the Paris-Ile de France region, like, many other traffic management centres, ensures on-site coordination with emergency services by officially incorporating a representative of the police force in the traffic management control room.
In another example, in the United States, the Florida Department of Transportation (FDOT) has an agreement with the Florida Highway Patrol to improve the performance of restoring traffic flow after an incident on motorways. The Florida Highway Patrol (Police) is responsible for clearing accidents as quickly as safely possible. The FDOT contributes to the process by providing traffic controls and choice of alternative routes to drivers during the clearance. The contract, called the Open Roads Policy, ensures a better traffic incident management. 6
The coordination among incident management actors should extend to the coordination amongst, or at least an accounting for, these actors’ different ways of treating crash-sites. Emergency service personnel are principally concerned with securing any victims present and ensuring the safety of their personnel. Road authorities are typically concerned with restoring traffic flows as quickly as possible.

IMPROVING THE RELIABILITY OF URBAN ROAD SYSTEM PERFORMANCE – 187
MANAGING URBAN TRAFFIC CONGESTION – ISBN 978-92-821-0128-5 - © ECMT, 2007
Law enforcement agencies also have an interest in keeping crash sites “closed” for investigative purposes. However, in many instances, these objectives need not be divergent and can be met without conflict. Doing so requires established and negotiated protocols to be put into place by both emergency service providers and roads authorities regarding the management of crash scenes – addressing such things as the rapid removal of vehicles, documenting the crash, the number of lanes that must be closed to ensure the safety of emergency responders, upstream signage warning of the crash scene, etc.
In the Netherlands, incident responders (Emergency personnel, Service Patrols, Towing and Recovery agents and traffic management authorities are all trained under a common framework established by the National Traffic and Information Management Centre. This training also establishes the practice of creating “standard” Coordination Teams for handling incidents with a clear allocation of tasks and responsibilities. While “standard” in its approach, the actual responsibility for managing specific incidents differs from site to site based on circumstances – however, the designation of management responsibility for incidents follows a common protocol.7
One simple method to reduce the traffic impact of crash scenes has been to temporarily erect screens that shield the crash scene from the sight of passing motorists in the both travel directions. Not only does this considerably reduce the “rubber-necking” effect in the opposing travel direction, but it has an added benefit in that it can serve to reduce the number of “rubber-necking” induced crashes which otherwise can multiply the congestion impact of single crashes. Such portable accident screens have been deployed in several countries including the Netherlands, the UK and the USA.
8.2 Roadwork Management
Roadworks are often necessary to maintain or improve infrastructure in order to deliver ultimately smoother traffic flows but they can be trigger important surges in congestion if not managed properly. The scheduling of such interruptions are oftentimes known in advance to road authorities, but not necessarily to road users who oftentimes experience the onset of these as “unexpected” periods of congestion. It is therefore critically important then that road managers both include congestion management actions when developing and carrying out road maintenance/expansion activities as well as inform road users well in advance of such work, if possible. Traditional communication vectors such as print and radio can alert travellers to forthcoming roadworks prior to their departure while radio, variable message signs and, ultimately, interfaces with in-vehicle navigation systems can inform travellers already underway of potential roadwork-related blockages. Other strategies8 that reduce the impact of roadworks on traffic flows include working during off-peak hours, especially at night, and diverting traffic flows on other alternative roads. Work zone safety rules and protocols are also important from the perspective of work zone related congestion reduction since they can help avoid induced accidents and the congestion that these entail.
In Boston, USA, the Southeast Expressway reconstruction project has used contra flow lanes to compensate the loss of capacity. It has also developed the alternative routes by better pavement and signing or promoted alternative modes by park-and-ride facilities and information on public transport and ride sharing. Partnership with local authorities and private companies has led to better information for citizens and working time flexibility for commuters. This policy has resulted in a decrease by 9% on northbound traffic and thus reduces the risks of roadwork-related congestion and accidents 9
With the goal to give at least high quality information to the road users, the Hessian Road and Traffic Authority (HLSV) introduced in 1997 an internet-based roadwork information service (see Figure 8.4). The next step is to find solutions, which enable the authority to plan the road works in a
188 – IMPROVING THE RELIABILITY OF URBAN ROAD SYSTEM PERFORMANCE
MANAGING URBAN TRAFFIC CONGESTION – ISBN 978-92-821-0128-5 - © ECMT, 2007
way that the risk of congestion is minimised. For that goal, HLSV has developed and introduced the comprehensive roadwork management system Hessen to coordinate the planning and execution of road works and to avoid, respectively minimize, congestion caused by road works.10
The user can manually modify the beginning time for his planning scenario. Concrete options for the decision support are selection of different risk scenarios for traffic demand and capacity, variation of the roadwork beginning and its duration. Manual simulation of the roadwork impact is used by activating discrete time shifts (interactive shift of the beginning time of the road work by +/- 30 minutes).11
In a similar vein, the English Highways Agency uses a software package – QUADRO – to optimise road works in the United Kingdom.
Roadwork management is concerned with optimising the trade-off between delays to road users and the cost of different options for carrying out the works. For busy roads, there is a good case for carrying out most of the works at night, when the costs to the highway authority are higher, but the costs of delay are lower. And the decision of whether to close a complete carriageway or a single lane is based on similar analysis.
Roadwork management is usually granted by local administrators, transport operators and public work companies. Information has to be provided before the beginning of the roadwork and managed till the end.
Finally, it should be noted that some road administrations are fundamentally re-thinking the relationship between maintenance activities on the road network and the congestion these give rise to. Indeed, rather than asking how the impact of scheduled maintenance activities on traffic flows can be minimized, they have asked how to do away with, or at least greatly reduce the frequency of, necessary maintenance activities. One example is the use of long-life pavement materials requiring re-surfacing up to every 30 years rather than typical pavement surfaces which, on average, must be re-surfaced every 10 years. In many highly trafficked areas, the added costs of long-life pavements are more than covered by the added benefits of these pavements including the avoided work zone related congestion.12
8.3 Urban Freight Management: Better Managing Goods Distribution in Urban Areas
Freight transport and goods distribution suffer from congestion while, at the same time, they contribute to traffic slowing or blocking traffic – especially within the dense street networks that characterise many urban centres. Inadequate freight delivery bays lead trucks to partially or wholly block off streets while loading or unloading goods. Much of this can be seen with removal/moving trucks. In effect, these deliveries cause micro- and temporary bottlenecks that can quickly trigger extreme and sometimes durable congestion at peak hours despite the tight mesh of streets within urban areas. These bottlenecks are difficult to predict – at least with any precision – and thus contribute to unpredictable travel conditions that weigh heavily on individual travellers and negatively impact commercial travel. Thus measures seeking to rationalise and better manage urban goods distribution have an important role to play in alleviating congestion.
Many urban areas have sought to reduce the disruptive impact of on-street deliveries on urban traffic. These impacts have risen in recent years as new production and logistics patterns have favourised “just-in-time” deliveries. By reducing inventory stocks and relying increasingly on “floating” stock held in delivery vehicles, businesses have contributed to new commercial traffic patterns characterised by frequent and less-than-full truckloads with all of their concomitant impacts on urban traffic congestion.
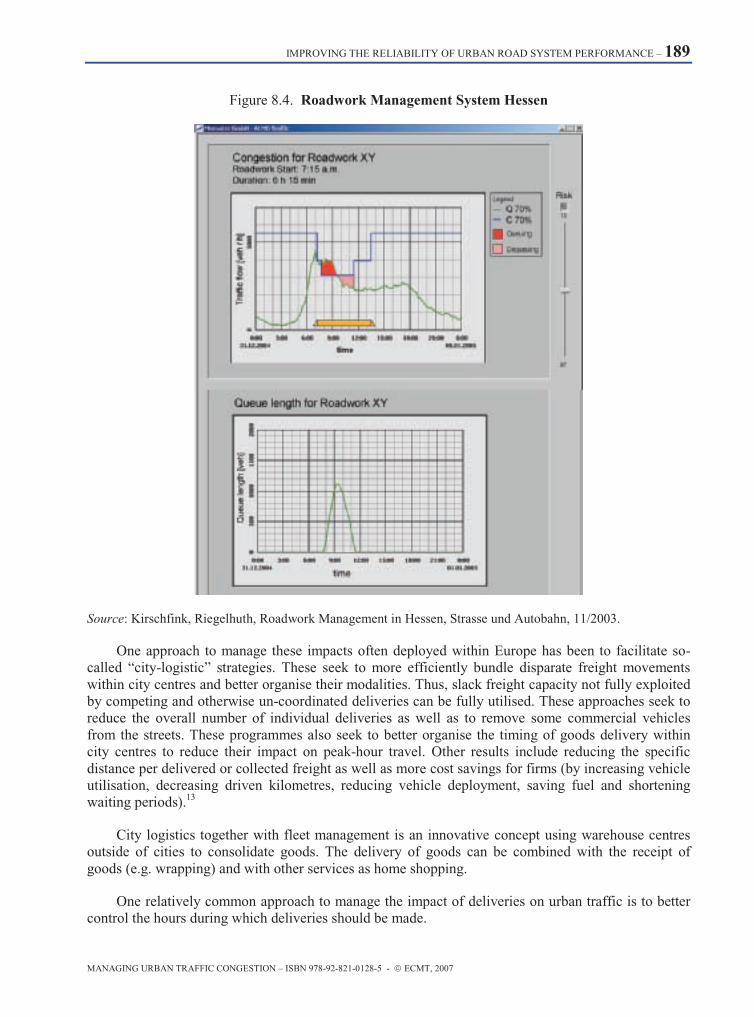
IMPROVING THE RELIABILITY OF URBAN ROAD SYSTEM PERFORMANCE – 189
MANAGING URBAN TRAFFIC CONGESTION – ISBN 978-92-821-0128-5 - © ECMT, 2007
Figure 8.4. Roadwork Management System Hessen
Source: Kirschfink, Riegelhuth, Roadwork Management in Hessen, Strasse und Autobahn, 11/2003.
One approach to manage these impacts often deployed within Europe has been to facilitate so-called “city-logistic” strategies. These seek to more efficiently bundle disparate freight movements within city centres and better organise their modalities. Thus, slack freight capacity not fully exploited by competing and otherwise un-coordinated deliveries can be fully utilised. These approaches seek to reduce the overall number of individual deliveries as well as to remove some commercial vehicles from the streets. These programmes also seek to better organise the timing of goods delivery within city centres to reduce their impact on peak-hour travel. Other results include reducing the specific distance per delivered or collected freight as well as more cost savings for firms (by increasing vehicle utilisation, decreasing driven kilometres, reducing vehicle deployment, saving fuel and shortening waiting periods).13
City logistics together with fleet management is an innovative concept using warehouse centres outside of cities to consolidate goods. The delivery of goods can be combined with the receipt of goods (e.g. wrapping) and with other services as home shopping.
One relatively common approach to manage the impact of deliveries on urban traffic is to better control the hours during which deliveries should be made.
190 – IMPROVING THE RELIABILITY OF URBAN ROAD SYSTEM PERFORMANCE
MANAGING URBAN TRAFFIC CONGESTION – ISBN 978-92-821-0128-5 - © ECMT, 2007
In Athens, the access to the downtown area is restricted for heavy vehicles during the morning peak hour. The implementation of this measure has proved successful, as travel average speeds have increased by a significant amount in the city centre.14
Other strategies implemented to reduce the impacts on travel time reliability and congestion imposed by heavy vehicles in urban areas are to optimise operations by creating separate lanes and tolls, improve shipping points and arrange signal timing and facilities at intersections. These measures can improve truck flows but do not necessarily act on traffic volumes.
It is also possible to impose charges on trucks for the use of infrastructure. This can influence firms to reduce the number of trips, to better utilise truck capacity and/or to use the alternative modes, where feasible and cost-effective. However, such an approach raises important issues relating to what exactly is being “priced”. Is it the truck’s damage on the road? If so, then this is not directly related to congestion. Is it the greater marginal cost imposed by trucks on urban traffic? If so, then an argument can be (and has been) made that in fact it is cars that impose greater marginal costs on trucks15 – especially as it can be argued that the it costs less and is more feasible to remove cars than trucks from urban roads (since passengers may have the option of travelling by public transport). These are all issues that must be addressed when looking at if and how freight delivery should be priced any differently than other vehicles.
The measures listed above have the potential to reduce or otherwise fluidify traffic on urban roads, but many are difficult to implement because of the technical and institutional barriers and the possible economic losses to individual firms. Also, as with many other isolated measures that seek to increase available road capacity, induced demand effects could negate any gains delivered through reduced and better organised urban goods delivery.
A long-term policy consists in changing business-operating practices: restricting shipping on peak periods, limiting the numbers of deliveries by better managing deliveries and encouraging mode shifts where local conditions permit. These approaches involve cooperation between private and public authorities to insure that the changes will be beneficial for both parties.
Measures, which potentially increase the cost of deliveries may add to the cost of living in urban areas as well as, in the case of night time deliveries, cause local environmental problems from night time traffic noise. However, these strategies may sometimes deliver more benefits than costs.
In Barcelona is experimenting with night-time freight delivery using low noise vehicles.
While most goods deliveries in urban areas can best be accomplished by road, there are some instances where it makes commercial and congestion-policy sense to seek to shift some flows to alternative modes. These may include serving a specific corridor by rail – or seeking to alleviate through freight traffic – by shifting it onto rail (see box). Other instances may include the use of waterways and canals for goods distribution and bulk shipping to and from urban goods distribution centres (as in the case of Amsterdam and Paris). Even tramways may potentially be used for site-specific urban distribution.
An example from Vienna (Austria): a freight tramway using is tested in the feasibility study GueterBim (since 2005), that continues the traditional using of freight tramway discontented fifty years ago there.

IMPROVING THE RELIABILITY OF URBAN ROAD SYSTEM PERFORMANCE – 191
MANAGING URBAN TRAFFIC CONGESTION – ISBN 978-92-821-0128-5 - © ECMT, 2007
Two Case Studies of Freight Congestion Management Practices in the United States
The Alameda Corridor, Los Angeles, CA, and Long Beach, CA
The Alameda Corridor is a 20-mile freight rail expressway between the neighbouring ports of Los Angeles and Long Beach and the transcontinental rail yards and railroad mainlines near downtown Los Angeles. The centerpiece is the Mid-Corridor-Trench, a below-ground railway that is 10 miles long, 30 feet deep and 50 feet wide. By consolidating 90 miles of branch rail lines into a high-speed expressway, the Alameda Corridor eliminated conflicts at more than 200 at-grade railroad crossings where cars and trucks previously had to wait for long freight trains to slowly pass. It also cut by more than half, to approximately 45 minutes, the time it takes to transport cargo containers by train between the ports and downtown Los Angeles.
The project was constructed at a cost of $2.4 billion by the Alameda Corridor Transportation Authority – a joint powers agency known as ACTA and governed by the cities and ports of Los Angeles and Long Beach and the Los Angeles County Metropolitan Transportation Authority. The Alameda Corridor opened on time and on budget on April 15, 2002. It was funded through a unique blend of public and private sources, including $1.16 billion in proceeds from bonds sold by ACTA; a $400 million loan by the U.S. Department of Transportation; $394 million from the ports; $347 million in grants administered by the Los Angeles County Metropolitan Transportation Authority and $130 million in other state and federal sources and interest income. Debts are retired with fees paid by the railroads for transportation of cargo on the Alameda Corridor and for cargo transported into and out of the region by rail even if the Alameda Corridor is not used.
The project has focused on delivering the following outcomes:
• Reduced traffic congestion on surface streets by eliminating conflicts at 200 street-level railroad crossings.
• Slashed emissions from idling cars and trucks by 54%. • Cut emissions from locomotives by 28%. • Increased efficiency of cargo distribution network to accommodate growing international
trade.
Since the start of operations on April 15, 2002, the Alameda Corridor has handled an average of 35 train movements per day – a figure consistent with earlier projections for this stage of operations. Usage is projected to increase steadily as the volume of international trade through the ports grows. The ports project the need for more than 100 train movements per day by the year 2020. The Alameda Corridor can accommodate approximately 150 train movements per day. The Alameda Corridor is intended primarily to transport cargo arriving at the ports and bound for destinations outside of the five-county Southern California region (imports) or originating outside the region and shipped overseas via the ports (exports). This accounts for approximately half of the cargo handled by the ports. The other half of the cargo handled by the ports is bound for or originates in the region, and that cargo is transported primarily by truck.
Chicago Region Environmental and Transportation Efficiency (CREATE) programme, Chicago, IL
The CREATE (Chicago Region Environmental and Transportation Efficiency) program is a proposed $1.5B public/private partnership including the City of Chicago, the State of Illinois and the Association of American Railroads (AAR) representing six freight railroads and Chicago’s commuter railroad, Metra. The program would improve network operations principally along four freight rail corridors and a commuter rail corridor in the Chicago area. The program of approximately 80 individual projects includes six rail-rail flyovers; 49 miles of new track; centralized traffic control for the corridors’ 122 route miles; 364 new higher speed turnouts; and, 25 road/rail grade separations.

192 – IMPROVING THE RELIABILITY OF URBAN ROAD SYSTEM PERFORMANCE
MANAGING URBAN TRAFFIC CONGESTION – ISBN 978-92-821-0128-5 - © ECMT, 2007
The Chicago rail/freight hub is widely considered as the nation’s busiest and its operations have significant influence throughout the region and nation. If the program is completed, its proponents are predicting substantial national, regional and local economic benefits as well as safety and environmental benefits.
The freight railroads have committed $212M, the State will be making a decision on proposed bond funding of $300M in the coming weeks, and the City has made an unspecified financial commitment which we understand to be in the range of $100M. The project proponents are hoping for a substantial earmark ($900M-$1B) in the TEA-21 reauthorization bill, but the program’s major sponsor, Rep. Lipinski did not run for reelection.
USDOT expressed public support for the program and has been working with the stakeholders. An intermodal team with headquarters and field personnel from OST, FHWA, FTA, and FRA representatives has been established.
Source: FHWA, questionnaire response.
Chapter Summary
• Congested roads are generally unreliable roads – research indicates that while variability of travel times is insignificant under a volume capacity (v/c) ratio of 0.9, it increases sharply to a v/c of 1.3, where it ceases to increase further – thus much of what can be done to reduce excess congestion will also deliver travel time reliability benefits.
• Research into travel time reliability largely supports the findings from recent traffic management and transport economics research – travel time reliability can best be delivered when traffic is managed such that actual flows are below the road’s physical capacity.
• Research suggests that measures that increase intersection capacity in dense urban networks can deliver trip reliability benefits without necessarily improving average travel times. Despite their limited impact on average travel times, the trip reliability benefits derived from these measures deliver tangible benefits to roadway users.
• More generally, small reductions in v/c ratios can deliver large reliability benefits – especially if these bring v/c below 1.0 – even if they do not deliver tangible travel time benefits.
• The largest benefits in travel time reliability may occur at inter-peak times – the greatest benefits stemming from reliability-specific measures would flow to those who can re-schedule their departure times away from the highly congested peak.
• Three particular measures can greatly contribute to improved reliability of travel times. These are coordinated incident management policies, better coordinating and managing roadwork in order to reduce congestion and better managing urban freight transport. Implementing policies in these areas not only increases the predictability of road system performance, but is typically very cost-effective in large urban areas.
IMPROVING THE RELIABILITY OF URBAN ROAD SYSTEM PERFORMANCE – 193
MANAGING URBAN TRAFFIC CONGESTION – ISBN 978-92-821-0128-5 - © ECMT, 2007
NOTES 1. Ensor, M. (2004a) and Ensor, M. (2004).
2. Chin, S.M. et al (2004).
3. The report makes a distinction between loss of capacity and its impacts. Major roadworks carried out at night on a rural motorway may result in a significant loss of capacity (as measured in closed lanes) but will have little real impact on travellers since so few travel at that time and on that facility. Also, even if losses of capacity are recorded for urban areas, the report notes that because motorway capacity is often overdimensioned to absorb peak-hour flows, the resulting loss of capacity off peak may not entail any significant impacts. Our discussion of this report focuses then on the impacts triggered by the loss of capacity and not on the loss of capacity itself.
4. OECD, (2003).
5. It should be noted that “rubber-necking” itself is an important cause of crashes – Chin, S.M. et al (2004) finds that 16% of crashes are caused by drivers having their attention diverted by other crashes or incidents.
6. Florida Department of Transportation (http://www.dot.state.fl.us/).
7. FHWA, (2006a).
8. For a comprehensive listing of these, see the ARROWS practical handbook on workzone management: http://www.ntua.gr/arrows/.
9. ITE (1997).
10. Kirschfink, H. and Riegelhuth, G. (2003).
11. Kirschfink, H. and Riegelhuth, G. (2003).
12. For a thorough discussion of this topic, see OECD (2005b).
13. City-Logistik Magdeburg (2005) and City-Logistik Aachen (2005).
14. Questionnaire Greece, M. Karlaftis, National Technical University of Athens.
15. See, for instance, McKinnon, A. (2004).

LOCKING IN THE BENEFITS OF AVAILABLE CAPACITY – 195
MANAGING URBAN TRAFFIC CONGESTION – ISBN 978-92-821-0128-5 - © ECMT, 2007
9. LOCKING IN THE BENEFITS OF AVAILABLE CAPACITY: ACCESS CONTROL, PARKING MANAGEMENT AND ROAD/CONGESTION PRICING
9.1 Introduction
As noted in Chapter 6:
“in light of induced and/or suppressed demand, capacity-producing measures should always be accompanied by measures that manage traffic levels in order to lock in the benefits derived from new capacity”.
This is fundamental to mitigating congestion. It is important in part because the practical outcome of much of the efforts made to tackle traffic congestion has been to release capacity on existing infrastructure or to increase capacity by adding new infrastructure. There must also be a focus on measures that manage traffic levels on the newly available capacity.
Before examining the measures that are available to manage traffic levels, it is useful to keep in mind the range of organisations typically involved in congestion mitigation and the types of actions that they have predominantly been taking. In this respect:
• National transport administrations may have an oversight role relating to congestion mitigation processes and funding allocation (as in the US) but in most other countries they have a much more limited role and in many cases little or no direct involvement at all with measures on the ground in major metropolitan areas - particularly measures related to urban public transport improvement.
• National and state/provincial/ regional road authorities often have a more significant role and are more likely to be responsible for large road infrastructure developments in major metropolitan areas – such as new sections of motorways or new/increased capacity along arterial roads (e.g. by adding a new traffic lane). They also may be involved in measures that free-up capacity on existing arterial roads (e.g. imposing “clearways” by restricting parking or expanding intersection capacity).
• Local governments with responsibilities for local roads are more likely to be involved in all measures that improve traffic flows by adding local capacity (e.g. intersection widening), improving local flows (e.g. one way streets) or freeing-up capacity (e.g. parking restrictions on local roads).
• Where they exist, metropolitan planning organisations are likely to have wider, land use and transport oversight responsibilities. In some cases, there are integrated land use/transport organisations with planning and multi-modal transport development responsibilities which have greater ability to take action on a comprehensive basis.

196 – LOCKING IN THE BENEFITS OF AVAILABLE CAPACITY
MANAGING URBAN TRAFFIC CONGESTION – ISBN 978-92-821-0128-5 - © ECMT, 2007
Of course, Ministers at national level and at State/regional level can in principle oversee action across a broader range of strategies than each of their individual agencies may be responsible for alone. However, their ability to take action outside the responsibilities of their own administrations will most likely depend on the level of support and cooperation of the other portfolios involved. This generally requires extensive consultation over long periods, often with uncertain outcomes.
The more common institutional arrangements therefore are more likely to favour interventions that are within the direct control of the agencies involved – which often means measures that will increase the infrastructure supply side of the demand-supply balance – thereby increasing the throughput capacity of the roads concerned and allowing increased traffic volumes as well as a better matching of supply with demand – rather than addressing the demand side.
Such newly available capacity can generally be expected to reduce congestion and decrease travel times – in the short-run. However, as noted previously, private car and commercial vehicle drivers within the whole of the urban are not insensitive to these changes and will take advantage of improved travel conditions by shifting their routes to these faster ones or by shifting their travel times to take advantage of the improved conditions. The availability of less congested travel on these routes may also generate new trips by road that otherwise would not have occurred, including trips previously undertaken by non-road-based public transport. In other words, existing and currently suppressed demand for use of the road network will re-distribute itself across the network until drivers experience traffic conditions that they judge to be equivalent on the alternative routes available.
What matters most from the perspective of congestion management policy is the resultant level of demand on specific links and the whole of the network after congestion management policies have been put into place – and the rapidity with which new capacity is filled.
Many congestion management measures have tended to underestimate the relationship between newly-supplied capacity and the resultant demand for that capacity. This has often led to new or newly freed-up capacity being filled more rapidly than assessments and projections anticipated.
From the perspective of transport administrations and their responsibilities, while no doubt concerned about such outcomes, with congestion having (re-)appeared on the newly provided capacity more quickly than expected, this may be taken as evidence of the need they had foreseen for this additional capacity. Eventually the full use of the available capacity is likely to be taken as vindication for the increases in capacity the administrations provided.
However, from the perspective of previous users and new road users attracted to the new facilities, they might conclude that congestion has not improved, if the newly-supplied capacity is quickly overwhelmed by demand, travel conditions worsen and travel delays return to levels previously experienced.
These types of experiences – which have been repeated in most cities and regions in member countries around the world – are a reminder that one of the definitions of congestion is “too much traffic for the available infrastructure”. The experiences with road capacity being overwhelmed by demand bring into focus that strategies and measures for tackling congestion need to focus on the demand side i.e. the fact that there is “too much traffic”- as well as the supply side i.e. that there is “not enough capacity”.

LOCKING IN THE BENEFITS OF AVAILABLE CAPACITY – 197
MANAGING URBAN TRAFFIC CONGESTION – ISBN 978-92-821-0128-5 - © ECMT, 2007
9.2 Demand Management Policies
Demand management policies are needed if authorities are going to be able to deal with the demand side of the congestion problems in large metropolitan areas – i.e. the fact that there is “too much traffic”. Managing demand would help ensure that traffic flows on the network do not increase to levels where network reliability is continually put at risk.
Unlike operational measures to increase road capacity, reduce bottlenecks and increase travel flows, metropolitan road authorities often do not have the legislative powers and authority needed to implement demand management policies across large metropolitan areas, local road administrations are even less likely to have them.
The authority and powers needed to develop and implement demand management policies across large metropolitan areas actually reside at a higher level – i.e. with the governments responsible for transport and related policy considerations at a metropolitan-wide level.
Demand management policies therefore require higher level policy interventions. They require consideration of congestion problems and action on a metropolitan-wide network basis, rather than on the basis of corridors or local road links that are within the remit of the different road authorities principally involved at present i.e. the various national, State/regional highway authorities and local governments and their administrations responsible for local roads.
Demand management policies require coordinated metropolitan-wide strategies and measures, taking into account all transport modes and all available policy levers – rather than solely the individual contributions of the many bodies typically involved in supply-side approaches, with their characteristically highly decentralised powers, responsibilities and actions.
Importantly, demand management policies also involve measures that do not simply give individual motorists more of what they may think is required – i.e. more capacity. Instead, they are likely to involve measures that moderate demand (e.g. in peak hours), limit traffic capacity (e.g. for access to sensitive areas) or increase the costs faced by individual users to better reflect social costs involved.
Looking across the wide set of measures available to decision-makers to address congestion, there are relatively few that offer prospects of tackling congestion by moderating demand on a metropolitan scale. However, three distinct approaches stand out as being not only important in their own right, but also and principally because they can have an important impact on a broad scale in managing the resultant demand for use of the capacity delivered by most other congestion management measures. These measures focus on the behaviour of road users and involve:
• Access management and control. • Parking management and control. • Road/congestion pricing.
Consideration is given to these measures in the following sections.
9.3 Access Management and Control
Access management and control has been used to manage traffic demand in some of the most extreme cases of roadway congestion. Access control generally has set rules regarding either: the physical access to the road network; or access to limited zones such as downtown or sensitive areas.
198 – LOCKING IN THE BENEFITS OF AVAILABLE CAPACITY
MANAGING URBAN TRAFFIC CONGESTION – ISBN 978-92-821-0128-5 - © ECMT, 2007
Access control has therefore focused either on restricting access to the whole of the urban road network, a subsection of this network or to specific roadway links and zones within the network. We will examine each of these strategies and their implications in this section.
9.3.1 Access Control to Designated Areas (e.g. Downtown)
Some countries use access controls to restrict the volume of vehicles able to use the road system to travel into sensitive areas. While the objectives of such access controls may include restricting traffic, the reasons do not always relate solely to containing traffic congestion; other reasons such as protecting sensitive social, environmental or historical areas could be more important. Some examples are set out below.
Operational Considerations
Access control initiatives can apply to vehicles or drivers and generally take one of several forms.
• Limited access for selective kinds of vehicles
The outcomes achieved by access control measures (reduction of the volume of traffic, environmental effects, etc.) depend on the number of the vehicles potentially affected and the extent of exemptions. The more exceptions given, the softer is the handling of the limited access and the fewer the benefits that can be expected. In historical centres, there may be access restrictions only particular vehicles e.g. on heavy freight transport by use of blue zones for. SUVs have limited access to town centres in some countries.
• Permit-based systems
Permit-based schemes focus on limiting access to designated users. Only people who have a permit can enter the area. Local authorities choose the criteria for access and deliver permits to drivers.
• License-plates based systems
License-based schemes give access to only certain vehicles e.g. some license-plate numbers of vehicles on particular days.
These tools can happen to be efficient but they do not bring revenue and cause additional costs of implementation and enforcement. Indeed, the positive effect of such policies is often limited in time.
In Italy, car-free areas (since 1992 named Zone a Traffico Limitato, ZTL) were introduced in the historical centres of several Italian towns in the second half of the eighties.1 This measure was mainly meant to control the substantial growth in traffic congestion that was particularly damaging these neighbourhoods due to their ancient structure and the small dimension of their streets.
ZTLs were conceived as a ban on private car circulation implemented in city centres during certain hours of working days. The ban concerned all private vehicles, excluding those owned by people resident in the area, and a few categories of other drivers who needed their car because of working purposes.

LOCKING IN THE BENEFITS OF AVAILABLE CAPACITY – 199
MANAGING URBAN TRAFFIC CONGESTION – ISBN 978-92-821-0128-5 - © ECMT, 2007
Athens Case Study
In Athens, private vehicle access in designated Athens downtown areas (Athens ring road) is restricted, depending upon the date and the last digit of the license plate. Vehicles that have an odd last digit in their license plate are allowed to enter the designated area when the date is odd. The opposite holds for vehicles whose license plate has an even last digit. Permanent inhabitants within the small ring are excluded from the measure. In cases of extreme weather or other special conditions, and especially when pollutants are expected to be high in the atmosphere of Athens, the designated area is expanded. The access control holds Monday through Friday, from 08:00-21:00. As well, heavy vehicles face strict restrictions regarding their ability to cross and/or access the city’s downtown area during morning peak hours. The restriction area is called the blue zone and recent studies have shown that the implementation of this measure has helped increase travel speeds in the city center by a significant amount.
Controlling congestion in Athens is also of extreme cultural importance. Congestion mitigation in the Athens downtown area around the Acropolis, the historical centre of Athens, includes various traffic calming measures in order to preserve the historic heritage. Only public transportation, emergency vehicles, two wheel vehicles and pedestrians are allowed to access the roads within the historical centre. Car use is allowed only to those who they permanently live in the area. Moreover, shop supplying is only allowed at night.
Source: Response to Questionnaire – (Greece).
In principle, this measure should have allowed the municipalities to recover important urban spaces for other uses: walking, shopping, tourist and leisure activities. In practice, the regulation undoubtedly produced - at least in the short run - a substantial reduction in congestion in these areas.
For example, access limitation in Bologna led to a reduction of the volume of traffic from approximately 128 500 (in 1986) down to 91 000 for in- and out-going vehicles. In Florence, these types of measures have resulted in a reduction of approximately 25% - and have also delivered important environmental benefits within the restricted zone.
The access restriction measure, however, as it was initially conceived in some towns, was probably too ambitious. Traffic bans were imposed in areas so large, and so important for their social and economic activities, that they could not realistically be implemented quickly – even if the measure had been explicitly supported by most of the population, as it was the case for a few towns.
The way the local Councils found to implement the measures quickly was to deliver a considerable number of special permits, which allowed vehicles to circulate within the car-free area, in spite of the ban. Although the permits were given – at least in the beginning – only on the basis of soundly motivated requests, this created a rather strange and difficult situation. Car-free areas were, in fact, far from free of them. The number of residents and special categories of workers entitled to enter ZTLs soon became too great to allow any substantial reduction in congestion.
Some of the original ZTL towns have moved on and have sought to improve upon the original approach.

200 – LOCKING IN THE BENEFITS OF AVAILABLE CAPACITY
MANAGING URBAN TRAFFIC CONGESTION – ISBN 978-92-821-0128-5 - © ECMT, 2007
Rome Case Study
The Municipality of Rome, in 1999, took the decision to not only put in place an automatic enforcement system for the ZTL based on license plate recognition technology – but also decided to integrate the ZTL-based approach to a more comprehensive regional mobility action plan. The ZTL was limited to the epicentre of Rome since its inception in 1989. Like many other ZTL’s access was based on a permit system and many exemptions were granted (for residents, public services, goods delivery, etc). Starting in 1998, non-residents were made to pay (either on a per-trip or by a yearly flat fee) for access to the zone thus moving away from the system multiple exemptions. “Exemption” permits were still issued but their number decreased by 10% per year through 2003. At the same time, increased restrictions were placed on the types of vehicles that could enter the zone (e.g. only catalysed vehicles).
These improvements on the original ZTL approach have been very effective and an immediate and sustained drop-off of traffic levels within the ZTL has been recorded from 2001 on (see Figure below). However, as with other access-restriction regimes, there have been some unforeseen consequences. The first of these is the increase in motorised 2-wheel access to the ZTL and the second has been the relative increase in off-scheme evening traffic.
0
2000
4000
6000
8000
10000
12000
14000
16000
18000
0%
10%
20%
30%
40%
50%
60%
Valore assoluto degli accessi sanzionabili nel periodo di esercizio Valore percentuale degli accessi sanzionabili rispetto alla domanda di accesso
I trimestre 2002 II trimestre 2002 III trimestre 2002 IV trimestre 2002 I trimestre 2003IV trimestre 2001
2001 2002 2003
Sciopero Trasporto Pubblico 14/03/03
Source: Image: Calamente, 2004.

LOCKING IN THE BENEFITS OF AVAILABLE CAPACITY – 201
MANAGING URBAN TRAFFIC CONGESTION – ISBN 978-92-821-0128-5 - © ECMT, 2007
9.3.2 Access Control for Specific Roadway Links (e.g. Ramp Metering)
Freeway entrance ramps and their merging processes are often a major cause of recurrent congestion on limited access roads such as freeways in metropolitan areas.
Ramp metering aims to reduce this congestion by staggering the volume of traffic that enters the highway traffic from on-ramps when the freeway is heavily trafficked. Therefore it makes use of traffic signals at freeway on-ramps to control the rate of vehicles entering the freeway. The signals can be set for different metering rates to optimize freeway flow and minimize congestion.
Operational Considerations
Signal timing algorithms and real-time data from mainline loop detectors are often used for more effective results. In some studies, ramp metering has proved to reduce breakdowns and to improve overall traffic conditions. Through the smoothed merging process, the number of accidents can be reduced significantly. Negative effects of ramp metering can be found on the metered ramps as travel times increase. There may be spillbacks on the secondary road network. This sets the prerequisite of enough space on the metered ramps. There also could be diversion effects because of longer travel times on the on-ramp. Local emissions near the ramp may increase from stop-and-go conditions and vehicle queuing on the ramp.
Like many modern ITS applications, ramp metering was first tested and installed in the USA. The first installation was in Chicago in 1963 and since then in over 2 500 sites in the USA. In Europe, ramp metering is in use in the Netherlands, Great Britain, France, and Germany (Source: ACEA).
However, when traffic flow is really significant, there are new problems of congestion on the ramp or there could be spillbacks on the secondary road network. The drivers tend to choose another way and create new traffic jams on different roads. This sets the prerequisite of enough space on the metered ramps.
In Minnesota, United States, a study has shown that the suppression of a ramp meter has caused an increase in travel time of 25% and rise in crash of 26%.
Fig. 9.1 illustrates common characteristics of ramp-metered traffic flow during the morning commute peak-hours in San Diego, U.S.A. (upper graph) and traffic volumes and speeds on a day when the ramp-metering was out of operation (lower graph). Without ramp metering, flows on the motorway are significant unstable and relatively slow (less than 30 miles per hour).
In summary, traffic flows on urban motorways can be protected by ramp metering which reduces traffic on the motorways by restricting/managing the access of vehicles at the point(s) of entry.
Ramp metering can be applied to the whole or a part of the motorway network. While still a queuing –based approach, the queues are shifted off the motorway network, meaning that users seeking to travel on already overloaded motorways experience the delays directly; and motorway users are protected from the delays and additional costs that additional users on the motorway network would impose on all other users. Importantly, ramp metering can also be implemented without having to impose direct charges for use of the network (e.g. in peak periods) and should be seriously considered in metropolitan areas where authorities choose not to impose direct road or congestion charges.
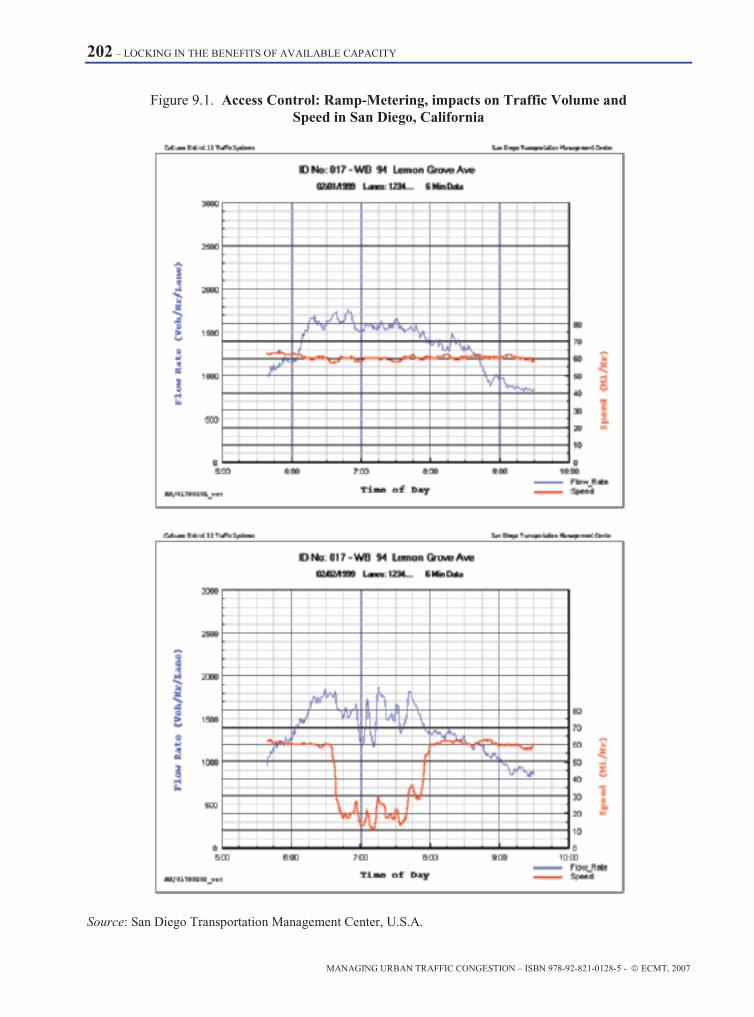
202 – LOCKING IN THE BENEFITS OF AVAILABLE CAPACITY
MANAGING URBAN TRAFFIC CONGESTION – ISBN 978-92-821-0128-5 - © ECMT, 2007
Figure 9.1. Access Control: Ramp-Metering, impacts on Traffic Volume and Speed in San Diego, California
Source: San Diego Transportation Management Center, U.S.A.
LOCKING IN THE BENEFITS OF AVAILABLE CAPACITY – 203
MANAGING URBAN TRAFFIC CONGESTION – ISBN 978-92-821-0128-5 - © ECMT, 2007
9.4 Parking Management and Control
Parking management and control is a policy lever that is readily available but one which often seems greatly under-utilised by authorities seeking to tackle traffic congestion.
Like road-pricing and other demand-side approaches, parking management and control can help tackle traffic congestion by reducing the demand for travel into the area encompassed. Parking management, due to the considerable flexibility this approach has, can also be quite specifically targeted in the sense that it can be applied on the basis of location and time. Parking management and control is therefore important because, unlike many supply-side measures, parking management has the potential to modify demand on a wide area basis.
Parking control is generally accepted as a means of rationing the use of limited parking spaces in high activity locations (e.g. with 2 hour parking limits). However, it is less readily accepted by the general public as a means of controlling overall car use and thus may, if used in isolation of other measures, be less effective for mitigating congestion on principal thoroughfares in the city.
This section will address the effectiveness of parking management and control in tackling traffic congestion. The section focuses on two different but potentially complementary approaches: physical limits on the parking spaces available; and increases in parking costs. By limiting the spaces available or in use, parking control aims to reduce the number of vehicles on the road network. While not directly an access control measure, parking policy, by allowing or preventing vehicles from occupying road and off-road parking, can be seen as a indirect form of access control.
Uncontrolled and free parking in inner cities, especially at work places, is considered as one of the major – albeit – indirect causes of traffic congestion in large urban areas. Such abundantly available free parking draws cars into urban areas and hampers efforts to promote the use of alternative modes in cities. Alternatively, however, too little parking supply in the face of high car use leads to congestion due to “cruising” or searching for available parking spaces. In some large cities, such “cruising” has been estimated to account for a significant portion of traffic at any given moment. Therefore parking management, as part of a bigger demand management strategy, is essential to balance demand and supply.
There are a number of fundamental tensions inherent in urban parking management. The first is that cities want to ensure a high level of accessibility – including accessibility by car – while at the same time wanting to not flood the city with traffic or pave it over with excess parking. There is also a tension between the level of parking that local transport authorities may wish to see provided and the level of parking that businesses feel are essential for their viability and/or other branches of government (e.g. economic development) may wish to have available. Related to the last point is the tension between what local authorities might control (on-street parking) and what the private sector may control (off-street parking). Finally, there is a very real and important tension between the parking expectations that city inhabitants might have (e.g. to be able to have an on-street parking space) and the parking expectations of city “users”2 (e.g. to have sufficient parking available to them to carry out their activities).
These tensions have oftentimes escaped any form of coordinated or rational arbitration and a set of oftentimes incoherent parking rules and policies have evolved within and across urban areas as a result. This situation has served to undermine congestion-management strategies in the past. A comprehensive approach parking management can address this situation and is thus an essential element in a balanced congestion management strategy.
204 – LOCKING IN THE BENEFITS OF AVAILABLE CAPACITY
MANAGING URBAN TRAFFIC CONGESTION – ISBN 978-92-821-0128-5 - © ECMT, 2007
There are many possible parking strategies that can be deployed in support of congestion management policies and these are oftentimes complementary. Generally however, there are those measures that target the provision of publicly provided on-street or off street parking and those measures that seek to indirectly manage the privately owned and controlled sparking stock – and in particular, workplace parking and parking at commercial destinations.
Parking management, as an indirect access control, is a regulatory approach of provision, control, regulation and restriction of parking. It means limiting the number of parking lots and designating beneficiaries with preferential treatment for residents and high-occupancy vehicles for example. Supply management also regulates the location of parking lots: off-street car parking in key locations together with relevant information for potential users can limit on-street parking and thus to decrease congestion due to park search. Finally, it is important to ensure that regulations are respected.
To avoid negative effects of restricted parking supply such as obstruction of other modes by illegal parking, traffic in search for parking space and others, parking management policies have to consider the following main aspects:
• Parking pricing is a crucial requirement for a successful parking management. In order to maintain accessibility it has to be sensible and aware of counterproductive effects.
• Consistent practises and prices have to be used throughout the whole urban area or district, and parking management strategies have to be co-ordinated beyond the main congested area.
• Public and private parking suppliers cooperate and work out one integrated parking management scheme in order to guarantee a balanced supply.
• Convenient and accurate information about available parking space is especially needed for efficient use of parking facilities and to avoid unnecessary traffic searching for parking space.
• Parking space should be managed and priced according to its convenience and priority users. Important aspects are:
− Location: adjacent/close/further away to destination, e.g. inner city.
− Time of day and duration.
− Type of user and their activities: living/working/visiting/shopping/delivery.
− Incentives for high-occupancy vehicles can be an additional measure to reduce car traffic.
− Integrated multi-purpose parking facilities serve more users using less space than individual parking lots, e.g. at theatres or shops. Parking space can be shared between user groups according to their parking patterns, destinations and different peak periods.
− It is very important, that appropriate enforcement programmes have to be implemented in the parking management to ensure the strategy’s success.
Pricing is an effective measure to regulate available parking. In many instances, authorities may seek to fix parking pricing in urban centres, so that car and parking use remain less attractive than public transport. The fee can depend on:
• Location: higher in inner-urban areas.
• Duration: increase with time, in inner cities, or decrease, in outer-urban area.
• Nature of the car owner: preferential fare for residents and car-pool.

LOCKING IN THE BENEFITS OF AVAILABLE CAPACITY – 205
MANAGING URBAN TRAFFIC CONGESTION – ISBN 978-92-821-0128-5 - © ECMT, 2007
The type and the rates of pricing reflect the goals of the policy adopted, but it seems important to harmonise the fare of neighbouring cities to prevent an economic imbalance in regions.
In Prague, the vast demand and moderate supply have led to parking control in the city centre. Three zones of parking have been introduced: short time periods (less than 2 hours) in best-located areas, longer periods (less than 6 hours) for visitors and unlimited parking for residents. While fares are higher for short-time parking lots, residents have to pay ten times more to obtain a parking space for their second car than what a parking lot for one car would cost.
Parking policy has also a large impact on travellers’ behaviour: they choose other modes of transport, shorten their stay, change their travel time or choose another parking facility. Therefore, this measure can contribute to congestion management and lead to travel-time savings and decreasing emissions. Nevertheless, negative effects of shifting traffic should be considered to develop effective parking management strategies before implementing pricing of parking.
Within the Munich MOBINET project, parking management measures have been tested and implemented. The objectives of the project included: managing parking supply in order to improve the situation for residents and “qualified demand” (shoppers, visitors, delivery etc) and increasing the accessibility of inner city neighbourhoods by creating disincentives for long-term commuter parking. By differentiating the parking supply according to zoning structures and characteristics of the qualified demand and creating designated share of parking supply for mixed-use, the management strategy proved very successful as figure 9.2 illustrates.
Figure 9.2. Before and After Implementation of Parking Management Measures
Source: Munich; MOBINET; 2003.
Parking management also includes park-and-ride (P+R) facilities that are common situated in suburbs locations for support of high occupancy vehicles and public transport. This policy should be developed together with public transport-related measures.
Parking management is a measure to encourage certain users, for example employees, to use their cars less. At the same time, sufficient and attractive alternatives have to be provided as “pull”-factors, as well. Therefore, providing enough capacity and high quality public transport with prices in adjusted relation to parking prices is a crucial requirement for successful parking management. On the other hand, parking management can improve the balanced accessibility of the city and contribute to a higher modal share of public transport. As another part of an integrated strategy, improved conditions for cycling like providing parking facilities for bicycles and save infrastructure for cyclists should be

206 – LOCKING IN THE BENEFITS OF AVAILABLE CAPACITY
MANAGING URBAN TRAFFIC CONGESTION – ISBN 978-92-821-0128-5 - © ECMT, 2007
considered, as well. Furthermore, Park-and-Ride (P+R) facilities at the edge of metropolitan areas can help to increase the modal share of public transport.
Figure 9.3 illustrates how combining Park and Ride facilities with advanced information provision on roadway travel times and public transportation travel times can provide a compelling and effective tool to mitigate congestion. In the case of the Makuhari New City Pilot project road users encouraged to make use of the Park and ride facilities at strategic points in the oftentimes congested eastern approaches to Tokyo. Travel times for travel on the un-tolled National Rt. 357, on the tolled motorway and on the Japan Rail Keiyo Line are communicated upstream of the Park and Ride facility and toll, rail and parking costs are communicated as well. Thus, travellers facing high levels of congestion on route 357 can either opt to pay for use of the motorway or park their car and take the train in to Tokyo.
Figure 9.3. Combining Park and Ride with Real-time Traveller Decision- Making Information: Tokyo Region
Makuhari New City
Tokyo Station
Makuhari Station
Motorway
National Route 357
Japan Rail Keiyo line
Travel Time Information (National route 357 at Makuhari)
90minutes by road
30minutes by highway
40minutes by rail
P&R parking lots are available
Source: Japanese Ministry of Land, Infrastructure and Transport.
However, care should be taken to not offer Park and Ride facilities an such a manner that it is more attractive to use the car + Park-and-Ride (P+R) instead of using a rapid transit system for the whole distance – unless policy goals warrant this. There are examples in Germany, where as much as 60% users of new Park-and-Ride-facilities had been using public transit for their whole trip before the new Park-And-Ride-supply was installed.
A good example for marketing Park-and-Ride-facilities is a national Park-and-Ride Directory in the United Kingdom to be accessed via Internet, which provides pre-trip information about available Park-and-Ride-facilities, their location and prices throughout the whole country. The directory is accessible at http://www.parkandride.net.
Another measure concerning parking is the kiss-and-ride (K+R) system for people, who just park for few minutes to drop or pick up their passengers. This system is successful at various public transport stations outside of the town centre. It supports also ride-sharing of commuters See figure 9.4.
The implementation of parking measures requires an analysis of the demand to find a convenient level for parking areas. It is also necessary to act in agreement with local authorities and private firms to apply parking regulations.

LOCKING IN THE BENEFITS OF AVAILABLE CAPACITY – 207
MANAGING URBAN TRAFFIC CONGESTION – ISBN 978-92-821-0128-5 - © ECMT, 2007
Figure 9.4. “Kiss and Ride” Parking at a Metro Station in Prague
Source: http://www.udi-praha.cz, 2005.
There is parking charge for private vehicles in Barcelona. Local authorities have decided to support motorcycles instead of cars in the city. Non-charged parking for motorcycles is available. This policy contributes in saving parking space and mitigates environment damage and congestion. The motorcycles are used all year round in Barcelona because of the nice weather in the city (figure 9.5).
Figure 9.5. Motorbike Parking in Barcelona
Source: Credit: Eva Gelová, 2005.
This policy can be very effective if it is applied at a wide area level, which makes it all the more difficult to set up. The partnership with private sectors to reduce or to maintain the number of parking lots is the key of a successful implementation. It restrains the expansion of private parking areas. When considering public parking, it seems essential to control it, and to make respected regulations by turning them into a useful form of organization.
Another key issue to keep in mind when considering parking policies is that these are most effective for areas with a large share of origin- or destination- traffic. For areas characterised by a significant amount of through traffic, parking measures may be less effective than might otherwise be. Furthermore, absent any accompanying demand management measures, successful parking policies that reduce the overall amount of originating and destination traffic may in fact free up road capacity for greater levels of through traffic thus exacerbating the congestion problem that the parking policy was meant to address.
208 – LOCKING IN THE BENEFITS OF AVAILABLE CAPACITY
MANAGING URBAN TRAFFIC CONGESTION – ISBN 978-92-821-0128-5 - © ECMT, 2007
Finally, parking policies should consider and account for the amount of parking available at workplaces and at commercial destinations – as well as in certain residential developments – as these can have an impact on the volume of traffic leading to and from these locations. In many instances, urban zoning requirements require that developers provide a minimum number of parking spaces in order to receive building or development permits. This policy, originally meant to ensure that streets adjacent to these developments be swamped with parked vehicles, may work against other parking management objectives that may seek to cap or otherwise limit parking availability in urban developments. In some instances, cities have sought to change their zoning and land-use development statutes to reflect maximum, rather than minimum, parking provisions. However, such approaches require that cities ensure a high level of non-car – and in particular, public transport – access to these developments for these to avoid the original problem of cars illegally parking or otherwise crowding on-street facilities. In some cases, as in Zurich (see box), cities have successfully linked a flexible interpretation of urban parking regulations to other policy objectives including congestion management.
Comprehensive and effective parking policies in support of congestion management goals will, therefore, cut across a number of actors (city inhabitants, city “users”, commercial interests and employers), should be coordinated with zoning and development statutes and address the full range of parking options (on-street and off-street, private and public), include some form of pricing and/or parking space allocation and be linked to policies promoting access by alternative modes. The case of the integrated strategy employed in Rome (see Section 9.6) is one example of how these different components can be made to work together to reduce the impact of congestion.
Flexible Interpretation of Parking Rules in Return for Reduced Trips in Zurich
The “Access Contingent Model” was developed by the city of Zurich in order to limit the traffic generation impact of new developments within the city.
As with many other urban parking rules, Zurich‘s requires developers to provide a minimum number of parking spaces for each type of land use. This has a cost for developers who must provide expensive parking capacity and/or to divert valuable real-estate to parking. The access contingent model eases these rules and grants exemptions from the minimum parking requirements and provides the developer with flexibility in managing the total stock of parking in return for the developers agreeing to a strict quota of generated trips from the designated zone.
The principle aims of the policy are:
• To allow development in dense urban areas, already saturated with traffic.
• To control the environmental effects of large buildings/real estate developments.
• To allow flexible use of parking spaces.
• To keep car traffic volume under control by defining the maximum number of trips, which can be generated from the targeted zones.
The number of authorised trips per year, the monitoring scheme and the penalties in case of non-compliance are defined in an agreement between the city and the land-owners/developers, and are linked to the approval of urban development plans or building permits. Landowners must establish, or contract the services of, an independent body mandated with the management and operation of the trip generation quota and parking management policy. This body typically takes on the following functions for the affected development zone:
LOCKING IN THE BENEFITS OF AVAILABLE CAPACITY – 209
MANAGING URBAN TRAFFIC CONGESTION – ISBN 978-92-821-0128-5 - © ECMT, 2007
• Distribution of parking permits to the different landowners.
• Distribution of trip quotas and management of non-compliance penalties.
• Provision of additional services such as public transport passes (Job-Tickets), on site car sharing, bicycle rentals.
• Monitoring the number of trips per day, week, month, year.
The monitoring results have to be delivered to the municipality within a time period defined within the agreement, normally every 6 months, and are used to determine compliance with the negotiated agreement between the developer and the city.
Before selecting a zone for the application of the access contingent model, several pre-conditions must be fulfilled, including the following:
• There must be pre-existing guidelines on the amount of manageable traffic volume in the surroundings of the site.
• The access to the area with the car must to be controllable (e.g., through a limited number of access and egress points) such that generated trips can be counted and assigned to the site.
• The site should be well connected with public transport.
• There should be clear information about the future mix of uses within the area (for the calculation of the number of trips.
The actual calculation of the trip generation quota follows an algorithm developed by the city of Zurich. The baseline number of trips is calculated by looking at the types of commercial/residential uses zoned for the area and calculating the total number of parking spots required by the Zurich parking ordinance. The trip generation potential of the zone is then derived by multiplying the number of required spots by the number of trips each spot is estimated to generate according to the type of commercial/residential use. These trips are then multiplied by the number of operational days in the year with additional trips factored in for week-ends and holidays. The final result is the yearly car-trip generating potential of the site that serves as the starting point for the negotiations between the city and the developer. During these negotiations, a developer who can show how this number of trips will be reduced by alternatives to single car-driver trips (e.g. through the implementation of CMM plans) can benefit from a reduced number of mandatory parking spaces. This reduced investment in parking, in turn, allows the developer to provide more “sellable” real estate or otherwise reduce their development costs (e.g. by not having to provide as much underground parking).
The access contingent model was first applied in 1999 in the framework of an urban renewal project called Zentrum Zurich North (ZZN). ZZN is a disaffected industrial area in the northern part of the city of Zurich which includes different uses on a total ground floor space of 1.4 Mio. square meters. 1 750 parking spaces are distributed in 9 different parking lots and/or structures. The agreement between the 12 landowners and the city of Zurich foresees a maximum number of 8 000 car trips per day, once the overall ground floor space is in use.
As of early 2006, the access contingent model has been put into practise in two areas of the city: Zentrum Zurich North (ZZN) and at one campus of the University of Technology of Zurich. The model works in both areas and the trip limits have not been exceeded so far. The mode share of ZZN has been in favour of public transport beyond all initial expectations. The reasons are the application of the model itself, excellent public transport coverage and the high prices of parking places (200 € a month).
On the strength of these experiences, the access contingent model is now required for all large urban development areas within Zurich (five underway in early 2006).

210 – LOCKING IN THE BENEFITS OF AVAILABLE CAPACITY
MANAGING URBAN TRAFFIC CONGESTION – ISBN 978-92-821-0128-5 - © ECMT, 2007
Flexible Interpretation of Parking Rules in Return for Reduced Trips in Zurich
The “Access Contingent Model” was developed by the city of Zurich in order to limit the traffic generation impact of new developments within the city.
As with many other urban parking rules, Zurich‘s requires developers to provide a minimum number of parking spaces for each type of land use. This has a cost for developers who must provide expensive parking capacity and/or to divert valuable real-estate to parking. The access contingent model eases these rules and grants exemptions from the minimum parking requirements and provides the developer with flexibility in managing the total stock of parking in return for the developers agreeing to a strict quota of generated trips from the designated zone.
The principle aims of the policy are:
• To allow development in dense urban areas, already saturated with traffic.
• To control the environmental effects of large buildings/real estate developments.
• To allow flexible use of parking spaces.
• To keep car traffic volume under control by defining the maximum number of trips, which can be generated from the targeted zones.
The number of authorised trips per year, the monitoring scheme and the penalties in case of non-compliance are defined in an agreement between the city and the land-owners/developers, and are linked to the approval of urban development plans or building permits. Landowners must establish, or contract the services of, an independent body mandated with the management and operation of the trip generation quota and parking management policy. This body typically takes on the following functions for the affected development zone:
• Distribution of parking permits to the different landowners.
• Distribution of trip quotas and management of non-compliance penalties.
• Provision of additional services such as public transport passes (Job-Tickets), on site car sharing, bicycle rentals.
• Monitoring the number of trips per day, week, month, year.
The monitoring results have to be delivered to the municipality within a time period defined within the agreement, normally every 6 months, and are used to determine compliance with the negotiated agreement between the developer and the city.
Before selecting a zone for the application of the access contingent model, several pre-conditions must be fulfilled, including the following:
• There must be pre-existing guidelines on the amount of manageable traffic volume in the surroundings of the site.
• The access to the area with the car must to be controllable (e.g., through a limited number of access and egress points) such that generated trips can be counted and assigned to the site.
• The site should be well connected with public transport.
• There should be clear information about the future mix of uses within the area (for the calculation of the number of trips.
The actual calculation of the trip generation quota follows an algorithm developed by the city of Zurich. The baseline number of trips is calculated by looking at the types of commercial/residential uses zoned for the area and calculating the total number of parking spots

LOCKING IN THE BENEFITS OF AVAILABLE CAPACITY – 211
MANAGING URBAN TRAFFIC CONGESTION – ISBN 978-92-821-0128-5 - © ECMT, 2007
9.5 Road/Congestion Pricing
There are probably few areas in modern economic society where conditions are as far from ideal as in the congested traffic and transportation facilities of our great modern metropolitan conurbations. This is equally true in the short run, in terms of making the best use of the facilities we have and, in the longer run, in terms of the appropriateness of the facilities for current and projected traffic needs.
This relative inefficiency can be attributed in large measure to the fact that the individual user, faced with alternative ways of achieving his objectives, does not, under existing conditions, receive any obvious indication of the costs which his choice will impose on others, whether by impairment of the quality of service or by the cost of expanding the facilities to the point where this impairment is prevented.
William Vickery3
It has been a common place event for transportation economists to put the conventional diagram on the board, note the self-evident optimality of pricing solutions, and then sit down waiting for the world to adopt this obviously correct solution. Well, we have been waiting for seventy years now, and it’s worth asking what are the facets of the problem we have been missing. Why is the world reluctant to do the obvious?
Charles Lave4
required by the Zurich parking ordinance. The trip generation potential of the zone is then derived by multiplying the number of required spots by the number of trips each spot is estimated to generate according to the type of commercial/residential use. These trips are then multiplied by the number of operational days in the year with additional trips factored in for week-ends and holidays. The final result is the yearly car-trip generating potential of the site that serves as the starting point for the negotiations between the city and the developer. During these negotiations, a developer who can show how this number of trips will be reduced by alternatives to single car-driver trips (e.g. through the implementation of CMM plans) can benefit from a reduced number of mandatory parking spaces. This reduced investment in parking, in turn, allows the developer to provide more “sellable” real estate or otherwise reduce their development costs (e.g. by not having to provide as much underground parking).
The access contingent model was first applied in 1999 in the framework of an urban renewal project called Zentrum Zurich North (ZZN). ZZN is a disaffected industrial area in the northern part of the city of Zurich which includes different uses on a total ground floor space of 1,4 Mio. square meters. 1’750 parking spaces are distributed in 9 different parking lots and/or structures. The agreement between the 12 landowners and the city of Zurich foresees a maximum number of 8 000 car trips per day, once the overall ground floor space is in use.
As of early 2006, the access contingent model has been put into practise in two areas of the city: Zentrum Zurich North (ZZN) and at one campus of the University of Technology of Zurich. The model works in both areas and the trip limits have not been exceeded so far. The mode share of ZZN has been in favour of public transport beyond all initial expectations. The reasons are the application of the model itself, excellent public transport coverage and the high prices of parking places (200 € a month).
On the strength of these experiences, the access contingent model is now required for all large urban development areas within Zurich (five underway in early 2006).
212 – LOCKING IN THE BENEFITS OF AVAILABLE CAPACITY
MANAGING URBAN TRAFFIC CONGESTION – ISBN 978-92-821-0128-5 - © ECMT, 2007
The two statements above illustrate both the promise and the difficulty of seeking to manage demand for roads via market mechanisms.
At present, in most locations, the rationing of road space is achieved by queuing. Congestion delays imposed by means of queuing impose costs indiscriminately on all road users. With a queuing regime, users who have a high need to use the road space suffer the same consequences as those who do not. Queuing-based approaches do not tackle directly the causes i.e. that there is too much traffic on the roads. Instead, they effectively meter access to the road space according to ‘willingness to wait’ or rather - in most cases where reasonable alternatives are not available – by ‘forcing’ users to wait because realistic choices are not available
Road users often have limited if any opportunity to choose between a range of quality/level of service and price options for use of the road system. The lack of market-based choices for users is no doubt one of the frustrations many users experience in congested conditions on the roads.
Queuing on the road system is a very different rationing mechanism to that users encounter in most of their expenditure areas and different from the regimes that apply in the case of most other infrastructure and a lot of services (e.g. telecommunications).
There are a number of other important consequences of making road space available without specific access or pricing controls:
• There is little resistance offered as the level of demand for usage of the road space rises until the road space becomes highly congested.
• At highly congested levels, travel reliability and levels of service are reduced, often dramatically – disadvantaging the users that the road systems are intended to benefit.
• For highly congested facilities, there is likely to be a significant difference between the actual level of road usage and the economically optimal level of road usage. The “excess” road usage results in significant disbenefits to road users as a group by comparison with “optimal” levels.
• New road space intended to overcome or mitigate congestion is likely in time to also become congested – as experience in most locations has confirmed. In other words a lack of intervention in access and pricing areas is likely to produce an outcome contrary to that intended when the decision was made to build new infrastructure.
In principle, congestion pricing offers road managers an ability to differentiate between road users on the basis of their individual demand for use of the road space. The adoption of congestion charging - on a cost-efficient basis - would provide a tool for road managers to manage demand, by increasing the resistance users face to further increases in demand as usage of the road space approaches “optimal” traffic congestions levels. It would also allow road managers to act quickly to reduce demand in circumstances where usage exceeds optimal levels; i.e. in situations where there are high levels of congestion and unreliability – i.e. levels currently typical of key road infrastructure in the larger metropolitan areas.
From a users’ viewpoint, congestion pricing would provide an opportunity for them to avoid the high costs of recurrent delays and unreliable travel conditions which they currently pay for with their time – by paying with money instead of time - for faster, more reliable and more predictable travel. Of

LOCKING IN THE BENEFITS OF AVAILABLE CAPACITY – 213
MANAGING URBAN TRAFFIC CONGESTION – ISBN 978-92-821-0128-5 - © ECMT, 2007
course, not all users would be willing to pay – and some users may not be able to pay the additional direct costs involved.
Location-based road or congestion pricing is nevertheless one of the few measures potentially available to road management bodies to ensure that available road space is used efficiently, in its broadest sense. Where cost-effective, it can help do so by providing a price-based choice for use of roads in circumstances where current demand is in excess of road space capacity. Congestion charging would help reduce congestion by reducing demand, especially for travel at peak times. Differential peak- and off-peak levels would help spread demand more evenly throughout the day.
Unlike many other congestion management approaches, road pricing also has the potential to clearly signal to policymakers when and where additional capacity may be needed.
The possible usage of congestion pricing as a means of tackling traffic congestion has been extensively researched over many decades. Many proposals to implement a form of congestion pricing have been made in recent years.
Recently, there has been an increase in the number of locations where congestion pricing or one of its simplified variants (e.g. London’s cordon-based congestion charging scheme) have been implemented or trialled (e.g. in Stockholm). This section will discuss both the mechanism itself and the difficulties it has faced in becoming an acceptable urban traffic management tool.
9.5.1 Economic Considerations
Congestion charging is primarily concerned with allocating scarce road space between competing users through pricing rather than through queuing. It requires a charging system which allows the cost of road use to vary by location and, generally, by time of day.
Congestion pricing is grounded in the economic theory and economic approaches to roads management, as outlined in Chapter 5.
By joining a busy road, a new user slows down traffic, therefore increasing travel times and imposing additional resource costs (e.g. fuel consumption) on all other drivers. This inflicts a cost upon each of the other drivers that the marginal road user does not pay for.
With congestion pricing, private costs are expected to become equal to social costs, allowing the market to function efficiently to produce an ‘optimal’ outcome. In the case of road usage, a congestion charge will raise the price paid by users and those who are not ready to pay the new price will not use the road. Imposition of the appropriate charges will ensure road usage will be reduced to its optimal level.
From an economic viewpoint, it would be important not to impose a single congestion charge in a given city. To be efficient, the charge should be equal to the marginal congestion cost. But this cost varies, and varies greatly, from place to place, and hour to hour. A single charge is likely to be either too high or too low to deal with most locations and circumstances.
The proceeds of the charges required to reduce road usage to optimum levels (and eliminate excess road use) are equal to the amount of the charge multiplied by the optimal number of vehicles using the road space at that charge. It should be noted that the proceeds of such charges do not represent a measure of congestion cost. Rather they represent the overall revenue raised by the charges

214 – LOCKING IN THE BENEFITS OF AVAILABLE CAPACITY
MANAGING URBAN TRAFFIC CONGESTION – ISBN 978-92-821-0128-5 - © ECMT, 2007
required to reduce traffic to the optimal level, i.e. to the level that will maximize the economic surplus, and eliminate the congestion cost externality.
Congestion charging offers the prospect of a double dividend: it would improve overall welfare in the area where it is imposed; and it would raise revenues that can be used to further improve welfare. It also has the potential to signal to policymakers when new capacity should be developed and provides a source of financing to cover the capital costs incurred (see box).
Transport Infrastructure Charges and Capacity Choice
A recent ECMT Roundtable5 investigated transport infrastructure charges and highlighted that while the potential for infrastructure capital and maintenance cost recovery via infrastructure charges (including congestion charges) existed, its practical application faced several hurdles. These included coordinating and optimising infrastructure charges across the whole of the urban road network (and not just on particular links), compensating for inflows of infrastructure-related revenue by decreasing other forms of oftentimes distortionary taxation, addressing the tension between local governments (who would likely receive infrastructure-related revenues) and national governments (who typically collect and redistribute the fuel taxes that should normally be reduced under an wide-spread infrastructure charging scheme). Nonetheless, if these and other practical issues are addressed, an infrastructure/congestion charging scheme can signal to policymakers that road capacity should be expanded when short-run optimal congestion pricing delivers revenues per unit of capacity that exceed the unit capital cost of that capacity. The Roundtable noted that “the market would thus indicate whether or not expansion is socially warranted, which will generally help improve the transparency and credibility of [infrastructure-related] cost-benefit analysis”.6
Source: ECMT Round Table 135, “Transport Infrastructure Charges and Capacity Choice“, 2007.
Most importantly, congestion charges would expose marginal road users to the marginal social costs of their use of road space (i.e. including the additional costs they impose on other road users).
An applied economist, however, will ask additional questions: how great is the welfare gain to be expected from the introduction of a marginal congestion charge; and what are the difficulties and costs associated with the implementation of the charge?
9.5.2 Operational Considerations
There are many operational aspects to be considered in implementation of a congestion pricing scheme.
A first consideration is whether or not there is a shared and accepted view that congestion is indeed a problem in the urban area. A review of 22 road pricing schemes across 14 countries undertaken by the UK government’s Commission for Integrated Transport (CFIT) found that:
“Whatever the aim, the common experience was that pricing was only acceptable if this objective could be seen as the solution to an already accepted problem,, and a sufficiently widespread acceptance that other existing policies are not capable of solving it (nor will they be able to in the future).”7
The CFIT review also noted the important role played by an influential champion (e.g. in the case of London), as well as clarity and transparency on the use of the revenue generated by the scheme.
LOCKING IN THE BENEFITS OF AVAILABLE CAPACITY – 215
MANAGING URBAN TRAFFIC CONGESTION – ISBN 978-92-821-0128-5 - © ECMT, 2007
Another important consideration is assessing the appropriate level for congestion charges. In principle, transport models can take into account the distribution of the value different road users put on time savings. This information can be combined with estimates of the environmental costs of pollution, damage to the road, accident related and other external costs. The analyst can then introduce the assumption that on each link in the network road users are required to pay a charge equal to the marginal cost they impose on other road users and on society. Knowledge of road users’ responses to changes in the cost of road use makes it possible estimate the impact of these charges on traffic volumes and speeds. With further iterations of the transport charging model, it is possible to reach an equilibrium in which all users of the network pay charges equivalent to the marginal social costs they impose.
Whether such theoretically derived charges could be imposed depends on the technology to be employed. Each vehicle owner must be billed as a function of his/her road usage. Progress in the technology is making this possible but at a cost.
Most congestion charging schemes require expensive capital investment or relatively high operating costs (including start-up costs) or both. For example, it is estimated that the costs of operating and enforcing the Central London Area charge reduce the transport user benefits provided by the scheme by around 50%. In other words, the benefits would be twice as high if the scheme could be implemented and operated at no cost. Even the simplest system of road pricing is complex to administer. Simpler systems, which are less responsive to changes in the level of congestion between different parts of the city, are more feasible on technical, administrative and cost grounds. But by simplifying the system and reducing the costs, the benefits it can deliver are also reduced.
The upfront capital costs and the operating costs of administering the scheme are important factors in establishing whether a congestion charging scheme represents value for money. The overall costs need to be compared with the net benefits expected. Of course, these net benefits do not equal the revenues raised (which are simply a transfer between road users and the charging authority). The revenues from congestion charging are likely to exceed by a considerable margin the overall resource savings and transport user benefits – e.g. the difference between the time savings for those who continue to travel by car plus savings to bus users less the loss of benefit from those who change their mode or time of travel.
Given these variables, costs and revenues for pricing initiatives can differ greatly from one project to another as illustrated by the estimates in Table 9.1.
Table 9.1. Approximate Cost & Revenue Comparisons of 4 Road Pricing Schemes
Set up costs Annual costs Charge level Annual Revenues
London £90m £92m £8 per day £97m Singapore (1998 ERP) £67m £5m £0-1.40 per trip, variable £27m Stockholm Set up & operation for 7
month trial: approx £120m £0.70-1.40 per trip, variable £60m
Oslo - £1 per trip £93m Source: Dix, TFL 2006.
While congestion charging can reduce traffic levels quite significantly, the actual decrease depends largely on the amount of the toll rates:

216 – LOCKING IN THE BENEFITS OF AVAILABLE CAPACITY
MANAGING URBAN TRAFFIC CONGESTION – ISBN 978-92-821-0128-5 - © ECMT, 2007
• In Singapore for example, there is a 30% decrease of the traffic volume toward the city centre and in London a decrease of over 20-30%.
• The cordon toll trial in Stockholm can also be seen to have reduced traffic on the principal thoroughfares leading into the central city by as much as 22% during morning and afternoon peak periods.
• Pricing projects whose principal objective is to cover infrastructure financing (e.g. Bergen, Oslo and Trondheim) have only delivered relatively small effects on traffic volumes because of the very low toll rates. In Oslo for example the number of cars passed through toll ring plazas was reduced by approximately 10%.
The charging area can be expected to see reduced environmental impacts because of reduced vehicle usage within its borders and because of the increased fluidity of traffic. In comparison to the previously situation the last three research reports concerning the London Congestion Charging Scheme showed a 12% reduction of nitrogen oxides and soot particles within the tolled zone. In the April 2005 report, Transport for London notes this reduction is now 16%. It also notes that the congestion charging programme has left emissions on the periphery of the cordon unchanged.
Congestion pricing can take one of several forms, discussed below.
9.5.3 Corridor-based Pricing
Corridor-based pricing describes the process of charging for use of a particular roadway segment. The main fields of application are motorways, bridges and tunnels. The pricing rate can vary during the day to reflect the prevailing traffic level and ensure the ensuing demand allows for “congestion-free” travel on the tolled lanes. Corridor pricing, often deployed as a tool to recover infrastructure costs, can also be seen not just as an effective congestion management tool but also as an essential strategy – especially when it entails some level of traffic-responsive variable pricing.
Peak and off-peak tolls can be found on many motorways and major roadworks in several countries – including in the United States where the practice is known as “value pricing” and is the focus of a set of demonstration projects funded by the federal government (see box).
High occupancy vehicle lanes (HOV, e.g. lanes where vehicles must have a minimum number of passengers) can be converted into High-Occupancy Toll (HOT) facilities thus addressing any under-use of HOV facilities. With a HOT facility, high occupancy vehicles still retain free or discounted access to these lanes but solo driver vehicles can opt to also use the facility by paying a toll. This toll sometimes varies according to time of day, travel direction or congestion levels.
HOT lanes can be also combined with Bus Rapid Transit (BRT) services and Park and Ride facilities (see Chapter 9 for a description of these) that together deliver high speed public transport services. These combined HOT lane and BRT services are especially suited to servicing lower density travel corridors and may be able to deliver high quality public transport services for a fraction of the cost of providing rail-based services.
Effective HOT lane systems and other corridor and/or toll systems have been greatly facilitated by technology which allows automatic toll collection and enforcement systems based on smart cards or electronic fee collection technologies. Indeed, these tools enable transport operators to ensure free flow payments without using “traditional” toll collection booths, themselves a considerable source of congestion on some motorways at peak travel volumes.
LOCKING IN THE BENEFITS OF AVAILABLE CAPACITY – 217
MANAGING URBAN TRAFFIC CONGESTION – ISBN 978-92-821-0128-5 - © ECMT, 2007
Value Pricing: Corridor-based Pricing in the United States
State Route 91 (SR 91) in California was the first fully automated toll road in the world and the first toll road in the United States to vary tolls by the level of congestion on the roadway. The four-lane roadway, built within the median of SR 91, is 10 miles in length with no intermediate access. Two lanes are provided in each direction and they are separated from the mainlanes by plastic pylons and a painted buffer. The toll rates are set according to level of congestion typically experienced on the roadway, thereby making travel during the peak periods the most expensive time to travel. Although, the facility is open 24 hours a day, seven days a week and tolls are charged at all times, the operators use price in an attempt to shift vehicles out of the peak period.
Motorists that choose to use the lanes are notified of the current toll well in advance of the facility via dynamic message signs. The tolls are paid exclusively through electronic toll collection. Users of the facility must have an account and a transponder. The facility is also managed to encourage travel in high occupancy vehicles. Carpools with three or more occupants, motorcycles, zero-emission vehicles and vehicles with disabled person license plates are free at all times with the exception of the evening peak period in the peak direction, when HOVs are charged 50% of the posted toll. Again, price is used to encourage certain travel behaviors and congestion-reducing conveyances.
The operators of the SR 91 Express Lanes have implemented a toll policy that is based on active management of the facility. The lanes are continuously monitored and this data is used the make adjustments to the tolls as necessary to keep the facility free-flowing. Hourly traffic volumes are monitored over a 12-week period. If vehicle volumes per hour per direction approach levels were speeds become unstable or slow the tolls may be adjusted. The new toll rate was to stay in effect for six months. If, after six months, it is determined that traffic volumes have fallen, creating excess capacity, the toll could be reduced. The operators of the facility are actively managing the lanes to optimize traffic flow.
The I-15 Express Lanes in San Diego, California, is an eight-mile, two-lane reversible facility that stretches between State Route 52 and State Route 56. Exhibit 7 depicts the Express lanes boundaries. The lanes are separated from the mainlanes by concrete barriers. Access is only available at the termini. The lanes originally operated as HOV lanes but often had unused capacity available. The lanes operate Monday through Friday from 5:45 - 11:00 am in the southbound direction and 1:00 - 7:00 pm in the northbound direction. In 1996 the HOV lanes were converted to HOT lanes, where SOVs are charged to use the facility and HOVs travel in the lanes free of charge.
I-15 employs dynamic tolling, the first of its kind implemented. Toll rates typically vary from $0.50 to $4.00 but can rise as high as $8.00 during severely congested conditions. Technology deployed in the corridor allows for the assessment of current traffic conditions and the toll rate is adjusted dynamically to ensure free flow conditions in the express lanes. Dynamic message signs prior to the entrance of the facility alert drivers to the current toll. The drivers then have ample time to choose whether or not to enter the lanes and pay the toll. As with SR 91, all users must be registered and have an established FasTrak account. A FasTrak account allows tolls to be collected electronically. No manual or cash toll collection is accommodated. The average daily traffic on the Express lanes is between 25 000 and 35 000 vehicles.
Source: Excerpted from http://ops.fhwa.dot.gov/freewaymgmt/managed_lanes/doc/crosscuttingstudy/chapter3.htm#san_dieg.
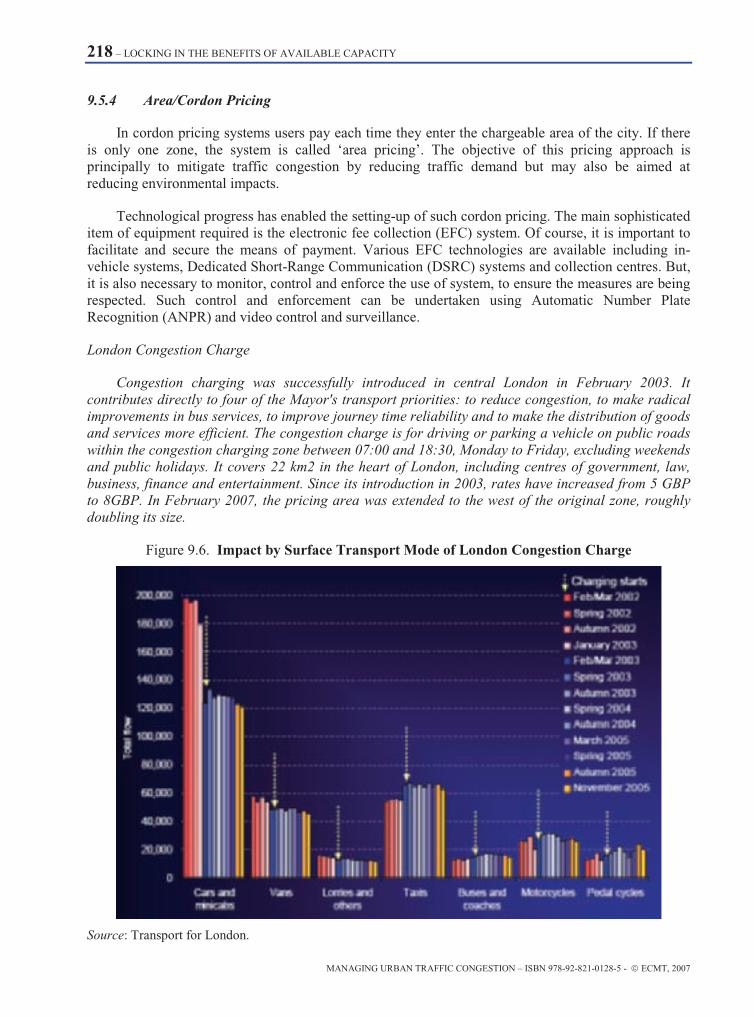
218 – LOCKING IN THE BENEFITS OF AVAILABLE CAPACITY
MANAGING URBAN TRAFFIC CONGESTION – ISBN 978-92-821-0128-5 - © ECMT, 2007
9.5.4 Area/Cordon Pricing
In cordon pricing systems users pay each time they enter the chargeable area of the city. If there is only one zone, the system is called ‘area pricing’. The objective of this pricing approach is principally to mitigate traffic congestion by reducing traffic demand but may also be aimed at reducing environmental impacts.
Technological progress has enabled the setting-up of such cordon pricing. The main sophisticated item of equipment required is the electronic fee collection (EFC) system. Of course, it is important to facilitate and secure the means of payment. Various EFC technologies are available including in-vehicle systems, Dedicated Short-Range Communication (DSRC) systems and collection centres. But, it is also necessary to monitor, control and enforce the use of system, to ensure the measures are being respected. Such control and enforcement can be undertaken using Automatic Number Plate Recognition (ANPR) and video control and surveillance.
London Congestion Charge
Congestion charging was successfully introduced in central London in February 2003. It contributes directly to four of the Mayor's transport priorities: to reduce congestion, to make radical improvements in bus services, to improve journey time reliability and to make the distribution of goods and services more efficient. The congestion charge is for driving or parking a vehicle on public roads within the congestion charging zone between 07:00 and 18:30, Monday to Friday, excluding weekends and public holidays. It covers 22 km2 in the heart of London, including centres of government, law, business, finance and entertainment. Since its introduction in 2003, rates have increased from 5 GBP to 8GBP. In February 2007, the pricing area was extended to the west of the original zone, roughly doubling its size.
Figure 9.6. Impact by Surface Transport Mode of London Congestion Charge
Source: Transport for London.

LOCKING IN THE BENEFITS OF AVAILABLE CAPACITY – 219
MANAGING URBAN TRAFFIC CONGESTION – ISBN 978-92-821-0128-5 - © ECMT, 2007
The impacts of the London Congestion charge have been immediate and important as illustrated in Figure 9.6. The overall decrease in traffic by 18% is largely the result of a 33% reduction in the number of cars entering the zone. Increases in bus patronage, subway travel, taxi use, bicycles and, to a lesser extent motorcycles, have insured high levels of access to the city centre. The removal of a relatively small share of cars, vans and lorries from the charging zone has led to a decrease in congestion of 30%.
Stockholm Trial
The city of Stockholm initiated a trial cordon pricing scheme in 2005 with the aim to reduce congestion, to increase accessibility and to reduce environmental damage from traffic. In particular, the charge sought to reduce traffic volumes during peak periods by 10-15% and to improve the overall accessibility of the central city for public transport and those cars paying the charge. The initial impact of the charge has surpassed the 10-15% reduction with traffic reductions as high as 22-26% on certain thoroughfares leading into the city in comparison with the same month in the year before the charge’s implementation (see Figure 9.7). However, some increases in the western by-pass road have been noted (e.g. 4-5% increase on average in relation to the same month in the last year prior to implementation) as also illustrated in the figure below. What has happened to the “missing” traffic is still of not yet fully known, although some drivers have switched to public transportation as revealed by increased bus ridership figures.
The impact of the Stockholm cordon toll can be seen in Figure 9.8 where, as in the case of London, a significant drop-off in traffic entering the charging zone can be seen to have taken place during the hours of operation. After a few months of operation, the trial was taken off-line in 2006 before Stockholm-area voters voted on whether or not to continue with the cordon pricing scheme in a referendum in October of that same year. Voters within the city of Stockholm voted to continue the scheme – but a non-binding vote by residents of outlying counties went against continuing the scheme. This may have been an indication that most of the traffic reduction benefits went to Stockholm city residents whereas the burden imposed by the scheme on outlying residents was not sufficiently compensated-for by increases in travel speeds for those willing to pay the toll. This, in turn, may have been linked to the relatively low level of congestion present in Stockholm. The government finally determined to reintroduce the charge, with some of the revenues used to finance new roads in the outlying areas.
In Genoa and Rome, authorities have put into place cordon charging systems for non-residents in the centres of those cities. The cordon charging system in these two cases is based on automatic licence plate identification and remote “smart” card reader systems. A cordon pricing scheme has been in place for several years in Trondheim, Norway, using electronic tags and differentiated and higher prices for access to the Central Business District. This system has recently been phased out since its main objective was to recover infrastructure costs and this has now been accomplished.

220 – LOCKING IN THE BENEFITS OF AVAILABLE CAPACITY
MANAGING URBAN TRAFFIC CONGESTION – ISBN 978-92-821-0128-5 - © ECMT, 2007
Figure 9.7. Traffic Volume Changes on Roads in Stockholm after Implementation of the Congestion Charge
Approximate location of CordonApproximate location of Cordon
Source: www.stockholmsforsoket.se/upload/Rapporter/Expert_group_summary_060621.pdf.
Figure 9.8. Impact of the Stockholm Congestion Charge: Average Impacts in Daily Traffic
Source: City of Stockholm.

LOCKING IN THE BENEFITS OF AVAILABLE CAPACITY – 221
MANAGING URBAN TRAFFIC CONGESTION – ISBN 978-92-821-0128-5 - © ECMT, 2007
The Economic Efficiency of the London and Stockholm Charging Schemes
Both the London and Stockholm cordon charges have clearly been successful in reducing congestion, and increasing traffic speeds within the affected zones. They have also faced, and won, electoral tests supporting the contention that the schemes have delivered perceivable and perceived welfare gains for the inhabitants of those city centres. However, one might ask whether or not these schemes are economically efficient – that is, do they deliver net economic gains to the urban regions concerned or are there inefficiencies in these schemes that lead to net losses? This is a question that has been addressed by both the cities involved and by some independent researchers.
The cities have found that the programmes have delivered net gains and have undertaken and published assessments and data supporting their claims8, however, one group of independent researchers have found the opposite to be true.
Prud’homme and Bocarejo (for London) and Prud’homme and Kopp (for Stockholm) in an analysis of the costs and benefits of both schemes found that the net costs in both cases outweigh the net benefits – albeit more so in London than in Stockholm. One of the key factors leading to their finding is the cost of implementing and operating the congestion charging schemes which, as they point out, is a particularly expensive proposition in the London case. They also point out that the tolls imposed are not optimal in that that they are fixed charges and do not reflect the instant or current costs of the congestion they are supposed to target.
In their analysis, Prud’homme et al consider data available to them to calculate pre- and post-charging number of trips, effective speeds (aggregate speeds in both instances), trip lengths, speed-density relationships, values of time, vehicle occupancy, and average tolls as inputs into a model which they specify in their papers. They also account for the welfare losses/gains of those priced off the roads at peak hours by looking at traffic volumes on bypass roads and both the quantity and quality of public transport trips generated by to the tolls. From these total welfare/loss values they subtract the calculated cost of implementing, enforcing and maintaining the charging system as well the costs of added public transport services and congestion in the latter.
The Prud’homme et al analyses have the merit of highlighting three important factors to consider for a congestion charge to be economically efficient:
• Severe road congestion must exist in order for the cost of relief to be offset by its benefits.
• Implementation costs should remain low since as they increase, the economic benefits of charging decrease proportionally.
• Low marginal costs should prevail in public transport given its important role in absorbing those car users “tolled-off” the network.
Nonetheless, Prud’hommes specific findings have been disputed in both the London and Stockholm analyses, and in particular, have been criticised for a reliance on overly broad aggregate values for some of the key parameters.
In the case of London, Charles Raux has published9 an analysis of Prud’homme et al’s assessment. He finds that the Prud’homme conclusions are extremely sensitive to measurements of speed which are used to define benefits/losses due to the scheme. Traffic speeds in the charging zone have ranged from 18.2 km/hr to 16.2 km/hr after the implementation of the charge (with an average of 17.14 km/hr). The benefits associated with the upper bound of traffic speeds (18.2 km/hr) are 35% greater than those associated with the average speed whereas those associated with the lower bound (16.2 km/hr) are 40% less than those associated with the average speed. Raux also points out that Prud’homme’s analysis, unlike that undertaken by London, ignores improvements in traffic speeds outside of the charging zone and fails to account for the very high value of time that
222 – LOCKING IN THE BENEFITS OF AVAILABLE CAPACITY
MANAGING URBAN TRAFFIC CONGESTION – ISBN 978-92-821-0128-5 - © ECMT, 2007
characterises week-day commuters accessing the zone. Finally, Raux points out that Prud’homme fails to account for the improved reliability of travel times which given the composition of the travelling public, is likely to be considerable.
In Stockholm, the city has pointed out that the formula used by Prud’homme et al to calculate time gains broadly aggregates flows and speeds over a 24-hr period whereas congestion is a highly temporal phenomenon. The city has used actual measured travel times and link flows for 80% of the network and has resorted to modelled flows and speeds for only the remaining 20%. The use of real data, they argue, leads to a different conclusion than Prud’homme. The city also points out that the net profit to the public transport operator has been left out of Prud’homme’s analysis as have the benefits of shorter travel times to bus patrons. Finally, they point out that the short depreciation period for the tolling hardware and software is not reflective of the life spans of other similar systems (e.g. Oslo’s) whereas the depreciation period employed by the city of Stockholm in their (positive) analysis is the standard Swedish period for these kinds of investment (infrastructure and software).
At this stage, there can be no definitive answer on the final economic efficiency of either tolling system. Prud’homme and his colleagues have raised some important points in their reports, particularly as they relate to the cost of implementing and operating these schemes – but the general findings are crucially dependent on assumptions about key variables. The cities concerned have used actual data and have come to completely different conclusions. There can, however, be no dispute that the cities have accomplished what they have set out to do which is to reduce road congestion while maintaining and possibly improving overall access to and within the charged areas.
Sources: Prud’homme and Bocarejo, 2005, Prud’homme and Kopp, 2006, TFL (private communication, 2005), Eliasson, 2006, Soderholm, 2006.
9.5.5 Variable Congestion Pricing
It is possible to adapt tolls to different elements like the distance driven or the level of traffic in order to improve the impact on traffic demand and assist with the management of congestion.
Distance-based pricing makes users pay charges proportional to the distance travelled. Variable pricing of this nature is best suited to wide-area applications. The technology needed, in addition to the equipment of collection and control mentioned above, is General and Vehicle Positioning Systems (GPS and VPS) to calculate the distance driven by the vehicles. While being able to contribute to congestion management, variable pricing of this type is often aimed principally at revenue raising.
A demonstration of distance-based pricing with the GPS technology has been introduced on 445 km2 in Gothenburg. It aims to reduce traffic congestion, especially during peak hours, and decrease gas emissions.
For traffic congestion pricing, the higher the traffic is, the more expensive is the fare. This action involves the use of meter to control volumes on the way.
In Singapore, an Electronic Road Pricing has been set up - with multiple peak-period fees, which evolve with the level of congestion. It uses DSRC and in-vehicles systems to collect the fee. This measure has succeeded in increasing average speed of vehicles by 50%.

LOCKING IN THE BENEFITS OF AVAILABLE CAPACITY – 223
MANAGING URBAN TRAFFIC CONGESTION – ISBN 978-92-821-0128-5 - © ECMT, 2007
Peak traffic volume can be modified by toll rates that vary with the time or traffic volume. Investigations at different crossings of the Hudson River in New York, USA, for example showed a decrease of the traffic volume in the peak hours of around 4-7% which resulted in a significant improvement of the traffic flow.
On the Lille-Paris motorway(France) a decrease of around 10% of peak hour traffic has been achieved with variable toll rates.
Variable pricing is better suited to reducing traffic congestion than fixed pricing given that it is based on the ‘pay-as-you-use’ principle which is widely and successfully applied in other sectors.
However, variable pricing can prove to be more difficult to implement than fixed pricing. Opposition based on equity concerns must be addressed.
9.6 Which Demand Management Strategy to Choose? Access Management, Parking Policies or Road/Congestion Pricing?
Urban areas are much more than thoroughfares for traffic. They concentrate and facilitate interactions between people and amongst firms and, for this reason, have proven to be formidably resilient and productive forms of human settlement.
As noted in Chapter 1, it is critically important that transport planners seeking to address urban traffic congestion bear in mind the beneficial impacts of agglomeration. Traffic engineering can deliver “fast” cities by maximising the speed and flow of vehicles in the urban environment, but the resultant situation may prove to be detrimental to the other essential features of successful urban areas (attractiveness, liveability, interaction density, economic productivity). “Fast” cities may not be the most productive and/or desirable and, conversely, the most productive/liveable cities may not be the fastest.
At some point, a balance between the benefits of agglomeration and the impacts of congestion must be reached if an urban area is to remain a dynamic and viable entity. How this balance is reached will depend on a number of decisions – including those that seek to address congestion. However, as discussed in Chapters 2 and 5, finding the “right” level of traffic is a challenge when so many traffic and congestion management measures result in increased traffic over the medium to long run. So much of what has traditionally been advanced as effective congestion response measures ultimately serve to create new – or to free up existing – capacity that will be eventually be used by travellers – if that capacity is not managed. This is why the three strategies outlined in the previous chapter not only deserve their own discussion but are fundamentally important in the congestion management process.
Creating new capacity or freeing up existing capacity is not a viable medium to long term solution absent some mechanism to lock-in the benefits derived from the newly available capacity. This report has outlined three strategies that enable policy-makers to achieve just that: access management, parking management and road/cordon pricing. While congestion management strategies should involve a wide range of measures suited to each particular urban area, congestion management policies that do not include one, or several, of the three demand-management approaches will likely not be effective over the medium to longer term in growing, economically vibrant cities and will likely not deliver the outcomes that policy-makers may have intended.
Which of these strategies should policy-makers then choose? Should they put in place access regimes as in Italy and Greece, should they put in place parking management schemes as in Paris and

224 – LOCKING IN THE BENEFITS OF AVAILABLE CAPACITY
MANAGING URBAN TRAFFIC CONGESTION – ISBN 978-92-821-0128-5 - © ECMT, 2007
Barcelona or should they use pricing initiatives like those on SR 91 in Los Angeles or in London and Stockholm?
The not-so-surprising answer is that they should do none of these … alone.
Each of these measures plays an important role in delivering traffic volumes that avoid extended periods of critical congestion – but the most effective and realistic deployment strategy for these measures involves combining two or more of these approaches into integrated congestion-response packages. There are two principal reasons for this.
• The first is that in combining these strategies, no single strategy has to bear the full brunt of the effort necessary to bring traffic levels in line with the type of traffic performance that citizens would like to see.
• The second reason for seeking to combine these is that each approach has its relative strengths. Combining them allows for overall strategies to be much more comprehensive and flexible than they otherwise might be and thus increases their chance of garnering wide-ranging support within the community.
It would be hard to imagine that a congestion management strategy based only on pricing or only on access or parking restrictions would be politically feasible. Indeed, if only one approach were used, it is likely that in order to deliver durable congestion relief, it would have to be unduly constraining. The effort and level of constraint for one single strategy would be so great as to ensure its failure. This is why, even in cases where a single instrument is predominantly used (e.g. cordon pricing in London and Stockholm, access restrictions in Italian cities, value-pricing measures on motorways in the United States), other instruments are also implemented and play an extremely important role in the overall success of the strategy. These instruments may include other demand management measures as well as other more “traditional” measures such as increases in capacity, provision of public transport services or signal timing improvements. These coordinated measures seek to deliver synergies (e.g. between road pricing, parking management and public transport services) that enable congestion to be managed without having recourse to a single, overly constraining, measure.
There is no single “best” approach to ensure that the benefits derived from increased and/or released capacity are “locked-in”. Non-market measures such as access restrictions and/or parking quotas are ultimately determined via a political process which articulates what kind of city inhabitants wish to live in. Based on some form of shared goals and vision for the urban area, inhabitants, via their elected officials and their technical staffs, determine what level of vehicular traffic they wish to allow and what other non-vehicular amenities they wish to preserve within their cities and set access and/or parking restrictions accordingly. These approaches have the benefit of capturing a wide set of values that might not easily be captured using only road or parking pricing. However, the downside of this approach is that it does not necessarily lead to economically efficient outcomes and may not adequately capture the wishes and needs of non-resident city “users” (e.g. those travelling to and/or through the city). Market mechanisms such as pricing, can, when properly designed, address some these shortcomings. It is not clear, however, that practical market mechanisms can capture all of the sometimes conflicting values that inhabitants of the greater urban region would wish to maximise.
Finally, it may be necessary to put in place two or more of these measures in order to account for the tensions that arise from the prevailing traffic management strategies on different parts of the urban road network. A classic case is the interface between urban motorways, where policies may seek to maximise flows, and urban centres, where policies may seek to restrict car use. Obviously, without

LOCKING IN THE BENEFITS OF AVAILABLE CAPACITY – 225
MANAGING URBAN TRAFFIC CONGESTION – ISBN 978-92-821-0128-5 - © ECMT, 2007
high quality park-and-ride facilities and adequate public transport, this situation can be intolerable for users.
Thus, there seems to be a strong argument for using two, or all three, of the approaches outlined in this Chapter (along with a selection of the other congestion management measures outlined in the following chapters) just as there seems to be a warning that using none of the approaches outlined here – and only depending on the measures outlined in the following chapters – would result in an ineffective congestion management response.
Figure 9.9. Coordinating Congestion Management Policies: The Rome “Blueprint”
Cordon Road Pricing (Automatic)ZTL/Historic Center
Park and RidePeriphery
Metro Lines and Suburban Rail
Intermodal nodes
Parking PricingCentral and Semi-Central Areas
Cordon Road Pricing (Automatic)ZTL/Historic CenterCordon Road Pricing (Automatic)ZTL/Historic Center
Park and RidePeripheryPark and RidePeriphery
Metro Lines and Suburban RailMetro Lines and Suburban Rail
Intermodal nodesIntermodal nodes
Parking PricingCentral and Semi-Central AreasParking PricingCentral and Semi-Central Areas
Source: Progress Project 2000, Deliverable D3.2.
The Municipality of Rome provides an interesting case study of how access and parking management can be combined with pricing and other measures to achieve lasting congestion management outcomes. As outlined earlier in section 9.1.1. of this chapter, Rome had put in place a relatively simple traffic exclusion zone within the city centre. For the reasons discussed earlier, this exclusion zone (ZTL) had a mitigated outcome (too many exemptions and low compliance – 60% of the traffic in the zone was non-compliant!). In order to address these dysfunctions in the first iteration of the Rome ZTL, the municipality decided to develop a comprehensive mobility plan for Rome which would both modernise the ZTL (with automatic card and licence plate recognition/enforcement technology) and integrate the ZTL within a greater context of public transport provision, parking management and limited pricing (for both parking and access to the centre). The municipality has been split into five roughly concentric rings spreading from the high-density epicentre to the low density periphery (see Figure 9.9). As one approaches the centre, parking10 becomes more and more restrictive and expensive, travelling by public transport becomes increasingly easy and car access to the “historical” ZTL is tightly controlled via the automatic access restriction scheme (IRIDE) implemented in 2001. This combined response has been one of the reasons behind the current success of the revamped ZTL scheme in Rome.

226 – LOCKING IN THE BENEFITS OF AVAILABLE CAPACITY
MANAGING URBAN TRAFFIC CONGESTION – ISBN 978-92-821-0128-5 - © ECMT, 2007
Chapter Summary and Policy Considerations: “Locking in the Benefits”
Access management and Control
• Traffic restriction zones are the simplest “command-and-control” tools available but need to be implemented and enforced clearly and consistently to bring results.
• Experience shows that traffic restriction zones should be linked to a set of complementary measures, as in the case of Rome, to ensure that one single measure does not bear the full brunt of the traffic reduction effort. Of these possible complementary measures, the provision of high quality public transport, parking controls and pricing all stand out as important complements to access restrictions.
• When designing a permit system, there is a need for clear and uniform rules on their attribution and strong enforcement policies so as to avoid abuse.
• Ramp Metering is a location-specific application of a queuing approach, which limits the rate of access to the major road (generally freeway) network. It can also discourage drivers from using the highway for short trips and can promote the use of ride sharing by dedicating special lanes for car pools or public transport. By keeping the queuing off the motorway network, ramp metering helps keep the flow rate in balance with the effective operational capacity of the major road system in this location.
• A ramp metering approach ensures that road users already on the system are partially protected from the delays that all road users would experience if all vehicles arriving at the ramp were allowed to try to enter the freeway flow. It also ensures that new users presenting themselves for access to the major road network, through delays on the ramp, bear a greater share of the delay costs involved in their access to an already congested roadway system.
• While not a permanent stand-alone solution, ramp metering is an important part of the management of a congested major road system – and therefore an important tool for the authorities concerned in discharging their infrastructure management responsibilities.
Parking Management and Control
• Parking management and control is a policy lever that is readily available but often seems greatly under-utilised by authorities seeking to tackle traffic congestion. Parking management and control is important because it has the potential to modify demand on a wide area basis.
• Like road-pricing and other demand-side approaches, parking management and control can assist the task of tackling traffic congestion by reducing the demand for travel to the area encompassed. Due to the considerable policy and operational flexibility available, parking control can also be quite specifically targeted, in the sense that it can be applied on the basis of location and time.
• Whether parking management and control is achieved by physical control of the total number of parking spaces in given area – or by setting pricing for parking spaces to control demand – parking imposes limitations on user choice and aims to modify user behaviour. This is in contrast with the supply-side measures such as providing additional capacity or improving traffic flows by reducing bottlenecks – which encourage more of the same behaviour.
• In many cities there are practical difficulties in attempting to tackle traffic congestion by parking management and control. Often there has been a history of parking policy changes and ‘about-faces’ which have diminished the ability to develop comprehensive and consistent parking policies now. There is often a plethora of parking requirements and
LOCKING IN THE BENEFITS OF AVAILABLE CAPACITY – 227
MANAGING URBAN TRAFFIC CONGESTION – ISBN 978-92-821-0128-5 - © ECMT, 2007
entitlements built into land use and building controls in central areas that reflects these historical changes. Parking policy difficulties have also been compounded by the large number of bodies involved in parking policy and management across larger metropolitan areas. - both public and private sector.
• Controlling parking may be very effective in restricting terminating traffic demand but any capacity on the roads that is freed up (e.g. for travel to central areas) will likely be filled by through traffic attracted from alternative routes by the improved travel conditions. Parking control will also be of little assistance in circumstances where the current demand is to drop off or pick up passengers – e.g. parents taking children to and from school. For these reasons, parking management as a tool for tackling traffic congestion needs to be supplemented by other measures (e.g. access control or pricing) to ensure the desired outcomes.
• In terms of public acceptability, parking control to tackle traffic congestion is not likely to be universally supported. Local officials considering alternative policy options are likely to be acutely aware that motorists are voters in elections. Parking control is likely to be seen as a restriction of current rights and entitlements by some parties, such as private property owners – and a threat to the commercial viability of businesses currently dependent on convenient customer parking.
• An offsetting argument in favour of parking management and control – which distinguishes it from the general range of supply-side measures for tackling congestion - is that, if it is achieved in part by increasing the price of parking, there will be additional revenues raised. Revenues raised by way of pricing and tougher parking enforcement therefore would potentially be available to further reduce congestion or to provide for complementary transport improvements such as in public transport.
Road/Congestion Pricing
• Congestion charging is one way of tackling congestion by reducing the levels of traffic on the roads in congested periods.
• Congestion charging can be introduced in one step on an area-wide basis – or can be introduced in many small steps, beginning with pricing along the major corridor(s) or on new lanes built in such corridors.
• There will be a number of important policy-related issues to consider prior to a decision to implement a congestion charging system. The first is that, like any other congestion mitigation measures, the congestion charging system should be effective – and importantly, cost effective.
• Equity is a very important consideration. Even if the proceeds of the congestion charges are redistributed to road users, in the form of lower fuel taxes for instance, a congestion charge is likely to benefit people as a function of their income. Road users as a group would gain (by the amount of the welfare gain minus collection costs) but some would gain more than others.
• Another issue is that congestion pricing raises similar concerns to ‘Access Control’ (see above) about the loss of fundamental “rights”. A congestion charge may appear to the motorist, who has paid a general road tax and a tax on fuel to take away a presumed “right” to use the road without incurring a further charge. This perception must be addressed by policy.
• The proceeds of a congestion charge are always greater than the social gain generated by the charge, that is the congestion cost. If these proceeds are not redistributed to road users one way or another, then road users as a group might perceive the charge as an additional

228 – LOCKING IN THE BENEFITS OF AVAILABLE CAPACITY
MANAGING URBAN TRAFFIC CONGESTION – ISBN 978-92-821-0128-5 - © ECMT, 2007
tax for which they receive no or insufficient direct benefit. If the money raised is not hypothecated to transport expenditures, then road users might perceive themselves to be net losers.
• Experience has shown that the level of support for road and congestion pricing generally hinges on the use of the funds raised. If the funding arrangements provide for revenues raised to go to general expenditure for allocation through the budget process, congestion pricing schemes are generally opposed. If the funding arrangements provide for the funds raised to be used for transport improvements (e.g. public transport or road improvements), experience shows support levels will increase considerably.
• One advantage of congestion pricing is that the charges and revenues that result provide market-based signals on where consideration needs to be given to possible transport improvements or infrastructure investments. Where the revenues raised are able to be channelled back into transport investments, congestion charging can help provide funds for undertaking priority transport investments (e.g. in public transport, ITS infrastructure or roads). Consideration could be given to reducing aggregate taxes otherwise prevailing (e.g. fuel and vehicle taxes).
• On highly congested facilities, infrastructure has the potential to be self financing with marginal cost pricing.
• There is a risk with pricing policies is to transfer traffic flows onto “free” (e.g. un-priced) roads and so create new congestion in other areas although this has not been a serious problem with the charging systems so far introduced. It is therefore important to plan complementary measures such as modification of road infrastructure, traffic management, information technology or improvements of public transport. Those parallel measures can make pricing more acceptable and also fairer for people who cannot afford the charges or tolls and thus contribute to public acceptability.
NOTES 1. Adapted from Fontana, M. (1999).
2. Those people who do not live within the city but work in the urban area or otherwise “use” it.
3. William Vickery (1967) in TRB (2005), p. 66.
4. Lave, C. (1995).
5. ECMT (2007).
6. Verhoef, E. in ECMT (2007).
7. CFIT (2006), p. 6.
8. TFL (2004), TFL (2005) and Eliasson, J. (2006).
9. Raux, C., (2005) and Mackie, P. (2005).
10. Very small proportions of the historical centres were subject to parking fees until the middle of the ‘90s. This delay was partly due to institutional barriers: in particular, municipalities had no human resources to enforce widespread parking control. Since then, parking charges have been systematically introduced in many city centres are sometimes being introduced also in the areas just outside the historical centres. However, very few also introduced parking charges for residents.

CONGESTION MANAGEMENT MEASURES THAT RELEASE OR PROVIDE NEW CAPACITY – 229
MANAGING URBAN TRAFFIC CONGESTION – ISBN 978-92-821-0128-5 - © ECMT, 2007
10. CONGESTION MANAGEMENT MEASURES THAT RELEASE OR PROVIDE NEW CAPACITY
This chapter examines the measures that can free up existing capacity or deliver new capacity. These measures fall into the following five categories; operational traffic management investment, public transport, mobility management, infrastructure modifications, and construction of new infrastructure.
10.1 Operational Traffic Management
Optimising the use of existing infrastructure is an important first step before proceeding to other measures such as the provision of new infrastructure. Many road authorities either implicitly or explicitly seek to “get the most use” out of their infrastructure. This report has already noted the inherent instability of traffic flows if infrastructure is operated at the absolute limits of capacity. However, many authorities view the notion of “getting the most” as ensuring the best possible performance of their network – which is a qualitatively different goal than seeking to maximise its use. Operational traffic management measures are important tools that can help managers ensure high levels of service on their roads and networks. This approach has a proven track record of improving traffic performance and reliability.
Operational measures that improve road performance can also create induced additional demand and thus erode some of the initial benefits realised. Thus it is important to accompany these measures with some form of traffic demand management.
10.1.1 Improving Operations through ITS
Intelligent Transport Systems – e.g. systems where information technologies are added to infrastructure and vehicles – can increase the operational efficiency of road networks. Figure 10.1 below illustrates the framework for linking technologies, infrastructure and vehicles which, pushed to its extreme, could eventually lead to a completely automated and self-regulating road network. There are already many ITS applications that can help to improve traffic conditions in urban areas.
10.1.2 Road Traffic Information
ITS applications communicate information about current road and traffic conditions to road managers and road users via variable messages road signs, radio, internet, mobile phones and in-vehicles systems. Road users can adapt their behaviour at short notice in response to this information by changing routes or means of transport. They can also change the timing of their trips. According to one study, traffic information to road users can reduce or divert up to 4% of car trips – mainly in favour of public transport and to a lesser degree by travellers renouncing their trips.1
Real-time- and near-real-time information about traffic conditions help operators manage available capacity and respond to disruptions by suggesting alternative routes or modes to car drivers. It can also be used in conjunction with public transport information and operations or electronic toll

230 – CONGESTION MANAGEMENT MEASURES THAT RELEASE OR PROVIDE NEW CAPACITY
MANAGING URBAN TRAFFIC CONGESTION – ISBN 978-92-821-0128-5 - © ECMT, 2007
collection. It can also reduce the incidence of non-recurrent congestion by improving incident detection and management and can minimises risks of further congestion-causing crashes in the vicinity of accident scenes.
Figure 10.1. Functional Concept of ITS measures
Source: Busch, F. et al. (2004), “ITS applications in road traffic – state of the art and prospects”
In order to provide high quality information, road authorities and/or managers must invest in traffic monitoring capabilities (either embedded loop detectors or some form of visual monitoring). The larger the road network, the greater the costs involved. There is a trade-off between seeking to reduce costs by reducing coverage of the network and enhancing value by providing dependable and relevant information to road users. The benefits of providing road traffic information (especially in reduced accident and congestion costs) can be considerable. Experience has shown these benefits often outweigh the costs in large urban areas. An example of pre-trip information in Prague is provided in Figure 10.2. 2
In the United States, local traffic information is available nation-wide simply by dialling 511. 3
In Munich, NetzInfo aims the optimal distribution of regional traffic on the motorway network by informing the driver about the current traffic situation and potential alternative routes (Figure 10.3).
In Germany the RoDIN24 traffic monitoring system passively observes signal data from mobile phone networks to generate anonymous location information for all subscribers. This information is used as an input to a Floating Car Data (FCD) analysis to generate real time road traffic information including Estimated Time of Arrival (ETA) for requested route for subscribers to the service.
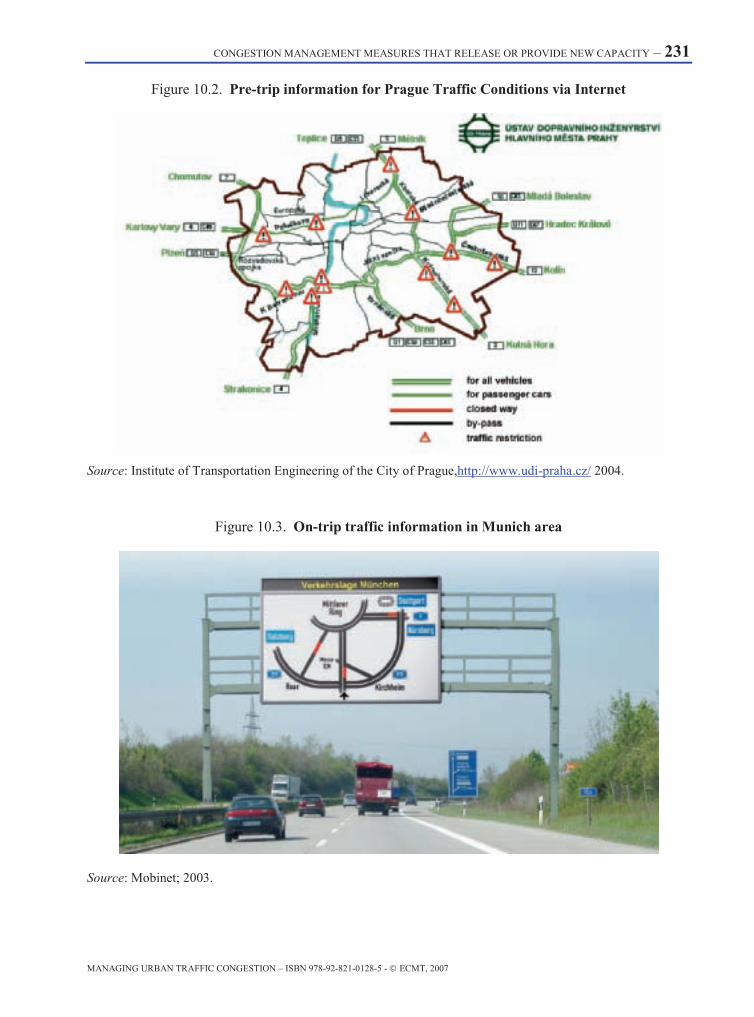
CONGESTION MANAGEMENT MEASURES THAT RELEASE OR PROVIDE NEW CAPACITY – 231
MANAGING URBAN TRAFFIC CONGESTION – ISBN 978-92-821-0128-5 - © ECMT, 2007
Figure 10.2. Pre-trip information for Prague Traffic Conditions via Internet
Source: Institute of Transportation Engineering of the City of Prague,http://www.udi-praha.cz/ 2004.
Figure 10.3. On-trip traffic information in Munich area
Source: Mobinet; 2003.

232 – CONGESTION MANAGEMENT MEASURES THAT RELEASE OR PROVIDE NEW CAPACITY
MANAGING URBAN TRAFFIC CONGESTION – ISBN 978-92-821-0128-5 - © ECMT, 2007
10.1.3 Pre-trip Traffic Guidance
When roadway managers know in advance of exceptional events that can have an impact on traffic flows on their networks (e.g. large sporting or cultural events, holiday travel peaks, etc.), they can communicate advice and alternative routes to road users in order to minimise overall disruptions. This is an important strategy to deploy in urban areas since these types of events can severely degrade traffic conditions. By warning users and helping them to prepare in advance, road authorities can minimise the impacts of these events by encouraging road users to postpone or reschedule trips, take different routes or use different modes.
Though the immediate impact of event-related pre-trip traffic guidance can be much larger than shifts in travel generated by everyday travel information systems, the overall congestion benefits are smaller since these events, unlike everyday travel, are exceptional and are limited to a few days per year.
10.1.4 Signal Coordination
Traffic signalling protocols can be used to coordinate traffic flows across street networks. In the most basic set-up, traffic lights are individually set to simple red-orange-green cycles. These cycles are not responsive to traffic and lead to under-use of roads under many conditions. Dynamically coordinated traffic signal devices (TSD’s) adapt to prevailing traffic flows. Well-coordinated signal control can accelerate traffic flow significantly especially through intersections, which contribute the most to congestion on dense street networks.
Coordinated signal timing can be an especially effective strategy for key routes at peak periods; but increasingly cities are opting for full network coverage. Coordinated signal timing can also be used to reinforce road safety, especially for pedestrians and cyclists by using on-demand crossing signals. Signal control can reduce system-wide waiting periods or encourage public transport by giving priority to buses and tramways at intersections.
An important factor, especially in large urban areas comprised of many different jurisdictions, is the potential “border” effect. Congestion can arise where coordinated and dynamic signal systems meet static traffic light systems or where two dynamic but un-coordinated TSD networks meet. In these circumstances, a regional framework for coordinating TSDs across the wider urban area can help improve traffic flows.
Dynamic TSD systems rely on detectors in the road network and traffic flow models to calculate the impact of control strategies. These technical means can be expensive but their benefits are substantial especially since these systems can automatically adjust traffic control strategies in response to prevailing traffic levels without requiring manual adjustments.
While the initial gains brought about by dynamic TSD systems are not likely to be repeated in the areas where they have been implemented, there are many areas on the periphery of large cities that may still benefit from these systems. Likewise there are still opportunities to implement dynamic traffic control in many medium-sized cities.
As with the other strategies outlined in this chapter, it is important that planners account for the rise in traffic that may come about once they improve traffic performance on certain links or throughout the whole of the system via improved traffic control.

CONGESTION MANAGEMENT MEASURES THAT RELEASE OR PROVIDE NEW CAPACITY – 233
MANAGING URBAN TRAFFIC CONGESTION – ISBN 978-92-821-0128-5 - © ECMT, 2007
In the Czech Republic, traffic signal device systems feed data into integrated traffic control centres which coordinate vehicular transport flows and pedestrian crossing timing.4 Likewise, Sydney’s transport authority uses sophisticated intelligent transport systems, including the Sydney Coordinated Adaptive Traffic System (SCATS) which controls and coordinates traffic signals, closed circuit television (CCTV) cameras, variable message signs and automated incident detection system .
Moscow increased the city’s road network capacity by 10 to 12% by putting in place the “START” – automatic centralized traffic monitoring and management – system. The system increases road capacity and reduces transport delays by coordinating traffic lights. START uses video surveillance to closely monitor traffic and conveys information relating to traffic conditions to users via variable message signs. Of the approximately 253 traffic lights at the most important intersections in Moscow, 122 are controlled by the “START” system.
10.1.5 Dynamic Speed Control
Speed is a critical factor to consider when looking at how vehicles fill available road capacity. Legal speeds are determined largely with safety in mind. However, on urban roads and mortorways, speed has an incidence on traffic flow. On crowded roads, sudden decelerations, uneven accelerations and differences in individual vehicle speeds can all trigger congestion. Slower, more even speeds and less erratic driving behaviour can all increase flows on roads while avoiding or postponing sudden flow discontinuities.
Speed control can rely on either static or dynamic measures. Signage, speed humps, chicane or pinch points are all static devices that encourage drivers to slow down and proceed more cautiously. Dynamic speed control aims to smooth traffic flow by changing speed limits in response to real-time traffic speed and flow data. Sudden disturbances in traffic flow are detected by loop sensors and appropriate reduced-speed limit messages are displayed via variable message signs (see figure 10.4).
Table 10.1. Benefit Cost Evaluation of Dynamic Speed Control: France
Source of Benefits (% contribution to total) Setting Ratio of Benefits to Public Expenditure
Travel Time Safety Other
Dense Urban Areas,
High Congestion
2.1 85 7 8
Less Dense Urban Areas,
Moderate Congestion
1.1 88 7 5
Source: DAEI-SESP Les Comptes des Transports en 2004, Tome 2, Juillet 2005.

234 – CONGESTION MANAGEMENT MEASURES THAT RELEASE OR PROVIDE NEW CAPACITY
MANAGING URBAN TRAFFIC CONGESTION – ISBN 978-92-821-0128-5 - © ECMT, 2007
Figure 10.4. Variable Speed Limits
France has undertaken an analysis of the benefit-cost ratio of dynamic speed control measures and has found these to be fairly important in large urban areas (see Table 10.1). These benefits stem largely from the gains in travel time that are made possible by smoothed traffic flows.
German figures report that variable speed control reduced the number of accidents by 30 % and increased capacity by 5 to 10 % by stabilising traffic flow. 5
Reducing Congestion through Dynamic Speed Control on the French Motorway Network
Since 1994, the motorway operator Autoroute du Sud de la France (ASF) has been experimenting with dynamic speed control to reduce congestion on the busy A7 motorway during the summer holidays.
The A7 motorway is one of one of Europe’s busiest interurban routes and often reaches saturation during peak holiday travel periods. This north/south corridor linking northern France with the French Riviera as well as Spain and Portugal sees an increase in traffic flows from a daily average of 75.000 vehicles to upwards of 110 000 vehicles per day on peak vacation travel days. This leads to hundreds of kilometres of traffic jams and severely degraded travel conditions in both the northbound and southbound directions. The number of crashes occurring also increase in saturated traffic conditions.
ASF developed a motorway congestion management system that uses an algorithm to give advance warning of congestion based on historical traffic flow data obtained from inductive loops buried in the roadway. When the algorithm detects a potential for “traffic flow destabilization” (e.g. when the speed flow curve approaches the critical apex), an alarm warns the respective control centres. Traffic controllers check the validity of the signal and activate the system to inform road users of a change in speed limits due to the traffic conditions.
Road users are informed in real-time of the new speed limit via radio (on the popular motorway traffic radio station), by mandatory speed limit pictograms (70, 90 or 110 km/h) mounted on overhead gantries, and with Variable Message Signs (VMS) located every 10 km. (see figure below). On some gantries equipped with traffic cameras, a VMS displays vehicles‘ license plate number and warns the driver to slow down if their speed is above the current mandatory limit on the section.

CONGESTION MANAGEMENT MEASURES THAT RELEASE OR PROVIDE NEW CAPACITY – 235
MANAGING URBAN TRAFFIC CONGESTION – ISBN 978-92-821-0128-5 - © ECMT, 2007
Initial evaluations showed that 75% of drivers drove within the speed limits. Roadside surveys also suggested that the system is widely supported by the motorists who face less congestion and fewer accidents during their journey. Ongoing statistical studies seem to indicate favourable trends in terms of traffic capacity and delay.
The programme has been extremely successful. In the southbound corridor, the use of three progressively slower speeds as traffic volume mounts (110 km/hr, 90 km/hr and 70 km/hr – in comparison with a normal speed limit of 130 km/hr) has reduced congestion by 40%, crashes by 20% and increased throughput in peak periods. 200 000 hours of traffic congestion have thus been avoided and all of this with a high level of approval from the travelling public.
In the northbound corridor, the experience has also proven to be successful. During peak periods, traffic jams have reduced by 16%, crashes by 50% and throughput has increased by 10%. 80% of interviewed drivers feel that they benefit from the lower speed limits.
The success of this trial has led other motorway operators to envisage extending the programme to the A9 and the A10 and has led several cities, including Paris and Toulouse, to study the possibility of implementing a similar scheme on urban motorways to reduce peak hour congestion.
Source: Schwab (2005), Autoroutes du Sud de la France and www.autoroutes.fr
Variable speed limits on the A7 motorway (France)
« Fort trafic, vitesse limitée » = Heavy traffic, lower speed limit.
10.1.6 Traffic Management Centres (TMC) and Traffic Control Centres (TCC)
Traffic Management Centres and Traffic Control Centres help monitor and manage traffic flows in metropolitan regions. In their most advanced forms, these centres bring together road managers, police and emergency services, road construction and maintenance departments and other actors who have an influence on network performance to jointly manage traffic flows. In large urban areas, TMC’s provide substantial returns on their investment by helping to avoid, or delaying the onset of, congestion and by avoiding and otherwise mitigating the impacts of crashes and vehicle breakdowns. France has undertaken an exhaustive analysis of the type of services typically provided by such centres and has found the benefits to be consistently in the range of 2 to 4 times the costs. (see Box 10.2)
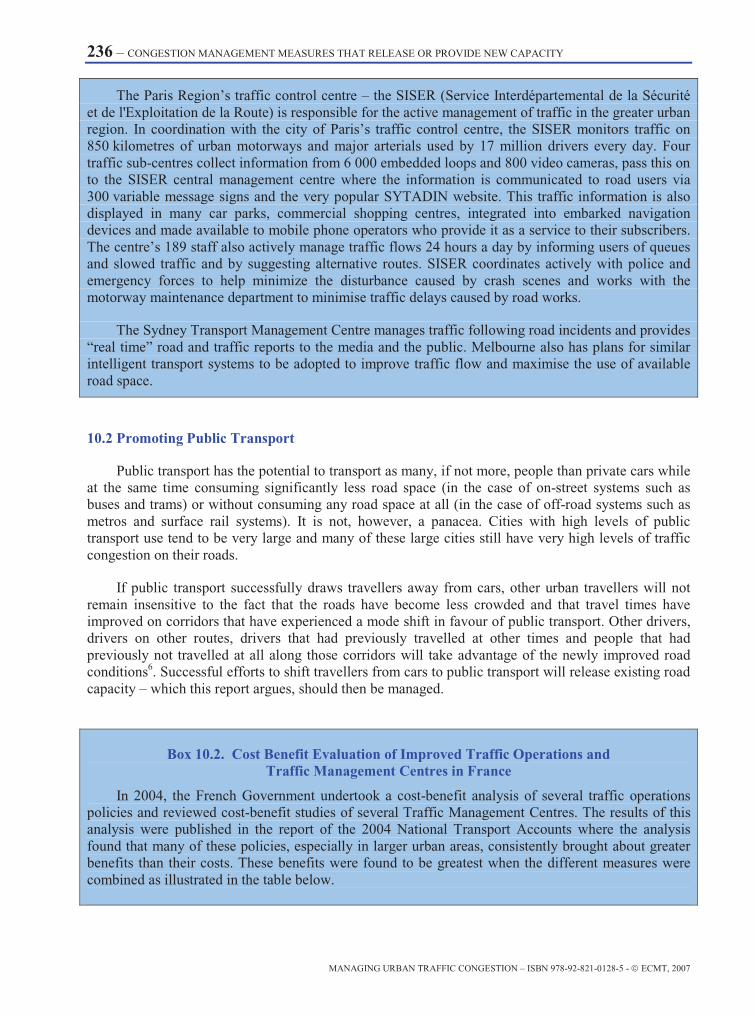
236 – CONGESTION MANAGEMENT MEASURES THAT RELEASE OR PROVIDE NEW CAPACITY
MANAGING URBAN TRAFFIC CONGESTION – ISBN 978-92-821-0128-5 - © ECMT, 2007
The Paris Region’s traffic control centre – the SISER (Service Interdépartemental de la Sécurité et de l'Exploitation de la Route) is responsible for the active management of traffic in the greater urban region. In coordination with the city of Paris’s traffic control centre, the SISER monitors traffic on 850 kilometres of urban motorways and major arterials used by 17 million drivers every day. Four traffic sub-centres collect information from 6 000 embedded loops and 800 video cameras, pass this on to the SISER central management centre where the information is communicated to road users via 300 variable message signs and the very popular SYTADIN website. This traffic information is also displayed in many car parks, commercial shopping centres, integrated into embarked navigation devices and made available to mobile phone operators who provide it as a service to their subscribers. The centre’s 189 staff also actively manage traffic flows 24 hours a day by informing users of queues and slowed traffic and by suggesting alternative routes. SISER coordinates actively with police and emergency forces to help minimize the disturbance caused by crash scenes and works with the motorway maintenance department to minimise traffic delays caused by road works.
The Sydney Transport Management Centre manages traffic following road incidents and provides “real time” road and traffic reports to the media and the public. Melbourne also has plans for similar intelligent transport systems to be adopted to improve traffic flow and maximise the use of available road space.
10.2 Promoting Public Transport
Public transport has the potential to transport as many, if not more, people than private cars while at the same time consuming significantly less road space (in the case of on-street systems such as buses and trams) or without consuming any road space at all (in the case of off-road systems such as metros and surface rail systems). It is not, however, a panacea. Cities with high levels of public transport use tend to be very large and many of these large cities still have very high levels of traffic congestion on their roads.
If public transport successfully draws travellers away from cars, other urban travellers will not remain insensitive to the fact that the roads have become less crowded and that travel times have improved on corridors that have experienced a mode shift in favour of public transport. Other drivers, drivers on other routes, drivers that had previously travelled at other times and people that had previously not travelled at all along those corridors will take advantage of the newly improved road conditions6. Successful efforts to shift travellers from cars to public transport will release existing road capacity – which this report argues, should then be managed.
Box 10.2. Cost Benefit Evaluation of Improved Traffic Operations and Traffic Management Centres in France
In 2004, the French Government undertook a cost-benefit analysis of several traffic operations policies and reviewed cost-benefit studies of several Traffic Management Centres. The results of this analysis were published in the report of the 2004 National Transport Accounts where the analysis found that many of these policies, especially in larger urban areas, consistently brought about greater benefits than their costs. These benefits were found to be greatest when the different measures were combined as illustrated in the table below.
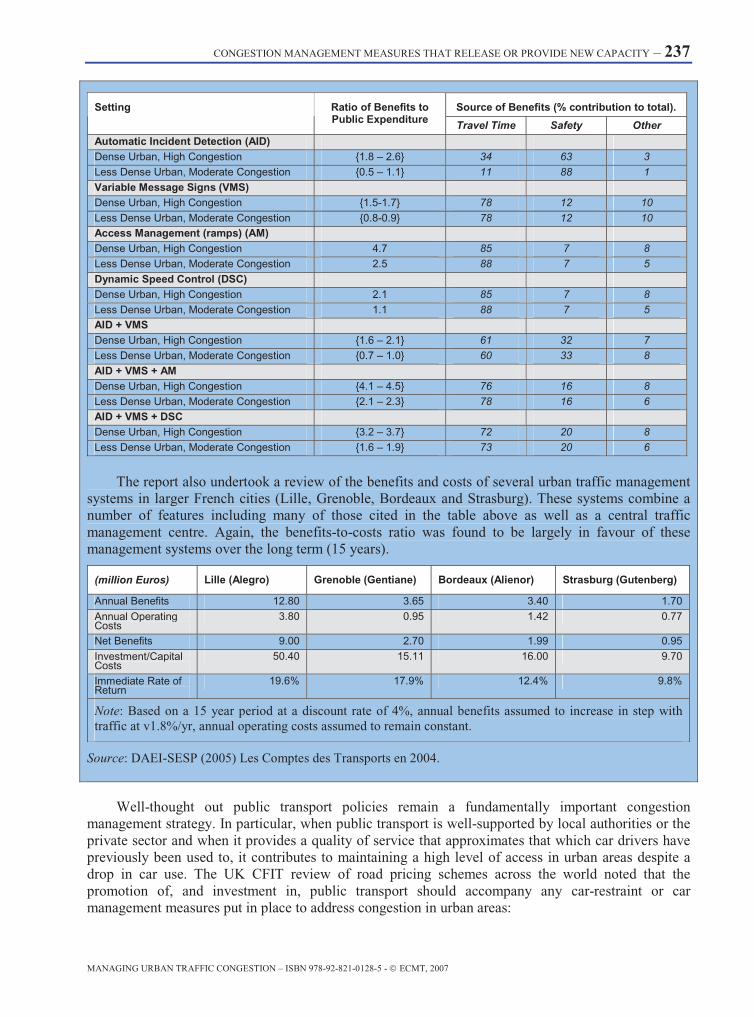
CONGESTION MANAGEMENT MEASURES THAT RELEASE OR PROVIDE NEW CAPACITY – 237
MANAGING URBAN TRAFFIC CONGESTION – ISBN 978-92-821-0128-5 - © ECMT, 2007
The report also undertook a review of the benefits and costs of several urban traffic management
systems in larger French cities (Lille, Grenoble, Bordeaux and Strasburg). These systems combine a number of features including many of those cited in the table above as well as a central traffic management centre. Again, the benefits-to-costs ratio was found to be largely in favour of these management systems over the long term (15 years).
(million Euros) Lille (Alegro) Grenoble (Gentiane) Bordeaux (Alienor) Strasburg (Gutenberg)
Annual Benefits 12.80 3.65 3.40 1.70 Annual Operating Costs
3.80 0.95 1.42 0.77
Net Benefits 9.00 2.70 1.99 0.95 Investment/Capital Costs
50.40 15.11 16.00 9.70
Immediate Rate of Return
19.6% 17.9% 12.4% 9.8%
Note: Based on a 15 year period at a discount rate of 4%, annual benefits assumed to increase in step with traffic at v1.8%/yr, annual operating costs assumed to remain constant.
Source: DAEI-SESP (2005) Les Comptes des Transports en 2004.
Source of Benefits (% contribution to total). Setting Ratio of Benefits to Public Expenditure Travel Time Safety Other
Automatic Incident Detection (AID) Dense Urban, High Congestion {1.8 – 2.6} 34 63 3 Less Dense Urban, Moderate Congestion {0.5 – 1.1} 11 88 1 Variable Message Signs (VMS) Dense Urban, High Congestion {1.5-1.7} 78 12 10 Less Dense Urban, Moderate Congestion {0.8-0.9} 78 12 10 Access Management (ramps) (AM) Dense Urban, High Congestion 4.7 85 7 8 Less Dense Urban, Moderate Congestion 2.5 88 7 5 Dynamic Speed Control (DSC) Dense Urban, High Congestion 2.1 85 7 8 Less Dense Urban, Moderate Congestion 1.1 88 7 5 AID + VMS Dense Urban, High Congestion {1.6 – 2.1} 61 32 7 Less Dense Urban, Moderate Congestion {0.7 – 1.0} 60 33 8 AID + VMS + AM Dense Urban, High Congestion {4.1 – 4.5} 76 16 8 Less Dense Urban, Moderate Congestion {2.1 – 2.3} 78 16 6 AID + VMS + DSC Dense Urban, High Congestion {3.2 – 3.7} 72 20 8 Less Dense Urban, Moderate Congestion {1.6 – 1.9} 73 20 6
Well-thought out public transport policies remain a fundamentally important congestion management strategy. In particular, when public transport is well-supported by local authorities or the private sector and when it provides a quality of service that approximates that which car drivers have previously been used to, it contributes to maintaining a high level of access in urban areas despite a drop in car use. The UK CFIT review of road pricing schemes across the world noted that the promotion of, and investment in, public transport should accompany any car-restraint or car management measures put in place to address congestion in urban areas:
238 – CONGESTION MANAGEMENT MEASURES THAT RELEASE OR PROVIDE NEW CAPACITY
MANAGING URBAN TRAFFIC CONGESTION – ISBN 978-92-821-0128-5 - © ECMT, 2007
“Pre-empting any potential capacity problems caused by car restraint measures is an important strategy, both for the scheme's practical success as well as its perceived success. The delivery of tangible improvements conveys crucial messages to the public, primarily that the scheme is not about preventing the public from travelling (and 'infringing' civil liberties), but about encouraging a switch in travel behaviour towards the use of more sustainable modes. Making this viable by the provision of real and practical alternative modes to the car either before, or at the same time as the launch of any new charging regime has been shown to be a necessary 'sweetener'” 7
In Athens, most efforts to reduce congestion have concentrated on getting car users to shift to public transportation. By developing an extensive, reliable and high quality public transportation network in the Athens Metropolitan Area, the city aims to increase public transport use from 32% (2004) to nearly 50% by 2008. These efforts include:
• Development of 2 new Metro lines, 1 new suburban rail line and a new tram system.
• Purchasing 700 new (CNG – Compressed Natural Gas) state-of-the-art buses.
• Traffic priority for all surface public transportation modes (buses, trolleys, tram), with the use of bus lanes and signalling pre-emption.
• Expansion of the recently completed 2 new Metro lines.
• Coverage of nearly the whole of the urban area by an integrated, coordinated public transportation network.
• New park-and-ride facilities near Metro stations and Bus terminals.
• Improvement of public transport performance (decrease in travel times, reliable itineraries).
For the congestion mitigation potential embodied in public transport to be realised, travellers must feel that the extent and quality of service provided are sufficient for them to forego using their cars. The net impact of policies in support of public transport will depend on the match between the offer of public transport and urban travellers’ trip-making needs and expectations regarding performance, safety and comfort. If these expectations are not met, travellers may opt for other transport modes (cars, motorised 2-wheelers, bicycles) or may eventually change their place of residence or work.
The following sections investigate key actions that can be undertaken to promote public transport.
10.2.1 Extension of Services
Public transport services can be extended physically (e.g. by adding new segments, lines or stops) or by increasing service frequency. Real-time passenger information systems can also extend service quality. Another type of qualitative improvement in service concerns increasing the accessibility of public transport to those who may otherwise experience difficulty in travelling via this mode (e.g., the disabled, the elderly and children).8 All of these measures, by making public transport more attractive or easier to use, have the potential to help attract new riders or retain existing users.
There are different types of public transport systems, corresponding to different levels of traffic and kinds of travel:

CONGESTION MANAGEMENT MEASURES THAT RELEASE OR PROVIDE NEW CAPACITY – 239
MANAGING URBAN TRAFFIC CONGESTION – ISBN 978-92-821-0128-5 - © ECMT, 2007
• Heavy Rail systems are rapid and sophisticated systems with dedicated lanes and few stops, best suited for high density sites on major lines.
• Light Rail systems are used to adapt traffic conditions on separated or mixed lanes, for medium density areas.
• Bus Rapid Transport systems provide high-quality light-rail type services (trunk routes, dedicated lanes, special fast-boarding vehicles and stations with boarding platforms) at lower costs. These can serve high to medium density areas effectively.
• Buses use existing roads and are effective in covering broader areas with diffuse demand levels. On dedicated lanes, they can also effectively service urban areas as well – however, when operating in general traffic, they can be negatively impacted by congestion.
• Paratransit, covering a number of small-scale services such as subsidised taxi services, demand-responsive bus routes, micro buses, etc. responds well to specific demand during off-peak periods or in highly dispersed zones.
It is important to match services and demand in order to satisfy users and minimise costs for transport operators.
10.2.2 Public Transport Fee Structures
Public transport fare structures have an influence on use. Ticket prices typically depend on the type of users (category, frequency, type of payments, etc) or on the type of trip (length, services, origin/destination, time, transfers, etc):
Public transport operators can seek to differentiate transport fees according to their goals. Fare differentiation can be related to:
• Customers: improving access and use, extending travel choices.
• Public Transport financing: increasing revenue, minimising operational costs.
• Management: improving transport operation and demand management (e.g. by peak and off-peak pricing on public transport services).
• Political concerns: increasing social equity, improving the environment.
The method of payment can also have an influence on levels of public transport use. Integrated tickets and electronic collection facilitate the use of public transport. A number of urban regions have successfully experimented with the integration of integrated fare structures with the most advanced of these offering region-wide, cross-mode electronic passes.
In the Czech Republic, major cities have introduced an integrated transport system for public transport, bringing together traditional city transport operators, regional bus transport operators and Czech Railways. Their tickets are compatible and this system enables passengers to easily reach many regional destinations. Public transport has been improved through higher frequency services, better information for users, signal priority at intersections and dedicated lanes for buses. 9
10.2.3 Public Transport Operational Improvements
Active management of headways and scheduling can ensure improved operational performance. This can be accomplished through the use of dedicated lanes for public transport, including bus rapid
240 – CONGESTION MANAGEMENT MEASURES THAT RELEASE OR PROVIDE NEW CAPACITY
MANAGING URBAN TRAFFIC CONGESTION – ISBN 978-92-821-0128-5 - © ECMT, 2007
transport (BRT) and High Occupancy Vehicle (HOV) lanes, giving buses and tramways priority at intersections. Bus Rapid Transit (BRT) – e.g. dedicated and separated bus lanes with quick-boarding station platforms – allow for metro-like performance at a much reduced cost. These express routes can serve as the backbone to extensive bus- and para-transit based networks that deliver high frequency and dependable service, even in areas that are relatively far-removed from urban centres. These measures can improve the reliability of public transport travel times which is a key consideration for users.
10.2.4 Other actions in support of public transport
One of the principal barriers for new users of public transport is the difficulty of intuitively navigating across urban public transport networks – especially when these are comprised many different operators and modes. Finding connections and understanding the changes one must make from bus to bus, from tram to metro, etc. can be daunting for the first-time user. Even for habitual users, transfer and waiting time are viewed negatively. Travel information systems that provide real-time information on public transport services and headways can reduce the negative impact of this downtime and help to guide travellers. The creation of areas with easy connections between modes and safe transfer zones contribute to reducing the problems travellers experience in multi-leg public transport trips. Locating parking facilities close to these platforms can help to integrate private transport (car-driving) to public transport. Such facilities include:
• Park-and-ride: parking lots for which the fee can be included in the transit ticket.
• “Kiss-and-ride”: space marked out for people who park for a few minutes to drop off or pick up their passengers.
• Bicycle lockers and parking.
Provision of such facilities should be co-ordinated between the public and private sectors in order to achieve maximum effectiveness.
10.2.5 Public Transport Information
Information systems can make it easier for people to use public transport instead of cars in many instances, but the public must trust that information to be correct for it to play a role in attracting new, or retaining existing, users. On-trip information on connections, headways, disturbances and delays are all extremely useful to users and can help to increase the attractiveness and usability of public transport. Care should also be taken to not overlook information of use for small but important groups of travellers – e.g. those with poor or no vision should be able to access travel information, wheelchair users should be able to seek connections that are accessible to them, foreign travellers will need language support.
The Czech national on-line intermodal public transport information system IDOS offers information on fares, time-tables and connections.10
The “Stadtinfoköln” system provides transport and traffic information in the Cologne region. General information is provided via variable message signs, radio, TV and videotext as is information crafted for individuals via internet, mobile phones and embarked navigation systems.
In Dresden public transport, real-time information via mobile phones allows users to make travel decisions and schedule their trips based on real-time information.
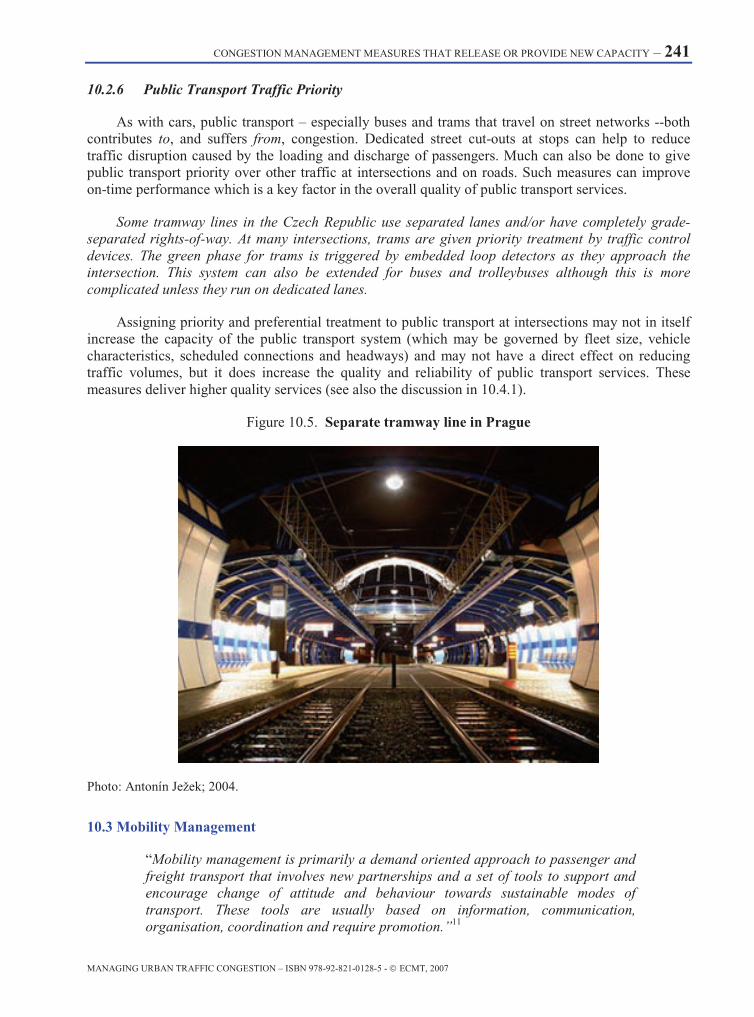
CONGESTION MANAGEMENT MEASURES THAT RELEASE OR PROVIDE NEW CAPACITY – 241
MANAGING URBAN TRAFFIC CONGESTION – ISBN 978-92-821-0128-5 - © ECMT, 2007
10.2.6 Public Transport Traffic Priority
As with cars, public transport – especially buses and trams that travel on street networks --both contributes to, and suffers from, congestion. Dedicated street cut-outs at stops can help to reduce traffic disruption caused by the loading and discharge of passengers. Much can also be done to give public transport priority over other traffic at intersections and on roads. Such measures can improve on-time performance which is a key factor in the overall quality of public transport services.
Some tramway lines in the Czech Republic use separated lanes and/or have completely grade-separated rights-of-way. At many intersections, trams are given priority treatment by traffic control devices. The green phase for trams is triggered by embedded loop detectors as they approach the intersection. This system can also be extended for buses and trolleybuses although this is more complicated unless they run on dedicated lanes.
Assigning priority and preferential treatment to public transport at intersections may not in itself increase the capacity of the public transport system (which may be governed by fleet size, vehicle characteristics, scheduled connections and headways) and may not have a direct effect on reducing traffic volumes, but it does increase the quality and reliability of public transport services. These measures deliver higher quality services (see also the discussion in 10.4.1).
Figure 10.5. Separate tramway line in Prague
Photo: Antonín Ježek; 2004.
10.3 Mobility Management
“Mobility management is primarily a demand oriented approach to passenger and freight transport that involves new partnerships and a set of tools to support and encourage change of attitude and behaviour towards sustainable modes of transport. These tools are usually based on information, communication, organisation, coordination and require promotion.”11
242 – CONGESTION MANAGEMENT MEASURES THAT RELEASE OR PROVIDE NEW CAPACITY
MANAGING URBAN TRAFFIC CONGESTION – ISBN 978-92-821-0128-5 - © ECMT, 2007
The concept of “mobility management” covers different services, organisational and consulting measures that allow users to change their travel-making choices. Communication and information are important elements of mobility management since the focus is on helping people change their own travel behaviour.
The success of mobility management policies is often conditioned by the scope and quality of information conveyed to travellers as well as by the intensity with which it is provided. Several studies have reinforced the finding that direct face-to-face communication is more effective in changing individuals’ travel choices than written information or information communicated via other media.12 This has important implications for the manner in which mobility management campaigns targeting congestion are carried out as well as the type of structures tasked to carry out these campaigns.
The remainder of this section will investigate different mobility management measures that can prove useful in managing urban congestion.
10.3.1 Ride Sharing
The term “ride sharing” is used to describe two or more individuals sharing one vehicle for a trip. Firms can help to coordinate ride-sharing among their workers or clients via on-line ride-matching services or bulletin boards.
Ride sharing allows users to reduce their travel costs and can have an important impact on traffic and parking demand. The success of ride sharing depends on the type of annex facilities or services provided to ride sharers (e.g. car rent services, well-located parking spots or HOV lanes) as well as on a supportive context (e.g. consistent working hours, high residential density, parking management, etc…). The ultimate success of these measures will depend largely on the success with which potential riders and rides are matched.
There are several principal ride sharing strategies.
Car-pooling
Car-pooling involves the use by several employees of one vehicle for commuting. Commuters can use the same vehicle every day and share expenses or rotate vehicle use among a pool of car-sharers. This measure is attractive because it is comes close to mimicking private car use and offers door-to-door travel. Coordination between riders and drivers can take place on an ad-hoc basis or can be facilitated through on-line ride matching services, internal company bulletin boards or through a mobility management service. Car-pooling can also be an option for longer-distance trips (e.g. weekend travel).
Recent studies have shown that 19% of all car movements in Germany already occur in car pools, but until September 2002 no public commuter system existed that allowed for easy ride-matching. The commuter system “Pendlernetz NRW” (www.pendlernetz.de) now provides this service for local traffic, whereas the system “Mitfahrzentrale” (www.mitfahrerzentrale.de) does so for long-distance or tourist traffic in Germany.13
Van-pooling and Bus-pooling
Van-pooling is similar to car-pooling but with the use of a van in the place of a car. The vehicle either belongs to one of the commuters, or to the company (which rents or lends it to its employees), or to a third party agency, which offers a vanpool service. The third-party solution is increasingly

CONGESTION MANAGEMENT MEASURES THAT RELEASE OR PROVIDE NEW CAPACITY – 243
MANAGING URBAN TRAFFIC CONGESTION – ISBN 978-92-821-0128-5 - © ECMT, 2007
popular because this outsourcing approach relieves the logistical burden on the firm and allows the offer of other bundled services as well.
Bus-pooling refers to bus services specially dedicated to the employees of a company. It can be organised by a third-party association or by the company itself.
10.3.2 Slow Modes
Cycling and walking can play an important role in the urban mobility mix given that a great number of trips cover relatively short distances. The lack of adequate and adapted pedestrian and cycling infrastructure can be an impediment. Even in those countries that have sought to promote these modes, growth in car traffic has often reduced the space available for non-motorised transport on urban roads.
One response has been to provide continuous and connected sidewalks and cycles lanes, in pleasant areas, with safe road interfaces. However, cycle paths are not always, nor even necessarily the most appropriate solution to promote cycling. It may be necessary to design some urban roads for slower motorised traffic and re-allocate road space to bicycles. In many instances separate cycle paths may prove to be more dangerous than roads because of the increase in “non-standard” road-cycle path interfaces and the high number of potential conflicts with other uses (and pedestrians in particular).
Visibly and effectively signing bicycle routes, distributing maps and arranging for safe bicycle parking and hire facilities at transfer stations and in inner cities can also help promote cycling in cities.
The development of non-motorised transport can lead to a reduction of car use, especially for very short distance trips and this is a relatively low cost strategy that has ancillary health benefits. However, it should be noted that cycling and walking may not represent a feasible alternative for all of the short urban trips that inhabitants make. One reason is that many of these trips are linked with other, longer, trips in complex trip chains. For instance, a worker may only have a 4 kilometre trip to go to work and back but they may also wish to have their car available to go shopping during the day or after work (and carry the goods home), to drop off their children in the morning and pick them up in the afternoon. Even though the commute trip may be easily made by bicycle, the car remains the preferred mode since it is better suited for the other trips.
Policies seeking to promote greater cycling and walking should clearly target those trips that are best suited (and therefore transferable) to these modes or otherwise address barriers that prevent their uptake. The successful implementation of these policies also requires an integrated cycling/pedestrian policy framework at the urban regional level and even at the national level14 with links to land-use development policies.
The National Cycling Development Strategy of the Czech Republic aims to develop a safe environment for cyclists and other road users as well as cleaner and more silent urban spaces. In particular, the strategy considers cycling to be an equal mode of transport and an integral part of the transport system. In Prague, an extensive network of cycle paths is planned covering 450 km.
In Germany, short-term rental bikes are provided by the national rail company Deutsche Bahn in some bigger cities. The bikes are placed all around the city centre. A flashing green light indicates a free one. Call-a-Bikes can be hired and returned easily at all major crossroads by making a telephone call and paying with a credit card. (see Figure 10.6) Similar systems are also available in a number of other cities including Lyon, Brussels and Vienna.

244 – CONGESTION MANAGEMENT MEASURES THAT RELEASE OR PROVIDE NEW CAPACITY
MANAGING URBAN TRAFFIC CONGESTION – ISBN 978-92-821-0128-5 - © ECMT, 2007
Figure 10.6. “Call a bike” Parking
Source: www.call-a-bike.de
10.3.3 Mobility Management in Companies
Corporate Mobility Management (or Company Mobility Management) strategies seek to promote sustainable commuter, business and customer travel and are put in place by private companies or public employers. CMM initiatives typically seek to reduce the negative impacts resulting from trips generated by large companies or groups of companies by specifically targeting employee and visitor/customer travel. Employers are directly involved in CMM strategies as they represent the principal “channel” to reach their employees.
The main instrument used for the planning and implementation of CMM measures – and for ex-post assessment – is the Mobility Plan. In general, a Mobility Plan includes:
• An analysis of the current situation and existing framework conditions (e.g. existing trip-patterns.
• The quality of accessibility of the site with different means of transport, legislative and regulatory context).
• The setting of targets to achieve (in terms of modal shift change or reduction of single vehicle occupancy rate).
• The definition of the range of measures to implement.
• The definition of the responsibilities for the implementation of each selected measure.
• The workplan for implementation.
• The methods and work plan for evaluation and controlling of the impact of the adopted measures.

CONGESTION MANAGEMENT MEASURES THAT RELEASE OR PROVIDE NEW CAPACITY – 245
MANAGING URBAN TRAFFIC CONGESTION – ISBN 978-92-821-0128-5 - © ECMT, 2007
For example the mobility plan for the hospital Rijnstate in Arnhem (ca 2350 employees) was established in cooperation with the hospital management board. The mobility plan has resulted in an increase of 22.5% in the public transport commuter share and the number of car-pooling members rose by 3.1%. 1.6% of commuters changed to the bicycle and solo car use declined in two years.15
Another example is Nokia in Bochum, Germany, with approximately 2600 employees. Prior to the CMM initiative, there were no public transport connections to the company site. A public private partnership was founded to improve the accessibility of the site. This partnership was co-financed by the Verkehrsverbund (Transport Association), Deutsche Bahn (German Railways) and Nokia itself. It successfully extended rail service to the Nokia site and secured the modernisation of the train sets. These changes resulted in direct commuter rail connections to the plant, faster journey times, an introduction of weekend services, more frequent services at peak times and improvements at railway stations along the way. Nokia was also given the opportunity to use in-vehicle advertising as an added bonus and thus gained extensive media coverage. One railway station is now called "Nokia". The number of passengers in the railway has more than quadrupled.16
Vorarlberger Medienhaus is an Austrian publishing house employing 300 persons that successfully implemented CMM. The firm’s location and work practices were generally favourable to car use: greenfield site, irregular work hours, large supply of parking and no public transport facilities. 75% of the employees drove to go to work. The travel plan, launched by a small group of employees, aimed to reduce the use of car amongst commuters. The introduction of cycles and pedestrian paths, the agreement with public transport operator to develop its services near the firm and information campaigns led to a decrease by 15% of the use of car. In addition, this plan tends to improve the image of the firm. 17
10.3.4 Dematerialising Transport
Modern information technologies and communication networks allow for the transfer of large amounts of data that previously had required individuals and/or companies to travel. This “dematerialisation” of data and, consequently, of travel has the potential to lead to a reduction of both private and business traffic. E-commerce services – services traded amongst companies or between companies and their customers – are one area that has been singled out for its “dematerialisation” potential. Examples of private use of e-commerce include:
• Online-banking: Electronic transactions via internet.
• Tele-shopping, Online-shopping: Electronic shopping via Internet. This induces freight traffic to deliver the goods. Usually, this freight traffic can be bundled and hence reduces traffic in comparison to classic shopping. However, it does lead to a rise in urban freight delivery that can have an impact on congestion levels.
• Examples for business use of e-commerce.
• Video conferences and video-presentations.
• Tele-diagnosis and remote maintenance: used in IT and automobile industry.
Overall, however, it is not yet clear that such practises have actually reduced the total number of trips taken or only allowed people and firms to replace some trips with others while getting more accomplished overall.

246 – CONGESTION MANAGEMENT MEASURES THAT RELEASE OR PROVIDE NEW CAPACITY
MANAGING URBAN TRAFFIC CONGESTION – ISBN 978-92-821-0128-5 - © ECMT, 2007
10.3.5 Changing Travel Behaviour
Several initiatives have shown that once travellers are made aware of existing and future traffic problems, they become more receptive to changing their travel behaviour. This is especially true if car users are aware of environmental issues and are receptive to changing their behaviour in light of their concerns. When given targeted information about alternative travel options at their disposal, these travellers may reduce their car use in favour of public transport, cycling and/or walking or otherwise change their pattern of car use to minimise their environmental impacts.
Schools
While most countries have formal education and licensing systems required for operating vehicles on roads, the same cannot be said for other transport modes. Most counties and/or urban regions offer little formal training in the skills necessary to get about urban areas via public transport, cycling or walking. “Mobility learning” for these modes is still very much an informal ad hoc process largely left up to travellers themselves. Furthermore, many children who once depended on collective transport or cycling/walking, are now ferried about by their parents in cars due, in part, to the latter’s’ perception of danger from increased road traffic.
Formalised school-based exposure to travelling via public transport, cycling and/or walking as children are developing their own trip-making behaviour can help to ensuring an even footing among modes. This type of “mobility learning” can be added to more traditional forms of traffic safety education.
National Media Campaigns, Regional and Local Campaigns
National media plans can also help to increase awareness of the impacts of excessive car use in cities. While such campaigns may not have an immediate impact on traffic, they can set in place the groundwork necessary for longer-term travel behaviour change much as other social and health campaigns have. At the local level, it may be helpful to provide car drivers with targeted and actionable messages relating to their travel. These operations can encourage use of alternative modes of transport under specific conditions such as for special events or emergencies.
Perth was the first Australian city to introduce a travel behaviour change program, TravelSmart. It was trialled in South Perth in 1997. The TravelSmart program aims to achieve a sustainable change in personal travel behaviour from single occupant car use to public transport, walking and cycling, smarter car use (car pooling) and in some cases, travel substitution (teleworking). Now a diverse range of travel behaviour change programs, including TravelSmart, are being implemented by governments around Australia. In Perth, the TravelSmart program has consistently seen increases of up to 10% in public transport use and walking/cycling, with a corresponding decrease in vehicle use and kilometres travelled.
10.4 Modifying Existing Infrastructure
After cost-effective options for improving the efficiency of road use have been explored, authorities should consider options for modifying existing infrastructure in order to increase peak-hour capacity. This capacity should be managed as with all other newly released or newly delivered capacity. The modification of existing infrastructure can be particularly useful for addressing bottlenecks or other local disturbances in traffic flow. It can also be useful in re-balancing the use of available road space amongst different modes.
CONGESTION MANAGEMENT MEASURES THAT RELEASE OR PROVIDE NEW CAPACITY – 247
MANAGING URBAN TRAFFIC CONGESTION – ISBN 978-92-821-0128-5 - © ECMT, 2007
10.4.1 Road Space Reallocation
In certain instances, congestion can arise because of the mix of incompatible or conflicting vehicle types on the same road space (e.g. when through car traffic is mixed with delivery services making local stops and buses or trams – each type of vehicle has its own pattern of travel that conflicts with the others). In some urban areas, authorities have sought to reduce these conflicts by re-allocating traffic according to the type of vehicles or traffic patterns they exhibit. This has led, for instance, to segregation between side-lanes for local traffic and central lanes on major arterials for through traffic.
Other examples include re-allocating road space away from cars to buses/trams to prevent the latter from getting bogged down in traffic. In these instances, authorities have sough to reduce the amount of space available to cars in favour of expanded space available to buses, sidewalks and cycle tracks. Re-allocated road-space can also be used for example to secure road crossings or to widen sidewalks. And in narrowing traffic lanes the travel speed can be reduced.18
In Paris, the re-allocation of road space in favour of buses running the “petite ceinture” orbital routes around the centre has increased their reliability and reduced their travel times. The attractiveness of these lines was improved leading to a 40% increase in the number of passengers.19
However, these traffic segregation measures should be approached with caution – especially within dense urban areas insofar as they may overly emphasise the transport function of roadspace to the detriment of all of its other vital urban functions. Increasing the space allocated to public transport may make sense in many instances as long as public transport remains a high quality and effective alternative for car use. Otherwise, it may actually increase the level of road congestion while delivering few tangible benefits. Likewise, schemes to segregate different road users onto their own dedicated facilities can lead to the creation of high-speed traffic conduits within urban areas that erode the non-transport but essential functions of urban streets (social space, café terraces, shop-fronts, children’s play areas, etc…). One-way streets, turn prohibitions and similar measures are not easily made consistent with the objective of creating a high quality urban environment, improving the quality of life for pedestrians and cyclists. There are limits to the extent to which such measures can be implemented because they could conflict with other wider objectives.
10.4.2 Roadway Modification and Geometric Design
Congestion can arise due to problems with roadway design. In these cases, it is necessary to modify the geometric design of the road segment to improve its quality and safety and ensure that design shortcoming no longer give rise to congestion. Geometric design takes into account the physical characteristics of the road and its intended level of use accounting for such things as: horizontal and vertical alignment, number of lanes, right-of-way and traffic volumes. Geometric reconstruction includes increasing lane width, creating climbing lanes for trucks, and removing sharp curves. Changing these parameters can increase traffic flow and improve safety at a moderate cost. However, the same caveat exists as for road-space re-allocation – care should be given to account for non-transport uses of the road and its environs so that these qualities are not degraded.
10.4.3 Tidal Flow Systems
Tidal flow systems are useful where there exists a significant daily change in the direction of the dominant traffic flow. Tidal flow systems operate by allowing motorists to use common lanes whose direction change according to the time of day and dominant flow (see Figure 10.7). This is achieved by coordinating in-road and gantry displays to guide traffic to the appropriate lanes. This measure is
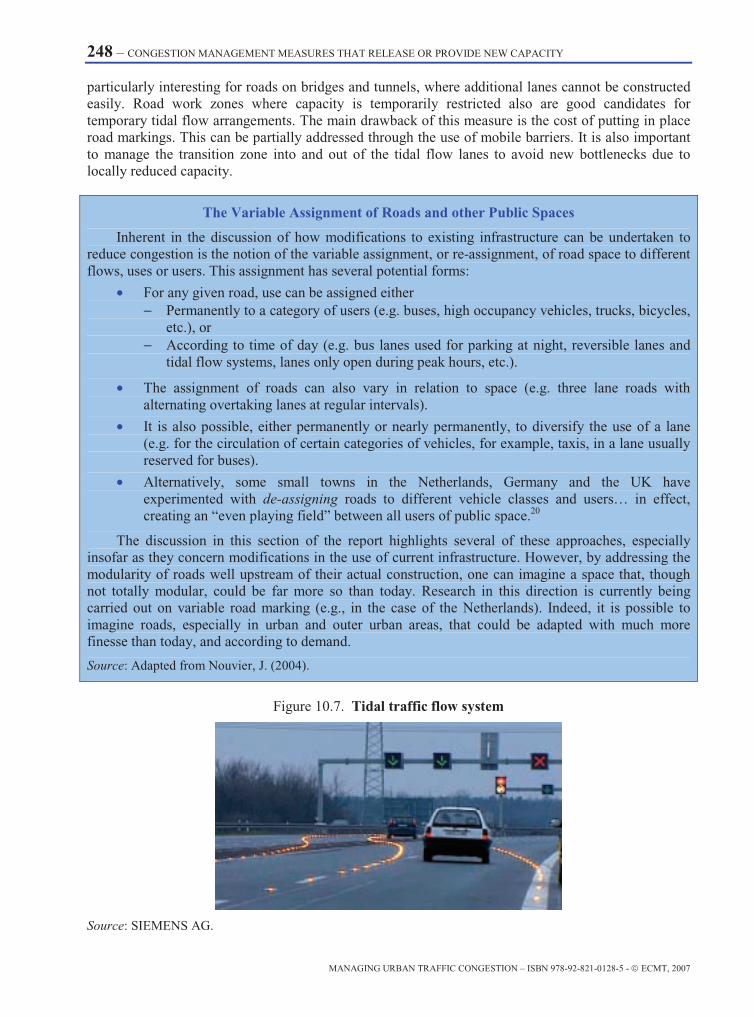
248 – CONGESTION MANAGEMENT MEASURES THAT RELEASE OR PROVIDE NEW CAPACITY
MANAGING URBAN TRAFFIC CONGESTION – ISBN 978-92-821-0128-5 - © ECMT, 2007
particularly interesting for roads on bridges and tunnels, where additional lanes cannot be constructed easily. Road work zones where capacity is temporarily restricted also are good candidates for temporary tidal flow arrangements. The main drawback of this measure is the cost of putting in place road markings. This can be partially addressed through the use of mobile barriers. It is also important to manage the transition zone into and out of the tidal flow lanes to avoid new bottlenecks due to locally reduced capacity.
The Variable Assignment of Roads and other Public Spaces
Inherent in the discussion of how modifications to existing infrastructure can be undertaken to reduce congestion is the notion of the variable assignment, or re-assignment, of road space to different flows, uses or users. This assignment has several potential forms:
• For any given road, use can be assigned either − Permanently to a category of users (e.g. buses, high occupancy vehicles, trucks, bicycles,
etc.), or − According to time of day (e.g. bus lanes used for parking at night, reversible lanes and
tidal flow systems, lanes only open during peak hours, etc.).
• The assignment of roads can also vary in relation to space (e.g. three lane roads with alternating overtaking lanes at regular intervals).
• It is also possible, either permanently or nearly permanently, to diversify the use of a lane (e.g. for the circulation of certain categories of vehicles, for example, taxis, in a lane usually reserved for buses).
• Alternatively, some small towns in the Netherlands, Germany and the UK have experimented with de-assigning roads to different vehicle classes and users… in effect, creating an “even playing field” between all users of public space.20
The discussion in this section of the report highlights several of these approaches, especially insofar as they concern modifications in the use of current infrastructure. However, by addressing the modularity of roads well upstream of their actual construction, one can imagine a space that, though not totally modular, could be far more so than today. Research in this direction is currently being carried out on variable road marking (e.g., in the case of the Netherlands). Indeed, it is possible to imagine roads, especially in urban and outer urban areas, that could be adapted with much more finesse than today, and according to demand.
Source: Adapted from Nouvier, J. (2004).
Figure 10.7. Tidal traffic flow system
Source: SIEMENS AG.
CONGESTION MANAGEMENT MEASURES THAT RELEASE OR PROVIDE NEW CAPACITY – 249
MANAGING URBAN TRAFFIC CONGESTION – ISBN 978-92-821-0128-5 - © ECMT, 2007
10.4.4 One-way Streets
When there are high volumes of traffic and little available space, one-way streets can help to increase road capacity and to ease signal timing. This measure can be particularly effective at intersections where it simplifies turning patterns and avoids conflicts between cars and pedestrians. It is best suited when there are other parallel streets available for the reverse flow so as to ensure high levels of accessibility.
10.4.5 Intersections
Intersections are often responsible for congestion in urban areas due to the converging of multi-directional flows in a limited space. Improving intersection design and operation can mitigate traffic congestion and reinforce safety by reducing conflicts amongst vehicles and with cycles and pedestrians.
Intersection treatments seeking to alleviate or avoid the onset of congestion include:
• Geometric design, to coordinate turns and avoid conflicts.
• Turn prohibitions, to eliminate conflicts with others who are turning.
• Guidelines for access, which determine the manner in which users will be provided access to the intersection, to reinforce safety.
• Grade separations, physical separation of flows to mitigate congestion and improve safety; this measure is used for high flows with consequent problems of safety.
• Traffic signal management, which contributes to better operations.
10.4.6 Re-classification of roads
Changing a road from one category to another (e.g. from local to collector to arterial, or vice versa) can also be a useful congestion management strategy. Upstream and downstream impacts on the entire network must be considered. Before changing the status of a road, steps should be undertaken to enhance the quality (pavement, signing, management, services etc) of the existing link to conform to the standards of the new road category.
10.5 Building New Infrastructure
Providing new road capacity by either extending or building new roads is typically a very high cost option in densely populated urban areas and can have adverse impacts on the urban environment. On the other hand, adding new capacity may be the only option that can deliver lasting congestion relief – provided that the new capacity is managed.
10.5.1 Roadway Expansion
Expanding one road can alleviate traffic on other roads and increase overall accessibility. This expansion may involve building new roads or creating new lanes, overpasses, tunnels or bridges. Comprehensive cost-benefit assessment methodologies are necessary to ensure that the costs of new road construction are less than the costs imposed by congestion itself and that the cost of the new facility is less then the cost of deploying other strategies that could deliver the same benefits. A complicating factor may be that the responsibilities of road authorities are limited to road investment or traffic management decisions which precludes them from adequately considering alternative

250 – CONGESTION MANAGEMENT MEASURES THAT RELEASE OR PROVIDE NEW CAPACITY
MANAGING URBAN TRAFFIC CONGESTION – ISBN 978-92-821-0128-5 - © ECMT, 2007
congestion management measures. For instance, dedicated funding available for road construction but not to other measures can bias the outcome of congestion management towards new construction.
Nevertheless, road construction can be an effective congestion response strategy when the above conditions above are met – and this is especially so in areas that have undeveloped or incomplete road networks.
Completion of the 3-Tier Tokyo Radial Road Network
Construction of ring roads in the Tokyo metropolitan area has fallen behind increases in demand. This is leading to severe traffic congestion as regional traffic is shunted through Tokyo’s dense urban streets as it seeks to cross from one side of the city to the other. Because of the delay in the construction of ring roads, roughly 60% of traffic on the centre of the Tokyo Metropolitan Expressway network is through traffic. Construction of ring roads will alleviate traffic congestion that is caused by this passing traffic. Efforts are also underway to eliminate bottlenecks through the targeted intersection and bottleneck treatment. These measures include long-term measures such as construction of bypass roads and short-term measures such as widening lanes etc. In a specific example, the grade separation project at the National Route 357 and loop route 7 intersection in Tokyo has resulted in an 8-fold increase in traffic speed during the morning peak.
Source: Japanese Ministry of Land, Infrastructure and Transport.

CONGESTION MANAGEMENT MEASURES THAT RELEASE OR PROVIDE NEW CAPACITY – 251
MANAGING URBAN TRAFFIC CONGESTION – ISBN 978-92-821-0128-5 - © ECMT, 2007
10.5.2 Construction of High Occupancy Vehicle (HOV) Lanes
Some urban areas have put in place dedicated high occupancy vehicle (HOV) lanes for cars with 2 or more occupants in order to reduce the number of single-occupant cars on the network. These lanes are sometimes used by taxis and buses as well. HOV lanes decrease travel times and their variability for their users – which, when extended to buses, can also be an incentive for using public transport. When successful, this measure can allow a greater number of people to travel along the road in question while decreasing the number of vehicles needed. It is especially effective when combined with park-and-ride facilities, traffic signal priority and free access to ramp meters and toll lanes.
Occupancy rules are clearly posted along these lanes and their success is largely predicated by credible and effective enforcement of the rules. However, HOV lanes are not necessarily a suitable response everywhere. Indeed, their impact is highest on those links in the urban motorway network that are consistently highly congested.21 HOV lanes can be especially effective when combined with High Occupancy Toll (HOT – see below) lanes that charge variable rates based on the level of congestion on parallel routes.
10.5.3 Construction of High Occupancy Toll (HOT) Lanes
High Occupancy Toll lanes are HOV lanes where single occupancy vehicles pay for access during peak hours. The toll paid can be set according to the time of day or according to the prevailing level of traffic on the parallel non-tolled lanes. Users can choose between using general-purpose lanes or paying for better conditions in the HOT lanes. The most advanced HOT systems allow for demand responsive tolling which communicates toll rates instantaneously via variable message signs and for use automatic toll collection.
In the USA, on the I-15 FasTrak in San Diego, high occupancy vehicles ride free and all single occupancy vehicles pay a toll. On the tolled SR 91 Express Lanes in Orange County, HOVs pay reduced tolls. In Houston, HOVs 3 vehicles (with three and more persons) have cost free access to the Katy Freeway and Northwest Freeway QuickRide, while HOVs 2 vehicles pay a toll.
A single HOT lane has a lower managed capacity than multiple HOT lanes. The one lane Houston I-10 Katy Freeway QuickRide with reversible-flow facility is kept to 1500 vehicles/hour. The SR 91 Express Lane provides two travel lanes in each direction operates at acceptable conditions with flow rates of ca 1800 vehicles/ hour/lane. 22
10.5.4 Construction of Parking Facilities
Given the importance of parking availability in predicating urban traffic flows (see Chapter 8), authorities may wish to expand or otherwise modify the offer of parking within the urban area. This may involve constructing new managed and priced parking facilities.
A before-and-after study of parking in Vienna showed the benefits of parking space management and enforcement. A crack-down on illegally parked vehicles (- 78%) resulted in an increased use of parking facilities that previously had been underused. The removal of the illegal parked vehicles from the streets also reduced traffic obstructions and increased downtown traffic flow. Finally, “cruising” for parking reduced by 20% as did the distances driven searching for parking (-18%).23

252 – CONGESTION MANAGEMENT MEASURES THAT RELEASE OR PROVIDE NEW CAPACITY
MANAGING URBAN TRAFFIC CONGESTION – ISBN 978-92-821-0128-5 - © ECMT, 2007
10.6 Packages of Measures
None of the individual measures described in this chapter can effectively provide a basis for durably managing congestion. The deployment of long-term congestion management policies must result from a reasoned plan that seeks to combine those measures which have the greatest promise for addressing the scale and scope of the urban traffic challenge. Such plans generally include:
• Studies to analyse the situation and fix objectives.
• Choice of measures and partners best suited to tackle the problem.
• Information to users.
• Implementation of the measures.
• Assessment to check the benefits and drawbacks of the measure and what can be improved.
How this plan is carried out depends largely on local circumstances but many examples of congestion management planning structures exist throughout the OECD/ECMT region.
The California Center for Innovative Transportation has proposed a comprehensive approach based on a Corridor Management Plan. This approach brings together regional, local and congestion management agencies in an effort to mitigate congestion along broad urbanised corridors according to the hierarchy of actions illustrated in figure 10.8. 24
Figure 10.8. Corridor Management Plan Demonstration
Source: California Center for Innovative Transport, 2005.
The Cologne project Stadtinfoköln (see Figure 10.9) combines various approaches to congestion mitigation. Many innovative services and tools have been used, e.g.:

CONGESTION MANAGEMENT MEASURES THAT RELEASE OR PROVIDE NEW CAPACITY – 253
MANAGING URBAN TRAFFIC CONGESTION – ISBN 978-92-821-0128-5 - © ECMT, 2007
• Networking together parking ticket machines and applying new algorithms to derive the occupation rate of open-space parking on streets.
• Online travel time measurement for cars in cities.
• Comparison of actual travel time and trip costs “car versus public transport”.
• Short-term prognoses of traffic and parking situation in the city.
• New approaches in the field of the economic evaluation.
The integration of various measures within a broad package reinforces the efficiency of each individual measure. For instance the co-benefits of different measures may include developing new financing as in the case where corridor pricing contributes to investments in new infrastructure. Another example is the role of park-and-ride facilities in enhancing public transport. Indeed, additional incentives can help to make a measure more acceptable by public as when improving the offer and quality of public transport helps to make road pricing more popular. Finally, integration also involves the association of short and long-term policies. Short-term measures should tackle urgent problems without interfering or unknowingly biasing long-term actions.
Figure 10.9. Combining multimodal traffic and travel information
Source: Project Stadtinfoköln, 2002.
254 – CONGESTION MANAGEMENT MEASURES THAT RELEASE OR PROVIDE NEW CAPACITY
MANAGING URBAN TRAFFIC CONGESTION – ISBN 978-92-821-0128-5 - © ECMT, 2007
NOTES
1. Sachverständigenrat für Umweltfragen (2005).
2. Institute of Transportation Engineering of the City of Prague (2004).
3. Questionnaire response.
4. Institute of Transportation Engineering of the City of Prague (2004).
5. BMVBW, Systems for influencing traffic flow on German Motorways – State of the art and Future Perspectives.
6. For instance, one study looking at the impact of the opening of the San Francisco Bay Area Rapid Transit (BART) Oakland-San Francisco line found that the immediate diversion of 8 750 car trips to BART was followed by an increase in 7000 new car trips – largely eroding the congestion-reduction benefits of the new Metro line. Sherret, A. (1975).
7. CFIT (2006).
8. For a review of these measures, see ECMT (2006b).
9. Institute of Transportation Engineering of the City of Prague (2004).
10. See http://www.idos.cz.
11. MOSAIC/MOMENTUM Consortia (1999).
12. Beckmann, K. J. ; Wehmeier, T. (2004).
13. Pendlernetz NRW (2005).
14. ECMT (2004).
15. Müller, G. (2001).
16. European Mobility Management (2005).
17. ECMT Round Table 121, Managing Commuters’ Behavior.
18. Bauhardt, C. (2005).
19. Bauhardt, C. (2005).
20. Initiated by Dutch traffic engineer, Hans Monderman in rural Holland, this approach has been picked by a number of other small towns and some urban neighbourhoods. The principal motivation behind these policies is not congestion reduction (often not as great a problem in the small rural towns concerned) but a desire to increase safety by, paradoxically, mixing all classes of road users, including pedestrians and cyclists. Empirical evidence from the first experiments with this approach has shown that safety increases as cars slow down as they enter an environment where no traffic rules are signalled and all users share the same road space.
21. TRB – Committee of HOV-Lanes (2005).
22. FHWA (2003).
23. Parkraumbewirtschaftung Wien (2005).
24. CCIT (2006).

CONGESTION RESPONSE STRATEGIES: GETTING THE DECISION PROCESS ON TRACK – 255
MANAGING URBAN TRAFFIC CONGESTION – ISBN 978-92-821-0128-5 - © ECMT, 2007
11. CONGESTION RESPONSE STRATEGIES: GETTING THE DECISION PROCESS ON TRACK
This chapter examines how to put in place congestion management policies from the point of view of public officials with responsibility for traffic management. It identifies some key problems that can divert or de-rail decision-making processes. The chapter draws conclusions on the formulation of congestion management strategies and on the choice and combination of instruments to employ and the decision processes to follow1.
11.1 Key Problems that threaten decision making processes
11.1.1 Institutional arrangements and overall responsibility/accountability
Tackling congestion requires an integrated multi-level approach and therefore a multi-level framework of planning and decision making. Such an integrated approach needs to span five broad levels encompassing:
1. Operational integration of different transport network operators.
2. Integration between instruments affecting different modes and between those involving infrastructure, traffic management, information and pricing.
3. Policy integration between transport and land use.
4. Organisational integration of government bodies and agencies with different responsibilities for transport policy.
5. And possibly organisational integration between transport and land use policies and other policy areas such as health and education.
Tackling congestion requires a plan – one that encompasses the complexities of the congestion problem, one that addresses the spatial extent of the region’s travel patterns and one that involves the relevant institutional and private actors across the urban area. For examples, the report Making the Right Choices: Options for Managing Transport Congestion of the State of Victoria in Australia2 notes that institutional changes that would improve management of transport congestion include a stronger role for public transport, a single transport budget and common project appraisal criteria.
11.1.2 Dynamic aspects of transport and land use interactions
Congestion is affected by land use policy. Policies seeking to mitigate congestion must take into account the interactions between transport and land use. The key problem in the decision-making context is that it is very difficult to anticipate the way in which these changes will manifest themselves and the timescales over which they will occur. Unless dynamic changes are taken into account, the basis on which decisions are taken could well be quite misleading. One example would be estimates of travel time savings as a result of higher speeds (e.g. by development of urban motorways). In the
256 – CONGESTION RESPONSE STRATEGIES: GETTING THE DECISION PROCESS ON TRACK
MANAGING URBAN TRAFFIC CONGESTION – ISBN 978-92-821-0128-5 - © ECMT, 2007
longer term, the result of higher speed travel has sometimes been the lengthening of commuter trips, not a reduction of travel time.
11.1.3 Coordination of road and public transport measures
Congestion must be addressed consistently across both road and public transport networks. Separate road and rail/public transport administrations, the multiplicity of decision-making authorities, different and dedicated revenue streams all contribute to the difficulty in coordinating road and public transport measures. This mis-match must be addressed by congestion management policies.
In some large metropolitan areas, suitable public transport systems providing levels of service approximating those of cars are simply not available. Of course, the lack of suitable public transport is often one of the factors contributing to the pressure for car use and the extent of excessive congestion on the roads in the first place.
11.1.4 Revenue raising, project funding and fiscal aspects
Almost all congestion measures cost money and some can be particularly expensive. The degree to which local and regional authorities can impose taxes or charges to pay for these will depend on national fiscal structures, which differ from country to country.
This assignment of fiscal authority and financial responsibilities can sometimes derail congestion management strategies, notably in the case of congestion charges. In some instances, the allocation of revenues has proven a difficult issue to resolve. Finance Ministries typically oppose any direct linking of revenues to specific expenditures. However, communities will often only support road or congestion pricing if the government guarantees that the revenues raised will be re-invested in road and public transport improvements.
11.1.5 Community consultation and stakeholder participation
Public consultation is an essential, and in some jurisdictions an obligatory step for certain congestion mitigation measures (e.g. zoning plans or new road construction). While many public agencies and transport operators are already familiar with some forms of public involvement, it is not clear that most have put in place comprehensive public outreach capacities for region-wide congestion mitigation plans. It is difficult to consult effectively and involve stakeholders when the subject requires consideration of so many complex matters, ranging from high level policy objectives, metropolitan land use and transport system planning, different levels of government responsibility and a diversity of interest groups competing for support. London offers a model for others to follow in the extensive consultation that accompanied development of the congestion charge by TfL.
11.1.6 Political risk taking
Congestion management strategies are likely to involve the Government taking the lead in one way or another. While the strategies being proposed may well be soundly based and likely to be very effective in achieving improved outcomes in the longer term, they may appear highly risky in the short term to the government taking decisions. Elected officials have a responsibility for identifying priorities and making proposals for transport expenditures. And yet, these expenditures will typically not provide returns widely perceived by the community for several years. The temptation is to favour projects with short-term results over those whose effects will only become apparent after the current administration has left office. The risks are minimised by thorough consultation and careful planning of the introduction of measures such as congestion charges, as the London experience demonstrates.

CONGESTION RESPONSE STRATEGIES: GETTING THE DECISION PROCESS ON TRACK – 257
MANAGING URBAN TRAFFIC CONGESTION – ISBN 978-92-821-0128-5 - © ECMT, 2007
11.2 Common elements of decision-making processes
11.2.1 Integrating and Co-ordinating Congestion Management Responsibilities
Each of the measures outlined in the previous chapter implies a certain managerial level of responsibility and decision making, ranging from broad urban development policies to day-to-day road operations. Experience has shown that for an approach to be successful, it should be comprised of measures belonging to several of these levels of responsibility so that synergies can be developed in meeting the congestion management objectives.
Effectively managing congestion requires a integrated multi-level approach and therefore a multi-level framework of planning and decision making. The more complex the congestion problem, the higher the levels of responsibility that should be incorporated in this approach. And the higher the level of responsibility involved, the broader the scope for planning and decision making that are involved in the congestion management policy process.
Successful integration of different policy streams is essential for the successful outcome of broad congestion management strategies. Integration can be thought of at five different levels:
• Operational integration of different services and information e.g. in public transport (including fares structures) and traffic management.
• Strategic integration between instruments affecting different modes and between those involving infrastructure, management, information and pricing.
• Policy integration between transport and land use.
• Organisational integration of government bodies and agencies with different responsibilities for transport.
• Policy – and possibly organisational - integration between transport and land use on the one hand and other policy areas such as health, education and society.
Effective congestion management strategies in large urban areas will typically incorporate many, if not all, of these levels of integration.
Integration at the strategic level can help to achieve benefits that flow from the use of instruments which complement each other. One difficulty, however, is that individual instruments can have adverse impacts on certain groups of users. A careful choice of complementary instruments can help balance the gains and losses and if appropriate compensate the losers. For all of these reasons, a package of instruments is likely to be more effective than selecting any one instrument on its own. Thus, synergy can be achieved between instruments such that the overall benefits of the congestion management package are greater than the sum of its parts.
11.2.2 Fitting Congestion Management Strategies within Broader Transport Policy
Effective congestion management strategies should be situated within a broader, integrated transport strategy. Just how the broader transport policy is formulated depends on local and national circumstances. These policies typically address “on the road” operational congestion responses in addition to other goals that can have an indirect role to play in congestion mitigation.
In many parts of Europe, for instance, the broad transport policy objectives as they pertain to urban travel can be characterised by the following four elements:

258 – CONGESTION RESPONSE STRATEGIES: GETTING THE DECISION PROCESS ON TRACK
MANAGING URBAN TRAFFIC CONGESTION – ISBN 978-92-821-0128-5 - © ECMT, 2007
• Reducing the current and future need to travel.
• Reducing the amount of travel by car.
• Improving the public transport system.
• Improving the performance of the road network generally.
In parts of North America and Oceania, largely due to their different land-use contexts, the focus is not so much on reducing the current and future need for travel or reducing the amount of travel by car per se but, rather, on reducing the environmental and social impacts of car use.
Whatever the greater transport policy goals, however, it rarely makes sense to consider only operational, “on road” congestion management responses because of the interdependencies between it and other parts of transport policy. The formulation of a congestion response strategy should therefore be regarded as “interlinked” with the formulation of a broader transport strategy.
11.3. Decision making approaches and context
The PROSPECTS’ Guidebook3 identifies three distinct approaches to decision-making which may be adopted when dealing with sustainable transport/land-use policies:
• Vision-led approaches usually involve an individual or committee having a clear view of the measures needed to improve transport and land use in the city. The focus then is on implementing them as effectively as possible.
The introduction of the London Congestion Charge Scheme may well be considered a good example of a “vision-led” approach; the same goes for the development of the famous light rail network around Karlsruhe and several of the tramway systems that were introduced in French cities.
• Plan-led approaches involve specifying objectives and problems, sometimes in the context of a vision statement, and adopting an ordered procedure identifying possible solutions to those problems, and selecting those which perform best. Plan-led approaches can take two principal forms:
In the true Objectives-led approach broad objectives are first specified, typically by the local authority or its elected members. These are then used to identify problems by assessing the extent to which current, or predicted future conditions, in the absence of new policy measures, fail to meet the objectives. This approach has been adopted in many integrated transport studies. In some cases this list of problems has then formed the basis for discussions with elected members or the public to see whether they have different perceptions of the problems. If they do, these are then used to redefine the objectives to match their concern.
The alternative Problem-oriented approach is to start by defining types of problem, and to use data on current (or predicted future) conditions to identify when and where these problems occur. The objectives are implicit in the specified problems, and in many cases may never actually be stated. This approach has the merit of being easily understood. However, it is critically dependent on developing a full list of potential problems at the outset. If particular types of problem (like access to centres of employment) are not identified because the underlying objective (accessibility) has not been considered, the resulting strategy will be only partially effective. It is thus wise to check with relevant stakeholders that the full set of potential problems has been identified.
CONGESTION RESPONSE STRATEGIES: GETTING THE DECISION PROCESS ON TRACK – 259
MANAGING URBAN TRAFFIC CONGESTION – ISBN 978-92-821-0128-5 - © ECMT, 2007
• Consensus-led approaches involve discussions between the stakeholders to try to reach agreement on each of the stages in the process. Ideally agreement is needed on the objectives to be pursued and their relative importance, the problems to be tackled, the policy instruments to be considered, the selection of policy instruments which best meet the objective, and the way in which they should be combined into an overall strategy, and implemented. In practice much consensus-building focuses on the choice of policy instruments, but it can be considerably enhanced by considering objectives and problems as well.
The most common approach in European cities is a mix of plan-led and consensus-led decision-making; the least common approaches are those which tend either towards vision-led or towards plan-led decision-making.
Each of the approaches has some obvious pitfalls:
• A consensus-led approach may, unless agreement can be quickly reached and sustained, lead to delay and inaction.
• A plan-led approach can become unduly dependent on professional planners, who may lose sight of the needs of politicians and stakeholders.
• And a vision-led approach is critically dependent on the individual with the vision. If he or she leaves office, it may prove very difficult to avoid abandoning the strategy.
There is no simple answer to the question, which approach would suit best for the formulation of a strategy in which specific circumstances.
One obvious criterion would seem the institutional distribution of responsibilities and discretionary powers within the metropolitan area. In other words the degree to which there is a match between geographical scope of the strategy and the responsibilities and powers of the authority who is to initiate the congestion management plan.
If the congestion problems and their possible solutions remain contained within the borders of one jurisdiction, the responsibility for formulating and implementing congestion response strategies may be limited to a single public body (e.g. a municipality). However, in most cases, congestion problems and/or solutions will have run across jurisdictional boundaries and require collaboration between different authorities and public bodies.
Even if there is an authority with sufficiently wide powers and responsibilities to match the geographical scope of the congestion problem, their action may well be influenced strongly by adjacent authorities, by other regional bodies, and by national governments or regional organisations. And any authority will inevitably experience the major influence that business, environmentalists, transport users, the general public and the media can all have on decision-making.
A useful example of a decision process architecture, focusing on “lower planning level processes” can be found in the “Handbook for Sustainable Traffic Management”, developed by the Dutch AVV Transport Research Centre. This handbook describes a process architecture for achieving agreement among network operators within a region (and among their stakeholders) about co-ordinated traffic management strategies, on all network tiers, aimed at optimisation of road use through the whole network.
260 – CONGESTION RESPONSE STRATEGIES: GETTING THE DECISION PROCESS ON TRACK
MANAGING URBAN TRAFFIC CONGESTION – ISBN 978-92-821-0128-5 - © ECMT, 2007
11.3.1 Institutional Frameworks
National institutional frameworks should be supportive of integrated transport policies at the urban level4. Some countries have created public bodies with appropriate powers for urban transport planning in cases where these frameworks did not exist beforehand by, for example, creating regional public bodies that are responsible for defining and overseeing the implementation of integrated urban transport policies.
Early starters in the 1970’s focused on the co-ordination of public transport in metropolitan regions (e.g. the German and Swiss “Verkehrsverbunde”). Since then, other drivers, such as the need for co-ordinated spatial economic development, have become more and more acute and have led to the creation of similar bodies. Since each country has its own government and political “culture” deeply rooted in its national history, the responsibilities and powers of these public bodies, as well as their form, tend to differ from country to country. For example, some have direct responsibility for public transport operations or pricing measures and levy taxes directly while others do not. The private sector takes an active role in influencing public transport and pricing decisions in some countries and this must be accounted for.
11.3.2 Stakeholder participation
Wide participation in consultation can help ensure that the full range of views and objectives is considered. It can provide a better understanding of transport problems, help generate innovative solutions and be a key factor in gaining public support and acceptability for the final mix of measures. Participation can save time and money later in the process, particularly at the implementation stage, as potential objections will likely have been minimised by taking stakeholders’s concerns into account early on.
The involvement of stakeholders can occur on a number of different levels:
• Information provision: a one-way process to keep those with an interest in the strategy informed.
• Consultation: the views of stakeholders and the general public are sought at particular stages of the study and the results are input back into the strategy formulation.
• Deciding together: the stakeholders become decision makers and work with the political decision-makers and professionals in formulating the strategy.
• Acting together: stakeholders also become involved in the implementation of the strategy. Public-private partnerships are one example of this approach.
• Supporting independent stakeholder groups: the city enables community interest groups to develop their own strategies.
When seeking input and co-operation from different actors, it is also important to include those groups that may not be immediately obvious but who are nonetheless affected by congestion management policies.

CONGESTION RESPONSE STRATEGIES: GETTING THE DECISION PROCESS ON TRACK – 261
MANAGING URBAN TRAFFIC CONGESTION – ISBN 978-92-821-0128-5 - © ECMT, 2007
Inzell Initiative
In September 1995 senior officials of the City of Munich met with representatives from BMW and leaders of various interest groups in the Bavarian skiing resort of Inzell. The purpose of this first - secret – ‘round table’ was to investigate whether a ‘win-win’ discourse on the development of the Munich region in general, and more particularly, of the organisation of transport within the region, could be found. The Inzell meeting was designed to relaunch the co-operation between the city and the car producer and to integrate other participants into this new discourse on the future of mobility in Munich after BMW’s ill fated "blue zone for Munich" initiative. This plan, initiated by BMW in 1989, combined full inner city pedestrianisation with the introduction of a comprehensive reorganisation of traffic in the rest of the city. Initially the impact of the “blue zone” plan was hampered by the fact that the City Council took offence as the car producer essentially meddled with strategic planning – a key government responsibility.
The outcome of the Inzell meeting was a major success. Never had Munich achieved such broad co-operation involving actors from such a variety of backgrounds and dealing with highly contentious political issues such as traffic management. The Inzell process gave rise to a new coalition that cut through existing positions and redefined the consensus view on the challenges facing the region and the solutions required. Working on the basis of a shared problem definition, the Inzell Traffic forum works out a common position amongst the various actors which is then fed directly to the city council whose task it is to take appropriate legislative action and to allocate resources to the solutions. This work has continued since the first “Inzeller Kreis” meeting and now forms the basis for mobility-related decision-making inn the greater Munich region.
Note: based on quotes from “Democracy in the Risk Society? Learning from the New Politics of Mobility in Munich”. (1999, Maarten Hajer & Sven Kesselring, article in Environmental Politics, 1999, no. 3, pp.1-23); and “Never walk alone! Processes, Results and Purposes of an innovative and successful mobility partnership in Munich” Martin Schreiner, Reiner Knäusl, Landeshauptstadt München; paper presented at ECOMM 2004, Lyon.
Different levels of decision-making are appropriate for different stages in the development of the congestion management strategy.
The actors to be involved may be categorised into different groups, such as:
• Political leaders/decision makers.
• Public authorities and agencies involved in operating the transport network.
• Public authorities and agencies involved in operating other public infrastructure networks (electrical power distribution, water distribution, sewer system, telecom, etc).
• Users of the transport system and their interest groups: transport companies, PT operators but of course also individual road users, cyclist associations etc.
• Organisations and companies that benefit from good access to their premises or suffer from bad access: employers, shops and trading companies, manufacturing companies, but also real estate owners, and interest groups who represent these: associations of industry, chamber of commerce etc.
• Interest groups representing environmental and other citizen’s interests.
• The general public.
262 – CONGESTION RESPONSE STRATEGIES: GETTING THE DECISION PROCESS ON TRACK
MANAGING URBAN TRAFFIC CONGESTION – ISBN 978-92-821-0128-5 - © ECMT, 2007
There is a good case for involving participation at all key stages in the development and implementation of a congestion management strategy. Once stakeholders have been invited to participate, it is important to clarify the roles of those involved and the contributions that may be expected from them. It is also important to seek agreement on the next steps to be taken, such as setting objectives, determining the scope and organising the problem analysis.
11.3.3 Community consultation
The most obvious opportunities for consultation during a decision process are during the early and the final stages of the process. When considering a congestion strategy, dedicated consultation sessions with users and/or citizens have proven to yield valuable results with regard to problem perception, defining objectives and the design of alternative solutions.
Participants must also believe that they have a genuine role to play and that the matters they bring forward will be taken into account; if this expectation is not met, it will be a threat to obtaining public support in later stages.
Wilmington, Delaware Congestion Management Strategy
The Wilmington Area Planning Council (WILMAPCO) is metropolitan planning organization responsible for meeting the federal transportation planning requirements. WILMAPCO designed a “Congestion Management System” (CMS – see Chapter 4) that systematically addresses congestion as part of the overall regional planning process. The process begins by assessing system performance using the following measures: volume to capacity ratio (road and public transport), intersection level of service, and percent under posted speed. These measures are evaluated for four different land-use/growth scenarios developed through the regional planning process. The CMS evaluates strategies for addressing congestion, with priority given to demand management, then roadway operations, and finally capacity additions. The system impacts from projected economic, population, and employment growth are also used to prioritize mitigation strategies. Recommendations are then evaluated and prioritized in the region’s long-range transportation plan.
Sources: http://www.wilmapco.org/cms/2005%20CMS%20FINAL.pdf and USDOT, FHWA http://ops.fhwa.dot.gov/publications/lpo_ref_guide/prim0407.htm.
Mobil 2010, Stadtentwicklungsplan Verkehr Berlin
The review process of the Berlin City Traffic Development Plan which started in 2000, has been accompanied by a Round Table with 20 representatives from the Berlin Parliament and the district councils, a scientific committee as well as representatives of key interest groups. Atypically, the analysis, definition of objectives and development of policy concepts were not developed from the “top-down”. Rather, all steps were first discussed within the Round Table which served as a community consultation group. The role of the scientific committee was to ensure the rigour of the analytical methods used during the process. This continuous involvement of the Round Table and the scientific committee resulted in broadening of the scope of perception of the problem that made it possible to address a wide range of views.
CONGESTION RESPONSE STRATEGIES: GETTING THE DECISION PROCESS ON TRACK – 263
MANAGING URBAN TRAFFIC CONGESTION – ISBN 978-92-821-0128-5 - © ECMT, 2007
11.4 Achieving shared views about objectives and problems
When congestion management policies do not clearly articulate what assumptions and goals they embody they may prove difficult to successfully implement. It is often easier to define “what you do not want” than to be clear about your objectives and in matters of congestion this is no different.
In the case of congestion, the focus of many actors is understandably on the negative impacts of crowded roads. Businesses point out that congestion costs them money, individuals feel that congestion robs them of time that could be spent more usefully – or at least more enjoyably – and city officials feel that congestion hampers their city’s economic vitality and growth prospects. All of these are valid concerns and thus the problem formulation relating to congestion is typically “get rid of it”. As pointed out in Chapters 1 and 5, this may be an overly simplistic and optimistic goal. A better approach might be to focus not on the negative (“get rid of congestion”) but on the positive (“make the city as attractive, dynamic and liveable as it possibly can be within our means”).
This is why in many best practices with a broader scope that involve a broader group of actors, the “problem-oriented” approach has proven to be valuable in achieving shared views, even if different actors have a different perception of what the “real problem is”.
In this approach the elaboration of objectives and targets is part of the problem analysis. Amongst various actors, the shared exploration of problems can contribute to converging problem perceptions and also to shared objectives – or at a minimum, to better identified points of contention.
One option to achieve a broader range of options and an enriched result is the introduction of competition between task forces. This is not uncommon in projects that are aimed to “design”. But there are few examples when it comes to congestion response strategies.
Reconciling Divergent Transport Policy Visions – the “Luteijn Committee”
One successful example of bringing together actors around common transport policy goals comes from the region of Haaglanden (the metropolitan area around The Hague) in the Netherlands. In 2002, an alliance of public and private actors were brought together in the so-called “Luteijn Committee” (nicknamed after its chairman) to develop a strategy to foster urban accessibility for a wide range of individual and economic actors. The Committee undertook two parallel competing problem analyses; one under the supervision of public, the other under the supervision of private actors. This resulted in a shared perception of the problems faced by the region and the need for action as well as a shared set of goals and measures that has been implemented by the so-called SWINGH task force since 2003.
The higher level objectives defined in the process outlined above indicate the directions in which particular congestion-response strategies should be developed. However they are abstract concepts and it is thus difficult to measure performance against them. More quantified objectives should be specified in terms of a series of indicators. For example, 95th percentile travel times would measure system reliability. This type of indicator is often called an outcome indicator, in that it measures part of the outcome of a strategy.
It is also possible to define input indicators, which measure what has been done (e.g. length of bus lanes implemented) and process indicators, which describe how the transport system is responding (e.g. number of bus users). While these may be useful in understanding what has happened, they are less useful in assessing performance, since they say nothing about impact on the key objectives. To be

264 – CONGESTION RESPONSE STRATEGIES: GETTING THE DECISION PROCESS ON TRACK
MANAGING URBAN TRAFFIC CONGESTION – ISBN 978-92-821-0128-5 - © ECMT, 2007
effective, outcome indicators must be exhaustive, in that they cover the whole range of objectives, provide sufficient information to decision-makers, and be sensitive to changes in the strategies that are tested.
Whether a “true objective-led” or a “problem-oriented” approach is pursued, in both cases, the leading questions for the further elaboration of objectives and targets of the strategy should be:
• What do you want the system to accommodate?
• Where? And when (time of day/week/month/year)?
• For which specific target groups?
• And defined in which terms/indicators, such as:
− Reliability?
− Average travel time not to deteriorate?
− “Through-put” capacity measured in number of vehicles?
− Number of passenger trips to be accommodated?
Discussing indicators early on will also help to sharpen the definition of objectives and thus serve the process to achieve agreement about these.
11. 5 About scope
The definition of the scope of a congestion response strategy should account for:
• The study area: parts of the network(s) to be considered, jurisdictions to be involved and the geographical scale.
• The range of optional policies and measures to be taken into consideration.
• Whether the focus is merely to be on “travel” or also on freight.
• The time horizon and whether the strategy is mainly to yield short term results or also to provide a more structural perspective for the network in the longer term.
• Whether the focus is on “improving access to locations” (i.e. specific sites or areas) or on “improving the Level of Service on specific parts of the network”.
11.5.1 Study area
In metropolitan areas, congestion rarely is a “single link” problem. Considering it like this may seem the logical thing to do if it seems primarily to be a local problem of maintaining level of service on a particular link. However in metropolitan areas where networks are interlinked, the interdependence between networks is substantial. Even if the problem seems to focus at one location (e.g. a bridge that is too narrow), the impacts affect other parts of the network and very often other, interlinked networks. And the actual problem causes may be found elsewhere too. It is important to choose the scope of the strategy appropriate to the problem causes that are to be addressed, as well as to all parts of the networks that may be affected by the possible solutions.
Even if this is taken for granted, jurisdictional borders may act as a psychological or even institutional barrier, too often network operators tend to seek solutions for congestion problems only within the boundaries of their jurisdiction. Broadening the scope to other networks also means involving other network operators and their stake holders (e.g. local officials and politicians).

CONGESTION RESPONSE STRATEGIES: GETTING THE DECISION PROCESS ON TRACK – 265
MANAGING URBAN TRAFFIC CONGESTION – ISBN 978-92-821-0128-5 - © ECMT, 2007
“Bringing in the user’s perspective” has proven to provide a strong argument for borders crossing. Users of transport systems are travelling from-door-to-door; they will judge the performance of the transport system – and the people who are responsible for it - by the way the system will accommodate their desired travel behaviour. Cross-jurisdictional boundaries are irrelevant to their judgement of transport system performance.
Applying the “from-door-to-door” philosophy implies a change of paradigm because it requires an integrated, customer-oriented and also service-oriented approach for accommodating travel, be it by car, by public transport or other modes or by a combination of these. It makes collaboration and co-ordination between operators and other actors necessary but also rewarding, because hindrances for the traveller may be more easily addressed by better collaboration between agencies than by isolated investments. Such “win-win-solutions” may be achieved, which in itself will be a stimulus for engaging in closer collaboration.
The problem analysis that was part of the “Luteijn process” in the Haaglanden region, described earlier, revealed several such easy-to-solve problems with win-win-effects, such as better co-ordination of traffic management between network operators on specific corridors but also harmonisation of road de-icing strategies between agencies. These were the problems that were first to be tackled in the package of measures that was developed.
11.5.2 Broadening the scope of “traditional” congestion management responses
Demand management approaches or other measures that seek to manage access to roads or parking have not “traditionally” been part of the package of measures deployed to treat congestion and yet their necessity is now understood by many roadway operators and local authorities. It is important to clarify early in the decision process why demand management measures are part of the response package in order to prevent controversies emerging in later stages. Such controversies might in particular arise when considering options like pricing of parking space or road use, or limiting access to certain areas or streets.
Identification of the target groups that will be affected by the demand management measures and assessing the contribution of these target groups to the perceived congestion problem, should be part of the problem definition phase.
Including demand management within congestion response strategies will also often entail the involvement of more actors in the decision process. For instance, regulating and/or pricing of public parking space may be powerful congestion response measures, because it will influence travel demand and therefore the number of cars on the road. But such policies may not be very effective if they do not take into account the privately owned and commercially operated parking facilities in the area.
With regard to demand management, freight transport and urban goods distribution deserves special attention. Where managing demand in passenger travel mostly means influencing individual travel behaviour, in freight it means influencing logistics and production processes. Including freight in a congestion response strategy therefore also means involving a new set of actors and commercial interests.
11.5.3 Time horizon: short vs. long term?
Is the strategy mainly to yield short term results or should it also provide a more structural perspective for the network in the longer term? The answer to this question is important since it will determine the range of options to be considered. Options that need longer periods to realise
266 – CONGESTION RESPONSE STRATEGIES: GETTING THE DECISION PROCESS ON TRACK
MANAGING URBAN TRAFFIC CONGESTION – ISBN 978-92-821-0128-5 - © ECMT, 2007
(e.g. review of spatial planning processes or regulations) may be left out of the scope if the priority lies in short term results. Whether or not this is the case, depends partly on how the strategy is to be embedded in the planning framework.
On every level within this framework it is possible to identify short term results. Achieving such short term results – especially if they have obvious positive effects for users and/or the general public - will be beneficial for getting support for the later stages because it will show stakeholders and the general public that the first efforts have generated beneficial changes.
Bias Inherent in Transport Appraisal: Examples from a Review of Small vs. Large Projects in the UK
One review of small versus large project appraisal in the UK found that there are some in-built biases in current appraisal techniques which discriminate against some of the best measures. This review highlighted that many smaller projects, whose cost-effectiveness and cumulative impact would have been better than their larger counterparts, are passed over because of these inherent biases. Many specific forms of bias were described in the review of which only two are covered here.
Proportionality of Appraisal Effort At the heart of transport appraisal is a set of calculations putting a cash value on the savings in
travel time, accidents, and operating costs forecast to arise as a result of a scheme, and comparing these with the cost of introducing the scheme. The cost of undertaking such a comprehensive appraisal is not proportional to the size of an initiative and thus full assessment is not done for many smaller schemes. Instead, a more tenuous outline assessment is carried out, with two major difficulties:
• The work looks less impressive.
• The short cuts used may actually bias against exactly such a scheme.
The remedy is to ensure that a method of appraisal is used whose cost in money and resources is a suitably small proportion of the cost of implementing the scheme but which is not in itself biased against the scheme.
The problem of ‘Speed’ Dominance In the formal part of most cost-benefit analyses, especially of road schemes, a large – sometimes
overwhelmingly large – part of the assessed benefit is the economic value of the time the scheme is expected to save road users. However, many of these time savings for large schemes have been exaggerated either due to omission or to underestimation of extra traffic induced by the scheme, which reduces the benefits expected. Faced with a big project which promises large speed benefits – even if implausibly – and a small scheme which does not make such promises, there will be a tendency to go with the former.
• Even in the biggest projects, the promised millions of hours of time saved typically may offer not ‘millions of hours’ saved, but ‘billions of seconds’ (see Chapter 5 for a discussion of small vs. large increments of time savings). In principle, conventional appraisal methods ought to favour those small local schemes which save an appreciably large amount of time for a smaller number of people but paradoxically the opposite often seems to happen: a bus lane will be described as saving a few hundred people a minute or two each, and it sounds small, whereas a road scheme will not be described as saving a few thousand people a second or two each, and the comparison is not made.

CONGESTION RESPONSE STRATEGIES: GETTING THE DECISION PROCESS ON TRACK – 267
MANAGING URBAN TRAFFIC CONGESTION – ISBN 978-92-821-0128-5 - © ECMT, 2007
• Promised or forecast time savings are converted to a cash value by application of a ‘value of time’ which is expected to grow in proportion to income in the future. This tends to offset the principle that promises distant in the future, should be discounted (by application of a discount rate). This tends to reduce the relative advantage that small schemes would otherwise often offer; of being able to produce benefits more swiftly.
• Possibly a much more important issue is that many small schemes do not actually try to make time savings. That is not their objective. They may actually do the opposite – not as an accidental unintended side effect, but because they are meant to improve safety, or the perception of safety, or the quality of life in a residential area where traffic is made less intrusive, and this may involve deliberately lowering vehicle speeds. The problem here is that the travel time losses are then included in an appraisal as a measured, well-understood, ‘scientific’ calculation which enters into the benefit-cost result, whereas the real objectives of the exercise may get lost in the qualitative, unmeasured, ‘unscientific’ parts of the appraisal. Reliability, for example, is hardly ever accorded a money benefit, even though many people think that it should have a higher benefit than speed per se.
The remedies for this form of bias may lay with the following:
• Whenever total time savings are reported, for whatever type of scheme, it should always be accompanied by a table or chart showing how many people’s door to door journey time is being changed (plus or minus) by less than 1 second, 1-5 seconds, 5-10 seconds, etc.
• Assessments of time savings for road users in general should always include allowance for changes to pedestrians and cyclists: calculations from a model excluding them are likely to be biased.
• Where the actual objective of a scheme is to slow traffic down this should not be expressed as a time ‘loss’ to be offset against the benefits, but as a benefit.
• It may be added that this is not only an issue for small schemes. Appraisal of big schemes also should take a more nuanced approach to speed and travel time savings.
Source: Adapted from: Goodwin, P., “Valuing the Small: Counting the Benefits”.
11.6 How will institutional (framework) conditions influence strategies and solutions?
It is important to be aware of the degree to which the outcome of the congestion response strategy will depend on prevailing institutional conditions. The distribution of responsibilities and discretionary powers concerning network management is an important factor that may condition the success of congestion management strategies. Network management roles may be fulfilled by different agencies across the urban region. In most metropolitan areas, co-ordination mechanisms between these agencies have already been put into place. Scrutinising the degree of co-ordination will often reveal substantial gaps that must be addressed in the context of regional congestion management. For example, many measures aimed at improving road performance depend on road users abiding by rules (speed limits, parking regulation). Therefore their success also depends on enforcement, i.e. on the co-operation of services and agencies like the police and the justice department. However, these agencies will not necessarily have congestion mitigation as one of their primary roles. This cooperation should be addressed at a higher level of urban governance.

268 – CONGESTION RESPONSE STRATEGIES: GETTING THE DECISION PROCESS ON TRACK
MANAGING URBAN TRAFFIC CONGESTION – ISBN 978-92-821-0128-5 - © ECMT, 2007
11.6.1 Addressing Institutional Bias
Many congestion response strategies are influenced by built-in biases that have a non-negligible incidence on their outcomes.
Funding conditions for instance may cause a “bias” towards certain solutions, in particular if the budget for investment in infrastructure are not the same as budget for measures to optimise use, traffic management, maintenance and/or operations. It may be easier to secure funding for the former option although the latter might deliver a more favourable outcome.
A similar bias may be caused by the specific method of cost-benefit-analysis that is implemented during the decision process. The elements that are to be taken into account and the weight that is attributed to each of those elements but also on the degree to which factors and impacts that are more difficult to quantify are taken into account (See box).
11.6.2 Addressing the Fiscal Context
The degree to which local and regional authorities have the power to impose taxes or charges will depend on the national fiscal structure, which differs from country to country. Congestion charging may seem the most obvious example of this, but it is not necessarily the most appropriate option. Workplace-related taxes (“workplace levy”, versement de transport), a more sophisticated system for parking charges or land value taxes may also be useful instruments.
In France the “Versement Transport”, a business tax imposed in large cities depending on the number of employees, has proven to be an important success factor for financing innovative urban transport systems that have emerged in French cities in recent years.
In the Netherlands, the parking charges for on-street parking were not considered a very powerful instrument for medium-size cities until the fines for over-time parking were integrated into the charging system as a municipal tax and thereby as a valuable source of finance for stricter enforcement.
11.6.3 Enforcement
As the success of many congestion measures depends on road users abiding by rules, their success also depends on enforcement, i.e. on the co-operation of services and agencies like the police and the justice department. Enforcement possibilities will be influenced by national cultural factors and people’s attitudes towards “abiding the law”.
11.6.4 Private Sector Involvement
It is important to make private actors “part of the solution”. Institutional conditions that are favourable for establishing public private partnerships (PPP) will help to achieve this. They also make it possible to generate extra funds for optimal solutions. In many cases, local and regional authorities already have built up experience with PPP, in particular for land development purposes. However experience with typical transport-related PPP may be limited to the development of parking garages or inter-urban toll-roads. Only a few countries, including Japan and the UK, have developed a tradition of PPP for urban transport systems with a supportive institutional framework for this purpose.
CONGESTION RESPONSE STRATEGIES: GETTING THE DECISION PROCESS ON TRACK – 269
MANAGING URBAN TRAFFIC CONGESTION – ISBN 978-92-821-0128-5 - © ECMT, 2007
11.7 Priorities
Part of the congestion management process is determining different actors’ priorities for action, relevant time horizons and preference for sets of measures. Priorities will vary between actors and according to the measure or set of measures under consideration.
Typically individual actors will focus on what set of measures will provide the greatest benefits and alleviate the greatest “misery” for their respective constituents. Focusing on reliability benefits has the potential to accomplish this across a wide spectrum of road user groups.
Of primary importance is the affordability of the measures selected – what is the least costly yet most effective package of measures to deploy in order to better manage congestion? As discussed in Chapter 5, actors must be clear, and ideally share a common understanding, of what is meant by “cost” and what is understood as “benefit”. As an example, increased travel speeds may be seen as a benefit to some (roadway users) and as a dis-benefit to others (e.g. road-side residents or metropolitan planning authorities concerned about urban spread).
Many local authorities have come to the conclusion that it may be best to focus on maximising the use of the existing network since this is more cost-effective than constructing new capacity and since there will be pressure to do this in any case on any new infrastructure. However, being clear about what it is exactly that is being “maximised” is central to the successful implementation of congestion response strategies. In some case, e.g. the maximising of technically feasible throughput, “maximisation” may be antithetical to congestion management goals.
Chapter Summary
• Tackling congestion requires an integrated multi-level approach and therefore a multi-level framework of planning and decision-making.
• Assembling a robust package of measures requires a strong match between the institutional framework – including agency powers and responsibilities – and the scale of the current and prospective congestion problem. Congestion does not respect administrative boundaries. The problem crosses geographic boundaries and cuts across institutions. It spills over from high capacity roads to local networks. “Squeezing” congestion out of one part of the transport system may simply transfer the problem to another part of the network. Whatever the wider transport policy goals, it rarely makes sense to consider congestion management in isolation because of the interdependencies between it and other parts of transport policy.
• Adopting institutional responsibilities and partnerships to match the scale and scope of the congestion problem to be addressed is an important first step. Where existing forums exist for the purposes of tackling urban sustainability issues, these may already provide strong foundations for driving forward strategy development.
• A key aspect of getting the right decision-making process in place is to assess the jurisdictional scope of the decision-making body in relation to the geographic scope of the problem.
• It is helpful to consider both the “source” areas for congestion, as well as the location where congestion problems are most visible. For example, if over 25% of traffic comes from the wider region beyond the city limits – this may argue for political engagement at the regional level.
270 – CONGESTION RESPONSE STRATEGIES: GETTING THE DECISION PROCESS ON TRACK
MANAGING URBAN TRAFFIC CONGESTION – ISBN 978-92-821-0128-5 - © ECMT, 2007
• The scale and nature of revenue streams for congestion management measures can unduly bias outcomes. As an example, easy availability of capital funds as opposed to operational funds can bias strategies towards new construction rather than operational management. At the early stages of formulating a congestion response strategy, it is important not to dismiss individual measures that fall outside obvious funding sources.
• Wide participation in consultation can help ensure that the full range of views and objectives is considered. It can provide a better understanding of transport problems, help generate innovative solutions and be a key factor in gaining public support and acceptability for the final mix of measures. Participation can save time and money later in the process, particularly at the implementation stage, as potential objections will likely have been minimised by taking stakeholders’s concerns into account early on.
• Ambitions are always likely to exceed available resources. It is therefore essential that authorities seek to prioritise their expenditures. Effective and lasting congestion management strategies must clearly articulate the criteria used for this prioritisation process, and, as much as possible, ensure a shared acceptance of these criteria.
• Appraisal methods used for congestion management projects should cost in money and resources a suitably small proportion of the cost of implementing the scheme without itself creating a bias against the scheme.
• Faced with a big project which promises large speed benefits and a small scheme which does not make such promises, there will be a tendency to go with the former. In principle, conventional appraisal methods ought to not be biased against those small local schemes which save an appreciably large amount of time for a smaller number of people
• Some traffic management schemes may not try to deliver travel time savings but may actually do the opposite because they are meant to improve safety or the quality of life in a residential area. They might also seek to improve travel time reliability without impacting overall travel times. The decision-making process should not be inherently biased against these types of measures.
NOTES 1. This chapter builds on work that has been done in the European PROSPECTS (www.ivv.tuwien.ac.at/?id=2550)
project, in particular on the findings that have been disseminated in the Decision Maker’s Guidebook (May, A. et al (2005) and through the KonSULT (www.elseviersocialsciences.com/transport/konsult) knowledgebase on Sustainable Urban Land use and Transport. PROSPECTS was conducted under the European Commission’s Cities of Tomorrow and Cultural Heritage programme. In particular the Guidebook provides advice on elements that are important to take into account when thinking about decision process design. Although aimed at the “higher” planning level of urban land use and transport strategies, it is equally useful for any person who is involved at the more operational level.
2. VCEC (2006).
3. May, A. et al (2005).
4. See also ECMT (2002).

BIBLIOGRAPHY – 271
MANAGING URBAN TRAFFIC CONGESTION – ISBN 978-92-821-0128-5 - © ECMT, 2007
BIBLIOGRAPHY
ACEA (2004), Basic Survey on Congestion in Europe, European Automobile Manufacturers
Association, Brussels.
Ahrens, A. (2000), “Market Segmentation as a Result from TU Dresden’s Continuous Travel Data Collection (SrV) and Related EVA Travel Demand Modelling”, working paper for the THINK-UP workshop: Segmentation of Passenger Markets – Users,(14 December, 2000, Dresden, Germany).
AHUA (2004), Unclogging America’s Arteries: Effective Relief for Highway Bottlenecks 1999-2004”, America Highway Users Alliance, Washington, D.C.
AirPARIF (2001), Etude et évaluation des emissions de polluants atmosphériques liées au traffic routier en Ile-de-France, Study undertaken by AirPARIF the Ile de France Region DRIRE, Paris, France.
Albert, G. and Mahalel, D. (2006), “Congestion Tolls and Parking Fees: A Comparison of the Potential Effect on Travel Behavior”, Transport Policy, Vol. 13, Issue 6, pp. 496-502.
Armelius, H. and Hultkrantz, L. (2006), “The Politico-Economic Link between Public Transport and Road Pricing: An Ex-Ante Study of the Stockholm Road-Pricing Trial”, Transport Policy, Vol. 13, Issue 2, pp. 162-172.
Arnott, R. (2001), “The Economic Theory of Traffic Congestion: A Microscopic Research Agenda”, presented to the Workshop on Environmental Economics of the CESifo Venice Summer Institute (Venice, July 18-19, 2001).
Arnott, R. and Inci, E. (2005), “An Integrated Model of Downtown Parking and Traffic Congestion”, NBER Working Paper Series, National Bureau of Economic Research, Working Paper 11118, Cambridge, MA.
Arnott,R.(1994), “Alleviating Traffic Congestion: Alternatives to Road Pricing”, Working Paper No.282, Department of Economics, Boston College, Boston.
ATC (2004), National Guidelines for Transport System Management in Australia, Australian Transport Council, Canberra, Australia.
Atkins, S. and Cairns, S. (2002), Reallocating Roadspace: An Update of Case Study Evidence and Related Research, ESRC TSU Working Paper, Transport Studies, University College London, London, United Kingdom.

272 – BIBLIOGRAPHY
MANAGING URBAN TRAFFIC CONGESTION – ISBN 978-92-821-0128-5 - © ECMT, 2007
Banks, J. (2006), “Effect of Time Gaps and Lane Flow Distributions on Freeway Bottleneck Capacity”, Paper Submitted to the 85th Annual Meeting of the Transportation Research Board, TRB 2006 Annual Meeting CD-ROM, Washington, D.C.
Bassan, S. et al (2006), “Time Dependent Analysis of Density Thresholds on Congested Freeways”, Paper Submitted to the 85th Annual Meeting of the Transportation Research Board, TRB 2006 Annual Meeting CD-ROM, Washington, D.C.
Bates, J. and Whelan, G. (2001), Size and Sign of Travel Time Savings, Working Paper 561, Institute for Transport Studies, University of Leeds, Leeds, United Kingdom.
Bates, J. et al (2001), “The Valuation of Reliability for Personal Travel”, Transportation Research Methodological, Vol. 37e, No. 2-3, pp 191-230.
Bauhardt, C. (2005),“Verkehrsplanung in Paris – Technische, organisatorische und politische Neuordnung des öffentlichen Stadtraums”, Internationales Verkehrswesen Vol. 57, No. 6, pp. 259-262.
Beckmann, K. and Wehmeier, T. (2004), Evaluation verkehrspolitischer Maßnahmen und Konzepte, Schlussbericht zum BMVBW-Forschungsprojekt Nr. 70.0693/2002/.
Bertini, R. (2005a), “You are the Traffic Jam: An Examination of Congestion Measures”, Submitted to the 85th Annual Meeting of the Transportation Research Board, TRB 2006 Annual Meeting CD-ROM, Washington, D.C.
Bertini, R. (2005b), “Congestion and Its Extent”, in D. Levinson and K. Krizek (eds.), ‘Access to Destinations: Rethinking the Transportation Future of our Region’, Elsevier, Amsterdam, The Netherlands.
Bertini, R. and Cassidy, M. (2002), “Some Observed Queue Discharge Features at a Freeway Bottleneck Downstream of a Merge”, Transportation Research Policy and Practice, Vol. 36a, Issue 8, pp. 683-697.
Bertini, R., Hansen, S. and Bogenberger, K. (2005), “Empirical Analysis of Traffic Sensor Data Surrounding a Bottleneck on a German Autobahn.” Transportation Research Record: Journal of the Transportation Research Board, No. 1934, Transportation Research Board, Washington, D.C., pp. 97-107.
Bertini, R.L., Boice, S. and Bogenberger, K.(2006), “Dynamics of Variable Speed Limit System Surrounding a Bottleneck on a German Autobahn.” Transportation Research Record: Journal of the Transportation Research Board, No. 1978, Transportation Research Board, Washington, D.C., pp. 149-159.
Blythe, P. (2005), “Congestion Charging: Technical Options for the Delivery of Future UK Policy”, Transportation Research Policy and Practice, Vol. 39a, Issues 7-9, pp. 571-587.
Boarnet, M. and Chalermpong, T. (2002), New Highways, Induced Travel and Urban Growth Patterns: A “Before-and-After” Test, Working Paper UCI-ITS-WP-02-8, Institute of Transportation Studies, University of California-Irvine, Irvine, California.
BIBLIOGRAPHY – 273
MANAGING URBAN TRAFFIC CONGESTION – ISBN 978-92-821-0128-5 - © ECMT, 2007
Boately, P.; Evans, G. and Werner, R. (2005), “Commuting Stress: Psychophysiological Effects of a Trip and Spillover into the Workplace”, Transportation Research Record, Journal of the Transportation Research Board N. 1924, TRB, Washington, pp. 112-117.
Bonsall P., and Kelly, C., (2005), “Road User Charging and Social Exclusion: The Impact of Congestion Charges on at-risk Groups”, Transport Policy, Vol. 12, N. 5, Oxford, pp. 406-418.
Bonsall, P. et al (2005), “The Differing Perspectives of Road Users and Service Providers”, Transport Policy, Vol. 12, Issue 4, pp. 334-344.
Bovy, P. (2001), “Traffic Flooding the Low Countries: How the Dutch Cope with Motorway Congestion”, Transport Reviews, Vol.21, No. 1, pp. 89-116.
Bovy, P. and Hoogendoorn, S. (2000), “Ill-Predictability of Road Traffic Congestion”, in Bell, M. and Cassir, C. (eds.), Reliability of Transport Networks, Research Studies Press, Baldock, United Kingdom, pp. 43-53.
Bremmer, D et al (2004), “Measuring Congestion: Learning from Operational Data”, Transportation Research Record, Transportation Research Board, N. 1895, pp.188-196.
Brilon, W. (2000), “Traffic Flow Analysis Beyond Traditional Methods”, Proceedings of the Fourth International Symposium on Highway Capacity (June 27–July 1, 2000, Maui, Hawaii), Transportation Research Board, Washington D.C., pp. 26-41.
Brilon, W., Geistefeldt, J., Regler, M.(2005), “Reliability of Freeway Traffic Flow: A Stochastic Concept of Capacity”, Proceedings of the 16th International Symposium on Transportation and Traffic Theory (College Park, Maryland, July 2005), pp. 125 – 144.
Browne, M. et al (2001), Home Deliveries in the United Kingdom, report for the Freight Transport Association, Transport Studies Group, University of Westminster, London, United Kingdom.
Brownstone, D. and Small, K. (2005), “Valuing Time and Reliability: Assessing The Evidence from Road Pricing Demonstrations”, Transportation Research Policy and Practice, Vol. 39a, Issue 4, pp. 279-293.
Brownstone, D. et al, (2003), “Drivers' Willingness-to-Pay to Reduce Travel Time: Evidence From the San Diego I-15 Congestion Pricing Project”, Transportation Research Policy and Practice, Vol. 37a, Issue 4, pp. 373-387.
Bunn, M. and Savage, G. (2003), Integrated Traffic Management and Emergency Response: Success Factors, University Transportation Center for Alabama (UTCA), UTCA Report no. 01101, Huntsville (AL).
Busch, F. et al. (2004), “ITS applications in Road Traffic – State of the Art and Prospects”, Straßenverkehrstechnik, 06/2004.
Button, K. (2004), “The Rationale for Road pricing: Standard Theory and Latest Advances”, in Santos, G. (ed.), Research in Transportation Economics Volume 9: Road Pricing Theory and Evidence, Elsevier, Amsterdam, pp. 3-25.
274 – BIBLIOGRAPHY
MANAGING URBAN TRAFFIC CONGESTION – ISBN 978-92-821-0128-5 - © ECMT, 2007
Button, K. (2004), Road Pricing: Final Report, Intelligent Transportation Center, School of Public Policy, George Mason University, Fairfax (VA).
Cairns, S. and Goodwin, P. (2002), Traffic Impact of Highway Capacity Reductions: What Transport Professionals Think, ESRC TSU Working Paper, Transport Studies, University College London, London, United Kingdom.
Cairns, S., et al (1998), Traffic Impact of Highway Capacity Reductions; Assessment of the Evidence, Landor Publishing, London, United Kingdom.
Calamante, M. and Di Serio, S. (2005), “Rome Access Control: 5 Years’ Experience”, presentation to the Information Management Policy Assessments for City Transport Systems (IMPACTS) Conference (17-18 March, 2005, Amsterdam).
CALTRANS (1999), California Life-Cycle Benefit/Cost Analysis Model, Booz Allen and Hamilton, Inc.
Cao, X. and Mokhtarian, P. (2005), “How do Individuals adapt their Personal Travel? A Conceptual Exploration of the Consideration of Travel-Related Strategies”, Transport Policy, Vol. 12, Issue 4, pp. 199-206.
Carlson, K. et al (2006), “Waiting Tolerance: Ramp Delay vs. Freeway Congestion”, Transportation Research Traffic Psychology and Behaviour, Vol. 9f, Issue 1 , pp. 1-13.
Cassidy, M., Anani, S. and Haigwood, J. (2002), “Study of Freeway Traffic Near an Off-Ramp”, Transportation Research Policy and Practice, Vol. 36a, Issue 6, pp. 563-572.
CCIT (2006), Corridor Management Plan Demonstration: Final Report, CCIT Task Order 3, California Center for Innovative Transportation, University of California at Berkeley, Berkely, California.
CFIT (2005), World Cities Research: Final Report on World Cities, UK Commission for Integrated Transport, http://www.cfit.gov.uk/docs/2005/worldcities/
CFIT (2006), World Review of Road Pricing, Phase 1: Lessons for the UK, UK Commission for Integrated Transport, http://www.cfit.gov.uk/docs/2006/wrrp/wrrp1/
Chao, C., Kwon, J. and Varaiya, P. (2005), “An Empirical Assessment of Traffic Operations”, in Mahmassani, H. (ed), ‘Transportation and Traffic Theory: Flow, Dynamics and Human Interaction (Proceedings of the 16th International Symposium on Transportation and Traffic Theory)’, Elsevier, Amsterdam.
Chen, A., Ji, Z. and Recker, W. (2001), Travel Time Reliability with Risk-Sensitive Travelers, Working Paper UCI-ITS-WP-01-09, Institute of Transportation Studies, University of California-Irvine, Irvine, California.
Chen, C. Jia, Z. and Varaiya, P. (2001), “Causes and Cures of Traffic Congestion”, Control Systems Magazine - IEEE, Vol. 21, No. 6, pp. 26-32.
BIBLIOGRAPHY – 275
MANAGING URBAN TRAFFIC CONGESTION – ISBN 978-92-821-0128-5 - © ECMT, 2007
Chen, C., Skabardonis, A. and Varaiya, P. (2003), “Travel Time Reliability as a Measure of Service”, Transportation Research Record: Journal of the Transportation Research Board, No. 1855, pp. 74-79.
Cherrett T., McDonald M. (2002), "Traffic Composition During the Morning Peak Period: Implications for Urban Traffic Management Systems", European Journal of Transportation and Infrastructure Research, Vol. 2, No. 1, pp. 41-55.
Chin, S.M. et al (2004), Temporary Losses of Highway Capacity and Impacts on Performance: Phase 2, Oak Ridge National Laboratory, ORNL/TM-2002/3, Oakridge (TN).
Choocharukul, K., Sinha, K. and Mannering, F. (2004), “User Perceptions and Engineering Definitions of Highway Level of Service: An Exploratory Statistical Comparison”, Transportation Research Policy and Practice, Vol. 38a, Issues 9-10, pp. 677-689.
Chung, K., Rudjanakanoknad, J. and Cassidy, M. (2007), “Relation between Traffic Density and Capacity Drop at Three Freeway Bottlenecks”, Transportation Research Methodological, Vol. 41b, Issue 1, pp. 82-95.
Cirillo, C. and Axhausen, K.W. (2006), “Evidence on the Distribution of Values of Travel Time Savings from a Six-Week Diary”, Transportation Research Policy and Practice, Vol. 40a, Issue 5, pp. 444-457.
Coifman, B. (2003), “Identifying the Onset of Congestion Rapidly with Existing Traffic Detectors”, Transportation Research Policy and Practice, Vol. 37a, Issue 3, pp. 277-291.
Coifman, B. et al (2006), “A Pilot Study into the Impacts of Lane Change Manoeuvres on Congested Freeway Segment Delays”, Paper Submitted to the 85th Annual Meeting of the Transportation Research Board, TRB 2006 Annual Meeting CD-ROM, Washington, D.C.
COMPETE (2007), COMPETE Final Report: Analysis of the Contribution of Transport Policies to the Competitiveness of the EU Economy and Comparison with the United States, ISI Fraunhofer Institute Systems and Innovation Research, Karlsruhe.
CPRE (2006), Beyond Transport Infrastructure: Lessons for the Future from Recent Road Projects: Full Report, Campaign to Protect Rural England (CPRE) and the Countryside Agency, London.
DAEI-SESP (2005), Les Comptes des Transports en 2004 Tome 2: Les Dossiers d’Analyse Economique des Poliotioques Publiques des Transports, Direction des Affaires Economiques et Internationales, Bureau d'Analyse Economique de Synthèse et de Prévision, Ministère des Transports, de l’Equipement, du Tourisme et de la Mer, Paris.
DAEI-SESP (2006), “Le Systeme Sytadin fait Gagner du Temps aux Franciliens”, Notes de Syntheses du SESP, No. 161, Direction des Affaires Economiques et Internationales, Bureau d'Analyse Economique de Synthèse et de Prévision, Ministère des Transports, de l’Equipement, du Tourisme et de la Mer, Paris.
Daganzo, C.F., Cassidy, M.J. and Bertini, R.L. (1999), “Possible Explanations of Phase Transitions in Highway Traffic.” Transportation Research Policy and Practice, Vol. 33a, No. 5, Elsevier, pp. 365–379.
276 – BIBLIOGRAPHY
MANAGING URBAN TRAFFIC CONGESTION – ISBN 978-92-821-0128-5 - © ECMT, 2007
De Borger, B. and van Dender, K. (2002), Transport Tax Reform, Commuting and Endogenous Values of Time, Working Paper UCI-ITS-WP-02-2, Institute of Transportation Studies, University of California-Irvine, Irvine, California.
De Jong, G et al (2006), “Impact of the E-Economy on Traffic and Traffic-Related Indicators in Urban Areas”, Paper Submitted to the 85th Annual Meeting of the Transportation Research Board, TRB 2006 Annual Meeting CD-ROM, Washington, D.C.
De Jong, G. and Gunn, H. (2001), “Recent Evidence of Car Cost and Time Elasticities of Travel Demand in Europe”, Journal of Transport Economics, Vol. 35, Part 2, pp. 137-160.
De Palma, A. and Fontan, C. (2000), Enquête MADDIF: Multimotif Adaptée à la Dynamique des Comportements en Ile de France. DRAST research report, Paris, France.
De Palma, A. and Lindsey, R. (2006), “Modelling and Evaluation of Road Pricing in Paris”, Transport Policy, Vol. 13, Issue 2, Modelling of Urban Road Pricing and its Implementation, pp. 115-126.
De Palma, A., Lindsey, R. and Niskanen, E. (2006), “Policy insights from the urban road pricing case studies”, Transport Policy, Vol. 13, Issue 2, pp. 149-161.
Denant-Boèmont, L. et al (2002, Les Modèles Structurels de Congestion: Une Etude Experimentale, French Ministry for Infrastructure, Transport and Housing, Paris, France.
DFT (2001), Perceptions of and Attitudes to Congestion, United Kingdom Department for Transport, www.dft.gov.uk/pgr/statistics/datatablespublications/att/perceptionsofandattitudestoc5124
DFT (2003), Value of Travel Time Savings in the UK: Summary Report, United Kingdom Department for Transport, http://www.dft.gov.uk/pgr/economics/rdg/valueoftraveltimesavingsinth3130
DFT (2004a), Attitudes to Roads, Congestion and Congestion Charging, United Kingdom Department for Transport, www.dft.gov.uk/pgr/statistics/datatablespublications/att/attitudestoroadscongestionan5120
DFT (2004b), Attitudes to Road Pricing, United Kingdom Department for Transport, www.dft.gov.uk/pgr/statistics/datatablespublications/att/attitudestoroadpricing
DFT (2004c), Feasibility Study of Road pricing in the UK - Full Report, United Kingdom Department for Transport, www.dft.gov.uk/pgr/roads/roadpricing/feasibilitystudy/studyreport/feasibilitystudyofroadpricin4002
DFT (2004d), Transport and City Competitiveness - Literature Review, United Kingdom Department for Transport, www.dft.gov.uk/pgr/scienceresearch/social/transportandcitycompetitiven1934
DFT (2005a), Attitudes to Congestion on Motorways and other Roads, United Kingdom Department for Transport, www.dft.gov.uk/pgr/statistics/datatablespublications/att/attitudestocongestion
DFT (2005b), Perceptions of Congestion: Report on Qualitative Research Findings, United Kingdom Department for Transport, www.dft.gov.uk/pgr/roads/tpm/congestion/perceptions/perceptionsofcongestionrepor4026
BIBLIOGRAPHY – 277
MANAGING URBAN TRAFFIC CONGESTION – ISBN 978-92-821-0128-5 - © ECMT, 2007
DFT (2005c), Tackling Congestion and Pollution: the Government's First Report, United Kingdom Department for Transport, www.dft.gov.uk/pgr/roads/tpm/congestion/tacklingcongestionandpolluti4028
DFT (2005d), Analysis of Congested Networks, United Kingdom Department for Transport, www.dft.gov.uk/pgr/roads/tpm/congestion/analysisofcongestednetworks
DFT (2005e), Response of Traffic to Increased Road Capacity, A Review of Seven Before-and-After Studies, United Kingdom Department for Transport, London.
DFT (2006a), Experiences of Congestion and Attitudes to Road Pricing, United Kingdom Department for Transport, www.dft.gov.uk/pgr/statistics/datatablespublications/att/experiencesofcongestionandat5122
DFT (2006b), Journey Time Variability: Modelling and Appraisal of Journey Time Variability, United Kingdom Department for Transport, www.dft.gov.uk/pgr/economics/rdg/jtv/ir/journeytimevariabilitymodell3093
Dong, J., Mahmassani, H. and Lu, C-C. (2006), “How Reliable is this Route?: Predictive Travel Time and Reliability for Anticipatory Traveler In formation Systems”, Paper Submitted to the 85th Annual Meeting of the Transportation Research Board, TRB 2006 Annual Meeting CD-ROM, Washington, D.C.
Dowling, R. et al (2003), “Methodology for Measuring Recurrent and Non-Recurrent Traffic Congestion”, Paper Submitted to the 83rd Annual Meeting of the Transportation Research Board, TRB 2004 Annual Meeting CD-ROM, Washington, D.C.
Downs, A. (1992), Stuck in Traffic: Coping with Peak-Hour Traffic Congestion, The Brookings Institute (Washington, D.C.) and the Lincoln Institute of Land Policy (Cambridge, MA).
Downs, A. (2004), Still Stuck in Traffic: Coping with Peak-Hour Traffic Congestion, Brookings Institute Press, Washington, D.C.
Drewe, P. (2004), What About Time in Urban Planning and Design in the ICT Age?, Working Paper – Design Studio ‘The Network City’, Faculty of Architecture, Delft University of Technology, Delft, The Netherlands.
ECMT (1998), Infrastructure-Induced Mobility: Report of Round Table 105, European Conference of Ministers of Transport, Paris.
ECMT (1999), Traffic Congestion in Europe: Report of Round Table 110, European Conference of Ministers of Transport, Paris.
ECMT (2002), Implementing Sustainable Urban Travel Policies: Key Messages for Governments, European Conference of Ministers of Transport, Paris, France.
ECMT (2004), National Policies to Promote Cycling, European Conference of Ministers of Transport, Paris, France.
ECMT (2005), Time and Transport: Report of Round Table 127, Joint Transport Research Centre of the OECD/ECMT, European Conference of Ministers of Transport, Paris.

278 – BIBLIOGRAPHY
MANAGING URBAN TRAFFIC CONGESTION – ISBN 978-92-821-0128-5 - © ECMT, 2007
ECMT (2006), Reducing NOx Emissions on the Road, European Conference of Ministers of Transport, Paris, France.
ECMT (2006b), Improving Public Transport Accessibility for All: A Guide to Good Practice, European Conference of Ministers of Transport, Paris, France.
ECMT (2007), Transport Infrastructure Charges and Capacity Choice: Report of Round Table 135, Joint Transport Research Centre of the OECD/ECMT, European Conference of Ministers of Transport, Paris.
ECMT (2007b), Cutting Transport CO2 Emissions: What Progress?, European Conference of Ministers of Transport, Paris, France.
Eliasson, J. (2006), Cost-Benefit Analysis of the Stockholm Congestion Charging System, Transek, AB, Stockholm, www.stockholmsforsoket.se/upload/Sammanfattningar/English/Cost-benefit%20analysis%20of%20the%20Stockholm%20Trial%20v2.pdf
Eliasson, J. and Mattsson, L-G. (2006), “Equity Effects of Congestion Pricing: Quantitative Methodology and a Case Study for Stockholm”, Transportation Research Policy and Practice, Vol. 40a, Issue 7, pp. 602-620.
Ensor, M. (2002), “Methodology to Assess the Benefits of Improved Trip Reliability: Final Report”, TRANSFUND, Wellington, N.Z.
Ensor, M. (2004), “A Procedure for Evaluating the Trip Reliability Benefits from Individual Roading Projects”, Conference Proceedings of the Second International Symposium on Transport Network Reliability (20-24 August, 2004, Christchurch, N.Z.), pp. 168-173.
Ensor, M. (2004a), “Searching For Trip Time Reliability Benefits”, Technical Note presented to the Traffic Management Workshop 2004 Technical Conference, IPENZ Transportation Group, (5-8 September 2004, Wellington, N.Z.).
Evans, A. (1992), “Road Congestion: The Diagrammatic Analysis”, The Journal of Political Economy, Vol. 100, No. 1, pp. 211-217.
Evans, A. (1993), “Road Congestion Pricing: When is it a Good Policy?”, Journal of Transport Economics and Policy, Vol. 26, No. 3, pp. 213-243.
FHWA (2001), On-Time Reliability Impacts of Advanced Traveler Information Services (ATIS): Washington, D.C. Case Study Final Report, United States Federal Highway Administration, Washington, D.C.
FHWA (2003), A Guide for HOT Lane Development, United States Federal Highway Administration, Washington, D.C.
FHWA (2004a), Mitigating Traffic Congestion: The Role of Demand-Side Strategies, United States Federal Highway Administration, Washington, D.C.
FHWA (2004b), Monitoring Urban Roadways in 2002: Using Archived Operations Data for Reliability and Mobility Measurement, United States Federal Highway Administration, Washington, D.C.

BIBLIOGRAPHY – 279
MANAGING URBAN TRAFFIC CONGESTION – ISBN 978-92-821-0128-5 - © ECMT, 2007
FHWA (2004c), “Traffic Congestion and Reliability: Linking Solutions to Problems”, United States Federal Highway Administration, Washington, D.C.
FHWA (2005a), Induced Traffic: Frequently Asked Questions, United States Federal Highway Administration, Washington D.C., http://www.fhwa.dor,gov/Planning/itfaq.htm.
FHWA (2005b), Traffic Congestion and Reliability Final Report: Trends and Advanced Strategies for Congestion Mitigation, United States Federal Highway Administration, Washington, D.C.
FHWA (2006a), Traffic Incident Response Practices in Europe, United States Federal Highway Administration, Washington, D.C.
FHWA (2006b), Travel Time Reliability: Making It There On Time, All The Time, United States Federal Highway Administration, Washington, D.C.
Finlay, H. and O’Mahony, M. (2003), “Impact of Traffic Congestion on Trade and Strategies for Mitigation”, Paper Submitted to the 83rd Annual Meeting of the Transportation Research Board, TRB 2004 Annual Meeting CD-ROM, Washington, D.C.
Fontana, M. (1999), “Car-Free Areas and Pedestrianisation for Traffic Management: The Experience of Five Italian Towns”, Paper presented to the ECMT/OECD Workshop on Managing Car Use For Sustainable Urban Travel (1-2 December, 1999, Dublin, Ireland).
Frey, H.C., Rouphail, N. and Zhai, H. (2006), “Speed- and Facility-Specific Emission Estimates for On-Road Light-Duty Vehicles based on Real-World Speed Profiles”, Paper Submitted to the 85th Annual Meeting of the Transportation Research Board, TRB 2006 Annual Meeting CD-ROM, Washington, D.C.
Frölich, P. (2003), Induced Traffic: Review of the Explanatory Models, Paper presented at the 3rd Swiss Transport Research Conference (Ascona, March 203), Institute for Transport Planning and Systems, Zurich.
Fujito, I. et al (2006), “Effect of Sensor Spacing on Performance Measure Calculations”, Transportation Research Record: Journal of the Transportation Research Board, No. 1945, Transportation Research Board, Washington, D.C., pp. 1-11.
Ghosh, A. (2001), Valuing Time and Reliability: Commuters’ Mode Choice from a Real Time Congestion Pricing Experiment, Thesis Dissertation, University of California-Irvine, Irvine.
Gissel, S. (1998), Issues in the Valuation of Travel Time Changes, Paper presented to Trafikdage pa Aalborg Universitet (August 24-25, 1998, Aalborg, Denmark).
Glaisser, E. and Kahn, M. (2003), Sprawl and Urban Growth, Working Paper 9733, National Bureau of Economic Research, Cambridge, Massachusetts.
Glaisser, E. and Kohlhase, J. (2003), Cities, Regions and the Decline of Transport Costs, Discussion Paper 2014, Harvard Institute of Economic Research, Harvard University, Cambridge, Massachusetts.

280 – BIBLIOGRAPHY
MANAGING URBAN TRAFFIC CONGESTION – ISBN 978-92-821-0128-5 - © ECMT, 2007
Glaister, S and Graham, D. (2002), Review of Income and Price Elasticities of Demand for Road Traffic: Final Report, Centre for Transport Studies, Imperial College of Science, Technology and Medecine, London, United Kingdom.
Glaister, S and Graham, D. (2005), “An Evaluation of National Road User Charging in England”, Transportation Research Policy and Practice, Vol. 39a, Issues 7-9, pp. 632-650.
Glaister, S. and Graham, D. (2006), “Proper Pricing for Transport Infrastructure and the Case of Urban Road Congestion”, Urban Studies, Vol. 43, No. 8, pp. 1395-1418.
Golob, T. and Regan, A. (2001), “Impacts of Highway Congestion on Freight Operations: Perceptions of Trucking Industry Managers”, Transportation Research Policy and Practice, Vol. 35a, pp. 577-599.
Golob, T. and Regan, A. (2004), Traffic Conditions and Truck Accidents on Urban Freeways, Working Paper UCI-ITS-WP-04-3, Institute of Transportation Studies, University of California-Irvine, Irvine, California.
Golob, T., Recker, W. and Alvarez, V. (2004), “Freeway Safety as a Function of Traffic Flow”, Accident Analysis and Prevention, Vol. 36, Issue 6, pp. 933-946.
Goodwin P. and Noland R. (2003), “Building New Roads Really Does Create Extra Traffic: A Response to Prakash et al.”, Applied Economics, Vol. 35, No. 13, pp. 1451-1457.
Goodwin, P. (2004), The Economic Costs of Road Traffic Congestion, Discussion Paper published by the Rail Freight Group, ESRC Transport Studies Unit, University College London, London.
Goodwin, P. (2006), “Induced Traffic Again. And Again. And Again”, Local Transport Today, no.450, 24 August, 2006, London.
Goodwin, P., Dargay, J. and Hanly, M. (2002), Review of Income and Price Elasticities in the Demand for Road Traffic: Final Report, ESRC Transport Studies Unit, University of London, ESRC TSU Publication 2002/13, London.
Goodwin, P., Dargay, J. and Hanly, M. (2004), “Elasticities of Road Traffic and Fuel Consumption with Respect to Price and Income: A Review”, Transport Reviews, Vol. 24, No. 3, pp. 275-292.
Grant, M. and Fung, C. (2006), “Congestion Management Systems: Innovative Practices for Enhancing Transportation Planning”, Paper Submitted to the 85th Annual Meeting of the Transportation Research Board, TRB 2006 Annual Meeting CD-ROM, Washington, D.C.
Haakana, M. (ed) (2004), Proceedings of the Second OSCAR (Optimised Expert System for Conducting Environmental Assessment of Urban Road Traffic) End User Workshop, Finnish Meteorological Institute (September 2004, Tuusula, Finland).
Hajer, M. and Kesselring, S. (1999), “Democracy in the Risk Society? Learning from the New Politics of Mobility in Munich”, Environmental Politics, No. 3, pp.1-23.
Hamer, R et al. (2005), The Value of Reliability in Transport: Provisional Values for the Netherlands Based on Expert Opinion, Report TR-240-AVV, AVV – Transport Research Centre of the Dutch Ministry of Transport, Rotterdam, The Netherlands.
BIBLIOGRAPHY – 281
MANAGING URBAN TRAFFIC CONGESTION – ISBN 978-92-821-0128-5 - © ECMT, 2007
Handy, S. (2002), “Smart Growth and the Transportation-Land Use Connection: What Does the Research Tell Us?”, Paper presented to New Urbanism and Smart Growth: A Research Symposium (May, 3 2002, University of Maryland, USA).
Hanson, S. and Schwab, M. (1995), "Describing Disaggregate Flows: Individual and Household Activity Patterns", in Hanson, S. (ed.), The Geography of Urban Transportation, Guilford Press, New York.
Harrington, W., Krupnick, A. and Alberini, A. (2001), “Overcoming Public Aversion to Congestion Pricing”, Transportation Research Policy and Practice, Vol. 35a, Issue 2, pp. 87-105.
Hau, T. (1992), “Economic Fundamentals of Road Pricing: A Diagrammatic Analysis”, Policy Research Working Paper Series, No. 1070, The World Bank, Washington, D.C.
Hensher, D. (2001), “Measurement of the Valuation of Travel Time Savings”, Journal of Transport Economics and Policy”, Vol. 35, Part 1, pp.71-98.
Hensher, D. and Button, K., eds.(2000), Handbook of Transport Modelling, Elsevier Science Ltd., Amsterdam.
Hensher, D. and King, J. (2001), “Parking Demand and Responsiveness to Supply, Pricing and Location in the Sydney Central Business District”, Transportation Research Policy and Practice, Vol. 35a, Issue 3, pp. 177-196.
Hensher, D. and Puckett, S. (2006), “Congestion and Variable User Charging as an Effective Travel Demand Management Instrument”, Transportation Research Policy and Practice, In Press.
Hensher, D.A, and Puckett, S.M, (2005), “Road User Charging: The Global Relevance of Recent Developments in the United Kingdom”, Transport Policy, Vol. 12, N. 5, Oxford, pp. 377-383.
Hills, P. (1993), “Road Congestion Pricing: When is it a Good Policy? A Comment”, Journal of Transport Economics and Policy, Vol. 26, pp. 91-99.
Holguin-Veras, H. et al (2006), “The Impacts of Time of Day Pricing on the Behavior of Freight Carriers in a Congested Urban Area: Implications to Road Pricing”, Transportation Research Policy and Practice, Vol. 40a, Issue 9, pp. 744-766.
Hollander, Y. (2006), “Direct versus Indirect Models for the Effects of Unreliability”, Transportation Research Policy and Practice, Vol. 40a, Issue 9, pp. 699-711.
Hong, K. and Szeto, W. (2005), “Road Pricing Modelling for Hyper-Congestion”, Transportation Research Policy and Practice, Vol. 39a, No.s 7-9, pp.705-722.
Hwang, K-Y. and Lee, S. (2005), “Restore Cheonggye Stream in the Downtown of Seoul: Impacts of a Serious Loss of Road Capacity on Traffic Conditions and Travel Behaviour”, Paper Submitted to the 84th Annual Meeting of the Transportation Research Board, TRB 2005 Annual Meeting CD-ROM, Washington, D.C.
Hyman, G. and Mayhew, L. (2002), “Optimizing the Benefits of Urban Road User Charging”, Transport Policy, Vol. 9, Issue 3, pp. 189-207.
282 – BIBLIOGRAPHY
MANAGING URBAN TRAFFIC CONGESTION – ISBN 978-92-821-0128-5 - © ECMT, 2007
ITE (1997), A Toolbox for Alleviating Traffic Congestion and Enhancing Mobility, Institute for Transportation Engineers, Washington, D.C.
Jaensirisak, S., Wardman, M. and May, A. (2005), “Acceptibility of Road Pricing Schemes”, Transport Economics and Policy”, Vol. 39, Part 2, pp.127-153.
Kawanura, K., and Mahajan, S. (2005), “Hedonic Analysis of Traffic Volumes on Property Values”, Transportation Research Record, Journal of the Transportation |Research Board N. 1924, TRB, Washington, pp.69-75.
Kelly, A. and Clinch, P. (2006), “Influence of Varied Parking Tariffs on Parking Occupancy Levels by Trip Purpose”, Transport Policy, Vol. 13, Issue 6, pp. 487-495.
Kerner, B. (2004), The Physics of Traffic: Empirical Freeway Pattern Features, Engineering Applications, and Theory, Springer, Berlin Germany.
Kerner, B. et al (2001), “Methods for Tracing and Forecasting Congested Traffic Patterns”, Traffic Engineering and Control, Vol. 42, No. 8, pp. 282-287.
Kerner, B. et al (2004), “Recognition and Tracking of Spatial-temporal Congested Traffic Patterns on Freeways”, Transportation Research Emerging Technologies, Vol. 12c, Issue 5, pp. 369-400.
King, D., Manville, M. and Shoup, D. (2005), “The Political Calculus of Congestion Pricing”, Paper Submitted to the 85th Annual Meeting of the Transportation Research Board, TRB 2006 Annual Meeting CD-ROM, Washington, D.C.
Kirschfink, H. and Riegelhuth, G. (2003), “Roadworks Management in Hessen (Umfassendes Baustellenmanagementsystem in Hessen)”, Straße+Autobahn, No. 11, pp. 640-646.
Kitamura, R. and Susilo, Y. (2006), “Does a Grand Latte Really Stir Up Gridlock? Stops in Commute Journeys and Incremental Travel”, Paper Submitted to the 85th Annual Meeting of the Transportation Research Board, TRB 2006 Annual Meeting CD-ROM, Washington, D.C.
Ko, J., Guensler, R. and Hunter, M. (2006), “Variability in Traffic Flow Quality Experienced by Drivers: Evidence from Instrumented Vehicles”, Paper Submitted to the 85th Annual Meeting of the Transportation Research Board, TRB 2006 Annual Meeting CD-ROM, Washington, D.C.
Kockelman, K. and Kalmanje, S. (2005), “Credit-Based Congestion Pricing: A Policy Proposal and the Public's Response”, Transportation Research Policy and Practice, Vol. 39a, Issues 7-9, August-November 2005, Pages 671-690.
Kockleman, K. (1998), “Changes in the Flow-Density Relation Due to Environmental, Vehicle and Driver Characteristics”, Transportation Research Record, Transportation Research Board, No. 1644, Washington, D.C.
Kockleman, K. (2001), “Modeling Traffic's Flow-Density Relation: Accommodation of Multiple Flow Regimes and Traveler Types”, Transportation, Vol. 28, No. 4, pp. 363-374.
Koopmans, C. and Kroes, E. (2004), Estimation of Congestion Costs in the Netherlands, Discussion Paper No. 28, Stichting voor Economisch Onderzoek, University of Amsterdam, Amsterdam.
BIBLIOGRAPHY – 283
MANAGING URBAN TRAFFIC CONGESTION – ISBN 978-92-821-0128-5 - © ECMT, 2007
Kopf, J. et al (2005), Central Puget Sound Freeway Network Usage and Performance: 2003 Update, Research Report, Research Project T2695, Task 51, FLOW Evaluation, Washington State Transportation Center, University of Washington, Seattle, Washington.
Kwon, J., Mauch, M. and Varaiya, P. (2006), “The Components of Congestion: Delay from Incidents, Special Events, Lane Closures, Weather, Potential Ramp Metering Gain and Excess Demand”, Paper Submitted to the 85th Annual Meeting of the Transportation Research Board, TRB 2006 Annual Meeting CD-ROM, Washington, D.C.
L’Observatoire des Déplacements à Paris (2006), Le Bilan des Déplacements en 2005, Mairie de Paris, Paris
Lam, T. and Small, K.A. (2001), “The Value of Time and Reliability: Measurement from a Value Pricing Experiment”, Transportation Research Methodological, Vol. 37e, pp. 231-251.
Lave, C. (1995), “The Demand Curve Under Road Pricing: A Comment -- Author’s Reply”, Transportation Research Policy and Practice, Vol. 29a, Issue 6, pp. 459-465.
Lay, M. and Daley, K. (2002), “The Melbourne City Link Project”, Transport Policy, Vol. 9, Issue 3, pp. 261-267.
Lee, S. et al (2004), “An Impact Analysis on Disconnecting a Major Expressway”, Conference Proceedings of the Second International Symposium on Transport Network Reliability (20-24 August, 2004, Christchurch, N.Z.), pp 274-280.
Leonard II, J.; Oliveira, M. (2000), “Towards an Areawide Service Measure”, Proceedings of the Fourth International Symposium on Highway Capacity (June 27–July 1, 2000, Maui, Hawaii), Transportation Research Board, Washington D.C., pp. 17-25.
Leurent, F. (2005a), La Capacité d’Ecoulement du Trafic, Rapport INRETS N. 265, Les Collections de l‘INRETS, Arceuil.
Leurent, F., (2005b), “The Network Cost of Congestion: Analysis and Computation of Marginal Social Cost Disaggregated by O-D Pair and Departure Time”, Paper presented at the European Transport Conference (Strasbourg, October 3-5, 2005).
Levine, J. and Garb, Y. (2002), “Congestion Pricing's Conditional Promise: Promotion of Accessibility or Mobility?”, Transport Policy, Vol. 9, Issue 3, pp. 179-188.
Levinson, D and Rafferty, P. (2004), “Delayer Pays Principle: Examining Congestion Pricing with Compensation”, International Journal of Transport Economics, Vol. 31, No. 3, pp. 295-311.
Levinson, D. (2001), “Perspectives on Efficiency in Transport”, Submitted to the 81st Annual Meeting of the Transportation Research Board, TRB 2002 Annual Meeting CD-ROM, Washington, D.C.
Levinson, D. (2005), “Micro-foundations of Congestion and Pricing: A Game Theory Perspective”, Transportation Research Policy and Practice, Vol. 39a, Issues 7-9, pp. 691-704.
Levinson, D. and Nebiyou Y. (2006). A Moment of Time: Reliability in Route Choice using Stated Preference, Paper presented at the 11th International Conference on Travel Behaviour Research (August 2006, Kyoto, Japan).
284 – BIBLIOGRAPHY
MANAGING URBAN TRAFFIC CONGESTION – ISBN 978-92-821-0128-5 - © ECMT, 2007
Levinson, D. and Wu, Y. (2005), “The Rational Locator Re-examined: Are Travel Times Still Stable?”, Transportation, Vol. 32, No. 2, , pp. 187-202.
Levinson, D. and Zhang, L. (2006), “Ramp Meters on Trial: Evidence from The Twin Cities Metering Holiday”, Transportation Research Policy and Practice, Vol. 40a, Issue 10, pp. 810-828.
Levinson, D. et al, (2005), Ramp Meter Delays, Freeway Congestion and Driver Acceptance: Final Report, Intelligent Transport Systems Institute, University of Minnesota, Report CTS 05-02, Minneapolis (MN).
Levinson, et al (2004), “Weighting Waiting: Evaluating the Perception of In-Vehicle Travel Time Under Moving and Stopped Conditions”, Transportation Research Record: Journal of the Transportation Research Board, No. 1898, pp. 61-68.
Li, R. (2004), Examining Travel Time Variability Using AVI Data, Working Paper, Institute of Transport Studies, Monash University, Monash.
Li, Y-W. (2003), “Evaluating the Urban Commute Experience: A Time Perception Approach”, Journal of Public Transportation, Vol. 6, No. 4, pp. 41-67
Lindgren, R. et al (2006), “Toward Demonstrating the Predictability of Bottleneck Activation on a German Autobahn.” Transportation Research Record: Journal of the Transportation Research Board, No. 1965, Transportation Research Board, Washington, D.C., pp. 12-22.
Lindsey, R. and Verhoef, E. (2000), “Congestion Modelling” in D. Hensher and K. Button (eds.), Handbook of Transport Modelling, Elsevier Science Ltd., Amsterdam, pp. 377-397.
Litman, T. (2003), “Accessibility”, Online Transportation Demand Management Encyclopaedia, Victoria Transport Policy Institute, Victoria, Canada. www.vtpi.org/tdm/tdm84.htm
Litman, T. (2005a), “Congestion Reduction Strategies”, Online Transportation Demand Management Encyclopaedia, Victoria Transport Policy Institute, Victoria, Canada. www.vtpi.org/tdm/tdm96.htm
Litman, T. (2005b), “Rebound Effects”, Online Transportation Demand Management Encyclopaedia, Victoria Transport Policy Institute, Victoria, Canada. www.vtpi.org/tdm/tdm64.htm
Litman, T. (2006a), Smart Congestion relief: Evaluating Highway Expansion Benefits, Victoria Transport Policy Institute, Victoria, Canada. www.vtpi.org/cong_relief.pdf
Litman, T. (2006b), Parking Management Strategies, Evaluation and Planning, Victoria Transport Policy Institute, Victoria, Canada. www.vtpi.org/ park_man.pdf
Litman, T. (2006c), Transportation Elasticities, Victoria Transport Policy Institute, Victoria, Canada. www.vtpi.org/elasticities.pdf
Lo, S-C. and Hall, R. (2006), “Effects of the Los Angeles Transit Strike on Highway Congestion”, Transportation Research Policy and Practice, Vol. 40a, Issue 10, pp. 903-917.
Lomax, T., Schrank, D. and Margiotta, R. (2003), Selecting Travel Reliability Measures, Texas Transportation Institute, Texas A&M University System, College Station, Texas.
BIBLIOGRAPHY – 285
MANAGING URBAN TRAFFIC CONGESTION – ISBN 978-92-821-0128-5 - © ECMT, 2007
Lorenz, M. and Elefteriadou, L. (2000), “A Probabilistic Approach to Defining Freeway Capacity and Breakdown”, Proceedings of the Fourth International Symposium on Highway Capacity (June 27–July 1, 2000, Maui, Hawaii), Transportation Research Board, Washington D.C., pp. 84-95.
Lu, M. et al (2005), “Perspective of Mitigating Shock Waves by Temporary In-Vehicle Dynamic Speed Control”, Paper Submitted to the 84th Annual Meeting of the Transportation Research Board, TRB 2005 Annual Meeting CD-ROM, Washington, D.C.
Luskin, D. and Chandrasekaran, A. (2004), “Employer Valuations of Employee Commuting Time: A Case Study of Office Tenants in North Dallas”, Paper Submitted to the 84th Annual Meeting of the Transportation Research Board, TRB 2005 Annual Meeting CD-ROM, Washington, D.C.
Lyons, G. (2003), “Future Mobility: It’s about Time”, Paper presented at the Universities Transport Study Group Conference, Loughborough, UK, January 2003.
Lyons, G. and Urry, J. (2005), “Travel Time Use in the Information Age”, Transportation Research Policy and Practice, Vol. 39a, Issues 2-3, pp.257-276.
Mackie, P. (2005), “The London Congestion Charge: |A Tentative Economic Appraisal. A Comment on the Paper by Prud'homme and Bocajero”, Transport Policy, Vol. 12, Issue 3, pp. 288-290.
Mackie, P.; Jara-Diaz, S.and Fowkes, A.(2001), “The Value of Travel Time Savings in Evaluation” Transportation Research Logistics and Transportation, Review 37e, pp.91-106.
Maerivoet, S. and de Moor, B. (2006), Traffic Flow Theory, Catholic University of Leuven, SISTA Technical Report 05, Leuven. http://arxiv.org/abs/physics/0507127
Mardsen, G., Bell, M. and Reynolds, S. (2001), “Towards a Real-Time Microscopic Emissions Model”, Transport Research: Transport and the Environment, Vol. 6d, No. 1, pp. 37-60.
Marsden, G. (2006), “The Evidence Base for Parking Policies--A Review”, Transport Policy, Vol. 13, Issue 6, Parking, pp. 447-457.
Masinick, J. and Teng, H. (2004), An Analysis on the Impact of Rubbernecking on Urban Freeway Traffic, Research Report No. UVACTS 150-62, Centre for Transportation Studies at the University of Virginia, Arlington.
May, A. et al (2005), Developing Sustainable Urban Land Use and Transport Strategies: A Decision-Makers’ Guidebook, EU Project on ‘Procedures for Recommending Optimal Sustainable Planning of European City Transport Systems’ (PROSPECTS), Deliverable 15, Institute for Transport Studies, University of Leeds, Leeds, United Kingdom.
May, A.D., Kelly, C. and Shepherd, S. (2006), “The Principles of Integration in Urban Transport Strategies”, Transport Policy, Vol. 13, Issue 4, pp. 319-327.
McKinnon, A., Ge, Y. and McClelland, D. (2004), Assessment of the Opportunities for Rationalising Road Freight Transport: Final Report, Link Research Project 022, Future Integrated Transport Programme, Heriot Watt University, Edinburgh, Scotland.
Metz, D. (2005), “Journey Quality as the Focus for Future Transport Policy”, Transport Policy, Vol. 12, No. 4, pp. 353-359.
286 – BIBLIOGRAPHY
MANAGING URBAN TRAFFIC CONGESTION – ISBN 978-92-821-0128-5 - © ECMT, 2007
Meyer, M. (2002), “Measuring System Performance: The Key to Establishing Operations as a Core Agency Mission”, Transportation Research Record 1817, Transportation Research Board, National Research Council, Washington, D.C.
Mokhtarian, P. (2004), “Reducing Road Congestion: a Reality Check – a Comment”, Transport Policy, Vol. 11, N. 2, Oxford, pp. 183-184.
Mokhtarian, P. (2005), “Travel as a Desired End, Not Just as a Means”, Transportation Research Policy and Practice, Vol. 39a, Issues 2-3, pp. 93-96.
Mokhtarian, P. and Ory, D.T. (2005), “When is Getting There Half the Fun? Modelling the Liking for Travel”, Transportation Research Policy and Practice, Vol. 39a, Issues 2-3, pp. 97-124.
Mokhtarian, P. and Salomon, I. (2001), “How Derived is the Demand for Travel? Some Conceptual and Measurement Considerations”, Transportation Research Policy and Practice, Vol. 35, Issue 8, pp. 695-719.
Morrison, S., (1986), “A Survey of Road Pricing”, Transportation Research Policy and Practice, Vol. 20a, Issue 2, pp. 87-97.
MOSAIC/MOMENTUM (1999), “Mobility Management – The European Approach”. Project CD-Rom, European Commission Transport RTD Programme: 4th Framework Programme, Brussels, Belgium.
Müller, G. (2001), “Betriebliches Mobilitätsmanagement: Status Quo einer Innovation in Deutschland und Europa”, Veröffentlichung des Referats für Arbeit und Wirtschaft, No. 133.
Mun, S-I. and Yonekawa, M. (2006), “Flextime, Traffic Congestion and Urban Productivity”, |Journal of Transport Economics and Policy, Vol. 40, Part 3, pp.329-358.
Munoz, J-C. and Daganzo, C. (2002), “The Bottleneck Mechanism of a Freeway Diverge”, Transportation Research Policy and Practice, Vol. 36a, Issue 6, pp. 483-505.
Musso, A. and Corazza, M. (2006), “Improving Urban Mobility Management: The Rome Case”, Paper Submitted to the 85th Annual Meeting of the Transportation Research Board, TRB 2006 Annual Meeting CD-ROM, Washington, D.C.
NAO (2004), Tackling Congestion by Making Better Use of England’s Motorways and Trunk Roads: Report to the Comptroller and Auditor General, United Kingdom National Audit Office, House of Commons Session 15 (2004-2005), London.
Nash, C and Sansom, T. (1999), Calculating Transport Congestion and Scarcity Costs: Final Report of the Expert Advisors to the High-Level Group on Infrastructure Charging (Working Group 2), European Commission, Brussels, Belgium.
NCHRP (1997a), “Quantifying Congestion: Volume 1, Final Report”, National Cooperative Highway Research Program Report 398, Transportation Research Board, National Research Council, Washington, D.C.

BIBLIOGRAPHY – 287
MANAGING URBAN TRAFFIC CONGESTION – ISBN 978-92-821-0128-5 - © ECMT, 2007
NCHRP (1997b), “Quantifying Congestion: Volume 2, User’s Guide”, National Cooperative Highway Research Program Report 398, Transportation Research Board, National Research Council, Washington, D.C.
NCHRP (1998), “Multimodal Corridor and Capacity Analysis Manual”, National Cooperative Highway Research Program Report 399, Transportation Research Board, National Research Council, Washington, D.C.
NCHRP (1999), “Valuation of Travel Time Savings and Predictability in Congested Conditions for Highway User Cost Estimations”, National Cooperative Highway Research Program Report 431, Transportation Research Board, National Research Council, Washington, D.C.
NCHRP (2001a), “Economic Implications of Congestion”, National Cooperative Highway Research Program Report 463, Transportation Research Board, National Research Council, Washington, D.C.
NCHRP (2001b), “Guidebook for Assessing the Social and Economic Effects of Transportation Projects”, National Cooperative Highway Research Program Report 456, Transportation Research Board, National Research Council, Washington, D.C.
Newbery, D. and Santos, G. (2002) “Estimating urban road congestion charges”, CEPR Discussion paper 3176, Centre for Economic Policy Research, London.
Newbery, D. and Santos, G. (2003), “Area Speed-Flow Relationships and Urban Congestion Costs”, presented at the International Symposium on the Theory and Practice of Congestion Charging, (Imperial College London, August 18-20).
Noland, R. (2001), “Relationships Between Highway Capacity and Induced Vehicle Travel”, Transportation Research Policy and Practice, Vol. 35a, Issue 1, pp. 47-72.
Noland, R. and Lem, L. (2001), “A Review of the Evidence for Induced Travel and Changes in Transportation and Environmental Policy in the United States and the United Kingdom”, Transportation Research: Transport and Environment, Vol. 7d, No. 1, pp. 1-26.
Noland, R. and Polak J. (2002), “Travel Time Variability: A Review of Theoretical and Empirical Issues”, Transport Reviews, Vol. 22, No. 1, pp. 39-54.
Noland, R. and Quddus, M. (2005), “Congestion and Safety: A Spatial Analysis of London”, Transportation Research Policy and Practice, Vol. 39a, Issues 7-9, pp. 737-754.
Noland, R. et al (1998), “Simulating Travel Reliability”, Regional Science and Urban Economics, Vol. 28, No. 5, pp. 535-564.
Nouvier, J. (2004), “The Variable Assignment of Roads and Public Spaces”, Paper presented at the 8th European Conference on Mobility Management (5-7 May 2004, Lyon).
NTOC (2005), Performance Measurement Initiative: Final Report, National Transportation Operations Coalition, Washington, D.C.

288 – BIBLIOGRAPHY
MANAGING URBAN TRAFFIC CONGESTION – ISBN 978-92-821-0128-5 - © ECMT, 2007
Odani, M. and Yamanaka, H. (2004), “Drivers’ Behaviors Analysis Under Strategic Toll Charging System to Improve Road Travel Reliability”, Conference Proceedings of the Second International Symposium on Transport Network Reliability (20-24 August, 2004, Christchurch, N.Z.), pp. 245-251.
Odani, M. and Yamanaka, H. (2004), “Drivers’ Behaviors Analysis Under Strategic Toll Charging System to Improve Road Travel Reliability”, Conference Proceedings of the Second International Symposium on Transport Network Reliability (20-24 August, 2004, Christchurch, N.Z.), pp. 245-251.
Odeck J. and Brathen, S. (2002), “Toll Financing in Norway: the Success, the Failures and Perspectives for the Future”, Transport Policy, Vol. 9, Issue 3, pp. 253-260.
OECD (1997), Performance Indicators for the Transport Sector, Road Transport Research Programme, Organisation for Economic Co-operation and Development, Paris.
OECD (2003), Delivering the Goods: 21st Century Challenges to Urban Goods Distribution, Road Transport Research Programme, Organisation for Economic Co-operation and Development, Paris.
OECD (2005), OECD Territorial Review of Seoul, Korea, Organisation for Economic Co-operation and Development, Paris.
OECD (2005b), Economic Evaluation of Long-Life Pavements, Organisation for Economic Co-operation and Development, Paris.
OECD (2006), Competitive Cities in a Global Economy”, Organisation for Economic Co-operation and Development, Paris.
Oh, J-S. and Chung, Y. (2006), “Calculation of Travel Time Variability from Loop Detector Data”, Paper Submitted to the 85th Annual Meeting of the Transportation Research Board, TRB 2006 Annual Meeting CD-ROM, Washington, D.C.
Oneyama, H., Oguchi, T. and Kuwahara, M. (2001), “Estimation Model of Vehicle Emission Considering Variation of Running Speed”, Journal of the Eastern Asia Society for Transportation Studies, Vol.4, No.5, pp.105-117.
Pahaut, S. and Sikow, C. (2006), “History of Thought and Prospects for Road Pricing”, Transport Policy, Vol. 13, Issue 2, pp. 173-176.
Park, M. and Regan, A. (2006), “Issues in Emerging Home Delivery Operations”, Paper Submitted to the 83rd Annual Meeting of the Transportation Research Board, TRB 2003 Annual Meeting CD-ROM, Washington, D.C.
Parry, I. (2002), “Comparing the Efficiency of Alternative Policies for Reducing Traffic Congestion”, Journal of Public Economics, Vol. 85, No. 3, pp. 333-362.
Parthasarathi, P., Levinson, D. and Karamalaputi, R. (2003), “Induced Demand: A Microscopic Perspective”| , Urban Studies, Vol. 40, No. 7, pp. 1335-1351.

BIBLIOGRAPHY – 289
MANAGING URBAN TRAFFIC CONGESTION – ISBN 978-92-821-0128-5 - © ECMT, 2007
Poole, R. and Orski, K. (2003), HOT Networks: A New Plan for Congestion Relief and Better Transit, Reason Pblic Policy Institute, Policy Study No. 305, Washington, D.C.
PROGRESS (2002), PROGRESS WP2: Scheme Design and Development, Pricing ROad use for Greater Responsibility, Efficiency and Sustainability in cities, Deliverable D3.2, V2,0. www.progress-project.org/
Prud’homme, R. (2001), “Is Congestion Pricing Such a Good Idea?”, Paper presented to the 9th World Conference on Transportation Research (Seoul, July 2001).
Prud’homme, R. (2004), “La congestion et ses coûts”, Rail et Transports, No. 316, pp. 58-61.
Prud’homme, R. and Bocarejo, J-P. (2005), “The London Congestion Charge: a Tentative Economic Appraisal”, Transport Policy, Vol. 12, Issue 3, pp. 279-287.
Prud’homme, R. and Bocarejo, J-P. (2006), “Le Péage de Londres: Constats et Controverses”, PREDIT: Recherches et Synthèses,No. 31, Ministère des Transports, de l’Equipement, du Tourisme et de la Mer, Paris.
Prud’homme, R. and Kopp, P. (2007), The Stockholm Toll: An Economic Evaluation, (unpublished), www.sika-institute.se/Doclib/2006/pm_060907_prud.pdf
RAC (2006), The Future of Motoring: A Clear Road Map or a Collision Course?, RAC Report on Motoring 2006, Royal Automobile Club of the United Kingdom, Norwich.
Rajamani, R. et al, (2005), Adaptive Cruise Control System Design and its Impact on Traffic Flow, Intelligent Transport Systems Institute, University of Minnesota, Report CTS 05-01, Minneapolis (MN).
Raney, E., Mokhtarian, P. and Salomon, I. (2000), “Modelling Individuals’ Consideration of Strategies to Cope with Congestion”, Transportation Research: Traffic Psychology and Behaviour, Vol. 3f, No. 3, pp. 141-165.
Raux, C. (2005), “Comments on ‘The London Congestion Charge: A Tentative Economic Appraisal’ (Prud’homme and Bocajero, 2005)”, Transport Policy, Vol. 12, pp. 368-371.
Raux, C. (2006), “Une Position Divergente (comment on ‘Le Péage de Londres: Constats et Controverses’)”, PREDIT: Recherches et Synthèses,No. 31, Ministère des Transports, de l’Equipement, du Tourisme et de la Mer, Paris.
Recker, W. et al (2005), Considering Risk-Taking Behaviour in Travel Time Reliability, Working Paper UCI-ITS-TS-WP-05-4, Institute of Transportation Studies, University of California-Irvine, Irvine, California.
Rouwendal, J. and Verhoef, E. (2006), “Basic Economic Principles of Road Pricing: From Theory to Applications”, Transport Policy, Vol. 13, Issue 2, pp. 106-114.
Sachverständigenrat für Umweltfragen (2005), Umwelt und Straßenverkehr: Hohe Mobilität – Umweltverträglicher Verkehr, Sondergutachten im Auftrag der Bundesregierung.
290 – BIBLIOGRAPHY
MANAGING URBAN TRAFFIC CONGESTION – ISBN 978-92-821-0128-5 - © ECMT, 2007
SACTRA (1994), Trunk Roads and the Generation of Traffic, HMSO, London, United Kingdom.
Safirova, E. and Gillingham, K. (2003), Measuring Marginal Congestion Costs of Urban Transportation: Do Networks Matter?, Discussion Paper 03-56, Resources for the Future, Washington, D.C.
Saleh, W. and Farrell, S. (2005), “Implications of Congestion Charging for Departure Time Choice: Work and Non-Work Schedule Flexibility”, Transportation Research Policy and Practice, Volume 39a, Issues 7-9, pp. 773-791.
Santos, G. (2004) “Urban Congestion Charging: A Second Best Alternative”, Journal of Transport Economics and Policy, Vol. 38, N. 3, pp. 345-369.
Santos, G. (2005), “Urban Congestion Charging: A Comparison between London and Singapore”, Transport Reviews, Vol. 25, No. 5, pp. 511-534.
Santos, G. (ed) (2004), Research in Transportation Economics Volume 9: Road Pricing Theory and Evidence, Elsevier, Amsterdam.
Santos, G. and Bhakar, J. (2006), “The Impact of the London Congestion Charging Scheme on the Generalised Cost of Car Commuters to the City of London from a Value of Travel Time Savings Perspective”, Transport Policy, Vol. 13, Issue 1, pp. 22-33.
Santos, G. and Fraser, G. (2006), “Road Pricing: Lessons from London”. Economic Policy, Vol. 21, N.46, pp. 264-310.
Santos, G. and Shaffer, B. (2004), “Preliminary Results of the London Congestion Charging Scheme”, Public Works, Management and Policy, Vol. 9, N. 2, pp. 164-181.
Sarzynski, A. et al (2006), “Testing the Conventional Wisdom about Land Use and Traffic Congestion: The More We Sprawl, the Less We Move?”, Urban Studies, Vol. 43, No. 3, pp601-626.
Schade, J. and Schlag, B. (2003), “Acceptability of Urban Transport Pricing Strategies”, Transportation Research Traffic Psychology and Behaviour, Volume 6f, Number 1, pp. 45-61.
Schiffer, R., Steinvorth, W. and Milam, R. (2004), “Comparative Evaluations on the Elasticity of Travel Demand”, Paper Submitted to the 84th Annual Meeting of the Transportation Research Board, TRB 2005 Annual Meeting CD-ROM, Washington, D.C.
Schmocker, J.D., et al. (2006), “Changes in the Frequency of Shopping Trips in Response to a Congestion Charge”, Transport Policy, Vol. 13, Issue 3, pp. 217-228.
Schrank, D. and Lomax, T. (2000), Texas Transportation Institute 1999 Urban Mobility Report, Texas Transportation Institute, Texas A&M University System, College Station, Texas.
Schrank, D. and Lomax, T. (2002), Texas Transportation Institute 2001 Urban Mobility Report, Texas Transportation Institute, Texas A&M University System, College Station, Texas.
Schrank, D. and Lomax, T. (2003), Texas Transportation Institute 2002 Urban Mobility Report, Texas Transportation Institute, Texas A&M University System, College Station, Texas.
BIBLIOGRAPHY – 291
MANAGING URBAN TRAFFIC CONGESTION – ISBN 978-92-821-0128-5 - © ECMT, 2007
Schrank, D. and Lomax, T. (2004a), Texas Transportation Institute 2003 Urban Mobility Report, Texas Transportation Institute, Texas A&M University System, College Station, Texas.
Schrank, D. and Lomax, T. (2004b), Texas Transportation Institute 2003 Urban Mobility Report – Volume 2: Five Congestion Reduction Strategies and Their Effects on Mobility, Texas Transportation Institute, Texas A&M University System, College Station, Texas.
Schrank, D. and Lomax, T. (2005a), Texas Transportation Institute 2004 Urban Mobility Report, Texas Transportation Institute, Texas A&M University System, College Station, Texas.
Schrank, D. and Lomax, T. (2005b), Texas Transportation Institute 2004 Urban Mobility Report – Volume 2: Six Congestion Reduction Strategies and Their Effects on Mobility, Texas Transportation Institute, Texas A&M University System, College Station, Texas.
Schrank, D. and Lomax, T. (2006), Texas Transportation Institute 2005 Urban Mobility Report, Texas Transportation Institute, Texas A&M University System, College Station, Texas.
Schreiner, M and Knäusl, R. (2004), “Never Walk Alone! Processes, Results and Purposes of an Innovative and Successful Mobility Partnership in Munich”, Paper presented at the 8th European Conference on Mobility Management (5-7 May 2004, Lyon).
Shepherd, S.P. et al (2006), “Designing Optimal Urban Transport Strategies: The Role of Individual Policy Instruments and the Impact of Financial Constraints”, Transport Policy, Vol. 13, Issue 1, pp. 49-65.
Sherret, A. (1975), Immediate Travel Impacts of Transbay Bay Area Rapid Transit (BART), Report no. TN 15-3-75, United States Department of Transport, Washington, D.C.
Shoup, D. (2005), The High Cost of Free Parking, Planner’s Press, American Planning Association, Chicago.
Shoup, D. (2006), “Cruising for Parking”, Transport Policy, Vol. 13, Issue 6, Parking, November 2006, Pages 479-486.
SIRIUS (2004), Les Déplacements sur le Réseau de Voies Rapides Urbaines d’Ile-de-France: Année 2003, Préfecture de la Région d’Ile-de-France, Paris, France.
Small K.A. and Chu X. (2003), “Hypercongestion”, Journal of Transport Economics and Policy, Vol. 37, No. 3, pp. 319-352.
Small, K., Noland, R. and Koskenoja, P. (1995), "Socio-Economic Attributes and Impacts of Travel Reliability: A Stated Preference Approach", California Partners for Advanced Transit and Highways (PATH). Research Reports: Paper UCB-ITS-PRR-95-36.
Small, K., Winston, C. and Yan, J. (2005) “Uncovering the Distribution of Motorists' Preferences for Travel Time and Reliability”, Econometrica Vol. 73, No. 4, pp. 1367–1382.
Stopher, P.R. (2004), “Reducing Road Congestion: a Reality Check”, Transport Policy, Vol. 11, N. 2, Oxford, pp. 117-132.

292 – BIBLIOGRAPHY
MANAGING URBAN TRAFFIC CONGESTION – ISBN 978-92-821-0128-5 - © ECMT, 2007
Storper, M. and Venables, J. (2004), " Buzz: Face-to-Face Contact and the Urban Economy ", Journal of Economic Geography, Vol.4, No. 4, pp. 351-370.
Sullivan, E. (2000), Continuation Study to Evaluate the Impacts of the SR91 Value-Priced Express Lanes: Final Report, submitted to State of California, Department of Transportation, Department of Civil and Environmental Engineering, Cal Poly State University, San Luis Obispo (CA).
Sumalee, A., May, T., Shepherd, S., (2005), “Comparison of Judgmental and Optimal Road Pricing Cordons”, Transport Policy, Vol. 12, N. 5, Oxford, pp. 384-390.
Taylor, B. (2004), “The Politics of Congestion Mitigation”, Transport Policy, Vol. 11, Issue 3, pp. 299-302.
TFL (2004), Congestion Charging Monitoring: Traffic Impacts of the Congestion Charging Scheme, Transport for London, London.
TFL (2005), Central London Congestion Charging Impacts Monitoring: Third Annual Report, Transport for London, London.
Transport Canada (2006), The Cost of Congestion in Canada, Transport Canada – Environmental Affairs, Ottowa.
TRB (2005), International Perspectives on Road Pricing: Report of the Committee for the International Symposium on Road Pricing (November 19-22, 2003), Transportation Research Board, Washington, D.C.
Tsekeris, T. and Stathopolous, A. (2006), “Real-Time Traffic Volatility Forecasting in Urban Arterial Networks”, Paper Submitted to the 85th Annual Meeting of the Transportation Research Board, TRB 2006 Annual Meeting CD-ROM, Washington, D.C.
Tseng, Y-Y., Ubbels, B. and Verhoef, E. (2005), “Value of Time, Schedule Delay and Reliability: Estimation Results of a Stated Choice Experiment Among Dutch Commuters Facing Congestion”, paper presented to the 45th Congress of the European Regional Science Association on Land Use and Water Management in a Sustainable Networked Society (23-27 August, 2005, Amsterdam).
TTI (2005), The Keys to Estimating Mobility in Urban Areas: Applying Definitions and Measures that Everyone Understands, White Paper prepared for the Urban Transportation Performance Measurement Study, Texas Transportation Institute, Texas A&M University System, College Station, Texas.
Ubbels, B. and Verhoef, E. (2006), “Behavioural Responses to Road Pricing: Empirical Results from a Survey among Dutch Car Owners”, Paper Submitted to the 85th Annual Meeting of the Transportation Research Board, TRB 2006 Annual Meeting CD-ROM, Washington, D.C.
USDOT (2006), National Strategy to Reduce Congestion on America’s Transportation Network, United States Department of Transportation, Washington, D.C.
BIBLIOGRAPHY – 293
MANAGING URBAN TRAFFIC CONGESTION – ISBN 978-92-821-0128-5 - © ECMT, 2007
Ushiwaka, K., Kikuchi, A. and Kitamura, R. (2004), Commuters’ Perception of Travel Time and Uncertainty under Congestion Pricing: Exploration of a Six-Week Field Experiment Data, Paper presented to the International Conference Experiments in Economic Sciences (14-17 December 2004, Kyoto, Japan).
Van Amselfort, D. and Bliemer, M. (2006), “Alternative Specifications of Schedule Delay Components: The Effect of Travel Time Uncertainty and Departure Time Rescheduling”, Paper Submitted to the 85th Annual Meeting of the Transportation Research Board, TRB 2006 Annual Meeting CD-ROM, Washington, D.C.
Van de Coevering, P. and Schwanen, T. (2006) “Re-evaluating the Impact of Urban Form on Travel Patterns in Europe and North-America”, Transport Policy, Vol. 13, Issue 3, pp. 229-239.
Van Zuylen, H. (2004), “The Effect of Irregularity of Travel Times on Departure Time Choice”, Conference Proceedings of the Second International Symposium on Transport Network Reliability (20-24 August, 2004, Christchurch, N.Z.), pp. 253-259.
Varaiya, P. (2005), “What We Have Learned about Highway Congestion”, Access, No. 27. pp. 2-9.
VCEC (2005), Inquiry into Managing Transport Congestion: Issues Paper, Victoria Competition and Efficiency Commission ,Government of the State of Victoria, Melbourne.
VCEC (2006), Making the Right Choices: Options for Managing Transport Congestion, Draft Full Report, Victoria Competition and Efficiency Commission, Government of the State of Victoria, Melbourne.
Verhoef, E. (2000), “Second-best Congestion Pricing in General Static Transportation Networks with Elastic Demands”, Tinbergen Institute Discussion Paper, TI 2000-078/3, Amsterdam.
Verhoef, E. (2005), “Speed-Flow Relations and Cost Functions for Congested Traffic: Theory and Empirical Analysis”, Transportation Research Policy and Practice, Volume 39a, Issues 7-9, pp. 792-812.
Verhoef, E. and Rouwendal, J. (2001), “A Structural Model of Traffic Congestion”, Tinbergen Institute Discussion Paper, TI 2001-026/3, Amsterdam.
Verhoef, E.(1999), “Time, Speeds, Flows and Densities in Static Models of Road Traffic Congestion and Congestion Pricing”, Regional Science and Urban Economics, Vol. 29, No. 3, pp. 341-369.
Vlahogianni, E., Karlaftis, M. and Golias, J. (2006), “Patterns in Short-Term Urban Traffic Flow: A Framework for Statistical Detection and Identification”, Paper Submitted to the 85th Annual Meeting of the Transportation Research Board, TRB 2006 Annual Meeting CD-ROM, Washington, D.C.
VTPI (2005), Transport Elasticities: How Prices and other Factors Affect Travel Behaviour, On-line TDM Encyclopedia, Victoria Transport Policy Institute, www.vtpi.org/tdm/tdm11.htm
Wachs, M. (2002), “Fighting Traffic Congestion with Information Technology”, Issues in Science and Technology, Vol. 19, No. 1.
294 – BIBLIOGRAPHY
MANAGING URBAN TRAFFIC CONGESTION – ISBN 978-92-821-0128-5 - © ECMT, 2007
Walters, A. (1961), “The Theory and Measurement of Private and Social Cost of Highway Congestion”, Econometrica, Vol. 29, No. 4, pp. 676-699.
Wardman, M. (2001) “A Review of British Evidence on Time and Service Quality Valuations”, Transportation Research E, Vol. 37e, Issue 2-3, pp. 107-128.
Warffemius, P. (2005), “Using the Standard Deviation of the Travel Time Distribution as an Indicator for Valuing the Reliability of Travel Time”, Paper presented at the Young Researchers Seminar of the European Conference of Transport Research Institutes (The Hague, 11-13 May, 2005).
Weisbrod, G., Vary, D. and Treyz, G. (2003), “Measuring the Economic Costs of Urban Traffic Congestion to Business”, Submitted to the 82nd Annual Meeting of the Transportation Research Board, TRB 2003 Annual Meeting CD-ROM, Washington, D.C.
Wener, R. and Evans, G. (2004), The Impact of Mode and Mode Transfer on Commuter Stress: The Montclair Connection – Final Report, University Transportation Research Center – Region 2, The City College of New York, New York, New York.
Wener, R., Evans, G. and Boately, P. (2005), “Commuting Stress: Psychophysiological Effects of a Trip and Spillover into the Workplace”, Transportation Research Record: Journal of the Transportation Research Board, No. 1924, Transportation Research Board, Washington, D.C., pp. 112-117.
Whitehead, T., (2005), “Transport Charging Interventions and Economic Activity”, Transport Policy, Vol. 12, N. 5, Oxford, pp. 451-463.
Wong, W., Noland, R. and Bell,M. (2005), “The Theory and Practice of Congestion Charging”, Transportation Research Policy and Practice, Vol. 39a, Issues 7-9, pp. 567-570.
Wright, C. and Lupton, K. (2001), “Traffic Congestion and the Fundamental Relationship of Traffic Flow”, Transport (Proceedings of the Institution of Civil Engineers), Vol. 147, Issue 4, pp. 231-238.
Ying, J-Q. and Ando, R. (2006), “Equilibrium Based Analysis on the Effects of Japan Highway’s Commuter Discount Policy in Nagoya Area”, Submitted to the 85th Annual Meeting of the Transportation Research Board, TRB 2006 Annual Meeting CD-ROM, Washington, D.C.
Zhang H. (1999), “A Mathematical Theory of Traffic Hysteresis”, Transportation Research: Methodological, Vol. 33b, No. 1, pp. 1-23.
Zhang, J., et al (2002), “The Effects of Roadway Supply on Peak Narrowing”, Journal of the Transportation Research Forum, Vol. 56, No. 3, pp. 129-145.
Zickus, M. and Greig, A. (2001), “Effects of Congested vs. Freeway Urban Traffic Flow on Air Pollutant Concentrations in a Street Canyon”, submitted to the Seventh International Conference on Harmonisation Within Atmospheric Dispersion Modelling for Regulatory Purposes, European Commission Joint Research Centre (May 28-31, 2001, Belgirate).

WORKING GROUP MEMBERS – 295
MANAGING URBAN TRAFFIC CONGESTION – ISBN 978-92-821-0128-5 - © ECMT, 2007
WORKING GROUP MEMBERS
Chair Tom WORSLEY (United Kingdom)
Australia Lyn MARTIN Barry MOORE Joe MOTHA Anthony OCKWELL Canada Bruno JACQUES John LAWSON Czech Republic Anne-Sophie COLAS Ivan FENCL Eva GELOVA France Michel ANDRÉ Fabien LEURENT Germany Gerd-Axel AHRENS Silja ASSENMACHER Klaus J. BECKMANN Fritz BUSCH Katja JOHÄNNING Anne PITRONE Stefan von der RUHREN Guido RINDSFÜSER Matthias SPANGLER Greece Matthew KARLAFTIS Italy Andrea TUMBIOLO Japan Toshio KUTSUKAKE Yukihiro TSUKADA Netherlands Henk PAUWELS New Zealand Ian MELSOM Russian Federation Vadim DONCHENKO
296 – WORKING GROUP MEMBERS
MANAGING URBAN TRAFFIC CONGESTION – ISBN 978-92-821-0128-5 - © ECMT, 2007
Spain Francesc ROBUSTÉ ANTÓN José Magín CAMPOS CACHEDA Matilde FERNÁNDEZ BALBÍN Pablo VÁZQUEZ RUIZ DE CASTROVIEJO Paulo TEIXEIRA Leif THORSON BOFARULL United Kingdom Tom SANSOM Tom WORSLEY United States William LYONS Edward WEINER OECD/ECMT Philippe CRIST John WHITE
OECD PUBLICATIONS, 2, rue André-Pascal, 75775 PARIS CEDEX 16
PRINTED IN FRANCE
(77 2007 01 1 P) ISBN 978-92-821-0128-5 - No. 55623 2007

TR
AN
SP
OR
T
RE
SE
AR
CH
C
EN
TR
E
2007
EUROPEAN CONFERENCEOF MINISTERS OF TRANSPORT
MANAGINGURBANTRAFFICCONGESTION
MA
NA
GIN
G U
RBAN
TRAFFIC CO
NG
ESTION
-:HSTCSC=VUVW]Z:(77 2007 01 1 P)ISBN 978-92-821-0128-5
MANAGING URBANTRAFFIC CONGESTION
Road congestion is a maddening feature of many large and growing urban areas. National
estimates of the cost of congestion often point to losses equivalent to around 1% of GDP in more congested countries. However, congestion is also
the result of one of the most beneficial aspects of urban development – agglomeration and its
positive contribution to GDP. How can urban regions balance the benefits of agglomeration
and the disadvantages of congestion?
This report seeks to answer key questions in managing urban traffic congestion. What
exactly is congestion, and when is it excessive?What are the costs and other impacts of
congestion? What strategic vision should guide congestion management policies?
What technology and operational optionsare available? What should a reasonableand effective congestion management
strategy look like?
The report was prepared by an international Working Group of the Joint OECD/ECMT Transport Research Centre and provides
a thorough overview of the nature, scope and measurement of congestion, necessary for any effective management policy. It offers policy-
oriented, research-based recommendations for effectively managing traffic and cutting
excess congestion in large urban areas.
www.oecd.org/publishing
Related Documents