Managing in an Uncertain Future, or, “Change Comes in Many Flavors… but You Don’t Get to Pick” A Presentation to CREW-Miami By Hugh F. Kelly, PhD, CRE Four Seasons Hotel Miami, FL January 17, 2012

Managing in an Uncertain Future, or, “Change Comes in Many Flavors… but You Don’t Get to Pick” A Presentation to CREW-Miami By Hugh F. Kelly, PhD, CRE.
Dec 16, 2015
Welcome message from author
This document is posted to help you gain knowledge. Please leave a comment to let me know what you think about it! Share it to your friends and learn new things together.
Transcript
Managing in an Uncertain Future,
or, “Change Comes in Many Flavors… but You
Don’t Get to Pick”
A Presentation to CREW-MiamiBy Hugh F. Kelly, PhD, CRE
Four Seasons HotelMiami, FL
January 17, 2012

Miami Is 'Worst-Run' City in America: Report
Magic City tops list of America's worst-run cities, Hialeah close behind
By Brian Hamacher | Monday, Jan 9, 2012 | Updated 11:38 AM EST
Violent crime, poverty, low education rate and a crippled housing industry helped Miami reach the top spot in 24/7 Wall Street's first-annual list of the worst-run cities in America.

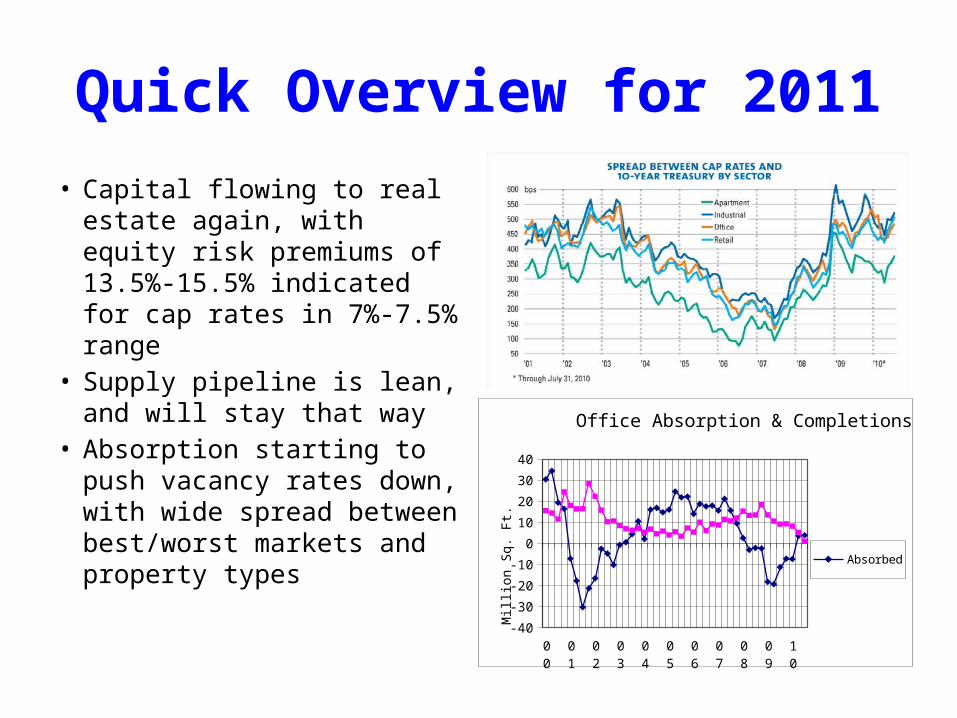
Quick Overview for 2011
• Capital flowing to real estate again, with equity risk premiums of 13.5%-15.5% indicated for cap rates in 7%-7.5% range
• Supply pipeline is lean, and will stay that way
• Absorption starting to push vacancy rates down, with wide spread between best/worst markets and property types
00
01
02
03
04
05
06
07
08
09
10
-40
-30
-20
-10
0
10
20
30
40
Office Absorption & Completions
Absorbed
Completed
Mill
ion
Sq.
Ft.
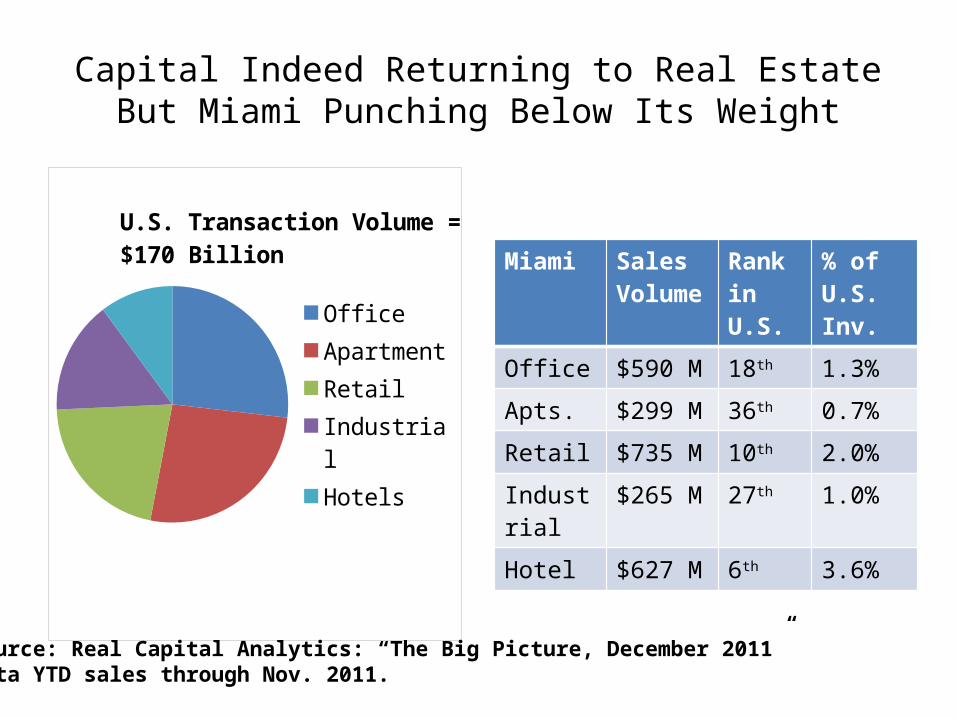
Capital Indeed Returning to Real EstateBut Miami Punching Below Its Weight
OfficeApartmentRetailIndustrialHotels
U.S. Transaction Volume = $170 Billion Miami Sales
VolumeRank in U.S.
% of U.S. Inv.
Office $590 M 18th 1.3%
Apts. $299 M 36th 0.7%
Retail $735 M 10th 2.0%
Industrial $265 M 27th 1.0%
Hotel $627 M 6th 3.6%
Source: Real Capital Analytics: “The Big Picture, December 2011”Data YTD sales through Nov. 2011.

The “Five Flavors” of Change
CyclesTrends
MaturationChange of State
Disruption
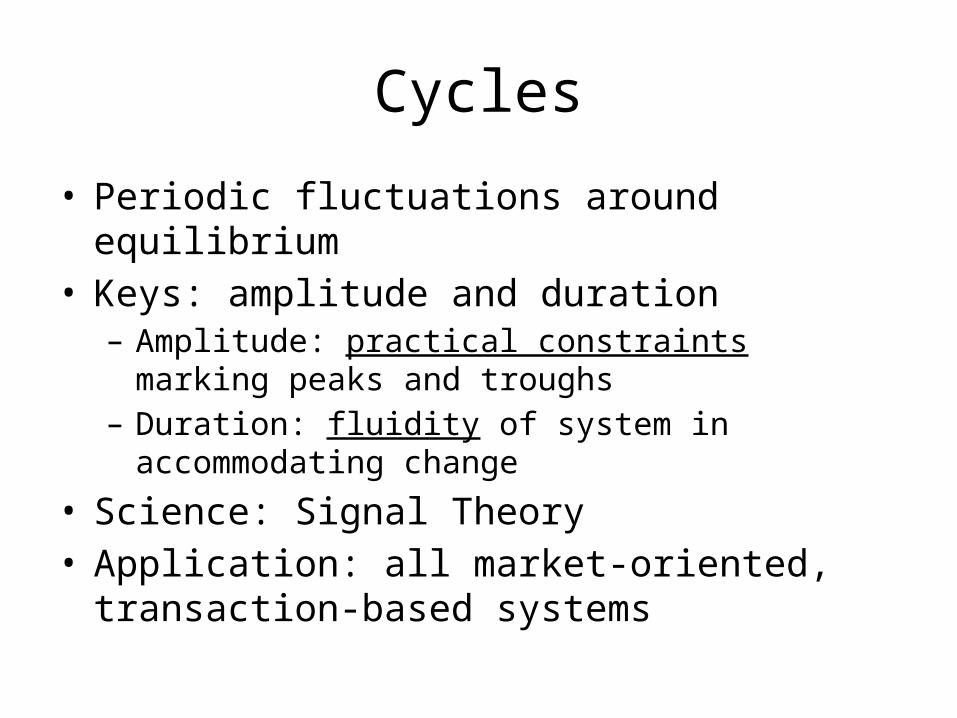
Cycles
• Periodic fluctuations around equilibrium• Keys: amplitude and duration
– Amplitude: practical constraints marking peaks and troughs
– Duration: fluidity of system in accommodating change
• Science: Signal Theory• Application: all market-oriented, transaction-based
systems

Non-Farm Employment and Real GDP
19901991
19921993
19941995
19961997
19981999
20002001
20022003
20042005
20062007
20082009
20102011
-6%
-4%
-2%
0%
2%
4%
6%
8%
GDP Non-Farm Employment
Year-over-year change
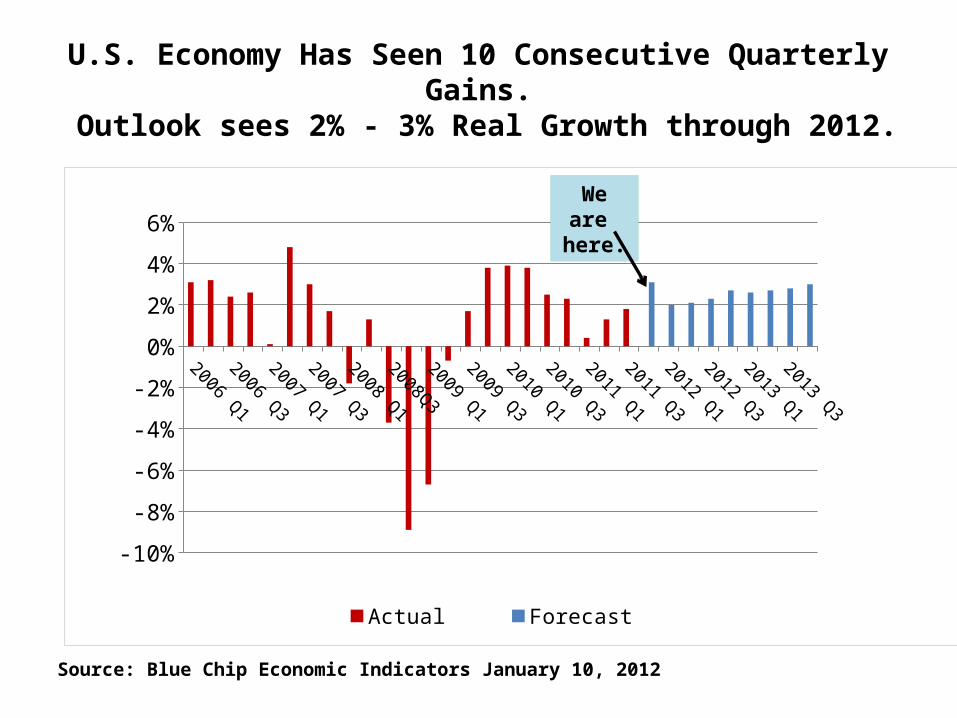
U.S. Economy Has Seen 10 Consecutive Quarterly Gains. Outlook sees 2% - 3% Real Growth through 2012.
2006 Q1
2006 Q3
2007 Q1
2007 Q3
2008 Q1
2008Q3
2009 Q1
2009 Q3
2010 Q1
2010 Q3
2011 Q1
2011 Q3
2012 Q1
2012 Q3
2013 Q1
2013 Q3
-10%
-8%
-6%
-4%
-2%
0%
2%
4%
6%
Actual Forecast
Source: Blue Chip Economic Indicators January 10, 2012
We are here.
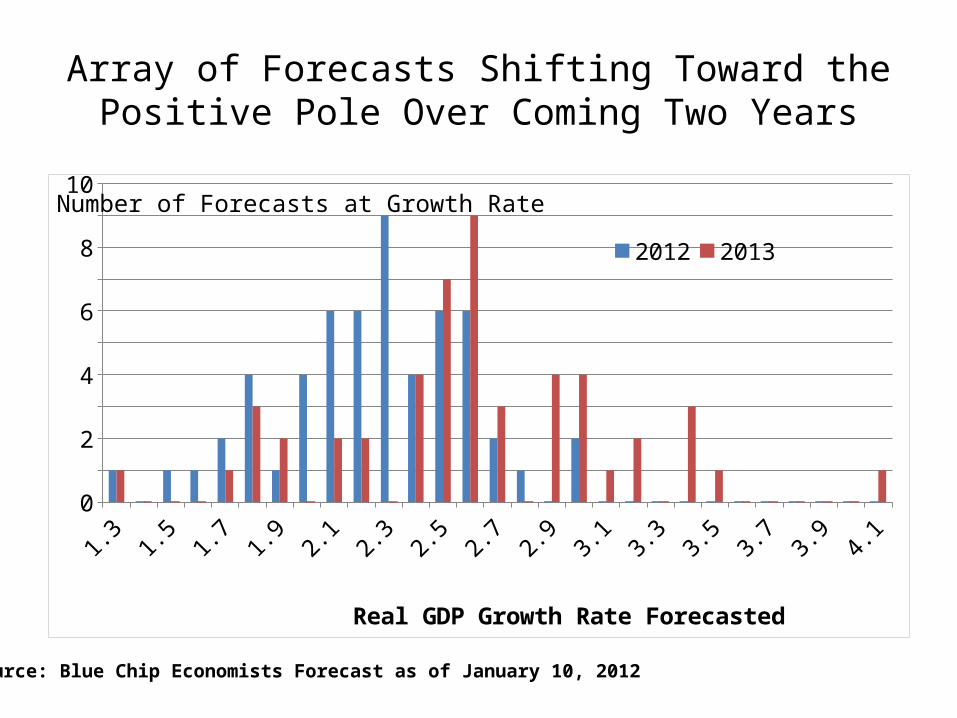
Array of Forecasts Shifting Toward the Positive Pole Over Coming Two Years
1.3 1.5 1.7 1.9 2.1 2.3 2.5 2.7 2.9 3.1 3.3 3.5 3.7 3.9 4.10123456789
10
2012 2013
Real GDP Growth Rate Forecasted
Number of Forecasts at Growth Rate
Source: Blue Chip Economists Forecast as of January 10, 2012

Joblessness Still Elevated, With Risk of High Unemployment Persisting,
but the Potential for Change is Subject to Much Debate!
2
3
4
5
6
7
8
9
10
11
Actual Consensus High Estimate Low Estimate
Sources: Actual Historical Data from Bureau of Labor Statistics;Forecasts from Blue Chip Economic Indicators, as of January 10, 2012
Percent

Fed Accommodative Policies and Flight to U.S. Treasuries Extending Historic Era of Low Interest Rates
2008 q12008 q22008 q32008 q42009 q12009 q22009 q32009 q42010 q12010 q22010 q32010 q42011 q12011 q22011 q32011 q42012 q12012 q22012 q32012 q42013 q12013 q22013 q32013 q4-1.0%
0.0%
1.0%
2.0%
3.0%
4.0%
5.0%
3 Month Bills 10 Year Notes
10-year Treasury yields are expected to fall in 2.2% to 2.6% range throughout 2012, not poking above 3% until mid- 2013
Source: Blue Chip Economic IndicatorsJanuary 10, 2012
Near zero-percent short-term rates now considered likely throughout the coming year as Fed continues to battle high unemployment and sluggish GDP

Political Dysfunction Means Economic Policy Is Rowing With Just One Oar
Monetary and Fiscal Policy Are Obviously Not in Synch.
Austerity in Fragile EconomyImpacting State and LocalGovernments Severely, andRetarding Overall Economic Growth.
Domestic and Eurozone ConcernsAre Conspiring to Limit InvestmentSpending and Hiring.
So, “Where are we in the cycle” might be the wrong question!
• The economic change we are coping with is clearly not a typical cycle. Unlike the early 1990s real estate collapse, this market is coping with a fundamental dislocation in the global economic and financial system
• Although U.S. commercial real estate retains its cyclical character, the strength of fundamental demand is being sapped by macro trends, including financial market fear.
• Therefore we need to look at non-cyclical forms of change to diagnose and to prescribe (pardon my “doctor-talk”).

Disruption
• Sudden and profound shock to system• Keys: radical challenge to system integrity; alteration
of paradigm; reconceptualization• Behaviors: may be revolutionary (novus ordo
saeclorum), or may prompt a compensatory return to new stasis (if not status quo ante)
• Science: particle physics; medicine• Applications: 9/11; Katrina; 1970s OPEC influences;
and, most recently, the “Panic of 2008” and its aftermath

OPEC Shocks of 1970s Offer a Good Illustration of “Disruptive Change”
After nearly 40 years of history, that change is not generally understood.In “real dollar” terms, oil prices were at historically low levels as recently as 2003.But we have never returned to pre-1973 price stability.This means that “event risk” has become a permanent factor for this commodity.

19901991
19921993
19941995
19961997
19981999
20002001
20022003
20042005
20062007
20082009
20102011
-0.04
-0.02
0
0.02
0.04
0.06
0.08
0.1
CPI 3-month 10-Year
Panic of 2008 ….
… and itsAftermath
Recurrent Crises Betray Structural WeaknessOf Financial System in Past Quarter-Century
UndercapitalizedBanks by BIS Standards
Mexican Peso Crisis and Orange County Bankruptcy
Thai Baht, RussianDefault, LTCM
Dot-Bomb;9/11

The Systemic Disruption of the Financial System Signals a Need for Structural Change
What is your judgment?
• To what degree should we ‘allow the markets to correct themselves’?• What is the appropriate level of oversight on banking and credit?• How do you connect the dots?

Complexity Theory Teaches Us About “Exponential Growth”

Maturation
• Organic adaptation to habitat and “unfolding” of system potential
• Keys: resource availability; system interactions; definition of niche; sustainability
• Behavior modeled on ecology (related to economy• Science: Biology• Applications: Highest and best use; segment growth
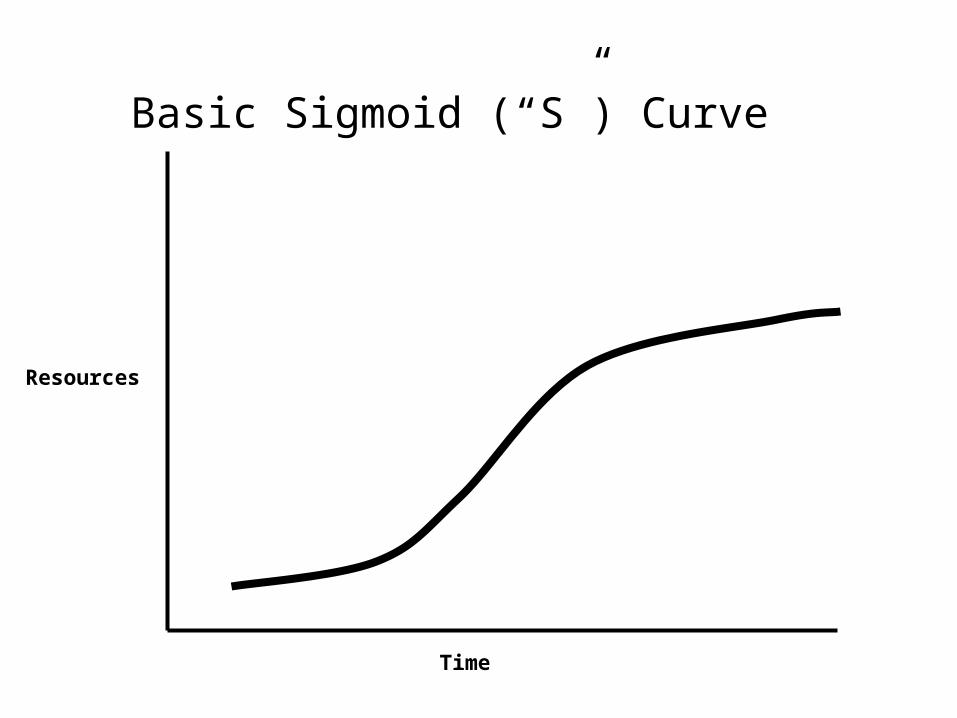
Time
Resources
Basic Sigmoid (“S”) Curve

Changes of State
• Fundamental yet short-run (potentially reversible) alteration of system conditions
• Keys: volatility of system; knowledge of critical points; boundary conditions affecting control; external pressures
• Behaviors radically changed though basic elements may be constant
• Science: molecular structure; chemistry• Applications: Liquidity conditions; “tenant/landlords
markets”

Changes of State
Vacancy
Rent
low
high
high
Landlord’s Market
Tenant’s Market

Trends
• Long-term shifts in system• Keys: fundamental but gradual alterations of
quality/quantity of system elements• Behavior can be constructed along the lines of
Newton’s Laws of Motion: interia; entropy• Science: Classical Physics• Applications: demography; occupational/industry
structural change
Try a Thought ExperimentThink of Miami in 2022:
Is it different from today? How?• Demographically
• Economically
• Ecologically
• As a community
• As a real estate market

Don’t Despair: Complexity Can Yield Beautiful Results

May Your 2012 – However Complex and Changing – Be a Path of Beauty!
Related Documents