19 CHAPTER 2 Financial Statements and Analysis INSTRUCTOR’S RESOURCES Overview This chapter examines the key components to the stockholders' report: the income statement, balance sheet, statement of retained earnings, and the statement of cash flows. On the income statement and balance sheet, the major accounts/balances are reviewed for the student. The rules for consolidating a company's foreign and domestic financial statements (FASB No. 52) are described. Following the financial statement coverage the chapter covers the evaluation of financial statements using the technique of ratio analysis. Ratio analysis is used by prospective shareholders, creditors, and the firm's own management to measure the firm's operating and financial health. Three types of comparative analysis are defined: cross-sectional analysis, time-series analysis, and combined analysis. The ratios are divided into five basic categories: liquidity, activity, debt, profitability, and market. Each ratio is defined and calculated using the financial statements of the Bartlett Company. A brief explanation of the implications of deviation from industry standard ratios is offered, with a complete (cross-sectional and time-series) ratio analysis of Bartlett Company ending the chapter. The DuPont system of analysis is also integrated into the example. PMF Tutor: Financial Ratios This section of the Gitman Tutor generates problems to give the student practice calculating liquidity, activity, debt, profitability, and market ratios. PMF Problem-Solver: Financial Ratios This module allows the student to compute all the financial ratios described in the text. There are three options: all ratios, families of ratios, and individual ratios.

managerial finance 10th editio by gitman
Jan 19, 2015
Welcome message from author
This document is posted to help you gain knowledge. Please leave a comment to let me know what you think about it! Share it to your friends and learn new things together.
Transcript
19
CHAPTER 2
Financial Statements
and Analysis INSTRUCTOR’S RESOURCES
Overview
This chapter examines the key components to the stockholders' report: the income statement, balance sheet, statement of retained earnings, and the statement of cash flows. On the income statement and balance sheet, the major accounts/balances are reviewed for the student. The rules for consolidating a company's foreign and domestic financial statements (FASB No. 52) are described. Following the financial statement coverage the chapter covers the evaluation of financial statements using the technique of ratio analysis. Ratio analysis is used by prospective shareholders, creditors, and the firm's own management to measure the firm's operating and financial health. Three types of comparative analysis are defined: cross-sectional analysis, time-series analysis, and combined analysis. The ratios are divided into five basic categories: liquidity, activity, debt, profitability, and market. Each ratio is defined and calculated using the financial statements of the Bartlett Company. A brief explanation of the implications of deviation from industry standard ratios is offered, with a complete (cross-sectional and time-series) ratio analysis of Bartlett Company ending the chapter. The DuPont system of analysis is also integrated into the example. PMF Tutor: Financial Ratios
This section of the Gitman Tutor generates problems to give the student practice calculating liquidity, activity, debt, profitability, and market ratios. PMF Problem-Solver: Financial Ratios
This module allows the student to compute all the financial ratios described in the text. There are three options: all ratios, families of ratios, and individual ratios.
Part 1 Introduction to Managerial Finance
20
PMF Templates
Spreadsheet templates are provided for the following problems: Problem Topic Problem 2-4 Calculation of EPS and retained earnings Problem 2-5 Balance sheet preparation Problem 2-6 Impact of net income on a firm’s balance sheet Problem 2-8 Statement of retained earnings Problem 2-15 Debt analysis Study Guide
Suggested Study Guide examples for classroom presentation: Example Topic
1 Basic ratio calculation 2 Common-size income statement 3 Evaluating ratios
Chapter 2 Financial Statements and Analysis
21
ANSWERS TO REVIEW QUESTIONS
2-1 The purpose of each of the 4 major financial statements are:
Income Statement - The purpose of the income statement is to provide a financial summary of the firm’s operating results during a specified time period. It includes both the sales for the firm and the costs incurred in generating those sales. Other expenses, such as taxes, are also included on this statement.
Balance Sheet – The purpose of the balance sheet is to present a summary of the assets owned by the firm, the liabilities owed by the firm, and the net financial position of the owners as of a given point in time. The assets are often referred to as investments and the liabilities and owners equity as financing.
Statement of Retained Earnings - This statement reconciles the net income earned during the year, and any cash dividends paid, with the change in retained earnings during the year.
Statement of Cash Flows - This statement provides a summary of the cash inflows and the cash outflows experienced by the firm during the period of concern. The inflows and outflows are grouped into the cash flow areas of operations, investment, and financing.
2-2 The notes to the financial statements are important because they provide detailed
information not directly available in the financial statements. The footnotes provide information on accounting policies, procedures, calculation, and transactions underlying entries in the financial statements.
2-3 Financial Accounting Standards Board Statement No. 52 describes the rules for
consolidating a company's foreign and domestic financial statements. It requires U.S.-based companies to translate foreign-currency-denominated assets and liabilities into U.S. dollars using the current rate (translation) method. This method uses the exchange rate prevailing on the date the fiscal year ends (the current rate). Income statement items can be translated using either the current rate or an average exchange rate for the period covered by the statement. Equity accounts are converted at the exchange rate on the date of the investment. In the retained earnings account any gains and losses from currency fluctuations are
stated separately in an equity reserve accountthe cumulative translation
adjustment accountand not realized until the parent company sells or closes the foreign operations.
2-4 Current and prospective shareholders place primary emphasis on the firm's
current and future level of risk and return as measures of profitability, while creditors are more concerned with short-term liquidity measures of debt. Stockholders are, therefore, most interested in income statement measures, and creditors are most concerned with balance sheet measures. Management is
Part 1 Introduction to Managerial Finance
22
concerned with all ratio measures, since they recognize that stockholders and creditors must see good ratios in order to keep the stock price up and raise new funds.
2-5 Cross-sectional comparisons are made by comparing similar ratios for firms
within the same industry, or to an industry average, as of some point in time. Time-series comparisons are made by comparing similar ratios for a firm measured at various points in time. Benchmarking is the term used to describe this cross-sectional comparison with competitor firms.
2-6 The analyst should devote primary attention to any significant deviations from the
norm, whether above or below. Positive deviations from the norm are not necessarily favorable. An above-normal inventory turnover ratio may indicate highly efficient inventory management but may also reveal excessively low inventory levels resulting in stockouts. Further examination into the deviation would be required.
2-7 Comparing financial statements from different points in the year can result in
inaccurate and misleading analysis due to the effects of seasonality. Levels of current assets can fluctuate significantly, depending on a company's business, so statements from the same month or year end should be used in the analysis to ensure valid comparisons of performance.
2-8 The current ratio proves to be the better liquidity measure when all of the firm’s
current assets are reasonably liquid. The quick ratios would prove to be the superior measure if the inventory of the firm is considered to lack the ability to be easily converted into cash.
2-9 Additional information is necessary to assess how well a firm collects receivables
and meets payables. The average collection period of receivables should be compared to a firm's own credit terms. The average payment period should be compared to the creditors' credit terms.
2-10 Financial leverage is the term used to describe the magnification of risk and
return introduced through the use of fixed-cost financing, such as debt and preferred stock.
2-11 The debt ratio and the debt-equity ratio may be used to measure the firm's degree
of indebtedness. The times-interest-earned and the fixed-payment coverage ratios can be used to assess the firm's ability to meet fixed payments associated with debt.
2-12 Three ratios of profitability found on a common-size income statement are: (1)
the gross profit margin, (2) the operating profit margin, and (3) the net profit margin.
Chapter 2 Financial Statements and Analysis
23
2-13 Firms that have high gross profit margins and low net profit margins have high levels of expenses other than cost of goods sold. In this case, the high expenses more than compensate for the low cost of goods sold (i.e., high gross profit margin) thereby resulting in a low net profit margin.
2-14 The owners are probably most interested in the Return on Equity (ROE) since it
indicates the rate of return they earn on their investment in the firm. ROE is calculated by taking net profits after taxes and dividing by stockholders' equity.
2-15 The price-earnings ratio (P/E) is the market price per share of common stock
divided by the earnings per share. It indicates the amount the investor is willing to pay for each dollar of earnings. It is used to assess the owner's appraisal of the value of the firm's earnings. The level of the P/E ratio indicates the degree of confidence that investors have in the firm's future. The market/book (M/B) ratio is the market price per of common stock divided by the firm’s book value per share. Firms with high M/B ratios are expected to perform better than firms with lower relative M/B values.
2-16 Liquidity ratios measure how well the firm can meet its current (short-term)
obligations when they come due.
Activity ratios are used to measure the speed with which various accounts are converted (or could be converted) into cash or sales.
Debt ratios measure how much of the firm is financed with other people's money and the firm's ability to meet fixed charges.
Profitability ratios measure a firm's return with respect to sales, assets, or equity (overall performance).
Market ratios give insight into how well investors in the marketplace feel the firm is doing in terms of return and risk.
The liquidity and debt ratios are most important to present and prospective creditors.
2-17 The analyst may approach a complete ratio analysis on either a cross-sectional or
time-series basis by summarizing the ratios into their five key areas: liquidity, activity, debt, profitability, and market. Each of the key areas could then be summarized, highlighting specific ratios that should be investigated.
2-18 The DuPont system of analysis combines profitability (the net profit margin),
asset efficiency (the total asset turnover) and leverage (the debt ratio). The

Part 1 Introduction to Managerial Finance
24
division of ROE among these three ratios allows the analyst to the segregate the specific factors that are contributing to the ROE into profitability, asset efficiency, or the use of debt.
Chapter 2 Financial Statements and Analysis
25
SOLUTIONS TO PROBLEMS
2-1 LG 1: Reviewing Basic Financial Statements
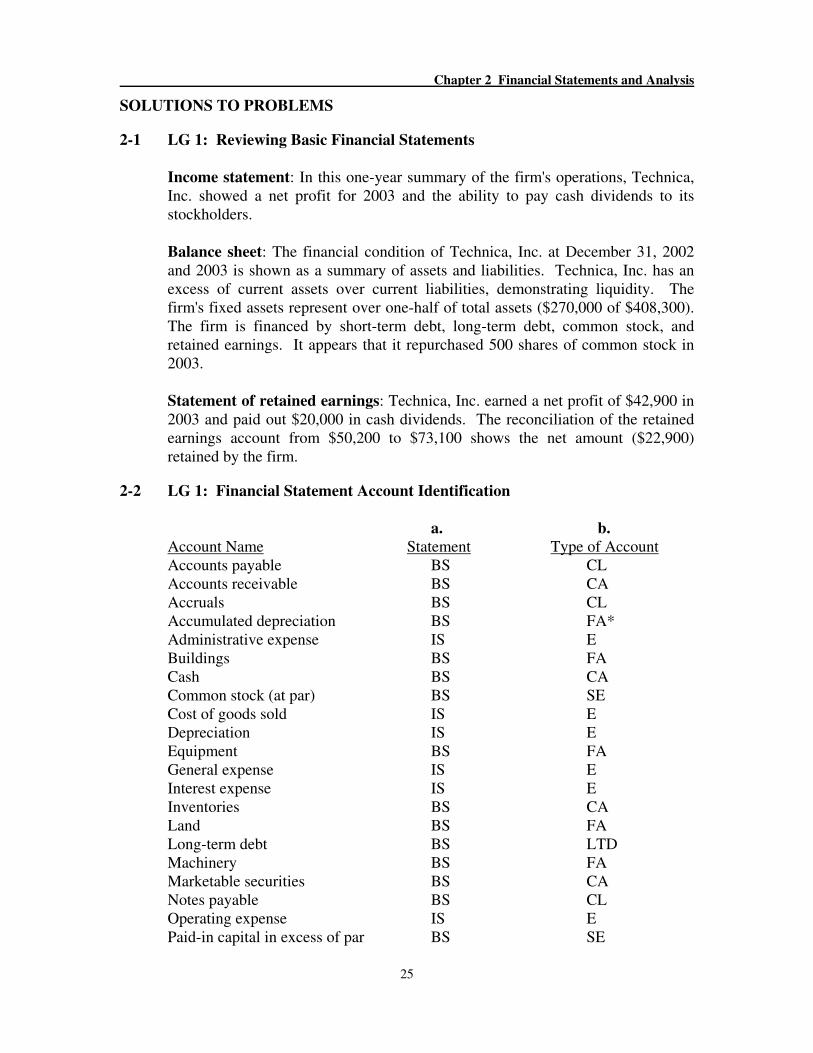
Income statement: In this one-year summary of the firm's operations, Technica, Inc. showed a net profit for 2003 and the ability to pay cash dividends to its stockholders.
Balance sheet: The financial condition of Technica, Inc. at December 31, 2002 and 2003 is shown as a summary of assets and liabilities. Technica, Inc. has an excess of current assets over current liabilities, demonstrating liquidity. The firm's fixed assets represent over one-half of total assets ($270,000 of $408,300). The firm is financed by short-term debt, long-term debt, common stock, and retained earnings. It appears that it repurchased 500 shares of common stock in 2003.
Statement of retained earnings: Technica, Inc. earned a net profit of $42,900 in 2003 and paid out $20,000 in cash dividends. The reconciliation of the retained earnings account from $50,200 to $73,100 shows the net amount ($22,900) retained by the firm.
2-2 LG 1: Financial Statement Account Identification
a. b.
Account Name Statement Type of Account Accounts payable BS CL Accounts receivable BS CA Accruals BS CL Accumulated depreciation BS FA* Administrative expense IS E Buildings BS FA Cash BS CA Common stock (at par) BS SE Cost of goods sold IS E Depreciation IS E Equipment BS FA General expense IS E Interest expense IS E Inventories BS CA Land BS FA Long-term debt BS LTD Machinery BS FA Marketable securities BS CA Notes payable BS CL Operating expense IS E Paid-in capital in excess of par BS SE
Part 1 Introduction to Managerial Finance
26
a. b.
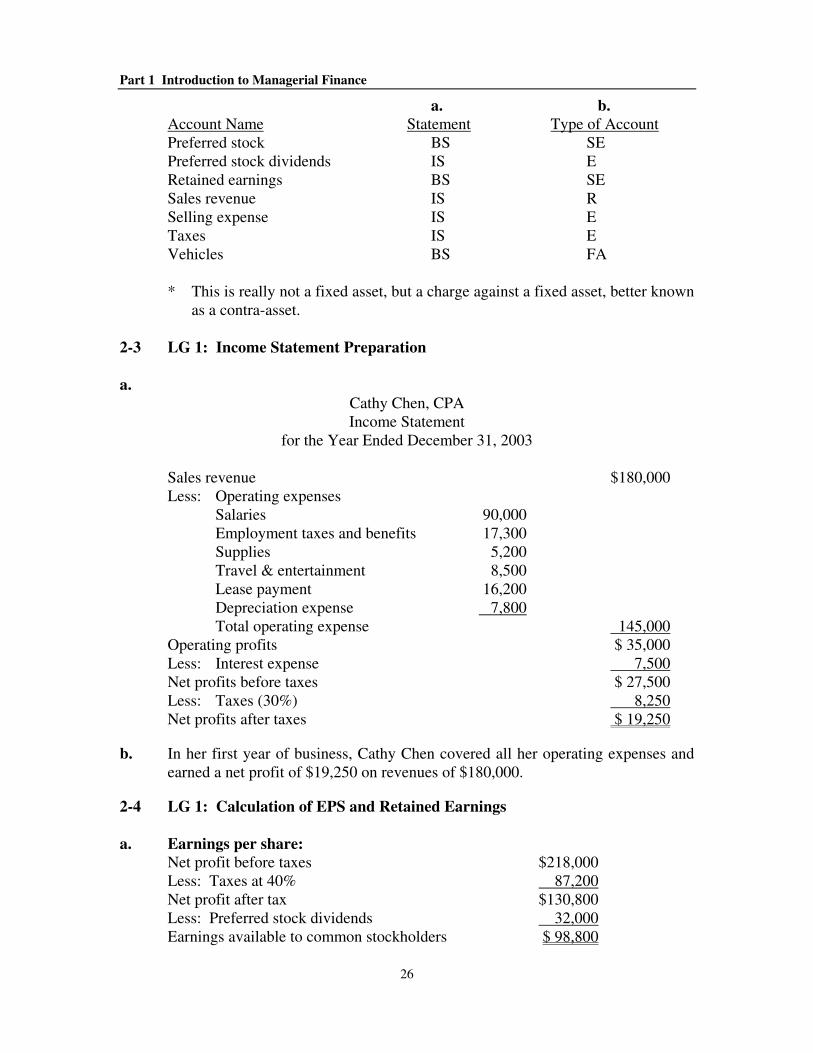
Account Name Statement Type of Account Preferred stock BS SE Preferred stock dividends IS E Retained earnings BS SE Sales revenue IS R Selling expense IS E Taxes IS E Vehicles BS FA
* This is really not a fixed asset, but a charge against a fixed asset, better known
as a contra-asset. 2-3 LG 1: Income Statement Preparation
a.
Cathy Chen, CPA Income Statement
for the Year Ended December 31, 2003
Sales revenue $180,000 Less: Operating expenses
Salaries 90,000 Employment taxes and benefits 17,300 Supplies 5,200 Travel & entertainment 8,500 Lease payment 16,200 Depreciation expense 7,800 Total operating expense 145,000
Operating profits $ 35,000 Less: Interest expense 7,500 Net profits before taxes $ 27,500 Less: Taxes (30%) 8,250 Net profits after taxes $ 19,250
b. In her first year of business, Cathy Chen covered all her operating expenses and earned a net profit of $19,250 on revenues of $180,000.
2-4 LG 1: Calculation of EPS and Retained Earnings
a. Earnings per share:
Net profit before taxes $218,000 Less: Taxes at 40% 87,200 Net profit after tax $130,800 Less: Preferred stock dividends 32,000 Earnings available to common stockholders $ 98,800
Chapter 2 Financial Statements and Analysis
27
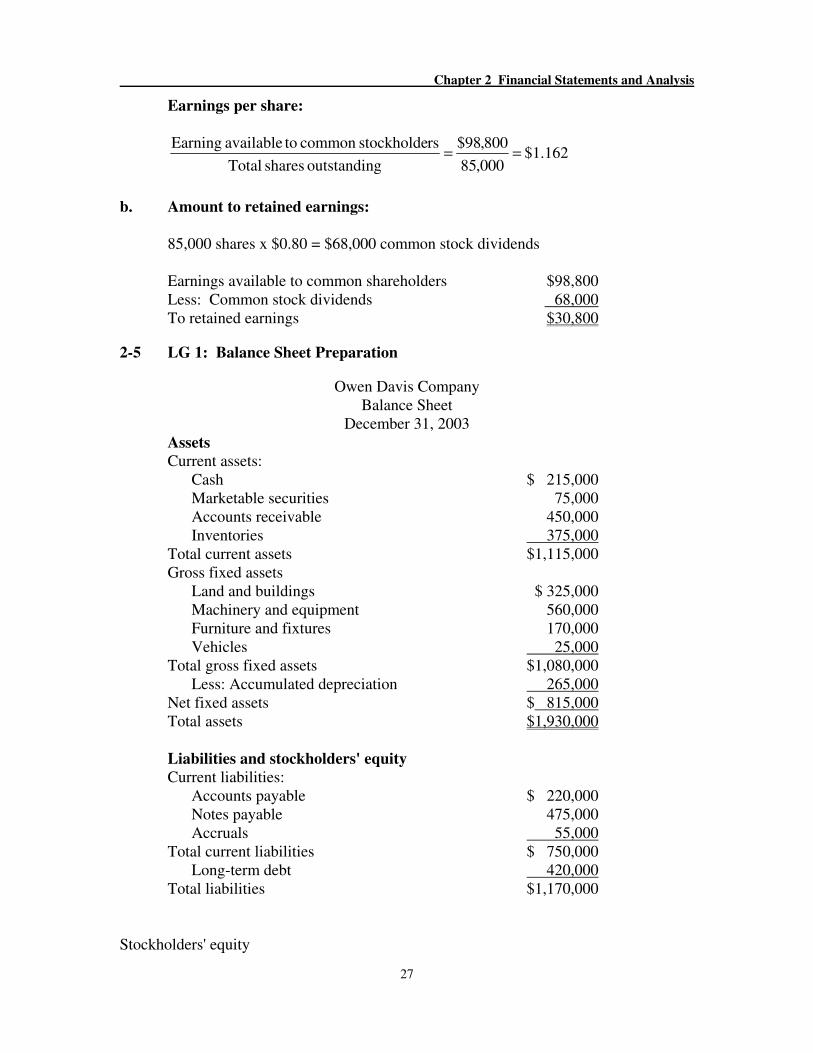
Earnings per share:
162.1$000,85
800,98$
goutstandin shares Total
rsstockholdecommon toavailable Earning==
b. Amount to retained earnings:
85,000 shares x $0.80 = $68,000 common stock dividends
Earnings available to common shareholders $98,800 Less: Common stock dividends 68,000 To retained earnings $30,800
2-5 LG 1: Balance Sheet Preparation
Owen Davis Company Balance Sheet
December 31, 2003 Assets
Current assets: Cash $ 215,000 Marketable securities 75,000 Accounts receivable 450,000 Inventories 375,000
Total current assets $1,115,000 Gross fixed assets
Land and buildings $ 325,000 Machinery and equipment 560,000 Furniture and fixtures 170,000 Vehicles 25,000
Total gross fixed assets $1,080,000 Less: Accumulated depreciation 265,000
Net fixed assets $ 815,000 Total assets $1,930,000
Liabilities and stockholders' equity
Current liabilities: Accounts payable $ 220,000 Notes payable 475,000 Accruals 55,000
Total current liabilities $ 750,000 Long-term debt 420,000
Total liabilities $1,170,000 Stockholders' equity
Part 1 Introduction to Managerial Finance
28
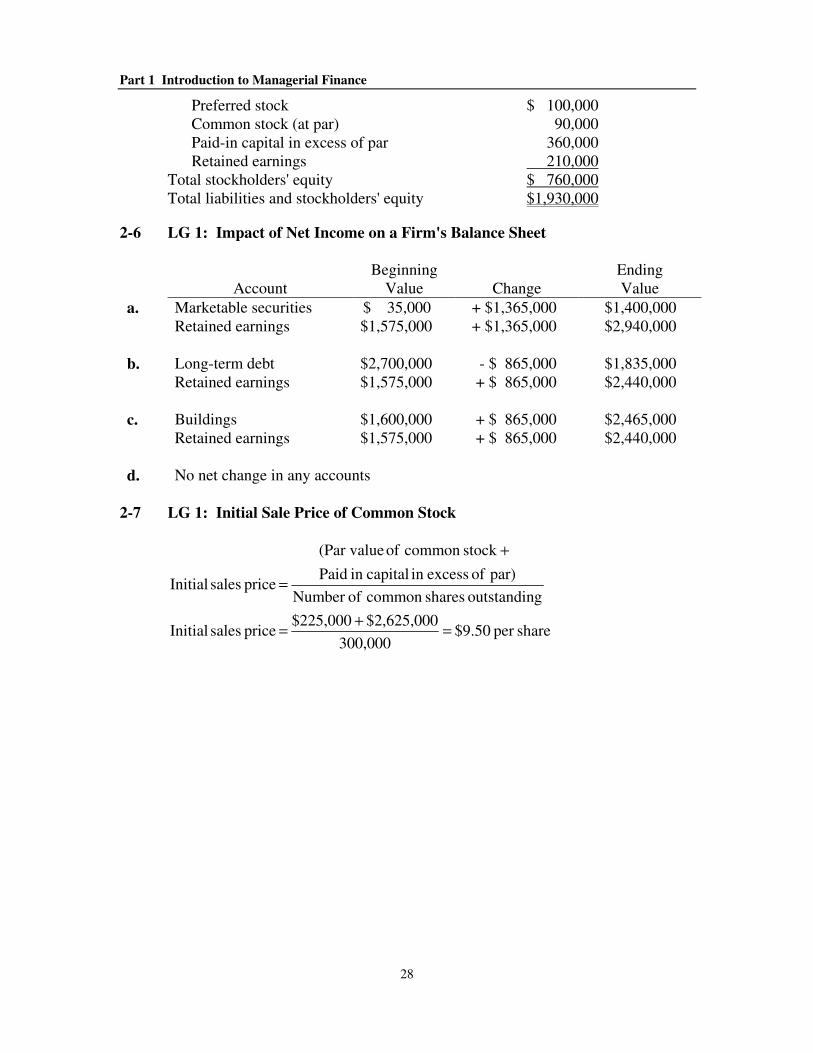
Preferred stock $ 100,000 Common stock (at par) 90,000 Paid-in capital in excess of par 360,000 Retained earnings 210,000
Total stockholders' equity $ 760,000 Total liabilities and stockholders' equity $1,930,000
2-6 LG 1: Impact of Net Income on a Firm's Balance Sheet
Account
Beginning Value
Change
Ending Value
a. Marketable securities $ 35,000 + $1,365,000 $1,400,000 Retained earnings $1,575,000 + $1,365,000 $2,940,000
b. Long-term debt $2,700,000 - $ 865,000 $1,835,000 Retained earnings $1,575,000 + $ 865,000 $2,440,000 c. Buildings $1,600,000 + $ 865,000 $2,465,000 Retained earnings $1,575,000 + $ 865,000 $2,440,000 d. No net change in any accounts
2-7 LG 1: Initial Sale Price of Common Stock
shareper 50.9$300,000
$2,625,000 $225,000 price sales Initial
goutstandin sharescommon ofNumber
par) of excessin capitalin Paid
stock common of (Par value
price sales Initial
=+
=
+
=
Chapter 2 Financial Statements and Analysis
29
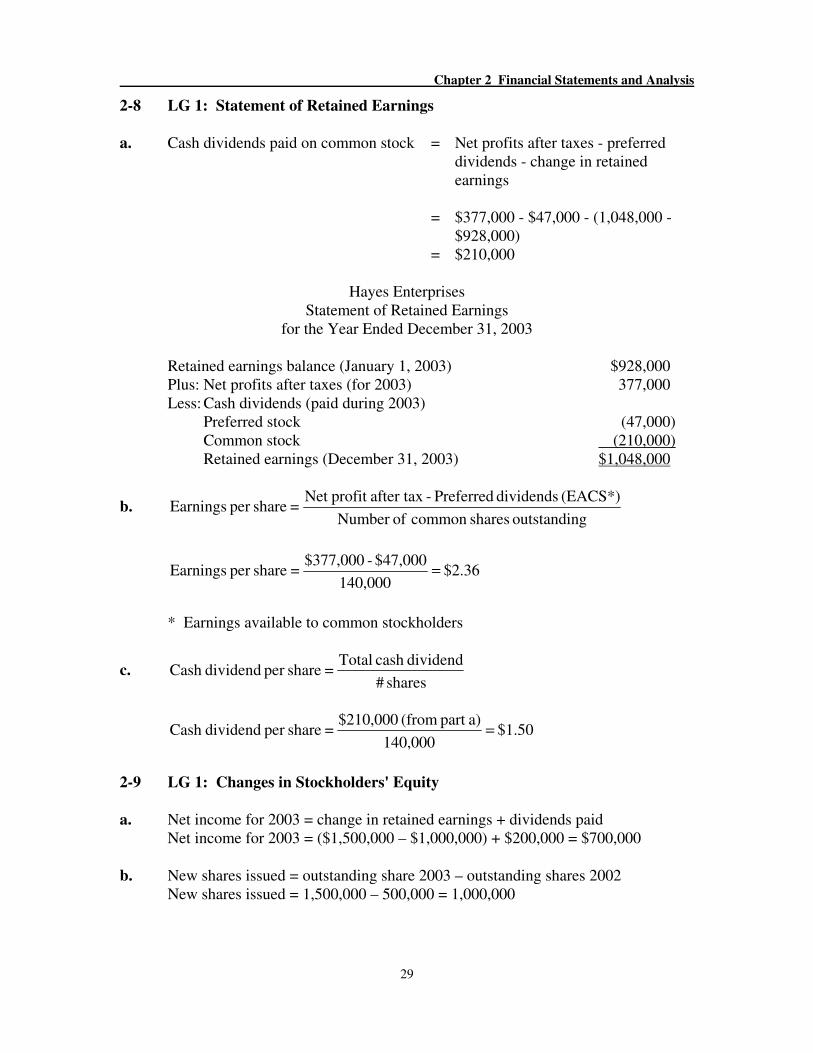
2-8 LG 1: Statement of Retained Earnings
a. Cash dividends paid on common stock = Net profits after taxes - preferred
dividends - change in retained earnings
= $377,000 - $47,000 - (1,048,000 -
$928,000) = $210,000
Hayes Enterprises
Statement of Retained Earnings for the Year Ended December 31, 2003
Retained earnings balance (January 1, 2003) $928,000 Plus: Net profits after taxes (for 2003) 377,000 Less: Cash dividends (paid during 2003)
Preferred stock (47,000) Common stock (210,000) Retained earnings (December 31, 2003) $1,048,000
b. goutstandin sharescommon ofNumber
(EACS*) dividends Preferred -after tax profit Net =shareper Earnings
36.2$140,000
$47,000 - $377,000=shareper Earnings =
* Earnings available to common stockholders
c. shares #
dividendcash Total=shareper dividendCash
50.1$140,000
a)part (from $210,000=shareper dividendCash =
2-9 LG 1: Changes in Stockholders' Equity a. Net income for 2003 = change in retained earnings + dividends paid
Net income for 2003 = ($1,500,000 – $1,000,000) + $200,000 = $700,000 b. New shares issued = outstanding share 2003 – outstanding shares 2002
New shares issued = 1,500,000 – 500,000 = 1,000,000
Part 1 Introduction to Managerial Finance
30
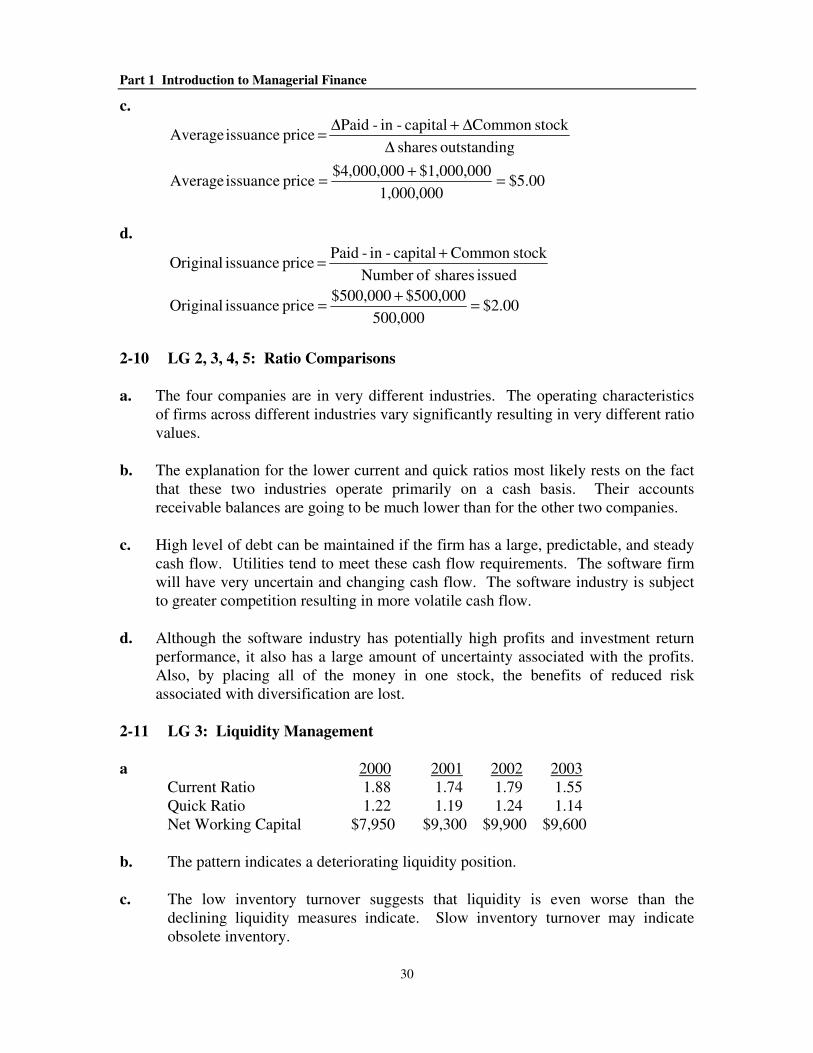
c.
00.5$1,000,000
$1,000,000$4,000,000price issuance Average
goutstandin shares
stockommon Ccapital-in-Paid price issuance Average
=+
=
∆
∆+∆=
d.
00.2$500,000
$500,000$500,000price issuance Original
issued shares ofNumber
stockommon Ccapital-in-Paid price issuance riginalO
=+
=
+=
2-10 LG 2, 3, 4, 5: Ratio Comparisons
a. The four companies are in very different industries. The operating characteristics
of firms across different industries vary significantly resulting in very different ratio values.
b. The explanation for the lower current and quick ratios most likely rests on the fact
that these two industries operate primarily on a cash basis. Their accounts receivable balances are going to be much lower than for the other two companies.
c. High level of debt can be maintained if the firm has a large, predictable, and steady
cash flow. Utilities tend to meet these cash flow requirements. The software firm will have very uncertain and changing cash flow. The software industry is subject to greater competition resulting in more volatile cash flow.
d. Although the software industry has potentially high profits and investment return
performance, it also has a large amount of uncertainty associated with the profits. Also, by placing all of the money in one stock, the benefits of reduced risk associated with diversification are lost.
2-11 LG 3: Liquidity Management
a 2000 2001 2002 2003
Current Ratio 1.88 1.74 1.79 1.55 Quick Ratio 1.22 1.19 1.24 1.14 Net Working Capital $7,950 $9,300 $9,900 $9,600
b. The pattern indicates a deteriorating liquidity position. c. The low inventory turnover suggests that liquidity is even worse than the
declining liquidity measures indicate. Slow inventory turnover may indicate obsolete inventory.
Chapter 2 Financial Statements and Analysis
31
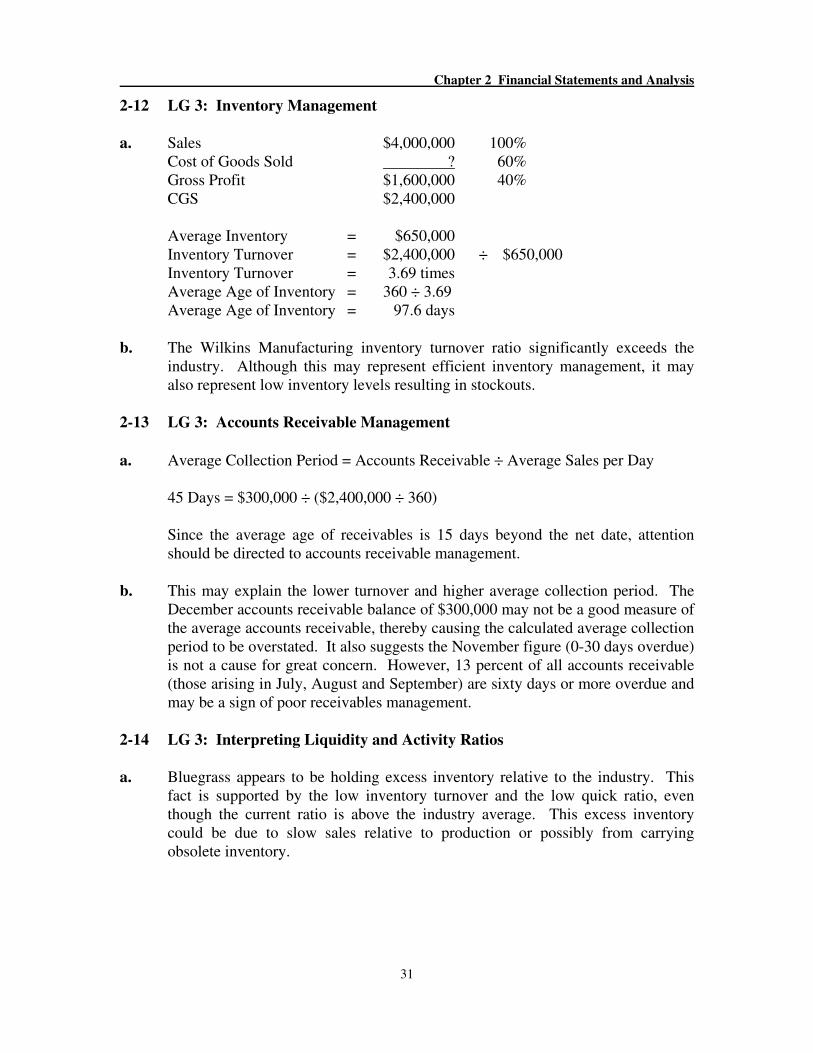
2-12 LG 3: Inventory Management
a. Sales $4,000,000 100%
Cost of Goods Sold ? 60% Gross Profit $1,600,000 40% CGS $2,400,000
Average Inventory = $650,000 Inventory Turnover = $2,400,000 ÷ $650,000 Inventory Turnover = 3.69 times Average Age of Inventory = 360 ÷ 3.69 Average Age of Inventory = 97.6 days
b. The Wilkins Manufacturing inventory turnover ratio significantly exceeds the
industry. Although this may represent efficient inventory management, it may also represent low inventory levels resulting in stockouts.
2-13 LG 3: Accounts Receivable Management
a. Average Collection Period = Accounts Receivable ÷ Average Sales per Day
45 Days = $300,000 ÷ ($2,400,000 ÷ 360)
Since the average age of receivables is 15 days beyond the net date, attention should be directed to accounts receivable management.
b. This may explain the lower turnover and higher average collection period. The
December accounts receivable balance of $300,000 may not be a good measure of the average accounts receivable, thereby causing the calculated average collection period to be overstated. It also suggests the November figure (0-30 days overdue) is not a cause for great concern. However, 13 percent of all accounts receivable (those arising in July, August and September) are sixty days or more overdue and may be a sign of poor receivables management.
2-14 LG 3: Interpreting Liquidity and Activity Ratios
a. Bluegrass appears to be holding excess inventory relative to the industry. This
fact is supported by the low inventory turnover and the low quick ratio, even though the current ratio is above the industry average. This excess inventory could be due to slow sales relative to production or possibly from carrying obsolete inventory.
Part 1 Introduction to Managerial Finance
32
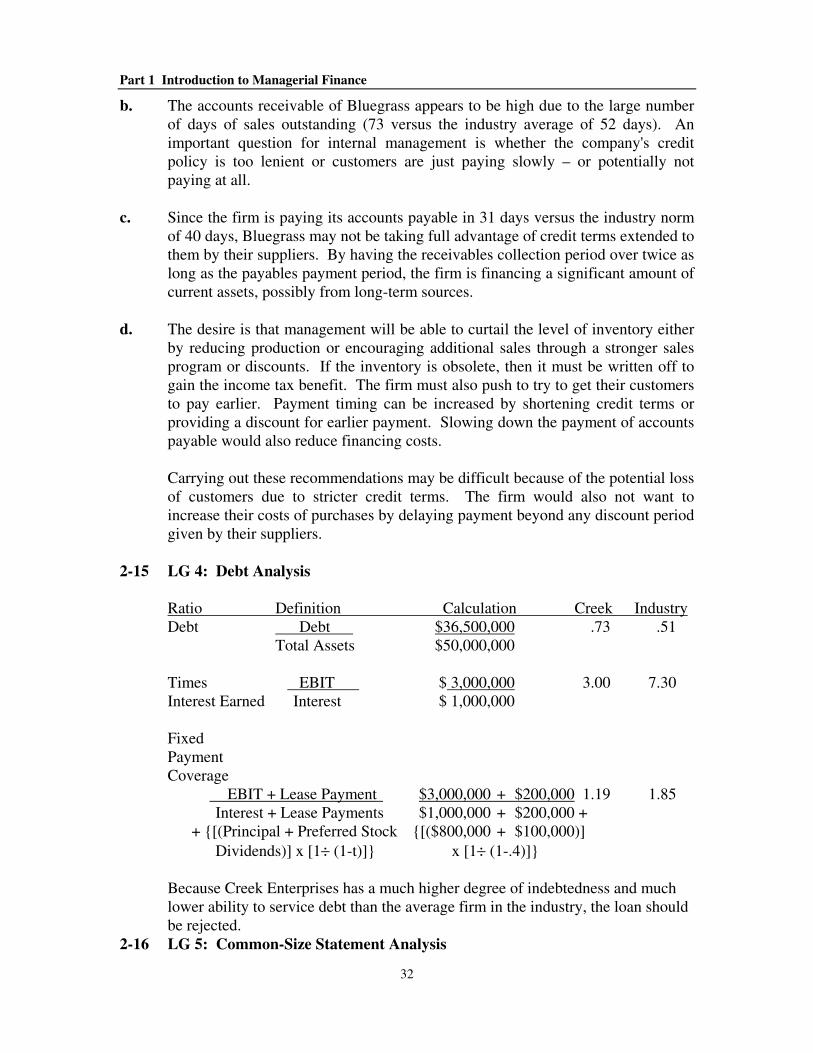
b. The accounts receivable of Bluegrass appears to be high due to the large number of days of sales outstanding (73 versus the industry average of 52 days). An important question for internal management is whether the company's credit policy is too lenient or customers are just paying slowly – or potentially not paying at all.
c. Since the firm is paying its accounts payable in 31 days versus the industry norm
of 40 days, Bluegrass may not be taking full advantage of credit terms extended to them by their suppliers. By having the receivables collection period over twice as long as the payables payment period, the firm is financing a significant amount of current assets, possibly from long-term sources.
d. The desire is that management will be able to curtail the level of inventory either
by reducing production or encouraging additional sales through a stronger sales program or discounts. If the inventory is obsolete, then it must be written off to gain the income tax benefit. The firm must also push to try to get their customers to pay earlier. Payment timing can be increased by shortening credit terms or providing a discount for earlier payment. Slowing down the payment of accounts payable would also reduce financing costs.
Carrying out these recommendations may be difficult because of the potential loss of customers due to stricter credit terms. The firm would also not want to increase their costs of purchases by delaying payment beyond any discount period given by their suppliers.
2-15 LG 4: Debt Analysis
Ratio Definition Calculation Creek Industry Debt Debt $36,500,000 .73 .51
Total Assets $50,000,000
Times EBIT $ 3,000,000 3.00 7.30 Interest Earned Interest $ 1,000,000
Fixed Payment Coverage
EBIT + Lease Payment $3,000,000 + $200,000 1.19 1.85 Interest + Lease Payments $1,000,000 + $200,000 +
+ {[(Principal + Preferred Stock {[($800,000 + $100,000)]
Dividends)] x [1÷ (1-t)]} x [1÷ (1-.4)]}
Because Creek Enterprises has a much higher degree of indebtedness and much lower ability to service debt than the average firm in the industry, the loan should be rejected.
2-16 LG 5: Common-Size Statement Analysis
Chapter 2 Financial Statements and Analysis
33
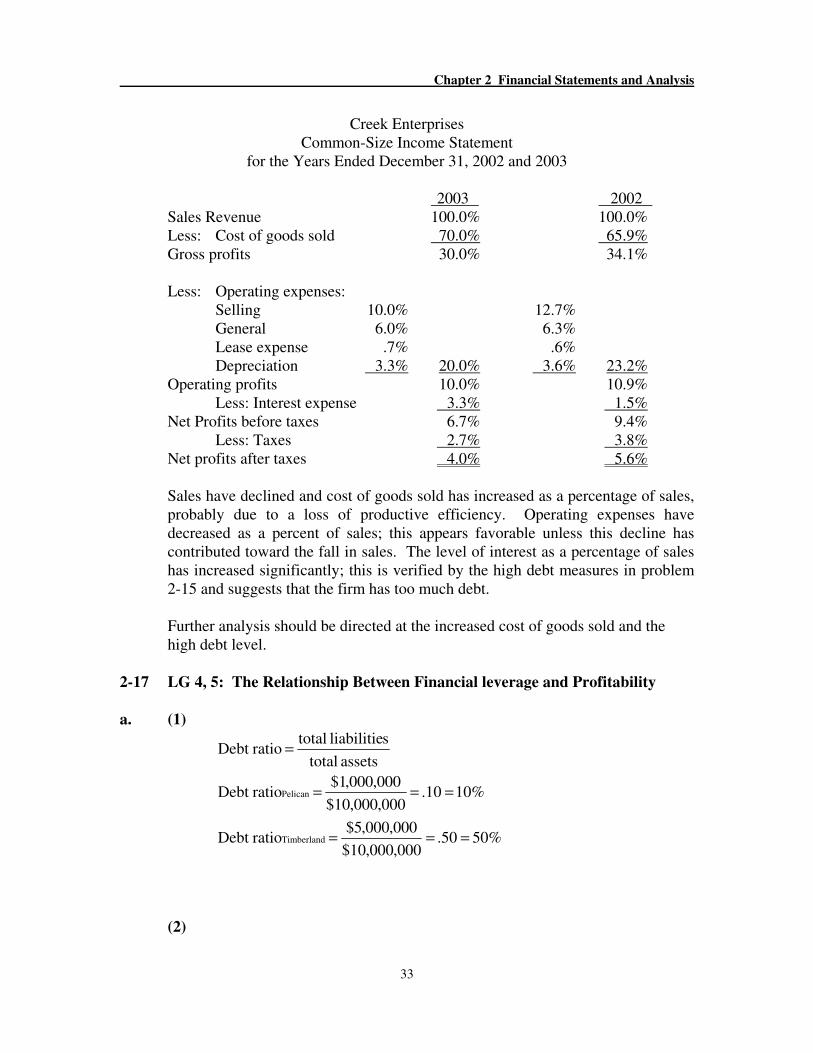
Creek Enterprises
Common-Size Income Statement for the Years Ended December 31, 2002 and 2003
2003 2002
Sales Revenue 100.0% 100.0% Less: Cost of goods sold 70.0% 65.9% Gross profits 30.0% 34.1%
Less: Operating expenses:
Selling 10.0% 12.7% General 6.0% 6.3% Lease expense .7% .6% Depreciation 3.3% 20.0% 3.6% 23.2%
Operating profits 10.0% 10.9% Less: Interest expense 3.3% 1.5%
Net Profits before taxes 6.7% 9.4% Less: Taxes 2.7% 3.8%
Net profits after taxes 4.0% 5.6%
Sales have declined and cost of goods sold has increased as a percentage of sales, probably due to a loss of productive efficiency. Operating expenses have decreased as a percent of sales; this appears favorable unless this decline has contributed toward the fall in sales. The level of interest as a percentage of sales has increased significantly; this is verified by the high debt measures in problem 2-15 and suggests that the firm has too much debt.
Further analysis should be directed at the increased cost of goods sold and the high debt level.
2-17 LG 4, 5: The Relationship Between Financial leverage and Profitability
a. (1)
%5050.000,000,10$
000,000,5$ratioDebt
%1010.000,000,10$
000,000,1$ratioDebt
assets total
sliabilitie total ratioDebt
Timberland
Pelican
===
===
=
(2)
Part 1 Introduction to Managerial Finance
34
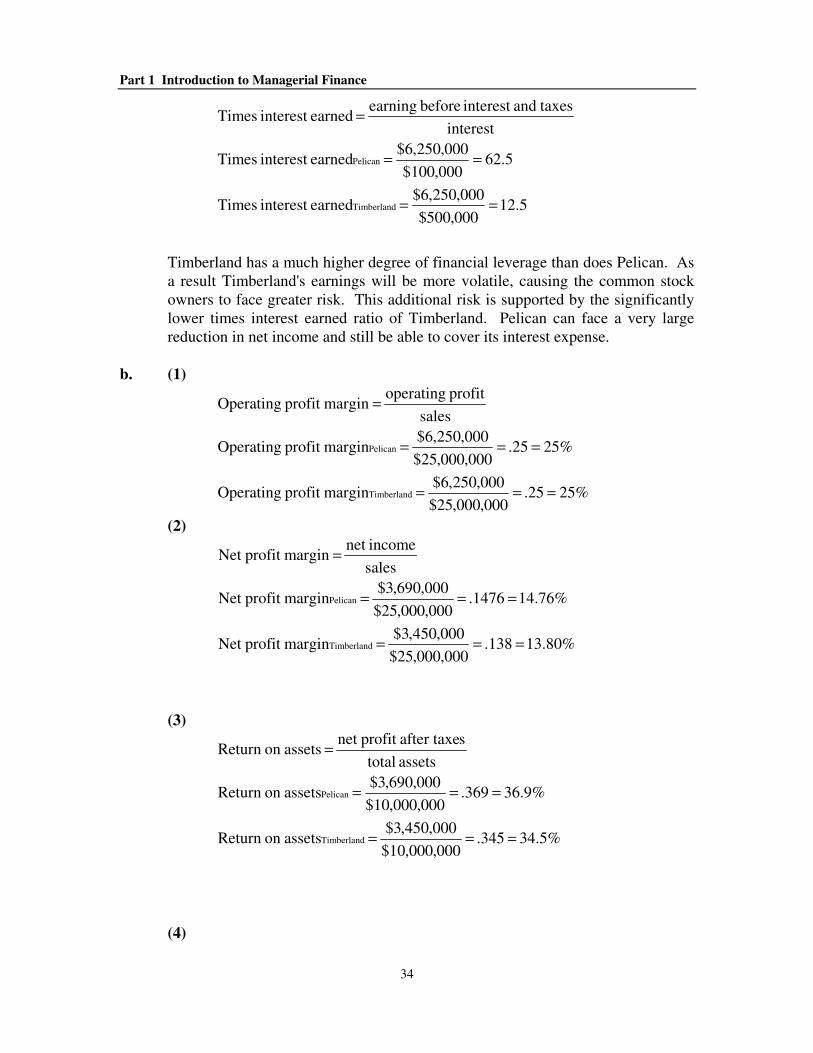
5.12000,500$
000,250,6$earnedinterest Times
5.62000,100$
000,250,6$earnedinterest Times
interest
taxesandinterest before earning earnedinterest Times
Timberland
Pelican
==
==
=
Timberland has a much higher degree of financial leverage than does Pelican. As a result Timberland's earnings will be more volatile, causing the common stock owners to face greater risk. This additional risk is supported by the significantly lower times interest earned ratio of Timberland. Pelican can face a very large reduction in net income and still be able to cover its interest expense.
b. (1)
%2525.000,000,25$
000,250,6$marginprofit Operating
%2525.000,000,25$
000,250,6$marginprofit Operating
sales
profit operating margin profit Operating
Timberland
Pelican
===
===
=
(2)
%80.13138.000,000,25$
000,450,3$marginprofit Net
%76.141476.000,000,25$
000,690,3$marginprofit Net
sales
incomenet margin profit Net
Timberland
Pelican
===
===
=
(3)
%5.34345.000,000,10$
000,450,3$assetson Return
%9.36369.000,000,10$
000,690,3$assetson Return
assets total
safter taxeprofit net assetson Return
Timberland
Pelican
===
===
=
(4)
Chapter 2 Financial Statements and Analysis
35
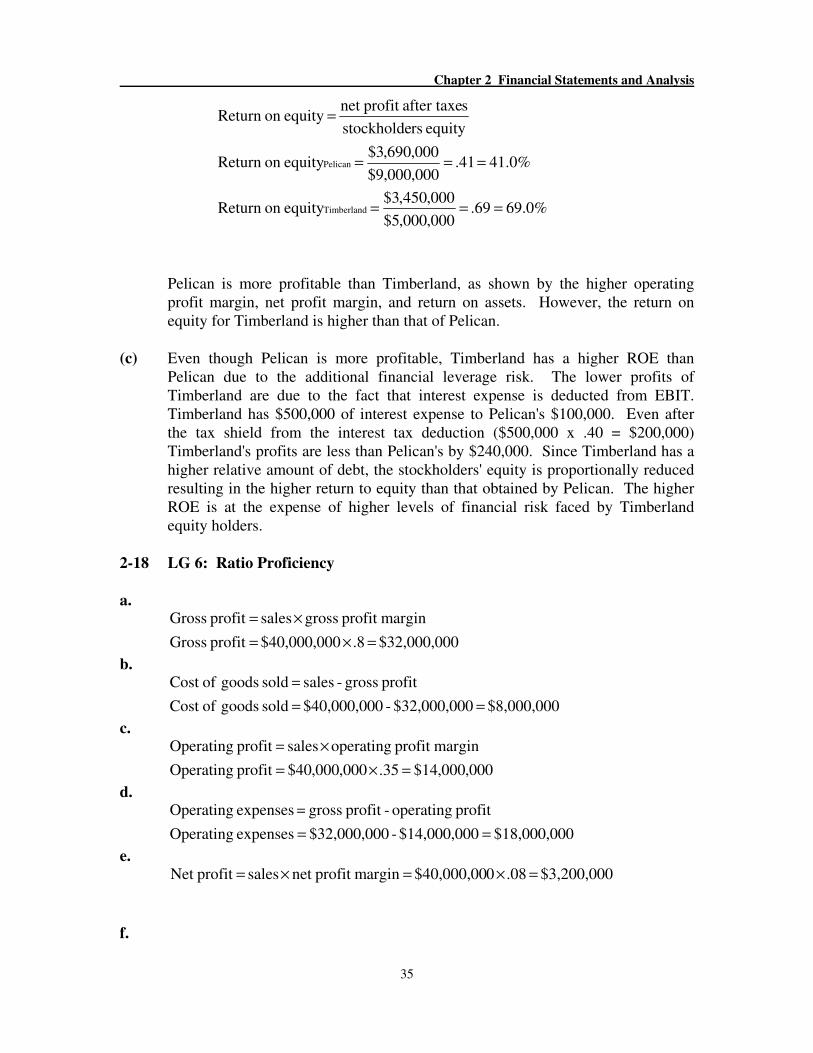
%0.6969.000,000,5$
000,450,3$equityon Return
%0.4141.000,000,9$
000,690,3$equityon Return
equity rsstockholde
safter taxeprofit net equity on Return
Timberland
Pelican
===
===
=
Pelican is more profitable than Timberland, as shown by the higher operating profit margin, net profit margin, and return on assets. However, the return on equity for Timberland is higher than that of Pelican.
(c) Even though Pelican is more profitable, Timberland has a higher ROE than
Pelican due to the additional financial leverage risk. The lower profits of Timberland are due to the fact that interest expense is deducted from EBIT. Timberland has $500,000 of interest expense to Pelican's $100,000. Even after the tax shield from the interest tax deduction ($500,000 x .40 = $200,000) Timberland's profits are less than Pelican's by $240,000. Since Timberland has a higher relative amount of debt, the stockholders' equity is proportionally reduced resulting in the higher return to equity than that obtained by Pelican. The higher ROE is at the expense of higher levels of financial risk faced by Timberland equity holders.
2-18 LG 6: Ratio Proficiency
a.
0$32,000,00 .8 0$40,000,00 profit Gross
marginprofit gross sales profit Gross
=×=
×=
b.
$8,000,000 0$32,000,00 - 0$40,000,00 sold goods ofCost
profit gross - sales sold goods ofCost
==
=
c.
000,000,14$35.000,000,40$profit Operating
marginprofit operating sales profit Operating
=×=
×=
d.
0$18,000,000$14,000,00-0$32,000,00expenses Operating
profit operating-profit gross expenses Operating
==
=
e.
$3,200,000 .08 0$40,000,00 margin profit net sales profit Net =×=×=
f.
Part 1 Introduction to Managerial Finance
36
0$20,000,00 2
0$40,000,00
overasset turn total
sales assets Total ===
g.
16,000,000$.20
$3,200,000
ROE
incomenet equity Total ===
h.
104,911,6$111,111$2.62360
0$40,000,0062.2days receivable Accounts
365
sales period collection average receivable Accounts
=×=×=
×=
2-19 LG 6: Cross-Sectional Ratio Analysis
a. Fox Manufacturing Company
Ratio Analysis
Industry Average Actual 2003 2003
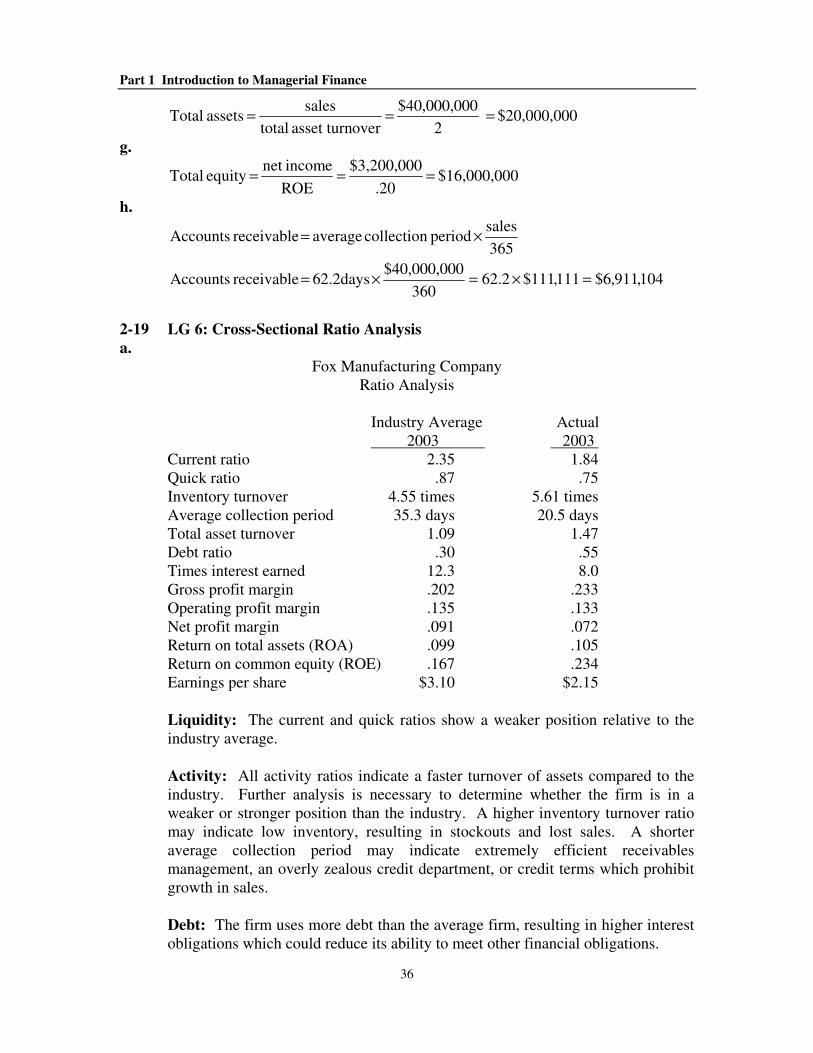
Current ratio 2.35 1.84 Quick ratio .87 .75 Inventory turnover 4.55 times 5.61 times Average collection period 35.3 days 20.5 days Total asset turnover 1.09 1.47 Debt ratio .30 .55 Times interest earned 12.3 8.0 Gross profit margin .202 .233 Operating profit margin .135 .133 Net profit margin .091 .072 Return on total assets (ROA) .099 .105 Return on common equity (ROE) .167 .234 Earnings per share $3.10 $2.15
Liquidity: The current and quick ratios show a weaker position relative to the industry average.
Activity: All activity ratios indicate a faster turnover of assets compared to the industry. Further analysis is necessary to determine whether the firm is in a weaker or stronger position than the industry. A higher inventory turnover ratio may indicate low inventory, resulting in stockouts and lost sales. A shorter average collection period may indicate extremely efficient receivables management, an overly zealous credit department, or credit terms which prohibit growth in sales.
Debt: The firm uses more debt than the average firm, resulting in higher interest obligations which could reduce its ability to meet other financial obligations.
Chapter 2 Financial Statements and Analysis
37
Profitability: The firm has a higher gross profit margin than the industry, indicating either a higher sales price or a lower cost of goods sold. The operating profit margin is in line with the industry, but the net profit margin is lower than industry, an indication that expenses other than cost of goods sold are higher than the industry. Most likely, the damaging factor is high interest expenses due to a greater than average amount of debt. The increased leverage, however, magnifies the return the owners receive, as evidenced by the superior ROE.
b. Fox Manufacturing Company needs improvement in its liquidity ratios and
possibly a reduction in its total liabilities. The firm is more highly leveraged than the average firm in its industry and, therefore, has more financial risk. The profitability of the firm is lower than average but is enhanced by the use of debt in the capital structure, resulting in a superior ROE.
2-20 LG 6: Financial Statement Analysis
a.
Ratio Analysis Zach Industries
Industry Actual Actual Average 2002 2003
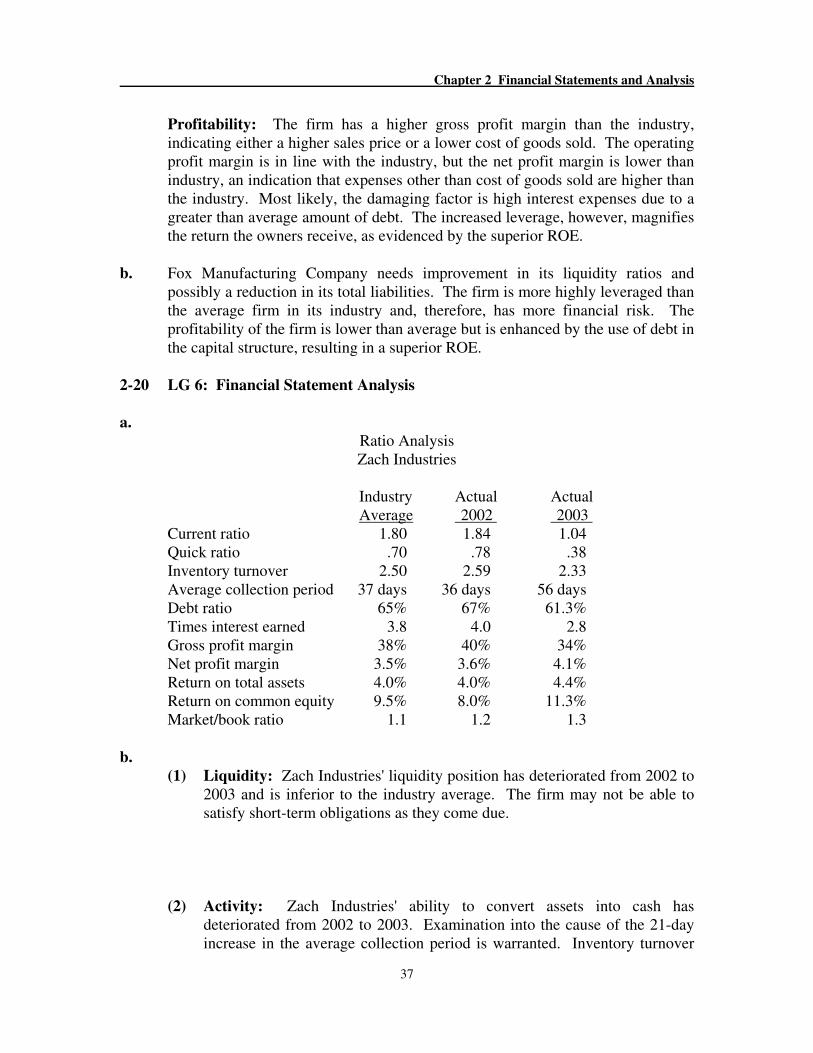
Current ratio 1.80 1.84 1.04 Quick ratio .70 .78 .38 Inventory turnover 2.50 2.59 2.33 Average collection period 37 days 36 days 56 days Debt ratio 65% 67% 61.3% Times interest earned 3.8 4.0 2.8 Gross profit margin 38% 40% 34% Net profit margin 3.5% 3.6% 4.1% Return on total assets 4.0% 4.0% 4.4% Return on common equity 9.5% 8.0% 11.3% Market/book ratio 1.1 1.2 1.3
b.
(1) Liquidity: Zach Industries' liquidity position has deteriorated from 2002 to 2003 and is inferior to the industry average. The firm may not be able to satisfy short-term obligations as they come due.
(2) Activity: Zach Industries' ability to convert assets into cash has deteriorated from 2002 to 2003. Examination into the cause of the 21-day increase in the average collection period is warranted. Inventory turnover
Part 1 Introduction to Managerial Finance
38
has also decreased for the period under review and is fair compared to industry. The firm may be holding slightly excessive inventory.
(3) Debt: Zach Industries' long-term debt position has improved since 2002
and is below average. Zach Industries’ ability to service interest payments has deteriorated and is below industry.
(4) Profitability: Although Zach Industries' gross profit margin is below its
industry average, indicating high cost of goods sold, the firm has a superior net profit margin in comparison to average. The firm has lower than average operating expenses. The firm has a superior return on investment and return on equity in comparison to the industry and shows an upward trend.
(5) Market: Zach Industries' increase in their market price relative to their
book value per share indicates that the firm’s performance has been interpreted as more positive in 2003 than in 2002 and it is a little higher than the industry.
Overall, the firm maintains superior profitability at the risk of illiquidity. Investigation into the management of accounts receivable and inventory is warranted.
2-21 LG 6: Integrative–Complete Ratio Analysis
Ratio Analysis
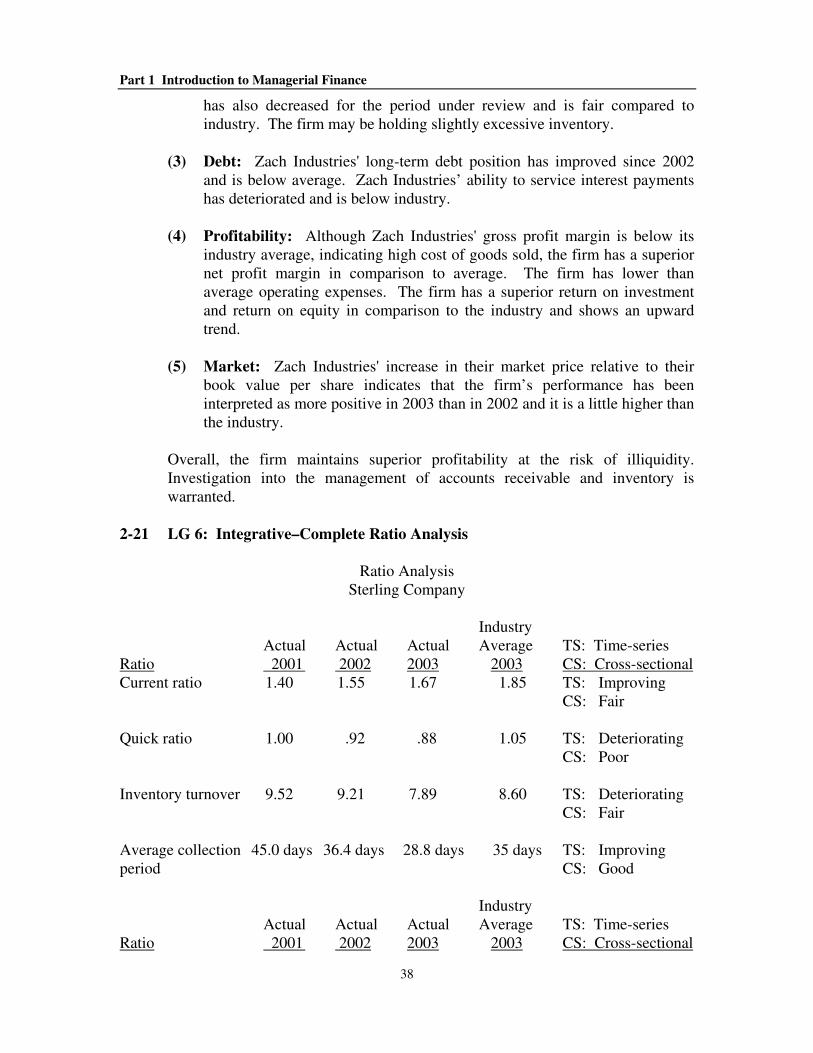
Sterling Company Industry Actual Actual Actual Average TS: Time-series Ratio 2001 2002 2003 2003 CS: Cross-sectional Current ratio 1.40 1.55 1.67 1.85 TS: Improving CS: Fair Quick ratio 1.00 .92 .88 1.05 TS: Deteriorating CS: Poor Inventory turnover 9.52 9.21 7.89 8.60 TS: Deteriorating CS: Fair Average collection 45.0 days 36.4 days 28.8 days 35 days TS: Improving period CS: Good Industry Actual Actual Actual Average TS: Time-series Ratio 2001 2002 2003 2003 CS: Cross-sectional
Chapter 2 Financial Statements and Analysis
39
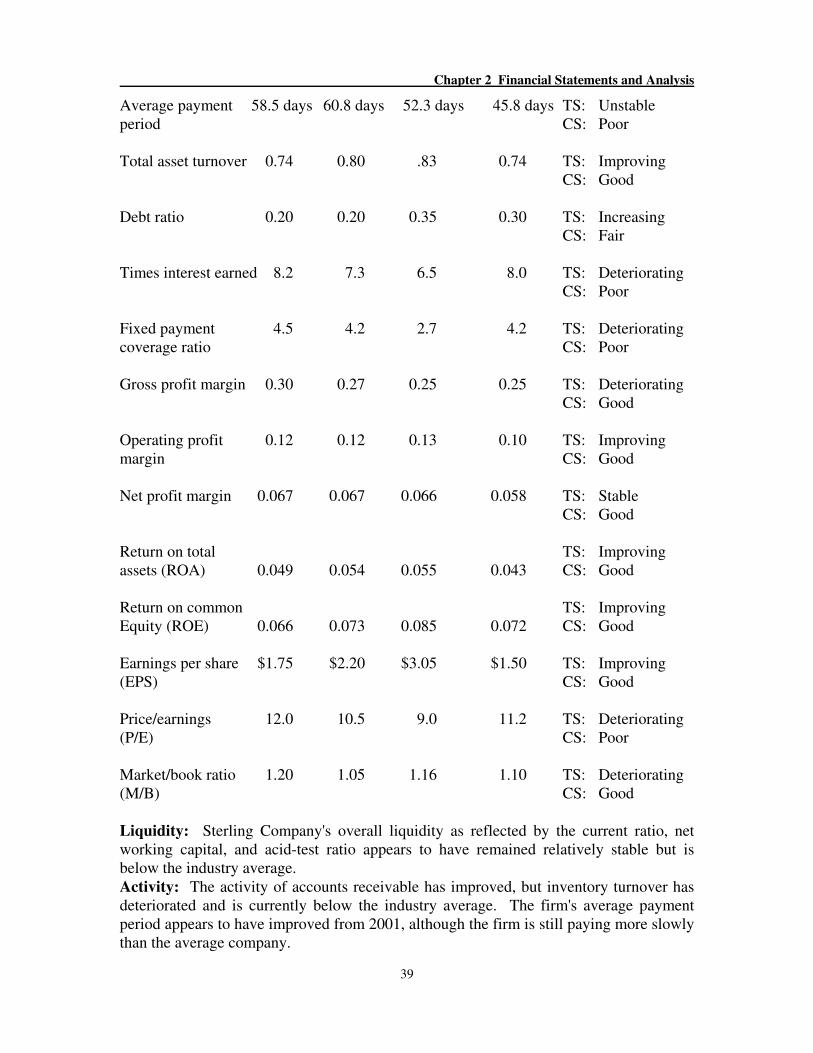
Average payment 58.5 days 60.8 days 52.3 days 45.8 days TS: Unstable period CS: Poor Total asset turnover 0.74 0.80 .83 0.74 TS: Improving CS: Good Debt ratio 0.20 0.20 0.35 0.30 TS: Increasing CS: Fair Times interest earned 8.2 7.3 6.5 8.0 TS: Deteriorating CS: Poor Fixed payment 4.5 4.2 2.7 4.2 TS: Deteriorating coverage ratio CS: Poor Gross profit margin 0.30 0.27 0.25 0.25 TS: Deteriorating CS: Good Operating profit 0.12 0.12 0.13 0.10 TS: Improving margin CS: Good Net profit margin 0.067 0.067 0.066 0.058 TS: Stable CS: Good Return on total TS: Improving assets (ROA) 0.049 0.054 0.055 0.043 CS: Good Return on common TS: Improving Equity (ROE) 0.066 0.073 0.085 0.072 CS: Good Earnings per share $1.75 $2.20 $3.05 $1.50 TS: Improving (EPS) CS: Good Price/earnings 12.0 10.5 9.0 11.2 TS: Deteriorating (P/E) CS: Poor Market/book ratio 1.20 1.05 1.16 1.10 TS: Deteriorating (M/B) CS: Good Liquidity: Sterling Company's overall liquidity as reflected by the current ratio, net working capital, and acid-test ratio appears to have remained relatively stable but is below the industry average. Activity: The activity of accounts receivable has improved, but inventory turnover has deteriorated and is currently below the industry average. The firm's average payment period appears to have improved from 2001, although the firm is still paying more slowly than the average company.
Part 1 Introduction to Managerial Finance
40
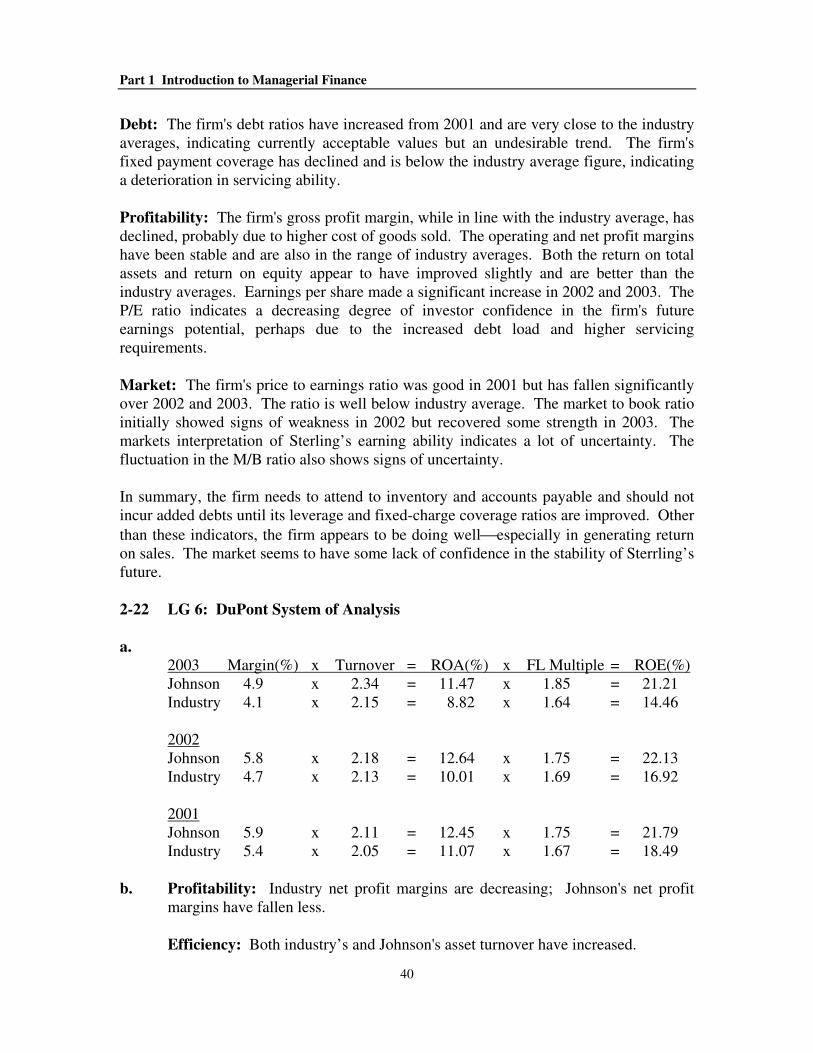
Debt: The firm's debt ratios have increased from 2001 and are very close to the industry averages, indicating currently acceptable values but an undesirable trend. The firm's fixed payment coverage has declined and is below the industry average figure, indicating a deterioration in servicing ability. Profitability: The firm's gross profit margin, while in line with the industry average, has declined, probably due to higher cost of goods sold. The operating and net profit margins have been stable and are also in the range of industry averages. Both the return on total assets and return on equity appear to have improved slightly and are better than the industry averages. Earnings per share made a significant increase in 2002 and 2003. The P/E ratio indicates a decreasing degree of investor confidence in the firm's future earnings potential, perhaps due to the increased debt load and higher servicing requirements. Market: The firm's price to earnings ratio was good in 2001 but has fallen significantly over 2002 and 2003. The ratio is well below industry average. The market to book ratio initially showed signs of weakness in 2002 but recovered some strength in 2003. The markets interpretation of Sterling’s earning ability indicates a lot of uncertainty. The fluctuation in the M/B ratio also shows signs of uncertainty. In summary, the firm needs to attend to inventory and accounts payable and should not incur added debts until its leverage and fixed-charge coverage ratios are improved. Other
than these indicators, the firm appears to be doing wellespecially in generating return on sales. The market seems to have some lack of confidence in the stability of Sterrling’s future. 2-22 LG 6: DuPont System of Analysis
a.
2003 Margin(%) x Turnover = ROA(%) x FL Multiple = ROE(%) Johnson 4.9 x 2.34 = 11.47 x 1.85 = 21.21 Industry 4.1 x 2.15 = 8.82 x 1.64 = 14.46
2002 Johnson 5.8 x 2.18 = 12.64 x 1.75 = 22.13 Industry 4.7 x 2.13 = 10.01 x 1.69 = 16.92
2001 Johnson 5.9 x 2.11 = 12.45 x 1.75 = 21.79 Industry 5.4 x 2.05 = 11.07 x 1.67 = 18.49
b. Profitability: Industry net profit margins are decreasing; Johnson's net profit
margins have fallen less.
Efficiency: Both industry’s and Johnson's asset turnover have increased.
Chapter 2 Financial Statements and Analysis
41
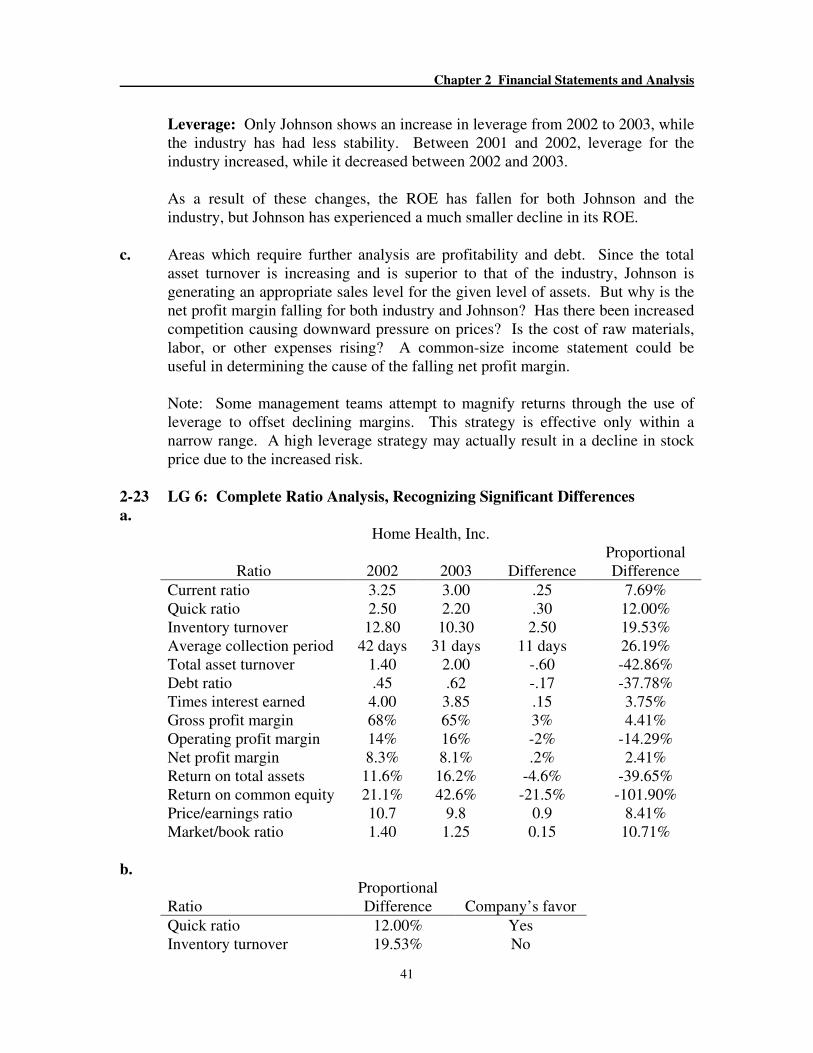
Leverage: Only Johnson shows an increase in leverage from 2002 to 2003, while the industry has had less stability. Between 2001 and 2002, leverage for the industry increased, while it decreased between 2002 and 2003.
As a result of these changes, the ROE has fallen for both Johnson and the industry, but Johnson has experienced a much smaller decline in its ROE.
c. Areas which require further analysis are profitability and debt. Since the total
asset turnover is increasing and is superior to that of the industry, Johnson is generating an appropriate sales level for the given level of assets. But why is the net profit margin falling for both industry and Johnson? Has there been increased competition causing downward pressure on prices? Is the cost of raw materials, labor, or other expenses rising? A common-size income statement could be useful in determining the cause of the falling net profit margin.
Note: Some management teams attempt to magnify returns through the use of leverage to offset declining margins. This strategy is effective only within a narrow range. A high leverage strategy may actually result in a decline in stock price due to the increased risk.
2-23 LG 6: Complete Ratio Analysis, Recognizing Significant Differences
a.
Home Health, Inc.
Ratio
2002
2003
Difference Proportional Difference
Current ratio 3.25 3.00 .25 7.69% Quick ratio 2.50 2.20 .30 12.00% Inventory turnover 12.80 10.30 2.50 19.53% Average collection period 42 days 31 days 11 days 26.19% Total asset turnover 1.40 2.00 -.60 -42.86% Debt ratio .45 .62 -.17 -37.78% Times interest earned 4.00 3.85 .15 3.75% Gross profit margin 68% 65% 3% 4.41% Operating profit margin 14% 16% -2% -14.29% Net profit margin 8.3% 8.1% .2% 2.41% Return on total assets 11.6% 16.2% -4.6% -39.65% Return on common equity 21.1% 42.6% -21.5% -101.90% Price/earnings ratio 10.7 9.8 0.9 8.41% Market/book ratio 1.40 1.25 0.15 10.71%
b.
Ratio
Proportional Difference
Company’s favor
Quick ratio 12.00% Yes Inventory turnover 19.53% No
Part 1 Introduction to Managerial Finance
42
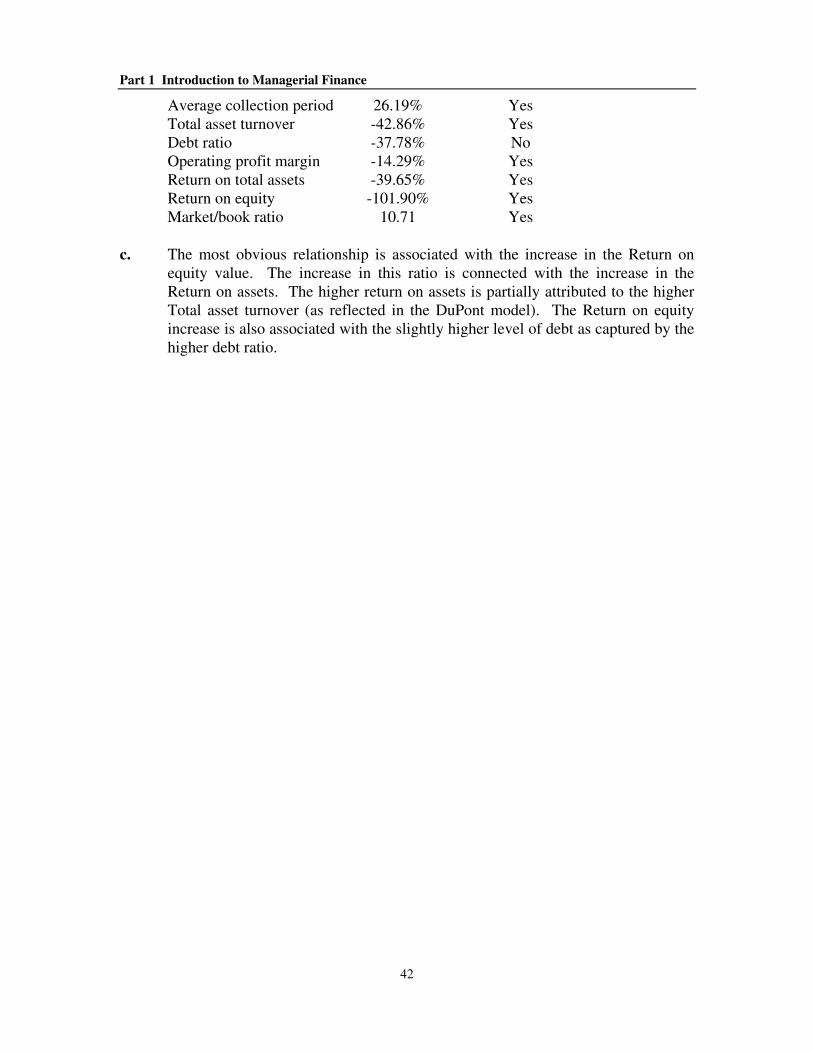
Average collection period 26.19% Yes Total asset turnover -42.86% Yes Debt ratio -37.78% No Operating profit margin -14.29% Yes Return on total assets -39.65% Yes Return on equity -101.90% Yes Market/book ratio 10.71 Yes
c. The most obvious relationship is associated with the increase in the Return on
equity value. The increase in this ratio is connected with the increase in the Return on assets. The higher return on assets is partially attributed to the higher Total asset turnover (as reflected in the DuPont model). The Return on equity increase is also associated with the slightly higher level of debt as captured by the higher debt ratio.
Chapter 2 Financial Statements and Analysis
43
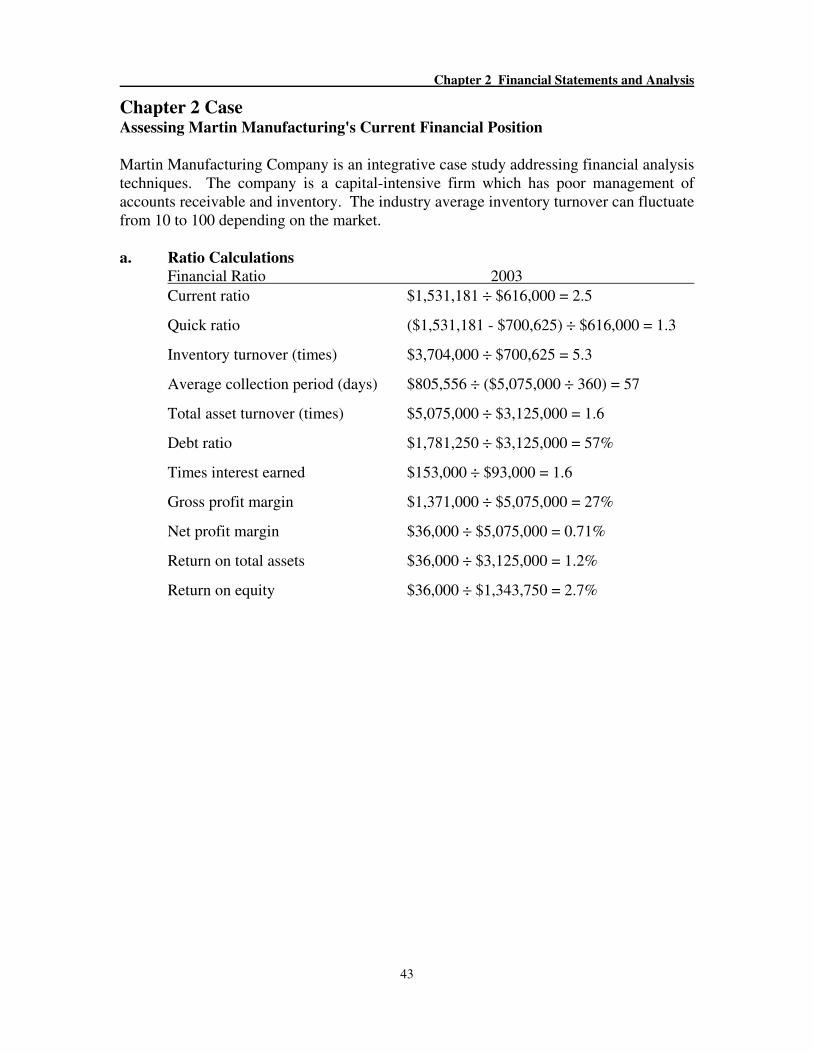
Chapter 2 Case Assessing Martin Manufacturing's Current Financial Position
Martin Manufacturing Company is an integrative case study addressing financial analysis techniques. The company is a capital-intensive firm which has poor management of accounts receivable and inventory. The industry average inventory turnover can fluctuate from 10 to 100 depending on the market. a. Ratio Calculations
Financial Ratio 2003
Current ratio $1,531,181 ÷ $616,000 = 2.5
Quick ratio ($1,531,181 - $700,625) ÷ $616,000 = 1.3
Inventory turnover (times) $3,704,000 ÷ $700,625 = 5.3
Average collection period (days) $805,556 ÷ ($5,075,000 ÷ 360) = 57
Total asset turnover (times) $5,075,000 ÷ $3,125,000 = 1.6
Debt ratio $1,781,250 ÷ $3,125,000 = 57%
Times interest earned $153,000 ÷ $93,000 = 1.6
Gross profit margin $1,371,000 ÷ $5,075,000 = 27%
Net profit margin $36,000 ÷ $5,075,000 = 0.71%
Return on total assets $36,000 ÷ $3,125,000 = 1.2%
Return on equity $36,000 ÷ $1,343,750 = 2.7%
Part 1 Introduction to Managerial Finance
44
Historical Ratios Martin Manufacturing Company
Actual Actual Actual Industry
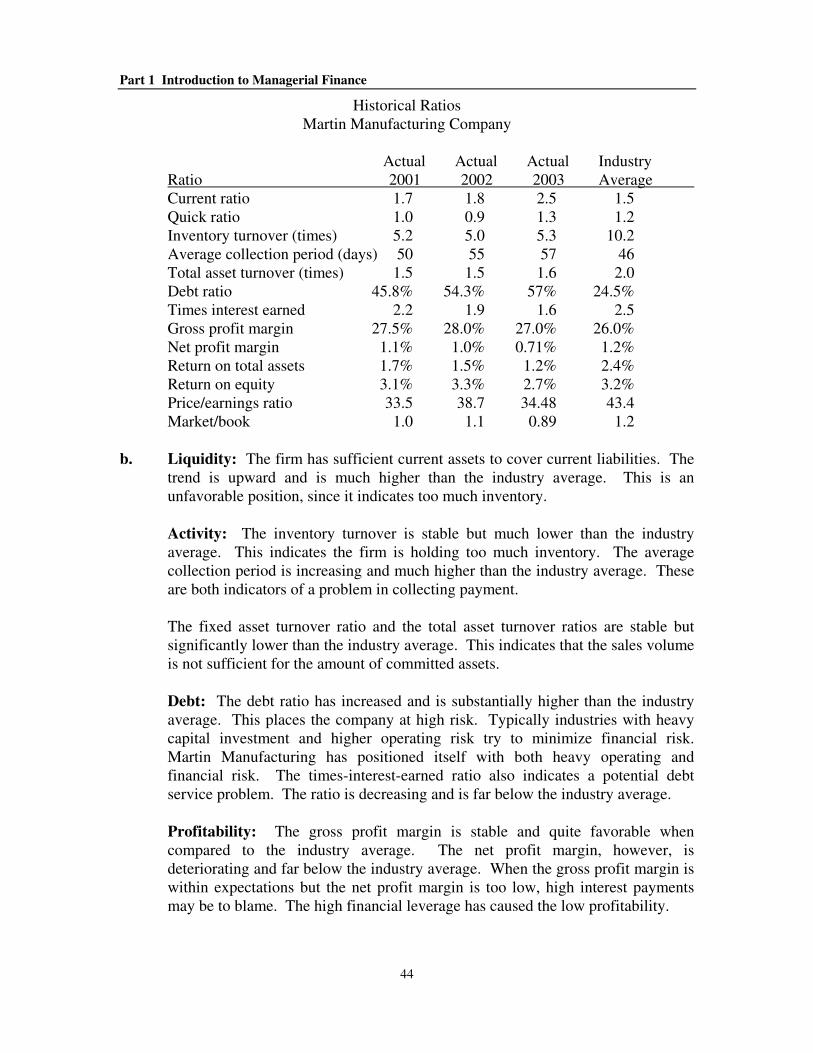
Ratio 2001 2002 2003 Average Current ratio 1.7 1.8 2.5 1.5 Quick ratio 1.0 0.9 1.3 1.2 Inventory turnover (times) 5.2 5.0 5.3 10.2 Average collection period (days) 50 55 57 46 Total asset turnover (times) 1.5 1.5 1.6 2.0 Debt ratio 45.8% 54.3% 57% 24.5% Times interest earned 2.2 1.9 1.6 2.5 Gross profit margin 27.5% 28.0% 27.0% 26.0% Net profit margin 1.1% 1.0% 0.71% 1.2% Return on total assets 1.7% 1.5% 1.2% 2.4% Return on equity 3.1% 3.3% 2.7% 3.2% Price/earnings ratio 33.5 38.7 34.48 43.4 Market/book 1.0 1.1 0.89 1.2
b. Liquidity: The firm has sufficient current assets to cover current liabilities. The
trend is upward and is much higher than the industry average. This is an unfavorable position, since it indicates too much inventory.
Activity: The inventory turnover is stable but much lower than the industry average. This indicates the firm is holding too much inventory. The average collection period is increasing and much higher than the industry average. These are both indicators of a problem in collecting payment.
The fixed asset turnover ratio and the total asset turnover ratios are stable but significantly lower than the industry average. This indicates that the sales volume is not sufficient for the amount of committed assets.
Debt: The debt ratio has increased and is substantially higher than the industry average. This places the company at high risk. Typically industries with heavy capital investment and higher operating risk try to minimize financial risk. Martin Manufacturing has positioned itself with both heavy operating and financial risk. The times-interest-earned ratio also indicates a potential debt service problem. The ratio is decreasing and is far below the industry average.
Profitability: The gross profit margin is stable and quite favorable when compared to the industry average. The net profit margin, however, is deteriorating and far below the industry average. When the gross profit margin is within expectations but the net profit margin is too low, high interest payments may be to blame. The high financial leverage has caused the low profitability.
Chapter 2 Financial Statements and Analysis
45
Market: The market price of the firm’s common stock shows weakness relative to both earnings and book value. This result indicates a belief by the market that Martin’s ability to earn future profits faces more and increasing uncertainty as perceived by the market.
c. Martin Manufacturing clearly has a problem with its inventory level, and sales are
not at an appropriate level for its capital investment. As a consequence, the firm has acquired a substantial amount of debt which, due to the high interest payments associated with the large debt burden, is depressing profitability. These problems are being picked up by investors as shown in their weak market ratios.
Related Documents