2017 ANNUAL REPORT Refine.

Welcome message from author
This document is posted to help you gain knowledge. Please leave a comment to let me know what you think about it! Share it to your friends and learn new things together.
Transcript

Index to the Management's Discussion and Analysis
EXECUTIVE SUMMARY
CORE BUSINESS AND STRATEGYCore BusinessBusiness ObjectiveStrategy
KEY PERFORMANCE DRIVERS AND CAPABILITIESKey Eternal DriversKey Internal Drivers
RESULTSOverall Annual PerformanceSelected Annual InformationResults Compared to 2017 TargetsAcquisitionsDiscussions of OperationsFourth Quarter ResultsQuarterly TrendsStatements of Financial PositionLiquidity and Capital ResourcesOther
OUTLOOK
CRITICAL ACCOUNTING ESTIMATES, DEVELOPMENTS, AND MEASURESCritical Accounting EstimatesAccounting DevelopmentsMaterialityDefinition of Non-IFRS Measures
RISK FACTORS
CONTROLS AND PROCEDURES
CORPORATE GOVERNACE
SUBSEQUENT EVENTS
CAUTIONARY NOTE REGARDING FORWARD-LOOKING STATEMENTS
2
4445
111113
2020212324254044464854
58
6363646465
68
78
78
80
80
2017 ANNUAL REPORT
Refine.

TABLE OF CONTENTS
1 Message from the Chair
2 Report to Shareholders
4 About Stantec
6 Business Model
10 Industry Position
11 Sustainability
12 2017 Financial Summary
14 2017 Financial Highlights
16 BoardofDirectorsandCorporateOfficers
M-1 Management's Discussion and Analysis
F-7 Consolidated Financial Statements
Austin Water Treatment Plant #4Austin, Texas

MESSAGE FROM THE CHAIR
In 2017, Stantec achieved our long-standing business objective: to become a top 10 global design firm. With strong leadership, by winning and successfully executing projects on behalf of our clients, and by consistently applying our organic and acquisition growth strategy, we’ve earned our position as one of the top firms in our industry.
Having achieved our objective in 2017, going forward into 2018 we will continue to evolve. We will work diligently to maintain and improve our position
in the global top 10, and we will strive to become a top-tier global design and delivery firm in each of the business lines and geographies where we operate. And we’ll remain committed to creating communities, fostering strong client relationships, embracing creativity, and governing the Company transparently and ethically.
The Company also refined its brand in 2017 to assist with our emergence as a globally iconic firm. The integration of MWH in North America was completed this year, and the integration of MWH offices outside of North America is well underway.
Finally, the board welcomes new president and chief executive officer,
Gord Johnston, and offers our gratitude to past president and chief executive officer, Bob Gomes. Both have served the Company with distinction, and both have worked together with the board to ensure a smooth transition. As Gord brings his considerable experience to leading the Company and our executive team, Bob will serve Stantec through his continued membership on the board of directors.
As ever, the board and I are grateful to you— our shareholders, clients, and employees—for your support.
Aram H. Keith Chair Stantec Board of Directors
STA NTEC INC. 1

As Stantec’s new president and CEO, I’d like to begin my first Report to Shareholders by expressing my excitement about the future of this Company. Thousands of talented employees have driven Stantec’s steady growth and our continuous profitability since 1954. And thanks to their contributions in 2017, we achieved our long-standing business objective—to become a top 10 global design firm—under the leader-ship of my predecessor, Bob Gomes.
I’m so pleased to lead Stantec forward as we refine our business objective: to be a top-tier global design and delivery firm, working with the world’s leading clients on innovative, world-changing projects.
Annual Result Highlights Stantec closed 2017 with a 19.5% increase in gross revenue, 10.3% increase in net revenue, 26.1% increase in EBITDA, and 3.2% increase in adjusted EBITDA compared to 2016. Adjusted diluted earnings per share (EPS) rose from $1.69 in 2016 to $1.77 in 2017; diluted EPS was down from $1.22 in 2016 to $0.85 in 2017 mainly due to the US tax reform, the sale of Innovyze, and some project challenges (detailed below).
Fourth Quarter Result Highlights The Company’s fourth quarter results were impacted by challenges in our Construction Services operations, including cost increases for certain UK waste-to-energy projects, execution and site condition issues for certain US legacy hard-bid projects, and a provision for a large
consulting project in our US Water business. Plus, as a result of US tax reform, we incurred a one-time tax expense of $31.2 million, offset by a revaluation of deferred tax assets and liabilities of $12.6 million.
Our Year of Accomplishment Results for 2017 were achieved by the efforts of our employees, three acquisitions, and a return to overall organic growth.
We also exceeded our targeted US$25 million in cost and revenue synergies from the MWH acquisition and fully integrated MWH’s North American Consulting Services.
During the year, we sold Innovyze, the water software business we acquired with MWH. The sale proceeds unlocked value for shareholders by
repaying over $220 million of our revolving credit facility, which also reduced interest payments on that debt.
Our teams secured a number of significant project wins in 2017, including work on the Royal Columbian Hospital Redevelopment Project in New Westminster, British Columbia; the Capital Improvement Program for the City of Sunrise, Florida; a mixed-use entertainment facility for the Colorado Rockies baseball team; Yorkshire Water’s Asset Management Programme 7 (AMP7) in the United Kingdom; and a strategic code of practice for self-driving vehicles in Dubai.
As of January 1, 2018, we are now branded globally as Stantec, and most offices, including those recently acquired, now have access to common collaboration tools. This increases our
2017 Fourth Quarter and Year End
2017 STANTEC ANNUAL REPORT2

REPORT TO SHAREHOLDERS
ability to connect the right talent with the right clients and the right projects. And we continue to maintain a strong backlog of projects: $3.9 billion at the end of 2017. Throughout 2018, a primary goal for leadership and employees will be to execute these projects successfully.
Looking Forward Our outlook remains positive. In 2018, we expect organic gross revenue growth in the low- to mid-single digits, driven by continued economic growth in the United States, increased infrastructure spending in the United States and Canada, global economic growth, and continued support for alternative project delivery.
We are well positioned for 2018 and the years ahead. We go forward as a company 22,000 strong,
packed with immense talent and strong client relationships around the world. I look forward to the world-class projects we’ll tackle and the communities we’ll create.
Gord Johnston President and CEO February 21, 2018
STA NTEC INC. 3

Brucejack MineStewart, British Columbia
Communities are fundamental. Whether around the corner or across the globe, they provide a foundation, a sense of place and of belonging. That’s why at Stantec, we always design with community in mind.
We care about the communities we serve—because they’re our communities too. This allows us to assess what’s needed and connect our expertise, to appreciate nuances and envision what’s never been considered, to bring together diverse perspectives so we can collaborate toward a shared success.
We’re designers, engineers, scientists, and project managers, innovating together at the intersection of community, creativity, and client relationships. Balancing these priorities results in projects that advance the quality of life in communities across the globe.
Stantec trades on the TSX and the NYSE under the symbol STN. Visit us at stantec.com or find us on social media.
WE CONNECT TO PROJECTS ON A PERSONAL LEVEL AND ADVANCE THE QUALITY OF LIFE ACROSS THE GLOBE.
22,000 EMPLOYEES
400 LOCATIONS
6 CONTINENTS
2017 STANTEC ANNUAL REPORT4

ABOUT STANTEC
How we make a difference in the world
What we stand for
What drives us to do better
What we will work to achieve in 2018
How we act
Creating communities Design with community in mind
We will be a top-tier global design and delivery firm
Build an inspiring, inclusive work environment that attracts, supports, and develops world-class talent.
Pursue and win work that transforms our communities and inspires our employees.
Execute projects exceptionally for our clients.
Combine what we know succeeded in the past with curiosity, creativity, and investment into what will succeed tomorrow.
Embrace and continue to enhance our Collaborative Business Model and integrated platform for competitive and operational advantage.
Make strategic acquisitions that strengthen our ability to improve the communities, sectors, and geographies we serve.
We put people first We do what is right We are better together We are driven to achieve
Our Purpose Our Promise
Our ValuesOur Business Objective
Strategic Elements
STA NTEC INC. 5

Our business model is key to our strategy. We provide services across diverse geographic regions, service specializations, and all phases of the infrastructure and facilities project life cycle—planning, design, construction, commissioning, maintenance, decommissioning, and remediation. We organize our business into two service offerings and four reportable segments.
Business Model Service Offerings
Consulting Services
We provide professional consulting services in engineering, architecture, interior design, landscape architecture, surveying, environmental services, project management, and project economics. Consulting Services derives its revenue from five business operating units: Buildings, Energy & Resources, Environmental Services, Infrastructure, and Water. (See page 8 for revenue breakdown.)
Construction Services
We provide construction and construction management services mainly on water-related projects for key long-term clients.
Consulting Services – Canada Consulting Services – United States Consulting Services – Global Construction Services
Planning Design Construction and Commissioning
Other
Reportable Segments
2017 STANTEC ANNUAL REPORT6

BUSINESS MODEL
CONSTRUCTION SERVICES64% United States 36% United Kingdom
CONSULTING SERVICES55% United States 30% Canada 15% Global
SERVICE OFFERINGS78% Consulting Services 22% Construction Services
BUSINESS OPERATING UNITS CONSULTING SERVICES
27% Infrastructure 22% Buildings 22% Water 17% Environmental Services 12% Energy & Resources
2017 Gross Revenue
2017 Gross Revenue by Geography
STA NTEC INC. 7

*Percent of Consulting Services gross revenue
BUILDINGS
ENERGY & RESOURCES
12%*
17%*
27%*
22%*
22%*
INFRASTRUCTURE
WATER
ENVIRONMENTAL SERVICES
Key revenue generators include pre-design, design, and construction administration services in planning (including functional planning), architecture, buildings engineering, and interior design for vertical infrastructure.
Core revenue streams include industrial engineering, project management, and construction management services.
Core revenue is derived from front-end environmental services and remediation activities.
Revenue comes from front-end design and engineering services and construction management services across the entire water cycle, including capture, treatment, distribution, reuse, and return.
Revenue is generated from front-end design and engineering services and project and construction management services for transportation and community development projects.
2017 STANTEC ANNUAL REPORT8

BUSINESS MODEL
BUILDINGS
WATER
RESOURCESENERGY &
ENV
IRO
NM
ENTA
LSE
RVIC
ES
INFRASTRUCTURE
Power
Power
WaterPow
er & Dams
Oil & G
as
Mining
Buildings
Transportation
Community Development
Mining
Conv
eyan
ce
Wat
er R
esou
rcesWastewater Treatm
entStormwater & Wet Weather FlowWater Treatment
Road
way
s
Community Development
Transit & Rail
Bridges
Commercial
Healthcare
Education
Industrial
Airports & AviationCivic
Science & Technology
Water
Oil & Gas
2017 Gross Revenue by Sector for
Consulting Services
STA NTEC INC. 9

For decades, our business objective was to be a top 10 global design firm. In 2017, we achieved that goal, maintaining our number 3 ranking in North America and reaching number 10 globally. Having achieved the top 10 position, our new business objective is to maintain or improve our position in the top 10 while being a top-tier global design and delivery firm.
*Source: Engineering News-Record and internal analyses
Industry Position
Kenneth F. Burns Memorial Bridge ReplacementWorcester, Shrewsbury, Massachusetts
$10,
000
$8,0
00
$6,0
00
$4,0
00
$2,0
00
$0#10
Top 150 Global Design Firms*
Global DesignRevenue (US$ M)
Dar Group
Wood/AMEC
CRCC (China)
Tetra Tech
WorleyParsons
Stantec
Fluor
Arcadis
CCCG (China)
SNC/Atkins
WSP
CEEC (China)
PCCC (China)
AECOM
Jacobs/CH2M
Top North American Design Firms*
$6,0
00
$5,0
00
$4,0
00
$3,0
00
$2,0
00
$1,0
00
$0
#3
North AmericanDesign Revenue
(US$ M)
Burns & McDonnell
Wood/AMEC
SNC/Atkins
CB&I
HDR
WSP
Tetra Tech
Stantec
AECOM
Jacobs/CH2M
$10,
000
$8,0
00
$6,0
00
$4,0
00
$2,0
00
$0
#10
Top 150 Global Design Firms*
Global DesignRevenue (US$ M)
Dar Group
Wood/AMEC
CRCC (China)
Tetra Tech
WorleyParsons
Stantec
Fluor
Arcadis
CCCG (China)
SNC/Atkins
WSP
CEEC (China)
PCCC (China)
AECOM
Jacobs/CH2M
Top North American Design Firms*
$6,0
00
$5,0
00
$4,0
00
$3,0
00
$2,0
00
$1,0
00
$0
#3
North AmericanDesign Revenue
(US$ M)
Burns & McDonnell
Wood/AMEC
SNC/Atkins
CB&I
HDR
WSP
Tetra Tech
Stantec
AECOM
Jacobs/CH2M
2017 STANTEC ANNUAL REPORT10

At Stantec, we commit to reducing our environmental impacts, improving the social impacts of our operations, and governing ourselves responsibly while operating profitably. We foster a culture of health, safety, security, inclusion, engagement, environmental performance, and quality.
In 2017, we donated approximately 1% of our pre-tax earnings (approximately $3 million) to community engagement activities. During Stantec in the Community Week, more than 5,000 employees helped over 400 community organizations across 6 continents.
We also continued to improve diversity and inclusion at Stantec, including piloting unconscious-bias training for employees.
In 2017, we met our midterm greenhouse gas (GHG) emission reduction goal, reduced GHG emissions more than 10% compared to our baseline year, and set new baseline goals that include our expanded global operations.
We actively supported the UN Global Compact and UN Sustainable Development Goals, plus implemented a Partner Code of Business Conduct to pass our environmental, social, and governance commitments to our supply chain.
In 2017, we were named the #1 Green Design Firm for Educational Buildings (Engineering News-Record (ENR)), #1 International Design Firm for Water (ENR), and #1 International Design Firm for Sewer/Waste (ENR).
Sustainability
INDUSTRY POSIT ION AND SUSTAINABIL IT Y
Filsinger Park ImprovementsKitchener, Ontario
STA NTEC INC. 11

Gross revenueNet revenue EBITDA (1)
Income before taxes Net income
Current assetsProperty and equipmentCurrent liabilitiesLong-term debtShareholders’ equityCash and cash equivalentsGross revenue backlog (2)
Earnings per share – basic (3)
Earnings per share – diluted (3)
Current ratio Net debt to equity ratio
Weighted average number of shares outstanding (3)
Shares outstanding (3)
Shares traded (3)
TSX (in Canadian dollars) High (3)
Low (3)
Close (3)
NYSE (in US dollars) High (3)
Low (3)
Close (3)
2017 Financial Summary
(In millions of Canadian dollars, except shares, per share amounts, and ratios) 13
2,236.4 1,832.4
261.2 198.9 146.2
726.2 133.5 407.0 200.9 892.6 143.0
1,413.0
1.58 1.57 1.78 0.11
92,510,462 93,152,264 53,330,260
36.17 19.15 32.93
34.03 19.13 31.00
14 2,529.9 2,075.3
294.7 223.2 164.5
844.4 152.7 475.1 256.1
1,086.2 153.7
1,795.0
1.76 1.74 1.78 0.14
93,540,206 93,836,258 64,933,061
38.14 29.17 31.93
34.75 25.15 27.42
15 2,877.2 2,373.7
306.3 211.6 156.4
951.4 158.1 632.1 232.3
1,323.3 67.3
2,198.0
1.66 1.65 1.51 0.22
94,143,455 94,435,898 60,585,646
38.09 28.77 34.32
30.01 21.57 24.79
16 4,300.1 3,098.4
336.3 180.8 130.5
1,582.5 213.9
1,072.8 928.6
1,975.7 210.9
3,882.0
1.22 1.22 1.48 0.41
107,006,168 114,081,229
73,683,416
36.85 27.99 33.92
27.65 20.71 25.25
17 5,140.1 3,417.3
424.1 263.5
97.0
1,608.2 212.6
1,153.3 541.4
1,896.3 239.5
3,928.0
0.85 0.85 1.39 0.26
113,991,507 113,991,676
55,888,176
37.13 30.24 35.16
28.85 22.25 27.95
2017 STANTEC ANNUAL REPORT12

(1) EBITDA is a non-IFRS measurement and is calculated as income before income taxes less net interest expense, amortization of intangible assets, and depreciation of property and equipment.
(2) Backlog is unaudited.(3) 2013 amounts have been adjusted from previously reported amounts
for the two-for-one share split on November 14, 2014.
Net-Zero Pavilion Ahuntsic, Quebec
FINANCIAL SUMMARY
STA NTEC INC. 13

2017 Financial Highlights
$0
$1,000
$2,000
$3,000
$4,000
$5,000
$6,000
Gross revenue Net revenue
13 14 15 16 17$0
$100
$200
$300
$400
$500
13 14 15 16 17
13 14 15 16 17$0.00
$0.50
$1.00
$1.50
$2.00
Diluted EPSAdjusted diluted EPS
$0
$50
$100
$150
$200
$250
$300
Operating cash flow Free cash flow
13 14 15 16 17
Cash FlowDiluted EPS
Gross Revenue and Net Revenue EBITDA
All charts represent millions of Canadian dollars, except for diluted EPS, adjusted diluted EPS, and dividends. Diluted EPS for 2013 has been adjusted for the November 14, 2014, two-for-one share split. EBITDA, adjusted diluted EPS, and adjusted net income are non-IFRS measures.
2017 STANTEC ANNUAL REPORT14

$0
$1,500
$3,000
$4,500
13 14 15 16 17
$0.00
$0.20
$0.40
$0.60
13 14 15 16 17
Gross Revenue Backlog
5-Year Gross Revenue CAGR (compound annual growth rate)
Organic Gross Revenue Growth (2017 vs. 2016)
Adjusted Net Income Growth (2017 vs. 2016)
Annual Dividend per Share
Dividend
FINANCIAL HIGHLIGHTS
22.4%
3.6%
11.5%
$0.50
STA NTEC INC. 15

The following knowledgeable and qualified professionals guide Stantec’s business while adhering to sound corporate governance practices in three areas: stewardship, independence, and expertise. We are proud to call them directors of our board and members of our Audit and Risk Committee and our Corporate Governance and Compensation Committee.
To learn more about our board members, refer to our 2017 Management Information Circular (available in the Investors section on stantec.com).
Board of Directors and Corporate Officers
2017 STANTEC ANNUAL REPORT16

BOARD OF DIRECTORS AND CORPORATE OFFICERS
AUDIT AND RISK COMMITTEE
Douglas K. Ammerman (Chair)Richard C. BradeenAnthony P. FranceschiniDonald J. Lowry
CORPORATE GOVERNANCE AND COMPENSATION COMMITTEE
Susan E. Hartman (Chair)Dr. Delores M. EtterDonald J. LowryMarie-Lucie Morin
BOARD OF DIRECTORS
Aram H. KeithChair of the Board of Directors Monarch Beach, California
Dr. Delores M. EtterDirector Camano Island, Washington
Donald J. LowryDirector Edmonton, Alberta
Gordon A. JohnstonPresident & CEO Edmonton, Alberta
Anthony P. FranceschiniDirector Edmonton, Alberta
Marie-Lucie MorinDirectorOttawa, Ontario
Richard C. BradeenDirectorMontréal, Québec
Douglas K. AmmermanDirector Laguna Beach, California
Robert J. GomesDirectorEdmonton, Alberta
Susan E. HartmanDirectorEvergreen, Colorado
Aram H. Keith Chair of the Board of DirectorsMonarch Beach, California
Gordon A. Johnston President & CEOEdmonton, Alberta
Daniel J. Lefaivre Executive Vice President & CFOSt. Albert, Alberta
Valentino DiManno Executive Vice President & CBOCalgary, Alberta
Scott L. Murray Executive Vice President & COOLexington, Kentucky
Steve M. Fleck Executive Vice President & CPOVancouver, British Columbia
Paul J. D. Alpern Senior Vice President, Secretary and General CounselSherwood Park, Alberta
CORPORATE OFFICERS
STA NTEC INC. 17

Head Office 200, 10160 – 112 Street Edmonton, Alberta T5K 2L6 Canada Ph: (780) 917-7000 Fx: (780) 917-7330 [email protected]
Securities Exchange Listing Stantec shares are listed on the Toronto Stock Exchange and the New York Stock Exchange under the symbol STN.
SHAREHOLDER INFORMATION

Index to the Management's Discussion and Analysis
CORE BUSINESS 2
OVERALL FINANCIAL PERFORMANCE 3
HIGHLIGHTS – Q4 2017 RESULTS 3
HIGHLIGHTS – FULL YEAR 2017 RESULTS 6
OUTLOOK 10
STRATEGY 12
KEY PERFORMANCE DRIVERS AND CAPABILITIES 17Key External Drivers 17Key Internal Drivers 18
FINANCIAL PERFORMANCE 22Selected Annual Information 22Acquisitions 22Divestitures 22Discussion of Operations 23Fourth Quarter Results 37Quarterly Trends 43Statements of Financial Position 44Liquidity and Capital Resources 47Other 50
CRITICAL ACCOUNTING ESTIMATES, DEVELOPMENTS, AND MEASURES 54Critical Accounting Estimates 54Accounting Developments 55Materiality 56Definition of Non-IFRS Measures 56
RISK FACTORS 59
CONTROLS AND PROCEDURES 68
CORPORATE GOVERNANCE 69
SUBSEQUENT EVENTS 70
CAUTIONARY NOTE REGARDING FORWARD-LOOKING STATEMENTS 70

Management’s Discussion and Analysis December 31, 2017 M-2 Stantec Inc.
Management’s Discussion and Analysis February 21, 2018 This discussion and analysis of Stantec Inc.’s (Stantec or the Company) operations, financial position, and cash flows for the year ended December 31, 2017, dated February 21, 2018, should be read in conjunction with the Company’s 2017 audited consolidated financial statements and related notes for the year ended December 31, 2017. Our 2017 audited consolidated financial statements and related notes are prepared in accordance with International Financial Reporting Standards (IFRS) as issued by the International Accounting Standards Board (IASB). Unless otherwise indicated, all amounts shown in this report are in Canadian dollars.
Additional information regarding the Company, including our Annual Information Form, is available on SEDAR at sedar.com and on EDGAR at .sec.gov. Such additional information is not incorporated by reference unless otherwise specified and should not be deemed to be made part of this Management’s Discussion and Analysis.
Core Business We collaborate across disciplines and industries to bring buildings, energy and resource, environmental, water and infrastructure projects to life. We provide services in engineering, architecture, interior design, landscape architecture, surveying, environmental sciences, construction services, project management, and project economics, from initial project concept and planning through to design, construction, commissioning, maintenance, decommissioning, and remediation. The Stantec community unites approximately 22,000 employees working in over 400 locations across 6 continents. Our promise is to design with community in mind.
We have refined our long-standing business objective, which was to be a top 10 global design firm. Having achieved that goal this year, we now seek to maintain our position in the top 10, while also becoming a top-tier global design and delivery firm, not only by size but also assessed qualitatively based on our capabilities and perception in the marketplace. We expect to achieve a long-term average compound gross revenue growth of 15% through a combination of organic and acquisition growth.
Our purpose—to create communities—is intrinsically linked to our values: we put people first, we do what is right, we are better together, and we are driven to achieve.
We have four reportable segments: Consulting Services – Canada, United States, and Global; and Construction Services. We have five Consulting Services business operating units: Buildings, Energy & Resources, Environmental Services, Infrastructure, and Water.
Stantec trades on the TSX and the NYSE under the symbol STN. Visit us at stantec.com or find us on social media. For further discussion of our business, strategy, and drivers, refer to the sections entitled Our Strategy and Key Performance Drivers and Capabilities in this report.

Management’s Discussion and Analysis December 31, 2017 M-3 Stantec Inc.
Overall Financial Performance The following table summarizes our key results for 2017 compared to 2016 and Q4 17 compared to Q4 16:
Highlights – Q4 2017 Results The following tables provide transparency into our results by our two Service Offerings:
(In millions of Canadian dollars, except per share amounts and percentages)
2017 $
2016 $
% Increase (Decrease)
2017 $
2016 $
% Increase (Decrease)
Gross revenue 5,140.1 4,300.1 19.5% 1,246.0 1,240.8 0.4%Net revenue 3,417.3 3,098.4 10.3% 805.0 820.2 (1.9% ) EBITDA (note) 424.1 336.3 26.1% 69.4 82.9 (16.3% ) Adjusted EBITDA (note) 363.4 352.3 3.2% 63.1 83.8 (24.7% ) Net income 97.0 130.5 (25.7% ) 11.2 29.4 (61.9% ) Adjusted net income (note) 202.0 181.1 11.5% 37.2 40.4 (7.9% ) Diluted earnings per share 0.85 1.22 (30.3% ) 0.10 0.26 (61.5% ) Adjusted diluted earnings per share (note) 1.77 1.69 4.7% 0.32 0.35 (8.6% ) Cash div idends declared per common share 0.50 0.45 11.1% 0.1250 0.1125 11.1%
Year Ended December 31 Quarter Ended December 31
note: EBITDA, adjusted EBITDA , adjusted net income, and adjusted diluted earnings per share are non-IFRS measures (discussed in the Definitions section of this report)
(In millions of Canadian dollars, except percentages) $ % of NR $ % of NR $ % of NR
Gross revenue 977.4 130.4% 268.6 487.5% 1,246.0 154.8%Net revenue 749.9 100.0% 55.1 100.0% 805.0 100.0%Gross margin 419.0 55.9% 6.5 11.8% 425.5 52.9%Administrative, marketing, and other expenses 348.6 46.5% 13.8 25.2% 362.4 45.0%
Adjusted EBITDA (note) 70.4 9.4% (7.3) (13.2%) 63.1 7.8% Loss on sale of property and equipment 0.4 0.0%Rebalancing of investments held for self-insured liabilities (6.7) (0.8% )
Total EBITDA (note) 69.4 8.6%
(In millions of Canadian dollars, except percentages) $ % of NR $ % of NR $ % of NR
Gross revenue 985.5 130.2% 255.3 404.6% 1,240.8 151.3%Net revenue 757.1 100.0% 63.1 100.0% 820.2 100.0%Gross margin 425.3 56.2% 21.9 34.7% 447.2 54.5%Administrative, marketing, and other expenses 341.9 45.2% 21.5 34.1% 363.4 44.3%
Adjusted EBITDA (note) 83.4 11.0% 0.4 0.7% 83.8 10.2%Loss on sale of property and equipment 0.9 0.1%
Total EBITDA (note) 82.9 10.1%
note: Adjusted EBITDA and EBITDA are non-IFRS measures (discussed in the Definitions section of this report)
Quarter Ended December 31, 2017
Consulting Construction Total
Quarter Ended December 31, 2016
Consulting Construction Total

Management’s Discussion and Analysis December 31, 2017 M-4 Stantec Inc.
Gross and net revenue. Gross revenue was up 0.4% to $1,246.0 million and net revenue retracted 1.9% to $805.0 million compared to Q4 16. We had positive organic gross revenue growth of 4.1% and organic net revenue growth of 2.2% in Q4 17 compared to Q4 16. This was mainly the result of growth in our Energy & Resources business operating unit. Organic growth was partly offset by the impact of foreign exchange rates and the divestiture of Innovyze Inc. (Innovyze), a water software business.
In Consulting Services – Canada, we had organic gross revenue growth of 5.4% and organic net revenue growth of 6.1% in Q4 17 compared to Q4 16. The growth is mainly attributable to continued housing demand, several larger pipeline projects, a large mining project, and continued healthcare work. Our Energy & Resources and Water business operating units and Transportation sector met management’s expectations; however, our Buildings and Environmental Services business operating units missed expectations. Our Canadian Consulting Services backlog remains healthy; however, due to seasonality, we experienced lower than anticipated utilization in several sectors.
In Consulting Services – United States, our organic gross revenue retracted 0.6% in Q4 17 compared to Q4 16 and 1.1% on a net revenue basis. Our Water business operating unit was negatively impacted by certain water programs coming to completion or slowing and a $5 million downward revenue adjustment on a major design-build project due to additional costs and design and project scope changes. Claims have been advanced against parties believed to be responsible for causing these additional costs which we expect may benefit future quarters as the claims are resolved. Excluding this $5 million negative impact, our Company-wide Water business would have had organic gross revenue growth in 2017 compared to 2016.
In Consulting Services – Global, we achieved organic gross revenue growth of 6.7% and organic net revenue growth of 8.3% in Q4 17 compared to Q4 16. Growth was due to strong project activity in the United Kingdom through the Water Asset Management Programme 6 (AMP6) cycle and improving market conditions in our Latin America Mining sector and Middle East Water business operating unit. However, revenue did not meet management’s expectations—mainly in our Buildings operations in the Middle East and in our Asia Pacific region—due to lower net revenue volume, project issues, and lower than expected utilization across these regions.
In Construction Services, several legacy MWH Global Inc. (MWH) projects experienced significant challenges. We recorded $5 million in cost increases related to certain UK-based waste-to-energy projects that are nearing completion where delays and certain asserted performance issues resulted in increases in costs to complete. Claims against parties believed to be responsible for causing much of these added costs were advanced or will be in the near future, of which only a portion was recognized as revenue to date. We expect future quarters may be benefited as these claims are resolved.
Construction Services in the United States recorded downward revenue adjustments and incurred cost escalations in several legacy MWH projects, including the major design-build project mentioned above for Consulting Services for which we submitted a $13.6 million claim covering both Consulting Services and Construction Services. In addition, we recognized cost escalations in legacy MWH US-based water hard-bid projects for $16.3 million. Site conditions and issues including those with project management and craft labor impacted the execution of these projects. These hard-bid projects are near completion. Management believes a significant portion of the cost overruns may be recovered and claims against the parties believed to be responsible for causing many of these overruns have been or will be asserted in due course; however, the claims process for additional potential recoveries may take a long time to resolve. These projects were awarded a number of years ago, when Construction Services expanded to take on projects outside of their core regional areas of expertise, and we have placed a hold on our hard-bid work outside of our established areas.

Management’s Discussion and Analysis December 31, 2017 M-5 Stantec Inc.
Gross margin. Gross margin decreased—from 54.5% in Q4 16 to 52.9% in Q4 17—primarily because of cost escalations and extending project life completion dates for certain US-based hard-bid and UK-based waste-to-energy projects in Construction Services (described above). Buildings gross margin was impacted by the mix of projects, competitive pressures, and the integration of acquisitions from 2016. Also, gross margin in our US Water business was impacted by the divestiture of Innovyze, which operated at higher margins, and a downward revenue adjustment (noted above).
Administrative and marketing expenses. Administrative and marketing expenses as a percentage of net revenue increased—from 44.3% in Q4 16 to 44.9% in Q4 17—mainly due to a $6.2 million increase in our provision for self-insurance, and a $3 million increase in marketing and administrative labor due to lower utilization. These were partly offset by a $5.3 million decrease in our share-based compensation.
Other income. Other income increased $6.6 million mainly due to the realization of a $6.7 million gain on the sale of certain equities on our investments held for self-insured liabilities.
EBITDA. EBITDA decreased 16.3%—from $82.9 million in Q4 16 to $69.4 million in Q4 17. Adjusted EBITDA decreased 24.7%—from $83.8 million in Q4 16 to $63.1 million in Q4 17. Gross margin decreased in Consulting Services mainly due to project mix and the divestiture of Innovyze, which operated at higher margins. Gross margin decreased significantly in Construction Services because of project issues and cost escalations (described above). EBITDA as a percentage of net revenue was lower because of an increase in administrative and marketing expenses in Consulting Services mainly caused by a $6.2 million increase in our provision for self-insurance and lower utilization (described above).
Other. Amortization of intangibles decreased $2.0 million in Q4 17 compared to Q4 16 due to the Innovyze sale. Interest expense decreased $1.4 million due to a decrease in our outstanding long-term debt because during Q2 17 we repaid $221.3 million of our revolving credit facility using the proceeds we received from the Innovyze sale.
Taxes. We recorded $31.2 million in tax expenses associated with a one-time transition tax on deemed mandatory repatriations and a deferred income tax recovery of $12.6 million both as a result of the US tax reform enacted on December 22, 2017. (See the Income Taxes section of this report for more information.)
Net Income and EPS. Adjusted net income of $37.2 million was down $3.2 million, or 7.9%, compared to Q4 16. Net income of $11.2 million was down $18.2 million, or 61.9%. Adjusted diluted EPS was down from $0.35 in Q4 16 to $0.32 in Q4 17 and diluted earnings per share (EPS) was down from $0.26 in Q4 16 to $0.10 in Q4 17.
See the Fourth Quarter Results section of this report for more details on our Q4 17 results. (EBITDA, adjusted EBITDA, and adjusted net income are defined in the Definition of Non-IFRS Measures in the Critical Accounting Estimates, Developments, and Measures section—the “Definitions section”—of this report.)
Other Q4 17 Information
On October 27, 2017, we acquired certain assets and liabilities of North State Resources Inc. (NSR), adding approximately 60 staff to our Company. Based in Redding, California, NSR provides expertise in physical, biological, and environmental sciences.
Subsequent to the quarter end, on February 21, 2018, we declared a cash dividend of $0.1375 per share, payable on April 12, 2018, to shareholders of record on March 29, 2018, an increase of 10.0% from last year.

Management’s Discussion and Analysis December 31, 2017 M-6 Stantec Inc.
Highlights – Full Year 2017 Results Results Compared to Targets
In the Management’s Discussion and Analysis in our 2016 Annual Report, we established various target ranges of expected performance measures for fiscal year 2017. The following table presents those results:
We met all of the targets listed above except net income as a percentage of net revenue. Tax impacts related to the US tax reform and a corporate reorganization reduced net income by $18.6 million and $3.2 million respectively. In addition, net income was impacted by the Innovyze sale because the $54.6 million gain on the sale was more than offset by the associated income tax expense of $94.5 million. Without these impacts and excluding the downward revenue adjustments and cost escalations incurred by Construction Services (described above), our net income as a percentage of net revenue would have met our targeted range. (See the Income Taxes section of this report for more details.) EBITDA as a percentage of net revenue was also impacted by the $54.6 million gain on the sale of Innovyze. Without this impact, EBITDA as a percentage of net revenue would have been 10.8%.
Measure 2017 Target Range Results Achieved
Gross margin as % of net revenue Between 53% and 55% 53.5%Administrative and marketing expenses as % of net revenue Between 41% and 43% 42.8%EBITDA as % of net revenue (notes 1 and 2) Between 11% and 13% 12.4%Net income as % of net revenue At or above 5% 2.8%x
Met or performed better than target.x Did not meet target.
note 1: EBITDA as a percentage of net revenue is calculated as EBITDA, divided by net revenue.note 2: EBITDA is a non-IFRS measure (discussed in the Definitions section of our 2017 Annual Report).
(In millions of Canadian dollars, except percentages) $ % of NR $ % of NR $ % of NR
Gross revenue 4,028.7 126.9% 1,111.4 456.4% 5,140.1 150.4%Net revenue 3,173.8 100.0% 243.5 100.0% 3,417.3 100.0%Gross margin 1,761.9 55.5% 66.0 27.1% 1,827.9 53.5%Administrative, marketing, and other expenses 1,400.3 44.1% 64.2 26.4% 1,464.5 42.9%
Adjusted EBITDA (note) 361.6 11.4% 1.8 0.7% 363.4 10.6%Acquisition-related costs 0.4 0.0%Loss on sale of property and equipment 0.2 0.0%Rebalancing of investments held for self-insured liabilities (6.7) (0.2% )Gain on disposition of a subsidiary (54.6) (1.6% )
Total EBITDA (note) 424.1 12.4%note: Adjusted EBITDA and EBITDA are non-IFRS measures (discussed in the Definitions section of this report)
2017
Consulting Construction Total

Management’s Discussion and Analysis December 31, 2017 M-7 Stantec Inc.
Gross and net revenue. Gross revenue was up 19.5% to $5,140.1 million and net revenue was up 10.3% to $3,417.3 million compared to 2016. Gross and net revenue saw positive organic growth of 3.6% and 0.1% respectively. Revenue growth was mainly due to acquisitions completed in 2016 and 2017. Organic growth in our Consulting Services – Canada and Consulting Services – Global reportable segments was partly offset by retraction in our Consulting Services – United States, in particular, in our Water and Environmental Services business operating units. Energy & Resources had organic growth due to increased activity in our Mining and Power sectors. Our Construction Services segment achieved organic gross revenue growth of 18.3%. Organic and acquisition revenue growth were partly offset by the impact of foreign exchange rates.
The gross to net revenue ratio for Consulting Services increased slightly from 2016 to 2017. The gross to net revenue ratio in our Energy & Resources and Environmental Services business operating units increased because a higher proportion of projects involved subconsultants in 2017 than in 2016 and certain projects included more flow-through expenses. The Buildings business operating unit gross to net revenue ratio increased because we inherited commitments to outside consultants from firms we acquired and we partnered with outside consultants on several major pursuits. As well, Consulting Services – Global saw an increase in subcontractor work in Environmental Services in southern Europe.
In Construction Services, the gross to net revenue ratio increased from 3.8 in 2016 to 4.6 in 2017 due to the mix of projects; in 2017, projects had a higher proportion of subcontracted work and increased flow-through costs to the client.
Gross margin. Gross margin as a percentage of net revenue decreased—from 54.1% in 2016 to 53.5% in 2017— mainly in Construction Services. This resulted from cost escalations and the extensions to project life completion dates for certain UK-based waste-to-energy projects and higher costs on certain US-based hard-bid projects, particularly in the fourth quarter. Gross margin for Consulting Services increased mainly in the Infrastructure business operating unit, a result of the mix of projects and improved margins in Transportation.
Administrative and marketing expenses. Administrative and marketing expenses as a percentage of net revenue decreased—from 43.1% in 2016 to 42.8% in 2017. Excluding the impact of $14.5 million in acquisition-related costs incurred in 2016 (mainly related to the MWH acquisition); our administrative and marketing expenses was 42.6% in 2016 compared to 42.8% in 2017, a slight increase year over year. This increase was impacted by a $12.0 million increase in IT costs because we migrated to cloud-based software and developed our global platform and core network infrastructure. Also, there was a $13.3 million increase in actuarial estimates associated with the provision for self-insurance mainly due to the addition of MWH. We incurred a $3.9 million increase in our professional and audit fees for regulatory and planning activities such as SOX compliance for the legacy MWH business and tax advice regarding the US tax reform and out-from-under tax planning. In addition,
(In millions of Canadian dollars, except percentages) $ % of NR $ % of NR $ % of NR
Gross revenue 3,654.9 124.9% 645.2 375.8% 4,300.1 138.8%Net revenue 2,926.7 100.0% 171.7 100.0% 3,098.4 100.0%Gross margin 1,612.8 55.1% 63.5 37.0% 1,676.3 54.1%Administrative, marketing, and other expenses 1,271.2 43.4% 52.8 30.8% 1,324.0 42.7%
Adjusted EBITDA (note) 341.6 11.7% 10.7 6.2% 352.3 11.4%Acquisition-related costs 14.5 0.5%Loss on sale of property and equipment 1.5 0.0%
Total EBITDA (note) 336.3 10.9%
note: Adjusted EBITDA and EBITDA are non-IFRS measures (discussed in the Definitions section of this report)
2016
Consulting Construction Total

Management’s Discussion and Analysis December 31, 2017 M-8 Stantec Inc.
we incurred approximately $3.5 million in costs related to integration activities for MWH. These higher costs were partly offset by an $11.3 million decrease in occupancy and lease exit costs and a $3.5 million decrease in severance payments.
Other income. Other income increased $10.2 million mainly due to the realization of a $6.7 million gain on the sale of equities on our investments held for self-insured liabilities.
We also recorded a $54.6 million gain on the sale of Innovyze in Q2 17.
EBITDA. EBITDA increased 26.1%—from $336.3 million in 2016 to $424.1 million in 2017. Adjusted EBITDA increased 3.2%—from $352.3 million in 2016 to $363.4 million in 2017. Adjusted EBITDA as a percentage of net revenue remained fairly constant year over year for Consulting Services. Construction Services EBITDA was impacted by cost escalations and revenue adjustments on certain projects (discussed previously).
Other. Amortization of intangible assets increased $4.5 million in 2017 compared to 2016 due to the increase in backlog and client relationships mainly from the MWH acquisition. This was partly offset by the sale of Innovyze.
Interest expense decreased $2.8 million due to a $3.9 million breakage fee on our senior secured notes in 2016. In addition, we had a decrease in our outstanding long-term debt in 2017 compared to 2016, partly offset by an increase in interest rates on our revolving credit facility.
Taxes. The reported annual tax rate of 63.2%, or $166.5 million, was impacted by out-from-under tax planning, the US tax reform bill, and the sale of Innovyze. A tax expense of $3.2 million was incurred because of a corporate reorganization that realigned certain global entities under a common UK parent company to make our corporate tax and organization structures more efficient. We recorded $31.2 million in tax expenses associated with a one-time transition tax on deemed mandatory repatriations and a deferred income tax recovery of $12.6 million, both a result of the US tax reform. Additionally, we recorded a $94.5 million net tax expense related to the sale of Innovyze. (See the Income Taxes section of this report for more information.) The effective income tax rate adjusted for all the items listed above is 24.0%.
Net income and EPS. Adjusted net income was $202.0 million—up $20.9 million or 11.5% from 2016. Net income was $97.0 million—down $33.5 million or 25.7% from 2016. Adjusted diluted EPS was up from $1.69 in 2016 to $1.77 in 2017, and diluted EPS was down from $1.22 in 2016 to $0.85 in 2017.
For further details regarding our overall annual performance, refer to the Financial Performance section of this report.
Strategic Activities. In 2017, we continued to grow by consistently executing our strategy. The following highlights major strategic activities in 2017 that contributed to our financial performance and overall financial condition:
• Divestiture of Innovyze. On May 5, 2017, we closed the sale of Innovyze, resulting in a pre-tax gain of $54.6 million in Q2 17. We saw this as an opportunity to continue working with Innovyze in servicing our clients while allowing both companies to prosper with the best available resources. We received gross proceeds of $369.1 million (US$270.0 million), less working capital adjustments and transaction costs. From a balance sheet perspective, the sale reduced our goodwill by $194.4 million and intangible assets by $95.1 million, and we reduced our revolving credit facility by $221.3 million.
Management’s Discussion and Analysis December 31, 2017 M-9 Stantec Inc.
• Growth through acquisition. By successfully executing our acquisition and integration strategy, acquisitions completed in 2017 and 2016 contributed $760.3 million and $364.4 million to our year-over-year growth in gross revenue and net revenue, respectively.
• Synergies achieved. When we announced the MWH acquisition on March 29, 2016, we outlined our anticipated synergies of approximately US$25 million—cost synergies of US$15 million and revenue synergies of US$10 million. As of the end of Q4 17, we exceeded our anticipated amount of US$25 million. Cost synergies were due primarily to reducing labor, eliminating corporate costs, reducing accounting fees, and savings from consolidating real estate. We also realized savings by realigning our combined insurance and employee benefit plans. We continue to achieve revenue synergies as we win work together that we would not be able to win if MWH and Stantec were separate companies.
• Integration. As of January 1, 2018, we are branded globally as “Stantec,” a significant milestone in our integration process. We have rolled out collaboration tools like common email, skype, and calendar access to ensure that we can find the right people to work on projects around the world. We will continue to invest in streamlining our common enterprise systems to improve our operational efficiency.
• Strong backlog. Our contract backlog remains consistent—$3.9 billion at December 31 in 2017 and 2016. Increases in our backlog due to organic and acquisition growth were offset by the strengthening Canadian dollar—from US$0.74 to US$0.80. (Backlog, a non-IFRS measure, is further discussed in the Definitions section of this report.)
• Evolution of Company leadership. Following a nine-year tenure, Bob Gomes retired from his role as president & CEO effective December 31, 2017, and he became a director on Stantec’s board. Gordon Johnston was selected by the board of directors to assume the role of president & CEO effective January 1, 2018. Gord has more than 30 years of industry leadership experience, including more than 20 years with Stantec.
During Q4 17, Stantec announced Steve Fleck’s promotion to the newly created position of chief practice and project officer (CPO) effective January 1, 2018. Following a successful tenure as an executive vice president leading the firm’s Project Delivery Office, Steve will manage the strategic positioning, contractual elements, and governance of Stantec’s largest projects while overseeing alternative project delivery. He has nearly 35 years of industry leadership experience, including more than 10 years with Stantec.
Subsequent to the year end, Richard Bradeen of Montreal, Quebec, was elected as a new director of our board. Richard served as senior vice-president of Strategy, Mergers & Acquisitions, Pension Investments, Corporate Audit Services, and Risk Assessment for Bombardier Inc. Prior to that, he worked at Ernst & Young for 19 years, holding increasingly senior roles including partner and president of the Corporate Finance Group in Toronto, Ontario. Richard will also serve on the board’s Audit and Risk Committee.
Management’s Discussion and Analysis December 31, 2017 M-10 Stantec Inc.
Outlook The following discussion includes forward-looking statements. For an outline of the material risks and assumptions associated with these statements, refer to the Cautionary Note Regarding Forward-Looking Statements section of this report.
Organic Revenue Growth
We expect organic gross revenue growth in 2018 to be in the low- to mid-single digits, in line with global GDP growth, and we continue to target a long-term average compound gross revenue growth rate of 15% through a combination of organic and acquisition growth.
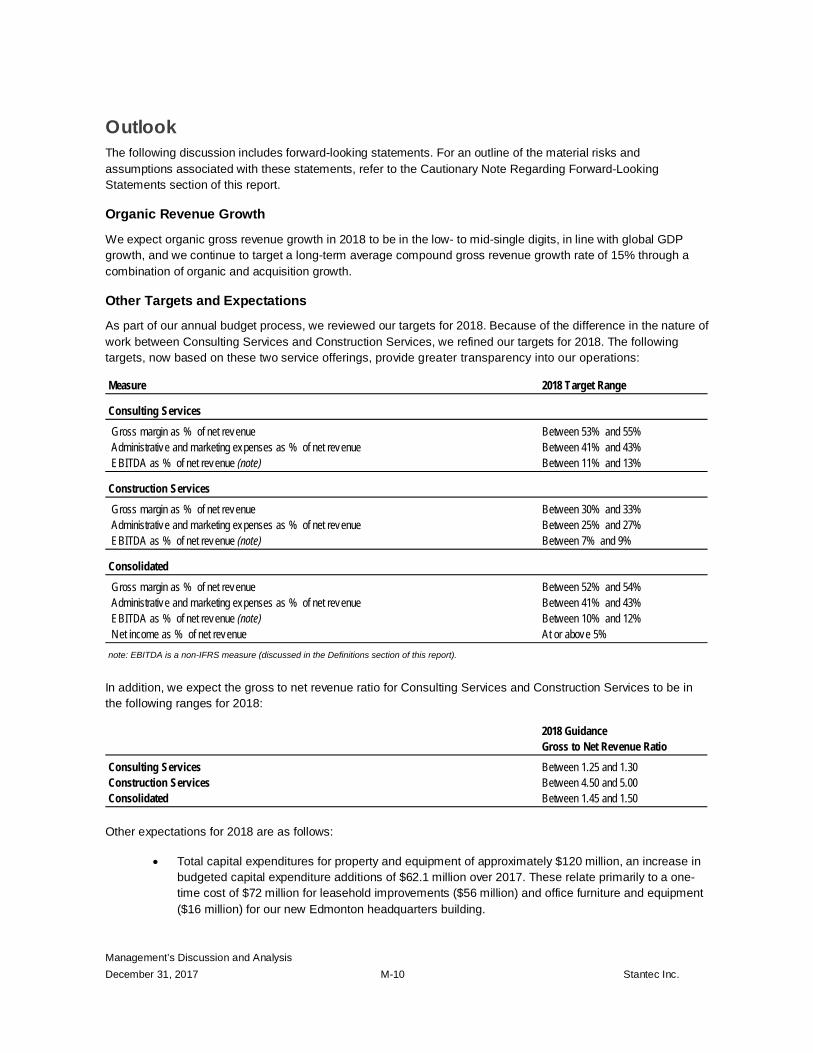
Other Targets and Expectations
As part of our annual budget process, we reviewed our targets for 2018. Because of the difference in the nature of work between Consulting Services and Construction Services, we refined our targets for 2018. The following targets, now based on these two service offerings, provide greater transparency into our operations:
In addition, we expect the gross to net revenue ratio for Consulting Services and Construction Services to be in the following ranges for 2018:
Other expectations for 2018 are as follows:
• Total capital expenditures for property and equipment of approximately $120 million, an increase in budgeted capital expenditure additions of $62.1 million over 2017. These relate primarily to a one-time cost of $72 million for leasehold improvements ($56 million) and office furniture and equipment ($16 million) for our new Edmonton headquarters building.
Measure 2018 Target Range
Consulting Services Gross margin as % of net revenue Between 53% and 55% Administrative and marketing expenses as % of net revenue Between 41% and 43% EBITDA as % of net revenue (note) Between 11% and 13%
Construction Services Gross margin as % of net revenue Between 30% and 33% Administrative and marketing expenses as % of net revenue Between 25% and 27% EBITDA as % of net revenue (note) Between 7% and 9%
Consolidated Gross margin as % of net revenue Between 52% and 54% Administrative and marketing expenses as % of net revenue Between 41% and 43% EBITDA as % of net revenue (note) Between 10% and 12% Net income as % of net revenue At or above 5%note: EBITDA is a non-IFRS measure (discussed in the Definitions section of this report).
2018 GuidanceGross to Net Revenue Ratio
Consulting Services Between 1.25 and 1.30Construction Services Between 4.50 and 5.00Consolidated Between 1.45 and 1.50
Management’s Discussion and Analysis December 31, 2017 M-11 Stantec Inc.
• Record a one-time lease exit liability charge of approximately $15 million in Q4 18 because of the move to our new Edmonton office and in accordance with IFRS. However, Stantec will receive the full reimbursement of this exit liability from our new landlord, plus the reimbursement of $28 million for tenant improvements. These recoveries will be treated as an inducement and reduce our lease costs over the life of the new lease term.
• Amortization expense for intangible assets for the full year 2018 of approximately $53 million. The decrease in budgeted compared to actual amortization of $80.2 million in 2017 is due primarily to a decrease in the intangible asset balance remaining from the MWH acquisition.
• Software additions of approximately $31 million. The increase in budgeted software additions over actual additions of $5.7 million in 2017 relates mainly to renewing our Autodesk in 2018.
• We expect an effective tax rate of approximately 27% in 2018. which is based on the statutory rates in jurisdictions where we operate and on our estimated earnings in each of those jurisdictions. We review statutory rates, uncertain tax positions, and jurisdictional earnings quarterly and adjust our estimated income tax rate accordingly.
As well, we continue to anticipate enhancements to our information technology infrastructure and enterprise system; this will optimize and streamline business processes and prepare us for global growth. We are building this foundation for growth because we believe in integrating acquired operations onto a consistent platform.
The targets and expectations listed above exclude the impact of acquisitions that may occur in 2018. Actual performance for 2018 will fluctuate, particularly from quarter to quarter, depending on the mix of clients and projects and the number of acquisitions completed in the year. Fluctuations will also occur due to seasonality: the first and fourth quarters have the lowest revenue generation and project activity because of holidays and weather conditions in the northern hemisphere. We could exceed some targets if, for instance, we complete an opportune larger acquisition that impacts our administrative and marketing expenses or temporarily increases our debt level.
The infrastructure and facilities market is diverse, consisting of many sectors and industries in both the public and private sectors. Clients within this market require services from multiple disciplines and areas of expertise for projects of varying complexities across the project life cycle. Market size is affected by many factors, including capital spending plans of private sector clients, government allocations to infrastructure, and the range of alternative project delivery (APD) methods in certain sectors.
For 2018, our outlook was determined based on various expectations, including the following:
• Continued economic growth in the United States resulting from tax reform, growth in non-residential construction, and our progress toward building a top-tier position in the market
• Increased infrastructure spending through regulatory support and spending by provincial, state, and federal governments in Canada and the United States
• Modest improvement in the energy and resource sector compared to 2017 because oil and gas and commodity prices are expected to stabilize and slowly improve and companies are expected to increase capital spending
• Continued support for APD methods, including P3s, in Canada, and new opportunities for APD in the United States
• Moderate slowdown in the Canadian housing market offset by housing growth in the United States • Global economic growth and our ability to expand our global footprint
We base our outlook on successfully capitalizing on opportunities and strategic initiatives (described in the Strategy section of this report).

Management’s Discussion and Analysis December 31, 2017 M-12 Stantec Inc.
Overall Outlook
Because of our diversity of operations, mix of clients, and flexible business model, as well as our ability to position our Company to work effectively in local communities and on national opportunities, we believe that we will continue to operate our business efficiently, to adapt our business to changing economic conditions, and to position ourselves for growth in a very large infrastructure and facilities market.
We expect to achieve a long-term average annual compound growth rate for gross revenue of 15%—a target we have met or exceeded since our initial public offering in 1994. This continued growth results from successfully executing our strategy, which means we can enhance the depth of our expertise, broaden our service offerings, increase our geographic presence in communities across North America and globally, provide expanded opportunities for our employees, and leverage our Integrated Management Systems. By further maximizing the critical mass and maturity we have achieved in certain sectors and geographic locations, we can increase our business with key clients and sell our services across local markets.
Our ability to expand depends on our strategic efforts to grow organically and the availability of acquisition opportunities. We believe our opportunities to expand have increased: the MWH acquisition in 2016 resulted in a larger global footprint. We do not expect to encounter constraints in 2018 when looking for available acquisition candidates because of our past success and the trend in our industry—smaller firms wanting to join larger and more stable organizations. At any particular time, we are discussing consolidation opportunities with many firms. Since we want an appropriate cultural fit and complementary services that can provide an accretive transaction, the acquisition process can extend over months, even years.
We continue to make significant progress on the integration of MWH. We have deployed key collaboration tools to the majority of the operations. We continue to evaluate and plan for the consolidation of our enterprise platforms, with the objective of streamlining where practical. Construction Services will not be integrated into Stantec’s Consulting Services platform and will continue to be reported as a separate segment of our business.
Strategy The following discussion includes forward-looking statements. For an outline of the material risks and assumptions associated with these statements, refer to the Cautionary Note Regarding Forward-Looking Statements at the end of this report.
Given the scale and diversity of our organization and the rapid evolution of the industry we operate within, we plan continually now, rather than following a three-year planning cycle. Starting with Plan 2018, we will create a new plan each year and evaluate and update it quarterly. Each annual plan will look forward five years or longer.
Reportable Segments
Our chief operating decision maker (chief executive officer) assesses our Company’s performance based on financial information available from our operating segments.
Our reportable segments (in accordance with IFRS) are based on our two primary service offerings—Consulting Services and Construction Services—and our regional geographic areas. The Company has four operating and reportable segments:
• Consulting Services – Canada • Consulting Services – United States • Consulting Services – Global • Construction Services

Management’s Discussion and Analysis December 31, 2017 M-13 Stantec Inc.
In our operational structure, we separate the construction business from the consulting business, which allows both streams of expertise to operate effectively and synergies to develop that complement but do not distract from the strategy of each business. However, the two businesses can be bundled when beneficial for the client. We are well positioned to leverage the strengths of each business to maintain and grow our number 1 position in the water market in the United Kingdom and achieve a strong position in the design-build market in the United States.
Business Model Our business model, a key element of our strategy, is based on providing services across diverse geographic regions, service specializations, and all phases of the infrastructure and facilities project life cycle—planning, design, construction, commissioning, maintenance, decommissioning, and remediation.
Because of our diverse model, we can generally adapt to changes in market conditions by offsetting a decreased demand for services in one business operating unit or geographic location with an increased demand in another. We believe this strategy helps us mitigate risk while we continue to increase our revenue and earnings. Also, we work on tens of thousands of projects for thousands of clients in hundreds of locations. This ensures we do not rely on a few large projects for our revenue.
The following information outlines the three main components of our business model: geographic diversification, service specialization, and life-cycle solutions.
Geographic Diversification
The first element of our business model is geographic diversification. Our Consulting Services business operates in three regional operating units—Canada, the United States, and Global—offering similar services across all regions. Our Construction Services business operates primarily in the United States and United Kingdom.
Canada
At December 31, 2017, we had over 7,500 employees in Canada. We benefit from a mature position within each region and view our strategic opportunities as follows:
• Grow our Canadian operations in facilities, pipelines, ports and marine terminals, waterpower and dams, health, education, mixed-use urbanization, and civic markets.
• Pursue business expansion opportunities in our Water business operating unit and Transportation sector in the Greater Toronto Area and the rest of Ontario, and in the Atlantic and British Columbia regions.
• Within our Energy & Resources business operating unit, capitalize on opportunities in alternative energy—specifically wind, hydro, and co-generation—and in carbon capture. For the oil sands, focus on emerging technology and sustaining capital opportunities.
• Continue to capitalize on opportunities in public-private partnerships (P3s) in the Transportation sector and Water and Buildings business operating units.
• Using the strength of our Indigenous partnerships and connection to our local communities, to pursue First Nations opportunities due to increased funding that has been outlined by the federal government.

Management’s Discussion and Analysis December 31, 2017 M-14 Stantec Inc.
United States
At December 31, 2017, we had approximately 9,800 employees in the United States (including 800 in Construction Services). Due to acquisitions completed over the past number of years, we are achieving critical mass and diversity in many sectors and geographies. We will remain focused on strengthening our service capabilities and reaching maturity in the markets we serve. We view our strategic opportunities as follows:
• Renew emphasis on expanding our Federal Services group.
• Continue to grow the Urban Places initiative, which gathers experts across a wide range of disciplines to help communities across the globe increase livability, equity, and sustainability.
• Fill in gaps in geography in our Water business operating unit, focusing on Texas.
• Continue to look for opportunities to expand our Environmental Services and Energy & Resources business operating units across the United States, focusing on the US West.
• In Energy & Resources, focus on acquiring firms in Houston and the US Northeast that have international capabilities in midstream integrity services.
• Continue to expand and diversify our US Buildings business from healthcare, education and commercial in existing geographies while continuing to integrate recently acquired firms and adding critical mass in the US West and Southeast.
Global
At December 31, 2017, we had over 5,000 employees outside North America (including 1,100 in Construction Services, all located in the United Kingdom). We view our strategic opportunities as follows:
• Grow our Australia and New Zealand operations to be a top-tier provider in multiple sectors so that we can operate at an optimum economic scale. In the short term, we will build on the MWH brand in Water and Transportation in Australia and New Zealand to leverage Stantec’s services and reputation in local market sectors.
• Grow our UK operations by diversifying into the most attractive UK business sectors and align them with the wider Stantec capabilities. Solidify and protect our top-tier presence in the water market by delivering our current AMP6 contracts and positioning for AMP7.
• Consolidate and strengthen our position and enhance our performance in other Global geographies, while further reviewing and planning the next stages of our Global business.
Service Specialization
The second element of our business model, service specialization, is discussed below (broken down by our two primary services: Consulting Services and Construction Services).
Consulting Services
Consulting Services currently represents approximately 80% of our overall gross revenue (93% of our overall net revenue). We provide professional consulting services in engineering, architecture, interior design, landscape architecture, surveying, environmental services, project management, and project economics under fee-for-service agreements with clients.

Management’s Discussion and Analysis December 31, 2017 M-15 Stantec Inc.
During 2017, Consulting Services had five specialized business operating units; within these five business operating units, we focus on sectors that our clients operate in. By better understanding our clients’ goals, the market influences, and our business drivers, we can offer multidisciplinary solutions to meet their needs.
Buildings We generate most revenue in our Buildings business operating unit by providing pre-design, design, and construction administration services in planning, architecture, buildings engineering, and interior design services for vertical infrastructure. Most revenue comes from private sector and institutional clients, the rest from public sector clients.
Energy & Resources We generate most revenue in our Energy & Resources business operating unit from industrial engineering, project management, and construction management services primarily for private sector clients.
Environmental Services We generate most revenue in our Environmental Services business operating unit by providing front-end environmental services for private sector clients and remediation activities for private and public sector clients. Environmental Services provides services across all Company sectors—7.0% of its revenue is generated from our Energy & Resources business operating unit.

Management’s Discussion and Analysis December 31, 2017 M-16 Stantec Inc.
Infrastructure We generate most revenue in our Infrastructure business operating unit by providing front-end design and engineering services; a small portion of this comes from project and construction management services.
Our Community Development sector primarily serves private sector clients. Our Transportation sector serves public sector clients for the most part, but a growth area is providing services using alternative project delivery methods.
Water We generate revenue in our Water business operating unit by providing front-end design and engineering and construction management services.
Construction Services
Construction Services currently represents approximately 20% of our overall gross revenue (7% of our overall net revenue). We provide construction and construction management services mainly on water-related projects for key long-term clients. The main contract types in this segment generally fall into four functional areas:
• Construction and construction management • Design-build and progressive design-build • Construction management in support of design completed by Consulting Services • Hard-bid construction with self-performance
In the United States, we offer start-to-finish construction capabilities to municipal, utility, federal, and industrial clients, including commissioning and start-up services. In the United Kingdom, we participate primarily in design-build water and wastewater projects through joint ventures and alliance agreements.
Life-Cycle Solutions
Life-cycle solutions is the third element of our business model. We provide professional services in all phases of the project life cycle: planning, design, construction, commissioning, maintenance, decommissioning, and remediation. This inclusive approach enables us to (1) deliver services during periods of strong new capital project activity (design and construction) and periods of redevelopment and operational spending activity (maintenance, integrity management, and remediation) and (2) maintain long-term client relationships throughout the life of a project or an infrastructure asset.
Beginning with the planning and design stages, we provide conceptual and detailed design services, conduct feasibility studies, and prepare plans and specifications. During the construction phase, we generally act as the owner’s representative, providing project management, construction management, surveying, and resident engineering services. In our Consulting Services business, we focus principally on fee-for-service work and rarely act as the contractor or take on construction risk. In our Construction Services business, we provide construction and construction management at-risk services. During the maintenance phase that follows project completion, we provide ongoing professional services for integrity management, as well as for maintenance and rehabilitation projects such as facilities and infrastructure management, facilities operations, and performance engineering. In the final decommissioning phase, we provide solutions, recommendations, and remediation strategies for taking facilities out of active service.

Management’s Discussion and Analysis December 31, 2017 M-17 Stantec Inc.
Key Performance Drivers and Capabilities Key External Drivers Consulting Services
Our Consulting Services business is driven by external industry factors that affect the demand for our services.
Buildings Our Buildings business operating unit is driven by a combination of factors, such as economic outlook, technological advancements, aging infrastructure, resiliency trends, regulatory changes, P3 project complexity, population growth, urbanization, and demographic changes. Drivers specific to our key market sectors include the following: infrastructure renewal and expansion (Airports & Aviation), US healthcare reform (Healthcare), the incorporation of full automation in warehousing and the supply chain (Industrial), transit-oriented developments (Commercial), transit infrastructure (Civic), and a focus on skilled learning to bridge workforce gaps (Education and Science & Technology).
Energy & Resources Our Energy & Resources business operating unit is driven primarily by supply and demand for commodities both globally and locally. Our Oil & Gas and Mining sectors are impacted by economics, commodity prices, cost reduction and efficiencies, technological advancements, and political and regulatory drivers (including carbon emission reductions). Other considerations include alternative fuels, aging infrastructure, and energy efficiency trends. These highly cyclical sectors can experience rapid and dramatic fluctuations in price and supply and demand.
Our Power sector is more of an infrastructure business, but economic activity also affects power demand and therefore impacts this market. Regulations, infrastructure age, the location of supply and demand for transmission and distribution, and renewable subsidization also influence activity in our Power sector.
For the WaterPower & Dams sector, significant drivers include climate change and the associated demand for hydroelectric power, both as a renewable generation source and for its ability to integrate other renewables (wind and solar). Aging infrastructure results in the need to rehabilitate, modernize, and upgrade existing dam and hydroelectric facilities.
Environmental Services Our Environmental Services business operating unit performs services in various capacities across all Company sectors, though most significantly in our Energy & Resources business operating unit and our Transportation and Commercial sectors. Therefore, the drivers for Environmental Services overlap with those affecting other business operating units. Following are the most significant drivers affecting Environmental Services: economic and political conditions, environmental regulations, emphasis on public safety and disaster resiliency, demand for emergency site remediation planning and cleanups, Indigenous involvement in resource-based projects, technology mega trends and increased spending on infrastructure improvements.
Infrastructure Our Infrastructure business operating unit is driven by a combination of economic, demographic, urbanization and housing, technology, public funding, and regulatory factors. Additional drivers include oil prices, employment rates, interest rates, public and active transport usage, technological advancements, aging infrastructure, resiliency trends, regulatory changes, elections, and alternative project delivery. Drivers specific to key market sectors include the housing-affordability crisis (Community Development), connected and autonomous vehicles (Transportation), and Smart Cities and design-build (Transportation). Overall, this business operating unit relies heavily on local and regional clients and benefits from Stantec’s strong community presence.

Management’s Discussion and Analysis December 31, 2017 M-18 Stantec Inc.
Water Our Water business operating unit completes work for both private and public sector entities. Water is driven primarily by regulations, increased water demands, changing nature of water supplies, and public funding. Our primary drivers include aging infrastructure, resiliency strategies, demographic shifts, climate change, globalization and geopolitics, technology, and economic mega-cycles.
Construction Services
Key performance drivers for Construction Services are similar to the drivers for the Water business operating unit in Consulting Services. Specifically, trends that are expected to impact water infrastructure requirements and drive growth in the sector include demographic shifts, water scarcity, climate change, globalization and geopolitics, technology, and economic cycles. Design-build opportunities in the water market also mean that we can bundle our Construction Services with our Consulting Services to better capture more of these opportunities.
Key Internal Drivers Growth opportunities
We aim to achieve consistent growth and profitability by sustaining excellence and remaining committed to our clients, employees, shareholders, and our diversification strategy.
We effectively service our existing regional and local clients, develop new client relationships, and grow our reputation and business where opportunities exist. This approach to market presence makes us less likely to be affected by downturns in regional economies.
Organic growth has been and continues to be an element of our strategy. To achieve growth, we leverage client relationships by cross-selling, following a sector-based approach, and by delivering our Account Management and our strategic pursuits and campaign programs. We refine internal strategies that promote a culture of revenue generation in all areas of our Company.
Acquisitions are also key to our strategy. Increasing the depth of our capabilities and broadening our geographic coverage leads to growth and better client service. For 2018, we will continue to follow our successful acquisition strategy for North America: we will maintain operational excellence, coordinate acquisition timing with integration efforts, and thoughtfully select targets that meet our sector and regional needs. Beyond North America, we will focus on growing our United Kingdom, Australia, and New Zealand operations.
Employees
Our people remain at the core of what we do. We strive to attract and retain the best employees in the field and are committed to supporting, fostering, and investing in each employee’s success through a culture of opportunity, equity, development, diversity, and innovation. Specific career streams provide employees with career development direction and growth opportunities based on their primary area of interest. We also have a formalized succession planning process and offer a number of leadership programs. Our Diversity and Inclusion (D&I) Councils foster a workplace that supports the unique differences of our clients and employees.
We measure the success of our various employee initiatives through retention rates, employee surveys, 360-degree feedback, and exit interviews. The results help us develop future programs and initiatives.
Senior leadership
Our Executive Vice President Team (EVPT) is made up of our senior leaders: the chief executive officer (CEO), chief financial officer (CFO), chief operating officer (COO), chief business officer (CBO), chief practice and project officer (CPO), and executive vice presidents (EVPs). The EVPT oversees the Company’s overall performance,

Management’s Discussion and Analysis December 31, 2017 M-19 Stantec Inc.
including developing and monitoring our business plan, monitoring financial performance and risks, approving policies and procedures, and overseeing acquisitions and divestitures. EVPs are specifically responsible for the performance of our reportable segments and business operating units.
Our ability to align the activities of our senior leadership and other key employees with our short- and long-term financial and strategic goals is a key driver of our success. In addition to fixed salaries, we provide short- and long-term compensation on a discretionary basis. For additional information regarding our executive compensation, refer to our Management Information Circular.
Account Management and strategic pursuits
Over the last two years, we have evolved our Account Management platform to improve our ability to gather client intelligence information, improve pursuit tracking, and enable our leadership teams to more actively engage with our clients. We regularly survey our clients to improve our performance by better understanding their needs.
To increase the effectiveness of our strategic positioning activities, a multipronged Position to Win Program was launched in 2017 and will continue to evolve in 2018. A standard and consistent business development framework provides a common sales process and sales language, enabling Stantec employees to work better together to propel our organic growth.
Alternative project delivery
We continue to put only a portion of our project bid fee at risk in return for a success fee in our public-private partnership (P3) and design projects. When appropriate, we will consider putting more of our upfront fee at risk in return for a higher success fee or for some long-term equity in the project. In 2018, we will continue this approach, and this potential upfront investment will continue to be used selectively on projects with the right risk oversight, terms and conditions, and project and partner combinations and will be subject to the review and approval of the Major Project Risk Committee before proposing the concept to our partners.
Creativity & Innovation Program
The Creativity & Innovation (C&I) Program is designed to support our people to explore new and enhanced services or solutions that benefit us, our clients, and our communities, and that enhance our reputation, competitive position, and, ultimately, our financial performance. The program is intended to provide annual monetary and non-monetary support and visibility to creativity and innovation in all its forms, both in the services that we bring to our clients and the services that support our internal operations.
External positioning
We bring our industry expertise and leading-edge creativity to the geographic areas we serve. The closer we are to our clients, the more we can build strong, successful working relationships. Through technology, effective communication, collaboration, and combined knowledge, our teams provide services and solutions from different geographic locations across the Company.
Ethics and integrity
Our reputation remains a significant asset; therefore, our focus continues to be on aligning our actions and decisions with our ethics and integrity policies. One way we ensure this is by conducting annual mandatory ethics, integrity, and anti-corruption compliance training for all employees. We articulate our high standard of business practices through our Project Management Framework, Code of Business Conduct, and policies and practices. We also engage an outside agency to monitor, review, and report any issues identified through our Integrity Hotline.

Management’s Discussion and Analysis December 31, 2017 M-20 Stantec Inc.
Health, safety, security, and environment
We work together for safety—at work, at home, and in our communities. We foster a safety culture that encourages making safe choices for ourselves and those around us so we all return home safely each day. Our Occupational Health and Safety Management System helps our employees, clients, and subcontractors understand the health, safety, security, and environmental risks related to their work so that they can identify hazards and assess and manage risk. We conduct regular audits and inspections, provide employee training, and maintain stringent hazard recognition and control processes.
Project Management
Since the MWH acquisition, we have incorporated best practices from both companies to help create integrated PM tools and processes, and in 2018 we will continue to build out our Project Management (PM) Ecosystem, processes, and tools that support project management, including embedding the PM career path. The enhanced tools and processes will help us share work more easily, manage our business better, and speak a common PM language, resulting in the PM leadership we need to execute projects exceptionally. We believe these enhancements will be key differentiators and catalysts for growth in the competitive marketplace.
We understand the need to enhance our earned value management culture, regularly update project processes, and recognize the revenue we earn based on the progress we achieve. Integrating the legacy MWH project financial management processes with Stantec’s legacy processes has provided Stantec with a robust set of business processes that drive earned value. We have incorporated these processes into our Integrated Management Platform and will deploy them through 2018.
We always strive to enhance our project execution and forecasting ability and to facilitate more efficient resource management. Currently, we use a diverse range of tools, including our Enterprise Management System, to execute projects effectively, and we will continue to invest in these tools in 2018.
Practice technology and global platform development
Our Company embraces digital technologies that help us improve and deliver professional services to clients. We have a dedicated Practice Technology team that studies and develops new technology solutions to ensure market differentiation, drive productivity gains, and bring industry recognition for innovation to Stantec. We also recognize the importance of cybersecurity and therefore have a comprehensive IT security program designed to predict, prevent, detect, and respond to cybersecurity threats. (Cybersecurity is further described in the Risk Factors section of this report.)
The global platform development and integration of Stantec’s business processes, practices, and systems continues in 2018. We need to closely manage scope by standardizing current Stantec North American business and system practices wherever possible, unless local legislation or critical client requirements need to be met.
Sustainability
At Stantec, sustainability means reducing the environmental impacts and improving the social impacts of our operations while governing ourselves responsibly. Through the services we offer, we help our clients do the same.

Management’s Discussion and Analysis December 31, 2017 M-21 Stantec Inc.
Our clients deal with escalating temperatures, water scarcity, unprecedented storms, social protests, and loss of biodiversity. Through the services we offer, we respond to these significant climate change-related challenges and promote sustainable development. Stantec sustainability professionals design LEED buildings and renewable energy systems, engineer net-zero and net-positive energy buildings, develop greenhouse gas inventories and energy action plans, provide clean water through water and wastewater treatment, deliver water reuse and recycling solutions, support sustainable supply chain capacity building, and incorporate sustainability practices into infrastructure design by applying the Envision rating system.
In our internal operations, we take responsibility for the impacts of our operations and choose approaches of least impact to the environment through an ISO-certified environmental management system as well as emission, energy, and waste-reduction programs.
Stantec tracks and reports our progress in our annual Sustainability Report (compliant with the Global Reporting Initiative) and our submissions to the Carbon Disclosure Project (CDP). We have participated in the United Nations Global Compact since 2015 and actively support the UN Sustainable Development Goals.
Community engagement
Our purpose is to create communities. We target donating up to 1% of our annual pre-tax profits through direct cash contributions or services in kind to charitable and not-for-profit endeavors in the arts, in education, in the environment, and in health and wellness.
In 2017, our Company contributed approximately $3 million to community engagement activities in arts, education, environment, and health and wellness. In addition to these funds, we continued to give back to our communities by volunteering, fundraising, and partnering with charitable and community organizations to work on social projects, environmental projects, and charitable initiatives. For example, as part of our Company-wide Stantec in the Community Week, more than 5,000 employees helped over 400 community organizations across 6 continents.
In every region, we make decisions with local input. We recognize that local employees best understand how to match our resources and capabilities to our communities’ priorities and how to provide support to the organizations that make a difference. Corporately, we provide the framework that guides decision making, ensuring our community investments align with our organizational objectives and resonate with our employees and business leaders in the communities we serve.
Financing
Our continued ability to finance our growth plan supports our success. Adequate financing gives us the flexibility to acquire firms that are appropriate for our vision and complement our business model.
Since the public trading of our shares began on the Toronto Stock Exchange (TSX) in 1994, we have increased our gross revenue at a compound annual rate of 19.3%. To fund acquisition growth, we require cash generated from both internal and external sources. Historically, we have completed acquisitions almost entirely by using cash generated from operations, credit facilities, and vendor notes. However, under certain favorable market conditions, we do consider issuing common shares to facilitate acquisition growth or to reduce borrowings under our credit facilities.

Management’s Discussion and Analysis December 31, 2017 M-22 Stantec Inc.
Financial Performance Selected Annual Information The following table highlights trending of certain annual information:
Acquisitions Consideration for acquisitions completed was $28.4 million in 2017 and $1.2 billion in 2016. We completed the following acquisitions in 2017:
• On April 28, 2017, we acquired certain assets and liabilities of Inventrix Engineering, Inc. (Inventrix), adding 22 staff to our Company. Inventrix, based in Seattle, Washington, provides expertise in mechanical engineering.
• On July 28, 2017, we acquired all the shares and business of RNL Facilities Corporation (RNL), adding approximately 130 staff to our Company. Based in Denver, Colorado, RNL provides expertise in architecture, interior design, urban design, and landscaping.
• On October 27, 2017, we acquired certain assets and liabilities of North State Resources, Inc. (NSR), adding approximately 60 staff to our Company. Based in Redding, California, NSR provides expertise in physical, biological, and environmental sciences.
Divestitures On May 5, 2017, we completed the sale of the shares of our software business, Innovyze, to the EQT Mid Market US fund, part of the international alternative investments firm EQT, for gross proceeds of $369.1 million (US$270 million), less working capital adjustments, resulting in net cash proceeds of $336.9 million. This sale transaction resulted in an accounting gain of $54.6 million. We recorded a tax expense of $94.5 million on this transaction resulting in an after-tax negative impact to net income of $39.9 million.
2017 vs. 2016 vs.2017 2016 (%) 2016 2015 (%) 2015
Gross revenue 5,140.1 19.5% 4,300.1 49.5% 2,877.2Net revenue 3,417.3 10.3% 3,098.4 30.5% 2,373.7EBITDA (note) 424.1 26.1% 336.3 9.8% 306.3Adjusted EBITDA (note) 363.4 3.2% 352.3 15.5% 305.1Net income 97.0 (25.7% ) 130.5 (16.6% ) 156.4Adjusted net income (note) 202.0 11.5% 181.1 (4.1% ) 173.9EPS – basic 0.85 (30.3% ) 1.22 (26.5% ) 1.66EPS – diluted 0.85 (30.3% ) 1.22 (26.1% ) 1.65Adjusted EPS – basic (note) 1.77 4.7% 1.69 (8.6% ) 1.85Adjusted EPS – diluted (note) 1.77 4.7% 1.69 (8.2% ) 1.84Cash div idends declared per common share 0.50 11.1% 0.45 7.1% 0.42
Total assets 3,880.9 (9.4% ) 4,284.7 83.0% 2,341.9Total long-term debt 739.6 (27.5% ) 1,020.5 179.3% 365.4
note: EBITDA, adjusted EBITDA, adjusted net income, and adjusted basic and diluted earnings per share (EPS) are non-IFRS measures and are further discussed in the Definitions section of this report.
(In millions of Canadian dollars, except per share amounts and percentages)
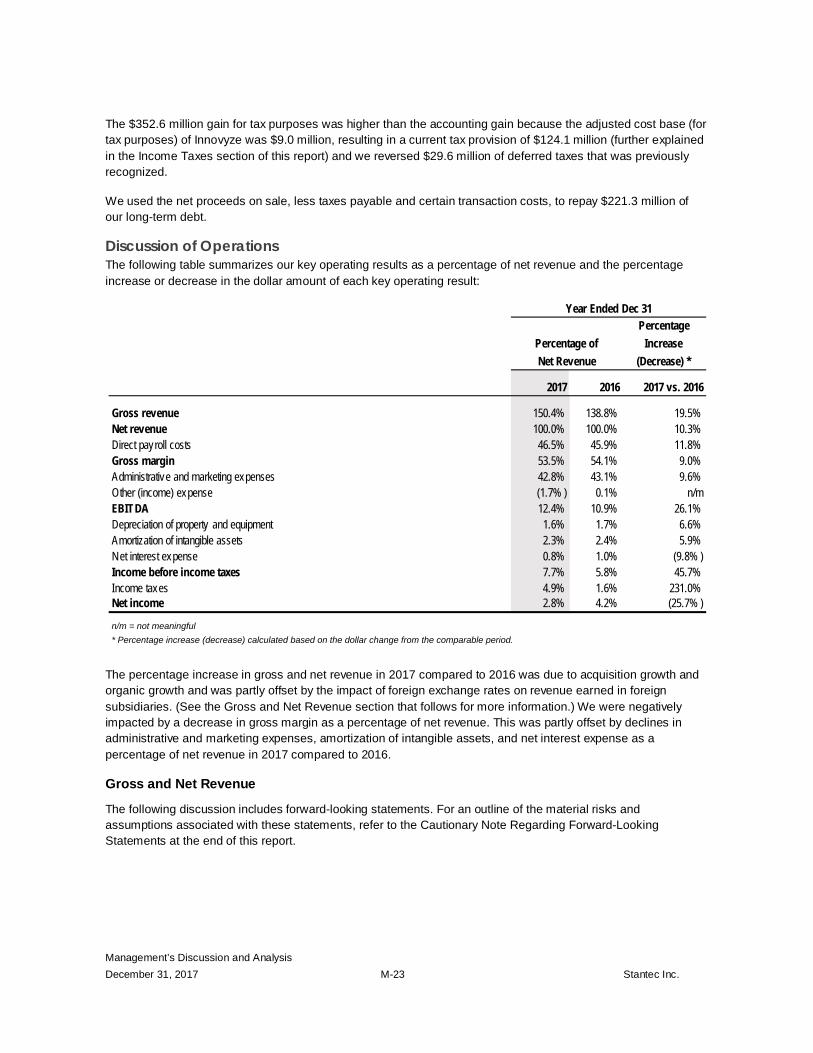
Management’s Discussion and Analysis December 31, 2017 M-23 Stantec Inc.
The $352.6 million gain for tax purposes was higher than the accounting gain because the adjusted cost base (for tax purposes) of Innovyze was $9.0 million, resulting in a current tax provision of $124.1 million (further explained in the Income Taxes section of this report) and we reversed $29.6 million of deferred taxes that was previously recognized.
We used the net proceeds on sale, less taxes payable and certain transaction costs, to repay $221.3 million of our long-term debt.
Discussion of Operations The following table summarizes our key operating results as a percentage of net revenue and the percentage increase or decrease in the dollar amount of each key operating result:
The percentage increase in gross and net revenue in 2017 compared to 2016 was due to acquisition growth and organic growth and was partly offset by the impact of foreign exchange rates on revenue earned in foreign subsidiaries. (See the Gross and Net Revenue section that follows for more information.) We were negatively impacted by a decrease in gross margin as a percentage of net revenue. This was partly offset by declines in administrative and marketing expenses, amortization of intangible assets, and net interest expense as a percentage of net revenue in 2017 compared to 2016.
Gross and Net Revenue
The following discussion includes forward-looking statements. For an outline of the material risks and assumptions associated with these statements, refer to the Cautionary Note Regarding Forward-Looking Statements at the end of this report.
Percentage Increase
(Decrease) *
2017 2016 2017 vs. 2016
Gross revenue 150.4% 138.8% 19.5%Net revenue 100.0% 100.0% 10.3%Direct payroll costs 46.5% 45.9% 11.8%Gross margin 53.5% 54.1% 9.0%Administrative and marketing expenses 42.8% 43.1% 9.6%Other (income) expense (1.7% ) 0.1% n/mEBITDA 12.4% 10.9% 26.1%Depreciation of property and equipment 1.6% 1.7% 6.6%Amortization of intangible assets 2.3% 2.4% 5.9%Net interest expense 0.8% 1.0% (9.8% )Income before income taxes 7.7% 5.8% 45.7%Income taxes 4.9% 1.6% 231.0%Net income 2.8% 4.2% (25.7% )
n/m = not meaningful
Year Ended Dec 31
Percentage of Net Revenue
* Percentage increase (decrease) calculated based on the dollar change from the comparable period.

Management’s Discussion and Analysis December 31, 2017 M-24 Stantec Inc.
While providing professional services, we incur certain direct costs for subconsultants, equipment, and other expenditures that are recoverable directly from our clients. Revenue associated with these direct costs is included in gross revenue. Because these direct costs and associated revenue can vary significantly from contract to contract, changes in gross revenue may not be indicative of our revenue trends. Accordingly, we also report net revenue (which is gross revenue less subconsultant, subcontractor, and other direct expenses) and analyze results in relation to net revenue rather than gross revenue.
The difference between gross revenue and net revenue is larger for construction-related projects than for consulting-related projects since Construction Services incurs proportionately higher costs. For construction projects, we use subcontractors to provide specialized building services such as earthwork, HVAC, electrical, piping, local craft labor, and design- and engineering-related services. Construction direct costs include expenditures for insurance, travel, and meals, and purchases of materials and equipment (such as membranes, pumps, steel, concrete, aggregate, pipe, and electrical components) to install into facilities.
For this analysis and in the tables that follow, revenue earned by acquired companies in the first 12 months following an acquisition is reported initially as revenue from acquisitions and thereafter as organic revenue.
Consulting Services generates approximately 70% of gross revenue in foreign currencies primarily in US dollars. Construction Services generates gross revenue primarily in British pound sterling and US dollars. Fluctuations in these currencies had a $75.4 million negative impact on our gross revenue results in 2017 compared to 2016 as further described below:
• The Canadian dollar averaged US$0.76 in 2016 and US$0.77 in 2017—a 1.3% increase. The strengthening Canadian dollar had a negative effect on gross and net revenue in 2017 compared to 2016.
• The Canadian dollar averaged GBP0.58 in 2016 and GBP0.60 in 2017—a 3.4% increase. The strengthening Canadian dollar had a negative effect on gross and net revenue in 2017 compared to 2016.
Fluctuations in other foreign currencies did not have a material impact on our gross and net revenue in 2017 compared to 2016.
Our contract backlog was $3.9 billion at December 31, 2017—$2.8 billion in Consulting Services and $1.1 billion in Construction Services—which is consistent with December 31, 2016. Backlog increased organically but was offset by the strengthening Canadian dollar. We define “backlog” as the total value of secured work that has not yet been completed where we have an executed contract or a letter of intent that management is reasonably assured will be finalized in a formal contract. (Backlog, a non-IFRS measure, is further described in the Definitions section of this report.) Only approximately the first 12 to 18 months of the total value of secured work for a project is included in contract backlog.

Management’s Discussion and Analysis December 31, 2017 M-25 Stantec Inc.
Acquisitions
Following is a list of acquisitions completed in 2016 and 2017 that impacted our four reportable segments and our five business operating units within Consulting Services:
Gross Revenue and Net Revenue by Reportable Segments
The following charts and tables summarize gross and net revenue as well as gross and net revenue growth in our two service offerings and four reportable segments:
REPORTABLE SEGMENTSMONTH
ACQUIRED BuildingsEnergy &
ResourcesEnvironmental
Services Infrastructure Water
Consulting Services - CanadaMWH May 2016
Arch | TB Dec. 2016
Consulting Services - United StatesBury Mar. 2016
MWH May 2016
VOA May 2016
Edwards & Zuck Sept. 2016
Inventrix Apr. 2017
RNL Jul. 2017
NSR Oct. 2017
Consulting Services - GlobalMWH May 2016
RNL Jul. 2017
Construction ServicesMWH May 2016 n/a n/a n/a n/a n/a
n/a = not applicable
CONSULTING SERVICES - BUSINESS OPERATING UNITS

Management’s Discussion and Analysis December 31, 2017 M-26 Stantec Inc.
Consulting Services – Canada
In our Consulting Services – Canada operations, gross revenue increased 2.0% and net revenue increased 0.7% in 2017 compared to 2016. Organic gross revenue grew 1.1% and organic net revenue grew 0.1% in 2017 compared to 2016. Organic revenue growth was seen primarily in our Mining and Power sectors and our Buildings and Infrastructure business operating units; this growth was partly offset by retraction in our Oil & Gas and WaterPower & Dams sectors and our Environmental Services business operating unit.
Gross Revenue by Reportable Segment
(In millions of Canadian dollars, except percentages) 2017 2016
Total Change
Change Due to Net
Acquisitions (Divestitures)
Change Due to
Foreign Exchange
Change Due to Organic
Growth (Retraction)
% of Organic
Growth (Retraction)
Consulting ServicesCanada 1,191.7 1,168.8 22.9 10.0 n/a 12.9 1.1%United States 2,226.0 2,062.9 163.1 209.5 (40.3) (6.1) (0.3% )Global 611.0 423.2 187.8 167.9 (10.4) 30.3 7.2%
Total Consulting Serv ices 4,028.7 3,654.9 373.8 387.4 (50.7) 37.1Percentage growth (retraction) 10.6% (1.4%) 1.0%
Construction Services 1,111.4 645.2 466.2 372.9 (24.7) 118.0 Percentage growth (retraction) 57.8% (3.8%) 18.3%
Total 5,140.1 4,300.1 840.0 760.3 (75.4) 155.1 3.6%
n/a = not applicablenote: Comparative figures have been reclassified due to a realignment between Consulting Services—United States and Consulting Services—Global reportable segments.
Net Revenue by Reportable Segment
(In millions of Canadian dollars, except percentages) 2017 2016
Total Change
Change Due to Net
Acquisitions (Divestitures)
Change Due to
Foreign Exchange
Change Due to Organic
Growth (Retraction)
% of Organic
Growth (Retraction)
Consulting ServicesCanada 1,027.6 1,020.6 7.0 6.3 n/a 0.7 0.1%United States 1,714.7 1,595.9 118.8 149.5 (30.6) (0.1) 0.0%Global 431.5 310.2 121.3 119.4 (6.7) 8.6 2.8%
Total Consulting Serv ices 3,173.8 2,926.7 247.1 275.2 (37.3) 9.2 Percentage growth (retraction) 9.4% (1.3%) 0.3%
Construction Services 243.5 171.7 71.8 89.2 (10.2) (7.2) Percentage growth (retraction) 52.0% (5.9%) (4.2%)
Total 3,417.3 3,098.4 318.9 364.4 (47.5) 2.0 0.1%
n/a = not applicablenote: Comparative figures have been reclassified due to a realignment between Consulting Services—United States and Consulting Services—Global reportable segments.

Management’s Discussion and Analysis December 31, 2017 M-27 Stantec Inc.
Our Buildings business operating unit saw organic growth in 2017 in Ontario, Alberta, and British Columbia because of the mobilization of new project wins. This growth was offset by retraction in the other provinces due to fee pressures, reduced government spending, and private sector investment slowing down because of soft commodity prices.
In our Energy & Resources business operating unit, our Oil & Gas sector experienced organic revenue retraction. Our Canadian Power operations were impacted by the slowdown in capital spending by oil and gas clients, so we increased our focus on renewable energy in Alberta, Saskatchewan, and Ontario. Our additional focus on the industrial market has resulted in major wins and an improved backlog. Growth in our Power sector in the Atlantic region offset retractions in other parts of Canada. Mining revenues grew organically in 2017 compared to 2016 because we secured a major project in Q2 17.
In our Environmental Services business operating unit, revenue retracted in 2017 compared to 2016, mainly in the oil and gas market in western Canada. This was partly offset by growth in other provinces. Environmental Services continued to face pricing pressure as clients reviewed their supply chain for opportunities to gain efficiencies; therefore, our margins were impacted. Organic revenue retraction slowed, as evidenced by recent wins, including some new clients and an increase in small project opportunities. Although the oil and gas and mining markets were challenged across North America, we maintained our backlog because of our strong emphasis on operations and maintenance programs and the award and execution of a few assessment projects. We saw growth in government infrastructure spending, including spending for Indigenous communities.
The Community Development sector in our Infrastructure business operating unit saw strong growth in eastern Canada and southern Alberta; however, central and northern Alberta retracted due to the continuing weakness in the oil and gas market. Alberta is in the early stages of economic recovery. We expect it will be some time before business volume increases and competitive pressure on fees softens. Because of increased government investment in infrastructure, we had new opportunities to pursue interdisciplinary services: for example, we secured the Calgary Foothills Cancer Centre and the Calgary Green Line Light Rail Transit Corridor projects.
Also, in the Infrastructure business operating unit, our Transportation business—in particular, our Transit & Rail sector—continued to show organic growth, benefiting from 2016 provincial budgets that provided stimuli for infrastructure spending. Significant investment in transit markets in Alberta and British Columbia was partly offset by retraction in our Quebec operations because existing large-scale projects were winding down.
Our Water business operating unit had slight growth in 2017 compared to 2016. Growth in eastern Canada was partly offset by retraction in western Canada and Quebec. Major projects were completed in Alberta and the economy slowed down in the Prairie provinces (a result of the continued slowdown in natural resource revenues). This slowdown impacted greenfield and brownfield investments in water and wastewater infrastructure.
Consulting Services – United States
In our Consulting Services – United States operations, gross revenue increased 7.9% and net revenue increased 7.4% in 2017 compared to 2016. Revenue grew in 2016 compared to 2017 because of acquisition growth mainly in our Buildings and Water business operating units. Organic gross revenue retracted by 0.3% and organic net revenue was flat in 2017 compared to 2016. The retraction in organic revenue was largely driven by our Water and Environmental Services business operating units and offset by organic growth in our Buildings and Infrastructure business operating units and WaterPower & Dams and Power sectors.
Organic gross revenue growth in our Buildings business operating unit resulted mainly from steady activity in the healthcare and commercial markets; we saw increased opportunities in the southwestern United States, particularly in our Education sector.

Management’s Discussion and Analysis December 31, 2017 M-28 Stantec Inc.
In our Energy & Resources business operating unit, WaterPower & Dams had large new projects in the West. Growth in our Power business was assisted by renewable energy and distributed power generation along with continued penetration in the transmission and distribution markets.
Our Environmental Services business operating unit was impacted by low commodity prices, reduced capital spending, the winding down of some larger projects, and the effect of decreased rates due to downward pricing pressures in the oil and gas sector. The retraction was partly offset by growth in our Power and Transportation sectors. We experienced increased activity in airport, rail, and highway and road projects, particularly in our eastern US operations, and we saw strong backlog spread across all our primary sectors. We expanded our services in the manufacturing sector to serve MWH’s key legacy clients.
In our Infrastructure business operating unit, our Community Development sector benefited from favorable and stable market indicators, including employment rates, housing demand, interest rates, and economic conditions.
Growth in the Transportation sector of our Infrastructure business operating unit was moderate, impacted by a retraction in our Central operations because significant projects—such as the State Highway 288 Toll Lanes and Loop I-375—are nearing design completion and certain projects in Ohio and Illinois have been delayed. Otherwise, an expanding US economy and our North American strategic market position led to an increase in organic growth opportunities, especially in APD. Because of our maturity and prominence in the Transportation sector, we are more selective when choosing the construction consortiums we want to team with in this expanding APD market, we attract top talent more easily, and we increase our diversity. Plus, our maturity in numerous locations throughout North America and our ability to serve our clients on all projects, regardless of size or prominence, better position us to compete in both large and small markets. Growth in Transportation was also positively influenced by a renewed investment in infrastructure, particularly in the Northeast, and localized gas tax increases in some states.
The Water business operating unit experienced organic gross and net revenue retraction in 2017 compared to 2016. This was due primarily to the $5 million downward revenue adjustment on a major design-build project, resulting from additional costs and design and project scope issues. Our core consulting business was flat year over year with retraction in the West and Pacific Northwest offset by growth in APDs and in the South and Southwest. In the Water Program Management group, several major tasks and entire programs that were active in 2016 ended shortly after year-end. Further, work on the Atlanta, San Jose, San Diego, and Willamette programs slowed down temporarily. However, amendments have been signed for additional work for these programs.
Consulting Services – Global
In our Consulting Services – Global operations, gross revenue increased 44.4% and net revenue increased 39.1% in 2017 compared to 2016. Acquisition revenue increased because of the MWH acquisition in 2016. Organic gross revenue grew 7.2% and organic net revenue grew 2.8% in 2017 compared to 2016.
In our Environmental Services business operating unit, we experienced organic revenue growth, fueled by increased private sector activity in southern Europe. We also experienced growth in our environmental remediation offerings in northern Europe.
Our Water business operating unit experienced year-over-year growth in 2017. The UK Water business saw continued strong revenue volume through the Asset Management Programme 6 (AMP6) cycle. As well, the Water sector in Australia and New Zealand benefited from higher public sector spending. These gains were partly offset by retraction in water-related foreign aid project business and retraction in our Middle East operations where infrastructure spending in the region was impacted by political uncertainty and low energy prices.

Management’s Discussion and Analysis December 31, 2017 M-29 Stantec Inc.
Organic revenue growth was offset by softness in our WaterPower & Dams sector and Buildings business operating unit. The decline in our WaterPower & Dams revenue was due to the completion of the Panama Canal Third Set of Locks project. Revenue in our Buildings business operating unit was down primarily in the Middle East, an area impacted by low energy prices and political instability. We also saw a decline in the Mining sector over the previous year. Because of project delays and cancellations, Mining revenue was down in Latin America and Australia, where capital spending by mining companies remains depressed. But the mining sector did show signs of recovery as the year progressed.
Highlights of projects secured in 2017 include a commissioning by the Regional Transit Authority (RTA) of the Government of Dubai to develop a Code of Practice. This will provide manufacturers with clarity on the nature of the upcoming regulatory and testing framework that the RTA will implement on the path to full deployment of self-driving vehicles on Dubai's roads. We were also awarded a contract to design upgrades to State Highway 58 in New Zealand.
Construction Services
In our Construction Services operations, gross revenue increased 72.3% and net revenue increased 41.8% in 2017 compared to 2016. Organic gross revenue grew 18.3% and organic net revenue retracted 4.2% in 2017 compared to 2016. Construction Services revenue was generated primarily in the United States and United Kingdom. The United States generated $697.2 million in gross revenue ($122.0 million in net revenue). In Florida, Texas, and the western United States, we had significant and steady work on a number of major water and wastewater treatment plant construction projects. Also, activity increased on a major commercial contract in the western United States; under this contract, we are performing the construction management and project management services for a major manufacturer.
The remaining $414.2 million in gross revenue ($121.5 million in net revenue) was earned mainly in the United Kingdom, driven by ongoing construction activities for water utilities in the third year of the Asset Management Programme 6 (AMP6) cycle.
Gross Revenue and Net Revenue by Consulting Services – Business Operating Units
The following tables summarize gross revenue and gross revenue growth in our five Consulting Services business operating units—Buildings, Energy & Resources, Environmental Services, Infrastructure, and Water:
Gross Revenue by Consulting Services - Business Operating Unit
(In millions of Canadian dollars, except percentages) 2017 2016
Total Change
Change Due to Net
Acquisitions (Divestitures)
Change Due to
Foreign Exchange
Change Due to Organic
Growth (Retraction)
% of Organic
Growth (Retraction)
Consulting ServicesBuildings 898.1 818.2 79.9 85.2 (10.6) 5.3 0.6%Energy & Resources 479.2 418.5 60.7 57.6 (8.4) 11.5 2.7%Environmental Serv ices 683.8 636.5 47.3 55.4 (5.8) (2.3) (0.4% )Infrastructure 1,090.4 1,059.7 30.7 20.4 (13.9) 24.2 2.3%Water 877.2 722.0 155.2 168.8 (12.0) (1.6) (0.2% )
Total Consulting Serv ices 4,028.7 3,654.9 373.8 387.4 (50.7) 37.1 Percentage growth (retraction) 10.6% (1.4%) 1.0%
note: Comparative figures have been reclassified due to a realignment of several business lines.

Management’s Discussion and Analysis December 31, 2017 M-30 Stantec Inc.
Buildings Organic gross and net revenue in the Buildings business operating unit were both flat when comparing 2017 to 2016. Organic revenue was impacted by the decline in the oil and gas markets, which affected private and public spending in our western Canadian and Middle East operations. The declines in Canada were offset by significant project wins, primarily in the healthcare sector. In the United States, gross revenue increased partly due to strategic acquisitions completed in 2016. We also benefited from the urbanization trend across North America as inner cities are revitalized. Our Civic sector provided a range of services that responded to these needs.
Highlights of projects secured in 2017 include design-build services for Phase One of the Royal Columbian Hospital Redevelopment Project in New Westminster, British Columbia, which includes a new acute mental health and substance use building, an energy center, a data center, underground parking, and other upgrades. We also secured a contract to design the Colorado Rockies West Lot, a mixed-use entertainment facility—approximately 650,000 square feet (60,000 square metres)—adjacent to the Colorado Rockies baseball stadium in Denver, Colorado. During Q4 17, we secured two student housing projects for the University of California, Davis (Orchard Park and West Village). We will serve as subcontractor to Pyatok for this project, providing interior design, landscape design, and MEP (mechanical, electrical, and plumbing). Stantec will serve as Prime Architect for the West Village project, while also providing interior design, landscape design, and MEP.
Energy & Resources In our Energy & Resources business operating unit, Mining had increased activity in Canada and Power experienced growth in Canada and the United States. However, we experienced organic revenue retraction in our Oil & Gas sector and Global Mining sector. Sustained weakness in the oil and gas sector in Canada continued to impact our engineering services. Despite a slowdown caused by uncertain market conditions, our midstream business in our Oil & Gas sector continued to be awarded new work because of our strong client relationships. In our Power sector, we secured projects because of infrastructure improvement, environmental compliance, and resiliency requirements in the transmission and distribution and the power replacement markets. Our Mining sector’s organic revenue growth was positive in 2017 because of improvements in the mining market. The 2016 retraction was challenging for our Mining sector, but the number of small and midsized capital project opportunities resulted in a turnaround in 2017.
In 2017, Stantec helped ensure that California’s Oroville Dam Spillway repairs were completed in time for the winter weather. Stantec’s efforts included the design, construction management, and biological monitoring to replace a key transmission line under threat of washout from erosions caused by the spillway damage; the engineering design, construction management, and oversight of the Oroville Spillway Recovery Project; as well as
Net Revenue by Consulting Services - Business Operating Unit
(In millions of Canadian dollars, except percentages) 2017 2016
Total Change
Change Due to Net
Acquisitions (Divestitures)
Change Due to
Foreign Exchange
Change Due to Organic
Growth (Retraction)
% of Organic
Growth (Retraction)
Consulting ServicesBuildings 714.8 665.8 49.0 61.3 (8.0) (4.3) (0.6% )Energy & Resources 401.5 367.9 33.6 44.9 (6.3) (5.0) (1.4% )Environmental Serv ices 458.9 443.1 15.8 29.3 (2.8) (10.7) (2.4% )Infrastructure 899.1 866.2 32.9 17.9 (10.7) 25.7 3.0%Water 699.5 583.7 115.8 121.8 (9.5) 3.5 0.6%
Total Consulting Serv ices 3,173.8 2,926.7 247.1 275.2 (37.3) 9.2 Percentage growth (retraction) 9.4% (1.3%) 0.3%
note: Comparative figures have been reclassified due to a realignment of several business lines.

Management’s Discussion and Analysis December 31, 2017 M-31 Stantec Inc.
the ongoing Federal Energy Regulatory Commission (FERC) relicensing (since 2000) and implementation (since 2007) for the entire Oroville Facilities Project.
Highlights of other significant projects secured in 2017 include the design work for the Gross Reservoir Expansion Project in Colorado, which will raise the dam’s height from 340 to 471 feet (from 104 to 144 metres), tripling its water storage and providing water for an additional 54,000 single-family homes per year. We also secured a contract to provide underground mining engineering design and reserve estimation for a platinum mine in South Africa.
Environmental Services Environmental Services was impacted by low commodity prices and reduced capital spending, primarily in the midstream oil and gas sector. This led to delays and cancellations and put downward pressure on project fees. Existing large-scale projects continued to wind down; however, the oil and gas industry showed signs of increasing activity in late 2017. Our North American operations continued to win a stream of smaller lower-margin projects because of our strong client relationships and industry expertise, and larger opportunities are emerging in the western Canada midstream sector.
Highlights of projects awarded in 2017 include a contract to conduct specialized technical studies (such as air and water quality) for projects undertaken by the Los Angeles Department of Water and Power. We will also provide environmental assessment and documentation services, assistance with permit acquisition, and mitigation monitoring. As well, we won a contract to provide environmental inspection support for Pacific Gas and Electric Company’s (PG&E’s) Environmental Inspections Program, specifically supporting their Air-Water-Hazardous Materials team to ensure that PG&E’s construction activities comply with environmental requirements and laws and regulations.
Infrastructure In our Infrastructure business operating unit, our Community Development sector had organic growth in 2017 compared to 2016 since both Canada and the United States experienced stable demand for housing, continued interest in Canadian and US urban design projects, and an increase in mixed-use commercial projects. Plus, our Transportation sector saw organic growth due to increased revenue across all major subsectors.
Highlights of projects secured in 2017 include Stantec joining a Traffic and Transportation Engineering Professional Services panel to provide efficient professional services for small to midsized transportation projects in Auckland, New Zealand, from 2017 to 2022. In addition, our Community Development team won the Alberta Infrastructure contract to provide project management, preliminary design, detailed design, and construction management for the next five years on the 2,000-acre (809-hectare) Parsons Creek master-planned community development in Fort McMurray, Alberta. We also won a bid to lead design services on the 9.8-mile (15.7-kilometre) Long Island Rail Road Third Track Expansion Project in New York state.
Water In our Water business operating unit, our Canadian business experienced organic revenue growth, and our Global business had strong organic revenue growth. This growth was offset by retraction in the United States due to the downward revenue adjustment on a major design-build project and temporary slowdowns in the Water Program Management group. Our gross revenue acquisition growth of $168.8 million is net of a $26.4 million reduction in revenue in 2017 compared to 2016 due to the sale of Innovzye.
Highlights of projects awarded in 2017 include the construction management services for the Willamette Water Supply Program, a US$1.2 billion project to develop a resilient and redundant water supply for communities in Washington County, Oregon. We were also awarded a contract to implement an inspection and enforcement program for industrial and commercial facilities using New York City’s Municipal Separate Storm Sewer System, which captures and diverts stormwater runoff to protect and improve the city’s water quality. In addition, Yorkshire Water appointed Stantec to be its strategic planning partner for the United Kingdom’s Asset Management
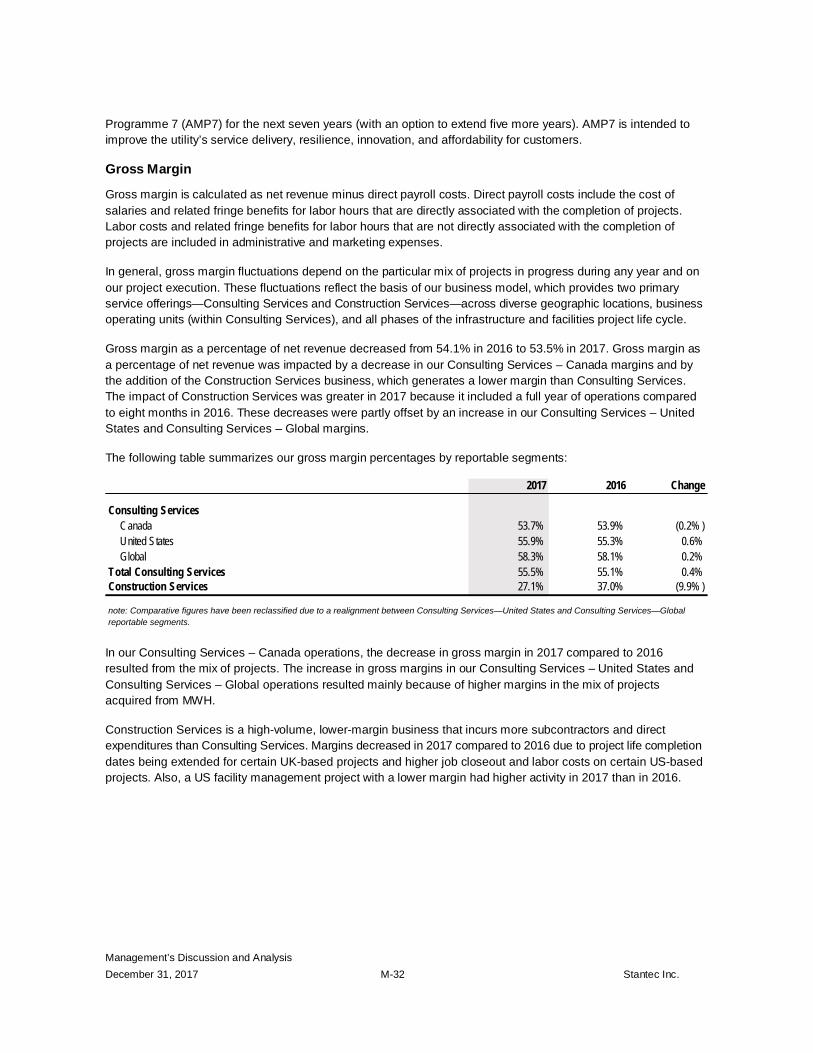
Management’s Discussion and Analysis December 31, 2017 M-32 Stantec Inc.
Programme 7 (AMP7) for the next seven years (with an option to extend five more years). AMP7 is intended to improve the utility’s service delivery, resilience, innovation, and affordability for customers.
Gross Margin
Gross margin is calculated as net revenue minus direct payroll costs. Direct payroll costs include the cost of salaries and related fringe benefits for labor hours that are directly associated with the completion of projects. Labor costs and related fringe benefits for labor hours that are not directly associated with the completion of projects are included in administrative and marketing expenses.
In general, gross margin fluctuations depend on the particular mix of projects in progress during any year and on our project execution. These fluctuations reflect the basis of our business model, which provides two primary service offerings—Consulting Services and Construction Services—across diverse geographic locations, business operating units (within Consulting Services), and all phases of the infrastructure and facilities project life cycle.
Gross margin as a percentage of net revenue decreased from 54.1% in 2016 to 53.5% in 2017. Gross margin as a percentage of net revenue was impacted by a decrease in our Consulting Services – Canada margins and by the addition of the Construction Services business, which generates a lower margin than Consulting Services. The impact of Construction Services was greater in 2017 because it included a full year of operations compared to eight months in 2016. These decreases were partly offset by an increase in our Consulting Services – United States and Consulting Services – Global margins.
The following table summarizes our gross margin percentages by reportable segments:
In our Consulting Services – Canada operations, the decrease in gross margin in 2017 compared to 2016 resulted from the mix of projects. The increase in gross margins in our Consulting Services – United States and Consulting Services – Global operations resulted mainly because of higher margins in the mix of projects acquired from MWH.
Construction Services is a high-volume, lower-margin business that incurs more subcontractors and direct expenditures than Consulting Services. Margins decreased in 2017 compared to 2016 due to project life completion dates being extended for certain UK-based projects and higher job closeout and labor costs on certain US-based projects. Also, a US facility management project with a lower margin had higher activity in 2017 than in 2016.
2017 2016 Change
Consulting ServicesCanada 53.7% 53.9% (0.2% )United States 55.9% 55.3% 0.6%Global 58.3% 58.1% 0.2%
Total Consulting Services 55.5% 55.1% 0.4%Construction Services 27.1% 37.0% (9.9% )
note: Comparative figures have been reclassified due to a realignment between Consulting Services—United States and Consulting Services—Global reportable segments.

Management’s Discussion and Analysis December 31, 2017 M-33 Stantec Inc.
The following table summarizes our gross margin percentages by business operating unit for Consulting Services:
In our Buildings business operating unit, gross margin increased in 2017 compared to 2016 as a result of lower employee costs and an increase in contract revenue on a major project in the Middle East. These increases were partly offset by a decrease in gross margins in our Canadian operations due to increased competition.
Our Energy & Resources business operating unit had higher margins in 2017 than in 2016, mainly due to the mix of projects acquired from MWH. In Canada, reduced capital investment in our Oil & Gas and Mining sectors resulted in reduced margins on projects that were awarded in the year.
Our Environmental Services business operating unit had lower margins, mainly because of clients’ downward pressures on fees and reduced subconsultant markups in response to economic challenges in certain markets, especially in the oil and gas industry in our Canadian operations. In the United States, gross margins remained relatively flat while Global gross margins grew in 2017.
Infrastructure had higher margins in 2017 than in 2016 due to the mix of projects and improved margins in Transportation, which led to higher utilization and efficiencies. This market has improved, resulting in a reduced impact from low-cost competitors. Another positive influence on margin was the completion of a major project that provided negative revenue impacts in 2016.
Water had lower margins in 2017 than in 2016 due to the May 5, 2017, divestiture of Innovyze; as a software business, Innovyze operated at high margins.
Administrative and Marketing Expenses
As a percentage of net revenue, our administrative and marketing expenses decreased from 43.1% in 2016 to 42.8% in 2017, falling within the expected range of 41% to 43%. Excluding the impact of $14.5 million in acquisition-related costs in 2016, our administrative and marketing expense as a percentage of net revenue was 42.6% in 2016. Administrative and marketing expenses as a percentage of net revenue fluctuates from year to year because of the amount of staff time charged to marketing and administrative labor, which is influenced by the mix of projects in progress during the period as well as by business development and acquisition integration activities.
When 2016 is adjusted to 42.6%, administrative and marketing expenses as a percentage of net revenue remained consistent year over year. Cloud-based software subscriptions and customization costs and investments in our core infrastructure increased by approximately $12.0 million. Costs incurred for project and financial MWH Americas integration activities were approximately $3.5 million because of lower utilization. Our provision for self-insurance costs increased by $13.3 million mainly due to the inclusion of MWH. Professional and audit fees increased by $3.9 million because additional fees were incurred for regulatory and planning activities, such as SOX compliance and tax advice regarding the US tax reform, and for the reorganization of certain global entities to align them under a common UK parent company. These increases were partly offset by a $3.5 million reduction in severance payments and an $11.3 million decrease in lease exit and occupancy costs because we consolidated our offices and optimized our existing office space.
2017 2016 Change
Consulting ServicesBuildings 54.7% 54.5% 0.3%Energy & Resources 52.0% 51.1% 0.9%Environmental Serv ices 57.3% 57.6% (0.3% )Infrastructure 55.2% 53.3% 1.9%Water 57.6% 59.1% (1.5% )
Total Consulting Services 55.5% 55.1% 0.4%
note: Comparative figures have been reclassified due to a realignment of several business lines.

Management’s Discussion and Analysis December 31, 2017 M-34 Stantec Inc.
Depreciation of Property and Equipment
Depreciation increased $3.4 million year over year. As a percentage of net revenue, depreciation of property and equipment decreased from 1.7% in 2016 to 1.6% in 2017. This decrease is due to the following: (i) a decrease in additions to property and equipment as a percentage of net revenue over the last three years and (ii) a $2.5 million decrease because of a prospective change from declining balance to straight-line depreciation. Additions (excluding acquisitions) to property and equipment were $62.1 million in 2017 compared to $58.7 million in 2016. We spent more in 2017 on property and equipment because of an increase in the number of leasehold improvements made to various office locations and an increase in engineering equipment.
As a professional services organization, we are not capital intensive. In the past, we made capital expenditures mostly for items such as leasehold improvements, computer equipment, furniture, and other office and field equipment. The $62.1 million of additions to property and equipment was $12.9 million less than our budgeted $75.0 million (set at the beginning of 2017) because we had fewer additions to computer equipment than we anticipated. Our capital expenditures during 2017 were financed by cash flows from operations.
Intangible Assets
The timing of completed acquisitions, size of acquisitions, and type of intangible assets acquired impact the amount of amortization of intangible assets in a period. Client relationships are amortized over estimated useful lives ranging from 10 to 15 years, and contract backlog and finite-lived trademarks are generally amortized over an estimated useful life of 1 to 3 years. Consequently, the impact of the amortization of contract backlog can be significant in the 4 to 12 quarters following an acquisition. As at December 31, 2017, $10.3 million of the $262.4 million in intangible assets related to backlog.
The following table summarizes the amortization of identifiable intangible assets:
The $4.5 million increase in intangible asset amortization from 2016 to 2017 was mainly due to an increase in backlog and client relationships from acquisitions completed in 2016 and 2017. The MWH acquisition in 2016 added $315.3 million to intangible assets in 2016; this was partly offset by the Innovyze sale. During 2017, we added $11.8 million to intangible assets: $6.1 million from acquisitions and $5.7 million mainly from renewing various software agreements.
The $5.7 million in additions to intangible software was below our budgeted $15.0 million (set at the beginning of 2017), mainly because certain planned software purchases were postponed.
(In millions of Canadian dollars, except percentages) 2017 2016
Client relationships 30.2 26.8 Backlog 26.4 22.3 Software 17.2 21.6 Other 8.3 6.9 Lease disadvantage (1.9) (1.9)
Total amortization of intangible assets 80.2 75.7

Management’s Discussion and Analysis December 31, 2017 M-35 Stantec Inc.
In accordance with our accounting policies, we review intangible assets at each reporting period to determine whether there is an indication of impairment. To determine indicators of impairment, we consider external sources of information such as prevailing economic and market conditions. We also consider internal sources of information such as the historical and expected financial performance of the intangible assets. Based on our review of intangible assets at each reporting period in 2017 and 2016, there have been no material indications of impairment. (See the Critical Accounting Estimates in the Critical Accounting Estimates, Developments, and Measures section of this report for more information about the methodology used to test long-lived assets and intangibles for impairment.)
Net Interest Expense
Net interest expense decreased by $2.8 million in 2017 compared to 2016. This decrease was primarily due to a $3.9 million breakage fee on our senior secured notes in 2016 and a $280.9 million decrease in our outstanding long-term debt at December 31, 2017, compared to December 31, 2016. These decreases were partly offset by an increase in interest rates on our revolving credit facility.
Repayments to our revolving credit facility of $221.3 million were made from proceeds received from the Innovyze sale. Additionally, payments of $66.4 million on notes payable from previous acquisitions were made to decrease notes payables from $127.2 million at December 31, 2016 to $60.8 million at December 31, 2017. The average interest rate for our revolving credit facility and term loan was 3.2% at December 31, 2017, and 3.13% at December 31, 2016. The weighted average interest rate on our notes payable was 3.46% in 2017 and 3.45% in 2016.
Foreign Exchange Losses and Gains
We reported a foreign exchange loss of $0.1 million in 2017 and $0.7 million in 2016. These foreign exchange losses arose from the translation of the foreign-denominated assets and liabilities held in our Canadian, US, and other foreign subsidiaries. We minimize our exposure to foreign exchange fluctuations by matching foreign currency assets with foreign currency liabilities and, when appropriate, by entering into forward contracts to buy or sell foreign currencies in exchange for Canadian dollars. The foreign exchange losses in 2017 and 2016 were caused by the volatility of daily foreign exchange rates and the timing of the recognition and relief of foreign-denominated assets and liabilities.
As at December 31, 2017, we had no material foreign-currency forward contracts.
Income Taxes
Our 2017 effective income tax rate was 63.2% compared to 27.8% in 2016. Our effective tax rate increased as a result of the following transactions: $94.5 million in net tax expense related to the sale of Innovyze, a $31.2 million one-time transition tax on deemed repatriated earnings resulting from the US tax reform, and a $3.2 million corporate reorganization tax charge. These increases were offset by a net recovery of $12.6 million from remeasuring deferred tax assets and liabilities pursuant to the US tax reform. Without the impact of these items, the effective tax rate would be 24.0%. The decrease in our effective tax rate from 27.8% in 2016 to 24.0% in 2017 was mainly due to the recognition of tax credits against income earned in jurisdictions with higher tax rates.

Management’s Discussion and Analysis December 31, 2017 M-36 Stantec Inc.
Innovyze Sale
The sale of Innovyze had a net tax impact of $94.5 million on net income. The current tax provision of $124.1 million was partly offset by the reversal of $29.6 million of deferred taxes previously recorded. The taxable gain on the Innovyze sale was $352.6 million, which is higher than the $54.6 million accounting gain because the adjusted cost base of Innovyze was $9.0 million.
The shares of Innovyze were purchased as part of the MWH acquisition. Stantec acquired MWH in a taxable share acquisition where the tax basis of MWH’s shares was equal to the consideration paid. Special elections were not available to push down this consideration to the adjusted cost base of MWH’s subsidiaries. Therefore, the fair value of MWH’s assets purchased, including intangibles and goodwill, could not be considered when calculating the taxable gain on the Innovyze sale. In addition, for US federal tax purposes, the current tax due on the gain on the Innovyze sale was taxed as ordinary income at full US federal and state tax rates.
Out-from-Under Reorganization
In September 2017, we completed a reorganization of certain global entities that aligned them under a common UK parent company. We incurred a non-recurring cash tax expense of $3.2 million primarily related to taxable capital gains realized as a result of the reorganization. As part of our long-term strategy to make our corporate tax and organizational structures more efficient, this reorganization will allow for a more efficient repatriation of profits.
US Tax Reform
On December 22, 2017, the United States enacted the Tax Cuts and Jobs Act of 2017 (the Tax Act or tax reform). The Tax Act significantly revises the US corporate income tax by, among other things, lowering the statutory corporate tax rate from 35% to 21%, imposing a mandatory one-time transitional tax on accumulated earnings of foreign subsidiaries, introducing new tax regimes, and changing how foreign earnings are subject to US tax.
Changes included in the Tax Act and considered significant to our Company include the remeasurement of federal net deferred tax liabilities resulting from the reduction in the US statutory corporate tax rate from 35% to 21%, the mandatory one-time transition tax on the accumulated earnings of our foreign subsidiaries, and the option to claim enhanced accelerated depreciation deductions on qualified property acquired and placed in service after September 27, 2017, and before 2023.
We have reasonably estimated the effects of the Tax Act and recorded provisional amounts in our audited consolidated financial statements as at December 31, 2017. The remeasurement of the Company’s federal net deferred tax liabilities at the lower tax rate of 21% resulted in a tax recovery of approximately $12.6 million (US$9.9 million). In addition, we incurred an approximate $31.2 million (US$24.5 million) one-time transition tax on the accumulated earnings of our foreign subsidiaries. Therefore, the net tax increase was $18.6 million (US$14.6 million).
The federal liability associated with the one-time transition tax was approximately $29.3 million (US$23.0 million). We elected to apply carryforward foreign tax credits of $9.1 million (US$7.1 million) against the federal portion for a net liability of $20.2 million (US$15.9 million), payable over eight years with no interest charged. The state liability associated with the one-time transition tax was approximately $1.9 million (US$1.5 million) and is due in 2018. (See note 29 in our 2017 audited consolidated financial statements for more information on the balances due each year for the federal portion.)
The Tax Act permits that certain capital expenditures can be immediately expensed until December 31, 2022. We expensed capital expenditures of $9.2 million (US$7.2 million). A company may also elect not to immediately write off qualifying assets. We will reassess our tax position annually to determine the most appropriate course of action.

Management’s Discussion and Analysis December 31, 2017 M-37 Stantec Inc.
When tax planning for 2018, we may consider other areas of the Tax Act—such as the base erosion anti-abuse tax (BEAT) and limitations on interest expense deductions. The BEAT subjects US corporations to a minimum tax after adding back base erosion payments (for example, payments made to foreign related parties through transfer-pricing arrangements). As additional guidance becomes available, we will consider our tax planning strategies to ensure an optimal approach is undertaken.
As we complete our analysis of the Tax Act, collect and prepare necessary data, and interpret any additional guidance issued by the U.S. Treasury Department, the IRS, and other standard-setting bodies, we may make adjustments to our estimates on a prospective basis. In particular, estimates were used to determine the one-time transition tax and the remeasurement of deferred tax assets and liabilities.
Fourth Quarter Results Overall Q4 17 Results
The following table summarizes our key operating results for Q4 17 as a percentage of net revenue and the percentage increase in the dollar amount of these results in Q4 17 compared to Q4 16:
Gross revenue increased 0.4%—from $1,240.8 million in Q4 16 to $1,246.0 million in Q4 17. Net revenue decreased 1.9%—from $820.2 million in Q4 16 to $805.0 million in Q4 17. Total gross revenue was positively impacted by acquisitions completed in 2016 and 2017 and overall organic revenue growth of 4.1%. Net revenue saw a decline, impacted by divestitures relating to the Innovyze sale and high subcontractor costs.
Adjusted EBITDA decreased 24.7%—from $83.8 million in Q4 16 to $63.1 million in Q4 17. EBITDA decreased 16.3%—from $82.9 million in Q4 16 to $69.4 million in Q4 17. EBITDA was negatively impacted by a decrease in our gross margin as a percentage of net revenue—from 54.5% in Q4 16 to 52.9% in Q4 17. Lower EBITDA as a percentage of net revenue also resulted from an increase in administrative and marketing expenses in Consulting Services mainly caused by a $6.2 million increase in our provision for self-insurance.
Net income decreased 61.9%—from $29.4 million in Q4 16 to $11.2 million in Q4 17. Diluted EPS decreased 61.5%—from $0.26 in Q4 16 to $0.10 in Q4 17. Adjusted diluted EPS decreased 8.6%—from $0.35 in Q4 16 to $0.32 in Q4 17. Net income was negatively impacted by the decrease in gross margin and an increase in
% Increase (Decrease)*
(In millions of Canadian dollars, except percentages) 2017 2016 2017 2016 2017 vs. 2016
Gross revenue 1,246.0 1,240.8 154.8% 151.3% 0.4%Net revenue 805.0 820.2 100.0% 100.0% (1.9%)Direct payroll costs 379.5 373.0 47.1% 45.5% 1.7%Gross margin 425.5 447.2 52.9% 54.5% (4.9%)Administrative and marketing expenses 361.2 363.5 44.9% 44.3% (0.6% )Depreciation of property and equipment 13.3 14.8 1.7% 1.8% (9.5% )Amortization of intangible assets 18.7 20.7 2.3% 2.5% (9.7% )Net interest expense 5.6 7.0 0.7% 0.9% (20.0% )Other net finance expense 0.5 0.8 0.2% 0.1% (37.5% )Share of income from joint ventures and associates 0.2 (0.7) 0.0% (0.1% ) (114.3% )Foreign exchange loss (gain) 0.3 0.2 0.0% 0.0% 50.0%Other (income) expense (6.1) 0.5 (0.8% ) 0.1% n/mIncome before income taxes 31.8 40.4 3.9% 4.9% (21.3%)Income taxes 20.6 11.0 2.5% 1.3% 87.3%Net income 11.2 29.4 1.4% 3.6% (61.9%)
n/m = not meaningful*percentage increase (decrease) calculated based on the dollar change from the comparable period.
Quarter EndedDecember 31 % of Net Revenue

Management’s Discussion and Analysis December 31, 2017 M-38 Stantec Inc.
administrative and marketing expenses as a percentage of net revenue—from 44.3% in Q4 16 to 44.9% in Q4 17. Also in Q4 17, we recorded an $18.6 million tax expense associated with the US tax reform enacted on December 22, 2017. (See the Income Taxes section of this report for more information.) These negative impacts were partly offset by decreases in depreciation, amortization, and net interest expense, and a $6.7 million rebalancing gain for investments held for self-insured liabilities.
Gross and Net Revenue – Q4 17 vs. Q4 16
During Q4 17, gross revenue increased by $5.2 million compared to Q4 16. This increase was positively impacted by acquisitions and growth in organic revenue and was partly offset by fluctuations in foreign currencies. Total gross revenue was also negatively impacted by the divestiture of our water software business, Innovyze, and a Quebec cell tower alignment business, Azimuth. The average exchange rate for the Canadian dollar was US$0.77 in Q4 17 compared to US$0.75 in Q4 16 and the British pound sterling was GBP0.60 in both Q4 17 and Q4 16.
Our operations are typically affected by seasonality: the first and fourth quarters have the lowest revenue generation and project activity due to holidays and weather conditions in the northern hemisphere.
The following tables summarize the change in gross and net revenue by reportable segment and by business operating unit in Q4 17 compared to Q4 16:
Gross Revenue by Reportable Segment
(In millions of Canadian dollars, except percentages)
Quarter Ended
Dec 31, 2017
Quarter Ended Dec 31,
2016Total
Change
Change Due to Net
Acquisitions (Divestitures)
Change Due to
Foreign Exchange
Change Due to Organic
Growth (Retraction)
% of Organic
growth (Retraction)
Consulting ServicesCanada 300.0 284.8 15.2 (0.1) n/a 15.3 5.4%United States 521.7 546.3 (24.6) 5.1 (26.2) (3.5) (0.6% )Global 155.7 154.5 1.2 (2.8) (6.4) 10.4 6.7%
Total Consulting Serv ices 977.4 985.6 (8.2) 2.2 (32.6) 22.2Percentage growth (retraction) 0.2% (3.3%) 2.3%
Construction Services 268.6 255.2 13.4 - (15.3) 28.7 Percentage growth (retraction) - (6.0%) 11.2%
Total 1,246.0 1,240.8 5.2 2.2 (47.9) 50.9 4.1%
n/a = not applicablenote: Comparative figures have been reclassified due to a realignment between Consulting Services—United States and Consulting Services—Global reportable segments.

Management’s Discussion and Analysis December 31, 2017 M-39 Stantec Inc.
The gross to net revenue ratio for Consulting Services was flat in Q4 17 compared to Q4 16. The gross to net revenue ratio for Construction Services was 4.87 in Q4 17 compared to 4.04 in Q4 16 due to the increased use of subcontractors in Q4 17 compared to Q4 16.
Our Consulting Services – Canada and Consulting Services – Global operations had increases in both organic gross and net revenue in Q4 17 compared to Q4 16. Organic growth in Canada resulted because of our private sector work, which increased for a number of reasons: the continued strong housing demand in Ontario, southern Alberta, and Quebec; several larger pipeline projects; and a large mining project. In the public sector, we continued work on large healthcare projects in Ontario, Alberta, and British Columbia. Our global operations had organic growth due to strong project activity in the United Kingdom through the Water Asset Management Programme 6 (AMP6) cycle and to improving market conditions in our Latin America Mining sector and Middle East Water business operating unit.
Our Consulting Services – United States operations had retraction in both organic gross and net revenue in Q4 17 compared to Q4 16. Organic retraction in the quarter was seen in our Buildings, Environmental Services, and Water business operating units and our Transportation sector. We completed significant design phases earlier in the year for a number of large projects in our Buildings and Water business operating units and our Transportation sector; this resulted in lower revenues in Q4 17. Our Environmental Services business operating unit continued to experience pricing pressure from clients. Our Water business operating unit was also negatively impacted by a downward revenue adjustment on a major design-build project. The retraction was partly offset by growth in our Community Development, Mining, Power, and WaterPower & Dams sectors. Growth in our WaterPower & Dams sector occurred primarily in the western United States, and our Community Development sector continued to see consistent growth because of the ramp-up of new design work.
Our Construction Services operations had organic gross revenue growth of 11.2% and organic net revenue retraction of 1.3%. Several legacy MWH projects experienced significant challenges. We recorded $5.0 million in cost increases related to certain UK-based waste-to-energy projects that are nearing completion. Construction Services in the United States recorded downward revenue adjustments and incurred cost escalations in several legacy projects, including the major design-build project for Consulting Services (mentioned above). In addition, we recognized cost escalations in legacy MWH US-based water hard-bid projects for $16.3 million due to site
Net Revenue by Reportable Segment
(In millions of Canadian dollars, except percentages)
Quarter Ended
Dec 31, 2017
Quarter Ended Dec 31,
2016Total
Change
Change Due to Net
Acquisitions (Divestitures)
Change Due to
Foreign Exchange
Change Due to Organic
Growth (Retraction)
% of Organic
Growth (Retraction)
Consulting ServicesCanada 252.5 238.8 13.7 (0.9) n/a 14.6 6.1%United States 390.8 414.3 (23.5) 0.7 (19.6) (4.6) (1.1% )Global 106.6 104.0 2.6 (2.5) (3.5) 8.6 8.3%
Total Consulting Serv ices 749.9 757.1 (7.2) (2.7) (23.1) 18.6 Percentage growth (retraction) (0.4%) (3.1%) 2.5%
Construction Services 55.1 63.1 (8.0) - (7.2) (0.8) Percentage growth (retraction) - (11.4%) (1.3%)
Total 805.0 820.2 (15.2) (2.7) (30.3) 17.8 2.2%
n/a = not applicablenote: Comparative figures have been reclassified due to a realignment between Consulting Services—United States and Consulting Services—Global reportable segments.

Management’s Discussion and Analysis December 31, 2017 M-40 Stantec Inc.
conditions, client delays, and productivity issues. Claims against parties believed to be responsible for causing much of these costs have been or will be asserted and any recoveries obtained may benefit future quarters as the claims are resolved.
The gross to net revenue ratio increased in our Buildings business operating unit due to the continued use of outside subconsultants on projects assumed from acquisitions. Over time, acquired firms will be transitioned to our integrated service model and some previously contracted services will be brought in-house. The gross to net revenue ratio decreased in our Energy & Resources and Environmental Services business operating units because we decreased the use of subconsultants and reduced direct expenses.
In our Buildings business operating unit, organic net revenue retraction was caused by the loss of certain architectural clients from acquired firms in the United States, predominately related to our engineering disciplines, and partly offset by the mobilization of large P3 healthcare projects in Canada, including the Calgary Cancer Centre and the Mackenzie Vaughan Hospital projects.
In our Energy & Resources business operating unit, the positive trend continued in our Canadian and US Power and Mining sectors, and we saw growth in our Canadian Oil & Gas and US WaterPower & Dams sectors. Growth
Gross Revenue by Consulting Services - Business Operating Unit
(In millions of Canadian dollars, except percentages)
Quarter Ended
Dec 31, 2017
Quarter Ended Dec 31,
2016Total
Change
Change Due to Net
Acquisitions (Divestitures)
Change Due to
Foreign Exchange
Change Due to Organic
Growth (Retraction)
% of Organic
Growth (Retraction)
Consulting ServicesBuildings 212.4 202.6 9.8 12.4 (6.3) 3.7 1.8%Energy & Resources 130.5 108.9 21.6 (1.8) (5.7) 29.1 26.7%Environmental Serv ices 177.4 186.7 (9.3) 0.9 (4.7) (5.5) (2.9% )Infrastructure 251.1 260.3 (9.2) - (7.4) (1.8) (0.7% )Water 206.0 227.1 (21.1) (9.3) (8.5) (3.3) (1.5% )
Total Consulting Serv ices 977.4 985.6 (8.2) 2.2 (32.6) 22.2 Percentage growth (retraction) 0.2% (3.3%) 2.3%
note: Comparative figures have been reclassified due to a realignment of several business lines.
Net Revenue by Consulting Services - Business Operating Unit
(In millions of Canadian dollars, except percentages)
Quarter Ended
Dec 31, 2017
Quarter Ended Dec 31,
2016Total
Change
Change Due to Net
Acquisitions (Divestitures)
Change Due to
Foreign Exchange
Change Due to Organic
Growth (Retraction)
% of Organic
Growth (Retraction)
Consulting ServicesBuildings 165.0 170.7 (5.7) 7.4 (4.8) (8.3) (4.9% )Energy & Resources 106.8 83.4 23.4 (1.7) (4.1) 29.2 35.0%Environmental Serv ices 112.2 112.3 (0.1) 0.8 (1.5) 0.6 0.5%Infrastructure 208.0 212.6 (4.6) - (7.1) 2.5 1.2%Water 157.9 178.1 (20.2) (9.2) (5.6) (5.4) (3.0% )
Total Consulting Serv ices 749.9 757.1 (7.2) (2.7) (23.1) 18.6 Percentage growth (retraction) (0.4%) (3.1%) 2.5%
note: Comparative figures have been reclassified due to a realignment of several business lines.

Management’s Discussion and Analysis December 31, 2017 M-41 Stantec Inc.
was partly offset by continued declining market conditions in our Global Mining and Global WaterPower & Dams sectors.
Organic net revenue in our Environmental Services business operating unit was impacted by pricing pressure as clients reviewed their supply chain for opportunities to gain efficiencies.
In our Infrastructure business operating unit, organic net revenue growth occurred in Canada, particularly in Alberta where the economy saw improvements and growth in the housing market. This growth was partly offset by retraction in our Transportation sector because certain projects are winding down in the central United States.
The organic revenue retraction in our Water business operating unit occurred primarily in the United States. We had a high volume of APD projects in Q4 16; the volume of work decreased in Q4 17. Also, major programs in the Program Management group were completed in the early part of 2017, and there was a $5 million downward revenue adjustment on major design-build project in Q4 17. This retraction was partly offset by revenue from projects in Cincinnati and Atlanta. Organic revenue retracted in Canada as a result of project completions in Alberta. Global Water operations grew in Q4 17 compared to Q4 16 due to significant AMP programs in the United Kingdom and water projects in the Middle East. Gross and net revenue decreased by $9.3 million in Q4 17 compared to Q4 16 due to the sale of Innovyze.
Gross Margin
Gross margin as a percentage of net revenue decreased from 54.5% in Q4 16 to 52.9% in Q4 17. Gross margins quarter over quarter in our reportable segments and our business operating units are summarized below:
Gross Margin by Reportable Segments
2017 2016 Change
Consulting ServicesCanada 54.1% 54.2% (0.1% )United States 55.5% 56.7% (1.2% )Global 61.6% 58.5% 3.1%
Total Consulting Services 55.9% 56.2% (0.3% )Construction Services 11.8% 34.8% (23.0% )
Quarter EndedDecember 31
note: Comparative figures have been reclassified due to a realignment between Consulting Services—United States and Consulting Services—Global reportable segments.
Gross Margin by Consulting Services - Business Operating Unit
2017 2016 Change
Consulting ServicesBuildings 53.2% 55.0% (1.9% )Energy & Resources 52.9% 53.4% (0.5% )Environmental Serv ices 58.6% 59.0% (0.4% )Infrastructure 56.4% 52.9% 3.6%Water 58.1% 60.8% (2.7% )
Total Consulting Services 55.9% 56.2% (0.3% )
note: Comparative figures have been reclassified due to a realignment of several business lines.
Quarter EndedDecember 31

Management’s Discussion and Analysis December 31, 2017 M-42 Stantec Inc.
Gross margins in our US operations declined as a result of the divestiture of Innovyze (a water software business that operated at higher margins) and some project execution challenges in our Buildings operations as acquisition integrations from 2016 moved toward completion. Gross margins in our Global operations increased, primarily because of the recognition of incentive fees on contracts in our UK and Middle East Water business as well as incentive fees and changes in estimated cost to complete on a major WaterPower & Dams project in Latin America.
Gross margins in Construction Services decreased from 34.8% in Q4 16 to 11.8% in Q4 17. Construction Services is a high-volume, lower-margin business that incurs more subcontractors and direct expenditures than Consulting Services. The lower margins in the quarter resulted because of significant project impacts. Project life completion dates were extended for certain UK-based waste-to-energy projects that are nearing completion and costs were higher on certain US-based hard-bid projects as a result of site conditions, craft labor issues, and productivity issues. Claims against parties believed to be responsible for causing much of these costs have been or will be asserted. Only a portion of these claims have been recognized as revenue to date and any recoveries obtained may benefit future quarters as the claims are resolved.
In Consulting Services, gross margins as a percentage of net revenue declined or remained flat in each business operating unit, except Infrastructure. Gross margins were affected by increased pricing pressures from oil and gas clients. The gross margin percentage decreased for Buildings due to the mix of projects, competitive pressures, and specific project issues on a number of projects acquired through recent acquisitions; decreased for Water because of the divestiture of Innovyze (which operated at high margins) and adjustments to both estimated costs to complete and revenue on certain projects; and increased for Infrastructure primarily because of improved margins in our Transportation sector due to the mix of projects.
Other
Administrative and marketing expenses as a percentage of net revenue increased from 44.3% in Q4 16 to 44.9% in Q4 17. This was mainly due to a $6.2 million increase in our provision for self-insurance and a $3 million increase in marketing and administrative labor due to lower utilization. These increases were partly offset by a $5.3 million decrease in share-based compensation. Our operations include higher administrative and marketing expenses in the fourth quarter; a primary reason for this is the holiday season and weather conditions in the northern hemisphere, which result in lower staff utilization. Overall, our analysis, based on a percentage of net revenue, was impacted by a lower net revenue base in Q4 17 than in Q4 16.
Depreciation as a percentage of net revenue decreased in Q4 17 compared to Q4 16. This decrease is a result of a decrease in additions to property and equipment as a percentage of net revenue over the last two years. In addition, amortization of intangible assets decreased resulting from our divestiture of Innovyze and net interest expense decreased because of a reduction in our long-term debt. Other income increased as a result of realized gains of $6.7 million associated with the sale of certain equities in our investments held for self-insured liabilities.
In Q4 17, our reported tax rate was 64.8% primarily impacted by a $18.6 million net tax expense associated with the US tax reform. Without the impact of the US tax reform, our estimated annual effective tax rate decreased from 27.0% in Q3 17 to 24.0% in Q4 17, resulting in a Q4 17 tax rate of 7.6%. The reduction of our effective tax rate was mainly due to the recognition of tax credits against income earned in jurisdictions with higher tax rates. Our effective tax rate is based on statutory rates in jurisdictions where we operate.

Management’s Discussion and Analysis December 31, 2017 M-43 Stantec Inc.
Quarterly Trends The following is a summary of our quarterly operating results for the last two fiscal years (all prepared in accordance with IFRS):
The following items impact the comparability of our quarterly results:
The MWH acquisition impacted our quarterly results beginning in Q2 16. In Q1 17, our results were impacted by a deferred tax charge of $90.4 million related to the potential sale of Innovyze; excluding this impact, our net income for Q1 17 would have been $32.4 million. In Q2 17, our results were impacted by the completion of the Innovyze sale; excluding this impact, our net income for Q2 17 would have been $47.1 million.
We experienced variability in our results of operations from quarter to quarter due to the seasonal nature of the industries and geographic locations we operate in. In the first and fourth quarters, we see seasonal slowdowns related to winter weather conditions and holiday schedules. (See additional information on the operating results for each of the first three quarters of 2017 in our Management’s Discussion and Analysis for each respective quarter.)
Quarterly Unaudited Financial Information
(In millions of Canadian dollars, except per share amounts) Q4 Q3 Q2 Q1 Q4 Q3 Q2 Q1
Gross revenue 1,246.0 1,299.2 1,318.6 1,276.3 1,240.8 1,257.3 1,046.6 755.4 Net revenue 805.0 853.0 888.5 870.8 820.2 872.2 777.4 628.6 Net income (loss) 11.2 46.2 97.6 (58.0) 29.4 49.3 21.2 30.6 Adjusted net income (note) 37.2 61.1 57.9 45.8 40.4 63.0 39.5 37.6
Earnings (loss) per share - basic 0.10 0.41 0.86 (0.51) 0.26 0.43 0.20 0.33 Earnings (loss) per share - diluted 0.10 0.40 0.85 (0.51) 0.26 0.43 0.20 0.32 Adjusted EPS - basic (note) 0.33 0.54 0.51 0.40 0.35 0.55 0.37 0.40 Adjusted EPS - diluted (note) 0.32 0.54 0.51 0.40 0.35 0.55 0.37 0.40
2017 2016
Quarterly earnings per share (EPS) and basic and diluted adjusted EPS are not additive and may not equal the annual EPS reported. This is a result of the effect of shares issued on the weighted average number of shares. Quarterly and annual diluted EPS and diluted adjusted EPS are also affected by the change in the market price of our shares since we do not include in dilution options when the exercise price of the option is not in the money.note: Adjusted net income and adjusted basic and diluted EPS are non-IFRS measures and are further discussed in the Definition of Non-IFRS Measures section of this report.
Gross Revenue
(In millions of Canadian dollars)
Q4 17 vs.Q4 16
Q3 17 vs.Q3 16
Q2 17 vs.Q2 16
Q1 17 vs.Q1 16
Increase (decrease) in gross revenue due to Net acquisition growth 2.2 4.0 200.5 553.6 Organic growth (retraction) 50.9 75.1 47.4 (18.3) Impact of foreign exchange rates on
revenue earned by foreign subsidiaries (47.9) (37.2) 24.1 (14.4)
Total net increase in gross revenue 5.2 41.9 272.0 520.9

Management’s Discussion and Analysis December 31, 2017 M-44 Stantec Inc.
Statements of Financial Position The following highlights the major changes to our assets, liabilities, and equity from December 31, 2016, to December 31, 2017:
Refer to the Liquidity and Capital Resources section for an explanation of the changes in current assets and current liabilities and the Shareholders’ Equity section for an explanation of the changes in equity.
Overall, the carrying amounts of assets and liabilities for our US subsidiaries on our consolidated balance sheets decreased because of the strengthening Canadian dollar—from US$0.74 at December 31, 2016, to US$0.80 at December 31, 2017. Other factors that impacted our long-term assets and liabilities are indicated below.
Goodwill and intangible assets decreased as a result of completing the Innovyze sale. Most notably, we sold $194.4 million of goodwill and $95.1 million of intangible assets. Intangible assets also decreased as a result of amortization recorded in the year. Decreases were partly offset by additions to goodwill and intangible assets from acquisitions made during the year. Other financial assets increased mainly because of an increase in investments held for self-insured liabilities and holdbacks on long-term contracts.
Total current and long-term debt decreased as a result of the following: net repayments of $203.0 million made to reduce our revolving credit facility, a $66.4 million decrease in notes payable from prior-year acquisitions, and a $12.7 million decrease in finance lease obligations. In accordance with our credit facility agreement, we were required to pay down our debt with the net proceeds of the Innovyze sale (less taxes payable and certain transaction costs), which reduced our revolving credit facility.
Balance Sheet Summary (In millions of Canadian dollars, except percentages) Dec 31, 2017 Dec 31, 2016 $ Change % Change
Total current assets 1,608.2 1,582.5 25.7 1.6% Property and equipment 212.6 213.9 (1.3) (0.6% )Goodwill 1,556.6 1,828.1 (271.5) (14.9% )Intangible assets 262.4 449.5 (187.1) (41.6% )Net employee defined benefit asset 12.7 - 12.7 n/mDeferred tax assets 23.2 26.2 (3.0) (11.5% )Other financial assets 186.1 160.1 26.0 16.2%All other assets 19.1 24.4 (5.3) (21.7% )
Total assets 3,880.9 4,284.7 (403.8) (9.4%)
Long-term debt 198.2 91.9 106.3 115.7%All other current liabilities 955.1 980.9 (25.8) (2.6% )
Total current liabilities 1,153.3 1,072.8 80.5 7.5%Income taxes payable 18.3 - 18.3 n/mLong-term debt 541.4 928.6 (387.2) (41.7% )Net employee defined benefit liability 31.2 50.5 (19.3) (38.2% )Deferred tax liabilities 54.6 79.6 (25.0) (31.4% )All other liabilities 182.8 176.7 6.1 3.5%Equity 1,896.3 1,975.7 (79.4) (4.0% )Non-controlling interests 3.0 0.8 2.2 n/m
Total liabilities and equity 3,880.9 4,284.7 (403.8) (9.4%)
n/m = not meaningful

Management’s Discussion and Analysis December 31, 2017 M-45 Stantec Inc.
The federal tax portion of the transition tax from the US tax reform is payable over eight years and is included in long-term income taxes payable.
The net employee defined benefit liability decreased $19.3 million and the net employee defined benefit asset increased $12.7 million, a combined decrease in the unfunded status of the Company’s defined benefit pension plans of $32.0 million. This change—the result of regular contributions of $13.6 million, voluntarily accelerated contributions of $7.7 million, and a positive return on plan assets of $30.1 million—was offset by actuarial losses, foreign exchange, and expenses of $19.4 million.
Net deferred tax liabilities decreased due to the Innovyze sale and the remeasurement of deferred taxes resulting from the US tax reform.
Goodwill
In accordance with our accounting policies (described in note 4 of our audited consolidated financial statements), we conduct a goodwill impairment test annually as at October 1 or more frequently if circumstances indicate that an impairment may occur or if a significant acquisition occurs between the annual impairment test date and December 31.
We allocate goodwill to our cash generating units (CGUs) or groups of CGUs. The Company currently has seven CGUs: three are grouped into Consulting Services – Global; two are grouped into Construction Services for the purposes of testing impairment; one is for Consulting Services – Canada; and one is for Consulting Services – United States. CGUs are defined based on the smallest identifiable group of assets that generates cash inflows that are largely independent of cash inflows from other assets or groups of assets. Other factors are considered, including how management monitors the entity’s operations. In 2016, Construction Services was considered as one CGU. In 2017, we concluded that the cash inflows of the operations in the US and UK businesses within Construction Services were not interdependent and are two separate CGUs.
As a Company, we constantly evolve and continue to expand into new geographic locations. As we evolve, we regularly review our corporate and management structure to ensure our operations are organized into logical units, particularly for making operating decisions and assessing performance. If we determine that our corporate and management structure should change, we review our definitions of CGUs and reportable segments. We do not allocate goodwill to or monitor it by our business operating units.
On October 1, 2016, and October 1, 2017, we performed our annual goodwill impairment test. Based on the results of these tests, we concluded that the recoverable amount of each CGU or group of CGUs approximated or exceeded its carrying amount and, therefore, goodwill was not impaired.
Valuation techniques
When performing our goodwill impairment test, we compare the recoverable amount of our CGUs or groups of CGUs to their respective carrying amounts. If the carrying amount of a CGU or group of CGUs is higher than its recoverable amount, an impairment charge is recorded as a reduction in the carrying amount of the goodwill on the consolidated statement of financial position and recognized as a non-cash impairment charge in income. We estimate the recoverable amount by using the fair value less costs of disposal approach. It estimates fair value using market information and discounted after-tax cash flow projections, which is known as the income approach. The income approach uses a CGU’s or group of CGUs’ projection of estimated operating results and discounted cash flows based on a discounted rate that reflects current market conditions.
We use cash flow projections from financial forecasts approved by senior management for a five-year period. For our last two impairment tests on October 1, 2016, and October 1, 2017, we discounted the cash flows for each CGU or group of CGUs using after-tax discount rates ranging from 8.9% to 15.1%. To arrive at cash flow

Management’s Discussion and Analysis December 31, 2017 M-46 Stantec Inc.
projections, we use estimates of economic and market information, including growth rates in revenues, estimates of future changes in operating margins, and cash expenditures. Other significant estimates and assumptions include estimates of future capital expenditures and changes in future working capital requirements.
We believe that our methodology provides us with a reasonable basis for determining whether an impairment charge should be taken. (Note 12 in our 2017 audited consolidated financial statements provides more details about our goodwill impairment test and is incorporated by reference in this report.)
If market and economic conditions deteriorate or if volatility in the financial markets causes declines in our share price, increases our weighted-average cost of capital, or changes valuation multiples or other inputs to our goodwill assessment, our goodwill may require testing for impairment between annual test dates. Moreover, changes in the numerous variables associated with the judgments, assumptions, and estimates we made in assessing the fair value of our goodwill could cause our CGUs or groups of CGUs to be impaired. These impairments are non-cash charges that could have a material adverse effect on our consolidated financial statements but would not have any adverse effect on our liquidity, cash flows from operating activities, or debt covenants, and would not have an impact on future operations.
Sensitivity
The calculation of fair value less costs of disposal for all of our CGUs or groups of CGUs is most sensitive to the following assumptions:
• Operating margin rates based on actual experience and management’s long-term projections.
• Discount rates—reflecting investors’ expectations when discounting future cash flows to a present value—that take into consideration market rates of return, capital structure, company size, and industry risk. This rate is further adjusted to reflect risks specific to the CGU or group of CGUs for which future estimates of cash flows have not been adjusted.
• Terminal growth rates based on actual experience and market analysis. Projections are extrapolated beyond five years using a growth rate that typically does not exceed 3.0%.
• Non-cash working capital requirements based on historical actual, rates, market analysis, and management’s long-term projections.
As at October 1, 2017, the recoverable amount of each CGU and group of CGUs exceeded its carrying amount. For Consulting Services – Canada and Consulting Services – United States, management believes that no reasonably possible change in any of the above key assumptions would have caused the carrying amount to exceed its recoverable amount.
For Consulting Services – Global group of CGUs, and Construction Services group of CGUs, as at the impairment testing date, the recoverable amount approximated the carrying amount. As a result, any adverse change in key assumptions could cause the carrying value to exceed the fair value less costs of disposal. The Consulting Services – Global group of CGUs had a moderated outlook in the pace of recoveries in the energy and mining sectors and in public sector spending in regions linked to these markets and Construction Services group of CGUs is under increased competition in the water sector. These moderated outlooks were reflected in the Company’s budget and projections finalized in late 2017.
The values assigned to the most sensitive key assumptions for Consulting Services – Global group of CGUs and Construction Services group of CGUs are listed in the table below:

Management’s Discussion and Analysis December 31, 2017 M-47 Stantec Inc.
Liquidity and Capital Resources The following discussion includes forward-looking statements. For an outline of the material risks and assumptions associated with these statements, refer to the Cautionary Note Regarding Forward-Looking Statements section at the end of this report.
We are able to meet our liquidity needs through a variety of sources, including cash generated from operations, long- and short-term borrowings from our $800 million revolving credit facility (with access to an additional $200 million subject to approval), our $460 million senior secured term loan, and the issuance of common shares. We use funds primarily to pay operational expenses; complete acquisitions; sustain capital spending on property, equipment, and software; repay long-term debt; and pay dividend distributions to shareholders.
We believe that internally generated cash flows, supplemented by borrowings, if necessary, will be sufficient to cover our normal operating and capital expenditures. We also believe that the design of our business model (explained in the Core Business and Strategy sections of this report) reduces the impact of changing market conditions on our operating cash flows. However, under certain favorable market conditions, we do consider issuing common shares to facilitate acquisition growth or to reduce borrowings under our credit facilities.
We continue to limit our exposure to credit risk by placing our cash and short-term deposits in—and, when appropriate, by entering into derivative agreements with—high-quality credit institutions. Investments held for self-insured liabilities include bonds and equities. We mitigate risk associated with these bonds and equities through the overall quality and mix of our investment portfolio.
Working Capital
The following table shows summarized working capital information as at December 31, 2017, compared to December 31, 2016:
Current assets increased primarily because of a $28.6 million increase in cash and cash equivalents (further explained in the Cash Flows section of this report) and a $2.7 million increase in trade and other receivables and in unbilled revenue. These increases were partly offset by an $11.6 million decrease in other financial assets due to the maturity of bonds in our investments held for self-insurance.
Gross revenue trade receivables increased 0.9%, or $6.8 million, from December 31, 2016, to December 31, 2017. During the year, our gross trade receivables in the over-90-day aging categories decreased 6.3%, or $8.5
Key Assumptions Consulting Services – Global Construction Services
Operating margin rates 5.6% to 8.1% 1.1% to 1.3%After tax discount rate 11.3% 12.5%Terminal growth rate 3% 3%Non-cash working capital rates 14.9% to 15.3% (5.1% ) to (5.6% )note: Operating margin rates and non-cash working capital rates for Consulting Services – Global are calculated on net revenue, whereas Construction Services' rates are calculated on gross revenue.
(In millions of Canadian dollars, except ratios) 2017 2016 Change
Current assets 1,608.2 1,582.5 25.7Current liabilities (1,153.3) (1,072.8) (80.5)Working capital (note) 454.9 509.7 (54.8)Current ratio (note) 1.39 1.48 n/a
note: Working capital is calculated by subtracting current liabilities from current assets. Current ratio is calculated by dividing current assets by current liabilities. Both non-IFRS measures are further described in the Definitions section of this report.
n/a= not applicable

Management’s Discussion and Analysis December 31, 2017 M-48 Stantec Inc.
million. The mix of clients may impact our trade receivables aging categories going forward. We reduce our gross revenue trade receivables with an allowance for doubtful accounts that is calculated using historical statistics for collection and loss experience. We also allow for specific projects based on our best estimate of an allowance after assessing the collectability of the outstanding receivables balance.
Investment in trade and other receivables and in unbilled revenue decreased from 88 days at December 31, 2016, to 84 days at December 31, 2017. In particular, our Construction Services decreased from 59 days at December 31, 2016, to 48 days at December 31, 2017.
Current liabilities increased primarily due to reclassifying $150.0 million of our term loan from long-term to current since tranche A of our term loan is due May 6, 2018. (Without reclassifying, our current ratio would have been 1.60.) This increase was partly offset by a $38.4 million decrease in notes payable for past acquisitions and a $5.5 million decrease in current finance lease obligations. Trade and other payables decreased $13.5 million mainly due to less retention and payroll accruals compared to December 31, 2016. In addition, deferred revenue decreased by $14.4 million mainly because Construction Services started work that we collected advance payments for.
Cash Flows
Our cash flows from (used in) operating, investing, and financing activities, as reflected in our consolidated statements of cash flows, are summarized in the following table:
Cash flows from operating activities
Cash flows from operating activities are impacted by the timing of acquisitions, particularly the timing of payments for acquired trade and other payables, including annual employee short-term incentive payments. The decrease in cash flows from operating activities in 2017 compared to 2016 resulted from an increase in cash paid to employees, which, in turn, was caused by an increase in the number of employees and short-term incentive payments in 2017. As well, cash paid to suppliers increased because of acquisition growth and the timing of various payments. The decrease in cash flows was partly offset by an increase in cash receipts from clients due to acquisition growth, a $12.1 million decrease in taxes paid as a result of paying less in tax instalments, and a $5.8 million increase in income taxes recovered due to a refund of an overpayment of 2016 tax instalments. Interest paid decreased $2.2 million, mainly because of a decrease in our level of borrowings year over year.
Cash flows from investing activities
Cash flows from investing activities increased in 2017 compared to 2016, mainly due to the receipt of $336.6 million (net of cash sold) from the Innovyze sale and a decrease in cash used for business acquisitions. We used $1.1 billion in 2016 to pay cash consideration for current year acquisitions (mainly for MWH) and notes payable compared to $79.7 million in 2017. In addition, the purchase of investments held for self-insured liabilities decreased $6.4 million. These decreases in cash outflows were partly offset by an income tax instalment of $124.1 million paid on the Innovyze sale. We also had less cash inflow from other financial assets since last year we received $13.3 million related to the liquidation of a trust acquired from MWH.
Cash flows used in financing activities
Cash flows used in financing activities increased in 2017 compared to 2016 mainly due to a $203.0 million net cash outflow for the payment of our revolving credit facility in 2017 compared to a net cash inflow of $500.0 million
(In millions of Canadian dollars, except percentages) 2017 2016 Change
Cash flows from operating activ ities 263.7 285.7 (7.7% )Cash flows from (used) in investing activ ities 60.3 (1,136.6) 105.3%Cash flows (used in) from financing activ ities (281.1) 995.1 128.2%

Management’s Discussion and Analysis December 31, 2017 M-49 Stantec Inc.
in 2016. In 2017, we used $221.3 million from the proceeds of the Innovyze sale to reduce our revolving credit facility. In 2016, we had a net cash inflow of $583.1 million from the issuance of shares as well as a net cash inflow of $490.6 million from the settlement of our old revolving credit facility and senior secured notes and from funds drawn on our new revolving credit facility and term loans. The increase in cash used in financing for 2017 compared to 2016 was also a result of paying an additional $9.4 million in dividends. These increases were partly offset by a decrease of $3.8 million to repurchase shares for cancellation under our Normal Course Issuer Bid.
Capital Management
We manage our capital structure according to our internal guideline of maintaining a net debt to EBITDA ratio of less than 2.5 to 1.0. At December 31, 2017, our net debt to EBITDA ratio was 1.16, calculated on a trailing four-quarter basis. There may be occasions when we exceed our target by completing acquisitions that increase our debt level for a period of time.
Stantec has $1.26 billion syndicated senior secured credit facilities consisting of a senior secured revolving credit facility of a maximum of $800 million and a $460 million term loan in three tranches. This agreement allows us access to an additional $200 million, subject to approval, under the same terms and conditions. The revolving credit facility, expiring May 6, 2021, may be repaid from time to time at our option and is available for future acquisitions, working capital needs, and general corporate purposes. Tranches A and B of the term loan were drawn in Canadian funds of $150 million each (due May 6, 2018, and May 6, 2019, respectively); tranche C was redenominated to Canadian dollars of $160.0 million (due May 6, 2020).
The credit facilities may be drawn in Canadian dollars as either a prime rate loan or a bankers’ acceptance; US dollars as either a US base rate or a LIBOR advance; or, in the case of the revolving credit facility, in sterling or euros as a LIBOR advance; and by way of letters of credit. Depending on the form under which the credit facilities are accessed, rates of interest vary between Canadian prime, US base rate, and LIBOR or bankers’ acceptance rates, plus specified basis points. The specified basis points vary—depending on our leverage ratio (a non-IFRS measure)—from 0 to 175 for Canadian prime and US base rate loans, and from 100 to 275 for bankers’ acceptances, LIBOR advances, and letters of credit. As security for the obligations under these facilities, Stantec and certain of our subsidiaries granted the lenders a first-ranking security interest over all present and after-acquired assets, property, and undertakings, subject to customary carve-outs.
The funds available under the revolving credit facility are reduced by any outstanding letters of credit issued pursuant to the facility agreement. At December 31, 2017, $538.3 million was available in our revolving credit facility for future activities.
We are subject to financial and operating covenants related to our credit facilities. Failure to meet the terms of one or more of these covenants constitutes a default, potentially resulting in accelerated repayment of our debt obligation. In particular, we are required to satisfy the following at all times: (1) our leverage ratio must not exceed 3.0 to 1.0, except in the case of a material acquisition when our leverage ratio must not exceed 3.5 to 1.0 for a period of four complete quarters following the acquisition and (2) our interest coverage ratio must not be less than 3.0 to 1.0. (Leverage ratio and interest coverage ratio are defined in the Definition of Non-IFRS Measures section of this report.)
We were in compliance with all of these covenants as at and throughout the year ended December 31, 2017.
Shareholders’ Equity
Shareholders equity decreased from $1,975.7 million at December 31, 2016, to $1,896.3 at December 31, 2017. Shareholders equity was impacted by various transactions as explained below.
We recorded a $134.1 million foreign exchange loss in our currency translation adjustments in other comprehensive income in 2017 compared to a $12.3 million gain in 2016. Unrealized losses arise when translating our foreign

Management’s Discussion and Analysis December 31, 2017 M-50 Stantec Inc.
operations into Canadian dollars. We do not hedge for this foreign exchange translation risk. The loss recorded during 2017 was caused primarily by the strengthening Canadian dollar compared to the US dollar. This was partly offset by a $13.8 million adjustment to recognize the realized exchange difference associated with the divestiture of Innovyze.
We hold investments for self-insured liabilities consisting of government and corporate bonds and equity securities. These investments are classified as available for sale and are stated at fair value with the unrecognized gain or loss recorded in other comprehensive income. Realized gains and losses are transferred to income as they arise. The net unrealized gain on the fair value of these investments was $0.5 million in 2017 and $3.9 million in 2016. The net realized gain transferred to income was $9.6 million in 2017 and $0.1 million in 2016.
The Company is a sponsor of defined benefit pension plans as a result of the MWH acquisition in 2016. In 2017, we recorded a remeasurement gain of $11.6 million on the net employee defined benefit liability in other comprehensive income; in 2016, we recorded a remeasurement loss of $14.4 million. This comprises actuarial losses in 2017 of $16.1 million ($36.9 million in 2016), the return on plan of assets of $30.1 million ($19.5 million in 2016), and a deferred tax expense of $2.4 million ($3.0 million recovery in 2016).
Our board of directors grants share options as part of our incentive programs. Our board granted 1,229,689 share options in 2017 (995,904 in 2016) to various officers and employees of the Company. These options vest equally over a three-year period and have a contractual life of five years from the grant date. Share options exercised generated $7.9 million in cash in 2017 and $5.0 million in cash in 2016.
In 2016, we renewed a Normal Course Issuer Bid with the TSX that enabled us to purchase up to 3,418,357 common shares during the period November 14, 2016, to November 13, 2017. We believe that, at times, the market price of our common shares does not fully reflect the value of our business or future business prospects and that, at these times, outstanding common shares are an attractive, appropriate, and desirable use of available Company funds. During 2017, 465,713 common shares were repurchased for cancellation pursuant to the ongoing Normal Course Issuer Bid at a cost of $14.4 million.
On November 9, 2017, we received approval from the TSX respecting the renewal of the Company’s Normal Course Issuer Bid that enables us to purchase up to 2,278,747 common shares during the period November 14, 2017, to November 13, 2018.
Other Outstanding Share Data
At December 31, 2017, there were 113,991,676 common shares and 4,426,237 share options outstanding. From January 1, 2018, to February 21, 2018, no shares were repurchased and cancelled under our Normal Course Issuer Bid, no share options were granted, 180,682 share options were exercised, and 4,000 share options were forfeited. At February 21, 2018, there were 114,172,358 common shares and 4,241,555 share options outstanding.
Contractual Obligations
As part of our continuing operations, we enter into long-term contractual arrangements from time to time. The following table summarizes the contractual obligations due on our long-term debt, operating and finance lease commitments, purchase and service obligations, and other liabilities as at December 31, 2017:

Management’s Discussion and Analysis December 31, 2017 M-51 Stantec Inc.
For further information regarding the nature and repayment terms of our long-term debt, operating leases, and finance lease obligations, refer to the Cash Flows Used in Financing Activities section of this report and notes 18 and 23 in our 2017 audited consolidated financial statements incorporated by reference in this report.
Our operating lease commitments include future minimum rental payments under non-cancellable agreements for office space. Our purchase and service obligations include agreements to purchase future goods and services that are enforceable and legally binding. Our other obligations include amounts payable under our deferred share unit plan and amounts payable for performance share units issued under our long-term incentive program. Failure to meet the terms of our operating lease commitments may constitute a default, potentially resulting in a lease termination payment, accelerated payments, or a penalty as detailed in each lease agreement. The previous table does not include obligations to fund defined benefit pension plans although we make regular contributions. Funding levels are monitored regularly and reset with triennial funding valuations performed for the board of trustees for the pension plans. The Company expects to contribute $14.9 million to the pension plans in 2018.
Off-Balance Sheet Arrangements
As at December 31, 2017, we had off-balance sheet financial arrangements relating to letters of credit in the amount of $56.1 million that expire at various dates before January 2019. These—including the guarantee of certain office rental obligations—were issued in the normal course of operations.
Also as part of the normal course of operations, our surety facilities allow for the issuance of bonds for certain types of project work. As at December 31, 2017, $587.1 million in bonds—expiring at various dates before December 2021—were issued under these surety facilities. This amount relates mainly to our construction business, which requires construction and performance bonds. These bonds are intended to provide owners with financial security regarding the completion of their construction project in the event of default.
In the normal course of business, we also provide indemnifications and, in limited circumstances, guarantees. These are granted on commercially reasonable contractual terms and are provided to counterparties in transactions such as purchase and sale contracts for assets or shares, service agreements, and leasing transactions. We also indemnify our directors and officers against any and all claims or losses reasonably incurred in the performance of their service to the Company to the extent permitted by law. These indemnifications may require us to compensate the counterparty for costs incurred through various events. The terms of these indemnifications and guarantees will vary based on the contract, the nature of which prevents us from making a reasonable estimate of the maximum potential amount that could be required to pay counterparties. Historically, we have not made any significant payments under such indemnifications or guarantees, and no amounts have been accrued in our consolidated financial statements with respect to these guarantees.
(In millions of Canadian dollars) TotalLess than
1 Year 1–3 Years 4–5 YearsAfter
5 Years
Debt 730.7 191.8 328.5 209.9 0.5 Interest on debt 44.3 19.6 22.4 2.3 - Operating leases 1,059.1 185.5 308.4 216.0 349.2 Finance lease obligation 10.4 7.3 3.1 - - Purchase and serv ice obligations 76.0 28.9 41.7 5.4 - Other obligations 44.9 8.4 13.2 0.9 22.4
Total contractual obligations 1,965.4 441.5 717.3 434.5 372.1
Payment Due by Period
Management’s Discussion and Analysis December 31, 2017 M-52 Stantec Inc.
Financial Instruments and Market Risk
Fair value. As at December 31, 2017, we value and record our financial instruments as follows:
• Cash and cash equivalents and cash in escrow are classified as financial assets at fair value through profit and loss (FVPL) and are recorded at fair value, with realized and unrealized gains and losses reported in income.
• Trade and other receivables are classified as receivables and are initially accounted for at fair value and subsequently adjusted for any allowance for doubtful accounts, with allowances reported in administrative and marketing expenses.
• Investments held for self-insured liabilities, consisting of bonds and equity securities, are classified as financial assets available for sale and are recorded at fair value, with accumulated unrealized gains and losses reported in other comprehensive income until disposed of. At that time, the realized gains and losses are recognized in other income for equity securities and in net finance income for bonds. Interest income is recorded in finance income; dividends are recorded in other income.
• Trade and other payables are classified as other financial liabilities and are initially recorded at fair value and subsequently recorded at amortized cost using the effective interest rate (EIR) method. Realized gains and losses are reported in income. The EIR method discounts estimated future cash payments or receipts through the expected life of a financial instrument, thereby calculating the amortized cost and subsequently allocating the interest income or expense over the life of the instrument.
• Long-term debts, including non-interest-bearing debts, are classified as loans and borrowings and are initially recorded at fair value and subsequently recorded at amortized cost using the EIR method. EIR amortization and realized gains and losses are reported in net finance expense.
All financial assets are recognized initially at fair value plus directly attributable transaction costs, except for financial assets at FVPL, for which transaction costs are expensed. Purchases or sales of financial assets are accounted for at trade dates. All financial liabilities are recognized initially at fair value and, in the case of loans and borrowings, net of directly attributable transaction costs.
After initial recognition, the fair values of financial instruments are based on the bid prices in quoted active markets for financial assets and on the ask prices for financial liabilities. For financial instruments not traded in active markets, fair values are determined using appropriate valuation techniques, which may include recent arm’s-length market transactions, reference to the current fair value of another instrument that is substantially the same, and discounted cash flow analysis; however, other valuation models may be used. The fair values of derivatives are based on third-party indicators and forecasts. The fair values of cash and cash equivalents, cash in escrow, trade and other receivables, and trade and other payables approximate their carrying amounts because of the short-term maturity of these instruments. The carrying amounts of bank loans approximate their fair values because the applicable interest rate is based on variable reference rates. The carrying amounts of other financial assets and financial liabilities approximate their fair values.
Market risk. We are exposed to various market factors that can affect our performance, primarily our currency and interest rates.

Management’s Discussion and Analysis December 31, 2017 M-53 Stantec Inc.
Currency
Our currency exchange rate risk results primarily from the following three factors:
1. Consulting Services generates and incurs a significant portion of revenue and expenses in US dollars. Construction Services generates and incurs revenues and expenses in US dollars and British pound sterling. Therefore, we are exposed to fluctuations in exchange rates. To the extent that
a. Foreign currency revenues are greater than foreign currency expenses in a strengthening Canadian dollar environment, we expect to see a negative impact on our income from operations.
b. Foreign currency revenues are greater than foreign currency expenses in a weakening Canadian dollar environment, we expect to see a positive impact on our income from operations.
2. Foreign exchange fluctuations may also arise on the translation of the balance sheet of (net investment in) our US-based or other foreign subsidiaries where the functional currency is different from the Canadian dollar, and they are recorded in other comprehensive income. We do not hedge for this foreign exchange translation risk.
3. Foreign exchange gains or losses arise on the translation of foreign-denominated assets and liabilities (such as accounts receivable, accounts payable and accrued liabilities, and long-term debt) held in our Canadian, US, and other foreign subsidiaries. We minimize our exposure to foreign exchange fluctuations on these items by matching foreign currency assets with foreign currency liabilities and, when appropriate, by entering into forward foreign currency contracts.
Although we may buy or sell foreign currencies in exchange for Canadian dollars in accordance with our foreign exchange risk mitigation strategy, on occasion we may have a net exposure to foreign exchange fluctuations because of the timing of the recognition and relief of foreign-denominated assets and liabilities. Based on a slight net exposure at December 31, 2017, we estimate that a 1.0% decrease in the exchange rates (with all other variables held constant) would have increased net income by less than $0.2 million. A 1.0% increase would have an equal and opposite impact on net income.
Interest rates
Changes in interest rates also present a risk to our performance. Our revolving credit facility and term loan balances carry a floating rate of interest. In addition, we are subject to interest rate pricing risk to the extent that our investments held for self-insured liabilities contain fixed-rate government and corporate bonds and term deposits. Based on our loan balance at December 31, 2017, we estimate that a 0.5% increase in interest rates (with all other variables held constant) would have decreased net income by $2.5 million. A 0.5% decrease would have an equal and opposite impact on net income.
Price risk
We are subject to market price risk to the extent that our investments held for self-insured liabilities contain equity funds. This risk is mitigated because the portfolio of equity funds is monitored regularly and is appropriately diversified. The effect of a 1.0% increase in equity prices (with all other variables held constant) would have increased comprehensive income by $0.4 million. A 1.0% decrease would have an equal and opposite impact on comprehensive income.

Management’s Discussion and Analysis December 31, 2017 M-54 Stantec Inc.
Related-Party Transactions
We have subsidiaries that are 100% owned and are consolidated in our financial statements. We also have agreements in place with several structured entities to provide various services, including architecture, engineering, planning, and project management. Based on these agreements, we have assessed that we have control over the relevant activities, we are exposed to variable returns, and we can use our power to influence the variable returns; therefore, we control these entities and have consolidated them in our consolidated financial statements. We receive a fee generally equal to the net income of the entities and have an obligation regarding their liabilities and losses. Transactions among subsidiaries and structured entities are entered into in the normal course of business and on an arm’s-length basis. Using the consolidated method of accounting, all intercompany balances are eliminated.
From time to time, we enter into transactions with associated companies and other entities pursuant to a joint arrangement. These transactions involve providing or receiving services and are entered into in the normal course of business and on an arm’s-length basis. Associated companies are entities over which we are able to exercise significant influence but not control. A joint arrangement is classified as either a joint venture or joint operation, based on the rights and obligations arising from the contractual obligations between the parties to the arrangement. A joint venture provides us with rights to the net assets of the arrangement. A joint operation provides us with rights to the individual assets and obligations.
We account for a joint operation by recognizing our share of assets, liabilities, revenues, and expenses of the joint operation and by combining them line by line with similar items in our consolidated financial statements. We use the equity method of accounting for our associated companies and joint ventures. In 2017, the total sales to our associates were $10.2 million and distributions paid by our associates were $0.7 million. At December 31, 2017, receivables from our associates were $1.8 million. Total sales to our joint ventures were $40.6 million and distributions paid by our joint ventures were $1.3 million in 2017. At December 31, 2017, receivables from our joint ventures were $10.8 million.
From time to time, we guarantee the obligations of a subsidiary or structured entity for lease agreements, service agreements, and obligations to a third party pursuant to an acquisition agreement. In addition, we may guarantee service agreements for associated companies, joint ventures, and joint operations. (Transactions with subsidiaries, structured entities, associated companies, joint ventures, and joint operations are further described in notes 14, 24, and 35 of our 2017 audited consolidated financial statements and are incorporated by reference in this report.)
Key management personnel have authority and responsibility for planning, directing, and controlling the activities of our Company and include our CEO, CFO, COO, CPO, CBO, and executive vice presidents. Total compensation to key management personnel and directors recognized as an expense was $16.1 million in 2017 compared to $16.5 million in 2016.
Critical Accounting Estimates, Developments, and Measures Critical Accounting Estimates The preparation of consolidated financial statements in accordance with IFRS requires us to make various judgments, estimates, and assumptions. There has been no significant change in our critical accounting estimates in 2017 from 2016, except for a change in the useful lives of certain property and equipment (further described in note 2 of our December 31, 2017, consolidated financial statements).
Note 5 of our December 31, 2017, consolidated financial statements outlines our significant accounting estimates and is incorporated by reference in this report.

Management’s Discussion and Analysis December 31, 2017 M-55 Stantec Inc.
The accounting estimates discussed in our consolidated financial statements are considered particularly important because they require the most difficult, subjective, and complex management judgments. Accounting estimates are done for the following:
• Revenue and cost recognition on contracts • Allowance for doubtful accounts • Provision for self-insured liabilities • Share-based payment transactions • Fair values on business combinations • Assessment of impairment of non-financial assets • Divestitures • Employee benefit plans • Fair value of financial instruments • Taxes • Categorizing interests in other entities
Because of the uncertainties inherent in making assumptions and estimates regarding unknown future outcomes, future events may result in significant differences between estimates and actual results. We believe that each of our assumptions and estimates is appropriate to the circumstances and represents the most likely future outcome.
Unless otherwise specified in our discussion of specific critical accounting estimates, we expect no material changes in overall financial performance and financial statement line items to arise, either from reasonably likely changes in material assumptions underlying an estimate or within a valid range of estimates from which the recorded estimate was selected. In addition, we are not aware of trends, commitments, events, or uncertainties that can reasonably be expected to materially affect the methodology or assumptions associated with our critical accounting estimates, subject to items identified in the Risk Factors, Outlook, and Cautionary Note Regarding Forward-Looking Statements sections of this report.
Accounting Developments Recently Adopted
Effective January 1, 2017, we adopted the following amendments:
• Recognition of Deferred Tax Assets for Unrealized Losses (Amendments to IAS 12) • Disclosure Initiative (Amendments to IAS 7) • Annual Improvements (2012–2014 Cycle) (Amendments to IFRS 12 Disclosure of Interests
in Other Entities)
The adoption of these amendments did not have an impact on the financial position or performance of our Company. Note 6 of our December 31, 2017, consolidated financial statements describes these amendments and is incorporated by reference in this report.
Future Adoptions
The list below includes issued standards, amendments, and interpretations that we reasonably expect to be applicable at a future date and intend to adopt when they become effective. We are currently assessing the impact of adopting these standards, amendments, and interpretations on our consolidated financial statements and cannot reasonably estimate the effect at this time.
• IFRS 15 Revenue from Contracts with Customers • IFRS 9 Financial Instruments • IFRS 16 Leases

Management’s Discussion and Analysis December 31, 2017 M-56 Stantec Inc.
• Classification and Measurement of Share-based Payment Transactions (Amendments to IFRS 2) • Annual Improvements (2014–2016 Cycle) (Amendments to IFRS 1 and IAS 28) • IFRIC 22 Foreign Currency Transactions and Advance Consideration • IFRIC 23 Uncertainty over Income Tax Treatments • Prepayment Features with Negative Compensation (Amendments to IFRS 9) • Long-term Interest in Associates and Joint Ventures (Amendments to IAS 28) • Annual Improvements (2015–2017 Cycle) (Amendments to IFRS 3 Business Combinations,
IFRS 11 Joint Arrangements, IAS 12 Income Taxes, and IAS 23 Borrowing Costs)
These standards, amendments, and interpretations are described in note 6 of our December 31, 2017, consolidated financial statements and are incorporated by reference in this report.
Materiality We determine whether information is “material” based on whether we believe that a reasonable investor’s decision to buy, sell, or hold securities in our Company would likely be influenced or changed if the information was omitted or misstated.
Definition of Non-IFRS Measures This Management’s Discussion and Analysis includes references to and uses terms that are not specifically defined in IFRS and do not have any standardized meaning prescribed by IFRS. These measures and terms are working capital, current ratio, return on equity, EBITDA, net debt to EBITDA, leverage ratio, interest coverage ratio, backlog, adjusted EBITDA, and adjusted EPS. These non-IFRS measures may not be comparable to similar measures presented by other companies. We believe that the measures defined here are useful for providing investors with additional information to assist them in understanding components of our financial results.
Working Capital. We use working capital as a measure for assessing overall liquidity. Working capital is calculated by subtracting current liabilities from current assets. There is no directly comparable IFRS measure for working capital.
Current Ratio. We use current ratio as a measure for assessing overall liquidity. Current ratio is calculated by dividing current assets by current liabilities. There is no directly comparable IFRS measure for current ratio.
Return on Equity. As part of our overall assessment of value added for shareholders, we monitor our return on equity. Return on equity is calculated as net income for the last four quarters, divided by the average shareholders’ equity over each of the last four quarters. There is no directly comparable IFRS measure for return on equity.
EBITDA. EBITDA represents net income before interest expense, income taxes, depreciation of property and equipment, amortization of intangible assets, and goodwill and intangible impairment. This measure is referenced in our credit facility agreement as part of our debt covenants, and we use it as part of our overall assessment of our operating performance. There is no directly comparable IFRS measure for EBITDA.
Net Debt to EBITDA. As part of our assessment of our capital structure, we monitor net debt to EBITDA. This measure is referenced in our credit facility agreement as part of our debt covenants. It is defined as the sum of (1) long-term debt, including current portion, less cash and cash equivalents and cash in escrow, divided by (2) EBITDA (as defined above). There is no directly comparable IFRS measure for net debt to EBITDA.
Leverage Ratio. This ratio is referenced in our New Credit Facilities agreement as part of our debt covenants. It is defined as total indebtedness divided by EBITDA. Total indebtedness, as defined in the credit facility agreement, includes all obligations for borrowed money; bonds, debentures, notes, or similar instruments; the deferred purchase price of property or services (excluding current accounts payable); and bankers’ acceptances; plus all of the following: obligations upon which interest is customarily paid; obligations under conditional sale or other title retention agreements related to property acquired; indebtedness secured by liens on owned property;

Management’s Discussion and Analysis December 31, 2017 M-57 Stantec Inc.
guarantees; capital lease obligations; letters of credit or guarantee; hedge exposures; and obligations to purchase, redeem, retire, or otherwise acquire our equity securities. There is no directly comparable IFRS measure for leverage ratio.
Interest Coverage Ratio. This ratio is referenced in our New Credit Facilities agreement as part of our debt covenants. It is defined as EBITDA divided by interest expense, including any interim amount payable pursuant to a hedge arrangement with respect to interest rate risk. There is no directly comparable IFRS measure for interest coverage ratio.
Backlog. As part of our assessment of our financial condition, we monitor our backlog. We define backlog as the total value of secured work that has not yet been completed that
• Is assessed by management as having a high certainty of being performed by either the existence of an executed contract or work order specifying the job scope, value, and timing, or
• Has been awarded to us through an executed binding or nonbinding letter of intent or agreement describing the general job scope, value, and timing. Management must be reasonably assured that the letter of intent or agreement will be finalized in the form of a formal contract.
Only the first 12 to 18 months of the total value of secured work of a project are included in work backlog.
Backlog is not a recognized performance measure under IFRS and does not have any standardized meaning prescribed by IFRS. We believe that backlog is a useful means of projecting activity in future periods. There is no directly comparable IFRS measure for backlog.
We currently use EBITDA as a measure of pre-tax operating cash flow and net income as a measure of overall profitability. Management defines adjusted EBITDA, adjusted net income, and adjusted EPS as follows:
• Adjusted EBITDA. This is EBITDA adjusted for acquisition-related costs, out-of-ordinary course severance, and gains or losses on property and equipment, discontinued operations, sale of subsidiaries, and the rebalancing of our investments held for self-insured liabilities. There is no directly comparable IFRS measure for adjusted EBITDA; the most directly comparable measure is net income.
• Adjusted Net Income. Net (loss) income, as prescribed by IFRS, is adjusted to exclude the amortization of acquisition-related intangibles, acquisition-related costs, out-of-ordinary course severance, and gains or losses on property and equipment, discontinued operations, sale of subsidiaries, the rebalancing of our investments held for self-insured liabilities, and tax expense as a result of a reorganization or major tax reform. There is no directly comparable IFRS measure for adjusted net income; the most directly comparable measure is net (loss) income.
• Adjusted EPS. Earnings per share, as prescribed by IFRS, adjusted to exclude the amortization of acquisition-related intangibles, acquisition-related costs, out-of-ordinary course severance, and gains or losses on property and equipment, discontinued operations, sale of subsidiaries, the rebalancing of our investments held for self-insured liabilities, and tax expense as a result of a reorganization or major tax reform. There is no directly comparable IFRS measure for adjusted EPS; the most directly comparable measure is EPS.
We believe adjusted EBITDA, adjusted net income, and adjusted EPS are useful for providing securities analysts, investors, and other interested parties with additional information to assist them in understanding components of our financial results (including a more complete understanding of factors and trends affecting our operating performance). They also provide supplemental measures of operating performance, thus highlighting trends that may not otherwise be apparent when relying solely on IFRS financial measures.

Management’s Discussion and Analysis December 31, 2017 M-58 Stantec Inc.
The tables below provide a reconciliation of net income to EBITDA and adjusted EBITDA, and a reconciliation of net income to adjusted net income and EPS to adjusted EPS.
(In millions of Canadian dollars, except per share amounts) 2017 2016 2017 2016 2015
Net income for the period 11.2 29.4 97.0 130.5 156.4 Add back:
Income taxes 20.6 11.0 166.5 50.3 55.2 Net interest expense 5.6 7.0 25.8 28.6 10.9 Depreciation of property and equipment 13.3 14.8 54.6 51.2 45.9 Amortization of intangible assets 18.7 20.7 80.2 75.7 37.9
EBITDA 69.4 82.9 424.1 336.3 306.3 Acquisition-related costs - - 0.4 14.5 0.8 Loss (gain) on sale of property and equipment 0.4 0.9 0.2 1.5 (1.9) Rebalancing of investments held for self-insured liabilities (6.7) - (6.7) - (4.2) Loss (gain) on disposition of a subsidiary - - (54.6) - 4.1 Adjusted EBITDA 63.1 83.8 363.4 352.3 305.1
(In millions of Canadian dollars, except per share amounts) 2017 2016 2017 2016 2015
Net income for the period 11.2 29.4 97.0 130.5 156.4 Add back:
Amortization of intangible assets related to acquisitions (note 1 ) 12.6 10.3 47.9 39.0 18.4 Acquisition-related costs (note 2) - - 0.3 10.5 0.6 Loss (gain) on sale of property and equipment 0.3 0.7 0.2 1.1 (1.4) Rebalancing of investments held for self-insured liabilities (note 3) (5.1) - (5.1) - (3.1) Loss (gain) on disposition of a subsidiary (note 4) - - 39.9 - 3.0 Tax expense on reorganization of legal entities (note 5) (0.4) - 3.2 - - US tax reform (note 5) 18.6 - 18.6 - -
Adjusted net income 37.2 40.4 202.0 181.1 173.9
Weighted average number of shares outstanding - basic 113,951,072 113,995,604 113,991,507 107,006,168 94,143,455 Weighted average number of shares outstanding - diluted 114,498,677 114,377,441 114,352,920 107,325,791 94,593,935
Adjusted earnings per shareAdjusted earnings per share - basic 0.33 0.35 1.77 1.69 1.85 Adjusted earnings per share - diluted 0.32 0.35 1.77 1.69 1.84
Year EndedDecember 31
Quarter EndedDecember 31
Year EndedDecember 31
Quarter EndedDecember 31
note 1: The add back of intangible amortization relates only to the amortization from intangible assets acquired through acquisitions and excludes the amortization of software purchased by Stantec. This amount for the quarter ended December 31, 2017, is net of tax of $2.1 (2016 - $4.0). For the year ended December 31, 2017, this amount is net of tax of $15.1 (2016 - $15.0). note 2: For the year ended December 31, 2017, this amount is net of tax of $0.1 (2016 - $4.0).note 3: This amount for the quarter ended December 31, 2017, is net of tax of $1.6 (2016 - nil). For the year ended December 31, 2017, this amount is net of tax of $1.6 (2016 - nil).note 4: Refer to the Divestitures section for further details.note 5: Refer to the Income Taxes section for further details.

Management’s Discussion and Analysis December 31, 2017 M-59 Stantec Inc.
Risk Factors Overview To preserve and enhance stakeholder value, we approach the management of risk strategically through our Enterprise Risk Management (ERM) program. The ERM process—governed by the board of directors (board) and Audit and Risk Committee—is applied across the organization to frontline employees. We view each risk in relation to each of the other risks because the risks encountered and the actions taken to mitigate the risks may impact another area of the organization and potentially create other risks.
Board governance and risk oversight
The board provides ERM oversight—including direction, guidance, and monitoring—and has delegated the responsibility for oversight of the ERM program to the Audit and Risk Committee. The committee ensures that
• Management has developed appropriate methods to identify, evaluate, mitigate, and report the principal risks inherent to our business and strategic direction
• Our systems, policies, and practices are appropriate and address our principal risks • Our risk appetite is appropriate for the organization
Annually, the board receives a comprehensive risk report when it receives the Company’s Strategic Plan. Quarterly, the ARC receives a report on the changes in principal risks and mitigation strategies.
Risk management responsibilities
The C-suite is directly accountable to the board for all risk-taking activities and risk management practices. Responsibility for risk management is shared across the organization. The executive leadership team manages risk from an integrated, Company-wide perspective: risk management is part of our day-to-day operations and included in key decision-making processes like strategic planning.
Our leadership team is supported by numerous teams—Legal; Integrity Management; Health, Safety, Security, and Environment (HSSE); Information Technology (IT); Finance; and others. These teams carry out risk management and compliance functions across the organization and work with management to design and monitor appropriate risk mitigation. Internal Audit provides independent assurance regarding the effectiveness and efficiency of risk management across the organization.
Principal risks and uncertainties
Management remains confident about our ability to successfully carry out long-term objectives; however, we are exposed to several risks and uncertainties, just like other professional infrastructure and facilities services firms. After conducting a risk assessment, we’ve identified the most significant risks to our Company (see below). These are listed from most to least significant based on their assessed impact on our Company and the probability that the risks may occur. If any of these risks occur, individually or in combination, our business, financial condition, results of operations, and prospects could be materially and adversely affected in ways we do not currently anticipate.
The risks and uncertainties described in this report are not the only ones we face. Additional risks and uncertainties—that we are unaware of, that we currently believe are not material, and that may arise based on new developments—may also become important factors that adversely affect our business.
Readers of this report should consider carefully the risks and uncertainties described below, together with all other information in this report.
Management’s Discussion and Analysis December 31, 2017 M-60 Stantec Inc.
Risks
Stantec may have difficulty achieving organic growth expectations.
Though our strategy is to pursue organic growth, if we are unable to effectively compete for projects, expand services to existing and new clients by cross-selling our services, and attract qualified staff or are significantly affected by adverse economic conditions, we may have difficulty increasing our market share and achieving organic growth expectations.
Project workplaces are inherently dangerous. Failure to maintain safe work sites could have an adverse impact on Stantec’s business, reputation, financial condition, and results of operations.
With projects and office locations across the globe, our employees travel to and work in high-security-risk countries around the world that may be undergoing political, social, and economic problems resulting in war, civil unrest, criminal activity, acts of terrorism, or public health crises. Construction sites are inherently dangerous. Though we invest in a strong program focused on the health, safety, and security of our employees as well as controlling environment-related risks, we are exposed to the risk of personal injury, loss of life, or environmental or other damage to our property or the property of others. We could be exposed to civil or statutory liability arising from injuries or deaths, or liable for damages greater than our insurance coverage. We may also incur additional costs on projects due to delays related to health and safety incidents. Failure to maintain a strong safety record may also result in loss of projects.
Stantec bears the risk of cost overruns on fixed-price contracts.
Our business has historically followed a fee-for-service model; however, some clients in select markets and business operating units are demanding APD methods, such as bundled services of engineering, procurement, and construction; design-builds; and public-private partnerships. Stantec may experience reduced profits or, in some cases, losses under these contracts if costs increase above our estimates or if we make errors in estimating costs. Poor project management may also result in cost overruns and liabilities.
Failure to maintain effective operational management practices may adversely affect Stantec’s financial condition and results of operations.
For Stantec to succeed, our internal processes—for example, strong project managers and project management tools, a simple and effective way to bill and collect from clients, and an appropriate insurance program—must support effective professional practice standards. If we do not manage projects effectively, we may incur additional costs and affect profitability. Projects that are over budget or not on schedule may also lead to client dissatisfaction and the withholding of payments and claims. Delays in billings and customer payments may require Stantec to make increased working capital investment.
Failure to manage subcontractor performance could lead to significant losses.
The profitable completion of some contracts depends to a large extent on the satisfactory performance of the subcontractors that complete different elements of work. If these subcontractors do not perform to acceptable standards, Stantec may be required to hire other subcontractors to complete the tasks, which may add additional costs to a contract, may impact profitability on a specific job, and, in certain circumstances, may lead to significant losses and claims.

Management’s Discussion and Analysis December 31, 2017 M-61 Stantec Inc.
Due to participation in joint arrangements, we may have limited control and may be adversely impacted by the failure of the joint arrangement or its participants in fulfilling their obligations.
As part of our business strategy, Stantec may enter into joint arrangements like partnerships or joint ventures where control may be shared with unaffiliated third parties. We sometimes have joint and several liability with these parties under the applicable contracts for the joint projects. In certain cases, these joint arrangements may not be subject to the same requirements regarding internal controls and internal control over financial reporting that we follow. Failure by a joint arrangement partner to comply with applicable rules, regulations, and client requirements may have an adverse impact on Stantec’s reputation, business, and financial condition.
If we fail to attract, retain, and mobilize skilled employees, we could adversely affect our ability to execute our strategy.
Stantec derives revenue almost exclusively from services performed by our employees. Therefore, our ability to attract, retain, and develop highly qualified people is a crucial driver of our success. An inability to attract, retain, and mobilize highly qualified staff could impede our ability to compete for new projects, deliver successfully on projects, and maintain or expand client relationships. Mobilization of employees may be further adversely impacted by changing visa rules or trade negotiations such as NAFTA and Brexit.
Also, the construction industry is increasingly facing a shortage of skilled laborers in some areas and disciplines, particularly in remote locations that require workers to live in temporary camps. The resulting competition for labor may limit our ability to take advantage of opportunities that would otherwise be available or may impact the profitability of these endeavors as we move forward.
A cybersecurity breach may cause loss of critical data, interrupt operations, and cause prejudice to our clients.
As a global company, we rely on computers, large enterprise systems, and information and communication technologies, including third-party vendor systems, to conduct our business; therefore, cybersecurity is an inherently high risk for organizations like us. Although we devote significant resources to the security of Stantec’s computer systems and have strong vetting processes for third-party systems we rely on, we may still be vulnerable to threats. If our systems are breached, we could be exposed to system interruptions, delays, and loss of critical data that could delay or interrupt our operations. We also possess sensitive and confidential data that our clients entrust us with. Loss of any such data may cause prejudice to our clients. Possible adverse impacts of these events include remediation and litigation costs, costs associated with increased protection, lost revenues, and reputational damage leading to lost clients.
A failure in our IT infrastructure could lead to business interruption and loss of critical data and, therefore, may adversely affect our operating results.
To sustain business operations and remain competitive, we rely heavily on our core and regional networks, complex server infrastructure and operating systems, communications and collaboration technology, design software, and business applications. As our Company grows, if we do not scale this core infrastructure and constantly upgrade our applications, systems, and network infrastructure, as well as attract and retain key IT personnel, then our service delivery and revenues could be interrupted or delayed.
We could be adversely affected by violations of the U.S. Foreign Corrupt Practices Act and similar worldwide anti-bribery laws.
The U.S. Foreign Corrupt Practices Act and similar worldwide anticorruption laws, including the UK’s Bribery Act and Canada’s Corruption of Foreign Public Officials Act, generally prohibit companies and their intermediaries
Management’s Discussion and Analysis December 31, 2017 M-62 Stantec Inc.
from making improper payments to officials for obtaining or retaining business. Stantec operates in many parts of the world that have experienced government corruption to some degree. In certain circumstances, strict compliance with anticorruption laws may conflict with local customs and practices.
We have implemented policies and provide training to our employees about the requirement to strictly comply with anti-bribery laws. We have also built processes to advise our partners, subcontractors, suppliers, and agents who work with us or work on our behalf that they must comply with anti-bribery law requirements. Despite Stantec’s policies, training, and compliance programs, we cannot assure that our internal control policies and procedures will always protect us from inadvertent, reckless, or criminal acts committed by our employees or agents. Violations of these laws or allegations of such violations could disrupt our business and result in a material adverse effect on our operating results or financial condition. Litigation or investigations relating to alleged violations could be costly and distracting for management, even if we are found not to be in violation after the investigation.
Demand for Stantec’s services is vulnerable to economic downturns and reductions in government and private industry spending.
Demand for our services is vulnerable to economic conditions and events, and our growing global organization is exposed to an increased number of local economy fluctuations and geopolitical risks.
Adverse economic conditions, political conditions, or both negatively impact our clients’ interest and ability to fund and approve new projects. Currency and interest rate fluctuations, inflation, financial market volatility, or credit market disruptions may negatively affect the ability of our clients to obtain credit to finance their businesses on acceptable terms. This, in turn, may impact their ability to pay us on time for our services, which may adversely affect our backlog, earnings, and cash flows.
In these conditions, our clients may seek to change the overall mix of services they purchase and demand a more favorable price and other contract terms. Increased competition during a period of economic decline could force us to accept contract terms that are less favorable to Stantec, which may cause our revenue and margins to decline and expose us to greater liability.
The outcome of claims and litigation and the threat of a major loss, even if Stantec is ultimately found not liable, could adversely impact our business.
The threat of a major loss—such as the filing of a design-defect lawsuit against Stantec for damages that exceed Stantec’s professional liability insurance limits—could adversely impact our business even if, after several years of protracted legal proceedings, Stantec is ultimately found not liable for the loss or claim. Furthermore, we are subject to the risk of claims and legal actions for various commercial and contractual matters that may arise primarily from construction disputes, in respect of which insurance may be limited or not available.
Failure to source suitable acquisition targets could impair our growth.
As the professional services industry consolidates, suitable acquisition candidates may become more difficult to find and may be available only at prices or under terms that are less favorable than they once were. Future acquisitions may result in a decrease in our operating income or operating margins, and we may be unable to recover investments made in any such acquisitions.

Management’s Discussion and Analysis December 31, 2017 M-63 Stantec Inc.
If we are not able to successfully manage our integration program, then our business and results of operations may be adversely affected.
Stantec continues to pursue growth opportunities through acquisition. One of Stantec’s core strategies and strengths has been to integrate companies immediately, though, with larger acquisitions, quick integration may not be possible or optimal.
Difficulties encountered while combining companies and running our enterprise through several different platforms could adversely affect the Company’s businesses. This may prevent us from achieving the anticipated synergies, improvement in professional service offerings, market penetration, profitability, and geographic presence that are the key drivers of our acquisition program. The value of an acquired business may decline if we are unable to retain key employees of the acquired business. Acquired firms may also expose Stantec to unanticipated problems or legal liabilities undiscovered during our due diligence processes.
We also risk losing or diminishing our entrepreneurial and innovative culture if our overall corporate growth is burdened by increased processes and administration.
Force majeure events could interrupt our business and negatively impact our ability to complete client work.
Stantec’s offices, IT infrastructure, project sites, and staff may be impacted by events beyond our control, such as natural disasters, extreme weather events, telecommunications failures, acts of war or terrorism, and so forth. Though we maintain a strong business continuity program, a major event could impact our ability to operate and may put our employees and clients at risk.
Climate change has presented an increasing number of extreme weather events in recent times, such as heavier precipitation, major fires, or hurricanes, that may also increase the severity and likelihood of such business interruptions. Such events could result in closed offices, difficulty for staff coming to work, damage to our office space, project delays and client dissatisfaction and claims.
Delays resulting from extended periods of poor weather in our construction projects may result in penalties for late completion (imposed by contract) or incur incremental costs arising from loss of productivity, compressed schedules, or overtime work used to offset time lost, reducing profitability.
New or changing policies, regulations, and standards could adversely affect our business operations and results.
Stantec is subject to various regulations and standards. Stantec’s business model includes a range of business operating units and jurisdictions, each with its own set of rules and regulations. As we grow geographically, compliance with additional regulations and standards could materially increase Stantec’s costs, and noncompliance with laws and regulations could have a significant impact on results.
For example, specific to climate change, the United Nations COP-21 Paris Agreement presents both risks and opportunities for our business. New environmental regulations, laws, and policies could result in increased costs for our clients or create the potential for litigation, possibly preventing a project from going forward and thus reducing the potential for our services. At the same time, by partnering with our clients early in the process, we help clients proactively address these changes in a way that provides them benefits, better protects the environment, and results in additional revenue for Stantec. Each of our business lines already has established components related to renewable energy, climate change adaptation, resiliency, sustainable buildings/infrastructure, environmental preservation, carbon capture, storage, and so forth. Relaxation or repeal of laws and regulations could also impact the demand for our services.

Management’s Discussion and Analysis December 31, 2017 M-64 Stantec Inc.
In addition, the implementation of trade barriers, changes in duties or border taxes, or changes in laws, policies, or regulations governing the industries and sectors in which we work could result in a decline in the demand for our services or could increase our costs. These changes in regulations and policies cannot be predicted, nor can we predict with certainty their impact on our business and our clients.
Our actual results could differ from the assumption and estimates used to prepare our financial statements.
In preparing our financial statements, under IFRS, we are required to make certain estimates and assumptions as of the date of the financial statements. These estimates and assumptions affect the reported values of assets, liabilities, revenue, and expenses, and the disclosure of contingent assets and liabilities. Areas requiring significant estimates by our management include
• Recognition of contract revenue, costs, profits, or losses when applying the principles of percentage-of-completion accounting
• Recognition of revenues related to project incentives or awards that we expect to receive • Recognition of recoveries under contract change orders or claims • Estimated amounts for expected project losses, contract close-outs, or other costs • Collectability of billed and unbilled accounts receivable and the need for an allowance for doubtful
accounts • Asset valuations • Income tax provisions and related valuation allowances • Determination of expense and potential liabilities under pension and other post-retirement benefit
programs • Accruals for other estimated liabilities, including litigation and insurance revenues and reserves
Our actual business and financial results could differ from our estimates of such results; this could have a material negative impact on our financial condition and reported results of operations.
Currency and interest rate fluctuations, inflation, financial market volatility, or credit market disruptions may limit our access to capital.
Several capital market risks could affect our business; however, key drivers impacting our business include currency risk, interest rate risk, and availability of capital. Although we report our financial results in Canadian dollars, a substantial portion of our revenue and expenses is generated or incurred in non-Canadian dollars. Therefore, if the Canadian dollar strengthens relative to the US dollar and other currencies, the amount of net income from our non-Canadian dollar business could decrease, having a material adverse effect on our business, financial condition, and results of operations. Changes in interest rates also present a risk to our performance. Our revolving credit facility carries a floating rate of interest. We are also subject to interest rate pricing risk to the extent that our investments held for self-insured liabilities contain fixed-rate government and corporate bonds. If we are unable to obtain additional debt or equity capital on acceptable terms, we may have to reduce the scope of our anticipated expansion, which may negatively affect our competitiveness and results of operations. We have no assurance that existing debt will continue to be available from our current lenders or other financial institutions on similar favorable terms. Similarly, there is no assurance that equity markets will be available to raise the level of capital to meet our needs.
These market fluctuations may also negatively affect the ability of our clients to obtain credit to finance their businesses on acceptable terms, which will impact the demand for our services and the existing clients’ ability to pay for our services.

Management’s Discussion and Analysis December 31, 2017 M-65 Stantec Inc.
Failure to adequately tax plan could significantly impair Stantec’s overall capital efficiency.
Continuous changes to various global tax laws all pose a risk to the organization. Management uses accounting and fiscal principles to determine income tax positions that we believe are likely to be sustained by applicable tax authorities; however, there is no assurance that Stantec’s tax benefits or tax liability will not materially differ from our estimates or expectations. In the ordinary course of business, the ultimate tax determination is uncertain for many transactions and calculations.
Any factor noted above could affect our operations and profitability, the availability of tax credits, the cost of the services we provide, and the availability of deductions for operating losses as Stantec grows. This, in turn, could have a material adverse effect on our net income or cash flows. An increase or decrease in Stantec’s effective tax rate could have a material adverse impact on our financial condition and results of operations.
Shareholder activists could disrupt the business and detract from management’s ability to focus on operations.
In recent years, shareholder activism has increased in equity markets. Canada has a shareholder-friendly legal framework. If Stantec is unable to provide the market with a compelling business strategy that is attractive to investors, it may be targeted by activist investors who may seek to bring about a change in the strategic direction, operations, governance, or financial structure of the Company. An activist investor campaign on Stantec could create management distraction, impose a significant cost to address it, and disrupt our business.
Stantec has defined benefit plans that currently have a significant deficit. These could grow in the future, causing us to incur additional costs.
Stantec has foreign defined benefit pension plans for certain employees. At December 31, 2017, two of the defined benefit pension plans had an aggregate deficit (the excess of the projected benefit obligations over the fair value of the plan assets) of approximately $31.2 million and one of the defined benefit pension plans had a surplus (the excess of the fair value of the plan assets over the projected benefit obligation) of approximately $12.7 million. In the future, our pension deficits or surplus may increase or decrease depending on changes in interest rate levels, pension plan performance, inflation and mortality rates, and other factors. If we are forced or elect to make up all or a portion of the deficit for unfunded benefit plans over a short time, our cash flow could be materially and adversely affected.
Access to bonding may be unavailable in the future due to economic or other external factors.
Many construction contracts require bonding. The construction industry has endured a certain degree of instability and uncertainty that arises from weak economic conditions; the long-term effects may increase pressures on debt obligations, causing delays on projects or failure to complete projects. Additionally, the issuance of bonds under surety facilities is at the sole discretion of the surety company on a project-by-project basis, and the indemnity agreements may be called at any time. As such, even sizable surety facilities are no guarantee of surety support on any specific project.
Managing Our Risks Global Operations
We manage our global Consulting Services business through a combination of centralized and decentralized controls to address the unique aspects of the various markets, cultures, and geographies we operate in. Our matrix-based leadership structure provides distinct yet coordinated oversight of our business services and geographies.

Management’s Discussion and Analysis December 31, 2017 M-66 Stantec Inc.
Our construction services are purposefully restricted to primarily two jurisdictions—the United States and the United Kingdom—to reduce the risks of performing work in jurisdictions where we have little background or experience.
Our approach to integration involves implementing our Company-wide information technology and financial management systems and providing support services from our corporate and regional offices.
Business Model
Our business model—based on geography, business operating unit specialization, and life-cycle diversification—reduces our dependency on any industry or economic driver. We intend to continue diversifying our geographic presence and service offerings and focusing on key client sectors. We believe this will reduce our susceptibility to industry-specific and regional economic cycles and will help us take advantage of economies of scale in the highly fragmented professional services industry.
We also differentiate our Consulting Services business from competitors by entering both large and small contracts with various fee amounts. We work on tens of thousands of projects for thousands of clients in hundreds of locations. Our broad project mix strengthens our brand identity and ensures that we do not rely on only a few large projects for our revenue. We expect to continue to pursue selective acquisitions, enabling us to enhance our market penetration and to increase and diversify our revenue base.
Our Construction Services business operates separately; however, Construction Services may be coordinated with our Consulting Services business when appropriate and advantageous for our client.
Effective Processes and Systems
Our Integrated Management System (IMS) provides a disciplined and accountable framework for managing risks, quality outcomes, and occupational health and safety and environmental compliance. Stantec’s operations (except for former MWH operations and recent acquisitions) are certified to the following four internationally recognized consensus ISO standards:
ISO 9001:2015 (Quality Management) ISO 14001:2015 (Environmental Management) OHSAS 18001:2007 (Occupational Health & Safety Management) ISO/IEC 20000-1:2011 (IT Service Management)
The former MWH North American operations will be incorporated into Stantec’s Integrated Management System ISO certifications in 2018. Our global operations are largely managed by country-specific management systems with differing ISO certifications as required to support those country- and industry-specific business requirements.
Consulting Services uses a Project Management (PM) Framework which confirms and clarifies the expectations Stantec has of its project managers. It includes the critical tasks which affect both the management of risks and achievement of quality on typical projects.
Our internal practice audit process enables us to assess the compliance of operations with our IMS. This ensures that all offices and labs are audited at least once over the three-year term of our ISO 9001, ISO 14001, and OHSAS 18001 registrations. Additionally, field-level assessments are conducted for projects where we provide construction-related services. We have a formal improvement process to encourage suggestions for improvement, address non-conformances with the IMS, promote root-cause analysis, and document follow-up actions and responsibilities.

Management’s Discussion and Analysis December 31, 2017 M-67 Stantec Inc.
Our largest and most complex projects are supported by our Programs and Business Solutions (PBS) group, which provides specialized program and project management services.
Construction Services uses a project Management Administration Plan (MAP) to tailor its project management practices to each project and integrate quality, risk, health and safety, IT, and change management procedures. During the project, project quality is assessed through a combination of periodic operational and scheduling reviews by management and mid-project quality reviews performed by an independent Global Risk Management team.
Our comprehensive IT security (cybersecurity) program is designed to predict, prevent, detect, and respond. Key initiatives of the program include detailed security and acceptable use policies, practices, and procedures; awareness campaigns to staff; and a comprehensive array of security initiatives for enforcing security standards, including regular penetration tests. We have an integrated Security Incident Response team linked to our Crisis Communication Plan to ensure that breach response protocols are aligned with our overall corporate crisis response plans.
We invest resources in our Risk Management team. Team members are dedicated to providing Company-wide support and guidance on risk avoidance practices and procedures. Structured risk assessments are conducted before we begin pursuing projects that involve heightened or unique risk factors.
Insurance
Our policies cover the following types of insurance: general, automobile, environmental, workers’ compensation and employers’, directors’, and officers’, professional, cyber, patent infringement, fiduciary, crime, Construction Services all risk, wrap-up, and contractors’ equipment liability. We have a regulated captive insurance company to insure and fund the payment of any professional liability self-insured retentions related to claims. We or our clients also obtain project-specific insurance when required.
Growth Management
We have an acquisition and integration program managed by a dedicated acquisition team to address the risk of being unsuccessful when integrating acquired companies. A senior regional or business leader is appointed for each acquisition. The team supports and is responsible for
• Identifying and valuing acquisition candidates • Undertaking and coordinating due diligence • Negotiating and closing transactions • Integrating employees and leadership structures immediately and systems as soon as practical
following an acquisition
Capital Liquidity
We meet our capital liquidity needs and expansion strategy through various sources that include cash generated from operations, short- and long-term borrowings from our $1.26 billion syndicated senior secured credit facilities, and the issuance of common shares.

Management’s Discussion and Analysis December 31, 2017 M-68 Stantec Inc.
Controls and Procedures Disclosure controls and procedures are designed to ensure that information we are required to disclose in reports filed with securities regulatory agencies is recorded, processed, summarized, and reported on a timely basis and is accumulated and communicated to management—including our CEO and CFO, as appropriate—to allow timely decisions regarding required disclosure.
Under the supervision and with the participation of management, including our CEO and CFO, we carried out an evaluation of the effectiveness of our disclosure controls and procedures as of December 31, 2017 (as defined in rules adopted by the Securities and Exchange Commission (SEC) in the United States and as defined in Canada by National Instrument 52-109, Certification of Disclosure in Issuer’s Annual and Interim Filings). Based on this evaluation, our CEO and CFO concluded that the design and operation of our disclosure controls and procedures were effective.
We account for the following joint operations in accordance with IFRS: Balfour Beatty MWH Joint Venture; Costain MWH Delivery Partner; Efficient Service Delivery; MBV Energy Recovery; MWH Constructors, Israel, Inc. Shikun and Binui – Solei Boneh Infrastructure, Ltd., Joint Venture; MWHT Costain Joint Venture; and Skanska MWH Balfour Beatty Joint Venture. Management does not have the contractual ability to assess the internal controls of these joint arrangements. Once the financial information is obtained from these joint arrangements, it falls within the scope of the Company’s internal controls framework. Management’s conclusion regarding the effectiveness of internal controls does not extend to the internal controls at the transactional level of these joint arrangements. Our 2017 audited consolidated financial statements includes $93.3 million and $25.7 million of total assets and net assets, respectively, as at December 31, 2017, and $304.0 million and $20.7 million of revenues and net income, respectively, for the year then ended related to these joint arrangements.
As permitted by published guidance of the SEC in the United States, management’s evaluation of and conclusions on the effectiveness of internal control over financial reporting did not include the internal controls of Inventrix Engineering, Inc.; RNL Facilities Corporation; and North State Resources, Inc. acquisitions; these are included in the Company’s 2017 consolidated financial statements. Aggregate assets acquired were $17.7 million, representing 0.5% of the Company’s total assets as at December 31, 2017. Gross revenue earned from the dates of acquisition to December 31, 2017, constituted 0.4% of the Company’s gross revenue for the year ended December 31, 2017.
Internal control over financial reporting is a process designed to provide reasonable assurance regarding the reliability of financial reporting and preparation of financial statements for external purposes in accordance with IFRS. A control system, no matter how well designed and operated, can provide only reasonable, not absolute, assurance with respect to the reliability of our financial reporting and preparation of our financial statements. Accordingly, management, including our CEO and CFO, does not expect that our internal control over financial reporting will prevent or detect all errors and all fraud. Management’s Annual Report on Internal Control over Financial Reporting and the Independent Auditors’ Report on Internal Controls are included in our 2017 consolidated financial statements.
There has been no change in our internal control over financial reporting during the year ended December 31, 2017, that materially affected or is reasonably likely to materially affect our internal control over financial reporting.
We will continue to periodically review our disclosure controls and procedures and internal control over financial reporting and may make modifications from time to time as considered necessary or desirable.

Management’s Discussion and Analysis December 31, 2017 M-69 Stantec Inc.
Corporate Governance Disclosure Committee Stantec has a Disclosure Committee, consisting of a cross-section of management. The committee’s mandate is to provide ongoing review of Stantec’s continuous disclosure policy and to facilitate compliance with applicable legislative and regulatory reporting requirements.
Board of Directors Stantec’s board of directors currently has 10 members. Eight members are independent under Canadian securities laws and under the rules of the SEC and the NYSE and are free from any interest or relationship that could materially interfere with their ability to act in the best interest of our Company and shareholders. Because Bob Gomes has been the CEO of Stantec within the past three years and Gord Johnston is Stantec’s current chief executive officer, they are not considered independent. The chair of Stantec’s board of directors, Aram Keith, is an independent director.
The board’s mandate is to supervise Stantec’s management with a view to the Company’s best interests. The board fulfills its mandate by
• Overseeing the Company’s strategic planning process • Satisfying itself as to the integrity of the CEO and other executive officers • Ensuring that the Company has a policy in place for communicating effectively with shareholders,
other stakeholders, and the public • Reviewing and monitoring the Company’s principal business risks as identified by management,
along with the systems for managing such risks • Overseeing senior management succession planning, including the appointment, development, and
monitoring of senior management • Ensuring that management maintains the integrity of the Company’s internal controls and
management information systems
In 2017, Stantec’s board included two committees: the Audit and Risk Committee and the Corporate Governance and Compensation Committee. Both committees are composed entirely of independent directors.
Audit and Risk Committee The Audit and Risk Committee monitors, evaluates, approves, and makes recommendations on matters affecting Stantec’s external audit, financial reporting, accounting control policies, and risk management. The chair provides regular reports at the Company’s board meetings. The board has determined that each member is financially literate and independent and that three members of the committee are “financial experts” (as the term is defined under the rules of the SEC and NYSE).
Corporate Governance and Compensation Committee The Corporate Governance and Compensation Committee monitors, evaluates, approves, and makes recommendations on matters affecting corporate governance and board and executive compensation. Governance matters include but are not limited to board size, director nominations, orientation, education, and self-evaluation. Compensation matters include but are not limited to director and executive management compensation, performance review, and succession planning. The committee reviews and approves the CEO’s objectives and monitors these objectives quarterly. The chair provides regular reports at board meetings.
More information about Stantec’s corporate governance can be found on our website (stantec.com), and additional information will be available in the Management Information Circular prepared for our May 10, 2018, annual general meeting of shareholders. As well, the following documents are posted on our website:

Management’s Discussion and Analysis December 31, 2017 M-70 Stantec Inc.
• Corporate Governance Guidelines • Audit and Risk Committee Terms of Reference • Corporate Governance and Compensation Committee Terms of Reference • Code of Business Conduct
The documents listed above are not and should not be deemed to be incorporated by reference. Copies of these documents will be made available in print form to any shareholder who requests them.
Subsequent Events On February 21, 2018, we declared a cash dividend of $0.1375 per share, payable on April 12, 2018, to shareholders of record on March 29, 2018, an increase of 10.0% from last year.
On February 21, 2018, Richard Bradeen of Montreal, Quebec, was elected as a new director of our board and will serve on the board’s Audit and Risk Committee.
Cautionary Note Regarding Forward-Looking Statements Our public communications often include written or verbal forward-looking statements within the meaning of the US Private Securities Litigation Reform Act and Canadian securities laws. Forward-looking statements are disclosures regarding possible events, conditions, or results of operations that are based on assumptions about future economic conditions or courses of action and include financial outlook or future-oriented financial information. Any financial outlook or future-oriented financial information in this Management’s Discussion and Analysis has been approved by management of Stantec. Such financial outlook or future-oriented financial information is provided for the purpose of providing information about management’s current expectations and plans relating to the future.
Forward-looking statements may involve but are not limited to comments with respect to our objectives for 2018 and beyond, our strategies or future actions, our targets, our expectations for our financial condition or share price, or the results of or outlook for our operations. Statements of this type may be contained in filings with securities regulators or in other communications and are contained in this report. Forward-looking statements in this report include but are not limited to the following:
• The discussion of our goals in the Core Business, Strategy, and Key Performance Drivers and Capabilities sections including but not limited to our ability to achieve a compound average growth rate of 15% through a combination of organic and acquisition growth, capitalize on strategic opportunities, and grow our market presence
• Our 2018 target ranges and expectations for certain measures in the Outlook section • Our ability to recover costs on challenged projects • Our expectations regarding future capital expenditures relating to our new corporate headquarters • Our expectations regarding economic trends, industry trends, and commodity prices in the sectors and
regions in which we operate • Our expectations regarding our sources of cash and ability to meet our normal operating and capital
expenditures in the Liquidity and Capital Resources section • Our target of donating 1% of our annual pre-tax profits to charitable and not-for-profit endeavours • Our plans to build out our Project Management Ecosystem • Our expectations on capital expenditures, software additions, amortization expenses for intangible
assets, and effective tax rate for 2018

Management’s Discussion and Analysis December 31, 2017 M-71 Stantec Inc.
These describe the management expectations and targets by which we measure our success and assist our shareholders in understanding our financial position as at and for the periods ended on the dates presented in this report. Readers are cautioned that this information may not be appropriate for other purposes.
By their nature, forward-looking statements require us to make assumptions and are subject to inherent risks and uncertainties. There is a significant risk that predictions, forecasts, conclusions, projections, and other forward-looking statements will not prove to be accurate. We caution readers of this report not to place undue reliance on our forward-looking statements since a number of factors could cause actual future results, conditions, actions, or events to differ materially from the targets, expectations, estimates, or intentions expressed in these forward-looking statements.
Future outcomes relating to forward-looking statements may be influenced by many factors and material risks, including the risks described in the Risk Factors section of this report.
Assumptions
In determining our forward-looking statements, we consider material factors including assumptions about the performance of the Canadian, US, and global economies in 2018 and their effect on our business. The factors and assumptions we used about the performance of Canadian, US, and Global economies in 2018 in determining our annual targets and our outlook for 2018 are listed in the Outlook section of this report. In addition, our budget is a key input for making certain forward-looking statements and certain key assumptions underlying our budget. These key factors and assumptions are set forth below:
• For 2018, the World Bank forecasted 2.9% for global real GDP growth; the Bank of Canada projected 2.1% GDP growth for Canada; and the Congressional Budget Office projected 2.2% for the United States.
• Management assumed the value of the Canadian dollar would be relatively stable compared to 2017 and used an average value of US$0.77 in 2018.
• In Canada, the overnight interest rate target—currently at 1.25%—is expected to further increase in 2018. The US Federal Reserve is expected to gradually increase the federal funds rate in 2018. Therefore, management assumed that the average interest rates would rise slightly in 2018 compared to 2017.
• Management considered the tax rates substantially enacted at December 31, 2017, for the countries we operate in to establish our effective income tax rate; in particular we considered the US tax reform enacted on December 22, 2017.
• The Canadian unemployment rate—5.9% at the end of 2017—is not expected to change significantly in 2018. In the United States, the unemployment rate—4.1% at the end of 2017, the lowest level in over 10 years—is expected to remain at historically low levels through 2018.
• In the United States, housing activity is expected to remain positive in 2018; the seasonally adjusted annual rate of total housing starts is expected to increase to 1,255,000 from the expected 1,191,000 total housing starts in 2017.
In Canada, the Canadian Mortgage and Housing Corporation suggested total housing starts will slow in 2018; new housing starts, expected to range from 192,200 to 203,000 units in 2018, are down modestly from 2017; however, they would still be at historical high levels.
• In recent months, the Architecture Billings Index (ABI) from the American Institute of Architects has been consistently above 50.0, suggesting growing demand for design services; we anticipate that it will largely remain above 50.0 throughout 2018 as non-residential construction continues to trend upwards.

Management’s Discussion and Analysis December 31, 2017 M-72 Stantec Inc.
• Prices for most metals, minerals, and precious metals are expected to increase in 2018 compared to 2017, according to the World Bank. According to the US Energy Information Administration, the price of WTI crude oil is expected to average $52.77 in 2018 compared to an average of $50.56 in 2017, and US crude oil production is expected to average 10.0 million barrels a day in 2018 compared to an average of 9.2 million barrels a day in 2017.
• Management expects to support our targeted level of growth using a combination of cash flows from operations and borrowings.
The preceding list of factors is not exhaustive. Investors and the public should carefully consider these factors, other uncertainties and potential events, and the inherent uncertainty of forward-looking statements when relying on these statements to make decisions with respect to our Company. The forward-looking statements contained herein represent our expectations as of February 21, 2018, and, accordingly, are subject to change after such date. Except as may be required by law, we do not undertake to update any forward-looking statement, whether written or verbal, that may be made from time to time. In the case of the ranges of expected performance for fiscal year 2018, it is our current practice to evaluate and, where we deem appropriate, to provide updates. However, subject to legal requirements, we may change this practice at any time at our sole discretion.

Consolidated Financial Statements For the Years Ended December 31, 2017, and 2016
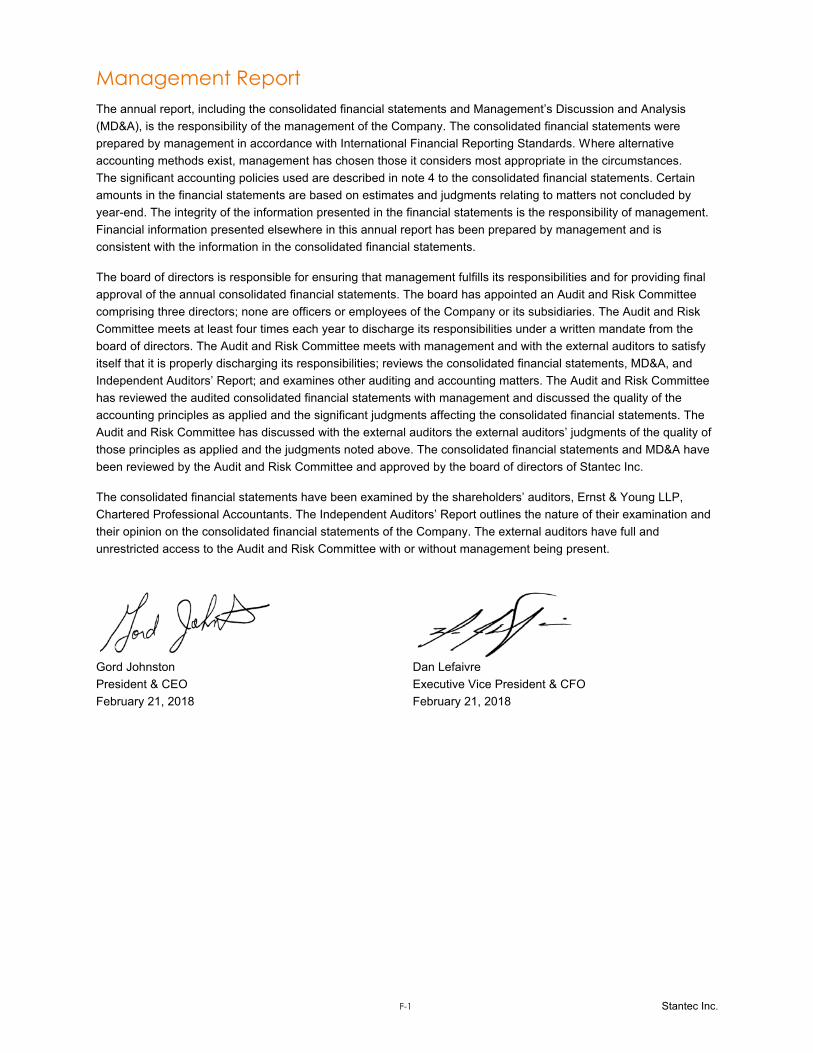
Management Report
The annual report, including the consolidated financial statements and Management’s Discussion and Analysis
(MD&A), is the responsibility of the management of the Company. The consolidated financial statements were
prepared by management in accordance with International Financial Reporting Standards. Where alternative
accounting methods exist, management has chosen those it considers most appropriate in the circumstances.
The significant accounting policies used are described in note 4 to the consolidated financial statements. Certain
amounts in the financial statements are based on estimates and judgments relating to matters not concluded by
year-end. The integrity of the information presented in the financial statements is the responsibility of management.
Financial information presented elsewhere in this annual report has been prepared by management and is
consistent with the information in the consolidated financial statements.
The board of directors is responsible for ensuring that management fulfills its responsibilities and for providing final
approval of the annual consolidated financial statements. The board has appointed an Audit and Risk Committee
comprising three directors; none are officers or employees of the Company or its subsidiaries. The Audit and Risk
Committee meets at least four times each year to discharge its responsibilities under a written mandate from the
board of directors. The Audit and Risk Committee meets with management and with the external auditors to satisfy
itself that it is properly discharging its responsibilities; reviews the consolidated financial statements, MD&A, and
Independent Auditors’ Report; and examines other auditing and accounting matters. The Audit and Risk Committee
has reviewed the audited consolidated financial statements with management and discussed the quality of the
accounting principles as applied and the significant judgments affecting the consolidated financial statements. The
Audit and Risk Committee has discussed with the external auditors the external auditors’ judgments of the quality of
those principles as applied and the judgments noted above. The consolidated financial statements and MD&A have
been reviewed by the Audit and Risk Committee and approved by the board of directors of Stantec Inc.
The consolidated financial statements have been examined by the shareholders’ auditors, Ernst & Young LLP,
Chartered Professional Accountants. The Independent Auditors’ Report outlines the nature of their examination and
their opinion on the consolidated financial statements of the Company. The external auditors have full and
unrestricted access to the Audit and Risk Committee with or without management being present.
Gord Johnston Dan Lefaivre
President & CEO Executive Vice President & CFO
February 21, 2018 February 21, 2018
F-1 Stantec Inc.

Management’s Annual Report on Internal Control over Financial Reporting
Management is responsible for establishing and maintaining an adequate system of internal control over financial
reporting. The Company’s internal control over financial reporting is a process designed to provide reasonable
assurance regarding the reliability of financial reporting and the preparation of financial statements for external
purposes in accordance with International Financial Reporting Standards (IFRS). Management conducted an
evaluation of the effectiveness of the system of internal control over financial reporting based on the framework in
Internal Control – Integrated Framework issued by the Committee of Sponsoring Organizations of the Treadway
Commission (2013 framework).
The Company accounts for joint operations in accordance with IFRS. The Company's significant joint operations are:
Balfour Beatty MWH Joint Venture, Costain MWH Delivery Partner, Efficient Service Delivery, MBV Energy
Recovery, MWH Constructors, Israel, Inc. Shikun and Binui - Solei Boneh Infrastructure, Ltd., Joint Venture, MWHT
Costain Joint Venture, and Skanska MWH Balfour Beatty Joint Venture. Once the financial information is obtained
from these joint arrangements, it falls within the scope of the Company’s internal controls framework. Management’s
conclusion regarding the effectiveness of internal controls does not extend to the internal controls at the
transactional level of these joint arrangements. The 2017 consolidated financial statements of the Company includes
$93.3 million and $25.7 million of total assets and net assets, respectively, as at December 31, 2017, and
$304.0 million and $20.7 million of revenues and net income, respectively, for the year then ended related to these
joint arrangements.
Management has assessed the effectiveness of the Company’s internal control over financial reporting, as at
December 31, 2017, and has concluded that such internal control over financial reporting is effective.
Ernst & Young LLP, which has audited the consolidated financial statements of the Company for the year
ended December 31, 2017, has also issued a report on the effectiveness of the Company’s internal control over
financial reporting.
As permitted by published guidance of the U.S. Securities and Exchange Commission (SEC), management’s
evaluation of and conclusions on the effectiveness of internal control over financial reporting did not include the
internal controls of Inventrix Engineering, Inc.; RNL Facilities Corporation; and North State Resources, Inc.
acquisitions, which are included in the Company’s 2017 consolidated financial statements. The aggregate assets
acquired were $17.7 million, representing 0.5% of the Company’s total assets as at December 31, 2017. The gross
revenue earned from their dates of acquisition to December 31, 2017, constituted 0.4% of the Company’s gross
revenue for the year ended December 31, 2017.
Gord Johnston Dan Lefaivre
President & CEO Executive Vice President & CFO
February 21, 2018 February 21, 2018
F-2 Stantec Inc.

Report of Registered Public Accounting Firm
To the Board of Directors and Shareholders of Stantec Inc.:
Opinion on the Consolidated Financial StatementsWe have audited the accompanying consolidated financial statements of Stantec Inc. (the “Company”), which
comprise the consolidated statements of financial position as at December 31, 2017 and 2016, the consolidated
statements of income, comprehensive (loss) income, shareholders’ equity and cash flows for the years ended
December 31, 2017 and 2016, and the related notes, comprising a summary of significant accounting policies and
other explanatory information (collectively referred to as the “consolidated financial statements”).
In our opinion, the consolidated financial statements present fairly, in all material respects, the consolidated financial
position of the Company as at December 31, 2017 and 2016, and its consolidated financial performance and its
consolidated cash flows for the years ended December 31, 2017 and 2016 in accordance with International Financial
Reporting Standards (IFRSs) as issued by the International Accounting Standards Board.
Report on internal control over financial reporting
We also have audited, in accordance with the standards of the Public Company Accounting Oversight Board
(United States) (“PCAOB”), the Company’s internal control over financial reporting as of December 31, 2017, based
on the criteria established in Internal Control – Integrated Framework (2013) issued by the Committee of Sponsoring
Organizations of the Treadway Commission (“COSO”), and our report dated February 21, 2018 expressed an
unqualified opinion on the effectiveness of the Company’s internal control over financial reporting.
Basis for Opinion Management’s Responsibility for the Consolidated Financial Statements
Management is responsible for the preparation and fair presentation of these consolidated financial statements in
accordance with IFRSs as issued by the International Accounting Standards Board, and for such internal control as
management determines is necessary to enable the preparation of consolidated financial statements that are free
from material misstatement, whether due to fraud or error.
Auditors’ Responsibility
Our responsibility is to express an opinion on these consolidated financial statements based on our audits. We
conducted our audits in accordance with Canadian generally accepted auditing standards and the standards of the
PCAOB. Those standards require that we plan and perform the audit to obtain reasonable assurance about whether
the consolidated financial statements are free from material misstatement, whether due to error or fraud. Those
standards also require that we comply with ethical requirements, including independence. We are required to be
independent with respect to the Company in accordance with the ethical requirements that are relevant to our audit
of the consolidated financial statements in Canada, the U.S. federal securities laws and the applicable rules and
regulations of the Securities and Exchange Commission and the PCAOB. We are a public accounting firm registered
with the PCAOB.
F-3 Stantec Inc.

An audit includes performing procedures to assess the risks of material misstatements of the consolidated financial
statements, whether due to error or fraud, and performing procedures to respond to those risks. Such procedures
included obtaining and examining, on a test basis, audit evidence regarding the amounts and disclosures in
the consolidated financial statements. The procedures selected depend on our judgment, including the assessment
of the risks of material misstatement of the consolidated financial statements, whether due to fraud or error. In
making those risk assessments, we consider internal control relevant to the Company’s preparation and fair
presentation of the consolidated financial statements in order to design audit procedures that are appropriate in
the circumstances.
An audit also includes evaluating the appropriateness of accounting policies and principles used and the
reasonableness of accounting estimates made by management, as well as evaluating the overall presentation
of the consolidated financial statements.
We believe that the audit evidence we have obtained in our audits is sufficient and appropriate to provide a
reasonable basis for our audit opinion.
We have served as the Company's auditor since 1993.
Chartered Professional Accountants
Edmonton, Canada
February 21, 2018
F-4 Stantec Inc.

Report on Internal Control over Financial Reporting
(Under the standards of the Public Company Accounting Oversight Board (United States))
To the Board of Directors and Shareholders of Stantec Inc.:
Opinion on Internal Control over Financial Reporting
We have audited Stantec Inc.’s internal control over financial reporting as of December 31, 2017, based on criteria
established in Internal Control—Integrated Framework issued by the Committee of Sponsoring Organizations of the
Treadway Commission (2013 framework),” (the COSO criteria). In our opinion, Stantec Inc. maintained, in all
material respects, effective internal control over financial reporting as of December 31, 2017, based on the
COSO criteria.
As indicated in the accompanying Management’s Annual Report on Internal Control over Financial Reporting,
management’s assessment of and conclusion on the effectiveness of internal control over financial reporting did
not include the internal controls of Balfour Beatty MWH Joint Venture, Costain MWH Delivery Partner, Efficient
Service Delivery, MBV Energy Recovery, MWH Constructors, Israel, Inc., Shikun and Binui – Solei Boneh
Infrastructure, Ltd., Joint Venture, MWHT Costain Joint Venture and Skanska MWH Balfour Beatty Joint Venture
(Joint Arrangements), which are included in the 2017 consolidated financial statements of the Company and
constituted $93.3 million and $25.7 million of total and net assets, respectively, as of December 31, 2017, and
$304 million and $20.7 million of gross revenues and net income, for the year then ended. In addition, it did not
include the internal controls of Inventrix Engineering, Inc., RNL Facilities Corporation, and North State Resources,
Inc. (Acquisitions), which are included in the 2017 consolidated financial statements of the Company. The total
assets acquired from these specified acquisitions represented 0.5% of Stantec Inc.'s consolidated total assets as at
December 31, 2017, and 0.4% of Stantec Inc.'s consolidated gross revenues for the year then ended. Our audit of
internal control over financial reporting of Stantec Inc. also did not include an evaluation of the internal control over
financial reporting of the Joint Arrangements and Acquisitions.
We also have audited, in accordance with the standards of the Public Company Accounting Oversight Board (United
States) (PCAOB), the consolidated financial statements of Stantec Inc., which comprise the consolidated statements
of financial position as at December 31, 2017 and 2016, the consolidated statements of income, comprehensive
(loss) income, shareholders’ equity and cash flows for the years ended December 31, 2017 and 2016, and the
related notes, comprising a summary of significant accounting policies and other explanatory information and our
report dated February 21, 2018 expressed an unqualified opinion thereon.
Basis for Opinion Stantec Inc.’s management is responsible for maintaining effective internal control over financial reporting and for its
assessment of the effectiveness of internal control over financial reporting included in the accompanying
Management Annual Report on Internal Control over Financial Reporting. Our responsibility is to express an opinion
on Stantec Inc.’s internal control over financial reporting based on our audit. We are a public accounting firm
registered with the PCAOB and are required to be independent with respect to the Stantec Inc. in accordance with
the U.S. federal securities laws and the applicable rules and regulations of the Securities and Exchange Commission
and the PCAOB.
We conducted our audit in accordance with the standards of the PCAOB. Those standards require that we plan and
perform the audit to obtain reasonable assurance about whether effective internal control over financial reporting
was maintained in all material respects.
Our audit included obtaining an understanding of internal control over financial reporting, assessing the risk that a
material weakness exists, testing and evaluating the design and operating effectiveness of internal control based on
the assessed risk, and performing such other procedures as we considered necessary in the circumstances. We
believe that our audit provides a reasonable basis for our opinion.
F-5 Stantec Inc.

Definition and Limitations of Internal Control over Financial Reporting A company’s internal control over financial reporting is a process designed to provide reasonable assurance
regarding the reliability of financial reporting and the preparation of financial statements for external purposes in
accordance with generally accepted accounting principles. A company’s internal control over financial reporting
includes those policies and procedures that (1) pertain to the maintenance of records that, in reasonable detail,
accurately and fairly reflect the transactions and dispositions of the assets of the company; (2) provide reasonable
assurance that transactions are recorded as necessary to permit preparation of financial statements in accordance
with generally accepted accounting principles, and that receipts and expenditures of the company are being made
only in accordance with authorizations of management and directors of the company; and (3) provide reasonable
assurance regarding prevention or timely detection of unauthorized acquisition, use, or disposition of the company’s
assets that could have a material effect on the financial statements.
Because of its inherent limitations, internal control over financial reporting may not prevent or detect misstatements.
Also, projections of any evaluation of effectiveness to future periods are subject to the risk that controls may become
inadequate because of changes in conditions, or that the degree of compliance with the policies or procedures
may deteriorate.
Chartered Professional Accountants
Edmonton, CanadaFebruary 21, 2018
F-6 Stantec Inc.

Consolidated Statements of Financial Position
December 31 December 312017 2016
(In millions of Canadian dollars) Notes $ $
ASSETS 18Current
Cash and cash equivalents 9 239.5 210.9Cash in escrow 9 7.9 8.8Trade and other receivables 10 816.1 806.4Unbilled revenue 414.8 421.8Income taxes recoverable 61.6 46.7Prepaid expenses 54.3 62.3Other financial assets 15 9.3 20.9Other assets 16 4.7 4.7Total current assets 1,608.2 1,582.5
Non-currentProperty and equipment 11 212.6 213.9Goodwill 12 1,556.6 1,828.1Intangible assets 13 262.4 449.5Investments in joint ventures and associates 14 9.7 9.2Net employee defined benefit asset 20 12.7 -Deferred tax assets 29 23.2 26.2Other financial assets 15 186.1 160.1Other assets 16 9.4 15.2
Total assets 3,880.9 4,284.7
LIABILITIES AND EQUITYCurrentTrade and other payables 17 704.6 718.1Deferred revenue 187.4 201.8Income taxes payable 11.0 1.8Long-term debt 18 198.2 91.9Provisions 19 28.1 36.0Other financial liabilities 1.8 2.4Other liabilities 21 22.2 20.8Total current liabilities 1,153.3 1,072.8Non-current
Income taxes payable 18.3 -Long-term debt 18 541.4 928.6Provisions 19 81.7 80.7Net employee defined benefit liability 20 31.2 50.5Deferred tax liabilities 29 54.6 79.6Other financial liabilities 9.1 7.6Other liabilities 21 92.0 88.4
Total liabilities 1,981.6 2,308.2
Shareholders’ equityShare capital 25 878.2 871.8Contributed surplus 25 21.5 18.7Retained earnings 947.1 917.9Accumulated other comprehensive income 49.5 167.3
Total shareholders’ equity 1,896.3 1,975.7
Non-controlling interests 3.0 0.8
Total liabilities and equity 3,880.9 4,284.7 See accompanying notes
On behalf of Stantec Inc.’s Board of Directors
Aram Keith, Director Gord Johnston, Director
F-7 Stantec Inc.

Consolidated Statements of Income
Years ended December 31(In millions of Canadian dollars, except per share amounts) Notes
2017$
2016$
Gross revenue 5,140.1 4,300.1Less subconsultant/subcontractor and other direct expenses 1,722.8 1,201.7
Net revenue 3,417.3 3,098.4Direct payroll costs 31 1,589.4 1,422.1
Gross margin 1,827.9 1,676.3Administrative and marketing expenses 7,25,31,37 1,463.8 1,335.1Depreciation of property and equipment 11 54.6 51.2Amortization of intangible assets 13 80.2 75.7Net interest expense 30 25.8 28.6Other net finance expense 30 7.1 6.4Share of income from joint ventures and associates 14 (2.6) (2.4)Foreign exchange loss 0.1 0.7Gain on disposition of a subsidiary 8 (54.6) -Other (income) expense 32 (10.0) 0.2
Income before income taxes 263.5 180.8
Income taxesCurrent 29 192.9 37.7Deferred 29 (26.4) 12.6
Total income taxes 166.5 50.3
Net income for the year 97.0 130.5
Earnings per shareBasic 33 0.85 1.22
Diluted 33 0.85 1.22 See accompanying notes
F-8 Stantec Inc.

Consolidated Statements of Comprehensive (Loss) Income
Years ended December 31 2017 2016(In millions of Canadian dollars) Notes $ $
Net income for the year 97.0 130.5
Other comprehensive (loss) income
Items that may be reclassified to net income in subsequent periods:
Exchange differences on translation of foreign operations (134.1) 12.3 Realized exchange difference on disposition of a subsidiary 8 13.8 -
Unrealized loss on foreign currency hedge 22 - (10.2)
Reclassification of realized loss on foreign currency hedge 22 - 10.2 Net unrealized loss on available-for-sale financial assets 0.5 3.9 Net realized gain on available-for-sale financial assets transferred to income 32 (9.6) - Income tax effect on available-for-sale financial assets - (0.1)
(129.4) 16.1
Items not to be reclassified to net income:
Remeasurement gains (losses) on net employee defined benefit liabilitynet of deferred tax of $2.4 (2016 – $3.0) 20 11.6 (14.4)
Other comprehensive (loss) income for the year, net of tax (117.8) 1.7
Total comprehensive (loss) income for the year, net of tax (20.8) 132.2See accompanying notes
F-9 Stantec Inc.

Consolidated Statements of Shareholders’ Equity
SharesOutstanding
(note 25)
ShareCapital
(note 25)
ContributedSurplus
(note 25)RetainedEarnings
Accumulated OtherComprehensive
Income (Loss) Total
(In millions of Canadian dollars, except shares
outstanding) # $ $ $ $ $
Balance, January 1, 2016 94,435,898 289.1 15.8 852.7 165.6 1,323.2
Net income 130.5 130.5Other comprehensive income 1.7 1.7
Total comprehensive income 130.5 1.7 132.2Share options exercised for cash 254,156 5.0 5.0Share-based compensation expense 4.4 4.4Shares repurchased under Normal Course
Issuer Bid (note 25) (572,825) (1.8) (0.1) (16.3) (18.2)Shares issued, net of transaction costs 19,964,000 578.1 - 578.1Reclassification of fair value of share
options previously expensed 1.4 (1.4) -Dividends declared (note 25) (49.0) (49.0)
Balance, December 31, 2016 114,081,229 871.8 18.7 917.9 167.3 1,975.7
Net income 97.0 97.0Other comprehensive loss (117.8) (117.8)
Total comprehensive income (loss) 97.0 (117.8) (20.8)Share options exercised for cash 376,160 7.9 7.9Share-based compensation expense 4.9 4.9Shares repurchased under Normal Course
Issuer Bid (note 25) (465,713) (3.6) - (10.8) (14.4)Reclassification of fair value of share
options previously expensed 2.1 (2.1) -Dividends declared (note 25) (57.0) (57.0)
Balance, December 31, 2017 113,991,676 878.2 21.5 947.1 49.5 1,896.3 See accompanying notes
F-10 Stantec Inc.

Consolidated Statements of Cash Flows
Years ended December 31 2017 2016(In millions of Canadian dollars) Notes $ $
CASH FLOWS FROM (USED IN) OPERATING ACTIVITIESCash receipts from clients 5,186.3 4,459.1Cash paid to suppliers (2,378.9) (1,900.8)Cash paid to employees (2,485.2) (2,194.9)Interest received 3.2 4.7Interest paid (28.6) (30.8)Finance costs paid (6.7) (7.3)Income taxes paid (44.7) (56.8)Income taxes recovered 18.3 12.5
Cash flows from operating activities 34 263.7 285.7
CASH FLOWS FROM (USED IN) INVESTING ACTIVITIESBusiness acquisitions, net of cash acquired 7 (79.7) (1,072.6)Cash in escrow (5.4) (7.7)Dividend distributions from investments in joint ventures and associates 1.9 0.8Purchase of investments held for self-insured liabilities (5.7) (12.1)(Increase) decrease in other financial assets (2.3) 14.2Proceeds from lease inducements 4.4 3.3Proceeds on disposition of a subsidiary, net of cash sold 8 336.6 -Income taxes paid on disposition of subsidiary 8 (124.1) -Purchase of intangible assets (5.5) (7.6)Purchase of property and equipment (61.3) (58.3)Proceeds on disposition of property and equipment 1.4 3.4
Cash flows from (used in) investing activities 60.3 (1,136.6)
CASH FLOWS FROM (USED IN) FINANCING ACTIVITIESRepayment of revolving credit facility 8,18 (462.4) (282.4)Proceeds from revolving credit facility 259.4 457.4Repayment of senior secured notes - (125.0)Proceeds from term loan 18 - 450.0Repayment of other long-term debt (3.4) -Transaction costs on long-term debt - (9.4)Payment of finance lease obligations (12.7) (14.3)Repurchase of shares for cancellation 25 (14.4) (18.2)Proceeds from issue of share capital 7.9 608.9Transaction costs for issue of shares - (25.8)Payment of dividends to shareholders 25 (55.5) (46.1)
Cash flows (used in) from financing activities (281.1) 995.1
Foreign exchange loss on cash held in foreign currency (14.3) (0.6)
Net increase in cash and cash equivalents 28.6 143.6Cash and cash equivalents, beginning of the year 210.9 67.3
Cash and cash equivalents, end of the year 9 239.5 210.9See accompanying notes
F-11 Stantec Inc.

Index to the Notes to the Consolidated Financial Statements
Note Page Note Page
1 Corporate Information F-13 35 Related-Party Disclosures F-61
2 Basis of Preparation F-13 36 Segmented Information F-65
3 Basis of Consolidation F-13 37 Investment Tax Credits F-67
4 Summary of Significant Accounting Policies F-14 38 Events after the Reporting Period F-67
5 Significant Accounting Judgments, Estimates,
and Assumptions F-22
6 Recent Accounting Pronouncements and
Changes to Accounting Policies F-25
7 Business Acquisitions F-29
8 Disposition of a Subsidiary F-32
9 Cash and Cash Equivalents F-33
10 Trade and Other Receivables F-34
11 Property and Equipment F-35
12 Goodwill F-36
13 Intangible Assets F-39
14 Investments in Joint Ventures and Associates F-40
15 Other Financial Assets F-41
16 Other Assets F-42
17 Trade and Other Payables F-42
18 Long-Term Debt F-42
19 Provisions F-44
20 Net Employee Defined Benefit Liability F-45
21 Other Liabilities F-48
22 Derivative Financial Instruments F-48
23 Commitments F-48
24 Contingencies and Guarantees F-49
25 Share Capital F-49
26 Fair Value Measurements F-52
27 Financial Instruments F-53
28 Capital Management F-55
29 Income Taxes F-56
30 Net Interest Expense and Other Net Finance
Expense F-58
31 Employee Costs F-59
32 Other (Income) Expense F-59
33 Earnings Per Share F-60
34 Cash Flow Information F-60
Notes to the Consolidated Financial Statements In Millions of Canadian Dollars Except Number of Shares and Per Share DataDecember 31, 2017 F-12 Stantec Inc.

Notes to the Consolidated Financial Statements
1. Corporate Information
The consolidated financial statements of Stantec Inc. (the Company) for the year ended December 31, 2017, were
authorized for issuance in accordance with a resolution of the Company’s board of directors on February 21, 2018.
The Company was incorporated under the Canada Business Corporations Act on March 23, 1984. Its shares are
traded on the Toronto Stock Exchange (TSX) and New York Stock Exchange (NYSE) under the symbol STN.
The Company’s registered office is located at 10160 – 112 Street, Edmonton, Alberta. The Company is domiciled
in Canada.
The Company is a provider of comprehensive professional services in the area of infrastructure and facilities for
clients in the public and private sectors. The Company’s services include engineering, architecture, interior design,
landscape architecture, surveying, environmental sciences, construction services, project management, and project
economics, from initial project concept and planning through to design, construction, commissioning, maintenance,
decommissioning, and remediation.
2. Basis of Preparation
These consolidated financial statements were prepared in accordance with International Financial Reporting
Standards (IFRS) as issued by the International Accounting Standards Board (IASB). The accounting policies
adopted in these consolidated financial statements are based on IFRS effective as at December 31, 2017.
The consolidated financial statements have been prepared on a historical cost basis, unless otherwise stated in
the significant accounting policies. The consolidated financial statements are presented in Canadian dollars,
and all values, including United States dollars, are rounded to the nearest million ($000,000), except when
otherwise indicated.
Based on a review of the underlying nature, physical use, and technological lives of certain property and equipment,
effective January 1, 2017, depreciation is calculated at annual rates designed to write off the costs of assets over
their estimated useful lives on a straight-line basis as follows:
Estimated lives Declining balance prior to 2017
Engineering equipment 5 to 10 years 20% to 30%Office equipment 5 to 10 years 20% to 30%Other 5 to 50 years 10% to 30%
Management believes that the change in the estimates better represents the use of the property and equipment and
the change was applied prospectively. The effect of the related change in estimates is a decrease of consolidated
depreciation expense of $2.5 for the year ended December 31, 2017. It is impracticable to determine the amount of
the effect in future periods since depreciation expense is impacted by additions and disposals.
3. Basis of Consolidation
The consolidated financial statements include the accounts of the Company, its subsidiaries, and its structured
entities as at December 31, 2017.
Subsidiaries and structured entities are fully consolidated from the date of acquisition, which is the date the Company
obtains control, and continue to be consolidated until the date that this control ceases. The financial statements of
the subsidiaries and structured entities are prepared as at December 31, 2017, and December 31, 2016. All
intercompany balances are eliminated.
Notes to the Consolidated Financial Statements In Millions of Canadian Dollars Except Number of Shares and Per Share DataDecember 31, 2017 F-13 Stantec Inc.

Joint ventures and associates are accounted for using the equity method, and joint operations are accounted for by
the Company recognizing its share of assets, liabilities, revenue, and expenses of the joint operation.
4. Summary of Significant Accounting Policies
a) Cash and cash equivalents
Cash and cash equivalents include cash and unrestricted investments. Such investments are carried at fair value.
b) Property and equipment
Property and equipment are recorded at cost less accumulated depreciation and any impairment losses. Cost
includes the cost of replacing parts of property and equipment. When significant parts of property and equipment are
required to be replaced in intervals, the Company recognizes such parts as individual assets with specific useful lives
and depreciation, respectively. All other repair and maintenance costs are recognized in the consolidated statements
of income as incurred.
Depreciation is calculated at annual rates designed to write off the costs of assets over their estimated useful lives
as follows:
Engineering equipment 5 to 10 years straight-lineOffice equipment 5 to 10 years straight-lineLeasehold improvements straight-line over term of lease to a maximum of
15 years or the improvement’s economic lifeOther 5 to 50 years straight-line
The assets’ residual values, useful lives, and methods of depreciation are reviewed at each financial year-end and
adjusted prospectively, if appropriate.
c) Intangible assets
Intangible assets acquired separately are measured on initial recognition at cost. The cost of a finite and indefinite
intangible asset acquired in a business combination is its fair value as at the date of acquisition. Following initial
recognition, finite intangible assets are carried at cost less any accumulated amortization and any impairment losses
and indefinite intangible assets are carried at cost less any impairment loss.
The Company’s intangible assets with finite lives are amortized over their useful economic lives on a straight-line
basis. The amortization period and the amortization method for an intangible asset with a finite useful life are
reviewed at least at each financial year-end.
The Company also incurs costs for third-party internet-based cloud computing services. These costs are expensed in
administrative and marketing expenses over the period of the service agreement.
Intangible assets acquired from business combinations
The Company’s policy is to amortize client relationships with finite lives over periods ranging from 10 to 15 years.
Contract backlog and finite trademarks are amortized over estimated lives of generally 1 to 3 years. Advantageous
lease commitments are amortized over the remaining lease term. The Company assigns value to acquired
intangibles using the income approach, which involves quantifying the present value of net cash flows attributed to
the subject asset. This, in turn, involves estimating the revenues and earnings expected from the asset. Recognition
of the contributory assets, such as workforce, working capital, and property and equipment required and used to
generate the expected after-tax earnings, is included since these assets also require a return based on their fair
values. Expected earnings after contributory charges and income taxes are discounted by the appropriate after-tax
discount rate to arrive at the fair value.
d) Leases
The determination of whether an arrangement is or contains a lease is based on the substance of the arrangement at
the inception date. A lease is an agreement whereby the lessor conveys to the lessee, in return for a payment or
series of payments, the right to use an asset for an agreed period of time.
Notes to the Consolidated Financial Statements In Millions of Canadian Dollars Except Number of Shares and Per Share DataDecember 31, 2017 F-14 Stantec Inc.

Finance leases, which transfer to the Company substantially all the risks and benefits incidental to ownership of the
leased items, are capitalized at the inception of the lease at the fair value of the leased asset or, if lower, at the
present value of the minimum lease payments. Lease payments are apportioned between finance charges and
reduction of the lease liability, achieving a constant rate of interest on the remaining balance of the liability. Finance
charges are recognized in the consolidated statements of income.
Leased assets are depreciated over their useful lives. However, if there is no reasonable certainty that the Company
will obtain ownership of the asset by the end of the lease term, the asset is depreciated over the shorter of either its
estimated useful life or the lease term. The Company’s finance leases are for certain office and automotive
equipment and are depreciated on a straight-line basis. The Company also has finance leases for software, which
are depreciated on a straight-line basis over periods ranging from three to seven years.
Rental payments under operating leases are expensed evenly over the lease term.
From time to time, the Company enters into or renegotiates premises operating leases that result in receiving lease
inducement benefits. These benefits are accounted for as a reduction of rental expense over the terms of the
associated leases. As well, from time to time, the Company enters into or renegotiates premises operating leases
that include escalation clauses. The scheduled rent increases pursuant to lease escalation clauses are recognized
on a straight-line basis over the lease terms.
e) Investments in joint arrangements and associates
Each joint arrangement of the Company is classified as either a joint venture or joint operation based on the rights
and obligations arising from the contractual obligations between the parties to the arrangement. A joint arrangement
that provides the Company with rights to the net assets of the arrangement is classified as a joint venture, and a joint
arrangement that provides the Company with rights to the individual assets and obligations arising from the
arrangement is classified as a joint operation.
The Company accounts for a joint venture using the equity method (described below). The Company accounts for a
joint operation by recognizing its share of assets, liabilities, revenues, and expenses of the joint operation and
combining them line by line with similar items in the Company’s consolidated financial statements.
Investments in associated companies, over which the Company is able to exercise significant influence but not
control, are accounted for using the equity method, which reflects the Company’s investment at original cost plus
post-acquisition changes in the Company’s share of the net assets of the associate. The share of the profit of
associates or joint ventures is recorded in the consolidated statements of income. Since this is profit attributable to
the equity holders of the associate or joint venture, it is profit after tax. Adjustments are made in the Company’s
consolidated financial statements to eliminate its share of unrealized gains and losses resulting from transactions
with its associates.
If the financial statements of associates or joint arrangements are prepared for a date that is different from the
Company’s date (due to the timing of finalizing and receiving information), adjustments are made for the effects of
significant transactions or events that occur between that date and the date of the Company’s financial statements.
When necessary, adjustments are made to bring the accounting policies in line with the Company’s.
f) Investments held for self-insured liabilities
In other financial assets, the Company has investments held for self-insured liabilities that are categorized as
available for sale and are recorded at fair value, with associated unrealized gains or losses (except permanent
impairments) reported in other comprehensive income until disposed of, at which time realized gains or losses
are recognized in income. These investments consist of government and corporate bonds, equity securities, and
term deposits.
Notes to the Consolidated Financial Statements In Millions of Canadian Dollars Except Number of Shares and Per Share DataDecember 31, 2017 F-15 Stantec Inc.

g) Provisions
General
Provisions are recognized when the Company has a present legal or constructive obligation as a result of a past
event, it is probable that an outflow of resources embodying economic benefits will be required to settle the
obligation, and a reliable estimate can be made of the amount of the obligation. When the Company expects some
or all of a provision to be reimbursed—for example, under an insurance contract—and when the reimbursement is
virtually certain, the reimbursement is recognized as a separate asset. The expense relating to any provision is
presented in the consolidated statements of income net of any reimbursement. If the effect of the time value of
money is significant, provisions are discounted using a current pretax rate that reflects, where appropriate, the risks
specific to the liability. When discounting is used, the increase in the provision due to the passage of time is
recognized as a finance cost.
Provision for self-insured liabilities
The Company self-insures certain risks related to professional liability, automobile physical damages, and
employment practices liability. The provision for self-insured liabilities includes estimates of the costs of reported
claims (including potential claims that are probable of being asserted) and is based on estimates of loss using
assumptions made by management, including consideration of actuarial projections. The provision for self-insured
liabilities does not include unasserted claims where assertion by a third party is not probable.
The Company invests funds to support the provision for self-insured liabilities. These investments are recorded at fair
value in other financial assets as investments held for self-insured liabilities.
Provisions for claims
The Company has claims that are not covered by its provisions for self-insured liabilities, including claims that are
subject to exclusions under the Company’s commercial and captive insurance policies. Provisions are recognized
for these claims in accordance with the preceding description of provisions under "General."
Contingent liabilities recognized in a business combination
A contingent liability recognized in a business combination is initially measured at its fair value. Subsequently, it is
measured in accordance with the preceding description of provisions under "General."
Onerous contracts
The Company’s onerous contracts consist of lease exit liabilities and sublease losses. For lease exit liabilities, the
Company accrues charges when it ceases to use an office space under an operating lease arrangement. Included
in the liability is the present value of the remaining lease payments offset by the present value of estimated future
rental income.
From time to time, the Company may sublet a portion of office space that is under an operating lease arrangement.
The Company accrues a liability, a sublease loss, if the costs to be incurred under an operating lease will exceed the
anticipated revenue on the sublease. Included in the liability is the present value of the remaining lease payments
offset by the present value of the future rental income.
h) Foreign currency translation
The Company’s consolidated financial statements are presented in Canadian dollars, which is also the parent
Company’s functional currency. Each entity in the Company determines its own functional currency, and items
included in the financial statements of each entity are measured using that functional currency.
Transactions and balances
Transactions in foreign currencies (i.e., those different from an entity’s functional currency) are initially translated into
the functional currency of an entity using the foreign exchange rate at the transaction date. Subsequent to the
transaction date, foreign currency transactions are measured as follows:
On the consolidated statements of financial position, monetary items are translated at the rate of exchange
in effect at the reporting date. Non-monetary items at cost are translated at historical exchange rates.
Notes to the Consolidated Financial Statements In Millions of Canadian Dollars Except Number of Shares and Per Share DataDecember 31, 2017 F-16 Stantec Inc.

Non-monetary items at fair value are translated at rates in effect at the date the fair value is determined.
Any resulting realized and unrealized foreign exchange gains or losses are included in income in the period
incurred. The exception is unrealized foreign exchange gains and losses on non-monetary investments
(equity investments) classified as available for sale, which are included in other comprehensive income.
Revenue and expense items are translated at the exchange rate on the transaction date, except for
depreciation and amortization, which are translated at historical exchange rates.
Foreign operations
The Company’s foreign operations are translated into its reporting currency (Canadian dollar) as follows:
Assets and liabilities are translated at the rate of exchange in effect at each consolidated statement of financial
position date
Revenue and expense items (including depreciation and amortization) are translated at the average rate of
exchange for the month
The resulting unrealized exchange gains and losses on foreign subsidiaries are recognized in other comprehensive
income (loss).
i) Financial instruments
Initial recognition and subsequent measurement
The Company classifies its financial instruments as follows:
Cash and cash equivalents and cash in escrow are classified as financial assets at fair value through profit andloss (FVPL) and are recorded at fair value, with realized and unrealized gains and losses reported in income.
Trade and other receivables are classified as receivables and are initially accounted for at fair value andsubsequently adjusted for any allowance for doubtful accounts, with allowances reported in administrative andmarketing expenses.
Investments held for self-insured liabilities, consisting of bonds, equity securities, and term deposits, are
classified as financial assets available for sale and are recorded at fair value, with accumulated unrealized
gains and losses reported in other comprehensive income (except permanent impairments) until disposed of;
at this time, the realized gains and losses are recognized in other income for equity securities and in finance
income for bonds and term deposits. Interest income is recorded in finance income, and dividends are
recorded in other income.
Trade and other payables are classified as other financial liabilities and are recorded at fair value and
subsequently recorded at amortized cost using the effective interest rate (EIR) method. Realized gains and
losses are reported in income. The EIR method discounts estimated future cash payments or receipts through
the expected life of a financial instrument, and thereby calculates the amortized cost and subsequently
allocates the interest income or expense over the life of the instrument.
Long-term debts are classified as loans and borrowings and are initially recorded at fair value and
subsequently recorded at amortized cost using the EIR method. EIR amortization and realized gains and
losses are reported in net finance expense.
Fair value
All financial assets are recognized initially at fair value plus directly attributable transaction costs, except for financial
assets at FVPL, for which transaction costs are expensed. Purchases or sales of financial assets are accounted for
at trade dates. All financial liabilities are recognized initially at fair value and, in the case of loans and borrowings, net
of directly attributable transaction costs.
After initial recognition, the fair values of financial instruments are based on the bid prices in quoted active markets
for financial assets and on the ask prices for financial liabilities. For financial instruments not traded in active markets,
Notes to the Consolidated Financial Statements In Millions of Canadian Dollars Except Number of Shares and Per Share DataDecember 31, 2017 F-17 Stantec Inc.

fair values are determined using appropriate valuation techniques, which may include recent arm’s-length market
transactions, reference to the current fair value of another instrument that is substantially the same, and discounted
cash flow analysis; however, other valuation models may be used. The fair values of the Company’s derivatives are
based on third-party indicators and forecasts. The fair values of cash and cash equivalents, cash in escrow, trade
and other receivables, and trade and other payables approximate their carrying amounts because of the short-term
maturity of these instruments. The carrying amounts of bank loans approximate their fair values because the
applicable interest rate is based on variable reference rates. The carrying amounts of other financial assets
and financial liabilities approximate their fair values except as otherwise disclosed in the consolidated
financial statements.
Derivatives
From time to time, the Company enters into foreign currency forward contracts to manage risk associated with net
operating assets or liabilities denominated in foreign currencies. The Company’s policy is not to use these derivatives
for trading or speculative purposes.
j) Impairment
The carrying amounts of the Company’s assets or group of assets, other than deferred tax assets, are reviewed at
each reporting date to determine whether there is an indication of impairment. An asset may be impaired if there is
objective evidence of impairment as a result of one or more events that have occurred after the initial recognition of
the asset (referred to as a “loss event”) and if that loss event has an impact on the estimated future cash flows of the
financial asset. When an indication of impairment exists or annual impairment testing for an asset is required, the
asset’s recoverable amount is estimated.
Trade and other receivables
The Company maintains an allowance for doubtful accounts on trade receivables. The estimate is based on the best
assessment of the collectibility of the related receivable balance based in part on the age of the outstanding
receivables and the Company’s historical collection and loss experience. When the carrying amount of the receivable
is reduced through the allowance, the reduction is recognized in administrative and marketing expenses in the
consolidated statements of income.
Non-financial assets
For non-financial assets such as property and equipment, goodwill, investments in joint ventures and associates, and
intangible assets, the recoverable amount is the higher of an asset’s or cash-generating unit’s (CGU’s) value in use
or its fair value less costs of disposal. The recoverable amount is determined for an individual asset, unless the
asset does not generate cash inflows that are largely independent of those from other assets or groups of assets.
Where the carrying amount of an asset or CGU exceeds its recoverable amount, the asset is considered impaired
and is written down to its recoverable amount. To assess value in use, the estimated future cash flows are
discounted to their present value using a pretax discount rate that reflects current market assessments of the time
value of money and the risks specific to the asset. To determine fair value less costs of disposal, an appropriate
valuation model is used. The results of these valuation techniques are corroborated by the market capitalization of
comparable public companies and arm’s-length transactions of comparable companies. Impairment losses are
recognized in the consolidated statements of income in those expense categories that are consistent with the nature
of the impaired asset.
Goodwill is not amortized but is evaluated for impairment annually (as at October 1) or more frequently if
circumstances indicate that an impairment may occur or if a significant acquisition occurs between the annual
impairment test date and December 31. The Company considers the relationship between its market capitalization
and its book value, as well as other factors, when reviewing for indicators of impairment. Goodwill is assessed for
impairment based on the CGUs or group of CGUs to which the goodwill relates. Any potential goodwill impairment is
identified by comparing the recoverable amount of a CGU or a group of CGUs to its carrying value including the
allocated goodwill. If the recoverable amount is less than its carrying value, an impairment loss is recognized.
An impairment loss of goodwill is not reversed. For other assets, an impairment loss may be reversed if the estimates
used to determine the recoverable amount have changed. The reversal is limited so that the carrying amount of the
Notes to the Consolidated Financial Statements In Millions of Canadian Dollars Except Number of Shares and Per Share DataDecember 31, 2017 F-18 Stantec Inc.

asset does not exceed its recoverable amount or the carrying amount that would have been determined, net of
amortization or depreciation, had no impairment loss been recognized for the asset in prior years. The reversal is
recognized in the consolidated statements of income.
Available-for-sale financial investments
For equity investments classified as available for sale, objective evidence of impairment includes a significant or
prolonged decline in the fair value of the investment below its cost. “Significant” is evaluated against the original
cost of the investment and “prolonged” against the period in which the fair value has been below its original cost.
Where there is evidence of impairment, the cumulative loss is removed from other comprehensive income and
recognized in the consolidated statements of income. Impairment losses on equity investments are not reversed
through the consolidated statements of income; increases in their fair value after impairment are recognized directly
in other comprehensive income.
For debt instruments (such as bonds) classified as available for sale, the Company first assesses individually
whether objective evidence of impairment exists for debt instruments that are individually significant or collectively for
debt instruments that are not individually significant. If an impairment loss has occurred, the amount recorded is the
cumulative loss, measured as the difference between the amortized cost and the current fair value, less any
previously recognized impairment loss. This amount is removed from other comprehensive income and recognized in
the consolidated statements of income.
Future interest income continues to be accrued based on the reduced carrying amount of the asset applying the rate
of interest used to discount the future cash flows for the purpose of measuring the impairment loss. If the fair value of
a debt instrument increases in a subsequent year and the increase can be objectively related to an event occurring
after the impairment loss was recognized, the impairment loss is reversed in the consolidated statements of income.
k) Revenue recognition
While providing services, the Company incurs certain direct costs for subconsultants, subcontractors, and other
expenditures that are recoverable directly from clients. These direct costs are included in the Company’s gross
revenue. Since these direct costs can vary significantly from contract to contract, changes in gross revenue may not
be indicative of the Company’s revenue trends. Therefore, the Company also reports net revenue, which is gross
revenue less subconsultants, subcontractors, and other direct expenses.
Revenue is recognized to the extent that it is probable that the economic benefits will flow to the Company and the
revenue can be reliably measured. Revenue is measured at the fair value of the consideration received, excluding
discounts, duty, and taxes collected from clients that are reimbursable to government authorities. The Company
assesses its revenue arrangements against specific criteria to determine if it is acting as a principal or an agent.
The Company has concluded that it is acting as a principal in all of its revenue arrangements.
Revenue from fixed-fee and variable-fee-with-ceiling contracts is recognized by referring to the stage of completion
using the revenue cost approach. Stage of completion is measured using labor and subcontractor costs incurred to
date as a percentage of total estimated labor and subcontractor costs for each contract. Where the contract outcome
cannot be measured reliably, revenue is recognized only to the extent that the expenses incurred are eligible to be
recovered. Provisions for estimated losses on incomplete contracts are made in the period that the losses are
determined. Revenue from time-and-material contracts without stated ceilings is recognized as costs are incurred.
Revenue is calculated based on billing rates for the services performed.
Unbilled revenue represents work in progress that has been recognized as revenue but has not yet been invoiced
to clients. Deferred revenue represent amounts that have been invoiced to clients but are not yet recognized
as revenue.
Notes to the Consolidated Financial Statements In Millions of Canadian Dollars Except Number of Shares and Per Share DataDecember 31, 2017 F-19 Stantec Inc.

l) Employee benefit plans
Defined benefit plans
The Company sponsors defined benefit pension plans covering certain full-time employees and past employees,
primarily in the United Kingdom. Benefits are based on final compensation and years of service. Benefit costs
(determined separately for each plan using the projected unit credit method) are recognized over the periods that
employees are expected to render services in return for those benefits.
Remeasurements, comprising of actuarial gains and losses and the return on the plan assets (excluding interest),
are recognized immediately in the consolidated statements of financial position with a corresponding debit or credit to
other comprehensive income in the period in which they occur. Remeasurements are not reclassified to net income in
subsequent periods.
The calculation of defined benefit obligations is performed annually by a qualified actuary. When the calculation
results in a potential asset, the recognized asset is limited to the economic benefits available in the form of any future
refunds or reductions in future contributions to the plan.
Past service costs are recognized in net income on the earlier of the date of the plan amendment or curtailment and
the date that the Company recognizes related restructuring costs.
Net interest is calculated by applying the discount rate to the net defined benefit liability or asset, adjusted for benefit
and contribution payments during the year. The Company recognizes the following changes in the net defined benefit
obligations under administrative and marketing expenses in the consolidated statements of income: service costs
comprising current service costs, past service costs, gains and losses on curtailments and non-routine settlements;
net interest expense or income; and administrative expenses paid directly by the pension plans.
Defined contribution plans
The Company also contributes to group retirement savings plans and an employee share purchase plan. Certain
plans are based on the amount of employee contributions and subject to maximum limits per employee. The
Company accounts for defined contributions as an expense in the period in which the contributions are made.
m) Taxes
Current income tax
Current income tax assets and liabilities for the current and prior periods are measured at the amount expected to be
recovered from or paid to the taxation authorities. The tax rates and tax laws used to compute the amount are those
that are enacted or substantively enacted at the reporting date in the countries where the Company operates and
generates taxable income.
Current income tax that relates to items recognized directly in equity is recognized in equity and not in the
consolidated statements of income. Management periodically evaluates positions taken in the tax returns with respect
to situations in which applicable tax regulations are subject to interpretation and establishes an uncertain tax liability
where appropriate.
Income taxes payable are typically expected to be settled within twelve months of the year end date. However, there
may be instances where taxes payable are over a longer period. The portions due in excess of a one year period are
classified as noncurrent and are not discounted.
Deferred tax
Deferred tax is determined using the liability method for temporary differences at the reporting date between the tax
bases of assets and liabilities and their carrying amounts for financial reporting purposes. Deferred tax liabilities are
generally recognized for all taxable temporary differences. Deferred tax assets are recognized for all deductible
temporary differences, carryforward of unused tax credits and unused tax losses, to the extent that it is probable that
taxable profit will be available against which the deductible temporary differences and the carryforward of unused tax
credits and unused tax losses can be utilized. Deferred taxes are not recognized for the initial recognition of goodwill;
Notes to the Consolidated Financial Statements In Millions of Canadian Dollars Except Number of Shares and Per Share DataDecember 31, 2017 F-20 Stantec Inc.

the initial recognition of assets or liabilities, outside of a business combination, that affect neither accounting nor
taxable profit; or the differences relating to investments in associates and interests in joint ventures to the extent that
the reversal can be controlled and it is probable that it will not reverse in the foreseeable future.
The carrying amount of deferred tax assets is reviewed at each reporting date and reduced to the extent that it is no
longer probable that sufficient taxable profit will be available to allow all or part of the deferred tax asset to be utilized.
Unrecognized deferred tax assets are reassessed at each reporting date and are recognized to the extent that it has
become probable that future taxable profits will allow the deferred tax asset to be recovered.
Deferred tax assets and liabilities are measured at the tax rates that are expected to apply in the year when the asset
is realized or the liability is settled and are based on tax rates and tax laws that have been enacted or substantively
enacted at the reporting date.
Deferred tax relating to items recognized in equity is also recognized in equity. Deferred tax items are recognized in
correlation to the underlying transaction either in other comprehensive income or directly in equity.
Deferred tax assets and deferred tax liabilities are offset if a legally enforceable right exists to set off tax assets
against tax liabilities and the deferred taxes relate to the same taxable entity and the same taxation authority.
Sales tax
Revenues, expenses, and assets, except trade receivables, are recognized net of the amount of sales tax
recoverable from or payable to a taxation authority. Trade receivables and trade payables include sales tax. The
net amount of sales tax recoverable from or payable to a taxation authority is included as part of trade receivables
or trade payables (as appropriate) in the consolidated statements of financial position.
n) Share-based payment transactions
Under the Company’s share option plan, the board of directors may grant to officers and employees remuneration in
the form of share-based payment transactions, whereby officers and employees render services as consideration for
equity instruments (equity-settled transactions).
Under the Company’s deferred share unit plan, the directors of the board of the Company may receive deferred
share units (DSUs) equal to one common share. Before 2014, the chief executive officer could also receive DSUs.
Under the Company’s long-term incentive plan, certain members of the senior leadership teams, including
the chief executive officer, are granted performance share units (PSUs) that vest and are to be settled after a
three-year period. The DSUs and PSUs are share appreciation rights that can be settled only in cash
(cash-settled transactions).
Equity-settled transactions
The cost of equity-settled transactions is measured at fair value at the grant date using a Black-Scholes
option-pricing model. The cost of equity-settled transactions, together with a corresponding increase in equity, is
recognized over the period in which the service conditions are fulfilled (the vesting period). For equity-settled
transactions, the cumulative expense recognized at each reporting date until the vesting date reflects the extent to
which the vesting period has expired and reflects the Company’s best estimate of the number of equity instruments
that will ultimately vest. The expense or credit to income for a period represents the movement in cumulative expense
recognized as at the beginning and end of that period and is recorded in administrative and marketing expenses. No
expense is recognized for awards that do not ultimately vest.
Cash-settled transactions
The cost of cash-settled transactions is measured initially at fair value at the grant date using a Black-Scholes
option-pricing model. This fair value is expensed upon issue with the recognition of a corresponding liability. The
liability is remeasured to fair value at each reporting date, up to and including the settlement date, with changes in
fair value recognized in administrative and marketing expenses.
Notes to the Consolidated Financial Statements In Millions of Canadian Dollars Except Number of Shares and Per Share DataDecember 31, 2017 F-21 Stantec Inc.

o) Earnings per share
Basic earnings per share is computed based on the weighted average number of common shares outstanding during
the year. Diluted earnings per share is computed using the treasury stock method, which assumes that the cash that
would be received on the exercise of options is applied to purchase shares at the average price during the year and
that the difference between the number of shares issued on the exercise of options and the number of shares
obtainable under this computation, on a weighted average basis, is added to the number of shares outstanding.
Antidilutive options are not considered in computing diluted earnings per share.
p) Business combinations and goodwill
Business combinations are accounted for using the acquisition method. The cost of an acquisition is measured as
the consideration transferred at fair value at the acquisition date. Any contingent consideration to be transferred by
the Company is recognized at fair value at the acquisition date. Subsequent changes to the fair value of the
contingent consideration are recognized in other income. Acquisition costs are expensed when incurred in
administrative and marketing expenses.
Goodwill is initially measured at cost, which is the excess of the consideration transferred over the fair value of a
Company’s net identifiable assets acquired and liabilities assumed. If this consideration is lower than the fair value of
the net assets acquired, the difference is recognized in income.
After initial recognition, goodwill is measured at cost less any accumulated impairment losses. For the purpose of
impairment testing, goodwill acquired in a business combination is, from the acquisition date, allocated to each CGU
or group of CGUs that is expected to benefit from the synergies of the combination, irrespective of whether other
assets or liabilities of the acquiree are assigned to those units. Each CGU or group of CGUs represents the lowest
level at which management monitors the goodwill.
q) Dividends
Dividends on common shares are recognized in the Company’s consolidated financial statements in the period the
dividends are declared by the Company’s board of directors.
5. Significant Accounting Judgments, Estimates, and Assumptions
Preparation of the Company’s consolidated financial statements requires management to make judgments,
estimates, and assumptions that affect the reported amounts of revenues, expenses, assets, and liabilities, as well as
the disclosure of contingent liabilities at the end of the reporting year. However, uncertainty about these assumptions
and estimates could result in outcomes that require a material adjustment to the carrying amount of the asset or
liability affected in future periods.
Discussed below are the key management judgments and assumptions concerning the future and other key sources
of estimation uncertainty at the reporting date that have a significant risk of causing a material adjustment to the
carrying amounts of assets and liabilities within the next financial year.
a) Revenue recognition
The Company accounts for its revenue in accordance with IAS 11 Construction Contracts, which requires estimates
to be made for contract costs and revenues. Revenue from fixed-fee and variable-fee-with-ceiling contracts is
recognized using the percentage of completion method based on the ratio of labor costs incurred to total estimated
labor costs. Estimating total direct labor costs is subjective and requires the use of management’s best judgments
based on the information available at that time. The Company also provides for estimated losses on incomplete
contracts in the period in which such losses are determined. Changes in the estimates are reflected in the period in
which they are made and affect the Company’s revenue and unbilled revenue.
b) Allowance for doubtful accounts
The Company maintains an allowance for doubtful accounts for estimated losses resulting from the inability to collect
on its trade receivables. The Company uses estimates in arriving at its allowance for doubtful accounts. The
estimates are based on the age of the outstanding receivables and on the Company’s historical collection and
Notes to the Consolidated Financial Statements In Millions of Canadian Dollars Except Number of Shares and Per Share DataDecember 31, 2017 F-22 Stantec Inc.

loss experience. Future collections of receivables that differ from the Company’s current estimates would affect the
results of its operations in future periods as well as the Company’s trade receivables and administrative and
marketing expenses.
c) Provision for self-insured liabilities
The Company self-insures certain risks, including professional liability, automobile liability, and employment practices
liability. The accrual for self-insured liabilities includes estimates of the costs of reported claims and is based on
estimates of loss using management’s assumptions, including consideration of actuarial projections. These estimates
of loss are derived from loss history that is then subjected to actuarial techniques to determine the proposed liability.
Estimates of loss may vary from those used in the actuarial projections and result in a larger loss than estimated.
Any increase in loss would be recognized in the period in which the loss is determined and increase the Company’s
self-insured liabilities and reported expenses.
d) Share-based payment transactions
The Company measures the cost of share-based payment transactions by reference to the fair value of the
equity instruments at the grant date. Estimating fair value for share-based payment transactions requires
determining the most appropriate valuation model, which is dependent on the terms and conditions of the grant.
The Company has chosen the Black-Scholes option-pricing model for equity-settled and cash-settled share-based
payment transactions.
Estimating fair value also requires determining the most appropriate inputs to the valuation model—including volatility
in the price of the Company’s shares, a risk-free interest rate, and the expected hold period to exercise—and making
assumptions about them. The expected volatility is based on the historical volatility of the Company’s shares over a
period commensurate with the expected term of the share option. The risk-free interest rate for the expected life of
the options is based on the yield available on government bonds, with an approximate equivalent remaining term at
the time of the grant. Historical data is used to estimate the expected life of the option. As well, the Company
estimates its forfeiture rate for equity-settled transactions based on historical experience to determine the
compensation expense arising from the share-based awards. Changes to estimates are recorded in the period in
which they are made and would affect the Company’s administrative and marketing expenses, contributed surplus,
and other liabilities.
e) Business combinations
In a business combination, the Company may acquire certain assets and assume certain liabilities of an acquired
entity. The estimate of fair values for these transactions involves judgment to determine the fair values assigned to
the tangible and intangible assets (i.e., backlog, client relationships, trademarks, software, and favorable and
unfavorable leases) acquired and the liabilities assumed on the acquisition. Determining fair values involves a variety
of assumptions, including revenue growth rates, expected operating income, and discount rates. During a
measurement period not to exceed one year, adjustments of the initial estimates may be required to finalize the fair
value of assets acquired and liabilities assumed. After the measurement period, a revision of fair value may impact
the Company’s net income.
f) Impairment of non-financial assets
Impairment exists when the carrying amount of an asset or CGU exceeds its recoverable amount, which is the higher
of its fair value less costs of disposal or its value in use. Fair value less costs of disposal is based on available data
from binding sales transactions in an arm’s-length transaction of similar assets or observable market prices less
incremental costs for disposing of the asset. In the absence of this data, other valuation techniques can be used to
estimate fair value less costs of disposal. The value in use calculation is based on a discounted cash flow model. The
cash flows are derived from budgets over an appropriate number of years and do not include restructuring activities
that the Company is not yet committed to or significant future investments that will enhance the asset’s performance
of the CGU being tested.
When based on a discounted cash flow methodology, the recoverable amount is most sensitive to the expected
future cash inflows, the growth rate used for extrapolation purposes, the discount rate, and non-cash working capital
requirements. To arrive at cash flow projections, the Company uses estimates of economic and market information
Notes to the Consolidated Financial Statements In Millions of Canadian Dollars Except Number of Shares and Per Share DataDecember 31, 2017 F-23 Stantec Inc.

over the projection period, including growth rates in revenues, estimates of future expected changes in operating
margins, and cash expenditures. Future estimates of capital expenditures are also a significant estimate.
g) Divestitures
For business divestitures, the Company may be required to allocate an amount of goodwill associated with an
operation being disposed of and include this goodwill in the carrying amount of the disposal group when determining
the gain or loss on disposal. The goodwill to be allocated is measured on the basis of the relative fair values of the
operation disposed of and the portion of the CGU retained. When the fair value(s) are determined using a discounted
cash flow methodology a variety of assumptions are required, including revenue growth rates, expected operating
income, non-cash working capital assumptions, and discount rates. These assumptions are assessed for
reasonability by comparing them to relevant market information and forecasts.
h) Employee benefit plans
The cost of the defined benefit pension plans and the present value of the pension obligations are determined
separately for each plan using actuarial valuations. An actuarial valuation involves making various assumptions that
may differ from actual future developments. These include determining the discount rate, mortality rates, future
salary increases, inflation, and future pension increases. Due to the complexities involved in the valuation and its
long-term nature, the defined benefit obligation and cost are highly sensitive to changes in these assumptions,
particularly to the discount and mortality rates (although a portion of the pension plans has protection against
improving mortality rates by utilizing guaranteed annuity rate contracts with an insurance company). All assumptions
are reviewed annually.
In determining the appropriate discount rate, management considers the interest rates of corporate bonds in
currencies consistent with the currencies of the post-employment obligation and that have an ‘AA’ rating or above,
as set by an internationally acknowledged rating agency, and extrapolated as needed along the yield curve to
correspond with the expected term of the benefit obligation.
The mortality rate is based on publicly available information in the actuarial profession’s publications plus any special
geographical or occupational features of each plan’s membership. Mortality tables tend to change only at intervals in
response to demographic changes. Future salary increases reflect the current estimate of management. Pension
increases are calculated based on the terms of the individual plans and estimated future inflation rates.
i) Fair value of financial instruments
When the fair value of financial assets and financial liabilities recorded in the consolidated statements of financial
position cannot be derived from active markets, it is determined using valuation techniques, including the discounted
cash flow model. The inputs to these models are taken from observable markets if possible, but when this is not
feasible, a degree of judgment is required to establish fair values. The judgments include considering inputs such as
liquidity risk, credit risk, and volatility. Changes in assumptions about these factors could affect the reported fair value
of financial instruments and reported expenses and income.
j) Taxes
Uncertainties exist with respect to the interpretation of complex tax regulations and the amount and timing of deferred
taxable income. The Company’s income tax assets and liabilities are based on interpretations of income tax
legislation across various jurisdictions, primarily in Canada and the United States, including the recent US tax reform
further described in note 29. The Company’s effective tax rate can change from year to year based on the mix of
income among different jurisdictions, changes in tax laws in these jurisdictions, and changes in the estimated value
of deferred tax assets and liabilities. The Company’s income tax expense reflects an estimate of the taxes it expects
to pay for the current year, as well as a provision for changes arising in the values of deferred tax assets and
liabilities during the year. The tax value of these assets and liabilities is impacted by factors such as accounting
estimates inherent in these balances, management’s expectations about future operating results, previous tax audits,
and differing interpretations of tax regulations by the taxable entity and the responsible tax authorities. Differences in
interpretation may arise for a wide variety of issues, depending on the conditions prevailing in the respective legal
Notes to the Consolidated Financial Statements In Millions of Canadian Dollars Except Number of Shares and Per Share DataDecember 31, 2017 F-24 Stantec Inc.

entity’s domicile. On a regular basis, management assesses the likelihood of recovering value from deferred tax
assets, such as loss carryforwards, as well as from deferred tax depreciation of capital assets, and adjusts the tax
provision accordingly.
Deferred tax assets are recognized for all unused tax losses to the extent that it is probable that taxable profit will be
available against which the losses can be utilized. Significant management judgment is required to determine the
amount of deferred tax assets that can be recognized based on the likely timing and the level of future taxable profits,
together with future tax-planning strategies. If estimates change, the Company may be required to recognize an
adjustment to its deferred income tax asset or liability and income tax expense.
k) Interests in other entities
The Company determines whether it has control over another entity by making judgments about what the relevant
activities of that entity are and which party or parties have power to direct those activities, as well as whether the
Company is exposed to variable returns of the entity. The Company assesses whether it has control, significant
influence, or joint control over an entity based on the individual facts and circumstances of each agreement. In the
case of a joint arrangement, the Company makes judgments to determine if the arrangement is a joint venture or joint
operation, including whether it has rights to the individual assets or liabilities or to the net assets of the entity and
whether unanimous consent is required to make decisions about relevant activities.
6. Recent Accounting Pronouncements and Changes to Accounting Policies
Recently adopted
The following amendments have been adopted by the Company effective January 1, 2017. The adoption of these
amendments did not have an impact on the financial position or performance of the Company.
In January 2016, the International Accounting Standards Board (IASB) issued Recognition of Deferred Tax Assets
for Unrealized Losses (Amendments to IAS 12). The amendments clarify requirements for the recognition of
deferred tax assets for unrealized losses on debt instruments measured at fair value. These amendments are
effective January 1, 2017, retrospectively, subject to certain exceptions.
In January 2016, the IASB issued Disclosure Initiative (Amendments to IAS 7). These amendments clarify IAS 7,
improving the information provided to users of financial statements about an entity’s financing activities. These
amendments are effective January 1, 2017, with earlier application permitted. The additional disclosures required
by the amendments are included in note 34.
In December 2016, the IASB issued Annual Improvements (2014-2016 Cycle) which amended IFRS 12
Disclosure of Interests in Other Entities (IFRS 12) to clarify the scope of disclosures. The amendments clarify that
the disclosure requirements in IFRS 12, other than those in paragraphs B10 to B16, apply to an entity’s held-for-
sale interests. The Company has adopted the amendments retrospectively.
Future adoptions
Listed below are the standards, amendments, and interpretations that the Company reasonably expects to be
applicable at a future date and intends to adopt when they become effective. The Company is currently considering
the impact of adopting these standards, amendments, and interpretations on its consolidated financial statements
and cannot reasonably estimate the effect at this time unless specifically mentioned below.
IFRS 15 Revenue from Contracts with Customers (IFRS 15)
In May 2014, the IASB issued IFRS 15 Revenue from Contracts with Customers (IFRS 15). In April 2016, the
IASB issued amendments to clarify the standard and provide additional transition relief for modified contracts and
completed contracts. IFRS 15 applies to all revenue contracts with customers and provides a model for the
recognition and measurement of the sale of some non-financial assets such as property, plant, and equipment, and
intangible assets. It sets out a five-step model for revenue recognition and applies to all industries. The core principle
is that revenue should be recognized to depict the transfer of promised goods or services to customers in an amount
that reflects the consideration that the entity expects to be entitled to in exchange for those goods or services.
IFRS 15 requires numerous disclosures, such as the disaggregation of total revenue, disclosures about performance
Notes to the Consolidated Financial Statements In Millions of Canadian Dollars Except Number of Shares and Per Share DataDecember 31, 2017 F-25 Stantec Inc.

obligations, changes in contract asset and liability account balances, and key judgments and estimates. In addition,
the accounting for loss-making contracts will fall under the onerous contracts guidance in IAS 37 Provisions,
Contingent Liabilities and Contingent Assets. Major provisions of IFRS 15 include determining which goods and
services are distinct and require separate accounting (performance obligations), determining the total transaction
price, estimating and recognizing variable consideration, identifying and accounting for contract modifications, and
determining whether revenue should be recognized at a point in time or over time (including guidance on measuring
the stage of completion).
The mandatory effective date of IFRS 15 is January 1, 2018, and the standard may be adopted using a full
retrospective or modified retrospective approach. The Company selected the modified retrospective approach which
will result in the cumulative effect of adoption being recognized at the date of initial application, January 1, 2018. The
Company elected to apply IFRS 15 only to contracts that were not completed at January 1, 2018. In addition, the
Company elected, as a practical expedient, to reflect the aggregate effect of all contract modifications that
occurred before January 1, 2018, for the purposes of identifying the satisfied and unsatisfied performance
obligations, determining the transaction price, and allocating the transaction price to the satisfied and unsatisfied
performance obligations.
The Company established a cross-functional IFRS 15 implementation team that provides regular updates to the Audit
and Risk Committee, including reports on the progress made on the project’s detailed work plan. As part of the
implementation project, the Company prepared an impact assessment, amended policies and practices, updated
internal controls, and educated stakeholders. The updated internal controls will be tested by management in the first
quarter of 2018. The Company’s operational finance team is in the process of completing contract reviews, and the
implementation team is in the process of finalizing its assessment and quantifying the potential effect of IFRS 15
requirements on its consolidated financial statements, including the impact on opening retained earnings as at
January 1, 2018. Details of key judgments and expected changes that may impact the timing and pattern of
recognition are described below. Because the Company’s assessment will not be finalized until the end of the first
quarter, the following explanation may not fully describe the potential effect of IFRS 15 on the Company’s accounting
policies and is subject to change with new facts and circumstances.
Revenue recognized over time: The Company transfers control of the goods or services it provides to clients over
time and therefore recognizes revenue progressively as the services are performed. The Company expects to
continue to recognize revenue over time for fixed-fee and variable-fee-with-ceiling contracts by referring to the stage
of completion using an input method based on cost. For the majority of its time-and-material contracts without stated
ceilings, the Company expects to apply a practical expedient that allows the recognition of revenue in the amount for
which it has the right to invoice, consistent with current practices for such contracts.
Contracts with multiple goods or services: The Company’s contracts often include multiple goods or services.
Currently, the Company may segment revenue recognition between services such as the design, preconstruction,
and construction phases of its contracts. Under IFRS 15, the Company will account for goods and services as
separate performance obligations if they are distinct—if a good or service is separately identifiable from other items in
the contract and if a customer can benefit from the good or service, either on its own or together with other resources
that are readily available to the customer. The Company expects that many of its contracts will include a single
performance obligation because the promise to transfer the individual goods or services is highly integrated and not
separately identifiable from other promises in the contract and, therefore, is not distinct. The Company expects that,
in some cases, the timing and pattern of revenue recognition may be impacted.
Contract modifications and claims: Contract modifications or claims against the customer have a different threshold
for recognition in IFRS 15 than in IAS 11. The Company currently includes contract modifications or claims against
the customer in estimated revenue at completion when it is probable the customer will approve or accept the amount
and it can be reliably measured. Under IFRS 15, contract modifications or claims against the customer are included
in estimated revenue at completion when management believes the Company has an enforceable right to the
modification or claim, the amount can be estimated reliably, and realization is highly probable. The Company expects
that, in some cases, the recognition of revenue related to contract modifications or claims against the customer will
be later under IFRS 15.
Notes to the Consolidated Financial Statements In Millions of Canadian Dollars Except Number of Shares and Per Share DataDecember 31, 2017 F-26 Stantec Inc.

Significant financing component: The Company currently recognizes holdbacks on long-term contracts at their
discounted present value. Under IFRS 15, holdbacks will not typically result in a significant financing component
as the intent is to provide protection against the failure of one party to adequately complete some or all of its
obligations under the contract. As a result, the Company expects that holdbacks on long-term contracts will no
longer be discounted.
Presentation of contract balances: The Company expects to reclassify certain amounts in the consolidated
statements of financial position to comply with IFRS 15. Amounts that are billed based on contractual milestones
or on achieving performance-based targets that are currently presented as unbilled revenue are expected to be
included in contract assets. In addition, contract asset and contract liability balances will be presented on a net
basis for each contract.
Disaggregation of revenue: The Company expects to disclose the disaggregation of gross revenue in categories that
are consistent with its disclosure of segmented information (note 36), except that disclosure of Construction Services
gross revenue by regional geographic area will be added.
IFRS 9 Financial Instruments (IFRS 9)
In July 2014, the IASB issued IFRS 9 Financial Instruments (IFRS 9) to introduce new requirements for the
classification and measurement of financial assets and financial liabilities, including derecognition. IFRS 9 requires
that all financial assets be subsequently measured at amortized cost or fair value. For financial liabilities designated
at fair value through profit and loss, the new standard also requires that changes in fair value attributable to a
financial liability’s credit risk be presented in other comprehensive income, not in profit or loss. Guidance on
accounting for debt modifications has also been amended. As well, IFRS 9 includes a single expected-loss
impairment model and a reformed approach to hedge accounting.
This standard is effective on or after January 1, 2018, and may be adopted using a full retrospective or modified
retrospective approach. The Company has selected the modified retrospective approach. Based on the analyses
performed to date, the Company is expecting the following impact from the adoption of the new standard on
January 1, 2018:
Classification and measurement: The Company’s debt instruments held for self-insured liabilities, currently classified
as available for sale, are being analyzed to determine whether the conditions for classification as fair value through
other comprehensive income (FVOCI) will be met. There will be no significant change to the accounting for debt
instruments that are ultimately determined to meet these conditions. To the extent that any debt instruments do not
meet these conditions, the fair value will be reclassified to financial assets at fair value through profit or loss (FVPL),
and the related fair value gains will be transferred from other comprehensive income to retained earnings on
January 1, 2018.
The Company has determined that equity securities held for self-insured liabilities do not meet the criteria to be
classified as either FVOCI or amortized cost. Consequently, $49.4 will be reclassified to financial assets at FVPL.
Related fair value gains of $1.0 will be transferred from other comprehensive income to retained earnings on
January 1, 2018.
Additional financial assets held by the Company include:
Cash and cash equivalents and cash held in escrow, currently measured at FVPL, that meet the conditions for
classification at amortized cost, and
Trade and other receivables and unbilled revenue, currently measured at amortized cost, that meet the
conditions for classification at amortized cost under IFRS 9
The Company does not expect the new guidance to affect the measurement of these financial assets.
There will be no impact on the Company’s accounting for financial liabilities because the new requirements affect
only the accounting for financial liabilities that are designated at FVPL, and the Company does not have any
such liabilities.
Notes to the Consolidated Financial Statements In Millions of Canadian Dollars Except Number of Shares and Per Share DataDecember 31, 2017 F-27 Stantec Inc.

Derecognition of financial assets and liabilities: Derecognition rules for financial liabilities have been amended to
clarify the accounting for modifications of fixed interest rate debt that do not result in extinguishment. To the extent
the Company has a modification of debt in the future that does not constitute an extinguishment, an immediate
remeasurement gain or loss will occur as a result of the revisions to this guidance. At January 1, 2018, there were no
outstanding debt instruments impacted by the retrospective impact of this guidance. The derecognition rules for
financial assets remain consistent with IAS 39 Financial Instruments: Recognition and Measurement.
Hedging: The new hedge accounting guidance will not impact the Company on adoption because there were no
designated hedges at December 31, 2017.
Impairment of financial assets: The new impairment model requires the recognition of impairment provisions based
on expected credit losses (ECL) rather than incurred credit losses. It applies to financial assets classified at
amortized cost, debt instruments measured at FVOCI, contract assets under IFRS 15, lease receivables, loan
commitments, and certain financial guarantee contracts. Based on the assessments undertaken to date, the
Company expects the impact on credit losses to be insignificant.
The new standard also introduces expanded disclosure requirements and changes in presentation. These are
expected to change the nature and extent of the Company’s disclosures about its financial instruments. Because the
Company is in its final stages of assessing IFRS 9, the above explanations may not fully describe the potential effects
of IFRS 9 on the Company’s accounting policies and is subject to change with new facts and circumstances.
IFRS 16 Leases (IFRS 16)
In January 2016, the IASB issued IFRS 16 Leases (IFRS 16) to introduce a single lease accounting model. It requires
a lessee to recognize assets and liabilities for all leases with a term of more than 12 months, unless the underlying
asset is low in value. IFRS 16 substantially carries forward the lessor accounting requirements in IAS 17 Leases
(IAS 17). The Company will apply IFRS 16 effective January 1, 2019.
The Company established an implementation team in early 2017. The Company continues to assess all potential
impacts and transition provisions of this standard and believes that the most significant impact will relate to the
accounting for operating leases associated with real estate leases. At this time, a quantitative estimate of the effect of
the new standard has not been determined, but the Company anticipates a material impact to the statement of
financial position due to the recognition of the present value of unavoidable future lease payments as lease assets
and lease liabilities. The Company has not yet selected the transition method it will apply. Because the Company is
currently assessing IFRS 16, the above explanation may not fully describe the potential effects of IFRS 16 on its
accounting policies and is subject to change with new facts and circumstances.
Other future adoptions
In June 2016, the IASB issued Classification and Measurement of Share-based Payment Transactions
(Amendments to IFRS 2). The amendments clarify how to account for the effects of vesting and non-vesting
conditions on the measurement of cash-settled share-based payments, share-based payment transactions with
a net settlement feature for withholding tax obligations, and a modification to the terms and conditions of a
share-based payment that changes the classification of the transaction from cash-settled to equity-settled. This
amendment is effective on or after January 1, 2018, with earlier application permitted.
In December 2016, the IASB issued Annual Improvements (2014-2016 Cycle) to make necessary but non-urgent
amendments to IFRS 1 First-time Adoption of International Financial Reporting Standards (IFRS 1), and IAS 28
Investments in Associates and Joint Ventures (IAS 28). The amendments to IFRS 1 and IAS 28 are effective
January 1, 2018, on a retrospective basis.
In December 2016, the International Financial Reporting Interpretations Committee (IFRIC) issued an
interpretation: IFRIC 22 Foreign Currency Transactions and Advance Consideration (IFRIC 22). This interpretation
clarifies that for non-monetary assets and non-monetary liabilities, the transaction date is the date used to
determine the exchange rate on which a company initially recognizes a prepayment or deferred income arising
Notes to the Consolidated Financial Statements In Millions of Canadian Dollars Except Number of Shares and Per Share DataDecember 31, 2017 F-28 Stantec Inc.

from an advance consideration. The interpretation is effective January 1, 2018, and entities may use either a
retrospective or prospective approach on transition, with earlier application permitted.
In June 2017, IFRIC issued IFRIC 23 Uncertainty over Income Tax Treatments (IFRIC 23). This interpretation
addresses how to reflect the effects of uncertainty in accounting for income tax. When there is uncertainty over
income tax treatments under IAS 12 Income Taxes, IFRIC 23 is to be applied to determine taxable profit
(tax loss), tax bases, unused tax losses, unused tax credits, and tax rates. This interpretation is effective
January 1, 2019, retrospectively, subject to certain exceptions.
In October 2017, the IASB issued Prepayment Features with Negative Compensation (Amendments to IFRS 9).
The amendments address concerns about how IFRS 9 classifies prepayable financial assets and clarifies
accounting for financial liabilities following a modification. These amendments are effective on or after
January 1, 2019, on a retrospective basis subject to certain exceptions, with earlier application permitted.
In October 2017, the IASB issued Long-term Interest in Associates and Joint Ventures (Amendments to IAS 28).
The amendments clarify that an entity applies IFRS 9 to long-term interests in an associate or joint venture that
forms part of a net investment in the associate or joint venture but to which the equity method is not applied.
These amendments are effective on or after January 1, 2019, on a retrospective basis subject to certain
exceptions, with earlier application permitted.
In December 2017, the IASB issued Annual Improvements (2015-2017 Cycle) to make necessary but non-urgent
amendments to IFRS 3 Business Combinations, IFRS 11 Joint Arrangements, IAS 12 Income Taxes, and IAS 23
Borrowing Costs. These amendments are effective on or after January 1, 2019, with earlier application permitted.
7. Business Acquisitions
Acquisitions are accounted for under the acquisition method of accounting, and the results of operations since the
respective dates of acquisition are included in the consolidated statements of income. From time to time, as a result
of the timing of acquisitions in relation to the Company’s reporting schedule, certain estimates of fair values of assets
and liabilities acquired may not be finalized at the initial time of reporting. These estimates are completed after the
vendors’ final financial statements have been prepared and accepted by the Company, after detailed project portfolio
reviews are performed, and when the valuations of intangible assets and other assets and liabilities acquired are
finalized. The preliminary fair values are based on management’s best estimates of the acquired identifiable assets
and liabilities at the acquisition date. During a measurement period not to exceed one year, adjustments to the initial
estimates may be required to finalize the fair value of assets and liabilities acquired. The Company will revise
comparative information if these measurement period adjustments are material.
The consideration paid for acquisitions may be subject to price adjustment clauses included in the purchase
agreements and may extend over a number of years. At each consolidated statement of financial position date, these
price adjustment clauses are reviewed. This may result in an increase or decrease of the notes payable consideration
(recorded on the acquisition date) to reflect either more or less non-cash working capital than was originally recorded.
Since these adjustments are a result of facts and circumstances occurring after the acquisition date, they are not
considered measurement period adjustments.
For some acquisitions, additional payments may be made to the employees of an acquired company that are based
on the employees’ continued service over an agreed time period. These additional payments are not included in the
purchase price. They are expensed as compensation when services are provided by the employees.
Notes to the Consolidated Financial Statements In Millions of Canadian Dollars Except Number of Shares and Per Share DataDecember 31, 2017 F-29 Stantec Inc.

Acquisitions in 2016
During 2016, the Company acquired all the shares and business of Bury Holdings, Inc. (Bury); MWH Global, Inc.
(MWH); VOA Associates, Inc. (VOA); Edwards and Zuck, P.C. and Edwards and Zuck Consulting Engineers, D.P.C.
(collectively called Edwards & Zuck); and certain assets and liabilities of Architecture | Tkalcic Bengert (Arch | TB).
The preliminary fair values of the net assets recognized in the Company’s consolidated financial statements were
based on management’s best estimates of the acquired identifiable assets and liabilities at the acquisition dates. For
the year ended December 31, 2017, management finalized the fair value assessment for all assets and liabilities
acquired from Bury, MWH, VOA, Edwards & Zuck and Arch | TB. For the Bury, VOA, Edwards & Zuck and Arch | TB
acquisitions, no adjustments were required to the initial estimates of the fair value of assets and liabilities acquired.
For the MWH acquisition, all adjustments required, from the initial estimates of the fair value of net assets acquired to
their final fair value, were recorded in 2016. These adjustments, as well as the final MWH purchase price allocation to
all identifiable assets and liabilities acquired, are disclosed in note 7 of the Company’s December 31, 2016, annual
consolidated financial statements. There were no significant measurement period adjustments recorded in the year
ended December 31, 2017.
Acquisitions in 2017
On April 28, 2017, the Company acquired certain assets and liabilities of Inventrix Engineering, Inc. (Inventrix) for
cash consideration and notes payable. Inventrix, based in Seattle, Washington, provides expertise in mechanical
engineering. This addition enhances the Company’s Buildings business operating unit in the United States. The
consideration was allocated to the fair value of assets and liabilities acquired.
On July 28, 2017, the Company acquired all the shares and business of RNL Facilities Corporation (RNL) for
cash consideration and notes payable. RNL, based in Denver, Colorado, has additional offices in Phoenix, Arizona;
Los Angeles, California; Washington, DC; and Abu Dhabi, United Arab Emirates. RNL provides expertise in
architecture, interior design, urban design, and landscaping. This addition enhances the Company’s Buildings
business operating unit.
On October 27, 2017, the Company acquired certain assets and liabilities of North State Resources, Inc. (NSR) for
cash consideration and notes payable. NSR is based in Redding, California, and has additional offices in Sacramento
and Chico, California. NSR provides expertise in physical, biological, and environmental sciences. This addition
enhances the Company’s Environmental Services business operating unit.
Notes to the Consolidated Financial Statements In Millions of Canadian Dollars Except Number of Shares and Per Share DataDecember 31, 2017 F-30 Stantec Inc.

Aggregate consideration for assets acquired and liabilities assumed
Details of the aggregate consideration transferred and the fair value of the identifiable assets and liabilities acquired
at the date of acquisition are as follows:
For acquisitions completed in the yearTotal
$
Cash consideration 18.7Notes payable 9.7
Consideration 28.4
Assets and liabilities acquired Cash acquired 5.4Non-cash working capital 0.8Property and equipment 0.8Intangible assets Client relationships 3.2 Contract backlog 2.7 Lease advantages 0.1 Other 0.1Provisions (0.1)Long-term debt (0.1)Deferred income taxes (0.8)
Total identifiable net assets at fair value 12.1Goodwill arising on acquisitions 16.3
Consideration 28.4
Other information
Trade receivables assumed from acquired companies are recognized at fair value at the time of acquisition. For
2017, trade receivables acquired as at the time of acquisition had a fair value of $7.9 and gross value of $8.2.
Goodwill consists of the value of expected synergies arising from an acquisition, the expertise and reputation of
the assembled workforce acquired, and the geographic location of the acquiree. Goodwill relating to acquisitions
completed in 2017 added to our Consulting Services – United States and Consulting Services – Global cash
generating units (CGUs). For all acquisitions completed in 2017, $22.3 of goodwill and intangible assets is deductible
for income tax purposes.
The fair values of provisions are determined at the acquisition date. These liabilities relate to claims that are subject
to legal arbitration and onerous contracts. For acquisitions completed in 2017, the Company assumed $0.2 in
provisions for claims. At the reporting date, provisions for claims outstanding relating to all prior acquisitions were
reassessed and determined to be $17.0, based on their expected probable outcome. Certain of these claims are
indemnified by the acquiree (note 19).
For business combinations that occurred in 2017, the gross revenue earned in 2017, since the acquired entities’
acquisition dates, is $19.8. The Company integrates the operations and systems of acquired entities shortly after the
acquisition date; therefore, it is impracticable to disclose the acquiree’s earnings in its consolidated financial
statements since the acquisition date.
If the business combinations that occurred in 2017 had taken place at the beginning of 2017, gross revenue
from continuing operations for 2017 would have been $5,176.8 (unaudited) and profit from continuing operations
would have been $98.3 (unaudited).
Notes to the Consolidated Financial Statements In Millions of Canadian Dollars Except Number of Shares and Per Share DataDecember 31, 2017 F-31 Stantec Inc.

In 2017, directly attributable acquisition-related costs of $0.4 have been expensed and are included in administrative
and marketing expenses. These costs consist primarily of legal, accounting, and financial advisory fees and costs
directly related to acquisitions.
Consideration paid and outstanding
Details of the consideration paid for current and past acquisitions are as follows:
December 312017
$
Cash consideration (net of cash acquired) 13.3Payments on notes payable from previous acquisitions 66.4
Total net cash paid 79.7
Total notes payable and adjustments to these obligations are as follows:
December 312017
$
Balance, beginning of the year 122.4Additions for acquisitions in the year 9.7Other adjustments (2.8)Payments (66.4)Interest 1.0Impact of foreign exchange (5.1)
Total notes payable 58.8
8. Disposition of a Subsidiary
On May 5, 2017, the Company completed the sale of the shares of Innovyze, Inc. along with its subsidiaries Innovyze
Pty Limited and Innovyze Limited (collectively, Innovyze). Innovyze was acquired as part of the MWH acquisition and
formed part of the Company’s Consulting Services – United States and Consulting Services – Global reportable
segments. Innovyze was sold for gross proceeds of $369.1 (US$270.0), less working capital adjustments, resulting in
cash proceeds of $336.9. As a result of the sale, the Company recognized the following gain on disposition in the
consolidated statements of income:
$
Gross proceeds 369.1Working capital adjustments (15.3)Transaction costs (16.9)
Net proceeds from sale 336.9
Net assets disposed (268.5)Cumulative exchange loss on translating foreign operations reclassified from equity (13.8)
Gain on disposition of a subsidiary 54.6
In accordance with the Credit Facilities agreement (note 18), the Company used the net proceeds on sale, less
taxes payable and certain transaction costs (all as defined in the relevant agreements), to repay its long-term debt
by $221.3.
As a result of the close of the sale, in the second quarter of 2017, current tax expense of $124.1 was recognized in
the consolidated statements of income calculated pursuant to US tax legislation. In addition, $29.6 of deferred taxes
Notes to the Consolidated Financial Statements In Millions of Canadian Dollars Except Number of Shares and Per Share DataDecember 31, 2017 F-32 Stantec Inc.

was recognized in the consolidated statements of income, primarily related to deferred taxes, previously recorded on
Innovyze net assets.
Major categories of assets and liabilities of Innovyze that were disposed of were as follows:
$
AssetsCash and cash equivalents 0.3Trade and other receivables 3.3Unbilled revenue 0.2Prepaid expenses 0.2Property and equipment 0.3Goodwill 194.4Intangibles Client relationships 71.0 Trademarks - indefinite 6.1 Software 18.0
Total assets disposed 293.8
LiabilitiesTrade and other payables 13.7Deferred revenue 10.1Income taxes payable 1.4Provisions 0.1
Total liabilities disposed 25.3
Net assets disposed 268.5
9. Cash and Cash Equivalents
The Company’s policy is to invest cash in excess of operating requirements in highly liquid investments. For the
purpose of the consolidated statements of cash flows, cash and cash equivalents consist of the following:
December 31 December 312017 2016
$ $
Cash 234.7 207.1Unrestricted investments 4.8 3.8
Cash and cash equivalents 239.5 210.9
Unrestricted investments consist of short-term bank deposits with initial maturities of three months or less.
At December 31, 2017, and pursuant to acquisition agreements, $7.9 (US$6.2) (2016 – $8.8 (US$6.6)) was held in
escrow accounts. These escrow funds cover potential indemnification claims and will be settled in accordance with
an escrow agreement. A corresponding obligation was recorded on acquisition and is included in notes payable
(note 18).
Notes to the Consolidated Financial Statements In Millions of Canadian Dollars Except Number of Shares and Per Share DataDecember 31, 2017 F-33 Stantec Inc.

10. Trade and Other Receivables
December 31 December 312017 2016
$ $
Trade receivables, net of allowance 746.6 740.7Holdbacks, current 43.8 45.0Other 25.7 20.7
Trade and other receivables 816.1 806.4
The Company maintains an allowance for estimated losses on trade receivables. The estimate is based on the best
assessment of the collectibility of the related receivable balance, which is determined in part based on the age of the
outstanding receivables and the Company’s historical collection and loss experience.
The following table provides a reconciliation of changes to the Company’s allowance for doubtful accounts.
December 31 December 312017 2016
$ $
Balance, beginning of the year 28.2 20.9Provision for doubtful accounts 11.6 17.0Deductions (8.7) (8.0)Impact of foreign exchange (2.0) (1.7)
Balance, end of the year 29.1 28.2
The aging analysis of gross trade receivables is as follows:
Total 1–30 31–60 61–90 91–120 121+$ $ $ $ $ $
December 31, 2017 775.7 406.5 183.6 60.0 39.4 86.2
December 31, 2016 768.9 413.6 159.5 61.7 44.1 90.0
Notes to the Consolidated Financial Statements In Millions of Canadian Dollars Except Number of Shares and Per Share DataDecember 31, 2017 F-34 Stantec Inc.

11. Property and Equipment
EngineeringEquipment
$
OfficeEquipment
$
LeaseholdImprovements
$
Assetsunder
FinanceLeases
$Other
$Total
$
CostDecember 31, 2015 129.0 70.7 130.9 2.2 31.7 364.5Additions 15.8 12.0 27.7 - 3.2 58.7Additions arising on acquisitions 15.7 6.2 28.5 0.8 3.2 54.4Disposals (27.1) (5.9) (18.7) (0.6) (4.2) (56.5)Transfers 1.4 0.5 (0.5) (1.4) (0.1) (0.1)Impact of foreign exchange (2.9) (1.5) (1.0) (0.1) (0.7) (6.2)
December 31, 2016 131.9 82.0 166.9 0.9 33.1 414.8Additions 21.2 6.8 29.4 - 4.7 62.1Additions arising on acquisitions 0.2 0.1 0.5 - - 0.8Disposals (33.4) (24.9) (16.4) (0.8) (3.0) (78.5)Transfers 0.1 (0.8) 0.2 - 0.5 -Impact of foreign exchange (3.3) (1.6) (5.1) - (1.5) (11.5)
December 31, 2017 116.7 61.6 175.5 0.1 33.8 387.7
Accumulated depreciationDecember 31, 2015 82.3 45.1 61.2 0.9 16.9 206.4Current year depreciation 17.6 8.4 22.2 0.2 2.8 51.2Disposals (25.5) (5.2) (17.5) (0.3) (3.1) (51.6)Transfers 0.7 - (0.1) (0.6) - -Impact of foreign exchange (2.0) (2.7) (0.9) (0.1) 0.6 (5.1)
December 31, 2016 73.1 45.6 64.9 0.1 17.2 200.9Current year depreciation 18.2 7.6 26.7 - 2.1 54.6Disposals (32.7) (25.4) (15.9) (0.1) (2.6) (76.7)Impact of foreign exchange (1.2) (0.2) (1.6) - (0.7) (3.7)
December 31, 2017 57.4 27.6 74.1 - 16.0 175.1
Net book valueDecember 31, 2016 58.8 36.4 102.0 0.8 15.9 213.9
December 31, 2017 59.3 34.0 101.4 0.1 17.8 212.6
Leasehold improvements includes construction work in progress of $3.5 (2016 – $2.5) on which depreciation has not
started. The Company entered into finance leases for certain office and automotive equipment.
Included in the Other category is automotive equipment, buildings, land, and fractional ownership of an aircraft.
Notes to the Consolidated Financial Statements In Millions of Canadian Dollars Except Number of Shares and Per Share DataDecember 31, 2017 F-35 Stantec Inc.

12. Goodwill
December 31 December 31
2017 2016 Note $ $
Net goodwill, beginning of the year 1,828.1 966.5Current year acquisitions 16.3 850.7Current year disposals 8 (194.4) -Impact of foreign exchange (93.4) 10.9
Net goodwill, end of the year 1,556.6 1,828.1
Gross goodwill, end of the year 1,734.6 2,006.1Accumulated impairment losses, beginning and end of the year (178.0) (178.0)
Net goodwill, end of the year 1,556.6 1,828.1
Goodwill arising from acquisitions includes factors such as the expertise and reputation of the assembled workforce
acquired, the geographic location of the acquiree, and the expected synergies.
CGUs are defined based on the smallest identifiable group of assets that generates cash inflows that are largely
independent of the cash inflows from other assets or groups of assets. Other factors are considered, including how
management monitors the entity’s operations. The Company has seven CGUs. Three of these are grouped into
Consulting Services – Global and two are grouped into Construction Services for the purposes of impairment testing.
The Company does not monitor goodwill at or allocate goodwill to its business operating units.
During the second quarter of 2017, the Company completed the sale of the shares of Innovyze (note 8). Innovyze’s
goodwill disposed of included $106.3 allocated from Consulting Services – United States and $88.1 allocated from
Consulting Services – Global.
On October 1, 2017, and October 1, 2016, the Company performed its annual goodwill impairment test in accordance
with its policy described in note 4. Based on the results of the 2017 and 2016 tests, the Company concluded that
the recoverable amount of each CGU or groups of CGUs approximated or exceeded its carrying amount and,
therefore, goodwill was not impaired.
Goodwill was allocated to each CGU or groups of CGUs as follows:
December 31 December 312017 2016
$ $
Consulting Services
Canada 337.8 337.6 United States 917.7 1,073.2 Global 183.2 287.9Construction Services 117.9 129.4
Allocated 1,556.6 1,828.1
Management believes that the methodology used to test impairment of goodwill, which involves a significant number
of judgments and estimates, provides a reasonable basis for determining whether an impairment has occurred. Many
factors used to determine whether goodwill is impaired are outside of management’s control and involve inherent
uncertainty. Therefore, actual results could differ from those estimated.
Notes to the Consolidated Financial Statements In Millions of Canadian Dollars Except Number of Shares and Per Share DataDecember 31, 2017 F-36 Stantec Inc.

Valuation techniques
When performing the goodwill impairment test, if the carrying amount of a CGU or group of CGUs is higher than its
recoverable amount, an impairment charge is recorded as a reduction in the carrying amount of the goodwill on the
consolidated statements of financial position and recognized as a non-cash impairment charge in income.
The Company estimates the recoverable amount by using the fair value less costs of disposal approach. It estimates
fair value using market information and discounted after-tax cash flow projections, which is known as the income
approach. The income approach uses a CGUs or groups of CGUs projection of estimated operating results and
discounted cash flows based on a discount rate that reflects current market conditions and the risk of achieving the
cash flows. The Company uses cash flow projections covering a five-year period from financial forecasts approved
by senior management. For its October 1, 2017, and October 1, 2016, impairment tests, the Company discounted
the cash flows for each CGU or group of CGUs using an after-tax discount rate ranging from 8.9% to 15.1%
(2016 – 9.0% to 13.7%) . To arrive at cash flow projections, the Company used estimates of economic and market
information over the projection period (note 5).
The Company validates its estimate of the fair value of each CGU or group of CGUs under the income approach by
comparing the resulting multiples to multiples derived from comparable public companies and comparable company
transactions. The Company reconciles the total fair value of all CGUs and groups of CGUs with its market
capitalization to determine if the sum is reasonable. If the reconciliation indicates a significant difference between the
external market capitalization and the fair value of the CGUs or groups of CGUs, the Company reviews and adjusts, if
appropriate, the discount rate of the CGU or groups of CGUs and considers whether the implied acquisition premium
(if any) is reasonable in light of current market conditions. The fair value measurement was categorized as a level 3
fair value based on the significant inputs in the valuation technique used (note 26).
The Company may need to test its goodwill for impairment between its annual test dates if market and economic
conditions deteriorate or if volatility in the financial markets causes declines in the Company’s share price, increases
the weighted average cost of capital, or changes valuation multiples or other inputs to its goodwill assessment. In
addition, changes in the numerous variables associated with the judgments, assumptions, and estimates made
by management in assessing the fair value could cause them to be impaired. Goodwill impairment charges are
non-cash charges that could have a material adverse effect on the Company’s consolidated financial statements but
in themselves do not have any adverse effect on its liquidity, cash flows from operating activities, or debt covenants
and will not have an impact on its future operations.
Key assumptions
The calculation of fair value less costs of disposal is most sensitive to the following assumptions:
Operating margin rates based on actual experience and management’s long-term projections.
Discount rates reflecting investors’ expectations when discounting future cash flows to a present value, taking
into consideration market rates of return, capital structure, company size, and industry risk. If necessary, a
discount rate is further adjusted to reflect risks specific to a CGU or group of CGUs when future estimates of
cash flows have not been adjusted.
Terminal growth rates based on actual experience and market analysis. Projections are extrapolated beyond five
years using a growth rate that does not exceed 3.0%.
Non-cash working capital requirements are based on historical actual rates, market analyis, and management's
long-term projections.
Notes to the Consolidated Financial Statements In Millions of Canadian Dollars Except Number of Shares and Per Share DataDecember 31, 2017 F-37 Stantec Inc.

Sensitivity to changes in assumptions
As at October 1, 2017, the recoverable amount of each CGU and group of CGUs exceeded its carrying amount.
For Consulting Services – Canada and Consulting Services – United States management believes that no
reasonably possible change in any of the above key assumptions would have caused the carrying amount to exceed
its recoverable amount.
For Consulting Services – Global group of CGUs, and Construction Services group of CGUs, as at the impairment
testing date, the recoverable amount approximated the carrying amount. As a result, any adverse change in key
assumptions could cause the carrying value to exceed the fair value less costs of disposal. The Consulting
Services – Global group of CGUs had a moderated outlook in the pace of recoveries in the energy and mining
sectors and in public sector spending in regions linked to these markets and Construction Services group of CGUs is
under increased competition in the water sector. These moderated outlooks were reflected in the Company’s budget
and projections finalized in late 2017.
The values assigned to the most sensitive key assumptions for Consulting Services – Global group of CGUs and
Construction Services group of CGUs are listed in the table below:
Key Assumptions Consulting Services – Global Construction Services
Operating margin rates 5.6% - 8.1% 1.1% - 1.3% After tax discount rate 11.3% 12.5% Terminal growth rate 3.0% 3.0% Non-cash working capital rates 14.9% - 15.3% (5.1%) - (5.6%)
Key assumptions for operating margin rates and non-cash working capital rates for Consulting Services - Global are
calculated on net revenue, whereas Construction Services rates are calculated on gross revenue.
Notes to the Consolidated Financial Statements In Millions of Canadian Dollars Except Number of Shares and Per Share DataDecember 31, 2017 F-38 Stantec Inc.

13. Intangible Assets
ClientRelationships
ContractBacklog Software Other Total
TotalLease
Disadvantage(note 21)
$ $ $ $ $ $
CostDecember 31, 2015 146.3 12.9 63.0 9.9 232.1 (8.1)Additions - - 25.7 - 25.7 -Additions – internal development - - 0.6 - 0.6 -Additions arising on acquisitions 246.9 50.6 27.6 29.1 354.2 (2.8)Removal of fully amortized assets (0.3) (9.5) (16.5) (1.5) (27.8) 0.5Impact of foreign exchange 6.1 1.5 (2.8) 0.9 5.7 0.1
December 31, 2016 399.0 55.5 97.6 38.4 590.5 (10.3)Additions - - 5.7 - 5.7 -Additions arising on acquisitions 3.2 2.7 - 0.2 6.1 -Disposals – Innovyze (78.1) - (19.1) (6.1) (103.3) -Disposals – other - - (3.3) - (3.3) -Removal of fully amortized assets (13.8) (6.2) (15.7) (3.1) (38.8) 2.5Impact of foreign exchange (20.8) (4.1) 0.4 (1.9) (26.4) 0.6
December 31, 2017 289.5 47.9 65.6 27.5 430.5 (7.2)
Accumulated amortizationDecember 31, 2015 59.3 6.0 25.4 3.3 94.0 (4.1)Current year amortization 26.8 22.3 21.6 6.9 77.6 (1.9)Removal of fully amortized assets (0.3) (9.5) (16.5) (1.5) (27.8) 0.4Impact of foreign exchange (0.8) 0.4 (2.3) (0.1) (2.8) 0.1
December 31, 2016 85.0 19.2 28.2 8.6 141.0 (5.5)Current year amortization 30.2 26.4 17.2 8.3 82.1 (1.9)Disposals – Innovyze (7.2) - (1.1) - (8.3) -Disposals – other - - (2.7) - (2.7) -Removal of fully amortized assets (13.8) (6.2) (15.7) (3.1) (38.8) 2.5Impact of foreign exchange (3.8) (1.8) 1.0 (0.6) (5.2) 0.4
December 31, 2017 90.4 37.6 26.9 13.2 168.1 (4.5)
Net book valueDecember 31, 2016 314.0 36.3 69.4 29.8 449.5 (4.8)
December 31, 2017 199.1 10.3 38.7 14.3 262.4 (2.7)
Once an intangible asset is fully amortized, the gross carrying amount and related accumulated amortization are
removed from the accounts. Software includes finance leases with a net book value of $16.5 (2016 – $23.0).
In accordance with its accounting policies in note 4, the Company tests intangible assets for recoverability when
events or changes in circumstances indicate that their carrying amount may not be recoverable. To determine
indicators of impairment of intangible assets, the Company considers external sources of information such as
prevailing economic and market conditions and internal sources of information such as the historical and expected
financial performance of the intangible assets. If indicators of impairment are present, the Company determines
recoverability based on an estimate of discounted cash flows, using the higher of either the value in use or the fair
value less costs of disposal methods. The measurement of impairment loss is based on the amount that the carrying
amount of an intangible asset exceeds its recoverable amount at the CGU level. As part of the impairment test, the
Company updates its future cash flow assumptions and estimates, including factors such as current and future
Notes to the Consolidated Financial Statements In Millions of Canadian Dollars Except Number of Shares and Per Share DataDecember 31, 2017 F-39 Stantec Inc.

contracts with clients, margins, market conditions, and the useful lives of the assets. During 2017, the Company
concluded that there were no indicators of impairment to intangible assets.
14. Investments in Joint Ventures and Associates
The Company has interests in a number of joint ventures and associates that are private entities not listed on any
public exchange. All operations are continuing.
Movement in investments in joint ventures and associates December 31 December 312017 2016
$ $
Balance, beginning of the year 9.2 4.5Additions arising on acquisitions - 3.0Share of total comprehensive income 2.6 2.4Dividends and distributions received (2.0) (0.8)Impact of foreign exchange (0.1) 0.1
Balance, end of the year 9.7 9.2
The Company’s interests in joint ventures include a 40% investment in PAE (New Zealand) Limited (PAE) and a
50% investment in ESH MWH Limited (ESH) which operates in the United Kingdom. Both joint ventures provide
construction services. No dividends were paid in 2017 and 2016. The significant financial information for these joint
ventures, based on their financial statements, are as follows:
For the year ended December 31 For the year ended December 31
2017 2016
PAE ESH PAE ESH
$ $ $ $
Revenue 61.3 30.1 28.6 -Other expenses 58.7 30.1 27.6 -Income tax expense 0.6 - 0.6 -
Net income for the year 2.0 - 0.4 -
Total comprehensive income 2.0 - 0.4 -
The Company has immaterial joint ventures and associates. Summarized financial information for the Company’s
share of these immaterial entities are as follows:
December 31 December 312017 2016
$ $
Total comprehensive income 1.8 2.2Aggregate carrying value 5.0 5.1
Activities classified as joint operations are accounted for in the consolidated financial statements by reflecting, line by
line, the Company’s share of the assets held jointly, liabilities incurred jointly, and revenue and expenses arising from
the joint operation (note 35).
To support the activities of certain joint ventures and associates, the Company and the other investors in the joint
ventures have agreed to make additional contributions in proportion to their interests to make up any losses, if
required. In addition, for certain joint ventures and associates, the profits will not be distributed until the parties to the
arrangement provide consent for distribution.
Notes to the Consolidated Financial Statements In Millions of Canadian Dollars Except Number of Shares and Per Share DataDecember 31, 2017 F-40 Stantec Inc.

15. Other Financial Assets
December 31 December 312017 2016
$ $
Investments held for self-insured liabilities 147.1 141.1Holdbacks on long-term contracts 39.6 33.9Indemnifications 2.4 2.4Other 6.3 3.6
195.4 181.0Less current portion 9.3 20.9
Long-term portion 186.1 160.1
Investments held for self-insured liabilities
Investments held for self-insured liabilities consist of government and corporate bonds, equity securities, and term
deposits. These investments are classified as available for sale and are stated at fair value with unrealized gains
(losses) recorded in other comprehensive (loss) income.
Their fair value and amortized cost are as follows:
December 31 December 312017 2016
$ $
Fair ValueAmortized Cost/Cost Fair Value
Amortized Cost/Cost
Bonds 97.7 98.6 93.0 93.1Equity securities 49.4 48.3 46.6 39.9Term deposits - - 1.5 1.5
Total 147.1 146.9 141.1 134.5
The bonds bear interest at rates ranging from 0.75% to 5.15% per annum (December 31, 2016 – 0.88% to 4.88%).
The terms to maturity of the bond portfolio, stated at fair value, are as follows:
December 31 December 312017 2016
$ $
Within one year 5.6 18.6After one year but not more than five years 73.5 64.8More than five years 18.6 9.6
Total 97.7 93.0
Indemnifications
The Company’s indemnifications relate to certain legal claims (note 19). During 2017, the change to provisions and
indemnification assets relating to prior acquisitions was $0.2 (2016 – increased by $1.2) due to new information
obtained in the year.
Notes to the Consolidated Financial Statements In Millions of Canadian Dollars Except Number of Shares and Per Share DataDecember 31, 2017 F-41 Stantec Inc.

16. Other Assets
December 31 December 312017 2016
$ $
Investment tax credits 9.2 14.1Transaction costs on long-term debt 4.9 5.8
14.1 19.9Less current portion 4.7 4.7
Long-term portion 9.4 15.2
17. Trade and Other Payables
December 31 December 312017 2016
$ $
Trade accounts payable 367.1 363.9Employee and payroll liabilities 248.8 270.7Accrued liabilities 88.7 83.5
Trade and other payables 704.6 718.1
18. Long-Term Debt
December 31 December 312017 2016
$ $
Notes payable 60.8 127.2Revolving credit facilities 209.9 416.1Term loan 458.5 454.1Finance lease obligations 10.4 23.1
739.6 1,020.5Less current portion 198.2 91.9
Long-term portion 541.4 928.6
Notes payable
Notes payable consists primarily of notes payable for acquisitions (note 7). The weighted average rate of interest on
the notes payable at December 31, 2017, was 3.46% (2016 – 3.45%). The notes payable may be supported by
promissory notes and are due at various times from 2018 to 2020. The aggregate maturity value of the notes at
December 31, 2017, was $61.9 (2016 – $129.4). At December 31, 2017, $57.4 (US$45.7) (2016 – $122.3 (US$91.1))
of the notes’ carrying amount was payable in US funds.
Revolving credit facilities and term loan
On May 6, 2016, the Company entered into an agreement for new $1.25 billion syndicated senior secured credit
facilities (Credit Facilities) consisting of a senior secured revolving credit facility in the maximum amount of
$800.0 and a $450.0 senior secured term loan in three tranches. This agreement allows the Company access to an
additional $200.0, subject to approval, under the same terms and conditions. The revolving credit facility expires on
May 6, 2021, and may be repaid from time to time at the option of the Company. The facility is available for future
acquisitions, working capital needs, and general corporate purposes. Tranches A and B of the term loan were drawn
in Canadian funds of $150.0 each (due May 6, 2018, and May 6, 2019, respectively), and tranche C was originally
drawn in US funds of $116.7 (due May 6, 2020). On May 5, 2017, the Company reached an agreement to extend the
maturity date of its $800.0 senior secured revolving credit facility from May 6, 2020, to May 6, 2021, and to
Notes to the Consolidated Financial Statements In Millions of Canadian Dollars Except Number of Shares and Per Share DataDecember 31, 2017 F-42 Stantec Inc.

redenominate tranche C of its senior secured term loan from US funds of $116.7 to Canadian funds of $160.0. The
term loan was recorded net of transaction costs of $3.3, which are amortized over the life of the three tranches.
The Credit Facilities may be drawn in Canadian dollars as either a prime rate loan or a bankers’ acceptance; in US
dollars as either a US base rate or a LIBOR advance; or, in the case of the revolving credit facility, in sterling or
euros as a LIBOR advance; and by way of letters of credit. Depending on the form under which the credit facilities
are accessed, rates of interest vary between Canadian prime, US base rate, and LIBOR or bankers’ acceptance
rates, plus specified basis points. The specified basis points vary, depending on the Company’s leverage ratio
(a non-IFRS measure), from 0 to 175 for Canadian prime and US base rate loans and from 100 to 275 for bankers’
acceptances, LIBOR advances, and letters of credit. As security for the obligations under these facilities, the
Company and certain of its subsidiaries granted the lenders a first-ranking security interest over all present and
after-acquired assets, property, and undertakings, subject to customary carve-outs. The Credit Facilities contain
restrictive covenants (note 28).
At December 31, 2017, $106.9 (US$85.0) of the revolving credit facility was payable in US funds, and $103.0 was
payable in Canadian funds. At December 31, 2016, $114.1 (US$85.0) of the revolving credit facility was payable in
US funds and $302.0 was payable in Canadian funds. At December 31, 2017, $460.0 of the term loan was payable in
Canadian funds. At December 31, 2016, $156.7 (US $116.7) of the term loan was payable in US funds and $300.0
was payable in Canadian funds. The average interest rate applicable at December 31, 2017, for the Credit Facilities
was 3.20% (2016 – 3.13%).
The funds available under the revolving credit facility are reduced by any outstanding letters of credit issued pursuant
to the facility agreement. At December 31, 2017, the Company had issued and outstanding letters of credit that
expire at various dates before January 2019, are payable in various currencies, and total $51.8 (2016 – $54.7).
These letters of credit were issued in the normal course of operations, including the guarantee of certain office
rental obligations. At December 31, 2017, $538.3 (2016 – $329.2) was available in the revolving credit facility for
future activities.
At December 31, 2017, there were $4.3 (2016 – $3.6) in additional letters of credit issued and outstanding, outside of
the Company’s revolving credit facility. These were issued in various currencies and expire at various dates before
November 2018.
Surety facilities
The Company has surety facilities to facilitate, as part of the normal course of operations, the issuance of bonds for
certain types of project work. At December 31, 2017, the Company issued bonds under these surety facilities totaling
$0.2 (2016 – $0.2) in Canadian funds, $587.1 (US$467.0) (2016 – $430.6 (US$320.7)) in US funds, and $1.0
(2016 – $1.3) in other foreign currencies. These bonds expire at various dates before December 2021.
Finance lease obligations
The Company has finance leases for software and for automotive and office equipment. At December 31, 2017,
finance lease obligations included finance leases bearing interest at rates ranging from 1.4% to 5.25%
(2016 – 1.37% to 5.93%). These finance leases expire at various dates before November 2021.
Future minimum lease payments under finance leases and the present value of the net minimum lease payments are
as follows:
December 31 December 312017 2016
$ $
Within one year 7.4 12.9After one year but not more than five years 3.1 10.4
Total minimum lease payments 10.5 23.3
Present value of minimum lease payments 10.4 23.1
Notes to the Consolidated Financial Statements In Millions of Canadian Dollars Except Number of Shares and Per Share DataDecember 31, 2017 F-43 Stantec Inc.

19. Provisions
December 31 December 312017 2016
$ $
Provision for self-insured liabilities 72.5 69.4Provisions for claims 18.9 25.2Onerous contracts 4.8 10.8End of employment benefit plans 13.6 11.3
109.8 116.7Less current portion 28.1 36.0
Long-term portion 81.7 80.7
In the normal conduct of operations, various legal claims are pending against the Company, alleging, among other
things, breaches of contract or negligence in connection with the performance of consulting and construction
services. The Company carries professional liability insurance, subject to certain deductibles and policy limits, and
has a captive insurance company that provides insurance protection against such claims. In some cases, the
Company may be subject to claims for which it is only partly insured or it is completely insured. Damages assessed in
connection with and the cost of defending such actions could be substantial and possibly in excess of policy limits, for
which a range of possible outcomes are either not able to be estimated or not expected to be significant. However,
based on advice and information provided by legal counsel, the Company’s previous experience with the settlement
of similar claims, and the results of the annual actuarial review, management believes that the Company has
recognized adequate provisions for probable and reasonably estimated liabilities associated with these claims. In
addition, management believes that it has appropriate insurance in place to respond to and offset the cost of
resolving these claims.
During the year, claims related to pre-acquisition contracts not covered by the Company's self-insurance have
developed. It is not practical to estimate the potential effect of these claims; however, management believes it is not
probable that resolution of these claims will result in an outflow and the Company has or will be asserting various
affirmative claims of its own related to the same projects.
Due to uncertainties in the nature of the Company’s legal claims, such as the range of possible outcomes and the
progress of the litigation, provisions accrued involve estimates. The ultimate cost to resolve these claims may exceed
or be less than that recorded in the consolidated financial statements. Management believes that the ultimate cost to
resolve these claims will not materially exceed the insurance coverage or provisions accrued and, therefore, would
not have a material adverse effect on the Company’s consolidated statements of income and financial position.
Management regularly reviews the timing of the outflows of these provisions. Cash outflows for existing provisions
are expected to occur within the next one to five years, although this is uncertain and depends on the development of
the various claims. These outflows are not expected to have a material impact on the Company’s cash flows.
Provision for self-insured liabilities December 31 December 312017 2016
$ $
Provision, beginning of the year 69.4 61.5Current-year provisions 23.9 10.5Claims from acquisitions - 8.0Payment for claims settlement (17.5) (9.6)Impact of foreign exchange (3.3) (1.0)
Provision, end of the year 72.5 69.4
Notes to the Consolidated Financial Statements In Millions of Canadian Dollars Except Number of Shares and Per Share DataDecember 31, 2017 F-44 Stantec Inc.

The current and long-term portions of the provision for self-insured liabilities are determined based on an actuarial
estimate. At December 31, 2017, the long-term portion was $65.9 (2016 – $64.0).
Provisions for claims December 31 December 31
2017 2016$ $
Provisions, beginning of the year 25.2 13.3Current-year provisions 2.3 2.3Claims from acquisitions 0.2 23.6Claims paid or otherwise settled (6.8) (11.3)Impact of foreign exchange (2.0) (2.7)
Provisions, end of the year 18.9 25.2
Provisions for claims include an estimate for costs associated with legal claims covered by third-party insurance.
Often, these legal claims are from previous acquisitions and may be indemnified by the acquiree (notes 7 and 15).
Onerous contracts December 31 December 312017 2016
$ $
Liability, beginning of the year 10.8 10.7Current-year provisions 0.7 4.3Resulting from acquisitions - 2.5Costs paid or otherwise settled (6.4) (6.6)Impact of foreign exchange (0.3) (0.1)
Liability, end of the year 4.8 10.8
Onerous contracts consist of lease exit liabilities and sublease losses. Payments for these onerous contracts will
occur until 2024. The Company anticipates a lease exit liability of approximately $15.0 to be recorded in the fourth
quarter of 2018 in relation to its corporate office move.
20. Net Employee Defined Benefit Liability
The Company sponsors defined benefit pension plans (the Plans) covering certain full-time employees and past
employees, primarily in the United Kingdom. The benefits for the defined benefit pension plans are based on final
compensation and years of service. The Plans ceased all future service benefits, although the future salary link has
been retained for certain continuing active members.
The Plans are governed by the laws of the United Kingdom. Each pension plan has a board of trustees–consisting of
four employer-appointed trustees (one of these is a professional trustee) and two member-nominated trustees–that is
responsible for administering the assets and defining the investment policies of the Plans.
The funding objective of each pension plan is to have sufficient and appropriate assets to meet actuarial liabilities.
The board of trustees reviews the level of funding required based on separate triennial actuarial valuations for
funding purposes; the most recent was completed as at March 31, 2017. The Plans require that contributions be
made to separately administered funds, which are maintained independently by custodians. The Company expects to
contribute $14.9 to the Plans in 2018.
The Plans expose the Company to a number of risks, including changes to long-term UK interest rates and inflation
expectations, movements in global investment markets, changes in life expectancy rates, foreign exchange risk, and
regulatory risk from changes in UK pension legislation. The Company is also exposed to price risk because the Plan
assets include significant investments in equities.
Guaranteed annuities, purchased for certain plan members upon retirement, protect a portion of the Plans from
changes in interest rates and longevity post-retirement. Post-retirement benefits that are fully matched with insurance
policies have been included in both the asset and liability figures in the following tables.
Notes to the Consolidated Financial Statements In Millions of Canadian Dollars Except Number of Shares and Per Share DataDecember 31, 2017 F-45 Stantec Inc.

A program of liability-driven investments (LDI) has been implemented to hedge a portion of the Plans’ long-term
interest rate risk. The LDI program is at a relatively early stage and relates to only a portion of the Plans’ investments;
therefore, the Plans remain exposed to significant interest rate risk, along with the other risks mentioned above.
The following table shows a reconciliation from the opening balances to the closing balances for the net defined
benefit liability and its components:
2017 2016
DefinedBenefit
Obligation
Fair Valueof PlanAssets
NetDefinedBenefit
Liability
DefinedBenefit
Obligation
Fair Valueof PlanAssets
NetDefinedBenefitLiability
$ $ $ $ $ $
Balance, beginning of the year 374.6 (324.1) 50.5 383.6 (339.8) 43.8
Included in profit or lossInterest expense (income) 10.4 (8.9) 1.5 7.5 (6.7) 0.8Administrative expenses paid by the Plans - 1.0 1.0 - 0.9 0.9
10.4 (7.9) 2.5 7.5 (5.8) 1.7
Included in other comprehensive incomeReturn on the plan assets (excluding interestincome) - (30.1) (30.1) - (19.5) (19.5)
Actuarial (gains) losses arising from:
Changes in demographic assumptions (8.1) - (8.1) (1.3) - (1.3)Changes in financial assumptions 29.5 - 29.5 35.0 - 35.0Experience adjustments (5.3) - (5.3) 3.2 - 3.2
Effect of movement in exchange rates 10.2 (9.4) 0.8 (45.0) 40.1 (4.9)
26.3 (39.5) (13.2) (8.1) 20.6 12.5
OtherBenefits paid (13.6) 13.6 - (8.4) 8.4 -Contributions by employer - (21.3) (21.3) - (7.5) (7.5)
(13.6) (7.7) (21.3) (8.4) 0.9 (7.5)
Balance, end of the year 397.7 (379.2) 18.5 374.6 (324.1) 50.5
Presented in the statement of financial position as:
December 31 December 312017 2016
$ $
Net defined benefit asset (12.7) -Net defined benefit liability 31.2 50.5
18.5 50.5
The Company has an unconditional right to derive economic benefit from the above surplus and has, therefore,
recognized a net defined benefit asset.
Notes to the Consolidated Financial Statements In Millions of Canadian Dollars Except Number of Shares and Per Share DataDecember 31, 2017 F-46 Stantec Inc.

The major categories of plan assets, measured at fair value, are as follows:
December 31 December 312017 2016
$ $
Cash and cash equivalents 2.9 8.8
Investments quoted in active markets (mutual funds and exchange-traded funds):
Equities 110.1 80.8 Corporate bonds and fixed income 45.0 36.1 Property funds 6.6 8.0
Unquoted investments (insurance contract):
Annuity policies 102.9 90.5 Equities and property 69.5 59.0 Corporate bonds 22.7 19.1 Cash and cash equivalents 19.5 21.8
Fair Value of the plan assets 379.2 324.1
The investment policy for the Plans is to balance risk and return. Approximately 40% of the plan assets are invested
in mutual funds and exchange-traded funds (both are fair valued using quoted market prices) or held in cash.
Approximately 30% of the plan assets are held in annuity policies which are purchased for certain plan members
upon retirement. The fair value of these policies reflects the value of the obligation for these retired plan members
and is determined using actuarial techniques and guaranteed annuity rates. The remaining assets of the Plans are
invested in a wholly insured with-profits insurance contract with a major insurance company. Contributions made to
this contract are invested in insurance policies administered by third parties, which provide for a declared rate of
interest. The yields on the investments are intended to provide for a steady return on the assets, which is not wholly
dependent on stock market fluctuations, to reflect the long-term performance of the investment. The insurance
contract is fair valued using valuation techniques with market observable inputs.
The present value of the defined benefit obligation is determined by discounting the estimated future cash flows using
actuarial valuations. The principal assumptions used in determining pension benefit obligations for the Plans are
shown below (expressed as weighted averages):
December 31 December 31 2017 2016
Discount rate 2.47% 2.68% Rate of increase in salaries 3.51% 4.50% Rate of inflation, pre-retirement 2.40% 2.45% Rate of increase in future pensions payment 3.53% 3.58%
Life expectancy at age 65 for current pensioners: Male 22 years 22 years
Female 24 years 24 years
Life expectancy at age 65 for current members aged 40: Male 23 years 24 years
Female 26 years 26 years
At December 31, 2017, the weighted average duration of the defined benefit obligation was 15 years
(2016 – 14 years).
Notes to the Consolidated Financial Statements In Millions of Canadian Dollars Except Number of Shares and Per Share DataDecember 31, 2017 F-47 Stantec Inc.

Quantitative sensitivity analyses showing the impact on the defined benefit obligation for significant assumptions are
as follows:
December 31 2017
December 312016
Increase Decrease Increase Decrease$ $ $ $
Change in discount rate by 0.25% (11.2) 11.8 (10.5) 11.0Change in pre-retirement inflation rate by 0.25% 3.9 (3.8) 3.5 (3.3)Change in salary growth by 0.25% 0.5 (0.5) 0.8 (0.6)Change in pension increase assumption by 0.25% 6.4 (6.1) 0.8 (0.8)Increase of one year in the life expectancy 6.0 n/a 4.6 n/a
The sensitivity analyses above have been determined based on a method that extrapolates the impact on the defined
benefit obligation as a result of reasonable changes in key assumptions occurring at the end of the reporting period.
The sensitivity analyses are based on a change in a significant assumption and keeping all other assumptions
constant, and may not be representative of an actual change in the defined benefit obligation as it is unlikely that
changes in assumptions would occur in isolation of one another.
21. Other Liabilities
December 31 December 312017 2016
Note $ $
Deferred gain on sale leaseback 0.5 1.1Lease inducement benefits 57.2 50.3Lease disadvantages 2.7 4.8Deferred share units payable 25 15.5 16.2Other cash-settled share-based compensation 25 7.0 8.0Liability for uncertain tax positions 31.3 28.8
114.2 109.2Less current portion 22.2 20.8
Long-term portion 92.0 88.4
22. Derivative Financial Instruments
During the year ended December 31, 2016, the Company entered into US$773.0 foreign currency forward contract
agreements to purchase US$773.0 for $1,009.0 at fixed rates varying from 1.3236 to 1.28655 that matured on
May 6, 2016. These derivative financial instruments were entered into to mitigate foreign currency fluctuation risk
on the purchase price of MWH that was to be paid in US dollars. The fair value of the contracts resulted in a realized
loss of $10.2 in 2016. The Company designated these foreign currency forward contracts as a cash flow hedge which
was effective to the date of maturity.
23. Commitments
The Company has various operating lease commitments, including commitments for annual basic premises rent
under long-term leases and equipment and vehicle operating leases. The Company also has purchase obligations for
cloud services, software support, and equipment. Depending on the agreement, the Company may enter into renewal
options or escalation clauses.
Notes to the Consolidated Financial Statements In Millions of Canadian Dollars Except Number of Shares and Per Share DataDecember 31, 2017 F-48 Stantec Inc.

Future minimum rental payments payable under noncancellable operating leases and purchase obligations as at
December 31, 2017, are as follows:
$
Within one year 214.4After one year but not more than five years 571.5More than five years 349.2
1,135.1
The premises rental expense for the year ended December 31, 2017, was $178.1 (2016 – $165.0).
Sublease rental income for the year ended December 31, 2017, was $7.4 (2016 – $6.0). Future minimum sublease
payments expected to be received under noncancellable sublease agreements as at December 31, 2017, are $16.8
(2016 – $20.9).
24. Contingencies and Guarantees
The nature of the Company’s legal claims and the provisions recorded for these claims are described in note 19.
Although the Company accrues adequate provisions for probable legal claims, it has contingent liabilities relating to
reported legal incidents that, based on current known facts, are not probable to result in future cash outflows. The
Company is monitoring these incidents and will accrue no provision until further information results in a situation in
which the criteria required to record a provision is met. Due to the nature of these incidents, such as the range of
possible outcomes and the possibility of litigation, it is not practicable for management to estimate the financial
effects of these incidents, the amount and timing of future outflows, and the possibility of any reimbursement of these
outflows.
In the normal course of business, the Company provides indemnifications and, in limited circumstances, surety bonds
and guarantees. These are often standard contractual terms and are provided to counterparties in transactions such
as purchase and sale contracts for assets or shares, service agreements, and leasing transactions. The Company
also indemnifies its directors and officers against any and all claims or losses reasonably incurred in the performance
of their service to the Company to the extent permitted by law. These indemnifications may require the Company to
compensate the counterparty for costs incurred as a result of various events, including changes to or in the
interpretation of laws and regulations, or as a result of damages or statutory sanctions that may be suffered by the
counterparty as a consequence of the transaction. The terms of these indemnifications and guarantees will vary
based on the contract, the nature of which prevents the Company from making a reasonable estimate of the
maximum potential amount that it could be required to pay to counterparties. In most cases, the potential payment
amount of an outstanding indemnification or guarantee is limited to the remaining cost of work to be performed under
engineering and construction contracts. The Company carries liability insurance, subject to certain deductibles and
policy limits, that provides protection against certain insurable indemnifications. Historically, the Company has not
made any material payments under such indemnifications or guarantees, and no amounts have been accrued in the
consolidated financial statements with respect to these indemnifications and guarantees.
25. Share Capital
Authorized
Unlimited Common shares, with no par value
Unlimited Preferred shares issuable in series, with attributes designated by the board of directors
Common shares
During 2017, 465,713 (2016 – 572,825) common shares were repurchased for cancellation pursuant to the ongoing
Normal Course Issuer Bid at a cost of $14.4 (2016 – $18.2). Of this amount, $3.6 (2016 – $1.9) reduced share capital
Notes to the Consolidated Financial Statements In Millions of Canadian Dollars Except Number of Shares and Per Share DataDecember 31, 2017 F-49 Stantec Inc.

and $10.8 (2016 – $16.3) was charged to retained earnings. On November 2, 2017, the Company received approval
from the TSX respecting the renewal of the Company’s Normal Course Issuer Bid, which enables it to purchase up to
2,278,747 common shares during the period November 14, 2017 to November 13, 2018.
During 2017, the Company recognized a share-based compensation expense of $9.5 (2016 – $8.9) in administrative
and marketing expenses in the consolidated statements of income. Of the amount expensed, $4.9 (2016 – $4.4)
related to the amortization of the fair value of options granted and $4.6 (2016 – $4.5) related to the cash-settled
share-based compensation (deferred share units (DSUs) and performance share units (PSUs)).
The fair value of the amortized portion of the options granted was reflected through contributed surplus, and the
cash-settled share-based compensation was reflected through other liabilities. Upon the exercise of share options for
which a share-based compensation expense has been recognized, the cash paid, together with the related portion of
contributed surplus, is credited to share capital.
Dividends
Holders of common shares are entitled to receive dividends when declared by the Company’s board of directors. The
table below describes the dividends declared and recorded in the consolidated financial statements in 2017.
Date Declared Record Date Payment DateDividend per Share
$ Paid
$ February 22, 2017 March 31, 2017 April 13, 2017 0.1250 14.3 May 10, 2017 June 30, 2017 July 13, 2017 0.1250 14.2 August 8, 2017 September 29, 2017 October 12, 2017 0.1250 14.2 November 8, 2017 December 31, 2017 January 11, 2018 0.1250 -
At December 31, 2017, trade and other payables included $14.3 (2016 – $12.8) related to the dividends declared on
November 8, 2017.
Share-based payment transactions
In 2017, under the long-term incentive program, the Company granted share options and PSUs. The Company also
has a DSU plan for the board of directors.
a) Share options
The Company has granted share options to officers and employees to purchase 4,426,237 shares at prices from
$14.33 to $32.90 per share. These options expire on dates between January 28, 2018, and May 16, 2022.
For the year ended For the year endedDecember 31 December 31
2017 2016Weighted Average Weighted Average
Exercise Price Exercise Price Shares per share Shares per share
# $ # $
Share options, beginning of the year 3,655,020 28.33 2,980,601 26.17Granted 1,229,689 31.75 995,904 32.83Exercised (376,160) 21.09 (254,156) 19.76Forfeited (82,312) 31.57 (67,329) 31.45
Share options, end of the year 4,426,237 29.84 3,655,020 28.33
Notes to the Consolidated Financial Statements In Millions of Canadian Dollars Except Number of Shares and Per Share DataDecember 31, 2017 F-50 Stantec Inc.
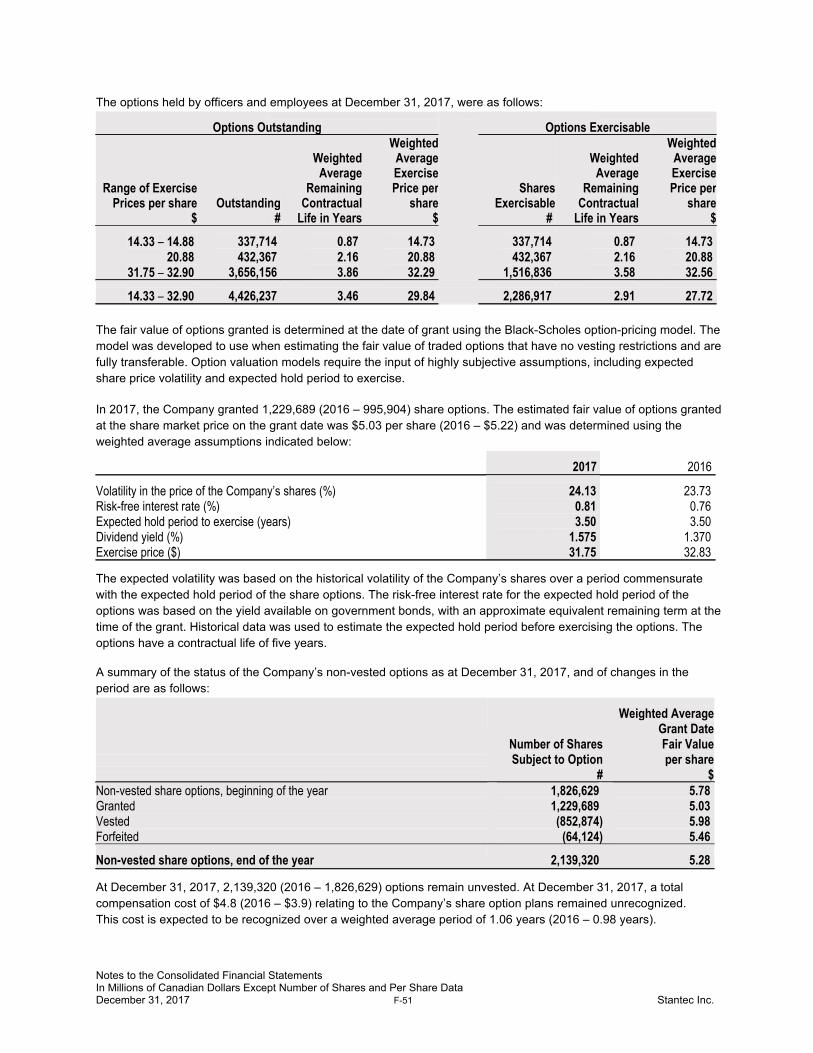
The options held by officers and employees at December 31, 2017, were as follows:
Options Outstanding Options Exercisable
Range of ExercisePrices per share
$Outstanding
#
WeightedAverage
RemainingContractual
Life in Years
WeightedAverageExercisePrice per
share$
SharesExercisable
#
WeightedAverage
RemainingContractual
Life in Years
WeightedAverageExercisePrice per
share$
14.33 – 14.88 337,714 0.87 14.73 337,714 0.87 14.7320.88 432,367 2.16 20.88 432,367 2.16 20.88
31.75 – 32.90 3,656,156 3.86 32.29 1,516,836 3.58 32.56
14.33 – 32.90 4,426,237 3.46 29.84 2,286,917 2.91 27.72
The fair value of options granted is determined at the date of grant using the Black-Scholes option-pricing model. The
model was developed to use when estimating the fair value of traded options that have no vesting restrictions and are
fully transferable. Option valuation models require the input of highly subjective assumptions, including expected
share price volatility and expected hold period to exercise.
In 2017, the Company granted 1,229,689 (2016 – 995,904) share options. The estimated fair value of options granted
at the share market price on the grant date was $5.03 per share (2016 – $5.22) and was determined using the
weighted average assumptions indicated below:
2017 2016
Volatility in the price of the Company’s shares (%) 24.13 23.73Risk-free interest rate (%) 0.81 0.76Expected hold period to exercise (years) 3.50 3.50Dividend yield (%) 1.575 1.370Exercise price ($) 31.75 32.83
The expected volatility was based on the historical volatility of the Company’s shares over a period commensurate
with the expected hold period of the share options. The risk-free interest rate for the expected hold period of the
options was based on the yield available on government bonds, with an approximate equivalent remaining term at the
time of the grant. Historical data was used to estimate the expected hold period before exercising the options. The
options have a contractual life of five years.
A summary of the status of the Company’s non-vested options as at December 31, 2017, and of changes in the
period are as follows:
Number of SharesSubject to Option
Weighted AverageGrant DateFair Value per share
# $Non-vested share options, beginning of the year 1,826,629 5.78Granted 1,229,689 5.03Vested (852,874) 5.98Forfeited (64,124) 5.46
Non-vested share options, end of the year 2,139,320 5.28
At December 31, 2017, 2,139,320 (2016 – 1,826,629) options remain unvested. At December 31, 2017, a total
compensation cost of $4.8 (2016 – $3.9) relating to the Company’s share option plans remained unrecognized.
This cost is expected to be recognized over a weighted average period of 1.06 years (2016 – 0.98 years).
Notes to the Consolidated Financial Statements In Millions of Canadian Dollars Except Number of Shares and Per Share DataDecember 31, 2017 F-51 Stantec Inc.

b) Performance share units
Under the Company’s long-term incentive program, certain members of the senior leadership teams, including the
chief executive officer (CEO), may be granted PSUs. These units are adjusted for dividends as they arise, based on
the number of units held on the record date. PSUs vest upon completing a three-year service condition that starts on
the grant date. The number of units that vest is subject to a percentage that can range from 0% to 200%, depending
on achieving two equally weighted three-year performance objectives based on net income growth and return on
equity. For units that vest, unit holders receive a cash payment based on the closing price of the Company’s common
shares on the third anniversary date of issue. For PSUs issued in 2017 onward, the price will be based on the
weighted-by-volume average of the closing market price of the Company's common shares for the last 5 trading days
preceding the anniversary date of issue. The fair value of these units is expensed over their three-year vesting period.
During 2017, 284,777 PSUs were issued (2016 – 233,255), and 19,617 PSUs were forfeited (2016 – 5,243). At
December 31, 2017, 685,233 PSUs were outstanding at a fair value of $14.3 (2016 – 576,055 PSUs were
outstanding at a fair value of $15.5).
c) Deferred share units
The directors of the board receive DSUs and, on an annual basis, elect to receive an additional fixed value
compensation in the form of either DSUs or cash payment, less withholding amounts, to purchase common shares. A
DSU is equal to one common share. Before 2014, the CEO could also receive DSUs. These units vest on their grant
date and are paid in cash to the CEO and directors of the board on their death or retirement, or in the case of the
CEO, in cash on termination. They are valued at the weighted-by-volume average of the closing market price of the
Company’s common shares for the last 10 trading days of the month of death, retirement, or termination. These units
are recorded at fair value. DSUs are adjusted for dividends as they arise, based on the number of units outstanding
on the record date.
During 2017, 38,625 DSUs (2016 – 37,325) were issued. At December 31, 2017, 438,969 DSUs were outstanding at
a fair value of $15.5 (2016 – 466,365 DSUs were outstanding at a fair value of $16.2).
26. Fair Value Measurements
All financial instruments carried at fair value are categorized into one of the following:
Level 1 – quoted market prices in active markets for identical assets or liabilities at the measurement date
Level 2 – observable inputs other than quoted prices included within level 1, such as quoted prices for similar
assets and liabilities in active markets, quoted prices for identical assets or liabilities that are not active, or
other inputs that are observable directly or indirectly
Level 3 – unobservable inputs for the assets and liabilities that reflect the reporting entity’s own assumptions
and are not based on observable market data
When forming estimates, the Company uses the most observable inputs available for valuation purposes. If a fair
value measurement reflects inputs of different levels within the hierarchy, the financial instrument is categorized
based on the lowest level of significant input.
When determining fair value, the Company considers the principal or most advantageous market in which it would
transact and the assumptions that market participants would use when pricing the asset or liability. The Company
measures certain financial assets at fair value on a recurring basis. During 2017, no change was made to the method
of determining fair value.
For financial instruments recognized at fair value on a recurring basis, the Company determines whether transfers
have occurred between levels in the hierarchy by reassessing categorizations at the end of each reporting period.
During the year ended December 31, 2017, no transfers were made between levels 1 and 2 of the fair value
measurements.
Notes to the Consolidated Financial Statements In Millions of Canadian Dollars Except Number of Shares and Per Share DataDecember 31, 2017 F-52 Stantec Inc.

The following table summarizes the Company’s fair value hierarchy for those assets and liabilities measured and
adjusted to fair value on a recurring basis as at December 31, 2017:
CarryingAmount
Quoted Prices inActive Markets for
Identical Items(Level 1)
Significant OtherObservable Inputs
(Level 2)
SignificantUnobservable Inputs
(Level 3)Note $ $ $ $
Investments held for self-insuredliabilities 15 147.1 - 147.1
-
Investments held for self-insured liabilities consist of government and corporate bonds, and equity securities. Fair
value of equities is determined using the reported net asset value per share of the investment funds. The funds
derive their value from the observable quoted prices of the equities owned that are traded in an active market. Fair
value of bonds is determined using observable prices of debt with characteristics and maturities that are similar to the
bonds being valued.
The following table summarizes the Company’s fair value hierarchy for those liabilities that were not measured at fair
value but are required to be disclosed at fair value on a recurring basis as at December 31, 2017:
Fair ValueAmount of
Liability
Quoted Prices inActive Markets for
Identical Items(Level 1)
Significant OtherObservable Inputs
(Level 2)
SignificantUnobservable Inputs
(Level 3)Note $ $ $ $
Notes payable 18 60.7 - 60.7 -
The fair value of notes payable is determined by calculating the present value of future payments using observable
benchmark interest rates and credit spreads for debt with similar characteristics and maturities.
27. Financial Instruments
Credit risk
Credit risk is the risk of financial loss to the Company if a counterparty to a financial instrument fails to meet its
contractual obligation. Financial instruments that subject the Company to credit risk consist primarily of cash and
cash equivalents, cash in escrow, trade and other receivables, investments held for self-insured liabilities, holdbacks
on long-term contracts, and indemnifications.
The Company’s maximum amount of credit risk exposure is limited to the carrying amount of these financial
instruments, which at December 31, 2017, was $1,252.6 (2016 – $1,203.5).
The Company limits its exposure to credit risk by placing its cash and cash equivalents in high-quality credit
institutions. Investments held for self-insured liabilities include corporate bonds, equity securities, and term deposits.
The Company believes the risk associated with corporate bonds, equity securities, and term deposits is mitigated by
the overall quality and mix of the Company’s investment portfolio.
The Company mitigates the risk associated with trade and other receivables and holdbacks on long-term contracts by
providing services to diverse clients in various industries and sectors of the economy. The Company does not
concentrate its credit risk in any particular client, industry, or economic or geographic sector. In addition,
management reviews trade and other receivables past due on an ongoing basis to identify matters that could
potentially delay the collection of funds at an early stage. The Company monitors trade receivables to an internal
target of days of revenue in trade receivables, which, at December 31, 2017, was 55 days (2016 – 57 days).
Notes to the Consolidated Financial Statements In Millions of Canadian Dollars Except Number of Shares and Per Share DataDecember 31, 2017 F-53 Stantec Inc.

Liquidity risk
Liquidity risk is the risk that the Company will not be able to meet obligations associated with its financial liabilities as
they fall due. The Company meets its liquidity needs through a variety of sources, including cash generated from
operations, long- and short-term borrowings from its $800.0 revolving credit facility and term loan, and the issuance
of common shares. The unused capacity of the revolving credit facility at December 31, 2017, was $538.3
(2016 – $329.2). The Company believes that it has sufficient resources to meet obligations associated with its
financial liabilities. Liquidity risk is managed according to the Company’s internal guideline of maintaining a net debt
to EBITDA ratio of less than 2.5 as defined in note 28.
The timing of undiscounted cash outflows relating to financial liabilities is outlined in the table below:
Total Less than 1 Year 1 to 3 Years After 3 Years$ $ $ $
December 31, 2017Trade and other payables 704.6 704.6 - -Long-term debt 740.8 198.4 541.4 1.0Other financial liabilities 10.9 1.8 7.5 1.6
Total contractual obligations 1,456.3 904.8 548.9 2.6
December 31, 2016Trade and other payables 718.1 718.1 - -Long-term debt 1,023.0 92.4 929.5 1.1Other financial liabilities 10.0 2.4 7.6 -
Total contractual obligations 1,751.1 812.9 937.1 1.1
In addition to the financial liabilities listed in the table, the Company will pay interest on the revolving credit facility and
the term loan outstanding in future periods. Further information on long-term debt is included in note 18.
Interest rate risk
Interest rate risk is the risk that the fair value of the future cash flows of a financial instrument will fluctuate because
of changes in market interest rates. The Company is subject to interest rate cash flow risk to the extent that its
revolving credit facility and term loan are based on floating interest rates. The Company is also subject to interest rate
pricing risk to the extent that its investments held for self-insured liabilities include fixed-rate government and
corporate bonds and term deposits.
If the interest rate on the Company’s revolving credit facility and term loan balances at December 31, 2017, was
0.5% higher, with all other variables held constant, net income would have decreased by $2.5. If it was 0.5% lower,
an equal and opposite impact on net income would have occurred.
Foreign exchange risk
Foreign exchange risk is the risk that the fair value of the future cash flows of a financial instrument will fluctuate
because of changes in foreign exchange rates. Foreign exchange gains or losses in net income arise on the
translation of foreign currency–denominated assets and liabilities (such as trade and other receivables, trade and
other payables, and long-term debt) held in the Company’s Canadian operations and foreign subsidiaries. The
Company minimizes its exposure to foreign exchange fluctuations on these items by matching foreign currency
assets with foreign currency liabilities.
If exchange rates were 1.0% lower at December 31, 2017, with all other variables held constant, net income
would have increased by less than $0.2. If they were 1.0% higher, an equal and opposite impact on net income would
have occurred.
Notes to the Consolidated Financial Statements In Millions of Canadian Dollars Except Number of Shares and Per Share DataDecember 31, 2017 F-54 Stantec Inc.

Foreign exchange fluctuations may also arise on the translation of the Company’s US-based subsidiaries or other
foreign subsidiaries, where the functional currency is different from the Canadian dollar, and are recorded in other
comprehensive income (loss). The Company does not hedge for this foreign exchange risk.
Price risk
The Company’s investments held for self-insured liabilities are exposed to price risk arising from changes in the
market values of the equity securities. This risk is mitigated because the portfolio of equity funds is monitored
regularly and is appropriately diversified.
A 1.0% increase in equity prices at December 31, 2017, would have increased the Company’s comprehensive
income by $0.4. A 1.0% decrease would have had an equal and opposite impact on comprehensive income.
28. Capital Management
The Company’s objective when managing capital is to provide sufficient capacity to cover normal operating and
capital expenditures, acquisition growth, and payment of dividends, while maintaining an adequate return for
shareholders. The Company defines its capital as the aggregate of long-term debt (including the current portion) and
shareholders’ equity.
The Company manages its capital structure to maintain the flexibility to adjust to changes in economic conditions and
acquisition growth and to respond to interest rate, foreign exchange, credit, and other risks. To maintain or adjust its
capital structure, the Company may purchase shares for cancellation pursuant to Normal Course Issuer Bids, issue
new shares, or raise or retire debt.
The Company periodically monitors capital by maintaining a net debt to EBITDA ratio below 2.5. This target is
established annually and monitored quarterly, and is the same as in 2016.
Net debt to EBITDA ratio, a non-IFRS measure, is calculated as the sum of (1) long-term debt, including current
portion, plus bank indebtedness, less cash and cash equivalents and cash in escrow, divided by (2) EBITDA,
calculated as income before income taxes, net interest expense, amortization of intangible assets, depreciation of
property and equipment, and goodwill and intangible asset impairment. The Company’s net debt to EBITDA ratio at
December 31, 2017, was 1.16 (2016 – 2.38), calculated on a trailing four-quarter basis. Going forward, there may be
occasions when the Company exceeds its target by completing acquisitions that increase its debt level above the
target for a period of time.
The Company is subject to restrictive covenants related to its Credit Facilities (measured quarterly). These covenants
include, but are not limited to, a leverage ratio and an interest coverage ratio (non-IFRS measures). The leverage
ratio is calculated as consolidated debt to EBITDA, and the interest coverage ratio is calculated as EBITDA to interest
expense. Failure to meet the terms of one or more of these covenants may constitute a default, potentially resulting in
accelerating the repayment of the debt obligation.
The Company was in compliance with the covenants under these agreements as at and throughout the year ended
December 31, 2017.
Notes to the Consolidated Financial Statements In Millions of Canadian Dollars Except Number of Shares and Per Share DataDecember 31, 2017 F-55 Stantec Inc.

29. Income Taxes
The effective income tax rate in the consolidated statements of income differs from statutory Canadian tax rates as a
result of the following:
For the year ended
December 31
2017 2016% %
Income tax expense at statutory Canadian rates 27.0 27.0Increase (decrease) resulting from:
Rate differential on foreign income 4.0 5.2Unrecognized tax losses and temporary differences (0.5) 1.1Non-deductible acquisition-related costs - 1.2Non-deductible meals and entertainment 0.9 1.0Income from associated companies (0.3) 0.7Non-taxable foreign income (4.1) (7.3)Research and development and other tax credits (2.7) (1.3)Disposition of a subsidiary 30.3 -Reorganization of corporate structure 1.2 -Statutory rate change on deferred tax balances (4.8) -Transition tax related to US tax reform 11.8 -Other 0.4 0.2
63.2 27.8
The major components of current income tax expense are as follows:
For the year ended December 31
2017 2016$ $
On-going operations 34.4 37.7Disposition of subsidiary 124.1 -Transition tax related to US tax reform 31.2 -Reorganization of corporate structure 3.2 -
Total current income tax expense 192.9 37.7
The major components of deferred income tax (recovery) expense are as follows:
For the year ended December 31
2017 2016$ $
Origination and reversal of timing differences 16.4 12.7Change of tax rates 0.6 (1.9)Unrecognized tax losses and temporary differences 0.4 1.8Recovery arising from previously unrecognized tax assets (1.6) -Revaluation due to US tax reform (12.6) -Disposition of a subsidiary (29.6) -
Total deferred income tax (recovery) expense (26.4) 12.6
Notes to the Consolidated Financial Statements In Millions of Canadian Dollars Except Number of Shares and Per Share DataDecember 31, 2017 F-56 Stantec Inc.

Significant components of the Company’s net deferred income tax assets (liabilities) are as follows:
December 31 December 312017 2016
$ $
Deferred income tax assets (liabilities)
Differences in timing of taxability of revenue and deductibility of expenses 36.1 69.3Loss and tax credit carryforwards 9.6 22.2Employee defined benefit plan 3.3 8.7Carrying value of property and equipment less than (in excess of) tax cost (3.6) 4.6Carrying value of intangible assets in excess of tax cost (78.8) (150.7)Cash to accrual adjustment on acquisition of US subsidiaries (2.5) (7.8)Other 4.5 0.3
(31.4) (53.4)
The following is a reconciliation of net deferred tax assets (liabilities):
December 31 December 312017 2016
$ $
Balance, beginning of the year (53.4) (10.0)Tax recovery during the year recognized in net income 26.4 (12.6)Impact of foreign exchange 1.8 (4.5)Deferred taxes acquired through business combinations (0.8) (28.3)Tax effect on other comprehensive income (2.4) 2.9Other (3.0) (0.9)
Balance, end of the year (31.4) (53.4)
At December 31, 2017, except as noted below, all loss carryforwards and deductible temporary differences available
to reduce the taxable income of Canadian, US, and foreign subsidiaries were recognized in the consolidated
financial statements.
December 31 December 312017 2016
$ $
Deductible temporary differences 12.8 8.8
Non-capital tax losses: Expire (2018 to 2037) 16.3 36.8
Never expire 72.2 54.0
88.5 90.8
Capital tax losses: Never expire 5.5 10.3
106.8 109.9
On December 22, 2017, the United States enacted tax reform legislation through the Tax Cuts and Jobs Act
(the Tax Act). This significantly changed US tax laws in a number of ways including but not limited to reducing the
corporate tax rate from 35% to 21% and moving from a worldwide tax system to a territorial system.
Notes to the Consolidated Financial Statements In Millions of Canadian Dollars Except Number of Shares and Per Share DataDecember 31, 2017 F-57 Stantec Inc.

In reporting periods before the Tax Act, the Company’s intent was not to repatriate foreign earnings, therefore,
deferred tax was not recorded since it was not probable it would reverse in the foreseeable future. As a result of the
enactment of the legislation, the Company incurred a $31.2 (US$24.5) one-time transition tax on deemed mandatory
repatriation of earnings. The US federal portion of this tax was $29.3 (US$23.0), when adjusted for foreign tax credits
previously recognized of $9.1 (US$7.1), resulted in a net transition tax liability of approximately $20.2 (US$15.9), and
is payable over eight years with no interest charged. The state liability portion of this tax was approximately $1.9
(US$1.5) and is due in 2018. The proportion of US federal tax due, net of foreign tax credits, is 8% from 2018 to
2022, 15% in 2023, 20% in 2024, and 25% in 2025.
In addition, the Company’s deferred tax assets and liabilities have been remeasured using a tax rate of 21%.Included in deferred income tax expense for changes in tax rate is a $12.6 (US$9.9) in recovery.
The Tax Act requires complex computations to be performed that were not previously required in US tax law,
judgements to be made in interpretation of the provisions of the Tax Act, significant estimates in calculations, and the
preparation and analysis of information not previously relevant or regularly produced. The US Treasury Department,
the IRS, and other standard-setting bodies could interpret or issue guidance on how provisions of the Tax Act will be
applied or otherwise administered that is different from the Company's interpretation. At this time, the Company
made its best estimate on each aspect of the tax law changes. As the Company completes its analysis, collects and
prepares necessary data, and interprets any additional guidance, the Company may make changes to its estimates
on a prospective basis. In particular,estimates were used to determine the one-time transition tax and the
remeasurement of deferrred tax assets and liabilities.
30. Net Interest Expense and Other Net Finance Expense
Net interest expense For the year ended December 31
2017 2016$ $
Interest on notes payable 2.9 4.4Interest on revolving credit facilities 24.4 19.8Interest on senior secured notes - 5.8Interest on finance leases 0.1 0.3Other 1.6 1.1
Total interest expense 29.0 31.4
Interest income on available-for-sale investment debt securities (2.4) (2.1)Other (0.8) (0.7)
Total interest income (3.2) (2.8)
Net interest expense 25.8 28.6
Notes to the Consolidated Financial Statements In Millions of Canadian Dollars Except Number of Shares and Per Share DataDecember 31, 2017 F-58 Stantec Inc.

Other net finance expense For the year ended December 31
2017 2016$ $
Amortization on available-for-sale investment debt securities 0.6 0.4Bank charges 8.6 7.4
Total other finance expense 9.2 7.8
Realized gain on sale of available-for-sale investment debt securities (1.4) (0.1)Derecognition of notes payable (0.7) (1.3)
Other net finance expense 7.1 6.4
31. Employee Costs
For the year endedDecember 31
2017 2016
Note $ $
Wages, salaries, and benefits 2,444.8 2,211.7Pension costs 70.2 58.9
Share-based compensation 25 9.5 8.9
Total employee costs 2,524.5 2,279.5
Direct labor 1,589.4 1,422.1
Indirect labor 935.1 857.4
Total employee costs 2,524.5 2,279.5
Direct labor costs include salaries, wages, and related fringe benefits for labor hours directly associated with the
completion of projects. Bonuses, share-based compensation, termination payments, and salaries, wages, and related
fringe benefits for labor hours not directly associated with the completion of projects are included in indirect labor
costs. Indirect labor costs are included in administrative and marketing expenses in the consolidated statements of
income. Included in pension costs is $67.7 (2016 – $57.2) related to defined contribution plans.
32. Other (Income) Expense
For the year ended December 31
2017 2016$ $
Loss on sale of property and equipment 0.2 1.5Realized gain on available-for-sale equity securities (9.6) -Other (0.6) (1.3)
Total other (income) expense (10.0) 0.2
Notes to the Consolidated Financial Statements In Millions of Canadian Dollars Except Number of Shares and Per Share DataDecember 31, 2017 F-59 Stantec Inc.

33. Earnings Per Share
The number of basic shares outstanding and diluted common shares, calculated on a weighted average basis, is
as follows:
December 31 December 312017 2016
# #
Basic shares outstanding 113,991,507 107,006,168Share options (dilutive effect of 4,426,237 options; 2016 – 3,655,020 options) 361,413 319,623
Diluted shares 114,352,920 107,325,791
At December 31, 2017, and 2016, no options were antidilutive.
34. Cash Flow Information
Cash flows from operating activities determined by the indirect method are as follows:
For the year endedDecember 31
2017 2016$ $
CASH FLOWS FROM (USED IN) OPERATING ACTIVITIES
Net income for the year 97.0 130.5Add (deduct) items not affecting cash: Depreciation of property and equipment 54.6 51.2 Amortization of intangible assets 80.2 75.7 Deferred income taxes (26.4) 12.6 Loss (gain) on sale of property and equipment 0.2 1.5 Realized gain on available-for-sale equity securities (9.6) - Gain on sale of a subsidiary (54.6) - Share-based compensation 9.5 8.9 Provision for self-insured liabilities and claims 26.2 12.8 Share of income from joint ventures and associates (2.6) (2.4) Other non-cash items 5.0 (2.6)
179.5 288.2
Trade and other receivables 70.7 32.8Unbilled revenue 58.9 1.9Prepaid expenses 15.9 (1.5)Income taxes recoverable 143.7 (4.8)Trade and other payables (172.8) 1.7Deferred revenue (32.2) (32.6)
84.2 (2.5)
Cash flows from operating activities 263.7 285.7
Notes to the Consolidated Financial Statements In Millions of Canadian Dollars Except Number of Shares and Per Share DataDecember 31, 2017 F-60 Stantec Inc.

A reconciliation of liabilities arising from financing activities for the year ended December 31, 2017 is as follows:
Statement of Cash Flows Non-cash Changes
January 12017
$ Proceeds
$
Repaymentsor Payments
$
ForeignExchange
$Other
$
December 31 2017
$
Revolving credit facilities 416.1 259.4 (462.4) (3.2) - 209.9Term loan 454.1 - - 3.3 1.1 458.5Finance lease obligations 23.1 - (12.7) (0.1) 0.1 10.4Dividends to shareholders 12.8 - (55.5) - 57.0 14.3
Total liabilities from financingactivities 906.1 259.4 (530.6) - 58.2
693.1
35. Related-Party Disclosures
At December 31, 2017, the Company had subsidiaries and structured entities that it controlled and included in its
consolidated financial statements. The Company also enters into related-party transactions through a number of joint
ventures and associates. These transactions involve providing or receiving services entered into in the normal course
of business.
The Company owns 100% of the voting and restricted securities of the entities below, except for certain
non-controlling interests as noted.
Name Jurisdiction of Incorporation
58053 Newfoundland & Labrador Inc. Newfoundland and Labrador, Canada59991 Newfoundland & Labrador Ltd. Newfoundland and Labrador, Canada3221969 Nova Scotia Company Nova Scotia, CanadaAIVEK Stantec Limited Partnership* Newfoundland and Labrador, CanadaBrycon-MWHC Joint Venture* UnincorporatedBury – AUS, Inc. Texas, United StatesBury – DFW, Inc. Texas, United StatesBury – HOU, Inc. Texas, United StatesBury – SAN, Inc. Texas, United StatesBury Holdings, Inc. Texas, United StatesEdwards and Zuck Consulting Engineers, D.P.C. New York, United StatesENTRAN of Virginia, PLLC Virginia, United StatesFST Engineers, Inc. New York, United StatesHarza International Development Company, LLC Delaware, United StatesHawksley Consulting Pty Limited AustraliaHouston Airport Alliance* UnincorporatedInternational Insurance Group Inc. BarbadosMontgomery Watson (Bermuda) Ltd. BermudaMontgomery Watson Harza (MWH) Mühendislik ve Müsavirlik Limited
Sirketi TurkeyMustang Acquisition Holdings Inc. Delaware, United StatesMWH (Fiji) Limited FijiMWH-AGS, Inc. JV* UnincorporatedMWH Americas Inc. Chile, Limitada ChileMWH Americas, A New York Corporation New York, United StatesMWH Architects and Engineers, Inc. Delaware, United StatesMWH Canada, Inc. CanadaMWH Constructors Canada Ltd. CanadaMWH Constructors Holding B.V. Netherlands*Non-controlling interest
Notes to the Consolidated Financial Statements In Millions of Canadian Dollars Except Number of Shares and Per Share DataDecember 31, 2017 F-61 Stantec Inc.
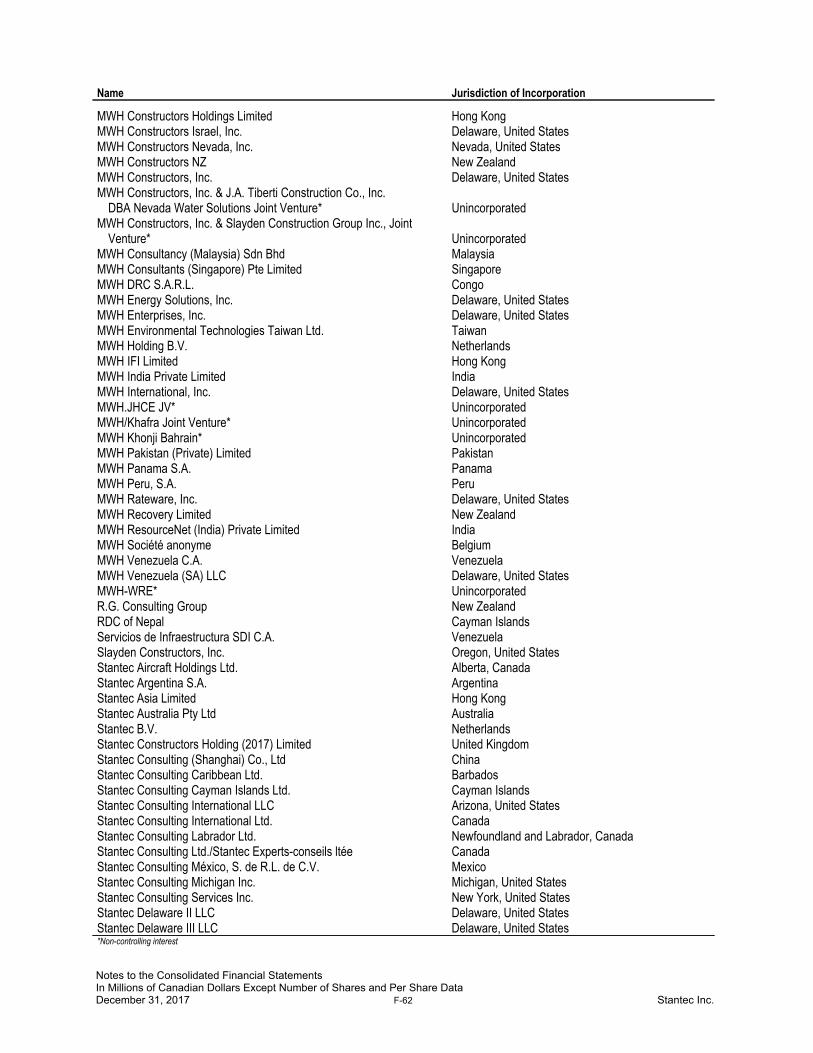
Name Jurisdiction of Incorporation
MWH Constructors Holdings Limited Hong KongMWH Constructors Israel, Inc. Delaware, United StatesMWH Constructors Nevada, Inc. Nevada, United StatesMWH Constructors NZ New ZealandMWH Constructors, Inc. Delaware, United StatesMWH Constructors, Inc. & J.A. Tiberti Construction Co., Inc.
DBA Nevada Water Solutions Joint Venture* UnincorporatedMWH Constructors, Inc. & Slayden Construction Group Inc., Joint
Venture* UnincorporatedMWH Consultancy (Malaysia) Sdn Bhd MalaysiaMWH Consultants (Singapore) Pte Limited SingaporeMWH DRC S.A.R.L. CongoMWH Energy Solutions, Inc. Delaware, United StatesMWH Enterprises, Inc. Delaware, United StatesMWH Environmental Technologies Taiwan Ltd. TaiwanMWH Holding B.V. NetherlandsMWH IFI Limited Hong KongMWH India Private Limited IndiaMWH International, Inc. Delaware, United StatesMWH.JHCE JV* UnincorporatedMWH/Khafra Joint Venture* UnincorporatedMWH Khonji Bahrain* UnincorporatedMWH Pakistan (Private) Limited PakistanMWH Panama S.A. PanamaMWH Peru, S.A. PeruMWH Rateware, Inc. Delaware, United StatesMWH Recovery Limited New ZealandMWH ResourceNet (India) Private Limited IndiaMWH Société anonyme BelgiumMWH Venezuela C.A. VenezuelaMWH Venezuela (SA) LLC Delaware, United StatesMWH-WRE* UnincorporatedR.G. Consulting Group New ZealandRDC of Nepal Cayman IslandsServicios de Infraestructura SDI C.A. VenezuelaSlayden Constructors, Inc. Oregon, United StatesStantec Aircraft Holdings Ltd. Alberta, CanadaStantec Argentina S.A. ArgentinaStantec Asia Limited Hong KongStantec Australia Pty Ltd AustraliaStantec B.V. NetherlandsStantec Constructors Holding (2017) Limited United KingdomStantec Consulting (Shanghai) Co., Ltd ChinaStantec Consulting Caribbean Ltd. BarbadosStantec Consulting Cayman Islands Ltd. Cayman IslandsStantec Consulting International LLC Arizona, United StatesStantec Consulting International Ltd. CanadaStantec Consulting Labrador Ltd. Newfoundland and Labrador, CanadaStantec Consulting Ltd./Stantec Experts-conseils ltée CanadaStantec Consulting México, S. de R.L. de C.V. MexicoStantec Consulting Michigan Inc. Michigan, United StatesStantec Consulting Services Inc. New York, United StatesStantec Delaware II LLC Delaware, United StatesStantec Delaware III LLC Delaware, United States*Non-controlling interest
Notes to the Consolidated Financial Statements In Millions of Canadian Dollars Except Number of Shares and Per Share DataDecember 31, 2017 F-62 Stantec Inc.

Name Jurisdiction of Incorporation
Stantec Delaware IV LLC Delaware, United StatesStantec Energy & Resources Inc. Delaware, United StatesStantec Environmental Engineering (Shanghai) Co., Ltd ChinaStantec Europe Limited United KingdomStantec Farrer Limited United KingdomStantec Global Capital Limited United KingdomStantec Holdings (2017) Limited United KingdomStantec Holdings New ZealandStantec Holdings II Ltd. Alberta, CanadaStantec Limited England and WalesStantec New Zealand New ZealandStantec New Zealand International New ZealandStantec Newfoundland & Labrador Ltd. Newfoundland and Labrador, CanadaStantec Oceania Limited United KingdomStantec S.p.A. ItalyStantec Technology International Inc. Delaware, United StatesStantec Treatment Group Limited United KingdomStantec Treatment Holding Limited United KingdomStantec Treatment Limited United KingdomStantec UK Limited United KingdomStassinu Stantec Limited Partnership* Newfoundland and Labrador, CanadaThomas Hawksley Consulting Limited United KingdomUEI Associates, Inc. Texas, United StatesUEI Global I, Inc. Texas, United States*Non-controlling interest
There are no significant restrictions on the Company’s ability to access or use assets or to settle liabilities of its
subsidiaries. The financial statements of all subsidiaries are prepared as at the same reporting date as the
Company’s.
Structured entities
At December 31, 2017, the Company had management agreements in place with several entities to provide various
services, including architecture, engineering, planning, and project management. These entities have been designed
so that voting rights are not the dominant factor in deciding who controls the entity. Each entity has a management
agreement in place that provides the Company with control over the relevant activities of the entity where it has been
assessed that the Company is exposed to variable returns of the entity and can use its power to influence the
variable returns. The Company receives a management fee generally equal to the net income of the entities and has
an obligation regarding the liabilities and losses of the entities. Based on these facts and circumstances,
management determined that the Company controls these entities and they are consolidated in the Company’s
consolidated financial statements. The Company does not have any unconsolidated structured entities.
Notes to the Consolidated Financial Statements In Millions of Canadian Dollars Except Number of Shares and Per Share DataDecember 31, 2017 F-63 Stantec Inc.

The following is a list of structured entities that are consolidated in the Company’s financial statements.
Name Jurisdiction of Incorporation
Architecture Stantec Québec Ltée Québec, CanadaConsorcio Stantec Architecture Ltd. y Capitel S.A. Limitada ChileHarza Associates of New York PLLC New York, United StatesMontgomery Watson Engineers of New York, P.C. New York, United StatesMWH Architects and Engineers of New York, P.C. New York, United StatesRNL Design, Inc. Colorado, United StatesSHW Group LLC Michigan, United StatesStantec Architecture and Engineering LLC Pennsylvania, United StatesStantec Architecture and Engineering P.C. Massachusetts, United StatesStantec Architecture Inc. North Carolina, United StatesStantec Architecture Ltd. CanadaStantec Connecticut Inc. Connecticut, United StatesStantec Engineering (Puerto Rico) P.S.C. Puerto RicoStantec Geomatics Ltd. Alberta, CanadaStantec International Inc. Pennsylvania, United StatesStantec Land Surveying Ltd. British Columbia, CanadaStantec Planning and Landscape Architecture P.C. Maine, United StatesStantec Planning and Landscape Architecture P.C. New York, United StatesVOA+BBA Design Partnership, L.L.C. Louisiana, United StatesVOA-Ellerbe Becket, LLC Florida, United States
Joint operations
The Company also conducts its business through the following significant joint operations, which primarily provide
construction services.
Name
Ownership
Interests Jurisdiction
Balfour Beatty MWH Joint Venture (The Advance JV) 50% United KingdomCostain MWH Delivery Partner 50% United KingdomEfficient Service Delivery 33% United KingdomMBV Energy Recovery 50% United KingdomMWH Constructors, Israel, Inc. Shikun and Binui - Solei Boneh Infrastructure, Ltd., Joint Venture 50% IsraelMWHT Costain Joint Venture 50% United KingdomSkanska MWH Balfour Beatty Joint Venture 33% United Kingdom
Joint ventures and associates
The Company enters into transactions through its investments in joint ventures and associates.
The following table provides the total dollar amount for transactions that have been entered into with related parties.
For the year ended December 31, 2017 For the year ended December 31, 2016
Sales to Related Parties
DistributionsPaid
Amounts Owedby Related
PartiesSales to
Related Parties Distributions
Paid
Amounts Owedby Related
Parties$ $ $ $ $ $
Joint ventures 40.6 1.3 11.1 41.5 0.3 28.1Associates 10.2 0.7 0.8 11.9 0.5 2.4
Notes to the Consolidated Financial Statements In Millions of Canadian Dollars Except Number of Shares and Per Share DataDecember 31, 2017 F-64 Stantec Inc.
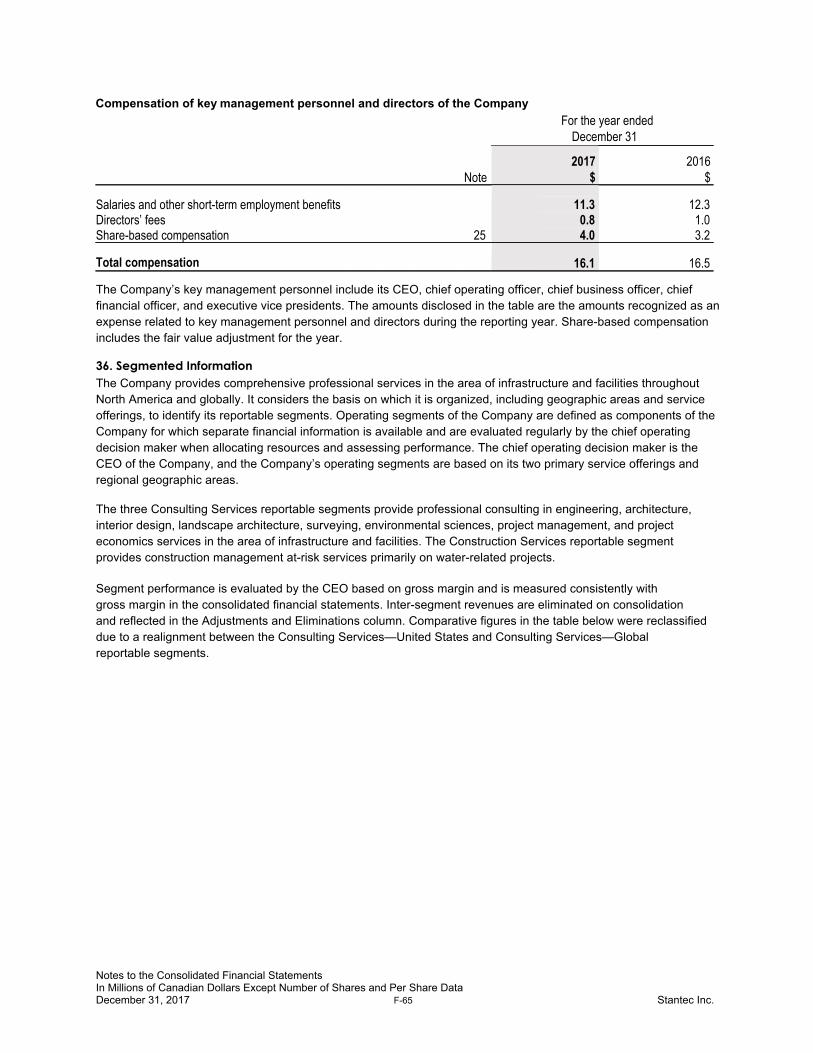
Compensation of key management personnel and directors of the Company
For the year endedDecember 31
2017 2016Note $ $
Salaries and other short-term employment benefits 11.3 12.3Directors’ fees 0.8 1.0Share-based compensation 25 4.0 3.2
Total compensation 16.1 16.5
The Company’s key management personnel include its CEO, chief operating officer, chief business officer, chief
financial officer, and executive vice presidents. The amounts disclosed in the table are the amounts recognized as an
expense related to key management personnel and directors during the reporting year. Share-based compensation
includes the fair value adjustment for the year.
36. Segmented Information
The Company provides comprehensive professional services in the area of infrastructure and facilities throughout
North America and globally. It considers the basis on which it is organized, including geographic areas and service
offerings, to identify its reportable segments. Operating segments of the Company are defined as components of the
Company for which separate financial information is available and are evaluated regularly by the chief operating
decision maker when allocating resources and assessing performance. The chief operating decision maker is the
CEO of the Company, and the Company’s operating segments are based on its two primary service offerings and
regional geographic areas.
The three Consulting Services reportable segments provide professional consulting in engineering, architecture,
interior design, landscape architecture, surveying, environmental sciences, project management, and project
economics services in the area of infrastructure and facilities. The Construction Services reportable segment
provides construction management at-risk services primarily on water-related projects.
Segment performance is evaluated by the CEO based on gross margin and is measured consistently with
gross margin in the consolidated financial statements. Inter-segment revenues are eliminated on consolidation
and reflected in the Adjustments and Eliminations column. Comparative figures in the table below were reclassified
due to a realignment between the Consulting Services—United States and Consulting Services—Global
reportable segments.
Notes to the Consolidated Financial Statements In Millions of Canadian Dollars Except Number of Shares and Per Share DataDecember 31, 2017 F-65 Stantec Inc.

Reportable segments
For the year ended December 31, 2017
Consulting Services Adjustments
Canada United
States Global Construction
Services Total
Segments and
Eliminations Consolidated $ $ $ $ $ $ $
Total gross revenue 1,221.9 2,254.0 664.7 1,126.2 5,266.8 (126.7) 5,140.1Less inter-segment
revenue 30.2 28.0 53.7 14.8 126.7 (126.7) -
Gross revenue fromexternal customers 1,191.7 2,226.0 611.0 1,111.4 5,140.1 - 5,140.1
Less subconsultants andother direct expenses 164.1 511.3 179.5 867.9 1,722.8 - 1,722.8
Total net revenue 1,027.6 1,714.7 431.5 243.5 3,417.3 - 3,417.3
Gross margin 551.5 958.7 251.7 66.0 1,827.9 - 1,827.9
For the year ended December 31, 2016
Consulting Services Adjustments
Canada United States Global Construction
Services Total
Segments andEliminations Consolidated
$ $ $ $ $ $ $
Total gross revenue 1,200.3 2,078.5 495.8 656.9 4,431.5 (131.4) 4,300.1Less inter-segment
revenue 31.5 15.5 72.7 11.7 131.4 (131.4) -Gross revenue from
external customers 1,168.8 2,063.0 423.1 645.2 4,300.1 - 4,300.1Less subconsultants and
other direct expenses 148.2 467.1 112.9 473.5 1,201.7 - 1,201.7
Total net revenue 1,020.6 1,595.9 310.2 171.7 3,098.4 - 3,098.4
Gross margin 549.7 883.0 180.1 63.5 1,676.3 - 1,676.3
Geographic information: Non-current assets December 31 December 312017 2016
$ $
Canada 452.4 471.2United States 1,311.2 1,479.8United Kingdom 119.3 135.9Other countries 148.7 404.6
Total non-current assets 2,031.6 2,491.5
Non-current assets in the table above consist of property and equipment, goodwill, and intangible assets. Geographic
information is attributed to countries based on the location of the assets.
Notes to the Consolidated Financial Statements In Millions of Canadian Dollars Except Number of Shares and Per Share DataDecember 31, 2017 F-66 Stantec Inc.

Geographic information: Gross revenue For the year endedDecember 31
2017 2016
$ $
Canada 1,202.3 1,168.8United States 2,923.2 2,468.2United Kingdom 533.0 318.2Other countries 481.6 344.9
Total gross revenue from external customers 5,140.1 4,300.1
Gross revenue is attributed to countries based on the location of the project.
Gross revenue by services For the year endedDecember 31
2017 2016$ $
Consulting Services
Buildings 898.1 818.2 Energy & Resources 479.2 418.5 Environmental Services 683.8 636.5 Infrastructure 1,090.4 1,059.7 Water 877.2 722.0Construction Services 1,111.4 645.2
Total gross revenue from external customers 5,140.1 4,300.1
The Company’s organizational structure for Consulting Services was realigned from four to five business operating
units effective January 1, 2017. Gross revenue for comparative figures was reclassified due to this realignment and a
realignment of services.
Customers
The Company has a large number of clients in various industries and sectors of the economy. No particular customer
exceeds 10% of the Company’s gross revenue.
37. Investment Tax Credits
Investment tax credits, arising from qualifying scientific research and experimental development efforts pursuant to
existing tax legislation, are recorded as a reduction of the applicable administrative and marketing expenses when
there is reasonable assurance of their ultimate realization. In 2017, investment tax credits of $9.6 (2016 – $5.9) were
recorded that reduced administrative and marketing expenses.
38. Events after the Reporting Period
Dividend
On February 21, 2018, the Company declared a dividend of $0.1375 per share, payable on April 12, 2018, to
shareholders of record on March 29, 2018.
Notes to the Consolidated Financial Statements In Millions of Canadian Dollars Except Number of Shares and Per Share DataDecember 31, 2017 F-67 Stantec Inc.

Head Office 200, 10160 – 112 Street Edmonton, Alberta T5K 2L6 Canada Ph: (780) 917-7000 Fx: (780) 917-7330 [email protected]
Transfer Agent Computershare Calgary, Alberta
Auditor Ernst & Young LLP Chartered Professional Accountants Edmonton, Alberta
Principal Bank Canadian Imperial Bank of Commerce
Securities Exchange Listing Stantec shares are listed on the Toronto Stock Exchange and the New York Stock Exchange under the symbol STN.
SHAREHOLDER INFORMATION
Related Documents