MANAGEMENT’S DISCUSSION AND ANALYSIS OF FINANCIAL CONDITION AND RESULTS OF OPERATIONS FOR THE THREE MONTHS ENDED DECEMBER 31 AND SEPTEMBER 30, 2016 AND FOR THE TWELVE MONTHS ENDED DECEMBER 31, 2016 AND 2015

Welcome message from author
This document is posted to help you gain knowledge. Please leave a comment to let me know what you think about it! Share it to your friends and learn new things together.
Transcript
MANAGEMENT’S DISCUSSION AND ANALYSIS OF FINANCIAL CONDITION AND
RESULTS OF OPERATIONS FOR THE THREE MONTHS ENDED DECEMBER 31 AND SEPTEMBER 30, 2016
AND FOR THE TWELVE MONTHS ENDED DECEMBER 31, 2016 AND 2015

The following discussion of Rosneft’s financial condition and results of operations is based on, and should be read in
conjunction with, the Company’s financial statements and the notes thereto for the periods ended December 31 and
September 30, 2016 and December 31, 2015 (the “Consolidated Financial Statements”). Such terms as “Rosneft”, “Company” and “Group” in their different forms in this report mean Rosneft Oil Company and its consolidated
subsidiaries, its equity share in associates and joint ventures.This report contains forward-looking statements that
involve risks and uncertainties. Rosneft’s actual results may materially differ from those discussed in such forward-looking statements as a result of various factors.
Except as otherwise indicated, oil and gas reserves and production are presented pro-rata for associates and joint ventures and 100% for fully consolidated subsidiaries.
Except as otherwise indicated, all amounts are provided in billions of RUB. All figures are rounded; however, figures
per unit of production are provided based on the actual data.
To convert tonnes to barrels a 7.404 ratio is used. To convert a thousand of cubic meters of gas to barrels of oil
equivalent a 6.09 ratio is used. To convert Rospan gas condensate to barrels of oil equivalent a 8.3 ratio is used.

3
Overview ................................................................................................................................................ 5
Financial and operating highlights ......................................................................................................... 5
Significant events in the fourth quarter of 2016 ..................................................................................... 6
Subsequent events .................................................................................................................................. 7
Macroeconomic factors affecting results of operations ......................................................................... 8
Changes in Crude Oil, Petroleum Product and Gas Prices ...................................................................... 8
USD/RUB and EUR/RUB Exchange Rates and Inflation ....................................................................... 9
Taxation ..................................................................................................................................................... 9
Mineral Extraction Tax (MET) .................................................................................................... 10
Export Customs Duty on Crude Oil ............................................................................................. 11
Export Customs Duty on Petroleum Products .............................................................................. 12
Changes in Transport Tariffs of Pipeline and Railway Monopolies ..................................................... 12
Financial performance for the three months ended December 31, 2016 and September 30, 2016, for
the twelve months ended December 31, 2016 and 2015 (Consolidated statement of profit or loss) ... 15
Upstream Operating Results ................................................................................................................. 16
Operating indicators ................................................................................................................................ 17
Production of Crude Oil and NGL ............................................................................................... 17
Production of Gas ......................................................................................................................... 18
Financial indicators ................................................................................................................................. 18
Equity share in financial resultsof upstream associates and joint ventures .................................... 18
Upstream production and operating expenses ............................................................................... 19
Exploration Expenses .................................................................................................................... 19
Mineral extraction tax ................................................................................................................... 19
Downstream Operating Results ............................................................................................................ 20
Operating indicators ................................................................................................................................ 21
Petroleum Product Output ............................................................................................................. 21
Financial indicators ................................................................................................................................. 22
Revenues and equity share in profits of associates and joint ventures* .......................................... 22
Cost of Purchased Oil, Gas and Petroleum Products and Refining Costs and others .................. 31
Pipeline Tariffs and Transportation Costs .................................................................................... 34
Excise tax ..................................................................................................................................... 35
Export Customs Duty ................................................................................................................... 36
Operating results of segment “Corporate and others” .......................................................................... 36
Separate indicators of the consolidated financial statements ............................................................... 36
Costs and Expenses ................................................................................................................................. 36
General and Administrative Expenses........................................................................................... 36
Depreciation, Depletion and Amortization .................................................................................... 37
Taxes Other than Income Tax ....................................................................................................... 37
Finance Income and Expenses ...................................................................................................... 37
Other Income and Other Expenses ................................................................................................ 37
4
Foreign Exchange Differences ...................................................................................................... 38
Cash flow hedges reclassified to profit or loss .............................................................................. 38
Income Tax ................................................................................................................................... 38
Net Income ........................................................................................................................................... 38
Liquidity and Capital Resources ........................................................................................................... 39
Cash Flows .............................................................................................................................................. 39
Net cash provided by operating activities ...................................................................................... 39
Net cash used in investing activities ............................................................................................. 39
Net cash used in financing activities ............................................................................................. 40
Capital Expenditures ............................................................................................................................... 40
Debt Obligations ................................................................................................................................... 41
Key consolidated financial highlights (in RUB terms) ........................................................................ 43
Calculation of Free Cash Flow ............................................................................................................... 43
Calculation of EBITDA .......................................................................................................................... 44
Calculation of EBITDA Margin ............................................................................................................. 44
Calculation of Net Income Margin attributable to Rosneft shareholders .............................................. 44
Calculation of Current ratio .................................................................................................................... 44
Calculation of Capital Employed and Related Indicators ...................................................................... 44
Calculation of Return on Average Capital Employed (ROACE) .......................................................... 45
Calculation of Return on Average Equity (ROAE) ............................................................................... 45
Consolidated financial highlights (in USD terms) ............................................................................... 46
Key consolidated financial highlights (in USD terms) .......................................................................... 46
Calculation of Free Cash Flow ............................................................................................................... 47
Calculation of EBITDA Margin ............................................................................................................. 47
Calculation of Net Income Margin ......................................................................................................... 47
Calculation of Current ratio .................................................................................................................... 47
Appendix: Average monthly RUB/US exchange rates, calculated using the Bank of Russia data ..... 48

5
Overview
Rosneft is a vertically integrated oil and gas company with core activities and assets located principally in
Russia. The Company is primarily engaged in exploration and production of hydrocarbons, oil refining and product
marketing.
Rosneft is one of the world’s largest publicly traded companies in terms of proved hydrocarbon reservesand
in terms of hydrocarbon production.
According to oil and marketable gas reserve information prepared by DeGolyer and MacNaughton,
independent reservoir engineers, proved hydrocarbon reserves reached 38 billion boe per SEC classification and
46 billion boe per PRMS classification as of December 31, 20161 and amounted to 34 billion boe per SEC
classification and 43 billion boe per PRMS classification as of December 31, 2015.
In 2016 crude oil and NGL production of the Company amounted to 210.05 mln tоnnes. The production of
natural and associated gas was 67.10 bcm in 2016. In 2016, excludingthe acquisitionof Bashneft assets (hereinafter,
refer to “new acquired assets”), crude oil and NGL production was 204.60 mln tonnes and natural and associated gas
production amounted to 66.92 bcm.
In 2016 crude oil processing amounted to 92.67 mln tonnes at the Company’s refineries in Russia and abroad
with current process utilisations. Excluding the acquisition of Bashneft assets in 2016 total crude oil processing
volume at the Company’s refineries in Russia was 87.47 mln tonnes.The remaining volumes of crude oil are mostly
exported to Europe, Asia and the CIS.
1 Including Bashneft proved hydrocarbon reserves of 2 billion boe per SEC classification and 2 billion boe per PRMS classification as of December
31, 2016.
Financial and operating highlights
For 3 months ended
%
change
For 12 months ended
December 31, %
change December 31,
2016
September 30,
2016 2016 2015
Financial results, RUB billion
Revenues and equity share in profits of associates and
joint ventures 1,485 1,223 21.4% 4,988 5,150 (3.1)%
EBITDA 365 292 25.0% 1,278 1,245 2.7%
Net income attributable to Rosneft shareholders 52 26 100% 181 355 (49.0)%
Capital expenditures 234 167 40.1% 709 595 19.2%
Free cash flow 25 84 (70.2)% 302 744 (59.4)%
Net Debt 1,890 1,651 14.5% 1,890 1,694 11.6 %
Operational results *
Hydrocarbon production (th. boe per day) 5,831 5,217 11.8% 5,369 5,159 4.1%
Crude oil and NGL production (th. barrels per day) 4,655 4,151 12.1% 4,252 4,116 3.3%
Gas production (th. boe per day) 1,176 1,066 10.3% 1,117 1,043 7.1%
Hydrocarbon production (th. boe per day)** 5,831 5,660 3.0% 5,701 5,574 2.3%
Production of petroleum products and petrochemical products in Russia (mln tonnes) 25.83 20.94 23.4% 84.75 82.91 2.2%
Production of petroleum products and petrochemical
products outside Russia (mln tonnes) 3.43 3.44 (0.3)% 13.46 12.45 8.1%
* Including acquired new assets. ** Pro Forma (including Bashneft starting from January1, 2015), only for purpose of presentation.
For reference only: Financial highlights in USD terms*
For 3 months ended %
change
For 12 months ended
December 31, %
change
December 31,
2016
September 30,
2016 2016 2015
Financial results, USD billion
Revenues and equity share in profits of associates
and joint ventures 24.1 19.4 24.2% 77.2 86.9 (11.2)%
EBITDA 5.8 4.5 28.9% 19.3 20.8 (7.2)%
Net income attributable to Rosneft shareholders 0.8 0.4 100% 2.8 6.1 (54.1)%
Capital expenditures 3.7 2.6 42.3% 10.7 9.7 10.3%
Free cash flow 0.4 1.3 (69.2)% 4.5 12.2 (63.1)%
Net debt 31.2 26.1 19.5% 31.2 23.2 34.5%
*Calculated using average monthly exchange rates of Bank of Russia for the reporting periods (Appendix), except for “Net debt”.

6
Significant events in the fourth quarter of 2016
Rosneft closed the deal of Targin Oilfield Services Company purchase
Rosneft completed the deal with AFK Systema to acquire 100% of Targin shares. The price of the transaction
will amount up to RUB 4.1 bln. The deal will increase the Company’s active rig fleet by 19%, and the number of well
servicing and workover crews by 30%.
Rosneft and BP conclude restructuring of the refining Joint Venture Ruhr Oel GmbH in
Germany
Rosneft and BP announce the completion of the deal to restructure the refining and petrochemical Joint
Venture Ruhr Oel GmbH (ROG) in Germany with effect from January 1, 2017. As a result of the JV
restructuring Rosneft becomes a direct holder and increases its shareholding in the Bayernoil refinery from 12.5% to
25%; the MiRO refinery - from 12% to 24%; and the PCK refinery – from 35.42% to 54.17%. In exchange, BP
consolidates 100% of the equity of the Gelsenkirchen refinery and the solvents production facility DHC Solvent
Chemie.
Rosneft to acquire a share in the Biggest Gas Field in the Mediterranean Sea
In December Company and Eni made an agreement for the acquisition of 30% in the concession agreement
for the development of the Zohr gas field (with the option to acquire additional 5%) and a 15% share in the project’s
operator.
Rosneft sold 19.5% stake to foreign investors
In December 2016 a 19.5 percent stake in the company was sold to the international investor's consortium.
Rosneft and Beijing Gas sign binding documents for the sale of 20% stake in
Verkhnechonskneftegaz
In November 2016, the Company and Beijing Gas Group signed a legally binding share sale agreement
relating to 20%shares in Verkhnechonskneftegaz. As of the issuing date of the Consolidated Financial Statements the
parties have not yet received all necessary regulatory approvals to complete the transaction.
Rosneft forms an international consortium on the basis of Taas-Yuryah Neftegazodobycha
Rosneft and the consortium of Indian companies, comprised of Oil India Limited (leader of the consortium),
Indian Oil Corporation Limited and Bharat Petro Resources Limited completed the transaction for the purchase of
29.9% of Taas-Yuryah Neftegazodobycha for consideration of RUB 73 billion.
Rosneft successfully completed the transaction to sell 23.9%shares in Vankorneft JSC to
a Consortium of Indian Companies
Rosneft and a consortium of Indian companies, consisting of Oil India Limited (the leader of the consortium),
Indian Oil Corporation Limited and Bharat Petro Resources Limited completed the transaction for the sale of 23.9% of
Vankorneft JSC to the Indian companies. As of December 31, 2016, the Company received a base payment of
RUB 106 billion. The agreement provides for the final settlement.
Rosneft successfully completed the transaction to sell 11% shares in Vankorneft JSC to
ONGC Videsh Limited
On 28 October, 2016 Rosneft Oil Company and ONGC Videsh Limited completed the transaction for the sale
of 11% of Vankorneft JSC to the Indian company. As of December 31, 2016, the Company received a base payment
of RUB 49 billion. The agreement provides for the final settlement.
Rosneft closed the deal on acquisition of the government’s stake in Bashneft
Under the Government of the Russian Federation Decree dated October 10, 2016 Rosneft carried out
necessary corporate actions to prepare for and execute the acquisition of the Government’s stake in Bashneft Public
Joint Stock Company representing 50.0755% of its charter capital.
On October 12, 2016, the Company closed the deal for the acquisition of the government’s stake in Bashneft
Oil Company. Consideration transferred totalled RUB 329.69 billion.

7
Rosneft acquired a 49% stake in Essar Oil Limited
On October 15, 2016 the Company acquired a 49% share interest in Essar Oil Limited (hereinafter - “EOL”)
from Essar Energy Holdings Limited and its affiliates. As a result of this transaction, the Company acquired share in
the refinery and the related infrastructure located in Vadinar, India. EOL's business also includes a network of Essar
branded retail outlets across India.
Subsequent events
Rosneft announces successful finalization of a project with Saras S.p.A.
In January 2017 the Company sold a 12% share in charter capital of Saras S.p.A to institutional investors. The
transaction price amounted to EUR 175 mln (RUB 11 bln at the official CBR exchange rate at the date of transaction).

8
Macroeconomic factors affecting results of operations
Main factors, affecting Rosneft’s results of operations are:
Changes in crude oil, petroleum product and gas prices;
RUB/USD exchange rate and inflation;
Taxation including changes in mineral extraction tax, export customs duty and excises;
Changes in tariffs of natural monopolies (for pipeline and railway transport);
Changes in electricity prices.
Changes in prices, export customs duty and transport tariffs may have a significant impact on the mix of
products and distribution channels the Company selects seeking to maximise netback prices of the produced crude oil.
Changes in Crude Oil, Petroleum Product and Gas Prices
World crude oil prices are highly volatile and fluctuate depending on the global balance of supply and demand
on the world crude oil market, political situation mainly in the oil producing regions of the world and other factors.
Crude oil exported by Rosneft via the Transneft’s pipeline system is blended with crude oil of other producers that is
of a different quality. The resulting Urals blend is traded at a discount to Brent. Crude oil exported via Eastern Siberia
– Pacific Ocean (“ESPO”) pipeline is sold at a price which is linked to the price of “Dubai” blend.
Petroleum product prices on international and domestic markets are primarily determined by the level of
world prices for crude oil, supply and demand for petroleum products and competition on different markets. Price
dynamics depends on the type of petroleum products.
The table below sets forth the average crude oil and petroleum products prices worldwide and in Russia in
USD and RUB. The prices nominated in USD are translated into RUB at average USD/RUB exchange rate for the
respective period.
For 3 months ended
change
For 12 months ended
December 31, change
December 31,
2016
September 30,
2016 2016 2015
World market (USD per barrel) % (USD per barrel) %
Brent (dated) 49.5 45.8 8.0% 43.7 52.4 (16.5)%
Urals (average Med and NWE) 48.3 44.0 9.7% 42.1 51.4 (18.2)%
Urals (FOB Primorsk) 46.1 42.6 8.2% 40.1 49.1 (18.2)%
Urals (FOB Novorossysk) 46.8 43.3 7.9% 41.0 50.3 (18.6)% Dubai 48.4 43.2 12.0% 41.3 50.9 (18.8)%
(USD per tonne) % (USD per tonne) %
Naphtha (av. FOB/CIF Med) 427 370 15.3% 372 441 (15.5)% Naphtha (av. FOB Rotterdam/CIF NWE) 439 380 15.6% 384 459 (16.5)%
Naphtha (CFR Japan) 450 389 15.7% 399 489 (18.4)% Fuel oil (av. FOB/CIF Med) 265 232 14.2% 210 261 (19.7)%
Fuel oil (av. FOB Rotterdam/CIF NWE) 262 225 16.5% 204 253 (19.3)%
High sulphur fuel oil 180 cst (FOB Singapore) 296 247 20.0% 231 293 (21.3)% Gasoil (av. FOB/CIF Med) 449 403 11.5% 391 486 (19.6)%
Gasoil (av. FOB Rotterdam/CIF NWE) 451 406 11.1% 393 491 (20.0)%
Gasoil(FOB Singapore) 443 399 11.1% 383 477 (19.7)% (th. RUB per barrel) % (th. RUB per barrel) %
Brent (dated) 3.12 2.96 5.4% 2.93 3.19 (8.2)%
Urals (average Med and NWE) 3.05 2.85 7.0% 2.82 3.14 (10.0)%
Urals (FOB Primorsk) 2.91 2.75 5.6% 2.69 2.99 (10.1)%
Urals (FOB Novorossysk) 2.95 2.80 5.3% 2.75 3.07 (10.4)%
Dubai 3.05 2.79 9.3% 2.77 3.10 (10.7)% (th. RUB per tonne) % (th. RUB per tonne) %
Naphtha (av. FOB/CIF Med) 26.9 23.9 12.5% 25.0 26.9 (7.1)%
Naphtha (av. FOB Rotterdam/CIF NWE) 27.7 24.5 12.8% 25.7 28.0 (8.1)% Naphtha (CFR Japan) 28.4 25.1 12.9% 26.7 29.8 (10.3)%
Fuel oil (av. FOB/CIF Med) 16.7 15.0 11.5% 14.1 15.9 (11.7)%
Fuel oil (av. FOB Rotterdam/CIF NWE) 16.5 14.6 13.7% 13.7 15.4 (11.2)% High sulphur fuel oil 180 cst (FOB Singapore) 18.7 16.0 17.1% 15.5 17.9 (13.5)%
Gasoil (av. FOB/CIF Med) 28.3 26.0 8.8% 26.2 29.6 (11.5)%
Gasoil (av. FOB Rotterdam/CIF NWE) 28.5 26.2 8.5% 26.3 29.9 (12.0)% Gasoil(FOB Singapore) 27.9 25.8 8.4% 25.7 29.1 (11.7)%
Russian market (net of VAT, including excise tax) (th. RUB per tonne) % (th. RUB per tonne) %
Crude oil 13.2 12.1 8.7% 12.2 12.8 (0.5)%
Fuel oil 8.9 7.0 26.0% 6.3 7.2 (11.6)% Summer diesel 28.5 28.2 1.0% 27.5 28.0 (1.6)%
Winter diesel 31.9 29.7 7.5% 29.1 29.9 (2.7)%
Jet fuel 28.1 25.3 11.3% 25.1 26.9 (6.5)% High octane gasoline 33.3 34.8 (4.3)% 33.0 31.2 6.0%
Low octane gasoline 30.8 31.3 (1.6)% 30.0 28.4 5.4%
Sources: average prices were calculated from unrounded data of analytical agencies.

9
The difference between price movements denominated in USD and those denominated in RUB is explained
by nominal RUB appreciation against USD by 2.5%in the fourth quarter of 2016 compared with the third quarter of
2016 and nominal RUB depreciation against USD by 9.1% in the twelve months of 2016 compared with the same
period of 2015.
The Russian Government regulates the price of the gas sold in Russia by Gazprom and its affiliates which is
considered as the benchmark for domestic gas market. Starting from July 1, 2015 regulated gas tariff for sale to all
customers group, which is set by the FAS increased by 7.5%. Starting from July 1, 2016 regulated gas tarifffor sale to
residents increased by 2% (there was no indexation for the rest customers groups). The regulated price has affected,
and is likely to continue to affect, the pricing of Rosneft gas sales. Rosneft’s average domestic gas sales price(net of
VAT) was RUB 3.32 thousand and RUB 3.11thousand per th.cubic meters in the fourth and in the third quarters of
2016, respectively; and RUB 3.24 thousand and RUB 3.17 thousand per th. cubic meters in 2016 and 2015,
respectively.
USD/RUB and EUR/RUB Exchange Rates and Inflation
The USD/RUB and EUR/RUB exchange rates and inflation in Russia affect Rosneft’s results as most of the
Company’s revenues from sales of crude oil and petroleum products are denominated in USD, while most of the
Company’s expenses are denominated in RUB.
The table below provides information on the exchange rates movements and inflation during the periods
analysed:
For 3 months ended
For 12 months ended
December 31,
December 31,
2016
September 30,
2016 2016 2015
Consumer price index (CPI) for the period* 1.3% 0.7% 5.4% 12.9%
Average RUB/USD exchange rate for the period** 63.07 64.62 67.03 60.96
RUB/USD exchange rate at the end of the period 60.66 63.16 60.66 72.88
Average RUB/EUR exchange rate for the period 68.13 72.15 74.23 67.78
RUB/EUR exchange rate at the end of the period 63.81 70.88 63.81 79.70
Source: Central Bank of Russian Federation. *Producer price index amounted to 4.0% y-o-y at the end of December 2016.
**See Average monthly RUB/USD exchange rates in the Appendix.
Taxation
The table below provides information on the average enacted tax rates specific to the Russian oil and gas
industry:
For 3 months
ended %
change
For 12 months
ended December 31, %
change December 31,
2015
September 30,
2015 2016 2015
Mineral extraction tax
Crude oil (RUB per tonne) 6,776 6,098 11.1% 5,777 6,312 (8.5)%
Export customs duty for crude oil
Crude oil (US$ per tonne) 91.7 88.8 3.3% 75.7 120.3 (37.1)%
Crude oil (RUB per tonne) 5,781 5,736 0.8% 5,076 7,334 (30.8)% Crude oil (RUB per barrel) 781 775 0.8% 686 991 (30.8)%
Export customs duty for petroleum products Gasoline (RUB per tonne) 3,523 3,496 0.8% 3,093 5,718 (45.9)%
Naphtha (RUB per tonne) 4,101 4,069 0.8% 3,601 6,231 (42.2)%
Light and middle distillates (RUB per tonne) 2,308 2,292 0.7% 2,028 3,517 (42.3)% Liquid fuels (fuel oil) (RUB per tonne) 4,738 4,701 0.8% 4,160 5,571 (25.3)%
*Calculated based on unrounded data.
According to Federal law 401-FZ of November 30, 2016 “On amendments to Part Two of the Tax Code and
Other Legislative Acts of the Russian Federation” new amendments were introduced from January 1, 2017, in respect
of excise duties, mineral extraction tax and other taxes.

10
In accordance with new amendments of the Tax legislation, acting from January 2017, the excise tax rates on
the petroleum products are differentiated in line with quality requirements to petroleum products:
Excise on petroleum products
2015 Since January 1
through
March 31, 2016
Since April 1,
through
December 31,
2016
2017 2018
High octane gasoline (RUB per tonne)
High octane gasoline non-compliant with euro-5 (RUB per tonne) 7,300 10,500 13,100 13,100 13,100
High octane gasoline euro-5 (RUB per tonne) 5,530 7,530 10,130 10,130 10,535
Naphtha (RUB per tonne) 11,300 10,500 13,100 13,100 13,100
Diesel (RUB per tonne) 3,450 4,150 5,293 6,800 7,072
Lubricants (RUB per tonne) 6,500 6,000 6,000 5,400 5,400
Benzol, paraxylene, ortoxylene (RUB per tonne) 2,300 3,000 3,000 2,800 2,800
Middle distillates (RUB per tonne) - 4,150 5,293 7,800 8,112
In accordance with new amendments of Federal law 401-FZ, the producer is able to apply an increased
coefficient to excise duty deduction of 1.74 in 2017 depending on certain type of the oil product subject to excise duty.
Effective tax burden of the Company was 44.7% and 44.2% in the fourth and third quarters of 2016,
respectively.
The mineral extraction tax and the export customs duty accounted for approximately 34.5% and 36.5% of
Rosneft’s total revenues in the fourth and third quarters of 2016,respectively, and also approximately 33.4% and
39.1% of Rosneft’s total revenues in 2016 and 2015. Tax withdrawing share in the financial results excluding forex
and one off effects was up to 86% in the twelve months of 2016.
Mineral Extraction Tax (MET)
The rate of mineral extraction tax (MET) for crude oil is linked to the Urals price in the international market
and changes every month. It is calculated in USD per barrel of crude oil produced using average exchange rate
established by the Central Bank of Russia for the respective month.
Starting from January 1, 2017 the mineral extraction tax rate will be calculated by multiplying the tax rate of
RUB 919 (in 2015 – RUB 766, in 2016– RUB 857) by the adjustment ratio of ((P - 15) x Eхchange rate / 261), where
“P” is the average Urals price per barrel and “Exchange rate” is the average RUB/USD exchange rate established by
the Central Bank of Russia in the respective month and minus the factor which characterizes crude oil production at a
particular oil field, “Dm”. The coefficient “Dm” is calculated using base rate (starting 2016 – RUB 559, in 2015 –
RUB 530) and factors which characterize the degree of depletion of a particular field, reserves of a particular field, the
degree of difficulty of extraction and region of production and oil properties. Starting from January 2017, additional
MET withdrawals are introduced: + RUB/tonne 306 in 2017 (RUB/tonne - 357 in 2018, RUB/tonne - 428 in 2019).
In 2016 the Company applied reduced and zero MET tax rates at certain fields:
Tax relieves in 2016 Applicable in the Company
Zero rates Oil fields with hard to recover reserves, including bazhenov, abalak, khadum,
domanic formations
Reduced MET by coefficient “Dm”, which
characterizes crude oil production at a
particular oil field
Oil fields located:
In Irkutsk region, the republic of Sakha (Yakutia) and Krasnoyarsk
territory which is applicable for the first 25 million tonnes of production
On the territory of the Nenets Autonomous district, Yamalo-nenets
Autonomous district – for the first 15 million tonnes of production
Okhotsk sea fields subject to zero mineral extraction tax rate which is
applicable for the first 30 million tonnes of production
Oil fields with reserve depletion rate of over 80%.
Oil fields with the volume of initial recoverable reserves being less than 5 million
tonnes.
Oil fields with high-viscosity crude oil (in-situ viscosity more than 200 mPas and
less than 10 000 mPas)
Special tax regime for offshore projects in the
Russian Federation
The offshore projects are categorized into one of four groups depending on its
complexity and specify MET rates for each project group ranging from 5% to
30% of hydrocarbon prices (natural gas projects of 3 and 4 groups of difficulty –
1.3% and 1.0% respectively).
Special tax regime exempting the Company
from paying mineral extraction tax. Exploration projects in the Sakhalin-1 psa.
11
MET rate calculation for natural gas and gas condensate
MET rate for natural gas
In the fourth and in the third quarters of 2016, average extraction tax for natural gas was RUB 534 and
RUB 531 per th. cubic meters, respectively. In the twelve months of 2016 and 2015 average extraction tax for natural
gas was RUB 535 and RUB 520 per th. cubic meters, respectively.
MET rate for gas condensate
The production of gas condensate is mainly subject to MET rate for crude oil because the purification of gas
condensate is compounded in the crude oil production. Mineral extraction gas condensate tax rate is applied in separate
purification of gas condensate.
Significant volume of gas condensate produced at Rospan fields is subject to mineral extraction gas
condensate tax rate, which amounted to RUB 3,111 and RUB 2,970 per tonne in the fourth and third quarters of 2016
respectively, and RUB 3,026 per tonne and RUB 2,331 per tonne in the twelve months of 2016 and 2015, respectively.
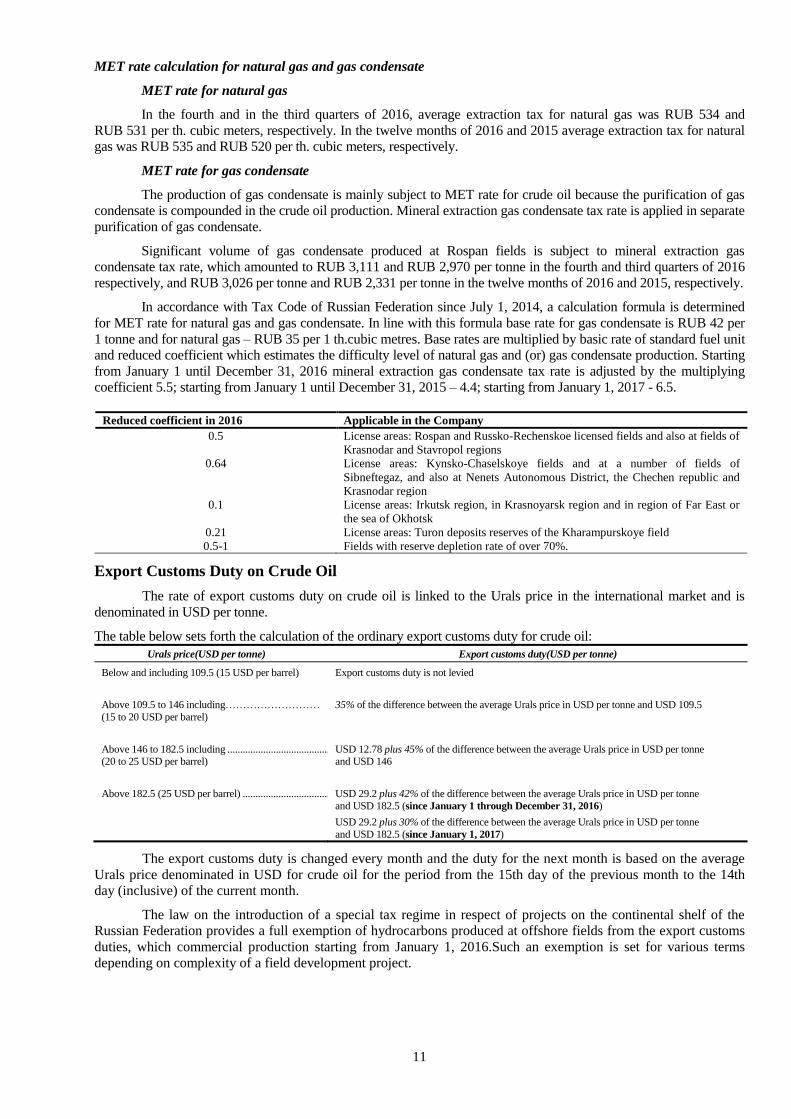
In accordance with Tax Code of Russian Federation since July 1, 2014, a calculation formula is determined
for MET rate for natural gas and gas condensate. In line with this formula base rate for gas condensate is RUB 42 per
1 tonne and for natural gas – RUB 35 per 1 th.cubic metres. Base rates are multiplied by basic rate of standard fuel unit
and reduced coefficient which estimates the difficulty level of natural gas and (or) gas condensate production. Starting
from January 1 until December 31, 2016 mineral extraction gas condensate tax rate is adjusted by the multiplying
coefficient 5.5; starting from January 1 until December 31, 2015 – 4.4; starting from January 1, 2017 - 6.5.
Reduced coefficient in 2016 Applicable in the Company
0.5 License areas: Rospan and Russko-Rechenskoe licensed fields and also at fields of
Krasnodar and Stavropol regions
0.64 License areas: Kynsko-Chaselskoye fields and at a number of fields of
Sibneftegaz, and also at Nenets Autonomous District, the Chechen republic and
Krasnodar region
0.1 License areas: Irkutsk region, in Krasnoyarsk region and in region of Far East or
the sea of Okhotsk
0.21 License areas: Turon deposits reserves of the Kharampurskoye field
0.5-1 Fields with reserve depletion rate of over 70%.
Export Customs Duty on Crude Oil
The rate of export customs duty on crude oil is linked to the Urals price in the international market and is
denominated in USD per tonne.
The table below sets forth the calculation of the ordinary export customs duty for crude oil:
Urals price(USD per tonne) Export customs duty(USD per tonne)
Below and including 109.5 (15 USD per barrel) Export customs duty is not levied
Above 109.5 to 146 including………………………
(15 to 20 USD per barrel)
35% of the difference between the average Urals price in USD per tonne and USD 109.5
Above 146 to 182.5 including ........................................
(20 to 25 USD per barrel)
USD 12.78 plus 45% of the difference between the average Urals price in USD per tonne
and USD 146
Above 182.5 (25 USD per barrel) .................................. USD 29.2 plus 42% of the difference between the average Urals price in USD per tonne
and USD 182.5 (since January 1 through December 31, 2016)
USD 29.2 plus 30% of the difference between the average Urals price in USD per tonne
and USD 182.5 (since January 1, 2017)
The export customs duty is changed every month and the duty for the next month is based on the average
Urals price denominated in USD for crude oil for the period from the 15th day of the previous month to the 14th
day (inclusive) of the current month.
The law on the introduction of a special tax regime in respect of projects on the continental shelf of the
Russian Federation provides a full exemption of hydrocarbons produced at offshore fields from the export customs
duties, which commercial production starting from January 1, 2016.Such an exemption is set for various terms
depending on complexity of a field development project.

12
Export customs duty on crude oil export to CIS
In accordance with the Eurasian Economic Agreement dated May 29, 2014 and effective from
January 1, 2015 export duties are not payable on crude oil export to countries-participants of Eurasian Economic
Agreement. Meanwhile, the Eurasian Economic Agreement enables some export limits on oil and oil products.
Export duties are not payable on crude oil exports to CIS countries that are members of the Customs Union.
At the same time quotes for tax-free sale of crude oil and petroleum products are set. In accordance with agreement
with Armenia all supplies above the quotes are subject for the duties.
In accordance with agreement between the Governments of Russian Federation and the Kazakhstan
Republic on trade and economic cooperation in crude oil and petroleum products supplies dated December 9, 2010
the export ban was set for the specified dark petroleum products exported from Russian Federation to the
Kazakhstan Republic.
Export Customs Duty on Petroleum Products
Export customs duty on petroleum products (except liquefied petroleum gas (“LPG”)) is set every month as
the marginal export customs duty rate on crude oil multiplied by the estimated ratio depending on the type of
petroleum product.
Export customs duty on LPG is based on the average price of LPG at Poland board (DAF Brest)
denominated in USD per tonne for the period from the 15th day of the previous month to the 14th day (inclusive) of
the current month.
Starting from January 1, 2015 marginal export customs duty for petroleum products is set as a percentage of
the marginal export customs duty for crude oil as listed in table below:
Type of petroleum product
Marginal export customs duty (% of the marginal export customs
duty for crude oil) for the period
January 1 -
December 31, 2015
January 1-
December 31, 2016
Since January 1,
2017
Light and middle distillates (excluding: naphtha and gasoline), benzene, toluene, xylenes, lubricants, diesel 48 40 30
Naphtha 85 71 55
Gasoline 78 61 30
Fuel oil, bitumen oil, other dark oil products 76 82 100
In 2016 and 2015 calculation of the export duty rate for petroleum products is based on the above marginal
rates for each type of petroleum product.
Changes in Transport Tariffs of Pipeline and Railway Monopolies
Rosneft transports most of its crude oil and petroleum products via pipeline network owned and operated
by JSC “AK “Transneft” (“Transneft”), which is a natural state-owned pipeline monopoly. Rosneft also transports
crude oil and petroleum products via railway network mainly owned and operated by Russian railways (“RZD”),
another natural state-owned monopoly.
The FAS1 has the authority to set Transneft’s base tariffs for transportation of crude oil and petroleum
products in Russia, which include a dispatch tariff, a pumping tariff, loading, charge-discharge, transshipment and
other tariffs. Tariffs for railroad transportation are also regulated by the FAS. The tariffs are set in roubles and are
not linked to the exchange rate.
The FAS sets tariffs for each separate route of the pipeline networks depending on the length of relevant
routes, transportation direction and other factors, alternatively tariffs may be set for the entire route of the pipeline
network. Tariffs for railroad transportation often depend on the type of cargo and the transportation route.
The FAS sets tariffs for gas pipeline transportation. The tariff includes two parts. The first part of tariff is
fixed for “input and output” facilities and mostly depends on the remoteness of facilities. The second part of the
tariff depends on gas transportation by Gazprom in the gas supply system and actual distance of gas transmission in
a gas pipeline. Tariffs are set in roubles.
1The FAS - the Federal Antimonopoly Service.
13
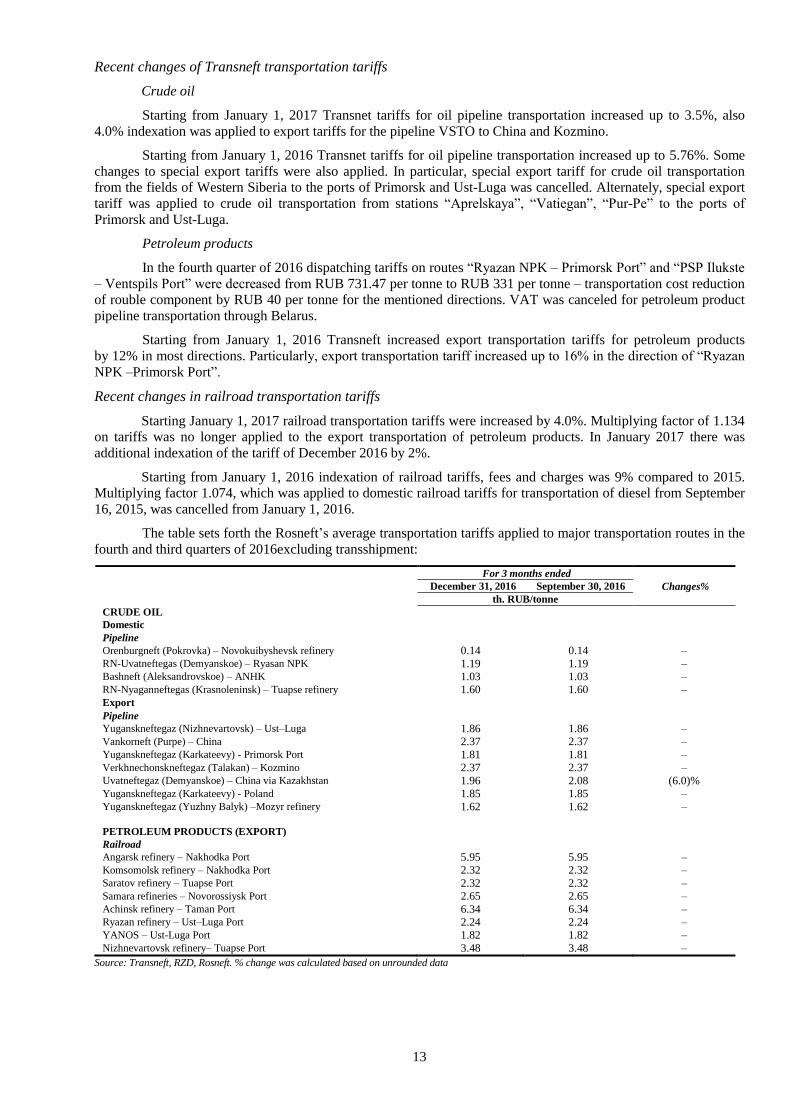
Recent changes of Transneft transportation tariffs
Crude oil
Starting from January 1, 2017 Transnet tariffs for oil pipeline transportation increased up to 3.5%, also
4.0% indexation was applied to export tariffs for the pipeline VSTO to China and Kozmino.
Starting from January 1, 2016 Transnet tariffs for oil pipeline transportation increased up to 5.76%. Some
changes to special export tariffs were also applied. In particular, special export tariff for crude oil transportation
from the fields of Western Siberia to the ports of Primorsk and Ust-Luga was cancelled. Alternately, special export
tariff was applied to crude oil transportation from stations “Aprelskaya”, “Vatiegan”, “Pur-Pe” to the ports of
Primorsk and Ust-Luga.
Petroleum products
In the fourth quarter of 2016 dispatching tariffs on routes “Ryazan NPK – Primorsk Port” and “PSP Ilukste
– Ventspils Port” were decreased from RUB 731.47 per tonne to RUB 331 per tonne – transportation cost reduction
of rouble component by RUB 40 per tonne for the mentioned directions. VAT was canceled for petroleum product
pipeline transportation through Belarus.
Starting from January 1, 2016 Transneft increased export transportation tariffs for petroleum products
by 12% in most directions. Particularly, export transportation tariff increased up to 16% in the direction of “Ryazan
NPK –Primorsk Port”.
Recent changes in railroad transportation tariffs
Starting January 1, 2017 railroad transportation tariffs were increased by 4.0%. Multiplying factor of 1.134
on tariffs was no longer applied to the export transportation of petroleum products. In January 2017 there was
additional indexation of the tariff of December 2016 by 2%.
Starting from January 1, 2016 indexation of railroad tariffs, fees and charges was 9% compared to 2015.
Multiplying factor 1.074, which was applied to domestic railroad tariffs for transportation of diesel from September
16, 2015, was cancelled from January 1, 2016.
The table sets forth the Rosneft’s average transportation tariffs applied to major transportation routes in the
fourth and third quarters of 2016excluding transshipment:
For 3 months ended
Changes% December 31, 2016 September 30, 2016
th. RUB/tonne
CRUDE OIL
Domestic
Pipeline Orenburgneft (Pokrovka) – Novokuibyshevsk refinery 0.14 0.14 – RN-Uvatneftegas (Demyanskoe) – Ryasan NPK 1.19 1.19 – Bashneft (Aleksandrovskoe) – ANHK 1.03 1.03 – RN-Nyaganneftegas (Krasnoleninsk) – Tuapse refinery 1.60 1.60 –
Export
Pipeline Yuganskneftegaz (Nizhnevartovsk) – Ust–Luga 1.86 1.86 – Vankorneft (Purpe) – China 2.37 2.37 – Yuganskneftegaz (Karkateevy) - Primorsk Port 1.81 1.81 – Verkhnechonskneftegaz (Talakan) – Kozmino 2.37 2.37 – Uvatneftegaz (Demyanskoe) – China via Kazakhstan 1.96 2.08 (6.0)% Yuganskneftegaz (Karkateevy) - Poland 1.85 1.85 – Yuganskneftegaz (Yuzhny Balyk) –Mozyr refinery 1.62 1.62 –
PETROLEUM PRODUCTS (EXPORT)
Railroad Angarsk refinery – Nakhodka Port 5.95 5.95 – Komsomolsk refinery – Nakhodka Port 2.32 2.32 – Saratov refinery – Tuapse Port 2.32 2.32 – Samara refineries – Novorossiysk Port 2.65 2.65 – Achinsk refinery – Taman Port 6.34 6.34 – Ryazan refinery – Ust–Luga Port 2.24 2.24 – YANOS – Ust-Luga Port 1.82 1.82 – Nizhnevartovsk refinery– Tuapse Port 3.48 3.48 –
Source: Transneft, RZD, Rosneft. % change was calculated based on unrounded data
14
Rosneft operates proprietary transportation and transshipment facilities. This allows the optimization of
Company’s logistics (netbacks). These facilities include: the Arkhangelsk, De-Kastri, Tuapse and Nakhodka export
terminals, the Okha – Komsomolsk-on-Amur pipeline, Vankor-Purpe pipeline and the Caspian Pipeline Consortium
(“CPC”).
Business Segments and Intersegment sales
Most of all of Rosneft’s operations and assets are located in the Russian Federation. As geographical regions
of the Russian Federation have similar economic and legal characteristics, Rosneft does not present geographical
segments separately. Rosneft also carries out projects outside Russia, including exploration and production projects in
Algeria, Norway, United Arab Emirates, Canada, Brazil, Vietnam, Venezuela and the USA and also stakes in
refineries in Germany and Belarus.
Operating Segments
As at the reporting date the activities of Rosneft are divided into two main operating segments, based on the
nature of their operations:
● Exploration and production (Upstream). Geological exploration and development of fields and crude oil
and gas production both on the onshore and offshore in the territory of Russia and abroad and internal
oilfield service companies;
● Refining and distribution (Downstream). Refining of crude oil, as well as the purchase, transportation, sale
of crude oil and petroleum products to the third parties in Russia and abroad;
● Other activities form the “Corporate” segment and include banking, financial services and other corporate
services.
Intersegment Sales
Rosneft’s two main business segments are interconnected: the majority of the revenues of one main segment
is included in the expenses of the other main segment. In particular, Upstream Group companies provide operator
services for Downstream Group companies, which sell part of crude oil on the domestic market or outside of Russia,
and processes the remaining part at own refineries or at the refineries of affiliates and third parties. Refined petroleum
products are then either sold by the Company through wholesale in international or domestic markets or sold to the
Company’s sale subsidiaries for subsequent distribution in Russia.
Intercompany sales present operational activity of segments as if the segments operate separately from each
other within the vertically integrated company using transfer prices for settlements between segments. For the
estimation of upstream revenues within vertically integrated company the price of Upstream (and the purchase price of
Downstream) was recalculated using the export market price minus transportation cost, minus export duty, dispatches
and other expenses relating to current sales. The price is established at oil gathering facility (point of sales) where
Upstream dispatches the oil to Downstream. All intercompany operations, including transactions from internal oilfield
service companies and corporate service companies, are eliminated on the consolidation level.

15
Financial performance for the three months ended December 31, 2016 and September 30, 2016,
for the twelve months ended December 31, 2016 and 2015 (Consolidated statement of profit or
loss) in RUB billions
For 3 months ended
%
change
For 12 months ended
December 31, %
change
December 31,
2016
September 30,
2016 2016 2015
Revenues and equity share in profits of
associates and joint ventures
Oil, gas, petroleum products and
petrochemicals sales 1,456 1,204 20.9% 4,887 5,071 (3.6)%
Support services and other revenues 19 18 5.6% 75 70 7.1%
Equity share in profits of associates and
joint ventures 10 1 >100% 26 9 >100%
Total revenues and equity share in profits
of associates and joint ventures 1,485 1,223 21.4% 4,988 5,150 (3.1)%
Costs and expenses
Production and operating expenses 167 132 26.5% 559 575 (2.8)%
Cost of purchased oil, gas, petroleum
products and refining costs 196 139 41.0% 614 530 15.8%
General and administrative expenses 38 31 22.6% 129 130 (0.8)%
Pipeline tariffs and transportation costs 155 138 12.3% 575 542 6.1%
Exploration expenses 4 3 33.3% 14 13 7.7%
Depreciation, depletion and amortization 133 120 10.8% 482 450 7.1%
Taxes other than income tax 400 336 19.0% 1,296 1,277 1.5%
Export customs duty 199 184 8.2% 657 925 (29.0)%
Total costs and expenses 1,292 1,083 19.3% 4,326 4,442 (2.6)%
Operating income 193 140 37.9% 662 708 (6.5)%
Finance income 33 17 94.1% 91 55 65.5%
Finance expenses (52) (45) 15.6% (193) (269) (28.3)%
Other income 43 5 >100% 50 75 (33.3)%
Other expenses (38) (16) >100% (76) (72) (5.6)%
Foreign exchange differences (15) (14) 7.1% (70) 86 -
Cash flow hedges reclassified to profit or
loss (36) (37) (2.7)% (147) (123) 19.5%
Income before income tax 128 50 >100% 317 460 (31.0)%
Income tax expense (62) (20) >100% (116) (104) 11.5%
Net income 66 30 >100% 201 356 (43.5)%
Net income attributable to
- Rosneft shareholders 52 26 >100% 181 355 (49.0)%
- non-controlling interests 14 4 >100% 20 1 >100%

16
Upstream Operating Results
The segment includes Rosneft Group companies that provide operating services, the independent enterprises
that produce oil, gas and gas condensate in Russia and abroad, the joint ventures and exploration units in Russia and
abroad, oil service companies. The segment includes revenues generated by the transfer of oil, gas and NGL to
downstream segment for subsequent sales to third parties and all operating costs associated with production and
exploration, and also revenues and costs of oil service companies that provide services to the Group companies.
The results set in the table below include the acquisition of Bashneft assets in October 2016.
For 3 months ended %
change
For 12 months ended December 31, %
change
December 31,
2016
September 30,
2016 2016 2015
Operational results
Hydrocarbon production (th. boe per day) 5,831 5,217 11.8% 5,369 5,159 4.1%
Crude oil and NGL production (th. barrels per day) 4,655 4,151 12.1% 4,252 4,116 3.3%
Gas production (th. boe per day) 1,176 1,066 10.3% 1,117 1,043 7.1%
Hydrocarbon production (mln boe )1 497.7 444.7 11.9% 1,822.3 1,744.9 4.4%
Hydrocarbon production (th. boe per day)2 5,831 5,660 3.0% 5,701 5,574 2.3%
Financial results, RUB billions
EBITDA 324 261 24.1% 1,172 1,044 12.3%
Capital expenditures3 185 149 24.2% 608 456 33.3%
Upstream operating expenses 89.4 72.9 22.6% 302.9 277.6 9.1%
Indicators per boe
EBITDA, RUB/boe 651 587 10.9% 643 598 7.5%
Capital expenditures, RUB/boe 372 335 11.0% 334 261 28.0%
Upstream operating expenses, RUB/boe 180 164 9.8% 166 159 4.4%
Upstream operating expenses, USD/boe4 2.8 2.5 12.0% 2.5 2.6 (3.8)% 1Excluding associates and joint ventures. 2Pro Forma (including Bashneft starting from January 2015), only for purpose of presentation. 3Ref. to “Capital expenditures”. 4Calculated using monthly RUB/USD exchange rates for the reporting periods.
Upstream EBITDA
For 3 months ended %
change
For 12 months ended December31, %
change
December 31,
2016
September 30,
2016 2016 2015
Revenues and equity share in profits of
associates and joint ventures 675 602 12.1% 2,470 2,487 (0.7)% Including equity share in profits of associates and
joint ventures 7 − >100% 17 2 >100%
Expenses net of depreciation 416 373 11.5% 1,458 1,530 (4.7)%
including
Upstream operating expenses1 77 73 6.3% 291 278 4.8%
General and administrative expenses 14 14 − 53 49 8.2%
Hydrocarbon procurement costs2 5 3 66.7% 25 17 47.1%
Pipeline tariffs and transportation costs and other costs3 9 4 >100% 31 34 (8.8)%
Exploration expenses 3 3 − 13 13 −
Taxes other than income tax 308 276 11.6% 1,045 1,139 (8.3)%
Effect of prepayments offsetting 39 32 21.9% 134 87 54.0%
Acquisition of Bashneft assets 26 − − 26 − −
EBITDA 324 261 24.1% 1,172 1,044 12.3% 1Percentage is calculated from unrounded data. 2See section “Cost of Purchased Oil, Gas and Petroleum Products and Refining Costs and others”. Since September 2016 cost of purchase and related
transportation expenses have been transferred to Downstream segment. 3Other costs include the estimation of ecological reserves revision of RUB 4.3 billion in the fourth quarter of 2016, RUB 0.4 billion in the third quarter
of 2016, and in the amount of RUB 5.4 billion and RUB 1.1 billion in 2016 and 2015, respectively.

17
Operating indicators
Production of Crude Oil and NGL
Rosneft has main fully consolidated production and development enterprises, which produce crude oil in
Western Siberia, Eastern Siberia, Timan Pechora, Central Russia, southern part of European Russia and the Russian
Far East. The Company also has a 20% stake in the Sakhalin-1 project and a 50% stake in JSC “Tomskneft” VNK,
both accounted for using proportionate consolidation method. In addition, Rosneft participates in major production
joint ventures accounted for using the equity method: Udmurtneft – 49.54% and Slavneft – 49.94%. The Company
also participates in international projects in Vietnam, Venezuela and Canada. In October 2016 the Company acquired
production assets of Bashneft.
The following table sets forth Rosneft’s crude oil and NGL production including the effect from the
consolidation of new assets (Bashneft) into group production:
For 3 months ended %
change
For 12 months ended
December 31, %
change
December 31,
2016
September 30,
2016 2016 2015
(million of barrels) (million of barrels)
Yuganskneftegaz (Western Siberia) 119.6 120.1 (0.4)% 471.4 462.1 2.0% Projects of the Vankor group (Eastern Siberia) 44.4 40.4 9.9% 164.0 162.9 0.7%
Samotlorneftegaz (Western Siberia) 36.5 37.2 (1.9)% 148.4 155.1 (4.3)%
Orenburgneft (Central Russia) 30.8 30.8 − 122.9 134.0 (8.3)% Samaraneftegaz (Central Russia) 23.7 23.4 1.3% 92.7 89.6 3.5%
RN-Uvatneftegaz (Western Siberia) 21.4 21.8 (1.8)% 86.0 81.9 5.0%
Verkhnechonskneftegaz (Eastern Siberia) 16.2 16.1 0.6% 64.4 64.0 0.6% Varyeganneftegaz (Western Siberia) 11.6 11.5 0.9% 45.9 46.5 (1.3)%
RN-Nyaganneftegaz (Western Siberia) 11.1 11.1 − 43.8 44.8 (2.2)%
Purneftegaz (Western Siberia) 9.9 9.9 − 39.3 41.1 (4.4)% Tomskneft (Western Siberia) 9.2 9.4 (2.1)% 36.1 36.7 (1.6)%
Severnaya Neft (Timan Pechora) 6.2 6.5 (4.6)% 24.9 21.2 17.5%
Northern tip of Chayvo (Far East ) 4.1 3.5 17.1% 16.8 14.3 17.5% Sakhalin-1 (Far East)
(net of royalty and government share) 3.0 2.4 25.0% 11.9 11.0 8.2%
Taas-Yuryah (Eastern Siberia) 2.1 2.0 5.0% 8.1 6.8 19.1% Bashneft-Dobycha (Central Russia) 31.4 − − 31.4 − −
Bashneft-Polyus (Timan Pechora)1 4.5 − − 4.5 − −
Sorovskneft (Western Siberia) 4.4 − − 4.4 − − Other 10.0 9.3 7.5% 37.1 34.4 7.8%
Crude oil and NGL production by fully
and proportionately consolidated enterprises 400.1 355.4 12.6% 1,454.0 1,406.4 3.4%
Slavneft (Western and Eastern Siberia) 13.8 13.9 (0.7)% 55.5 57.2 (3.0)% Udmurtneft (Central Russia) 5.8 5.8 − 23.2 23.6 (1.7)%
Polar Lights (Timan Pechora)2 − − − − 1.3 (100.0)% Other 8.6 6.8 26.5% 23.7 13.7 73.0%
Total share in production of associates and JV 28.2 26.5 6.4% 102.4 95.8 6.9%
Total crude oil and NGL production 428.3 381.9 12.1% 1,556.4 1,502.2 3.6%
Daily crude oil and NGL production
(th. barrels per day) 4,655 4,151 12.1% 4,252 4,116 3.3%
Daily crude oil and NGL production
(th. barrels per day) 3 4,655 4,583 1.6% 4,575 4,520 1.2% 1Refers to 100% consolidated share in production; 2The share was sold in December 2015. 3 Pro Forma (including Bashneft starting from January 2015), only for purpose of presentation..
In the fourth quarter of 2016 crude oil and NGL production was 428.3 mln barrels. Net of the effect of
acquisition of new assets in the fourth quarter of 2016 the production increased by 6.1 mln barrels compared to 381.9
mln barrels in the third quarter of 2016. Oil production growth was mainly caused by increased production at the fields
of Suzun group, by commissioning at fields of the Eastern Messoyakha group and by production growth at the fields
of the Northern tip of Chayvo and Sakhalin-1 after planned maintenance in the third quarter of 2016.
Excluding the effect of acquisition of Bashneft assets in 2016, the Company’s production increased up to
0.9% (1,516.1 mln bbl) compared to 1,502.2 mln barrels in 2015. The increase was driven by consistent improvement
in production at the fields of Yuganskneftegaz, Severnaya Neft, Samaraneftegaz and other assets due to increased
drilling development, application of new technologies and start of commissioning of new wells in 2015, completion of
testing of new infrastructure at the Suzun fields, commissioning at fields of the Eastern Messoyakha group.
In 2016, the Company increased its production drilling by 35% compared with 2015. The share of in-house
services in the total drilling footage consistently exceeds 50%. The growth of new wells put into operation exceeded
43% up to 2.6 thousand of units with app. 32% share of horizontal wells in comparison with the twelve months of
2015.
18
Production of Gas
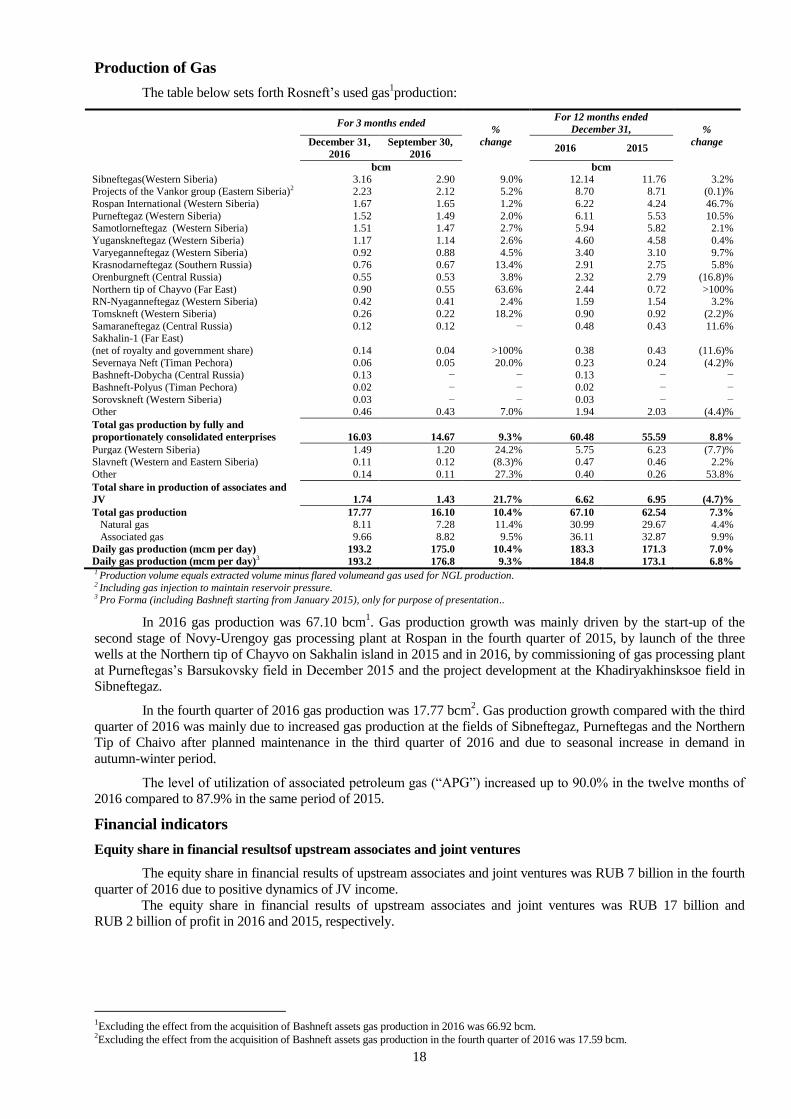
The table below sets forth Rosneft’s used gas1production:
For 3 months ended
%
change
For 12 months ended
December 31, %
change
December 31,
2016
September 30,
2016 2016 2015
bcm bcm
Sibneftegas(Western Siberia) 3.16 2.90 9.0% 12.14 11.76 3.2% Projects of the Vankor group (Eastern Siberia)2 2.23 2.12 5.2% 8.70 8.71 (0.1)%
Rospan International (Western Siberia) 1.67 1.65 1.2% 6.22 4.24 46.7%
Purneftegaz (Western Siberia) 1.52 1.49 2.0% 6.11 5.53 10.5% Samotlorneftegaz (Western Siberia) 1.51 1.47 2.7% 5.94 5.82 2.1%
Yuganskneftegaz (Western Siberia) 1.17 1.14 2.6% 4.60 4.58 0.4%
Varyeganneftegaz (Western Siberia) 0.92 0.88 4.5% 3.40 3.10 9.7% Krasnodarneftegaz (Southern Russia) 0.76 0.67 13.4% 2.91 2.75 5.8%
Orenburgneft (Central Russia) 0.55 0.53 3.8% 2.32 2.79 (16.8)%
Northern tip of Chayvo (Far East) 0.90 0.55 63.6% 2.44 0.72 >100% RN-Nyaganneftegaz (Western Siberia) 0.42 0.41 2.4% 1.59 1.54 3.2%
Tomskneft (Western Siberia) 0.26 0.22 18.2% 0.90 0.92 (2.2)%
Samaraneftegaz (Central Russia) 0.12 0.12 − 0.48 0.43 11.6% Sakhalin-1 (Far East)
(net of royalty and government share) 0.14 0.04 >100% 0.38 0.43 (11.6)%
Severnaya Neft (Timan Pechora) 0.06 0.05 20.0% 0.23 0.24 (4.2)% Bashneft-Dobycha (Central Russia) 0.13 − − 0.13 − −
Bashneft-Polyus (Timan Pechora) 0.02 − − 0.02 − −
Sorovskneft (Western Siberia) 0.03 − − 0.03 − − Other 0.46 0.43 7.0% 1.94 2.03 (4.4)%
Total gas production by fully and
proportionately consolidated enterprises 16.03 14.67 9.3% 60.48 55.59 8.8%
Purgaz (Western Siberia) 1.49 1.20 24.2% 5.75 6.23 (7.7)% Slavneft (Western and Eastern Siberia) 0.11 0.12 (8.3)% 0.47 0.46 2.2%
Other 0.14 0.11 27.3% 0.40 0.26 53.8%
Total share in production of associates and
JV 1.74 1.43 21.7% 6.62 6.95 (4.7)%
Total gas production 17.77 16.10 10.4% 67.10 62.54 7.3% Natural gas 8.11 7.28 11.4% 30.99 29.67 4.4%
Associated gas 9.66 8.82 9.5% 36.11 32.87 9.9%
Daily gas production (mcm per day) 193.2 175.0 10.4% 183.3 171.3 7.0%
Daily gas production (mcm per day)3 193.2 176.8 9.3% 184.8 173.1 6.8% 1 Production volume equals extracted volume minus flared volumeand gas used for NGL production. 2 Including gas injection to maintain reservoir pressure. 3 Pro Forma (including Bashneft starting from January 2015), only for purpose of presentation..
In 2016 gas production was 67.10 bcm1. Gas production growth was mainly driven by the start-up of the
second stage of Novy-Urengoy gas processing plant at Rospan in the fourth quarter of 2015, by launch of the three
wells at the Northern tip of Chayvo on Sakhalin island in 2015 and in 2016, by commissioning of gas processing plant
at Purneftegas’s Barsukovsky field in December 2015 and the project development at the Khadiryakhinsksoe field in
Sibneftegaz.
In the fourth quarter of 2016 gas production was 17.77 bcm2. Gas production growth compared with the third
quarter of 2016 was mainly due to increased gas production at the fields of Sibneftegaz, Purneftegas and the Northern
Tip of Chaivo after planned maintenance in the third quarter of 2016 and due to seasonal increase in demand in
autumn-winter period.
The level of utilization of associated petroleum gas (“APG”) increased up to 90.0% in the twelve months of
2016 compared to 87.9% in the same period of 2015.
Financial indicators
Equity share in financial resultsof upstream associates and joint ventures
The equity share in financial results of upstream associates and joint ventures was RUB 7 billion in the fourth
quarter of 2016 due to positive dynamics of JV income.
The equity share in financial results of upstream associates and joint ventures was RUB 17 billion and
RUB 2 billion of profit in 2016 and 2015, respectively.
1Excluding the effect from the acquisition of Bashneft assets gas production in 2016 was 66.92 bcm.
2Excluding the effect from the acquisition of Bashneft assets gas production in the fourth quarter of 2016 was 17.59 bcm.

19
Upstream production and operating expenses
Upstream production and operating expenses include materials and supplies, equipment maintenance and
repairs, wages and salaries, activities to enhance oil and gas recovery, procurement of fuel and lubricants, electricity
and other costs of Rosneft consolidated exploration and production units.
Upstream production and operating expenses amounted to RUB 89.4 billion (or 180 RUB/boe) in the fourth
quarter of 2016.Net of the effect of acquisition of new assets upstream production and operating expenses were
RUB 77.5 billion (170 RUB/boe or increase by 3.7%) and increased by 6.3% in the fourth quarter of 2016 compared
with RUB 72.9 billion the third quarter of 2016. The increase was mainly due to scheduled increase in workovers and
growth of electricity tariffs.
Excluding the effect of acquisition of new assets in the twelve months of 2016, upstream production and
operating expenses increased by 4.8% and amounted to RUB 291.0 billion (or 163 RUB/boe, an increase by 2.5% per
boe) compared to RUB 277.6 billion (159 RUB/boe) in the twelve months of 2015 that is mainly due to the growth of
electricity expenses compensated by decrease in workovers and power-generation facilities maintenance expenses.
Exploration Expenses
Exploration expenses mainly relate to exploratory drilling, seismic and other geological and geophysical
works. Exploratory drilling costs are generally capitalized if commercial reserves of crude oil and gas are discovered
or expensed in the current period in the event of unsuccessful exploration results.
In the fourth quarter of 2016 exploration expenses amounted to RUB 4 billion. Excluding the effect of
acquisition of Bashneft assets exploration expenses did not change in comparison with the third quarter of 2016 and
amounted to RUB 3 billion. Excluding the effect of acquisition of new assets exploration expenses amounted to
RUB 13 billion in 2016 and remained at the level of 2015.
Mineral extraction tax
The amount of mineral extraction tax was RUB 313 billion in the fourth quarter of 2016 compared to
RUB 262 billion in the third quarter of 2016. Excluding the effect of acquisition of Bashneft assets, the growth of
MET expense amounted to RUB 286 billion mainly due to MET rate growth by 11.1% for the period.
The following table sets actual mineral extraction tax rates for the periods analysed:
For 3 months ended
change
%
For 12 months
ended December 31, change
% December 31,
2016
September 30,
2016 2016 2015
(thousand RUB per tonne, except %)
Average enacted oil mineral extraction tax rate 6.78 6.10 11.1% 5.78 6.31 (8.4)% Actual mineral extraction tax expense per tonne of
oil produced 5.72 5.41 5.7% 5.06 5.69 (11.1)%
Actual mineral extraction tax expense per tonne of oil equivalent produced* 4.74 4.40 7.7% 4.15 4.62 (10.2)%
(RUB per thousand cubic metres, except %)
Аverage actual gas extraction tax rate 534 531 0.6% 535 520 2.9%
*Including consolidated oil and gas volumes.
The actual mineral extraction tax rate is lower than generally established tax rates for the analyzed periods
primarily due to tax exemptions which are active in the form of reduced rates at particular fields, zero rates and
reduced extraction tax rate by “Dm” coefficient which characterizes complexity of crude oil production at a particular
oil field according to the Russian tax legislation (See section: “Mineral extraction tax”).

20
Downstream Operating Results
The segment includes Group companies that provide services for oil and gas processing, petrochemical
production in Russia and abroad, joint ventures, sales units of oil, gas and petroleum products to counterparties in
Russia and abroad. The segment includes revenue generated from the sale of oil, gas, petrochemical products and
petroleum products to third parties, and all operating costs associated with processing, trading and logistics. The
results set in the table below include the acquisition of Bashneft assets in October 2016.
For 3 months ended
%
change
For 12 months ended
December 31,
%
change
December, 31
2016
September 30,
2016 2016 2015
Operational results, mln tonne
Crude oil processing at refineries 30.37 24.83 22.3% 100.26 96.90 3.5%
Processing at Company’s own refineries in Russia 25.01 19.61 27.5% 79.95 77.07 3.7%
Processing at Company’s own refineries outside Russia 3.25 3.28 (0.9)% 12.72 10.80 17.8%
Processing at Associates’ refineries 2.11 1.94 8.8% 7.59 9.03 (15.9)%
Financial results, RUB billion
EBITDA 51 43 18.6% 150 256 (41.4)%
Capital expenditures of refineries* 31 13 >100% 65 108 (39.8)%
Operating expenses of processing in Russia 31.91 18.68 70.8% 88.32 77.08 14.6%
Operating expenses of processing outside Russia 7.41 6.84 8.3% 31.42 28.48 10.3%
Indicators per tonne of the output**
EBITDA, RUB per tonne 1,805 1,879 (3.9)% 1,619 2,913 (44.4)%
Capital expenditure of refineries, RUB per tonne 1,097 568 93.1% 701 1,229 (43.0)%
Operating expenses for processing in Russia, RUB per
tonne 1,277 953 34.0% 1,105 1,000 10.5% Operating expenses for processing outside Russia, RUB
per tonne 2,277 2,089 9.0% 2,469 2,638 (6.4)% *Refer to “Capital expenditures”. **Calculated from unrounded data.
Downstream EBITDA
For 3 months ended %
change
For12 months ended December 31, %
change
December 31,
2016
September 30,
2016 2016 2015
RUB billion RUB billion
Revenues and equity share in profits
of associates and joint ventures 1,324 1,237 7.0% 4,844 5,152 (6.0)% Including equity share in profits of associates and
joint ventures 3 1 >100% 8 6 33.3%
Expenses net of depreciation 1,275 1,194 6.8% 4,696 4,896 (4.1)%
including
Operating expenses at refineries, cost of additives
and materials procured for processing 38 37 2.7% 153 160 (4.4)% Operating expenses of retail companies 11 11 − 43 42 2.4%
Cost of purchased oil, gas, petroleum products and
refining costs including intersegment turnover 846 754 12.2% 3,063 3,031 1.1% Administrative expenses including doubtful debt
allowances 10 8 25.0% 34 47 (27.7)%
Pipeline tariffs and transportation costs and other costs 139 136 2.2% 547 524 4.4%
Taxes other than income tax 53 59 (10.2)% 208 124 67.7%
Export customs duty 183 184 (0.5)% 641 925 (30.7)% Effect from intragroup balance change and others (5) 5 − 7 14 (50.0)%
Amendments to costs 2015-2014 − − − − 29 −
Effect of acquisition of new assets 2 − − 2 − −
EBITDA* 51 43 18.6% 150 256 (41.4)%
*Calculated from unrounded data.

21
Operating indicators
Petroleum Product Output
Rosneft processes produced and procured crude oil at its refineries: the Tuapse refinery on the Black Sea coast
in the South of Russia, the Komsomolsk refinery in the Russian Far East, the Achinsk and Angarsk refineries in
Eastern Siberia, the Kuibyshev, Novokuibyshevsk and Syzran refineries in the Samara region, the Saratov refinery and
the Ryazan refinery (the European part of Russia) and others. Rosneft also owns processing crude oil in Belarus, and
until 31 December 2016 the Company owned production capacity at four Ruhr Oel GmbH (ROG) refineries in
Germany. Starting from March 2015 the Novokuibyshevsk petrochemical refinery results are included in petroleum
product output volumes as well as acquired additional share in PCK Raffinerie GmbH starting from December 2015.
At the end of December 2016 the Company completed the restructuring of foreign refining assets of Ruhr Oel GmbH
in Germany. Starting from October 2016 crude oil processing at Bashneft refineries is incorporated in the oil
processing of Rosneft group.
The following table sets forth Rosneft’s crude oil processing and petroleum product output volumes including
the effect of acquisition of new Bashneft assets in October 2016:
For 3 months ended
%
change
For 12 months ended
December 31, %
change
December 31,
2016
September30,
2016 2016 2015
mln of tonnes mln of tonnes
Crude oil processing at refineries in Russia1 22.23 21.55 3.2% 82.65 84.70 (2.4)%
Effect of acquisition of new assets 4.82 − − 4.82 − −
Crude oil processing at refineries outside Russia 3.32 3.28 1.2% 12.79 12.20 4.8% including crude oil processing at Ruhr Oel GmbH
(ROG)2,3 3.25 3.28 (0.9)% 12.72 10.80 17.8%
including crude oil processing in Belarus 0.07 − − 0.07 1.40 (95.0)%
Total Group crude oil processing 30.37 24.83 22.3% 100.26 96.90 3.5%
Petroleum product output:
High octane gasoline 2.99 2.97 0.7% 11.55 11.10 4.1% Low octane gasoline 0.03 0.04 (25.0)% 0.13 0.16 (18.8)%
Naphtha 1.58 1.51 4.6% 5.79 5.58 3.8%
Diesel 6.88 6.70 2.7% 25.65 26.26 (2.3)% Fuel oil 5.95 5.26 13.1% 21.98 26.62 (17.4)%
Jet fuel 0.72 0.93 (22.6)% 3.04 3.12 (2.6)%
Petrochemicals 0.24 0.18 33.3% 0.69 0.95 (27.4)% Other 3.13 3.35 (6.6)% 11.61 9.12 27.3%
Product output at Rosneft’s refineries in Russia 21.52 20.94 2.8% 80.44 82.91 (3.0)% Effect of acquisition of new assets 4.31 − 100.0% 4.31 − 100.0% Product output at refineries outside Russia 3.43 3.44 (0.3)% 13.46 12.45 8.1% including crude oil output at Ruhr Oel GmbH (ROG) 3.37 3.44 (2.0)% 13.40 11.15 20.2%
including product output in Belarus 0.06 − − 0.06 1.30 (95.4)%
Total Group product output 29.26 24.38 20.0% 98.21 95.36 3.0% 1Including processing at YaNOS refinery 2Excluding additives obtained for processing 3Including share in PCK Raffinerie GmbH.
In the fourth quarter of 2016 Rosneft’s total refinery throughput in Russia net of the effect of acquisition of
new assets amounted to 22.23 mln tonnes, an increase of 3.2% compared to the third quarter of 2016. This is mainly
due to the optimization of utilization rate at refineries in terms of the price changes.
In the twelve months of 2016 crude oil processing volume net of the effect of acquisition of new assets was
2.4% lower compared with the twelve months of 2015. In terms of negative price effect of 2016, the refinery
utilisation rate was strongly managed to obtain maximum effectiveness from crude oil processing.
In the fourth quarter of 2016, processing volume at the German refineries slightly decreased compared to the
third quarter of 2016 due to scheduled turnarounds. The processing volume at the German refineries in the twelve
months of 2016 increased by 17.8% compared with the same period of 2015 due to the acquisition of additional share
in PCK Raffinerie GmbH in November 2015.

22
Financial indicators
Revenues and equity share in profits of associates and joint ventures*
In the fourth quarter of 2016 revenues and equity share in profits of associates and joint ventures amounted to
RUB 1,485 billion. Revenues and equity share in profits of associates and joint ventures net of the effect of acquisition
of Bashneft assets amounted to RUB 1,317 billion in comparison with RUB 1,223 billion in the third quarter of 2016.
Increase in revenues in the fourth quarter of 2016 is mainly due to market price growth.
In 2016, revenues and equity share in profits of associates and joint ventures amounted to RUB 4,988 billion.
Net of the effect of the acquisition of Bashneft assets, the revenues amounted to RUB 4,820 billion in comparison with
RUB 5,150 billion in 2015.
The table below presents revenues from sales of crude oil, gas, petroleum and petrochemical products and
other revenues in billions of RUB**
:
For 3 months ended
%
change
For 12 months ended December 31,
%
change
December 31,
2016
September 30,
2016 2016 2015
% of
revenue
% of
revenue
% of
revenue
% of
revenue
RUB billion, except %
Crude oil
International Sales to non-CIS 568 38.3% 490 40.0% 15.9% 1,977 39.6% 2,111 40.9% (6.3)%
Europe and other directions 335 22.6% 280 22.8% 19.6% 1,128 22.6% 1,232 23.8% (8.4)%
Asia 233 15.7% 210 17.2% 11.0% 849 17.0% 879 17.1% (3.4)%
International sales to CIS 23 1.5% 22 1.8% 4.5% 118 2.4% 135 2.6% (12.6)%
Domestic sales 24 1.6% 18 1.5% 33.3% 82 1.6% 79 1.5% 3.8%
Total crude oil 615 41.4% 530 43.3% 16.0% 2,177 43.6% 2,325 45.0% (6.4)%
Gas 60 4.0% 46 3.8% 30.4% 214 4.3% 188 3.7% 13.8%
Petroleum products
International Sales to non-CIS 404 27.3% 318 26.0% 27.0% 1,309 26.3% 1,426 27.8% (8.2)%
Europe and other directions 307 20.8% 236 19.3% 30.1% 984 19.8% 1,099 21.5% (10.5)%
Asia 97 6.5% 82 6.7% 18.3% 325 6.5% 327 6.3% (0.6)%
International Sales to CIS 27 1.8% 20 1.6% 35.0% 65 1.3% 64 1.2% 1.6%
Domestic sales 297 20.0% 251 20.5% 18.3% 963 19.3% 875 17.0% 10.1%
Wholesale 177 11.9% 142 11.6% 24.6% 545 10.9% 475 9.2% 14.7%
Retail 120 8.1% 109 8.9% 10.1% 418 8.4% 400 7.8% 4.5%
Sales of bunker fuel to end-users 11 0.7% 12 1.0% (8.3)% 36 0.7% 52 1.0% (30.8)%
Total petroleum products 739 49.8% 601 49.1% 23.0% 2,373 47.6% 2,417 47.0% (1.8)%
Sales of LNG 2 0.1% − − − 3 0.1% − − −
Petrochemical products 40 2.7% 27 2.2% 48.1% 120 2.4% 115 2.2% 4.3%
International sales 28 1.9% 21 1.7% 33.3% 96 1.9% 95 1.8% 1.1%
Domestic sales 12 0.8% 6 0.5% 100.0% 24 0.5% 20 0.4% 20.0%
Amendments to sales 2015-20141 − − − − − − − 26 0.5% −
Sales of petroleum products,
petrochemicals and LNG 781 52.6% 628 51.3% 24.4% 2,496 50.1% 2,558 49.7% (2.4)%
Support services and other
revenues 19 1.3% 18 1.5% 5.6% 75 1.5% 70 1.4% 7.1%
Equity share in profits of associates
and joint ventures 10 0.7% 1 0.1% >100% 26 0.5% 9 0.2% >100%
Total revenues and equity share in
profits of associates and joint
ventures
1,485 100.0% 1,223 100.0% 21.4% 4,988 100.0% 5,150 100.0% (3.1)%
* Under IFRS consolidated financial statements. **The difference between percentages presented in the above table and other section is a result of rounding. 1Amendments to sales and costs 2015-2014 are disclosed on gross basis with net impact of RUB (3.2) billion for the reporting period. In view of
updating of invoices issued previously necessary amendments were made in the accounting records.

23
Sales Volumes
The table below analyses crude oil, gas, petroleum and petrochemical product sales volumes:
For 3 months ended
%
change
For 12 months ended December 31,
%
change
December 31,
2016
September 30,
2016 2016 2015
mln
bbl
% of
total
volume
mln
bbl
% of
total
volume
mln
bbl
% of
total
volume
mln
bbl
% of
total
volume
Crude oil
International Sales to non-CIS 208.1 45.9% 188.1 47.6% 10.6% 791.5 47.9% 741.1 47.3% 6.8%
Europe and other directions 125.9 27.8% 111.1 28.1% 13.3% 472.4 28.5% 447.2 28.6% 5.6%
Asia 82.2 18.1% 77.0 19.5% 6.8% 319.1 19.4% 293.9 18.7% 8.6%
International Sales to CIS 10.3 2.3% 11.9 3.0% (13.4)% 59.2 3.6% 66.6 4.2% (11.1)%
Domestic 11.8 2.6% 9.7 2.4% 21.6% 42.2 2.6% 40.0 2.5% 5.5%
Total crude oil 230.2 50.8% 209.7 53.0% 9.8% 892.9 54.1% 847.7 54.0% 5.3%
Crude oil
mln
tonnes
mln
tonnes
mln
tonnes
mln
tonnes
International Sales to non-CIS 28.1 45.9% 25.4 47.6% 10.6% 106.9 47.9% 100.1 47.3% 6.8%
Europe and other directions 17.0 27.8% 15.0 28.1% 13.3% 63.8 28.5% 60.4 28.6% 5.6%
Asia 11.1 18.1% 10.4 19.5% 6.7% 43.1 19.4% 39.7 18.7% 8.6%
International Sales to CIS 1.4 2.3% 1.6 3.0% (12.5)% 8.0 3.6% 9.0 4.2% (11.1)%
Domestic sales 1.6 2.6% 1.3 2.4% 23.1% 5.7 2.6% 5.4 2.5% 5.5%
Total crude oil 31.1 50.8% 28.3 53.0% 9.9% 120.6 54.1% 114.5 54.0% 5.3%
Petroleum products
International Sales to non-CIS 17.3 28.3% 14.5 27.1% 19.3% 61.1 27.4% 59.5 28.2% 2.7%
Europe and other directions 12.7 20.8% 10.8 20.2% 17.6% 45.9 20.6% 46.3 22.0% (0.9)%
Asia 4.6 7.5% 3.7 6.9% 24.3% 15.2 6.8% 13.2 6.2% 15.2%
International Sales to CIS 1.0 1.6% 0.9 1.7% 11.1% 2.6 1.2% 2.0 0.9% 30.0%
Domestic sales 10.1 16.5% 8.2 15.4% 23.2% 32.8 14.7% 29.7 14.0% 10.4%
Wholesale 7.0 11.4% 5.4 10.2% 29.6% 21.9 9.8% 18.8 8.9% 16.5%
Retail 3.1 5.1% 2.8 5.2% 10.7% 10.9 4.9% 10.9 5.1% 0.0%
Sales of bunker fuel to end-users 0.5 0.8% 0.7 1.3% (28.6)% 1.9 0.9% 3.0 1.4% (36.7)%
Total petroleum products 28.9 47.2% 24.3 45.5% 18.9% 98.4 44.2% 94.2 44.5% 4.5%
Sales of LNG 0.1 0.2% − − − 0.2 0.1% − − −
Petrochemical products 1.1 1.8% 0.8 1.5% 37.5% 3.5 1.6% 3.2 1.5% 9.4%
International sales 0.7 1.1% 0.5 0.9% 40.0% 2.4 1.1% 2.2 1.0% 9.1%
Domestic sales 0.4 0.7% 0.3 0.6% 33.3% 1.1 0.5% 1.0 0.5% 10.0%
Total crude oil and products, LNG 61.2 100.0% 53.4 100.0% 14.6% 222.5 100.0% 211.9 100.0% 5.0%
Gas bcm bcm bcm bcm
Sales Volumes 18.03 14.57 23.7% 65.00 58.68 10.8%

24
Average Sales Prices
The following table sets forth Rosneft’s average export and domestic prices of crude oil, gas, petroleum
products and petrochemical products (the average sales prices may differ from official market prices provided by
specialized agencies due to different quality of products and sales terms) 1:
For 3 months ended
%
change
For 12 months ended
December 31,
%
change
December 31,
2016
September 30,
2016 2016 2015
(th.RUB/
barrel)
(th.RUB/
tonne)
(th.RUB/
barrel)
(th.RUB/
tonne)
(th.RUB/
barrel)
(th.RUB/
tonne)
(th.RUB/
barrel)
(th.RUB/
tonne)
Average prices on foreign markets
Crude oil, non-CIS 2.93 21.7 2.76 20.5 5.9% 2.68 19.9 3.01 22.3 (10.8)%
Europe and other directions2 2.84 21.1 2.71 20.1 5.0% 2.61 19.3 2.96 21.9 (11.9)%
Asia2 3.07 22.7 2.85 21.1 7.6% 2.81 20.8 3.14 23.3 (10.7)%
Crude oill, CIS 2.14 15.8 1.97 14.6 8.2% 1.98 14.7 2.01 14.9 (1.3)%
Petroleum products, non- CIS 23.8 21.8 9.2% 21.6 24.0 (10.0)%
Europe and other directions 24.5 21.7 12.9% 21.6 23.8 (9.2)%
Asia 21.9 22.1 (0.9)% 21.7 24.8 (12.5)%
Petroleum products, CIS 25.6 24.1 6.2% 24.8 32.5 (23.7)%
Sales of LNG 20.2 − − 20.0 − −
Petrochemical products 38.5 39.1 (1.5)% 39.3 42.8 (8.2)%
Average domestic prices
Crude oil 2.1 15.4 1.89 14.0 10.0% 1.94 14.4 2.00 14.8 (2.7)%
Petroleum products 29.4 30.5 (3.6)% 29.4 29.5 (0.3)%
Wholesale 25.4 26.2 (3.1)% 24.9 25.3 (1.6)%
Retail 38.3 38.9 (1.5)% 38.3 36.7 4.4%
Gas (the RUB./the cubic meter) 3
3.32 3.11 6.8% 3.24 3.17 2.2%
Petrochemical products4 29.2 20.2 44.6%4 22.3 19.3 15.5%
Sales of bunker fuel to end-users 20.2 18.4 9.8% 18.5 17.1 8.2%
1Average price is calculated from unrounded figures.
2Price excludes revenues under prepaid long-term crude oil supply contracts and revenues from crude oil sales to Transneft (RUB 26 billion and
RUB 22 billion, in the fourth and in the third quarters of 2016;RUB 97 billion and RUB 75 billion in the twelve months of 2016 and 2015, respectively). 3Including gas sales outside Russian Federation average gas prices were 3.37 th.RUB./th. cubic meter in the 4thquarter of 2016 and
3.16 th.RUB./th. cubic meter in the third quarter of 2016 and 3.30 th.RUB./th. cubic meter in the twelve months of 2016 and
3.20 th.RUB./th. cubic meter in the twelve months of 2015. 4Product structure of Bashneft assets integrated in the 4thquarter2016 influenced price growth.
International Crude Oil Sales to non-CIS
Revenues from international crude oil sales to non-CIS countries in the fourth quarter of 2016 amounted to
RUB 568 billion. In the fourth quarter of 2016, net of the effect of acquisition of new assets the revenues increased up
to RUB 524 billion compared to RUB 490 billion in the third quarter of 2016. Revenue increase was due to upturn in
sales volumes by 5.9% (favourable impact on revenue of RUB 30 billion) and was accompanied by increase in sales
volume by 2.0% or RUB 12 billion.
In the twelve months of 2016 revenues from international crude oil sales to non-CIS countries net of the effect
of acquisition of new assets decreased by 8.4% and amounted to RUB 1,933 billion compared with the same period of
2015. Average sales price downturn by 10.8% (negative impact on revenue of RUB 242 billion) was partially offset by
increase in sales volume by 4.6% (favourable impact on revenue of RUB 102 billion).
International Crude Oil Sales to CIS
Revenue from sales of crude oil to CIS in the fourth quarter of 2016 amounted to RUB 23 billion. In the
fourth quarter of 2016, net of the effect of acquisition of new assets the revenues decreased to RUB 21 billion
compared to RUB 22 billion in the third quarter of 2016.The decrease was mainly caused by decline of sales volume
by 19.3% (negative impact on revenue of RUB 4 billion) which was partially offset by growth of average sales price of
8.2% (favourable impact on revenues of RUB 3 billion).
In the twelve months of 2016 revenues from international crude oil sales to CIS countries, net of the effect of
acquisition of new assets, amounted to RUB 116 billion.
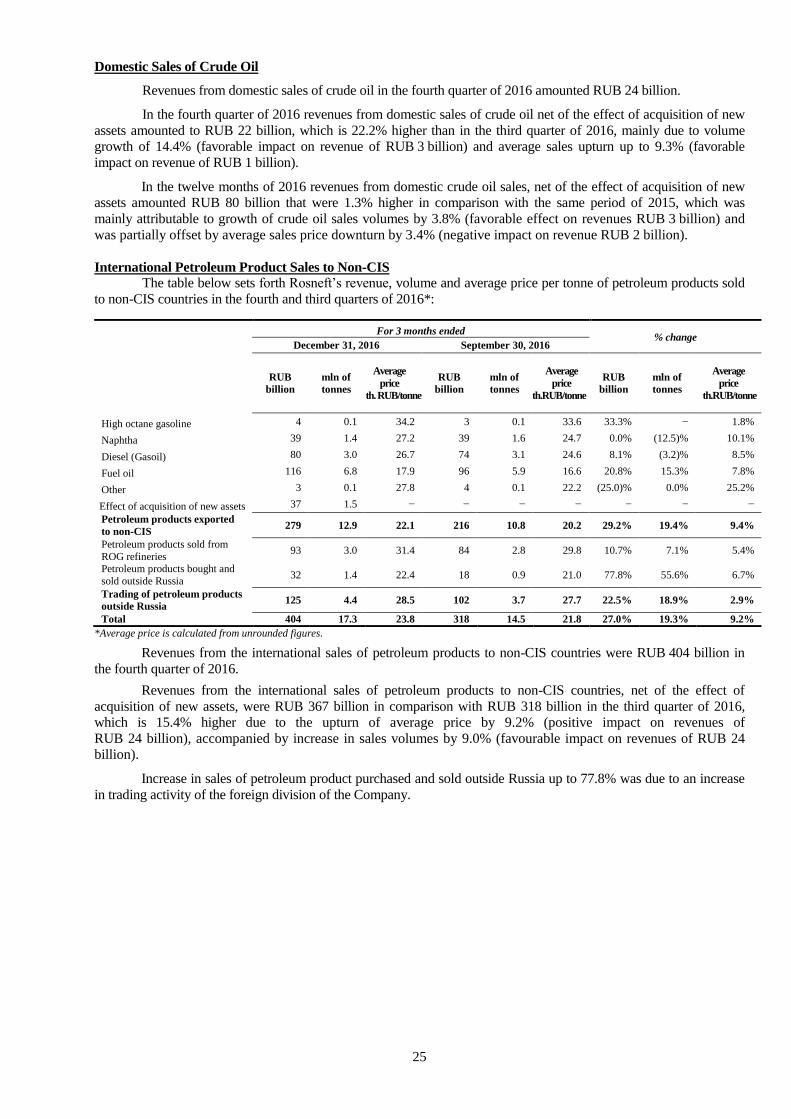
25
Domestic Sales of Crude Oil
Revenues from domestic sales of crude oil in the fourth quarter of 2016 amounted RUB 24 billion.
In the fourth quarter of 2016 revenues from domestic sales of crude oil net of the effect of acquisition of new
assets amounted to RUB 22 billion, which is 22.2% higher than in the third quarter of 2016, mainly due to volume
growth of 14.4% (favorable impact on revenue of RUB 3 billion) and average sales upturn up to 9.3% (favorable
impact on revenue of RUB 1 billion).
In the twelve months of 2016 revenues from domestic crude oil sales, net of the effect of acquisition of new
assets amounted RUB 80 billion that were 1.3% higher in comparison with the same period of 2015, which was
mainly attributable to growth of crude oil sales volumes by 3.8% (favorable effect on revenues RUB 3 billion) and
was partially offset by average sales price downturn by 3.4% (negative impact on revenue RUB 2 billion).
International Petroleum Product Sales to Non-CIS The table below sets forth Rosneft’s revenue, volume and average price per tonne of petroleum products sold
to non-CIS countries in the fourth and third quarters of 2016*:
*Average price is calculated from unrounded figures.
Revenues from the international sales of petroleum products to non-CIS countries were RUB 404 billion in
the fourth quarter of 2016.
Revenues from the international sales of petroleum products to non-CIS countries, net of the effect of
acquisition of new assets, were RUB 367 billion in comparison with RUB 318 billion in the third quarter of 2016,
which is 15.4% higher due to the upturn of average price by 9.2% (positive impact on revenues of
RUB 24 billion), accompanied by increase in sales volumes by 9.0% (favourable impact on revenues of RUB 24
billion).
Increase in sales of petroleum product purchased and sold outside Russia up to 77.8% was due to an increase
in trading activity of the foreign division of the Company.
For 3 months ended % change
December 31, 2016 September 30, 2016
RUB
billion
mln of
tonnes
Average
price
th. RUB/tonne
RUB
billion
mln of
tonnes
Average
price
th.RUB/tonne
RUB
billion
mln of
tonnes
Average
price
th.RUB/tonne
High octane gasoline 4 0.1 34.2 3 0.1 33.6 33.3% − 1.8%
Naphtha 39 1.4 27.2 39 1.6 24.7 0.0% (12.5)% 10.1%
Diesel (Gasoil) 80 3.0 26.7 74 3.1 24.6 8.1% (3.2)% 8.5%
Fuel oil 116 6.8 17.9 96 5.9 16.6 20.8% 15.3% 7.8%
Other 3 0.1 27.8 4 0.1 22.2 (25.0)% 0.0% 25.2%
Effect of acquisition of new assets 37 1.5 − − − − − − −
Petroleum products exported
to non-CIS 279 12.9 22.1 216 10.8 20.2 29.2% 19.4% 9.4%
Petroleum products sold from
ROG refineries 93 3.0 31.4 84 2.8 29.8 10.7% 7.1% 5.4%
Petroleum products bought and
sold outside Russia 32 1.4 22.4 18 0.9 21.0 77.8% 55.6% 6.7%
Trading of petroleum products
outside Russia 125 4.4 28.5 102 3.7 27.7 22.5% 18.9% 2.9%
Total 404 17.3 23.8 318 14.5 21.8 27.0% 19.3% 9.2%

26
The table below sets forth Rosneft’s revenues, volume and average price per tonne of petroleum products sold to non-
CIS countries in the twelve months of 2016 and 2015*: For 12 months ended December 31,
% change 2016 2015
RUB
billion
million of
tonnes
Average
price
th.RUB/
tonne
RUB
billion
million of
tonnes
Average
Price
th.RUB/
tonne
RUB
billion
million of
tonnes
Average
price
th.RUB/
tonne
High octane gasoline 13 0.4 33.4 17 0.5 36.5 (23.5)% (20.0)% (8.5)%
Naphtha 146 5.7 25.4 151 5.5 27.6 (3.3)% 3.6% (8.0)%
Diesel (Gasoil) 307 12.6 24.4 432 14.8 29.1 (28.9)% (14.9)% (16.2)%
Fuel oil 374 24.9 15.3 475 26.9 17.6 (21.3)% (7.4)% (13.1)%
Other 17 0.7 23.5 25 1.0 25.7 (32.0)% (30.0)% (8.6)%
Effect of acquisition of new assets 37 1.5 − − − − − − −
Petroleum products exported to non-
CIS 894 45.8 19.7 1,100 48.7 22.6 (18.7)% (6.0)% (12.8)%
Petroleum products sold from ROG
refineries 328 11.1 29.6 278 9.1 30.6 18.0% 22.0% (3.3)%
Petroleum product purchased and sold outside Russia
87 4.2 20.9 48 1.7 28.9 81.3% >100% (27.7)%
Trading of petroleum products
outside Russia 415 15.3 27.2 326 10.8 30.4 27.3% 41.7% (10.5)%
Total 1,309 61.1 21.6 1,426 59.5 24.0 (8.2)% 2.7% (10.0)%
*Average price is calculated from unrounded figures.
In the twelve months of 2016 revenues from sales of petroleum products to non-CIS countries amounted to
RUB 1,309 billion that were 8.2% lower than in the same period of 2015.
Net of the effect of acquisition of new assets revenues from sales of petroleum products to non-CIS countries
were 10.8 % lower compared with the same period of 2015 and amounted to RUB 1,272 billion mainly due to average
price downturn by 10.0% (unfavourable impact on revenues of RUB 157 billion).
Increase in sales of petroleum product purchased and sold outside Russia up to 81.3% due to an increase in
trading activity of the foreign division of the Company.
International Petroleum Product Sales to CIS
Revenues from sales of petroleum products to CIS countries were RUB 27 billion in the fourth quarter of
2016. Net of the effect of acquisition of new assets, revenues from sales of petroleum products to CIS countries
were 25.0% higher compared with the third quarter of 2016 mainly due to average price upturn by 6.6% (favourable
effect on revenues of RUB 2 billion) and was accompanied by slightly increase in sales volumes (favourable impact
on revenues of RUB 3 billion).
Net of the effect of acquisition of new assets, revenues from sales of petroleum products to CIS countries in
the twelve months of 2016 were RUB 63 billion or 1.6% (RUB 1 billion) lower than in the same period of 2015 due
to average price downturn by 23.7% (negative impact on revenues of RUB 20 billion), that was partially offset by
increase in petroleum products sales volumes by 25.0% (favourable effect on revenues of RUB 19 billion).
Domestic Sales of Petroleum Products
The table below sets forth Rosneft’s revenue, volume and average price per tonne of petroleum products
sold in Russian the fourth and third quarters of 2016*:
For 3 months ended % change
December 31, 2016 September 30, 2016
RUB
billion
mln of
tonnes
Average
price th.
RUB/
tonne
RUB
billion
mln of
tonnes
Average
price th.
RUB/
tonne
RUB
billion
mln of
tonnes
Average
price th.
RUB/
tonne
High octane gasoline 110 2.9 38.7 122 3.1 39.5 (9.8)% (6.5)% (2.0)%
Diesel (Gasoil) 77 2.4 32.3 87 2.8 31.2 (11.5)% (14.3)% 3.5% Fuel oil 6 0.5 11.0 2 0.2 7.8 >100.0% >100.0% 41.0%
Jet fuel 22 0.7 29.3 25 0.9 28.2 (12.0)% (22.2)% 3.9%
Other 14 1.0 14.1 15 1.2 12.4 (6.7)% (16.7)% 13.7% Effect of the acquisition of new assets 68 2.6 − − − − − − −
Total 297 10.1 29.4 251 8.2 30.5 18.3% 23.2% (3.6)%
*Average price is calculated from unrounded figures.
Revenues from sales of petroleum products on the domestic market were RUB 297 billion in the fourth
quarter of 2016.

27
Net of the effect of acquisition of new assets, revenues from sales of petroleum products on the domestic
market were RUB 229 billion, or by 8.8% lower, compared with the third quarter of 2016, which was mainly due to
decrease in petroleum products sales volume of 8.5% (unfavourable effect on revenue of RUB 23 billion), partially
offset by 0.3% upturn of average sales price (positive effect on revenue of RUB 1 billion).
The table below sets forth Rosneft’s revenue, volume and average price per tonne of petroleum products
sold in Russian the twelve months of 2016 and 2015*: For 12 months ended December 31,
% change 2016 2015
RUB
billion
million of
tonnes
Average
price
th.RUB/
tonne
RUB
billion
million of
tonnes
Average
price
th.RUB/
tonne
RUB
billion
million of
tonnes
Average
price
th.RUB/
tonne
High octane gasoline 444 11.7 38.1 423 11.6 36.4 5.0% 0.9% 4.7%
Diesel (Gasoil) 306 10.0 30.7 297 9.6 31.0 3.0% 4.2% (1.0)%
Fuel oil 12 1.6 7.3 14 1.7 8.0 (14.3)% (5.9)% (8.8)%
Jet fuel 85 3.0 27.9 94 3.2 29.2 (9.6)% (6.3)% (4.5)%
Other 48 3.9 12.5 47 3.6 13.4 2.1% 8.3% (6.7)% Effect of the acquisition of new assets 68 2.6 − − − − − − −
Total 963 32.8 29.4 875 29.7 29.5 10.1% 10.4% (0.3)%
*Average price is calculated from unrounded figures.
Net of the effect of acquisition of new assets revenues from sales of petroleum products on the domestic
market in the twelve months of 2016 were 2.3% higher compared to the same period of 2015 and amounted RUB
895 billion. The increase was due to sales volume growth of 1.7% (favourable effect on revenue of RUB 15 billion)
and average sales price growth of 0.7% (favourable effect on revenue of RUB 5 billion).
Sales of LNG
Since May 2016, the Company supplies LNG under a contract with the Egyptian Natural Gas Holding
Company, concluded in August of 2015. Sales volumes for year 2016 amounted to 0.174 mln tonnes
(RUB 3 billion).
Sales of bunker fuel
The Company sells bunker fuel (fuel oil, low-viscosity marine fuel and diesel fuel) in the seaports (the Far
East, the North, the North West and South of the European part of Russia) and river ports (the Volga-Don basin and
in the rivers of Western Siberia) of the Russian Federation and in the ports outside the Russian Federation.
Revenues from sales of bunker fuel in the fourth quarter of 2016 were RUB 11 billion, and decrease by
9.1% in comparison with the third quarter of 2016, which is mainly attributed to decrease in sales volumes by
28.6% (negative impact on revenue of RUB 3 billion) due to seasonal factor and was partially offset by growth of
average sales price by 9.8% (positive impact on revenue of RUB 2 billion).
Revenues from sales of bunker fuel in the twelve months of 2016 decreased by 30.8% or RUB 16 billion in
comparison with the same period of 2015 due to decrease in sales volumes by 36.7% (negative effect on revenue of
RUB 19 billion), considering the fact that the redirection of resources from exports in favor of bunkering took place
in 2015 and was partially offset by average sales price upturn by 8.2% or RUB 3 billion.
Petrochemical Product Sales
Revenues from sales of petrochemical products in the fourth quarter of 2016 amounted to RUB 40 billion
(1.1 mln tonnes).
Petrochemical product sales volumes from Ruhr Oel GmbH (ROG) amounted to 0.46 mln tonnes in the
fourth quarter of 2016 that is lower by 0.6%1in comparison with the third quarter of 2016.
Petrochemical product sales volumes in the twelve months of 2016 from Ruhr Oil GmbH (ROG) slightly
decreased by 2.0% (calculated from unrounded figures) and amounted to 1.90 mln tones compared with the same
period of 2015.
Gas Sales
The Company strategy envisages gas business expansion on the Russian gas domestic market. In order to
increase its share on the gas domestic market Rosneft implements gas program aimed at diversification of trading
channels and building of long-term contracts portfolio.
1Calculated based on unrounded data.

28
The table below sets forth revenues, volumes and average price of gas sales by Rosneft*:
For 3 months ended %
change
For 12 months ended
December 31, %
change
December 31,
2016
September 30,
2016 2016 2015
(RUB billion)
(RUB billion)
Revenue
In the Russian Federation 59.4 44.7 32.9% 208.0 184.0 13.0%
Outside the Russian Federation 1.4 1.3 7.7% 6.4 3.8 68.4%
Total 60.8 46.0 32.2% 214.4 187.8 14.2%
Sales volumes (bcm) (bcm)
In the Russian Federation 17.86 14.40 24.0% 64.19 58.03 10.6%
Outside the Russian Federation 0.17 0.17 − 0.81 0.65 24.6%
Total 18.03 14.57 23.7% 65.00 58.68 10.8%
Average price
(th. RUB/th. of cubic
metres)
(th. RUB/th. of cubic
metres)
In the Russian Federation 3.32 3.11 6.8% 3.24 3.17 2.2%
Outside the Russian Federation 8.07 7.36 9.6% 7.82 5.88 33.0%
Total 3.37 3.16 6.6% 3.30 3.20 3.1%
*Average price is calculated from unrounded figures.
In the fourth quarter of 2016 revenues from gas sales increased in comparison with the third quarter of
2016 and amounted to RUB 59.4 billion due to average price downturn in Russia, mainly attributable to growth of
gas sales volume by 24.0% due to seasonal factor.
Gas volumes growth of 10.8% (positive effect on revenue of RUB 20 billion) in the twelve months of 2016
compared with the same period 2015 and average price upturn of 3.1% (positive impact on revenues of
RUB 6 billion) contributed to gas sales growth by 14.2% compared with the same period of 2015.
Volumes of gas sales outside the Russian Federation increased by 24.6% in the twelve months of 2016
compared with the same period of 2015, which is caused by the expansion of contract portfolio of trading division
of company’s subsidiary RTSA.
In the twelve months of 2016 the volume of gas sales on the gas exchange amounted to 2,482.6 bcm or
15% share in the total volume of gas sales on the gas exchange for this period.
Support Services and Other Revenues
Rosneft owns service companies which render drilling, construction, repairs and other services mainly to
the companies within the Group. Revenues from services rendered to third parties are reported in the consolidated
statements of profit or loss.
The following table sets forth Rosneft’s other revenues for the periods analysed:
For 3 months ended
%
change
For 12 months ended December 31,
%
change December 31, 2016 September 30, 2016 2016 2015
% of total
revenue
% of total
revenue
% of total
revenue
% of total
revenue
billion RUB, except %
Drilling services 0.7 3.6% 0.5 2.9% 40.0% 2.9 3.9% 9.5 13.6% (69.5)%
Sales of materials 6.7 34.2% 7.0 40.0% (4.3)% 25.4 33.8% 21.8 31.1% 16.5%
Repairs and maintenance
services 0.7 3.6% 0.6 3.4% 16.7% 3.0 4.0% 2.7 3.9% 11.1%
Rent services 1.5 7.7% 1.4 8.0% 7.1% 5.3 7.0% 3.7 5.3% 43.2%
Construction services 0.1 0.5% − − − 0.2 0.3% 0.3 0.4% (33.3)%
Transport services 3.0 15.3% 3.3 18.9% (9.1)% 14.8 19.7% 12.8 18.3% 15.6%
Electric power sales and
transmission 2.6 13.3% 1.4 8.0% 85.7% 7.8 10.4% 7.3 10.4% 6.8%
Other revenues 4.3 21.8% 3.3 18.8% 30.3% 15.8 20.9% 11.9 17.0% 32.8%
Total 19.6 100.0% 17.5 100.0% 12.0% 75.2 100.0% 70.0 100.0% 7.4%
Support services and other revenues were RUB 19.6 billion in the fourth quarter of 2016.
Net of the effect of acquisition of new assets support services and other revenues amounted to
RUB 16.6 billion or 5.1% lower in comparison with the third quarter of 2016.

29
Support services and other revenues net of the effect of acquisition of new assets in the twelve months of
2016 increased by 3.1% compared with the same period of 2015.
Equity share in profits of downstream associates and joint ventures
The equity share in net financial results (profits) of downstream associates and joint ventures amounted to
RUB 3 billion and RUB 1 billion in the fourth and in the third quarters of 20161.The equity share in net financial
results of downstream associates and joint ventures was RUB 8 billion in the twelve months of 2016 and
RUB 6 billion in 2015.
Downstream production and operating cost
Downstream operating expenses include*:
For 3 months ended
%
change
For 12 months ended
December 31, %
change December 31,
2016
September 30,
2016 2016 2015
billion RUB, except %
Operating expenses at refineries in Russia 21.1 18.7 12.8% 77.5 77.1 0.5%
Operating expenses at refineries and cost of additives
and materials procured for processing outside Russia 16.2 18.2 (11.0)% 75.1 82.3 (8.7)%
Operating expenses of retail companies 11.4 11.3 (0.9)% 43.5 41.7 4.3%
Effect of the acquisition of new assets 11.9 − − 11.9 − −
Downstream operating expenses 60.6 48.2 25.7% 208.0 201.1 3.4%
Intragroup inventory effect and others (5.6) 4.8 − 6.0 15.4 (61.0)%
Amendments to costs 2015-2014 − − − − 28.7 −
Total DownstreamOperating expenses** 55 53 3.8% 214 245 (22.2)% *The difference between percentages presented in the above table and other sections is a result of rounding.
**Cost of materials for blending at the retail companies was presented in the “Cost of Purchased Oil, Gas and Petroleum Products and Refining
Costs”. The comparative periods were adjusted respectively.
Operating expenses of refineries and retail companies net of the effect of acquisition of new assets
increased insignificantly by 1.0% compared with the third quarter of 2016 and amounted to
RUB 48.7 billion.
In twelve months of 2016 operating expenses of refineries and retail companies were RUB 196.1 billion,
net of the effect of new assets, and decreased by 2.5% compared with the same period of 2015.
Operating expenses at Company’s refineries
The table below shows operating expenses at Rosneft’s refineries:
For 3 months ended
%
change
For 12 months ended
December31, %
change December 31,
2016
September 30,
2016 2016 2015
Operating expenses at refineries in Russia (RUB
billion) 21.07 18.68 12.8% 77.48 77.08 0.5%
The effect of acquisition of new assets 10.84 − − 10.84 − −
Operating expenses per tonne of petroleum product
and petrochemical output (RUB per tonne)1 1,072 978 9.6% 1,055 1,018 3.6%
Operating expenses per tonne of crude oil throughput (RUB per tonne)1 1,042 953 9.3% 1,031 1,000 3.1%
Operating expenses at refineries outside Russia
(RUB billion)* 7.41 6.84 8.3% 31.42 28.48 10.3%
Operating expenses per tonne of petroleum product
and petrochemical output (RUB per tonne) 2,197 1,995 10.1% 2,345 2,556 (8.3)%
Operating expenses per tonne of crude oil throughput (RUB per tonne) 2,277 2,089 9.0% 2,469 2,638 (6.4)%
Total operating expenses at Rosneft’s refineries
(RUB billion) 39.32 25.52 54.1% 119.74 105.56 13.4% 1The indicators are net of the effect of the acquisition of new assets (Bashneft)
*Refineries outside Russia also procured the additives and materials for processing: in the fourth quarter of 2016 (net of the effect of acquisition) –RUB
8.8 billion, in the third quarter of 2016 – RUB 11.4billion, in the twelve months of 2016 and 2015 – RUB 43.7 billion and RUB 53.8 billion, respectively.
1See the equity share in net financial results of upstream associates and joint ventures in the section “Upstream operating results”.

30
Operating expenses of Rosneft’s refineries in Russia amounted to RUR 31.91 billion in the fourth quarter
of 2016.
Excluding the effect of acquisition of new assets operating expenses amounted to RUB 21.07 billion and
increased by 12.8% compared with the third quarter of 2016. The increase is mainly due to planned increase in
turnaround expenses and increased volumes of crude oil processing.
In the twelve months of 2016 operating expenses of Rosneft’s refineries in Russia, net of the effect of
acquisition of new assets (RUB 77.48 billion), increased by 0.5% compared with the same period of 2015 mainly
due to increased electricity tariffs and indexation of wages and were compensated by decreased purchases of
additives.
Operating expenses of Rosneft’s refineries outside Russia increased in the fourth quarter of 2016 by 8.3%
in comparison with the third quarter of 2016 due to increase in planned turnaround expenses. In the twelve months
of 2016 operating expenses of Rosneft’s refineries outside Russia increased by 10.3% compared with the same
period of 2015 mainly due to RUB/EUR depreciation by 8.7% and due to expenses growth caused by acquisition of
additional share in refineries in Germany.
In the fourth quarter of 2016 operating costs per tonne of crude oil throughput of Rosneft’s refineries in
Russia, net of the effect of acquisition of new assets, increased by 9.3% compared with the third quarter of 2016 and
amounted to RUB 1,042 per tonne. The increase was mostly due to increase in turnaround expenses. The increase of
3.1% in operating costs per tonne, net of the effect of acquisition of new assets, in the twelve months of 2016
compared with the same period of 2015 was due to increased electricity tariffs and indexation of wages.
Operating expenses per tonne of crude oil throughput of Rosneft’s refineries outside Russia were
RUB 2,277 per tonne in the fourth quarter of 2016 which is an increase of 9.0% compared with the third quarter
of 2016.
Operating expenses per tonne of crude oil throughput of Rosneft’s refineries outside Russia decreased by
6.4% up to RUB 2,469 per tonne in the twelve months of 2016 compared with the same period of 2015.

31
Cost of Purchased Oil, Gas and Petroleum Products and Refining Costs and others
The following table shows Rosneft’s crude oil, gas and petroleum products procurement costs and volumes
and third-party refining costs*:
For 3 months ended
%
change
For 12 months ended
December 31, %
change December 31,
2016
September 30,
2016 2016 2015
Crude oil and gas procurement
Cost of crude oil and gas procured (RUB billion)** 139 105 32.4% 454 416 9.1%
including Domestic market 65 45 44.4% 206 187 10.2%
International market 74 60 23.3% 248 229 8.3%
Volume of crude oil procured (millions of barrels) 54.2 45.0 20.4% 191.9 169.8 13.0%
including Domestic market 28.0 23.6 18.6% 99.7 98.2 1.5%
International market 26.2 21.4 22.4% 92.2 71.6 28.8%
Volume of gas procured (bcm) 5.17 2.28 >100% 15.77 11.45 37.7%
LNG procurement
Cost of LNG (RUB billion) 2 − 100% 3 − 100%
Volume of LNG procured (millions of tonnes) 0.11 − 100% 0.17 − 100%
Petroleum products procurement
Cost of petroleum products procured (RUB billion)*** 41 26 57.7% 121 80 51.3% Volume of petroleum products procured
(millions of tonnes) 1.64 1.06 54.7% 5.13 2.52 >100%
Crude oil, gas and petroleum products refining services Cost of refining of crude oil under processing agreements
(RUB billion) 7.2 7.8 (7.7)% 28.7 34.2 (16.1)% Volumes of crude oil and petroleum products, refined
under processing agreements (millions of tonnes) 2.2 2.2 − 8.8 10.4 (15.4)% Volumes of refining of gas under processing agreements (bcm) 2.6 2.7 (3.7)% 10.3 11.2 (8.0)%
Petroleum products for blending procurement**** Cost of petroleum products procured for blending (RUB billion) 6.1 7.2 (15.3)% 25.8 29.8 (13.4)%
Including intercompany purchases 6.0 7.0 (14.3)% 25.2 29.8 (15.4)%
Inventory revaluation written-off 7 − − 7 − −
Total cost of procured oil, gas and petroleum products
and refining costs (RUB billion) 196 139 41.0% 614 530 15.8% *Cost of purchases under IFRS consolidated financial statements (net of intercompany turnover). **Including cost of Upstream segment in the amount of RUB 5 billion, RUB 4billion in the fourth and in the third quarters of 2016, also RUB 25 billion
and RUB 17 billion in 2016 and 2015, respectively. ***Average procurement price of petroleum products from third parties may be higher than the average selling price of petroleum products due to differences in the mix of procured and sold petroleum products. ****Cost of materials for blending at the retail companies was reclassified from “Operating expenses of retail companies”. The comparative periods
were adjusted accordingly.

32
Crude oil and Gas procurement
Rosneft purchases crude oil primarily from its associates to process it at own refineries or export. Rosneft
procures crude oil on the international market to supply it to refineries in Germany.
Crude oil and gas procurement costs were RUB 139 billion and RUB 454 billion in the fourth quarter and
2016 respectively. Net of new assets acquisition the crude oil and gas procurement cost was RUB 131 billion and
RUB 446 billion in the fourth quarter and 2016 respectively. Organic growth by 24.8% is mainly attributable to
increased seasonal consumption.
The structure of crude oil purchases, net of the effect of acquisition of new assets, is provided in the table
below:
For 3 months ended
%
change
For 12 months ended
December 31, %
change December 31,
2016
September 30,
2016 2016 2015
mln barrels mln barrels
International market 26.2 21.4 22.4% 92.2 71.6 28.8%
Udmurtneft 6.2 7.0 (11.4)% 25.2 25.8 (2.3)%
Slavneft 12.4 14.2 (12.7)% 51.8 58.0 (10.7)%
Effect from new assets acquisition 4.7 − − 4.7 − −
Others 4.7 2.4 95.8% 18.0 14.4 25.0%
Total 54.2 45.0 20.4% 191.9 169.8 13.0%
Rosneft performs oil swaps operations in order to optimize transportation costs of deliveries to refineries.
Revenues and costs related to these operations are shown on a net basis in the “Pipeline tariffs and Transportation
costs” line of the consolidated statement of Profit or Loss.
The volume of swaps was 6.6 mln barrels, 8.5 mln barrels in the fourth and third quarters of 2016. In 2016
and 2015 the volumes of swaps were 30.6 mln barrels and 12.8 mln barrels, respectively.
Petroleum products procurement
Petroleum products from third parties are procured primarily to cover current needs of Rosneft’s retail
subsidiaries. Procurement of petroleum products is exposed to seasonal fluctuations of volumes and mix.
Procurement prices may significantly vary depending on regional markets.
Petroleum products outside Russia were purchased primarily for sale on the international markets.
The table below sets forth Rosneft’s costs, volumes and average prices per tonne of petroleum products
procured from third parties in the fourth and third quarters of 2016:
For 3 months ended % change
December 31, 2016 September 30, 2016
RUB
billion
mln
tonnes
th. RUB/
tonne*
RUB
billion
mln
tonnes
th. RUB/
tonne*
RUB
billion
mln
tonnes
th. RUB/
tonne
Petroleum products procurement in Russia 6 0.16
6 0.22
− (27.3)%
High octane gasoline 1 0.03 38.3 1 0.04 37.6 − (25.0)% 1.9%
Diesel 3 0.07 34.5 3 0.09 33.5 − (22.2)% 3.0%
Jet fuel 0 0.01 25.6 0 0.01 25.0 − − 2.4%
Others 1 0.05 25.9 2 0.08 23.1 (50.0)% (37.5)% 12.1%
Effect of the acquisition of new assets 1 0.00 − − − − − − − Petroleum products and petrochemicals
procured outside Russia 35 1.48 23.7 20 0.84 21.7 75.0% 76.2% 9.2%
Including petroleum products procurement 32 1.42 22.2 18 0.84 20.9 77.8% 69.0% 6.2%
Total 41 1.64 24.7 26 1.06 23.2 57.7% 54.7% 6.5%
Calculated based on unrounded numbers.
The volume of petroleum products procured in Russia, net of the effect of acquisition of new assets in the
fourth quarter of 2016 decreased (-0.06 mln tonnes) in comparison with the third quarter of 2016. Procurement of
petroleum products outside Russia meets the contractual obligations under long-term agreements for sales of
petroleum products.

33
The table below sets forth Rosneft’s costs, volumes and average prices per tonne of petroleum products
procured from third parties in 2016 and 2015:
For 12 months ended December 31, % change
2016 2015
RUB
billion
mln
tonnes
th. RUB/
tonne*
RUB
billion
mln
tonnes
th. RUB/
tonne*
RUB
billion
mln
tonnes
th. RUB/
tonne
Petroleum products procurement in
Russia 24 0.79
29 0.82
(17.2)% (3.7)%
High octane gasoline 6 0.17 35.3 10 0.30 35.7 (40.0)% (43.3)% (1.1)%
Diesel 10 0.31 33.5 11 0.31 32.5 (9.1)% − 3.1%
Jet fuel 0 0.02 26.2 3 0.10 28.4 (100)% (80.0)% (7.7)%
Others 7 0.29 24.8 5 0.11 25.4 40.0% >100% (2.4)%
Effect of the acquisition of new assets 1 0.00 − − − − − − − Petroleum products and petrochemicals
procured outside Russia 97 4.34 23.7 51 1.70 29.6 90.2% >100% (19.9)% Including petroleum products procurement 87 4.18 19.1 49 1.65 29.6 77.6% >100% (35.5)%
Total 121 5.13 23.1 80 2.52 31.0 51.3% >100% (25.5)% *Calculated based on unrounded numbers.
Average purchase prices may be different from average sale prices depending on different regional
structure of purchases and mix structure of the petroleum products.
Volume of petroleum products procured in Russia, net of the effect of acquisition of new assets decreased
(-0.03 mln tonnes) in 2016 compared with the same period of 2015 due to demand satisfaction by own resources.
Petroleum products and petrochemicals procurement outside Russia
Petroleum products and petrochemicals procured outside Russia amounted to RUB 35 billion
(1.48 mln tonnes) in the fourth quarter of 2016. Procurement of petroleum products outside Russia meets the
contractual obligation under long-term agreements for sales of petroleum products.
Petroleum products procured outside Russia, net of the effect of acquisition of new assets, in 2016
amounted to RUB 97 billion (4.34 mln tonnes) in comparison with RUB 51 billion (1.70 mln tonnes) in 2015 which
was caused by increase in sales under long-term contracts.
Сrude oil and gas processing, petroleum products processing
Starting from April 2014, associated petroleum gas sales to Sibur Holding and purchases of dry stripped
gas from “Sibur” are presented on a net basis in the Company’s financial statements in processing costs. Processing
costs was RUB 3.72 billion and RUB 4.21 billion in the fourth and third quarters of 2016. In 2016 and 2015
processing costs were RUB 15.01 billion and RUB 15.99 billion, respectively.

34
Pipeline Tariffs and Transportation Costs
Transportation costs are costs incurred by Rosneft to transport crude oil for refining and to end customers, and
to deliver petroleum products from refineries to end customers (these may include pipeline tariffs and railroad tariffs,
handling costs, port fees, sea freight and other costs) and also costs to transport gas via gas pipeline system.
In the fourth quarter of 2016 Rosneft’s transportation costs amounted to RUB 155 billion. Transportation
costs, net of the effect of acquisition of new assets, increased by 5.1% and amounted to
RUB 145 billion compared with the third quarter of 2016. The growth in transportation costs was mainly due to an
increased share of crude oil and petroleum products export and volume of gas transportation via gas pipeline system.
The table below sets forth the comparison (quarter-on-quarter basis) of costs per tonne of crude oil and
petroleum products transported by pipeline, railroad and mixed transportation and gas transportation costs via gas
pipeline system in the fourth and in the third quarters of 2016:
For 3 months ended % change
December31 2016 September 30, 2016
Volume,
mln
tonnes
Share in
export
volumes
Cost,
bln
RUB
Cost per
tonne,
th.RUB/t*
Volume,
mln
tonnes
Share in
export
volumes
Cost,
bln
RUB
Cost per
tonne,
th.RUB/t*
Volume Cost
Cost
per
tonne
CRUDE OIL
International sales
Pipeline 26.7 97.8% 52.9 1.98 26.5 98.1% 51.8 1.95 0.8% 2.1% 1.5%
Railroad and mixed 0.6 2.2% 1.9 3.18 0.5 1.9% 1.7 3.24 20.0% 11.8% (1.9)%
Effect of the acquisition of new assets - - 2.6 - - - - - - - -
Transportation to refineries
Pipeline** 23.1 17.4 0.76 22.4 18.5 0.83 3.1% (5.9)% (8.4)%
Railroad and mixed 2.4 8.1 3.45 2.5 8.9 3.57 (4.0)% (9.0)% (3.4)%
Effect of the acquisition of new assets - 0.6 - - - - - - -
PETROLEUM PRODUCTS
International sales
Pipeline 1.0 5.7% 1.9 1.99 0.8 4.9% 1.9 2.35 25.0% 0,0% (15.3)%
Railroad and mixed 13.9 78.5% 31.5 2.28 12.6 77.3% 29.6 2.35 10.3% 6.4% (3.0)%
Pipeline and FCA*** 2.8 15.8% 2.9 17.8% (3.4)%
Effect of the acquisition of new assets - - 4.6 - - - - - - -
GAS bcm RUB/bcm bcm RUB/bcm
Pipeline **** 12.2 12.8 1.05 10.6 12.1 1.14 15.1% 5.8% (7.9)%
Other transportation expenses ***** 21 13 61.5%
Total 70.5 155 68.2 138 3.4% 12.3% *Calculated based on unrounded data. **Including crude oil purchased on international market, which was directed to Ruhr Oel GmbH. ***Rosneft exported part of petroleum products in the fourth quarter of 2016 and third quarter of 2016through its own export terminal in Tuapse, on FCA terms, where Rosneft does not bear transportation expenses directly, except for transshipment and dispatching cargo costs. ****Part of gas volumes was dispatched on terms under which Rosneft does not bear transportation expenses. In the fourth and third quarters of 2016
these volumes amounted to 5.8 bcm and 4.0 bcm respectively. *****Other transportation expenses include cost of railroad transportation of petroleum products from refineries to tank farms and road transportation
from tank farms to fuel filling station.
Crude oil pipeline transportation cost per tonne of international sales in the fourth quarter of 2016, net of the
effect of acquisition of new assets, remained practically unchanged and amounted to RUB 1.98 thousand.
The decrease in crude oil railroad and mixed transportation cost per tonne of international sales, net of the
effect of acquisition of new assets, was 1.9% due to change in logistic structure in the fourth quarter 2016 and
decreasing of share of expensive routes.
Crude oil pipeline transportation cost per tonne of supplies to refineries, net of the effect of acquisition of new
assets, decreased by 8.4% in the fourth quarter of 2016 compared to the third quarter of 2016 which was caused by
change in structure of transportation routes.
Crude oil railroad and mixed transportation cost per tonne of supplies to refineries, net of the effect of
acquisition of new assets, in the fourth quarter of 2016 decreased by 3.4% compared with the third quarter of 2016 due
to change in structure of transportation routes.
The decrease in pipeline cost per tonne of petroleum product international sales (net of the effect of
acquisition of new assets) by 15.3% in the fourth quarter of 2016 compared with the previous quarter was mainly due
to positive impact of RUB strengthening on USD denominated component of tariff.

35
Railroad and mixed transportation cost per tonne of petroleum product international sales (net of the effect of
acquisition of new assets) decreased by 3.0% in the fourth quarter of 2016 compared to the third quarter of 2016 due to
change in transportation routes and the late termination of river navigation period.
Gas transportation costs decrease by 7.9% in the fourth quarter of 2016 compared to the third quarter of 2016
resulted from decrease in average transportation distance to final consumers. In the fourth quarter of 2016 indexation
of gas transportation tariffs was not carried out.
The table below sets forth comparison for costs per tonne of crude oil and petroleum products transported by
pipeline, railway and mixed transportation and gas transportation costs via gas pipeline system in the twelve months of
2016 and 2015:
For 12months ended December 31, % change
2016 2015
Volume,
mln
tonnes
Share in
export
volumes
Cost,
bln
RUB
Cost per
tonne,
th.RUB/t*
Volume,
mln
tonnes
Share in
export
volumes
Cost,
bln
RUB
Cost per
tonne,
th.RUB/t*
Volume Cost
Cost
per
tonne
CRUDE OIL
International sales
Pipeline 109.9 97.5% 214.2 1.95 103.8 95.1% 185.4 1.79 5.9% 15.5% 8.9%
Railroad and mixed 2.8 2.5% 9.8 3.41 5.3 4.9% 17.7 3.28 (47.2)% (44.6)% 4.0%
Effect of the acquisition of new assets - - 2,6 - - - - - - - -
Transportation to refineries
Pipeline** 87.0 66.8 0.77 90.0 73.3 0.82 (3.3)% (8.9)% (6.1)%
Railroad and mixed 8.4 29.1 3.53 6.5 26.3 4.04 29.2% 10.6% (12.6)%
Effect of the acquisition of new assets - 0.6 - - - - - - -
PETROLEUM PRODUCTS
International sales
Pipeline 3.8 5.8% 10.3 2.69 4.1 6.2% 11.4 2.79 (7.3)% (9.6)% (3.6)%
Railroad and mixed 52.1 79.2% 131.1 2.52 52.2 79.5% 140.6 2.69 (0.2)% (6.8)% (6.3)%
Pipeline and FCA*** 9.9 15.0% 9.4 14.3% 5.3%
Effect of the acquisition of new assets - - 4.6 - - - - - - - -
GAS bcm RUB/bcm bcm RUB/bcm
Pipeline **** 44.7 48.2 1.08 41.1 42.2 1,03 8.8% 14.2% 4.9%
Other transportation expenses ***** 58 45 28.9%
Total 273.9 575 271.3 542 1.0% 6.1% *Calculated based on unrounded data. ** Including crude oil purchased on international market, which was directed to Ruhr Oel GmbH (ROG). ***Rosneft exported part of petroleum products in the twelve months of 2016 and 2015 through its own export terminal in Tuapse on FCA terms, where
Rosneft does not bear transportation expenses directly, except for transshipment and dispatching cargo costs. **** Part of gas volumes was dispatched on terms where Rosneft does not bear transportation expenses. In the twelve months of 2016 and 2015 these volumes amounted to 20.3 bcm, 17.6 bcm respectively. ***** Other transportation expenses include cost of railroad transportation of petroleum products from refineries to tank farms and road transportation
from tank farms to fuel filling stations.
The change in transportation costs per tonne of products sold (for crude oil and petroleum products) in the
twelve months of 2016 compared with the same period of 2015 mainly resulted from tariffs indexation and change in
transportation routes.
Excise tax
In the fourth quarter of 2016 excise tax was RUB 61 billion, including additional costs related to processing
outside Russian Federation in the amount of RUB 6 billion, in comparison with RUB 52 billion in the third quarter of
2016. Exercise tax, net of the effect of acquisition of new assets and additional costs related to processing outside
Russian Federation, amounted to RUB 43 billion in the fourth quarter of 2016 in comparison with RUB 47 billion in
the third quarter of 2016.
Excises tax in 2016 was RUB 197 billion (including additional costs related to processing outside Russian
Federation in the amount of RUB 26 billion). Excises tax, net of the effect of acquisition of new assets and additional
costs related to processing outside Russian Federation, in 2016 increased to RUB 159 billion in comparison with
RUB 103 billion the same period of 2015 mainly due to increased excise tax rate for petroleum products.

36
Export Customs Duty
Export customs duties include crude oil and petroleum products export customs duties. The export customs
duties are also discussed above under “Macroeconomic Factors Affecting the Results of Operations – Taxation”.
The following table sets forth Rosneft’s export customs duties for the periods analyzed:
For 3 months ended
%
change
For 12 months ended
December 31 %
change December 31,
2016
September 30,
2016 2016 2015
RUB billion, except %
Export customs duty for crude oil 148 140 5.7% 497 683 (27.2)%
Export customs duty for petroleum products 51 44 15.9% 160 242 (33.9)%
Total export customs duty 199 184 8.2% 657 925 (29.0)%
Export customs duty, net of the effect of acquisition of new assets amounted to RUB 183 billion. An organic
decrease of 0.5% in the fourth quarter of 2016 in comparison with the third quarter of 2016 was mostly due to positive
duty lag effect compensated by increased export duty rate in RUB terms (increase of 0.8%).
Decrease in export customs duty, net of the effect of acquisition of new assets in the twelve months of 2016
compared with the same period of 2015 mainly resulted from lower export duty rates due to the decrease in oil prices
(by 30.8% in RUB terms).
The following table sets forth certain information about the export customs duty on crude oil:
For 3 months ended
%
change
For 12 months ended
December 31, %
change December 31,
2016
September 30,
2016 2016 2015
Urals (average Med and NWE) (USD/bbl) 48.3 44.0 9.7% 42.1 51.4 (18.2%)
Average enacted export customs duty on crude
oil (th. RUB/tonne) 5.78 5.74 0.8% 5.08 7.33 (30.8%) Hypothetical export customs duty on crude oil*
(th. RUB/tonne) 6.34 5.66 12.0% 5.38 6.60 (18.5%)
Average customs duty on crude oil exports subject to regular rate (th. RUB/tonne) 5.75 5.76 (0.2%) 4.98 7.28 (31.6%)
*Hypothetical customs duty is calculated using the average Urals price for the period (i.e. without time lag).
The actual average customs duty on exports is subject to regular duty deviates from the enacted export
customs duty due to different monthly export volumes.
Operating results of segment “Corporate and others”
Segment includes the Group companies that provide corporate services and holdings’ expenses. For 3 months ended
%
change
For 12 months ended December 31, %
change December 31,
2016
September 30,
2016 2016 2015
Financial results, RUB billion
EBITDA (10) (12) 16.7% (44) (55) 20.0%
Capital expenditures* 8 1 >100% 16 15 6.7% *Refer to “Capital expenditures”.
Separate indicators of the consolidated financial statements
Costs and Expenses
General and Administrative Expenses
General and administrative expenses include wages, salaries and social benefits (except for wages of
technical staff of production and refining entities), banking commissions, third-party fees for professional services,
insurance expenses (except for insurance of oil and gas production and refining entities), maintenance of social
infrastructure, lease expenses, allowances for doubtful accounts and other general expenses.
General and administrative expenses were RUB 38 billion in the fourth quarter of 2016. General and
administrative expenses, net of the effect of acquisition of new assets, were RUB 35 billion in the fourth quarter of
2016 and increased compared to the third quarter of 2016 (RUB 31 billion). The growth was due to recognition of
bank commissions, consulting services and other costs relevant to the completion of transaction of the acquisitions
at the end of 2016.

37
General and administrative expenses were RUB 129 billion in 2016. General and administrative expenses
in 2016, net of the effect of acquisition of new assets and one-off doubtful debt provision accruals, was
RUB 123 billion compared with RUB 117 billion (RUB 130 billion including doubtful debt provision accruals) in
2015. Annual increase by 5.1% compared with the same period of 2015 that is in line with inflation level for the
period. Control over administrative expenses remains one of the main directions of Company policy.
Depreciation, Depletion and Amortization
Depreciation, depletion and amortization include depreciation of crude oil and gas producing assets, and other
production and corporate assets.
In the fourth quarter of 2016, DDA amounted to RUB 133 billion. Net of the effect of acquisition of new
assets DDA decreased by 3.3% compared with the third quarter of 2016 and amounted to RUB 116 billion. Decline
was due to recognition of interim evaluation of proved developed reserves at certain fields.
In 2016 DDA was RUB 482 billion. In 2016 DDA, net of the effect of acquisition of new assets, amounted to
RUB 465 billion, that is by 3.3% higher than in the same period of 2015 and caused by increase in putting fixed assets
into operations with the application of reduced depletion rate for oil infrastructure at certain greenfields. New depletion
rate estimated on the results of DeGolyer and MacNaughton report on oil and marketable gas reserve will be
applicable from January 1, 2017.
Taxes Other than Income Tax
Taxes other than income tax include the mineral extraction tax, the excise tax, the property tax and other
taxes. The basis for calculation of mineral extraction tax is described under “Macroeconomic Factors Affecting
Results of Operations – Mineral Extraction Tax” above.
The following table sets forth Rosneft’s taxes other than income tax (excluding export duties) for the periods
analysed (in RUB billion):
For 3 months ended %
change
For 12 months ended December 31, %
change December 31,
2016
September 30,
2016 2016 2015
Mineral extraction tax 313 262 19.5% 1,007 1,091 (7.7)%
Excise tax 61 52 17.3% 197 103 91.3%
Social security tax 13 12 8.3% 50 47 6.4%
Property tax 11 8 37.5% 36 31 16.1% Other taxes, interest, penalties and other
payments to budget 2 2 − 6 5 20.0%
Total taxes other than income tax 400 336 19.0% 1,296 1,277 1.5%
Taxes other than income tax, net of the effect of acquisition of new assets, were RUB 359 billion and
increased by 6.8% in the fourth quarter of 2016, compared to RUB 336 billion in the third quarter of 2016 due to
mineral extraction tax expenses growth.
In 2016 taxes other than income tax, net of the effect of acquisition of new assets decreased by 1.7% in
comparison with the same period of 2015 mainly due to decrease in mineral extraction tax base rate (by 8.5% in RUB
terms).
Finance Income and Expenses
Finance income and expenses include interest received on deposits, deposit certificates and loans issued,
interest paid on loans and borrowings received, results from changes in fair value of financial assets measured at fair
value, results from operations with derivative financial instruments, increase in provision due to the unwinding of
discount, results from disposal of financial assets and other finance income and expenses.
In the fourth quarter of 2016, net finance expenses amounted to RUB 19 billion. Net of the effect of
acquisition of new assets, net financial expenses decreased to RUB 15 billion compared to RUB 28 billion in the third
quarter of 2016 due to the positive result from fair value measurement of derivative financial instruments and RUB
appreciation against USD.
In 2016 net finance expenses were RUB 102 billion. Net of the effect of acquisition of new assets, net
financial expenses decreased by 54.2% to RUB 98 billion compared to RUB 214 billion in the same period of 2015
that was mainly due to the settlement of derivative financial instruments in 2015 opened during 2012-2014.
Other Income and Other Expenses
In the fourth quarter of 2016 other income was RUB 43 billion. Net of the effect of acquisition of new assets,
other income was RUB 36 billion compared to RUB 5 billion in the third quarter of 2016.

38
The increase was due to positive effect from the restructuring of Ruhr Oel GmbH. In 2016 and 2015 other
income was RUB 50 billion and RUB 75 billion, respectively.
In the fourth quarter of 2016 other expenses amounted to RUB 38 billion. Net of the effect of acquisition of
new assets, other expenses were RUB 34 billion compared to RUB 16 billion in the previous quarter.
Other expenses include effect of fixed assets disposal in the course of operating activities and other expenses.
In the fourth quarter of 2016 other expenses include the effect from decline in market value of some assets.
In 2016 and 2015 other expense were RUB 76 billion (RUB 72 billion - net of the effect of acquisition of new
assets) and RUB 72 billion, respectively.
Foreign Exchange Differences
Foreign exchange effects are mostly attributable to monthly revaluation of assets and liabilities denominated
in foreign currency at the exchange rate at the end of the period.
In the fourth and in the third quarters of 2016 foreign exchange loss recognized in profit and loss statement
was RUB 15 billion and RUB 14 billion, respectively.
The effect from capitalization of the foreign exchange differences on capital loans to fund capital
expenditures amounted to RUB 0 billion and RUB 51 billion in the twelve months of 2016 and 2015, respectively.
Cash flow hedges reclassified to profit or loss
Cash flow hedges reclassified to profit or loss recognized in the consolidated statement of profit or loss in the
fourth quarter of 2016 was RUB 36 billion and RUB 37 billion in the third quarter of 2016.
In 2016 and 2015 cash flow hedges reclassified to profit or loss recognized in the consolidated statement of
profit or loss amounted to RUB 147 billion and RUB 123 billion, respectively.
Income Tax
The following table sets forth the Company’s effective income tax rate under IFRS for the periods analysed:
For 3 months ended For 12 months ended December 31
December 31,
2016
September 30,
2016 2016 2015
Effective rate of income tax (IFRS) 35.21% 18.0% 24.61% 21.1% 1 Excluding one-off recognition of income tax of RUB 38 billion accrued on disposal of shares in subsidiaries in 2016 (in the fourth quarter of
2016:RUB 17 billion).
The Company applies the provisions of IAS 12 “Income taxes” to determine effective tax rate. Increase in
effective tax rate in 2016 is mainly due to growth of non-deductible expenses for income tax purposes and due to
growth of tax on intra-group dividends.
In accordance with Statement of comprehensive income, income tax expense was RUB 62 billion,
and RUB 20 billion in the fourth and in the third quarters of 2016, respectively. Income tax was RUB 116 billion and
RUB 104 billion in the twelve months of 2016 and 2015, respectively.
Net Income
Net income amounted to RUB 66 billion (RUB 52 billion attributable to Rosneft’s shareholders) in the fourth
quarter of 2016 compared with the net income of RUB 30 billion in the third quarter of 2016 (RUB 26 billion
attributable to Rosneft’s shareholders). Net profit upturn was mostly driven by increase in operating profit due to
positive price dynamics and positive effect from export duties lag.
Net income amounted to RUB 201 billion (RUB 181 billion attributable to Rosneft’s shareholders) in the
twelve months of 2016 compared to RUB 356 billion (RUB 355 billion attributable to Rosneft’s shareholders) in 2015.

39
Liquidity and Capital Resources
Cash Flows
The principal items of the statement of cash flows for the periods analysed are as follows:
For 3 months ended %
change
For 12 months ended December 31, %
change December 31,
2016
September 30,
2016 2016 2015
RUB billion RUB billion
Net cash provided by operating activities 102 172 (40.7)% 632 2 195 (71.2)%
Net cash (used in) investing activities (939) (44) >100% (973) (813) 19.7%
Net cash (used in) financing activities 847 (126) >100% 692 (1 091) >100%
Net cash provided by operating activities
Net cash provided by operating activities amounted to RUB 102 billion in the fourth quarter of 2016
compared to RUB 172 billion in the third quarter of 2016.
Operating cash flow includes operations with trading securities as part of the Company’s efforts to manage
cash resources (net inflow was RUB 0 billion in the fourth quarter of 2016, RUB 1 billion in the third quarter of 2016,
respectively).
Net cash provided by operating activity adjusted for the above mentioned operations amounted to
RUB 102 billion in the fourth quarter of 2016 (adjusted for operations with trading securities in the amount of
RUB 0 billion), RUB 171 billion in the third quarter of 2016 (adjusted for operations with trading securities in the
amount of RUB 1 billion).
Net cash provided by operating activity for the periods analysed is given in the table below:
For 3 months ended
% change
For 12 months ended December 31, %
change December 31,
2016
September 30,
2016 2016 2015
RUB billion RUB billion
Net cash provided by operating activity 102 172 (40.7)% 632 2,195 (71.2)%
Effect from operations with trading securities − (1) − (4) (5) (20.0)% Adjusted net cash provided by operating
activity 102 171 (40.4)% 628 2,190 (71.3)% Offsetting of prepayments received under long
term supply contracts at average ex.rate 94 80 17.5% 288 176 63.6% Receipt of prepayments under long term supply
contracts − − − − (1,027) −
Financing under future suppliers 63 − 100% 95 − −
Adjusted net cash provided by operating
activity 259 251 3.2% 1,011 1,339 (24.5)%
In the fourth quarter of 2016 adjusted operating cash flow was RUB 259 billion. Net of the effect of
acquisition of new assets, adjusted operating cash flow amounted to RUB 278 billion compared with RUB 251 billion
in the third quarter of 2016. Stability in operating cash flow was mainly caused by strengthening of internal control of
operating flows in terms of price growth in the fourth quarter and scheduled advance payments.
In 2016 and 2015 adjusted operating cash flow, excluding the effect of acquisition of new assets, was
RUB 1,030 billion and RUB 1,339 billion, respectively.
Net cash used in investing activities
Net cash used in the investing activities was RUB 939 billion in the fourth quarter of 2016.
Net cash used in the investing activities was RUB 964 billion in the fourth quarter of 2016, excluding the
effect of acquisition of new assets, compared to RUB 44 billion used in the investing activities in the third quarter
of 2016. In the fourth quarter of 2016 planned growth of investing activity was due to acquisition of Bashneft assets
(RUB 330 billion), payments for participation interest in JV, long-term cash deposits in Russian banks and planned
capital expenditures.
Net cash used in investing activities in the twelve months of 2016 was RUB 998 billion, net of the effect of
acquisition of new assets, and net cash used in investing activities in the twelve months of 2015 was RUB 813 billion.

40
Net cash used in financing activities
Net cash used in financing activities was RUB 848 billion in the fourth quarter of 2016, excluding the effect
of acquisition of new assets, compared to RUB 126 billion used in the financing activities in the third quarter of 2016.
In the fourth quarter of 2016 the Company raised long-term and short-term ruble funds. Effect from raising ruble funds
was partially compensated by planned repayment of foreign currency loans and by proceeds from sales of shares in
subsidiaries (RUB 308 billion in 2016).
Net cash used in financing activities in the twelve months of 2016 was RUB 693 billion, excluding the effect
of acquisition of new assets, and RUB 1,091 billion in 2015, respectively. The change of net cash used in financing
activities was due to effect from raising long-term and short-term funds for the Company's investment projects.
Capital Expenditures
The table below sets forth Rosneft’s capital expenditures by operating segments and license acquisition costs:
For 3 months ended
%
change
For 12 months ended
December 31, %
change December 31,
2016
September 30,
2016 2016 2015
Yuganskneftegaz 44 44 − 158 111 42.3%
Vankorneft 6 6 − 30 32 (6.3)%
Orenburgneft 9 7 28.6% 29 29 −
Samotlorneftegaz 14 11 27.3% 44 32 37.5%
Projects on Sakhalin 6 5 20.0% 30 37 (18.9)%
Uvatneftegaz 7 5 40.0% 26 27 (3.7)%
Verkhnechonskneftegaz 4 5 (20.0)% 17 16 6.3%
Purneftegaz 6 5 20.0% 19 16 18.8%
Rospan International 15 9 66.7% 42 23 82.6%
Samaraneftegaz 7 6 16.7% 24 22 9.1%
Varyoganneftegaz 6 4 50.0% 18 13 38.5%
VSNGK 6 5 20.0% 21 17 23.5%
Tomskneft VNK 1 2 (50.0)% 7 6 16.7%
Nyaganneftegaz 5 2 >100% 12 9 33.3%
Severnaya Neft 5 3 66.7% 14 11 27.3%
Suzun 9 8 12.5% 33 15 >100%
Taas-Yuryah Neftegazodobycha 7 6 16.7% 22 13 69.2%
Sibneftegaz 1 2 (50.0)% 5 5 −
Tumenneftegaz 3 3 − 10 4 >100%
Other 16 11 45.5% 42 29 44.8%
Government grants (5) − − (8) (11) (27.3)%
Effect of acquisition of new assets 13 − − 13 − −
Total upstream segment 185 149 24.2% 608 456 33.3%
Tuapse refinery 6 2 >100% 11 19 (42.1)%
Kuibyshev refinery 5 2 >100% 10 16 (37.5)%
Novokuibyshevsk refinery 3 2 50.0% 8 11 (27.3)%
Syzran refinery 1 1 − 5 12 (58.3)%
Angarsk refinery 2 1 100.0% 5 10 (50.0)%
Achinsk refinery 2 1 100.0% 4 10 (60.0)%
Ryazan refinery 2 − >100% 4 6 (33.3)%
Komsomolsk refinery − 1 (100.0)% 2 6 (66.7)%
Saratovsky refinery − 1 (100.0)% 1 1 −
Other refineries 5 2 >100% 10 17 (41.2)%
Marketing Business Units and others 10 4 >100% 20 16 25.0%
Effect of acquisition of new assets 5 − − 5 − −
Total downstream segment 41 17 >100% 85 124 (31.5)%
Other activities 7 1 >100% 15 15 −
Effect of acquisition of new assets 1 − − 1 − −
Total other activities 8 1 >100% 16 15 6.7%
Total capital expenditures 234 167 40.1% 709 595 19.2%
Acquisition of licenses 8 1 >100% 24 14 71.4%
Return of auction advances − (8) − (13) (13) −
In the fourth quarter of 2016 total capital expenditures amounted to RUB 234 billion. Capital expenses,
excluding the effect of acquisition of new assets, were RUB 215 billion (increase by 28.7%) compared with
RUB 167 billion in the third quarter of 2016.

41
The increase in total capital expenditures, net of the effect of acquisition of new assets, in the twelve
months of 2016 in comparison with the same period of 2015 was due to the expansion of the drilling program and
planned growth of investment in the development of new fields.
In the fourth quarter of 2016 upstream capital expenditures, excluding the effect of acquisition of new
assets, amounted to RUB 172 billion (increase by 15.4%) in comparison with RUB 149 billion in the third quarter
of 2016. In the twelve months of 2016 upstream capital expenditures, excluding the effect of new acquisition of
new assets, were RUB 595 billion and RUB 456 billion in the twelve months of 2016 and 2015, respectively.
Organic growth of upstream capital expenses by 30.5% is mainly due to increased development drilling (+ 35% to
the same period of 2015) and increased rate of launches of new projects.
In the fourth quarter of 2016 downstream capital expenditures were RUB 41 billion. Net of the effect of
acquisition of new assets, downstream capital expenditures amounted to RUB 36 billion in the fourth quarter 2016,
including capital expenditures of investment tariffs, in comparison with RUB 17 billion in the third quarter of 2016.
Downstream capital expenditures, excluding the effect of acquisition of new assets, in the twelve months of 2016 and
2015 were RUB 80 billion and RUB 124 billion, respectively.
In the fourth quarter of 2016 capital expenditures of refineries, net of the effect of acquisition of new assets,
amounted to RUB 26 billion compared to RUB 13 billion in the third quarter of 2016. In the twelve months of 2016
capital expenditures of refineries were RUB 60 billion, excluding the effect of acquisition of new assets, and
amounted to RUB 108 billion in twelve months of 2015, respectively.
The capital expenditures of refineries in 2016 were mainly focused on the financing of refinery
modernization program and also on the maintaining of current capacities of refineries in Russia, and also on the
financing of construction works on Eastern petrochemical company.
Capital expenditures of other activities related to scheduled purchases of transport and other equipment net
of the effect of acquisition of new assetswere RUB 7 billion in the fourth quarter and RUB 1 billion in the third
quarter of 2016, respectively.
The license acquisition costs in the fourth quarter of 2016 amounted to RUB 8 billion and referred to
acquisition of new licenses for research, exploration and production at sites in the Samara region, Orenburg region,
Irkutsk region, Chechen Republic, the Sakha Republic (Yakutia) and the Khanty-Mansiysky Autonomous district.
The license acquisition costs in the third quarter of 2016 amounted to RUB 1 billion and referred to
acquisition of new licenses for research, exploration and production at sites in the Samara region, the Khanty-
Mansiysky and the Sakha Republic (Yakutia). In the third quarter of 2016 the Company also returned the advance
in the amount of RUB 8 billion issued in the previous quarter for the participation in auctions.
In the twelve months of 2016 the license acquisition costs were RUB 24 billion and referred to the
advances issued for the participation in auction aimed at acquiring new licenses for research, exploration and
production at blocks located in Sakha Republic (Yakutia), Krasnoyarsk region, Samara region, the Khanty-
Mansiysky and the Yamal-Nenets Autonomous districts. In the same period the Company received cash from the
repayment of advances issued in previous periods in the amount of RUB 13 billion for the participation in auctions.
In the twelve months of 2015 the license acquisition costs were RUB 14 billion and referred to the
advances issued for the participation in auctions aimed at acquiring new licenses for research, exploration and
production at blocks located in Eastern and Western Siberian region and Samara region. In the same period the
Company received cash from the repayment of advances issued in previous periods in the amount of RUB 13
billion for the participation in the auction.1
Debt Obligations
Rosneft net debt amounts to RUB 1,890 billion as of December 31, 2016. Rosneft net debt, net of the effect
of acquisition of new assets, amounts to RUB 1,774 billion as of December 31, 2016 compared to
RUB 1,651 billion as of September 30, 2016.
Rosneft’s total loans and borrowings and other financial liabilities was RUB 3,585 billion as of December
31, 2016. Rosneft’s total loans and borrowings and other financial liabilities, net of the effect of acquisition of new
assets, was RUB 3,464 billion compared to RUB 2,927 billion as of September 30, 2016.The increase in total debt
was mainly attributable to the raising of rouble funds, which was partially compensated by foreign exchange effect
and scheduled payments of debt nominated in the foreign currency.
1 Starting from 2015 all cash receipts from the repayment of advances issued for the participation in the auctions which were called off or were won by
other participants are recorded in line “Acquisition of licenses and auction advances” of Consolidated statement of cash flows.

42
Portion of Rosneft’s long-term loans is secured by oil export contracts. If the Company fails to make timely
debt repayments, the terms of such contracts normally provide the lender with an express right of claim for
contractual revenue in the amount of failing loan repayments.
As of December 31, 2016, September 30, 2016 and December 31, 2015: 24.7%, 32.6% and 34.8%,
respectively, of Rosneft’s loans and borrowings were secured by crude oil export contracts (excluding exports to the
CIS).
As of December 31, 2016, September 30, 2016 and December 31, 2015 pledged oil exports constituted
4.4%, 4.5% and 4.8%,respectively, of the total crude oil export sales for the analyzed period (excluding exports to
the CIS).
The net debt саlculation is disclosed in the following table:
As of the date December 31,
2016
September 30,
2016
December 31,
2015
RUB billion
Short-term loans and borrowings and other financial liabilities 1,671 947 1,040
Long-term loans and borrowings and other financial liabilities 1,914 1,980 2,283
Total debt 3,585 2,927 3,323
Cash and cash equivalents 790 787 559
Other short-term financial assets and part of deposits 905* 489 1,070
Net debt 1,890 1,651 1,694
*In 2016 Company made some market linked deposits to participate in trading transactions and in current
M&A transactions and to finance crude oil supplies to Venezuela and Cuba. Deposits are placed in Russian high-
rated banks with possible 1 year-term of repayment.
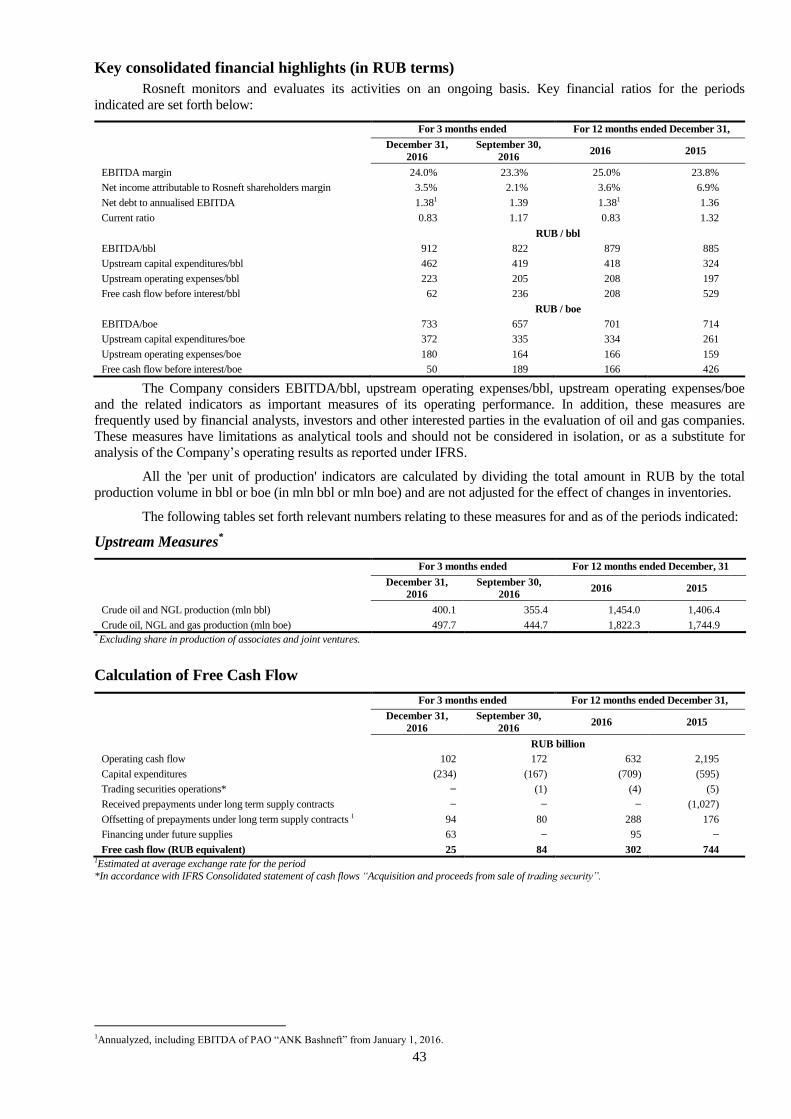
43
Key consolidated financial highlights (in RUB terms)
Rosneft monitors and evaluates its activities on an ongoing basis. Key financial ratios for the periods
indicated are set forth below:
For 3 months ended For 12 months ended December 31,
December 31,
2016
September 30,
2016 2016 2015
EBITDA margin 24.0% 23.3% 25.0% 23.8%
Net income attributable to Rosneft shareholders margin 3.5% 2.1% 3.6% 6.9%
Net debt to annualised EBITDA 1.381 1.39 1.381 1.36
Current ratio 0.83 1.17 0.83 1.32
RUB / bbl
EBITDA/bbl 912 822 879 885
Upstream capital expenditures/bbl 462 419 418 324
Upstream operating expenses/bbl 223 205 208 197
Free cash flow before interest/bbl 62 236 208 529
RUB / boe
EBITDA/boe 733 657 701 714
Upstream capital expenditures/boe 372 335 334 261
Upstream operating expenses/boe 180 164 166 159
Free cash flow before interest/boe 50 189 166 426
The Company considers EBITDA/bbl, upstream operating expenses/bbl, upstream operating expenses/boe
and the related indicators as important measures of its operating performance. In addition, these measures are
frequently used by financial analysts, investors and other interested parties in the evaluation of oil and gas companies.
These measures have limitations as analytical tools and should not be considered in isolation, or as a substitute for
analysis of the Company’s operating results as reported under IFRS.
All the 'per unit of production' indicators are calculated by dividing the total amount in RUB by the total
production volume in bbl or boe (in mln bbl or mln boe) and are not adjusted for the effect of changes in inventories.
The following tables set forth relevant numbers relating to these measures for and as of the periods indicated:
Upstream Measures*
For 3 months ended For 12 months ended December, 31
December 31,
2016
September 30,
2016 2016 2015
Crude oil and NGL production (mln bbl) 400.1 355.4 1,454.0 1,406.4
Crude oil, NGL and gas production (mln boe) 497.7 444.7 1,822.3 1,744.9 * Excluding share in production of associates and joint ventures.
Calculation of Free Cash Flow
For 3 months ended For 12 months ended December 31,
December 31,
2016
September 30,
2016 2016 2015
RUB billion
Operating cash flow 102 172 632 2,195
Capital expenditures (234) (167) (709) (595)
Trading securities operations* − (1) (4) (5)
Received prepayments under long term supply contracts − − − (1,027)
Offsetting of prepayments under long term supply contracts 1 94 80 288 176
Financing under future supplies 63 − 95 −
Free cash flow (RUB equivalent) 25 84 302 744 1Estimated at average exchange rate for the period
*In accordance with IFRS Consolidated statement of cash flows “Acquisition and proceeds from sale of trading security”.
1Annualyzed, including EBITDA of PAO “ANK Bashneft” from January 1, 2016.
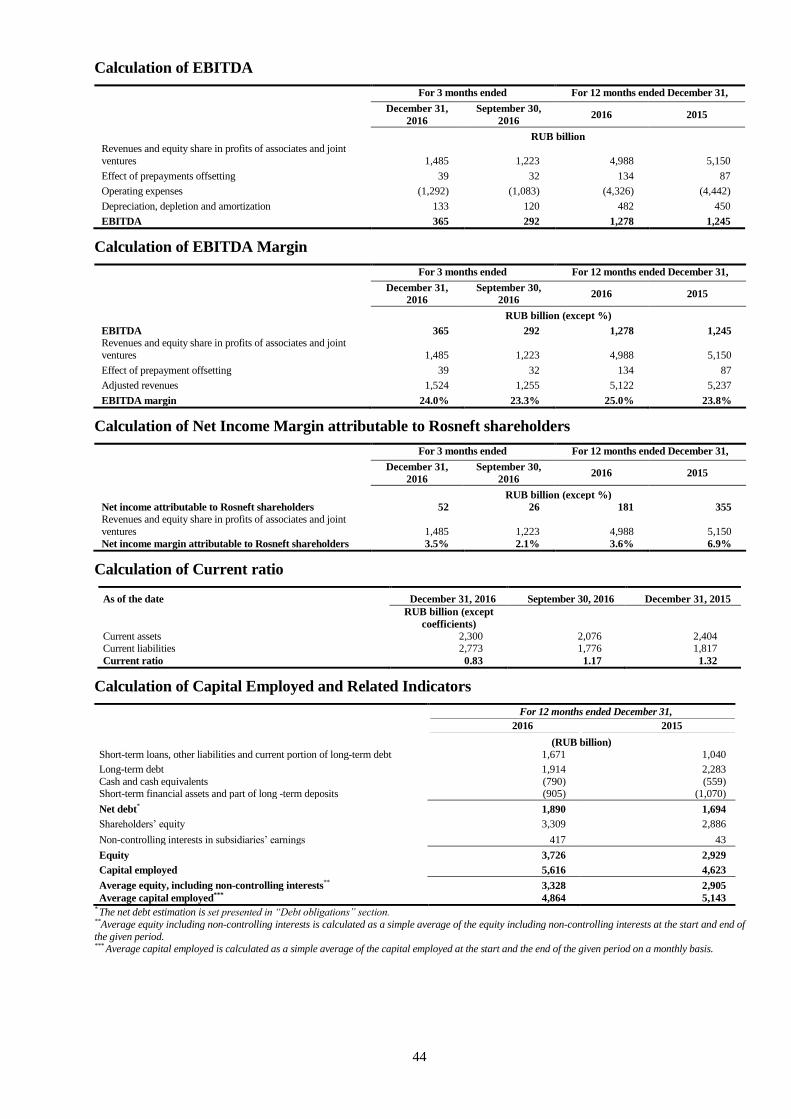
44
Calculation of EBITDA
For 3 months ended For 12 months ended December 31,
December 31,
2016
September 30,
2016 2016 2015
RUB billion Revenues and equity share in profits of associates and joint
ventures 1,485 1,223 4,988 5,150
Effect of prepayments offsetting 39 32 134 87
Operating expenses (1,292) (1,083) (4,326) (4,442)
Depreciation, depletion and amortization 133 120 482 450
EBITDA 365 292 1,278 1,245
Calculation of EBITDA Margin
For 3 months ended For 12 months ended December 31,
December 31,
2016
September 30,
2016 2016 2015
RUB billion (except %)
EBITDA 365 292 1,278 1,245
Revenues and equity share in profits of associates and joint
ventures 1,485 1,223 4,988 5,150
Effect of prepayment offsetting 39 32 134 87
Adjusted revenues 1,524 1,255 5,122 5,237
EBITDA margin 24.0% 23.3% 25.0% 23.8%
Calculation of Net Income Margin attributable to Rosneft shareholders
For 3 months ended For 12 months ended December 31,
December 31,
2016
September 30,
2016 2016 2015
RUB billion (except %) Net income attributable to Rosneft shareholders 52 26 181 355
Revenues and equity share in profits of associates and joint
ventures 1,485 1,223 4,988 5,150
Net income margin attributable to Rosneft shareholders 3.5% 2.1% 3.6% 6.9%
Calculation of Current ratio
As of the date December 31, 2016 September 30, 2016 December 31, 2015
RUB billion (except
coefficients)
Current assets 2,300 2,076 2,404 Current liabilities 2,773 1,776 1,817
Current ratio 0.83 1.17 1.32
Calculation of Capital Employed and Related Indicators
For 12 months ended December 31,
2016 2015
(RUB billion)
Short-term loans, other liabilities and current portion of long-term debt 1,671 1,040
Long-term debt 1,914 2,283
Cash and cash equivalents (790) (559) Short-term financial assets and part of long -term deposits (905) (1,070)
Net debt* 1,890 1,694
Shareholders’ equity 3,309 2,886
Non-controlling interests in subsidiaries’ earnings 417 43
Equity 3,726 2,929
Capital employed 5,616 4,623
Average equity, including non-controlling interests** 3,328 2,905
Average capital employed*** 4,864 5,143 * The net debt estimation is set presented in “Debt obligations” section. **Average equity including non-controlling interests is calculated as a simple average of the equity including non-controlling interests at the start and end of
the given period. *** Average capital employed is calculated as a simple average of the capital employed at the start and the end of the given period on a monthly basis.

45
Calculation of Return on Average Capital Employed (ROACE)
For 12 months ended December 31
2016 2015
(RUB billion, except %)
Revenue and equity share in profits of associates and joint ventures 4,988 5,150
Total costs and expenses (4,326) (4,442)
Effect of prepayments offsetting 134 87 Income tax expense (116) (104)
Return used for calculation of ROACE 680 691
Average capital employed 4,864 5,143
ROACE 14.0% 13.4%
Calculation of Return on Average Equity (ROAE)
For 12 months ended December 31
2016 2015
(RUB billion, except %)
Net income attributable to Rosneft shareholders 181 355
Average equity, including non-controlling interests 3,328 2,905
ROAE 5.4% 12.2%
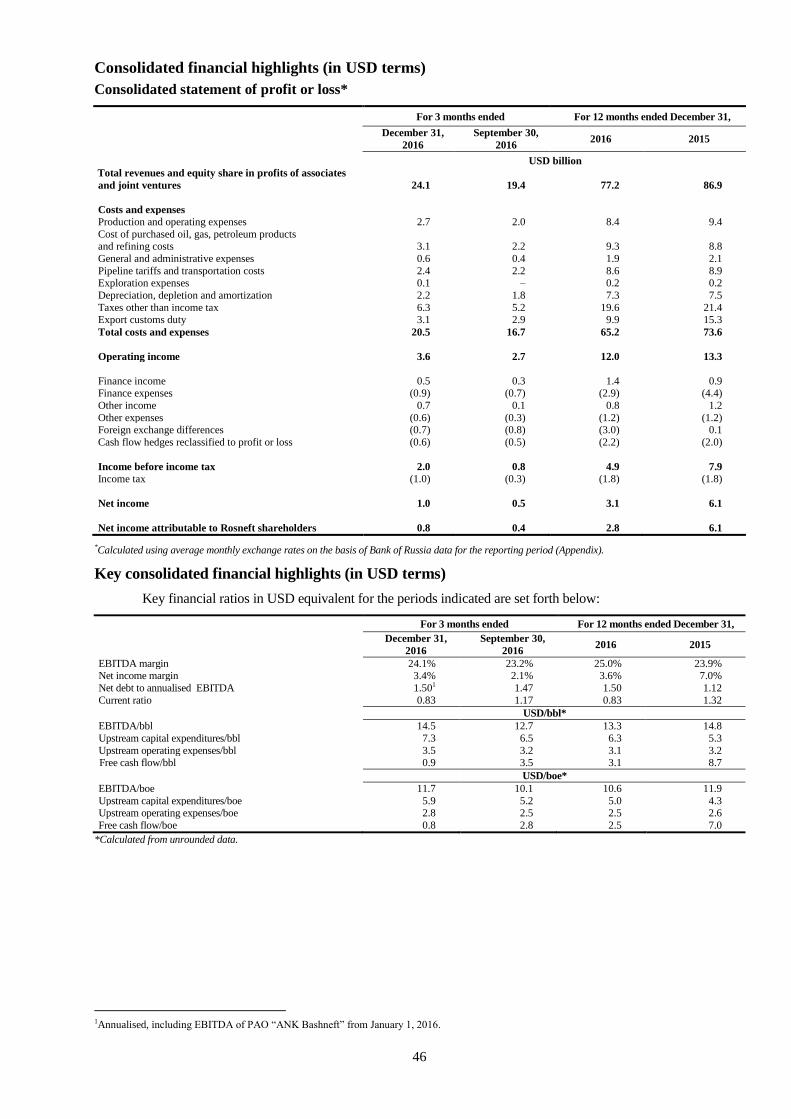
46
Consolidated financial highlights (in USD terms)
Consolidated statement of profit or loss*
For 3 months ended For 12 months ended December 31,
December 31,
2016
September 30,
2016 2016 2015
USD billion Total revenues and equity share in profits of associates
and joint ventures 24.1 19.4 77.2 86.9
Costs and expenses
Production and operating expenses 2.7 2.0 8.4 9.4
Cost of purchased oil, gas, petroleum products and refining costs 3.1 2.2 9.3 8.8
General and administrative expenses 0.6 0.4 1.9 2.1
Pipeline tariffs and transportation costs 2.4 2.2 8.6 8.9 Exploration expenses 0.1 – 0.2 0.2
Depreciation, depletion and amortization 2.2 1.8 7.3 7.5
Taxes other than income tax 6.3 5.2 19.6 21.4 Export customs duty 3.1 2.9 9.9 15.3
Total costs and expenses 20.5 16.7 65.2 73.6
Operating income 3.6 2.7 12.0 13.3
Finance income 0.5 0.3 1.4 0.9 Finance expenses (0.9) (0.7) (2.9) (4.4)
Other income 0.7 0.1 0.8 1.2
Other expenses (0.6) (0.3) (1.2) (1.2) Foreign exchange differences (0.7) (0.8) (3.0) 0.1
Cash flow hedges reclassified to profit or loss (0.6) (0.5) (2.2) (2.0)
Income before income tax 2.0 0.8 4.9 7.9
Income tax (1.0) (0.3) (1.8) (1.8)
Net income 1.0 0.5 3.1 6.1
Net income attributable to Rosneft shareholders 0.8 0.4 2.8 6.1
*Calculated using average monthly exchange rates on the basis of Bank of Russia data for the reporting period (Appendix).
Key consolidated financial highlights (in USD terms)
Key financial ratios in USD equivalent for the periods indicated are set forth below:
For 3 months ended For 12 months ended December 31,
December 31,
2016
September 30,
2016 2016 2015
EBITDA margin 24.1% 23.2% 25.0% 23.9% Net income margin 3.4% 2.1% 3.6% 7.0%
Net debt to annualised EBITDA 1.501 1.47 1.50 1.12
Current ratio 0.83 1.17 0.83 1.32
USD/bbl*
EBITDA/bbl 14.5 12.7 13.3 14.8
Upstream capital expenditures/bbl 7.3 6.5 6.3 5.3
Upstream operating expenses/bbl 3.5 3.2 3.1 3.2
Free cash flow/bbl 0.9 3.5 3.1 8.7
USD/boe*
EBITDA/boe 11.7 10.1 10.6 11.9
Upstream capital expenditures/boe 5.9 5.2 5.0 4.3 Upstream operating expenses/boe 2.8 2.5 2.5 2.6
Free cash flow/boe 0.8 2.8 2.5 7.0
*Calculated from unrounded data.
1Annualised, including EBITDA of PAO “ANK Bashneft” from January 1, 2016.
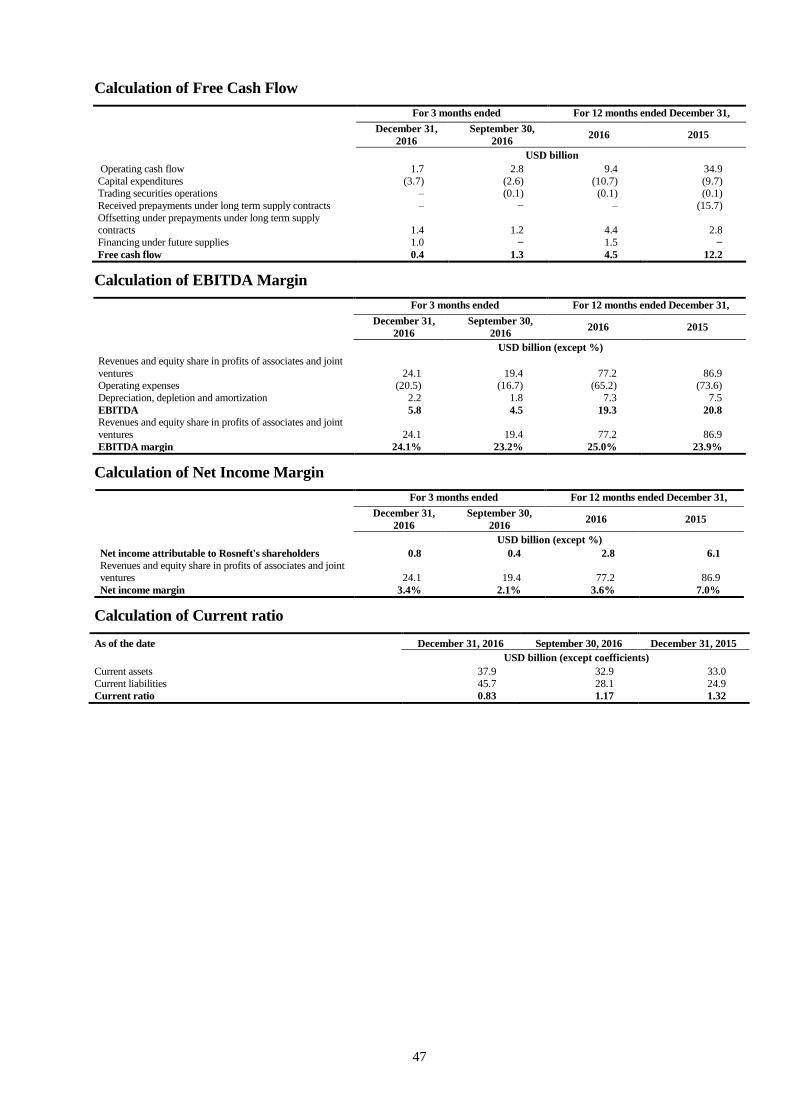
47
Calculation of Free Cash Flow
For 3 months ended For 12 months ended December 31,
December 31,
2016
September 30,
2016 2016 2015
USD billion
Operating cash flow 1.7 2.8 9.4 34.9
Capital expenditures (3.7) (2.6) (10.7) (9.7) Trading securities operations – (0.1) (0.1) (0.1)
Received prepayments under long term supply contracts – − – (15.7)
Offsetting under prepayments under long term supply contracts 1.4 1.2 4.4 2.8
Financing under future supplies 1.0 − 1.5 −
Free cash flow 0.4 1.3 4.5 12.2
Calculation of EBITDA Margin
For 3 months ended For 12 months ended December 31,
December 31,
2016
September 30,
2016 2016 2015
USD billion (except %)
Revenues and equity share in profits of associates and joint
ventures 24.1 19.4 77.2 86.9 Operating expenses (20.5) (16.7) (65.2) (73.6)
Depreciation, depletion and amortization 2.2 1.8 7.3 7.5
EBITDA 5.8 4.5 19.3 20.8
Revenues and equity share in profits of associates and joint
ventures 24.1 19.4 77.2 86.9
EBITDA margin 24.1% 23.2% 25.0% 23.9%
Calculation of Net Income Margin
For 3 months ended For 12 months ended December 31,
December 31,
2016
September 30,
2016 2016 2015
USD billion (except %)
Net income attributable to Rosneft's shareholders 0.8 0.4 2.8 6.1
Revenues and equity share in profits of associates and joint ventures 24.1 19.4 77.2 86.9
Net income margin 3.4% 2.1% 3.6% 7.0%
Calculation of Current ratio
As of the date December 31, 2016 September 30, 2016 December 31, 2015
USD billion (except coefficients)
Current assets 37.9 32.9 33.0
Current liabilities 45.7 28.1 24.9
Current ratio 0.83 1.17 1.32

48
Appendix: Average monthly RUB/US exchange rates, calculated using the Bank of Russia data
2016 2015
RUB/USD
January 76.31 61.88
February 77.23 64.68
March 70.51 60.26
April 66.69 52.93
May 65.67 50.59
June 65.31 54.51
July 64.34 57.08
August 64.93 65.20
September 64.60 66.77
Оctober 62.68 63.09
November 64.37 65.03
December 62.20 69.68
Related Documents