58 | MIGA ANNUAL REPORT 2012 Management’s Discussion and Analysis (FY12) Overview Development Activities Summary of Business Segments Outlook and Challenges Funding Sources Capital Management Investment Management Critical Accounting Policies Results of Operations Corporate Governance Financial Statements Management’s Report Regarding Effectiveness of Internal Controls Over External Financial Reporting Report of Independent Auditors on Management Assertion Regarding Effectiveness of Internal Controls Over External Financial Reporting Independent Auditors’ Report Balance Sheet Statement of Income Statement of Comprehensive Income Statement of Changes in Shareholders’ Equity Statement of Cash Flows Statement of Subscriptions to Capital Stock and Voting Power Statement of Guarantees Outstanding Notes to Financial Statements management’s discussion and analysis (fy12) financial statements

Welcome message from author
This document is posted to help you gain knowledge. Please leave a comment to let me know what you think about it! Share it to your friends and learn new things together.
Transcript
58 | MIGA ANNUAL REPORT 2012
Management’s Discussion and Analysis (FY12)
Overview Development Activities Summary of Business Segments Outlook and ChallengesFunding SourcesCapital ManagementInvestment ManagementCritical Accounting PoliciesResults of OperationsCorporate Governance
Financial Statements
Management’s Report Regarding Effectiveness of Internal Controls Over External Financial ReportingReport of Independent Auditors on Management Assertion Regarding Effectiveness of Internal Controls Over External Financial ReportingIndependent Auditors’ Report Balance Sheet Statement of Income Statement of Comprehensive IncomeStatement of Changes in Shareholders’ Equity Statement of Cash Flows Statement of Subscriptions to Capital Stock and Voting PowerStatement of Guarantees OutstandingNotes to Financial Statements
management’s discussion and analysis (fy12) financial statements
MIGA ANNUAL REPORT 2012 | 59
1 SmallerguaranteesmaybeunderwrittenthroughtheMIGA’sSmallInvestmentProgram(SIP),butSIPcoverageislimitedtotherisksoftransferrestriction,expropriation,andwarandcivildisturbance.
Overview
Established in 1988, the Multilateral Investment Guarantee Agency (MIGA or “the Agency”) is a member of the World Bank Group. The World Bank Group also includes the International Bank for Reconstruction and Development (IBRD), the International Development Association (IDA), the International Finance Corporation (IFC), and the International Centre for Settlement of Investment Disputes (ICSID). MIGA is a legal entity separate and distinct from IBRD, IDA, IFC, and ICSID, with its own charter (the “Convention”), share capital, financial structure, management, and staff. Membership in the Agency, which currently stands at 177 countries, is open to all members of IBRD.
MIGA’s mission is to promote foreign direct investment (FDI) into developing countries to support economic growth, reduce poverty, and improve people’s lives. To this end, the Agency acts as a multilateral risk mitigator, providing investors and lenders in the international investment com-munity with the level of comfort necessary to invest in developing countries. MIGA’s core business is the provision of political risk insurance (PRI). In addition, as part of its mandate, the Agency carries out complementary activities such as providing dispute resolution, technical assistance, and research and knowledge services to support FDI.
MIGA is committed to promoting projects that are economically, environmentally, and socially sustainable, and that promise a strong devel-opment impact. By providing PRI for foreign direct investment in developing countries, MIGA is able to play a critical role in supporting the World Bank Group’s broad strategic priorities.
Since its inception, MIGA has issued $27.2 billion of guarantees (including amounts issued under the Cooperative Underwriting Program), in support of 701 projects in 105 member countries. The Agency has also supported numerous technical assistance activities, as well as multiple programs at regional and global levels in member countries.
MIGA is financially self-sustaining, and its activities are supported by a strong capital base and a comprehensive risk management framework. The Agency prepares its financial statements in accordance with generally accepted accounting principles in the United States of America (US GAAP) as well as International Financial Reporting Standards (IFRS) as issued by the International Accounting Standards Board (IASB).
Development Activities
Summary of Business SegmentsMIGA seeks to fulfill its mission in developing member countries by offering PRI, investment dispute resolution, technical assistance, and research and knowledge services.
Political Risk Insurance MIGA provides investment guarantees against certain non-commercial and sovereign risks to eligible foreign investors for qualified investments in developing member countries. MIGA covers against the risks of 1) transfer restriction and inconvertibility, 2) expropriation, 3) breach of contract, 4) war and civil disturbance, and, 5) the non-honoring of a sovereign financial obligation. Investors may choose any combination of these covers 1
(see Box 1). MIGA insures new cross-border investments originating in any MIGA member country, destined for any developing member country. Types of investments that can be covered include equity, shareholder and non-shareholder loans, and loan guarantees (provided the loans have a minimum maturity of more than one year). Other forms of investments—such as technical assistance and management contracts, or franchising and licensing agreements—may also be eligible. Table 1 contains a summary of cumulative guarantees issued in member countries.
Box 1 – Risks Covered by MIGA Guarantees
MIGA provides PRI to eligible investors and lenders against the following non-commercial risks:
r Transfer restriction and inconvertibility – the risk of inconvertibility of local currency into foreign exchange for transfer outside the host country. Currency depreciation is not covered.
r Expropriation – the risk of partial or total loss of the insured investment as a result of acts by the host government that may reduce or eliminate ownership of, control over, or rights to the insured investment.
r War and civil disturbance – the risk of damage to, or the destruction or disappearance of, tangible covered assets caused by politically motivated acts of war or civil disturbance in the host country, including revolution, insurrection, coups d’état, sabotage and terrorism.
r Breach of contract – the risk of being unable to obtain or enforce an arbitral or judicial decision recognizing the breach of an obligation by the host government.
r Non-honoring of a sovereign financial obligation – the risk that a sovereign may fail to honor an unconditional financial payment obli-gation or guarantee, where the underlying project meets all of MIGA’s normal eligibility requirements. Unlike MIGA’s breach of contract coverage, this coverage does not require a final arbitral award or court decision as a precondition to payment of a claim.
60 | MIGA ANNUAL REPORT 2012
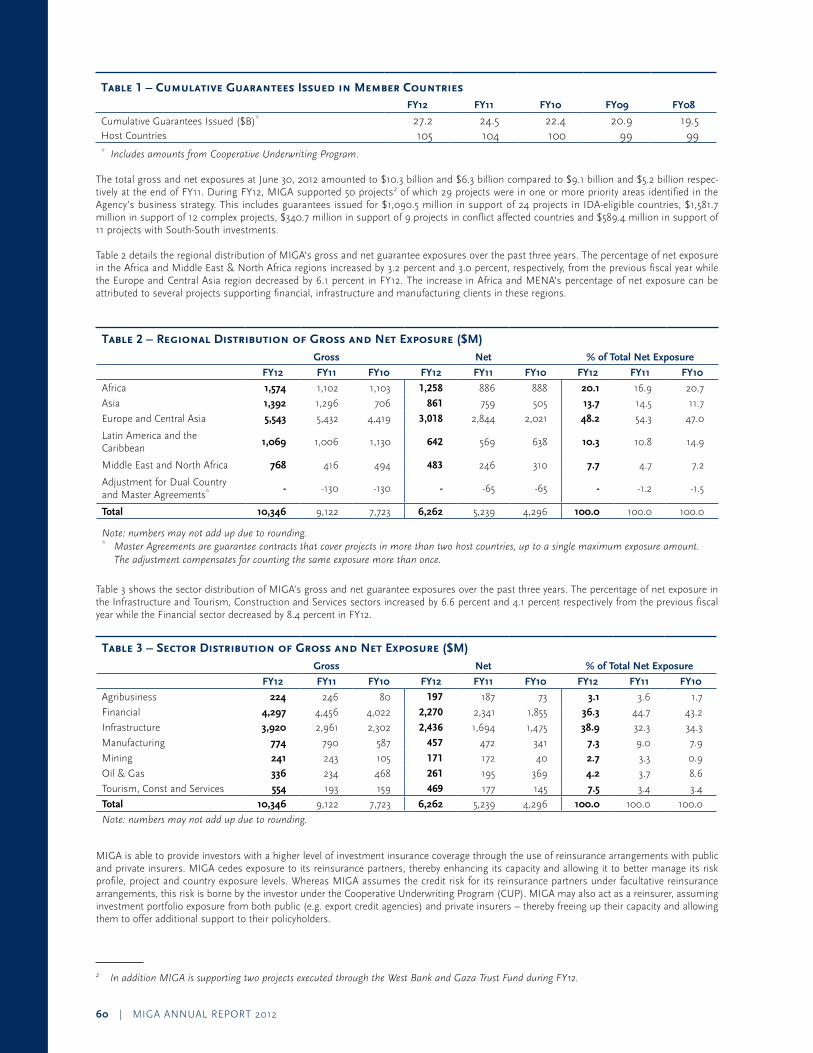
Table 1 – Cumulative Guarantees Issued in Member CountriesFY12 FY11 FY10 FY09 FY08
Cumulative Guarantees Issued ($B)* 27.2 24.5 22.4 20.9 19.5Host Countries 105 104 100 99 99*IncludesamountsfromCooperativeUnderwritingProgram.
The total gross and net exposures at June 30, 2012 amounted to $10.3 billion and $6.3 billion compared to $9.1 billion and $5.2 billion respec-tively at the end of FY11. During FY12, MIGA supported 50 projects2 of which 29 projects were in one or more priority areas identified in the Agency’s business strategy. This includes guarantees issued for $1,090.5 million in support of 24 projects in IDA-eligible countries, $1,581.7 million in support of 12 complex projects, $340.7 million in support of 9 projects in conflict affected countries and $589.4 million in support of 11 projects with South-South investments.
Table 2 details the regional distribution of MIGA’s gross and net guarantee exposures over the past three years. The percentage of net exposure in the Africa and Middle East & North Africa regions increased by 3.2 percent and 3.0 percent, respectively, from the previous fiscal year while the Europe and Central Asia region decreased by 6.1 percent in FY12. The increase in Africa and MENA’s percentage of net exposure can be attributed to several projects supporting financial, infrastructure and manufacturing clients in these regions.
Table 2 – Regional Distribution of Gross and Net Exposure ($M) Gross Net % of Total Net Exposure
FY12 FY11 FY10 FY12 FY11 FY10 FY12 FY11 FY10
Africa 1,574 1,102 1,103 1,258 886 888 20.1 16.9 20.7
Asia 1,392 1,296 706 861 759 505 13.7 14.5 11.7
Europe and Central Asia 5,543 5,432 4,419 3,018 2,844 2,021 48.2 54.3 47.0
Latin America and the Caribbean
1,069 1,006 1,130 642 569 638 10.3 10.8 14.9
Middle East and North Africa 768 416 494 483 246 310 7.7 4.7 7.2
Adjustment for Dual Country and Master Agreements* - -130 -130 - -65 -65 - -1.2 -1.5
Total 10,346 9,122 7,723 6,262 5,239 4,296 100.0 100.0 100.0
Note:numbersmaynotaddupduetorounding.*MasterAgreementsareguaranteecontractsthatcoverprojectsinmorethantwohostcountries,uptoasinglemaximumexposureamount.
Theadjustmentcompensatesforcountingthesameexposuremorethanonce.
Table 3 shows the sector distribution of MIGA’s gross and net guarantee exposures over the past three years. The percentage of net exposure in the Infrastructure and Tourism, Construction and Services sectors increased by 6.6 percent and 4.1 percent respectively from the previous fiscal year while the Financial sector decreased by 8.4 percent in FY12.
Table 3 – Sector Distribution of Gross and Net Exposure ($M) Gross Net % of Total Net Exposure
FY12 FY11 FY10 FY12 FY11 FY10 FY12 FY11 FY10
Agribusiness 224 246 80 197 187 73 3.1 3.6 1.7
Financial 4,297 4,456 4,022 2,270 2,341 1,855 36.3 44.7 43.2
Infrastructure 3,920 2,961 2,302 2,436 1,694 1,475 38.9 32.3 34.3
Manufacturing 774 790 587 457 472 341 7.3 9.0 7.9
Mining 241 243 105 171 172 40 2.7 3.3 0.9
Oil & Gas 336 234 468 261 195 369 4.2 3.7 8.6
Tourism, Const and Services 554 193 159 469 177 145 7.5 3.4 3.4
Total 10,346 9,122 7,723 6,262 5,239 4,296 100.0 100.0 100.0
Note:numbersmaynotaddupduetorounding.
MIGA is able to provide investors with a higher level of investment insurance coverage through the use of reinsurance arrangements with public and private insurers. MIGA cedes exposure to its reinsurance partners, thereby enhancing its capacity and allowing it to better manage its risk profile, project and country exposure levels. Whereas MIGA assumes the credit risk for its reinsurance partners under facultative reinsurance arrangements, this risk is borne by the investor under the Cooperative Underwriting Program (CUP). MIGA may also act as a reinsurer, assuming investment portfolio exposure from both public (e.g. export credit agencies) and private insurers – thereby freeing up their capacity and allowing them to offer additional support to their policyholders.
2 InadditionMIGAissupportingtwoprojectsexecutedthroughtheWestBankandGazaTrustFundduringFY12.
MIGA ANNUAL REPORT 2012 | 61
3 MIGA’scategorizationfordevelopingcountries;seeMIGAMemberCountrieslistintheAppendicessectionoftheAnnualReport
Technical Assistance (TA)MIGA supports the multi-donor Investment Climate Advisory Services of the World Bank Group, which helps governments design and implement reforms to improve their business environment and attract domestic and foreign investment. Investment Climate Advisory Services remains focused on IDA and conflict-affected countries.
MIGA’s financial contribution has supported projects that reduce policy impediments and provide support to governments in attracting new investors as well as retaining and expanding existing investments.
Research and Knowledge Services MIGA carries out research and disseminates information to promote investment in its developing member countries. This year MIGA’s flagship report WorldInvestmentandPoliticalRisk provided an in-depth analysis on the risk of expropriation—perceived risk, actual dimensions, and pre-ferred containment strategies. It found that the probability of disputes between governments and foreign investors is materially increased by an economic shock and/or significant political shift. It also addressed FDI in the Middle East and North Africa in light of the Arab Spring, as well as the reaction of multinational enterprises to those developments.
Investment Dispute ResolutionConsistent with Article 23 of the MIGA Convention, the Agency seeks both to remove impediments to the flow of investment to developing member countries and to encourage the settlement of disputes between investors and host governments. MIGA actively pursues the resolution of disputes affecting MIGA-supported projects. In many cases, these efforts focus on situations in which either a claim has been or is expected to be filed, but MIGA will also assist in resolving problems that are not related to its cover. During FY12, MIGA engaged with investors or governments in relation to projects located in Argentina, Guinea, Senegal, Rwanda, Sierra Leone, and Uganda.
In appropriate circumstances, the Agency will mediate disputes between states and investors not guaranteed by MIGA if such disputes inhibit the flow of additional investment to the country. In such circumstances, MIGA may seek compensation for these services and reimbursement for its costs in conducting the mediation.
Outlook and Challenges
Market TrendsThe contraction and low-growth in developed countries, especially in the euro zone, has prompted a shift in global investment patterns, with more investors and lenders seeking opportunities in riskier markets. More generally, the ongoing global volatility has prompted many investors to reevaluate their risk-mitigation strategies. MIGA’s guarantee holders continue to show a certain level of caution and risk aversion by maintaining their political risk coverage for existing projects for longer periods than in years prior.
Operational Priorities In FY11, MIGA’s Board of Directors, endorsed an updated Operational Directions paper, FY12-14Strategy:AchievingValue-DrivenVolume. This strategy reaffirmed MIGA’s commitments to the operational priorities that have guided the Agency since FY05:
r InvestmentsinIDAcountries, a key area of comparative advantage for MIGA. r Investmentsinconflict-affectedcountries, an area of increased engagement for the Agency over the past few years and where MIGA remains
strongly relevant. r Investmentsincomplexprojects, mostly in infrastructure and the extractive industries, often involving government intervention and resulting
in a delicate balance of risk-sharing by stakeholders. r SupportforinvestmentsbetweenMIGACategoryTwocountries3 (South-South investments), given the growing proportion of FDI coming
from developing countries and the need to provide underserved corporations with PRI
MIGA’s delivery of these operational priorities will be guided by the need to:
r SupportandcomplementWorldBankGroup strategies articulated for specific countries, as well as its strategic themes. r Beresponsivetoclientsandthemarket through greater flexibility in service and product delivery across all markets. r Promotefinancialsustainability which will require an efficient use of MIGA’s capital and the maintenance of a balanced portfolio.
Funding Sources
Subscribed CapitalMIGA derives its financial strength primarily from the capital it receives from its shareholders and its retained earnings.
MIGA’s Convention established MIGA’s authorized capital stock (membership shares) at 100,000 shares—equivalent to $1,082 million—with a provision that the authorized capital stock shall automatically increase upon the admission of a new member to the extent that the total number of authorized shares are sufficient to allow subscription by the new member. As of June 30, 2012 the total authorized shares increased to 186,259, equivalent to $2,015.3 million subscribed by 177 member countries. South Sudan and Niger completed their membership requirement during FY12.
As of June 30, 2012, the initial subscribed shares increased to 107,700, equivalent to $1,165.3 million. Of the initial membership shares subscribed, 20 percent or $233.1 million had been paid-in and the remaining 80 percent or $932.2 million was subject to call when needed by MIGA to meet its obligations. At June 30, 2012, $113.8 million is in the form of nonnegotiable, non-interest bearing demand obligations (promissory notes). The notes are denominated in freely convertible currencies and are due on demand to meet MIGA’s obligations. Since inception, MIGA has not encashed any of the promissory notes.
62 | MIGA ANNUAL REPORT 2012
As of June 30, 2012, cumulative subscriptions to the General Capital Increase (GCI) totaled 69,303 shares, equivalent to $749.8 million, and General Capital Increase (GCI) shares reserved through instruments of contribution totaled 6,959 shares, equivalent to $75.3 million. Of the GCI shares subscribed, $132.3 million has been paid-in and $617.5 million is callable.
As of June 30, 2012, MIGA’s total subscribed capital amounted to $1,915.1 million, of which $365.4 million was paid-in and $1,549.7 million was callable. Since its inception, no call has been made on MIGA’s callable capital. Any calls on unpaid subscriptions are uniform on all shares. If the amount received by MIGA on a call is insufficient to meet the obligations which necessitated the call, MIGA may make further calls until the amounts received are sufficient to meet such obligations. The liability of a member on a call or calls is limited to the unpaid balance of its capital subscription.
Equity Total shareholders’ equity as reported in MIGA’s balance sheet as of June 30, 2012 was $905.2 million compared with $924.0 million as of June 30, 2011. This amount consists of subscribed capital, less uncalled portions of subscriptions, plus retained earnings and accumulated other compre-hensive income (loss). The decrease of $18.8 million in FY12 reflects increased retained earnings of $5.9 million, an increase in accumulated other comprehensive loss of $25.1 million and an increase in subscribed capital $0.4 million.
Capital Management
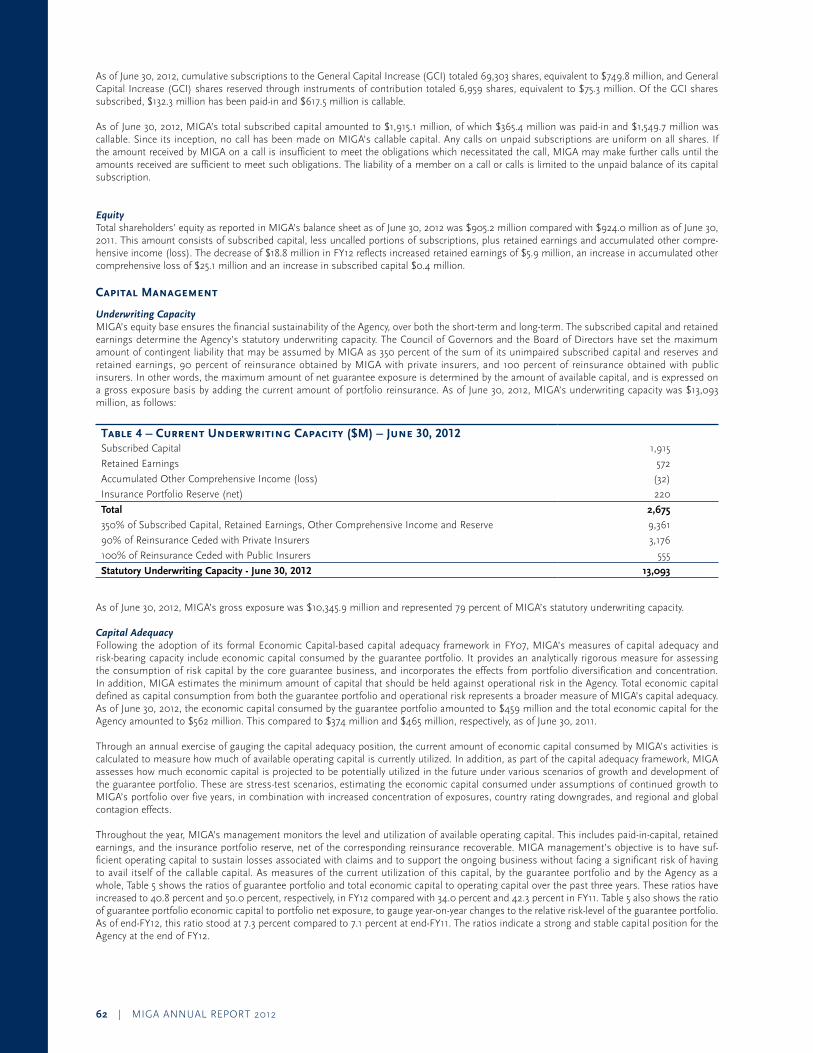
Underwriting Capacity MIGA’s equity base ensures the financial sustainability of the Agency, over both the short-term and long-term. The subscribed capital and retained earnings determine the Agency’s statutory underwriting capacity. The Council of Governors and the Board of Directors have set the maximum amount of contingent liability that may be assumed by MIGA as 350 percent of the sum of its unimpaired subscribed capital and reserves and retained earnings, 90 percent of reinsurance obtained by MIGA with private insurers, and 100 percent of reinsurance obtained with public insurers. In other words, the maximum amount of net guarantee exposure is determined by the amount of available capital, and is expressed on a gross exposure basis by adding the current amount of portfolio reinsurance. As of June 30, 2012, MIGA’s underwriting capacity was $13,093 million, as follows:
Table 4 – Current Underwriting Capacity ($M) – June 30, 2012 Subscribed Capital 1,915
Retained Earnings 572
Accumulated Other Comprehensive Income (loss) (32)
Insurance Portfolio Reserve (net) 220
Total 2,675
350% of Subscribed Capital, Retained Earnings, Other Comprehensive Income and Reserve 9,361
90% of Reinsurance Ceded with Private Insurers 3,176
100% of Reinsurance Ceded with Public Insurers 555
Statutory Underwriting Capacity - June 30, 2012 13,093
As of June 30, 2012, MIGA’s gross exposure was $10,345.9 million and represented 79 percent of MIGA’s statutory underwriting capacity.
Capital Adequacy Following the adoption of its formal Economic Capital-based capital adequacy framework in FY07, MIGA’s measures of capital adequacy and risk-bearing capacity include economic capital consumed by the guarantee portfolio. It provides an analytically rigorous measure for assessing the consumption of risk capital by the core guarantee business, and incorporates the effects from portfolio diversification and concentration. In addition, MIGA estimates the minimum amount of capital that should be held against operational risk in the Agency. Total economic capital defined as capital consumption from both the guarantee portfolio and operational risk represents a broader measure of MIGA’s capital adequacy. As of June 30, 2012, the economic capital consumed by the guarantee portfolio amounted to $459 million and the total economic capital for the Agency amounted to $562 million. This compared to $374 million and $465 million, respectively, as of June 30, 2011.
Through an annual exercise of gauging the capital adequacy position, the current amount of economic capital consumed by MIGA’s activities is calculated to measure how much of available operating capital is currently utilized. In addition, as part of the capital adequacy framework, MIGA assesses how much economic capital is projected to be potentially utilized in the future under various scenarios of growth and development of the guarantee portfolio. These are stress-test scenarios, estimating the economic capital consumed under assumptions of continued growth to MIGA’s portfolio over five years, in combination with increased concentration of exposures, country rating downgrades, and regional and global contagion effects.
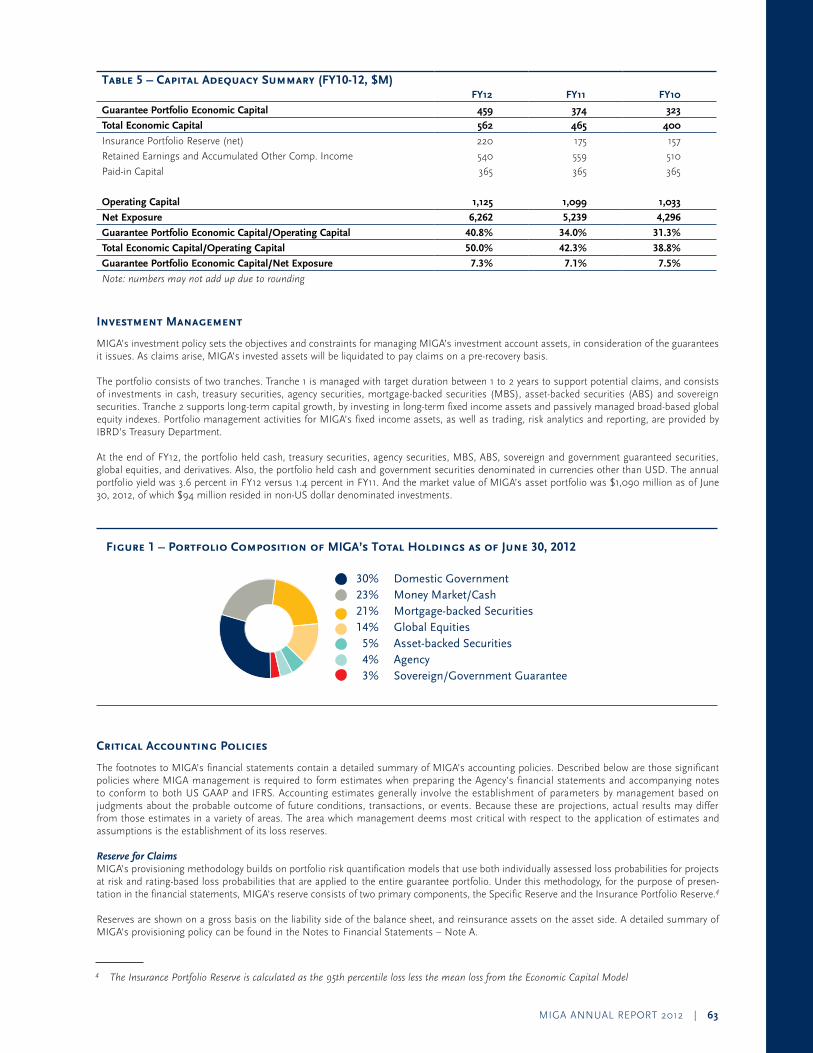
Throughout the year, MIGA’s management monitors the level and utilization of available operating capital. This includes paid-in-capital, retained earnings, and the insurance portfolio reserve, net of the corresponding reinsurance recoverable. MIGA management’s objective is to have suf-ficient operating capital to sustain losses associated with claims and to support the ongoing business without facing a significant risk of having to avail itself of the callable capital. As measures of the current utilization of this capital, by the guarantee portfolio and by the Agency as a whole, Table 5 shows the ratios of guarantee portfolio and total economic capital to operating capital over the past three years. These ratios have increased to 40.8 percent and 50.0 percent, respectively, in FY12 compared with 34.0 percent and 42.3 percent in FY11. Table 5 also shows the ratio of guarantee portfolio economic capital to portfolio net exposure, to gauge year-on-year changes to the relative risk-level of the guarantee portfolio. As of end-FY12, this ratio stood at 7.3 percent compared to 7.1 percent at end-FY11. The ratios indicate a strong and stable capital position for the Agency at the end of FY12.
MIGA ANNUAL REPORT 2012 | 63
Table 5 – Capital Adequacy Summary (FY10-12, $M) FY12 FY11 FY10
Guarantee Portfolio Economic Capital 459 374 323
Total Economic Capital 562 465 400
Insurance Portfolio Reserve (net) 220 175 157
Retained Earnings and Accumulated Other Comp. Income 540 559 510
Paid-in Capital 365 365 365
Operating Capital 1,125 1,099 1,033
Net Exposure 6,262 5,239 4,296
Guarantee Portfolio Economic Capital/Operating Capital 40.8% 34.0% 31.3%
Total Economic Capital/Operating Capital 50.0% 42.3% 38.8%
Guarantee Portfolio Economic Capital/Net Exposure 7.3% 7.1% 7.5%
Note:numbersmaynotaddupduetorounding
Investment Management
MIGA’s investment policy sets the objectives and constraints for managing MIGA’s investment account assets, in consideration of the guarantees it issues. As claims arise, MIGA’s invested assets will be liquidated to pay claims on a pre-recovery basis.
The portfolio consists of two tranches. Tranche 1 is managed with target duration between 1 to 2 years to support potential claims, and consists of investments in cash, treasury securities, agency securities, mortgage-backed securities (MBS), asset-backed securities (ABS) and sovereign securities. Tranche 2 supports long-term capital growth, by investing in long-term fixed income assets and passively managed broad-based global equity indexes. Portfolio management activities for MIGA’s fixed income assets, as well as trading, risk analytics and reporting, are provided by IBRD’s Treasury Department.
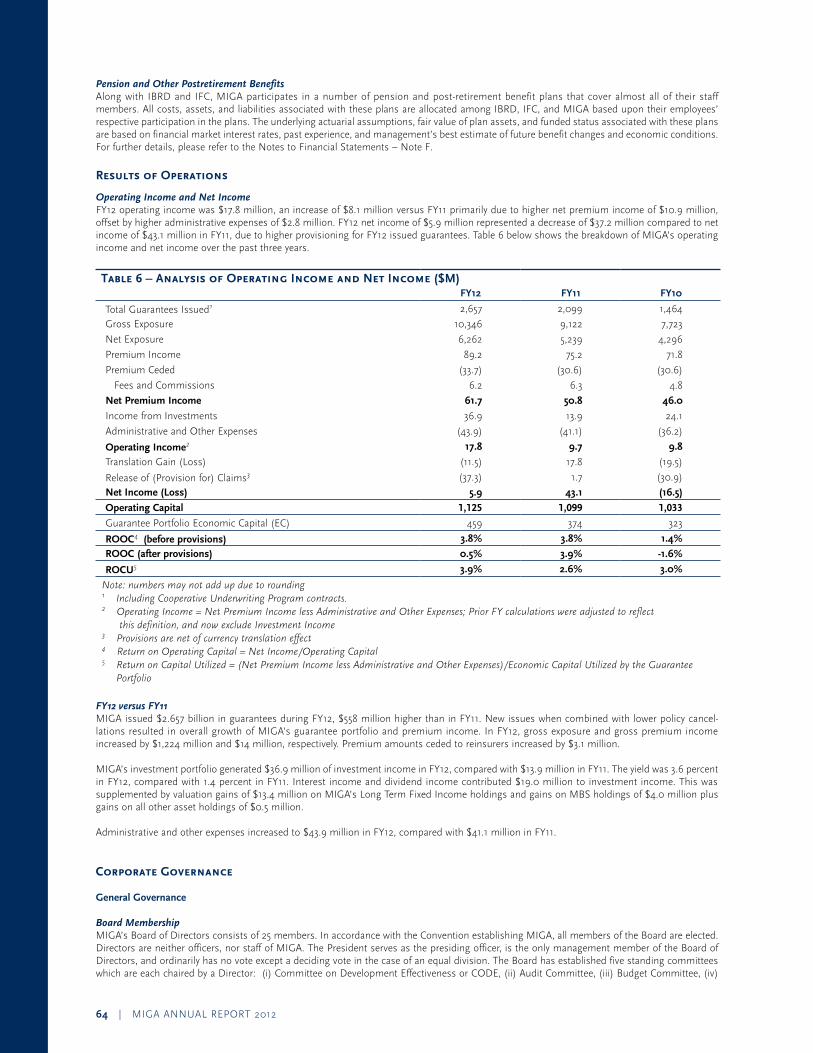
At the end of FY12, the portfolio held cash, treasury securities, agency securities, MBS, ABS, sovereign and government guaranteed securities, global equities, and derivatives. Also, the portfolio held cash and government securities denominated in currencies other than USD. The annual portfolio yield was 3.6 percent in FY12 versus 1.4 percent in FY11. And the market value of MIGA’s asset portfolio was $1,090 million as of June 30, 2012, of which $94 million resided in non-US dollar denominated investments.
Figure 1 – Portfolio Composition of MIGA’s Total Holdings as of June 30, 2012
Critical Accounting Policies
The footnotes to MIGA’s financial statements contain a detailed summary of MIGA’s accounting policies. Described below are those significant policies where MIGA management is required to form estimates when preparing the Agency’s financial statements and accompanying notes to conform to both US GAAP and IFRS. Accounting estimates generally involve the establishment of parameters by management based on judgments about the probable outcome of future conditions, transactions, or events. Because these are projections, actual results may differ from those estimates in a variety of areas. The area which management deems most critical with respect to the application of estimates and assumptions is the establishment of its loss reserves.
Reserve for ClaimsMIGA’s provisioning methodology builds on portfolio risk quantification models that use both individually assessed loss probabilities for projects at risk and rating-based loss probabilities that are applied to the entire guarantee portfolio. Under this methodology, for the purpose of presen-tation in the financial statements, MIGA’s reserve consists of two primary components, the Specific Reserve and the Insurance Portfolio Reserve.4
Reserves are shown on a gross basis on the liability side of the balance sheet, and reinsurance assets on the asset side. A detailed summary of MIGA’s provisioning policy can be found in the Notes to Financial Statements – Note A.
30% Domestic Government 23% Money Market/Cash 21% Mortgage-backed Securities 14% Global Equities 5% Asset-backed Securities 4% Agency 3% Sovereign/Government Guarantee
4 TheInsurancePortfolioReserveiscalculatedasthe95thpercentilelosslessthemeanlossfromtheEconomicCapitalModel
64 | MIGA ANNUAL REPORT 2012
Pension and Other Postretirement BenefitsAlong with IBRD and IFC, MIGA participates in a number of pension and post-retirement benefit plans that cover almost all of their staff members. All costs, assets, and liabilities associated with these plans are allocated among IBRD, IFC, and MIGA based upon their employees’ respective participation in the plans. The underlying actuarial assumptions, fair value of plan assets, and funded status associated with these plans are based on financial market interest rates, past experience, and management’s best estimate of future benefit changes and economic conditions. For further details, please refer to the Notes to Financial Statements – Note F.
Results of Operations
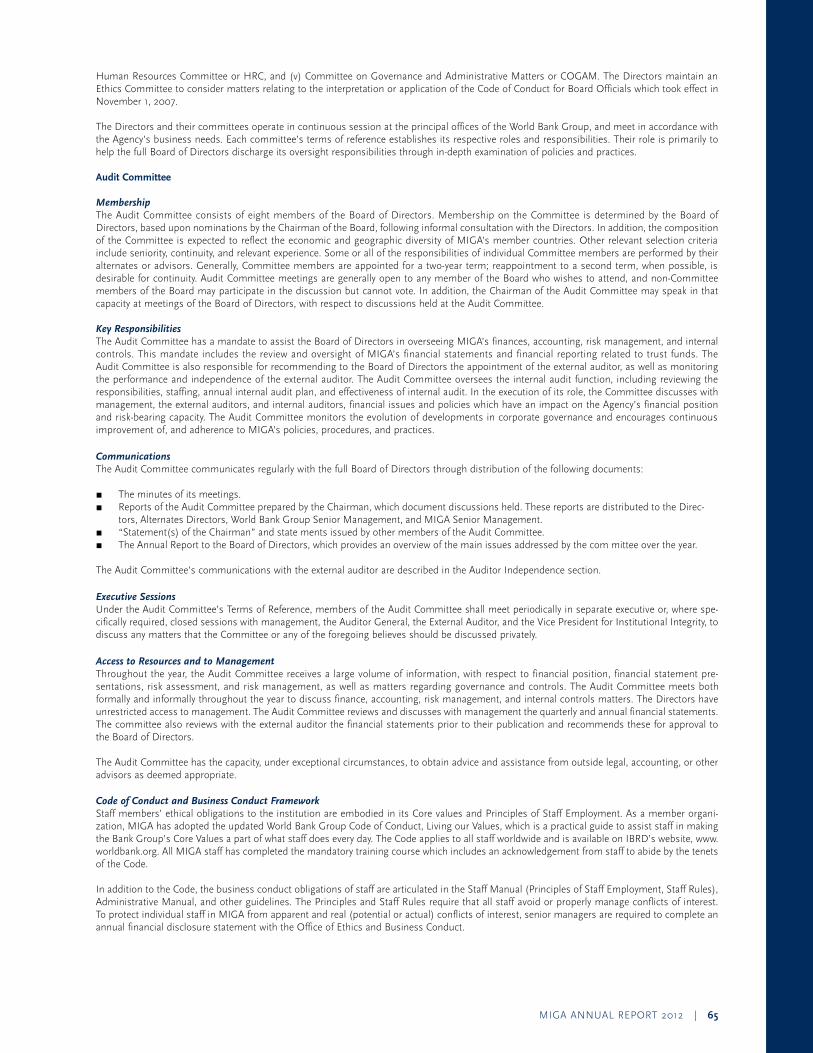
Operating Income and Net IncomeFY12 operating income was $17.8 million, an increase of $8.1 million versus FY11 primarily due to higher net premium income of $10.9 million, offset by higher administrative expenses of $2.8 million. FY12 net income of $5.9 million represented a decrease of $37.2 million compared to net income of $43.1 million in FY11, due to higher provisioning for FY12 issued guarantees. Table 6 below shows the breakdown of MIGA’s operating income and net income over the past three years.
Table 6 – Analysis of Operating Income and Net Income ($M) FY12 FY11 FY10
Total Guarantees Issued1 2,657 2,099 1,464
Gross Exposure 10,346 9,122 7,723
Net Exposure 6,262 5,239 4,296
Premium Income 89.2 75.2 71.8
Premium Ceded (33.7) (30.6) (30.6)
Fees and Commissions 6.2 6.3 4.8
Net Premium Income 61.7 50.8 46.0
Income from Investments 36.9 13.9 24.1
Administrative and Other Expenses (43.9) (41.1) (36.2)
Operating Income2 17.8 9.7 9.8
Translation Gain (Loss) (11.5) 17.8 (19.5)
Release of (Provision for) Claims3 (37.3) 1.7 (30.9)
Net Income (Loss) 5.9 43.1 (16.5)
Operating Capital 1,125 1,099 1,033
Guarantee Portfolio Economic Capital (EC) 459 374 323
ROOC4 (before provisions) 3.8% 3.8% 1.4%
ROOC (after provisions) 0.5% 3.9% -1.6%
ROCU5 3.9% 2.6% 3.0%
Note:numbersmaynotaddupduetorounding1IncludingCooperativeUnderwritingProgramcontracts.2OperatingIncome=NetPremiumIncomelessAdministrativeandOtherExpenses;PriorFYcalculationswereadjustedtoreflectthisdefinition,andnowexcludeInvestmentIncome3Provisionsarenetofcurrencytranslationeffect4ReturnonOperatingCapital=NetIncome/OperatingCapital5ReturnonCapitalUtilized=(NetPremiumIncomelessAdministrativeandOtherExpenses)/EconomicCapitalUtilizedbytheGuarantee
Portfolio
FY12 versus FY11MIGA issued $2.657 billion in guarantees during FY12, $558 million higher than in FY11. New issues when combined with lower policy cancel-lations resulted in overall growth of MIGA’s guarantee portfolio and premium income. In FY12, gross exposure and gross premium income increased by $1,224 million and $14 million, respectively. Premium amounts ceded to reinsurers increased by $3.1 million.
MIGA’s investment portfolio generated $36.9 million of investment income in FY12, compared with $13.9 million in FY11. The yield was 3.6 percent in FY12, compared with 1.4 percent in FY11. Interest income and dividend income contributed $19.0 million to investment income. This was supplemented by valuation gains of $13.4 million on MIGA’s Long Term Fixed Income holdings and gains on MBS holdings of $4.0 million plus gains on all other asset holdings of $0.5 million.
Administrative and other expenses increased to $43.9 million in FY12, compared with $41.1 million in FY11.
Corporate Governance
General Governance
Board Membership MIGA’s Board of Directors consists of 25 members. In accordance with the Convention establishing MIGA, all members of the Board are elected. Directors are neither officers, nor staff of MIGA. The President serves as the presiding officer, is the only management member of the Board of Directors, and ordinarily has no vote except a deciding vote in the case of an equal division. The Board has established five standing committees which are each chaired by a Director: (i) Committee on Development Effectiveness or CODE, (ii) Audit Committee, (iii) Budget Committee, (iv)
MIGA ANNUAL REPORT 2012 | 65
Human Resources Committee or HRC, and (v) Committee on Governance and Administrative Matters or COGAM. The Directors maintain an Ethics Committee to consider matters relating to the interpretation or application of the Code of Conduct for Board Officials which took effect in November 1, 2007.
The Directors and their committees operate in continuous session at the principal offices of the World Bank Group, and meet in accordance with the Agency’s business needs. Each committee’s terms of reference establishes its respective roles and responsibilities. Their role is primarily to help the full Board of Directors discharge its oversight responsibilities through in-depth examination of policies and practices.
Audit Committee
MembershipThe Audit Committee consists of eight members of the Board of Directors. Membership on the Committee is determined by the Board of Directors, based upon nominations by the Chairman of the Board, following informal consultation with the Directors. In addition, the composition of the Committee is expected to reflect the economic and geographic diversity of MIGA’s member countries. Other relevant selection criteria include seniority, continuity, and relevant experience. Some or all of the responsibilities of individual Committee members are performed by their alternates or advisors. Generally, Committee members are appointed for a two-year term; reappointment to a second term, when possible, is desirable for continuity. Audit Committee meetings are generally open to any member of the Board who wishes to attend, and non-Committee members of the Board may participate in the discussion but cannot vote. In addition, the Chairman of the Audit Committee may speak in that capacity at meetings of the Board of Directors, with respect to discussions held at the Audit Committee.
Key ResponsibilitiesThe Audit Committee has a mandate to assist the Board of Directors in overseeing MIGA’s finances, accounting, risk management, and internal controls. This mandate includes the review and oversight of MIGA’s financial statements and financial reporting related to trust funds. The Audit Committee is also responsible for recommending to the Board of Directors the appointment of the external auditor, as well as monitoring the performance and independence of the external auditor. The Audit Committee oversees the internal audit function, including reviewing the responsibilities, staffing, annual internal audit plan, and effectiveness of internal audit. In the execution of its role, the Committee discusses with management, the external auditors, and internal auditors, financial issues and policies which have an impact on the Agency’s financial position and risk-bearing capacity. The Audit Committee monitors the evolution of developments in corporate governance and encourages continuous improvement of, and adherence to MIGA’s policies, procedures, and practices.
CommunicationsThe Audit Committee communicates regularly with the full Board of Directors through distribution of the following documents:
r The minutes of its meetings. r Reports of the Audit Committee prepared by the Chairman, which document discussions held. These reports are distributed to the Direc-
tors, Alternates Directors, World Bank Group Senior Management, and MIGA Senior Management. r “Statement(s) of the Chairman” and state¬ments issued by other members of the Audit Committee. r The Annual Report to the Board of Directors, which provides an overview of the main issues addressed by the com¬mittee over the year.
The Audit Committee’s communications with the external auditor are described in the Auditor Independence section.
Executive SessionsUnder the Audit Committee’s Terms of Reference, members of the Audit Committee shall meet periodically in separate executive or, where spe-cifically required, closed sessions with management, the Auditor General, the External Auditor, and the Vice President for Institutional Integrity, to discuss any matters that the Committee or any of the foregoing believes should be discussed privately.
Access to Resources and to ManagementThroughout the year, the Audit Committee receives a large volume of information, with respect to financial position, financial statement pre-sentations, risk assessment, and risk management, as well as matters regarding governance and controls. The Audit Committee meets both formally and informally throughout the year to discuss finance, accounting, risk management, and internal controls matters. The Directors have unrestricted access to management. The Audit Committee reviews and discusses with management the quarterly and annual financial statements. The committee also reviews with the external auditor the financial statements prior to their publication and recommends these for approval to the Board of Directors.
The Audit Committee has the capacity, under exceptional circumstances, to obtain advice and assistance from outside legal, accounting, or other advisors as deemed appropriate.
Code of Conduct and Business Conduct FrameworkStaff members’ ethical obligations to the institution are embodied in its Core values and Principles of Staff Employment. As a member organi-zation, MIGA has adopted the updated World Bank Group Code of Conduct, Living our Values, which is a practical guide to assist staff in making the Bank Group’s Core Values a part of what staff does every day. The Code applies to all staff worldwide and is available on IBRD’s website, www.worldbank.org. All MIGA staff has completed the mandatory training course which includes an acknowledgement from staff to abide by the tenets of the Code.
In addition to the Code, the business conduct obligations of staff are articulated in the Staff Manual (Principles of Staff Employment, Staff Rules), Administrative Manual, and other guidelines. The Principles and Staff Rules require that all staff avoid or properly manage conflicts of interest. To protect individual staff in MIGA from apparent and real (potential or actual) conflicts of interest, senior managers are required to complete an annual financial disclosure statement with the Office of Ethics and Business Conduct.

66 | MIGA ANNUAL REPORT 2012
Guidance for staff is also provided through programs, training materials, and other resources. Managers are responsible for ensuring that internal systems, policies, and procedures are consistently aligned with MIGA’s business conduct framework. The following World Bank Group units assist in communicating business conduct expectations to staff:
r The Office of Ethics and Business Conduct (EBC) provides leadership, management and oversight for MIGA’s ethics infrastructure including the Ethics HelpLine, a consolidated conflicts of interest disclosure/resolu¬tion system, financial disclosure, ongoing training to both internal and external audi¬ences, and communication resources. This office has the mandate to review and assist in the resolution of allegations of staff misconduct.
r The Integrity Vice Presidency (INT) is charged with investigating allegations of fraud and corruption in projects benefiting from World Bank Group funding or guarantees. It also trains and educates staff and clients in detecting and reporting fraud and corruption.
Both EBC and INT report directly to the President and is composed of professionals from a range of disciplines including financial analysts, re-searchers, investigators, lawyers, prosecutors, forensic accountants, and staff with operational experience across the World Bank Group. These units maintain comprehensive websites to provide guidance on how to handle concerns.
Auditor IndependenceThe Board of Directors adopted a set of principles applicable to the appointment of the external auditor for the World Bank Group. Key features of those principles include:
r Prohibition of the external auditor from the provision of all non audit-related services r All audit-related services must be pre-approved on a case-by-case basis by the Board of Directors, upon recom¬mendation by the Audit Com-
mittee r Rebidding of the external audit contract every five years r Prohibition of any firm serving as external auditors for more than two consecutive five-year terms r Mandatory rotation of the senior partner after five years r An evaluation of the performance of the external auditor at the mid-point of the five year term
The external auditor is appointed to a five-year term of service. This is subject to annual reappointment based on the recommendation of the Audit Committee and approval of a resolution by the Executive Directors. The Board of Executive Directors approved the appointment of KPMG as the World Bank Group’s auditors for a five-year term commencing FY09.
As standard practice, the external auditor is invited as an observer to attend all Audit Committee meetings and is frequently asked to present its perspective on issues. In addition, the Audit Committee meets periodically with the external auditor in private sessions without the presence of management. Communication between the external auditor and the Audit Committee is ongoing, as frequently as is deemed necessary by either party. MIGA’s external auditors follow the communication requirements with audit committees set out under US Generally Accepted Auditing Standards and International Standards on Auditing. In keeping with these standards, significant formal communications include:
r Quarterly and annual financial statement reporting r Annual appointment of the external auditors r Presentation of the external audit plan r Presentation of control recommendations and discussion of the Internal Control over Financial Reporting (ICFR) attestation and report r Presentation of a statement regarding independence
In addition to committee meetings, individual members of the Audit Committee have independent access to the external auditor.
MIGA ANNUAL REPORT 2012 | 67
Management’s Report Regarding Effectiveness of Internal Controls Over External Financial Reporting

68 | MIGA ANNUAL REPORT 2012
Management’s Report Regarding Effectiveness of Internal Controls Over External Financial Reporting (cont’d)
MIGA ANNUAL REPORT 2012 | 69
Report of Independent Auditors on Management Assertion Regarding Effectiveness of Internal Controls Over External Financial Reporting
70 | MIGA ANNUAL REPORT 2012
Report Of Independent Auditors on Management Assertion Regarding Effectiveness Of Internal Controls Over External Financial Reporting (cont’d)

MIGA ANNUAL REPORT 2012 | 71
Independent Auditors’ Report

72 | MIGA ANNUAL REPORT 2012
Balance Sheet June 30, 2012 and June 30, 2011, expressed in thousands of US dollars
FY12 FY11
ASSETS
CASH $10,485 $11,049
INVESTMENTS - Trading (including securities transferred under repurchase agreements) - Note B
1,091,326 1,105,559
Securities purchased under resale agreements - Note B 13,000 -
Derivative Assets - Note B 282,918 115,120
NONNEGOTIABLE, NONINTEREST-BEARING DEMAND OBLIGATIONS - Note C 113,794 115,088
OTHER ASSETS
Receivable for investment securities sold - Note B 1,475 12,646
Estimated reinsurance recoverables - Note E 52,900 40,300
Prepaid premiums ceded to reinsurers 34,384 33,327
Net assets under retirement benefits plans - Note F 9,248 27,546
Miscellaneous 12,908 2,017
110,915 115,836
TOTAL ASSETS $1,622,438 $1,462,652
Liabilities and Shareholders’ Equity
LIABILITIES
Payable for investment securities purchased - Note B $4,641 $57,185
Securities sold under repurchase agreements - Note B 15,190 26,674
Derivative liabilities - Note B 282,050 115,342
Accounts payable and accrued expenses 43,695 43,294
Unearned premiums and commitment fees 93,432 67,811
Reserve for claims - Note E
Specific reserve for claims 7,700 17,100
Insurance portfolio reserve 270,500 211,200
Reserve for claims - gross 278,200 228,300
Total liabilities 717,208 538,606
CONTINGENT LIABILITIES – Note D
SHAREHOLDERS’ EQUITY
Capital stock – Note C
Authorized capital (186,259 shares - June 30, 2012; 186,042 shares-June 30, 2011)
Subscribed capital (177,003 shares- June 30, 2012; 176,786 shares-June 30, 2011) 1,915,172 1,912,825
Less uncalled portion of subscriptions 1,549,759 1,547,882
365,413 364,943
Payments on account of pending subscriptions - 67
365,413 365,010
Retained earnings 572,271 566,376
Accumulated other comprehensive loss (32,454) (7,340)
Total shareholders’ equity 905,230 924,046
TOTAL LIABILITIES AND SHAREHOLDERS’ EQUITY $1,622,438 $1,462,652
Seeaccompanyingnotestothefinancialstatements

MIGA ANNUAL REPORT 2012 | 73
Statement of Income For the fiscal years ended June 30, 2012 and June 30, 2011, expressed in thousands of US dollars
FY12 FY11
INCOME
Income from guarantees
Premium income - Note D $89,179 $75,195
Premium ceded - Note D (33,681) (30,630)
Fees and commissions 6,206 6,260
Total 61,704 50,825
Income from investments - Note B 36,898 13,850
Translation (losses) gains (11,523) 17,843
Total income 87,079 82,518
EXPENSES
Provision for (release of) claims - Note E 37,300 (1,700)
Administrative expenses 43,884 41,079
Total expenses 81,184 39,379
NET INCOME $5,895 $43,139
Statement of Comprehensive Income For the fiscal years ended June 30, 2012 and June 30, 2011, expressed in thousands of US dollars
FY12 FY11
NET INCOME $5,895 $43,139
OTHER COMPREHENSIVE (LOSS) INCOME
Change in unrecognized net actuarial (losses) gains on benefit plans (23,758) 5,449
Change in unrecognized prior service (costs) credits on benefit plans (1,356) 118
Total other comprehensive (loss) income (25,114) 5,567
COMPREHENSIVE (LOSS) INCOME $(19,219) $48,706
Seeaccompanyingnotestothefinancialstatements

74 | MIGA ANNUAL REPORT 2012
Statement of Changes in Shareholders’ Equity For the fiscal years ended June 30, 2012 and June 30, 2011, expressed in thousands of US dollars
FY12 FY11
CAPITAL STOCK
Balance at beginning of the fiscal year $365,010 $365,010
Paid-In subscriptions 403 -
Ending Balance $365,413 365,010
RETAINED EARNINGS
Balance at beginning of the fiscal year 566,376 523,237
Net income 5,895 43,139
Ending Balance 572,271 566,376
TOTAL ACCUMULATED OTHER COMPREHENSIVE LOSS
Balance at beginning of the fiscal year (7,340) (12,907)
Other comprehensive (loss) income (25,114) 5,567
Ending Balance (32,454) (7,340)
TOTAL SHAREHOLDERS’ EQUITY $905,230 $924,046
Statement of Cash Flows For the fiscal years ended June 30, 2012 and June 30, 2011, expressed in thousands of US dollars
FY12 FY11
CASH FLOWS FROM OPERATING ACTIVITIES:
Net income $5,895 $43,139
Adjustments to reconcile net income to net cash (used in) provided by operating activities:
Provision for (release of) claims - Note E 37,300 (1,700)
Translation losses/(gains) 11,523 (17,843)
Net changes in:
Investments - Trading (52,951) (56,197)
Other assets, excluding investment receivables (2,424) (13,882)
Accounts payable and accrued expenses (29,371) 21,462
Unearned premiums and commitment fees 30,254 26,400
Net cash provided by operating activities 226 1,379
CASH FLOWS FROM FINANCING ACTIVITIES:
Capital subscription payments 168 -
Net cash provided by financing activities 168 -
EFFECT OF EXCHANGE RATE CHANGES ON CASH (958) 748
Net (decrease) increase in cash (564) 2,127
Cash at beginning of the fiscal year 11,049 8,922
CASH AT END OF THE FISCAL YEAR $10,485 $11,049
Seeaccompanyingnotestothefinancialstatements

MIGA ANNUAL REPORT 2012 | 75
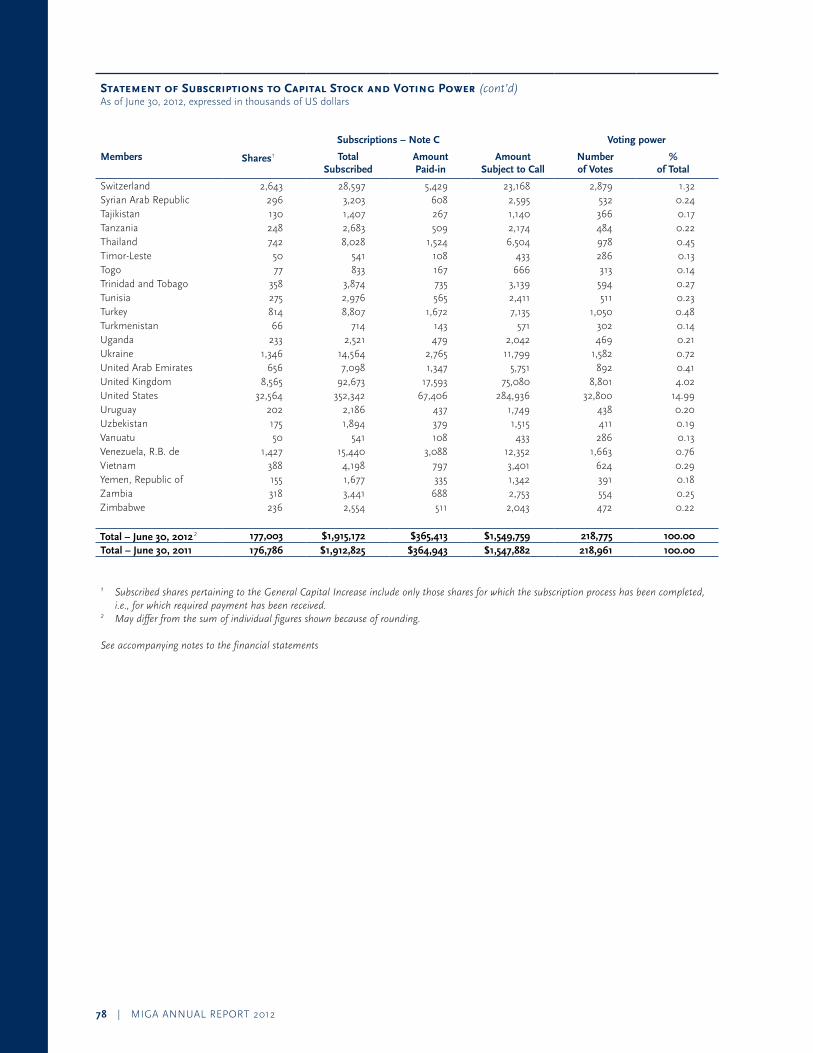
Statement of Subscriptions to Capital Stock and Voting Power As of June 30, 2012, expressed in thousands of US dollars
Subscriptions – Note C Voting power
Members Shares1 Total Subscribed
Amount Paid-in
Amount Subject to Call
Numberof Votes
% of Total
Afghanistan 118 $1,277 $255 $1,022 354 0.16 Albania 102 1,104 210 894 338 0.15 Algeria 1,144 12,378 2,350 10,028 1,380 0.63 Angola 187 2,023 405 1,618 423 0.19 Antigua and Barbuda 50 541 108 433 286 0.13 Argentina 2,210 23,912 4,539 19,373 2,446 1.12 Armenia 80 866 173 693 316 0.14 Australia 3,019 32,666 6,201 26,465 3,255 1.49 Austria 1,366 14,780 2,806 11,974 1,602 0.73 Azerbaijan 115 1,244 249 995 351 0.16 Bahamas, The 176 1,904 362 1,542 412 0.19 Bahrain 136 1,472 279 1,193 372 0.17 Bangladesh 599 6,481 1,230 5,251 835 0.38 Barbados 120 1,298 246 1,052 356 0.16 Belarus 233 2,521 504 2,017 469 0.21 Belgium 3,577 38,703 7,347 31,356 3,813 1.74 Belize 88 952 181 771 324 0.15 Benin 108 1,169 222 947 344 0.16 Bolivia 220 2,380 452 1,928 456 0.21 Bosnia and Herzegovina 80 866 173 693 316 0.14 Botswana 88 952 181 771 324 0.15 Brazil 2,606 28,197 5,353 22,844 2,842 1.30 Bulgaria 643 6,957 1,321 5,636 879 0.40 Burkina Faso 61 660 132 528 297 0.14 Burundi 74 801 160 641 310 0.14 Cambodia 164 1,774 337 1,437 400 0.18 Cameroon 107 1,158 232 926 343 0.16 Canada 5,225 56,535 10,732 45,803 5,461 2.50 Cape Verde 50 541 108 433 286 0.13 Central African Rep. 60 649 130 519 296 0.14 Chad 60 649 130 519 296 0.14 Chile 855 9,251 1,756 7,495 1,091 0.50 China 5,530 59,835 11,359 48,476 5,766 2.64 Colombia 770 8,331 1,582 6,749 1,006 0.46 Congo, Dem. Rep. of 596 6,449 1,224 5,225 832 0.38 Congo, Republic of 115 1,244 236 1,008 351 0.16 Costa Rica 206 2,229 423 1,806 442 0.20 Côte d'Ivoire 310 3,354 637 2,717 546 0.25 Croatia 330 3,571 678 2,893 566 0.26 Cyprus 183 1,980 376 1,604 419 0.19 Czech Republic 784 8,483 1,610 6,873 1,020 0.47 Denmark 1,265 13,687 2,598 11,089 1,501 0.69 Djibouti 50 541 108 433 286 0.13 Dominica 50 541 108 433 286 0.13 Dominican Republic 147 1,591 318 1,273 383 0.18 Ecuador 321 3,473 659 2,814 557 0.25 Egypt, Arab Republic of 809 8,753 1,662 7,091 1,045 0.48 El Salvador 122 1,320 264 1,056 358 0.16 Equatorial Guinea 50 541 108 433 286 0.13 Eritrea 50 541 108 433 286 0.13 Estonia 115 1,244 236 1,008 351 0.16 Ethiopia 123 1,331 253 1,078 359 0.16
Seeaccompanyingnotestothefinancialstatements

76 | MIGA ANNUAL REPORT 2012
Statement of Subscriptions to Capital Stock and Voting Power (cont’d) As of June 30, 2012, expressed in thousands of US dollars
Subscriptions – Note C Voting power
Members Shares1 Total Subscribed
Amount Paid-in
Amount Subject to Call
Numberof Votes
% of Total
Fiji 71 768 154 614 307 0.14 Finland 1,057 11,437 2,171 9,266 1,293 0.59 France 8,565 92,673 17,593 75,080 8,801 4.02 Gabon 169 1,829 347 1,482 405 0.19 Gambia, The 50 541 108 433 286 0.13 Georgia 111 1,201 240 961 347 0.16 Germany 8,936 96,688 18,355 78,333 9,172 4.19 Ghana 432 4,674 887 3,787 668 0.31 Greece 493 5,334 1,013 4,321 729 0.33 Grenada 50 541 108 433 286 0.13 Guatemala 140 1,515 303 1,212 376 0.17 Guinea 91 985 197 788 327 0.15 Guinea-Bissau 50 541 108 433 286 0.13 Guyana 84 909 182 727 320 0.15 Haiti 75 812 162 650 311 0.14 Honduras 178 1,926 366 1,560 414 0.19 Hungary 994 10,755 2,042 8,713 1,230 0.56 Iceland 90 974 195 779 326 0.15 India 5,371 58,114 11,032 47,082 5,607 2.56 Indonesia 1,849 20,006 3,798 16,208 2,085 0.95 Iran, Islamic Rep 1,659 17,950 3,590 14,360 1,895 0.87 Iraq 350 3,787 757 3,030 586 0.27 Ireland 650 7,033 1,335 5,698 886 0.40 Israel 835 9,035 1,715 7,320 1,071 0.49 Italy 4,970 53,775 10,208 43,567 5,206 2.38 Jamaica 319 3,452 655 2,797 555 0.25 Japan 8,979 97,153 18,443 78,710 9,215 4.21 Jordan 171 1,850 351 1,499 407 0.19 Kazakhstan 368 3,982 756 3,226 604 0.28 Kenya 303 3,278 622 2,656 539 0.25 Korea, Republic of 791 8,559 1,625 6,934 1,027 0.47 Kosovo 96 1,039 208 831 332 0.15 Kuwait 1,639 17,734 3,367 14,367 1,875 0.86 Kyrgyz Republic 77 833 167 666 313 0.14 Lao People's Dem 60 649 130 519 296 0.14 Latvia 171 1,850 351 1,499 407 0.19 Lebanon 250 2,705 514 2,191 486 0.22 Lesotho 88 952 181 771 324 0.15 Liberia 84 909 182 727 320 0.15 Libya 549 5,940 1,188 4,752 785 0.36 Lithuania 187 2,023 384 1,639 423 0.19 Luxembourg 204 2,207 419 1,788 440 0.20 Macedonia, FYR of 88 952 181 771 324 0.15 Madagascar 176 1,904 362 1,542 412 0.19 Malawi 77 833 167 666 313 0.14 Malaysia 1,020 11,036 2,095 8,941 1,256 0.57 Maldives 50 541 108 433 286 0.13 Mali 143 1,547 294 1,253 379 0.17 Malta 132 1,428 271 1,157 368 0.17 Mauritania 111 1,201 228 973 347 0.16 Mauritius 153 1,655 314 1,341 389 0.18
Seeaccompanyingnotestothefinancialstatements
MIGA ANNUAL REPORT 2012 | 77
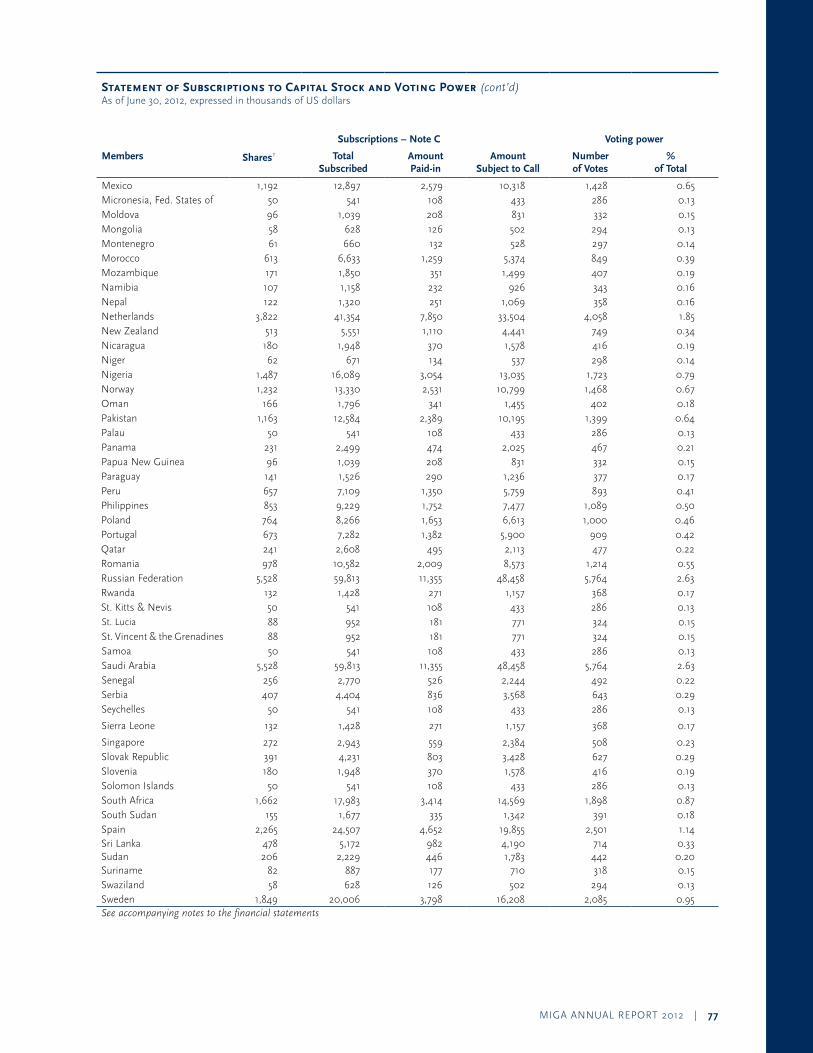
Statement of Subscriptions to Capital Stock and Voting Power (cont’d) As of June 30, 2012, expressed in thousands of US dollars
Subscriptions – Note C Voting power
Members Shares1 Total Subscribed
Amount Paid-in
Amount Subject to Call
Numberof Votes
% of Total
Mexico 1,192 12,897 2,579 10,318 1,428 0.65 Micronesia, Fed. States of 50 541 108 433 286 0.13 Moldova 96 1,039 208 831 332 0.15 Mongolia 58 628 126 502 294 0.13 Montenegro 61 660 132 528 297 0.14 Morocco 613 6,633 1,259 5,374 849 0.39 Mozambique 171 1,850 351 1,499 407 0.19 Namibia 107 1,158 232 926 343 0.16 Nepal 122 1,320 251 1,069 358 0.16 Netherlands 3,822 41,354 7,850 33,504 4,058 1.85 New Zealand 513 5,551 1,110 4,441 749 0.34 Nicaragua 180 1,948 370 1,578 416 0.19 Niger 62 671 134 537 298 0.14 Nigeria 1,487 16,089 3,054 13,035 1,723 0.79 Norway 1,232 13,330 2,531 10,799 1,468 0.67 Oman 166 1,796 341 1,455 402 0.18 Pakistan 1,163 12,584 2,389 10,195 1,399 0.64 Palau 50 541 108 433 286 0.13 Panama 231 2,499 474 2,025 467 0.21 Papua New Guinea 96 1,039 208 831 332 0.15 Paraguay 141 1,526 290 1,236 377 0.17 Peru 657 7,109 1,350 5,759 893 0.41 Philippines 853 9,229 1,752 7,477 1,089 0.50 Poland 764 8,266 1,653 6,613 1,000 0.46 Portugal 673 7,282 1,382 5,900 909 0.42 Qatar 241 2,608 495 2,113 477 0.22 Romania 978 10,582 2,009 8,573 1,214 0.55 Russian Federation 5,528 59,813 11,355 48,458 5,764 2.63 Rwanda 132 1,428 271 1,157 368 0.17 St. Kitts & Nevis 50 541 108 433 286 0.13 St. Lucia 88 952 181 771 324 0.15 St. Vincent & the Grenadines 88 952 181 771 324 0.15 Samoa 50 541 108 433 286 0.13 Saudi Arabia 5,528 59,813 11,355 48,458 5,764 2.63 Senegal 256 2,770 526 2,244 492 0.22 Serbia 407 4,404 836 3,568 643 0.29 Seychelles 50 541 108 433 286 0.13
Sierra Leone 132 1,428 271 1,157 368 0.17
Singapore 272 2,943 559 2,384 508 0.23 Slovak Republic 391 4,231 803 3,428 627 0.29 Slovenia 180 1,948 370 1,578 416 0.19 Solomon Islands 50 541 108 433 286 0.13 South Africa 1,662 17,983 3,414 14,569 1,898 0.87 South Sudan 155 1,677 335 1,342 391 0.18 Spain 2,265 24,507 4,652 19,855 2,501 1.14 Sri Lanka 478 5,172 982 4,190 714 0.33 Sudan 206 2,229 446 1,783 442 0.20 Suriname 82 887 177 710 318 0.15 Swaziland 58 628 126 502 294 0.13 Sweden 1,849 20,006 3,798 16,208 2,085 0.95 Seeaccompanyingnotestothefinancialstatements
78 | MIGA ANNUAL REPORT 2012
Statement of Subscriptions to Capital Stock and Voting Power (cont’d) As of June 30, 2012, expressed in thousands of US dollars
Subscriptions – Note C Voting power
Members Shares1 Total Subscribed
Amount Paid-in
Amount Subject to Call
Numberof Votes
% of Total
Switzerland 2,643 28,597 5,429 23,168 2,879 1.32 Syrian Arab Republic 296 3,203 608 2,595 532 0.24 Tajikistan 130 1,407 267 1,140 366 0.17 Tanzania 248 2,683 509 2,174 484 0.22 Thailand 742 8,028 1,524 6,504 978 0.45 Timor-Leste 50 541 108 433 286 0.13 Togo 77 833 167 666 313 0.14 Trinidad and Tobago 358 3,874 735 3,139 594 0.27 Tunisia 275 2,976 565 2,411 511 0.23 Turkey 814 8,807 1,672 7,135 1,050 0.48 Turkmenistan 66 714 143 571 302 0.14 Uganda 233 2,521 479 2,042 469 0.21 Ukraine 1,346 14,564 2,765 11,799 1,582 0.72 United Arab Emirates 656 7,098 1,347 5,751 892 0.41 United Kingdom 8,565 92,673 17,593 75,080 8,801 4.02 United States 32,564 352,342 67,406 284,936 32,800 14.99 Uruguay 202 2,186 437 1,749 438 0.20 Uzbekistan 175 1,894 379 1,515 411 0.19 Vanuatu 50 541 108 433 286 0.13 Venezuela, R.B. de 1,427 15,440 3,088 12,352 1,663 0.76 Vietnam 388 4,198 797 3,401 624 0.29 Yemen, Republic of 155 1,677 335 1,342 391 0.18 Zambia 318 3,441 688 2,753 554 0.25 Zimbabwe 236 2,554 511 2,043 472 0.22
Total – June 30, 20122 177,003 $1,915,172 $365,413 $1,549,759 218,775 100.00 Total – June 30, 2011 176,786 $1,912,825 $364,943 $1,547,882 218,961 100.00
1 SubscribedsharespertainingtotheGeneralCapitalIncreaseincludeonlythosesharesforwhichthesubscriptionprocesshasbeencompleted, i.e.,forwhichrequiredpaymenthasbeenreceived.2 Maydifferfromthesumofindividualfiguresshownbecauseofrounding.
Seeaccompanyingnotestothefinancialstatements
MIGA ANNUAL REPORT 2012 | 79
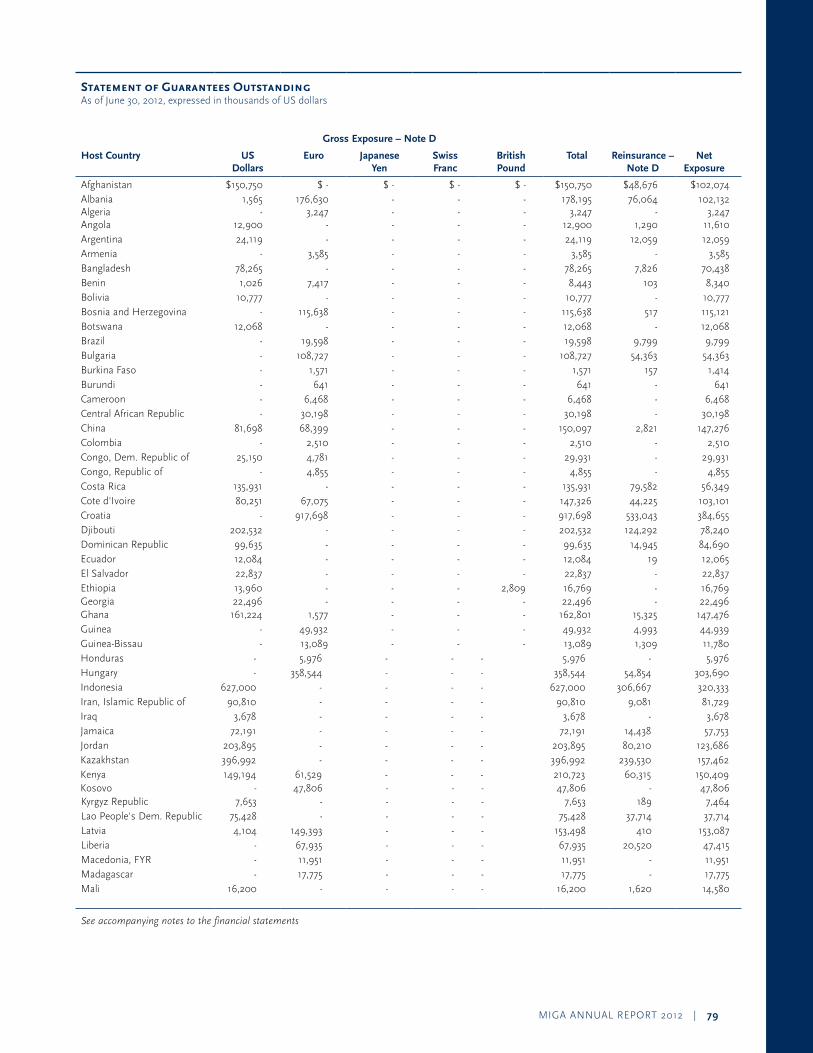
Statement of Guarantees Outstanding As of June 30, 2012, expressed in thousands of US dollars
Gross Exposure – Note D
Host Country US Dollars
Euro Japanese Yen
Swiss Franc
British Pound
Total Reinsurance – Note D
NetExposure
Afghanistan $150,750 $ - $ - $ - $ - $150,750 $48,676 $102,074Albania 1,565 176,630 - - - 178,195 76,064 102,132Algeria - 3,247 - - - 3,247 - 3,247Angola 12,900 - - - - 12,900 1,290 11,610Argentina 24,119 - - - - 24,119 12,059 12,059Armenia - 3,585 - - - 3,585 - 3,585Bangladesh 78,265 - - - - 78,265 7,826 70,438Benin 1,026 7,417 - - - 8,443 103 8,340Bolivia 10,777 - - - - 10,777 - 10,777Bosnia and Herzegovina - 115,638 - - - 115,638 517 115,121Botswana 12,068 - - - - 12,068 - 12,068Brazil - 19,598 - - - 19,598 9,799 9,799Bulgaria - 108,727 - - - 108,727 54,363 54,363Burkina Faso - 1,571 - - - 1,571 157 1,414Burundi - 641 - - - 641 - 641Cameroon - 6,468 - - - 6,468 - 6,468Central African Republic - 30,198 - - - 30,198 - 30,198China 81,698 68,399 - - - 150,097 2,821 147,276Colombia - 2,510 - - - 2,510 - 2,510Congo, Dem. Republic of 25,150 4,781 - - - 29,931 - 29,931Congo, Republic of - 4,855 - - - 4,855 - 4,855Costa Rica 135,931 - - - - 135,931 79,582 56,349Cote d'Ivoire 80,251 67,075 - - - 147,326 44,225 103,101Croatia - 917,698 - - - 917,698 533,043 384,655Djibouti 202,532 - - - - 202,532 124,292 78,240Dominican Republic 99,635 - - - - 99,635 14,945 84,690Ecuador 12,084 - - - - 12,084 19 12,065El Salvador 22,837 - - - - 22,837 - 22,837Ethiopia 13,960 - - - 2,809 16,769 - 16,769Georgia 22,496 - - - - 22,496 - 22,496Ghana 161,224 1,577 - - - 162,801 15,325 147,476Guinea - 49,932 - - - 49,932 4,993 44,939Guinea-Bissau - 13,089 - - - 13,089 1,309 11,780Honduras - 5,976 - - - 5,976 - 5,976Hungary - 358,544 - - - 358,544 54,854 303,690Indonesia 627,000 - - - - 627,000 306,667 320,333Iran, Islamic Republic of 90,810 - - - - 90,810 9,081 81,729Iraq 3,678 - - - - 3,678 - 3,678Jamaica 72,191 - - - - 72,191 14,438 57,753Jordan 203,895 - - - - 203,895 80,210 123,686Kazakhstan 396,992 - - - - 396,992 239,530 157,462Kenya 149,194 61,529 - - - 210,723 60,315 150,409Kosovo - 47,806 - - - 47,806 - 47,806Kyrgyz Republic 7,653 - - - - 7,653 189 7,464Lao People's Dem. Republic 75,428 - - - - 75,428 37,714 37,714Latvia 4,104 149,393 - - - 153,498 410 153,087Liberia - 67,935 - - - 67,935 20,520 47,415Macedonia, FYR - 11,951 - - - 11,951 - 11,951Madagascar - 17,775 - - - 17,775 - 17,775Mali 16,200 - - - - 16,200 1,620 14,580
Seeaccompanyingnotestothefinancialstatements
80 | MIGA ANNUAL REPORT 2012
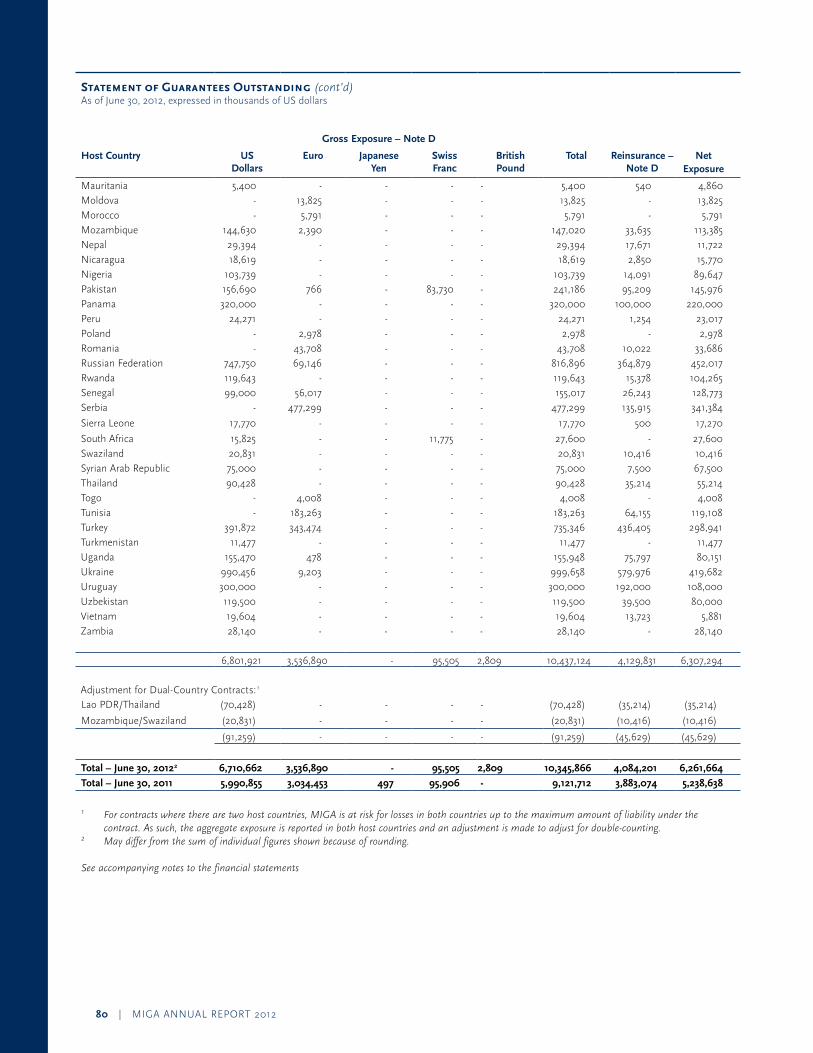
Statement of Guarantees Outstanding (cont’d) As of June 30, 2012, expressed in thousands of US dollars
Gross Exposure – Note D
Host Country US Dollars
Euro Japanese Yen
Swiss Franc
British Pound
Total Reinsurance – Note D
NetExposure
Mauritania 5,400 - - - - 5,400 540 4,860Moldova - 13,825 - - - 13,825 - 13,825Morocco - 5,791 - - - 5,791 - 5,791Mozambique 144,630 2,390 - - - 147,020 33,635 113,385Nepal 29,394 - - - - 29,394 17,671 11,722Nicaragua 18,619 - - - - 18,619 2,850 15,770Nigeria 103,739 - - - - 103,739 14,091 89,647Pakistan 156,690 766 - 83,730 - 241,186 95,209 145,976Panama 320,000 - - - - 320,000 100,000 220,000Peru 24,271 - - - - 24,271 1,254 23,017Poland - 2,978 - - - 2,978 - 2,978Romania - 43,708 - - - 43,708 10,022 33,686Russian Federation 747,750 69,146 - - - 816,896 364,879 452,017Rwanda 119,643 - - - - 119,643 15,378 104,265Senegal 99,000 56,017 - - - 155,017 26,243 128,773Serbia - 477,299 - - - 477,299 135,915 341,384
Sierra Leone 17,770 - - - - 17,770 500 17,270
South Africa 15,825 - - 11,775 - 27,600 - 27,600Swaziland 20,831 - - - - 20,831 10,416 10,416Syrian Arab Republic 75,000 - - - - 75,000 7,500 67,500Thailand 90,428 - - - - 90,428 35,214 55,214Togo - 4,008 - - - 4,008 - 4,008Tunisia - 183,263 - - - 183,263 64,155 119,108Turkey 391,872 343,474 - - - 735,346 436,405 298,941Turkmenistan 11,477 - - - - 11,477 - 11,477Uganda 155,470 478 - - - 155,948 75,797 80,151Ukraine 990,456 9,203 - - - 999,658 579,976 419,682Uruguay 300,000 - - - - 300,000 192,000 108,000Uzbekistan 119,500 - - - - 119,500 39,500 80,000Vietnam 19,604 - - - - 19,604 13,723 5,881Zambia 28,140 - - - - 28,140 - 28,140
6,801,921 3,536,890 - 95,505 2,809 10,437,124 4,129,831 6,307,294
Adjustment for Dual-Country Contracts:1
Lao PDR/Thailand (70,428) - - - - (70,428) (35,214) (35,214)
Mozambique/Swaziland (20,831) - - - - (20,831) (10,416) (10,416)
(91,259) - - - - (91,259) (45,629) (45,629)
Total – June 30, 20122 6,710,662 3,536,890 - 95,505 2,809 10,345,866 4,084,201 6,261,664
Total – June 30, 2011 5,990,855 3,034,453 497 95,906 - 9,121,712 3,883,074 5,238,638
1 Forcontractswheretherearetwohostcountries,MIGAisatriskforlossesinbothcountriesuptothemaximumamountofliabilityunderthecontract.Assuch,theaggregateexposureisreportedinbothhostcountriesandanadjustmentismadetoadjustfordouble-counting.
2 Maydifferfromthesumofindividualfiguresshownbecauseofrounding.
Seeaccompanyingnotestothefinancialstatements
MIGA ANNUAL REPORT 2012 | 81
Notes to Financial Statements
PurposeThe Multilateral Investment Guarantee Agency (MIGA), established on April 12, 1988 and located in Washington D.C., is a member of the World Bank Group which also includes the International Bank for Reconstruction and Development (IBRD), the International Finance Corporation (IFC), the International Development Association (IDA), and the International Center for Settlement of Investment Disputes (ICSID). MIGA’s activities are closely coordinated with and complement the overall development objectives of the other World Bank institutions. MIGA is designed to help developing countries attract productive foreign investment by both private investors and commercially operated public sector companies. Its facilities include guarantees or insurance against noncommercial risks and a program of advisory services and technical assistance to support member countries’ efforts to attract and retain foreign direct investment.
Note A: Summary of Significant Accounting and Related Policies
Basis of PreparationMIGA’s financial statements have been prepared in accordance with International Financial Reporting Standards (IFRS) issued by the International Accounting Standards Board (IASB) and with accounting principles generally accepted in the United States of America (U.S. GAAP). The policy adopted is that considered most appropriate to the circumstances of MIGA having regard to its legal requirements and to the practices of other international insurance entities.
On August 9, 2012, the acting Executive Vice President and the Chief Financial Officer authorized the financial statements for issue. MIGA has evaluated subsequent events through August 9, 2012, the date of issue. Accounting and Reporting DevelopmentsThe IASB issued IFRS 4, InsuranceContracts in March 2004 to achieve convergence of widely varying insurance industry accounting practices around the world. The IASB has divided the insurance project into two phases. In line with the requirements of Phase 1, MIGA included addi-tional disclosures beginning the quarter ended September 30, 2005 that identify and explain the amounts in the financial statements arising from insurance contracts. In July 2010, the IASB released an exposure draft on Phase 2 of the project addressing issues on insurance accounting. The Financial Accounting Standard Board (FASB) is deliberating the accounting for insurance contracts in a joint effort with the IASB and is expected to issue an exposure draft in 2012.
In November 2009, IASB issued IFRS 9, Financial Instruments as a first step as part of a wider project to replace International Accounting Standards (IAS) 39, FinancialInstruments:RecognitionandMeasurement. The November 2009 issuance of IFRS 9 focuses on the classification and measurement of financial assets where it retains but simplifies the mixed measurement model and establishes two primary measurement cat-egories for financial assets: amortized cost and fair value. The basis of classification depends on the entity’s business model and the contractual cash flow characteristics of the financial assets. Requirements for financial liabilities were added to IFRS 9 in October 2010, most of which were carried forward unchanged from IAS 39. However, some changes were made to the fair value option for financial liabilities to address the issue of own credit risk. The standard is effective for annual periods beginning on or after January 1, 2015. MIGA is currently assessing the impact of this standard on its financial statements.
In June 2011, the IASB issued an amended employee benefits standard IAS 19EmployeeBenefits, which has an effective date of annual periods beginning on or after January 1, 2013. The amended standard is expected to impact accounting around the funded defined benefit plans primarily driven by a new approach to calculating and presenting the net interest income or expense on the net defined benefit liability or asset. The standard will require entities to present the net interest income or expense on the net defined benefit liability or asset as a single net interest figure, based on the discount rate that is used to measure the defined benefit obligations. MIGA is currently assessing the impact of this standard on its financial statements.
In May 2011, the FASB issued Accounting Standard Update (ASU) 2011-04, Fair Value Measurement (Topic 820): Amendments to Achieve Common Fair Value Measurement and Disclosure Requirements in U.S. GAAP and International Financial Reporting Standards (IFRS). The amendments result in common fair value measurement and disclosure requirements in IFRS and U.S. GAAP. While many of the amendments are changes in wording that do not significantly impact current practice, some of the amendments change the existing fair value measurement and disclosure requirements. This ASU is effective for interim and annual periods beginning after December 15, 2011. MIGA has adopted this ASU in the quarter ended March 31, 2012. For the related additional fair value disclosures, see Note B – Investments.
Differences between US GAAP and IFRSThe Compensation Retirement Benefits Topic of the FASB Accounting Standards Codification (ASC) 715-30 requires employers to recognize on their balance sheets the funded status of their defined benefit post retirement plans, measured as the difference between the fair value of the plan assets and the benefit obligation. Gains or losses and prior service costs or credits that arise during the period are recognized as part of Other Comprehensive Income, to the extent they are not recognized as components of the net periodic benefit cost. Additionally, ASC 715-30 requires unrecognized net actuarial gains or losses and unrecognized prior service costs to be recognized in the ending balance of Accumulated Other Comprehensive Income. These amounts will be adjusted as they are subsequently recognized as components of net periodic benefit cost.
MIGA’s accounting policy under IAS 19, Employee Benefits is to recognize all actuarial gains and losses in the period in which they occur—but outside profit or loss—“in a statement of changes in shareholder’s equity.” This is a permitted alternative available under IAS 19 and MIGA considers that this will allow it to show the over/under funded position on the balance sheet thereby making its financial statements more relevant and complete. ASC 715-30 and IAS 19 differ in the treatment of amortization of unrecognized actuarial gains or losses. ASC 715-30 requires that the unrecognized actuarial gains or losses to be amortized through the Statement of Income, and IAS 19 requires the unrecognized actuarial gains or losses to be recognized in Other Comprehensive Income and immediately recognized in Retained earnings. MIGA does not believe the differences are material.

82 | MIGA ANNUAL REPORT 2012
Use of EstimatesThe preparation of financial statements in conformity with IFRS and U.S. GAAP requires management to make estimates and assumptions that affect the amounts reported in the financial statements. Actual results could differ from these estimates.
Significant judgments have been made in areas which management views as most critical with respect to the establishment of its loss reserves, the determination of net periodic cost/income from pension and other post retirement benefits plans, and the present value of benefit obligations.
InvestmentsMIGA manages its investment portfolio both for the purpose of providing liquidity for potential claims and for capital growth. MIGA invests in equity securities, time deposits, asset backed securities (ABS) and government and agency obligations based on its investment policy approved by the Board. Government and agency obligations include highly rated fixed rate bonds, notes, bills and other obligations issued or unconditionally guaranteed by governments of countries or other official entities including government agencies or by multilateral organizations. MIGA makes use of derivatives contracts such as exchange traded futures, options and covered forward contracts to manage its investment portfolio. The purposes of these transactions are to enhance the return and manage the overall duration of the portfolio. With respect to futures and options, MIGA generally closes out most open positions prior to expiration. Futures are settled on a daily basis.
MIGA has classified all investment securities as trading. Investments classified as trading securities are reported at fair value using trade-date accounting. Securities purchased or sold may have a settlement date that is different from the trade-date. Securities purchased that could not be settled before the reporting dates are recorded as liability. Similarly, securities sold that could not be settled before the reporting dates are recorded under Other Assets.
For trading securities, unrealized net gains and losses are recognized in earnings. Income from investments includes net gains and losses, dividend income and interest income.
Nonnegotiable, Noninterest-bearing Demand Obligations on Account of Subscribed CapitalPayments on these instruments are due to MIGA upon demand and are held in bank accounts which bear MIGA’s name. Accordingly, these instruments are carried and reported at face value as assets on the Balance Sheet.
Impairment of Reinsurance AssetsMIGA assesses at each balance sheet date whether there is objective evidence that the reinsurance asset is impaired, and makes a provision for such impairment. Objective evidence may be in the form of observable data that comes to MIGA’s attention periodically. If an impairment is determined, the carrying amount of the reinsurance asset is reduced through the use of an allowance account and the amount of the loss is recognized in the Statement of Income.
Reserve for ClaimsMIGA’s reserve consists of two primary components, the Specific Reserve and the Insurance Portfolio Reserve. These components are compre-hensive and mutually exclusive with respect to risk of losses that may develop from each guarantee contract, and from the contingent liability for the portfolio as a whole.
The Specific Reserve is calculated based on contract-specific parameters that are reviewed every quarter by MIGA’s management for contracts that have known difficulties. The Insurance Portfolio Reserve is calculated based on the long-term historical experiences of the political risk insurance industry.
Assumptions and parameters used in the calculations are intended to serve as the basis for an objective reserve for probable claims. Key assumptions, including frequency of claim, severity, and expected recovery have been quantitatively derived from the political risk insurance industry’s historical claims data. The principal sources of data used as inputs for the assumptions include the Berne Union and the Overseas Private Investment Corporation. The historical analysis of the data from those sources is further augmented by an internal econometric scoring analysis in order to derive risk-differentiated parameters with term structure effects over time. The historical and econometric analyses cover periods that are over 30 years, and the derived parameters are considered stable in the short term; however the parameters are reviewed periodically. Short-term risk changes are captured by changes in internal risk ratings for countries and contracts on a quarterly basis. For the purpose of claims provisioning, MIGA factors in the time value of money of potential cash flows, using representative risk-free interest rates as the discount rates.
For the purpose of the presentation of the financial statements, insurance liabilities (or reserves) are presented on a gross basis and not net of reinsurance. Therefore, MIGA’s reserves are shown on a gross basis on the liability side of the balance sheet, while establishing reinsurance recoverable assets on the asset side. Reinsurance does not relieve MIGA of its primary liability to the insured. Currency Translation Assets and liabilities denominated in foreign currencies are translated at market exchange rates in effect at the end of the period. Income and expenses are translated at either the market exchange rates in effect on the dates on which they are recognized or at an average of the market exchange rates in effect during each month. Translation adjustments are reflected in the Statement of Income.
MIGA’s Investment Policy approved by the Board of Directors includes the establishment of a system for active management of MIGA’s exposures to foreign currencies, whereby the amounts of non dollar assets would be matched to non dollar reserve components. The objective is to align the currency compositions of MIGA’s assets and liabilities, and to thereby minimize the sensitivity of MIGA’s net income to movements in foreign currency exchange rates.
Valuation of Capital Stock Under the MIGA Convention, all payments from members subscribing to the capital stock of MIGA shall be settled on the basis of the average value of the Special Drawing Rights (SDR) introduced by the International Monetary Fund, as valued in terms of United States dollars for the period January 1, 1981 to June 30, 1985, such value being equal to $1.082 for one SDR.

MIGA ANNUAL REPORT 2012 | 83
Revenue RecognitionPremium amounts received on direct insurance contracts and reinsurance contracts assumed can be annual, semi-annual or quarterly and are recorded as unearned premium. Premiums are recognized as earned on a pro rata basis over the contract period. A receivable for premium is recorded when the contract has been renewed and coverage amounts have been identified.
MIGA cedes to reinsurers in the normal course of business by obtaining treaty and facultative reinsurance to augment its underwriting capacity and to mitigate its risk by protecting portions of its insurance portfolio. Premiums ceded follow the same approach as for direct insurance con-tracts and are recognized as expenses on a pro rata basis over the contract period.
Fee and commissions income for MIGA primarily consists of administrative fees, arrangement fees, facility fees, renewal fees, commitment (offer) fees, and ceding commissions. Fees and commissions received upon renewal are recognized as income on a pro rata basis over the contract period.
Note B: Investments
A summary of MIGA’s investment portfolio at June 30, 2012 and June 30, 2011 are as follows:
Fair Value
In thousands of US dollars June 30, 2012 June 30, 2011
Equity securities $145,605 $93,287
Comingled funds 9,062 6,600
Government obligations 399,730 352,483
Time deposits 306,418 418,038
Asset backed securities 230,511 235,151
Total Investments - Trading $1,091,326 $1,105,559
MIGA manages its investments on a net portfolio basis. The following table summarizes MIGA’s net portfolio position as of June 30, 2012 and June 30, 2011:
Fair Value
In thousands of US dollars June 30, 2012 June 30, 2011
Investments – trading $1,091,326 $1,105,559
Cash held in investment portfolioa 2,868 1,406
Securities purchased under resale agreements 13,000 -
Receivable for investment securities sold 1,475 12,646
Derivative assets
Currency forward contracts 282,732 115,086
Othersb 186 34
Derivative liabilities
Currency forward contracts (282,031) (115,093)
Othersb (19) (249)
Payable for investment securities purchased (4,641) (57,185)
Securities sold under repurchase agreements (15,190) (26,674)
Net investment portfolio $1,089,706 $1,035,530
a.ThisamountisincludedunderCashintheBalanceSheetb.TheserelatetoTo-Be-Announced(TBA)securities
Investments are denominated primarily in United States dollars with instruments in non-dollar currencies representing 8.6 percent (8.3 percent – June 30, 2011) of the portfolio. MIGA classifies all investment securities as trading. Investments classified as trading securities are reported at fair value with unrealized gains or losses included in earnings. The unrealized net gains/(losses) included in the Income from investments for the fiscal years ended June 30, 2012 and June 30, 2011 amounted to $7,420,000 and ($838,000) respectively.
84 | MIGA ANNUAL REPORT 2012
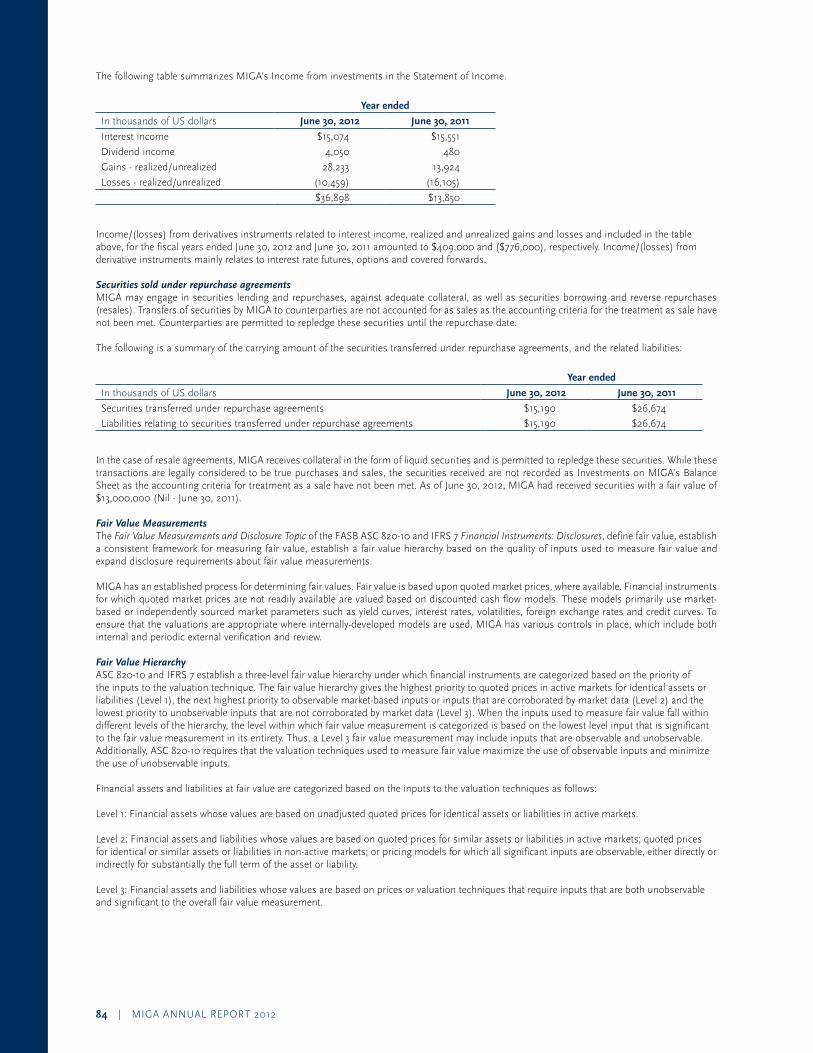
The following table summarizes MIGA’s Income from investments in the Statement of Income.
Year ended
In thousands of US dollars June 30, 2012 June 30, 2011
Interest income $15,074 $15,551
Dividend income 4,050 480
Gains - realized/unrealized 28,233 13,924
Losses - realized/unrealized (10,459) (16,105)
$36,898 $13,850
Income/(losses) from derivatives instruments related to interest income, realized and unrealized gains and losses and included in the table above, for the fiscal years ended June 30, 2012 and June 30, 2011 amounted to $409,000 and ($776,000), respectively. Income/(losses) from derivative instruments mainly relates to interest rate futures, options and covered forwards.
Securities sold under repurchase agreementsMIGA may engage in securities lending and repurchases, against adequate collateral, as well as securities borrowing and reverse repurchases (resales). Transfers of securities by MIGA to counterparties are not accounted for as sales as the accounting criteria for the treatment as sale have not been met. Counterparties are permitted to repledge these securities until the repurchase date.
The following is a summary of the carrying amount of the securities transferred under repurchase agreements, and the related liabilities:
Year ended
In thousands of US dollars June 30, 2012 June 30, 2011
Securities transferred under repurchase agreements $15,190 $26,674
Liabilities relating to securities transferred under repurchase agreements $15,190 $26,674
In the case of resale agreements, MIGA receives collateral in the form of liquid securities and is permitted to repledge these securities. While these transactions are legally considered to be true purchases and sales, the securities received are not recorded as Investments on MIGA’s Balance Sheet as the accounting criteria for treatment as a sale have not been met. As of June 30, 2012, MIGA had received securities with a fair value of $13,000,000 (Nil - June 30, 2011).
Fair Value Measurements The FairValueMeasurementsandDisclosureTopic of the FASB ASC 820-10 and IFRS 7 FinancialInstruments:Disclosures, define fair value, establish a consistent framework for measuring fair value, establish a fair value hierarchy based on the quality of inputs used to measure fair value and expand disclosure requirements about fair value measurements.
MIGA has an established process for determining fair values. Fair value is based upon quoted market prices, where available. Financial instruments for which quoted market prices are not readily available are valued based on discounted cash flow models. These models primarily use market-based or independently sourced market parameters such as yield curves, interest rates, volatilities, foreign exchange rates and credit curves. To ensure that the valuations are appropriate where internally-developed models are used, MIGA has various controls in place, which include both internal and periodic external verification and review.
Fair Value HierarchyASC 820-10 and IFRS 7 establish a three-level fair value hierarchy under which financial instruments are categorized based on the priority of the inputs to the valuation technique. The fair value hierarchy gives the highest priority to quoted prices in active markets for identical assets or liabilities (Level 1), the next highest priority to observable market-based inputs or inputs that are corroborated by market data (Level 2) and the lowest priority to unobservable inputs that are not corroborated by market data (Level 3). When the inputs used to measure fair value fall within different levels of the hierarchy, the level within which fair value measurement is categorized is based on the lowest level input that is significant to the fair value measurement in its entirety. Thus, a Level 3 fair value measurement may include inputs that are observable and unobservable. Additionally, ASC 820-10 requires that the valuation techniques used to measure fair value maximize the use of observable inputs and minimize the use of unobservable inputs. Financial assets and liabilities at fair value are categorized based on the inputs to the valuation techniques as follows:
Level 1: Financial assets whose values are based on unadjusted quoted prices for identical assets or liabilities in active markets.
Level 2: Financial assets and liabilities whose values are based on quoted prices for similar assets or liabilities in active markets; quoted prices for identical or similar assets or liabilities in non-active markets; or pricing models for which all significant inputs are observable, either directly or indirectly for substantially the full term of the asset or liability.
Level 3: Financial assets and liabilities whose values are based on prices or valuation techniques that require inputs that are both unobservable and significant to the overall fair value measurement.
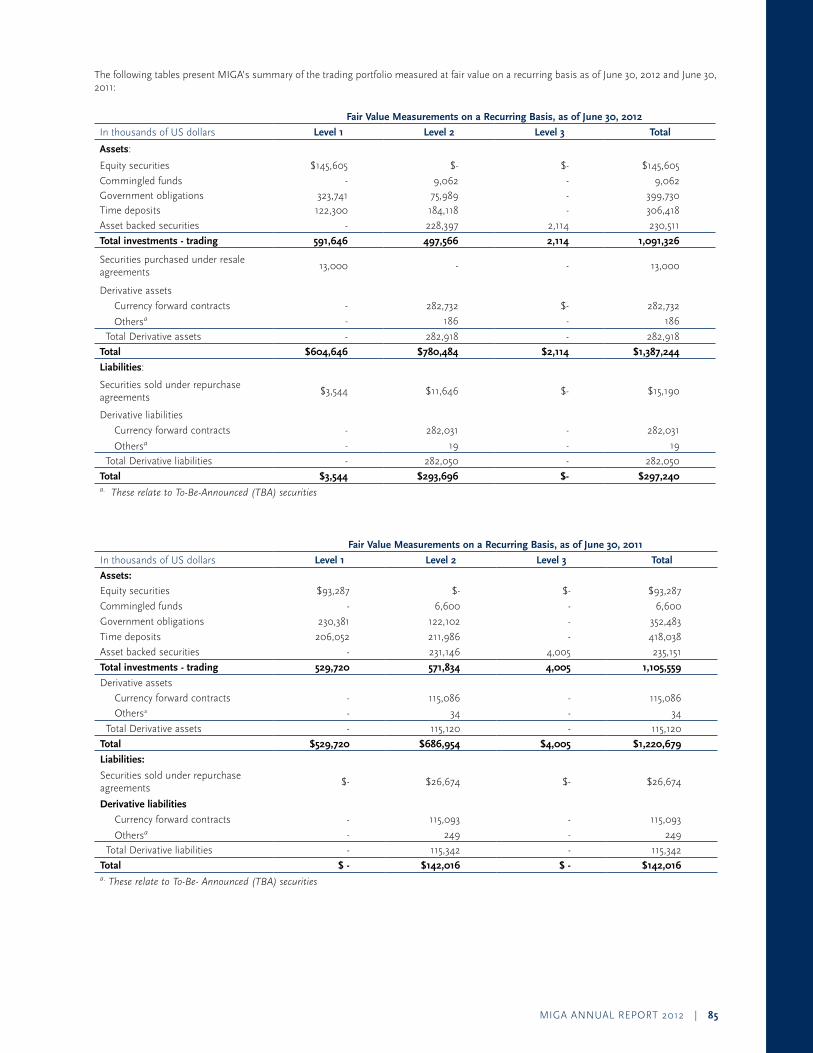
MIGA ANNUAL REPORT 2012 | 85
The following tables present MIGA’s summary of the trading portfolio measured at fair value on a recurring basis as of June 30, 2012 and June 30, 2011:
Fair Value Measurements on a Recurring Basis, as of June 30, 2012
In thousands of US dollars Level 1 Level 2 Level 3 Total
Assets:
Equity securities $145,605 $- $- $145,605
Commingled funds - 9,062 - 9,062 Government obligations 323,741 75,989 - 399,730 Time deposits 122,300 184,118 - 306,418
Asset backed securities - 228,397 2,114 230,511
Total investments - trading 591,646 497,566 2,114 1,091,326
Securities purchased under resale agreements
13,000 - - 13,000
Derivative assets
Currency forward contracts - 282,732 $- 282,732
Othersa - 186 - 186
Total Derivative assets - 282,918 - 282,918
Total $604,646 $780,484 $2,114 $1,387,244
Liabilities:
Securities sold under repurchase agreements
$3,544 $11,646 $- $15,190
Derivative liabilities
Currency forward contracts - 282,031 - 282,031
Othersa - 19 - 19
Total Derivative liabilities - 282,050 - 282,050
Total $3,544 $293,696 $- $297,240 a.TheserelatetoTo-Be-Announced(TBA)securities
Fair Value Measurements on a Recurring Basis, as of June 30, 2011
In thousands of US dollars Level 1 Level 2 Level 3 Total
Assets:
Equity securities $93,287 $- $- $93,287
Commingled funds - 6,600 - 6,600
Government obligations 230,381 122,102 - 352,483
Time deposits 206,052 211,986 - 418,038
Asset backed securities - 231,146 4,005 235,151
Total investments - trading 529,720 571,834 4,005 1,105,559
Derivative assets
Currency forward contracts - 115,086 - 115,086
Othersa - 34 - 34
Total Derivative assets - 115,120 - 115,120
Total $529,720 $686,954 $4,005 $1,220,679
Liabilities:
Securities sold under repurchase agreements
$- $26,674 $- $26,674
Derivative liabilities
Currency forward contracts - 115,093 - 115,093
Othersa - 249 - 249
Total Derivative liabilities - 115,342 - 115,342
Total $ - $142,016 $ - $142,016 a.TheserelatetoTo-Be-Announced(TBA)securities
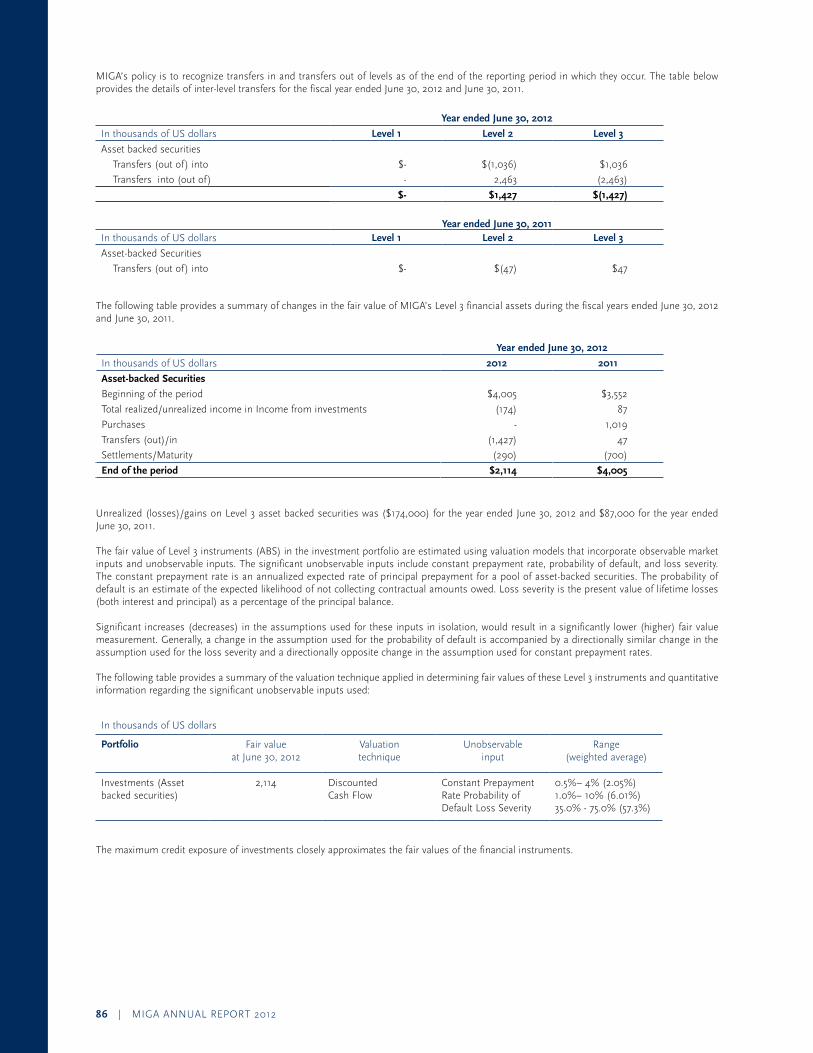
86 | MIGA ANNUAL REPORT 2012
MIGA’s policy is to recognize transfers in and transfers out of levels as of the end of the reporting period in which they occur. The table below provides the details of inter-level transfers for the fiscal year ended June 30, 2012 and June 30, 2011.
Year ended June 30, 2012
In thousands of US dollars Level 1 Level 2 Level 3
Asset backed securities
Transfers (out of) into $- $(1,036) $1,036
Transfers into (out of) - 2,463 (2,463)
$- $1,427 $(1,427)
Year ended June 30, 2011In thousands of US dollars Level 1 Level 2 Level 3
Asset-backed Securities
Transfers (out of) into $- $(47) $47
The following table provides a summary of changes in the fair value of MIGA’s Level 3 financial assets during the fiscal years ended June 30, 2012 and June 30, 2011.
Year ended June 30, 2012
In thousands of US dollars 2012 2011
Asset-backed Securities
Beginning of the period $4,005 $3,552
Total realized/unrealized income in Income from investments (174) 87
Purchases - 1,019
Transfers (out)/in (1,427) 47
Settlements/Maturity (290) (700)
End of the period $2,114 $4,005
Unrealized (losses)/gains on Level 3 asset backed securities was ($174,000) for the year ended June 30, 2012 and $87,000 for the year ended June 30, 2011.
The fair value of Level 3 instruments (ABS) in the investment portfolio are estimated using valuation models that incorporate observable market inputs and unobservable inputs. The significant unobservable inputs include constant prepayment rate, probability of default, and loss severity. The constant prepayment rate is an annualized expected rate of principal prepayment for a pool of asset-backed securities. The probability of default is an estimate of the expected likelihood of not collecting contractual amounts owed. Loss severity is the present value of lifetime losses (both interest and principal) as a percentage of the principal balance.
Significant increases (decreases) in the assumptions used for these inputs in isolation, would result in a significantly lower (higher) fair value measurement. Generally, a change in the assumption used for the probability of default is accompanied by a directionally similar change in the assumption used for the loss severity and a directionally opposite change in the assumption used for constant prepayment rates.
The following table provides a summary of the valuation technique applied in determining fair values of these Level 3 instruments and quantitative information regarding the significant unobservable inputs used:
In thousands of US dollars
Portfolio Fair value at June 30, 2012
Valuation technique
Unobservable input
Range (weighted average)
Investments (Asset backed securities)
2,114 Discounted Cash Flow
Constant Prepayment Rate Probability of Default Loss Severity
0.5%– 4% (2.05%) 1.0%– 10% (6.01%) 35.0% - 75.0% (57.3%)
The maximum credit exposure of investments closely approximates the fair values of the financial instruments.
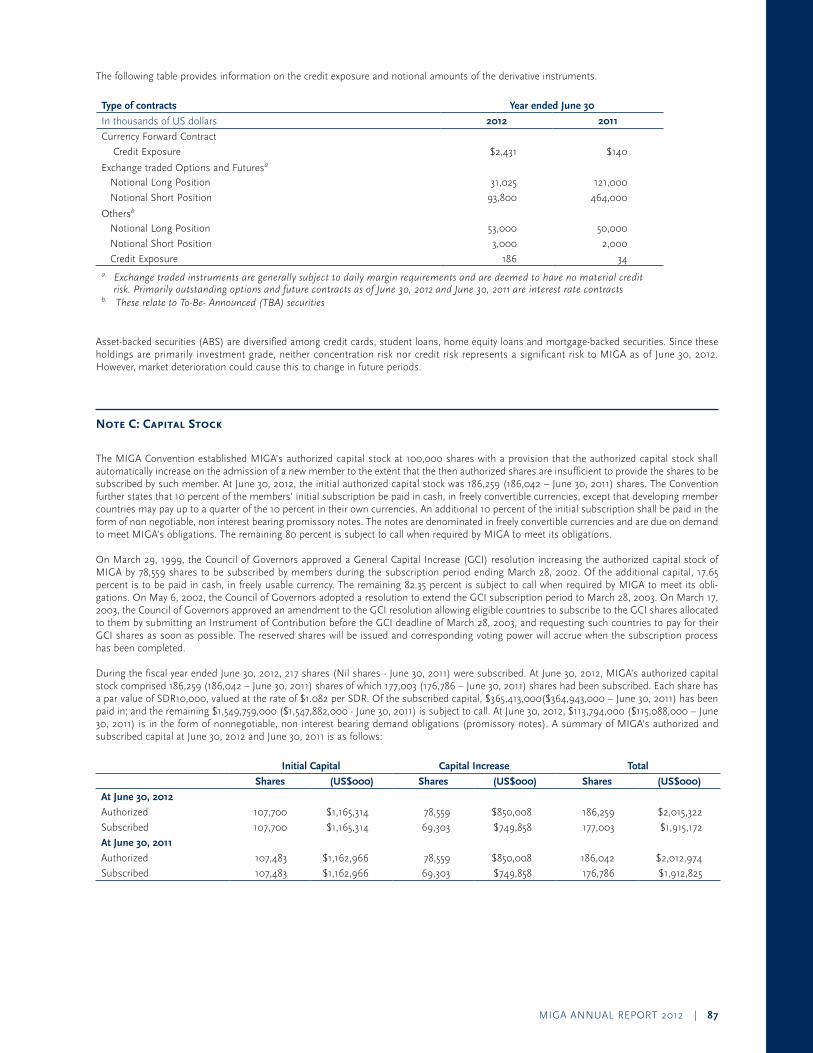
MIGA ANNUAL REPORT 2012 | 87
The following table provides information on the credit exposure and notional amounts of the derivative instruments.
Type of contracts Year ended June 30
In thousands of US dollars 2012 2011
Currency Forward Contract
Credit Exposure $2,431 $140
Exchange traded Options and Futuresa
Notional Long Position 31,025 121,000
Notional Short Position 93,800 464,000
Othersb
Notional Long Position 53,000 50,000
Notional Short Position 3,000 2,000
Credit Exposure 186 34 a.Exchangetradedinstrumentsaregenerallysubjecttodailymarginrequirementsandaredeemedtohavenomaterialcredit
risk.PrimarilyoutstandingoptionsandfuturecontractsasofJune30,2012andJune30,2011areinterestratecontractsb.TheserelatetoTo-Be-Announced(TBA)securities
Asset-backed securities (ABS) are diversified among credit cards, student loans, home equity loans and mortgage-backed securities. Since these holdings are primarily investment grade, neither concentration risk nor credit risk represents a significant risk to MIGA as of June 30, 2012. However, market deterioration could cause this to change in future periods.
Note C: Capital Stock
The MIGA Convention established MIGA’s authorized capital stock at 100,000 shares with a provision that the authorized capital stock shall automatically increase on the admission of a new member to the extent that the then authorized shares are insufficient to provide the shares to be subscribed by such member. At June 30, 2012, the initial authorized capital stock was 186,259 (186,042 – June 30, 2011) shares. The Convention further states that 10 percent of the members’ initial subscription be paid in cash, in freely convertible currencies, except that developing member countries may pay up to a quarter of the 10 percent in their own currencies. An additional 10 percent of the initial subscription shall be paid in the form of non negotiable, non interest bearing promissory notes. The notes are denominated in freely convertible currencies and are due on demand to meet MIGA’s obligations. The remaining 80 percent is subject to call when required by MIGA to meet its obligations.
On March 29, 1999, the Council of Governors approved a General Capital Increase (GCI) resolution increasing the authorized capital stock of MIGA by 78,559 shares to be subscribed by members during the subscription period ending March 28, 2002. Of the additional capital, 17.65 percent is to be paid in cash, in freely usable currency. The remaining 82.35 percent is subject to call when required by MIGA to meet its obli-gations. On May 6, 2002, the Council of Governors adopted a resolution to extend the GCI subscription period to March 28, 2003. On March 17, 2003, the Council of Governors approved an amendment to the GCI resolution allowing eligible countries to subscribe to the GCI shares allocated to them by submitting an Instrument of Contribution before the GCI deadline of March 28, 2003, and requesting such countries to pay for their GCI shares as soon as possible. The reserved shares will be issued and corresponding voting power will accrue when the subscription process has been completed.
During the fiscal year ended June 30, 2012, 217 shares (Nil shares - June 30, 2011) were subscribed. At June 30, 2012, MIGA’s authorized capital stock comprised 186,259 (186,042 – June 30, 2011) shares of which 177,003 (176,786 – June 30, 2011) shares had been subscribed. Each share has a par value of SDR10,000, valued at the rate of $1.082 per SDR. Of the subscribed capital, $365,413,000($364,943,000 – June 30, 2011) has been paid in; and the remaining $1,549,759,000 ($1,547,882,000 - June 30, 2011) is subject to call. At June 30, 2012, $113,794,000 ($115,088,000 – June 30, 2011) is in the form of nonnegotiable, non interest bearing demand obligations (promissory notes). A summary of MIGA’s authorized and subscribed capital at June 30, 2012 and June 30, 2011 is as follows:
Initial Capital Capital Increase Total
Shares (US$000) Shares (US$000) Shares (US$000)
At June 30, 2012
Authorized 107,700 $1,165,314 78,559 $850,008 186,259 $2,015,322
Subscribed 107,700 $1,165,314 69,303 $749,858 177,003 $1,915,172
At June 30, 2011
Authorized 107,483 $1,162,966 78,559 $850,008 186,042 $2,012,974
Subscribed 107,483 $1,162,966 69,303 $749,858 176,786 $1,912,825
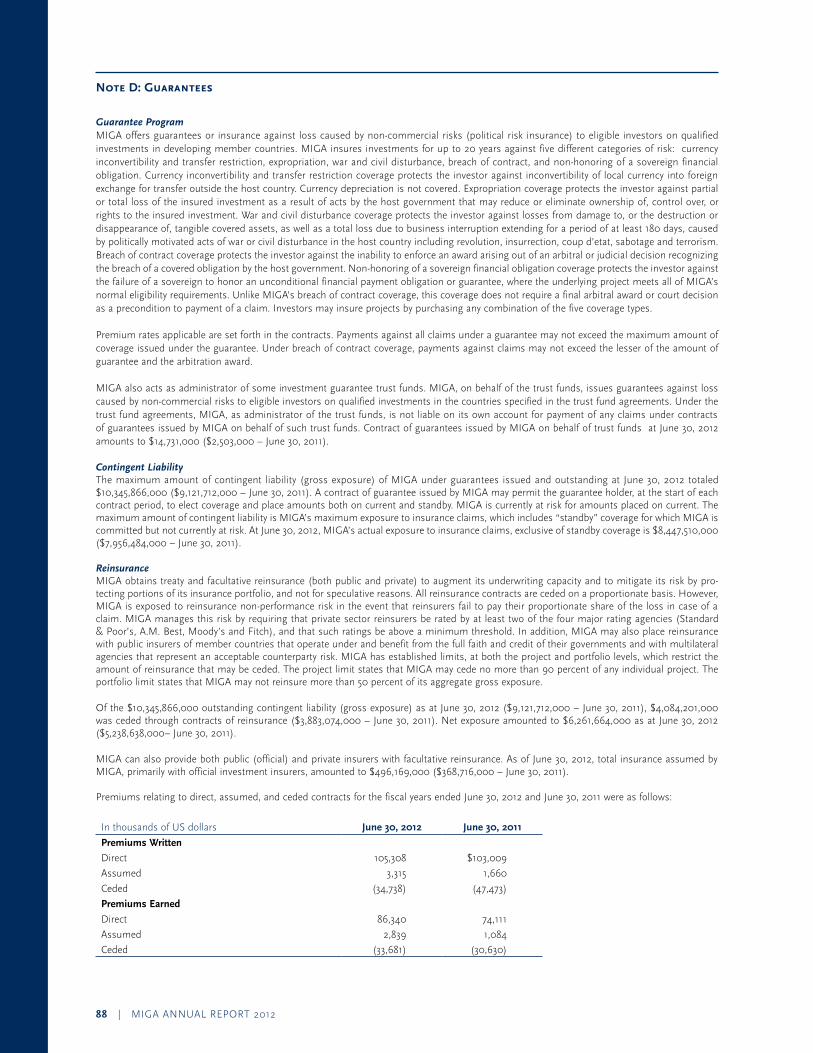
88 | MIGA ANNUAL REPORT 2012
Note D: Guarantees
Guarantee ProgramMIGA offers guarantees or insurance against loss caused by non-commercial risks (political risk insurance) to eligible investors on qualified investments in developing member countries. MIGA insures investments for up to 20 years against five different categories of risk: currency inconvertibility and transfer restriction, expropriation, war and civil disturbance, breach of contract, and non-honoring of a sovereign financial obligation. Currency inconvertibility and transfer restriction coverage protects the investor against inconvertibility of local currency into foreign exchange for transfer outside the host country. Currency depreciation is not covered. Expropriation coverage protects the investor against partial or total loss of the insured investment as a result of acts by the host government that may reduce or eliminate ownership of, control over, or rights to the insured investment. War and civil disturbance coverage protects the investor against losses from damage to, or the destruction or disappearance of, tangible covered assets, as well as a total loss due to business interruption extending for a period of at least 180 days, caused by politically motivated acts of war or civil disturbance in the host country including revolution, insurrection, coup d’etat, sabotage and terrorism. Breach of contract coverage protects the investor against the inability to enforce an award arising out of an arbitral or judicial decision recognizing the breach of a covered obligation by the host government. Non-honoring of a sovereign financial obligation coverage protects the investor against the failure of a sovereign to honor an unconditional financial payment obligation or guarantee, where the underlying project meets all of MIGA’s normal eligibility requirements. Unlike MIGA’s breach of contract coverage, this coverage does not require a final arbitral award or court decision as a precondition to payment of a claim. Investors may insure projects by purchasing any combination of the five coverage types.
Premium rates applicable are set forth in the contracts. Payments against all claims under a guarantee may not exceed the maximum amount of coverage issued under the guarantee. Under breach of contract coverage, payments against claims may not exceed the lesser of the amount of guarantee and the arbitration award.
MIGA also acts as administrator of some investment guarantee trust funds. MIGA, on behalf of the trust funds, issues guarantees against loss caused by non-commercial risks to eligible investors on qualified investments in the countries specified in the trust fund agreements. Under the trust fund agreements, MIGA, as administrator of the trust funds, is not liable on its own account for payment of any claims under contracts of guarantees issued by MIGA on behalf of such trust funds. Contract of guarantees issued by MIGA on behalf of trust funds at June 30, 2012 amounts to $14,731,000 ($2,503,000 – June 30, 2011).
Contingent LiabilityThe maximum amount of contingent liability (gross exposure) of MIGA under guarantees issued and outstanding at June 30, 2012 totaled $10,345,866,000 ($9,121,712,000 – June 30, 2011). A contract of guarantee issued by MIGA may permit the guarantee holder, at the start of each contract period, to elect coverage and place amounts both on current and standby. MIGA is currently at risk for amounts placed on current. The maximum amount of contingent liability is MIGA’s maximum exposure to insurance claims, which includes “standby” coverage for which MIGA is committed but not currently at risk. At June 30, 2012, MIGA’s actual exposure to insurance claims, exclusive of standby coverage is $8,447,510,000 ($7,956,484,000 – June 30, 2011).
Reinsurance MIGA obtains treaty and facultative reinsurance (both public and private) to augment its underwriting capacity and to mitigate its risk by pro-tecting portions of its insurance portfolio, and not for speculative reasons. All reinsurance contracts are ceded on a proportionate basis. However, MIGA is exposed to reinsurance non-performance risk in the event that reinsurers fail to pay their proportionate share of the loss in case of a claim. MIGA manages this risk by requiring that private sector reinsurers be rated by at least two of the four major rating agencies (Standard & Poor’s, A.M. Best, Moody’s and Fitch), and that such ratings be above a minimum threshold. In addition, MIGA may also place reinsurance with public insurers of member countries that operate under and benefit from the full faith and credit of their governments and with multilateral agencies that represent an acceptable counterparty risk. MIGA has established limits, at both the project and portfolio levels, which restrict the amount of reinsurance that may be ceded. The project limit states that MIGA may cede no more than 90 percent of any individual project. The portfolio limit states that MIGA may not reinsure more than 50 percent of its aggregate gross exposure.
Of the $10,345,866,000 outstanding contingent liability (gross exposure) as at June 30, 2012 ($9,121,712,000 – June 30, 2011), $4,084,201,000 was ceded through contracts of reinsurance ($3,883,074,000 – June 30, 2011). Net exposure amounted to $6,261,664,000 as at June 30, 2012 ($5,238,638,000– June 30, 2011).
MIGA can also provide both public (official) and private insurers with facultative reinsurance. As of June 30, 2012, total insurance assumed by MIGA, primarily with official investment insurers, amounted to $496,169,000 ($368,716,000 – June 30, 2011).
Premiums relating to direct, assumed, and ceded contracts for the fiscal years ended June 30, 2012 and June 30, 2011 were as follows:
In thousands of US dollars June 30, 2012 June 30, 2011
Premiums Written
Direct 105,308 $103,009
Assumed 3,315 1,660
Ceded (34,738) (47,473)
Premiums Earned
Direct 86,340 74,111
Assumed 2,839 1,084
Ceded (33,681) (30,630)

MIGA ANNUAL REPORT 2012 | 89
Portfolio Risk Management Controlled acceptance of political risk in developing countries is MIGA’s core business. The underwriting of such risk requires a comprehensive risk management framework to analyze, measure, mitigate and control risk exposures. Claims risk, the largest risk for MIGA, is the risk of incurring a financial loss as a result of a claimable political risk event in developing countries. Political risk assessment forms an integral part of MIGA’s underwriting process and includes the analysis of both country-related and project-related risks.
Country risk assessment is a combination of quantitative and qualitative analysis. Ratings are assigned individually to each risk for which MIGA provides insurance coverage in a country. Country ratings are reviewed and updated every quarter. Country risk assessment forms the basis of the underwriting of insurance contracts, setting of premium levels, capital adequacy assessment and provisioning for claims. Project-specific risk assessment is performed by a cross-functional team. Based on the analysis of project-specific risk factors within the country context, the final project risk ratings can be higher or lower than the country ratings of a specific coverage. The decision to issue an insurance contract is subject to approval by MIGA’s Senior Management and concurrence by the Board of Directors. In order to avoid excessive risk con-centration, MIGA sets exposure limits per country and per project. The maximum net exposure which may be assumed by MIGA is $720 million ($600 million – June 30, 2011) in each host country and $220 million ($180 million – June 30, 2011) for each project.
As approved by the Board of Directors and the Council of Governors, the maximum aggregate amount of contingent liabilities that may be assumed by MIGA is 350 percent of the sum of MIGA’s unimpaired subscribed capital and its retained earnings, and insurance portfolio reserve plus such portion of the insurance ceded by MIGA through contracts of reinsurance as the Board of Directors may determine. Accordingly, at June 30, 2012, the maximum level of guarantees outstanding (including reinsurance) may not exceed $13,093 million ($12,817 million – June 30, 2011).
Portfolio Diversification MIGA aims to diversify its guarantee portfolio so as to limit the concentration of exposure to loss in a host country, region, or sector. The portfolio shares of the top five and top ten largest exposure countries provide an indicator of concentration risk. The gross and net exposures of the top five and top ten countries at June 30, 2012 and June 30, 2011 are as follows:
In thousands of US dollars June 30, 2012 June 30, 2011
Exposure in Top Five Countries
Exposure in Top Ten Countries
Exposure in Top Five Countries
Exposure in Top Ten Countries
Gross Exposure $4,096,598 $5,949,433 $4,185,685 $5,976,636
% of Total Gross Exposure 39.6 57.5 45.9 65.5
Net Exposure $1,918,072 $3,051,252 $1,894,936 $3,043,052
% of Total Net Exposure 30.6 48.7 36.2 58.1
A regionally diversified portfolio is desirable for MIGA as an insurer, because correlations of claims occurrences are typically higher within a region than between regions. When a correlation is higher, the probability of simultaneous occurrences of claims will be higher.
The regional distribution of MIGA’s portfolio at June 30, 2012 and June 30, 2011 is as follows:
In thousands of US dollars June 30, 2012 June 30, 2011
GrossExposure
NetExposure
% of Total Net Exposure
GrossExposure
NetExposure
% of Total Net Exposure
Africa $1,573,908 $1,257,866 20.1 $1,101,887 $885,715 16.9
Asia 1,391,723 861,415 13.8 1,295,724 759,163 14.5
Europe and Central Asia 5,543,471 3,017,803 48.2 5,432,561 2,843,859 54.3
Latin America and Caribbean 1,068,547 641,601 10.2 1,005,684 569,132 10.9
Middle East and North Africa 768,217 482,979 7.7 415,751 245,717 4.7
Adjustment for Master Agreement * (129,895) (64,948) (1.3)
$10,345,866 $6,261,664 100.0 $9,121,712 $5,238,638 100.0 * AdjustmentformasteragreementaccountsforMIGA’smaximumexposuretolosswithasingleinvestorbeinglessthanthesumofthe
maximumaggregateliabilitiesundertheindividualcontracts.
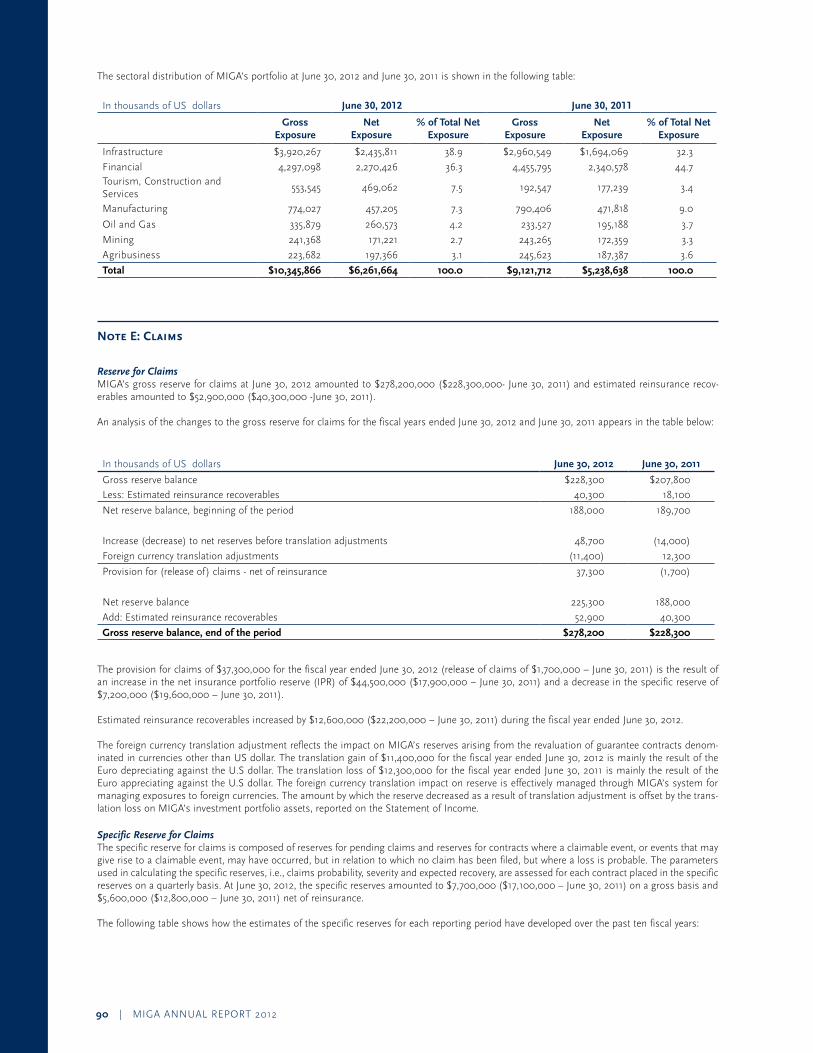
90 | MIGA ANNUAL REPORT 2012
The sectoral distribution of MIGA’s portfolio at June 30, 2012 and June 30, 2011 is shown in the following table:
In thousands of US dollars June 30, 2012 June 30, 2011
GrossExposure
NetExposure
% of Total Net Exposure
GrossExposure
NetExposure
% of Total Net Exposure
Infrastructure $3,920,267 $2,435,811 38.9 $2,960,549 $1,694,069 32.3
Financial 4,297,098 2,270,426 36.3 4,455,795 2,340,578 44.7 Tourism, Construction and Services
553,545 469,062 7.5 192,547 177,239 3.4
Manufacturing 774,027 457,205 7.3 790,406 471,818 9.0
Oil and Gas 335,879 260,573 4.2 233,527 195,188 3.7
Mining 241,368 171,221 2.7 243,265 172,359 3.3
Agribusiness 223,682 197,366 3.1 245,623 187,387 3.6
Total $10,345,866 $6,261,664 100.0 $9,121,712 $5,238,638 100.0
Note E: Claims
Reserve for Claims MIGA’s gross reserve for claims at June 30, 2012 amounted to $278,200,000 ($228,300,000- June 30, 2011) and estimated reinsurance recov-erables amounted to $52,900,000 ($40,300,000 -June 30, 2011).
An analysis of the changes to the gross reserve for claims for the fiscal years ended June 30, 2012 and June 30, 2011 appears in the table below:
In thousands of US dollars June 30, 2012 June 30, 2011
Gross reserve balance $228,300 $207,800
Less: Estimated reinsurance recoverables 40,300 18,100
Net reserve balance, beginning of the period 188,000 189,700
Increase (decrease) to net reserves before translation adjustments 48,700 (14,000)
Foreign currency translation adjustments (11,400) 12,300
Provision for (release of) claims - net of reinsurance 37,300 (1,700)
Net reserve balance 225,300 188,000
Add: Estimated reinsurance recoverables 52,900 40,300
Gross reserve balance, end of the period $278,200 $228,300
The provision for claims of $37,300,000 for the fiscal year ended June 30, 2012 (release of claims of $1,700,000 – June 30, 2011) is the result of an increase in the net insurance portfolio reserve (IPR) of $44,500,000 ($17,900,000 – June 30, 2011) and a decrease in the specific reserve of $7,200,000 ($19,600,000 – June 30, 2011).
Estimated reinsurance recoverables increased by $12,600,000 ($22,200,000 – June 30, 2011) during the fiscal year ended June 30, 2012.
The foreign currency translation adjustment reflects the impact on MIGA’s reserves arising from the revaluation of guarantee contracts denom-inated in currencies other than US dollar. The translation gain of $11,400,000 for the fiscal year ended June 30, 2012 is mainly the result of the Euro depreciating against the U.S dollar. The translation loss of $12,300,000 for the fiscal year ended June 30, 2011 is mainly the result of the Euro appreciating against the U.S dollar. The foreign currency translation impact on reserve is effectively managed through MIGA’s system for managing exposures to foreign currencies. The amount by which the reserve decreased as a result of translation adjustment is offset by the trans-lation loss on MIGA’s investment portfolio assets, reported on the Statement of Income.
Specific Reserve for Claims The specific reserve for claims is composed of reserves for pending claims and reserves for contracts where a claimable event, or events that may give rise to a claimable event, may have occurred, but in relation to which no claim has been filed, but where a loss is probable. The parameters used in calculating the specific reserves, i.e., claims probability, severity and expected recovery, are assessed for each contract placed in the specific reserves on a quarterly basis. At June 30, 2012, the specific reserves amounted to $7,700,000 ($17,100,000 – June 30, 2011) on a gross basis and $5,600,000 ($12,800,000 – June 30, 2011) net of reinsurance.
The following table shows how the estimates of the specific reserves for each reporting period have developed over the past ten fiscal years:
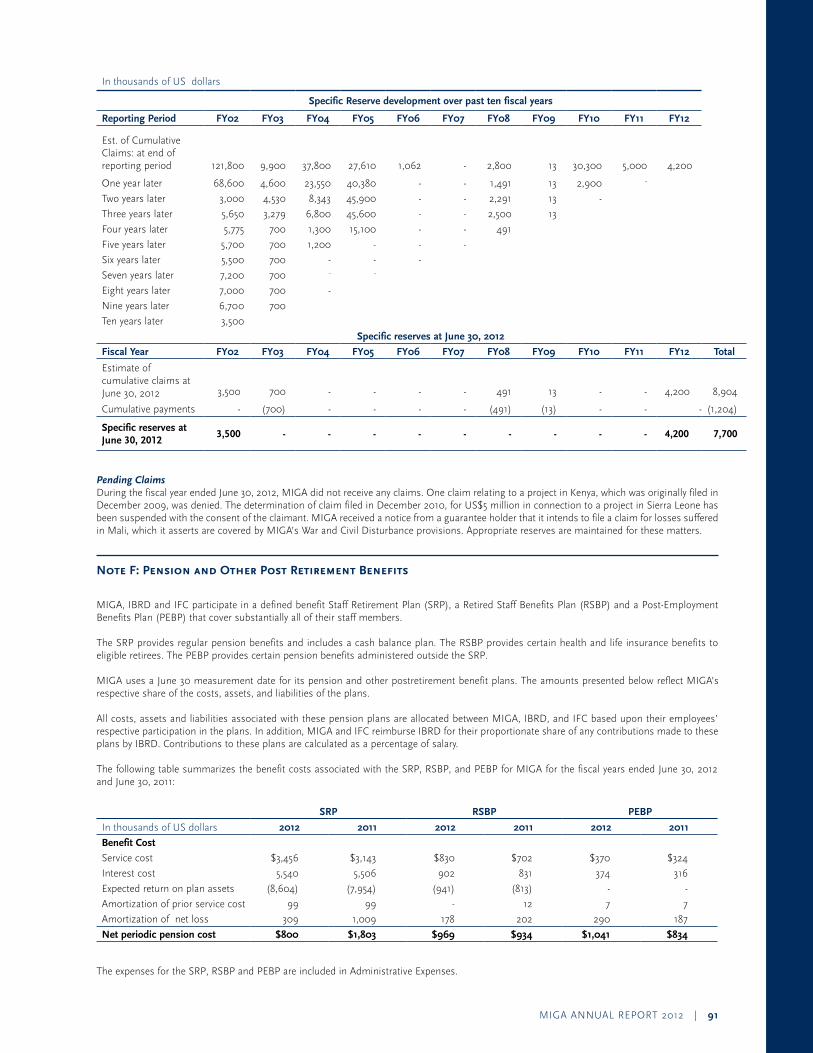
MIGA ANNUAL REPORT 2012 | 91
In thousands of US dollars
Specific Reserve development over past ten fiscal years
Reporting Period FY02 FY03 FY04 FY05 FY06 FY07 FY08 FY09 FY10 FY11 FY12
Est. of Cumulative Claims: at end of reporting period 121,800 9,900 37,800 27,610 1,062 - 2,800 13 30,300 5,000 4,200
One year later 68,600 4,600 23,550 40,380 - - 1,491 13 2,900 -
Two years later 3,000 4,530 8,343 45,900 - - 2,291 13 -
Three years later 5,650 3,279 6,800 45,600 - - 2,500 13
Four years later 5,775 700 1,300 15,100 - - 491
Five years later 5,700 700 1,200 - - -
Six years later 5,500 700 - - -
Seven years later 7,200 700 - -
Eight years later 7,000 700 -
Nine years later 6,700 700
Ten years later 3,500
Specific reserves at June 30, 2012
Fiscal Year FY02 FY03 FY04 FY05 FY06 FY07 FY08 FY09 FY10 FY11 FY12 Total
Estimate of cumulative claims at June 30, 2012 3,500 700 - - - - 491 13 - - 4,200 8,904
Cumulative payments - (700) - - - - (491) (13) - - - (1,204)
Specific reserves at June 30, 2012
3,500 - - - - - - - - - 4,200 7,700
Pending Claims During the fiscal year ended June 30, 2012, MIGA did not receive any claims. One claim relating to a project in Kenya, which was originally filed in December 2009, was denied. The determination of claim filed in December 2010, for US$5 million in connection to a project in Sierra Leone has been suspended with the consent of the claimant. MIGA received a notice from a guarantee holder that it intends to file a claim for losses suffered in Mali, which it asserts are covered by MIGA’s War and Civil Disturbance provisions. Appropriate reserves are maintained for these matters.
Note F: Pension and Other Post Retirement Benefits
MIGA, IBRD and IFC participate in a defined benefit Staff Retirement Plan (SRP), a Retired Staff Benefits Plan (RSBP) and a Post-Employment Benefits Plan (PEBP) that cover substantially all of their staff members.
The SRP provides regular pension benefits and includes a cash balance plan. The RSBP provides certain health and life insurance benefits to eligible retirees. The PEBP provides certain pension benefits administered outside the SRP.
MIGA uses a June 30 measurement date for its pension and other postretirement benefit plans. The amounts presented below reflect MIGA’s respective share of the costs, assets, and liabilities of the plans.
All costs, assets and liabilities associated with these pension plans are allocated between MIGA, IBRD, and IFC based upon their employees’ respective participation in the plans. In addition, MIGA and IFC reimburse IBRD for their proportionate share of any contributions made to these plans by IBRD. Contributions to these plans are calculated as a percentage of salary. The following table summarizes the benefit costs associated with the SRP, RSBP, and PEBP for MIGA for the fiscal years ended June 30, 2012 and June 30, 2011:
SRP RSBP PEBP
In thousands of US dollars 2012 2011 2012 2011 2012 2011
Benefit Cost
Service cost $3,456 $3,143 $830 $702 $370 $324
Interest cost 5,540 5,506 902 831 374 316
Expected return on plan assets (8,604) (7,954) (941) (813) - -
Amortization of prior service cost 99 99 - 12 7 7
Amortization of net loss 309 1,009 178 202 290 187
Net periodic pension cost $800 $1,803 $969 $934 $1,041 $834
The expenses for the SRP, RSBP and PEBP are included in Administrative Expenses.
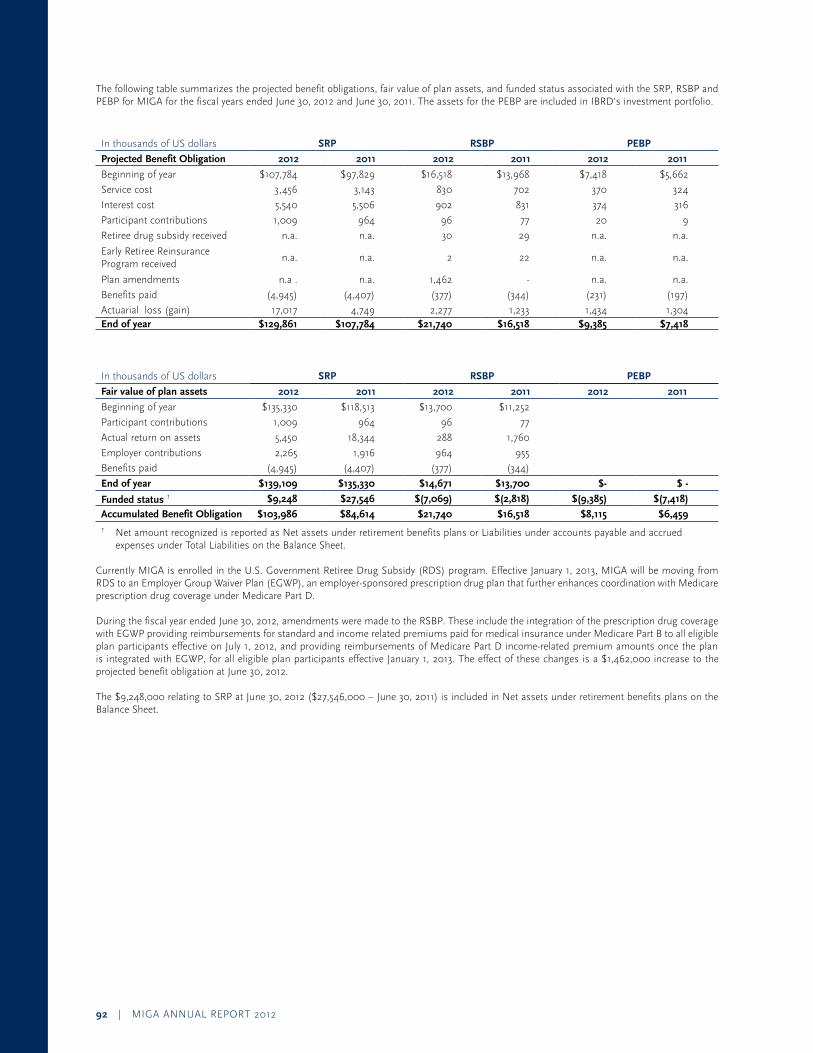
92 | MIGA ANNUAL REPORT 2012
The following table summarizes the projected benefit obligations, fair value of plan assets, and funded status associated with the SRP, RSBP and PEBP for MIGA for the fiscal years ended June 30, 2012 and June 30, 2011. The assets for the PEBP are included in IBRD’s investment portfolio.
In thousands of US dollars SRP RSBP PEBP
Projected Benefit Obligation 2012 2011 2012 2011 2012 2011
Beginning of year $107,784 $97,829 $16,518 $13,968 $7,418 $5,662
Service cost 3,456 3,143 830 702 370 324
Interest cost 5,540 5,506 902 831 374 316
Participant contributions 1,009 964 96 77 20 9
Retiree drug subsidy received n.a. n.a. 30 29 n.a. n.a.
Early Retiree Reinsurance Program received
n.a. n.a. 2 22 n.a. n.a.
Plan amendments n.a . n.a. 1,462 - n.a. n.a.
Benefits paid (4,945) (4,407) (377) (344) (231) (197)
Actuarial loss (gain) 17,017 4,749 2,277 1,233 1,434 1,304 End of year $129,861 $107,784 $21,740 $16,518 $9,385 $7,418
In thousands of US dollars SRP RSBP PEBP
Fair value of plan assets 2012 2011 2012 2011 2012 2011
Beginning of year $135,330 $118,513 $13,700 $11,252
Participant contributions 1,009 964 96 77
Actual return on assets 5,450 18,344 288 1,760
Employer contributions 2,265 1,916 964 955
Benefits paid (4,945) (4,407) (377) (344)
End of year $139,109 $135,330 $14,671 $13,700 $- $ -
Funded status 1 $9,248 $27,546 $(7,069) $(2,818) $(9,385) $(7,418)
Accumulated Benefit Obligation $103,986 $84,614 $21,740 $16,518 $8,115 $6,459 1 Net amount recognized is reported as Net assets under retirement benefits plans or Liabilities under accounts payable and accrued
expenses under Total Liabilities on the Balance Sheet.
Currently MIGA is enrolled in the U.S. Government Retiree Drug Subsidy (RDS) program. Effective January 1, 2013, MIGA will be moving from RDS to an Employer Group Waiver Plan (EGWP), an employer-sponsored prescription drug plan that further enhances coordination with Medicare prescription drug coverage under Medicare Part D.
During the fiscal year ended June 30, 2012, amendments were made to the RSBP. These include the integration of the prescription drug coverage with EGWP providing reimbursements for standard and income related premiums paid for medical insurance under Medicare Part B to all eligible plan participants effective on July 1, 2012, and providing reimbursements of Medicare Part D income-related premium amounts once the plan is integrated with EGWP, for all eligible plan participants effective January 1, 2013. The effect of these changes is a $1,462,000 increase to the projected benefit obligation at June 30, 2012.
The $9,248,000 relating to SRP at June 30, 2012 ($27,546,000 – June 30, 2011) is included in Net assets under retirement benefits plans on the Balance Sheet.
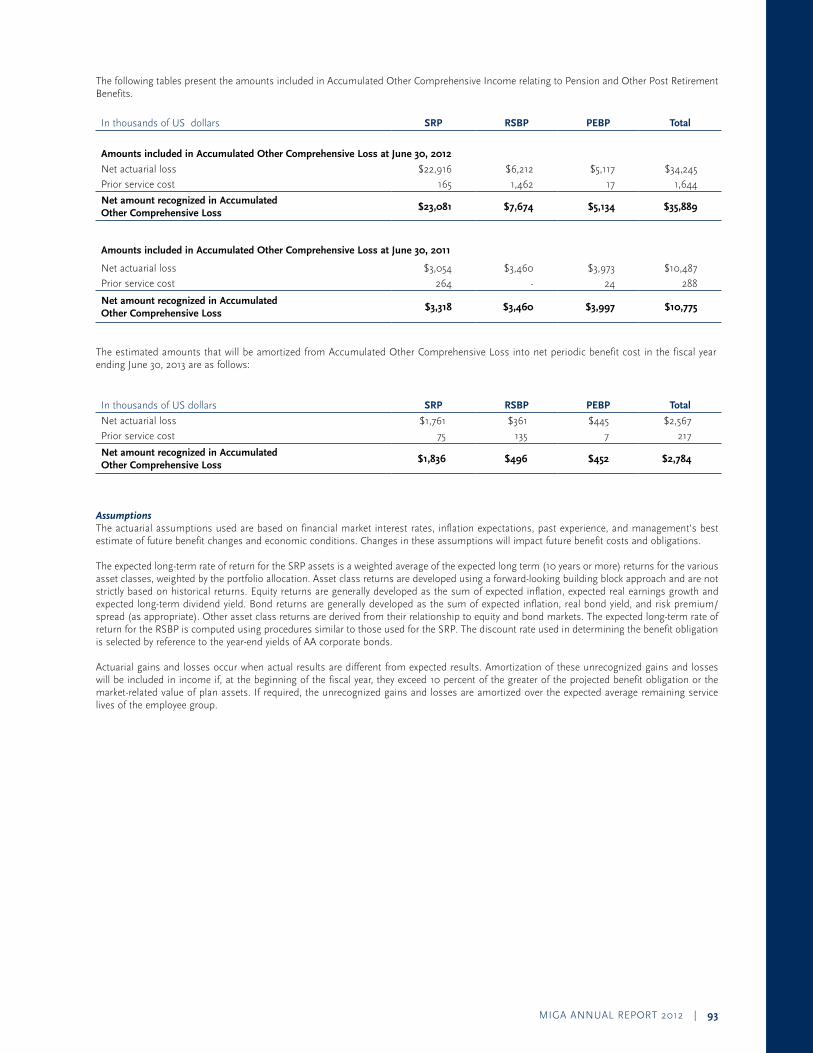
MIGA ANNUAL REPORT 2012 | 93
The following tables present the amounts included in Accumulated Other Comprehensive Income relating to Pension and Other Post Retirement Benefits.
In thousands of US dollars SRP RSBP PEBP Total
Amounts included in Accumulated Other Comprehensive Loss at June 30, 2012
Net actuarial loss $22,916 $6,212 $5,117 $34,245
Prior service cost 165 1,462 17 1,644
Net amount recognized in Accumulated Other Comprehensive Loss
$23,081 $7,674 $5,134 $35,889
Amounts included in Accumulated Other Comprehensive Loss at June 30, 2011
Net actuarial loss $3,054 $3,460 $3,973 $10,487
Prior service cost 264 - 24 288
Net amount recognized in Accumulated Other Comprehensive Loss
$3,318 $3,460 $3,997 $10,775
The estimated amounts that will be amortized from Accumulated Other Comprehensive Loss into net periodic benefit cost in the fiscal year ending June 30, 2013 are as follows:
In thousands of US dollars SRP RSBP PEBP Total
Net actuarial loss $1,761 $361 $445 $2,567
Prior service cost 75 135 7 217
Net amount recognized in Accumulated Other Comprehensive Loss
$1,836 $496 $452 $2,784
Assumptions The actuarial assumptions used are based on financial market interest rates, inflation expectations, past experience, and management’s best estimate of future benefit changes and economic conditions. Changes in these assumptions will impact future benefit costs and obligations.
The expected long-term rate of return for the SRP assets is a weighted average of the expected long term (10 years or more) returns for the various asset classes, weighted by the portfolio allocation. Asset class returns are developed using a forward-looking building block approach and are not strictly based on historical returns. Equity returns are generally developed as the sum of expected inflation, expected real earnings growth and expected long-term dividend yield. Bond returns are generally developed as the sum of expected inflation, real bond yield, and risk premium/spread (as appropriate). Other asset class returns are derived from their relationship to equity and bond markets. The expected long-term rate of return for the RSBP is computed using procedures similar to those used for the SRP. The discount rate used in determining the benefit obligation is selected by reference to the year-end yields of AA corporate bonds.
Actuarial gains and losses occur when actual results are different from expected results. Amortization of these unrecognized gains and losses will be included in income if, at the beginning of the fiscal year, they exceed 10 percent of the greater of the projected benefit obligation or the market-related value of plan assets. If required, the unrecognized gains and losses are amortized over the expected average remaining service lives of the employee group.
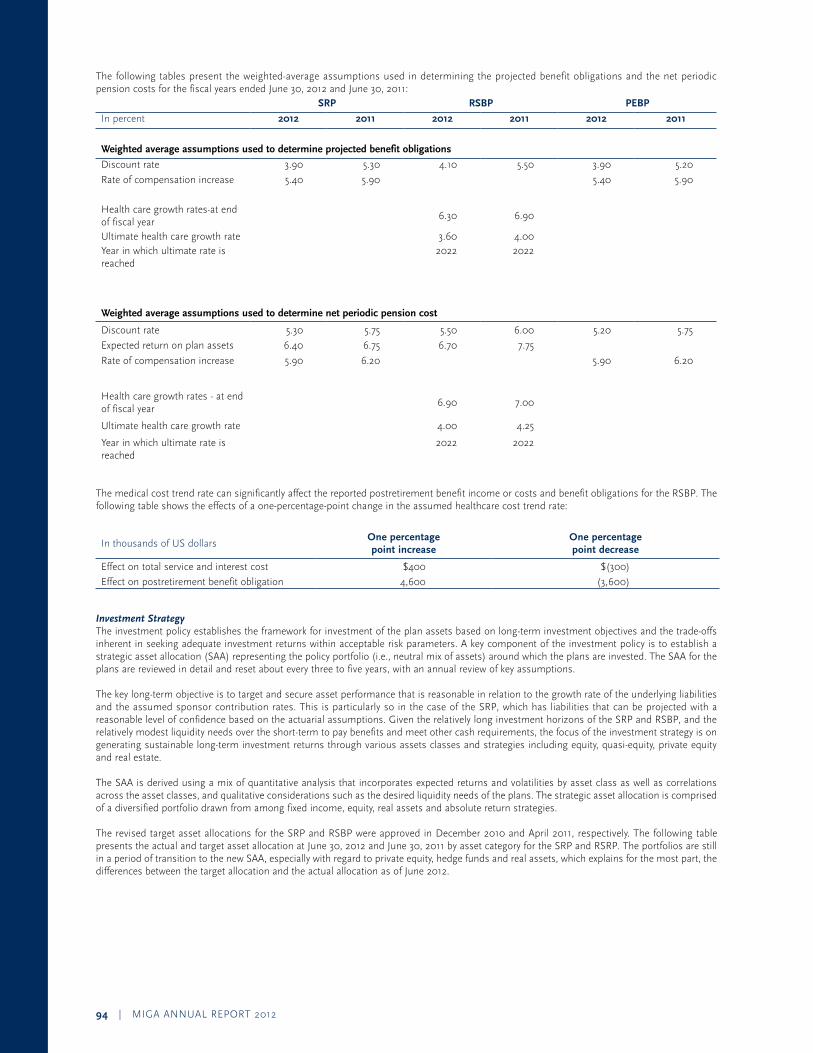
94 | MIGA ANNUAL REPORT 2012
The following tables present the weighted-average assumptions used in determining the projected benefit obligations and the net periodic pension costs for the fiscal years ended June 30, 2012 and June 30, 2011:
SRP RSBP PEBP
In percent 2012 2011 2012 2011 2012 2011
Weighted average assumptions used to determine projected benefit obligations
Discount rate 3.90 5.30 4.10 5.50 3.90 5.20
Rate of compensation increase 5.40 5.90 5.40 5.90
Health care growth rates-at end of fiscal year
6.30 6.90
Ultimate health care growth rate 3.60 4.00 Year in which ultimate rate is reached
2022 2022
Weighted average assumptions used to determine net periodic pension cost
Discount rate 5.30 5.75 5.50 6.00 5.20 5.75
Expected return on plan assets 6.40 6.75 6.70 7.75
Rate of compensation increase 5.90 6.20 5.90 6.20
Health care growth rates - at end of fiscal year
6.90 7.00
Ultimate health care growth rate 4.00 4.25
Year in which ultimate rate is reached
2022 2022
The medical cost trend rate can significantly affect the reported postretirement benefit income or costs and benefit obligations for the RSBP. The following table shows the effects of a one-percentage-point change in the assumed healthcare cost trend rate:
In thousands of US dollarsOne percentage point increase
One percentage point decrease
Effect on total service and interest cost $400 $(300)
Effect on postretirement benefit obligation 4,600 (3,600)
Investment Strategy The investment policy establishes the framework for investment of the plan assets based on long-term investment objectives and the trade-offs inherent in seeking adequate investment returns within acceptable risk parameters. A key component of the investment policy is to establish a strategic asset allocation (SAA) representing the policy portfolio (i.e., neutral mix of assets) around which the plans are invested. The SAA for the plans are reviewed in detail and reset about every three to five years, with an annual review of key assumptions.
The key long-term objective is to target and secure asset performance that is reasonable in relation to the growth rate of the underlying liabilities and the assumed sponsor contribution rates. This is particularly so in the case of the SRP, which has liabilities that can be projected with a reasonable level of confidence based on the actuarial assumptions. Given the relatively long investment horizons of the SRP and RSBP, and the relatively modest liquidity needs over the short-term to pay benefits and meet other cash requirements, the focus of the investment strategy is on generating sustainable long-term investment returns through various assets classes and strategies including equity, quasi-equity, private equity and real estate.
The SAA is derived using a mix of quantitative analysis that incorporates expected returns and volatilities by asset class as well as correlations across the asset classes, and qualitative considerations such as the desired liquidity needs of the plans. The strategic asset allocation is comprised of a diversified portfolio drawn from among fixed income, equity, real assets and absolute return strategies.
The revised target asset allocations for the SRP and RSBP were approved in December 2010 and April 2011, respectively. The following table presents the actual and target asset allocation at June 30, 2012 and June 30, 2011 by asset category for the SRP and RSRP. The portfolios are still in a period of transition to the new SAA, especially with regard to private equity, hedge funds and real assets, which explains for the most part, the differences between the target allocation and the actual allocation as of June 2012.

MIGA ANNUAL REPORT 2012 | 95
In percent SRP RSBP
Target allocation 2012
% of Plan Assets
Target allocation 2012
% of Plan Assets
Asset Class (%) 2012 2011 (%) 2012 2011
Fixed income & cash 31 33 33 24 32 33
Public equity 27 24 24 29 27 27
Private equity 15 20 20 20 24 25
Hedge funds 15 11 11 15 8 8
Real assetsa 12 12 12 12 9 7
Total 100 100 100 100 100 100aRealassetscompriseprimarilyofRealestateandRealestateinvestmenttrusts(REITs)withasmallallocationtoinfrastructureandtimber
Significant Concentrations of Risk in Plan Assets The assets of the SRP and RSBP are diversified across a variety of asset classes. Investments in these asset classes are further diversified across funds, managers, strategies, geographies and sectors to limit the impact of any individual investment. In spite of such level of diversification, equity market risk remains the primary source of the plans’ overall return volatility.
Risk Management PracticesManaging investment risk is an integral part of managing the assets of the Plan. Liability-driven investment management and asset diversification are central to the overall investment strategy and risk management approach for the SRP. The surplus volatility risk (defined as the annualized standard deviation of asset returns relative to that of liabilities) is considered the primary indicator of the Plan’s overall investment risk. It is used to define the risk tolerance level and establish the overall level of investment risk.
Investment risk is regularly monitored at the absolute level, as well as at the relative levels with respect to the investment policy, manager benchmarks, and liabilities of the Plan. Stress tests are performed periodically using relevant market scenarios to assess the impact of extreme market events. Monitoring of performance (at both manager and asset class levels) against benchmarks and compliance with investment guidelines is carried out on a regular basis as part of the risk monitoring process. Risk management for different asset classes is tailored to their specific characteristics and is an integral part of the external managers’ due diligence and monitoring processes.
Credit risk is monitored on a regular basis and assessed for possible market event impacts. The liquidity position of the Plans is analyzed at regular intervals and periodically tested using various stress scenarios to ensure that the Plans have sufficient liquidity to meet all cash flow requirements. In addition, the long-term cash flow needs of the Plans are considered during the SAA exercise and are one of the main drivers in determining maximum allocation to the illiquid investment vehicles.
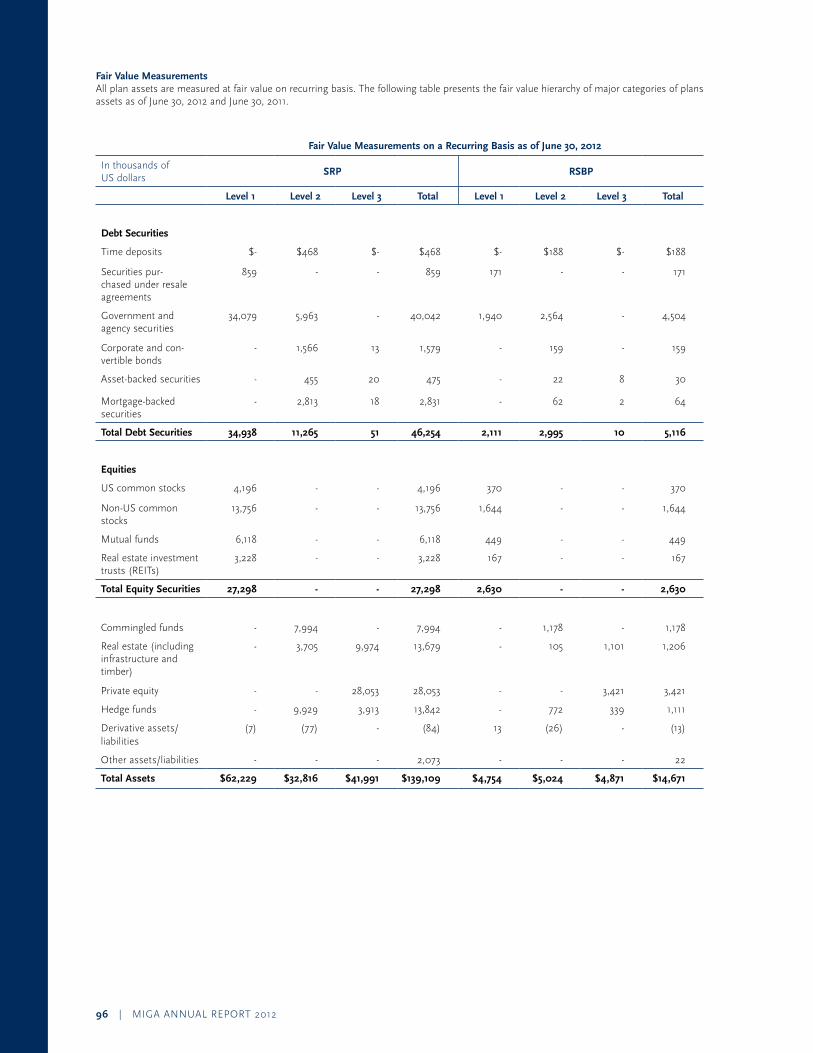
96 | MIGA ANNUAL REPORT 2012
Fair Value Measurements All plan assets are measured at fair value on recurring basis. The following table presents the fair value hierarchy of major categories of plans assets as of June 30, 2012 and June 30, 2011.
Fair Value Measurements on a Recurring Basis as of June 30, 2012
In thousands of US dollars
SRP RSBP
Level 1 Level 2 Level 3 Total Level 1 Level 2 Level 3 Total
Debt Securities
Time deposits $- $468 $- $468 $- $188 $- $188
Securities pur-chased under resale agreements
859 - - 859 171 - - 171
Government and agency securities
34,079 5,963 - 40,042 1,940 2,564 - 4,504
Corporate and con-vertible bonds
- 1,566 13 1,579 - 159 - 159
Asset-backed securities - 455 20 475 - 22 8 30
Mortgage-backed securities
- 2,813 18 2,831 - 62 2 64
Total Debt Securities 34,938 11,265 51 46,254 2,111 2,995 10 5,116
Equities
US common stocks 4,196 - - 4,196 370 - - 370
Non-US common stocks
13,756 - - 13,756 1,644 - - 1,644
Mutual funds 6,118 - - 6,118 449 - - 449
Real estate investment trusts (REITs)
3,228 - - 3,228 167 - - 167
Total Equity Securities 27,298 - - 27,298 2,630 - - 2,630
Commingled funds - 7,994 - 7,994 - 1,178 - 1,178
Real estate (including infrastructure and timber)
- 3,705 9,974 13,679 - 105 1,101 1,206
Private equity - - 28,053 28,053 - - 3,421 3,421
Hedge funds - 9,929 3,913 13,842 - 772 339 1,111
Derivative assets/ liabilities
(7) (77) - (84) 13 (26) - (13)
Other assets/liabilities - - - 2,073 - - - 22
Total Assets $62,229 $32,816 $41,991 $139,109 $4,754 $5,024 $4,871 $14,671

MIGA ANNUAL REPORT 2012 | 97
Fair Value Measurements on a Recurring Basis as of June 30, 2011
In thousands of US dollars
SRP RSBP
Level 1 Level 2 Level 3 Total Level 1 Level 2 Level 3 Total
Debt Securities
Time deposits $- $2,465 $- $2,465 $- $203 $- $203
Securities pur-chased under resale agreements
3,099 - - 3,099 179 - - 179
Government and agency securities
27,105 10,262 - 37,367 558 2,460 - 3,018
Corporate and con-vertible bonds
- 2,705 25 2,730 - 1,081 - 1,081
Asset backed securities - 1,253 268 1,521 - 57 17 74
Mortgage backed securities
- 4,458 154 4,612 - 72 7 79
Total Debt Securities 30,204 21,143 447 51,794 737 3,873 24 4,634
Equities
US common stocks 3,575 - - 3,575 327 - - 327
Non-US common stocks
12,640 - - 12,640 1,330 - - 1,330
Mutual Funds 2,723 - - 2,723 332 - - 332
Real estate investment trusts (REITs)
2,731 - - 2,731 22 - - 22
Total Equity Securities 21,669 - - 21,669 2,011 - - 2,011
Commingled funds - 7,941 - 7,941 - 1,593 - 1,593
Real estate (including infrastructure and timber)
- 3,384 8,024 11,408 - 92 889 981
Private equity - - 27,394 27,394 - - 3,413 3,413
Hedge funds - 12,578 3,518 16,096 - 807 298 1,105
Derivative assets/ liabilities
188 (257) - (69) 3 (57) - (54)
Other assets/liabilities - - - (903) - - - 17
Total Assets $52,061 $44,789 $39,383 $135,330 $2,751 $6,308 $4,624 $13,700
Valuation Methods and Assumptions The following are general descriptions of asset categories, as well as the valuation methodologies and inputs used to determine the fair value of each major category of Plan assets. It is important to note that the investment amounts in the asset categories shown in the table above are different from the asset category allocation shown in the Investment Strategy section of the note. Asset classes in the table above are grouped by the characteristics of the investments held. The asset class break-down in the Investment Strategy section is based on management’s view of the economic exposures after considering the impact of derivatives and certain trading strategies.
Debtsecurities include time deposits, U.S. treasuries and agencies, debt obligations of foreign governments and debt obligations in corporations of domestic and foreign issuers. Fixed income also includes investments in asset-backed securities such as collateralized mortgage obligations and mortgage-backed securities. These securities are valued by independent pricing vendors at quoted market prices for the same or similar securities, where available. If quoted market prices are not available, fair values are based on discounted consistently from period to period. Unless quoted prices are available, money market instruments and securities purchased under resale agreements are reported at face value, which approximates fair value.
Equitysecurities(including REITs) are invested in companies in various industries and countries. Investments in public equity listed on securities exchanges are valued at the last reported sale price on the last business day of the fiscal year.

98 | MIGA ANNUAL REPORT 2012
Commingledfunds are typically common or collective trusts reported at NAV as provided by the investment manager or sponsor of the fund based on valuation of underlying investments, and reviewed by management.
Privateequity includes investments primarily in leveraged buyouts, distressed investments and venture capital funds across North America, Europe and Asia in a variety of sectors. A large number of these funds are in the investment phase of their life cycle. Private equity investments do not have a readily determinable fair market value and are reported at NAV provided by the fund managers, and reviewed by management, taking into consideration the latest audited financial statements of the funds. The underlying investments are valued using inputs such as cost, operating results, discounted future cash flows and trading multiples of comparable public securities.
Realestate includes several funds which invest in core real estate as well as non-core types of real estate investments such as debt, value add, and opportunistic equity investments. Real estate investments do not have a readily determinable fair market value and are reported at NAV provided by the fund managers, and reviewed by management, taking into consideration the latest audited financial statements of the funds. The valuations of underlying investments are based on income and/or cost approaches or comparable sales approach, and taking into account discount and capitalization rates, financial conditions, local market conditions among others.
Hedgefund investments include those seeking to maximize absolute returns using a broad range of strategies to enhance returns and provide additional diversification. Hedge Funds include investments in equity, event driven, fixed income, multi strategy and macro relative value strategies. These investments do not have a readily determinable fair market value and are reported at NAVs provided by external managers or fund administrators (based on the valuations of underlying investments) on a monthly basis, and reviewed by management, taking into consid-eration the latest audited financial statements of the funds.
Investments in hedge funds and commingled funds can typically be redeemed at NAV within the near term while investments in private equity and most real estate are inherently long term and illiquid in nature with a quarter lag in reporting by the fund managers. For the reporting of those asset classes with a reporting lag, management estimates are based on the latest available information taking into account underlying market fundamentals and significant events through the balance sheet date.
Investmentinderivativessuch as equity or bond futures, to-be-announced (TBA) securities, swaps, options and currency forwards are used to achieve a variety of objectives that include hedging interest rates and currency risks, gaining desired market exposure of a security, an index or currency exposure and rebalancing the portfolio. Over-the-counter derivatives are reported using valuations based on discounted cash flow methods incorporating market observable input.
The following tables present a reconciliation of Level 3 assets held during the year ended June 30, 2012 and June 30, 2011. Investment in certain real estate funds that were identified as redeemable within 90 days of the period end were transferred out of Level 3 into Level 2.
In thousands of US dollarsSRP - Fair Value Measurements Using Significant Unobservable Inputs (Level 3),
Year Ended June 30, 2012
Corporate and
convertible Debt
Asset- backed
Securities
Mortgage-backed
Securities
Private Equity
Real EstateHedge Funds
Total
Balance as of July 1, 2011 $25 $268 $154 $27,394 $8,024 $3,518 $39,383
Actual return on plan assets: -
Relating to assets still held at the reporting date
1 (7) 51 (2,497) 207 (69) (2,314)
Relating to assets sold during the period
1 2 (46) 2,231 313 (35) 2,466
Purchases, issuance and settlements, net
(14) (239) (89) 925 1,430 590 2,603
Transfers in - - 9 - - 224 233
Transfers out - (4) (61) - - (315) (380)
Balance as of June 30, 2012 $13 $20 $18 $28,053 $9,974 $3,913 $41,991

MIGA ANNUAL REPORT 2012 | 99
In thousands of US dollarsRSBP - Fair Value Measurements Using Significant Unobservable Inputs (Level 3),
Year Ended June 30, 2012
Corporate and
convertible Debt
Asset- backed
Securities
Mortgage-backed
Securities
Private Equity
Real EstateHedge Funds
Total
Balance as of June 30, 2011 $- $17 $7 $3,413 $889 $298 $4,624
Actual return on plan assets:
Relating to assets still held at the reporting date
- - 0 (292) 159 (9) (142)
Relating to assets sold during the period
- (0) - 297 97 (1) 393
Purchases, issuance and settlements, net
- (8) (4) 4 (45) 86 33
Transfers in - - - - - 17 17
Transfers out - (0) (2) - - (53) (55)
Balance as of June 30, 2012 $- $8 $2 $3,421 $1,101 $339 $4,871
In thousands of US dollarsSRP - Fair Value Measurements Using Significant Unobservable Inputs (Level 3),
Year Ended June 30, 2011
Corporate and
convertible Debt
Asset- backed
Securities
Mortgage-backed
Securities
Private Equity
Real EstateHedge Funds
Total
Balance as of July 1, 2010 $42 $545 $248 $23,557 $7,892 $4,499 $36,782
Actual return on plan assets: -
Relating to assets still held at the reporting date
3 55 11 619 1,627 491 2,805
Relating to assets sold during the period
- (34) (7) 2,823 181 276 3,239
Purchases, issuance and set-tlements, net
3 26 (20) 395 1,678 (1,815) 267
Transfers in (out) (23) (324) (77) - (3,354) 66 (3,710)
Balance as of June 30, 2011 $25 $268 $154 $27,394 $8,024 $3,518 $39,383
In thousands of US dollarsRSBP - Fair Value Measurements Using Significant Unobservable Inputs (Level 3)
Year Ended June 30, 2011
Corporate and
convertible Debt
Asset-backed
Securities
Mortgage-backed
Securities
Private Equity
Real EstateHedge Funds
Total
Balance as of July 1, 2010 $3 $18 $6 $2,888 $633 $367 $3,914
Actual return on plan assets:
Relating to assets still held at the reporting date
0 4 2 172 111 32 321
Relating to assets sold during the period
(0) (3) (1) 351 24 40 412
Purchases, issuance and set-tlements, net
(3) 13 1 1 205 (145) 72
Transfers in (out) - (15) - - (84) 4 (95)
Balance as of June 30, 2011 $- $17 $7 $3,413 $889 $298 $4,624
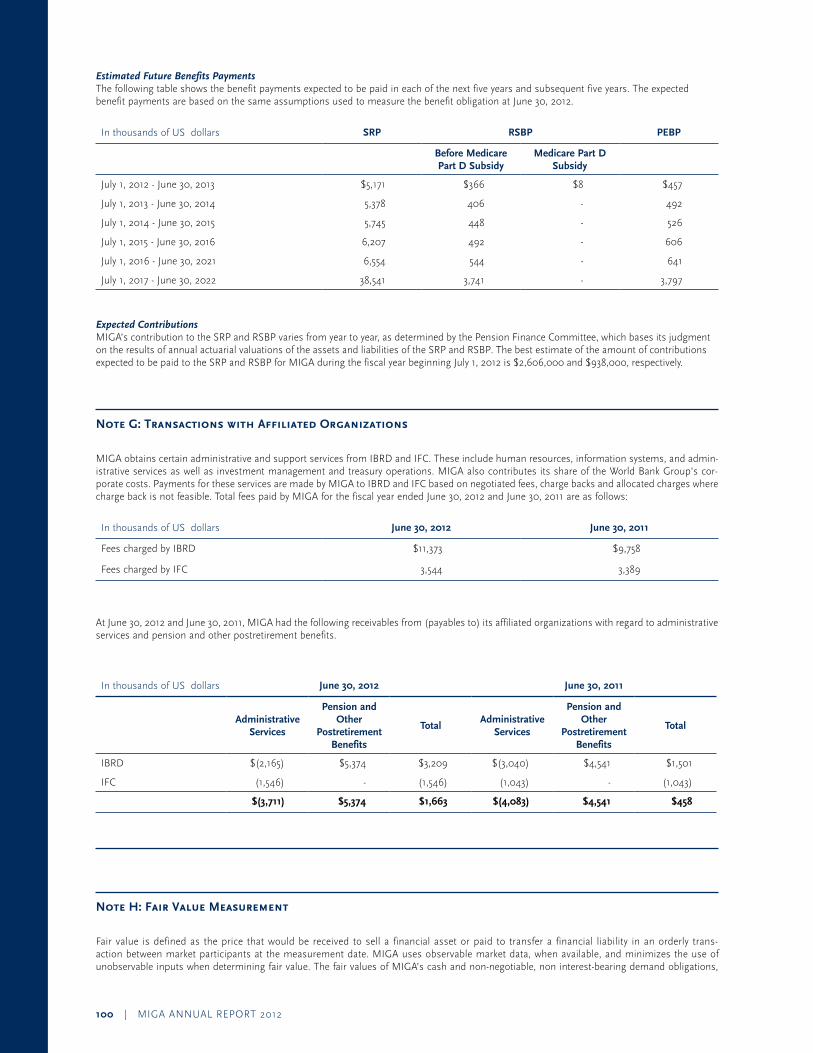
100 | MIGA ANNUAL REPORT 2012
Estimated Future Benefits PaymentsThe following table shows the benefit payments expected to be paid in each of the next five years and subsequent five years. The expected benefit payments are based on the same assumptions used to measure the benefit obligation at June 30, 2012.
In thousands of US dollars SRP RSBP PEBP
Before Medicare Part D Subsidy
Medicare Part D Subsidy
July 1, 2012 - June 30, 2013 $5,171 $366 $8 $457
July 1, 2013 - June 30, 2014 5,378 406 - 492
July 1, 2014 - June 30, 2015 5,745 448 - 526
July 1, 2015 - June 30, 2016 6,207 492 - 606
July 1, 2016 - June 30, 2021 6,554 544 - 641
July 1, 2017 - June 30, 2022 38,541 3,741 - 3,797
Expected Contributions MIGA’s contribution to the SRP and RSBP varies from year to year, as determined by the Pension Finance Committee, which bases its judgment on the results of annual actuarial valuations of the assets and liabilities of the SRP and RSBP. The best estimate of the amount of contributions expected to be paid to the SRP and RSBP for MIGA during the fiscal year beginning July 1, 2012 is $2,606,000 and $938,000, respectively.
Note G: Transactions with Affiliated Organizations
MIGA obtains certain administrative and support services from IBRD and IFC. These include human resources, information systems, and admin-istrative services as well as investment management and treasury operations. MIGA also contributes its share of the World Bank Group’s cor-porate costs. Payments for these services are made by MIGA to IBRD and IFC based on negotiated fees, charge backs and allocated charges where charge back is not feasible. Total fees paid by MIGA for the fiscal year ended June 30, 2012 and June 30, 2011 are as follows:
In thousands of US dollars June 30, 2012 June 30, 2011
Fees charged by IBRD $11,373 $9,758
Fees charged by IFC 3,544 3,389
At June 30, 2012 and June 30, 2011, MIGA had the following receivables from (payables to) its affiliated organizations with regard to administrative services and pension and other postretirement benefits.
In thousands of US dollars June 30, 2012 June 30, 2011
Administrative Services
Pension and Other
Postretirement Benefits
TotalAdministrative
Services
Pension and Other
Postretirement Benefits
Total
IBRD $(2,165) $5,374 $3,209 $(3,040) $4,541 $1,501
IFC (1,546) - (1,546) (1,043) - (1,043)
$(3,711) $5,374 $1,663 $(4,083) $4,541 $458
Note H: Fair Value Measurement
Fair value is defined as the price that would be received to sell a financial asset or paid to transfer a financial liability in an orderly trans-action between market participants at the measurement date. MIGA uses observable market data, when available, and minimizes the use of unobservable inputs when determining fair value. The fair values of MIGA’s cash and non-negotiable, non interest-bearing demand obligations,

MIGA ANNUAL REPORT 2012 | 101
receivables for investment securities sold, payables for investment securities purchased, accounts payable and accrued expenses approximate their carrying values. The fair values of government obligations are based on quoted market prices and the fair values of asset backed securities are based on pricing models for which market observable inputs are used. The degree to which management judgment is involved in determining the fair value of a financial instrument is dependent upon the availability of quoted market prices or observable market parameters. For financial instruments that trade actively and have quoted market prices or observable market parameters, there is minimal subjectivity involved in mea-suring fair value. Substantially all of MIGA’s financial instruments use either of the foregoing methodologies to determine fair values that are recorded on its financial statements.
Note I: Risk Management
The responsibility for approving MIGA’s risk management policies lies with the Board of Directors. The Audit Committee of the Board deals with risk management issues. While the Executive Vice President assumes the responsibility for overall risk management with the support of the senior management team, the responsibility for the design and operational implementation of the risk management framework lies with the Finance and Risk Management Group with coordination from the Legal Affairs and Claims Group, the Operations Group and the Economics and Policy Group.
Risk CategoriesMIGA is exposed to a variety of risks and uses risk management programs such as an Economic Capital Framework, and reinsurance arrangements to manage its risk. Below is a description of risk management systems of the important risks for MIGA.
r Insurance Risk Political risk assessment forms an integral part of MIGA’s underwriting process, and includes the analysis of both country-related and project-related risks. Insurance risk arises from MIGA’s core business of issuing investment guarantees. MIGA’s earnings depend upon the extent to which claims experience is consistent with assumptions used in setting prices for products and establishing technical pro-visions and liabilities for claims. If actual claims experience of the Agency is less favorable than underlying assumptions, then income would be reduced. MIGA monitors claim activities and provisions for pending claims. In addition, claims reserves for the guarantee portfolio are calculated, using MIGA’s Economic Capital model.
Economic Capital and Portfolio Risk ModelingFor portfolio risk management purposes, MIGA currently utilizes an Economic Capital Model, based on best practices framework used in risk modeling. The Economic Capital concept is a widely recognized risk management tool in the banking and insurance industries, defining the minimum amount of capital an organization needs to hold in order to sustain larger than expected losses with a high degree of confidence, over a defined time horizon and given the risk exposure and defined risk tolerance. MIGA defines its economic capital as the 99.99th percentile of the aggregate loss distribution over a one year horizon, minus the mean of the loss distribution, which is in line with industry practice.
The model helps evaluate concentration risk in the guarantee portfolio and facilitates active, risk-based exposure management by allocating the Economic Capital to particular regions, countries, sectors, covers, or individual contracts, based on their respective risk contribution. In order to prevent excessive risk concentration, MIGA uses the Economic Capital model to set exposure limits per country and per project, and to support decision making in terms of pricing and exposure retention for new projects. MIGA’s reinsurance program, including treaty and facultative rein-surance, is linked to the portfolio risk modeling and helps manage the risk profile of the portfolio.
The Economic Capital model also serves as the cornerstone of MIGA’s capital adequacy framework, and provides the analytical basis for risk-based pricing of its products as well as quantification of the need for prudent technical provisions for claims. In addition, the model-based capital adequacy assessment determines the size and duration targets for MIGA’s liquidity holdings. The economic capital, pricing models and underlying parameters are reviewed periodically.
r Credit Risk Counter-party credit risk in MIGA’s portfolio is the risk that reinsurers would fail to pay their share of a claim. MIGA requires that private sector reinsurers, with which it conducts business, be rated by at least two of the four major rating agencies (Standard & Poor’s, A.M. Best, Moody’s and Fitch), and that the ratings be above a minimum threshold. Also, MIGA has established limits at both the project and portfolio levels, which restrict the amount of reinsurance. At present MIGA’s investment portfolio does not have significant credit risk exposure. MIGA currently invests in fixed income securities with high credit quality. The Investment authorization stipulates that government or agency sponsored debt securities be AA-rated or above, time deposits be A-rated or above, and corporate debt securities be AAA-rated.
r Interest Rate Risk Interest rate changes affect the market values of MIGA’s invested assets. A need to liquidate assets to pay for claims in an unfavorable interest rate environment may generate trading losses and reduce investment income. Changes in interest rates will also affect prepayment speeds of mortgage and asset backed security holdings, which may affect the duration of the asset portfolio. A 100 basis point parallel shift in the yield curve would impact the net income for the year ended June 30, 2012, by approximately $19.9 million ($21.3 million – June 30, 2011). This interest rate sensitivity is illustrative only and is based on simplified scenarios. The impact of a parallel shift in interest rates is determined using market value weighted portfolio duration applied to invested asset balance at year end.
r Foreign Exchange Rate Risk The majority of MIGA’s assets and contingent liabilities are denominated in USD, but some guarantee contracts are issued in other currencies such as EUR. To the extent that a claim is made in a non-USD currency and requires payment in excess of MIGA’s holdings of that currency, MIGA may face a foreign exchange related loss in converting to the needed currency to pay for a claim. A 10% change in the USD/Euro year end exchange rate would impact net income for the year ended June 30, 2012, by approximately $9.0 million ($8.1million – June 30, 2011) and net guarantee exposure by approximately $229.7 million ($203.4 million – June 30, 2011). The impact on the net income is mitigated by an offsetting effect due to exchange rate movement on provision for claims. This foreign exchange rate sensitivity is illustrative only and is based on simplified scenarios.
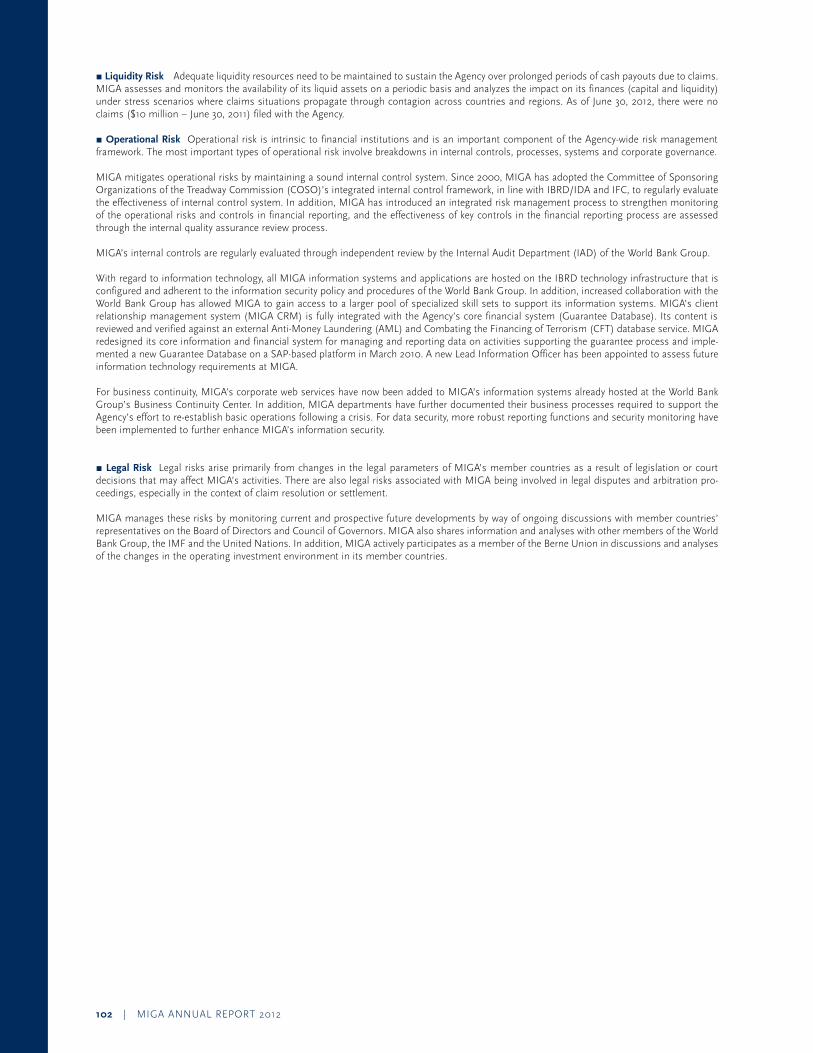
102 | MIGA ANNUAL REPORT 2012
r Liquidity Risk Adequate liquidity resources need to be maintained to sustain the Agency over prolonged periods of cash payouts due to claims. MIGA assesses and monitors the availability of its liquid assets on a periodic basis and analyzes the impact on its finances (capital and liquidity) under stress scenarios where claims situations propagate through contagion across countries and regions. As of June 30, 2012, there were no claims ($10 million – June 30, 2011) filed with the Agency.
r Operational Risk Operational risk is intrinsic to financial institutions and is an important component of the Agency-wide risk management framework. The most important types of operational risk involve breakdowns in internal controls, processes, systems and corporate governance.
MIGA mitigates operational risks by maintaining a sound internal control system. Since 2000, MIGA has adopted the Committee of Sponsoring Organizations of the Treadway Commission (COSO)’s integrated internal control framework, in line with IBRD/IDA and IFC, to regularly evaluate the effectiveness of internal control system. In addition, MIGA has introduced an integrated risk management process to strengthen monitoring of the operational risks and controls in financial reporting, and the effectiveness of key controls in the financial reporting process are assessed through the internal quality assurance review process.
MIGA’s internal controls are regularly evaluated through independent review by the Internal Audit Department (IAD) of the World Bank Group.
With regard to information technology, all MIGA information systems and applications are hosted on the IBRD technology infrastructure that is configured and adherent to the information security policy and procedures of the World Bank Group. In addition, increased collaboration with the World Bank Group has allowed MIGA to gain access to a larger pool of specialized skill sets to support its information systems. MIGA’s client relationship management system (MIGA CRM) is fully integrated with the Agency’s core financial system (Guarantee Database). Its content is reviewed and verified against an external Anti-Money Laundering (AML) and Combating the Financing of Terrorism (CFT) database service. MIGA redesigned its core information and financial system for managing and reporting data on activities supporting the guarantee process and imple-mented a new Guarantee Database on a SAP-based platform in March 2010. A new Lead Information Officer has been appointed to assess future information technology requirements at MIGA.
For business continuity, MIGA’s corporate web services have now been added to MIGA’s information systems already hosted at the World Bank Group’s Business Continuity Center. In addition, MIGA departments have further documented their business processes required to support the Agency’s effort to re-establish basic operations following a crisis. For data security, more robust reporting functions and security monitoring have been implemented to further enhance MIGA’s information security.
r Legal Risk Legal risks arise primarily from changes in the legal parameters of MIGA’s member countries as a result of legislation or court decisions that may affect MIGA’s activities. There are also legal risks associated with MIGA being involved in legal disputes and arbitration pro-ceedings, especially in the context of claim resolution or settlement. MIGA manages these risks by monitoring current and prospective future developments by way of ongoing discussions with member countries’ representatives on the Board of Directors and Council of Governors. MIGA also shares information and analyses with other members of the World Bank Group, the IMF and the United Nations. In addition, MIGA actively participates as a member of the Berne Union in discussions and analyses of the changes in the operating investment environment in its member countries.

MIGA ANNUAL REPORT 2012 | 103
Related Documents