Management’s Discussion & Analysis of Financial Results For the three and nine month periods ended September 30, 2011 Nov 9, 2011 1 Excellon Resources Inc. (the "Company", or "Excellon") has prepared this Management's Discussion and Analysis of Financial Results ("MD&A") for the three and nine month period ended September 30, 2011 in accordance with the requirements of National Instrument 51‐102 ("NI 51‐102"). This MD&A contains information as at November 9, 2011 and provides information on the operations of the Company for the three and nine month periods ended September 30, 2011 and 2010 and subsequent to the period end, and should be read in conjunction with the unaudited interim consolidated financial statements for the three and nine month period ended September 30, 2011 and the audited consolidated financial statements for the year ended December 31, 2010 filed on SEDAR. The unaudited interim consolidated financial statements for the nine month period ended September 30, 2011 have been prepared in accordance with International Financial Reporting Standards (“IFRS”). Effective January 1, 2011, the Company began reporting in United States dollars and this change has been applied retrospectively. All figures in this MD&A are in US dollars unless otherwise noted.

Welcome message from author
This document is posted to help you gain knowledge. Please leave a comment to let me know what you think about it! Share it to your friends and learn new things together.
Transcript

Management’s Discussion & Analysis of Financial Results For the three and nine month periods ended September 30, 2011
Nov 9, 2011
1
Excellon Resources Inc. (the "Company", or "Excellon") has prepared this Management's Discussion and Analysis of Financial Results ("MD&A") for the three and nine month period ended September 30, 2011 in accordance with the requirements of National Instrument 51‐102 ("NI 51‐102"). This MD&A contains information as at November 9, 2011 and provides information on the operations of the Company for the three and nine month periods ended September 30, 2011 and 2010 and subsequent to the period end, and should be read in conjunction with the unaudited interim consolidated financial statements for the three and nine month period ended September 30, 2011 and the audited consolidated financial statements for the year ended December 31, 2010 filed on SEDAR. The unaudited interim consolidated financial statements for the nine month period ended September 30, 2011 have been prepared in accordance with International Financial Reporting Standards (“IFRS”). Effective January 1, 2011, the Company began reporting in United States dollars and this change has been applied retrospectively. All figures in this MD&A are in US dollars unless otherwise noted.

Management’s Discussion & Analysis of Financial Results For the three and nine month periods ended September 30, 2011
Nov 9, 2011
2
Description of Business Excellon is exploring, developing and mining the high‐grade silver‐zinc‐lead mineralization on its approximately 58,054‐hectare (143,455‐acre) Platosa Property ("Platosa"), including an optioned portion, in northeastern Durango State, Mexico. The style of mineralization at Platosa resembles that of several of the world‐class carbonate replacement deposits ("CRD") of Mexico. The Company produces two concentrates; a silver‐lead concentrate and a silver‐zinc concentrate. Both concentrates are shipped to the port of Manzanillo where they are purchased by Consorcio Minero de Mexico Cormin Mex, S.A. de C.V., a Trafigura Group Company. On October 25, 2011 the Company reported an updated Mineral Resource estimate for the Platosa Mine. The estimate was prepared as at July 31, 2011. The new Measured plus Indicated Mineral Resource estimate is 637,000 tonnes grading 836 g/t (24.4 oz/T) Ag, 8.95% Pb, 10.58% Zn. The Measured plus Indicated tonnage has increased by 10% from that of the previous estimate as at October 31, 2009. Lead and Zn grades are nearly unchanged while the Ag grade has decreased by 8% as most of the added tonnes have a lower Ag grade than those mined since late 2009. The new Inferred Mineral Resource estimate is 69,000 tonnes grading 1,011 g/t (29.5 oz/T) Ag, 11.35% Pb, 11.34% Zn. Inferred Ag, Pb and Zn grades increased significantly while tonnage decreased, principally because 2009 Inferred tonnes with a value below the 2011 Net Smelter Return (“NSR”) cut‐off of US$200/tonne were dropped. Taking into account the 109,000 tonnes of production since the previous estimate, total tonnage increased by 10%. The increase in tonnage is derived largely from the Pierna, 6A/6B and NE‐1 Mantos. The high‐grade Pierna Manto, discovered in late 2010, contributed a Measured plus Indicated Mineral Resource of 45,000 tonnes grading 776 g/t (22.6 oz/T) Ag, 8.80% Pb, 15.94% Zn. The new estimate confirms that the Mineral Resource at Platosa has been maintained since the previous estimate.
Platosa Project – Mineral Resource Estimate (as of July 31, 2011)
Category Tonnes (t) Ag (g/t)
Ag (oz/T)
Pb (%)
Zn (%)
Contained Ag (oz)
Contained Pb (lb)
Contained Zn (lb)
Measured 88,000 1,064 31.0 9.14 11.99 3,016,000 17,760,000 23,301,000
Indicated 549,000 800 23.3 8.92 10.36 14,104,000 107,918,000 125,248,000
M + I 637,000 836 24.4 8.95 10.58 17,120,000 125,678,000 148,549,000
Inferred 69,000 1,011 29.5 11.35 11.34 2,241,000 17,254,000 17,247,000
Notes:
1. CIM definitions were followed for the classification of Mineral Resources. 2. Mineral Resources are estimated at an incremental NSR cut-off value of US$200 per tonne 3. NSR metal price assumptions: Ag US$25.00/oz, Pb US$1.15/lb, Zn US$1.15/lb. 4. Estimate is of Mineral Resources only and, because these do not constitute Mineral Reserves, they do not have
any demonstrated economic viability. 5. National Instrument 43-101 compliant Mineral Resource estimate prepared by David Ross, P.Geo., of Roscoe
Postle Associates Inc., independent geological and mining consultants of Toronto, Ontario. Prepared as at July 31, 2011.
6. Totals may not add correctly due to rounding.

Management’s Discussion & Analysis of Financial Results For the three and nine month periods ended September 30, 2011
Nov 9, 2011
3
The above resource estimate is for the Platosa Project only and does not include any estimates from the Miguel Auza property acquired in June 2009. Changes to Accounting Standards International Financial Reporting Standards (IFRS) Effective January 1, 2011, the Company adopted IFRS as required for all publicly accountable enterprises by the Canadian Accounting Standards Board (“AcSB”). The adoption date of January 1, 2011 has required the restatement for comparative purposes of amounts reported by the Company for the year ended December 31, 2010. A reconciliation from equity under Canadian GAAP to IFRS at the date of transition (January 1, 2010) and reconciliation from profit and loss under Canadian GAAP to IFRS for the prior year comparable quarter and year to date for 2010, has been disclosed in note 5 to the unaudited consolidated financial statements and later in this MD&A. Impact of the changeover to IFRS The conversion to IFRS resulted in few differences in recognition, measurement, and presentation provided in the interim consolidated financial statements. Cash flows have not been affected by the change. Net assets at December 31, 2010 were decreased by only $9,000 which was the impact of the change in the method of measuring the rehabilitation provision (asset retirement obligation). Comprehensive income for the year ended December 31, 2010 was also impacted in the same amount by the restatement of the rehabilitation provision and also by a change in the measurement of share‐based compensation that added an additional $104,000 in expense. Therefore the total decrease in comprehensive income was $113,000. Both of these changes are non‐cash items. Management expects that future reporting will not be affected by much more than the variation disclosed in the interim consolidated financial statements to‐date. Regarding presentation, the financial position, income statement and cash flow statement line items relate easily to each other under Canadian GAAP and IFRS with the exception of mineral properties that had to be reclassified under IFRS. At December 31, 2010 mineral rights of about $2 million, net of amortization were reclassified to Intangibles. The remainder of mineral properties was reclassified to property, plant and equipment as mining properties. International Accounting Standard (IAS) 34 Interim Financial Reporting states that the purpose of interim financial reporting is to provide an update on the latest complete set of annual financial statements. Less note disclosure is required in interim reporting than that required in a full set of IFRS annual financial statements. However, an interim financial report that complies only with the minimum requirements under IAS 34 is less informative in the first quarter after a transition to IFRS, since the latest annual financial statements were prepared under Canadian GAAP. Consequently, additional IFRS transition

Management’s Discussion & Analysis of Financial Results For the three and nine month periods ended September 30, 2011
Nov 9, 2011
4
information, such as the opening consolidated statement of financial position and accounting policies under IFRS, are included in the Company’s Q1 interim consolidated financial statements so that financial statements users are better able to understand how the transition to IFRS affected previously reported annual and interim results. Accordingly, the Ontario Securities Commission (“OSC”) has stated that issuers do not have to repeat this kind of information in their Q2 and Q3 interim financial reports, since the information is already available on public record through their Q1 report. The OSC also stated that it would therefore not object to issuers making a cross‐reference to the Q1 report in their Q2 and Q3 interim financial reports. The Company has made such cross‐reference in its interim financial statements after Q1. Other matters related to interim reporting in the year of changeover Two other matters related to the Company’s interim reports in the year of the changeover should be noted. The Company follows IAS 34 when preparing quarterly consolidated financial statements. Under IAS 34, condensed financial statements may be produced. Accordingly, the reconciliations to Canadian GAAP in the interim 2011 financial statements may not highlight all the items that will be reported in the 2011 annual financial statements. Management does not believe that the more extensive disclosures that will be made in the annual financial statements will have a significant effect on future results. While interim financial statements need to be prepared in accordance with IAS 34, it is only when preparing the first annual IFRS financial statements that decisions about optional exemptions under IFRS 1 are required to be finalized. Management believes that decisions about IFRS 1 exemptions in 2011 quarterly reporting are expectations of the final elections to be reported in the first annual IFRS financial statements. The IFRS accounting differences, preliminary findings concerning accounting policies and the IFRS 1 selections set out in the interim consolidated financial statements are based on current IFRS which are subject to change. The Company’s reporting under IFRS in 2011 will be based on the standards effective at December 31, 2011. Accordingly, the Company continues to monitor standards development by the International Accounting Standards Board and the AcSB. Change to United States Dollar Reporting Effective January 1, 2011, the Company began reporting in US dollars. This change was made in order to improve the comparability of the Company’s financial information with other mining companies. This change has been applied retrospectively as if the new presentation currency has always been the US dollar. Mine Operations Platosa mine production for the third quarter of 2011 was as planned for tonnes. Silver and lead grades were 9% and 11% respectively below plan while zinc grade was 44% above plan. Nine‐month production was slightly above plan in terms of tonnes. Silver grade was 8% below plan and lead grade was 16% below plan while zinc grade was 15% above plan. The nine‐month figures are marked improvements over

Management’s Discussion & Analysis of Financial Results For the three and nine month periods ended September 30, 2011
Nov 9, 2011
5
those of the first quarter. Management expects these improvements to continue as mine development continues to advance favourably and more production areas become available. Actual and planned mine production for the third quarter and first nine months of 2011 are as follows:
The following are the Platosa mine production statistics for the periods indicated:
3 months ended
September 30, 2011
3 months ended September 30,
2010
9 months ended September 30,
2011
9 months ended September 30,
2010 Tonnes of ore processed 15,048 12,391 42,366 52,309 Ore grades: Silver (g/t) 723 848 732 835 Lead (%) 6.37 5.94 6.11 6.66 Zinc (%) 11.35 7.26 8.90 8.30 Recoveries: Silver (%) 88.5 84.0 87.4 86.3 Lead (%) 74.2 65.5 73.3 69.1 Zinc (%) 81.0 70.0 76.6 75.3 Production: Silver – (oz) 283,839 282,963 861,060 1,096,016 Lead – (lb) 1,545,294 1,054,753 4,211,403 4,974,091 Zinc – (lb) 2,694,969 1,451,904 6,071,893 7,145,644 Sales: Silver – (oz) 276,942 282,963 854,163 1,096,016 Lead – (lb) 1,519,787 1,054,753 4,185,896 4,974,091 Zinc – (lb) 2,572,547 1,451,904 5,949,471 7,145,644 Realized prices:
Silver – ($US/oz) 37.18 18.84 37.14 18.15 Lead – ($US/lb) 0.99 0.99 1.08 0.92 Zinc – ($US/lb) 1.01 0.99 1.04 0.91
Period Tonnes Ag (g/t) Pb (%) Zn (%) Third quarter ended September 30, 2011 (plan) 15,000 790 7.13 7.89Third quarter ended September 30, 2011 (actual) 15,048 723 6.37 11.35 Nine months ended September 30, 2011 (plan) 42,000 795 7.17 7.70Nine months ended September 30, 2011 (actual) 42,366 732 6.11 8.90

Management’s Discussion & Analysis of Financial Results For the three and nine month periods ended September 30, 2011
Nov 9, 2011
6
Cash Cost per Ounce of Silver Produced The Company's cash cost per ounce of silver produced for the three‐month period ended September 30, 2011 was US$6.95 per ounce (three months ended September 30, 2010 ‐ US$14.75/oz). For the nine‐month period ended September 30, 2011 the cash cost of silver production was US$6.65 per ounce compared to US$6.61 per ounce for the same period of 2010. The calculation of cash cost per ounce produced reflects the cost of production adjusted for by‐product and various non‐operating costs included in Cost of Sales. The table which follows presents the details of the calculation. Cash operating costs in the current quarter at $2.0 million (refer to the following table) are lower than the same period last year by $1.3 million as ore processed in Q3 ‐ 2011 at 15,048 tonnes was 21% higher than the same period last year. Cash costs have dropped significantly from US$14.75/oz silver in Q3 ‐ 2010 to US$6.95/oz silver in Q3 ‐ 2011, however, cash costs have increased from US$3.74/oz silver in Q2 ‐ 2011 to US$6.95/oz silver in the current quarter due to the lower grade of ore processed. On a year‐to‐date basis ore processed is 20% lower in the current year compared to 2010 and unit cash costs per ounce of silver produced are 1% higher. Reconciliation of Cash Cost per Ounce of Silver Produced, Net of By‐Product Credits:
(1) By‐product credits comprise revenues from sales of zinc and lead.
Cash operating cost, net of by‐product credits, is provided as additional information. It is a non‐GAAP measure that does not have a standardized meaning. This measure should not be considered in isolation or as a substitute for measures of performance prepared in accordance with generally accepted accounting principles, and is not necessarily indicative of operating expenses as determined under generally accepted accounting principles. This measure is intended to provide investors with information about the cash generating capabilities of the Company's operations. The Company uses this information for the same purpose. This analysis excludes capital expenditures and income taxes.
3 months ended
3 months ended
9 months ended
9 months ended
September 30, 2011
September 30, 2010
September 30, 2011
September 30, 2010
$ $ $ $ Cost of sales 4,392,935 5,645,287 13,329,267 15,480,862 Adjustments - increase/(decrease): Depletion, depreciation and amortization (600,379) (557,000) (1,927,291) (1,841,000) Inventory changes 240,330 (514,669) (36,000) (148,198) Third party smelting and refining charges 1,679,008 982,451 4,222,915 3,883,344 Royalties (131,465) (81,993) (405,077) (306,392) By-product credits (1) (3,607,994) (2,201,419) (9,461,187) (9,825,477) Cash operating cost 1,972,435 3,272,657 5,722,627 7,243,139 Ounces of silver produced 283,839 221,879 861,060 1,096,016 Cash operating cost per ounce of silver produced in US $/oz
6.95
14.75
6.65
6.61

Management’s Discussion & Analysis of Financial Results For the three and nine month periods ended September 30, 2011
Nov 9, 2011
7
Exploration MEXICO Platosa Property The Platosa mine exploits a series of typical, although very high‐grade, distal CRD silver, lead, zinc manto deposits located strategically within the prolific Mexican CRD Belt. It is the Company’s belief and diamond drilling results to early November 2011 continue to confirm, that the Platosa Property holds considerable potential for the discovery of additional high‐grade manto mineralization and for the discovery of large‐tonnage, though lower grade, proximal CRD mineralization. CRDs are epigenetic, intrusion‐related, high‐temperature sulphide‐dominant, lead‐zinc‐silver‐(copper‐gold)‐rich deposits that commonly occur in clusters associated with major regional geologic features. The Mexican CRD Belt is perhaps the world's best developed CRD cluster and Platosa lies in the centre of the northwest‐southeast trending axis of the largest deposits of the belt. Several features make CRDs highly desirable mining targets. These include:
• Size – Proximal CRDs average 10 to 15 million tonnes of ore and the largest range up to 50 million tonnes;
• Grade – Ores are typically polymetallic with metal contents ranging from 2‐12% lead; 2‐18% zinc, 60‐600 g/t silver, up to 2% copper and 6 g/t gold; and
• Deposit morphology – Individual CRD orebodies within the overall deposit are continuous and average 0.5 to 2 million tonnes in size, with some up to 20 million tonnes. They are typically metallurgically straight‐forward and given that they are limestone‐hosted, the environmental impact of tailings disposal is generally minimal.
CRD orebodies take the form of lenses or elongate to elongated‐tabular bodies referred to as mantos or chimneys depending on whether they are horizontal or steeply inclined. A spectrum of CRD orebodies exists, ranging from distal manto and medial chimney massive sulphide bodies to proximal sulphide‐rich skarns associated with unmineralized or porphyry‐type intrusive bodies. Transitions of orebody morphology and mineralogy, and alteration zoning can be used in exploration to trace mantos into chimneys, sulphides into skarn, or skarn into stock contact deposits. During the third quarter, the first nine months of 2011 and up to the time of the present report, exploration efforts have focussed on two target types in two general areas. Towards the end of the third quarter a third target type, Rare Earth Elements, was added to the exploration program and plans made to expand the exploration program to encompass this target in the coming months. The first target is located in an irregularly‐shaped area extending roughly 1.5 kilometres (“km”) from the Platosa Mine. In this area the primary objective is as follows: • To further add to the known distal‐style, high‐grade CRD Mineral Resources and to discover new
mantos by drilling the geological, structural and geophysical targets developed by 2010 and previous drilling and geotechnical surveys. This follows on the success in adding mineralization to the 6A/6B Manto and the discovery of the Pierna Manto, both during 2010;

Management’s Discussion & Analysis of Financial Results For the three and nine month periods ended September 30, 2011
Nov 9, 2011
8
The second area encompasses the vast majority of the remainder of the property, including a portion of the first area. Within this area the objectives are as follows: • To pursue the potential for discovery of larger‐volume medial and proximal CRD mineralization.
Geological evidence of this potential has been found in several drill holes completed since 2008 including hole EX10‐LP763 drilled in 2010 in the Rincon del Caido area approximately 1.5 km NNW of the Guadalupe Manto. A portion of the early 2011 exploration program focussed on the Rincon del Caido – 6A/6B Corridor after‐which efforts focussed elsewhere as Company geologists received the interpreted results of the 2010 ZTEM survey. In October drilling began again on stratigraphic targets in the Rincon del Caido area; and
• Continue to pursue the development of additional targeting tools. From mid 2010 until the end of July 2011 this work focussed on preparing for and then following up the results of the ZTEM airborne geophysical survey flown in the fall of 2010 and the three‐dimensional Induced Polarization (3D IP) survey carried out earlier in 2010. Several 3D IP targets were drilled between late 2010 and early 2011 but no significant sulphides were intersected. Company geologists intend to revisit the survey results as time permits. The interpreted ZTEM results became available near the end of February 2011 and between March and late July six ZTEM targets were drilled. No significant results were obtained. The Company and its geophysical consultant continue to study new interpretation options for the survey data and remain confident that additional proximal targets will be defined from these data.
The third target is Rare Earth Elements (“REE”) found in the Cañón Colorado area approximately 6 km northwest of the Platosa Mine: • In a press release dated September 27, 2011 the Company announced the discovery of anomalous
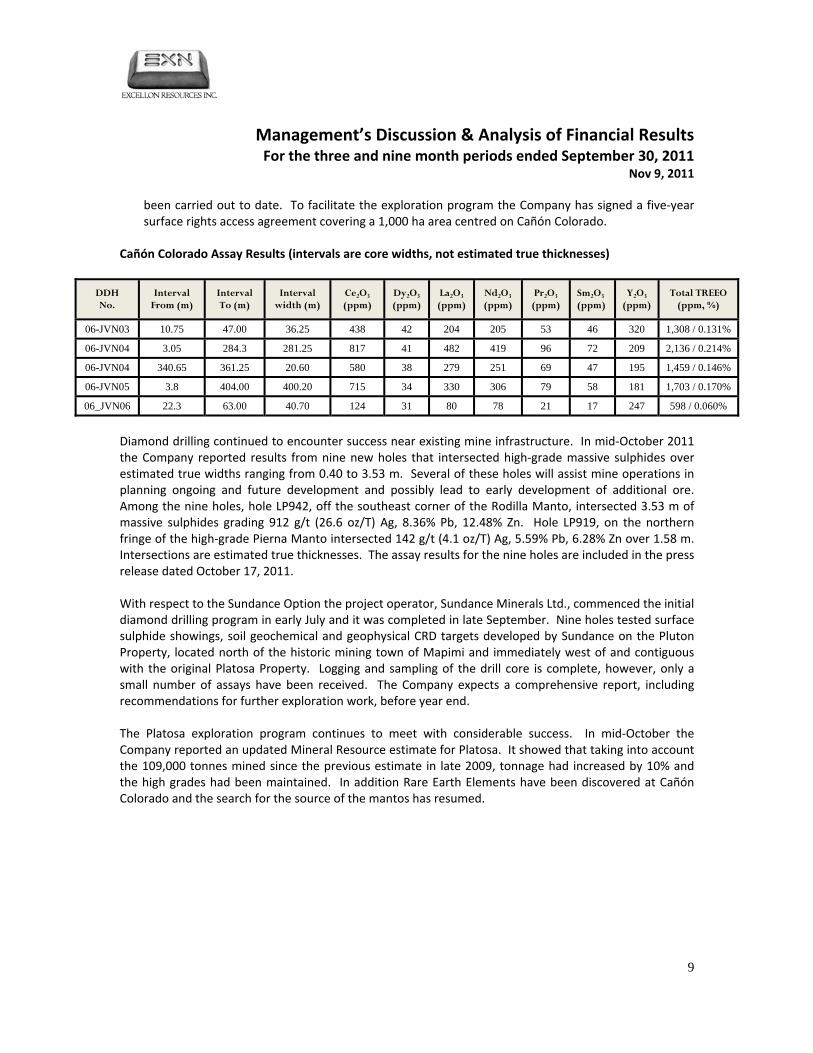
REE values in four drill holes located northwest of the Platosa Mine at Cañón Colorado. Values of Total Rare Earth Element Oxides (TREEO), the manner in which REE content is normally reported, range from 1,308 ppm (0.131%) TREEO over a 36.25 metre (“m”) core width in hole EX06‐JVN03 to 2,136 ppm (0.214%) TREEO over a 281.25 m core width in hole EX06‐JVN04. The TREEO amounts are comprised of Cerium, Dysprosium, Lanthanum, Neodymium, Praseodymium, Samarium and Yttrium oxides. Scattered values of other REE oxides have been encountered but were not included in the reported results. Assays for the four holes are shown in the table below. Intersections are reported as core widths since not enough is known about the occurrence to estimate true thicknesses;
• The four holes were drilled into a lightly‐sulphidized 400 by 400 m, irregularly‐shaped and outcropping rhyolite breccia in the Cañón Colorado area during the course of one of the Company’s carbonate replacement deposit (CRD) exploration programs in 2006 and the analytical package used was understandably designed for silver, lead, zinc, and associated elements, not REE exploration, although the package did include Lanthanum (La) and Yttrium (Y). While Y is not an REE, it is commonly found with REEs and typically grouped with them for discussion purposes. During the course of reviewing historic data and field examinations of certain prospective CRD areas earlier in 2011, Company geologists encountered anomalous Y values in surface samples and this led them back to the Cañón Colorado area and to resampling the preserved drill core from the 2006 program. Previously‐sampled core was quarter split and several hundred metres of previously unsampled core were split and assayed specifically for REEs; and
• The Company has begun a mapping and prospecting program and will carry out additional diamond drilling before year end. Should drilling results continue to be promising, the Company would then be in a position to undertake more advanced work such as metallurgical studies of which none have
Management’s Discussion & Analysis of Financial Results For the three and nine month periods ended September 30, 2011
Nov 9, 2011
9
been carried out to date. To facilitate the exploration program the Company has signed a five‐year surface rights access agreement covering a 1,000 ha area centred on Cañón Colorado.
Cañón Colorado Assay Results (intervals are core widths, not estimated true thicknesses)
DDH No.
Interval From (m)
Interval To (m)
Interval width (m)
Ce2O3 (ppm)
Dy2O3 (ppm)
La2O3 (ppm)
Nd2O3 (ppm)
Pr2O3 (ppm)
Sm2O3 (ppm)
Y2O3 (ppm)
Total TREEO (ppm, %)
06-JVN03 10.75 47.00 36.25 438 42 204 205 53 46 320 1,308 / 0.131%
06-JVN04 3.05 284.3 281.25 817 41 482 419 96 72 209 2,136 / 0.214%
06-JVN04 340.65 361.25 20.60 580 38 279 251 69 47 195 1,459 / 0.146%
06-JVN05 3.8 404.00 400.20 715 34 330 306 79 58 181 1,703 / 0.170%
06_JVN06 22.3 63.00 40.70 124 31 80 78 21 17 247 598 / 0.060%
Diamond drilling continued to encounter success near existing mine infrastructure. In mid‐October 2011 the Company reported results from nine new holes that intersected high‐grade massive sulphides over estimated true widths ranging from 0.40 to 3.53 m. Several of these holes will assist mine operations in planning ongoing and future development and possibly lead to early development of additional ore. Among the nine holes, hole LP942, off the southeast corner of the Rodilla Manto, intersected 3.53 m of massive sulphides grading 912 g/t (26.6 oz/T) Ag, 8.36% Pb, 12.48% Zn. Hole LP919, on the northern fringe of the high‐grade Pierna Manto intersected 142 g/t (4.1 oz/T) Ag, 5.59% Pb, 6.28% Zn over 1.58 m. Intersections are estimated true thicknesses. The assay results for the nine holes are included in the press release dated October 17, 2011. With respect to the Sundance Option the project operator, Sundance Minerals Ltd., commenced the initial diamond drilling program in early July and it was completed in late September. Nine holes tested surface sulphide showings, soil geochemical and geophysical CRD targets developed by Sundance on the Pluton Property, located north of the historic mining town of Mapimi and immediately west of and contiguous with the original Platosa Property. Logging and sampling of the drill core is complete, however, only a small number of assays have been received. The Company expects a comprehensive report, including recommendations for further exploration work, before year end. The Platosa exploration program continues to meet with considerable success. In mid‐October the Company reported an updated Mineral Resource estimate for Platosa. It showed that taking into account the 109,000 tonnes mined since the previous estimate in late 2009, tonnage had increased by 10% and the high grades had been maintained. In addition Rare Earth Elements have been discovered at Cañón Colorado and the search for the source of the mantos has resumed.
Management’s Discussion & Analysis of Financial Results For the three and nine month periods ended September 30, 2011
Nov 9, 2011
10
Miguel Auza Property The Miguel Auza property encompasses 41,498 ha (102,540 acres) and lies on the eastern flank of the Fresnillo Mexican Silver Trend some 150‐200 km north of Fresnillo and Zacatecas City, both of which areas have and continue to be the source of a large percentage of Mexican silver, lead and zinc production. The property covers numerous high‐ and low‐sulphide epithermal veins carrying Ag, Au, Pb, and Zn. The property has been the site of a large amount of historic mining since the time of the Spaniards and as recently as 2008 when Silver Eagle Mines, through its Mexican subsidiary, carried out mining and milling on the Calvario Vein system. The Company carried out a modest exploration program at Miguel Auza between the fall of 2009 and the fall of 2010 and while certain areas were highlighted as meriting further exploration work a decision was made to concentrate exploration activities at Platosa for the foreseeable future. CANADA AND OTHER In August 2011, the Company acquired Lateegra Gold Corp. (“Lateegra”), a junior exploration company whose main assets included the DeSantis Property in northeastern Ontario and the Beschefer Property in northwestern Quebec, both important gold exploration projects. It holds several other Canadian exploration properties and the El Condor gold property in southern Ecuador. This property is located within 3 km of Kinross’s Fruta del Norte gold deposit, which is the subject of an ongoing advanced underground exploration program. Subsequent to the transaction, Lateegra became a wholly‐owned subsidiary of the Company. DeSantis Property, Northeastern Ontario Lateegra acquired its interest in the DeSantis Property from International Prospectors and Explorers Inc. (“IEP”), via an option agreement dated February 1, 2010 and in the DeSantis West Property via an option agreement dated April 13, 2010. Collectively, these are referred to as the DeSantis Property. Under the terms of the DeSantis (IEP) Property agreement Lateegra has already earned a 51% interest in the property. Lateegra may acquire the additional 49% interest in the property by making additional payments of C$375,000 and issuing a total of 2,500,000 Lateegra shares prior to April 2013. Under the DeSantis West option agreement, Lateegra may acquire a 100% interest in the property by making cash payments totaling C$50,000, of which C$15,000 has already been paid, issuing a total of 225,000 Lateegra shares, of which 75,000 have already been issued, and completing exploration expenditures of C$150,000 prior to April 2013. Subsequent to the Company’s acquisition of Lateegra, Excellon shares will be issued at the rate of 0.54 Excellon shares for every one Lateegra share. The Company’s DeSantis Project is located along the Destor‐Porcupine Tectonic Zone (“DPZ”), the main structure controlling gold deposits in the Timmins gold camp, approximately 5 km southwest of downtown Timmins, 11 km west of the Dome Mine, currently owned and operated by Goldcorp Inc. and 14 km east of Lake Shore Gold Corp.’s Timmins Mine. The DeSantis property covers approximately 5 km of strike length within highly prospective volcanic stratigraphy on the north side of the DPZ, including the past producing DeSantis Mine. Gold deposits in the Timmins gold camp occur in a variety of forms, but virtually all can be related to structural controls associated with major deformation zones, the foremost
Management’s Discussion & Analysis of Financial Results For the three and nine month periods ended September 30, 2011
Nov 9, 2011
11
being the Destor‐Porcupine Tectonic Zone, thus are mesothermal gold deposits, exhibiting the form of ‘shear‐zone hosted gold deposits.’ Such gold deposits are typified by wide alteration envelopes hosted within volcanic sequences with a locus of deformation and alteration in discrete zones which also host significant veining including quartz and accessory minerals and gold. The DeSantis Property hosts at least five known gold‐bearing zones, including the Contact Zone, Hydrothermal Zone, Albitite Zone, Arsenopyrite Zone, and East Pit area, all of which are located near the area of historic underground mining on the property. The DeSantis Mine produced 35,800 ounces of gold from 178,650 tonnes of ore which graded 6.2 g/t gold during its intermittent production history. Production was carried out from nine levels sourcing principally the Albitite and Hydrothermal Alteration Zones, accessed via the 379 m‐deep DeSantis No. 2 Shaft. A major exploration effort on the property was undertaken in the mid 1980s by a Noranda Inc. ‐ Stan West Mining Corp. joint venture. Focussed on deeper portions of the Albitite Zone, this advanced exploration program rehabilitated the DeSantis No. 2 Shaft, several of the lowest underground levels, and completed test mining and underground drilling from those levels. Resultant from that work and the work of others, a historic resource estimate for the Albitite Zone is 65,500 tonnes grading 7.85 g/t gold, while the Hydrothermal Alteration Zone was estimated to contain 117,000 tonnes grading 9.09 g/t gold. These resource estimates, while considered relevant, are historic in nature, do not have currently demonstrated economic viability and should not be relied upon.
Since acquiring an interest in the DeSantis Property Lateegra has conducted two diamond drilling campaigns, one in 2010 and another in 2011. The latter is ongoing.
The 2011 drilling program commenced in June with the objective of expanding known zones and in particular, exploring for potential extensions at depth.
In a press release dated October 18, 2011, the Company announced results from exploration drilling directed towards the Hydrothermal Zone as shown in the following table. Intersections are reported as core widths since not enough is known about the nature of the occurrence to estimate true thicknesses:

Management’s Discussion & Analysis of Financial Results For the three and nine month periods ended September 30, 2011
Nov 9, 2011
12
2011 Drill Program Results Summary to Mid‐October:
DDH No. Interval From (m)
IntervalTo (m)
IntervalWidth (m)
Au (g/t)
DS11‐001 188.00 188.92 0.92 1.81DS11‐002 168.90 169.57 0.67 4.81 366.45 368.40 1.95 4.30 370.20 370.90 0.70 1.39 374.20 375.05 0.85 1.34DS11‐003 85.50 86.40 0.90 2.05 290.89 291.23 0.34 1.34DS11‐004 289.50 290.50 1.00 1.06DS11‐005 321.84 323.00 1.16 1.56 406.60 407.55 0.95 1.10 410.30 410.75 0.45 2.46DS11‐006 NsiDS11‐007 388.00 389.50 1.50 1.09DS11‐008 154.29 154.81 0.52 5.68DS11‐009 248.00 249.45 1.45 6.02DS11‐010 Abandoned DS11‐010A 194.74 196.00 1.26 1.63 199.00 222.17 23.17 3.63Incl. 221.00 222.17 1.17 14.25 Nsi = No significant intercepts
Commencing in late October, the DeSantis drill campaign began assessing the potential for down‐dip extensions to the Albitite Zone. The Company considers that the DeSantis Property, both in the area of historic mining in the vicinity of the DeSantis No. 2 Shaft and elsewhere on the property continues to host considerable potential for additional gold mineralization.
Beschefer Property, Quebec
Lateegra acquired its interest in the Beschefer Property via an option agreement dated January 31, 2011. Under the terms of the agreement, Lateegra may earn a 100% interest in the property by making cash payments totalling C$50,000 (already made) and issuing 6,000,000 Lateegra shares, of which 4,000,000 have already been issued, prior to February 15, 2012. As per the transaction whereby Lateegra became a wholly‐owned subsidiary of Excellon, Excellon shares will be issued at a rate of 0.54 Excellon shares for each Lateegra share due under the terms of the option agreement.
The Beschefer Property is located within the Abitibi Greenstone Belt approximately 75 km west of Matagami, in northwestern Quebec, 12 km east of the past producing Selbaie Mine. The Selbaie Mine produced 57.5 million tonnes grading 0.56 g/t gold, 38 g/t silver, 0.87% copper, and 1.85% zinc over its

Management’s Discussion & Analysis of Financial Results For the three and nine month periods ended September 30, 2011
Nov 9, 2011
13
mine life. The property has little or no bedrock exposure and is muskeg covered such that drilling is restricted to the winter and freezing conditions.
The property hosts the “B‐14” Zone, a gold mineralized shear zone, hosted within a typical Archean volcanic ‘greenstone’ assemblage. As previously reported, 1,520 m of diamond drilling in five holes were completed in early 2011, primarily on the B‐14 Zone. Results include 3.80 g/t gold over 4.35 m including 13.85 g/t over 0.30 hole m in BE11‐001, and 12.4 g/t gold over 3.78 m including 63.5 g/t gold over 0.43 m in hole BE11‐003 (all reported gold grades are uncut). In addition, hole BE11‐002 intercepted 2.3% copper over 2.58 m. Intersections are reported as core widths since not enough is known about the nature of the occurrence to estimate true thicknesses The Company’s early‐2011 drilling results confirm that the B‐14 Zone has the potential to host a significant gold resource and other portions of the property should be further investigated for gold as well as base metal potential. An 8,000 metre drill campaign is planned for late 2011 and early 2012 to further assess the B‐14 Zone as well as explore other portions of the property. This campaign is expected to commence in December 2011, contingent on weather conditions allowing access. Stoughton Property, Northeastern Ontario Lateegra acquired its right to earn an interest in the Stoughton Property, located north of the DPZ near the Quebec‐Ontario border, via an option agreement dated November 11, 2010. In Q3, 2011, the Company terminated the option on the property and returned it to the vendor. Qualified Persons Mr. John Sullivan, BSc., PGeo., Excellon’s Vice President of Exploration for Mexico has acted as the Qualified Person, as defined in NI 43‐101, with respect to the disclosure of the scientific and technical information related to Mexico contained in this MD&A and has supervised the preparation of the technical information on which such disclosure is based. Mr. Sullivan is an economic geologist with over 35 years of experience in the mineral industry. Prior to joining Excellon in 2007 he was a senior geologist at a Toronto‐based international geological and mining engineering consulting firm where he evaluated properties and prepared NI 43‐101 reports on gold and base metal projects in Canada and internationally. In addition he has held senior positions with two large Canadian mining companies where he directed major exploration programs, managed field offices, and evaluated projects in Canada, Europe, Africa and Latin America. Mr. Sullivan is not independent of Excellon as he is an officer of the Company. The Company’s Canadian exploration programs are conducted under the supervision of its Vice President of Exploration for Canada Ms. Heather Miree, B.Sc., P. Geo. Ms. Miree has acted as Qualified Person, as defined by NI 43‐101, with respect to the disclosure of the scientific or technical information related to Canada contained in the MD&A and has supervised and verified those portions of the technical activities

Management’s Discussion & Analysis of Financial Results For the three and nine month periods ended September 30, 2011
Nov 9, 2011
14
completed during 2011 on which such disclosure is based and verified technical information related to 2010 exploration activities completed by the Company. Ms. Miree is an economic geologist with over 25 years of experience in the mineral industry. Ms. Miree has held senior geological and supervisory roles with several junior and mid‐sized mining companies, in the areas of exploration and operations. During such roles, Ms. Miree conducted exploration programs, completed project evaluations, managed regional exploration offices, was Chief Mine Geologist, and participated in the advancement of projects from exploration to commercial production. Ms. Miree is not independent of Excellon as she is an officer of the Company. Risk and Uncertainties The Company is exposed to many risks in conducting its business, including but not limited to: metal price risk since the Company derives its revenues from the sale of silver, lead and zinc; foreign exchange risk since the Company reports in United States dollars but operates in jurisdictions that use other currencies; the inherent risk of uncertainties in estimating Mineral Resources; political risk associated with operating in foreign jurisdictions, environmental risks and risks associated with labour relations issues. Risk factors affecting the Company are described in the Annual Information Form on Sedar (www.sedar.com). In addition, there is no assurance that the Company will have sufficient cash resources to meet its objectives since this is dependent on being able to maintain adequate production levels and to realize adequate revenues based on metal prices as well as being able to raise capital as required. Overall Performance The Company derives over 84% of its revenue from the sale of silver. The Company’s realized price from silver sales during the three month period ended September 30, 2011 was US$37.18 as compared to US$18.84 for the same period in 2010. On a year to date basis, the realized price from silver sales was US$37.14 in 2011 compared to US$18.15 in 2010. Average market silver prices for the three month period ended September 30, 2011 was US$38.79 (September 30, 2010 ‐ US$18.96) and US$36.21 for 2011 year to date (September 30, 2010 year to date ‐ $US18.07). Sales of silver during the third quarter of 2011 was 283,839 ounces which was 61,960 higher than the same period of 2010 but on a year to date basis at 861,060 is lower than the same period in 2010 by 234,956 ounces. However sales revenues for the third quarter and on a year to date basis exceeded the prior year comparative periods by $5.1 million and $10.1 million. The improved sales revenue in Q3 ‐ 2011 and year‐to‐date when compared 2010 was mainly due to improvements in the price of silver.

Management’s Discussion & Analysis of Financial Results For the three and nine month periods ended September 30, 2011
Nov 9, 2011
15
Results of Operations Financial statement highlights for the three and nine month periods ended September 30, 2011 and 2010 are as follows:
3 months ended 3 months ended 9 months ended 9 months ended Sept 30,
2011 Sept 30,
2010 Sept 30,
2011 Sept 30,
2010 $000’s $000’s $000’s $000’s Revenue 11,174 6,057 34,001 23,878 Cost of sales 4,394 5,645 13,330 15,481 Gross profit 6,780 412 20,671 8,397 Expenses: Exploration expenditures 1,576 1,983 3,880 7,368 General and administration 1,566 1,051 3,893 3,085 Other 4,088 (591) 3,052 (293) Income tax 526 (19) 2,312 (613) Net income for the period (976) (2,012) 7,534 (1,150)
During the quarter ended September 30, 2011 the Company recorded a net loss of $1.0 million which is significantly lower than the same period last year. The improved net income for the quarter primarily reflects the impact of a realized silver price which has increased from US$18.84 per ounce in 2010 to US$37.18 in 2011. Gross profit, or income from mine operations, for Q3 – 2011 was $6.8 million compared to $0.4 million for the Q3 – 2010. The improvement in gross profit reflects the significant impact of improved commodity prices along with lower costs of sales. The improved cost of sales is due to the mine not incurring any significant water problems as it did in Q3 – 2010. Exploration expenditures during Q3 – 2011 are approximately 20% lower than the comparable period of 2010. General and administrative costs represent administrative costs incurred in Canada. Management compensation is the largest component and is comparable to the previous periods presented above. Other costs represent unrealized foreign exchange gains and losses of the Company.
Management’s Discussion & Analysis of Financial Results For the three and nine month periods ended September 30, 2011
Nov 9, 2011
16
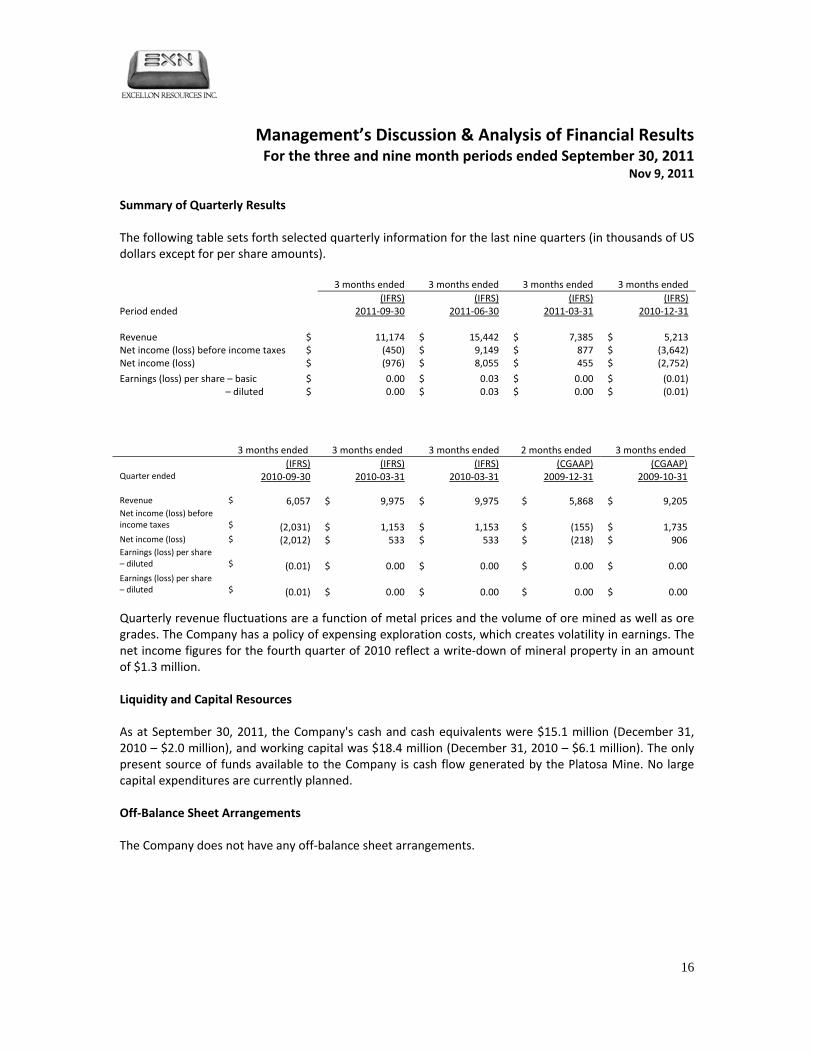
Summary of Quarterly Results The following table sets forth selected quarterly information for the last nine quarters (in thousands of US dollars except for per share amounts). 3 months ended 3 months ended 3 months ended 3 months ended (IFRS) (IFRS) (IFRS) (IFRS)Period ended 2011‐09‐30 2011‐06‐30 2011‐03‐31 2010‐12‐31 Revenue $ 11,174 $ 15,442 $ 7,385 $ 5,213Net income (loss) before income taxes $ (450) $ 9,149 $ 877 $ (3,642)Net income (loss) $ (976) $ 8,055 $ 455 $ (2,752)
Earnings (loss) per share – basic $ 0.00 $ 0.03 $ 0.00 $ (0.01) – diluted $ 0.00 $ 0.03 $ 0.00 $ (0.01)
3 months ended 3 months ended 3 months ended 2 months ended 3 months ended (IFRS) (IFRS) (IFRS) (CGAAP) (CGAAP)Quarter ended 2010‐09‐30 2010‐03‐31 2010‐03‐31 2009‐12‐31 2009‐10‐31 Revenue $ 6,057 $ 9,975 $ 9,975 $ 5,868 $ 9,205Net income (loss) before income taxes
$
(2,031) $ 1,153 $ 1,153 $
(155)
$ 1,735
Net income (loss) $ (2,012) $ 533 $ 533 $ (218) $ 906Earnings (loss) per share – diluted
$
(0.01) $ 0.00 $ 0.00 $
0.00
$ 0.00
Earnings (loss) per share – diluted
$
(0.01) $ 0.00 $ 0.00 $
0.00
$ 0.00
Quarterly revenue fluctuations are a function of metal prices and the volume of ore mined as well as ore grades. The Company has a policy of expensing exploration costs, which creates volatility in earnings. The net income figures for the fourth quarter of 2010 reflect a write‐down of mineral property in an amount of $1.3 million. Liquidity and Capital Resources As at September 30, 2011, the Company's cash and cash equivalents were $15.1 million (December 31, 2010 – $2.0 million), and working capital was $18.4 million (December 31, 2010 – $6.1 million). The only present source of funds available to the Company is cash flow generated by the Platosa Mine. No large capital expenditures are currently planned. Off‐Balance Sheet Arrangements The Company does not have any off‐balance sheet arrangements.

Management’s Discussion & Analysis of Financial Results For the three and nine month periods ended September 30, 2011
Nov 9, 2011
17
Related Party Transactions The Corporate Secretary of the Company is a partner in a firm that provides legal services to the Company. During the nine month period ended September 30, 2011, the Company paid an aggregate of $305,000 (nine months period ended September 30, 2010 ‐ $232,000) for legal services from the firm that include the Lateegra acquisition. These services were provided in the normal course of operations and are measured at the exchange amount which is the amount established and agreed to by the related parties. Common share data (as at November 9, 2011) Common shares outstanding (1) 278,069,233Stock options and warrants granted (1) 17,913,487Total 295,982,720
(1) Includes 27,030,787 shares issued in the Lateegra acquisition (refer to note 8 of the Q3‐2011 interim financial statements) and 7,438,045 shares for the Lateegra stock options and warrants exercisable for Excellon shares.
Critical Accounting Estimates The Company's significant accounting policies are described in Note 4 to the interim consolidated financial statements for the period ended September 30, 2011. The preparation of the Company's consolidated financial statements, in conformity with GAAP, requires management to make estimates and assumptions that affect amounts reported in the consolidated financial statements and accompanying notes. The following is a list of the accounting policies that the Company believes are critical, due to the degree of uncertainty regarding the estimates or assumptions involved and the magnitude of the asset, liability, revenue or expense being reported:
• Valuation of mineral properties and other long‐lived assets; • Decommissioning and site rehabilitation provision; • Income taxes; and • Share‐based compensation
Valuation of mineral properties and other long lived assets The Company reviews and evaluates the carrying value of its mineral properties for impairment whenever events or circumstances indicate that the carrying amounts of these assets may not be recoverable. When the carrying amount exceeds the discounted cash flow, an impairment loss is recorded. Discounted cash flows are based on estimated production from the Company's Measured, Indicated and Inferred Mineral Resources. Assumptions underlying the cash flow estimate include, but are not limited to, discount rates, forecasted prices for silver, lead and zinc, production levels, and operating, capital, exploration and reclamation costs. Assumptions underlying future cash flow estimates are subject to risks and uncertainties. Therefore, it is possible that changes in estimates with respect to the Company's mine plans could occur which may affect the expected recoverability.

Management’s Discussion & Analysis of Financial Results For the three and nine month periods ended September 30, 2011
Nov 9, 2011
18
The accumulated costs of mineral properties are amortized using the units of production basis using Measured, Indicated and Inferred Mineral Resources (as defined by National Instrument 43‐101). Property, plant and equipment are recorded at cost and are amortized using the straight‐line method. Decommissioning and site rehabilitation provision Due to uncertainties relating to environmental remediation, the cost of future site restoration could differ from the amount recorded in the consolidated financial statements. The estimate of the liability associated with site rehabilitation costs is subject to change based on expected inflation, changes to laws and regulations, changes in technology and other factors. Income taxes The Company follows the liability method of accounting for deferred income taxes. Under this method, deferred tax assets and liabilities are determined based on the differences between the financial reporting and tax bases of assets and liabilities and are measured using the substantively enacted tax rates and laws that will be in effect when the differences are expected to reverse. A valuation allowance is provided to the extent that it is probable that deferred income tax assets will not be utilized against future taxable profit. Share‐based compensation The Company has a stock‐based compensation plan that is described in note 10 to the Company's September 30, 2011 interim consolidated financial statements. The Company records all stock‐based compensation for stock options using the fair value method. The fair value of each stock option issued is estimated on the date of grant using the Black‐Scholes option pricing model, with expected volatility based on historical volatility of the Company's share price. Historical data is used to estimate the term of the stock option and forfeiture rate. The risk free rate for expected term of the stock option is based on the Government of Canada yield curve in effect at the time of the grant. Financial Instruments The Company's financial instruments as at September 30, 2011 consist of cash and cash equivalents, short‐term investments, accounts receivable, income taxes receivable and accounts payable and accrued liabilities. The fair value of these instruments approximates their carrying value. There were no off‐balance sheet financial instruments. Cash and cash equivalents consist solely of cash deposits with major Canadian and Mexican banks. The Company does not use derivative or hedging instruments to reduce its exposure to fluctuations in foreign currency exchange rates.

Management’s Discussion & Analysis of Financial Results For the three and nine month periods ended September 30, 2011
Nov 9, 2011
19
Internal Control over Financial Reporting and Disclosure Controls and Procedures Management has designed internal control over financial reporting (“ICFR”) to provide reasonable assurance regarding the reliability of financial reporting and the preparation of financial statements for external purposes in accordance with IFRS. Management has designed disclosure controls and procedures (“DC&P”) to provide a reasonable assurance that (i) material information relating to the Company is made known to them by others, particularly during the period in which the annual filings are being prepared and (ii) information required to be disclosed by the Company in its annual filings, interim filings or other reports filed or submitted by it under securities legislation is recorded, processed, summarized and reported within the time periods specified in securities legislation. The Company’s conversion to IFRS is not expected to impact the effectiveness of ICFR, however, management will continue to monitor the effectiveness of ICFR. TRANSITION TO IFRS The adoption of IFRS has not had a material impact on the Company’s financial position, operations or business decisions. The effect of the company’s transition to IFRS is summarized as follows: a. Transition elections b. Reconciliation of equity and comprehensive income as previously reported under Canadian GAAP to
IFRS c. Adjustments to the statement of cash flows a. Transition elections The company has applied the following transition exceptions and exemptions to full retrospective application of IFRS:
As described in note b.
Cumulative translation adjustment i.Rehabilitation provision ii.Business combinations iii.Share based payments iv.

Management’s Discussion & Analysis of Financial Results For the three and nine month periods ended September 30, 2011
Nov 9, 2011
20
b. Reconciliation of equity and comprehensive income as previously reported under Canadian GAAP to IFRS (figures in thousands of US Dollars)
Note Dec 31, 2010 Sept 30, 2010 Jan 1, 2010Equity b $ $ $
Equity as reported under Canadian GAAP 30,766 30,574 30,200
Contributed surplusShare based payment amortization iv. 104 103 -
104 103 - Accumulated other comprehensive loss
Cumulative translation adjustment i. 2,534 2,534 2,534 2,534 2,534 2,534
DeficitCumulative translation adjustment i. (2,534) (2,534) (2,534) Rehabilitation provision ii 101 109 65 Rehabilitation cost ii (108) (30) (63) Share based payment amortization iv. (104) (103) -
(2,645) (2,558) (2,532)
Equity as reported under IFRS 30,759 30,653 30,202
Three months Nine monthsended Sept 30, ended Sept 30,
Note 2010 2010Comprehensive income (loss) b $ $
As reported under Canadian GAAP (108) (565)
Increase (decrease) in net income for:Decommissioning and site rehabilitation impact ii. 79 78 Share based payment amortization iv. (31) (103)
48 (25)
Increase (decrease) in other comprehensive income - - As reported under IFRS (60) (590)
Explanatory notes
i. In accordance with IFRS transitional provisions, the company has elected to reset the cumulative translation account, which includes gains and losses arising from the translation of foreign operations, to zero at the date of transition to IFRS. The cumulative translation account has decreased and the deficit has been increased by $2,534,000.
ii. Similar to Canadian GAAP, when a rehabilitation provision (asset retirement obligation) is established, the company is required to set up a corresponding asset and depreciate it over the remaining useful life of the asset. Any changes in the rehabilitation provision are added
Management’s Discussion & Analysis of Financial Results For the three and nine month periods ended September 30, 2011
Nov 9, 2011
21
to or subtracted from the cost of the asset to which the obligation relates. In accordance with IFRS transitional provisions, the company elected to take a simplified approach to calculate and record the asset related to the rehabilitation provision in the opening IFRS consolidated balance sheets. The rehabilitation provision on the transition date calculated in accordance with IFRS is discounted back to the date when the provision first arose, at which date the corresponding asset is set up. This asset is then depreciated to its carrying amount at the transition date.
The rehabilitation provision calculated at the transition date has decreased the carrying amount of the previous asset retirement obligation recognized under Canadian GAAP by $65,000 and the deficit has been reduced. The corresponding asset has also decreased but by $63,000 net of depreciation and the deficit has been charged. Over time the provision is impacted by the unwinding of the discount rate used to determine its carrying value. This unwinding amount is referred to as accretion and is recognized in the statement of income as a finance cost. Likewise the rehabilitation cost is amortized. Foreign exchange gains and losses resulting from the translation of these items are recognized in the statement of income. The rehabilitation provision calculated at September 30, 2010 has decreased the carrying amount of the previous asset retirement obligation recognized under Canadian GAAP by $119,000 and the deficit has been reduced (December 31, 2010 ‐ $101,000). The corresponding asset has also decreased by $40,000 net of depreciation and the deficit has been charged (December 31, 2010 ‐ $108,000). The total impact on comprehensive income net of the foreign exchange difference between January 1, 2010 and September 30, 2010 was income of $78,000 (December 31, 2010 – expense of $7,000).
iii. In accordance with IFRS 1 transitional provisions, the company elected to apply IFRS relating to business combinations prospectively from January 1, 2010. There were no adjustments arising from this election as all acquired assets and liabilities conformed to IFRS.
iv. In accordance with IFRS 1 transitional provisions, the company elected to apply IFRS relating to share‐based payments retrospectively to outstanding stock options that had not vested prior to January 1, 2010. There were no adjustments arising from this election as all outstanding stock options had vested by January 1, 2010.
Subsequent to the transition date, increases in the amortization of the fair value of vested stock options were required under IFRS in the amount of $103,000 at September 30, 2010 and $104,000 at December 31, 2010.
c. Adjustments to the statement of cash flows The transition from Canadian GAAP to IFRS had no significant impact on cash flows generated by the company except that, under IFRS, cash flows relating to interest are classified in a consistent manner as operating, investing or financing each period. Under Canadian GAAP, cash flows relating to interest payments were classified as operating.

Management’s Discussion & Analysis of Financial Results For the three and nine month periods ended September 30, 2011
Nov 9, 2011
22
Additional Sources of Information Additional disclosures pertaining to the Company, including its most recent audited and unaudited interim financial statements, management information circular, material change reports, press releases and other information, are available on the SEDAR website at www.sedar.com or on the Company's website at www.excellonresources.com. This MD&A may contain "forward‐looking statements" that reflect the Company's current expectations regarding the future results of operations, performance and achievements of the Company, including potential property acquisitions, the timing, content, cost and results of work programs, geological interpretations, potential mineral recovery processes and rates, proposed production rates, the construction of a mill, the acquisition of surface rights and negotiation and closing of future financings. The Company has tried, wherever possible, to identify these forward‐looking statements by, among other things, using words such as "anticipate," "believe," "estimate," "expect" and similar expressions. The statements reflect the current beliefs of the management of the Company, and are based on currently available information. Accordingly, these statements are not guarantees of future performance and are subject to known and unknown risks, uncertainties and other factors, which could cause the actual results, performance, or achievements of the Company to differ materially from those expressed in, or implied by these statements. See “Risk Factors”.
Related Documents