Management Consultants www.prtm.com Leading thinking for lasting results Aerospace and Defense Industry Benchmarking Survey Results 2005 AIA Product Support Conference November 9 th , 2005 For further information, contact: Mike Finley, Director Ned Glattly, Principal Tony Gonçalves, Manager PRTM 1000 Thomas Jefferson St., NW Suite 600 Washington, DC 20002 Tel: (202) 625-7200 Fax: (202) 625-7256 [email protected] [email protected] [email protected]

Welcome message from author
This document is posted to help you gain knowledge. Please leave a comment to let me know what you think about it! Share it to your friends and learn new things together.
Transcript

ManagementConsultants
www.prtm.com
Leading thinking for lasting results
Aerospace and Defense Industry Benchmarking Survey Results
2005 AIA Product Support Conference
November 9th, 2005
For further information, contact: Mike Finley, DirectorNed Glattly, PrincipalTony Gonçalves, Manager
PRTM1000 Thomas Jefferson St., NWSuite 600Washington, DC 20002
Tel: (202) 625-7200Fax: (202) 625-7256
[email protected] [email protected]@prtm.com
2 ManagementConsultants
© Copyright 2005 PRTM
Findings and insights on performance-based logistics in the A&D industry
Why benchmark
How A&D industry supply chains are performing
Findings on the state of PBLs
What it means to be ‘Performance-Based’
3 ManagementConsultants
© Copyright 2005 PRTM
Seminal study of A&D industry PBLs and their associated supply chains
OSD and AIA sponsored
Goals of the study Develop a measure of PBL progress thus far
Understand which PBL practices lead to superior supply chain performance and which do not
Develop recommendations and a path forward to improve future PBLs
Provide readouts to participants with their individual results
Over-arching GoalValidate case for moving overall industrial base up the PBL maturity scale
Government win: better weapons system performance
Industry win: shareholder value

4 ManagementConsultants
© Copyright 2005 PRTM
A&D PBL supply chain benchmarking provides insight into PBL value
PBLs align the supply chain building blocks… Organizations
Practices
Information
Alignment and process maturity lead to logistics performance
Maturity and performance leads to uplift Greater profits for industry and revenue from expanded service offerings
Better performance and lower costs for government
5 ManagementConsultants
© Copyright 2005 PRTM
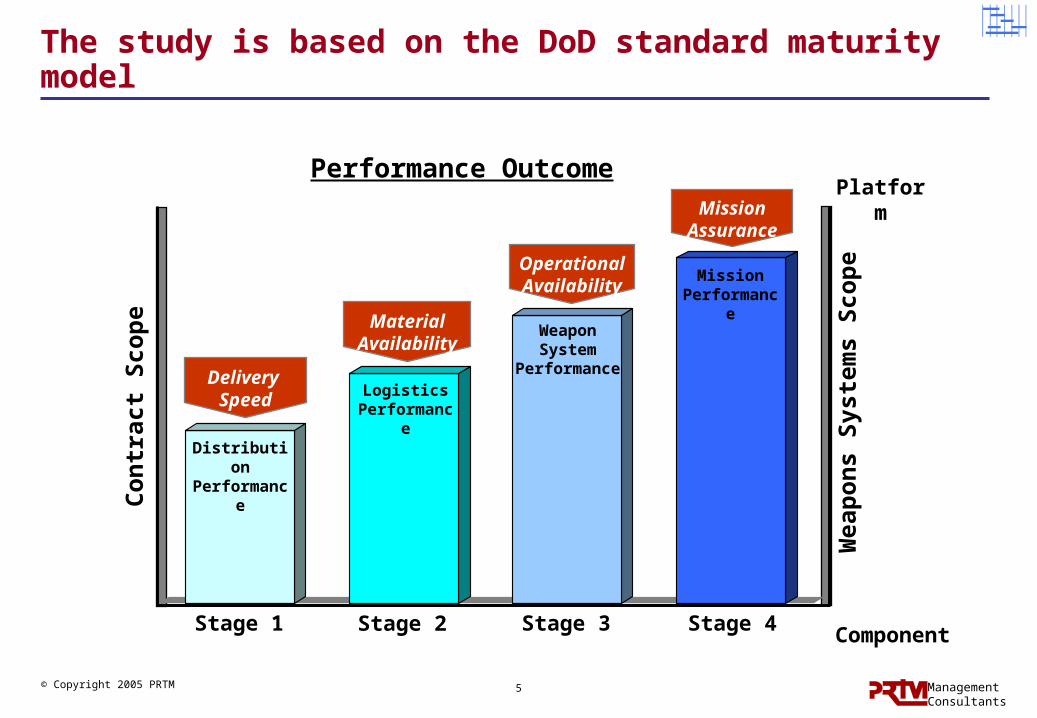
The study is based on the DoD standard maturity model
Co
ntr
act
Sco
pe
Wea
po
ns
Sys
tem
s S
cop
e
Component
PlatformPerformance Outcome
Stage 1 Stage 2 Stage 3 Stage 4
Delivery Speed
OperationalAvailability
MaterialAvailability
MissionAssurance
MissionPerformance
Weapon System
PerformanceLogistics
Performance
DistributionPerformance
6 ManagementConsultants
© Copyright 2005 PRTM
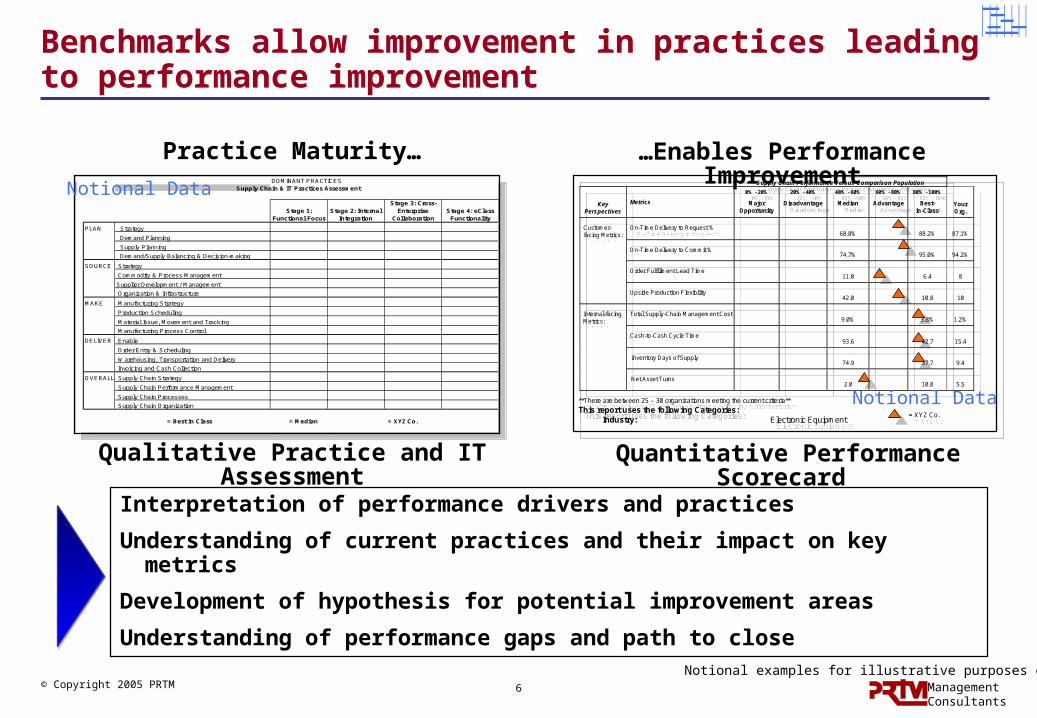
Benchmarks allow improvement in practices leading to performance improvement
Interpretation of performance drivers and practices
Understanding of current practices and their impact on key metrics
Development of hypothesis for potential improvement areas
Understanding of performance gaps and path to close
Supply Chain Performance Versus Comparison Population
KeyPerspectives
Metrics
0% - 20%
MajorOpportunity
20% - 40%
Disadvantage
40% - 60%
Median
60% - 80%
Advantage
80% - 100%
Best-in-Class
YourOrg.
On-Time Delivery to Request %68.8% 88.2% 87.1%
On-Time Delivery to Commit %74.7% 95.0% 94.2%
Order Fulfillment Lead Time11.0 6.4 8
Customer-facing Metrics:
Upside Production Flexibility42.0 10.8 10
Total Supply-Chain Management Cost9.0% 3.8% 1.2%
Cash-to-Cash Cycle Time93.6 42.7 15.4
Internal-facingMetrics:
Inventory Days of Supply74.9 37.7 9.4
Net Asset Turns2.0 10.8 5.5
**There are between 25 – 30 organizations meeting the current criteria**
This report uses the following Categories:Industry: Electronic Equipment = XYZ Co.
Quantitative Performance Scorecard
DOMINANT PRACTICESSupply Chain & IT Practices Assessment
Stage 1: Functional Focus
Stage 2: Internal Integration
Stage 3: Cross-Enterprise
CollaborationStage 4: eClass
Functionality
PLAN Strategy
Demand Planning
Supply Planning
Demand/Supply Balancing & Decision-making
SOURCE Strategy
Commodity & Process Management
Supplier Development / Management
Organization & Infrastructure
MAKE Manufacturing Strategy
Production Scheduling
Material Issue, Movement and Tracking
Manufacturing Process Control
DELIVER Enable
Order Entry & Scheduling
Warehousing, Transportation and Delivery
Invoicing and Cash Collection
OVERALL Supply Chain Strategy
Supply Chain Performance Management
Supply Chain Processes
Supply Chain Organization
= Best in Class = Median = XYZ Co.
Qualitative Practice and IT Assessment
Notional examples for illustrative purposes only
Practice Maturity… …Enables Performance Improvement
Notional Data
Notional Data

7 ManagementConsultants
© Copyright 2005 PRTM
Practice Maturity
Discrete supply chain processes and data flows well documented and understood
Resources managed at department level and performance measured at functional level
Stage 2:Internal
IntegrationStage 1:Functional
FocusCompany-wide process and data model continuously measured at the company, process, and diagnostic levels
Resources managed at both functional and cross-functional levels
Strategic partners throughout the global supply chain collaborate to:
• Identify joint business objectives and action plans
• Enforce common processes and data sharing
• Define, monitor,and react to performance metrics
IT and eBusiness solutions enable a collaborative supply chain strategy that:
• Aligns participating companies’ business objectives and associated processes
• Results in real-time planning, decision- making, and execution of supply chain responses to customer requirements
Stage 3:External
Integration
Stage 4:Cross-Enterprise
Collaboration
Understanding stage of maturity helps move toward world-class performance levels
Early Stage Mature

8 ManagementConsultants
© Copyright 2005 PRTM
Results in brief
PBL Supply Chains vs. traditional aerospace and industrial (A&I) supply chains Have lower costs as a percent of revenue
Exhibit more mature practices
Are challenged by customer speed requirements
Cost performance and practice maturity are highly correlated
Opportunities for improvement abound
Sharing general results
Survey sponsors receive more specific feedback
Individual participants anonymous due to non-disclosure agreements
Detailed individual feedback to participants
Survey responses indicate that A&D PBL supply chains are demonstrating superior performance in most areas

9 ManagementConsultants
© Copyright 2005 PRTM
Survey participants describe significantly more mature practices than similar A&I supply chains
1.5
2
2.5
3
3.5
4
Pra
cti
ce
Ma
turi
ty S
co
re
(1-4
)
Strate
gy
Deman
d Pla
nning
Supply
Plannin
g
Deman
d/Supp
ly B
alan
cing
Enable
Order
Entry
& S
ched
ulin
g
S.C. P
roce
sses
Whse
, Tra
ns. &
Del
iver
y
S. C. O
rg.
Current Practices and IT Assessment
Survey Participants A&I Supply Chains
PBLs have relatively more mature planning processes and Supply Chain organizations
Order management is the only area where PBLs trail the rest of industry
4 = Collaborative3 = External Integration2 = Internal Integration1 = Functional Focus

10 ManagementConsultants
© Copyright 2005 PRTM
1.5
2
2.5
3
3.5
4
Pra
cti
ce
Ma
turi
ty S
co
re
(1-4
)
Strate
gy
Deman
d Pla
nning
Supply
Plannin
g
Deman
d/Supp
ly B
alan
cing
Enable
Order
Entry
& S
ched
ulin
g
S.C. P
roce
sses
Whse
, Tra
ns. &
Del
iver
y
S. C. O
rg.
Emerging Practices and IT Assessment
Survey Participants A&I Supply Chains
Survey participants are targeting more mature practices than similar A&I supply chains
PBLs are satisfied with order and supply chain processes and do not plan to growth in these areas
PBLs want to create very mature distribution capabilities and Supply Chain organizations
4 = Collaborative3 = External Integration2 = Internal Integration1 = Functional Focus
11 ManagementConsultants
© Copyright 2005 PRTM
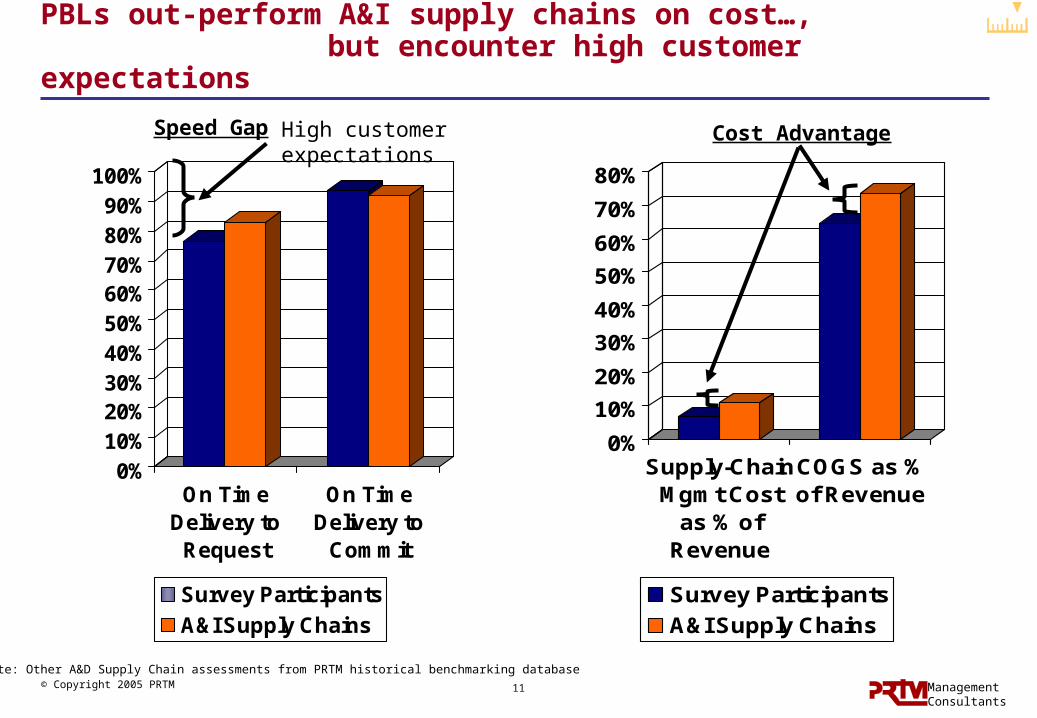
PBLs out-perform A&I supply chains on cost…,but encounter high customer expectations
0%10%20%30%40%50%60%70%80%90%
100%
On TimeDelivery to
Request
On TimeDelivery to
Commit
Survey Participants
A&I Supply Chains
0%
10%
20%
30%
40%
50%
60%
70%
80%
Supply-ChainMgmt Cost
as % ofRevenue
COGS as %of Revenue
Survey Participants
A&I Supply Chains
Note: Other A&D Supply Chain assessments from PRTM historical benchmarking database
Speed Gap Cost AdvantageHigh customer expectations

12 ManagementConsultants
© Copyright 2005 PRTM
More mature practices have 42% lower supply management costs
Supply Chain Management Cost as a % of Revenue
Top Performing Supply Chains
Most Mature Practices
Practice Maturity
Top Performers
All Others
Internal Integration
External Integration
+
86% Overla
p
13 ManagementConsultants
© Copyright 2005 PRTM
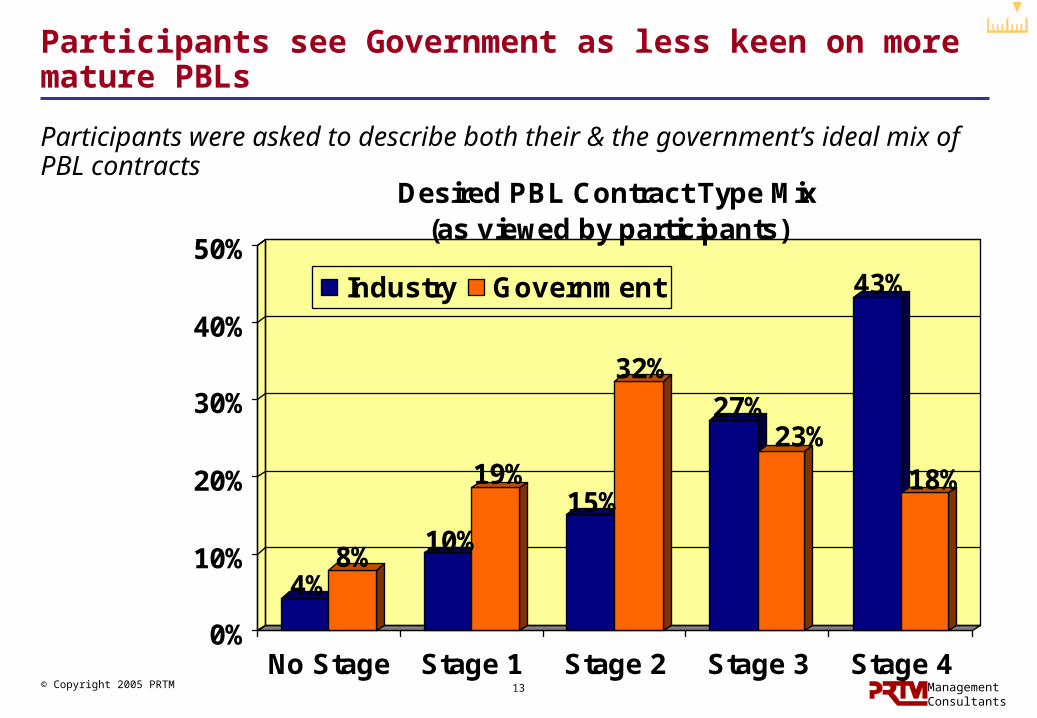
Participants see Government as less keen on more mature PBLs
4%8%
10%
19%15%
32%27%
23%
43%
18%
0%
10%
20%
30%
40%
50%
No Stage Stage 1 Stage 2 Stage 3 Stage 4
Desired PBL Contract Type Mix(as viewed by participants)
Industry Government
Participants were asked to describe both their & the government’s ideal mix of PBL contracts

14 ManagementConsultants
© Copyright 2005 PRTM
Participants view Government acceptance as the primary barrier to accelerating use and maturity of PBLs
When asked to rank the top 6 barriers to accelerating use of PBLS
(1 = most important; 6 = least important)
… 71% Ranked education of Government employees as number 1 or 2
… 57% Ranked multi-year funding as priority 1 or 2
… 0% Ranked education of industry employees as number 1 or 2
100% of participants said industry is more willing than Government to use Mission Assurance PBLs !
15 ManagementConsultants
© Copyright 2005 PRTM
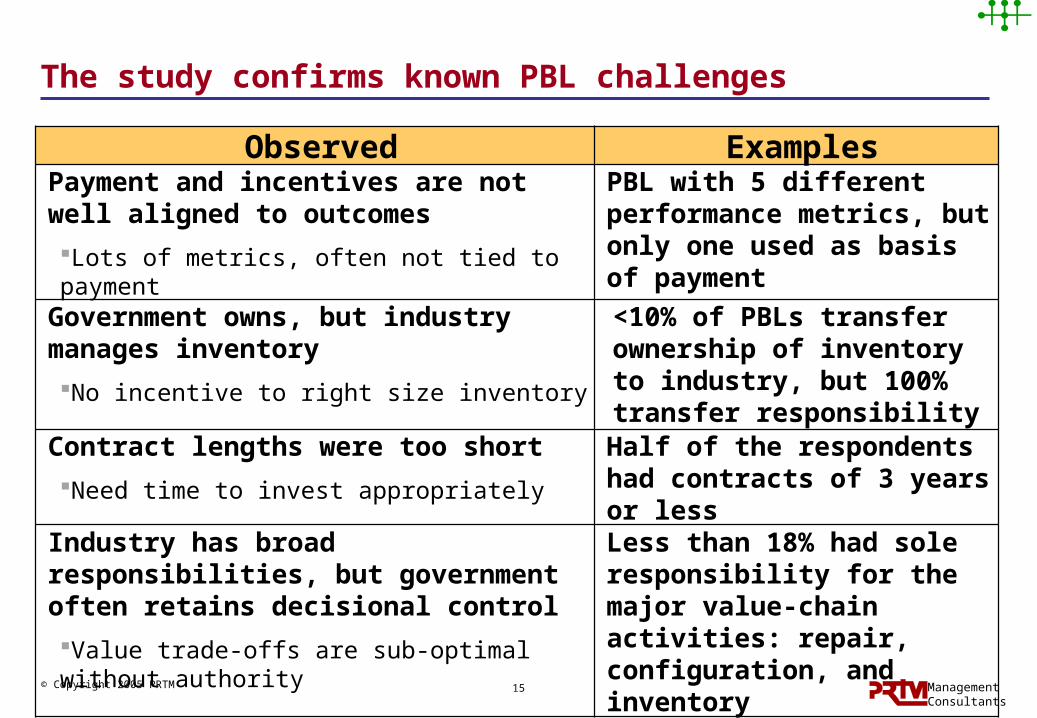
The study confirms known PBL challenges
Observed ExamplesPayment and incentives are not well aligned to outcomes
Lots of metrics, often not tied to payment
PBL with 5 different performance metrics, but only one used as basis of payment
Government owns, but industry manages inventory
No incentive to right size inventory
<10% of PBLs transfer ownership of inventory to industry, but 100% transfer responsibility
Contract lengths were too short
Need time to invest appropriately
Half of the respondents had contracts of 3 years or less
Industry has broad responsibilities, but government often retains decisional control
Value trade-offs are sub-optimal without authority
Less than 18% had sole responsibility for the major value-chain activities: repair, configuration, and inventory
16 ManagementConsultants
© Copyright 2005 PRTM
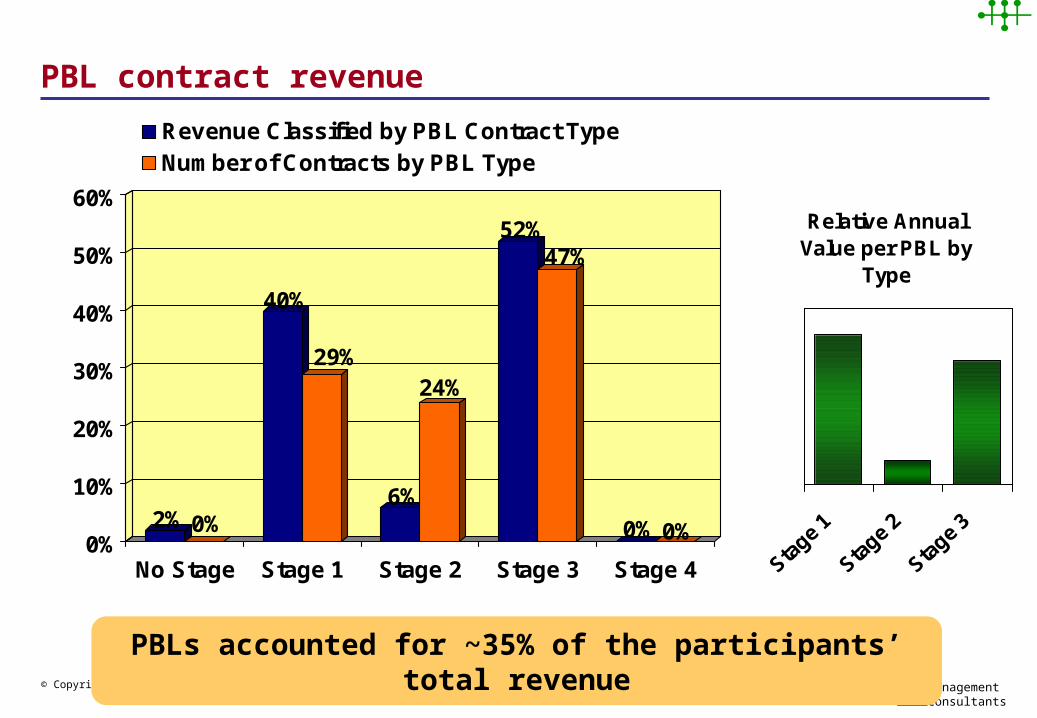
PBL contract revenue
2% 0%
40%
29%
6%
24%
52%47%
0% 0%0%
10%
20%
30%
40%
50%
60%
No Stage Stage 1 Stage 2 Stage 3 Stage 4
Revenue Classified by PBL Contract TypeNumber of Contracts by PBL Type
PBLs accounted for ~35% of the participants’ total revenue
Relative Annual Value per PBL by
Type
Stage 1
Stage 2
Stage 3
17 ManagementConsultants
© Copyright 2005 PRTM
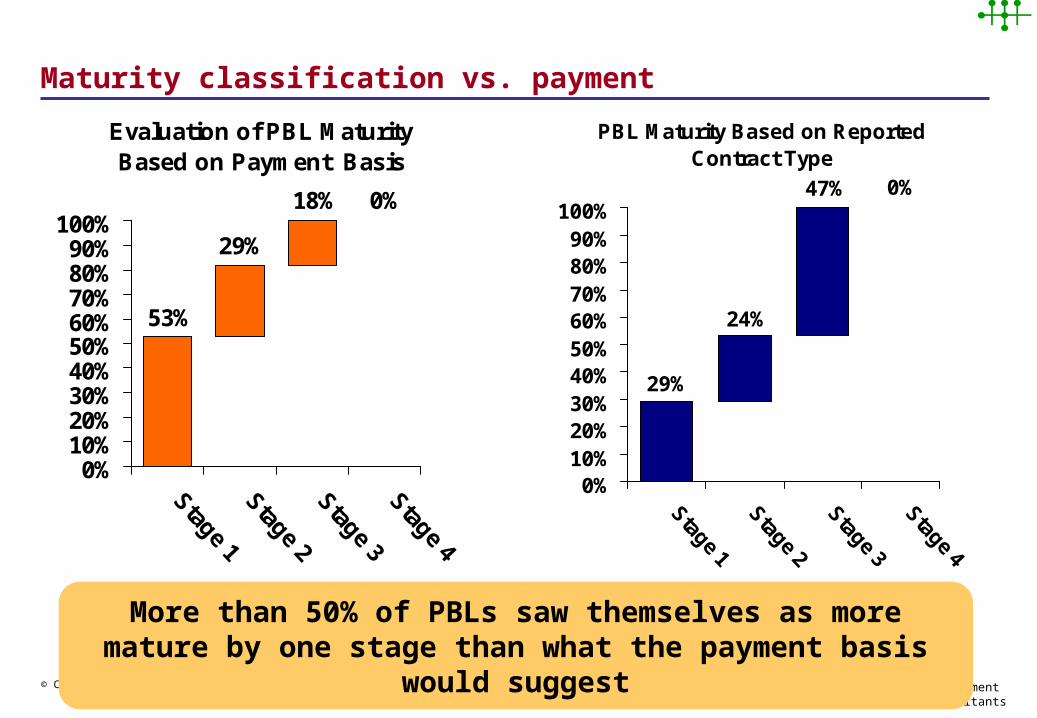
Maturity classification vs. payment
Evaluation of PBL Maturity Based on Payment Basis
0%18%
29%
53%
0%10%20%30%40%50%60%70%80%90%
100%
Stage 1Stage 2Stage 3Stage 4
PBL Maturity Based on Reported Contract Type
47%
24%
29%
0%
0%10%20%30%40%50%60%70%80%90%
100%
Stage 1
Stage 2
Stage 3
Stage 4
More than 50% of PBLs saw themselves as more mature by one stage than what the payment basis would suggest

18 ManagementConsultants
© Copyright 2005 PRTM
The case for inventory ownership
PBL Inventory Ownership
>90%<10%
Government Industry
Industry has little reason to improve reliability when they can buy it with ‘free’ inventoryThis type of arrangement may actually encourage more government-owned inventory
Weapons System Performance Levers
Supplier-Owned Gov’t-Owned
Cost to Supplier
Perf. Impact
Cost to Supplier
Perf. Impact
Increase inventory investment $ - $$ n/a
Invest in reliability improvement $$$ $$$
Decrease repair cycle time $$ $$
An AIA-Government working group on inventory ownership would facilitate innovative ways to address the inventory challenge

19 ManagementConsultants
© Copyright 2005 PRTM
Average PBL life is only five years, even with options
Survey Respondent PBL Base Contract Length
(in years)
0% 20% 40% 60%
0
1
2-3
4-5
Survey Respondent PBL Option Length
(in years)
0% 20% 40% 60%
0
1
2-3
4-5
Average Base
~3.2 years
Average Option
~1.9 years
Short option periods discourage continuous improvement

20 ManagementConsultants
© Copyright 2005 PRTM
Contract lengths are often too short to create an incentive for industry to invest to create greater value
Cos
tTraditional vs. Performance-Based Contract
Providers’ profits are higher (Area between the lines is bigger with PBL)
Total Cost for the Government is lower
Investment to improve reliability
TermTraditional Gov’t Cost PBL Gov’t Cost
PBL Industry CostTraditional Industry Cost
Industry Profit
Average PBL Base Period
Term- 3 ¼ yrs
Investment
Recovery Period
Time creates incentives to invest to reduce costs
Obsolescence may offset some cost improvements anticipated at renewal
21 ManagementConsultants
© Copyright 2005 PRTM
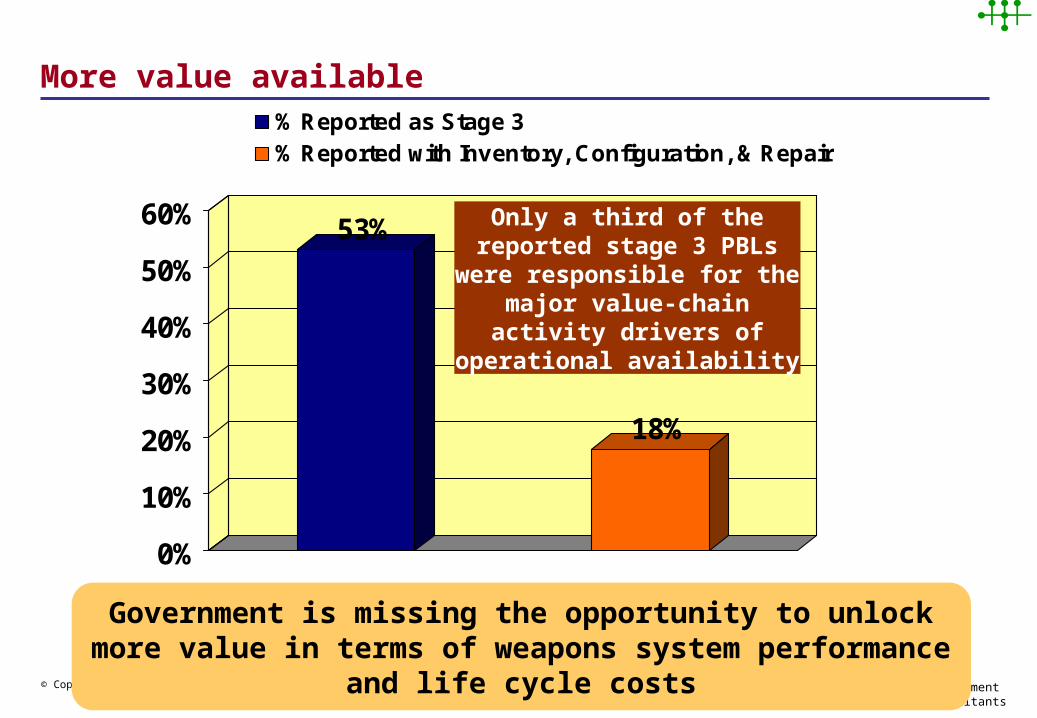
More value available
Government is missing the opportunity to unlock more value in terms of weapons system performance and life cycle costs
53%
18%
0%
10%
20%
30%
40%
50%
60%
% Reported as Stage 3% Reported with Inventory, Configuration, & Repair
Only a third of the reported stage 3 PBLs were
responsible for the major value-chain activity drivers of
operational availability

22 ManagementConsultants
© Copyright 2005 PRTM
What it means to be performance based
Warfig
hter
Warfig
hter
Valu
eV
alue
MissionAssurance
OperationalAvailability
MaterialAvailability
1. Shared Value Creation1. Shared Value Creation““Making the pie bigger…”Making the pie bigger…”
2. Performance Incentives2. Performance Incentives““Driving behavior…”Driving behavior…”
3. Performance Period3. Performance Period““Leveraging the learning curve…”Leveraging the learning curve…”
4. Payment Basis4. Payment Basis““Paying for performance…”Paying for performance…”
5. Value Chain Ownership5. Value Chain Ownership““Defining accountability…”Defining accountability…”5. Value Chain Ownership5. Value Chain Ownership
““Defining accountability…”Defining accountability…”
DeliverySpeed
Performance ObjectivesPerformance ObjectivesP
BL
Ten
ets
PB
L T
enet
s
The PBL maturity framework provides a basis to explain the gaps in performance by creating a common lexicon and reference model

23 ManagementConsultants
© Copyright 2005 PRTM
Synchronizing and aligning the tenets to the performance objective desired creates value for industry and the warfighter
The PBL Maturity Framework provides a way to break down a PBL into it’s critical parts and
A-B: Alignment value creation
A-C: Scope value creation
A-D: Scope & alignment value creation
Ali
gn
men
t
Performance Objective
Delivery Speed
Operational
AvailabilityMaterial
Availability
MissionAssurance
Stage 1 Stage 2 Stage 3 Stage 4
Shared Shared Value CreationValue Creation
SharedSharedValue CreationValue Creation
Shared Shared Value CreationValue Creation
Shared Shared Value CreationValue Creation
PerformancePerformanceIncentivesIncentives
PerformancePerformanceIncentivesIncentives
PerformancePerformanceIncentivesIncentives
PerformancePerformanceIncentivesIncentives PerformancePerformance
PeriodPeriodPerformancePerformancePeriodPeriodPerformancePerformance
PeriodPeriodPerformancePerformancePeriodPeriod
Payment BasisPayment BasisPayment BasisPayment Basis
Payment BasisPayment BasisPayment BasisPayment Basis
Value-ChainValue-ChainOwnershipOwnership
Value-ChainValue-ChainOwnershipOwnership
Value-ChainValue-ChainOwnershipOwnership
Value-ChainValue-ChainOwnershipOwnership
Value Scope
Valu
e Creatio
n
A C
D
B
Changing the objective creates more potential value, greater value is not automatic

24 ManagementConsultants
© Copyright 2005 PRTM
Both government and industry have great opportunities to improve future performance-based relationships
Gov’t Industry
Alignment
Train contracts personnel on PBL concepts and metrics All payments must be tied to desired performance metric
Leadership must continue to push for more mature PBLs – Stage 1’s should be challenged
InventoryUse working groups to create collaborative inventory models
Longer partnershipsCreate incentives for continuous performance and cost improvements in base and option periods
Price option year risk when longer periods are needed to recoup investments
Value-Chain
Transfer authority & responsibility – industry must control all the necessary levers to maximize value and performance
Related Documents