University of Oxford Department of International Development SLPTMD Working Paper Series No. 007 Management Characteristics, Managerial Ownership and Innovative Efficiency in High-technology Industry Andy Cosh, Xiaolan Fu, Alan Hughes

Welcome message from author
This document is posted to help you gain knowledge. Please leave a comment to let me know what you think about it! Share it to your friends and learn new things together.
Transcript

University of Oxford
Department of International Development
SLPTMD Working Paper Series
No. 007
Management Characteristics, Managerial Ownership and
Innovative Efficiency in High-technology Industry
Andy Cosh, Xiaolan Fu, Alan Hughes

������������������ �� ����������� ��������� �������������� ������ � ����� ��� ���������������������
����������� ��������������������
�
��������������� ������������������� ����������������� ������ ���� ���������� �����
�� �����!� "������������� ���� ������#$�������������������� ���������������%�������� �����&�������� ���� ���������� ����
Abstract
This paper explores the impact of management characteristics and managerial ownership on a firm’s innovation performance in transforming innovation resources into commercially successful outputs. These questions are investigated using a recent firm- level survey database for 440 innovative British small and medium enterprises (SMEs) over the period 1998-2001. Both Data Envelopment Analysis (DEA) and Stochastic Frontier Analysis (SFA) are employed to benchmark each firm’s innovative efficiency against best practice. Quality and the variety of innovations are taken into account by combining Principal Component Analysis (PCA) with DEA. We find evidence suggesting that the innovative efficiency of SMEs is significantly affected by their management characteristics and ownership structure. Formality in management structure, incentive design and human resource management practices all show significant effects on the innovative efficiency of firms. Managerial ownership is found to have a non-monotonous, non-linear relationship with the firms’ innovative efficiency, supporting both an alignment effect and an entrenchment effect of managerial ownership on the innovation performance of firms. Results of this study reveal a significant moderating influence of the industry’s technological environment on the relationship between management characteristics, ownership structure and innovative efficiency of firms. Evidence from this study suggests that formal management structure and training intensity play a more important role in commercialising innovation inputs in high-technology sectors; while incentive schemes and managerial ownership are more important for innovative efficiency in the traditional sectors. Keywords: Management characteristics, managerial ownership, innovative efficiency
�����������������
We are grateful to Steven Floyd for very helpful comments which have led to significant improvement of the paper. We also thank Bronwyn Hall and the reviewers and participants of the Academy of Management Annual Meeting, 9th European Workshop on Efficiency and Productivity Analysis, the Cambridge-MIT Competitiveness Forum, and the SPRU 40th Anniversary Conference for helpful comments, and the Cambridge-MIT Institute and i10 (UK) for generous funding. �

1
INTRODUCTION
The innovation performance of organisations is determined not only by its resources and
innovation inputs, but more importantly, by its productivity in innovation and the factors that
affect this productivity. Innovation is not a simple linear transformation with basic science and
other inputs at one end of a chain and commercialisation at the other (Hughes, 2003). Successful
innovation requires more than brilliant scientists. It takes leaders, entrepreneurial spirit, great
ideas, quality design, good management, and the right organisational structures (Hjelt, 2005). It
requires high-quality decision-making, long-range planning, motivation and management
techniques, coordination, and efficient R&D, openness to external sources of knowledge for
innovation, and production and marketing expertise. Therefore, the innovation performance of a
firm is determined not only by ‘hard’ internal factors such as R&D manpower and R&D
investment, but also by certain soft internal factors such as management practices and
governance structures (Aghion and Tirole, 1994; Bessant et al., 1996; Black and Lynch (2001);
Bertrand and Schoar (2003); and Cosh et al., 2004) and the firm’s openness to external sources
(Chesbrough, 2003). Top management characteristics, leadership, synergy between departments,
research partnerships, marketing efficiency and human resource management are all found to be
closely correlated with a firm’s propensity to innovate (Hoffman and Hegarty, 1993; Bughin and
Jacques, 1994; Nam and Tatum, 1997; Goes and Park, 1997; Tsai, 2001; and Laursen and Foss,
2003). The concentration of share ownership, institutional ownership, external ownership and
CEO compensation schemes are also found to be related to the R&D intensity, or innovation
propensity, of firms (Kochhar and David, 1996; Love et al., 1996; Bishop and Wiseman, 1999;
Chowdhury and Geringer, 2001; Balkin et al., 2002; Czarnitzki and Kraft, 2004; and Hosono et
al., 2004).

2
While substantial work has been done on a firm’s propensity for innovation, research on the
productivity of innovation is limited. Comparing the difference between Japan and the US in
innovation cost and time, with special emphasis on the use of internal versus external
technology, Mansfield (1988) finds the Japanese have great advantages in carrying out
innovations based on external technology, but not internal technology. Firm size and spillovers,
in particular from academic sources, are also found to be positively correlated with industrial
research productivity (Henderson and Cockburn, 1996; Adams, 2000; and Siegel et al., 2003).
Experiences and alliances are found to contribute to research productivity in the pharmaceutical
industry (Danzon et al., 2003); and public versus private ownership is argued to be a contributing
factor in the cross-sectional variance of R&D efficiencies (Zhang et al., 2003). Composing a
patent quality index using a linear combination of observed indicators, a recent study by
Lanjouw and Schankerman (2004) finds that research productivity at the firm level, measured by
the number of patents divided by R&D, is inversely related to patent quality and the level of
demand. A brief summary of the literature is presented in Table I.
----------------------------------------
INSERT TABLE I HERE
-----------------------------------------
Prior research therefore shows the importance of certain internal firm characteristics as
determinants of innovation productivity. To date, however, very little is known about the impact
of management characteristics and collaboration on innovation productivity. Moreover, most
research has explored this issue amongst large firms. Very few studies have addressed these
issues in the context of small and medium-sized enterprises (SMEs), which may play a critical
role in shaping industrial evolution a seedbed for novel innovation. This study seeks to fill this

3
gap in the literature by examining the impact of management characteristics and collaboration on
the efficiency of innovation in the context of SMEs. We draw our sample from a recent firm
level postal survey data covering 2130 British SMEs for the year 2001 and their innovation
experience in the previous two years.
The study makes several contributions to the literature. First, it attempts to link management
science with innovation and industrial economics, and to examine the impact of management
characteristics and collaboration on the productivity of innovation. As discussed earlier,
management and governance systems are crucial factors affecting the innovative productivity of
industrial organisations. However, empirical evidence on this issue is surprisingly rare.
Second, this study evaluates innovative efficiency in a multiple-output framework by attempting
to capture different types of innovation and different qualities of innovation, whereas most past
research on industrial research productivity uses a single indicator for the measurement of
research productivity. We take into account not only the percentage of sales attributed to new or
improved products, but also process and supply system innovations. Quality differences in
innovations, measured here in terms of their novelty, have also been allowed for by incorporating
Principal Component Analysis (PCA) into the multi-output model. It measures a firm’s
efficiency in innovation using both parametric and non-parametric frontier analysis to compare a
firm’s observed performance with best practice. Both the stochastic frontier analysis (SFA) and
the data envelopment analysis (DEA) are employed in the estimation of innovation productivity
to cross check the robustness of the results.

4
Third, firms in different industries have different technology opportunities and innovation
strategies. The management and collaboration variables may impact innovation efforts
differently in high-tech SMEs, for example compared to other firms. This study, therefore,
explores the different patterns of the effects of management characteristics and managerial
ownership across the manufacturing and services, high-technology and medium- and low-
technology sectors and discusses its implications. It finds that in the high-technology sector,
knowledge-related management factors, such as collaboration, training and formality in
management play a crucial role in enhancing innovative efficiency; while in the low- and
medium-technology sectors, it is managerial incentives and organisational flexibilities that play
an important role in innovative efficiency.
The rest of the paper is organised as follows. Section 2 briefly discusses the theoretical
framework and the hypotheses. Section 3 addresses the methodology. Section 4 discusses the
data. Section 5 presents the econometric results. Section 6 concludes.
THEORY AND HYPOTHESES
Successful innovation requires the effective management of a wide range of complementary
assets within the firm, and the development of an integrated system matched with its
technological and economic environment. This includes the development of effective motivation
and efficient allocation utilisation and reallocation of internal and external resources for
innovation. A firm’s potential innovative performance will necessarily be influenced by the
economic and technological opportunities in the industry that it belongs, its interactions with
5
other sources of knowledge such as suppliers, customers, universities and competitors and the
ability of its innovative efforts to transform and transcend existing industrial patterns (Hughes
and Scott Morton 2006; Cosh et al., 2006). Within the innovating firm, in practice, the creator,
owner, user and financier of innovations are, in most cases, not the same party. Successfully
commercialised innovation involves integrating inputs and efforts across top management and
various functional departments such as production, finance and marketing as well as research.
These elements of top management may have different interests and motivations which may give
rise to agency problems, free-riding and extra transaction costs (Aghion and Tirole, 1994).
Figure 1 attempts to map these elements of the complex innovation system at the firm level.
Coordinating and managing such a complex system to achieve commercial success from an
innovation, given the high degrees of uncertainty and a very low possibility of commercial
success1, requires determined and effective management. Therefore, managerial ownership and
management characteristics of a firm such as management structure, decision-making practices
and incentive arrangements may all affect the firm’s innovation performance. The complexity
revealed in Figure 1 indicates the range of factors which must be controlled for or included as
independent variables I explaining innovation performance. We consider key elements of this
system in turn.
� Managerial ownership
Innovation requires continuous investment in R&D so as to sustain a firm’s capability to
innovate at the cutting edge of technology (Jelinek & Schoonhoven, 1993). Innovation activities
also involve considerable risk since less than 20% of all new product introductions succeed
(Crawford, 1987); and even the few projects that do survive are typically unprofitable during
their first few years (Block & MacMillan, 1993). Success in innovation, therefore, requires

6
strong managerial support (Nam and Tatum, 1997; Kuratko et al., 1997; Scott and Bruce, 1994).
Top management’s commitment to beating the competition, their attitude towards innovation and
willingness to take risks all affect firms’ strategic decision-making (Papadakis and Barwise,
2002).
However, agency theory suggests that when ownership is separated from management, the
objectives of managers and owners may diverge. Lack of an ownership interest in the companies
they manage, may cause a lack of the willingness on the part of executives to support the risk-
taking associated with innovation, or see it through to fruition (Wright et al., 1996). The
executives may behave opportunistically by supporting projects that increase their own wealth
and pursue short-term objectives instead of the long-run growth of the company and the interests
of other shareholders. They will lack the incentives to support innovation which may put their
positions at risk and which may require new skills (Fama and Jensen, 1983; Wright et al., 1996).
This may therefore give the rise of X-inefficiency in innovation as top management plays an
important role in decision-making, innovation planning and management in small firms.
The alignment effect of managerial share-ownership may reduce the agency problem to certain
extent (Jensen and Meckling, 1976). Increased levels of executive ownership make executives’
wealth more dependent on their companies’ long-term performance. This gives the executive an
incentive to support innovation which may raise the competitiveness of their companies in the
long run (Jenkins & Seiler, 1990; Zahra et al., 2000). Managerial share-ownership can also
empower managers to initiate innovation activities (Finkelstein and D’Aveni, 1994). The

7
ownership interest for managers may motivate them to make more effort in R&D project
decision making, resource allocation and innovation management (Jensen and Meckling, 1976).
However, when managerial ownership reaches a sufficiently high level, an entrenchment
problem may arise as high share ownership may provide management with the power to insulate
themselves from the pressures of external discipline and internal monitoring devices (Fama and
Jensen, 1983) and in a small firm context pursue a ‘quiet life’ in a so called lifestyle business.
Therefore, the relationship between managerial ownership and firm performance may be non-
monotonic with firm performance first increasing with the increase in managerial ownership,
then declining until managerial ownership reaches certain level (Morck, et al., 1988; McConnell
and Servaes, 1990; Cosh, et al., 2006). Therefore,
H1: Managerial share-ownership will be associated with innovative efficiency in a nonlinear
way, where the slope is initially positive as the level of managerial ownership increases but
becomes negative as the level of managerial ownership becomes larger.
� Management structure
The debate over the benefits of organic and mechanistic (formal) management systems is well
documented. Burns and Stalker (1961) argue that a mechanistic management system,
characterized by specialised differentiation of functional tasks, precise definition of rights,
obligations and hierarchy, is appropriate to stable conditions. Whereas organic structures,
characterised by ‘realistic’ and continually re-defined individual tasks through interaction, spread
commitment to the concern beyond any technical definition, and a lateral rather than a vertical
direction of communication through the organization, are appropriate to dynamic environments.
On the other hand, starting from the seminal ‘ideal type’ analysis of the 19th century sociologist

8
Max Weber a stream of literature has argued about the merits of the bureaucratic form of
organisation, characterised by clear cut division of activities, assignment of roles and
hierarchically arranged authority, and its technically superiority relative to other forms of
organization. The claimed advantages of formal structures include greater precision, speed, task
knowledge and continuity. They also include reduced friction and ambiguity. Seen from this
perspective the relative lack of structure that allegedly characterizes new firms appears as a
liability not a benefit (Stinchcombe, 1965). Firms with informal management structures will be
less able to adopt cost leadership strategies that require sophisticated cost, budget and profit
controls. It is unlikely that such simple structures could adequately support a broad extensive
geographic or product diversification (Miller and Toulouse, 1986). A formal management
structure may also have a positive reputational effect and help small firms establish a better
access to external funding and establish collaboration links (Sine et al., 2004; Cosh et al., 2005).
Therefore,
H2: Firms with an informal management structure will be less efficient in innovation than those
with a formal management structure.
� Strategic decision making
The information-processing capabilities of top management are associated with the quality of the
strategic decision-making of firms and thereby affect firm performance (Haleblian and
Finkelstein, 1993). The limited foresight and bounded rationality of people mean that firms with
key member groups taking strategic decisions will have increased capabilities and viewpoints
relative to firms where Chief Executives personally control strategic and operating decisions.
With a group involved in strategic decision making there will be greater volumes of information
that can be absorbed and recalled; and there will be a greater number of critical judgements

9
available in decision making; and the range of perspectives brought to bear on a problem will be
wider (Harrison, 1975; Hoffman and Maier, 1961 and Haleblian and Finkelstein, 1993).
Moreover, a balanced power distribution facilitates information sharing and idea exchange.
Based on a study of 47 large US corporations, Haleblian and Finkelstein (1993) find that firms
with large teams performed better and firms with dominant CEOs performed worse in a turbulent
environment. The association between team size, CEO dominance and firm performance is
significant in an environment that allows top managers high discretion in making strategic
choices. Therefore, firms with key member group taking strategic decision are likely to make a
more informed decision than those dominated by the CEO’s personal preference (Miller and
Toulouse, 1986; Papadakis and Barwise, 2002). This may enable better use of the available
resources of the firm and better identification of market and technological opportunities. Hence,
H3: Firms with key member group taking strategic decision are more likely to innovate
effectively than firms whose Chief Executives personally controls strategic and operating
decisions.
� Incentive schemes
The presence of the agency problem may give rise to X-inefficiency (Leibenstein, 1978; Button
and Weyman-Jones, 1992), and subsequently reduce a firm’s efficiency in innovation. Given the
presence of the agency problem, incentive schemes (e.g. stock options and performance-related
pay) are designed to set up alignment mechanisms that alter the risk orientation of agents to align
them with the interests of principals. The incorporation of accountability through performance-
related payment schemes for managers and employees is found to have a significant correlation
with various indicators of business performance (e.g., Fu and Balasubramanyam, 2003; Black
and Lynch, 2004). We could expect that performance pay, which may motivate not only the

10
managers but also the scientists and all other employees to devote more attention to firms’ long-
term growth and make their most efforts, and therefore enhance the X-efficiency in innovation.
Therefore,
H4: Firms that use performance-related pay will be more efficient in innovation than those who
did not.
� Human resource management
Innovation is an activity in which human capital plays a key role. Active human resource
management is argued to be an essential contributor to firms’ innovation capacity (Laursen and
Foss 2003). There is a considerable literature on the relationship between training and the
propensity for innovation. Baldwin and Yates (1999) and Cosh et al. (2000) argue that there is a
two-way relationship between innovation and training. Better labour and managerial skills leads
to more innovation; in the mean time, more innovation creates greater demand for training. As
Acemoglue (1997) finds, workers are more willing to invest in their skills by accepting lower
wages today if they expect their firms to innovate and pay them higher wages in the future.
Similarly, firms are willing to innovate when they expect the quality of the future workforce to
be higher when workers invest more in their skills.
What is the impact of training on a firm’s productivity of innovation? Empirical studies on the
effects of training on firm performance in general provide mixed evidence. While Bartel (1994)
finds that formal training helps inefficient manufacturing firms catch up with their peers’ average
productivity, Black and Lynch (1995 and 1996) fail to find a significant effect of training on firm
productivity. The increased workforce skills through training are likely to improve not only a
firm’s likelihood to innovate, but also its efficiency in innovation. Firms that have trained

11
workers at the time of implementation of the new technology can really reap the quasi-rent
generated by innovation (Ballot and Taymaz, 1997). Therefore,
H5: Firms’ investment in training is positively associated with their efficiency in innovation.
� Complementarities between different individual management characteristics
The organisational studies and strategic management literature argues that it is not a single action
that is the route to higher levels of organisational performance, but a number of complementary
changes (Walker, 2004; Hughes and Scott Morton 2006). For instance, it is found that the
magnitude of the performance effect of a set of human resource management practices is greater
in the full system than in the sum of each practice taken individually (Ichniowski et al., 1997).
As stated earlier, by aligning the interests of owners and managers and employees, and holding
managers and employees accountable for their performance, performance pay is likely to reduce
the agency costs and free riding problem, and thereby reduce X-inefficiency in innovation.
Therefore, we should expect that in a firm with a formal management structure where
responsibility is clearly defined and performance can be accurately measured, this mechanism
may have a significant effect on innovative efficiency. Whereas under informal management
structure with serious ambiguity in responsibility, performance pay will not have a significant
effect on efficiency. Moreover, some management practices are complementary to each other.
Although some firms have spent on training to enhance the skills level of their employees and
managers, the benefits of training will take greater effect if performance related pay system is
introduced in the firm that gives employees and managers the incentives to make the most of
their effort. Hence,
H6a: Performance-related pay will have a stronger positive association with innovative
efficiency in a firm with formal rather than informal management structure.
12
H6b: Training will be more positively associated with innovative efficiency in a firm that has
introduced performance-related pay scheme than in others that do not.
• Interactions between management characteristics and managerial ownership
As discussed earlier, managerial ownership may affect managers’ effort and behaviour through
its alignment or entrenchment effects. Therefore, the impact of management characteristics on a
firm’s innovative efficiency is likely to be mediated by the level of managerial ownership in the
firm. In firms with relatively low level of managerial ownership, interests of owners and the
Chief Executives (CEs) may diverge. In such a case, incentive schemes, especially long-term
performance related stock option scheme, will play a more significant role in motivating
managers. Moreover, in firms with a low level of managerial ownership, leaving strategic and
operating decisions to the CE’s personal control may give the CE the power to make and
implement those decisions that are favourable to his own interests. Group-based decision-making
structure may overcome this problem and direct the strategic decisions of the firm are made in
favour of the majority of the shareholder. Therefore,
H7. Top management motivation and monitoring practices (e.g. group-based decision making
and stock option schemes) will be more significantly associated with innovative efficiency in
firms with low levels of managerial ownership.
• Moderating effects of industry technology environment
Firms in different technological groups have different innovation opportunities and require
different strategies for innovation. In industries of high technological dynamism, firms face
greater uncertainty that springs from the economic and social feasibility of new technologies
(Tushman & Rosenkopf), and uncertainty derived from the difference between the information

13
needed to perform a task and the information available, which present crucial problems for
decision makers (Galbraith, 1973). In addition to the technological uncertainty, there are also
uncertainties over whether a technology will prove acceptable to the market. “Nonscientific”
factors have caused many technologically effective inventions to fail to gain market acceptance
(Tushman & Rosenkopf, 1992). Moreover, in the high-technology sector SMEs are often
established to exploit the creative ideas and knowledge of their founders. The owners may be
experts in science and engineering, but may be short in managerial skills (Bollinger et al., 1983;
and Utterback et. al., 1988). Introduction of improved management practices may play a crucial
role in assisting these high-tech SMEs to successfully commercialise their knowledge and skills.
The adoption of a formal management structure based on function specialisation, may lead top
and middle managers to have a clearer idea of their managerial job functions and greater
specialised task knowledge (Stinchcombe, 1965). It also provides a clear structure for effective
cost management (Miller and Toulouse, 1986). Formal structures are found to raise new venture
turnover in dynamic emerging economic sectors (Sine et al., 2004), and enhance a firm’s
propensity to innovate (Cosh et al., 2005). Moreover, in high-technology industries knowledge
plays a crucial role. As a result, we should expect knowledge-enhancing management practices
such as training will be more important in these industries than in traditional industries. Hence,
H8a: Formal management structure will be more significantly associated with innovative
efficiency in high-technology sectors than in traditional industries.
H8b: The impact of training on innovative efficiency is likely to be more significant in high-
technology sectors than in traditional industries.

14
METHOD
Data
Data for this study is drawn from the small and medium sized business postal survey for 2002
(CBR2002) conducted by the Centre for Business Research (CBR) at the University of
Cambridge. This survey produced an achieved sample of 2130 SMEs in the British
manufacturing and business services sectors covering the period 1998-2001. The sampling frame
for the survey was all independent businesses in manufacturing and business services with less
than 500 employees in Great Britain (including business partnerships and sole proprietors) and
was based on the Dun & Bradstreet UK Marketing Database. The sample design was based on a
stratified approach using size and sector proportions chosen to avoid swamping the sample with
micro businesses. The survey covered two groups of firms both based on the same sampling
frame and survey design. The first group had been surveyed in previous years as part of the
development of the CBR unique longitudinal small firm database. (old panel). The second group
were firms who were newly sampled to form the basis of a new longitudinal panel.(new panel).
For the old panel, 521 usable responses were received, a unit response rate of 33% from eligible
firms. For the new panel, 1609 usable responses were received and the unit response rate was
14%. A response bias analysis in terms of age employment turnover pre tax profit and legal
status revealed that there were no major differences between the respondents and the non-
respondents in these groups, although respondents had somewhat lower turnover but higher
profit margins than non-respondents in the old panel and the respondents in the new panel tended
to be somewhat older than the non-respondents in some manufacturing industries. A spatial
analysis revealed that the combined achieved sample was representative of the regional
distribution of the small business population in Great Britain.
15
The survey data includes responses covering the percentage of sales which the firms attribute to
new or improved products introduced in the survey period, as well as indicators of the incidence
of product process and logistic innovations. The incidence data distinguishes innovations new to
the firm but not the industry (diffusion innovation) and innovation new to the firm and the
industry (novel or original innovation). It also includes data on R&D employment and R&D
expenditure
The survey questionnaire covers not only innovation, but also business performance management
structure and ownership characteristics. The rich information embedded in this survey allows us
to explore the impact of management and ownership on SME innovative capacity and compare
the difference between micro, small and medium firms. Of the total 2130 SMEs, 978 firms
reported themselves to have either product or process innovation. In order to focus on firms with
measurable innovation inputs and because the data envelopment analysis (DEA) requires inputs
and outputs to be positive, all the observations with zero sales due to new or improved products
zero R&D expenditure or zero R&D staff are excluded from the sample. After pair-wise deletion
of missing observations and outliers with zero values in these variables the number of cases
entering the final sample is 440. The mean value of the number of employees in each firm is 66.
Twenty percent of them are micro firms in the 1-9 size band; 36 percent are small firms in the
10-49 size band; and 44 percent of them are medium firms in the 50-499 size band. To test for
possible sample biases arising from the reduction in sample size for these reasons we compared
the mean levels and quartile levels of the number of employees and key management

16
characteristics for our 440 firms with those for the whole sample of 900 innovating firms and
found no significant difference.
Empirical studies of innovation in SMEs rely heavily on survey data because a firm’s percentage
of sales due to new or improved products and the number the number of R&D staff and amount
of R&D expenditure is either never or rarely reported in small business company accounts..
Multi-method validation of survey responses, however, often cannot be achieved for such survey
based studies. Using data solely from a single survey for statistical analysis may produce so
called common methods bias if the design survey instrument predisposes answers following a
similar profile across respondents. The potential for such bias can be addressed by careful survey
design and post hoc statistical analysis. We assessed the presence of common method bias in our
design in two ways. First, we randomly sapled respondents and compared the financial figures
obtained from the survey for these firms with the financial data available in an independent data
base (FAME). The vast majority of the financial data are consistent with each other, and less
than 10 percent of the observations showed a significant variance. Second, we also assessed the
evidence for common methods bias statistically using Harmon’s single factor test, which uses
factor analysis combining multiple variables from the survey to see if a single dominant factor or
one general factor effectively summarises the responses (Podsakoff and Organ, 1986). We found
no evidence of significant sole source bias using this test.

17
Measurement of Dependent Variable: Estimation of Innovative Efficiency
There are three main approaches to the measurement of efficiency: ratio analysis such as labour
productivity and capital productivity, the normal econometric approach such as total factor
productivity (TFP) index, and the frontier approach, such as data envelopment analysis (DEA).
Total factor productivity (TFP) can in principle take into account the contribution of factors,
other than labour and capital, such as managerial skills and technical know-how. The
conventional total factor productivity approach defines TFP growth as the residual of output
growth after the contribution of labour and capital inputs and other input variables have been
subtracted from total output growth. This method, however, attributes all the deviations from the
expected output to TFP without taking into account measurement error. It is also based on
several well-known strong assumptions: (1) the form of production function is known; (2) there
are constant returns to scale; (3) there is optimising behaviour on the part of firms; and (4) there
is neutral technical change. If these assumptions do not hold, TFP measurements will be biased
(Coelli et al., 1998; Arcelus and Arocena, 2000).
The frontier approach evaluates a firm’s efficiency against a measure of the best practice. There
are two main methods for the estimation. One is a non-parametric programming approach, the
Data Envelopment Analysis (DEA); another is a parametric production function approach, the
Stochastic Frontier Analysis (SFA). In the DEA approach, a best-practice function is built
empirically from observed inputs and outputs. The efficiency measure of a firm’s innovation
activity is defined by its position relative to the frontier of best performance established
mathematically by the ratio of the weighted sum of outputs to the weighted sum of inputs
(Charnes et al., 1978). The strength of the programming approach lies not only in its lack of

18
parameterisation, but also in that no assumptions are made about the form of the production
function. In addition, the programming approach allows us to estimate efficiency from a multi-
output and multi-input perspective. This technique has a main shortcoming in that there is no
provision for statistical noise, or measurement error, in the model (Greene, 1997; Norman and
Stoker, 1991). The econometric stochastic frontier approach, however, has the main advantage
that measurement error can be minimised and hypotheses can be tested with statistical rigour;
although it has the drawback that the production function is assumed to be known and to be
homogeneous across firms.
Given the advantages and disadvantages of the different efficiency estimation approaches, we
use the DEA approach in the estimation of the innovative efficiency because this method allows
us to evaluates a firm’s efficiency in innovation against best practice, We employ both
programming and econometric methods to cross check the robustness of the results. Technical
details of the two approached are given in Appendix 1.
In the analysis, since our major objective is to maximise innovation output, we concentrate on
output-oriented efficiency, which reflects a firm’s efficiency in producing maximum innovation
output with given inputs, under variable returns to scale. Innovation output is measured by the
percentage of sales that relates to new, or significantly improved, products. This indicator has the
advantage over other output innovation indicators (e.g. the number of innovations and patents)
because it reflects the extent of the commercial success of the innovations. Inputs in our models
include the value of R&D expenditure as a percentage of sales and the total number of R&D staff
as a share of the total labour force.

19
However, innovation includes not only product innovation, but also process and logistics
innovation. In addition, there are also differences in degrees of novelty between innovations.
Given that DEA analysis allows for multi-outputs in the model, we include these other measures
of innovation as other outputs in our DEA model. Following Adler and Golany (2001), we
combine the principal component analysis (PCA) of these other measures with DEA. PCA
explains the variance structure of a matrix of data through linear combinations of variables which
capture a large proportion of the variance in the data but, at the same time, reduce the data to a
few principal components. If most of the population variance can be attributed to the first few
components, then they can replace the original variables without much loss of information.
The results of a PCA can be negative but, following Charnes et al. (1985) and Ali and Seiford
(1990), an affine transformation of data can be utilised with no change in the results. Therefore,
following Adler and Golany (2001), all the factors produced from PCA used subsequently in the
DEA have been increased by the most negative value in the vector plus one when necessary, thus
ensuring strictly positive data for the DEA. The translation is as follows,
aFACFAC +=' ,
where FAC is the factors derived from PCA, and { } 1+= FACMina .
Our DEA analysis is carried out both for our principal output measure, the percentage of sales
accounted for by new, or significantly improved, products; and for that measure combined with
the two factors produced from the PCA.
20
For the Stochastic Frontier Approach, following Siegel et al., (2003), we assume a half-normal
distribution for the efficiency component µ , which means the firms are either “on the frontier” or
below it. The output of the knowledge production function, y, is measured by the percentage of
sales that relates to new or significantly improved products (NEWSALE), as in the single-output
DEA case. Inputs in the SFA model include the value of R&D expenditure as a percentage of
sales (RDS) and the share of R&D staff2 in the labour force (RDPS). The empirical model that
yields our SFA measure of innovative efficiency is therefore as follows:
µυξφη −+++= RDPSRDSNEWSALE lnlnln (1)
Having described our methods for evaluating innovative efficiency, we now turn to the variables
that we have argued in our discussion of theory above should have important influences on the
level of efficiency.
Explanatory Variables of Innovative Efficiency
There are five independent variables in this study: incentive schemes; management structure;
decision-making structure; training; and managerial ownership. Below we explain how each of
these variables was measured.
Incentive schemes
Compensation related incentive schemes include long-term and short-term pay. Stock options
and other forms of equity-based compensation are tied to achieving objectives over periods
ranging from three to five years. Performance-related pay normally relates compensation to
short-term performance such as monthly sales revenue, or earnings. We therefore measure
21
incentive schemes in two ways. One is the number of managers and employees participating in a
stock option scheme as a percentage of the total labour force. Another is a dummy variable for
performance related pay. Firms who answer they have used performance related pay during the
previous three years have a value for 1, and those who have not are given a value of zero.
Management structure
In small businesses, many firms just have an informal structure without a clearly defined
organisation structure. In the questionnaire, firms are asked to indicate which of the following
structures most closely describes the structure of their management organisation: informal
structure; structure based on functional specialisation; structure based on product markets; or
structure based on geographic regions. Management structure is proxied by a dummy variable
which equals to 0 if a firm has an informal structure and 1 if a firm’s management structure is
based on functions, product markets or geographic regions.
Decision-making structure
In small businesses, it is not unusual that managers, especially owner-managers, control both
strategic and operating decisions of the firms. Our measure of decision-making structure is a
dummy variable according to answers to a question asking firms to describe their CEO’s
involvement in decision making. Firms where the CEO is one of the key members of a group
taking strategic decisions with indirect control of operating decisions are given a value of 1 and
all other cases where the CEO has sole control of strategic and or operating decisions are given a
value of zero.
Training
We measure training intensity by the ratio of a firm’s formal training cost to its total labour costs.
Managerial ownership

22
Our measure of managerial ownership is the percentage of a firm’s ordinary shares owned by the
Chief Executive, or Managing Partner (with 100% attributed to Sole Proprietors).
Industry technological environment
We classify firms into high-technology industries and traditional industries according to the
definition given by Butchart (1987). A dummy variable, which equals 1 for firms in high-
technology sectors and zero for firms in traditional sectors, is used to indicate a firm’s industry
technology category.
Control Variables
In addition to the 6 independent variables, we included 4 control variables: organisational
flexibility; collaboration; firm size; and the industry concentration ratio. Innovation requires
organizational flexibility to facilitate the coordination between the departments within the
innovating firm (Miller and Toulouse, 1986; Wissema et al., 1980). A flexible organization
structure helps to reduce the transaction costs within organisations. It facilitates the learning from
external sources, the adaptation of best practices and the exploitation of existing information.
Therefore, such an organizational structure will provide a favourable environment for the
generation and fostering of new ideas. Conversely, a high degree of organizational rigidity
increases transaction costs and hampers necessary structural changes for innovation. It reduces
not only a firm’s propensity of innovation (Bughin and Jacques, 1994; Galende and de la Fuente,
2003), but also the productivity of innovation. We measure a firm’s organisational rigidity on a
scale from 1 to 5. Firms who regard organisational rigidities as a crucial barrier to innovation in
their firms are given a value of 5 whilst those that regard it as insignificant barrier are given a
value of 1.

23
External linkages, both public (including higher education institutions) and private, are found to
benefit innovation in small businesses (Hoffman et al, 1998; Chesbrough 2003; Cosh et al.,
2006). These linkages can be important sources of knowledge that directly strengthen the
technological competences of the SMEs and hence their competitive advantage. Collaboration
with customers, suppliers, higher education institutions, even competitors, allows firms to
expand their range of expertise, develop specialist products, and achieve various other corporate
objectives (Kitson et al., 2001). In recent years, important contributions to innovation from
business collaborations, in particular the supply chains, have received increasing attention
(Porter and Stern, 1999). Networking is found to be positively associated with innovation (Goes
and Park, 1997), although there are sector and size variations (Rogers, 2004). Universities are
found to contribute to basic research awareness and insight among the partners (Hall, 2000).
University participation in research programmes is also found to have a positive impact on firm
patenting (Darby et. al., 2003). Collaboration with competitors and customers provides a firm
with greater access to domestic or international markets. This may lead to greater commercial
success of the new products, and enhances the productivity of innovation through economics of
scale. Collaboration with suppliers may lead to lower costs and better quality of the new
products. All this may result in higher productivity of the innovation activities. We measure a
firm’s collaboration using a dummy variable which equals 1 for firms who have engaged in
formal, or informal, collaborative or partnership arrangements with any other organisations, and
zero otherwise.

24
According to the Schumpeterian hypothesis, firm size and market structure should be related to
innovation activities. Large firms are often argued to be more innovative as they enjoy greater
economies of scale and scope than the small firms (Cohen, 1996) and can capture the fruits of
their innovation. They also have easier access to finance and greater capability to invest in R&D
or acquire external innovation outcomes (Geroski et al, 2002). However, it is also argued that the
relative innovative advantage between large and small firms is determined by market
concentration, the extent of entry barriers and the overall importance of innovation activity.
Small firms tend to have the relative advantage in industries which are highly innovative, and
utilise a large component of skilled labour (Acs and Audretsch, 1987). Market structure affects
innovation since a lack of competition in a market will give rise to inefficiency and result in
sluggish innovative activity (Geroski, 1990). In a competitive market with low concentration, the
competitive environment and competition pressure may induce small firms to be more innovative
to survive (Segerstrom, 1991).
Firm size is measured by the number of employees; and industry concentration ratio is measured
by the share of turnover of top three enterprise groups in total industry output obtained from the
Annual Business Inquiry collected by the Office of National Statistics in the UK.
In the estimation of firm innovative efficiency, the efficiency scores have an upper bound of 1.0
and a lower bound of 0.0. In these circumstances ordinary least squares estimates would be
inconsistent. Therefore, the regression model for technical efficiency is specified in form of the
Tobit model as follows (Tobin, 1958).
25
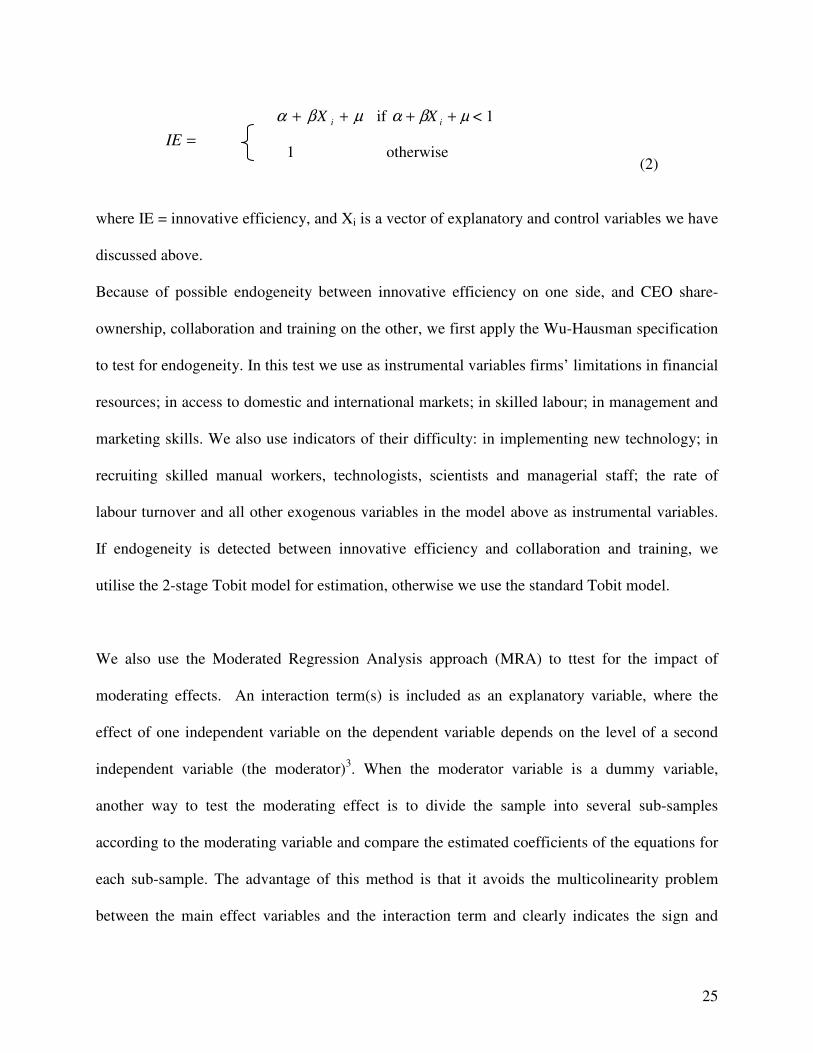
where IE = innovative efficiency, and Xi is a vector of explanatory and control variables we have
discussed above.
Because of possible endogeneity between innovative efficiency on one side, and CEO share-
ownership, collaboration and training on the other, we first apply the Wu-Hausman specification
to test for endogeneity. In this test we use as instrumental variables firms’ limitations in financial
resources; in access to domestic and international markets; in skilled labour; in management and
marketing skills. We also use indicators of their difficulty: in implementing new technology; in
recruiting skilled manual workers, technologists, scientists and managerial staff; the rate of
labour turnover and all other exogenous variables in the model above as instrumental variables.
If endogeneity is detected between innovative efficiency and collaboration and training, we
utilise the 2-stage Tobit model for estimation, otherwise we use the standard Tobit model.
We also use the Moderated Regression Analysis approach (MRA) to ttest for the impact of
moderating effects. An interaction term(s) is included as an explanatory variable, where the
effect of one independent variable on the dependent variable depends on the level of a second
independent variable (the moderator)3. When the moderator variable is a dummy variable,
another way to test the moderating effect is to divide the sample into several sub-samples
according to the moderating variable and compare the estimated coefficients of the equations for
each sub-sample. The advantage of this method is that it avoids the multicolinearity problem
between the main effect variables and the interaction term and clearly indicates the sign and
µβα ++ iX if µβα ++ iX < 1
=IE 1 otherwise
(2)

26
magnitude of the main effects in different states with regard to the moderator. This method,
however, does not demonstrate the significance of the differences across sectors. Given the
advantage and disadvantages of the two approaches, we combine MRA with sub-group analysis
wherever appropriate in our analysis.
RESULTS
Table II presents means, standard deviations and correlations among variables. Of all the
innovating firms in the valid sample, the average share of new products in total sales is 41
percent. The average R&D expenditure to total sales ratio is 14 percent, and the proportion of
R&D staff in the total labour force is 9 percent. On average, 52 percent of the ordinary shares is
owned by the CE, 4 percent of the workforce has participated in stock option schemes and 44
percent of our sample has used performance-related pay. About 70 percent of the firms have
reported a management structure based either on functional specialisation, or product markets or
geographical regions, but in only 28 percent of the firms are strategic decisions is made by a
group of key members rather than the CEO’s personal control of strategic and/or operating
decisions. The magnitude of the correlation coefficients between the independent variables is not
large in most of the cases. This indicates that multicollinearity does not present a significant
problem and that all the independent variables could be included in the regressions4.
----------------------------------------
INSERT TABLE II HERE
-----------------------------------------

27
Frontier estimates of innovative efficiency
The innovative efficiency of firms is estimated using both Data Envelopment Analysis (DEA)
and Stochastic Frontier Analysis (SFA). The process and logistics innovation outputs were
summarized using Principal Component Analysis (PCA). There are two factors which explain
52% of the variance across all the underlying variables. These two factors are retained and
extracted, and the estimated ‘factor loadings’ which represent the weights attached to each
underlying variable in the factor are reported in Table III. These two factors are: diffusion
process and logistics innovation (new to the firm but not the industry (FAC1) and original
process and logistics innovation (new to the firm and the industry) (FAC2). The latter factor has
higher quality in terms of novelty.
----------------------------------------
INSERT TABLE III HERE
-----------------------------------------
For the DEA analysis, the efficiency is estimated in three scenarios when innovation output is
measured by: (1) percentage of innovative sales; (2) innovative sales as in (1) plus the two
principal components without weights, and (3) innovative sales and the two principal
components with weights restriction. The innovative sales variable indicates the extent of
commercial success of the innovation. In this scenario we assume it has the same quality as
original process and logistics innovations, and their importance is twice that of the diffusion
innovations. Therefore, the weights restriction we use in the 3-outputs DEA3w model is as
follows5:
qnewsale = qnew to industry innovation = 2 qnew to firm innovation

28
As Table IV shows, the three DEA estimates and the SFA estimate are, in general, highly
correlated with each other. The estimated correlation coefficients between the single-output DEA
estimates (DEA1) on the one hand, and the weighted 3-output DEA estimates (DEA3w) and
SFA estimates (SFA1) on the other, are higher than 0.90. The SFA estimates (SFA1) have the
lowest variance as this approach has controlled for statistical noise. The impact-weighted,
quality-adjusted multi-output DEA estimates (DEA3w) have the lowest standard deviations
among the three DEA estimates. The differences in standard deviations between these estimates
are, however, very small. These results seem to suggest that the percentage of sales on account
of new or improved products has, to a certain extent, captured each firm’s variation in
innovation, both the type and the quality. The findings for only DEA1 and SFA1 are therefore
presented in our subsequent analysis.
----------------------------------------
INSERT TABLE IV HERE
-----------------------------------------
Breaking down the single-output DEA efficiency scores across the industries, Figure 2 shows
that the Research and Development sector (SIC73) had the highest average innovative efficiency
at 0.65 suggesting that, compared to other industry sectors in UK, they are the most efficient
sector in transforming innovation inputs into innovative sales. This result is not unexpected as
this sector should have the most experience in innovation management. The computer and
related activities (SIC72) sector also enjoy a relative high average innovative efficiency at 0.55.
The SMEs in the transportation, storage and communication sector (SIC60-64) are the least
efficient in transforming innovation inputs into output. The manufacturing sectors do not show
significant difference between each other in their innovative efficiency on average.

29
----------------------------------------
INSERT FIGURE 2 HERE
-----------------------------------------
Analysis of determinants of innovative efficiency
What are the determinants of SME innovative efficiency? Table V presents the Tobit model
estimation results. In view of the possible presence of heteroskedasticity, Quasi-maximum
likelihood (QML) standard errors that are robust to general misspecification are adopted in
estimation. As the Wu-Hausman test for endogeneity suggests that there is no significant
endogeneity between innovative efficiency on one hand, and managerial share ownership,
collaboration and training cost on the other, the standard Tobit model result is preferred to the 2-
stage Tobit model result.
----------------------------------------
INSERT TABLE V HERE
-----------------------------------------
The results show that the level of managerial ownership is non-linearly related to the innovative
efficiency of firms. The percentage of share owned by the CEO is positively correlated with
innovative efficiency and is statistically significant; while the estimated coefficient of the
quadratic term is negative. The results are consistent across all specifications. The inflection
point in the relationship is at 65 to 68 percent.6 This result suggests that the marginal value of
managerial ownership diminishes, and that beyond a threshold level the entrenchment effect of
managerial ownership outweighs the alignment effect.
30
Incentive schemes exert a positive effect on innovative efficiency which is statistically
significant in half of the specifications. The innovative efficiency for firms that have
performance-related-pay scheme (PRP) is about 0.06 units higher than that for the firms without
the PRP scheme. A one unit increase in the percentage of employees participated in stock option
schemes is to raise innovative efficiency by 0.1 unit7. This result lends support to the significant
effect of incentive schemes in reducing the agency and free-riding problem in the innovation
process. Our findings suggest that with income related to their performance, individuals and
groups will make greater effort and that this enhances the overall efficiency of the firm including
its innovative efficiency.
Formal management structure shows a consistent significant positive impact on innovative
efficiency. In other words, firms that have a formal management system are more efficient in
innovation than those that have not. The estimated coefficient of the training variable shows the
expected positive sign, and is statistically significant in half of the equations. However, the
estimated coefficients of the decision structure variable are not statistically significant in any of
the equations. This result seems to suggest that although decision-making structure has been
found to have important effect on firm’s likelihood to innovate, its impact on innovation
efficiency is not significant.
Firms that feel they are hampered by organisational rigidities show a statistically significant
worse performance in terms of innovative efficiency. The magnitude, the sign and the statistical
significance level of the estimated coefficients are robust across the specifications. This result
implies that organisational rigidities significantly increase operational costs within the firm,

31
weaken a firm’s adaptability to change, and reduce its efficiency in transforming resources into
commercially successful outputs. As expected, collaboration shows a significant positive effect
on innovative efficiency. This suggests that the complementary resources and skills shared
through research partnership enable SMEs to innovate more efficiently and effectively.
Firm size shows a negative effect on innovative efficiency and is statistically significant in the
regression with DEA-based efficiency model. There are several possible explanations for this.
First, R&D effectiveness is higher in small firms than in large firms as best practice may be more
often met in small firms (Rothwell, 1986) and small firms have a relative managerial advantage
in innovation (Bughin and Jacques, 1994). The advantage of small firms in innovation
management comes not only from R&D department efficiency, but also from synergy between
the firm’s departments. Second, larger firms are more likely to have broader product portfolios,
with a wider range of novelty, than are the smaller SMEs. Young small businesses are more
likely to concentrate on single newly introduced products. The proportion of sales accounted for
by products that were new, or significantly improved, in the previous three years may, therefore,
be lower in larger firms than in small firms. Finally, it should be remembered that the SFA
estimates have excluded the statistical noise in measurement. This fact suggests that, controlling
for statistical noise, there is no significant difference in innovative efficiency between large and
small firms. Table V also demonstrates some significant industry effects to which we return
below.

32
Complementarities between management characteristics
The regression results for the hypotheses on the interaction between incentive schemes and
management structure, and incentive schemes and training intensity are reported for the DEA1
innovative efficiency measure only in Table VI. The estimated coefficients are positive and the
interaction term between performance-related pay and formal management structure is
statistically significant at 10% level. This lends some support to the hypothesis that simultaneous
presence of a formal management structure and performance-based pay will reinforce the
individual effects of these factors and improve innovative efficiency. Both of the estimated
coefficients of the interaction terms between training intensity and incentive schemes show the
expected signs; they are however not statistically significant.
----------------------------------------
INSERT TABLE VI HERE
-----------------------------------------
The plot of the relationship in Figure 3 shows the interaction more clearly. This plot shows
graphically that incentive schemes are positively related to innovative efficiency in firms with a
formal management structure, but do not make a significant difference within an informal
management structure. Both of the estimated coefficients of the interaction terms between
training intensity and incentive schemes show the expected signs; they are however not
statistically significant.
----------------------------------------
INSERT FIGURE 3 HERE
-----------------------------------------
33
The moderating effects of managerial ownership
Tests of the hypotheses concerning the moderating effects of managerial ownership are reported
in Table VII. Drawing upon our finding of a non-linear relationship between managerial
ownership and innovative efficiency, we split the sample into two sub-sets by CEO share
ownership at the estimated turning point 0.65. Firms whose percentage of ordinary shared owned
by the CEOs are smaller than 65 percent are classified into the low managerial ownership
sample, and firms whose percentage of ordinary shared owned by the CEOs are greater than 65
percent are classified into the high managerial ownership sample.
As expected, ownership exerts a significantly positive influence on innovation efficiency in the
low managerial sample, but a negative yet insignificant in the high ownership group. Similarly,
the estimated coefficient of the stock option scheme variable is positive and statistically
significant at the 1% significance level in the low managerial ownership sample, but not
statistically significant in the high ownership group. The magnitude of the estimated coefficient
is 0.239 in the low managerial ownership sample, which is about 20 times of that in the high
managerial ownership sample at 0.013. This evidence supports our hypothesis that top
management motivation arrangements exert a larger and more significant effect in firms with a
low level of managerial ownership. The estimated coefficient of the group-based decision
variable in the low ownership group is positive, but the estimated coefficient for the high
ownership group is negative; both are insignificant. These results suggest that, although group-
based decision-making may take wider information into account and help to mitigate CEO’s
opportunity to take self-interested decision, its practical importance is questionable. The balance
between the monitoring and autonomy of CEOs is a question for further research. Interestingly,

34
in firms with a high level of managerial ownership, advanced management practices, such as
formal management structure, training and collaboration play a significant role in enhancement
of innovative efficiency.
----------------------------------------
INSERT TABLE VII HERE
-----------------------------------------
The moderating effects of industry technology environment
Table VIII reports the regression results for the hypotheses on the moderating role of industry
technology environment. We divide the whole sample into high-tech and traditional sub-samples.
The research and development, computer and related activities and manufacturing of electrical
and optical equipment sectors are classified into the high-technology sub-sample. The results
shown in this Table clearly support the hypotheses that industry technology environment would
moderate the relationship between management characteristics and innovative efficiency. Formal
management structure and training intensity play a more important role in the high-technology
sector; while incentive schemes and managerial ownership are more important for innovative
efficiency in the traditional sectors.
----------------------------------------
INSERT TABLE VIII HERE
-----------------------------------------
The magnitude of the estimated coefficients of formal management structure and training
intensity are several times larger than those for the traditional sectors and they are statistically
significant in the high-technology sector, but insignificant in the traditional sectors.

35
The significantly lower magnitude of the effect of managerial ownership in the high-technology
sector seems to suggest a better alignment effect of managerial ownership on innovative
efficiency in the traditional sector. The estimated coefficient of the performance-related pay
variable is positive and significant in the traditional sectors sample, but negative and not
significant in the high-technology sector. Results from this analysis suggest that the industry’s
technology environment affects the strength of relationships between management structure and
innovative performance in a material way.
DISCUSSIONS AND CONCLUSIONS
Findings from this study suggest that, in general, management structure, management practices
and ownership structure affect a firm’s innovation efficiency. The form and strength of these
effects vary across sectors. This is consistent with an evolutionary perspective in which
managerial and organisational routines reflect the private (or tacit) aspect of learning, which
enables firms to develop within their particular environment through their unique path-dependent
dynamic capabilities (Teece et al., 1997).
Our finding that formal management structure enhances firms’ efficiency in innovation is
consistent with the arguments of Stinchcombe (Stinchcombe, 1965). The positive effect of
formality in management structure is found to be most significant in the small high-technology
sector. Managers in this sector face greater technological and economic uncertainties than in the
traditional sector, but are often well trained in science and engineering rather than business and
management. Therefore, adopting formal management structures, for instance by establishing a
36
formal marketing division, will help these firms achieve greater success in commercialising their
innovative ideas. Formal management structure is also found to moderate a firm’s short-term
payment scheme. Performance-related pay appears to work more effectively in a formal
management structure. Policy implications of these findings are important in the context of the
debate on the effect of ‘organic’ versus ‘mechanistic’ structures on firm performance. An
‘organic structure is often regarded as more suitable for small businesses in dynamic
environments and then in turn linked to be associated informal management structures (Burns
and Stalker, 1961). We do find that organisational rigidity inhibits efficient innovation. However
this does not means that informality promotes innovation. On the contrary our findings show that
a formal management structure exerts significant benefits for small business, especially in the
dynamic high-technology sector.
Managerial ownership is found to have a non-monotonous relationship with innovative
efficiency. This finding is similar to those of Morck, et al. (1988) and McConnell and Servaes
(1990) and others for the USA and in the context of takeovers for the UK (Cosh et al., 2006). In
these cases the turning or tiling off point is at much lower proportions of share ownership. Our
results suggest that the positive influence of managerial ownership in our small firm sample
exists up to quite high levels of ownership but becomes negative after that optimal level is
reached. Decision making structure does not show a significant direct, or indirect, effect on the
innovative efficiency of firms. One interpretation of this could be that decision-making structure
at top management level may have greater influence on a firm’s decision over whether to
innovate than on the productivity of innovation. Productivity in innovation may mainly rely on a
firm’s management and governance system in efficient utilisation of internal and external

37
resources and effective motivation of managers and employees. These factors determine the
allocative efficiency, productive efficiency and X-efficiency in the innovation process.
Tests of the interactions among management characteristics variables show support for only one
hypothesis, the significant interaction effect between management structure and performance-
related pay. The estimated coefficients of other interaction terms whilst having the expected
signs are not statistically significant. However, when we take account of the interaction of
managerial ownership with stock option schemes we do find significant interaction effects. The
evidence presented here supports our hypothesis that top management motivation arrangements
exert a larger and more significant effect in firms with a low level of managerial ownership. The
implications of these findings are useful for practitioners and researchers in designing new
management package and evaluating the effect of current practices.
Another primary finding from this study is that a firm’s technological environment moderates the
strength and, in some cases, the form of relationship between management characteristics,
managerial ownership and innovative efficiency. The main indication for public policy and
management is that the appropriate choice of management structure and methods for improving
innovation efficiency depends on the technological environment in which the firm operates. For
example, compared with traditional sectors, the innovative efficiency of high-tech SMEs is
significantly associated with a formal management structure and training. The high-tech SMEs
who have adopted a formal management structure and who have invested more in training are
more efficient in innovation. On the other hand, in the traditional sectors, managerial ownership
and incentive schemes play a significantly positive role in raising innovative efficiency.

38
The questions of how to measure innovation output and how to evaluate a firm’s efficiency in
innovation are important issues for empirical research in innovation economics and innovation
management. This study has used two frontier analysis approaches to evaluate a firm’s efficiency
in innovation. The frontier approach differs from normal productivity measurement in that it
benchmarks a firm’s performance against best practice. It has also tried different measures of
innovation outputs taking into account of different types and qualities of innovation. The
estimated efficiency scores from the one-output and the weighted three-output DEA models and
the SFA model are highly consistent. This finding suggests that despite the different advantages
and disadvantages of various innovation measures, the percentage of sales due to new, or
significantly improved, products picks up most of the quantity and quality aspects of the
innovation performance of organisations.
Of course, the transformation of innovation inputs into successfully commercialised new
products takes time. Given that the data used here are cross-sectional, this limitation of the
current study needs to be noted. Future studies using longitudinal datasets and including time
dynamics within the model could produce further insights in this field.
Conclusions
Productivity in innovation has been a key issue for managers and policy-makers. How a firm’s
general management characteristics and ownership structure impacts on its innovative efficiency
is central to this issue. This paper has investigated the impact of management structure,
management practices and ownership structure on innovative efficiency using a recent survey

39
database for British SMEs. We find that firms’ management characteristics and managerial
ownership are significantly associated with their innovative efficiency. Formality in management
structure affects firms’ efficiency in innovation directly and indirectly by moderating the strength
of other management factors. Incentive design and human resource management practices also
have significant effect on innovative efficiency of firms. Managerial ownership is found to have
a non-monotonous non-linear relationship with firms’ innovative efficiency, supporting both an
alignment effect and an entrenchment effect of managerial ownership on the innovation
performance of firms. Results of this study reveal a significant moderating influence of a firm’s
technological environment on the relationship between management characteristics, ownership
structure and its innovative efficiency. Evidence from this study suggests that SMEs in the high-
technology sector have more to gain in terms of commercialising their innovative ideas and
inputs by adopting a formal management structure and providing training to their managers and
employees.
REFERENCES
Acemoglu, D. (1997). ‘Training and innovation in an imperfect labour market’. The Review of Economic Studies, 64, 3, 445-464.
Acs, Z. S. and Audretsch, D. B. (1990). Innovation and Small Firms, Cambridge, MA: MIT Press.
Adams, J. D. and Marcu, M. (2004). ‘R&D sourcing, joint ventures and innovation: a multiple indicators approach’. NBER working paper 10474.
Adams, J. (2000. Endogenous R&D spillovers and industrial research productivity, NBER Working Paper No 7484.
Adler, N. and Golany, B. (2001). ‘Evaluation of deregulated airline networks using data envelopment analysis combined with principal component analysis with an application to Western Europe’. European Journal of Operational Research, 132, 260-273.
Aghion, P. and Tirole, J. (1994). ‘The management of innovation’. The Quarterly Journal of Economics, 109, 4, 1185-1209.
Ali, A.I. and Seiford, L.M. (1990). ‘Translation invariance in data envelopment analysis’. Operations Research Letters, 9, 403-405.
Baldwin, J. and Gellatly, G. (2003). Innovation Strategies and Performance in Small Firms, Cheltenham and Northampton: Edward Elgar.
Baldwin, J. and Yates, J. (1999). ‘Innovation, training and success’. Statistical Canada, Analytical Studies Branch.
Baldwin, J. R. (1997). ‘The importance of research and development for innovation in small and large Canadian manufacturing firms’. Research Paper Series No. 107, Ottawa: Statistics Canada.
Ballot, G. and Tay, E. (1997). ‘The dynamics of firms in a micro-to-macro model: The role of training, learning and innovation’. Journal of Evolutionary Economics, 7, 4, p435-58.
Bartel, a. P. (1994). ‘Productivity gains from the implementation of employee training programmes’. Industrial Relations, 33, 411-25.
Bertand, M. and Schoar, A. (2003). ‘Managing with Style: the effect of managers on firm policies’. Quarterly Journal of Economics, 1169-1208.
Bessant, J., Caffyn, S. and Gilbert, J. (1996). ‘Learning to manage innovation’. Technology Analysis & Strategic Management, 8, 1, 59-70.
Bishop, P. and Wiseman, N. (1999). ‘External ownership and innovation in the United Kingdom’. Applied Economics, 31, 443-450.
Black, S.E. and Lynch, L.M. (1995). Beyond the incidence of training: evidence from a national employers survey, NBER Working Paper, 5231.
Black, S.E. and Lynch, L.M. (1996). ‘Human capital investments and productivity’. American Economic Review, 86, 263-7.

41
Black, S.E. and Lynch, L.M. (2001). ‘How to Compete: the impact of workplace practices and information technology on productivity’. Review of Economics and Statistics, 83, 3, 434-445.
Black, S. E. and Lynch, L. M. (2004). ‘What’s driving the new economy?: the benefits of workplace innovation’. The Economic Journal, 114, 97-116.
Blundell, R., Griffith, R. and Van Reenen, J. (1999). ‘Market share, market value and innovation in a panel of British manufacturing firms’. The Review of Economic Studies, 66, 3, 529-554.
Bollinger, L., Katherine H. and. Utterback, J. M. (1983). ‘A Review of Literature and Hypotheses on New Technology-Based Firms’. Research Policy, 12, 1, 1-14.
Bughin, J. and Jacques, J.M. (1994). ‘Managerial efficiency and the Schumpeterian link between size, market structure and innovation revisited’. Research Policy, 23, 6, 653-659.
Busemeyer, J.R. and Jones, L.E., 1983. ‘Analysis of multiplicative combination rules when the causal variables are measured with error’, Psychological Bulletin, 93 (3): 549-562.
Charnes, A., Cooper, W. W. and Rhodes, E. (1978). ‘Measuring the Efficiency of Decision Making Units’. European Journal of Operational Research, 2, 6, 429-444.
Charnes, A., Cooper, W.W., Golany, B., Seiford, L., and Stutz, J. (1985). ‘Foundations of data envelopment analysis for Pareto-Koopmans efficient empirical production functions. Journal of Econometrics, 30, 91-107.
Chesbrough, H.(2003) Open Innovation: The new imperative for creating and profiting from technology. Harvard Business School Publishing: Boston, MA
Celderman, M., 2000. ‘Contingency theory and moderated regression analysis: the effect of measurement level, measurement error and non-linear relations’, Vrije Universiteit Amsterdam, Research Memorandum, 2000-32.
Cohen, W. and Levin, R. C. (1989). ‘Empirical studies of innovation and market structure’. in R. Schmalensee and R. D. Willig (eds.), Handbook of Industrial Organization: Vol . 2, Amsterdam: Elsevier Science Publishers.
Cohen, W. (1996). ‘Empirical studies of innovative activity’. in P. Stoneman (ed.), The Handbook of the Economics of Technological Change, Oxford: Basil Blackwell, 182-264.
Cooke, P., Roper, S. and Wylie, P. (2003). ‘‘The golden thread of innovation’ and Northern Ireland’s evolving regional innovation system’. Regional studies, 37, 4, 365-379.
Cooper, W. W., Seiford, L. M. and Tone, K. (2000). Data Envelopment analysis: a comprehensive Text with Models, Applications, References and DEA-Solver Software, Boston/Dordrecht/ London: Kluwer Academic Publishers.
Cosh, A, Cumming,D. and Hughes, A. (2005) ‘Outside Entrepreneurial Capital’ CBR Working Paper no 301, Centre for Business Research, University of Cambridge, March.
42
Cosh, A., Fu, X. and Hughes, A. (2004). ‘How much does informality in management matter for SME innovation’ the 35th Entrepreneurship, Innovation and Small Business (EISB) Conference, Barcelona, Spain, September 2005.
Cosh, A., Guest, P.M. and Hughes, A. (2006) ‘Board Share-ownership and Takeover Performance’ Journal of Business Finance and Accounting, 3, 3 and 4, 459-510, April.
Cosh, A., Hughes, A. and Lester, R.K.(2006) UK Plc: Just How Innovative Are We? Cambridge-MIT Institute University of Cambridge.
Cosh, A., Hughes, A. and Weeks, M. (2000). ‘The relationship between training and employment growth in small and medium-sized enterprises'. Department for Education and Employment, Research Report No. 245, Sheffield.
Czarnitzki, D. and Kraft, K. (2004). ‘Firm leadership and innovative performance: evidence from seven EU countries’. Small Business Economics, 22, 325-332.
Danzon, P., Nicholson, S. and Pereira, N.S. (2003). ‘Productivity in pharmaceutical biotechnology R&D: The role of experience and alliances’. NBER working paper w9615.
Darby, M. R., Zucker, L. G. and Wang A. (2003). ‘Universities, joint ventures, and success in the Advanced Technology Program’. NBER working paper no. 9463.
Dean, J. W. Jr. and M. R Sharfman (1993). ‘Procedural Rationality in the Strategic Decision-making Process’. Journal of Management Studies, 30, 3, pp. 587–610.
Doyle, P. (2001). ‘Management structures and marketing strategies in UK industry’. European Journal of Marketing, 13, 5, 319-331.
Fama, E.F. and Jensen, M.C.(1983). ‘Separation of ownership and control’, Journal of Law and Economics, 88, 2,301-325.
Fu, X. and Balasubramanayam, V.N. (2003). ‘Township and village enterprises in China’. Journal of Development Studies, 39, 4, 27-46.
Furman, J., Porter, M. and Stern, S. (2002). ‘The determinants of national innovative capacity’. Research Policy, 31, 899-933.
Galbraith, J.R. 1973. Designing complex organizations. Reading, MA: Addison-Wesley. Galende, J. and de la Fuente, J.M. (2003). ‘Internal factors determining a firm’s
innovative behaviour’. Research Policy, 32, 5, 715-737. Geroski, P. A. (1990). ‘Innovation, technological opportunity, and market structure’.
Oxford Economic Papers, 42, 3, 586-602. Geroski, P.A., Van Reenen, J. and Walters, C. (2002). ‘Innovation, patents and cash
flow’. in Kleinknecht, A. and Mohnen, P. (eds) Innovation and Firm Performance: Econometric Explorations of Survey Data, Palgrave, New York.
Goes, J.B. and Park, S.H. (1997). ‘Interorganizational links and innovation: the case of hospital services’. Academy of management journal, 40, 3, 673-696.
Green, W. (1997). ‘Frontier production functions’. in M. H. Pesaran and P. Schimidt (eds.), Handbook of Applied econometrics, vol. II. Microeconomics, Oxford: Blackwell Publishers.
Grossman, G. M. and Helpman, E. (1990). ‘Trade, innovation and growth’. American Economic Review Papers and Proceedings, 80, 2, 86-91.
43
Haleblian, J. and S. Finkelstein (1993). ‘Top Management Team Size, CEO Dominance, and Firm Performance: The Moderating Roles of Environmental Turbulence and Discretion’. Academy of Management Journal, 36, 4, pp. 844–863.
Hall, B. H. (2000). ‘Universities as research partners’. NBER working paper no. w.7643. Harrison, E. F. (1975). The managerial decision-making process, Boston: Houghton
Mifflin. Hjelt, P. (2005). ‘What it takes to innovate’. FORTUNE, March 7, 52-53. Henderson, R. and Cockburn, I. (1996). ‘Scale, scope and spillovers: the determinants of
research productivity in drug discovery’. The RAND journal of economics, 27, 1, 32-59.
Hoffman, F. R. and Maier, N.R.F. (1961). ‘Quality and acceptance of problem solutions by member of homogenous and heterogeneous groups, Journal of Abnormal and Social Psychology, 58, 27-32.
Hoffman, K., Parejo, M., Bessant, J. and Perren, L. (1998). ‘Small firms, R&D, technology and innovation in the UK: a literature review’. Technovation, 18, 1, 39-73.
Hoffman, R.C. and Hegarty, W. H. (1993). ‘Top management influence on innovations: effects of executive characteristics and social culture’. Journal of Management, 19, 3, 549-574.
Hosono, K., Tomiyama, M. and Miyagawa, T. (2004). ‘Corporate governance and research and development: evidence from Japan’. Economics of Innovation and New Technology, 13, 2, 141-146.
Hughes, A. (2003). ‘Knowledge Transfer, Entrepreneurship and Economic Growth: Some Reflections and Implications for Policy in the Netherlands’. University of Cambridge Centre for Business Research Working Paper no.273.
Hughes,A. and Scott Morton, M.S. (2006) ‘The Transforming Power of Complementary Assets’ MIT Sloan Management Review, Summer, 47 , 50-58.
Ichniowski C, Shaw K, Prennushi G.1997. The effect of Human Resource Management Practices on Productivity: A Study of steel finishing lines. American Economic Review, 87(3): 291-313.
Jenkins, E. and Seiler, R. (1990). ‘The impact of executive compensation schemes upon the level of discretionary expenditures and growth in stockholder wealth’. Journal of Business Finance and Accounting, 17, 585-592.
Jensen, M.C. and Meckling, W.H. (1976). ‘Theory of the firm: managerial behavior, agency costs and ownership structure’. Journal of Financial Economics, 3, 305-60.
Lanjouw, J. O. and Schankerman, M. (2004). ‘Patent Quality and Research Productivity: Measuring Innovation with Multiple Indicators’. Economic Journal, Apr2004, 114 495, 441-466.
Laursen, K. and Foss, N.J. (2003). ‘New human resource management practices, complementarities and the impact on innovation performance’. Cambridge Journal of Economics, 27, 243-263.
Leibenstein, H. (1978). ‘On the basic proposition of X-Efficiency theory’. American Economic Review, 68, 2, 328-332.
44
Love, J.H., Ashcroft, B and Dunlop, S. (1996). ‘Corporate structure, ownership and the likelihood of innovation’. Applied Economics, 28, 737-746.
McConnell, J. and Servaes, H. (1990). ‘Additional evidence on equity ownership and corporate value’. Journal of Financial Economics, 27, 2,595-612.
Mairesse, J. and Hall, B. H. (1996). ‘Estimating the productivity of research and development: an exploration of GMM methods using data on French and United States manufacturing firms’. NBER working paper No. 5501.
Malerba. F. and Orsenigo, L. (1990). ‘Technological regimes and patterns of innovation: a theoretical and empirical investigation of the Italian case’. In: Heerthe, A., Perlman, M. (Eds.), Evolving Technology and Market Structure: Studies in Schumpeterian Economics. University of Michigan Press, Ann Arbor, MI.
Mansfield, E. (1988). ‘The speed and cost of industrial innovation in Japan and the US: external vs. internal technology’. Management Science, 34 10, 1157-68.
Miller, D. and J. M. Toulouse (1986). ‘Chief executive personality and corporate strategy and structure in small firms’. Management Science, 32, 11, 1389–1409.
Morck, R., Shleifer, A. and Vishny, W. (1988). ‘Management ownership and market valuation: an empirical analysis’. Journal of Financial Economics, 20, 1/2, 293-316.
Mowery, D. C., Oxley, J. E. and Silverman, B. S. (1996). ‘Strategic alliances and interfirm knowledge transfer’. Strategic Management Journal, 17, special issue, 77-91.
Nam, C.H. and Tatum, C.B. (1997). ‘Leaders and champions for construction innovation’. Construction Management & Economics, 15, 3, 259-271.
Negassi, S. (2004). ‘R&D co-operation and innovation: a microeconometric study on French firms’. Research Policy, 33, 3, 365-385.
Norman, M. and Stoker, B. (1991). Data Envelopment Analysis: The Assessment of Performance, Chichester: John Wiley.
Pavitt, K. (1987). ‘The objectives of technology policy’. Science and Public Policy, 14, 4, 182-188.
Porter, M. and Stern, S. (1999). The New Challenge to America’s Prosperity: Findings from the Innovation Index. Council on Competitiveness, Washington, D.C., USA.
Poutxiouris, P. (2003). ‘The strategic orientation of owner-managers of small ventures: evidence from the UK small business economy’. International Journal of Entrepreneurial Behaviour and Research, 9, 5, 185-214.
Rogers, M. (2004). ‘Networks, firm size and innovation’. Small Business Economics, 22, 141-153.
Roper, S. (2000). Benchmarking regional innovation: a comparison of Baden-Wurttemberg, Bavaria, Northern Ireland and the Republic of Ireland, Northern Ireland Economic Research Centre Working Paper No. 56, Belfast.
Rothwell, R. (1986). ‘The role of small firms in technological innovation’. In Curra, J. eds. The Survival of the Small Firm, Gower, London.
Rothwell, R. and Zegveld, W. (1982). Innovation and the Small and Medium-sized Firm, London: Frances Pinter.
45
Scherer, F. M. (1980). Industrial Market Structure and Economic Performance, 2nd edn. Chicago: Rand McNally.
Segerstrom, P. S. (1991). ‘Innovation, imitation and economic growth’. The Journal of Political Economy, 99, 4, 807-827.
Shepperd, J.A., 1991. ‘Cautions in assessing spurious ‘moderator effects’’. Psychological Bulletin, 110(2): 315-317.
Siegel, D. S., Westhead, P. and Wright, M. (2003). ‘Assessing the impact of university science parks on research productivity: exploratory firm-level evidence from the United Kingdom’. International Journal of Industrial Organization, 21, 9, 1357-70.
Symeonidis, G. (2001). ‘Price competition, innovation and profitability: theory and UK evidence’. CEPR Discussion Paper No. 2816. Centre for Economic Policy research, London.
Tobin, J. (1958). ‘Estimation of relationship for limited dependent variables’. Econometrica, 26, 1, 24-36.
Tsai, W. (2001). ‘Knowledge transfer in intraorganizational networks: effects of network position and absorptive capacity on business unit innovation and performance’. Academy of management journal, 44, 5, 996-1004.
Tushman, M.L. & Rosenkopf, L., 1992. ‘Organizational determinants of technological change: Towards a sociology of technological evolution’. In B.M. Staw & L.L.Cummings (Eds), Research in organizational behavior, 14, 311-347. Greenwich, CT: JAI Press.
Utterback, J. M., Meyer, M., Roberts, E. and Reitberger, G. (1988). ‘Technology and Industrial Innovation in Sweden: A Study of Technology-Based Firms Formed Between 1965 and 1980,’ Research Policy, 17, 15-26.
Walker, R.M. (2004). ‘Innovation and Organisational performance: evidence and a research agenda’. AIM Research Working Paper Series, 002-June-2004, London.
Wissema, J., van Der Pol, H. and Messer, H. (1980). ‘Strategic management archetypes’. Strategic Management Journal, 1, 1, 37-47.
Wright, P., Ferris, S.P., Sarin, A., and Awasthi, V. (1996). ‘Impact of corporate insider, blockholder, and institutional equity ownership on firm risk taking’. Academy of Management Journal, 39, 2, 441-463.
Zahra, A., Neubaum, D. and Huse, M. (2000). ‘Entrepreneurship in medium-size companies: exploring the effects of ownership and governance systems’. Journal of Management, 26, 5, 947-976.
Zhang, A., Zhang, Y. and Zhao, R. (2003). ‘A study of the R&D efficiency and productivity of Chinese firms’. Journal of Comparative Economics, 31, 444-464.

46
Table I. A summary of selected literature on industrial research productivity
Study Country Sample Method Measure of research
productivity
Results
Mansfield, E. (1988)
US and Japan
50 Japanese and 75 US major firms in 6 manufacturing industries, 1985
Questionnaire survey, Comparison.
The time and cost of innovation judged by the Chief Executives.
The impact of external and internal technology. The Japanese have great advantages in carrying out innovations based on external technology, but not in carrying out innovations based on internal technology. A large part of US’s problem in this regard seems to be due to its apparent inability to match Japan as a quick and effective user of external technology.
Henderson, R. and Cockburn, I. (1996)
US and European
An unbalanced panel. 38 research programs from 10 firms over 30 years in pharmaceutical industry.
Poisson regression.
Number of patents.
Larger research efforts are more productive, not only because they enjoy economies of scale, but also because they realize the economies of scope by sustaining diverse portfolios of research projects that capture internal and external knowledge spillovers.
Mairesse, J. and Hall, B. (1996)
US and France
Two panels of about 1000 manufacturing firms in the US and France over the 1980s, including large and medium-sized firms.
Regression controlled for simultaneity bias with GMM (Generalised Method of Moments).
Output elasticity of R&D.
The contribution of R&D to sales productivity growth appears to have declined during the 1980s. The role of simultaneity bias is higher in the US than in France, possibly reflecting the greater importance of liquidity constraints for R&D investment in that country. Using sales instead of value added does not seriously bias the results.
Adams, J. (2000) US 220 R&D laboratories in 4 manufacturing industries. 1996.
Postal survey. Negative binomial regressions
Number of patents.
The full effect of spillovers on research productivity of firms exceeds the structural effect. Learning expenditure transmits the effect of spillovers. And it increases in response to industrial and academic R&D spillovers. Academic spillovers appear to have a more pervasive effect on R&D than do industrial spillovers.

47
Table I. (Continued) Danzon, P., Nicholson, S. and Pereira, N.S. (2003)
US 900 firms, 1988-2000 in pharmaceutical industry. Large and small firms.
Logistic regressions
Probability of success
Success probabilities are negatively correlated with mean sales by category (which is consistent with a model of dynamic, competitive entry). Success probabilities are larger for products developed in an alliance.
Zhang et al (2003) China 8341 firms, 1995 large and small firms.
Cross-section regression.
Estimated using Stochastic Frontier Analysis.
Public and private ownership and R&D efficiency. Ownership to be a contributing factor in the cross-sectional variance of R&D efficiencies. The state sector has significantly lower R&D efficiency than the non-state sector.
Siegel, Donald S., Westhead, Paul and Wright, Mike (2003)
UK Survey data for 89 science park firms and 88 non-science park firms in the late 1980s.
(1). Negative binomial regression. (2) Stochastic frontier analysis and Tobit model
Measures of innovation output: number of new products, number of patents, and number of copyrights, alternatively. (1) Estimates of science park dummy. (2) Estimates of the marginal product of R&D (3) Estimates of SFA
Companies located on university science parks in the United Kingdom have higher research productivity than observationally equivalent firms not located on a university science park. The preliminary results are robust to the use of alternative econometric procedures to assess relative productivity.
Lanjouw, J. O. and Schankerman, M. (2004)
US Panel data for about 1500 US manufacturing firms over 1980-93.
Develop an index of patent ‘quality’. OLS and IV
Ratio of patents to R&D.
Research productivity at the firm level is inversely related to patent quality and the level of demand.

48
Table II. Descriptive Statistics and Correlation Coefficients Mean Std.Dev. 1 2 3 4 5 6 7 8 9 10 11 12 13 14 1 NEWSALE 41.05 28.08 1.00 2 RDS 0.14 0.19 0.21 1.00 3 RDPS 0.09 0.13 0.14 0.92 1.00 4 OS 52.08 32.49 0.11 0.10 0.13 1.00 5 SOPT 0.04 0.18 0.16 0.14 0.10 -0.10 1.00 6 PP 0.44 0.50 0.10 -0.02 -0.05 -0.03 0.13 1.00 7 MS 0.70 0.46 0.06 -0.21 -0.31 -0.18 0.12 0.13 1.00 8 DEC 0.28 0.45 -0.01 -0.13 -0.14 -0.19 0.06 0.06 0.26 1.00 9 OG 1.58 0.89 -0.13 -0.07 -0.05 -0.06 -0.05 0.01 0.07 0.03 1.00
10 COOP 0.53 0.50 0.09 0.05 -0.01 -0.13 0.17 0.13 0.20 0.17 0.05 1.00 11 TR 1.44 1.56 0.09 -0.02 -0.08 -0.02 0.05 0.21 0.14 0.11 -0.02 0.06 1.00 12 LFS 3.47 1.39 -0.09 -0.51 -0.58 -0.32 0.07 0.20 0.59 0.31 0.12 0.17 0.26 1.00 13 CONC 2.56 0.75 -0.03 0.06 0.03 -0.09 -0.04 -0.03 0.06 0.01 -0.02 0.00 -0.07 0.04 1.00 14 HITEC 0.28 0.45 0.11 0.28 0.20 -0.05 0.11 0.02 0.09 0.02 -0.02 0.09 0.06 -0.09 0.29 1.00 Notes: NEWSALE: Percentage of sales accounted for by new or improved products. RDS: R&D expenditure to total sales RDPS: Share of R&D staff in total labour force OS: Percentage of ordinary shares owned by the chief executive. OS2: Quadratic term of OS PP: Performance related payment dummy, 1=yes, 0=no SOPT: Percent of managers and employees participated in stock option scheme. MS: Management structure dummy, 0 for firms with informal structures and 1 for others DEC: Decision making structure dummy, 1 for firms with group based strategic decision making and 0 for others. TR: Training input, measured by formal training costs as a percentage of total labour costs. OG: Organisational rigidities ranging from 1 to 5 which indicate this is an insignificant barrier and a crucial barrier, respectively. COOP: Innovation co-operation agreements dummy, 1=yes, 0=no LFS: Log of firm size measured by the number of employees CONC: Industry concentration ratio measured by the share of turnover of top three enterprise groups in total industry output. HITEC: High-technology industry dummy, 1 =yes, 0 =no.

49
Table III. Factor loadings of innovation outputs FAC1 FAC2
Innovation New
to firm
Innovation New
to industry
Diffusion innovation: manufacturing production methods .726 2.319E-02
Diffusion innovation: manufacturing logistics .777 8.824E-02
Diffusion innovation: service sector process innovations .649 .117
Original innovation: manufacturing production methods 1.974E-02 .747
Original innovation: manufacturing logistics .131 .700
Original innovation: service sector process innovations 7.683E-02 .681
Extraction Method: Principal Component Analysis. Rotation Method: Varimax with Kaiser Normalization. Rotation converged in 3 iterations.
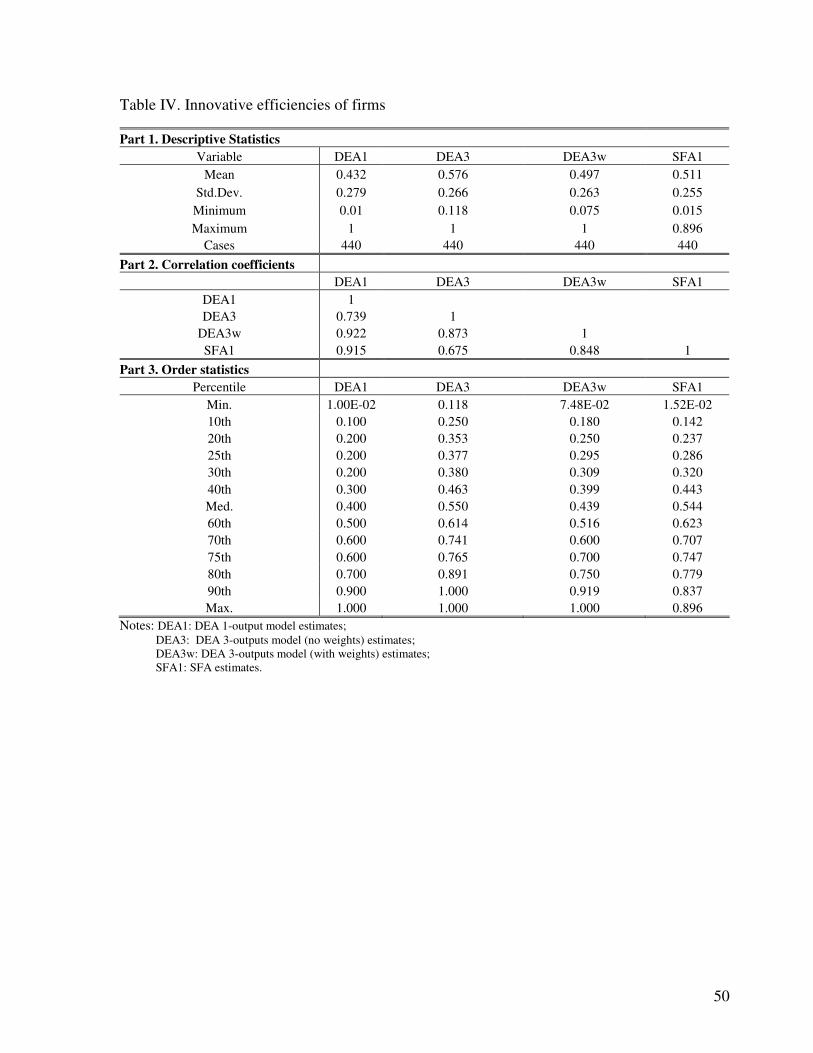
50
Table IV. Innovative efficiencies of firms
Part 1. Descriptive Statistics Variable DEA1 DEA3 DEA3w SFA1
Mean 0.432 0.576 0.497 0.511 Std.Dev. 0.279 0.266 0.263 0.255 Minimum 0.01 0.118 0.075 0.015 Maximum 1 1 1 0.896
Cases 440 440 440 440 Part 2. Correlation coefficients
DEA1 DEA3 DEA3w SFA1 DEA1 1 DEA3 0.739 1
DEA3w 0.922 0.873 1 SFA1 0.915 0.675 0.848 1
Part 3. Order statistics Percentile DEA1 DEA3 DEA3w SFA1
Min. 1.00E-02 0.118 7.48E-02 1.52E-02 10th 0.100 0.250 0.180 0.142 20th 0.200 0.353 0.250 0.237 25th 0.200 0.377 0.295 0.286 30th 0.200 0.380 0.309 0.320 40th 0.300 0.463 0.399 0.443 Med. 0.400 0.550 0.439 0.544 60th 0.500 0.614 0.516 0.623 70th 0.600 0.741 0.600 0.707 75th 0.600 0.765 0.700 0.747 80th 0.700 0.891 0.750 0.779 90th 0.900 1.000 0.919 0.837 Max. 1.000 1.000 1.000 0.896
Notes: DEA1: DEA 1-output model estimates; DEA3: DEA 3-outputs model (no weights) estimates; DEA3w: DEA 3-outputs model (with weights) estimates; SFA1: SFA estimates.

51
Table V. Management characteristics, managerial ownership and innovation efficiency: Tobit model estimation
� � � '�(��������� ���� � � � �
� '!�)� &��)�
� �����*� +,����� �����*� +,����� �����*� +,����� �����*� +,�����
�������� -*..)///� -*---� -*.0)///� -*---� -*120///� -*---� -*13)///� -*---�
#&� -*--1//� -*-)0� -*--1//� -*-)2� -*--4//� -*-)3� -*--4//� -*-)5�
#&0� ,-*---//� -*-40� ,-*---//� -*-.-� ,-*---/� -*-.0� ,-*---/� -*-.1�
&#+6� -*)3-//� -*-)5� � � -*-23� -*)-)� � �
++� � � -*-1-� -*)7.� � � -*-74//� -*-).�
�&� -*-72/� -*-5)� -*-55//� -*-03� -*)-)///� -*--1� -*-2.///� -*--5�
'!�� -*--7� -*5.-� -*--1� -*2-3� ,-*-))� -*3)5� ,-*--4� -*20-�
6�� -*-)3/� -*-3.� -*-)1� -*)4)� -*-)./� -*-70� -*-))� -*)5.�
�##+� -*-.1/� -*-77� -*-.4/� -*-3-� -*-7)//� -*-)2� -*-.0//� -*-17�
#8� ,-*-03/� -*-54� ,-*-41//� -*-41� ,-*-40//� -*-04� ,-*-40//� -*-01�
9�&� ,-*-43///� -*--5� ,-*-45///� -*--3� ,-*-)3� -*)33� ,-*-).� -*014�
9�#:�� ,-*-02� -*0-)� ,-*-07� -*07)� ,-*-)3� -*453� ,-*-)2� -*4.0�
&!�0�;��*�����<����� ��=� ,-*)02///� -*--)� ,-*))0///� -*--.� ,-*-71/� -*-3-� ,-*-7-/� -*-2)�
&!�4�;��*���������� ���>��(� ����?� (*=� ,-*-.7� -*005� ,-*-1)� -*45-� ,-*-.3� -*)70� ,-*-1.� -*03.�
&!�1�;����������>���� ������� � � ��=� ,-*))1//� -*-)1� ,-*-2)/� -*-.)� ,-*-1-� -*41.� ,-*-40� -*112�
&!�.�;���(�����>���������� � � ��=� ,-*-)-� -*57-� -*-01� -*73.� ,-*-.)� -*4)7� ,-*-45� -*17)�
&!�7�;�������>�������(����=� -*)-4� -*.13� -*)..� -*474� -*).0� -*020� -*)34� -*003�
� � � � � � � � �
9���9 @�� ���� ,)0.*)20� � ,)00*)51� � 5*.)3� � 3*220� �
'!�#�+�� ������ -*42.� � -*420� � -*11)� � -*11-� �
:� 11-� � 11-� � 11-� � 11-� �
Note: 1. *** Significant at the 1% level. ** Significant at the 5% level. * Significant at the 10% level. 2. Base industry: SEC1 Light manufacturing industry. 3. Wu-Hausman test for exogeneity (H0: exogeneity) has been conducted for managerial share ownership, collaboration and training variables. None of these variables are reported to be endogenous at the 1% significance level. Therefore, the standard Tobit model is preferred to the simultaneous equations model.

52
Table VI. Management and the efficiency of innovation: interactions between management characteristics
������ ������ � �����������A� '!�)� � � � � � � �
� �����*� +,����� �����*� +,����� �����*� +,����� �����*� +,�����
�������� -*.74///� -*---� -*.17///� -*---� -*..0///� -*---� -*.40///� -*---�
#&� -*--1//� -*-)1� -*--1//� -*-)7� -*--1//� -*-)0� -*--1//� -*-)7�
#&0� ,-*---//� -*-4.� ,-*---//� -*-1.� ,-*---//� -*-40� ,-*---//� -*-1-�
&#+6� ,-*)14� -*.37� � � -*).3� -*))0� � �
++� � � ,-*-17� -*144� � � -*--4� -*24.�
�&� -*-71� -*)-5� -*-11� -*4..� -*-75/� -*-50� -*-55//� -*-07�
'!�� -*--7� -*510� -*--3� -*547� -*--7� -*574� -*--.� -*573�
6�� -*-)3/� -*-33� -*-)1� -*)45� -*-)7/� -*-20� -*---� -*220�
�##+� -*-../� -*-.5� -*-.)/� -*-50� -*-.1/� -*-7.� -*-.4/� -*-34�
#8� ,-*-03/� -*-5-� ,-*-41//� -*-44� ,-*-03/� -*-5.� ,-*-41//� -*-44�
9�&� ,-*-45///� -*--7� ,-*-47//� -*-)-� ,-*-43///� -*--5� ,-*-43///� -*--5�
9�#:�� ,-*-4-� -*)53� ,-*-07� -*0.2� ,-*-02� -*0-1� ,-*-0.� -*074�
&!�0�;��*�����<����� ��=� ,-*)05///� -*--)� ,-*)).///� -*--1� ,-*)02///� -*--)� ,-*))-///� -*--7�
&!�4�;��*���������� ���>��(� ����?� (*=� ,-*-.-� -*057� ,-*-10� -*473� ,-*-.7� -*007� ,-*-14� -*4.7�
&!�1�;����������>���� ������� � � ��=� ,-*))3//� -*-))� ,-*-27//� -*-45� ,-*))1//� -*-)1� ,-*-53/� -*-7)�
&!�.�;���(�����>���������� � � ��=� ,-*-)1� -*5-1� -*-)2� -*31-� ,-*-))� -*5.4� -*-0)� -*3)0�
&!�7�;�������>�������(����=� -*-25� -*.7.� -*)34� -*4-5� -*)-0� -*..-� -*).-� -*433�
&#+6/�&� -*40.� -*0-0� � � � � � �
++/�&� � � -*))4/� -*-2)� � � � �
&#+6/6�� � � � � -*--5� -*5.-� � �
++/6�� � � � � � � -*-07� -*)71�
� � � � � � � � �
9���9 @�� ���� ,)01*435� � ,)0-*3.5� � ,)0.*)31� � ,)0)*0)3� �
'!�#�+�� ������ -*427� � -*424� � -*42.� � -*420� �
:� 11-� � 11-� � 11-� � 11-� �

53
Table VII. Moderating effects of managerial ownership
� 9�<������ ���<���� (� � ������� ���<���� (�
� �����*� +,����� �����*� +,�����
�������� -*12-///� -*---� -*307///� -*--.�
#&� -*--4///� -*--)� ,-*--)� -*340�
&#+6� -*042///� -*--7� -*-)4� -*204�
�&� -*-.2� -*0)5� -*)05/� -*-30�
'!�� -*-)5� -*741� ,-*-)3� -*321�
6�� -*-))� -*417� -*-4.//� -*-07�
�##+� -*-11� -*00)� -*-50� -*)-1�
#8� ,-*-03� -*)37� ,-*-)2� -*145�
9�&� ,-*-)3� -*444� ,-*-70///� -*--5�
9�#:�� ,-*-41� -*043� ,-*-4-� -*104�
&!�4�;��*�����<����� ��=� ,-*)43///� -*--7� ,-*)-5� -*)-4�
&!�1�;��*���������� ���>��(� ����?� (*=� ,-*-02� -*7-3� ,-*)-5� -*)51�
&!�)0�;����������>���� ������� � � ��=� ,-*)47//� -*-)3� ,-*-51� -*053�
&!�)4�;���(�����>���������� � � ��=� -*-70� -*427� ,-*))-� -*0.0�
&!�)1�;�������>�������(����=� -*))1� -*.)4� � �
� � � � �
9���� @�� ���� ,5.*52� � ,44*.-� �
'!�#�+�� ������ -*421� � -*1-.� �
:� 020� � )15� �
Note: Low managerial ownership sample: firms whose percentage of ordinary shared owned by the CEOs are smaller than 65 percent. High managerial ownership sample: firms whose percentage of ordinary shared owned by the CEOs are greater than 65 percent. Dependent variable: DEA1.

54
Table VIII. Moderating effects of industry technology environment
� �����*� +,����� �����*� +,�����
�������� -*.75///� -*---� -*.))///� -*---�
#&� -*--1///� -*--7� -*--1///� -*--7�
#&0� ,-*---//� -*-04� ,-*---//� -*-40�
&#+6� -*)2.//� -*-44� � �
++� � � -*-33//� -*-0)�
�&� -*-1)� -*413� -*-74� -*).)�
'!�� -*-)4� -*342� -*--2� -*5))�
6�� -*--3� -*..)� -*--1� -*30)�
�##+� -*-.1/� -*-74� -*-17� -*))-�
#8� ,-*-01� -*)00� ,-*-4-/� -*-.5�
9�&� ,-*-43///� -*--7� ,-*-45///� -*--7�
9�#:�� ,-*-40� -*)74� ,-*-05� -*00-�
&!�0�;��*�����<����� ��=� ,-*)03///� -*--)� ,-*))-///� -*--7�
&!�4�;��*���������� ���>��(� ����?� (*=� ,-*))1� -*0-3� ,-*-.1� -*..4�
&!�1�;����������>���� ������� � � ��=� ,-*))7//� -*-))� ,-*-2-//� -*-.-�
&!�.�;���(�����>���������� � � ��=� ,-*-71� -*.40� -*-1-� -*723�
&!�7�;�������>�������(����=� -*-03� -*55.� -*)41� -*13-�
#&/�6� ,-*--0/� -*-73� ,-*--0//� -*-42�
&#+6/�6� ,-*-.7� -*700� � �
++/�6� � � ,-*)42//� -*-44�
�&/�6� -*)13/� -*-..� -*)14/� -*-7.�
'!�/�6� ,-*-40� -*7..� ,-*--2� -*2--�
6�/�6� -*-40/� -*-27� -*-1-//� -*-17�
� � � � �
9���9 @�� ���� ,)0-*-43����� � ,))1*24.� �
'!�#�+�� ������ -*423� � -*421� �
:� 11-� � 11-� �
Note: Dependent variable: DEA1.

55
Figure 1

56
Figure 2
Sectoral Pattern of Innovative Efficiency
0.38
0.38
0.39
0.43
0.41
0.35
0.44
0.55
0.65
0.43
0.00 0.10 0.20 0.30 0.40 0.50 0.60 0.70
Light manufacturing
Manufacturing of raw materials
Manufacturing of electrical and optical equipment
Manufacturing of transport equipment
Manufacturing not elsew here classif ied
Transportation, storage and communication
Real estate, renting and business activities
Computer and related activities
Research and development
National average
Innovative efficiency (DEA1)
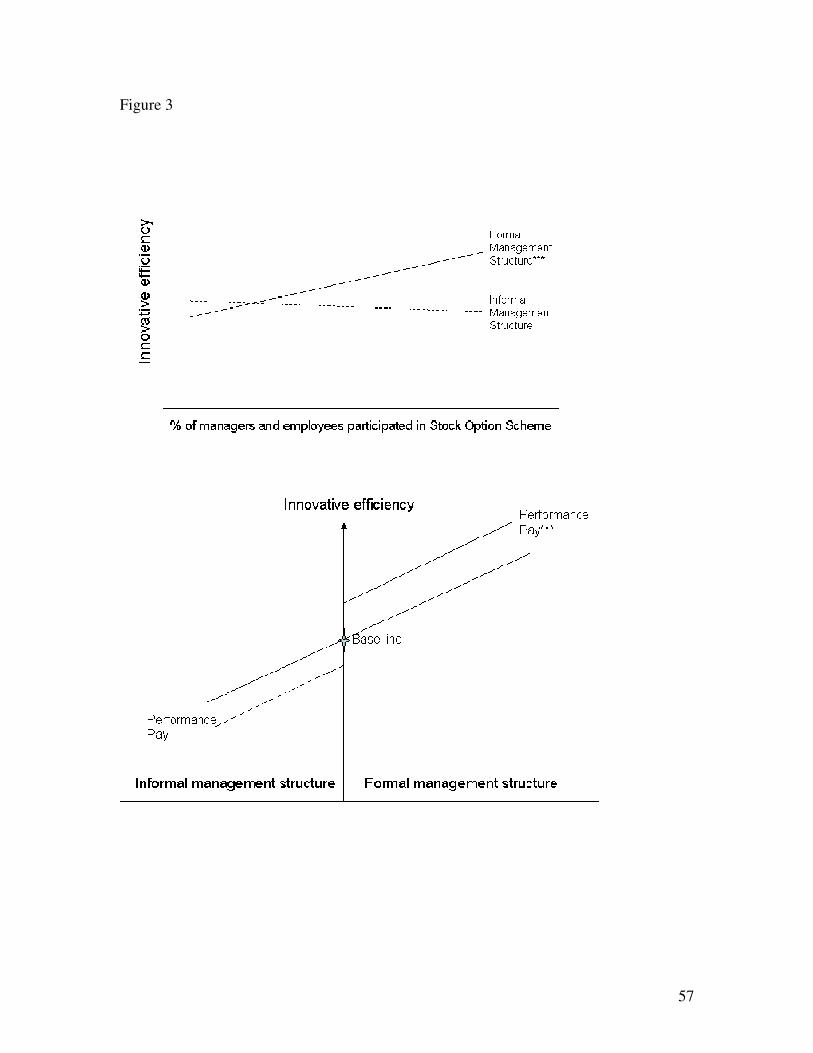
57
Figure 3

58
Appendix 1. DEA and SFA approaches for the estimation of innovative efficiency In the DEA approach, for a sample of n firms, if X and Y are the observations on
innovation inputs and outputs, assuming variable returns to scale, the firm’s innovative
efficiency score, θ , is the solution to the linear program problem,
λθ ,Max θ
st. 0≥+− λθ Yyi 0≥− λXxi 0≥iλ
� = 1iλ .,...,1 ni = (1)
where θ is a scalar and λ is an nx1 vector of constants. The efficiency score ranges from
0 to 1. If θ k = 1 and all slacks are zero, the kth firm is deemed to be technically efficient
(Cooper et al., 2000).
In the SFA approach, assuming a particular production functional form, technical
inefficiency is modelled as a one-sided error term. Assuming a knowledge production
function as follows:
)exp()( uvxfy −= (2)
where y is innovation output, x is a vector of basic innovation inputs. The stochastic
production frontier is )exp()( vxf , where v is a random disturbance that capture the
effects of statistical noise and is distributed as ),0( 2vN σ ; u is a one side error term
representing a variety of features that reflect efficiency. u is independent of v and 0≥u ,
with certain distribution assumptions, e.g., half-normal and exponential distribution. The
technical efficiency (TE) relative to the stochastic frontier is thus defined as
TE )exp()exp()(
uvxf
y −== (3)

59
1 About 3000 raw ideas are needed to produce 50 patent applications and, ultimately, one
commercial success (Stevens & Burley, 1997).
2 The weight is 1 for full-time staff and 0.5 for part-time staff.
3 This method, however, is also subject to several limitations. For example, the model will
be affected by measurement error and multicolinearity between the independent
variables. Spurious interaction effects may be found if moderated regression analysis is
used on data that in reality contain a non-linear relation between the dependent variable
and one of the independent variables (Busemeyer and Jones, 1983; Shepperd, 1991;
Celderman, 2000). As suggested by literature review that there is likely to be a non-linear
relationship between managerial ownership and firm performance, following Celderman
(2000) we introduced a quadratic term of managerial ownership into the model to reduce
the problem.
4 Although correlations among independent variables were generally small, the
association between firm size and management structure is 0.59. To ensure
multicollinearity is not a problem, we conducted the same analyses reported dropping
each of these two variables in successive regression equations. Results did not change,
indicating the correlation between firm size and management structure does not bias the
results.
5 We have also experimented with the DEA analysis using different weights. The
estimated results do not appear to be significantly different.

60
6 The inflection point is calculated as the derivative of innovative efficiency with respect
of managerial ownership.
7 The marginal effects of each Tobit model are not reported in the Tables.
Related Documents