CA SRI LANKA CURRICULUM 2015 KE2 Management Accounting Information (English) Additional Study Support Material This document is designed to use as an additional study support material. Students are advised to refer the content in the study text and the additional study support material under each chapter. The students who have already purchased the “Executive Level KE2 – Management Accounting Information” study text are also advised to refer this study support material.

Welcome message from author
This document is posted to help you gain knowledge. Please leave a comment to let me know what you think about it! Share it to your friends and learn new things together.
Transcript
C A S R I L A N K A C U R R I C U L U M 2 0 1 5
KE2 Management Accounting Information
(English)
A d d i t i o n a l S t u d y S u p p o r t M a t e r i a l
This document is designed to use as an additional study support material. Students are
advised to refer the content in the study text and the additional study support material
under each chapter. The students who have already purchased the “Executive Level KE2 –
Management Accounting Information” study text are also advised to refer this study
support material.
KE2 - Additional Study Support Material
2
All Rights Reserved
Contents KE2 Management Accounting Information Part A Fundamental Aspects of Cost Accounting
1 Introductory mathematics 3
4 Accounting for materials 14
6 Job, batch, contract and service costing 18
Part B Quantitative Aspects for Accounting
9 Normal distribution and sampling distributions 19
Part C Cost Accounting Systems
10 Accounting for overheads 28
11 Absorption, marginal and activity based costing 29
Part D Financial Mathematics for Business and Project Appraisal
Fundamentals
12 Financial mathematics for business 32
Part F Mathematics for Business Functions
16 Mathematics for business functions 34
Part G Budgeting and Forecasting
17 Budgetary control and budgetary systems 37
18 Forecasting and Preparing Budgets 44
KE2 - Additional Study Support Material
3
All Rights Reserved
Additional Practice Questions to Chapter 1
Introductory Mathematics
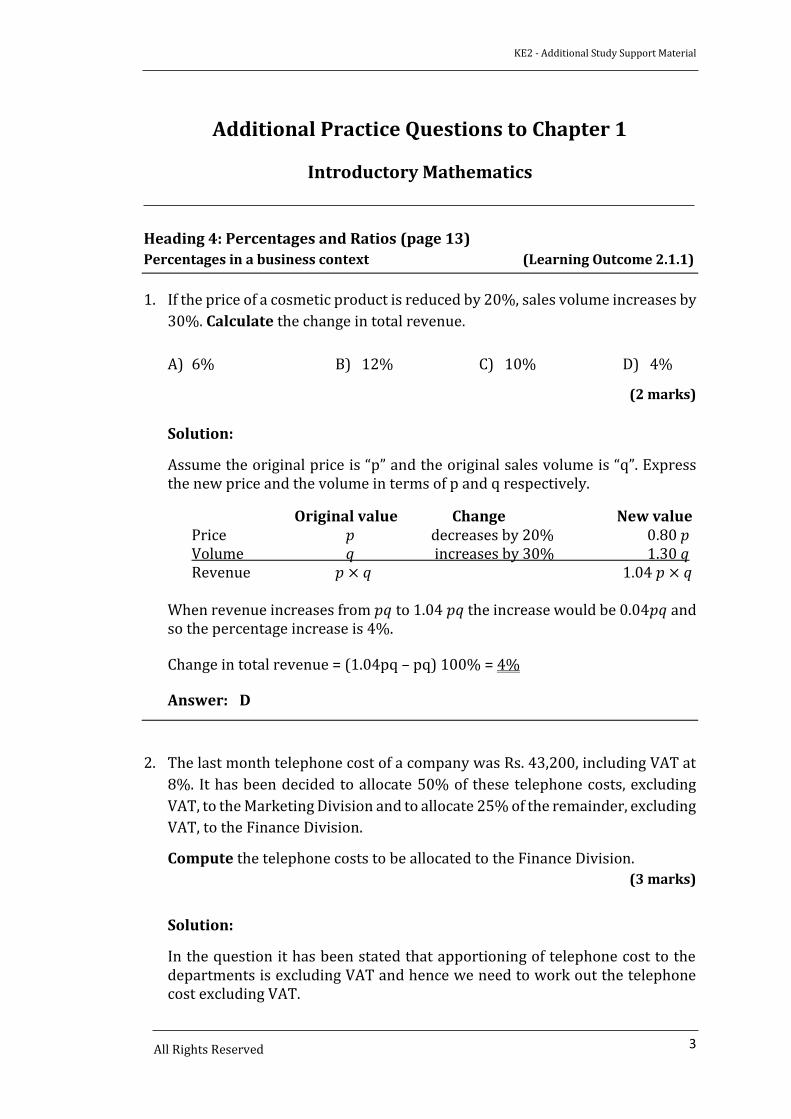
Heading 4: Percentages and Ratios (page 13)
Percentages in a business context (Learning Outcome 2.1.1)
1. If the price of a cosmetic product is reduced by 20%, sales volume increases by
30%. Calculate the change in total revenue.
A) 6% B) 12% C) 10% D) 4%
(2 marks) Solution:
Assume the original price is “p” and the original sales volume is “q”. Express the new price and the volume in terms of p and q respectively.
Original value Change New value Price 𝑝 decreases by 20% 0.80 𝑝 Volume 𝑞 increases by 30% 1.30 𝑞 Revenue 𝑝 × 𝑞 1.04 𝑝 × 𝑞
When revenue increases from 𝑝𝑞 to 1.04 𝑝𝑞 the increase would be 0.04𝑝𝑞 and so the percentage increase is 4%.
Change in total revenue = (1.04pq – pq) 100% = 4% Answer: D
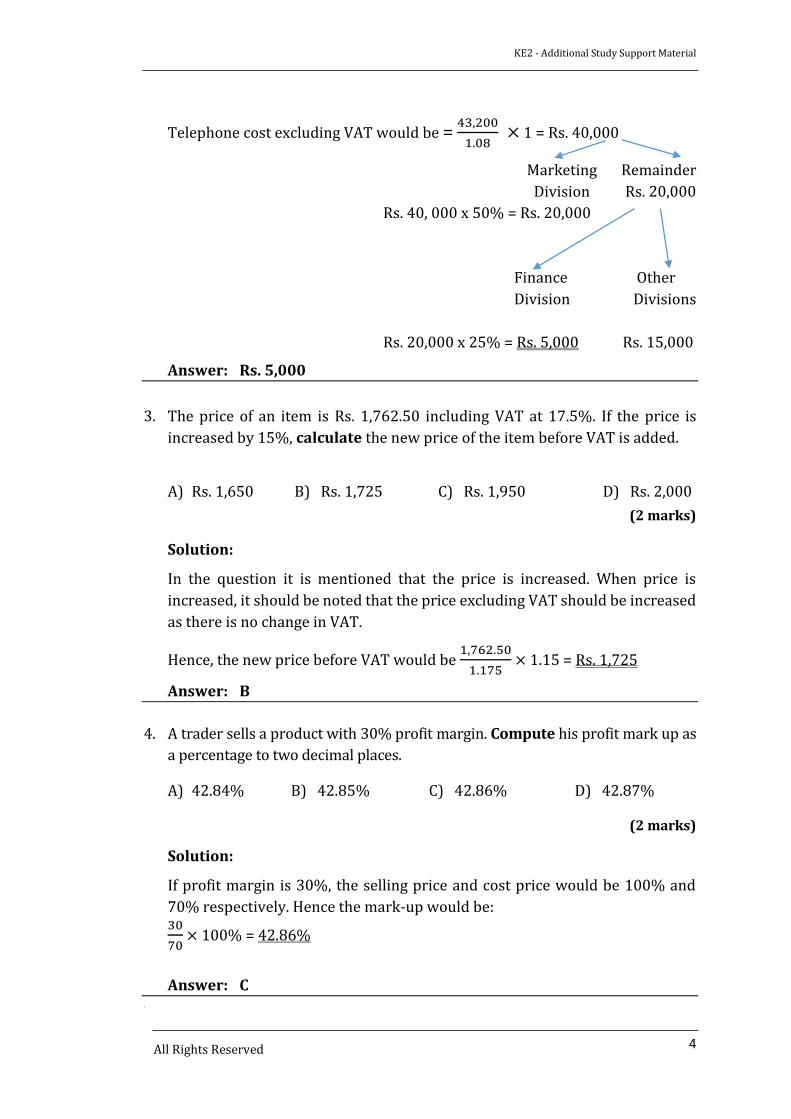
2. The last month telephone cost of a company was Rs. 43,200, including VAT at
8%. It has been decided to allocate 50% of these telephone costs, excluding
VAT, to the Marketing Division and to allocate 25% of the remainder, excluding
VAT, to the Finance Division.
Compute the telephone costs to be allocated to the Finance Division.
(3 marks)
Solution:
In the question it has been stated that apportioning of telephone cost to the departments is excluding VAT and hence we need to work out the telephone cost excluding VAT.
KE2 - Additional Study Support Material
4
All Rights Reserved
Telephone cost excluding VAT would be = 43,200
1.08 × 1 = Rs. 40,000
Marketing Remainder
Division Rs. 20,000
Rs. 40, 000 x 50% = Rs. 20,000
Finance Other
Division Divisions
Rs. 20,000 x 25% = Rs. 5,000 Rs. 15,000
Answer: Rs. 5,000
3. The price of an item is Rs. 1,762.50 including VAT at 17.5%. If the price is
increased by 15%, calculate the new price of the item before VAT is added.
A) Rs. 1,650 B) Rs. 1,725 C) Rs. 1,950 D) Rs. 2,000
(2 marks)
Solution:
In the question it is mentioned that the price is increased. When price is
increased, it should be noted that the price excluding VAT should be increased
as there is no change in VAT.
Hence, the new price before VAT would be 1,762.50
1.175 × 1.15 = Rs. 1,725
Answer: B
4. A trader sells a product with 30% profit margin. Compute his profit mark up as
a percentage to two decimal places.
A) 42.84% B) 42.85% C) 42.86% D) 42.87%
(2 marks)
Solution:
If profit margin is 30%, the selling price and cost price would be 100% and
70% respectively. Hence the mark-up would be: 30
70 × 100% = 42.86%
Answer: C \
KE2 - Additional Study Support Material
5
All Rights Reserved
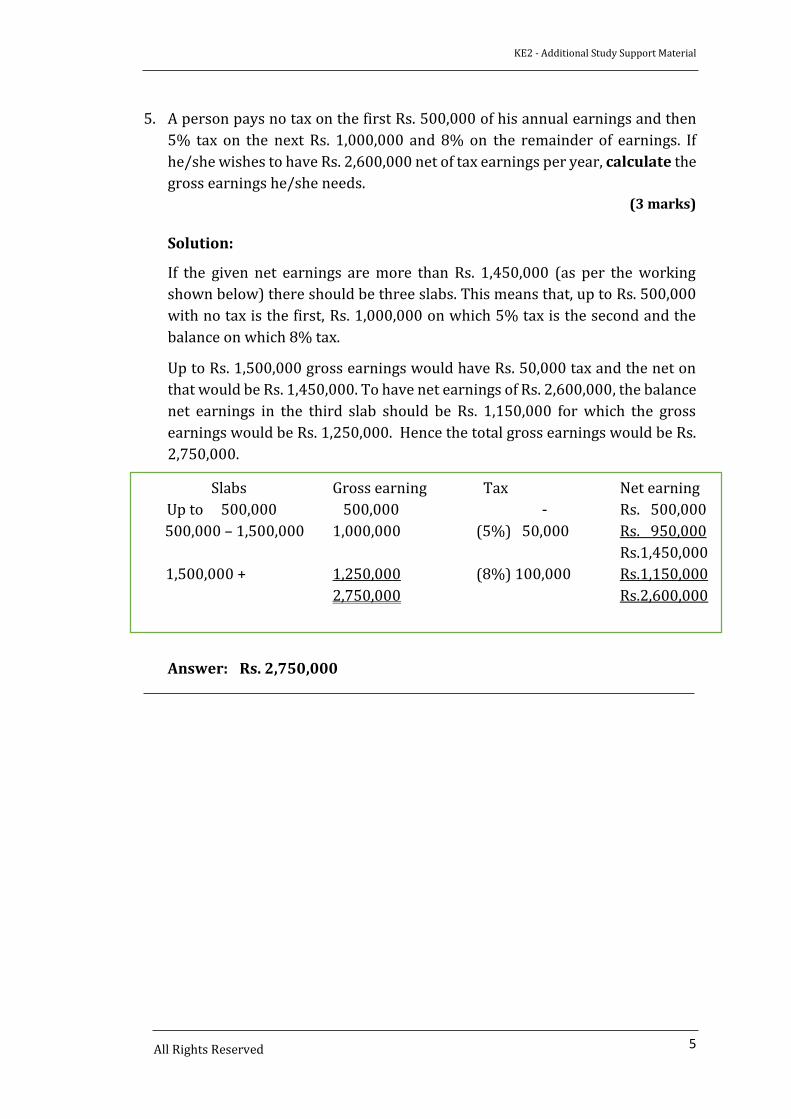
5. A person pays no tax on the first Rs. 500,000 of his annual earnings and then
5% tax on the next Rs. 1,000,000 and 8% on the remainder of earnings. If
he/she wishes to have Rs. 2,600,000 net of tax earnings per year, calculate the
gross earnings he/she needs.
(3 marks)
Solution:
If the given net earnings are more than Rs. 1,450,000 (as per the working
shown below) there should be three slabs. This means that, up to Rs. 500,000
with no tax is the first, Rs. 1,000,000 on which 5% tax is the second and the
balance on which 8% tax.
Up to Rs. 1,500,000 gross earnings would have Rs. 50,000 tax and the net on
that would be Rs. 1,450,000. To have net earnings of Rs. 2,600,000, the balance
net earnings in the third slab should be Rs. 1,150,000 for which the gross
earnings would be Rs. 1,250,000. Hence the total gross earnings would be Rs.
2,750,000.
Answer: Rs. 2,750,000
Slabs Gross earning Tax Net earning
Up to 500,000 500,000 - Rs. 500,000
500,000 – 1,500,000 1,000,000 (5%) 50,000 Rs. 950,000
Rs.1,450,000
1,500,000 + 1,250,000 (8%) 100,000 Rs.1,150,000
2,750,000 Rs.2,600,000
KE2 - Additional Study Support Material
6
All Rights Reserved
Heading 4: Percentages and Ratios (Page 13)
Percentages in a business context (Learning Outcome.2.1.1)
Chapter 6 , Heading 3: Batch costing (Page 214)
Specific and continuous order costing (Learning Outcome.1.4.2)
A company produces a device which is used in the manufacture of vehicles. It
consists of ONE control unit made in India and TWO reinforced aluminium
linkages supplied by a local supplier. Instrumentation and assembly are carried
out at its factory in Sri Lanka. Other details are given below:
Control Units from India
The company buys in consignments of 500 units. The control price is Indian
rupees 5,000, but subject to a quantity discount of 10% for orders of at least 500.
Freight charges for a consignment of 500 units are Indian rupees of 750,000.
Insurance is payable at the rate of 2% of the gross sum insured; the gross sum
insured equals the cost of units plus freight. After landing in the Colombo Port,
transport costs to the factory are Rs. 200,000, plus Rs. 300 per unit carried.
(Exchange rate: Indian Rupee 1 = Sri Lankan Rupees 2.50)
Aluminium linkages from a local supplier
These are bought from a local supplier at Rs. 6,350 per unit.
Production at the factory
Other materials used in production cost Rs. 750 per device. Within the factory each
production run of 500 devices requires 400 hours in Instrumentation at Rs. 1,200
per hour, 250 hours in Production at Rs. 800 per hour and 95 hours in Inspection
at Rs. 1,000 per hour. On the average, Inspection which is the final stage rejects
5% of the devices as defective; these are worthless.
At the current planned production levels, fixed costs are absorbed into production
by adding 40% to the overall cost of labour and other materials incurred at the
factory. The selling price to the trade is set so that its gross profit is 20% of the
total amount invoiced to customers.
Required:
(a) Prepare the statement of total cost of production.
(b) Calculate the unit price to the trade of the device.
(Total 10 marks)
(Learning Outcome 2.1.1)
KE2 - Additional Study Support Material
7
All Rights Reserved
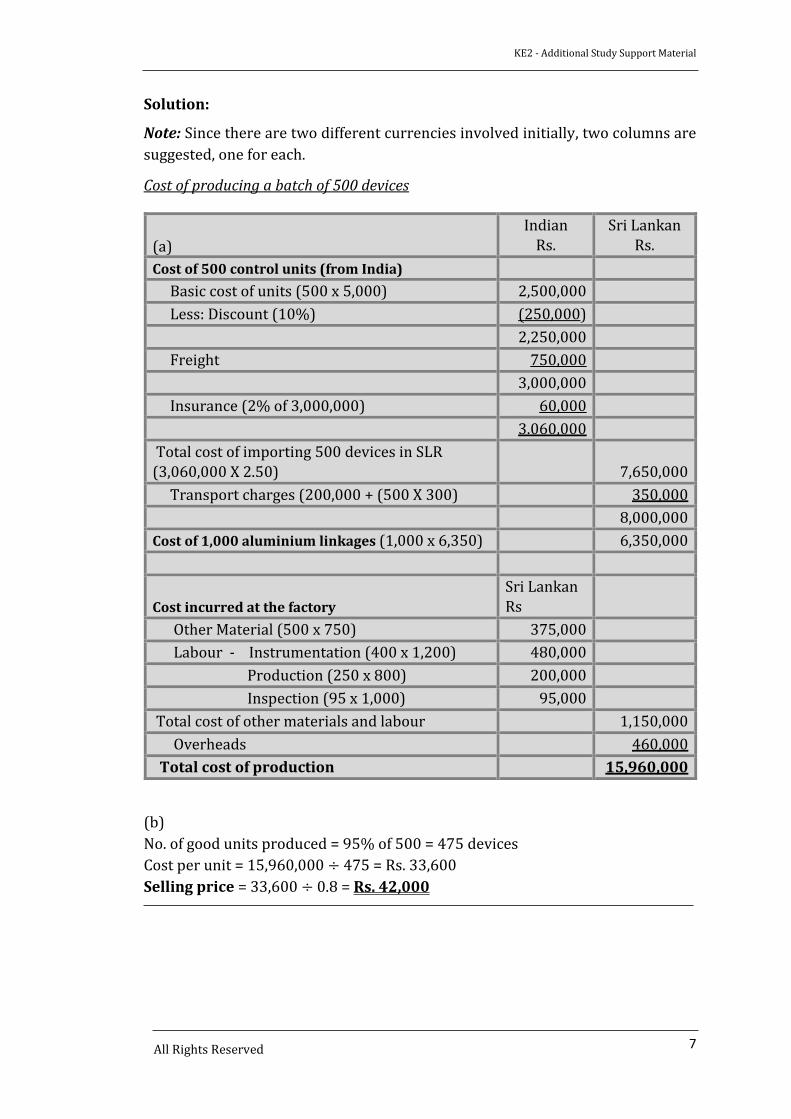
Solution:
Note: Since there are two different currencies involved initially, two columns are
suggested, one for each.
Cost of producing a batch of 500 devices
(b)
No. of good units produced = 95% of 500 = 475 devices
Cost per unit = 15,960,000 ÷ 475 = Rs. 33,600
Selling price = 33,600 ÷ 0.8 = Rs. 42,000
(a)
Indian Rs.
Sri Lankan Rs.
Cost of 500 control units (from India)
Basic cost of units (500 x 5,000) 2,500,000
Less: Discount (10%) (250,000)
2,250,000
Freight 750,000
3,000,000
Insurance (2% of 3,000,000) 60,000
3.060,000
Total cost of importing 500 devices in SLR (3,060,000 X 2.50) 7,650,000
Transport charges (200,000 + (500 X 300) 350,000
8,000,000
Cost of 1,000 aluminium linkages (1,000 x 6,350) 6,350,000
Cost incurred at the factory
Sri Lankan Rs
Other Material (500 x 750) 375,000
Labour - Instrumentation (400 x 1,200) 480,000
Production (250 x 800) 200,000
Inspection (95 x 1,000) 95,000
Total cost of other materials and labour 1,150,000
Overheads 460,000
Total cost of production 15,960,000
KE2 - Additional Study Support Material
8
All Rights Reserved
Heading 6: Errors (page 28)
Variations under addition, subtraction, multiplication
and division (Learning Outcome 2.2.1)
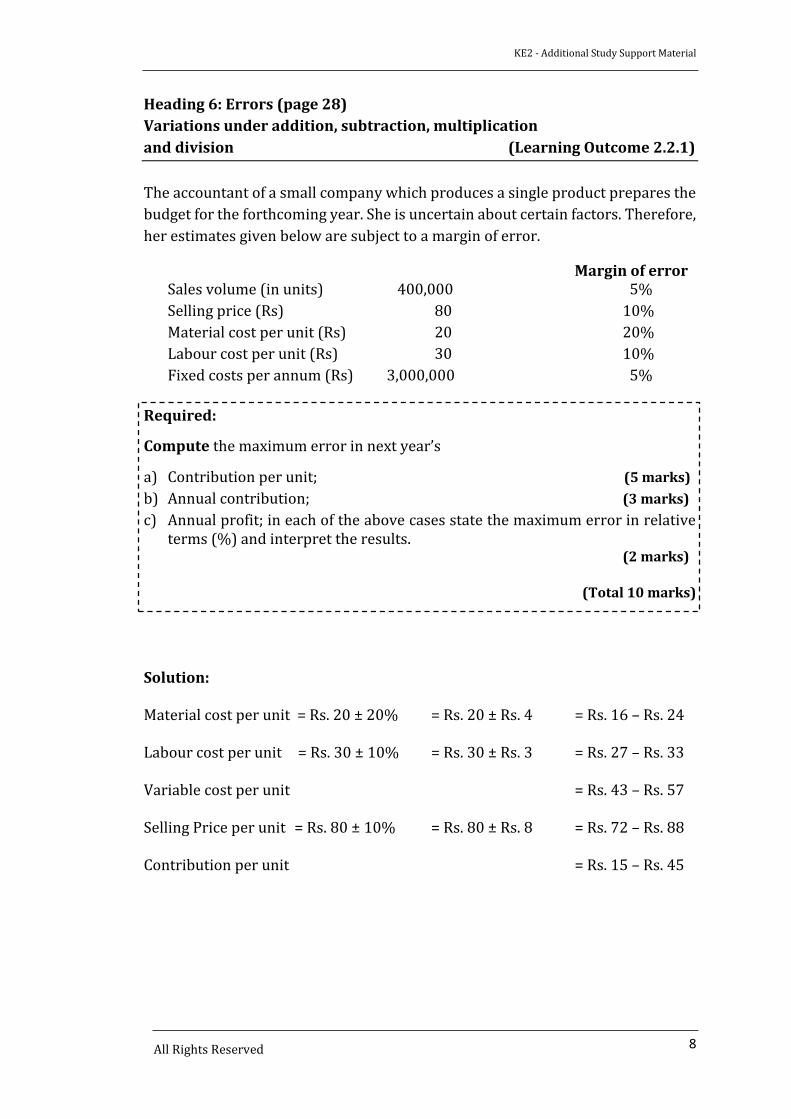
The accountant of a small company which produces a single product prepares the
budget for the forthcoming year. She is uncertain about certain factors. Therefore,
her estimates given below are subject to a margin of error.
Margin of error Sales volume (in units) 400,000 5%
Selling price (Rs) 80 10%
Material cost per unit (Rs) 20 20%
Labour cost per unit (Rs) 30 10%
Fixed costs per annum (Rs) 3,000,000 5%
Required:
Compute the maximum error in next year’s
a) Contribution per unit; (5 marks)
b) Annual contribution; (3 marks)
c) Annual profit; in each of the above cases state the maximum error in relative terms (%) and interpret the results.
(2 marks)
(Total 10 marks)
Solution:
Material cost per unit = Rs. 20 ± 20% = Rs. 20 ± Rs. 4 = Rs. 16 – Rs. 24
Labour cost per unit = Rs. 30 ± 10% = Rs. 30 ± Rs. 3 = Rs. 27 – Rs. 33
Variable cost per unit = Rs. 43 – Rs. 57
Selling Price per unit = Rs. 80 ± 10% = Rs. 80 ± Rs. 8 = Rs. 72 – Rs. 88
Contribution per unit = Rs. 15 – Rs. 45

KE2 - Additional Study Support Material
9
All Rights Reserved
a) The contribution per unit can also be expressed as follows:
Contribution per unit = Rs. 15 - Rs. 45 = Rs. 30 ± Rs. 15 = Rs. 30 ± 50%
Interpretation: When the selling price is subject to ± 10% error and the
material and labour cost per unit is subject to errors of ± 20%
and ± 10% respectively then contribution per unit will be
subject to an error of ± 50%.
b) Sales Volume = 400,000 ± 5% = 400,000 ± 20,000
= [380,000 – 420,000] units
Contribution per unit = [Rs. 15 – Rs. 45]
Hence total contribution would be between = Rs. 5,700,000 – Rs. 18,900,000
= Rs. 12,000,000 ± 6,900,000
= Rs. 12,000,000 ± 57.5%
The maximum error in total contribution would be 57.5%.
Interpretation: When the sales volume is subject to ± 5% error and the
contribution per unit is subject to an error of ±50% error,
the maximum error in the total contribution would be ±
57.5%.
c) Total contribution is [Rs. 5,700,000 – Rs. 18,900,000]
Fixed overhead = Rs. 3,000,000 ± 5%
= Rs. 3,000,000 ± Rs. 150,000
= Rs. 2,850,000 – Rs. 3,150,000
Hence, annual profit would be [Rs. 2,550,000 - Rs. 16,050,000]. This could be
expressed as Rs. 9,000,000 ± Rs. 7,050,000 = Rs. 9,000,000 ± 78.3%
Interpretation: When all the variations happen in the factors as
mentioned in the question the profit will be subject to a
maximum error of ± 78.3%.
KE2 - Additional Study Support Material
10
All Rights Reserved
Heading 7: The arithmetic mean
Heading 8: The Variance and the standard deviation
Mean and standard deviation (Learning Outcome 2.3.1)
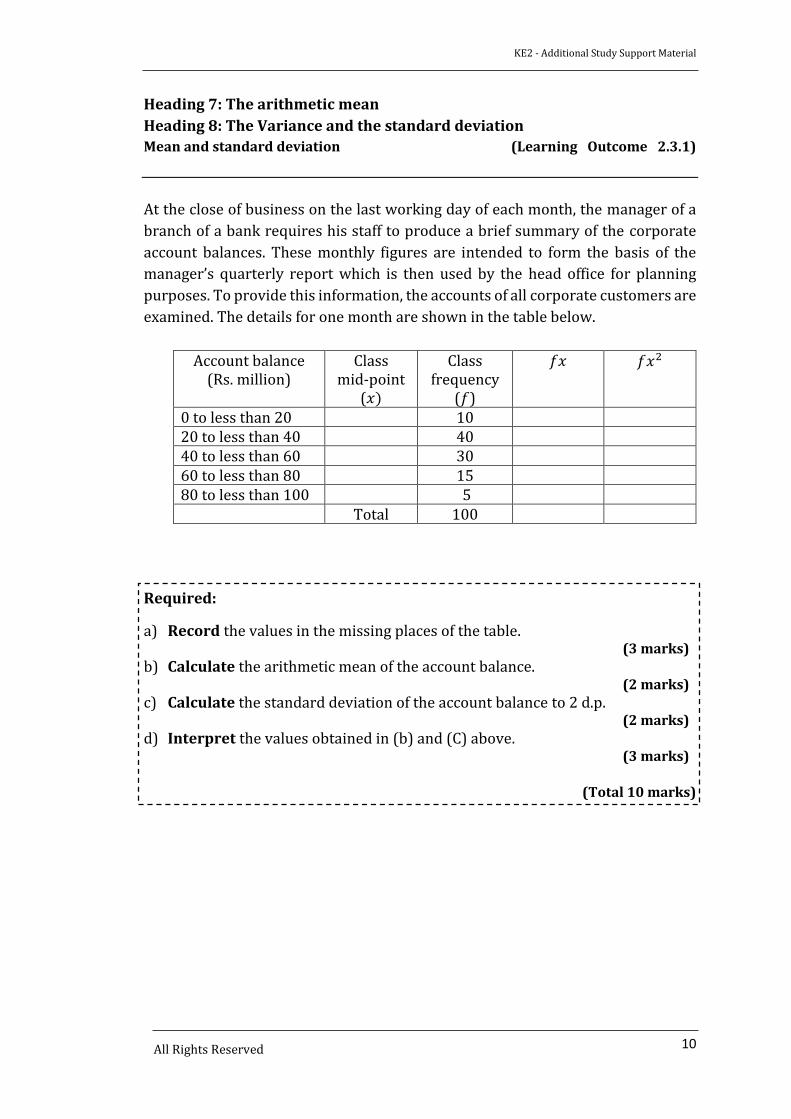
At the close of business on the last working day of each month, the manager of a
branch of a bank requires his staff to produce a brief summary of the corporate
account balances. These monthly figures are intended to form the basis of the
manager’s quarterly report which is then used by the head office for planning
purposes. To provide this information, the accounts of all corporate customers are
examined. The details for one month are shown in the table below.
Account balance (Rs. million)
Class mid-point
(𝑥)
Class frequency
(𝑓)
𝑓𝑥 𝑓𝑥2
0 to less than 20 10 20 to less than 40 40 40 to less than 60 30 60 to less than 80 15 80 to less than 100 5
Total 100
Required:
a) Record the values in the missing places of the table. (3 marks)
b) Calculate the arithmetic mean of the account balance. (2 marks)
c) Calculate the standard deviation of the account balance to 2 d.p. (2 marks)
d) Interpret the values obtained in (b) and (C) above. (3 marks)
(Total 10 marks)
KE2 - Additional Study Support Material
11
All Rights Reserved
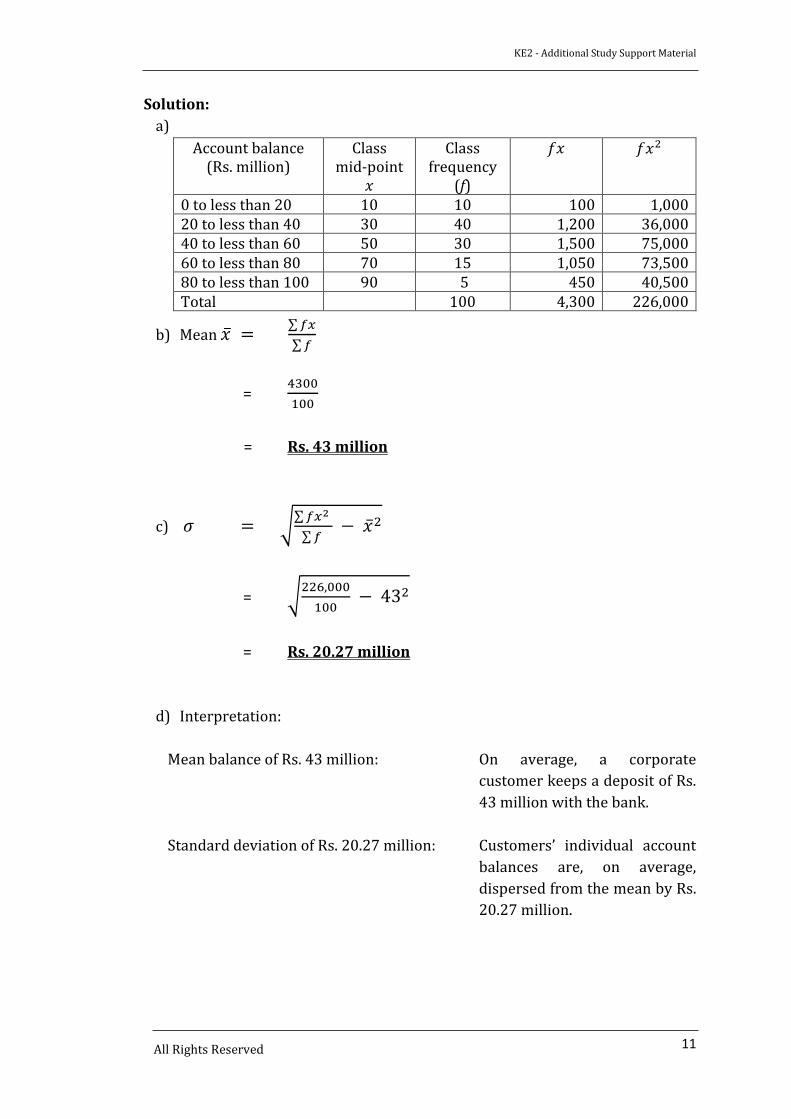
Solution:
a)
Account balance (Rs. million)
Class mid-point
𝑥
Class frequency
(f)
𝑓𝑥 𝑓𝑥2
0 to less than 20 10 10 100 1,000 20 to less than 40 30 40 1,200 36,000 40 to less than 60 50 30 1,500 75,000 60 to less than 80 70 15 1,050 73,500 80 to less than 100 90 5 450 40,500 Total 100 4,300 226,000
b) Mean �̅� = ∑ 𝑓𝑥
∑ 𝑓
= 4300
100
= Rs. 43 million
c) 𝜎 = √∑ 𝑓𝑥2
∑ 𝑓 − �̅�2
= √226,000
100 − 432
= Rs. 20.27 million
d) Interpretation:
Mean balance of Rs. 43 million: On average, a corporate
customer keeps a deposit of Rs.
43 million with the bank.
Standard deviation of Rs. 20.27 million: Customers’ individual account
balances are, on average,
dispersed from the mean by Rs.
20.27 million.
KE2 - Additional Study Support Material
12
All Rights Reserved
Heading 10: Indices terminology (page 42)
Heading 13: Weighted index numbers (page 47)
Index numbers (Learning Outcome .2.6.1)
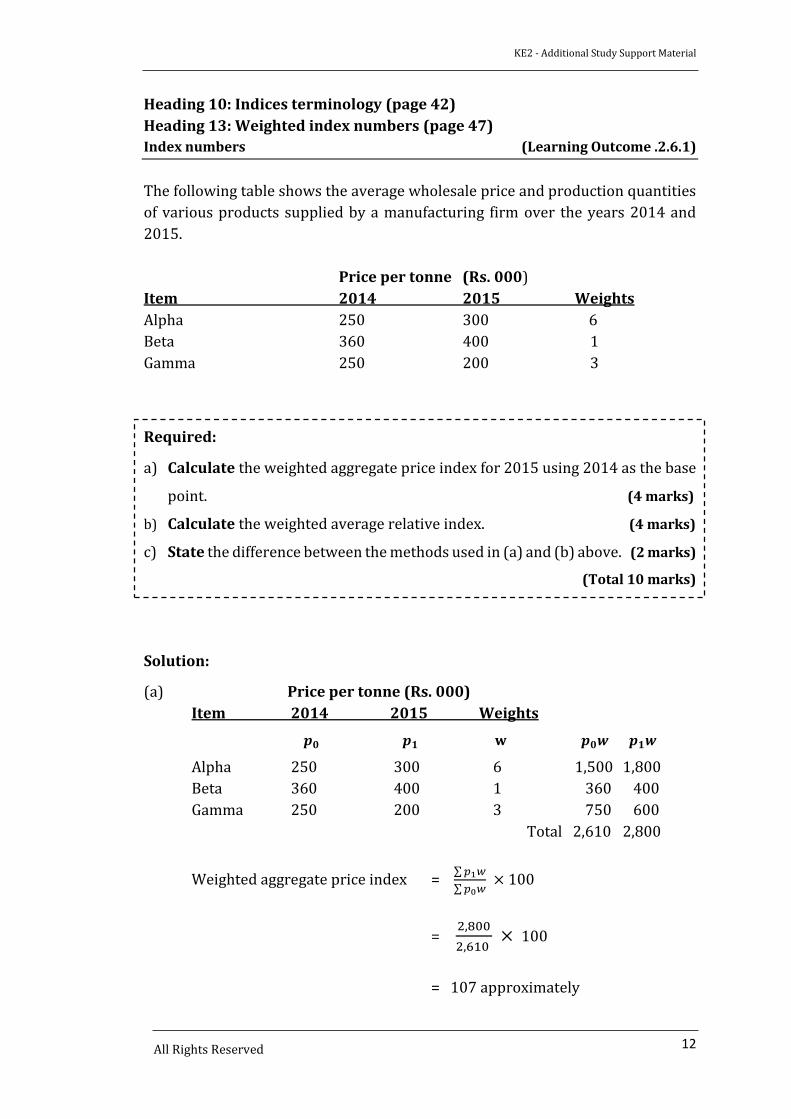
The following table shows the average wholesale price and production quantities
of various products supplied by a manufacturing firm over the years 2014 and
2015.
Price per tonne (Rs. 000)
Item 2014 2015 Weights
Alpha 250 300 6
Beta 360 400 1
Gamma 250 200 3
Required:
a) Calculate the weighted aggregate price index for 2015 using 2014 as the base
point. (4 marks)
b) Calculate the weighted average relative index. (4 marks)
c) State the difference between the methods used in (a) and (b) above. (2 marks)
(Total 10 marks)
Solution:
(a) Price per tonne (Rs. 000)
Item 2014 2015 Weights
𝒑𝟎 𝒑𝟏 w 𝒑𝟎𝒘 𝒑𝟏𝒘
Alpha 250 300 6 1,500 1,800
Beta 360 400 1 360 400
Gamma 250 200 3 750 600
Total 2,610 2,800
Weighted aggregate price index = ∑ 𝑝1𝑤
∑ 𝑝0𝑤 × 100
= 2,800
2,610 × 100
= 107 approximately

KE2 - Additional Study Support Material
13
All Rights Reserved
The overall increase in prices, using the standard weights given, between
2014 and 2015, is approximately 7% (107% - 100%).
b) Price relative weights
𝑰 = 𝒑𝟏
𝒑𝟎 × 100 w I × w
Alpha 300
250 × 100 = 120 6 720
Beta 400
360× 100 = 111 1 111
Gamma 200
250 ×100 = 80 3 240
10 1,071
Weighted average of price relative = 1,071
10 = 107 (approximately)
The overall increase in prices, using the standard weights provided,
between 2014 and 2015, is approximately 7%.
c) The difference between weighted aggregate method and the weighted
average method is, the weights are provided first and then the index is
calculated. Whereas with the weighted average method, the index is
calculated first and then the weights are provided.
Both show the overall increase in prices, taking the weights given into
account.
KE2 - Additional Study Support Material
14 All Rights Reserved
Additional Practice Questions to Chapter 4
Accounting for Materials
Heading 7: FIFO (first in, first out)Heading 8: LIFO (last in, first out)Heading 9: AVCO (cumulative weighted average pricing)Material and inventory control - Profit differences under FIFO, LIFO and AVCO (Learning Outcome.1.2.2)
David Ltd is a dealer in washing machines. Assume that it buys and sells a
standard size of machines. On 01 April 2015, the company had a stock of 240
machines at purchase price of Rs. 40,000. During the month of April 2015, the
shipments received and the quantities issued to retailers are summarised and given below:
Shipments received (Purchased):
06 April 250 machines at Rs. 41,000
12 April 200 machines at Rs. 41,500
22 April 270 machines at Rs. 42,000
Issued to retailers (Sales):
09 April 400 machines at Rs. 50,000
27 April 500 machines at Rs. 50,000
David Ltd had a stock of 60 washing machines in the store at the end of April 2015.
Required:
Calculate the profits obtained for the month of April 2015 under the stock
valuation methods of FIFO, LIFO and the monthly AVCO.
(Total 10 marks)
KE2 - Additional Study Support Material
15 All Rights Reserved
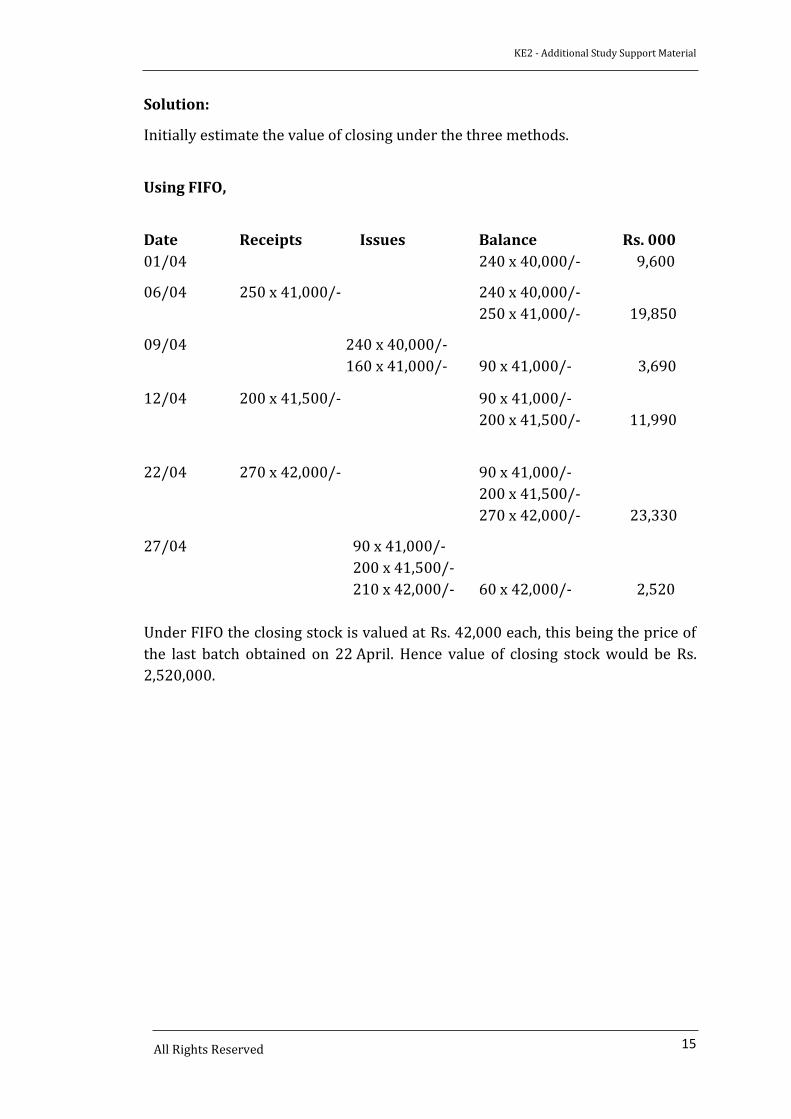
Solution:
Initially estimate the value of closing under the three methods.
Using FIFO,
Date Receipts Issues Balance Rs. 000
01/04 240 x 40,000/- 9,600
06/04 250 x 41,000/- 240 x 40,000/-
250 x 41,000/- 19,850
09/04 240 x 40,000/-
160 x 41,000/- 90 x 41,000/- 3,690
12/04 200 x 41,500/- 90 x 41,000/-
200 x 41,500/- 11,990
22/04 270 x 42,000/- 90 x 41,000/-
200 x 41,500/-
270 x 42,000/- 23,330
27/04 90 x 41,000/-
200 x 41,500/-
210 x 42,000/- 60 x 42,000/- 2,520
Under FIFO the closing stock is valued at Rs. 42,000 each, this being the price of
the last batch obtained on 22 April. Hence value of closing stock would be Rs.
2,520,000.
KE2 - Additional Study Support Material
16 All Rights Reserved
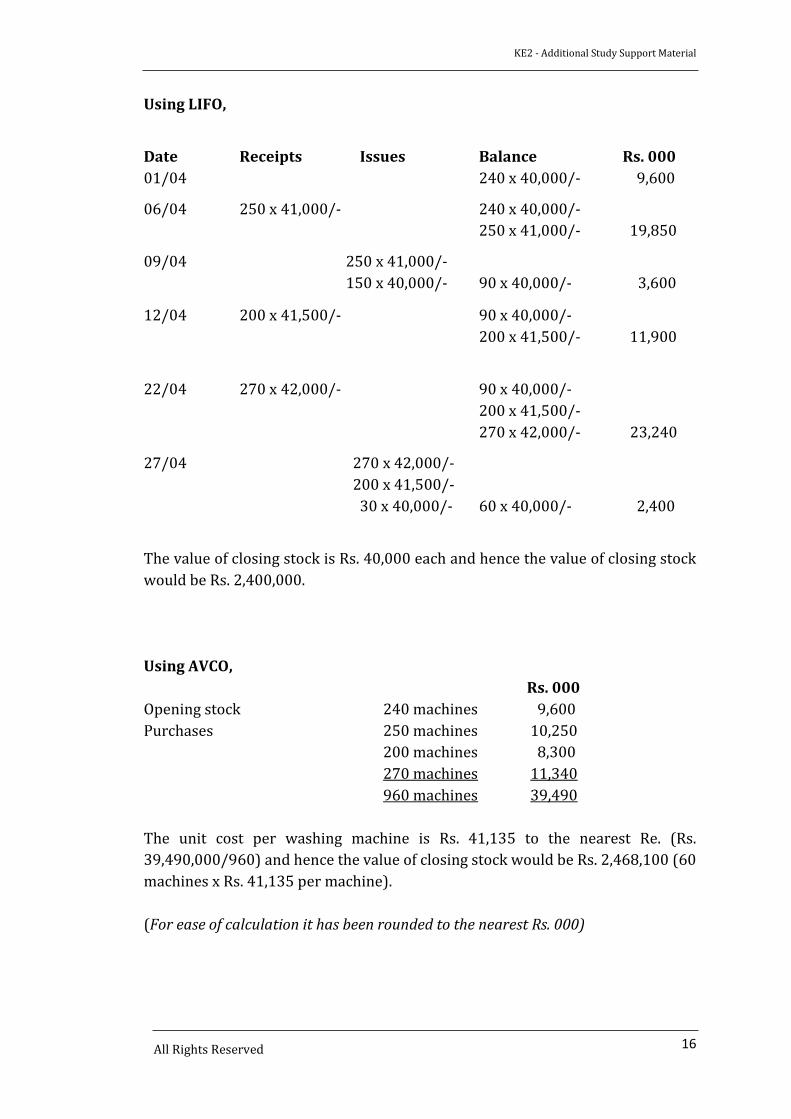
Using LIFO,
Date Receipts Issues Balance Rs. 000
01/04 240 x 40,000/- 9,600
06/04 250 x 41,000/- 240 x 40,000/-
250 x 41,000/- 19,850
09/04 250 x 41,000/-
150 x 40,000/- 90 x 40,000/- 3,600
12/04 200 x 41,500/- 90 x 40,000/-
200 x 41,500/- 11,900
22/04 270 x 42,000/- 90 x 40,000/-
200 x 41,500/-
270 x 42,000/- 23,240
27/04 270 x 42,000/-
200 x 41,500/-
30 x 40,000/- 60 x 40,000/- 2,400
The value of closing stock is Rs. 40,000 each and hence the value of closing stock
would be Rs. 2,400,000.
Using AVCO,
Rs. 000
Opening stock 240 machines 9,600
Purchases 250 machines 10,250
200 machines 8,300
270 machines 11,340
960 machines 39,490
The unit cost per washing machine is Rs. 41,135 to the nearest Re. (Rs.
39,490,000/960) and hence the value of closing stock would be Rs. 2,468,100 (60
machines x Rs. 41,135 per machine).
(For ease of calculation it has been rounded to the nearest Rs. 000)
KE2 - Additional Study Support Material
17 All Rights Reserved
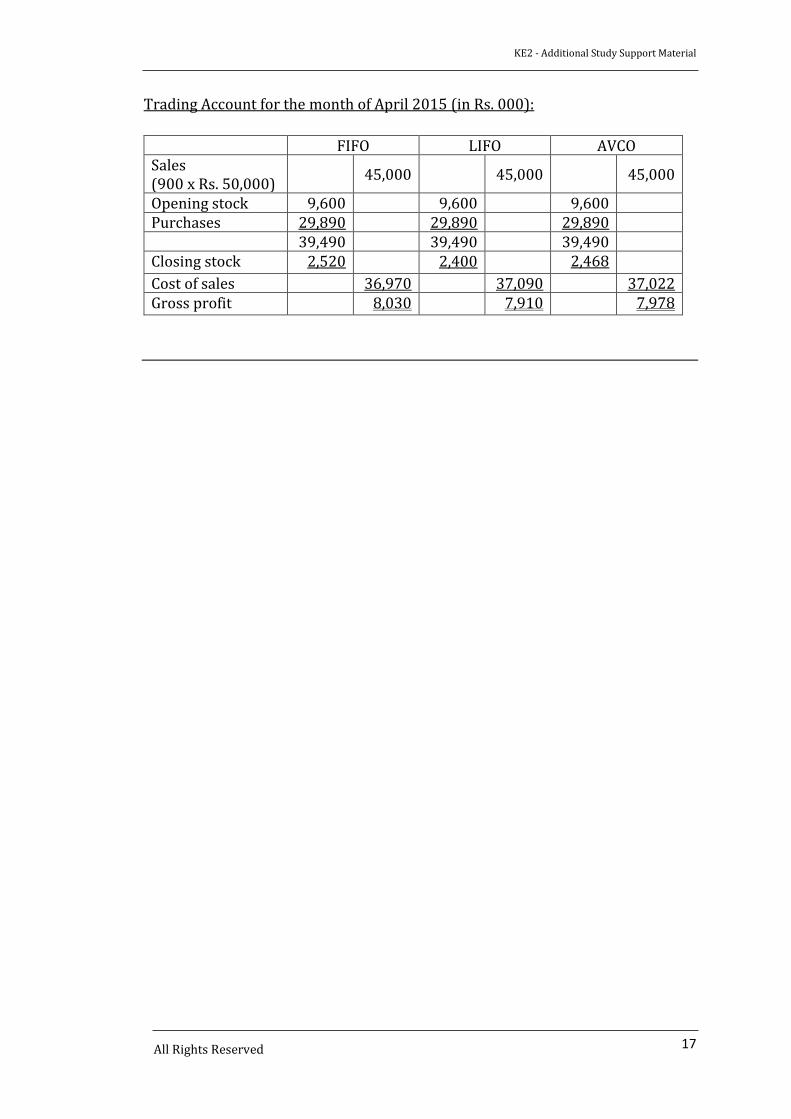
Trading Account for the month of April 2015 (in Rs. 000):
FIFO LIFO AVCO Sales (900 x Rs. 50,000)
45,000 45,000 45,000
Opening stock 9,600 9,600 9,600
Purchases 29,890 29,890 29,890
39,490 39,490 39,490
Closing stock 2,520 2,400 2,468
Cost of sales 36,970 37,090 37,022
Gross profit 8,030 7,910 7,978
KE2 - Additional Study Support Material
18
All Rights Reserved
Additional Practice Questions to Chapter 6
Job, batch, contract and service costing
Heading 4: Contract costing (Page 216)
Specific and continuous order costing (Learning Outcome 1.4.2)
A contract has been signed by a company for Rs. 8 million during the financial year
2015/2016. The contractor incurs Rs. 3.6 million during the year and expects to
incur another Rs. 2.4 million to complete the job. The customer has agreed to pay
80% of jobs approved and certified. Calculate the profit to be recognised.
A) Rs. 1.20 million B) Rs. 1.50 million C) Rs. 1.80 million D) Rs. 2 million
(2 marks)
Solution:
Estimated profit = Contract price – {Expenditure incurred up to the point + Expected
amount to be incurred in the balance period}
= 8 – {3.6 + 2.4} = Rs. 2 million
Profit to be recognised = 2 × 3.6
6 = Rs. 1.2 million
Note: Customer’s agreement to pay only 80% of the jobs approved and certified is
ignored in computation of profit as per LKAS 11.
Answer: A
KE2 - Additional Study Support Material
19
All Rights Reserved
Additional Practice Questions to Chapter 9
Normal Distribution and Sampling Distributions
Sub Heading 6.4: Estimation of parameters: Confidence intervals (Page 325)
Sampling technique – Confidence interval (Learning Outcome 2.5.1)
1. The Municipal Council of a city is considering how it should change a derelict
site to a peoples’ leisure centre. Three proposals have been put forward by its
board members, for which the Council decides to ascertain people’s opinion
through a sample survey. The sample includes 900 people of the city
population. Preferences expressed by the sample are as follows:
Number of people
Public Park 360
Performing Art Centre 240
Cricket Ground 300
Required:
i) Calculate the confidence interval
&
ii) Interpret the results in each case in the situations given below.
a) The proportion of the city population that prefers the Cricket Ground at
95% level.
(5 marks)
b) The number of the city population that prefers the Performing Art Centre
at 99% level, assuming a city population of 500,000 people.
(5 marks)
(Total 10 marks)
Solution:
a) i. Confidence interval for population proportion at any given level is
𝑃 = 𝑝 ± 𝑍 × 𝑆𝐸𝑃
The proportion of people in the sample who prefer Cricket Grounds is 300
900 = ⅓.
𝑝 = ⅓ SEP =√⅓×⅔
900 = 0.0157 (approx.) and at 95% level Z = 1.96
𝑃 = 𝑝 ± 𝑍 × 𝑆𝐸𝑃
KE2 - Additional Study Support Material
20
All Rights Reserved
P = ⅓ ± 1.96 × 0.0157
Hence, P = 0.303 – 0.364
P = 30.3% - 36.4%
ii.Interpretation: We are 95% certain that between 30.3% and 36.4% of the
city population prefer a Cricket Ground built in that land.
b) 𝑖. 𝑃 = 𝑝 ± 𝑍 × 𝑆𝐸𝑃
The proportion of people in the sample that prefers Performing Art Centre
is 240
900 =
4
15.
𝑝 = 4
15 SEP =√
4
15 ×
11
15
900 = 0.0147 (approx.) and at 99% level Z = 2.58
𝑃 = 𝑝 ± 𝑍 × 𝑆𝐸𝑃
P = 4
15 ± 2.58 × 0.0147
Hence, P = 0.2287 – 0.3046
P = 22.87% - 30.46%
So, the number of people in the city population that prefers Performing Art
Centre is as follows:
= (22.87% - 30.46%) × 500,000
= 114,350 – 152,300
ii.Interpretation: We are 99% sure that between 114,350 and 152,300 in the city
population go for Performing Art Centre.
KE2 - Additional Study Support Material
21
All Rights Reserved
2. The number of enquiries received at a five star hotel tend to be normally
distributed with a mean of 45 calls per hour with a standard deviation of 9 calls
per hour.
Required:
a) Calculate the probability that the average number of calls per hour over a
9-hour period is
(i) Over 50
(ii) Under 37
(iii) Between 42 and 49
(5 marks)
b) Calculate the 95% confidence limits for the average number of calls
received per hour over the 9-hour period.
(3 marks)
c) Explain, briefly the advantages and disadvantages of working with sample
data (2 marks)
(Total 10 marks)
Solution:
The sampling distribution of sample means is normally distributed with mean
(�̅�) = 45 calls and the standard error of mean (SEM) = 9
√9 = 3 calls
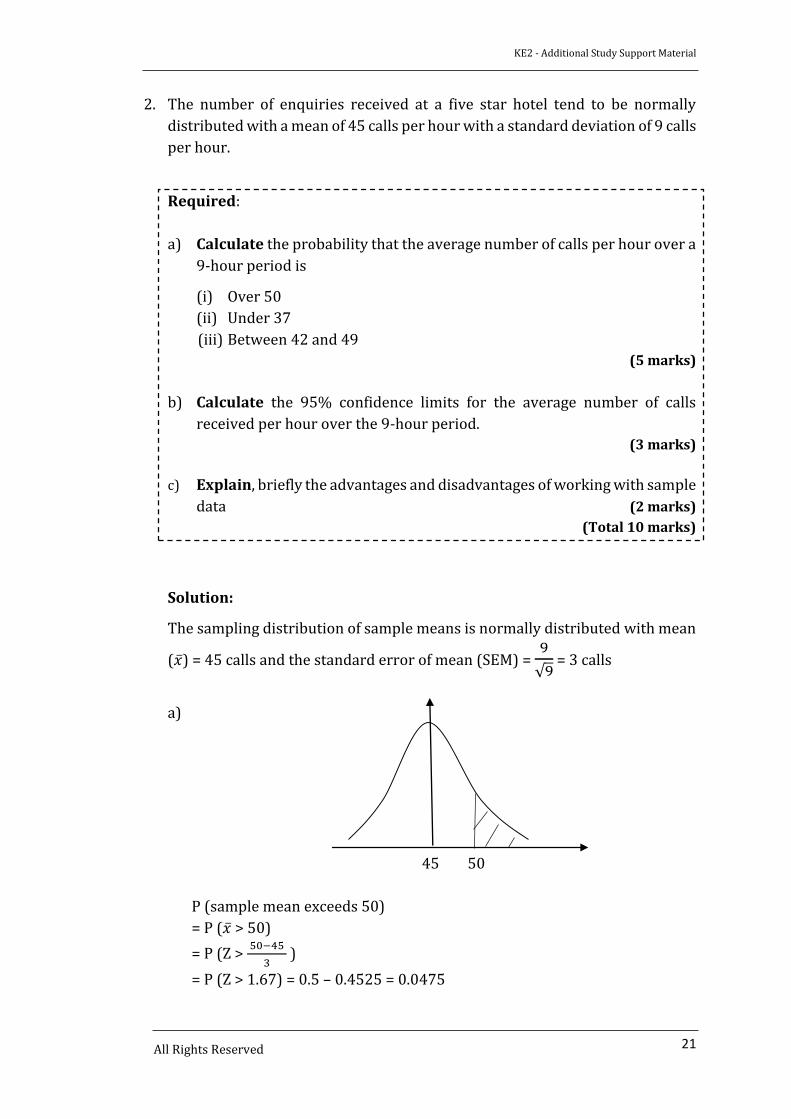
a)
45 50
P (sample mean exceeds 50)
= P (�̅� > 50)
= P (Z > 50−45
3 )
= P (Z > 1.67) = 0.5 – 0.4525 = 0.0475
KE2 - Additional Study Support Material
22
All Rights Reserved
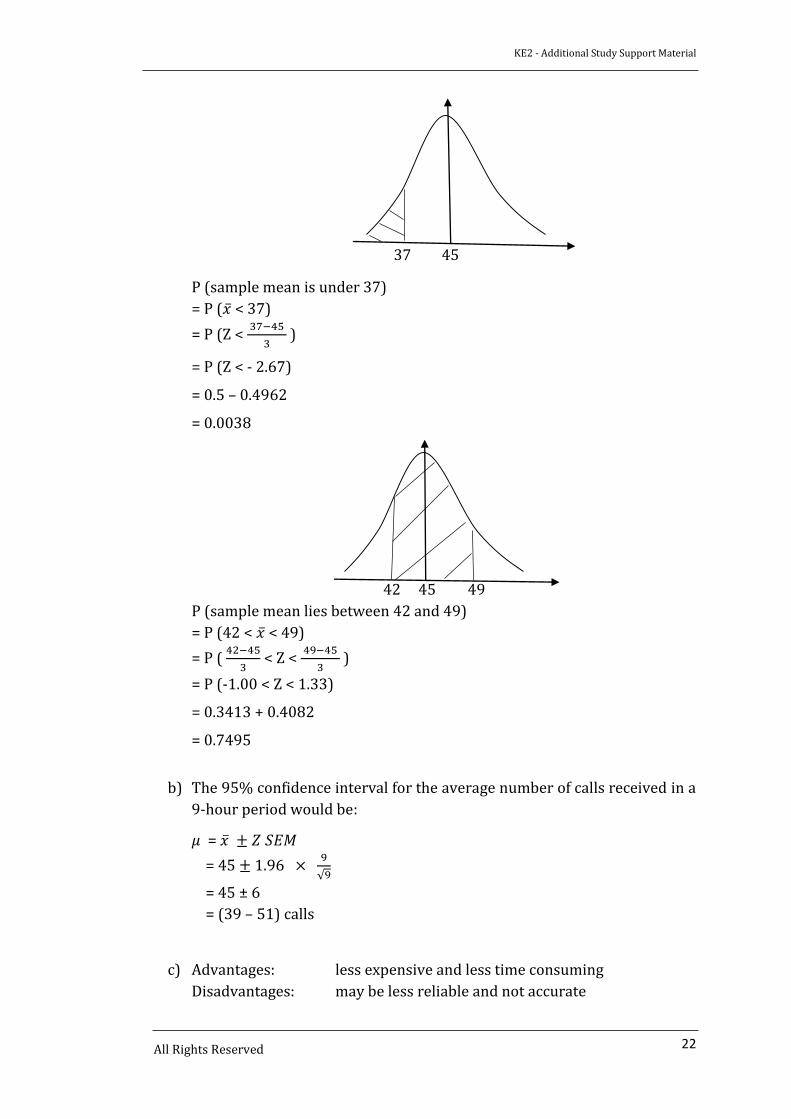
37 45
P (sample mean is under 37)
= P (�̅� < 37)
= P (Z < 37−45
3 )
= P (Z < - 2.67)
= 0.5 – 0.4962
= 0.0038
42 45 49
P (sample mean lies between 42 and 49)
= P (42 < �̅� < 49)
= P ( 42−45
3 < Z <
49−45
3 )
= P (-1.00 < Z < 1.33)
= 0.3413 + 0.4082
= 0.7495
b) The 95% confidence interval for the average number of calls received in a
9-hour period would be:
𝜇 = �̅� ± 𝑍 𝑆𝐸𝑀
= 45 ± 1.96 × 9
√9
= 45 ± 6
= (39 – 51) calls
c) Advantages: less expensive and less time consuming
Disadvantages: may be less reliable and not accurate

KE2 - Additional Study Support Material
23
All Rights Reserved
Sub Heading- 7.2 Breakeven analysis
Page No. 329
The word “point” needs to be corrected as “Profit”. Corrected profit/volume
chart is given below.
Profit
KE2 - Additional Study Support Material
24
All Rights Reserved
Sub Heading 6.4: Estimation of parameters: Confidence intervals (Page 325)
Sampling technique – Confidence interval (Learning Outcome 2.5.1)
Chapter 18
Forecasting for budgeting (Learning Outcome 7.2.2)
Lankan Automobiles PLC
Lankan Automobiles PLC operates a chain of garages in three major cities,
Colombo, Kandy and Galle. The company’s business include car hire, servicing,
repairs and petrol sales. It operates for 50 weeks a year, closing for one week in
December from Christmas to New Year and another one week in April for Sinhala
& Tamil New Year.
Car Servicing Departments
Lankan Automobiles PLC is concerned about the number of errors which seems to
be made on customers’ service bills in the pricing of replacement items such as oil
filters, engine oil, brake shoes, fan and A/C belts etc. The car servicing
departments of the three garages in Colombo, Kandy and Galle had an internal
audit last week. The internal audit included 100% investigation on 10% of its
invoices in the last month.
Some of the findings of the internal audit were as follows:
Colombo Kandy Galle
Number of invoices checked 144 64 49
Number of items on invoices 444 135 90
Number of items with error 40 15 10
Average (mean) value of error +Rs. 800 +Rs. 200 - Rs. 120
Standard deviation Rs. 84 Rs. 40 Rs. 35
(A plus mean value shows over charging and a minus under charging)
Hire Cars
Two types of fleets are used for this service, Maruti Suzuki Swift (S) and Maruti
Suzuki Ritz (R).
The new vehicle of both types cost the same. The company has 5 cars of each type.
The Management Accountant of the firm has already obtained a relationship
between the age (X) of a vehicle in months and its market value (Y) in Rs. million
for each type of fleet using the least squares method of regression analysis. Given
below are age and market value of each vehicle of each type.
KE2 - Additional Study Support Material
25
All Rights Reserved
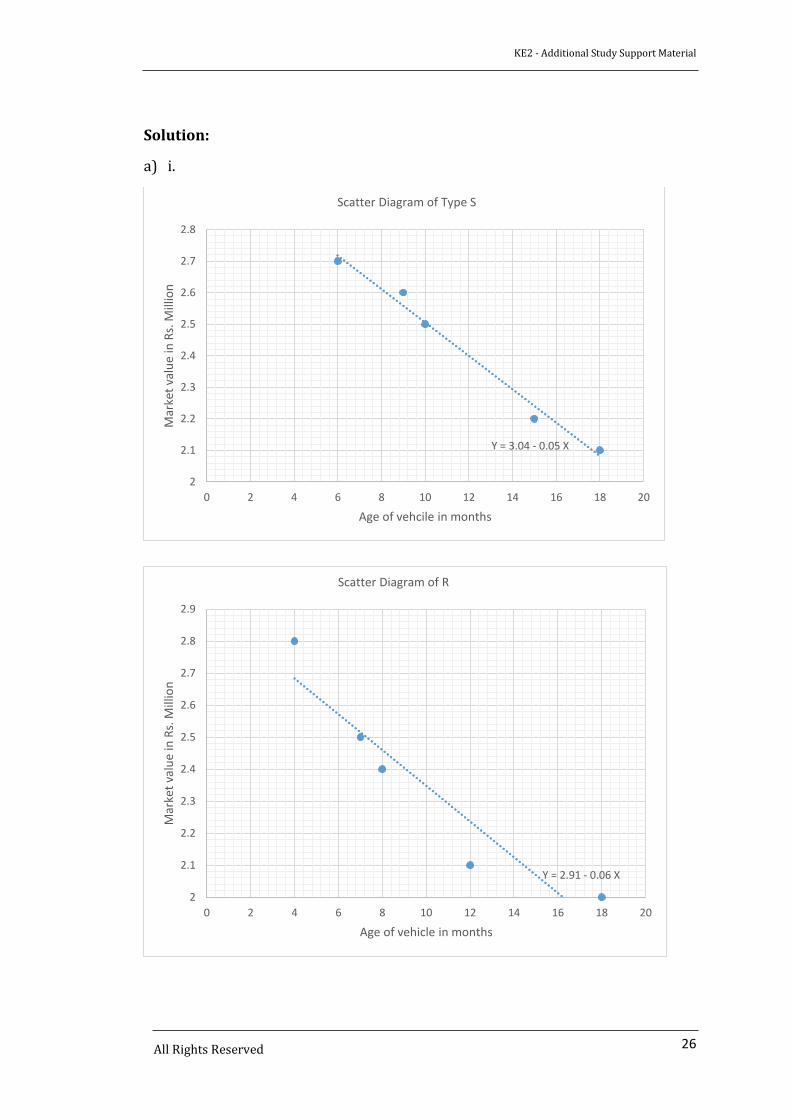
Type S:
Vehicle: 1 2 3 4 5
Age (X) in months 6 10 9 15 18
Market Value(Y) in 2.7 2.5 2.6 2.2 2.1
(Rs. Mn)
Correlation coefficient (r) = - 0.99
Regression equation: Y = 3.04 – 0.05 X
�̅� = 11.6
�̅� = 2.42
Type R:
Vehicle: 1 2 3 4 5
Age (X) in months 7 8 12 4 18
Market Value(Y) in 2.5 2.4 2.1 2.8 2.0
(Rs. Mn)
Correlation coefficient (r) = - 0.94
Regression equation: Y = 2.91 – 0.06 X
�̅� = 9.8
�̅� = 2.36
Required:
a) i. Graph the scatter diagrams of the two types of fleet (S and R), include the
regression lines.
ii. Interpret the regression lines and graphs.
(10 marks)
b) Assess, for the service departments, 95% confidence limits for the following
and interpret the results.
i. The percentage of items with error in the Colombo Garage.
(5 marks)
ii. The mean of monthly value of errors in the Galle Garage
(5 marks)
(Total 20 marks)
KE2 - Additional Study Support Material
26
All Rights Reserved
Solution:
a) i.
Y = 3.04 - 0.05 X
2
2.1
2.2
2.3
2.4
2.5
2.6
2.7
2.8
0 2 4 6 8 10 12 14 16 18 20
Mar
ket
valu
e in
Rs.
Mill
ion
Age of vehcile in months
Scatter Diagram of Type S
Y = 2.91 - 0.06 X
2
2.1
2.2
2.3
2.4
2.5
2.6
2.7
2.8
2.9
0 2 4 6 8 10 12 14 16 18 20
Mar
ket
valu
e in
Rs.
Mill
ion
Age of vehicle in months
Scatter Diagram of R
KE2 - Additional Study Support Material
27
All Rights Reserved
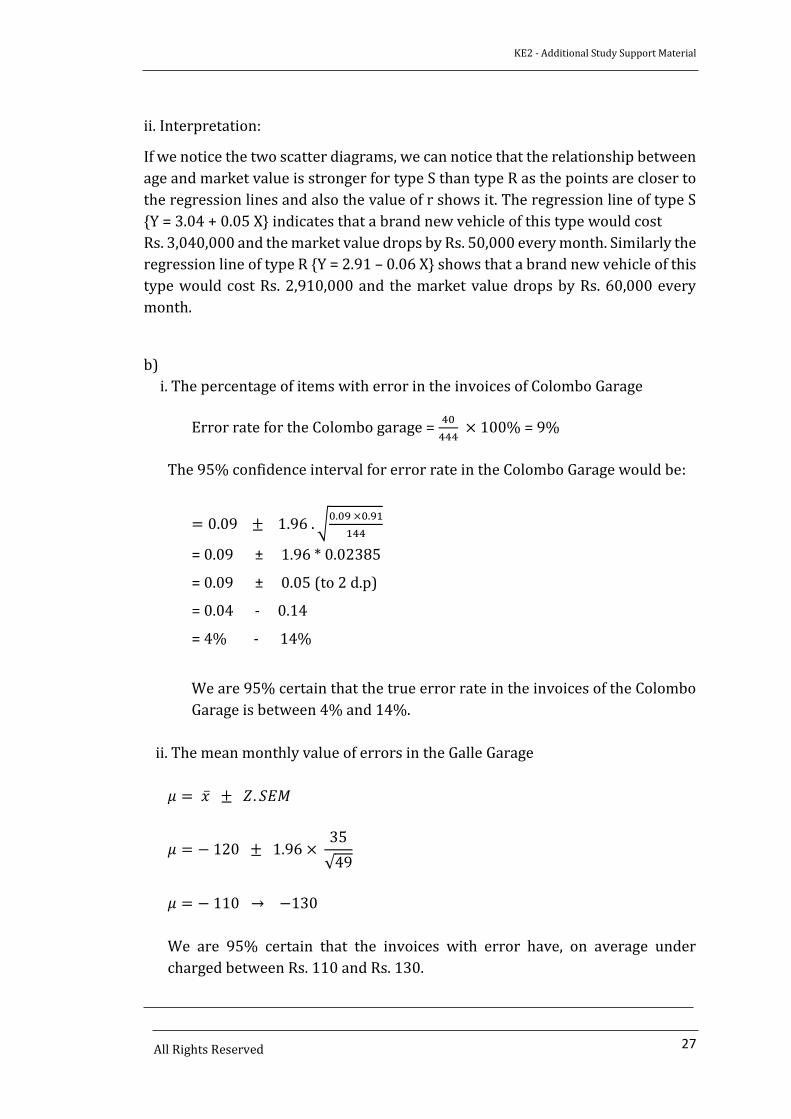
ii. Interpretation:
If we notice the two scatter diagrams, we can notice that the relationship between
age and market value is stronger for type S than type R as the points are closer to
the regression lines and also the value of r shows it. The regression line of type S
{Y = 3.04 + 0.05 X} indicates that a brand new vehicle of this type would cost
Rs. 3,040,000 and the market value drops by Rs. 50,000 every month. Similarly the
regression line of type R {Y = 2.91 – 0.06 X} shows that a brand new vehicle of this
type would cost Rs. 2,910,000 and the market value drops by Rs. 60,000 every
month.
b)
i. The percentage of items with error in the invoices of Colombo Garage
Error rate for the Colombo garage = 40
444 × 100% = 9%
The 95% confidence interval for error rate in the Colombo Garage would be:
= 0.09 ± 1.96 . √0.09 ×0.91
144
= 0.09 ± 1.96 * 0.02385
= 0.09 ± 0.05 (to 2 d.p)
= 0.04 - 0.14
= 4% - 14%
We are 95% certain that the true error rate in the invoices of the Colombo
Garage is between 4% and 14%.
ii. The mean monthly value of errors in the Galle Garage
𝜇 = �̅� ± 𝑍. 𝑆𝐸𝑀
𝜇 = − 120 ± 1.96 × 35
√49
𝜇 = − 110 → −130
We are 95% certain that the invoices with error have, on average under
charged between Rs. 110 and Rs. 130.
KE2 - Additional Study Support Material
28
All Rights Reserved
Additional Contents to Chapter 10
Accounting for Overheads
Heading 7: Over and under absorption of overheads (Page 364)
Absorption costing and marginal costing – Accounting of under/over-absorbed
overheads (Learning Outcome 3.1.2)
The accounting treatment of under/over absorption of overheads could be done
in one of the following ways:
a) Using supplementary rates:
It is calculated by dividing the under or over absorbed amount by the amount
absorbed and expressed as a percentage. Under absorption is adjusted by the
plus percentage and over absorption by the minus percentage.
b) By writing off to the Costing P & L Account:
The amount of under or over-absorption at the end of the accounting period is
transferred to the Costing Profit and Loss Account. Since the under or over
absorbed is transferred directly to Costing P & L, it will distort the value of
stock by the amount of under or over-absorption of overheads.
c) Under or over absorption will be taken in the accounts in to the subsequent
Year.
KE2 - Additional Study Support Material
29
All Rights Reserved
Additional Contents to Chapter 11
Absorption, marginal and activity based costing
Heading 7: Calculating product costs using ABC (Page 389) The steps involved in ABC (Learning Outcome 3.2.2)
An ABC system would be developed by analysing the causes of overhead costs as
a function of the support activities carried out within the organisation. These cost
drivers are then used to apportion costs in a meaningful way to the different
products produced in a multi-product organisation.
Steps involved with ABC approach:
Let us explain the steps with activity based costing approach taking a simple
example given below:
Example:
A company produces four products, AYE, BEE, CEE and DEE. The standard cost
card of the 4 products is shown below:
AYE BEE CEE DEE
Rs Rs Rs Rs
Material 1,200 1,500 800 1,000
Labour (at Rs. 600 per hour) 1,800 1,500 900 1,200
Production overhead absorbed 1,500 1,250 750 1,000
Standard cost per unit 4,500 4,250 2,450 3,200
Quantity produced (in units) 8,000 6,000 10,000 5,000
In the above cost card, production overhead has been absorbed on the basis of
labour hours.
The accountant of the firm is keen to introduce ABC since there is great diversity
in the product range. He has identified only two major cost pool for production
overhead. They are Machine set-ups and quality assurance for which the cost
drivers are identified as purchase orders and number of batches produced. The
cost associated with the above cost pools are as follows:
Quality assurance Rs. 12,000,000
Machine set-up Rs. 20,000,000
Rs. 32,000,000
KE2 - Additional Study Support Material
30 All Rights Reserved
Further relevant information on the four products are as follows:
AYE BEE CEE DEE
Number of purchase orders 800 700 900 600
Number of batches produced 80 40 80 50
Required:
Calculate the activity based standard cost of production per unit for the four
products.
Solution:
If we consider the steps mentioned in Chapter 11, heading 7
Step 1: Identify the major production related activities and the cost of
these activities
In this example the production related activities are quality assurance and machine set-up.
Step 2: Identify the cost drivers. It provides an explanation of the size of
the cost pool.
The cost drivers for the two production related activities have been
identified as number of purchase orders and number of batches
produced.
Step 3: Record the cost of each activity into cost pools
Cost pools are quality assurance and machine set-ups for which the
amounts are Rs. 12 million and Rs. 20 million.
Step 4: Charge support overheads to products on the basis of their usage of
the activity.
Calculate a cost driver rate for each activity cost pool in the same
way as an overhead is calculated with the traditional approach and
then use the rates to products to arrive at an activity based product
cost.
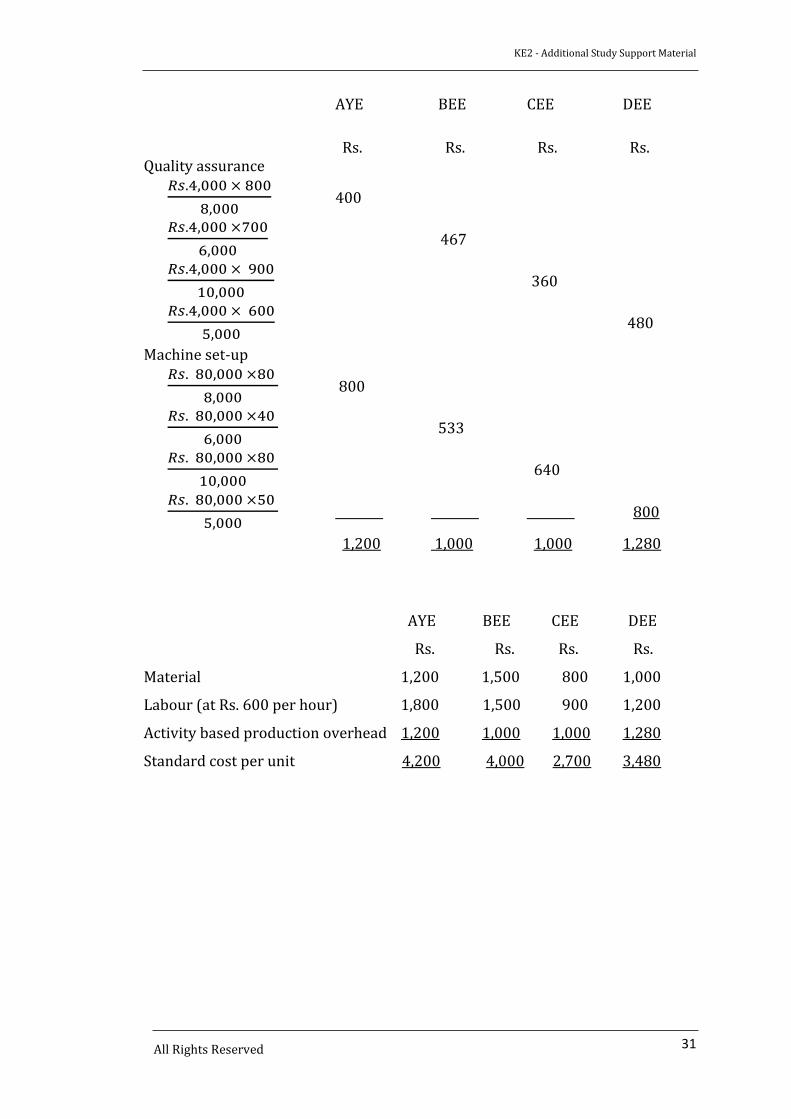
Cost driver rate:
- Quality assurance = 𝑅𝑠.12,000,000
3,000 𝑜𝑟𝑑𝑒𝑟𝑠= Rs. 4,000
- Machine set-up = 𝑅𝑠.20,000,000
250 𝑠𝑒𝑡−𝑢𝑝𝑠= Rs. 80,000
KE2 - Additional Study Support Material
31 All Rights Reserved
AYE BEE CEE DEE
Rs. Rs. Rs. Rs. Quality assurance
𝑅𝑠.4,000 × 800
8,000400
𝑅𝑠.4,000 ×700
6,000467
𝑅𝑠.4,000 × 900
10,000360
𝑅𝑠.4,000 × 600
5,000480
Machine set-up 𝑅𝑠. 80,000 ×80
8,000 800
𝑅𝑠. 80,000 ×40
6,000 533
𝑅𝑠. 80,000 ×80
10,000 640
𝑅𝑠. 80,000 ×50
5,000 800
1,200 1,000 1,000 1,280
AYE BEE CEE DEE
Rs. Rs. Rs. Rs.
Material 1,200 1,500 800 1,000
Labour (at Rs. 600 per hour) 1,800 1,500 900 1,200
Activity based production overhead 1,200 1,000 1,000 1,280
Standard cost per unit 4,200 4,000 2,700 3,480
KE2 - Additional Study Support Material
32 All Rights Reserved
Additional Practice Questions to Chapter 12
Financial Mathematics for Business
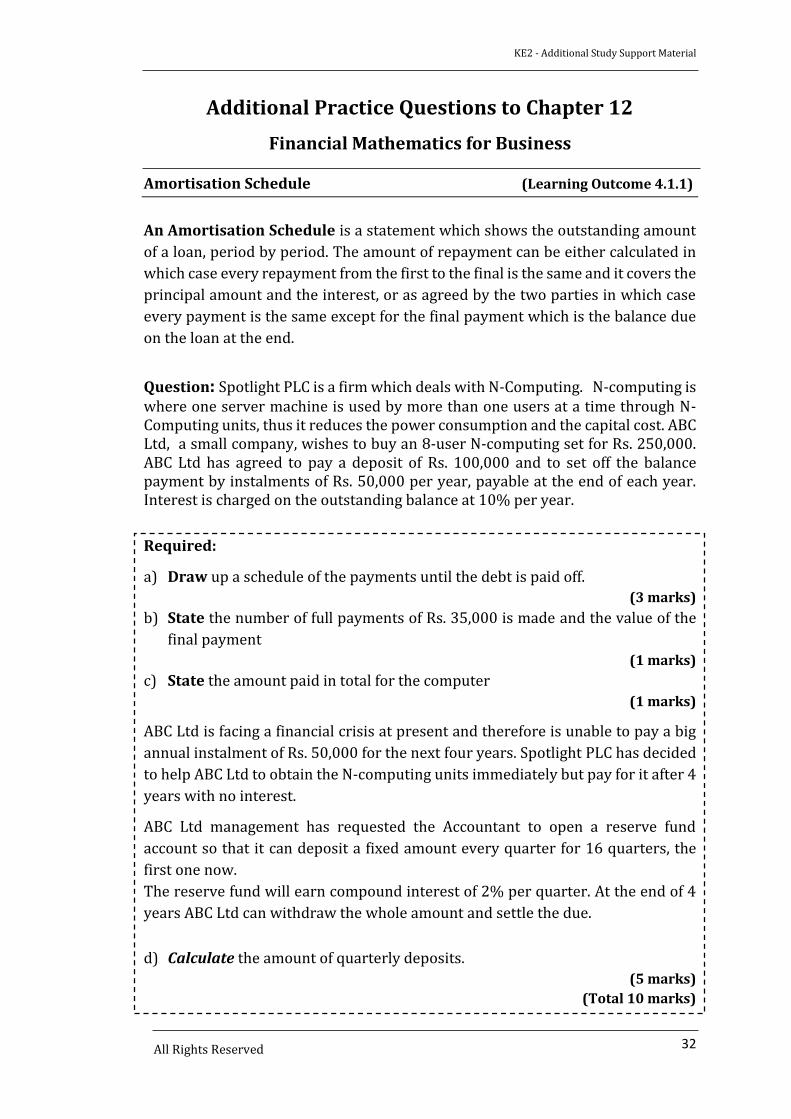
Amortisation Schedule (Learning Outcome 4.1.1)
An Amortisation Schedule is a statement which shows the outstanding amount
of a loan, period by period. The amount of repayment can be either calculated in
which case every repayment from the first to the final is the same and it covers the
principal amount and the interest, or as agreed by the two parties in which case
every payment is the same except for the final payment which is the balance due
on the loan at the end.
Question: Spotlight PLC is a firm which deals with N-Computing. N-computing is where one server machine is used by more than one users at a time through N-Computing units, thus it reduces the power consumption and the capital cost. ABC Ltd, a small company, wishes to buy an 8-user N-computing set for Rs. 250,000. ABC Ltd has agreed to pay a deposit of Rs. 100,000 and to set off the balance payment by instalments of Rs. 50,000 per year, payable at the end of each year. Interest is charged on the outstanding balance at 10% per year.
Required:
a) Draw up a schedule of the payments until the debt is paid off.
(3 marks)
b) State the number of full payments of Rs. 35,000 is made and the value of the
final payment
(1 marks)
c) State the amount paid in total for the computer
(1 marks)
ABC Ltd is facing a financial crisis at present and therefore is unable to pay a big
annual instalment of Rs. 50,000 for the next four years. Spotlight PLC has decided
to help ABC Ltd to obtain the N-computing units immediately but pay for it after 4
years with no interest.
ABC Ltd management has requested the Accountant to open a reserve fund
account so that it can deposit a fixed amount every quarter for 16 quarters, the
first one now.
The reserve fund will earn compound interest of 2% per quarter. At the end of 4
years ABC Ltd can withdraw the whole amount and settle the due.
d) Calculate the amount of quarterly deposits.
(5 marks)
(Total 10 marks)

KE2 - Additional Study Support Material
33 All Rights Reserved
Solution:
a)
Year Amount at the
Beginning
(Rs.)
Interest
payable
(Rs.)
Installments
(Rs.)
Amount at
the end
(Rs.)
1 150,000 15,000 (50,000) 115,000
2 115,000 11,500 (50,000) 76,500
3 76,500 7,650 (50,000) 34,150
4 34,150 3,415 (37,565) NIL
b) There are 3 full payments of Rs. 50,000 and the final payment is Rs. 37,565.
c) Total amount paid for the computer,
Rs. 100,000 + (3 * Rs. 50,000) + Rs. 37,565 = Rs. 287,565
d) Assume that each quarterly investment deposit is Rs. A then
250,000 = 𝐴 × 1.02 × (1.0216 − 1)
(1.02 − 1)
A = (250,000 ×0.02)
{1.02 ×(1.0216−1)}
A = Rs. 13,150 (approx.)

KE2 - Additional Study Support Material
34 All Rights Reserved
Additional Practice Questions to Chapter 16
Mathematics for Business Functions
Heading 8: The profit-maximising price/output level
Average cost minimisation (Learning Outcome 6.2.1)
1. On a certain ferry it has been observed that the running costs per km, C are
directly proportional to the square of the sailing speed. It can be considered as
C = 𝑘 × 𝑥2, where k is a constant and 𝑥 is the sailing speed. From experience
and it is known that C = Rs. 27,000 per km when the speed is 30 km per hour.
In addition, there are other costs of Rs. 1,000 per hour, regardless of the ferry
speed. Every week the ferry makes 10 journeys of 81 km up and down.
Required
Assess the following requirements:
a) A mathematical expression for the cost of a journey of 60 km at 𝑥 km per
hour in terms of 𝑥.
(4 marks)
b) The most economical sailing speed for the ferry and the total cost for that
journey at that speed.
(6 marks)
(Total 10 marks)
Solution:
a) Total weekly cost = Running costs + Other costs
To estimate the running cost, the constant k should be identified. This is
possible from the equation C = 𝑘 × 𝑥2
27,000 = k (900), and hence, k = 30
This implies running costs are = 30 𝑥2
Other costs depend upon the sailing time. When the ferry sails at
𝑥 𝑘𝑚 𝑝𝑒𝑟 ℎ𝑜𝑢𝑟 time taken for a journey (up and down) would be 81
𝑥 hours
and so other costs per journey = 81,000
𝑥
Therefore weekly other costs would be810,000
𝑥
Total weekly costs (C) = 30 𝑥2 + 810,000
𝑥
KE2 - Additional Study Support Material
35 All Rights Reserved
C = 30 𝑥2 + 810,000
𝑥
𝑑𝐶
𝑑𝑥= 30𝑥 –
810,000
𝑥2
At turning points, 𝑑𝐶
𝑑𝑥 = 0 and so 30𝑥 –
810,000
𝑥2= 0
This implies that 30 𝑥3 = 810,000
𝑥3 = 27,000
𝑥 = 30 km per hour
The turning point is minima as 𝑑2𝐶
𝑑𝑥> 0
Hence, the most economical speed is 30 km per hour.
When 𝑥 = 30 total weekly cost would be 30 (302) + 810,000
30= Rs. 54,000 per week.
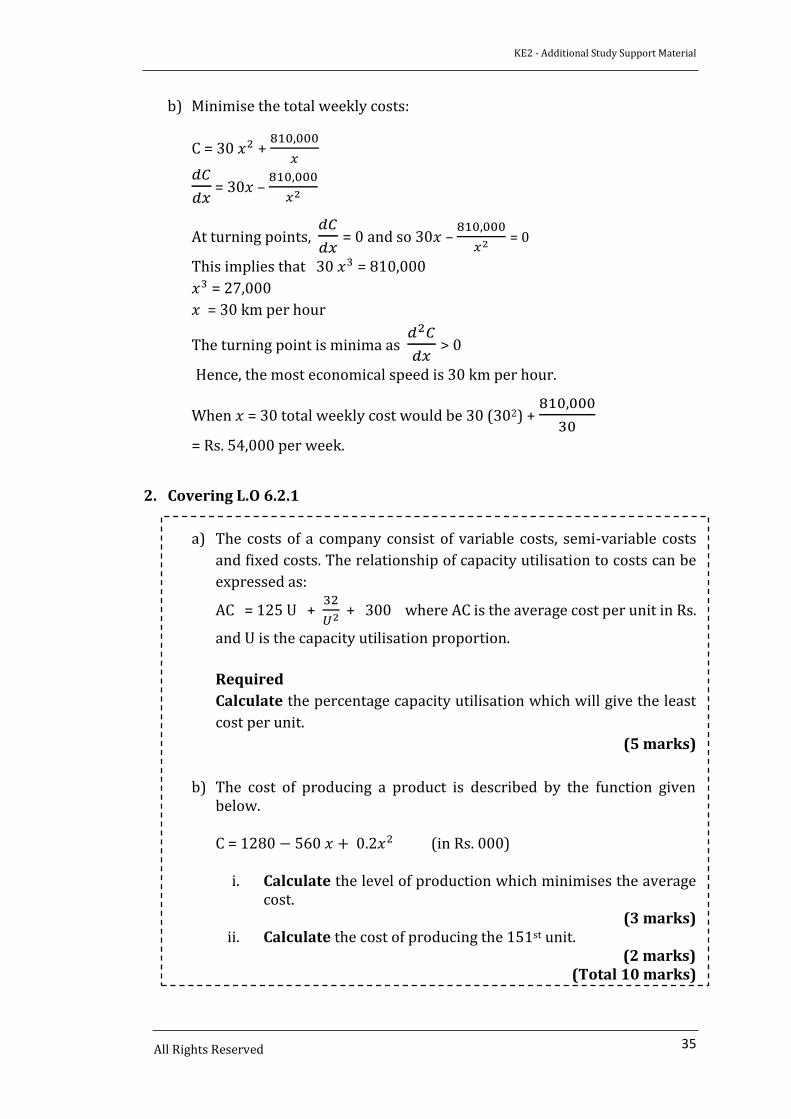
2. Covering L.O 6.2.1
a) The costs of a company consist of variable costs, semi-variable costs
and fixed costs. The relationship of capacity utilisation to costs can be
expressed as:
AC = 125 U + 32
𝑈2 + 300 where AC is the average cost per unit in Rs.
and U is the capacity utilisation proportion.
Required
Calculate the percentage capacity utilisation which will give the least
cost per unit.
(5 marks)
b) The cost of producing a product is described by the function givenbelow.
C = 1280 − 560 𝑥 + 0.2𝑥2 (in Rs. 000)
i. Calculate the level of production which minimises the averagecost.
(3 marks) ii. Calculate the cost of producing the 151st unit.
(2 marks) (Total 10 marks)
b) Minimise the total weekly costs:
KE2 - Additional Study Support Material
36 All Rights Reserved
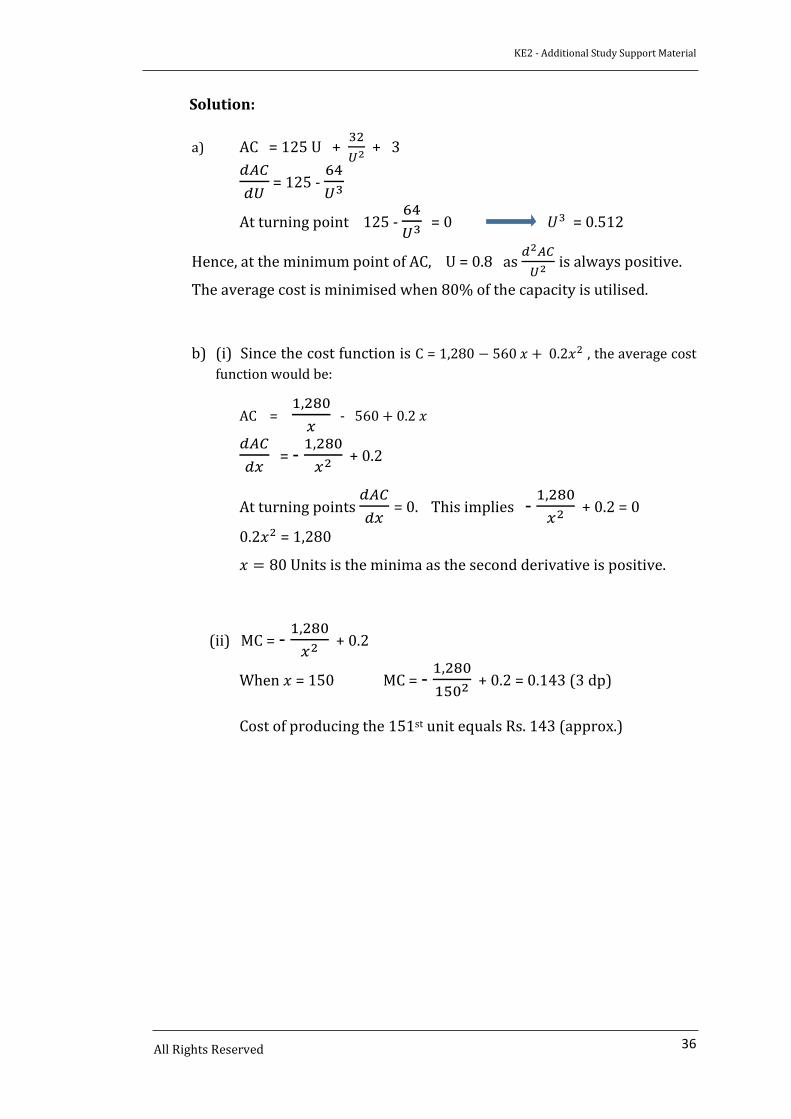
Solution:
a) AC = 125 U + 32
𝑈2 + 3
𝑑𝐴𝐶
𝑑𝑈 = 125 -
64
𝑈3
At turning point 125 - 64
𝑈3 = 0 𝑈3 = 0.512
Hence, at the minimum point of AC, U = 0.8 as 𝑑2𝐴𝐶
𝑈2 is always positive.
The average cost is minimised when 80% of the capacity is utilised.
b) (i) Since the cost function is C = 1,280 − 560 𝑥 + 0.2𝑥2 , the average cost
function would be:
AC = 1,280
𝑥 - 560 + 0.2 𝑥
𝑑𝐴𝐶
𝑑𝑥= -
1,280
𝑥2 + 0.2
At turning points 𝑑𝐴𝐶
𝑑𝑥= 0. This implies -
1,280
𝑥2 + 0.2 = 0
0.2𝑥2 = 1,280
𝑥 = 80 Units is the minima as the second derivative is positive.
(ii) MC = - 1,280
𝑥2 + 0.2
When 𝑥 = 150 MC = - 1,280
1502 + 0.2 = 0.143 (3 dp)
Cost of producing the 151st unit equals Rs. 143 (approx.)
KE2 - Additional Study Support Material
37 All Rights Reserved
Additional Practice Questions to Chapter 17
Budgetary Control and Budgetary Systems
Heading 4: Functional budgets (Page 591)
Preparing functional budgets (Learning Outcome 7.3.1)
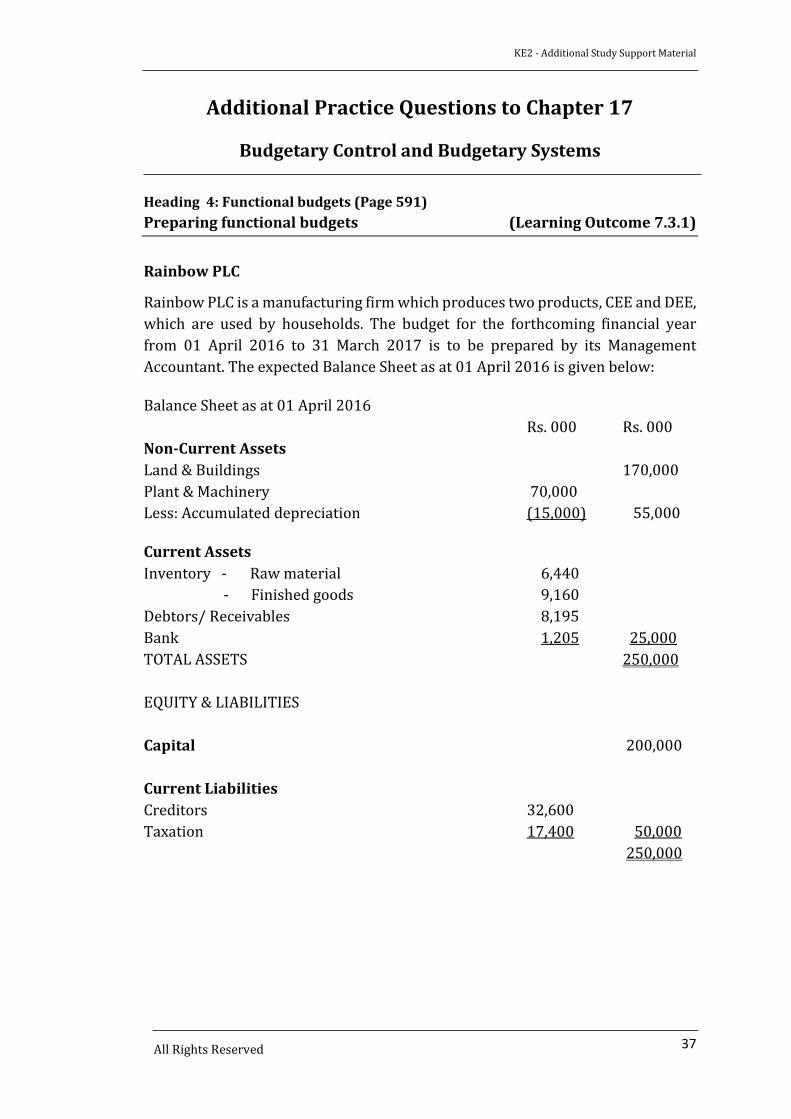
Rainbow PLC
Rainbow PLC is a manufacturing firm which produces two products, CEE and DEE,
which are used by households. The budget for the forthcoming financial year
from 01 April 2016 to 31 March 2017 is to be prepared by its Management
Accountant. The expected Balance Sheet as at 01 April 2016 is given below:
Balance Sheet as at 01 April 2016
Rs. 000 Rs. 000
Non-Current Assets
Land & Buildings 170,000
Plant & Machinery 70,000
Less: Accumulated depreciation (15,000) 55,000
Current Assets
Inventory - Raw material 6,440
- Finished goods 9,160
Debtors/ Receivables 8,195
Bank 1,205 25,000
TOTAL ASSETS 250,000
EQUITY & LIABILITIES
Capital 200,000
Current Liabilities
Creditors 32,600
Taxation 17,400 50,000
250,000
KE2 - Additional Study Support Material
38 All Rights Reserved
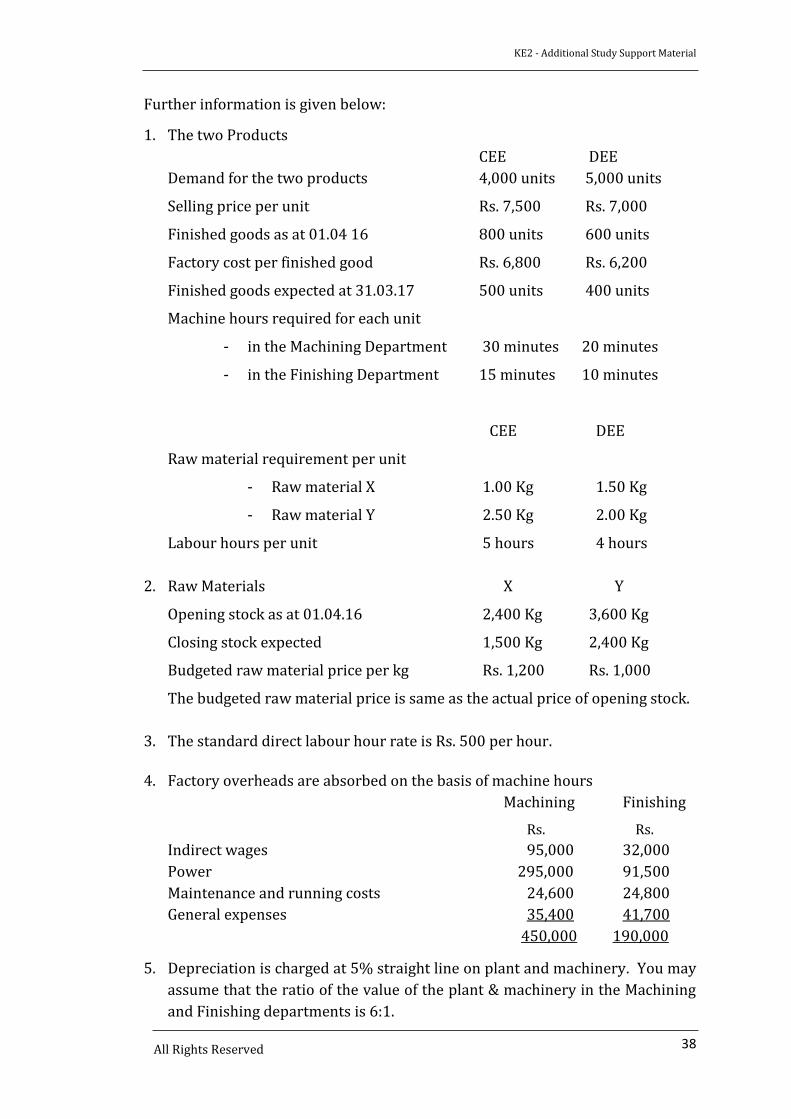
Further information is given below:
1. The two Products
CEE DEE
Demand for the two products 4,000 units 5,000 units
Selling price per unit Rs. 7,500 Rs. 7,000
Finished goods as at 01.04 16 800 units 600 units
Factory cost per finished good Rs. 6,800 Rs. 6,200
Finished goods expected at 31.03.17 500 units 400 units
Machine hours required for each unit
- in the Machining Department 30 minutes 20 minutes
- in the Finishing Department 15 minutes 10 minutes
CEE DEE
Raw material requirement per unit
- Raw material X 1.00 Kg 1.50 Kg
- Raw material Y 2.50 Kg 2.00 Kg
Labour hours per unit 5 hours 4 hours
2. Raw Materials X Y
Opening stock as at 01.04.16 2,400 Kg 3,600 Kg
Closing stock expected 1,500 Kg 2,400 Kg
Budgeted raw material price per kg Rs. 1,200 Rs. 1,000
The budgeted raw material price is same as the actual price of opening stock.
3. The standard direct labour hour rate is Rs. 500 per hour.
4. Factory overheads are absorbed on the basis of machine hours
Machining Finishing
Rs. Rs.
Indirect wages 95,000 32,000
Power 295,000 91,500
Maintenance and running costs 24,600 24,800
General expenses 35,400 41,700
450,000 190,000
5. Depreciation is charged at 5% straight line on plant and machinery. You may
assume that the ratio of the value of the plant & machinery in the Machining
and Finishing departments is 6:1.
KE2 - Additional Study Support Material
39 All Rights Reserved
6. Selling and distribution expenses are expected to be Rs. 322,000.
7. There is neither opening nor closing work in progress and inflation should be
ignored.
Required:
Prepare the following budgets for the year ended 31st March 2017 for Rainbow
PLC.
a) Sales budget (2 marks)
b) Production budget (in units) (1 marks)
c) Plant utilization budget (2 marks)
d) Materials usage budget (3 marks)
e) Labour budget (2 marks)
f) Factory overhead budget (2 marks)
g) Materials purchase budget (2 marks)
h) Cost of goods sold budget (3 marks)
i) Budgeted profit and loss account (3 marks)
(Total 20 marks)
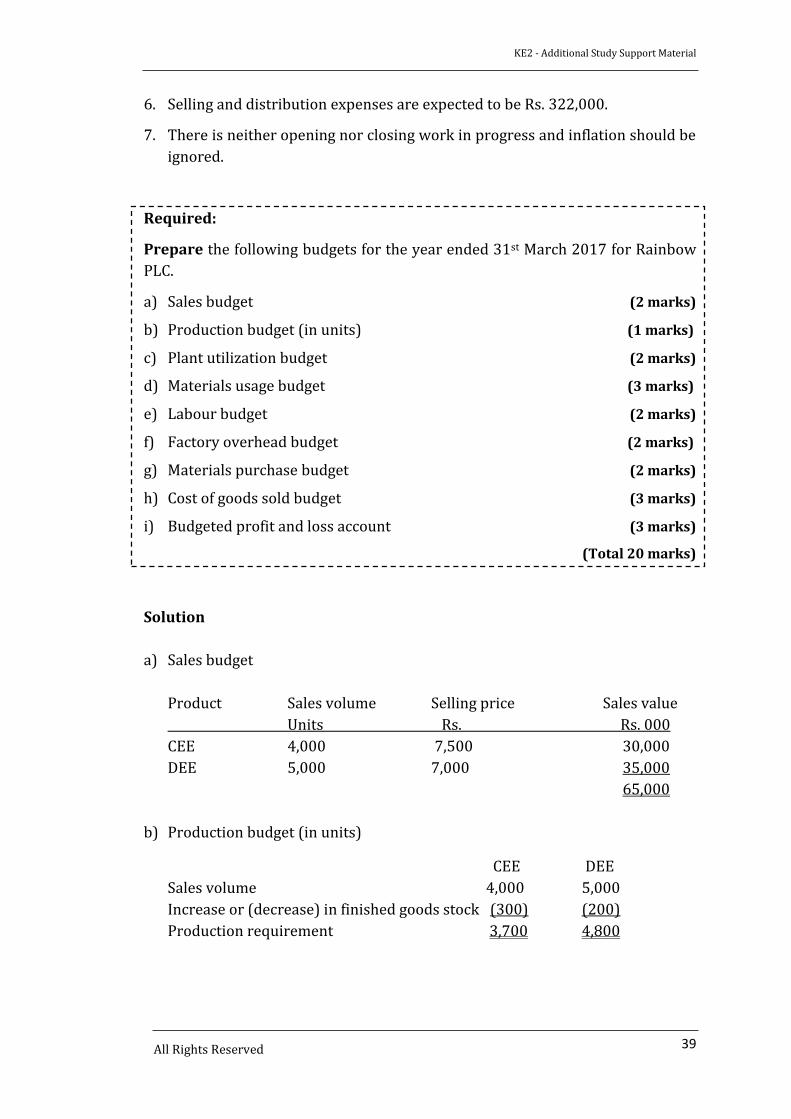
Solution
a) Sales budget
Product Sales volume Selling price Sales value
Units Rs. Rs. 000
CEE 4,000 7,500 30,000
DEE 5,000 7,000 35,000
65,000
b) Production budget (in units)
CEE DEE
Sales volume 4,000 5,000
Increase or (decrease) in finished goods stock (300) (200)
Production requirement 3,700 4,800
KE2 - Additional Study Support Material
40 All Rights Reserved
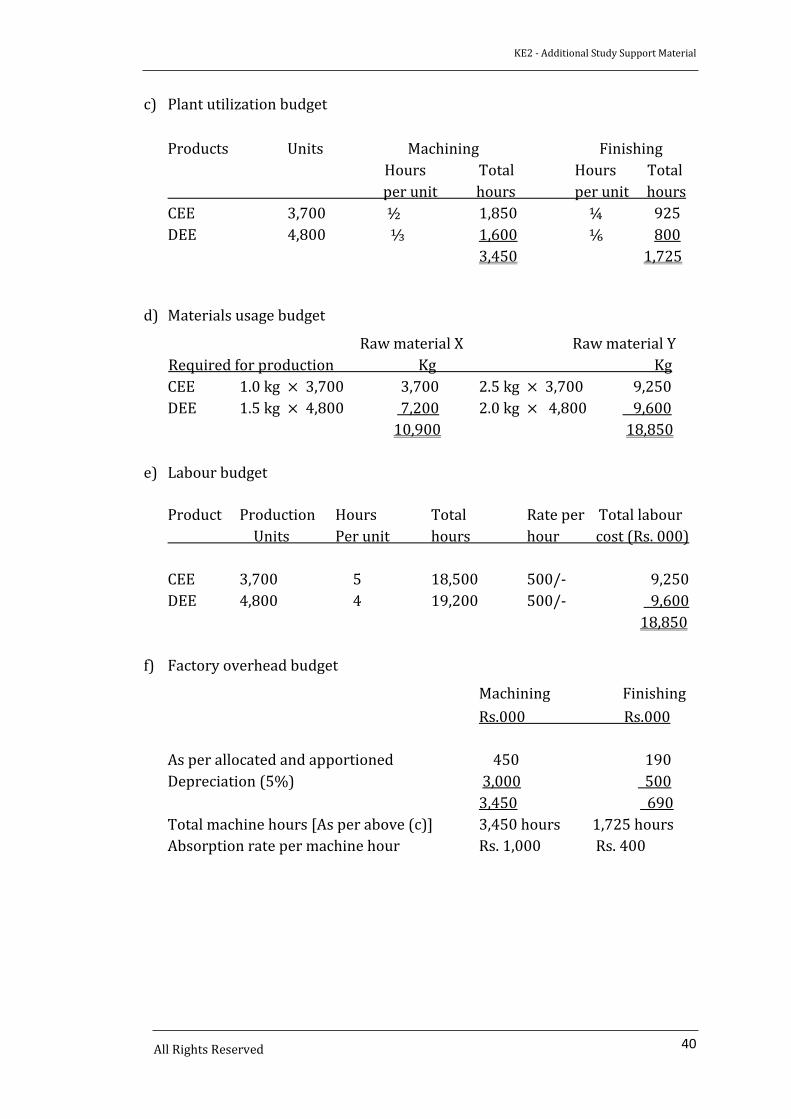
c) Plant utilization budget
Products Units Machining Finishing
Hours Total Hours Total
per unit hours per unit hours
CEE 3,700 ½ 1,850 ¼ 925
DEE 4,800 ⅓ 1,600 ⅙ 800
3,450 1,725
d) Materials usage budget
Raw material X Raw material Y
Required for production Kg Kg
CEE 1.0 kg × 3,700 3,700 2.5 kg × 3,700 9,250
DEE 1.5 kg × 4,800 7,200 2.0 kg × 4,800 9,600
10,900 18,850
e) Labour budget
Product Production Hours Total Rate per Total labour
Units Per unit hours hour cost (Rs. 000)
CEE 3,700 5 18,500 500/- 9,250
DEE 4,800 4 19,200 500/- 9,600
18,850
f) Factory overhead budget
Machining Finishing
Rs.000 Rs.000
As per allocated and apportioned 450 190
Depreciation (5%) 3,000 500
3,450 690
Total machine hours [As per above (c)] 3,450 hours 1,725 hours
Absorption rate per machine hour Rs. 1,000 Rs. 400
KE2 - Additional Study Support Material
41 All Rights Reserved
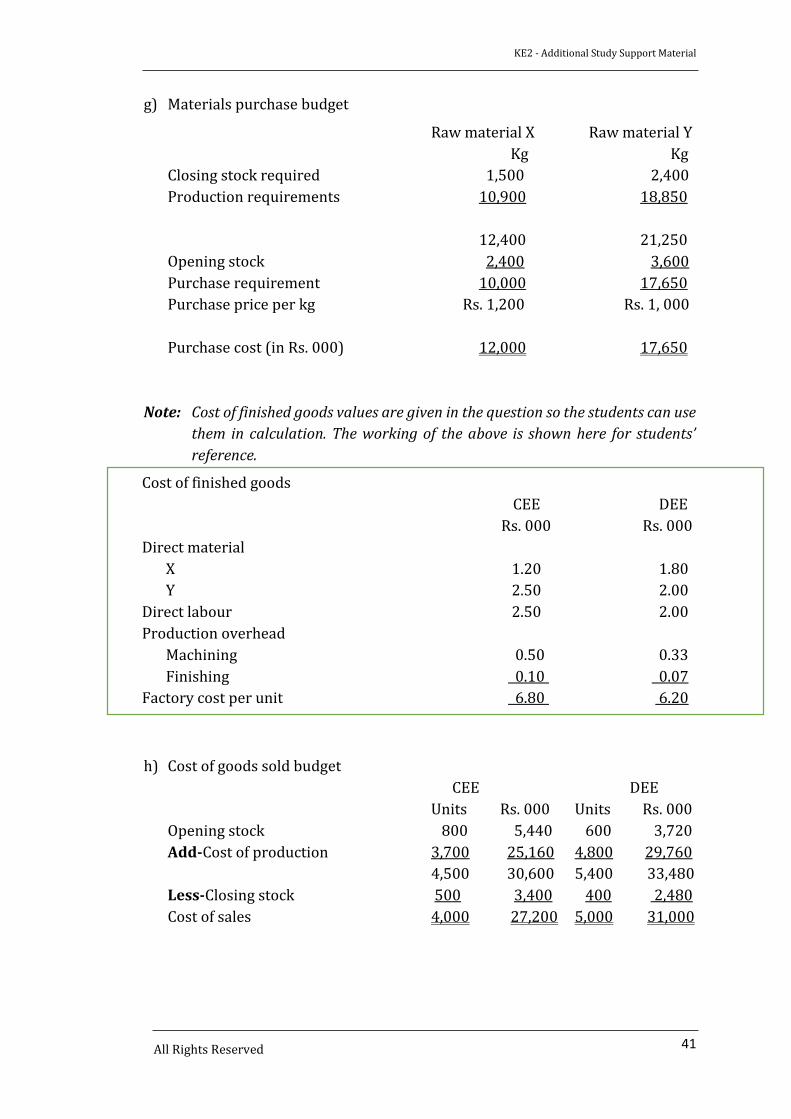
g) Materials purchase budget
Raw material X Raw material Y
Kg Kg
Closing stock required 1,500 2,400
Production requirements 10,900 18,850
12,400 21,250
Opening stock 2,400 3,600
Purchase requirement 10,000 17,650
Purchase price per kg Rs. 1,200 Rs. 1, 000
Purchase cost (in Rs. 000) 12,000 17,650
Note: Cost of finished goods values are given in the question so the students can use
them in calculation. The working of the above is shown here for students’
reference.
h) Cost of goods sold budget
CEE DEE
Units Rs. 000 Units Rs. 000
Opening stock 800 5,440 600 3,720
Add-Cost of production 3,700 25,160 4,800 29,760
4,500 30,600 5,400 33,480
Less-Closing stock 500 3,400 400 2,480
Cost of sales 4,000 27,200 5,000 31,000
Cost of finished goods
CEE DEE
Rs. 000 Rs. 000
Direct material
X 1.20 1.80
Y 2.50 2.00
Direct labour 2.50 2.00
Production overhead
Machining 0.50 0.33
Finishing 0.10 0.07
Factory cost per unit 6.80 6.20

KE2 - Additional Study Support Material
42 All Rights Reserved
i) Budgeted profit and loss account
CEE DEE Total
Rs. 000 Rs. 000 Rs. 000
Sales 30,000 35,000 65,000
Less: Cost of sales 27,200 31,000 58,200
Gross profit 2, 800 4,000 6,800
Less: Selling & Administration expenses 322
Net profit before taxation 6,478
Note: There will be no under or over absorbed production overhead in a budgeted
profit or loss account.
KE2 - Additional Study Support Material
43 All Rights Reserved
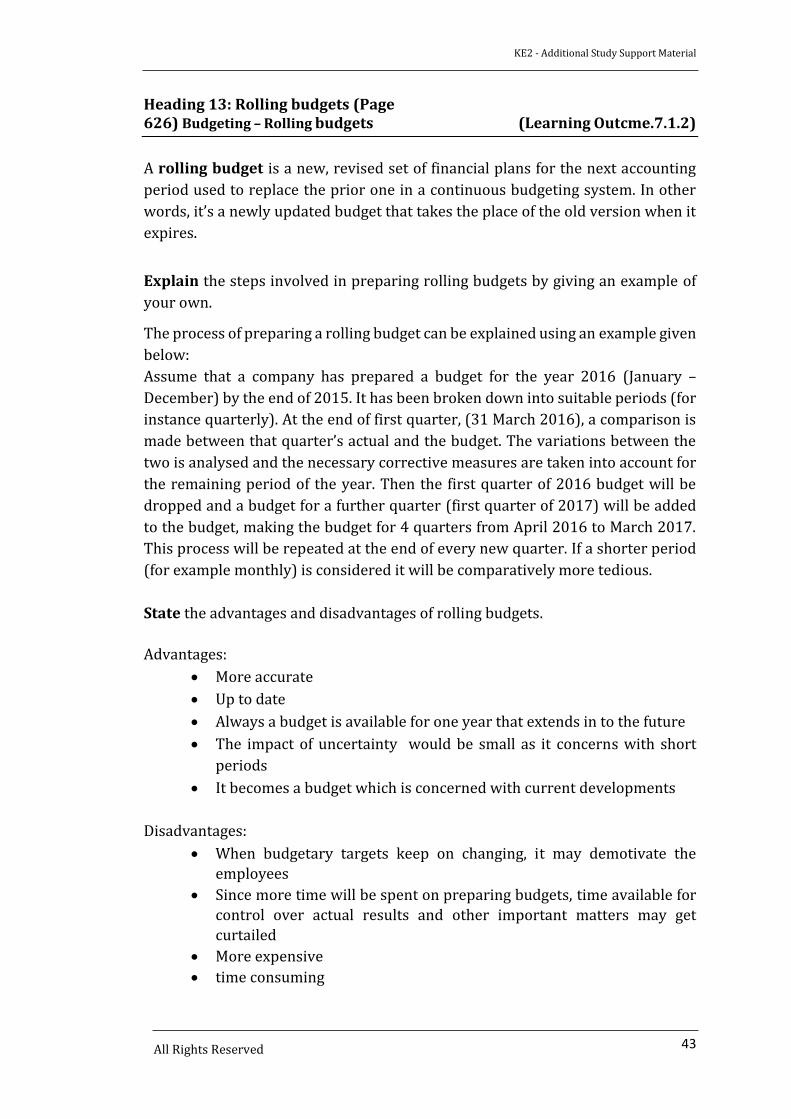
Heading 13: Rolling budgets (Page 626) Budgeting – Rolling budgets (Learning Outcme.7.1.2)
A rolling budget is a new, revised set of financial plans for the next accounting
period used to replace the prior one in a continuous budgeting system. In other
words, it’s a newly updated budget that takes the place of the old version when it
expires.
Explain the steps involved in preparing rolling budgets by giving an example of
your own.
The process of preparing a rolling budget can be explained using an example given
below:
Assume that a company has prepared a budget for the year 2016 (January –
December) by the end of 2015. It has been broken down into suitable periods (for
instance quarterly). At the end of first quarter, (31 March 2016), a comparison is
made between that quarter’s actual and the budget. The variations between the
two is analysed and the necessary corrective measures are taken into account for
the remaining period of the year. Then the first quarter of 2016 budget will be
dropped and a budget for a further quarter (first quarter of 2017) will be added
to the budget, making the budget for 4 quarters from April 2016 to March 2017.
This process will be repeated at the end of every new quarter. If a shorter period
(for example monthly) is considered it will be comparatively more tedious.
State the advantages and disadvantages of rolling budgets.
Advantages:
More accurate
Up to date
Always a budget is available for one year that extends in to the future
The impact of uncertainty would be small as it concerns with short
periods
It becomes a budget which is concerned with current developments
Disadvantages:
When budgetary targets keep on changing, it may demotivate the
employees
Since more time will be spent on preparing budgets, time available for
control over actual results and other important matters may get
curtailed
More expensive
time consuming
KE2 - Additional Study Support Material
44 All Rights Reserved
Additional Practice Questions to Chapter 18
Forecasting and Preparing budget
Heading 11: Sales forecasting: time series analysis (Page 673)
Forecasting for budgeting –
Calculating forecast information (Learning Outcome. 7.2.4)
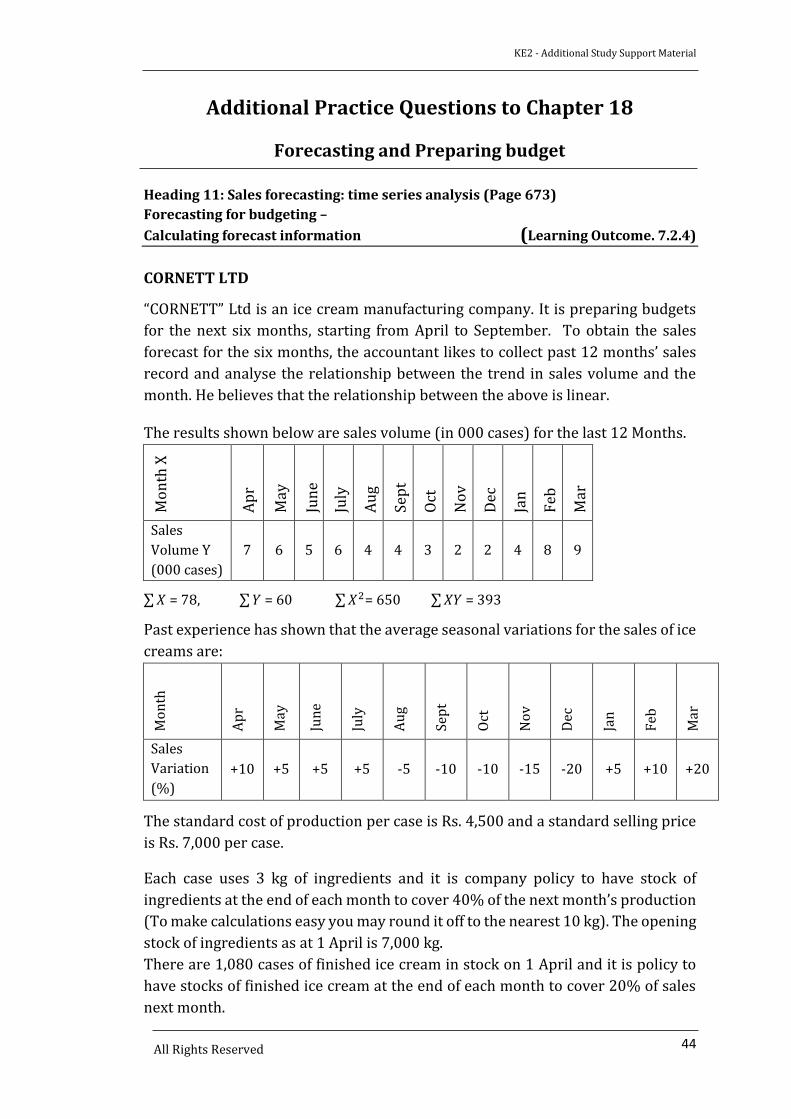
CORNETT LTD
“CORNETT” Ltd is an ice cream manufacturing company. It is preparing budgets
for the next six months, starting from April to September. To obtain the sales
forecast for the six months, the accountant likes to collect past 12 months’ sales
record and analyse the relationship between the trend in sales volume and the
month. He believes that the relationship between the above is linear.
The results shown below are sales volume (in 000 cases) for the last 12 Months.
Mo
nth
X
Ap
r
May
Jun
e
July
Au
g
Sep
t
Oct
No
v
Dec
Jan
Feb
Mar
Sales
Volume Y
(000 cases)
7 6 5 6 4 4 3 2 2 4 8 9
∑ 𝑋 = 78, ∑ 𝑌 = 60 ∑ 𝑋2= 650 ∑ 𝑋𝑌 = 393
Past experience has shown that the average seasonal variations for the sales of ice
creams are:
Mo
nth
Ap
r
May
Jun
e
July
Au
g
Sep
t
Oct
No
v
Dec
Jan
Feb
Mar
Sales
Variation
(%)
+10 +5 +5 +5 -5 -10 -10 -15 -20 +5 +10 +20
The standard cost of production per case is Rs. 4,500 and a standard selling price
is Rs. 7,000 per case.
Each case uses 3 kg of ingredients and it is company policy to have stock of
ingredients at the end of each month to cover 40% of the next month’s production
(To make calculations easy you may round it off to the nearest 10 kg). The opening
stock of ingredients as at 1 April is 7,000 kg.
There are 1,080 cases of finished ice cream in stock on 1 April and it is policy to
have stocks of finished ice cream at the end of each month to cover 20% of sales
next month.
KE2 - Additional Study Support Material
45
All Rights Reserved
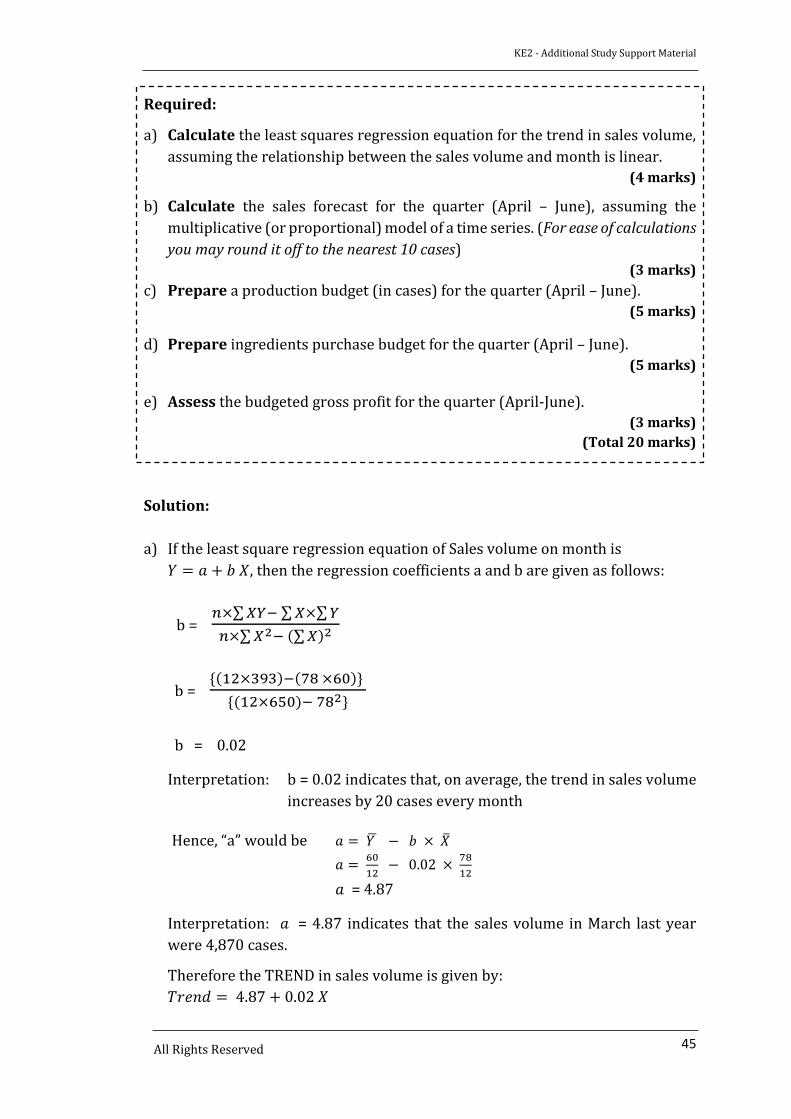
Required:
a) Calculate the least squares regression equation for the trend in sales volume,
assuming the relationship between the sales volume and month is linear.
(4 marks)
b) Calculate the sales forecast for the quarter (April – June), assuming the
multiplicative (or proportional) model of a time series. (For ease of calculations
you may round it off to the nearest 10 cases)
(3 marks)
c) Prepare a production budget (in cases) for the quarter (April – June).
(5 marks)
d) Prepare ingredients purchase budget for the quarter (April – June).
(5 marks)
e) Assess the budgeted gross profit for the quarter (April-June).
(3 marks)
(Total 20 marks)
Solution:
a) If the least square regression equation of Sales volume on month is
𝑌 = 𝑎 + 𝑏 𝑋, then the regression coefficients a and b are given as follows:
b = 𝑛×∑ 𝑋𝑌− ∑ 𝑋×∑ 𝑌
𝑛×∑ 𝑋2− (∑ 𝑋)2
b = {(12×393)−(78 ×60)}
{(12×650)− 782}
b = 0.02
Interpretation: b = 0.02 indicates that, on average, the trend in sales volume
increases by 20 cases every month
Hence, “a” would be 𝑎 = 𝑌 ̅ − 𝑏 × �̅�
𝑎 = 60
12 − 0.02 ×
78
12
𝑎 = 4.87
Interpretation: 𝑎 = 4.87 indicates that the sales volume in March last year
were 4,870 cases.
Therefore the TREND in sales volume is given by:
𝑇𝑟𝑒𝑛𝑑 = 4.87 + 0.02 𝑋
KE2 - Additional Study Support Material
46
All Rights Reserved
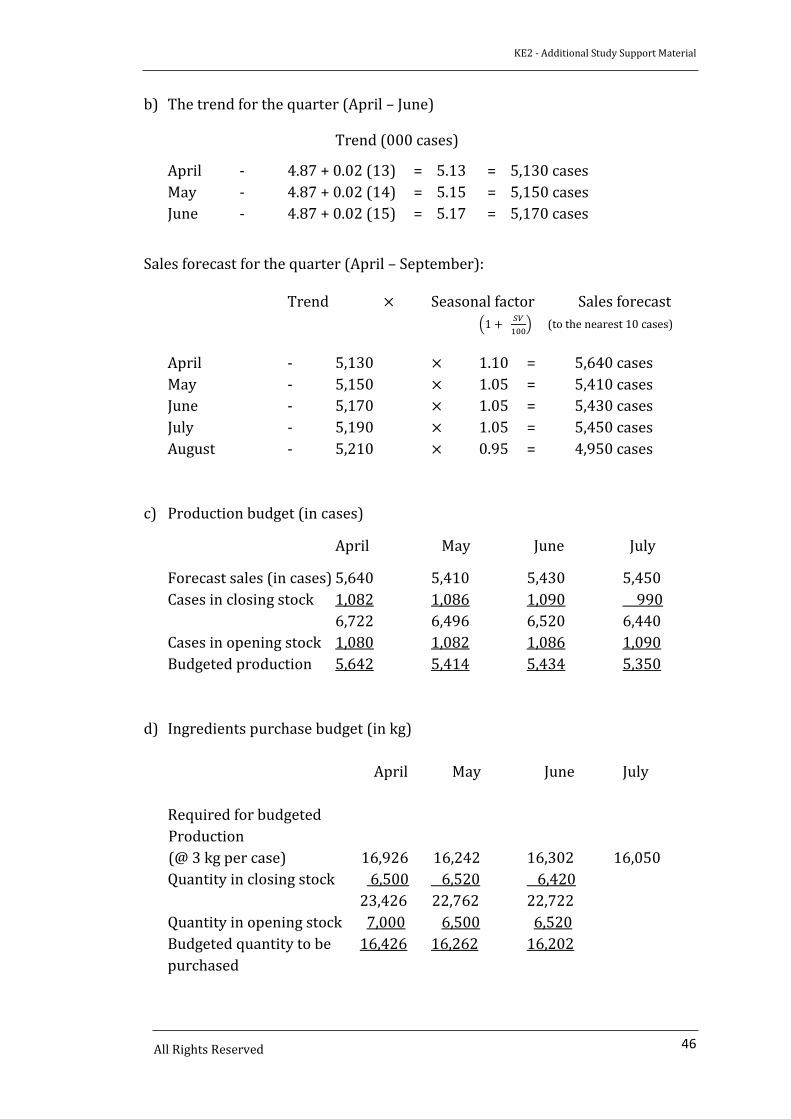
b) The trend for the quarter (April – June)
Trend (000 cases)
April - 4.87 + 0.02 (13) = 5.13 = 5,130 cases
May - 4.87 + 0.02 (14) = 5.15 = 5,150 cases
June - 4.87 + 0.02 (15) = 5.17 = 5,170 cases
Sales forecast for the quarter (April – September):
Trend × Seasonal factor Sales forecast
(1 + 𝑆𝑉
100) (to the nearest 10 cases)
April - 5,130 × 1.10 = 5,640 cases
May - 5,150 × 1.05 = 5,410 cases
June - 5,170 × 1.05 = 5,430 cases
July - 5,190 × 1.05 = 5,450 cases
August - 5,210 × 0.95 = 4,950 cases
c) Production budget (in cases)
April May June July
Forecast sales (in cases) 5,640 5,410 5,430 5,450
Cases in closing stock 1,082 1,086 1,090 990
6,722 6,496 6,520 6,440
Cases in opening stock 1,080 1,082 1,086 1,090
Budgeted production 5,642 5,414 5,434 5,350
d) Ingredients purchase budget (in kg)
April May June July
Required for budgeted
Production
(@ 3 kg per case) 16,926 16,242 16,302 16,050
Quantity in closing stock 6,500 6,520 6,420
23,426 22,762 22,722
Quantity in opening stock 7,000 6,500 6,520
Budgeted quantity to be 16,426 16,262 16,202
purchased
KE2 - Additional Study Support Material
47
All Rights Reserved
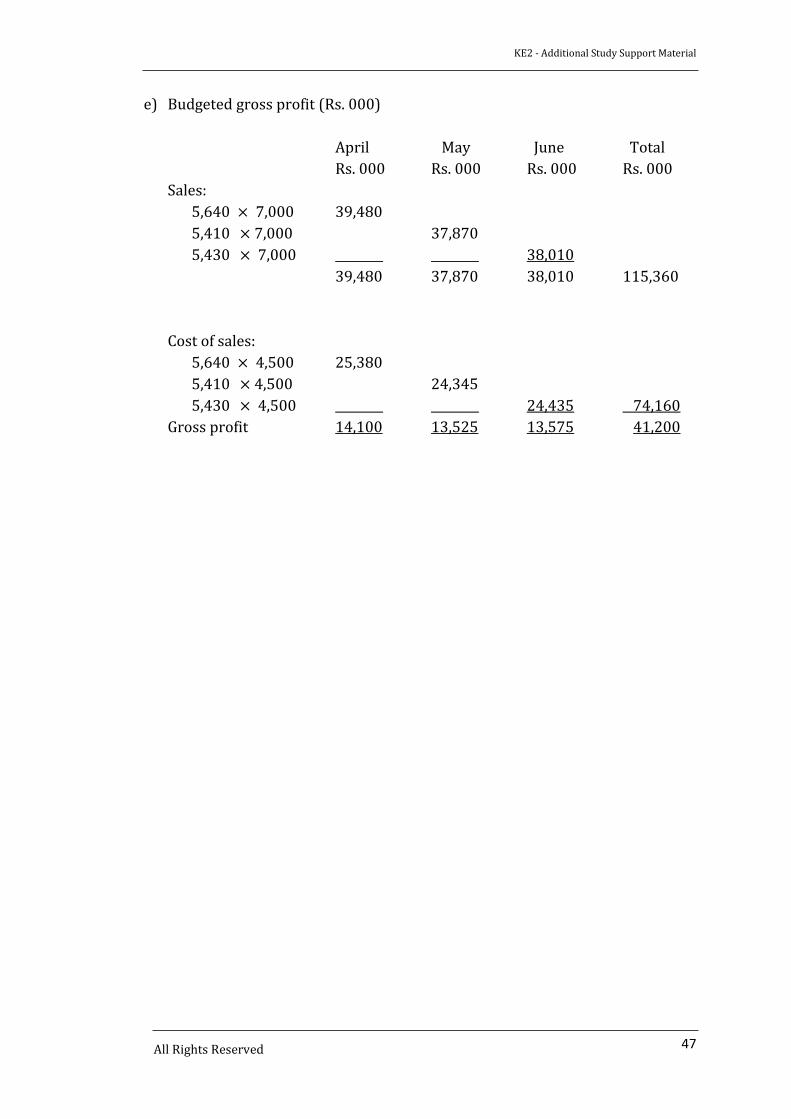
e) Budgeted gross profit (Rs. 000)
April May June Total
Rs. 000 Rs. 000 Rs. 000 Rs. 000
Sales:
5,640 × 7,000 39,480
5,410 × 7,000 37,870
5,430 × 7,000 38,010
39,480 37,870 38,010 115,360
Cost of sales:
5,640 × 4,500 25,380
5,410 × 4,500 24,345
5,430 × 4,500 24,435 74,160
Gross profit 14,100 13,525 13,575 41,200
Related Documents