Introduction to DUNN Capital Management, LLC Managed Futures: World Monetary & Agriculture Program Financial Professional Use Only - Not For Public Distribution TARGETING PORTFOLIO SOLUTIONS TM

Welcome message from author
This document is posted to help you gain knowledge. Please leave a comment to let me know what you think about it! Share it to your friends and learn new things together.
Transcript
Introduction toDUNN Capital Management, LLCManaged Futures: World Monetary & Agriculture Program
Financial Professional Use Only - Not For Public Distribution
TARGETING PORTFOLIO SOLUTIONS
TM
2 • Introduction to DUNN Capital
Financial Professional Use Only – Not For Public Distribution.
Introduction to Managed Futures
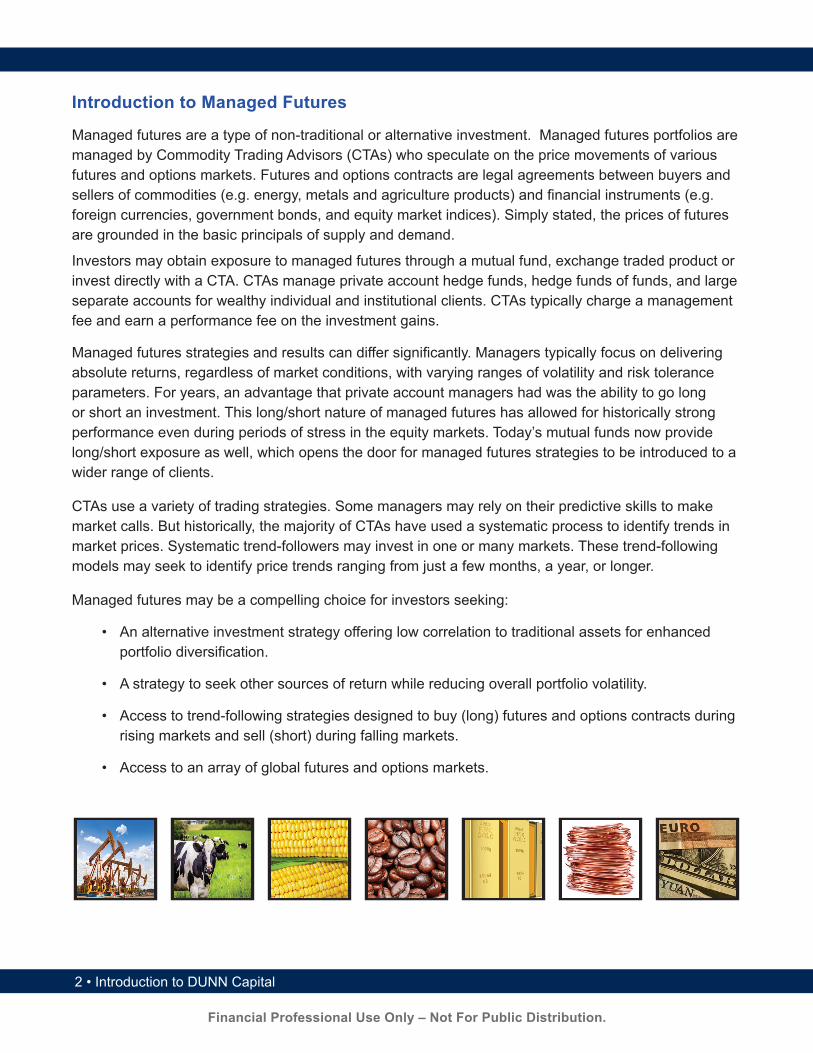
Managed futures are a type of non-traditional or alternative investment. Managed futures portfolios are managed by Commodity Trading Advisors (CTAs) who speculate on the price movements of various futures and options markets. Futures and options contracts are legal agreements between buyers and sellers of commodities (e.g. energy, metals and agriculture products) and financial instruments (e.g. foreign currencies, government bonds, and equity market indices). Simply stated, the prices of futures are grounded in the basic principals of supply and demand.
Investors may obtain exposure to managed futures through a mutual fund, exchange traded product or invest directly with a CTA. CTAs manage private account hedge funds, hedge funds of funds, and large separate accounts for wealthy individual and institutional clients. CTAs typically charge a management fee and earn a performance fee on the investment gains.
Managed futures strategies and results can differ significantly. Managers typically focus on delivering absolute returns, regardless of market conditions, with varying ranges of volatility and risk tolerance parameters. For years, an advantage that private account managers had was the ability to go long or short an investment. This long/short nature of managed futures has allowed for historically strong performance even during periods of stress in the equity markets. Today’s mutual funds now provide long/short exposure as well, which opens the door for managed futures strategies to be introduced to a wider range of clients.
CTAs use a variety of trading strategies. Some managers may rely on their predictive skills to make market calls. But historically, the majority of CTAs have used a systematic process to identify trends in market prices. Systematic trend-followers may invest in one or many markets. These trend-following models may seek to identify price trends ranging from just a few months, a year, or longer.
Managed futures may be a compelling choice for investors seeking:
• An alternative investment strategy offering low correlation to traditional assets for enhanced portfolio diversification.
• A strategy to seek other sources of return while reducing overall portfolio volatility.
• Access to trend-following strategies designed to buy (long) futures and options contracts during rising markets and sell (short) during falling markets.
• Access to an array of global futures and options markets.

Introduction to DUNN Capital • 3
Financial Professional Use Only – Not For Public Distribution.
DUNN’s approach to risk and return differs from peer firms and places the firm on the same side of the table as its investors. The firm has always viewed risk from the perspective of the investor. This is not surprising given that a large portion of the firm’s assets under management belong to employees, friends, and family.
As a CTA, DUNN’s presence has been fairly quiet without much self-promotion, but those in the industry have taken notice. Over the years, DUNN has received many forms of recognition for their award winning investment strategies.
2014 Best Multi-Advisor Futures Fund
Best US Managed Futures (CTA) Fund
Management Company
DUNN Capital Management, LLC
Founded in 1974 by Dr. William A Dunn, a pioneer in managed futures, DUNN Capital Management, LLC (DUNN) is one of the world’s oldest Commodity Trading Advisor (CTA) firms. DUNN has been broadly recognized as a top-performing CTA firm and has approximately $1 billion in assets under management.
DUNNCAPITAL MANAGEMENT, LLC
In 1984, DUNN created its flagship World Monetary and Agriculture Program (WMA*). WMA utilizes a systematic, trend following strategy, encompassing a portfolio of financial and commodity futures markets. Some CTA programs put an emphasis on absolute returns ahead of total return. The focus of WMA is on wealth expansion through long-term growth, rather than sacrificing return in favor of capital preservation.
The WMA strategy is based on DUNN’s philosophy that all markets exhibit exploitable trends, and one can achieve better risk-adjusted performance by combining a large number of low-correlated markets. The program is almost always invested, either long or short, in more than 50 markets across a broad range of asset classes and all sectors.
*The World Monetary & Agriculture Program is available only to Qualified Participants. Futures trading is speculative and involves risk. Past performance is not indicative of future results.
Awards from Barclay Hedge, CME Group and Hedgeweek. Images used with permission.
4 • Introduction to DUNN Capital
Financial Professional Use Only – Not For Public Distribution.
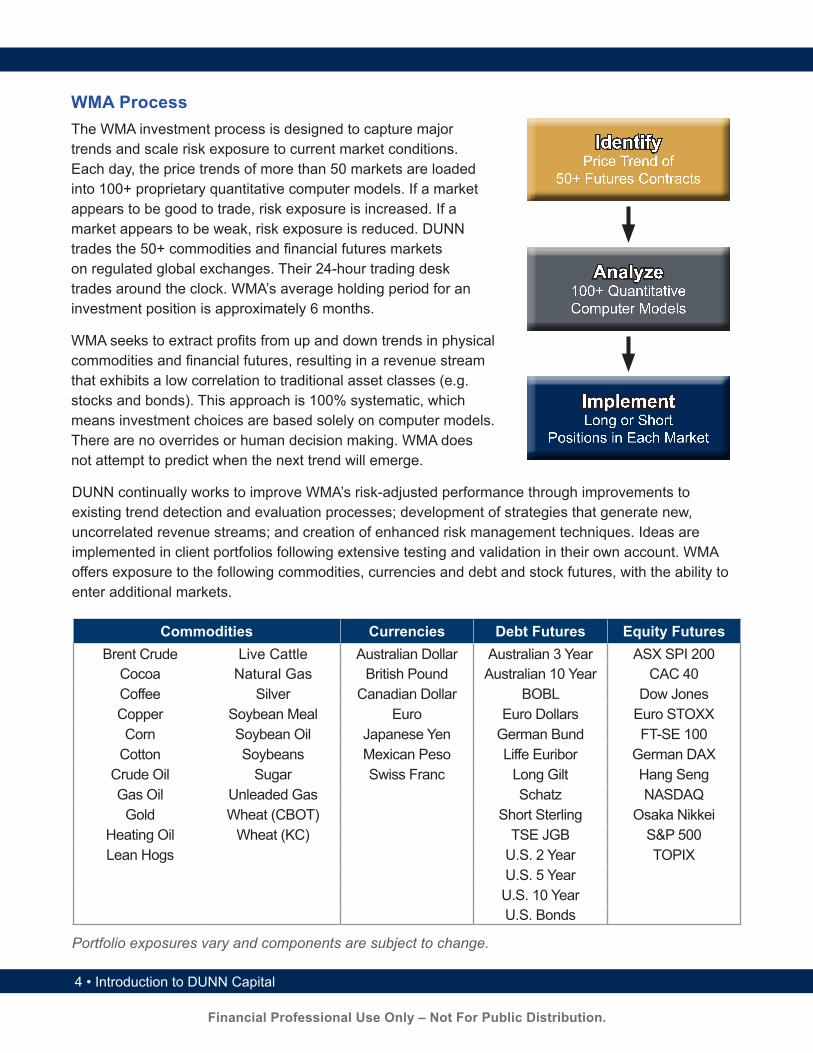
WMA Process The WMA investment process is designed to capture major trends and scale risk exposure to current market conditions. Each day, the price trends of more than 50 markets are loaded into 100+ proprietary quantitative computer models. If a market appears to be good to trade, risk exposure is increased. If a market appears to be weak, risk exposure is reduced. DUNN trades the 50+ commodities and financial futures markets on regulated global exchanges. Their 24-hour trading desk trades around the clock. WMA’s average holding period for an investment position is approximately 6 months.
WMA seeks to extract profits from up and down trends in physical commodities and financial futures, resulting in a revenue stream that exhibits a low correlation to traditional asset classes (e.g. stocks and bonds). This approach is 100% systematic, which means investment choices are based solely on computer models. There are no overrides or human decision making. WMA does not attempt to predict when the next trend will emerge.
IdentifyPrice Trend of
50+ Futures Contracts
Analyze100+ QuantitativeComputer Models
ImplementLong or Short
Positions in Each Market
DUNN continually works to improve WMA’s risk-adjusted performance through improvements to existing trend detection and evaluation processes; development of strategies that generate new, uncorrelated revenue streams; and creation of enhanced risk management techniques. Ideas are implemented in client portfolios following extensive testing and validation in their own account. WMA offers exposure to the following commodities, currencies and debt and stock futures, with the ability to enter additional markets.
Portfolio exposures vary and components are subject to change.
Commodities Currencies Debt Futures Equity FuturesBrent Crude Live Cattle Australian Dollar Australian 3 Year ASX SPI 200
Cocoa Natural Gas British Pound Australian 10 Year CAC 40Coffee Silver Canadian Dollar BOBL Dow JonesCopper Soybean Meal Euro Euro Dollars Euro STOXXCorn Soybean Oil Japanese Yen German Bund FT-SE 100
Cotton Soybeans Mexican Peso Liffe Euribor German DAXCrude Oil Sugar Swiss Franc Long Gilt Hang SengGas Oil Unleaded Gas Schatz NASDAQ
Gold Wheat (CBOT) Short Sterling Osaka NikkeiHeating Oil Wheat (KC) TSE JGB S&P 500Lean Hogs U.S. 2 Year TOPIX
U.S. 5 YearU.S. 10 YearU.S. Bonds
Introduction to DUNN Capital • 5
Financial Professional Use Only – Not For Public Distribution.
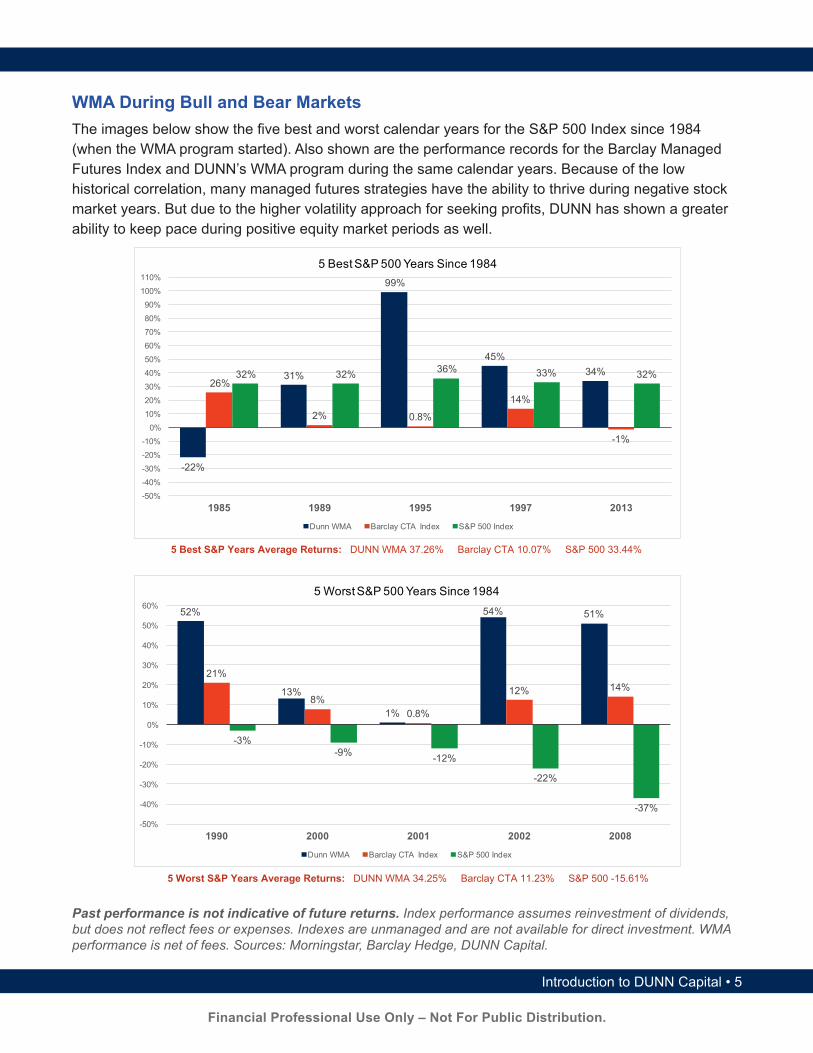
WMA During Bull and Bear Markets The images below show the five best and worst calendar years for the S&P 500 Index since 1984 (when the WMA program started). Also shown are the performance records for the Barclay Managed Futures Index and DUNN’s WMA program during the same calendar years. Because of the low historical correlation, many managed futures strategies have the ability to thrive during negative stock market years. But due to the higher volatility approach for seeking profits, DUNN has shown a greater ability to keep pace during positive equity market periods as well.
52%
13%
1%
54% 51%
21%
8%0.8%
12% 14%
-3%-9% -12%
-22%
-37%-50%
-40%
-30%
-20%
-10%
0%
10%
20%
30%
40%
50%
60%
1990 2000 2001 2002 2008
5 Worst S&P 500 Years Since 1984
Dunn WMA Barclay CTA Index S&P 500 Index
-22%
31%
99%
45%34%
26%
2% 0.8%
14%
-1%
32% 32% 36% 33% 32%
-50%
-40%
-30%
-20%
-10%
0%
10%
20%
30%
40%
50%
60%
70%
80%
90%
100%
110%
1985 1989 1995 1997 2013
5 Best S&P 500 Years Since 1984
Dunn WMA Barclay CTA Index S&P 500 Index
5 Best S&P Years Average Returns: DUNN WMA 37.26% Barclay CTA 10.07% S&P 500 33.44%
5 Worst S&P Years Average Returns: DUNN WMA 34.25% Barclay CTA 11.23% S&P 500 -15.61%
Past performance is not indicative of future returns. Index performance assumes reinvestment of dividends, but does not reflect fees or expenses. Indexes are unmanaged and are not available for direct investment. WMA performance is net of fees. Sources: Morningstar, Barclay Hedge, DUNN Capital.
6 • Introduction to DUNN Capital
Financial Professional Use Only – Not For Public Distribution.
Risk (Standard Deviation)
CTAsDUNN World Monetary& Agriculture Program
Managed FuturesMutual Funds
Market Frontier(Stocks & Bonds)
Return
-25%
-20%
-15%
-10%
-5%
0%
5%
10%
15%
20%
25%
30%
35%
0% 5% 10% 15% 20% 25% 30% 35%
WMA
Stocks
Bonds
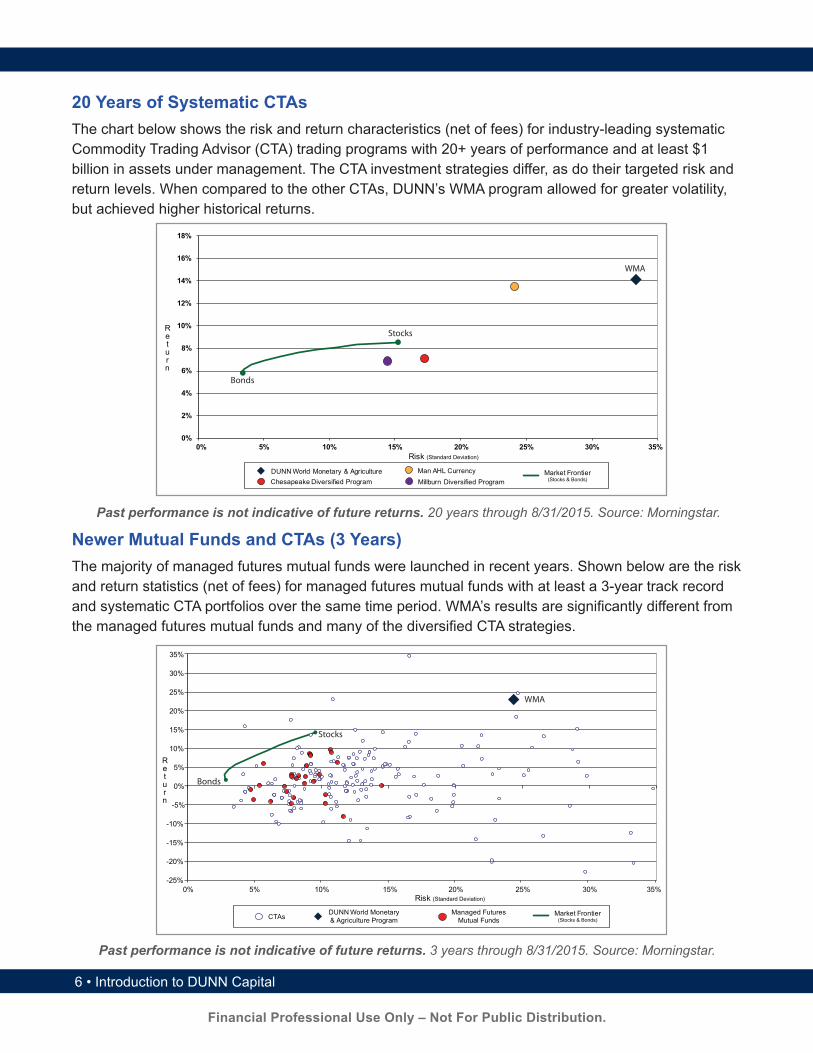
Newer Mutual Funds and CTAs (3 Years)The majority of managed futures mutual funds were launched in recent years. Shown below are the risk and return statistics (net of fees) for managed futures mutual funds with at least a 3-year track record and systematic CTA portfolios over the same time period. WMA’s results are significantly different from the managed futures mutual funds and many of the diversified CTA strategies.
20 Years of Systematic CTAsThe chart below shows the risk and return characteristics (net of fees) for industry-leading systematic Commodity Trading Advisor (CTA) trading programs with 20+ years of performance and at least $1 billion in assets under management. The CTA investment strategies differ, as do their targeted risk and return levels. When compared to the other CTAs, DUNN’s WMA program allowed for greater volatility, but achieved higher historical returns.
Past performance is not indicative of future returns. 3 years through 8/31/2015. Source: Morningstar.
0%
2%
4%
6%
8%
10%
12%
14%
16%
18%
0% 5% 10% 15% 20% 25% 30% 35%
DUNN World Monetary & Agriculture Man AHL CurrencyMillburn Diversified ProgramChesapeake Diversified Program
Return
WMA
Stocks
Bonds
Market Frontier(Stocks & Bonds)
Risk (Standard Deviation)
Past performance is not indicative of future returns. 20 years through 8/31/2015. Source: Morningstar.

Introduction to DUNN Capital • 7
Financial Professional Use Only – Not For Public Distribution.
Asset Allocation: Impact on Risk and ReturnThe table and graph below illustrate the impact of adding an allocation of the DUNN WMA program to a hypothetical blended portfolio of 60% stocks and 40% bonds. One would assume that adding a higher volatility investment, such as the WMA, would significantly raise the overall risk levels of a traditional portfolio—but it didn’t. Not only did the performance improve, in many cases the risk level remained fairly constant, within only a few percentage points difference. Many other managed futures programs maintain low correlation, but without the performance boost provided by a higher volatility strategy such as the DUNN WMA (see the Barclay BTOP 50 managed futures index below).
Past performance is not indicative of future returns. Performance greater than 1 year is annualized. Asset class proxies for the 60/40 Portfolio: Stocks (S&P 500 Index), Bonds (Barclays U.S. Aggregate Bond Index). Assumed allocations to WMA were made by reducing allocations equally from both stocks and bonds from the traditional 60/40 portfolio. Annualized standard deviation is used to illustrate Risk. Index performance assumes reinvestment of dividends, but does not reflect fees or expenses. Indexes are unmanaged and are not available for direct investment. Source: Morningstar.
1 Year 3 Years 5 Years 10 YearsAs of 7/31/2015 Return Risk Return Risk Return Risk Return Risk60/40 Portfolio 7.84% 5.50% 11.35% 5.34% 11.16% 6.80% 7.01% 8.76%
5% Allocation to WMA 10.10% 5.71% 12.07% 5.48% 11.62% 6.61% 7.53% 8.29%10% Allocation to WMA 12.39% 6.31% 12.77% 5.88% 12.06% 6.72% 8.02% 8.14%20% Allocation to WMA 17.07% 8.26% 14.16% 7.21% 12.92% 7.74% 8.95% 8.83%
DUNN WMA Program 58.81% 30.64% 22.31% 24.48% 17.14% 27.79% 13.38% 29.57%S&P 500 Index 11.21% 9.12% 17.58% 8.56% 16.24% 11.73% 7.72% 14.72%Barclays U.S. Agg. Index 2.82% 3.28% 1.60% 2.88% 3.27% 2.80% 4.61% 3.27%Barclay BTOP 50 Index 11.69% 9.43% 2.58% 6.37% 2.76% 6.20% 3.66% 6.22%
4%
5%
6%
7%
8%
9%
10%
0% 2% 4% 6% 8% 10% 12% 14% 16%
Risk (Standard Deviation)
Return
100% Stocks
100% Bonds
60/40
With 5% WMA
With 10% WMA
With 20% WMA
Adding DUNN WMAto the 60/40
Stock/Bond Blend
New Frontiers: Adding WMA to the 60/4010 Year Averages (as of 7/31/2015)

AD-100615
Past performance is not indicative of future results. The contents contained herein are for informational purposes only and are not intended as an offer to buy or sell any security, or participate in any trading strategy or investment program. This material does not provide tailored investment advice and was prepared without regard for specific circumstances and objectives. The DUNN Capital World Monetary & Agriculture Program (“WMA”) is not a mutual fund, and is only available to qualified participants. Futures trading is speculative, involves risk, and may not be suitable for all investors. Before investing, please read the prospectus and shareholder reports to learn about the investment strategy and potential risks. Investing involves risks, including the potential for loss of principal. An investor should consider the fund’s investment objective, charges, expenses and risks carefully before investing. This and other information about the fund is contained in the fund’s prospectus, which can be obtained by calling 1-877-277-6933. Arrow Funds are distributed by an affiliate, Archer Distributors, LLC (member FINRA).
Arrow Funds | 6100 Chevy Chase Drive, Suite 100 | Laurel, MD 20707 | (877) 277-6933 Opt. 1.
Visit our website at www.arrowfunds.com
TARGETING PORTFOLIO SOLUTIONS
TM
Arrow Funds is a mutual fund company with a passion for helping investors meet their financial goals. We believe in offering targeted portfolio solutions for the ever-changing markets. Our vision is to be the leading provider of alternative and tactical investments that seek to enhance returns and mitigate risk.
Related Documents