ICDS BIHAR ICDS Internship Final Report Malnutrition in Patna District Andrew R. Bracken MPP Candidate 2013 University of Michigan Gerald R. Ford School of Public Policy 10/8/2012

Welcome message from author
This document is posted to help you gain knowledge. Please leave a comment to let me know what you think about it! Share it to your friends and learn new things together.
Transcript

ICDS BIHAR
ICDS Internship Final Report
Malnutrition in Patna District
Andrew R. Bracken
MPP Candidate 2013
University of Michigan
Gerald R. Ford School of Public Policy
10/8/2012

Andrew R. Bracken ICDS Report
1
ACKNOWLEDGEMENTS
I would like to express my gratitude to all ICDS staff in the State of Bihar for the opportunity to
intern in Patna for ten weeks. A special thanks goes to ICDS Director Mr Praveen Kishore for
affording me the chance to come to intern for ICDS. Monitoring Officer Ms Abha Prasad helped
immensely in understanding ICDS, arranged field visits, and treated me very kindly. Mr Pradeep
Joseph helped me focus my research, provided invaluable and insightful feedback, and assisted
me with tasks I could not otherwise accomplish. I would like to thank Patna DPO Mr Sudhir
Kumar for granting me complete access to any resource and facility I desired in Patna District. I
would also like to specially thank the following CDPOs, their Lady Supervisors, and Anganwadi
Workers who generously shared their precious time and entertained my every request: Ms
Rashmi Chaudari (Fatuha), Ms Anjana Kumari (Masaurhi), Ms Mamta Verma (Dulhin Bazar),
Ms Babita Rai (Hajipur Sadar), Ms Madhumita Kumari (Patna Sadar 1), Ms Kanchan Kumari
Giri (Patna Sadar 3), and Ms Tarani Kumari (Patna Sadar 4).

Andrew R. Bracken ICDS Report
2
CONTENTS
ACKNOWLEDGEMENTS ............................................................................................................ 1
CONTENTS .................................................................................................................................... 2
ABBREVIATIONS ........................................................................................................................ 3
EXECUTIVE SUMMARY ............................................................................................................ 4
INTRODUCTION .......................................................................................................................... 7
MALNUTRITION .......................................................................................................................... 7
GROWTH STANDARDS AND MALNUTRITION ..................................................................... 9
DATA COLLECTION ................................................................................................................. 13
DATA ANALYSIS ....................................................................................................................... 15
RECOMMENDATIONS .............................................................................................................. 36
CONCLUSION ............................................................................................................................. 39

Andrew R. Bracken ICDS Report
3
ABBREVIATIONS
AC Anthropometric calculator
AWC Anganwadi Centre
CDC Centers for Disease Control
CDPO Childhood Development Project Officer
DPO District Programme Officer
GHI Global Hunger Index
HIV Human Immunodeficiency Virus
IA Individual assessment
ICDS Integrated Child Development Services
ISHI India State Hunger Index
LS Lady Supervisor
MIS Management Information System
MGRS Multicentre Growth Reference Study
NCHS National Center for Health Statistics
NHS National Health Service (United Kingdom)
NS Nutritional survey
SNP Supplementary Nutrition Programme
THR Take Home Ration
UNICEF United Nations Children’s Fund
WHO World Health Organization

Andrew R. Bracken ICDS Report
4
EXECUTIVE SUMMARY
Introduction: Despite Bihar’s high growth rate in recent years, malnutrition persists as a barrier
to development. The WHO (World Health Organisation) characterises malnutrition as
[N]ot enough as well as too much food, the wrong types of food, and the body's
response to a wide range of infections that result in malabsorption of nutrients or the
inability to use nutrients properly to maintain health.1
The 2008 India State Hunger Index (ISHI) ranked Bihar 15th
of 17 states surveyed. Bihar notably
ranked below average in the proportion of underweight children (56.1% vs. 42.5%).2 In 2005-6
the WHO found that of Bihari children aged 0-5, 56.4% were -2 standard deviations or more
from the ideal weight (mean of 0) and 25.4% were -3 or more standard deviations from the
mean.3 A malnourished child is more susceptible to disease and can suffer permanent mental and
physical damage. The first 2-3 years are the most critical for preventing long-term damage.
Objective: The objective of this report is to define malnutrition and childhood growth standards;
present research about the impact of block and sex on malnutrition, supplementary nutrition
(SNP), and Take Home Ration (THR) provision in Patna District; and offer recommendations to
reduce malnutrition in Bihari children though ICDS.
Data collection: Child growth and malnutrition data are from visits to 34 Anganwadi Centres
(AWCs) in Patna and Vaishali Districts. Block-level data are from ICDS’s MIS (Management
Information System). AWC growth and malnutrition data were analysed with WHO Anthro
software and two-tailed t-tests in Excel to determine malnutrition levels and if there was a gender
bias in malnutrition. Block-level data from 2011-12 were analysed with chi-squared (X2) tests in
Excel to determine if malnutrition rates, SNP, and THR provision were independent of sex.
AWC data were not collected from randomly selected AWCs. Block-level data were not
available for all blocks in Patna District, nor were all block-wise reports complete.
Data analysis and results: The analysis in this report yielded the following results:
AWC gender malnutrition independence analysis
3 of 22 AWCs with sufficient data showed malnutrition to be dependent on gender at an
alpha of 0.05. In each case males were more malnourished than females.
1 http://www.who.int/water_sanitation_health/diseases/malnutrition/en/
2 http://www.ifpri.org/publication/comparisons-hunger-across-states-india-state-hunger-index
3 http://www.who.int/nutgrowthdb/database/countries/who_standards/ind.pdf

Andrew R. Bracken ICDS Report
5
The best AWC had average weight-for-age -1.19 standard deviations from the ideal mean
(11.7th
percentile); the worst AWC had average weight-for-age -3.64 standard deviations
from the ideal mean (0.0001th
percentile).
A weighted average of weight-for-age standard deviations for the 22 AWCs showed
results almost identical to the WHO’s for Bihar in 2005-6:4
o -2 or more standard deviations below the mean: 57.05% (vs. 56.4% WHO).
o -3 or more standard deviations below the mean: 23.28% (vs. 25.4% WHO).
Patna District malnutrition, SNP, and THR gender independence analysis
SNP provision favoured:
o Females 31.75% of the time and males 2.38% (all ages).
o Females 21% of the time and males 5% (6 months –1 year).
o Females 14% of the time and males 2% (1-3 years).
o Females 60% of the time and males 0% (3-6 years).
THR provision favoured:
o Females 22.62% of the time and males 23.81% (all ages).
o Females 19% of the time and males 26% (6 months –3 years).
o Females 26% of the time and males 21% (3-6 years).
For malnutrition, the sexes worst affected were (Normal, Grade I, Grade II, Grade III,
Grade IV), by percentage of statistically significant cases:
o Females 19%, 5%, 10%, 14%, 5%; males 0%, 5%, 0%, 0%, 0% (0-1 years).
o Females 10%, 5%, 5%, 33%, 24%; males 10%, 33%, 10%, 5%, 5% (1-3 years).
o Females 10%, 5%, 10%, 5%, 5%; males 5%, 5%, 5%, 19%, 5% (3-6 years).
Conclusions from the analysis: Data analysis yielded the following conclusions:
AWC gender malnutrition independence analysis
Even the best AWCs had extremely high rates of malnutrition.
Weight-for-age data are not uniformly collected by sevikas and thus it is difficult to make
firm conclusions. However, the data in this report are very close to the WHO’s, although
this shows almost no change in malnutrition since 2005-6.
Patna District malnutrition, SNP, and THR gender independence analysis
SNP: In most cases there is no difference between sexes, but females are more favoured
than males, especially at ages 3-6. This is probably because families send older males to
private or primary schools while females remain in AWCs.
4 http://www.who.int/nutgrowthdb/database/countries/who_standards/ind.pdf

Andrew R. Bracken ICDS Report
6
THR: There is not obvious district-wide gender bias in THR. In some blocks females are
favoured, in others males, but overall there is not a large difference. This is probably
because families benefit equally from females and males receiving THR.
Malnutrition: While females and males suffer high rates of malnutrition, females tend to
be overrepresented in the worst grades (III and IV). Only at ages 3-6 do males show
higher levels of malnutrition in Grade III. This is probably because the males remaining
in AWCs are the poorest of the poor because wealthier males attend private or primary
schools. Females remaining in AWCs are from all income levels.
Recommendations: This report makes the following recommendations:
Use standard growth measures: Sevikas do not use standard growth measures. Each
AWC follows its own procedures. ICDS must train sevikas to all use the same measures
which will allow for improved data analysis at block, district, and state levels.
Properly train AWWs (Anganwadi Workers) on growth measurements: AWWs do not
take growth measurements correctly. The WHO provides a Training Course on Child
Growth Assessment5 which could serve as a model. Without good growth data, ICDS will
not know the situation in AWCs and will not properly intervene in this the most
important of its focus areas, nutrition.
Provide each AWC with scales and use them correctly: Most AWCs do not have proper
scales for weighing babies and older children, nor do they know how to use them. This
results in unreliable growth data which again constrains ICDS’s ability to provide proper
interventions in nutrition.
Investigate differences in SNP and THR distribution: It appears some differences exist in
SNP and THR provision between sexes. ICDS should investigate why this occurs and
ensure that the children with the greatest need receive SNP and THR. Males should be
better served by SNP and females better served by THR.
Focus interventions on younger children, especially ages 0-2: Children are most
vulnerable to permanent mental and physical damage from ages 0-2. ICDS interventions
should focus on these children to get the highest return on limited ICDS resources.
Universalise ICDS in Bihar: The best way to combat malnutrition in Bihari children is to
universalise ICDS as some Indian states have done.
Properly dispose used needles: At several AWCs used needles were observed. This is a
public health hazard and must never be allowed.
Adjust AWC rental allowance by location and select healthier locations: Rental
allowance should be based on location, with urban AWCs receiving a higher allowance
than rural AWCs. Many urban AWCs are clearly bad for the children’s health near
garbage dumps, open sewers, and standing water.
5 http://www.who.int/childgrowth/training/en/

Andrew R. Bracken ICDS Report
7
INTRODUCTION
For my research under the ICDS internship programme for international graduate students I
chose to focus on nutrition, which is related to my interest and experience in food security. I used
my experiences as a graduate student at the University of Michigan’s Gerald R. Ford School of
Public Policy MPP programme and in international development as a Peace Corps Volunteer in
the African countries of Cape Verde and Mozambique from 2008 to 2011.
After visiting Anganwadi Centres (AWCs) in Patna Sadar 1 and Masaurhi blocks in Patna
District, I decided to focus on malnutrition in children who receive supplementary nutrition or
Take Home Ration (THR). Sevikas are required to keep growth charts, which give the best
measurement of malnutrition available at the Anganwadi level and form the basis of reports
which they submit.
I visited 34 AWCs in different blocks of Patna District, and Hajipur in Vaishali District, to gather
data and study the blocks, learn how AWCs function, and witness the performance of the blocks.
I visited about 10 additional AWCs where I did not gather data. I decided to focus on Fatuha and
urban Patna based on communication problems as a non-Hindi speaker and logistical constraints.
The objectives of this report are to introduce malnutrition, analyse malnutrition in and between
the AWCs and blocks and between females and males, and offer recommendations which ICDS
can use to improve the serious nutritional situation of children in the State of Bihar. Whenever
possible I used sound statistical methods to analyse data and make useful recommendations.
To save precious space for analysis, I will not include a general description of ICDS, as the
reader should have a good grasp of the organisation. I refer readers unfamiliar with ICDS in
Bihar to the website http://www.icdsbih.gov.in or to the many publications about ICDS.
MALNUTRITION
Malnutrition in India: According to the World Health Organization (WHO), malnutrition:
[C]oncerns not enough as well as too much food, the wrong types of food, and the
body's response to a wide range of infections that result in malabsorption of
nutrients or the inability to use nutrients properly to maintain health.6
India mostly suffers from malnutrition as a lack of food and proper nutrients in available or
consumed food. Other factors that cause malnutrition include poor hygiene, poor sanitation, and
unsafe water supply. Malnutrition weakens its victim and leaves him or her more vulnerable to
illnesses like hepatitis or malaria. Untreated, malnutrition can cause permanent mental and
6 http://www.who.int/water_sanitation_health/diseases/malnutrition/en/
Andrew R. Bracken ICDS Report
8
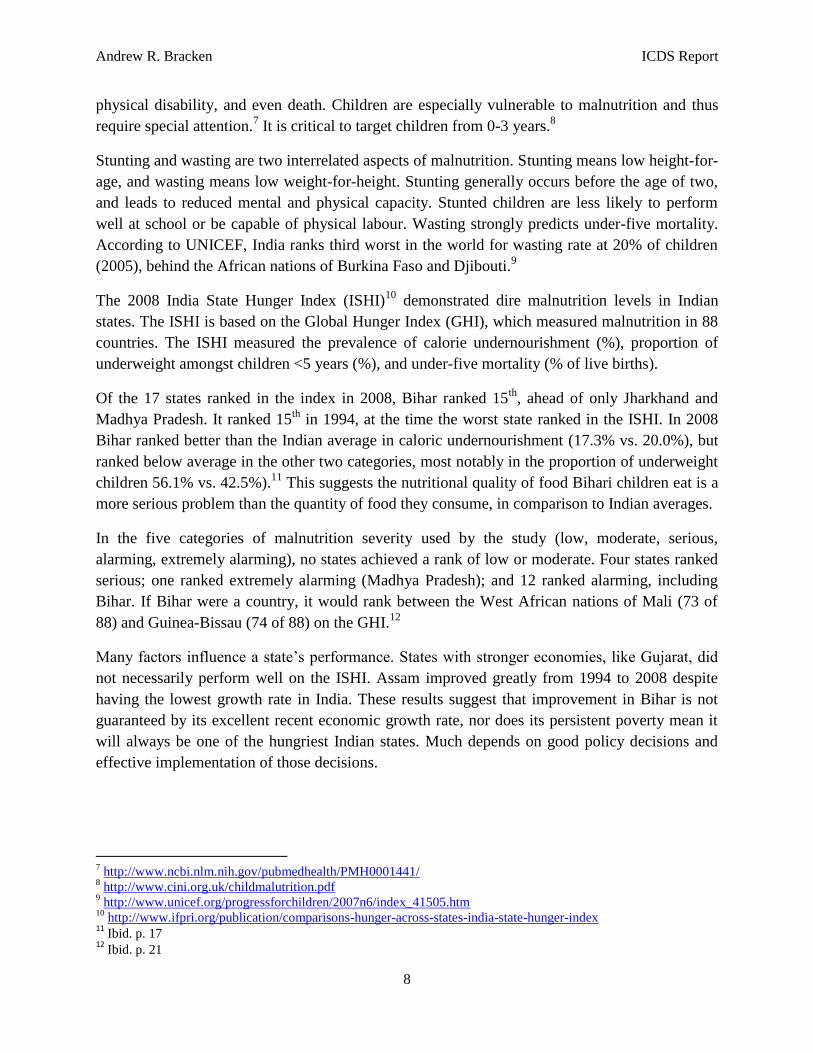
physical disability, and even death. Children are especially vulnerable to malnutrition and thus
require special attention.7 It is critical to target children from 0-3 years.
8
Stunting and wasting are two interrelated aspects of malnutrition. Stunting means low height-for-
age, and wasting means low weight-for-height. Stunting generally occurs before the age of two,
and leads to reduced mental and physical capacity. Stunted children are less likely to perform
well at school or be capable of physical labour. Wasting strongly predicts under-five mortality.
According to UNICEF, India ranks third worst in the world for wasting rate at 20% of children
(2005), behind the African nations of Burkina Faso and Djibouti.9
The 2008 India State Hunger Index (ISHI)10
demonstrated dire malnutrition levels in Indian
states. The ISHI is based on the Global Hunger Index (GHI), which measured malnutrition in 88
countries. The ISHI measured the prevalence of calorie undernourishment (%), proportion of
underweight amongst children <5 years (%), and under-five mortality (% of live births).
Of the 17 states ranked in the index in 2008, Bihar ranked 15th
, ahead of only Jharkhand and
Madhya Pradesh. It ranked 15th
in 1994, at the time the worst state ranked in the ISHI. In 2008
Bihar ranked better than the Indian average in caloric undernourishment (17.3% vs. 20.0%), but
ranked below average in the other two categories, most notably in the proportion of underweight
children 56.1% vs. 42.5%).11
This suggests the nutritional quality of food Bihari children eat is a
more serious problem than the quantity of food they consume, in comparison to Indian averages.
In the five categories of malnutrition severity used by the study (low, moderate, serious,
alarming, extremely alarming), no states achieved a rank of low or moderate. Four states ranked
serious; one ranked extremely alarming (Madhya Pradesh); and 12 ranked alarming, including
Bihar. If Bihar were a country, it would rank between the West African nations of Mali (73 of
88) and Guinea-Bissau (74 of 88) on the GHI.12
Many factors influence a state’s performance. States with stronger economies, like Gujarat, did
not necessarily perform well on the ISHI. Assam improved greatly from 1994 to 2008 despite
having the lowest growth rate in India. These results suggest that improvement in Bihar is not
guaranteed by its excellent recent economic growth rate, nor does its persistent poverty mean it
will always be one of the hungriest Indian states. Much depends on good policy decisions and
effective implementation of those decisions.
7 http://www.ncbi.nlm.nih.gov/pubmedhealth/PMH0001441/
8 http://www.cini.org.uk/childmalutrition.pdf
9 http://www.unicef.org/progressforchildren/2007n6/index_41505.htm
10 http://www.ifpri.org/publication/comparisons-hunger-across-states-india-state-hunger-index
11 Ibid. p. 17
12 Ibid. p. 21

Andrew R. Bracken ICDS Report
9
GROWTH STANDARDS AND MALNUTRITION
There are several ways to categorize malnutrition, including by standards developed by the
Centers for Disease Control’s (CDC) National Center for Health Statistics (NCHS) from the
United States and the WHO, amongst others. I use WHO standards based on standard deviations
and percentiles, although the ICDS MIS (Management Information System) uses a different
classification with grades Normal to IV.
Dr Dilek A. Bishku of the University of Chicago explained the Gomez definition of malnutrition
by grades, using weight as a percentage of the reference weight, which is the 50th
percentile. In
this scale normal weight is 1, and grades are expressed as a percentage of normal:
Normal: 90-110%
Grade I (mild malnutrition): 75-89%
Grade II (moderate malnutrition): 60-74%
Grade III (severe malnutrition): <60%
Dr Bishku noted that 3-5% of the population will be -2 standard deviations (z-score of -2) from
the ideal weight, although they are not malnourished. Some children are naturally small, and
Bihar is no exception.13
The following WHO table explains z-score measurements for four childhood growth indicators.
ICDS only collects weight-for-age data. Grey areas are considered normal measurements.14
z-scores for various growth indicators
13
http://pediatrics.uchicago.edu/chiefs/chronicdisease/documents/pearlshandout.doc 14
http://www.who.int/childgrowth/training/module_c_interpreting_indicators.pdf

Andrew R. Bracken ICDS Report
10
WHO growth charts measure children either by z-scores or percentiles. It can be easier to think
of malnutrition in percentiles than in z-scores. The following table shows the relationship
between the two:
Percentile z-score
>99th
3
97th
2
85th
1
50th
0
15th
-1
3rd
-2
<1st -3
The following are growth charts using both measurements for girls, and excerpts from simplified
field tables. All are for ages 0-5; though they are available for various age ranges, both sexes,
and in more detailed measurements.
15
WHO weight-for-age chart for girls, by z-score
15
http://www.who.int/childgrowth/standards/cht_wfa_girls_z_0_5.pdf

Andrew R. Bracken ICDS Report
11
16
WHO weight-for-age chart for girls, by percentile
17
WHO weight-for-age simplified field table for girls, by z-score
16
http://www.who.int/childgrowth/standards/cht_wfa_girls_p_0_5.pdf 17
http://www.who.int/childgrowth/standards/sft_wfa_girls_z_0_5.pdf

Andrew R. Bracken ICDS Report
12
18
WHO weight-for-age simplified field table for girls, by percentile
The following image is of the new WHO growth charts used in AWCs. This particular chart is
from Patna Sadar 1. The charts come in a book separated by gender (blue pages for boys, pink
pages for girls), each page with one chart. The graph’s colour-coding in green, yellow, and red
clearly shows a child’s nutritional status. It shows a male of 25 months in the red area, although
he seems to be growing fast enough to move into the less malnourished yellow area in several
months.
New WHO colour-coded growth chart (Male, 2 years 1 month)
18
http://www.who.int/childgrowth/standards/sft_wfa_girls_p_0_5.pdf

Andrew R. Bracken ICDS Report
13
WHO child growth standards:19
I used WHO standards to determine malnutrition in children
ages 0-5. While children up to six years old attend AWCs, the WHO standards only apply to age
five. The WHO developed growth standards based on its Multicentre Growth Reference Study
(MGRS) from 1997 to 2003, based on data from approximately 8,500 children in six countries:
Brazil, Ghana, India, Norway, Oman, and the United States.
While some argue that India should use a different measurement or that WHO measures do not
apply to Indians, these guidelines are considered the global standard. According to the WHO:
The standards describe normal child growth from birth to 5 years under optimal
environmental conditions and can be applied to all children everywhere,
regardless of ethnicity, socioeconomic status and type of feeding.20
The MGRS used a variety of measurements to determine growth, including head circumference-
for-age, weight-for-age, and weight-for-height. While it is not necessary to use every
measurement to determine malnutrition, it is best to collect as much information as possible.
The WHO website also provides materials for a Training Course on Child Growth Assessment to
train healthcare workers in monitoring child growth.
DATA COLLECTION
At each AWC I collected the best available data for malnutrition: Growth cards, new WHO
growth charts, old WHO growth charts, personally weighing children, THR records. Given the
type of data sevikas collect, the best way to measure malnutrition rates is to use the WHO’s
guidelines based on weight-for-age, as other data like head circumference and height are not
collected by sevikas.
I also downloaded 2011-12 data from the ICDS MIS for each block in Patna District to analyse
the role of gender in malnutrition, supplementary nutrition, and THR provision.
Data collection challenges: The quality of data I encountered in Patna and Vaishali Districts
varied widely. Some AWCs have no growth data on children ages 0-5, while other centres use
the newest WHO growth charts each month for every child. Most centres I visited do not use the
new colour-coded WHO charts, even though some have them and should all use them.
I was not able to visit randomly selected AWCs for various reasons. I faced difficulties
explaining statistical methods to CDPOs. I believe they took me to “good” centres, partly
because they reflect well on the CDPO but also because a “bad” centre is not likely to have
19
http://www.who.int/childgrowth/en/ 20
http://www.who.int/childgrowth/faqs/applicable/en/index.html

Andrew R. Bracken ICDS Report
14
useful data. Even if I had visited randomly selected centres, I believe data collection would have
been more difficult, not to mention the logistical challenges of traveling to spread out AWCs.
Many sevikas monitor children’s weight occasionally but not every month, which reduces the
growth charts’ usefulness. If a sevika consistently plots a child’s weight, a z-score (or percentile)
far below the mean (or 50th
percentile) can be shown graphically to result from an illness and a
deviation from a normally healthy growth trajectory. If a sevika only plotted weight once every
six months, if many children were ill during that time they would appear more malnourished than
they really are. Also, if a child has oedema, his/her malnutrition status may not be valid, though
according to previous studies oedema is not as large a problem in India as it is in other countries.
Sevikas do not test for oedema.
Each sevika has a different system of records. Some keep records for all 40 registered students,
some keep records for students and children 0-3, although many do not have complete records
for either group. Many sevikas combine children 0-3 and students in the WHO growth charts or a
THR notebook. Very few sevikas keep a register of children in the community who are on the
AWC’s “waiting list.” The lack of a visible student list makes it difficult or impossible to
determine which children in attendance are actually registered. It is impossible to tell if the most
deserving children attend the AWC or receive THR.
Sevikas do not use a consistent format for recording growth data. For age, some sevikas use date-
of-birth, others use months, still others use the “year.month” format (e.g. 16 months is 1.4, or 1
year 4 months). In the date-of-birth format, it is necessary to know when the sevika recorded the
child’s weight, because it is necessary to know how old the child was at the date of measurement
to determine if she or he is malnourished. Sevikas always record weight in kilograms, though it
is clear that they do not take accurate measurements because so many records end in 0 or 5 (e.g.
10.5 kg or 5.0 kg), but rarely in other digits (e.g. 3.7 kg or 11.4 kg).
Finally, many AWCs do not have equipment for measuring children, or if they do, sevikas do not
know how to properly use the equipment. Therefore it is difficult to know how the sevika got the
data she plotted. It could simply be data reused from a different year, or a guess. A good sevika
intuitively knows if a child is relatively healthy or not, but it is necessary to record this data.
In some cases I could not determine if the sevika had correctly plotted or recorded growth data,
even if she had done the measurements correctly. If I believed data to be incorrect or extremely
flawed I excluded it from my analysis. This is why my analysis does not include all 34 AWCs I
visited. It was not possible to conduct a random sample of AWCs in either district, so for
malnutrition I will not make broad conclusions about blocks based on the data I collected at
AWCs, only about the individual AWCs.
On the MIS, data was only available for one month from 2011-12 for each block in Patna
District. This could be because CDPOs did not submit reports, or the data centre staff did not
enter data. The strength of my analysis depends on the accuracy of the data in the MIS. I

Andrew R. Bracken ICDS Report
15
downloaded data from each block in Patna District except for Naubatpur and Patna Sadar 3,
which were not available. I reached conclusions about the effect of gender on three things:
malnutrition, the supplementary nutrition programme (SNP), and THR in Patna District.
DATA ANALYSIS
WHO Anthro software:21
The WHO developed software called Anthro for personal computers
and mobile devices. Anthro can be used to apply WHO growth standards and motor skills
development to children ages 0-5. The software includes three modules: Anthropometric
calculator (AC), Individual assessment (IA), and Nutritional survey (NS). A healthcare worker
can input comprehensive data about the child including birthdate, date, gender, height, oedema
status, and weight. Anthro calculates the malnutrition status and magnitude of malnutrition for
each child and creates reports for groups of 12 or more children. It creates growth charts for
individual children. Data can be exported to Excel, STATA, and other software programmes.
AWC malnutrition analysis with Anthro: I entered all relevant data collected from AWCs in
Anthro. Some AWCs provided data that appeared incorrect for various reasons; I did not use this
data. The data collected was age (in days), sex, and weight in kilograms. Most growth records at
AWCs are in months, so I converted them to days using WHO guidelines. Anthro assigns each
child a randomised birthdate within his/her age range because I usually did not have their
birthdates. For each AWC I created a NS of children ages 0-5.
Anthro: user interface Anthro: Individual record
21
http://www.who.int/childgrowth/software/en/

Andrew R. Bracken ICDS Report
16
For each child Anthro calculates the standard deviations from the mean and which percentile the
child falls under, based on the data entered. A mean of 0 (z-score of 0) or the 50th
percentile are
considered ideal weight-for-age, with children below undernourished and children above over-
nourished. I created an NS for each AWC. The data are approximately normally distributed or
skewed to the right. The data can be separated by age group and gender. Anthro creates reports
with the mean z-score and standard deviation for each NS, for the entire AWC and for age
groups or by gender. Anthro calculates 95% confidence intervals for each NS for two and three
standard deviations from the mean. All of these data can be exported and analysed with software
programmes. Anthro omits values which are considered too extreme, though they could be valid,
especially with the poor nutritional status of many AWC children.
The following are Anthro outputs which can be used for analysis and are based on the data
entered in the software.

Andrew R. Bracken ICDS Report
17
Nutritional survey standard analysis
Detailed tables with 95% confidence intervals*
Set 1: Sexes combined
Age groups N Weight-for-age (%)
% < -3SD (95% CI) % < -2SD (95% CI) Mean SD
Total: 36 19.4 (5.1%, 33.8%) 72.2 (56.2%, 88.2%) -2.37 0.97
(0-5) 2 0 (0%, 25%) 50 (0%, 100%) -1.49 0.76
(6-11) 4 25 (0%, 79.9%) 75 (20.1%, 100%) -2.98 2.07
(12-23)17 17.6 (0%, 38.7%) 76.5 (53.4%, 99.6%) -2.32 0.68
(24-35)13 23.1 (0%, 49.8%) 69.2 (40.3%, 98.2%) -2.37 0.88
(36-47)0
(48-60)0
Set 2: Males
Age groups N Weight-for-age (%)
% < -3SD (95% CI) % < -2SD (95% CI) Mean SD
Total: 16 43.8 (16.3%, 71.2%) 75 (50.7%, 99.3%) -2.81 1.24
(0-5) 0
(6-11) 1 100 (50%, 100%) 100 (50%, 100%) -5.98 0
(12-23)6 50 (1.7%, 98.3%) 66.7 (20.6%, 100%) -2.77 0.86
(24-35)9 33.3 (0%, 69.7%) 77.8 (45.1%, 100%) -2.49 1.03
(36-47)0
(48-60)0
Set 3: Females
(6-11) 3 0 (0%, 16.7%) 66.7 (0%, 100%) -1.98 0.64
(12-23)11 0 (0%, 4.5%) 81.8 (54.5%, 100%) -2.08 0.43
(24-35)4 0 (0%, 12.5%) 50 (0%, 100%) -2.11 0.35
(36-47)0
(48-60)0
Excerpt from Anthro standard report (Dulhin Bazar AWC 057)

Andrew R. Bracken ICDS Report
18
Anthro: Graph of weight-for-age, by age (Fatuha AWC 026)
Anthro: Graph of weight-for-age, by sex (Fatuha AWC 026)

Andrew R. Bracken ICDS Report
19
Anthro: Individual record. Female, 334.4 days old, 6.10 kg, -3.02 standard
deviations from the mean (Fatuha AWC 026)
The following table is the result of extensive AWC visits and analysis using Anthro and Excel.
Block/AWC
Date
Visited
AWC weight-for-age data
(n = number of children, z = z-
score, sd = standard deviation)
Notes (where applicable) Female Male Total
Dulhin Bazar
1 011 19/06/12 n= 9
z= -2.45
sd= 0.37
n= 19
z= -2.69
sd= 0.49
n= 28
z= -2.6
sd= 0.46
Very good records on old growth
chart for 80 children (0-3 THR and
AWC students). Large AWC in
Urdu-language school. More than
40 children. Most children in
uniform. Children appear
moderately healthy.
2 057 19/06/12 n= 20
z= -2.01
sd= 0.47
n= 16
z= -2.81
sd= 1.24
n= 36
z= -2.37
sd= 0.97
Good records. Moderately large
AWC with outside courtyard. We
arrived after 12:00 PM; all children
had eaten and left AWC.
Total: 2
AWCs
Fatuha

Andrew R. Bracken ICDS Report
20
1 001 14/06/12 n= 8
z= -1.55
sd= 1.17
n= 13
z= -1.31
sd= 0.77
n= 21
z= -1.4
sd= 0.92
Most children in uniform. AWC is
well-ventilated. Very good records:
Growth cards and new growth
charts.
2 005 04/07/12 n= 25
z= -1.87
sd= 1.77
n= 22
z= -1.29
sd= 1.3
n= 47
z= -1.6
sd= 1.58
Records in new WHO growth chart
but sevika has plotted some
children incorrectly.
3 012 14/06/12 n= 19
z= -1.64
sd= 0.76
n= 20
z= -2.51
sd= 0.87
n= 39
z= -2.08
sd= 0.92
Good growth records.
4 013 04/07/12 n= 35
z= -2.18
sd= 1.08
n= 19
z= -1.95
sd= 1.23
n= 54
z= -2.1
sd= 1.13
Good records in new WHO growth
charts. Sevika is very experienced.
35 children present. Some in
uniform. Children are well-
behaved. Many flies in AWC,
possibly because of the rain. Some
children have skin problems.
5 021 14/06/12 n= 9
z= -3.02
sd= 1.83
n= 4
z= -1.79
sd= 2.04
n= 13
z= -2.64
sd= 1.9
Well-organized AWC. Incomplete
records. Most children in uniform.
>10 unregistered children present;
health appears poor. Children
received snack of puffed riced; fruit
is not affordable.
6 024 04/07/12 No data No data No data No growth data. Sevika keeps age
in one notebook and weight in
another. She has a new WHO
growth chart but does not use it.
7 026 04/07/12 n= 48
z= -2.91
sd= 0.81
n= 33
z= -2.42
sd= 0.58
n= 81
z= -2.28
sd= 0.73
Good records in new WHO growth
chart. 40 children present. Some in
uniform. AWC has nice courtyard
and veranda.
8 127 29/06/12 No data n= 32
z= -2.36
sd= 0.84
n= 32
z= -2.36
sd= 0.84
Sevika using new WHO growth
chart but all female and some male
records did not appear correctly
plotted. There were used
immunization needles outside the
AWC near where food is prepared,
a major health concern.
9 128 29/06/12 No data No data
No data AWC was built with Government
funds and community support.

Andrew R. Bracken ICDS Report
21
AWC is closed and the community
is angry. LS and CDPO recorded
complaints and testimony from
community. Used immunization
needles outside the AWC, a major
health concern.
10 186 29/06/12 No data No data
No data No growth data recorded. >30
children present. 3 children in
uniform. Sevika not distributing
THR in correct quantities. LS and
CDPO recorded complaints and
testimony from community.
Total: 10
AWCs
Hajipur
1 058 26/06/12 n= 18
z= -1.63
sd= 1.12
n= 20
z= -1.79
sd= 1.27
n= 38
z= -1.71
sd= 1.18
Growth records from old WHO
chart.
2 061 26/06/12 n= 24
z= -1.83
sd= 1.15
n= 17
z= -2.15
sd= 1.38
n= 41
z= -1.96
sd= 1.24
Complete records.
3 062 26/06/12 n= 26
z= -1.85
sd= 1.33
n= 14
z= -1.79
sd= 1.37
n= 40
z= -1.83
sd= 1.33
Complete records.
4 076 26/06/12 n= 17
z= -2.81
sd= 0.30
n= 11
z= -3.03
sd=0.68
n= 28
z= -2.9
sd= 0.49
Nice, airy AWC. Sevika has started
to use new WHO growth charts, but
records children using the THR
notebook. Children seemed bored
or without energy.
5 077 26/06/12 n= 14
z= -1.72
sd= 1.62
n= 25
z= -1.65
sd= 1.91
n= 39
z= -1.68
sd= 1.79
Good records in THR notebook.
Children mostly in uniform.
Children using blackboards to learn
to write.
Total: 5
AWCs
Masaurhi
1 203 08/06/12 No data No data No data Met several girls from SABLA
scheme who seem empowered and
respected in the community. Not all
pregnant women take advantage of

Andrew R. Bracken ICDS Report
22
prenatal care at local health
facilities. I did not collect data here,
but it was available.
Total: 1 AWC
Patna Sadar 2
1 006 13/06/12 No data No data No data AWC was closed at 10:30 AM.
2 013 13/06/12 n= 19
z= -3.02
sd= 1.81
n= 10
z= -3.06
sd= 1.19
n= 29
z= -3.04
sd= 1.6
Approximately 20 children present.
0 children in uniform. Good growth
data.
3 016 13/06/12 No data No data No data Approximately 22 children present.
Incomplete growth data from
growth cards. No growth charts. No
money for snacks. Some children in
the area attend private school
instead of AWC.
4 019 13/06/12 No data No data No data Very small AWC located in a
garage. AWC smells strongly of
oil: Must be bad for the children.
Many flies. Environment outside of
AWC very poor with trash and
standing water. Many children with
skin diseases. Approximately 23
children present. 5 children in
uniform. Sevika has old and new
growth charts but does not know
how to use either.
5 159 15/06/12 No data No data No data AWC does not have complete
registers. Approximately 8 children
present. Most children appear
unhealthy with skin diseases.
Several bags of THR, probably rice
and pulses, arrived for distribution.
8 women brought children 0-3 for
THR. We weighed them. Sevika
did not know how to correctly use
the scale.
6 190 13/06/12 No data No data No data Very small. Approximately 22
children present. No growth charts.
Few children in uniform.
7 191 15/06/12 n= 8 n= 10 n= 18 Poor records. Incomplete THR and

Andrew R. Bracken ICDS Report
23
z= -0.95
sd= 1.12
z= -1.38
sd= 1.22
z= -1.19
sd= 1.16
other registers. No growth data.
<20 children present. Some
children in uniform.
Total: 7
AWCs
Patna Sadar 3
1 046 20/06/12 n= 13
z= -1.81
sd= 1.1
n= 29
z= -2.45
sd=0.77
n= 42
z= -2.23
sd= 0.93
Good growth data from growth
cards. AWC is very small. Many
sevikas in Sadar 3 contribute their
own money for rent.
2 051 20/06/12 n= 21
z= -3.30
sd= 0.75
n= 19
z= -3.39
sd= 0.93
n= 40
z= -3.34
sd= 0.83
Good growth records. AWC
located in a tiny hallway with small
businesses.
3 154 20/06/12 n= 13
z= -1.81
sd= 1.1
n= 29
z= -2.41
sd= 0.79
n= 42
z= -2.22
sd= 0.93
Good growth data on old charts.
Sevika very experienced.
Total: 3
AWCs
Patna Sadar 4
1 033 21/06/12 n= 37
z= -2.23
sd= 1.02
n= 34
z= -1.87
sd= 0.95
n= 71
z= -2.06
sd= 1.00
Excellent records. AWC small but
well-organized. One child is
severely malnourished (6 years old,
<10 kg, exhibits all classic signs of
severe malnourishment).
2 035 21/06/12 n= 7
z= -3.15
sd= 1.41
n= 6
z= -4.22
sd= 1.56
n= 13
z= -3.64
sd= 1.52
Incomplete data in old WHO
growth chart. Sevika does not use
her new WHO chart.
3 070 21/06/12 n= 15
z= -2.05
sd= 1.66
n= 23
z= -1.72
sd= 1.65
n= 38
z= -1.85
sd= 1.64
Excellent records using new WHO
growth chart. Children well-
behaved and most in uniforms.
AWC is a good environment for
children.
4 076 21/06/12 n= 13
z= -2.06
sd= 0.74
n= 25
z= -2.01
sd= 0.93
n= 38
z= -2.03
sd= 0.86
Excellent records using new growth
charts. Children well-behaved and
mostly in uniforms.
Total: 4
AWCs
Chart total: 34 AWCS

Andrew R. Bracken ICDS Report
24
The following table summarizes the best and worst results from AWCs in malnutrition:
Block AWC z-score Percentile Notes
Best females Patna Sadar 2 191 -0.95 17.1 Questionable data
Best males Fatuha 005 -1.29 9.9
Best total Patna Sadar 2 191 -1.19 11.7 Questionable data
Worst females Patna Sadar 3 051 -3.30 0.0005
Worst males Patna Sadar 4 035 -4.22 0.00001
Worst total Patna Sadar 4 035 -3.64 0.0001
The following table shows the percentages of children below -2 and -3 standard deviations from
the ideal mean of 0, and a weighted percentage total for the AWCs included. These are AWCs I
visited which had sufficient data to analyse.
Block AWC <-3 <-2 n
Dulhin Bazar 011 14.30 92.90 28 400.40 2,601.20
Dulhin Bazar 057 19.40 72.20 36 698.40 2,599.20
Fatuha 001 0.00 33.30 21 - 699.30
Fatuha 005 23.40 36.60 47 1,099.80 1,720.20
Fatuha 012 10.30 46.20 39 401.70 1,801.80
Fatuha 013 22.20 57.40 54 1,198.80 3,099.60
Fatuha 021 38.50 53.80 13 500.50 699.40
Fatuha 026 17.30 67.90 81 1,401.30 5,499.90
Fatuha 127 18.80 68.80 32 601.60 2,201.60
Hajipur 058 5.30 42.10 38 201.40 1,599.80
Hajipur 061 19.50 53.70 41 799.50 2,201.70
Hajipur 062 20.00 32.50 40 800.00 1,300.00
Hajipur 076 39.30 96.40 28 1,100.40 2,699.20
Hajipur 077 20.50 53.80 39 799.50 2,098.20
Patna 2 013 72.40 79.30 29 2,099.60 2,299.70
Patna 2 191 5.60 16.70 18 100.80 300.60
Patna 3 046 23.80 52.40 42 999.60 2,200.80
Patna 3 051 60.00 100.00 40 2,400.00 4,000.00
Patna 3 154 23.80 50.00 42 999.60 2,100.00
Patna 4 033 15.50 47.90 71 1,100.50 3,400.90
Patna 4 035 69.20 84.60 13 899.60 1,099.80
Patna 4 070 26.30 50.00 38 999.40 1,900.00
Patna 4 076 15.80 36.80 38 600.40 1,398.40
Total 868 20,202.80 49,521.30
23.28 57.05Total %

Andrew R. Bracken ICDS Report
25
The three tables show the terribly high malnutrition levels in AWCs visited. In the best centres
(one of which had questionable data) malnutrition rates are still very high, while the worst
centres’ rates are almost impossibly high. While the centres were not randomly selected and thus
impossible to generalise across Patna District, it is likely that malnutrition levels are similarly
high everywhere. The majority of AWCs visited had weight-for-age z-scores of below -2 or
below the 3rd
percentile, which means 97% of children worldwide have higher weight-for-age.
The notes column in the first table shows the irregularity in recordkeeping. Several AWCs had
no records, while most had outdated records in incorrect or outdated formats, like the black and
white WHO growth charts or only THR registers. However, the consistently low z-scores lead
me to believe that even with incomplete and poor recordkeeping the data I found presents an
accurate picture of terrible malnutrition in AWCs, although it might not be the most current data.
The percentages in the final table match almost exactly the percentages for <-3 and <-2 standard
deviations from the ideal mean of 0 found in Bihar by the WHO in 2005-6: 25.4% and 56.4%,
versus the 23.3% and 57.0% I observed.22
The national figures for India were 24.3% and 50.7%.
This lends credibility to the data I collected. It shows a slight worsening in <-2 malnutrition and
a slight improvement in <-3 malnutrition since 2005-6 in Bihar. If this data is correct, it shows
little progress has been made in improving childhood nutrition.
AWC malnutrition gender independence analysis: To determine if there was a statistically
significant difference between malnutrition rates in females and males in AWCs visited, I
analysed data using independence tests in Excel. I obtained this information by first entering
malnutrition data from AWCs into Anthro software. Then I exported the reports and edited them
for use in Excel. I used t-tests to test for independence, with two tails to correct for errors in data
and data collection. I treated most comparisons as homoscedastic (equal variance) unless the
difference in observations for females and males warranted treating them as heteroscedastic
(unequal variance). I used the standard alpha level of 0.05 for all statistical analyses, which
means that the probability of finding the result I found was less than 5% if the difference
between means for females and males was zero as assumed (i.e. there was no difference in
malnutrition between the sexes). As I was not able to randomly sample AWCs, I cannot make
conclusions about Patna District, only the individual AWCs I visited.
22
http://www.who.int/nutgrowthdb/database/countries/who_standards/ind.pdf

Andrew R. Bracken ICDS Report
26
#
Block AWC Alpha
Statistically
significant?
Which group is more
malnourished?
1 Dulhin Bazar 011 0.2162 No
2 Dulhin Bazar 057 0.0250 Yes Males
3 Fatuha 001 0.5686 No
4 Fatuha 005 0.2062 No
5 Fatuha 012 0.0021 Yes Males
6 Fatuha 013 0.4757 No
7 Fatuha 021 0.8317 No
8 Fatuha 026 0.1566 No
9 Hajipur 058 0.6727 No
10 Hajipur 061 0.4428 No
11 Hajipur 062 0.8960 No
12 Hajipur 076 0.3443 No
13 Hajipur 077 0.8023 No
14 Patna Sadar 2 013 0.9494 No
15 Patna Sadar 2 191 0.4589 No
16 Patna Sadar 3 046 0.0446 Yes Males
17 Patna Sadar 3 051 0.7423 No
18 Patna Sadar 3 154 0.0516 No
19 Patna Sadar 4 033 0.1418 No
20 Patna Sadar 4 035 0.2175 No
21 Patna Sadar 4 070 0.5476 No
22 Patna Sadar 4 076 0.3327 No
This table shows that in the AWCs visited, there were only three where there was a statistically
significant difference in malnutrition rates between females and males. In those three AWCs,
males were more malnourished than females. This table and the one before it show that while
malnutrition rates are extremely high in AWCs, females and males seem to be approximately
equally malnourished. However, this result cannot be assumed true for every AWC or block in
Patna District. One reason for more highly malnourished males could be that wealthier, older
male children are sent by their parents to private or primary schools, leaving only more
malnourished males. The females in the AWC would be both poorer and wealthier, more and
less malnourished. Therefore the males would be more malnourished, assuming parents are not
as likely to send females to private or primary schools, regardless of the family’s wealth.
Patna District malnutrition, SNP, and THR gender independence analysis: To determine if there
was a statistically significant difference in malnutrition and the provision of SNP and THR
between females and males in Patna District, I analysed block-level data from the MIS using

Andrew R. Bracken ICDS Report
27
independence tests in Excel. I used the chi-squared (X2) test of independence to analyse data
from 2011-12 for every block except Naubatpur and Patna Sadar 3, which had insufficient data.
The chi-squared test compares actual values to predicted values. I assumed that females and
males would have the same malnutrition rates and equal access to SNP and THR. The predicted
values are thus based only on the proportion of children eligible for each programme. For
example, if 40 females and 30 males were eligible for THR, and THR was available for 35
children (half of the total of 70 eligible children), I assumed that 20 females and 15 males would
receive THR, or half (50%) of each sex.
I chose the standard alpha level of 0.05, which means that the probability of finding the result I
found was less than 5% if the difference between females and males in malnutrition rates and
SNP and THR provision was zero. I used data from all but two blocks in Patna District, though
some blocks clearly did not have complete data. I am somewhat confident in making conclusions
about Patna District based on my analysis given the large amount and relative completeness of
data analysed.
Highlighted cells represent a statistically significant result, which suggest that the provision of
SNP or THR, or the level of malnutrition, is dependent on sex. If SNP or THR provision favours
one sex, it means that sex receives more SNP or THR than expected based on eligibility. If
malnutrition rates are worse for one sex, it means that sex has higher levels of malnutrition in a
given category than expected by enrolment numbers.
The following three tables show the result of independence tests for each block in total SNP and
SNP >15 days, and which sex SNP provision favours if there is a statistically significant
difference. The final tables show the percentages of favour (no difference, favours females,
favours males) as a total and by age group.

Andrew R. Bracken ICDS Report
28
Age group
Total SNP Favours >15 days Favours
1 Bakhtiyarpur 0.9321 0.9321
2 Barh 0.0046 Boys 0.0046 Boys
3 Bihta 0.1456 0.1456
4 Bikram 0.4058 0.0591
5 Danapur 0.0000 Girls 0.0001 Girls
6 Dhanarua 0.7889 0.5347
7 Dulhin Bazar 0.6111 0.6111
8 Fatuha 0.0002 Girls 0.4748
9 Khusrupur 0.4066 0.1199
10 Maner 0.1894 0.3663
11 Masaurhi 0.0349 Girls 0.0009 Girls
12 Mokama-Ghoshwari 0.9656 0.9656
13 Paliganj 0.2898 0.2378
14 Pandarak 0.8898 0.8898
15 Patna 1 0.9626 0.0477 Girls
16 Patna 2 0.2316 0.0367 Girls
17 Patna 4 0.0031 Girls 0.0001 Girls
18 Patna 5 0.1974 0.2912
19 Patna Gramin 0.1366 0.3433
20 Phulwari Sharif 0.1555 0.1473
21 Punpun-Sampatchak 0.2105 0.2935
6 months to 1 year
5) Number of beneficiaries for:
a) Supplementary nutrition in all reporting AWCs
Age group
Total SNP Favours >15 days Favours
1 Bakhtiyarpur 0.6538 0.6538
2 Barh 0.7577 0.2036
3 Bihta 0.0732 0.0823
4 Bikram 0.1986 0.1684
5 Danapur 0.0201 Girls 0.0209 Girls
6 Dhanarua 0.4922 0.4210
7 Dulhin Bazar 0.0503 0.0503
8 Fatuha 0.1059 0.4186
9 Khusrupur 0.0148 Girls 0.9141
10 Maner 0.9480 0.0935
11 Masaurhi 0.8023 0.0015 Boys
12 Mokama-Ghoshwari 0.3065 0.3065
13 Paliganj 0.3863 0.5416
14 Pandarak 0.5987 0.5987
15 Patna 1 0.0644 0.1363
16 Patna 2 0.9141 0.9841
17 Patna 4 0.0080 Girls 0.0027 Girls
18 Patna 5 0.0790 0.0831
19 Patna Gramin 0.0968 0.0019 Girls
20 Phulwari Sharif 0.3913 0.1104
21 Punpun-Sampatchak 0.1072 0.2716
1 to 3 years

Andrew R. Bracken ICDS Report
29
Age group
Total SNP Favours >15 days Favours
1 Bakhtiyarpur -0.0215 Girls 0.0215 Girls
2 Barh -0.8935 0.8935
3 Bihta -0.9617 0.9617
4 Bikram -0.0435 Girls 0.0206 Girls
5 Danapur 0.0000 Girls 0.0000 Girls
6 Dhanarua -0.0004 Girls 0.0011 Girls
7 Dulhin Bazar -0.1763 0.1763
8 Fatuha -0.7221 0.4568
9 Khusrupur 0.0000 Girls 0.0000 Girls
10 Maner -0.0502 0.5214
11 Masaurhi 0.0000 Girls 0.0010 Girls
12 Mokama-Ghoshwari -0.2443 0.2443
13 Paliganj -0.5059 0.8051
14 Pandarak -0.0001 Girls 0.0001 Girls
15 Patna 1 -0.0002 Girls 0.0001 Girls
16 Patna 2 0.9141 0.9841
17 Patna 4 0.0000 Girls 0.0000 Girls
18 Patna 5 0.0000 Girls 0.0000 Girls
19 Patna Gramin -0.0179 Girls 0.1316
20 Phulwari Sharif 0.0000 Girls 0.0000 Girls
21 Punpun-Sampatchak 0.0000 Girls 0.0001 Girls
3 to 6 years
No difference 83 65.87% N/A 0
Girls 40 31.75% % of total 0.00%
Boys 3 2.38%
Total 126 100.00%
SNP Favours (all ages)
Favours
Females 9 21% 6 14% 25 60%
Males 2 5% 1 2% 0 0%
No difference 31 74% 35 83% 17 40%
Total 42 100% 42 100% 42 100%
1-3 years 3-6 years6 mo - 1 year
The previous tables show that in most cases SNP does not favour either sex, but in almost 32%
of cases it favours females, mostly from ages 3-6. Males are favoured in less than 3% of cases.
Females are favoured more as they grow older, which could be because parents send their
daughters to free AWCs, but invest more in males and send them to private or primary schools.
The 3-6 age group shows the most significant result: Females are favoured in about 60% of
blocks for SNP. Males are never favoured, and in 40% of cases neither sex is favoured.

Andrew R. Bracken ICDS Report
30
The following tables show the result of independence tests for each block in single and double
THR and which sex THR provision favours if there is a statistically significant difference. The
final tables show the percentages of favour (no difference, favours girls, favours boys) as a total
and by age group.
Single THR Favours Double THR Favours
1 Bakhtiyarpur 0.1385 0.0547
2 Barh 0.1669 0.9301
3 Bihta 0.7762 0.0024 Girls
4 Bikram 0.3873 0.5235
5 Danapur 0.0001 Girls 0.0001 Girls
6 Dhanarua 0.0000 Boys 0.0898
7 Dulhin Bazar 0.1837 0.3984
8 Fatuha 0.0000 Boys 0.0000 Boys
9 Khusrupur 0.1644 0.0000 Girls
10 Maner 0.0000 Boys 0.5337
11 Masaurhi 0.0001 Boys 0.0001 Girls
12 Mokama-Ghoshwari 0.6784 0.0873
13 Paliganj 0.0321 Girls 0.4099
14 Pandarak 0.1427 0.0555
15 Patna 1 0.1267 0.8346
16 Patna 2 0.0088 Boys 0.5930
17 Patna 4 0.1689 0.0094 Boys
18 Patna 5 0.3988 0.0003 Girls
19 Patna Gramin 0.0283 Boys 0.0205 Boys
20 Phulwari Sharif 0.0000 Boys 0.2879
21 Punpun-Sampatchak 0.0236 Boys 0.0000 Girls
b) Number of children for THR
6 months to 3 years

Andrew R. Bracken ICDS Report
31
Single THR Favours Double THR Favours
1 Bakhtiyarpur 0.0126 Girls 0.0584
2 Barh 0.1167 N/A
3 Bihta 0.6740 N/A
4 Bikram 0.9298 0.0000 Boys
5 Danapur 0.0016 Girls 0.0000 Boys
6 Dhanarua 0.0668 0.0000 Boys
7 Dulhin Bazar 0.2068 N/A
8 Fatuha 0.0026 Boys 0.4235
9 Khusrupur 0.0100 Girls 0.9473
10 Maner 0.0014 Boys 0.7105
11 Masaurhi 0.1853 0.0000 Boys
12 Mokama-Ghoshwari N/A N/A
13 Paliganj N/A N/A
14 Pandarak 0.0000 Girls N/A
15 Patna 1 0.0001 Girls N/A
16 Patna 2 0.0016 Girls 0.0000 Boys
17 Patna 4 0.2547 0.0001 Boys
18 Patna 5 0.0000 Girls N/A
19 Patna Gramin 0.0000 Girls N/A
20 Phulwari Sharif 0.0000 Girls 0.0000 Boys
21 Punpun-Sampatchak 0.0050 Girls 0.0000 Girls
3 to 6 years
No difference 45 53.57% N/A 11
Females 19 22.62% % of total 13.10%
Males 20 23.81%
Total 84 100.00%
Favours
Favours
Females 8 19% 11 26%
Males 11 26% 9 21%
No difference 23 55% 22 52%
Total 42 100% 42 100%
6 mo to 3 years 3-6 years
These tables suggest that THR provision does not favour females or males about 54% of the
time, but of the remaining instances about half favour females and half favour males. This is
quite a different result from SNP, where females are overwhelmingly favoured. Age group does
not seem to be a major factor determining which sex is favoured in THR provision. One possible
reason for the difference in SNP and THR favouritism is that parents do not perceive much
personal benefit from a child receiving SNP, but send females because it is free. Parents send
males to a perceived better school even if they must pay. However, for THR, families directly

Andrew R. Bracken ICDS Report
32
benefit because they eat the food, not just the recipient. Thus families invest equally in females
and males to get THR.
From 6 months to 3 years in 55% of cases there is no favouritism, in 19% females are favoured,
and in 26% males are favoured. From 3-6 years in 52% of cases there is no favouritism, in 26%
females are favoured, and in 21% males are favoured. This could be consistent with the
hypothesis that females are healthier than males at an early age, but after two years males tend to
be healthier so females will require more nutrition. AWWs may have a female bias as well.
The following tables show the result of independence tests in each block based on weight
classification, to determine if weight classification is dependent on sex. There are five categories
(from healthiest to most unhealthy): Normal, I, II, III, and IV. For the Normal category a sex
would be classified as “Worse” if there were fewer children than expected. For categories I-IV a
sex would be classified as “Worse” if there were more children than expected.
Normal Worse Grade I Worse Grade II Worse Grade III Worse Grade IV Worse
1 Bakhtiyarpur 0.0136 Girls 0.0062 Girls 0.2651 0.8995 0.4478
2 Barh N/A N/A N/A N/A N/A
3 Bihta N/A N/A N/A N/A N/A
4 Bikram 0.4712 0.2935 0.0511 0.6780 0.1976
5 Danapur 0.0099 Girls 0.2374 0.0102 Girls 0.9725 0.1003
6 Dhanarua 0.0164 Girls 0.3705 0.8421 0.0614 0.1933
7 Dulhin Bazar N/A N/A N/A N/A N/A
8 Fatuha 0.6400 0.3039 0.7280 0.1713 0.2001
9 Khusrupur 0.6153 0.0764 0.4061 0.6182 0.2319
10 Maner 0.0359 Girls 0.3199 0.2217 0.0760 0.4433
11 Masaurhi 0.0682 0.9360 0.9283 0.2036 0.2160
12 Mokama-Ghoshwari N/A 0.5837 N/A 0.6825 N/A
13 Paliganj N/A N/A N/A 0.8787 N/A
14 Pandarak N/A N/A 0.8380 0.8463 N/A
15 Patna 1 0.0958 0.9807 0.8703 0.0362 Girls 0.4437
16 Patna 2 0.1139 0.1234 0.6292 0.0145 Girls 0.0252 Girls
17 Patna 4 0.1786 0.1992 0.7533 0.1315 N/A
18 Patna 5 0.7226 0.5385 0.9715 0.6538 N/A
19 Patna Gramin 0.4888 0.1919 0.8842 0.1890 N/A
20 Phulwari Sharif 0.4772 0.0225 Boys 0.0257 Girls 0.4404 0.6982
21 Punpun-Sampatchak 0.6850 0.1336 0.6240 0.0181 Girls 0.1665
No difference 93 88.57% N/A 28
Girls 11 10.48% % of total 26.67%
Boys 1 0.95%
Total 105 100.00%
7) By weight classification
Less than 1 year
More malnourished <1

Andrew R. Bracken ICDS Report
33
This above table shows that for children under one year, there is no difference about 89% of the
time, but where there is a difference females are almost always more malnourished than males.
This means that where there is a difference, males are overrepresented in the healthier categories.
This is not consistent with the hypothesis that under two years females are healthier than males.
1 to 3 years
Normal Worse Grade I Worse Grade II Worse Grade III Worse Grade IV Worse
1 Bakhtiyarpur 0.8622 0.0468 Girls 0.2284 0.1027 N/A
2 Barh 0.1994 N/A 0.3542 N/A 0.9753
3 Bihta 0.4959 0.6379 0.3549 N/A N/A
4 Bikram 0.8578 0.7248 0.4120 0.5562 0.0013 Boys
5 Danapur 0.0001 Boys 0.0398 Boys 0.0132 Boys 0.0003 Girls 0.0454 Girls
6 Dhanarua 0.7684 0.0156 Boys 0.6518 0.0052 Girls 0.7138
7 Dulhin Bazar N/A N/A 0.8913 N/A N/A
8 Fatuha 0.4857 0.9389 0.9687 0.7959 0.0533
9 Khusrupur 0.0614 0.7451 0.1092 0.0276 Girls 0.0001 Girls
10 Maner 0.4940 0.1864 0.8935 0.0632 0.7303
11 Masaurhi 0.6612 0.0144 Boys 0.8625 0.0464 Girls 0.0211 Girls
12 Mokama-Ghoshwari 0.9385 0.2695 N/A 0.9871 N/A
13 Paliganj 0.7942 0.7715 0.9256 0.5922 N/A
14 Pandarak N/A 0.1661 0.8914 0.3535 N/A
15 Patna 1 0.0211 Girls 0.8427 0.1716 0.5104 0.2079
16 Patna 2 0.1539 0.9614 0.1313 0.5282 0.0000 Girls
17 Patna 4 0.0000 Boys 0.0069 Boys 0.1026 0.0244 Boys N/A
18 Patna 5 0.3288 0.0453 Boys 0.0218 Boys 0.0045 Girls N/A
19 Patna Gramin 0.7385 0.1817 0.1457 0.0573 N/A
20 Phulwari Sharif 0.0434 Girls 0.0123 Boys 0.0049 Girls 0.0442 Girls 0.0023 Girls
21 Punpun-Sampatchak 0.4673 0.0080 Boys 0.1282 0.0000 Girls 0.5361
No difference 76 72.38% N/A 17
Girls 16 15.24% % of total 16.19%
Boys 13 12.38%
Total 105 100.00%
More malnourished 1-3
The table above shows that from ages 1-3, there is still not a difference in most categories (about
73%). However, this is lower than ages 0-1. Females are more malnourished (15%) but males are
not significantly better (12%). The table does show, however, that in the worst two categories
females are overrepresented (33%, 24%), while males are more represented in the second best
category, Grade I (33%). Overall females are worse off because when there is a difference, they
are overrepresented in the worst malnourishment categories.

Andrew R. Bracken ICDS Report
34
3 to 6 years
Normal Worse Grade I Worse Grade II Worse Grade III Worse Grade IV Worse
1 Bakhtiyarpur 0.7737 0.9536 0.6282 0.9004 N/A
2 Barh 0.5122 0.1325 0.3725 N/A 0.7412
3 Bihta 0.0087 Boys N/A N/A N/A N/A
4 Bikram 0.3746 0.4677 0.7735 0.0165 Boys 0.0001 Girls
5 Danapur 0.8196 0.7407 0.1069 0.8527 0.0000 Boys
6 Dhanarua 0.0215 Girls 0.0130 Girls 0.0154 Girls 0.0016 Boys 0.0919
7 Dulhin Bazar 0.8183 0.5860 0.3455 N/A N/A
8 Fatuha 0.5490 0.0880 0.3884 0.6671 0.8779
9 Khusrupur 0.6230 0.4978 0.5911 0.2745 0.7196
10 Maner 0.5460 0.1319 0.1026 0.0001 Boys N/A
11 Masaurhi 0.0428 Girls 0.4553 0.9794 0.0240 Girls 0.7294
12 Mokama-Ghoshwari 0.3113 0.6632 0.4859 N/A N/A
13 Paliganj 0.6786 0.5040 0.4497 N/A N/A
14 Pandarak 0.8151 0.6375 0.4848 N/A N/A
15 Patna 1 0.1721 0.2423 0.2855 0.0117 Boys 0.4935
16 Patna 2 0.9140 0.6858 0.4620 0.8037 0.4649
17 Patna 4 0.2932 0.8359 0.3194 0.8133 N/A
18 Patna 5 0.7921 0.2551 0.0379 Boys 0.6521 N/A
19 Patna Gramin 0.5182 0.1818 0.2081 0.6426 N/A
20 Phulwari Sharif 0.1067 0.0504 0.7332 0.2985 0.0626
21 Punpun-Sampatchak 0.5611 0.0283 Boys 0.0004 Girls 0.4581 N/A
No difference 90 85.71% N/A 19
Girls 7 6.67% % of total 18.10%
Boys 8 7.62%
Total 105 100.00%
More malnourished 3-6
The above table shows that in most cases (86%) there is no difference between genders in
malnutrition categories. Where there is a difference, males are slightly worse than females. In
ages 3-6, unlike the previous age groups, males are overrepresented in the second worst category
of malnutrition (19% versus 5% females). One possible explanation is that these males are from
the poorest families who cannot send them to a perceived better school. Healthier males are from
wealthier families and may attend private or primary school, not AWCs. More females will stay
in AWCs, regardless of their malnutrition level or their families’ wealth because families tend
not to invest in daughters.

Andrew R. Bracken ICDS Report
35
Worse
Females 4 19% 1 5% 2 10% 3 14% 1 5%
Males 0 0% 1 5% 0 0% 0 0% 0 0%
No difference 17 81% 19 90% 19 90% 18 86% 20 95%
Total 21 100% 21 100% 21 100% 21 100% 21 100%
Worse
Females 2 10% 1 5% 1 5% 7 33% 5 24%
Males 2 10% 7 33% 2 10% 1 5% 1 5%
No difference 17 81% 13 62% 18 86% 13 62% 15 71%
Total 21 100% 21 100% 21 100% 21 100% 21 100%
Worse
Females 2 10% 1 5% 2 10% 1 5% 1 5%
Males 1 5% 1 5% 1 5% 4 19% 1 5%
No difference 18 86% 19 90% 18 86% 16 76% 19 90%
Total 21 100% 21 100% 21 100% 21 100% 21 100%
Ages 0-1
Normal Grade I Grade II Grade III Grade IV
Grade INormal
Ages 1-3
Ages 3-6
Normal Grade I Grade II Grade III Grade IV
Grade IVGrade IIIGrade II
This final table above summarizes malnutrition levels by age group and sex across Patna District
blocks. For ages 0-1 females are underrepresented in the best category, “Normal,” and over
represented in the worst three categories (10%, 14%, 5%) when there is a difference. For ages 1-
3, females and males are equal in the Normal category, males are worse in Grades I and II (33%
and 10%), but females are worse in Grades III and IV (33% and 24%). For ages 3-6, females are
worse in Normal and Grade II (10% and 10%), males are worse in Grade III, and the sexes are
equal in the other categories.
Overall these block-level tables show the importance of focusing attention on females, especially
in the 1-3 group. While both sexes suffer from high rates of malnutrition, within the four
categories females are more often in the most severe categories than males. Older males should
also receive special attention because they tend to be more highly malnourished than younger
males.

Andrew R. Bracken ICDS Report
36
RECOMMENDATIONS
Use standard growth measures: Sevikas do not use consistent growth measures. Each AWC has
a different method of recordkeeping. Most sevikas record some growth measures, but every
sevika needs to use the same format. If every AWC collects growth data in a consistent format, it
will be easier for ICDS to aggregate data to know accurate malnourishment levels and respond
appropriately.
New WHO colour-coded growth charts must be distributed to every AWC.
Decide which children will be entered in the new growth charts:
Children 0-3 who receive THR
AWC students
Unregistered children/children on the AWC “waiting list”
Plot the growth data every month. Monitor children in the yellow chart area and
take action for the children in the red chart area.
Hold all staff accountable for keeping updated registers: LSs must ensure that
sevikas follow consistent standards. CDPOs must ensure that LSs properly
supervise sevikas. DPO staff must hold CDPOs accountable for the staff they
supervise.
Properly train AWWs on growth measurements: While it will not be possible for AWCs to take
every growth measurement suggested by the WHO, they should know how to correctly take
some measurements. The WHO’s Training Course on Child Growth Assessment23
includes
materials for a 3½ day training, and also a video. The materials are not available in Hindi, but
trainers could translate the information. If AWWs do not take growth measures correctly, ICDS
will not know the true nutritional status of children, and will not be able to intervene properly. Of
ICDS’s focus areas, nutrition should be a priority because a child’s nutrition in the critical first
years largely determines his or her future health and success.
Provide each AWC with scales and use them correctly: Many AWCs do not have scales to weigh
children. Even in AWCs which do have scales, AWWs need better training to use scales for
collecting weight data. Some AWCs only have bathroom scales, which are inappropriate for
measuring babies. Every AWC should have access to a hanging scale for babies, as well as a
bathroom-type scale for children who can stand still. AWWs also need training on how to “zero”
a scale, so the correct weight is taken. If a scale is not zeroed correctly, all weight-for-age data
will be incorrect. I witnessed this in Patna Sadar 2, where the sevika set the scale incorrectly by
almost 5 kg and tried to weigh struggling babies on it.
Investigate differences in SNP and THR distribution: It appears that there is sometimes a
difference in SNP provision between females and males, which favours females. ICDS should
investigate why that might be, and focus on better serving males with SNP. Conversely, it does 23
http://www.who.int/childgrowth/training/en/

Andrew R. Bracken ICDS Report
37
appear that while both females and males suffer from high malnutrition rates, females are
represented more highly in categories III and IV. Thus for THR, ICDS should focus more on
females than males.
Focus interventions on younger children, especially ages 0-2: Children aged 0-2 are most
vulnerable to the effects of malnutrition. If they do not develop correctly in this period, their
physical and mental potential will be greatly reduced, limiting their quality of life and ability to
contribute to society. Older children are less vulnerable to malnutrition.
Sevikas must focus on proper education for lactating mothers, because if children are not
properly breastfed and nourished for at least the first six months of life, by the time they enter the
AWC they will already be at large risk of permanent damage due to malnutrition. My informal
observations in Masaurhi suggest that young mothers do not have proper education and do not
use free resources available at local health centres and hospitals.
Since ICDS provides sevikas with limited resources, sevikas should focus what they do have on
the younger children. If there is money available for a snack, sevikas should ensure that the
youngest children eat it, which will require extra supervision so stronger and older children do
not take from younger children. Sevikas should ensure that the youngest children get plenty of
SNP, even if they eat more slowly than old children and thus do not appear hungry.
According to my analysis of all block-level data for Patna District, the highest statistically
significant rates and differences in malnutrition between females and males occur from ages 1-3.
Therefore ICDS should particularly focus on those children, as explained previously.
Universalise ICDS in Bihar: There is no simple way to follow this recommendation. It requires
cooperation from the Centre and State governments to fund universalization. However,
according to my AWC analysis, malnutrition rates in Bihar have essentially remained the same
since 2005-6, based on the WHO study. There are still many unregistered children and “waiting
lists” for every AWC. Many AWCs distribute THR to unregistered children who are in need but
cannot attend the local AWC because of non-universalization. Therefore ICDS should urgently
expand its fight against malnutrition though SNP, THR, and education. Bihar’s impressive
economic growth may not help the poorest of the poor, but good policies like universalization of
ICDS can.
Properly dispose used needles: I observed improper disposal of immunisation needles twice.
According to the British National Health Service (NHS) hepatitis B and C, and HIV (Human
Immunodeficiency Virus) can be transmitted through used needles.24
It is the responsibility of
the Primary Health Centre staff giving the immunisation to remove and properly dispose used
needles, but all AWWs must ensure that nurses and doctors follow the correct procedures. This is
24
http://www.nhs.uk/chq/Pages/infections-from-used-needles-or-
sharps.aspx?CategoryID=200&SubCategoryID=2001

Andrew R. Bracken ICDS Report
38
a grave public health issue for the entire community. Everyone in the community must know the
dangers of used needles, and demand that the health authorities properly dispose of them.
Used needles (Fatuha AWC 127) Used needles (Fatuha AWC 128)
Adjust AWC rental allowance by location and select healthier locations: The quality of AWCs
varies greatly across blocks. While space for rent is available in Patna city, it is expensive and
the rental allowance does not pay for acceptable centres. Sevikas use their own money to rent a
better space, or use unacceptable centres. Patna Sadar 2 had the worst centres I observed.
Many AWCs in Patna are located near trash dumps or standing water, which put children and
AWWs at high risk of hepatitis, malaria, and typhoid, amongst other diseases. In blocks outside
Patna, spaces for AWCs may not be as easily available, though they should be more affordable.
In Dulhin Bazar, Fatuha, Hajipur, and Masaurhi AWCs seemed more spacious and healthier.
ICDS should adjust the rental allowance by location, giving urban AWCs more money for rent
and demanding it is used to rent healthy spaces away from open sewers, standing water, and
trash. Rural blocks should receive a lower allowance than urban blocks. AWWs should be held
accountable for providing health spaces for children.
AWC in Patna Sadar 1, metres from trash dump

Andrew R. Bracken ICDS Report
39
CONCLUSION
My research in Patna District showed high levels of malnutrition in every AWC visited and
block which had data available on the ICDS MIS. It is well known, however, that Bihari
children, and Indian children in general, suffer terribly from malnutrition. To decrease
malnutrition, there are a few things ICDS can do.
AWWs need better training to catalogue malnutrition. Otherwise ICDS will not know where
malnutrition is most dire and requires the strongest response. ICDS should be universal in Bihar.
It should focus more resources on malnutrition, even if it means reducing resources for other
parts of its mission. ICDS should focus on the youngest children, especially from 0-2, who are
most vulnerable to the lasting damage of malnutrition and cannot defend themselves. ICDS
should determine why SNP and THR sometimes favour one sex over the other, and ensure that
children with the highest need benefit the most. Urban AWCs should have a higher rental
allowance to reflect the higher cost of rent necessary to have healthy spaces for children and
AWWs. Finally, ICDS must ensure proper disposal of used immunisation needles to protect
public health.
I believe these findings and recommendations can help ICDS to better use and focus its limited
resources on nutrition, arguably the most important area of intervention. If children are severely
malnourished at a young age they will not be able to benefit fully from pre-school education,
reach their mental and physical potential, or contribute fully to the development of Bihar and
India. ICDS can make an impact on millions of children if focuses its resources wisely on the
nutrition of the youngest and most vulnerable children.
Related Documents