1 MALNUTRITION AND SOCIOECONOMIC GAPS IN MALNUTRITION IN GHANA Van de Poel E 1 Department of Applied Economics, Erasmus University Rotterdam, The Netherlands Department of Economics, University of Antwerp, Belgium Hosseinpoor A Equity, Poverty and Social Determinants of Health, Evidence and Information for Policy, World Health Organization, Switzerland Jehu-Appiah C Policy Planning Monitoring and Evaluation Division, Ghana Health Service, Ghana Speybroeck N Equity, Poverty and Social Determinants of Health, Evidence and Information for Policy, World Health Organization, Switzerland Summary. – This study identifies factors that are associated with malnutrition and socioeconomic gaps in malnutrition in Ghana using data from the Ghana 2003 Demographic Health Survey. Socioeconomic inequality is measured in terms of a concentration index of malnutrition, which is decomposed into inequality into the determinants of malnutrition. The results show that malnutrition in Ghana is related to poverty, education, health care and family planning services and regional characteristics. To reduce poor- rich disparities in malnutrition, health policies in Ghana should further be directed at strategies/interventions to reduce poverty and to improve the use of health care services and maternal education among the poorer population groups. Furthermore, regional disparities should be tackled. 1 Correspondence to: Ellen Van de Poel Department of Applied Economics Erasmus University Rotterdam Burg. Oudlaan 50 3000 DR Rotterdam,The Netherlands Tel: +31 10 408 1502 Fax: +31 10 408 91 41 E-mail: [email protected]

Welcome message from author
This document is posted to help you gain knowledge. Please leave a comment to let me know what you think about it! Share it to your friends and learn new things together.
Transcript
1
MALNUTRITION AND SOCIOECONOMIC GAPS IN MALNUTRITION IN GHANA
Van de Poel E 1 Department of Applied Economics, Erasmus University Rotterdam, The Netherlands
Department of Economics, University of Antwerp, Belgium
Hosseinpoor A Equity, Poverty and Social Determinants of Health, Evidence and Information for
Policy, World Health Organization, Switzerland
Jehu-Appiah C Policy Planning Monitoring and Evaluation Division, Ghana Health Service, Ghana
Speybroeck N
Equity, Poverty and Social Determinants of Health, Evidence and Information for
Policy, World Health Organization, Switzerland
Summary. – This study identifies factors that are associated with malnutrition and socioeconomic gaps in
malnutrition in Ghana using data from the Ghana 2003 Demographic Health Survey. Socioeconomic
inequality is measured in terms of a concentration index of malnutrition, which is decomposed into
inequality into the determinants of malnutrition. The results show that malnutrition in Ghana is related to
poverty, education, health care and family planning services and regional characteristics. To reduce poor-
rich disparities in malnutrition, health policies in Ghana should further be directed at
strategies/interventions to reduce poverty and to improve the use of health care services and maternal
education among the poorer population groups. Furthermore, regional disparities should be tackled.
1Correspondence to:
Ellen Van de Poel
Department of Applied Economics
Erasmus University Rotterdam
Burg. Oudlaan 50
3000 DR Rotterdam,The Netherlands
Tel: +31 10 408 1502
Fax: +31 10 408 91 41
E-mail: [email protected]

2
INTRODUCTION
Background
In the developing world, an estimated 230 million (39%) children under the age of five
are chronically malnourished and about 54% of deaths among children younger than 5
are associated with malnutrition (UNICEF, 2000). Malnutrition is a major public health
and development concern, certainly in Sub-Saharan Africa, and has foregoing health and
socioeconomic impacts. In Sub-Saharan Africa, the prevalence of malnutrition among the
group of under-fives is estimated at 41% (UNICEF, 2000). It is the only region in the
world where the number of child deaths is increasing and in which food insecurity and
absolute poverty are expected to increase (United Nations, 2000; Smith, Obeid & Jensen,
2000; Smith & Haddad, 2000). Malnutrition in early childhood is also associated with
significant functional impairment in adult life and reduced work capacity, hereby
affecting economic productivity (Pelletier, Frongillo & Habicht, 1993; Pelletier &
Frongillo, 1995; Vella et al, 1992; Delpeuch et al, 2000; Mendez & Adair, 1999;
Schroeder & Brown, 1994). Children who are malnourished not only tend to have
increased morbidity and mortality but are also more prone to suffer from delayed mental
development, poor school performance and reduced intellectual achievement (Pelletier,
Frongillo & Habicht, 1993, Pelletier & Frongillo, 1995, Schroeder & Brown, 1994).
Chronic malnutrition is usually measured in terms of growth retardation. It is widely
accepted that children over the world have much the same growth potential, at least to
seven years of age. Environmental factors, diseases, inadequate diet, and the handicaps of
poverty appear to be far more important than genetic predisposition in producing
deviations from the reference. These conditions, in turn, are closely linked to overall
standards of living and the ability of populations to meet their basic needs. Therefore, the
assessment of growth not only serves as one of the best global indicators of children’s
nutritional status, but also provides an indirect measurement of the quality of life of an
entire population (de Onis, Frongillo & Blossner, 2000; Lavy et al, 1996; Martorell et al,
1992).
3
Large scale development programs such as the Millennium Development Goals (MDGs)
have also picked up on the importance of the under-fives' nutritional status as indicators
for evaluating progress (UN Millennium Project, 2006). Progress towards the MDGs and
in meeting the needs of the worlds poorest in general, should benefit all people,
irrespective of their socioeconomic status. When aiming at reducing childhood
malnutrition, it is important not only to consider averages, which can obscure large
inequalities across population groups. Failure to tackle these inequalities is acting as a
brake on making progress towards achieving the MDGs and is a cause of social injustice
(UNDP, 2005; Bambas et al, 2005).
GHANA
Against this background, Ghana provides an interesting case study. The country
experienced remarkable gains in health from the immediate post independence era. Life
expectancy improved over the years and the prevention of a range of communicable
diseases improved child survival and development. However in the last decade despite
increasing investments in health, Ghana has not achieved envisaged health outcomes.
There has been no significant change in Ghana’s under-five and infant mortality rates
between 1993 and 2003. In the last couple of years, under-five mortality is actually
slightly increasing. Life expectancy has also stagnated between 57.42 years in 2000 and
56 years in 2005 (Ghana Statistical Service, 2004). Ghana’s human development index
(HDI) is worsening too; after improving from 0.444 in 1975 to 0.563 in 2001, the HDI
dropped to 0.520 in 2005 (UNDP, 2005). Since 1988, there has been no definite trend in
malnutrition (in terms of height-for-age). Apparent gains between 1988 and 1998 were
reversed in 2003 (ORC Macro, 2005). Although the Ghana DHS 2003 final report
(Ghana Statistical Service, 2004) recommends caution when using data from the various
DHS surveys to assess the trend in the nutritional status, it is noted that there is a trend
over the past five years of increased stunting compared to a decrease of wasting and
underweight. Further, there is a trend of continued high values of stunting in the North
compared to the South (Ghana Statistical Service, 2004; Shepherd et al, 2004). However,
a further note of care is necessary when assessing trends in malnutrition as comparisons
between the 2003 and 1997 CWIQ (Core Welfare Indicators Questionnaire) data show
4
increases in the percentage of children stunted, wasted and underweight in every region
of the country, except in the three Northern regions (ISSER, 2005). 1
A paradigm shift in Ghanaian health policy is taking place in 2006. The theme for the
new Health policy in Ghana is ‘Creating Wealth through Health”. One of the fundamental
hypotheses of this policy is that improving health and nutritional status of the population
leads to improved productivity, economic development and wealth creation (Ministry of
Health, 2006). Since this policy adopts an approach that addresses the broader
determinants of health, it has thus generated interest in socio-economic inequalities in
health and malnutrition. It is further recognised that not paying attention to malnutrition
inequalities during the early years of life is likely to perpetuate inequality and ill health in
future generations and thus defeat the aims of the new health policy.
Malnutrition in Ghana is most prevalent under the form of Protein Energy Malnutrition
(PEM), which results in growth retardation and underweight. About 54% of all deaths
beyond early infancy are associated with PEM, making this the single greatest cause of
child mortality in Ghana (Ghana Health Service, 2005 a).
The contribution of this paper is twofold. First it delivers evidence on the determinants of
malnutrition in Ghana. Secondly, to our knowledge this is the first study to provide
insight into the factors behind socioeconomic inequality in malnutrition in Ghana.
METHODS
Measuring malnutrition
Nutritional status was expressed in terms of height-for-age z-scores. An overview of
other nutritional indices and why height-for-age is the most suited for this kind of
analysis is provided in Pradhan et al (2003). The z-scores are calculated as:
height of child - median height of reference population
standard deviation of reference population.
Generally, children whose height-for-age z-score is below minus 2 standard deviations of
the median of the (US) reference population are considered chronically malnourished or
stunted. In the regression models, the negative of the z-score is used as dependent

5
variable ( y ). This facilitates interpretation since it has a positive mean and is increasing
in malnutrition (Wagstaff et al, 2003). There are two advantages of using the z-score
instead of a binary or ordinal variable indicating whether the child is
(moderately/severely) stunted. First, the z-score contains more information on the depth
and duration of malnourishment instead of simply indicating whether or not the child is
malnourished. Second, it allows for linear regression analysis, which facilitates the
interpretation of coefficients and the decomposition of socioeconomic inequality.
The concentration index as a measure of socioeconomic inequality
Assume y is the negative of the height-for-age z-score that is linearly increasing in
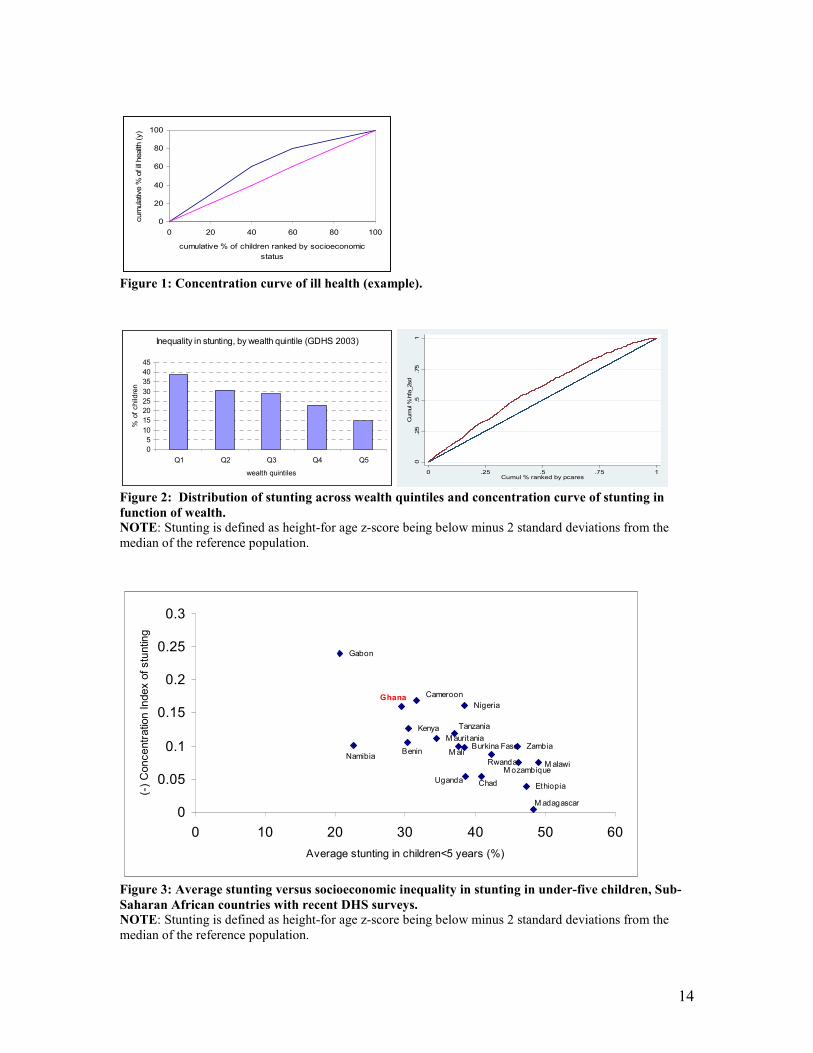
malnutrition. A concentration index (C) of malnutrition results from a concentration
curve. This curve plots the cumulative proportion of children, ranked by socioeconomic
status, against the cumulative proportion of y , as illustrated in Figure 1.
If all children, irrespective of their socioeconomic status, have the same y , the
concentration curve would coincide with the diagonal. The concentration curve lies above
the diagonal if y is larger among the poorer children and vice versa. The further the
curve lies from the diagonal, the higher the socioeconomic inequality in ill health. A
concentration index is a measure of this inequality and is defined as twice the area
between the concentration curve and the diagonal. If children with low socioeconomic
status suffer more malnutrition than their better off peers, the concentration curve lies
above the diagonal and the concentration index will be negative (Wagstaff & Van
Doorslaer, 2004). 2
Decomposition of socioeconomic inequality
More formally, a concentration index can be written as:
1
2
1
1 −=
∑
∑
=
=n
i
i
n
i
ii
y
Ry
C
where iy refers to the i -th individual and iR is its respective fractional rank in the
income distribution. If iy is linearly modelled

6
∑=
++=K
k
iikki xy1
εβα
, Wagstaf et al (2003) showed that the concentration index of y can be decomposed into
inequality in the determinants of y as follows:
µµβ εGC
Cx
C k
K
k
kk +
=∑
=1
where µ is the mean of y , kx is the mean of kx , kC is the concentration index of kx and
εGC is the generalized concentration index of the residuals. The latter term reflects the
socioeconomic inequality in y that cannot be explained by the model and is calculated as
∑=
=n
i
iiRn
GC1
2εε .
Because of the survey nature of the data, all estimates take into account clustering and
sample weights.
DATA
Data is used from the 2003 Ghana Demographic Health Survey (DHS) and restricted to
children under the age of 5. Anthropometric measures are missing for 12.3% of children
in this age group. The final sample contains information on 3000 children.3 The
nutritional status of a child is specified to be a linear function of a vector of child-level
characteristics such as age, gender, duration of breastfeeding, size at birth; a vector of
maternal characteristics such as education, mother's age at birth, birth interval, parity,
marital status, use of prenatal health services, occupation and finally a vector of
household-level characteristics such as wealth, type of toilet facility, access to safe water,
region and urbanization. The explanatory variables are described in Table 1. All have
well documented relevance in the literature (Smith & Haddad, 2000; Vella et al, 1992; de
Onis et al, 2000; Lavy et al, 1996; WHO, 1997; Wagstaff et al, 2003; Ukuwuani &
Suchindran, 2003; Alderman, 1990; Tharakan & Suchindran, 1999; Larrea & Kawachi,
2005; Brakohiapa et al, 1988; Ruel et al, 1999). 4

7
RESULTS
Summary statistics
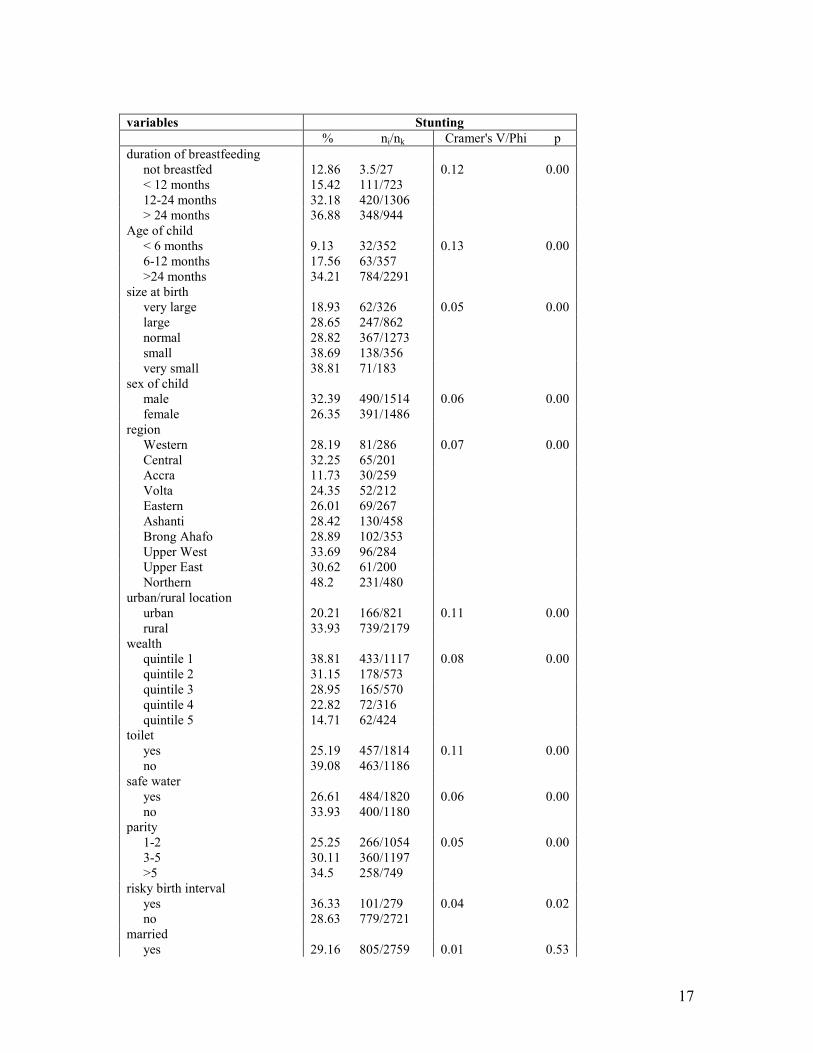
In 2003 DHS data for Ghana, 29.35% of children under the age of 5 are stunted. The
concentration index for stunting in children under the age of 5 equalled -0.167
(SD=0.018). This negative value implies that poor children had a higher probability of
being stunted than their better off peers. Figure 2 illustrates the strong socioeconomic
inequality in childhood stunting. The malnutrition rate among children in the poorest
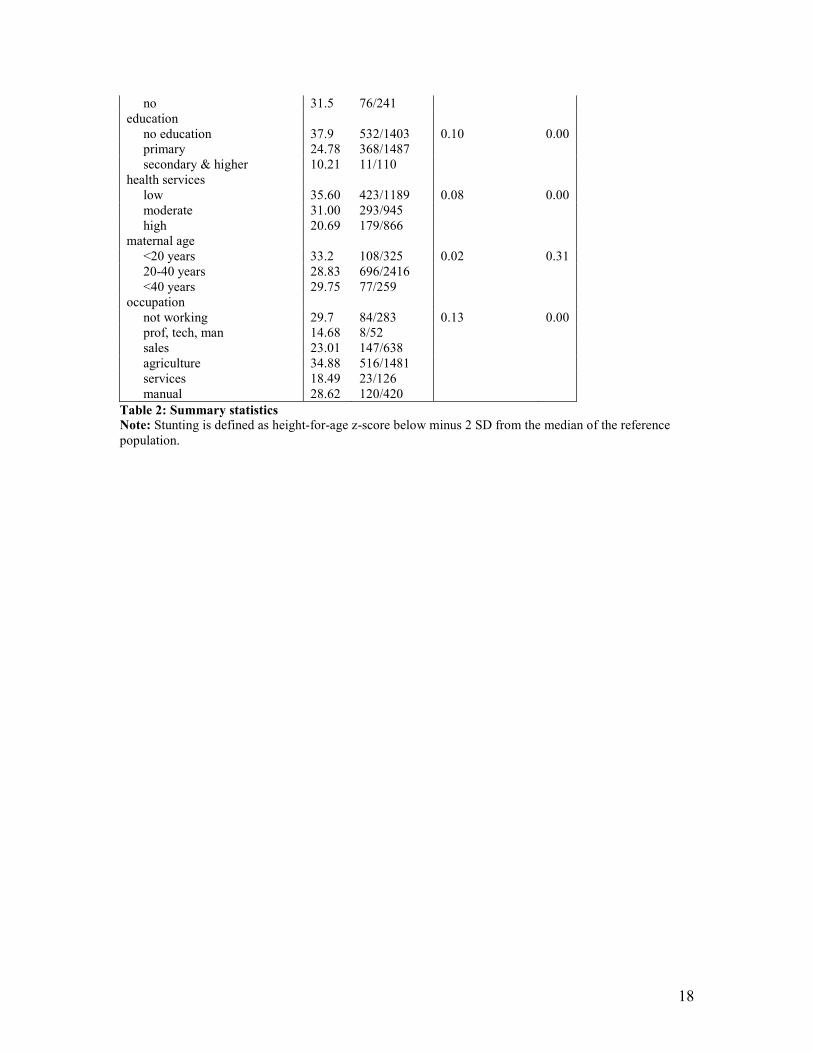
quintiles was more than twice the rate of children in the richest quintile. Figure 3 shows a
comparative picture of stunting and socioeconomic inequality in stunting across the Sub-
Saharan African region. 5
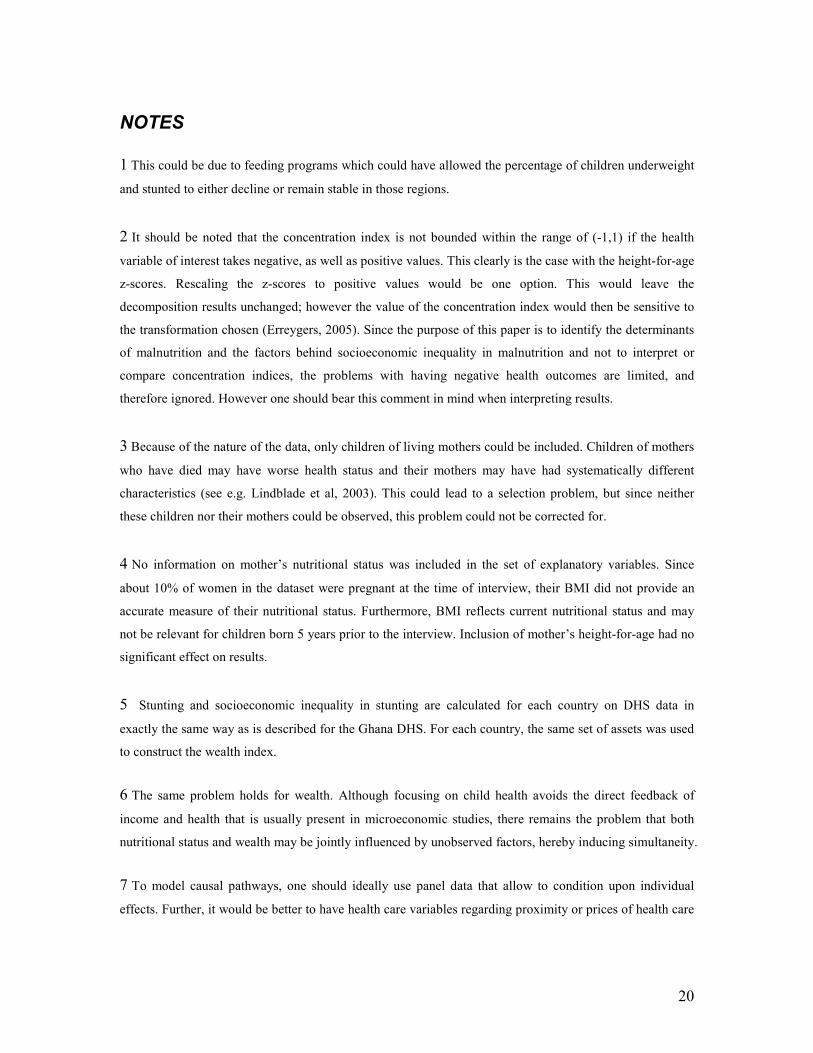
Summary statistics and bivariate relationships between explanatory variables and stunting
are shown in Table 2. Stunting is defined as height-for-age being below minus 2 SD from
the median of the reference population.
Determinants of malnutrition
The regression coefficients and their significance are shown in the first two columns of
Table 3. Note that the dependent variable is increasing in malnutrition, such that a
negative coefficient should be interpreted as lowering malnutrition.
Malnutrition increased with the child's age in a non-linear way. Children who were very
small at birth had a higher probability to be stunted than children with normal size. Male
children were more prone to malnutrition than their female peers. Long duration of
breastfeeding had a borderline significant negative impact on children's growth.
With respect to maternal characteristics, the existence of a short birth interval and higher
parity were significantly increasing malnutrition. Children of women that (highly)
accessed health services and education were less prone to being malnourished. Maternal
occupation showed no clear effect.
Household wealth and regional variables showed a strong significant association with
childhood malnutrition. Sanitation variables had no significant effect on malnutrition. As
compared to the Northern region all regions were associated with lower malnutrition.
This effect was the largest for the Accra and Volta region. The high regional disparities in
malnutrition are further illustrated in Figure 4. The four most deprived regions in Ghana

8
(Northern, Central, Upper East and Western regions) exhibited the greatest burden of
malnutrition.
Decomposition of socioeconomic inequality in malnutrition
Table 3 also shows the concentration index and the absolute and relative contributions of
each determinant to socioeconomic inequality in childhood malnutrition. For the ease of
interpretation, the last column shows the grouped contribution of the categorical variables.
A negative contribution to socioeconomic inequality implies that the respective variable
is lowering socioeconomic inequality and vice versa. A variable can contribute to
socioeconomic inequality in malnutrition both through its effect on malnutrition and
through its unequal distribution across wealth groups. The extent to which each of the
explanatory variables is unequally distributed across wealth is reflected by its C value. A
negative C means that the determinant is more prevalent among poorer households.
Wealth explained the major part (45%) of socioeconomic inequality. Other important
contributors were regional variables (15%), the use of health care services (15%) and
maternal education (9%). The age of the child was contributing negatively to
socioeconomic inequality (-9%). This means that the combined effect of its coefficient
and its distribution by wealth was lowering socioeconomic inequality in malnutrition.
Older children are more likely to be stunted and are more prevalent in higher wealth
quintiles. The latter is reflected by the positive and significant C of the variable age3
(SD=0.0056). The contribution of the error term only amounted to about 4%, meaning
that the decomposition model functioned well in explaining socioeconomic inequality in
malnutrition.
DISCUSSION
Relative to other Sub-Saharan countries, Ghana appeared to have a rather low level of
average stunting, combined with relatively high socioeconomic inequality in stunting.
Determinants of malnutrition
Malnutrition in Ghanaian children accumulated over time. The same age pattern was
found in Vella et al (1992), Wagstaff et al (2003) and Tharakan & Suchindran (2005).
The higher prevalence of malnutrition among boys as compared to girls, and the negative

9
effect of long breastfeeding are also commonly found in the literature (Vella et al, 1992;
Wagstaff et al, 2003; Brakohiapa et al, 1988; Larrea & Kawachi, 2005). Long duration of
breastfeeding may be associated with higher malnutrition because it reflects lack of
resources to provide children with adequate nutrition. It is also possible that children who
are breastfed for a long time are more reluctant to eat other foods, as was found by
Brakohiapa et al (1988) in their study on a cohort of Ghanaian children.
Short birth intervals and high parity affected childhood growth negatively by placing a
heavy burden on the mother’s reproductive and nutritional resources, and by increasing
competition for the scarce resources within the household (Brakohiapa et al, 1988).
Children of younger mothers could be more prone to malnutrition because of
physiological immaturity and social and psychological stress that come with child
bearing at young age (Heaton, 2005).
Maternal education was only significantly lowering childhood malnutrition from the level
of secondary education on. This may reflect low quality primary education for women
currently in childbearing years. It can also point to education only generating the
necessary income to purchase food from the level of secondary education on. However,
although education is often suggested to be a measure of social status, the effect stayed
significant after controlling for household wealth and living conditions. A high level of
maternal education could also lower childhood malnutrition through other pathways such
as increased awareness of healthy behaviour, sanitation practices and a more equitable
sharing of household resources in favour of the children (Smith & Haddad, 1999; Vella et
al, 1992).
Sanitation in terms of having a toilet and access to safe water was not significantly
affecting malnutrition. Ukwuani et al (2003) also reported this result, but they did find a
significant effect of sanitation on wasting (which reflects current nutritional status).
Therefore they concluded that good sanitation can avoid episodes of diarrhoea and hereby
affecting current nutritional status, while it may not be sufficient for long term child
growth.
The higher levels of malnutrition of the population living in the northern regions of
Ghana have already been observed many decades ago (see e.g. Alderman, 1990). This
regional pattern reflects ecological constraints, worse general living conditions and
10
access to public facilities in the Northern regions. In addition, the persistence of this
regional inequality can point to an intergenerational effect of malnutrition. Since women
who were malnourished as children are more likely to give birth to low-birth-weight
children, past prevalence of child malnutrition is likely to have an effect on current
prevalence.
Decomposition of socioeconomic inequality in malnutrition
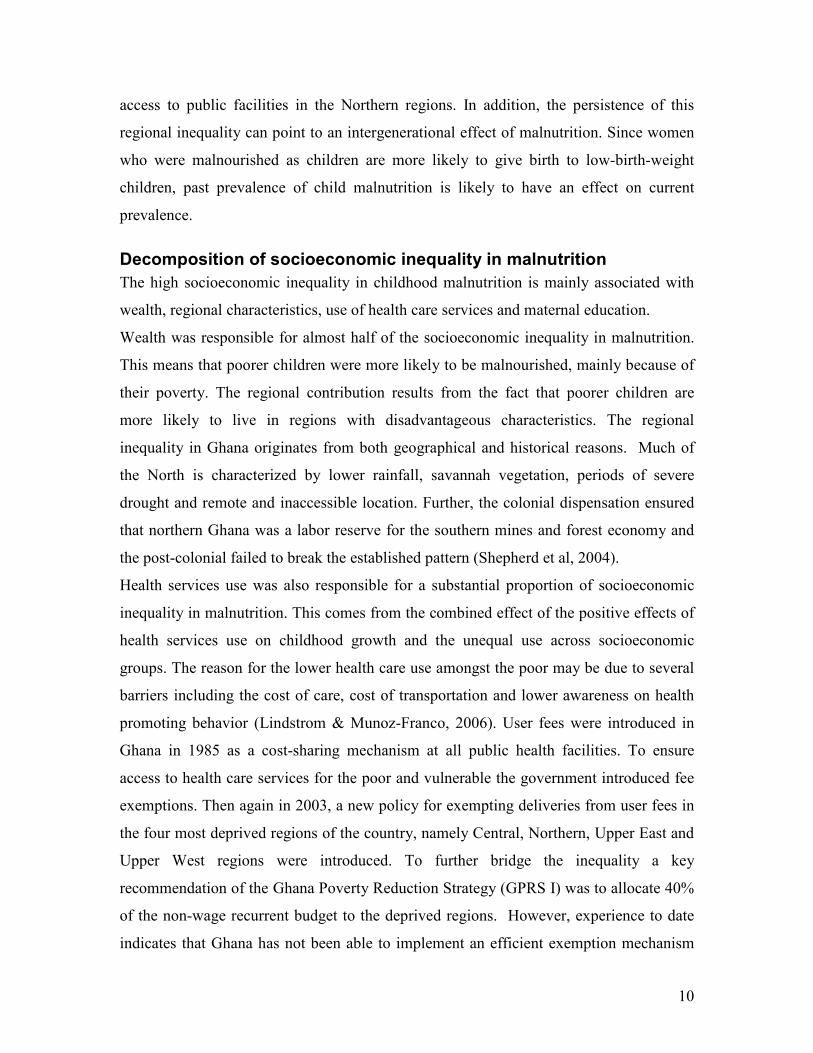
The high socioeconomic inequality in childhood malnutrition is mainly associated with
wealth, regional characteristics, use of health care services and maternal education.
Wealth was responsible for almost half of the socioeconomic inequality in malnutrition.
This means that poorer children were more likely to be malnourished, mainly because of
their poverty. The regional contribution results from the fact that poorer children are
more likely to live in regions with disadvantageous characteristics. The regional
inequality in Ghana originates from both geographical and historical reasons. Much of
the North is characterized by lower rainfall, savannah vegetation, periods of severe
drought and remote and inaccessible location. Further, the colonial dispensation ensured
that northern Ghana was a labor reserve for the southern mines and forest economy and
the post-colonial failed to break the established pattern (Shepherd et al, 2004).
Health services use was also responsible for a substantial proportion of socioeconomic
inequality in malnutrition. This comes from the combined effect of the positive effects of
health services use on childhood growth and the unequal use across socioeconomic
groups. The reason for the lower health care use amongst the poor may be due to several
barriers including the cost of care, cost of transportation and lower awareness on health
promoting behavior (Lindstrom & Munoz-Franco, 2006). User fees were introduced in
Ghana in 1985 as a cost-sharing mechanism at all public health facilities. To ensure
access to health care services for the poor and vulnerable the government introduced fee
exemptions. Then again in 2003, a new policy for exempting deliveries from user fees in
the four most deprived regions of the country, namely Central, Northern, Upper East and
Upper West regions were introduced. To further bridge the inequality a key
recommendation of the Ghana Poverty Reduction Strategy (GPRS I) was to allocate 40%
of the non-wage recurrent budget to the deprived regions. However, experience to date
indicates that Ghana has not been able to implement an efficient exemption mechanism

11
or commit to the 40% budgetary allocation to achieve the principal purpose. In addition
to these financial hurdles, poorer people are often also located further from health centers.
The ratios of population to nurses and doctors are the highest the poorest regions of
Ghana. For example the ratio of population to doctors in the northern region is 1:81338
compared to the national average of 1:17733. Trends also show that since 1995 the
Northern region has had the lowest average number of outpatient visits per capita in the
country (Ghana Health Service, 2005 b).
The negative contribution of age comes from the combined facts that older children are
more likely to be malnourished and at the same time more prevalent in the richer wealth
quintiles. The latter could be related to higher child and infant mortality rates amongst
poorer households that cause the proportion of older children to be lower among poor
households as compared to richer households.
Considerations and limitations
There exist some limitations of this study. First, for 12.3% of the children below 5 years
of age, anthropometric scores were missing. To the extent that these missing values are
not random this could introduce a problem. A logit model explaining the selection in the
sample and a Heckman sample selection model (using different exclusion restrictions)
were used to check for this (Wooldridge, 2002). Both tests did not reveal large sample
selection problems, and coefficients in the Heckman model were very similar to those in
the model presented here. Second, DHS only collects information on the recent food
consumption of the youngest child under three years of age living with the mother.
Restricting the sample to these children would substantially reduce the number of
observations. However, the analysis was also conducted on this sub sample, using food
consumption as one of the determinants of malnutrition (indices were created similar to
Tharakan & Suchindran, 1999; Larrea & Kawachi, 2005). Since the regression and
decomposition results did not alter much, these are not presented in this paper (but are
available with the authors upon request). Third, it is important to note that this paper is
not modelling causal pathways, but merely showing the factors that are associated with
malnutrition and socioeconomic inequality in malnutrition and the magnitude of these
associations. It must be admitted that the model is likely to suffer from endogeneity in the
sense that e.g. mothers who use health care services are likely to differ in other –

12
unobservable – characteristics that influence children’s nutritional status.6 This problem
however should not be exaggerated as the aim of the paper is to model correlations, not
causality.7
CONCLUSIONS AND POLICY IMPLICATIONS
The regression results show that malnutrition in Ghana is a multisectoral problem.
However in Ghana it often falls through the cracks since it has no institutional home.
Tackling malnutrition therefore calls for a shared vision and should be viewed and
addressed in a broader context (World Bank, 2004). Therefore special attention needs to
be given to policies aimed at reducing malnutrition based on the magnitude and nature of
determinants of malnutrition, such as poverty, education, health care and family planning
services and regional characteristics. Currently in Ghana, various interventions are being
implemented to reduce both PEM and micro nutrient deficiencies. These include the
Infant and Young Child Feeding Strategy (IYCF) and Community Based Nutrition and
Food Security project among others. However these initiatives address only the
symptoms of malnutrition and cannot have a sustained impact in the long term as they do
not deal with the root causes.
If equity goals are to be achieved, health policies in Ghana should further be directed at
strategies/interventions to reduce poverty and to improve the use of health care services
and maternal education among the poorer population groups. Furthermore, regional
disparities should further be tackled to narrow the gap in malnutrition between the poor
and the rich. A starting point could be for policy makers to include under-five
malnutrition differentials to set criteria to guide resource allocation to regions. Moreover,
the strong regional contributions to socioeconomic inequality, even after controlling for
other factors such as household wealth and education, bring forward the issue of
geographical targeting. Further targeting public programs towards the central and
northern regions would substantially reduce socioeconomic inequality in malnutrition and
is administratively easier than targeting the poor. The latter argument is relevant for
Ghana, where pro-poor policies (redistribution schemes and exemption policies) are not
having the aimed effect because of problems in identifying the poor (Bosu et al, 2000;
Bosu et al, 2004). Geographic targeting reduces leakage of program benefits to the non-

13
needy compared to untargeted programs, although under coverage of the truly needy can
increase. “Fine-tuning" the targeting by basing it on smaller geographic units increases
efficiency, but in some circumstances may be costly and politically unacceptable (Baker
& Grosch, 1994).
With respect to Ghana, regional averages should be interpreted with caution as there is
large heterogeneity between districts in each region and indeed among socio-economic
groups within districts. In this case, polices aimed at reducing child malnutrition based on
regional averages may lead to under coverage of those in need.8 Nonetheless, there is a
need for additional research to further decompose regional malnutrition inequalities to
generate valuable information for policy making decisions. The Ghana Growth and
Poverty Reduction Strategy (GPRSII) for 2006 – 2009 states that one of the strategies to
be implemented is developing and implementing high impact yielding strategies for
malnutrition (GPRS II, p122.) This would mean targeting areas at the greatest risks of
malnutrition, replicate best practices and expand coverage. This then should result in
decreasing malnutrition rates among children particularly in rural areas and northern
Ghana.
14
0
20
40
60
80
100
0 20 40 60 80 100
cumulative % of children ranked by socioeconomic
status
cumulative % of ill health (y)
Figure 1: Concentration curve of ill health (example).
Inequality in stunting, by wealth quintile (GDHS 2003)
0
5
10
15
20
25
30
35
40
45
Q1 Q2 Q3 Q4 Q5
wealth quintiles
% of children
0.25
.5.75
1
Cumul % hfa_2sd
0 .25 .5 .75 1Cumul % ranked by pcares
Figure 2: Distribution of stunting across wealth quintiles and concentration curve of stunting in
function of wealth.
NOTE: Stunting is defined as height-for age z-score being below minus 2 standard deviations from the
median of the reference population.
Zambia
Uganda
Tanzania
Rwanda
Nigeria
Namibia
Mozambique
Mauritania
Mali
Malawi
Madagascar
Kenya
Ghana
Gabon
EthiopiaChad
Cameroon
Burkina Faso Benin
0
0.05
0.1
0.15
0.2
0.25
0.3
0 10 20 30 40 50 60
Average stunting in children<5 years (%)
(-) Concentration Index of stunting
Figure 3: Average stunting versus socioeconomic inequality in stunting in under-five children, Sub-
Saharan African countries with recent DHS surveys.
NOTE: Stunting is defined as height-for age z-score being below minus 2 standard deviations from the
median of the reference population.

15
Inequality in stunting in children<5 years, by region
(GDHS 2003)
0
10
20
30
40
50
60
western
central
greater accra
volta
eastern
ashanti
brong ahafo
northern
upper west
upper east
% of children
Inequality in stunting in children<5 years by
grouped regions (GDHS 2003)
0
5
10
15
20
25
30
35
40
45
northern middle southern accra
regions (grouped)
% of children
Figure 4: Inequality in stunting by regions and grouped regions (as in Larrea & Kawachi, 2005).

16
Variable Description
breastfeeding duration of breastfeeding (in months)
age age of child split into 3 categories:age1≤6 months; 6 months<age2≤12 months; age3>12
size size of child at birth in 5 categories: very large, large, normal, small, very small
Sex sex of child: male(1), female (0)
region region of residence: Western, Central, Accra, Volta, Eastern, Ashanti, Brong Ahafo,
Upper West, Upper East, Northern
urban urban location (1), rural location (0)
wealth
Wealth quintiles (quintile 1) based upon principal component analysis. The wealth
indicator is estimated on household level and combines the following assets: electricity,
radio, TV, fridge, bike, motor, car, phone and the type of the flooring material (Filmer &
Pritchett, 2001).
toilet having a toilet (flush toilet, traditional pit toilet, ventilated improved pit latrine) (1-0)
water
Whether the household has access to safe water available (1-0). The following sources of
water supply were regarded as safe water: piped water (piped into dwelling, piped into
yard, plot, or public tap); water from open well (manually pumped water, protected
well); covered well or borehole (public well or private well); tanker truck or vendor; and
bottled water.
parity number of children the mother has given birth to
birth interval whether there were less than 24 months between the child's birth and the birth of the
previous child (1-0)
married whether the child's mother is married or living together (1-0)
education education level of the mother split into 3 categories: no education, primary, secondary
and higher
health service Use of health services (low, moderate, high) estimated by principal component analysis.
The indicator combines skilled birth attendance, antenatal care and proportion of
recommended vaccinations. (see Larrea & Kawachi, 2005)
maternal occupation professional, technical, managerial; clerical; sales; agriculture; services; manual; not
working
maternal age maternal age at birth in years
Table 1: Description of independent variables
NOTE: Reference categories for categorical variables used in the regression model are underscored.
17
variables Stunting
% ni/nk Cramer's V/Phi p
duration of breastfeeding
not breastfed 12.86 3.5/27 0.12 0.00
< 12 months 15.42 111/723
12-24 months 32.18 420/1306
> 24 months 36.88 348/944
Age of child
< 6 months 9.13 32/352 0.13 0.00
6-12 months 17.56 63/357
>24 months 34.21 784/2291
size at birth
very large 18.93 62/326 0.05 0.00
large 28.65 247/862
normal 28.82 367/1273
small 38.69 138/356
very small 38.81 71/183
sex of child
male 32.39 490/1514 0.06 0.00
female 26.35 391/1486
region
Western 28.19 81/286 0.07 0.00
Central 32.25 65/201
Accra 11.73 30/259
Volta 24.35 52/212
Eastern 26.01 69/267
Ashanti 28.42 130/458
Brong Ahafo 28.89 102/353
Upper West 33.69 96/284
Upper East 30.62 61/200
Northern 48.2 231/480
urban/rural location
urban 20.21 166/821 0.11 0.00
rural 33.93 739/2179
wealth
quintile 1 38.81 433/1117 0.08 0.00
quintile 2 31.15 178/573
quintile 3 28.95 165/570
quintile 4 22.82 72/316
quintile 5 14.71 62/424
toilet
yes 25.19 457/1814 0.11 0.00
no 39.08 463/1186
safe water
yes 26.61 484/1820 0.06 0.00
no 33.93 400/1180
parity
1-2 25.25 266/1054 0.05 0.00
3-5 30.11 360/1197
>5 34.5 258/749
risky birth interval
yes 36.33 101/279 0.04 0.02
no 28.63 779/2721
married
yes 29.16 805/2759 0.01 0.53
18
no 31.5 76/241
education
no education 37.9 532/1403 0.10 0.00
primary 24.78 368/1487
secondary & higher 10.21 11/110
health services
low 35.60 423/1189 0.08 0.00
moderate 31.00 293/945
high 20.69 179/866
maternal age
<20 years 33.2 108/325 0.02 0.31
20-40 years 28.83 696/2416
<40 years 29.75 77/259
occupation
not working 29.7 84/283 0.13 0.00
prof, tech, man 14.68 8/52
sales 23.01 147/638
agriculture 34.88 516/1481
services 18.49 23/126
manual 28.62 120/420
Table 2: Summary statistics
Note: Stunting is defined as height-for-age z-score below minus 2 SD from the median of the reference
population.

19
Table 3: Regression and decomposition results (dependent variable: negative height-for-age z-score).
Number of observations= 3000, R2= 0.2395, C of dependent variable=-0.1387.
variables coefficient p-value C contribution % con % con
breastfeeding 0.0079 0.0920 -0.0180 -0.0019 1.37 1.37
age
age2 0.6918 0.0000 -0.0161 -0.0010 0.73 -8.25
age3 1.4407 0.0000 0.0143 0.0125 -8.98
size at birth
size very large -0.2188 0.0100 0.1378 -0.0028 2.01 3.08
size large -0.0246 0.7020 -0.0159 0.0001 -0.07
size small 0.2718 0.0010 -0.0790 -0.0020 1.42
size very small 0.3872 0.0000 0.0285 0.0005 -0.39
sex of child 0.2321 0.0000 -0.0017 -0.0002 0.11
region
Western -0.4564 0.0000 0.0345 -0.0013 0.94 14.85
Central -0.3392 0.0230 -0.0923 0.0022 -1.59
Accra -0.6948 0.0000 0.5043 -0.0296 21.30
Volta -0.5689 0.0000 -0.1582 0.0057 -4.12
Eastern -0.4683 0.0010 0.0792 -0.0031 2.27
Ashanti -0.2616 0.0360 0.1822 -0.0070 5.04
Brong Ahafo -0.3167 0.0120 0.0297 -0.0008 0.57
Upper West -0.5419 0.0000 -0.4102 0.0056 -4.04
Upper East -0.6726 0.0000 -0.2837 0.0076 -5.51
urban -0.0843 0.2990 0.4231 -0.0093 6.72 6.72
wealth
quintile 1 0.4248 0.0000 -0.6782 -0.0731 52.71 45.19
quintile 2 0.3633 0.0030 -0.1705 -0.0091 6.55
quintile 3 0.2454 0.0180 0.2187 0.0086 -6.20
quintile 4 0.2158 0.0690 0.5406 0.0109 -7.86
toilet -0.1149 0.2340 0.1318 -0.0083 6.01 6.01
water -0.0135 0.8190 0.1288 -0.0009 0.62 0.62
parity 0.0341 0.0780 -0.0625 -0.0064 4.63 4.63
birth interval 0.2195 0.0140 0.0364 0.0006 -0.44 -0.44
married -0.0430 0.6690 0.0082 -0.0003 0.18 0.18
education
primary -0.0773 0.2650 0.1350 -0.0046 3.33 9.33
secondary & higher -0.3876 0.0010 0.6541 -0.0083 6.00
health services
moderate -0.0777 0.2600 -0.0383 0.0008 -0.54 14.72
high -0.2706 0.0020 0.3002 -0.0212 15.26
maternal age -0.0129 0.0510 -0.0049 0.0014 -1.02 -1.02
occupation
prof, tech, man -0.0308 0.8470 0.6792 -0.0003 0.24 -0.56
sales -0.2110 0.0370 0.2607 -0.0107 7.70
agriculture -0.1480 0.1530 -0.2607 0.0136 -9.81
services 0.0027 0.9850 0.2381 0.0000 -0.02
manual -0.1453 0.2350 0.1165 -0.0018 1.32
constant 0.5940 0.0130
error -0.0050 3.57 3.57
total -0.1387 100.00 100.00
20
NOTES
1 This could be due to feeding programs which could have allowed the percentage of children underweight
and stunted to either decline or remain stable in those regions.
2 It should be noted that the concentration index is not bounded within the range of (-1,1) if the health
variable of interest takes negative, as well as positive values. This clearly is the case with the height-for-age
z-scores. Rescaling the z-scores to positive values would be one option. This would leave the
decomposition results unchanged; however the value of the concentration index would then be sensitive to
the transformation chosen (Erreygers, 2005). Since the purpose of this paper is to identify the determinants
of malnutrition and the factors behind socioeconomic inequality in malnutrition and not to interpret or
compare concentration indices, the problems with having negative health outcomes are limited, and
therefore ignored. However one should bear this comment in mind when interpreting results.
3 Because of the nature of the data, only children of living mothers could be included. Children of mothers
who have died may have worse health status and their mothers may have had systematically different
characteristics (see e.g. Lindblade et al, 2003). This could lead to a selection problem, but since neither
these children nor their mothers could be observed, this problem could not be corrected for.
4 No information on mother’s nutritional status was included in the set of explanatory variables. Since
about 10% of women in the dataset were pregnant at the time of interview, their BMI did not provide an
accurate measure of their nutritional status. Furthermore, BMI reflects current nutritional status and may
not be relevant for children born 5 years prior to the interview. Inclusion of mother’s height-for-age had no
significant effect on results.
5 Stunting and socioeconomic inequality in stunting are calculated for each country on DHS data in
exactly the same way as is described for the Ghana DHS. For each country, the same set of assets was used
to construct the wealth index.
6 The same problem holds for wealth. Although focusing on child health avoids the direct feedback of
income and health that is usually present in microeconomic studies, there remains the problem that both
nutritional status and wealth may be jointly influenced by unobserved factors, hereby inducing simultaneity.
7 To model causal pathways, one should ideally use panel data that allow to condition upon individual
effects. Further, it would be better to have health care variables regarding proximity or prices of health care
21
services than regarding usage. The latter is both demand and supply driven and it may be possible that
women experiencing difficult pregnancies are more likely to seek antenatal care. This would result in an
underestimation of the positive effects of health care use on children’s health (see e.g. Conway & Deb,
2005). However, no such data were available in the 2003 Ghana DHS. Another option would be to predict
health care use, but we were not able to find strong predictors for health care.
8 Morris et al (1999) expose some important limitations of geographic targeting if used to place poverty-
alleviation or nutrition interventions within cities. Using data from Abidjan (Cote d'Ivoire) and Accra
(Ghana), they found significant clustering in housing conditions; however they did not find any sign of
geographic clustering of nutritional status in either city. This implies that geographic targeting of nutrition
interventions in these and similar cities has important limitations. Geographic targeting would probably
lead to a significant under coverage of the truly needy and, unless accompanied by additional targeting
mechanisms, would also result in significant leakage to non-needy populations.
REFERENCES
Alderman H. (1990). Nutritional status in Ghana and its determinants. Social Dimensions
of Adjustments in sub-Saharan Africa. World Bank Working Paper nr 3. World
Bank, Washington.
Available at: www.worldbank.org/afr/poverty/pdf/docnav/02956.pdf
Baker J, Grosch M. (1994). Poverty reduction through geographic targeting: How well
does it work? World development, 22, 7, 983-995.
Bambas L, Braveman P, Dachs JNW, Delgado I, Gakidou E, Moser K, Rolfe L, Vega J,
Zarowsky C. (2005). Strengthening health information systems to address health
equity challenges. Bulletin of the World Health Organization, 83, 8, 561-640.
Bosu WK, Nsowah-Nuamah N, Ward PM. (2000). A Profile of Health Inequalities in
Ghana. Ministry of Health, Ghana.
Bosu WK, Larya-Adjei GL, McIntyre D. (2004). A Review of the Ghana Health sector's
Pro-poor Agenda. Ghana.
Brakohiapa LA, Bille A, Quansah E, Kishi K, Yartey J, Harrison E, Armar MA,
Yamamoto S. (1988). Does prolonged breastfeeding adversely affect a child's
nutritional status? Lancet, 332, 8608, 20, 416-418.
22
Conway KS, Deb P. (2005). Is prenatal care really ineffective? Or, is the ‘devil’ in the
distribution? Journal of Health Economics, 24, 3, 489-513.
Delpeuch F, Traissac P, Martin-Pre Y, Massamba JP, Maire B. (2000). Economic crisis
and malnutrition: socioeconomic determinants of anthropometric status of
preschool children and their mothers in an African urban area. Public Health
Nutrition, 3, 1, 39-47.
de Onis M, Frongillo EA, Blossner M. (2000). Is malnutrition declining? An analysis of
changes in levels of child malnutrition since 1980. Bulletin of the World Health
Organization, 78, 10, 1222-1233.
Erreygers, G. (2005). Beyond the health concentration index: an Atkinson
alternative to the measurement of socioeconomic inequality of health. University
of Antwerp. Antwerp
Filmer D, Pritchett L. (2001). Estimating wealth effects without expenditure data - or
tears: An application to educational enrolments in states of India. Demography,
38, 1, 115-132.
Ghana Growth and Poverty Reduction Strategy Paper (GPRSI). (2003). Ghana Poverty
Reduction Strategy 2003-2005: An Agenda for Growth and Prosperity.
Available at :
http://siteresources.worldbank.org/GHANAEXTN/Resources/Ghana_PRSP.pdf
Ghana Growth and Poverty Reduction Strategy Paper (GPRSII). (2005). National
Development Planning Commission, Ghana. Available at :
http://siteresources.worldbank.org/INTPRS1/Resources/Ghana_PRSP(Nov-
2005).pdf
Ghana Health Service. (2005).
a) Imagine Ghana free of malnutrition. Ghana.
b) Facts and Figures 2005. Ghana.
Available at:
http://www.ghanahealthservice.org/includes/upload/publications/FACTS%20
AND%20FIGURES%202005.pdf
Ghana Ministry of Health. (2006). National Health Policy Draft. Ghana.
23
Ghana Statistical Service (GSS), Noguchi Memorial Institute for Medical Research
(NMIMR), and ORC Macro. (2004). Ghana Demographic and Health Survey
2003. Calverton, Maryland.
Heaton T, Forste R, Hoffmann J, Flake D. (2005). Cross-national variation in family
influences on child health, Social Science and Medicine, 60,97-108.
ISSER (Institute of Statistical, Social and Economic Research). (2005). University of
Ghana, Ghana. Available at: http://www.isser.org/69%20Cavalcanti.pdf
Larrea C, Kawachi I. (2005). Does economic inequality affect child malnutrition? The
case of Ecuador. Social Science and Medicine, 60, 165-178.
Lavy V, Strauss J, Thomas D, de Vreyer P. (1996). Quality of health care, survival and
health outcomes in Ghana. Journal of Health Economics, 15, 333-357.
Lindblade KA, Odhiambo F, Rosen DH, De Cock KM. (2003). Health and nutritional
status of orphans < 6 years old cared for by relatives in western Kenya. Tropical
Medicine and International Health, 8, 67-72.
Lindstrom DP, Munoz-Franco E. (2006). Migration and maternal health services
utilization in rural Guatemala. Social Science and Medicine, 63, 706-721.
Martorell R , Rivera J, Kaplowitz H, Pollitt E. (1992). Long-term consequences of
growth retardation during early childhood. In: Hernandez M, Argente J, eds.
Human growth: basic and clinical aspects. Amsterdam, Elsevier Science
Publishers, p. 143–149.
Mendez MA, Adair LS. (1999). Severity and timing of stunting in the first two years of
life affect performance on cognitive tests in late childhood. Journal of Nutrition,
129, 1555–1562.
Morris S, Levin CE, Armar-Klemesu M, Maxwell D, Ruel MT. (1999). Does geographic
tareting of nutrition interventions make sense in cities? Evidence from Abidjan
and Accra. World Development, 27, 11, 2011-2019.
ORC Macro. (2005). Trends in Demographic, Family Planning, and Health
Indicators in Ghana, 1960-2003: Trend Analysis of Demographic and Health
Surveys Data. Calverton, Maryland, USA.
Pelletier DL , Frongillo EA. (1995). The effects of malnutrition on child mortality in

24
developing countries. Bulletin of the World Health Organization, 73, 4, 443–448.
Pelletier DL, Frongillo EA, Habicht JP. (1993). Epidemiological evidence for a
potentiating effect of malnutrition on child mortality. American Journal of Public
Health, 83, 8, 1130-1133.
Pradhan M, Sahn DE, Younger SD. (2003). Decomposing world health inequality.
Journal of Health Economics, 22, 271-293.
Ruel MT, Levin CE, Armar-Klemesu D, Maxwell D, Morris S. (1999). Good care
practices can mitigate the negative effects of poverty and low maternal schooling
on children’s nutritional status: Evidence from Accra. World Development,
27, 11, 1993-2009.
Schroeder DG, Brown KH. (1994). Nutritional status as a predictor of child survival:
summarizing the association and quantifying its global impact. Bulletin of the
World Health Organization, 72, 569–579.
Shepherd A, Gyimah-Boadi E, Gariba S, Plagerson S, Wahab Musa A. (2004). Bridging
the North South divide in Ghana. World Development Report 2006, Background
Papers. Available at:
http://siteresources.worldbank.org/INTWDR2006/Resources/477383-
1118673432908/Bridging_the_North_South_Divide_in_Ghana.pdf
Smith LC, Haddad L. (2000). Explaining child malnutrition in developing countries: a
cross country analysis. International Food Policy Research Institute, Food
Consumption and Nutrition Division discussion paper nr. 60.
Available at: http://www.ifpri.org/pubs/abstract/111/rr111.pdf
Smith LC, Obeid AEE, Jensen HH. (2000). The geography and causes of food insecurity
in developing countries. Agricultural Economics, 22, 199-215.
Smith LC, Ruel MT, Ndiaye A. (2005). Why is child malnutrition lower in urban than in
rural areas? Evidence from 36 developing countries. World Development, 33, 8,
1285-1305.
Tharakan CT, Suchindran CM. (1999). Determinants of child malnutrition - An
intervention model for Botswana. Nutritional Research, 19, 6, 843-860.
Ukuwuani FA, Suchindran CM. (2003). Implications of women's work for child
25
nutritional status in sub-Saharan Africa: a case study of Nigeria. Social Science
and Medicine, 56, 2109-2121.
Vella V, Tomkins A, Borghesi A, MiglioriGB, Adriko BC, Crevatin E. (1992).
Determinants of child nutrition in north-west Uganda. Bulletin of the World
Health Organization, 70, 5, 637-647.
UNICEF (United Nations Children’s Fund). (2000). The state of the world's children.
Available at: http://www.unicef.org/sowc00/
UN (United Nations). (2000) Sub-Saharan Africa – the human costs of the 2015
‘business-as-usual’ scenario. Available at:
http://hdr.undp.org/docs/events/Berlin/Background_paper.pdf
UNDP (United Nations Development Program). (2005). Human Development Report.
Available at: http://hdr.undp.org/reports/global/2005/
United Nations Millennium Project. (2006). About the Goals: What they are.
Available at: http://www.unmillenniumproject.org/goals/
Wagstaff A, van Doorslaer E, Watanabe N. (2003). On decomposing the causes of health
sector inequalities with an application to malnutrition inequalities in Vietnam.
Journal of Econometrics; 112, 207-223.
Wagstaff, A., & van Doorslaer, E. (2004). Overall versus socioeconomic health
inequality: a measurement framework and two empirical illustrations. Health
Economics, 13, 297-301.
WHO (World Health Organization). (1997). Global database on malnutrition. De Onis M,
Blossner M. World health Organization, Geneva.
Wooldridge JM. (2002). Econometric analysis of Cross Section and Panel Data, MIT
Press, Cambridge, 752 p.
World Bank (2004). Improving, Health, nutrition and population outcomes in Sub-
Saharan Africa. World Bank, Washington, 245 p.
Related Documents


![Malnutrition [Autosaved]](https://static.cupdf.com/doc/110x72/577cd2051a28ab9e7895192c/malnutrition-autosaved.jpg)