Malignancy Types Gene Variation Clinical Stage Genomic Information Phenomic Information Developmental State Heredity Status Histology Site Differentiation Status Molecular Entity Types Phenotypic Entity Types Genomic Variation associated with Malignancy

Malignancy Types Gene Variation Clinical Stage Genomic InformationPhenomic Information Developmental State Heredity Status Histology Site Differentiation.
Dec 21, 2015
Welcome message from author
This document is posted to help you gain knowledge. Please leave a comment to let me know what you think about it! Share it to your friends and learn new things together.
Transcript

Malignancy Types
Gene
Variation
Clinical Stage
Genomic Information Phenomic Information
Developmental State
Heredity Status
Histology
Site
Differentiation Status
Molecular Entity Types Phenotypic Entity Types
Genomic Variation associated with Malignancy

Flow Chart for Manual Annotation Process
Biomedical Literature
Entity Definitions
Annotators (Experts)Manually Annotated Texts
Machine-learning Algorithm
Annotation Ambiguity
Auto-Annotated Texts

QuickTime™ and aTIFF (LZW) decompressor
are needed to see this picture.

A point mutation was found at codon 12 (G A).
Variation
Defining biomedical entities

A point mutation was found at codon 12 (G A).
Variation
A point mutation was found at codon 12 Variation.Type Variation.Location
(G A). Variation.InitialState Variation.AlteredState
Data Gathering
Data Classification
Defining biomedical entities

Conceptual boundaries Sub-classification of entities
Defining biomedical entities

Conceptual boundaries Sub-classification of entities Levels of specificity
Defining biomedical entities

Levels of specificity
Gene Entity
GeneProtein kinase (Super family)MAPK (Gene family)MAPK10
Malignancy type Entity
Cancer/TumorCarcinomaLung carcinomaSquamous cell lung carcinoma

Conceptual boundaries Sub-classification of entities Levels of specificity Conceptual overlaps between entities
Symptom: Subjective or objective evidence of disease.
Disease: A specific pathological process with a characteristic set of symptoms.
Arrhythmia vs. Long QT Syndrome
Defining biomedical entities

Conceptual boundaries Sub-classification of entities Levels of specificity Conceptual overlaps between entities Domain-specific clarification
Gene entity clarification:
Regulation element -- promoters (eg. TATA box)
Defining biomedical entities
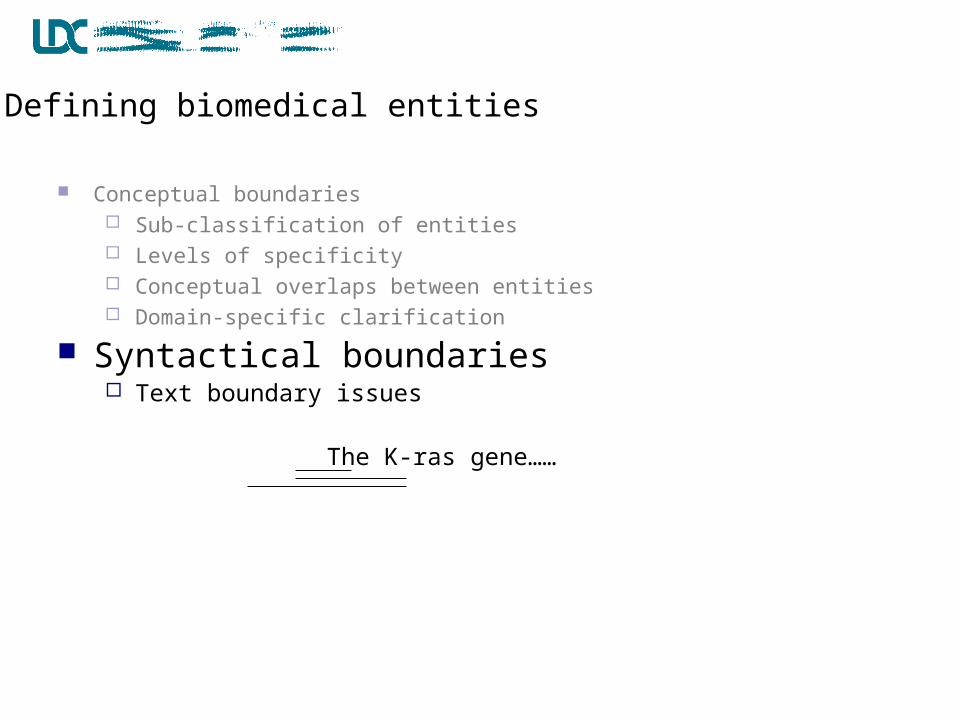
Conceptual boundaries Sub-classification of entities Levels of specificity Conceptual overlaps between entities Domain-specific clarification
Syntactical boundaries Text boundary issues
The K-ras gene……
Defining biomedical entities
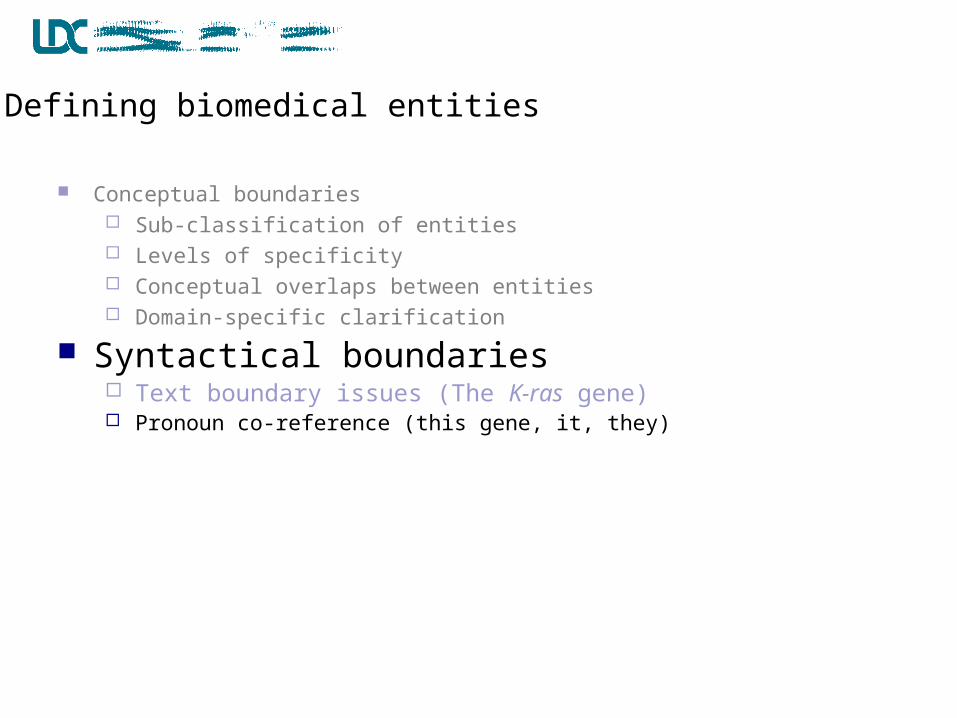
Conceptual boundaries Sub-classification of entities Levels of specificity Conceptual overlaps between entities Domain-specific clarification
Syntactical boundaries Text boundary issues (The K-ras gene) Pronoun co-reference (this gene, it, they)
Defining biomedical entities

Conceptual boundaries Sub-classification of entities Levels of specificity Conceptual overlaps between entities Domain-specific clarification
Syntactical boundaries Text boundary issues (The K-ras gene) Co-reference (this gene, it, they) Structural overlap -- entity within entity (same entity type)
MAP kinase kinase kinase
Defining biomedical entities

Conceptual boundaries Sub-classification of entities Levels of specificity Conceptual overlaps between entities Domain-specific clarification
Syntactical boundaries Text boundary issues (The K-ras gene) Pronoun co-reference (this gene, it, they) Structural overlap -- entity within entity (different entity type)
Squamous cell lung carcinoma
Defining biomedical entities

Conceptual boundaries Sub-classification of entities Levels of specificity Conceptual overlaps between entities Domain-specific clarification
Syntactical boundaries Text boundary issues (The K-ras gene) Co-reference (this gene, it, they) Structural overlap -- entity within entity Discontinuous mentions (N- and K-ras )
Defining biomedical entities

Ambiguity within an entity type
Semantic ambiguity challenges
CATcatalaseglycine-N-acyltransferase (GLYAT)

Ambiguity within an entity type Ambiguity between entity types
Semantic ambiguity challenges
CATGene entityOrganism

Ambiguity within entity types Ambiguity between entity types Gene entity ambiguity
3% of human genes share aliases Huge ambiguity of genes between species (mouse and human) Gene.general, Gene.gene/RNA, Gene.protein
Semantic ambiguity challenges
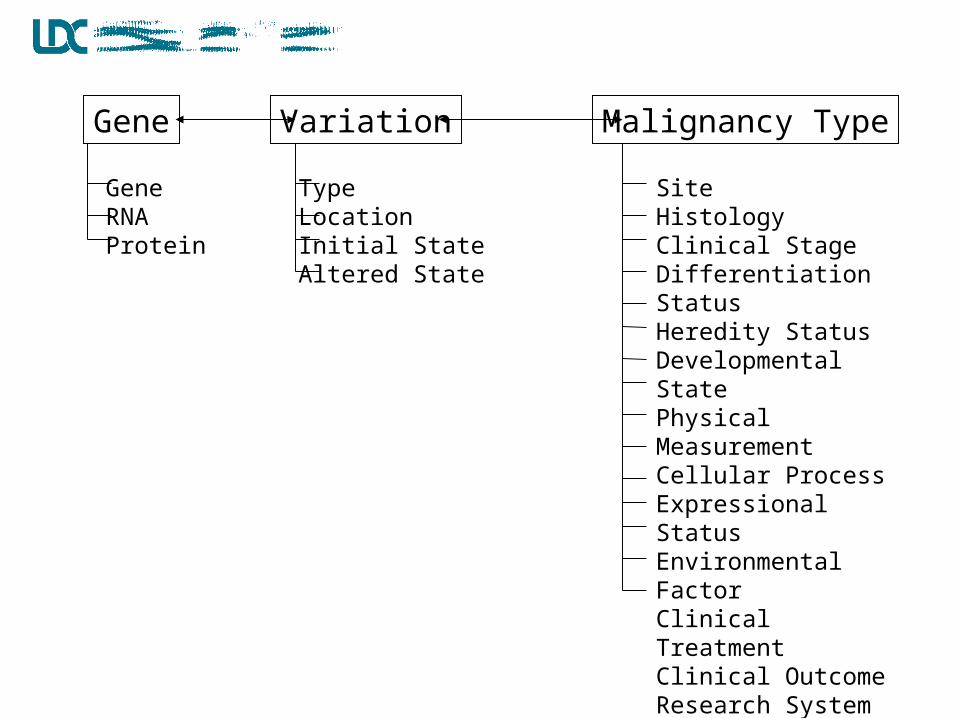
Gene Variation Malignancy Type
GeneRNAProtein
TypeLocationInitial StateAltered State
SiteHistologyClinical StageDifferentiation StatusHeredity Status Developmental StatePhysical MeasurementCellular Process Expressional StatusEnvironmental FactorClinical TreatmentClinical OutcomeResearch SystemResearch MethodologyDrug Effect

QuickTime™ and aTIFF (LZW) decompressor
are needed to see this picture.
http://www.ldc.upenn.edu/mamandel/itre/annotators/onco/definitions.html

Manual Annotation Corpus Release
Jena University Language & Information Engineering Lab: http://www.julielab.de
K Bretonnel Cohen and Lawrence Hunter, BMC Bioinformatics. 2006; 7(Suppl 3): S5.
QuickTime™ and aTIFF (LZW) decompressor
are needed to see this picture.
Summary -- Entity Definition
Developed iterative process for biomedical entity definition;
Defined genomic and phenotypic entities with distinct conceptual and syntactical boundaries in genomic variation of malignancy;
Constructed a manually annotated corpus with 1442 oncology-focused articles.
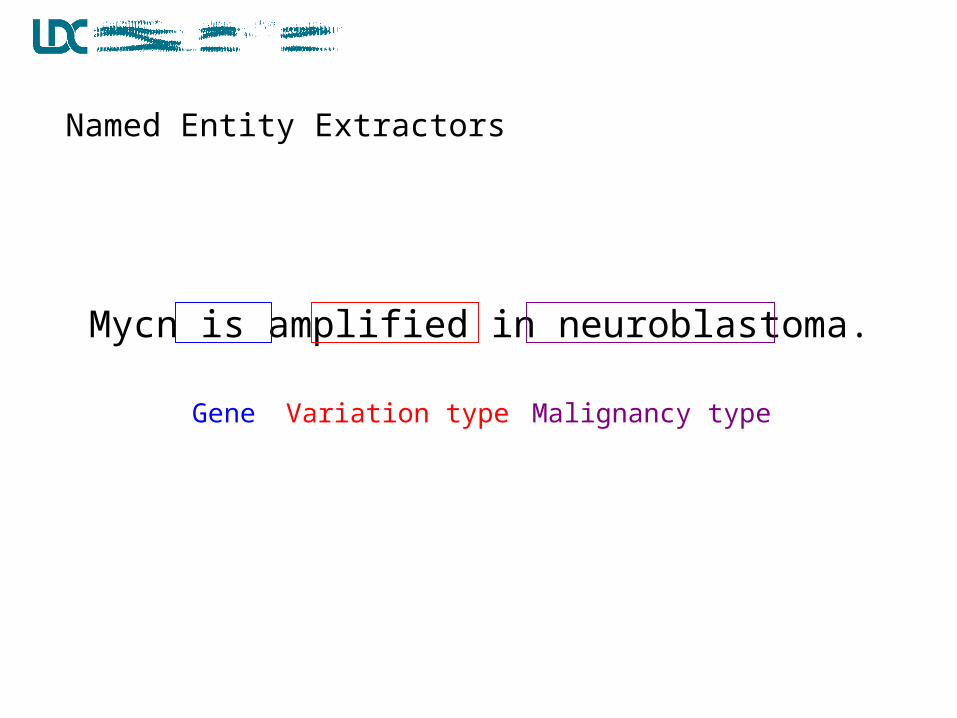
Named Entity Extractors
Mycn is amplified in neuroblastoma.
Gene Variation type Malignancy type

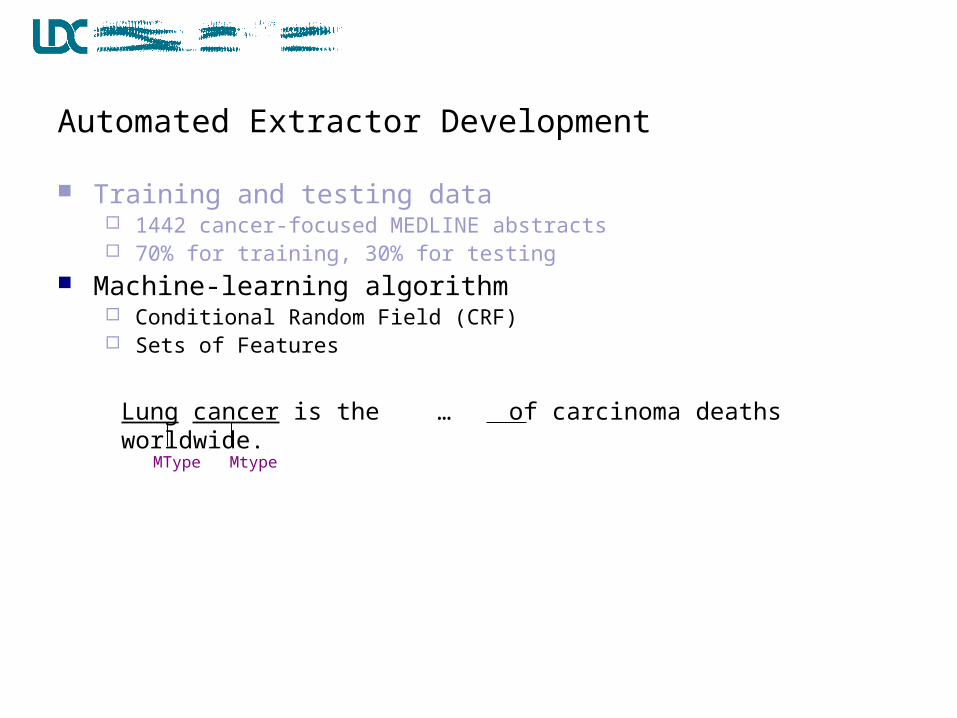
Automated Extractor Development
Training and testing data 1442 cancer-focused MEDLINE abstracts 70% for training, 30% for testing
Automated Extractor Development
Training and testing data 1442 cancer-focused MEDLINE abstracts 70% for training, 30% for testing
Machine-learning algorithm Conditional Random Field (CRF) Sets of Features
Lung cancer is the … of carcinoma deaths worldwide.
MType Mtype

Automated Extractor Development
Training and testing data 1442 cancer-focused MEDLINE abstracts 70% for training, 30% for testing
Machine-learning algorithm Conditional Random Fields (CRFs) Sets of Features
Orthographic features (capitalization, punctuation, digit/number/alpha-numeric/symbol);
Character-N-grams (N=2,3,4); Prefix/Suffix: (*oma); Offsite conjuction (3 consecutive word tokens); Domain-specific lexicon (NCI neoplasm list).

Extractor Performance
• Precision: (true positives)/(true positives + false positives) • Recall: (true positives)/(true positives + false negatives)
Entity Precision RecallGene 0.864 0.787
Variation Type 0.8556 0.7990Location 0.8695 0.7722
State-Initial 0.8430 0.8286State-Sub 0.8035 0.7809Overall 0.8541 0.7870
Malignancy type 0.8456 0.8218Clinical Stage 0.8493 0.6492
Site 0.8005 0.6555Histology 0.8310 0.7774
Developmental State 0.8438 0.7500

Normal textMalignancies
PMID: 15316311Morphologic and molecular characterization of renal cell carcinoma in children and young adults.A new WHO classification of renal cell carcinoma has been introduced in 2004. This classificationincludes the recently described renal cell carcinomas with the ASPL-TFE3 gene fusion and carcinomaswith a PRCC -TFE3 gene fusion. Collectively, these tumors have been termed Xp11.2 or TFE3translocation carcinomas, which primarily occur in children and young adults. To further study thecharacteristics of renal cell carcinoma in young patients and to determine their genetic background, 41renal cell carcinomas of patients younger than 22 years were morphologically and geneticallycharacterized. Loss of heterozygosity analysis of the von Hippel - Lindau gene region and screening forVHL gene mutations by direct sequencing were performed in 20 tumors. TFE3 protein overexpression,which correlates with the presence of a TFE3 gene fusion, was assessed by immunohistochemistry.Applying the new WHO classification for renal cell carcinoma, there were 6 clear cell (15 %), 9 papillary(22 %), 2 chromophobe, and 2 collecting duct carcinomas. Eight carcinomas showed translocationcarcinoma morphology (20 %). One carcinoma occurred 4 years after a neuroblastoma. Thirteen tumorscould not be assigned to types specified by the new WHO classification: 10 were grouped as unclassified(24 %), including a unique renal cell carcinoma with prominently vacuolated cytoplasm and WT1expression. Three carcinomas occurred in combination with nephroblastoma. Molecular analysis revealeddeletions at 3p25-26 in one translocation carcinoma, one chromophobe renal cell carcinoma, and onepapillary renal cell carcinoma. There were no VHL mutations. Nuclear TFE3 overexpression was detectedin 6 renal cell carcinomas, all of which showed areas with voluminous cytoplasm and foci of papillaryarchitecture, consistent with a translocation carcinoma phenotype. The large proportion of TFE3 "translocation " carcinomas and "unclassified " carcinomas in the first two decades of life demonstrates thatrenal cell carcinomas in young patients contain genetically and phenotypically distinct tumors with furtherpotential for novel renal cell carcinoma subtypes. The far lower frequency of clear cell carcinomas andVHL alterations compared with adults suggests that renal cell carcinomas in young patients have a uniquegenetic background.

CRF-based Extractor vs. Pattern Matcher
The testing corpus 39 manually annotated MEDLINE abstracts selected 202 malignancy type mentions identified
The pattern matching system 5,555 malignancy types extracted from NCI neoplasm
ontology Case-insensitive exact string matching applied 85 malignancy type mentions (42.1%) recognized correctly
The malignancy type extractor 190 malignancy type mentions (94.1%) recognized correctly Included all the baseline-identified mentions

The Types of Mentions NOT Identified by Pattern Matching
Mention Types Mention Examples NCI List
Acronyms NB Neuroblastoma
Lexical variants (plural forms) Renal cell carcinomas Renal cell carcinoma
Polymorphic expressionsLung cancer
(tumor/tumour)Lung neoplasm
higher levels of specificity Solid tumor <More specific tumor>
Tumor names with modifiers Translocation carcinoma Carcinoma

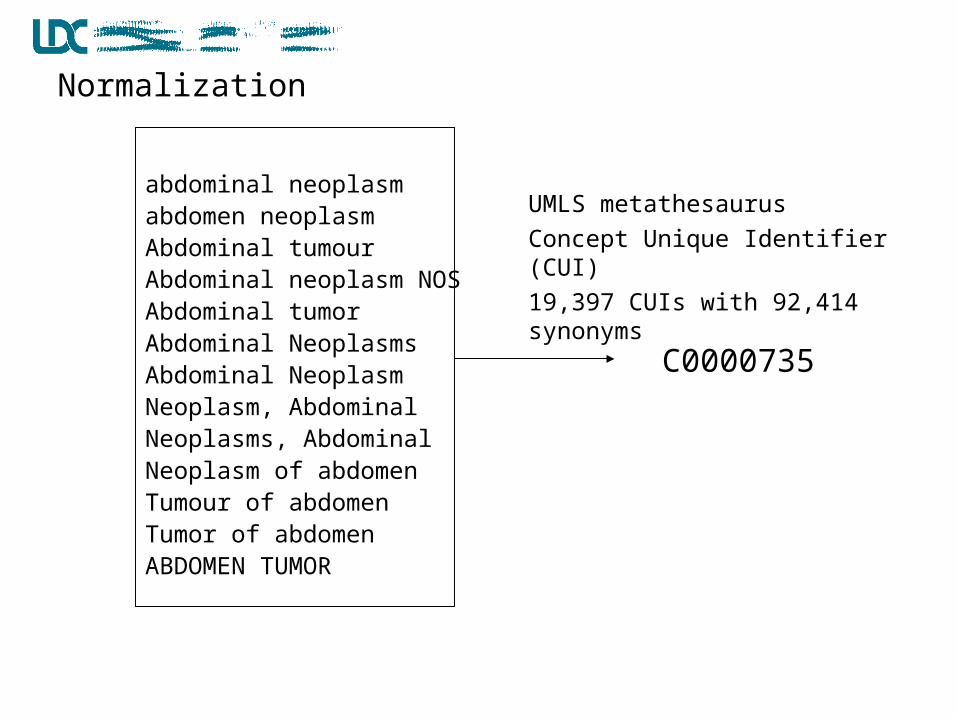
Normalization
abdominal neoplasmabdomen neoplasmAbdominal tumourAbdominal neoplasm NOSAbdominal tumorAbdominal NeoplasmsAbdominal NeoplasmNeoplasm, AbdominalNeoplasms, AbdominalNeoplasm of abdomenTumour of abdomenTumor of abdomenABDOMEN TUMOR
Unique Identifier
Normalization
abdominal neoplasmabdomen neoplasmAbdominal tumourAbdominal neoplasm NOSAbdominal tumorAbdominal NeoplasmsAbdominal NeoplasmNeoplasm, AbdominalNeoplasms, AbdominalNeoplasm of abdomenTumour of abdomenTumor of abdomenABDOMEN TUMOR
UMLS metathesaurus Concept Unique Identifier (CUI)19,397 CUIs with 92,414 synonyms
C0000735

Normalization – Computational Procedures
Rule-based algorithm Applied to both entity mentions and vocabulary terms (UMLS
metathesaurus) Case insensitivity (carcinoma/Carcinoma) Space/punctuation removal (lung-cancer/lungcancer) Stemming (neuroblastoma/neuroblastomas)
Applied to mentions only First/last character removal (additional space/punctuation) First/last word removal (translocation lung carcinoma)
Evaluate the accuracy and the priority of the rules 1,000 randomly selected entity mentions Choose the best performed rule combination and sequences

MEDLINE Data Processing
Tagging MEDLINE pre-2006 abstracts 15,433,668 MEDLINE abstracts 9,153,340 redundant and 580,002 distinct malignancy type
mentions ~60% extracted mentions matched to UMLS CUIs 1,642 CPU-hours (2.44 days on a 28-CPU cluster)
Infrastructure construction (postgreSQL Database)

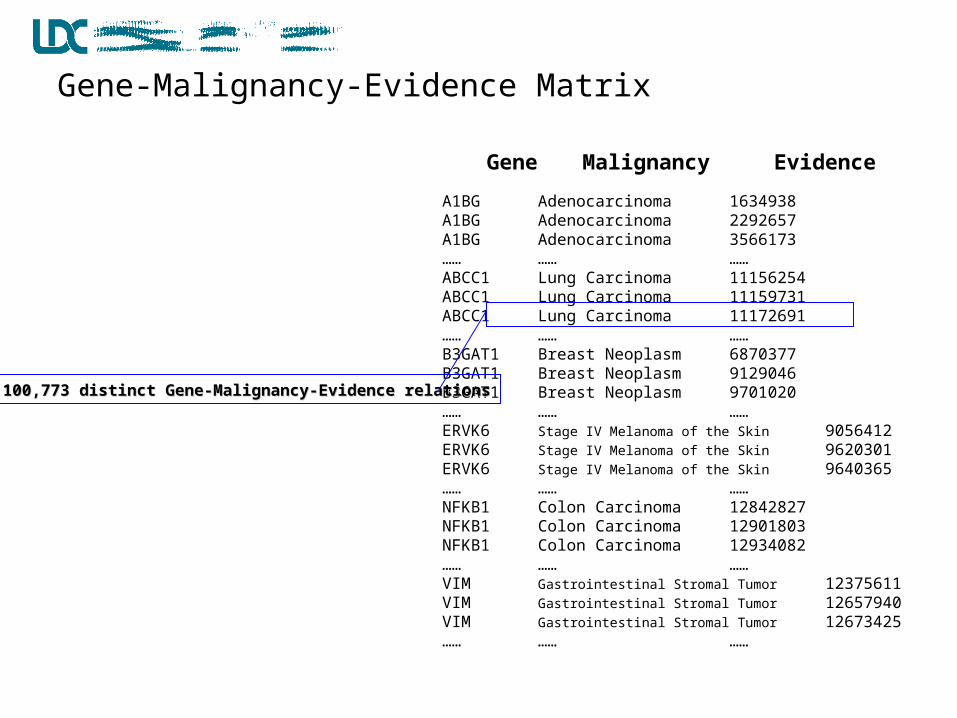
Gene-Malignancy-Evidence Matrix
A1BG Adenocarcinoma 1634938A1BG Adenocarcinoma 2292657A1BG Adenocarcinoma 3566173…… …… ……ABCC1 Lung Carcinoma 11156254ABCC1 Lung Carcinoma 11159731ABCC1 Lung Carcinoma 11172691…… …… ……B3GAT1 Breast Neoplasm 6870377B3GAT1 Breast Neoplasm 9129046B3GAT1 Breast Neoplasm 9701020…… …… ……ERVK6 Stage IV Melanoma of the Skin 9056412ERVK6 Stage IV Melanoma of the Skin 9620301ERVK6 Stage IV Melanoma of the Skin 9640365…… …… ……NFKB1 Colon Carcinoma 12842827NFKB1 Colon Carcinoma 12901803NFKB1 Colon Carcinoma 12934082…… …… ……VIM Gastrointestinal Stromal Tumor 12375611VIM Gastrointestinal Stromal Tumor 12657940VIM Gastrointestinal Stromal Tumor 12673425…… …… ……
Gene Malignancy Evidence
21,493,687 normalized gene symbols (16,875 unique)21,493,687 normalized gene symbols (16,875 unique)

Gene-Malignancy-Evidence Matrix
A1BG Adenocarcinoma 1634938A1BG Adenocarcinoma 2292657A1BG Adenocarcinoma 3566173…… …… ……ABCC1 Lung Carcinoma 11156254ABCC1 Lung Carcinoma 11159731ABCC1 Lung Carcinoma 11172691…… …… ……B3GAT1 Breast Neoplasm 6870377B3GAT1 Breast Neoplasm 9129046B3GAT1 Breast Neoplasm 9701020…… …… ……ERVK6 Stage IV Melanoma of the Skin 9056412ERVK6 Stage IV Melanoma of the Skin 9620301ERVK6 Stage IV Melanoma of the Skin 9640365…… …… ……NFKB1 Colon Carcinoma 12842827NFKB1 Colon Carcinoma 12901803NFKB1 Colon Carcinoma 12934082…… …… ……VIM Gastrointestinal Stromal Tumor 12375611VIM Gastrointestinal Stromal Tumor 12657940VIM Gastrointestinal Stromal Tumor 12673425…… …… ……
Gene Malignancy Evidence
5,398,954 normalized malignancy types (4,166 CUIs)5,398,954 normalized malignancy types (4,166 CUIs)
Gene-Malignancy-Evidence Matrix
A1BG Adenocarcinoma 1634938A1BG Adenocarcinoma 2292657A1BG Adenocarcinoma 3566173…… …… ……ABCC1 Lung Carcinoma 11156254ABCC1 Lung Carcinoma 11159731ABCC1 Lung Carcinoma 11172691…… …… ……B3GAT1 Breast Neoplasm 6870377B3GAT1 Breast Neoplasm 9129046B3GAT1 Breast Neoplasm 9701020…… …… ……ERVK6 Stage IV Melanoma of the Skin 9056412ERVK6 Stage IV Melanoma of the Skin 9620301ERVK6 Stage IV Melanoma of the Skin 9640365…… …… ……NFKB1 Colon Carcinoma 12842827NFKB1 Colon Carcinoma 12901803NFKB1 Colon Carcinoma 12934082…… …… ……VIM Gastrointestinal Stromal Tumor 12375611VIM Gastrointestinal Stromal Tumor 12657940VIM Gastrointestinal Stromal Tumor 12673425…… …… ……
Gene Malignancy Evidence
3,100,773 distinct Gene-Malignancy-Evidence relations3,100,773 distinct Gene-Malignancy-Evidence relations

Ranked by Frequency
6500
6550
6600
6650
6700
6750
6800
6850
Gene-Malignancy Relaions
TP53-CarcinomaESR1-Breast CarcinomaESR1-Breast Neoplasm

Summary -- Extractor Development and Application
Developed well-performed automated entity extractors across genomic and phenotypic domains;
Constructed rule-based computational procedure for normalization;
Applied the extractors and normalizers to all MEDLINE abstracts;
Imported the extracted information into a relational database.

Text Mining Applications -- Hypothesizing NB Candidate Genes

Text Mining Applications -- Hypothesizing NB Candidate Genes
Two distinct subtypes of neuroblastoma
Developmental State
BiologyClinical
StageClinical Outcome
Trk Expression
NB Subtype A Younger age DifferentiationLower Stage
FavorableHigh level
expression of NTRK1
NB Subtype B Older age ProliferationHigher Stage
UnfavorableHigh level
expression of NTRK2

Text Mining Applications -- Hypothesizing NB Candidate Genes
Two distinct subtypes of neuroblastoma• Distinct clinical behaviors (favorable vs. unfavorable)• NGF/NTRK1 (TrkA) vs. BDNF/NTRK2 (TrkB) signaling
pathways
Trk Signaling Angiogenesis DifferentiationDrug
ResistanceTumorigenicity
NB Subtype A NTRK1/NGF Inhibits Yes Inhibits Inhibits
NB Subtype B NTRK2/BDNF Promotes No Promotes Promotes

Text Mining Applications -- Hypothesizing NB Candidate Genes
Two distinct subtypes of neuroblastoma• Distinct clinical behaviors (favorable vs. unfavorable)• NGF/NTRK1 (TrkA) vs. BDNF/NTRK2 (TrkB) signaling
pathways• Determine the early response genes differentiating the two
pathways• More precise prognosis and clinical intervention
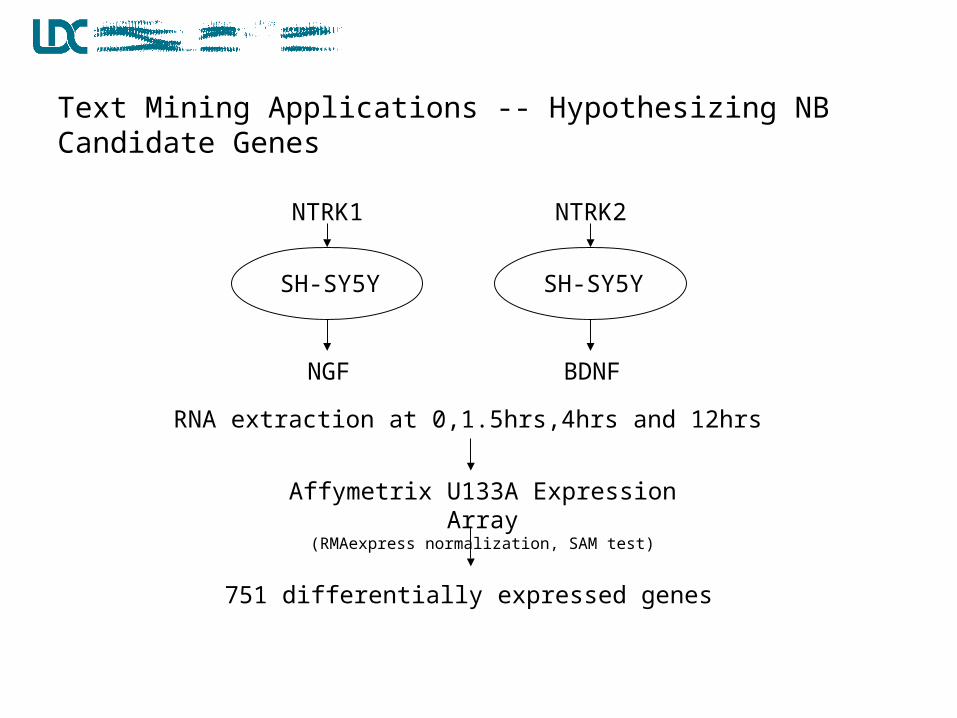
Text Mining Applications -- Hypothesizing NB Candidate Genes
SH-SY5Y
NTRK1
SH-SY5Y
NTRK2
NGF BDNF
RNA extraction at 0,1.5hrs,4hrs and 12hrs
Affymetrix U133A Expression Array
(RMAexpress normalization, SAM test)
751 differentially expressed genes

Text Mining Applications -- Hypothesizing NB Candidate Genes
Microarray Expression Data Analysis
Gene Set 1: NTRK1, NTRK2
468
Gene Set 2: NTRK2, NTRK1
283
symbol
NALP1
RALY
CDC2L6
RASGRP2
KCNK3
RPS6KA1
SEC61A2
VGF
CACNA1C
TBX3
THRA
B4GALT5
NRXN2
GNB5
RAI2
FRS3

Text Mining Applications -- Hypothesizing NB Candidate Genes
Differentially represented genes in biomedical literature
• NTRK1 vs. NTRK2 pathway differentially associated genes/proteins based on literature
• Preferential association determined by co-occurrence with either receptor 5 times or more over the other
• Assumption: the co-occurrence frequency is reflecting functional correlation

Text Mining Applications -- Hypothesizing NB Candidate Genes
NTRK1/NTRK2 Preferentially Associated Genes in Literature
LitSet 1: NTRK1 Associated Genes
LitSet 2: NTRK2 Associated Genes
157
514
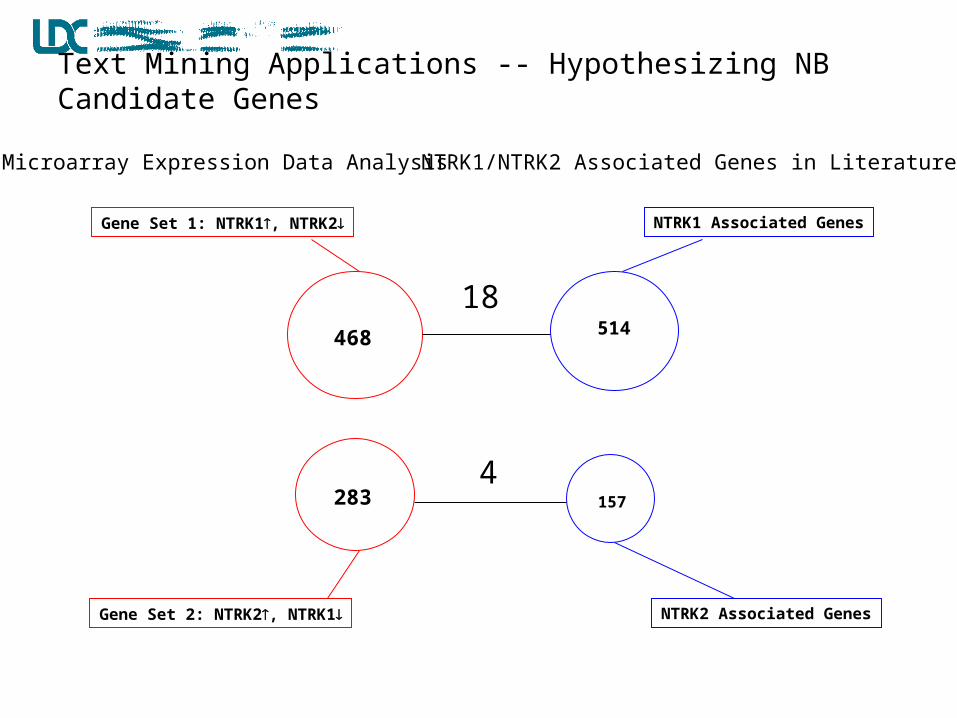
Text Mining Applications -- Hypothesizing NB Candidate Genes
Microarray Expression Data Analysis NTRK1/NTRK2 Associated Genes in Literature
Gene Set 1: NTRK1, NTRK2 NTRK1 Associated Genes
NTRK2 Associated Genes
468
157
514
Gene Set 2: NTRK2, NTRK1
283
18
4

Functional Pathway Analysis
Determine gene enrichment score for six selected functional pathways:
CD -- Cell Death;CGP -- Cell Growth and Proliferation; CCSI -- Cell-to-Cell Signaling and Interaction; CM -- Cell MorphologyNSDF -- Nervous System Development and Function;CAO -- Cellular Assembly and Organization.

Functional Pathway Analysis
Six selected pathways:
CD -- Cell Death; CM -- Cell Morphology; CGP -- Cell Growth and Proliferation; NSDF -- Nervous System Development and Function; CCSI -- Cell-to-Cell Signaling and Interaction; CAO -- Cellular Assembly and Organization.
Ingenuity Pathway Analysis Tool Kit
Overall Group(N=10,459)
Array Group(N= 751)
Text Group(N= 550)
Overlap Group(N=22)
CD 1979, 18.9% 153, 20.4% 309, 56.2% 12, 54.5%CGP 2251, 21.5% 154, 20.5% 304, 55.3% 3, 13.6%CCSI 1492, 14.3% 57, 9.98% 186, 33.8% 7, 31.8%CM 1068, 10.2% 85, 11.3% 219, 39.8% 7, 31.8%
NSDF 897, 8.58% 108, 19.6% 148, 26.9% 9, 40.9%CAO 755, 7.22% 103, 13.7% 115, 20.9% 11, 50%
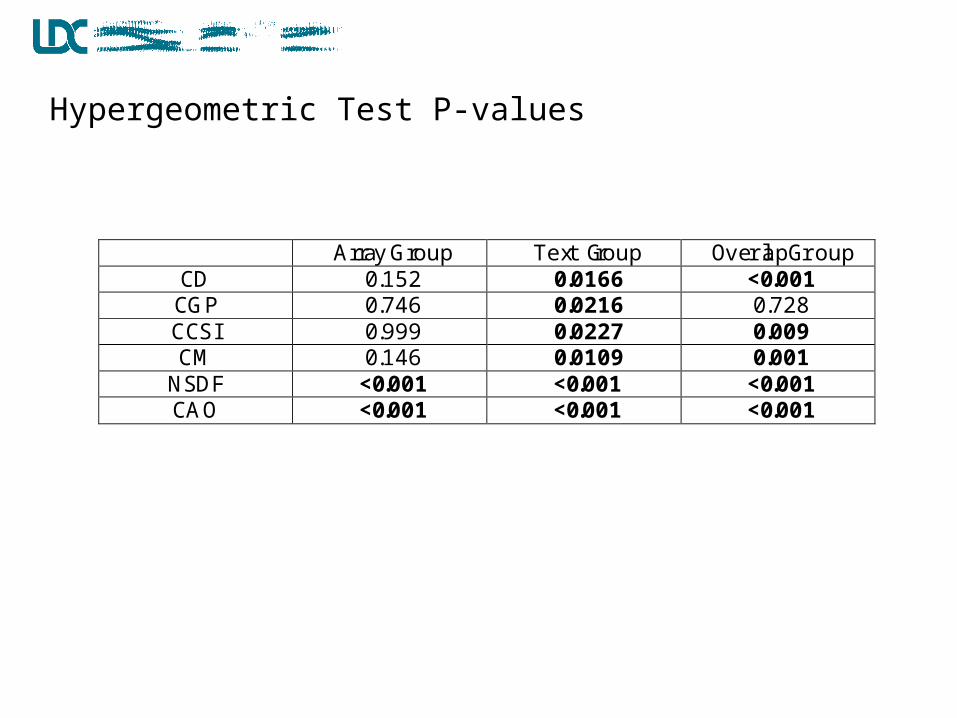
Hypergeometric Test P-values
Array Group Text Group Overlap GroupCD 0.152 0.0166 <0.001
CGP 0.746 0.0216 0.728CCSI 0.999 0.0227 0.009CM 0.146 0.0109 0.001
NSDF <0.001 <0.001 <0.001CAO <0.001 <0.001 <0.001

Hypergeometric Test between Array and Overlap Groups
Overlap GroupCD <0.001
CGP 0.728CCSI 0.00940CM 0.0124
NSDF <0.001CAO 0.0117
Multiple-test corrected P-values (Bonferroni step-down)

RT-PCR Experimental Validation
11 out of 22 genes selected for RT-PCR validation:
Symbol Description
CAMK4 calcium/calmodulin-dependent protein kinase IVVSNL1 visinin-like 1TBC1D8 TBC1 domain family, member 8 (with GRAM domain)RPS6KA1 ribosomal protein S6 kinase, 90kDa, polypeptide 1EFNB3 ephrin-B3B3GAT1 beta-1,3-glucuronyltransferase 1 (glucuronosyltransferase P)GNAS GNAS complex locusNEFH neurofilament, heavy polypeptide 200kDaINA internexin neuronal intermediate filament protein, alphaNEFL neurofilament, light polypeptide 68kDaTYRO3 TYRO3 protein tyrosine kinase

RT-PCR Experimental Validation
EFNB3
0
0.5
1
1.5
2
2.5
TrkA
TrkB
0hr 1.5hr 4hr 12hr

EFNB3 Discussion
EFNB3 (ephrin-B3) belongs to a family of ligands that binds to Eph family receptor tyrosine kinases
Implicated in axon guidance and vertebrate nervous system development
Exhibited growth-suppressive activity against NB cells in vitro
Preferentially and significantly associated with low tumor stage and favorable clinical outcomes in neuroblastoma primary tumors

RT-PCR Experimental Validation
TYRO3
0
0.2
0.4
0.6
0.8
1
1.2
1.4
TrkA
TrkB
0hr 1.5hr 4hr 12hr

TYRO3 Discussion
Trans-memberane receptor tyrosine kinase activated by GAS6
GAS6 has showed to promote human fetal oligodendrocyte survival without proliferation
GAS6 may also contribute to cell adhesion and immune responses
Further study of GAS6/TYRO3 signaling is needed

Summary -- NB Application
Prioritized array-determined differentially expressed genes by integrating text mining results
Literature-based method showed its capability of enriching functionally relevant genes by pathway analysis
RT-PCR experiments further validated the inferential power of text mining
Conclusion
Created a process for iteratively and precisely defining biomedical semantic types directly from literature
Developed automated entity extractors across genomic and phenotypic domains in malignancy with satisfactory accuracy rates
Applied this computational entity recognition and normalization process to all MEDLINE abstracts
Integrated text mining results with neuroblastoma experimental data to hypothesize candidate genes differentiating neuroblastoma subtypes
Future Directions
Increasing dimensions of Information matrix
Context-based normalization algorithm
Relation extraction with deeper semantic parsing

Acknowledgement
Penn BioIE Team:
Dr. Mark Liberman Dr. Mark Mandel Dr. Ryan McDonald Dr. Fernando Pereira Annotator team
Brodeur Lab:
Dr. Garrett Brodeur Ms. Ruth Ho Dr. Jane Minturn
CHOP NAP Core:
Dr. Eric Rappaport
CHOP Bioinformatics Core:
Dr. Xiaowu Gai Dr. Jim Zhang
White Lab:
Steve Carroll Hawren Fang Kevin Murphy
Related Documents