MALDI-ion mobility mass spectrometry of lipids in negative ion mode† Shelley N. Jackson, a Damon Barbacci, ab Thomas Egan, b Ernest K. Lewis, b J. Albert Schultz b and Amina S. Woods * a Profiling and imaging using MALDI mass spectrometry (MS) allows detection and localization of biomolecules in tissue, of which lipids are a major component. However, due to the in situ nature of this technique, complexity of tissue and need for a chemical matrix, the recorded signal is complex and can be difficult to assign. Ion mobility adds a dimension that provides coarse shape information, separating isobaric lipids, peptides, and oligonucleotides along distinct familial trend lines before mass analysis. Previous work using MALDI-ion mobility mass spectrometry to analyze and image lipids has been conducted mainly in positive ion mode, although several lipid classes ionize preferentially in negative ion mode. This work highlights recent data acquired in negative ion mode to detect glycerophosphoethanolamines (PEs), glycerophosphoserines (PSs), glycerophosphoglycerols (PGs), glycerolphosphoinositols (PIs), glycerophosphates (PAs), sulfatides (STs), and gangliosides from standard tissue extracts and directly from mouse brain tissue. In particular, this study focused on changes in ion mobility based upon lipid head groups, composition of radyl chain (# of carbons and double bonds), diacyl versus plasmalogen species, and hydroxylation of species. Finally, a MALDI-ion mobility imaging run was conducted in negative ion mode, resulting in the successful ion mapping of several lipid species. Introduction Tissue proling and mass spectrometry imaging (MSI) by matrix-assisted laser desorption/ionization mass spectrometry (MALDI-MS) has enabled the direct analysis and localization of biomolecules (proteins and peptides) while maintaining the anatomical integrity of the tissue. 1–3 Recently, the use of tissue proling and MSI has grown rapidly in the eld of lipidomics. 4–7 Ion mobility (IM) mass spectrometry is a robust method that allows for the rapid separation and detection of a wide range of biologically important compounds. 8–10 The coupling of MALDI- MS with IM spectrometry (MALDI-IM MS) has allowed for a variety of samples to be analyzed and offers the potential for real-time separation, which operates within the several hundred microsecond time interval between the application of each focused laser desorption pulse to the sample. 10–13 In one study, 14 MALDI-IM MS was used to analyze and separate complex mixtures of phospholipids in positive mode. The change in phospholipids' ion dri time was shown to be dictated by the following factors: (1) radyl chain length and its degree of unsaturation, (2) head group type, and (3) type of cationization (salt adducts) of individual species. Additional work has successfully used ion mobility mass spectrometry to analyze mixtures of most major classes of phospholipids and sphingolipids. 15–19 Due to the in situ nature of direct tissue analysis and the complex composition of tissue, MALDI-IM MS offers a distinct advantage for lipids analysis in tissue by separating lipid species by ion mobility prior to mass analysis. The rst study to demonstrate this used MALDI-IM MS to prole phospholipids in a rat brain tissue section. 20 In this study, nine different species of phospholipids were assigned in positive ion mode. Additional studies proled cocaine, phospholipids, and gangliosides from rat brain. 17,21 MSI by MALDI-IM MS was quick to follow tissue prole studies and has been successful in mapping lipids in brain tissue, breast tumor models, and mouse spleen. 22–25 To date most studies of lipids by MALDI-IM MS have analyzed samples in positive ion mode. One drawback to this is that studies have shown that in positive ion mode phosphatidylcholines and sphingomyelins (both contain a positively charged quaternary ammonium group) suppress the detection of other lipid classes. 26,27 Additionally, several classes of lipids ionize more readily in negative ion mode 28 based on their structure (Fig. 1) and in one recent study 29 both a PI and ST specie were imaged from brain tissue using MALDI-IM MS in negative ion mode. Herein, MALDI-IM MS is used to simulta- neously separate and analyze several classes of negatively ionized lipids from spot proles and images from standards a Integrative Neuroscience, NIDA IRP, NIH 333 Cassell Drive, Room 1120, Baltimore, MD 21224, USA. E-mail: [email protected]; Fax: +1 443-740-2144; Tel: +1 443- 740-2747 b Ionwerks Inc., Houston, Texas, USA † Electronic supplementary information (ESI) available. See DOI: 10.1039/c4ay00320a Cite this: Anal. Methods, 2014, 6, 5001 Received 7th February 2014 Accepted 25th March 2014 DOI: 10.1039/c4ay00320a www.rsc.org/methods This journal is © The Royal Society of Chemistry 2014 Anal. Methods, 2014, 6, 5001–5007 | 5001 Analytical Methods PAPER Published on 26 March 2014. Downloaded by NATIONAL INSTITUTES OF HEALTH on 25/07/2014 13:31:04. View Article Online View Journal | View Issue

Welcome message from author
This document is posted to help you gain knowledge. Please leave a comment to let me know what you think about it! Share it to your friends and learn new things together.
Transcript

AnalyticalMethods
PAPER
Publ
ishe
d on
26
Mar
ch 2
014.
Dow
nloa
ded
by N
AT
ION
AL
IN
STIT
UT
ES
OF
HE
AL
TH
on
25/0
7/20
14 1
3:31
:04.
View Article OnlineView Journal | View Issue
aIntegrative Neuroscience, NIDA IRP, NIH 3
MD 21224, USA. E-mail: [email protected]
740-2747bIonwerks Inc., Houston, Texas, USA
† Electronic supplementary informa10.1039/c4ay00320a
Cite this: Anal. Methods, 2014, 6, 5001
Received 7th February 2014Accepted 25th March 2014
DOI: 10.1039/c4ay00320a
www.rsc.org/methods
This journal is © The Royal Society of C
MALDI-ion mobility mass spectrometry of lipids innegative ion mode†
Shelley N. Jackson,a Damon Barbacci,ab Thomas Egan,b Ernest K. Lewis,b
J. Albert Schultzb and Amina S. Woods*a
Profiling and imaging usingMALDImass spectrometry (MS) allows detection and localization of biomolecules in
tissue, of which lipids are a major component. However, due to the in situ nature of this technique, complexity
of tissue and need for a chemical matrix, the recorded signal is complex and can be difficult to assign. Ion
mobility adds a dimension that provides coarse shape information, separating isobaric lipids, peptides, and
oligonucleotides along distinct familial trend lines before mass analysis. Previous work using MALDI-ion
mobility mass spectrometry to analyze and image lipids has been conducted mainly in positive ion mode,
although several lipid classes ionize preferentially in negative ion mode. This work highlights recent data
acquired in negative ion mode to detect glycerophosphoethanolamines (PEs), glycerophosphoserines (PSs),
glycerophosphoglycerols (PGs), glycerolphosphoinositols (PIs), glycerophosphates (PAs), sulfatides (STs), and
gangliosides from standard tissue extracts and directly from mouse brain tissue. In particular, this study
focused on changes in ion mobility based upon lipid head groups, composition of radyl chain (# of carbons
and double bonds), diacyl versus plasmalogen species, and hydroxylation of species. Finally, a MALDI-ion
mobility imaging run was conducted in negative ion mode, resulting in the successful ion mapping of several
lipid species.
Introduction
Tissue proling and mass spectrometry imaging (MSI) bymatrix-assisted laser desorption/ionization mass spectrometry(MALDI-MS) has enabled the direct analysis and localization ofbiomolecules (proteins and peptides) while maintaining theanatomical integrity of the tissue.1–3 Recently, the use of tissueproling andMSI has grown rapidly in the eld of lipidomics.4–7
Ion mobility (IM) mass spectrometry is a robust method thatallows for the rapid separation and detection of a wide range ofbiologically important compounds.8–10 The coupling of MALDI-MS with IM spectrometry (MALDI-IM MS) has allowed for avariety of samples to be analyzed and offers the potential forreal-time separation, which operates within the several hundredmicrosecond time interval between the application of eachfocused laser desorption pulse to the sample.10–13 In one study,14
MALDI-IM MS was used to analyze and separate complexmixtures of phospholipids in positive mode. The change inphospholipids' ion dri time was shown to be dictated by thefollowing factors: (1) radyl chain length and its degree ofunsaturation, (2) head group type, and (3) type of cationization
33 Cassell Drive, Room 1120, Baltimore,
.gov; Fax: +1 443-740-2144; Tel: +1 443-
tion (ESI) available. See DOI:
hemistry 2014
(salt adducts) of individual species. Additional work hassuccessfully used ion mobility mass spectrometry to analyzemixtures of most major classes of phospholipids andsphingolipids.15–19
Due to the in situ nature of direct tissue analysis and thecomplex composition of tissue, MALDI-IM MS offers a distinctadvantage for lipids analysis in tissue by separating lipidspecies by ion mobility prior to mass analysis. The rst study todemonstrate this used MALDI-IM MS to prole phospholipidsin a rat brain tissue section.20 In this study, nine differentspecies of phospholipids were assigned in positive ion mode.Additional studies proled cocaine, phospholipids, andgangliosides from rat brain.17,21 MSI by MALDI-IMMS was quickto follow tissue prole studies and has been successful inmapping lipids in brain tissue, breast tumor models, andmouse spleen.22–25 To date most studies of lipids by MALDI-IMMS have analyzed samples in positive ion mode. One drawbackto this is that studies have shown that in positive ion modephosphatidylcholines and sphingomyelins (both contain apositively charged quaternary ammonium group) suppress thedetection of other lipid classes.26,27 Additionally, several classesof lipids ionize more readily in negative ion mode28 based ontheir structure (Fig. 1) and in one recent study29 both a PI and STspecie were imaged from brain tissue using MALDI-IM MS innegative ion mode. Herein, MALDI-IM MS is used to simulta-neously separate and analyze several classes of negativelyionized lipids from spot proles and images from standards
Anal. Methods, 2014, 6, 5001–5007 | 5001
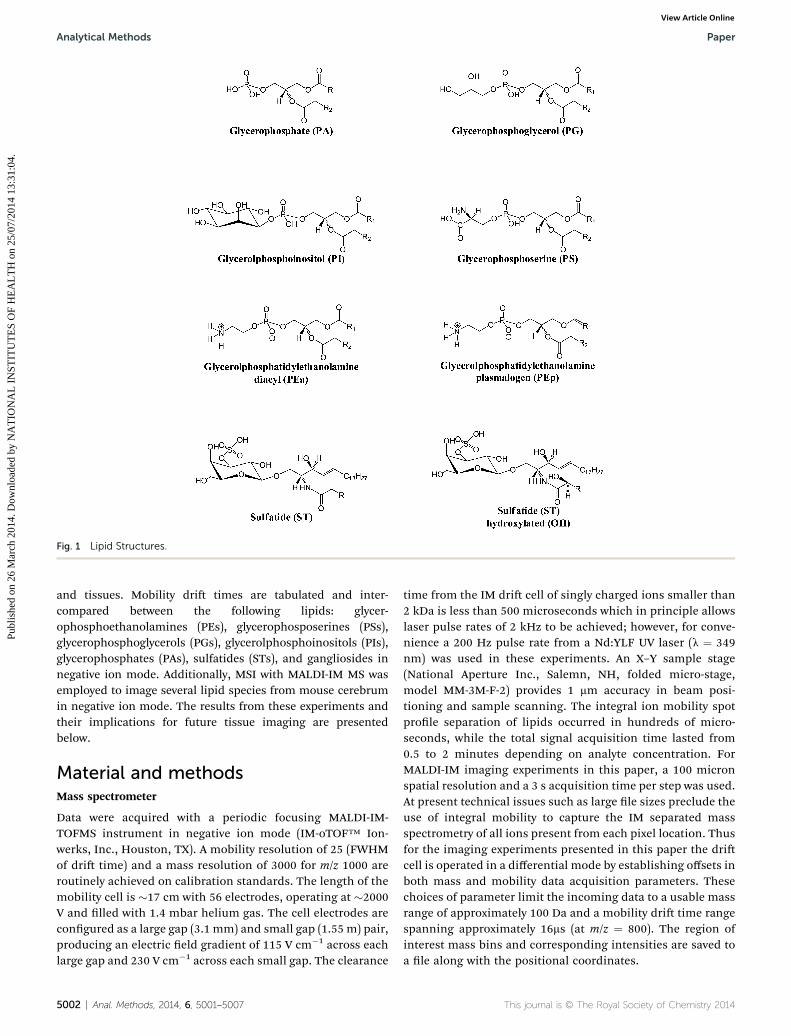
Fig. 1 Lipid Structures.
Analytical Methods Paper
Publ
ishe
d on
26
Mar
ch 2
014.
Dow
nloa
ded
by N
AT
ION
AL
IN
STIT
UT
ES
OF
HE
AL
TH
on
25/0
7/20
14 1
3:31
:04.
View Article Online
and tissues. Mobility dri times are tabulated and inter-compared between the following lipids: glycer-ophosphoethanolamines (PEs), glycerophosposerines (PSs),glycerophosphoglycerols (PGs), glycerolphosphoinositols (PIs),glycerophosphates (PAs), sulfatides (STs), and gangliosides innegative ion mode. Additionally, MSI with MALDI-IM MS wasemployed to image several lipid species from mouse cerebrumin negative ion mode. The results from these experiments andtheir implications for future tissue imaging are presentedbelow.
Material and methodsMass spectrometer
Data were acquired with a periodic focusing MALDI-IM-TOFMS instrument in negative ion mode (IM-oTOF™ Ion-werks, Inc., Houston, TX). A mobility resolution of 25 (FWHMof dri time) and a mass resolution of 3000 for m/z 1000 areroutinely achieved on calibration standards. The length of themobility cell is �17 cm with 56 electrodes, operating at �2000V and lled with 1.4 mbar helium gas. The cell electrodes arecongured as a large gap (3.1 mm) and small gap (1.55 m) pair,producing an electric eld gradient of 115 V cm�1 across eachlarge gap and 230 V cm�1 across each small gap. The clearance
5002 | Anal. Methods, 2014, 6, 5001–5007
time from the IM dri cell of singly charged ions smaller than2 kDa is less than 500 microseconds which in principle allowslaser pulse rates of 2 kHz to be achieved; however, for conve-nience a 200 Hz pulse rate from a Nd:YLF UV laser (l ¼ 349nm) was used in these experiments. An X–Y sample stage(National Aperture Inc., Salemn, NH, folded micro-stage,model MM-3M-F-2) provides 1 mm accuracy in beam posi-tioning and sample scanning. The integral ion mobility spotprole separation of lipids occurred in hundreds of micro-seconds, while the total signal acquisition time lasted from0.5 to 2 minutes depending on analyte concentration. ForMALDI-IM imaging experiments in this paper, a 100 micronspatial resolution and a 3 s acquisition time per step was used.At present technical issues such as large le sizes preclude theuse of integral mobility to capture the IM separated massspectrometry of all ions present from each pixel location. Thusfor the imaging experiments presented in this paper the dricell is operated in a differential mode by establishing offsets inboth mass and mobility data acquisition parameters. Thesechoices of parameter limit the incoming data to a usable massrange of approximately 100 Da and a mobility dri time rangespanning approximately 16ms (at m/z ¼ 800). The region ofinterest mass bins and corresponding intensities are saved toa le along with the positional coordinates.
This journal is © The Royal Society of Chemistry 2014

Fig. 2 (a) MALDI-IM 2D plot of brain STs. (b) Plot of drift time versusm/z of egg PA, egg PG, brain PS, liver PI, and brain ST extracts with DHAmatrix.
Paper Analytical Methods
Publ
ishe
d on
26
Mar
ch 2
014.
Dow
nloa
ded
by N
AT
ION
AL
IN
STIT
UT
ES
OF
HE
AL
TH
on
25/0
7/20
14 1
3:31
:04.
View Article Online
Data are presented as 2D contour plots of ion intensity as afunction of dri time (y-axis) and m/z (x-axis). In addition, thederived 1D ion mobility spectrum and 1D mass spectrum foreach MALDI-IM spectrum are also included. In the 2D contourplots of dri time versus m/z, compounds that have the samemolecular weight but different structures are observed alongion groupings which have different slopes. The values repor-ted for the m/z and dri time for individual lipid species arebased upon a centroid calculation of the (boxcar-averaged)smoothed 2D signal, giving the center-of-mass for a particular2D ion intensity distribution. All contour plots were producedusing IDL soware (Exelis Visual Information Solutions,Boulder, CO).
Lipid extracts
The following lipid extracts: PAs from chicken egg, PEs fromporcine brain, PGs from chicken egg, PIs from bovine liver, PSsfrom porcine brain, and STs from porcine brain were purchasedfrom Avanti Polar Lipids (Alabaster, AL). Stock solutions of thelipids were prepared in chloroform : methanol (2 : 1 v/v) at aconcentration of 10 nmol mL�1.
Matrix
2,6-Dihydroxyacetophenone (DHA) was used as the MALDImatrix. For lipid extracts, saturated DHA was mixed with 3mM ammonium sulfate and 0.05% heptauorobutyric acid in50% ethanol, while for direct tissue analysis and imagingsaturated DHA was mixed with 125 mM ammonium sulfateand 0.05% heptauorobutyric acid in 50% ethanol. Theaddition of HFBA has been shown to improve DHA's lifetimeunder vacuum and the ammonium sulfate aids in displacingsalt adducts.30
Tissue sectioning and handling
All the animal use and handling in this work abides by the Guidefor the Care and Use of Laboratory Animals (NIH). Mice wereeuthanized with isourane and were decapitated upon cessationof respiration. The brains were quickly removed from the skulland frozen in dry ice-chilled isopentane for no more than 10seconds, prior to storage at�80 �C. The frozen mice brains weretransferred from �80 �C to the cryostat chamber (CM 3050 S;Leica Microsystems Nussloch GmbH, Nussloch, Germany) at�20 �C. The tissue samples were attached to the cryostat samplestages using ice slush made from distilled water. This procedurehas been described in detail previously.20 The brains were cutinto 16 mm sections and placed onto the MALDI sample targets.The plates were stored at �80 �C until analysis.
Sample preparation
Lipid extract stock solutions were diluted to 500 pmols mL�1 inDHA matrix solution and 0.5 mL was deposited onto the MALDIsample target. For MALDI imaging, tissue sections were sprayedwith matrix using an artistic air brush.31 To improve the matrixcoating and limit evaporation, the spraying was done in a coldroom (+4 �C).
This journal is © The Royal Society of Chemistry 2014
Lipid assignment
Assignment of lipid species was as follows: PA, PG, PI, and PSspecies numbering equal the total length and number of doublebonds of both radyl chains, while ST species numberingcorresponds to the length and number of double bonds of theacyl chain attached to the sphingosine base. PE species equalthe total length and number of both radyl chains with a repre-senting diacyl species and p representing plasmalogen species.
Results and discussions
Initial studies were conducted on standard tissue extracts fordifferent classes of glycerolphospholids and sphingolipids innegative ion mode to record their mobility time and molecularweight. Fig. 2a illustrates a MALDI-IM MS spectrum of brain STextracts in negative ion mode with DHA matrix. Five species ofsulfatides (ST C22:0(OH)/d18:1, ST C24:1/d18:1, ST C24:0/d18:1,ST C24:1(OH)/d18:1, ST C24:0(OH)/d18:1) were detected as [M�H]� ions in the m/z range shown. As observed previously forother lipid classes by IM-MS in positive ionmode, an increase inmobility time parallels the increase in saturation of the acylchain (i.e. decrease in the number of double bonds).14–16,18 Inone study it was suggested that the variation in collision cross
Anal. Methods, 2014, 6, 5001–5007 | 5003
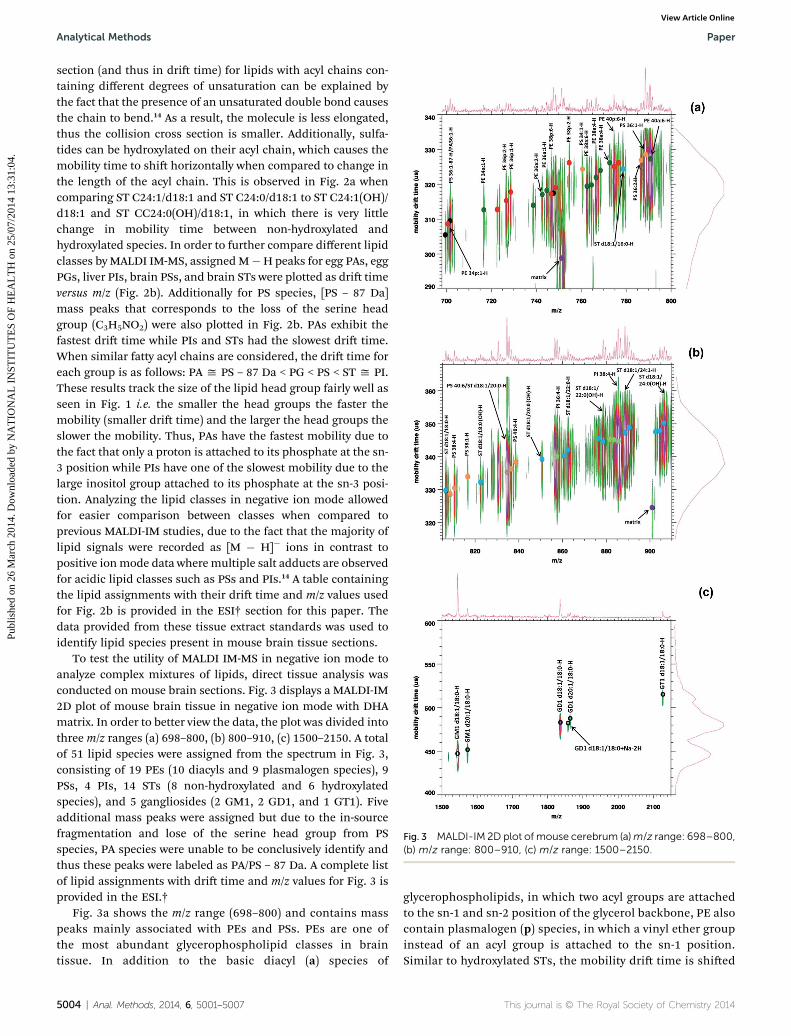
Fig. 3 MALDI-IM 2D plot of mouse cerebrum (a)m/z range: 698–800,(b) m/z range: 800–910, (c) m/z range: 1500–2150.
Analytical Methods Paper
Publ
ishe
d on
26
Mar
ch 2
014.
Dow
nloa
ded
by N
AT
ION
AL
IN
STIT
UT
ES
OF
HE
AL
TH
on
25/0
7/20
14 1
3:31
:04.
View Article Online
section (and thus in dri time) for lipids with acyl chains con-taining different degrees of unsaturation can be explained bythe fact that the presence of an unsaturated double bond causesthe chain to bend.14 As a result, the molecule is less elongated,thus the collision cross section is smaller. Additionally, sulfa-tides can be hydroxylated on their acyl chain, which causes themobility time to shi horizontally when compared to change inthe length of the acyl chain. This is observed in Fig. 2a whencomparing ST C24:1/d18:1 and ST C24:0/d18:1 to ST C24:1(OH)/d18:1 and ST CC24:0(OH)/d18:1, in which there is very littlechange in mobility time between non-hydroxylated andhydroxylated species. In order to further compare different lipidclasses byMALDI IM-MS, assignedM�H peaks for egg PAs, eggPGs, liver PIs, brain PSs, and brain STs were plotted as dri timeversus m/z (Fig. 2b). Additionally for PS species, [PS – 87 Da]mass peaks that corresponds to the loss of the serine headgroup (C3H5NO2) were also plotted in Fig. 2b. PAs exhibit thefastest dri time while PIs and STs had the slowest dri time.When similar fatty acyl chains are considered, the dri time foreach group is as follows: PA y PS – 87 Da < PG < PS < ST y PI.These results track the size of the lipid head group fairly well asseen in Fig. 1 i.e. the smaller the head groups the faster themobility (smaller dri time) and the larger the head groups theslower the mobility. Thus, PAs have the fastest mobility due tothe fact that only a proton is attached to its phosphate at the sn-3 position while PIs have one of the slowest mobility due to thelarge inositol group attached to its phosphate at the sn-3 posi-tion. Analyzing the lipid classes in negative ion mode allowedfor easier comparison between classes when compared toprevious MALDI-IM studies, due to the fact that the majority oflipid signals were recorded as [M � H]� ions in contrast topositive ionmode data wheremultiple salt adducts are observedfor acidic lipid classes such as PSs and PIs.14 A table containingthe lipid assignments with their dri time and m/z values usedfor Fig. 2b is provided in the ESI† section for this paper. Thedata provided from these tissue extract standards was used toidentify lipid species present in mouse brain tissue sections.
To test the utility of MALDI IM-MS in negative ion mode toanalyze complex mixtures of lipids, direct tissue analysis wasconducted on mouse brain sections. Fig. 3 displays a MALDI-IM2D plot of mouse brain tissue in negative ion mode with DHAmatrix. In order to better view the data, the plot was divided intothree m/z ranges (a) 698–800, (b) 800–910, (c) 1500–2150. A totalof 51 lipid species were assigned from the spectrum in Fig. 3,consisting of 19 PEs (10 diacyls and 9 plasmalogen species), 9PSs, 4 PIs, 14 STs (8 non-hydroxylated and 6 hydroxylatedspecies), and 5 gangliosides (2 GM1, 2 GD1, and 1 GT1). Fiveadditional mass peaks were assigned but due to the in-sourcefragmentation and lose of the serine head group from PSspecies, PA species were unable to be conclusively identify andthus these peaks were labeled as PA/PS – 87 Da. A complete listof lipid assignments with dri time and m/z values for Fig. 3 isprovided in the ESI.†
Fig. 3a shows the m/z range (698–800) and contains masspeaks mainly associated with PEs and PSs. PEs are one ofthe most abundant glycerophospholipid classes in braintissue. In addition to the basic diacyl (a) species of
5004 | Anal. Methods, 2014, 6, 5001–5007
glycerophospholipids, in which two acyl groups are attachedto the sn-1 and sn-2 position of the glycerol backbone, PE alsocontain plasmalogen (p) species, in which a vinyl ether groupinstead of an acyl group is attached to the sn-1 position.Similar to hydroxylated STs, the mobility dri time is shied
This journal is © The Royal Society of Chemistry 2014
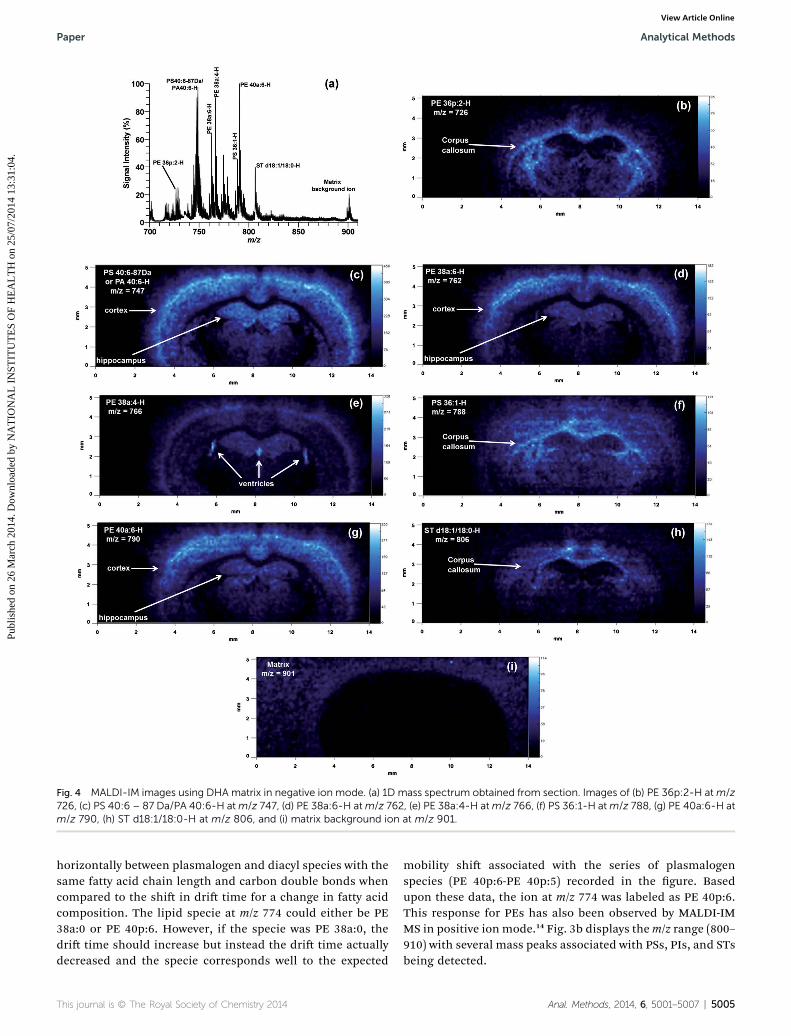
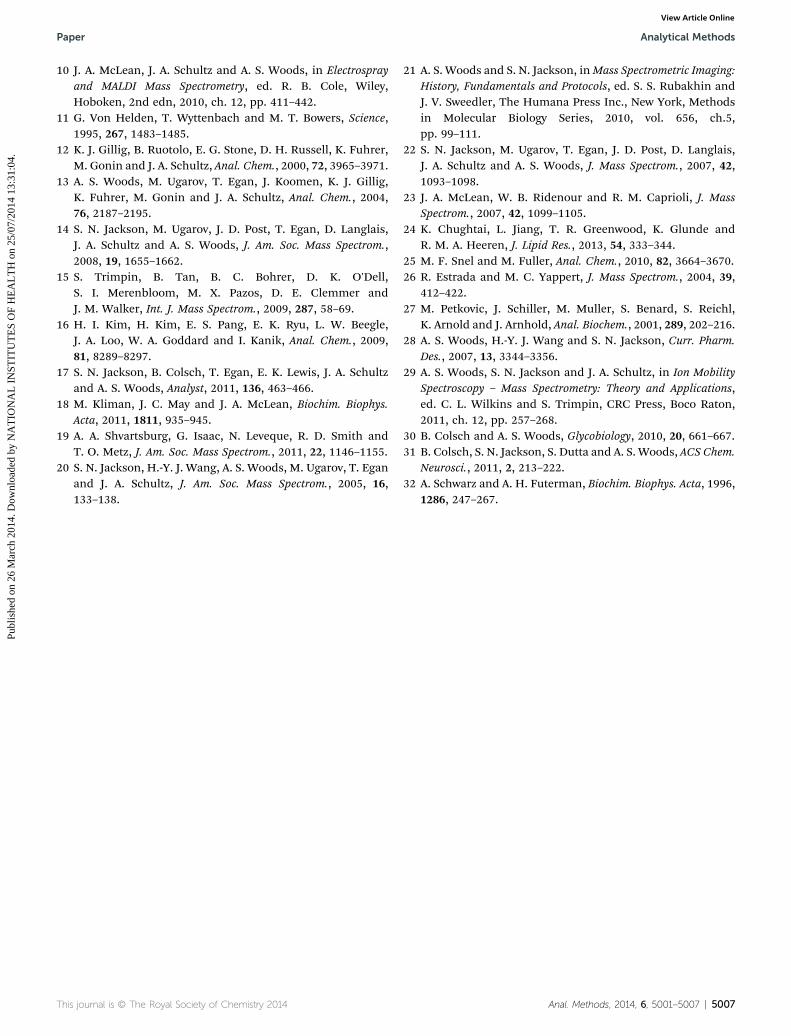
Fig. 4 MALDI-IM images using DHA matrix in negative ion mode. (a) 1D mass spectrum obtained from section. Images of (b) PE 36p:2-H atm/z726, (c) PS 40:6 – 87 Da/PA 40:6-H atm/z 747, (d) PE 38a:6-H atm/z 762, (e) PE 38a:4-H atm/z 766, (f) PS 36:1-H atm/z 788, (g) PE 40a:6-H atm/z 790, (h) ST d18:1/18:0-H at m/z 806, and (i) matrix background ion at m/z 901.
Paper Analytical Methods
Publ
ishe
d on
26
Mar
ch 2
014.
Dow
nloa
ded
by N
AT
ION
AL
IN
STIT
UT
ES
OF
HE
AL
TH
on
25/0
7/20
14 1
3:31
:04.
View Article Online
horizontally between plasmalogen and diacyl species with thesame fatty acid chain length and carbon double bonds whencompared to the shi in dri time for a change in fatty acidcomposition. The lipid specie at m/z 774 could either be PE38a:0 or PE 40p:6. However, if the specie was PE 38a:0, thedri time should increase but instead the dri time actuallydecreased and the specie corresponds well to the expected
This journal is © The Royal Society of Chemistry 2014
mobility shi associated with the series of plasmalogenspecies (PE 40p:6-PE 40p:5) recorded in the gure. Basedupon these data, the ion at m/z 774 was labeled as PE 40p:6.This response for PEs has also been observed by MALDI-IMMS in positive ion mode.14 Fig. 3b displays them/z range (800–910) with several mass peaks associated with PSs, PIs, and STsbeing detected.
Anal. Methods, 2014, 6, 5001–5007 | 5005

Table 1 Effect of lipid structure on mobility time
Lipid structure Effect on mobility (dri) time
Head group of lipid PA y PS – 87 Da < PG < PS < ST y PIfor similar radyl chains
Increase in radyl chain length Increase in mobility timeIncrease in degree of saturation(decrease in double bonds)
Increase in mobility time
Diacyl versus plasmalogen Little to no change in mobility timefor similar radyl chains (shihorizontally)
Hydroxylated versusnonhydroxylated
Little to no change in mobility timefor similar radyl chains (shihorizontally)
Increase in # of sialic acids ingangliosides
Increase in mobility time
Analytical Methods Paper
Publ
ishe
d on
26
Mar
ch 2
014.
Dow
nloa
ded
by N
AT
ION
AL
IN
STIT
UT
ES
OF
HE
AL
TH
on
25/0
7/20
14 1
3:31
:04.
View Article Online
Gangliosides are complex glycosphingolipids that contain oneor more negatively charged sialic acids, N-acetylneuraminic acid(GM1 ¼ 1 sialic acid, GD1 ¼ 2 sialic acids, GT1 ¼ 3 sialic acids).Fig. 3c shows the m/z range for ganglioside species detected inmouse brain tissue and ve species were detected (GM1 d18:1/18:0, GM1 d20:1/18:0, GD1 d18:1/18:0, GD1 d20:1/18:0, GT1d18:1/18:0) as [M� H]� peaks. GM1, GD1, and GT1 are the maingangliosides in the central nervous systems of mammals andrepresent 80–90% of total gangliosides.32 As can be seen inFig. 3c, ganglioside species separated by the number of sialic acidresidues due to the increase in mobility time corresponding tothe increase in the number of sialic acids. GD1 gangliosides areactually composed of two structural isomers, GD1a, containingtwo sialic acids one attached to the terminal galactose residueand one to the rst galactose residue in its oligosaccharide head,and GD1b where the two sialic acids are attached to the rstgalactose residue in the oligosaccharide head. Standards of bothGD1a and GD1b were analyzed (data not shown). However, thetwo isomers (GD1a and GD1b) were not able to be separatedbased upon the mobility time of their [M � H]� peaks and thustheir corresponding peaks in tissue were labeled as GD1.
Fig. 4 shows the results of a MALDI-IM imaging run obtainedwith DHA matrix from a mouse cerebrum in negative ion mode.A mass range of 685–955 and amobility dri time of 320 ms wereused to acquire the data in Fig. 4. The total 1D mass spectrumfor the imaging run is shown in Fig. 4a. Major lipid peaks in themass spectrum correspond to PE 36p:2, PS 40:6 – 87 Da/PA 40:6,PE 38a:6, PE 38a:4, PS 36:1, PE 40a:6, and ST d18:1/18:0. Clearanatomical regions were visualized in the ion images of indi-vidual lipid species (Fig. 4b–h) mainly tracking white versus greymatter regions. Lipids concentrated in the corpus callosum, awhite matter region, were PE 36p:2 (Fig. 4b), PS 36:1 (Fig. 4f),and ST d18:1/18:0 (Fig. 4h). Grey matter regions such as thecerebral cortex and hippocampus contained higher amounts ofthe following lipid species: PS 40:6 – 87 Da or PA 40:6 (Fig. 4c),PE 38a:6 (Fig. 4d), PE 40a:6 (Fig. 4g). One lipid specie, PE 38a:4(Fig. 4f) was found in high abundance in the 3 ventricle regionsof the cerebrum. Fig. 4i shows an ion image for a matrix clusterpeak at m/z ¼ 901, which is concentrated on the stainless steelsample plate off of the tissue section. Additionally, this peak iseasy to distinguish from the lipid peaks because of the lowmobility time for a peak in that mass range, which causes it tobe off of the lipid trend line.
Conclusions
This study is the rst time MALDI-IM MS was used in negativeion mode for the analysis of several major classes of lipids.Similar to positive ion mode, MALDI-IM MS allowed for the fast2D separation of lipid species based upon dri time and m/z innegative ion mode. The change in dri time (i.e. collision crosssection of the ion) of lipids was due to the radyl chain lengthand degree of unsaturation, the head group, and the type ofradyl chain (plasmalogen versus diacyl) of individual species. Abrief summary of these results are listed in Table 1. Based uponthese factors, the identication of lipids species using MALDI-IMMS was able to be simplied and improved. Additionally, the
5006 | Anal. Methods, 2014, 6, 5001–5007
analysis of lipids in negative ion mode further simplied theassignment of acidic lipids by reducing the salt adducts thatdominates spectra in positive ion mode. Moreover, direct tissueanalysis of lipids in negative ion mode allowed for more acidic(negative) lipid species to be detected and thus imaged whencompared to positive ion mode. Future studies will includemodication to both the instrument and soware to be able toimage the whole ion mobility time range instead of the currentsetup that only allows for an approximately 16ms window. Thiswill greatly increase the number of lipid species imaged and willenable a more complete pre-separation of lipids by mobilityprior to mass analysis at the expense of managing ever-enlarging massive le sizes.
Acknowledgements
This research was supported by the Intramural ResearchProgram of the National Institute on Drug Abuse, NIH. Ionwerksgratefully acknowledges partial support of this work from NIHSBIR phase II grants 5R44DA030853 and 2R44DA036263-02.
References
1 D. S. Cornett, M. L. Reyzer, P. Chaurand and R. M. Caprioli,Nat. Methods, 2007, 4, 828–833.
2 E. R. van Hove Amstalden, D. F. Smith and R. M. A. Heeren,J. Chromatogr. A., 2010, 1217, 3946–3954.
3 E. H. Seeley, K. Schwamborn and R. M. Caprioli, J. Biol.Chem., 2013, 286, 25459–25466.
4 S. N. Jackson and A. S. Woods, J. Chromatogr. B: Anal.Technol. Biomed. Life Sci., 2009, 877, 2822–2829.
5 J. A. Fernandez, B. Ochoa, O. Fresnedo, M. T. Giralt andR. Rodrıguez-Puertas, Anal. Bioanal. Chem., 2011, 401, 29–51.
6 N. Goto-Inoue, T. Hayasaka, N. Zaima andM. Setou, Biochim.Biophys. Acta, 2011, 1811, 961–969.
7 D. Gode and D. A. Volmer, Analyst, 2013, 138, 1289–1315.8 D. C. Collins and M. L. Lee, Anal. Bioanal. Chem., 2002, 372,66–73.
9 A. B. Kanu, P. Dwivedi, M. Tam, L. Matz and H. H. Hill, Jr,J. Mass Spectrom., 2008, 43, 1–22.
This journal is © The Royal Society of Chemistry 2014
Paper Analytical Methods
Publ
ishe
d on
26
Mar
ch 2
014.
Dow
nloa
ded
by N
AT
ION
AL
IN
STIT
UT
ES
OF
HE
AL
TH
on
25/0
7/20
14 1
3:31
:04.
View Article Online
10 J. A. McLean, J. A. Schultz and A. S. Woods, in Electrosprayand MALDI Mass Spectrometry, ed. R. B. Cole, Wiley,Hoboken, 2nd edn, 2010, ch. 12, pp. 411–442.
11 G. Von Helden, T. Wyttenbach and M. T. Bowers, Science,1995, 267, 1483–1485.
12 K. J. Gillig, B. Ruotolo, E. G. Stone, D. H. Russell, K. Fuhrer,M. Gonin and J. A. Schultz, Anal. Chem., 2000, 72, 3965–3971.
13 A. S. Woods, M. Ugarov, T. Egan, J. Koomen, K. J. Gillig,K. Fuhrer, M. Gonin and J. A. Schultz, Anal. Chem., 2004,76, 2187–2195.
14 S. N. Jackson, M. Ugarov, J. D. Post, T. Egan, D. Langlais,J. A. Schultz and A. S. Woods, J. Am. Soc. Mass Spectrom.,2008, 19, 1655–1662.
15 S. Trimpin, B. Tan, B. C. Bohrer, D. K. O'Dell,S. I. Merenbloom, M. X. Pazos, D. E. Clemmer andJ. M. Walker, Int. J. Mass Spectrom., 2009, 287, 58–69.
16 H. I. Kim, H. Kim, E. S. Pang, E. K. Ryu, L. W. Beegle,J. A. Loo, W. A. Goddard and I. Kanik, Anal. Chem., 2009,81, 8289–8297.
17 S. N. Jackson, B. Colsch, T. Egan, E. K. Lewis, J. A. Schultzand A. S. Woods, Analyst, 2011, 136, 463–466.
18 M. Kliman, J. C. May and J. A. McLean, Biochim. Biophys.Acta, 2011, 1811, 935–945.
19 A. A. Shvartsburg, G. Isaac, N. Leveque, R. D. Smith andT. O. Metz, J. Am. Soc. Mass Spectrom., 2011, 22, 1146–1155.
20 S. N. Jackson, H.-Y. J. Wang, A. S. Woods, M. Ugarov, T. Eganand J. A. Schultz, J. Am. Soc. Mass Spectrom., 2005, 16,133–138.
This journal is © The Royal Society of Chemistry 2014
21 A. S. Woods and S. N. Jackson, inMass Spectrometric Imaging:History, Fundamentals and Protocols, ed. S. S. Rubakhin andJ. V. Sweedler, The Humana Press Inc., New York, Methodsin Molecular Biology Series, 2010, vol. 656, ch.5,pp. 99–111.
22 S. N. Jackson, M. Ugarov, T. Egan, J. D. Post, D. Langlais,J. A. Schultz and A. S. Woods, J. Mass Spectrom., 2007, 42,1093–1098.
23 J. A. McLean, W. B. Ridenour and R. M. Caprioli, J. MassSpectrom., 2007, 42, 1099–1105.
24 K. Chughtai, L. Jiang, T. R. Greenwood, K. Glunde andR. M. A. Heeren, J. Lipid Res., 2013, 54, 333–344.
25 M. F. Snel and M. Fuller, Anal. Chem., 2010, 82, 3664–3670.26 R. Estrada and M. C. Yappert, J. Mass Spectrom., 2004, 39,
412–422.27 M. Petkovic, J. Schiller, M. Muller, S. Benard, S. Reichl,
K. Arnold and J. Arnhold, Anal. Biochem., 2001, 289, 202–216.28 A. S. Woods, H.-Y. J. Wang and S. N. Jackson, Curr. Pharm.
Des., 2007, 13, 3344–3356.29 A. S. Woods, S. N. Jackson and J. A. Schultz, in Ion Mobility
Spectroscopy – Mass Spectrometry: Theory and Applications,ed. C. L. Wilkins and S. Trimpin, CRC Press, Boco Raton,2011, ch. 12, pp. 257–268.
30 B. Colsch and A. S. Woods, Glycobiology, 2010, 20, 661–667.31 B. Colsch, S. N. Jackson, S. Dutta and A. S. Woods, ACS Chem.
Neurosci., 2011, 2, 213–222.32 A. Schwarz and A. H. Futerman, Biochim. Biophys. Acta, 1996,
1286, 247–267.
Anal. Methods, 2014, 6, 5001–5007 | 5007
Related Documents