MALDI Imaging Mass Spectrometry for In Situ Proteomic Analysis of Preneoplastic Lesions in Pancreatic Cancer Barbara M. Gru ¨ ner 1 , Hannes Hahne 2 , Pawel K. Mazur 1¤ , Marija Trajkovic-Arsic 1 , Stefan Maier 2,3 , Irene Esposito 3,4 , Evdokia Kalideris 1 , Christoph W. Michalski 5 , Jo ¨ rg Kleeff 5 , Sandra Rauser 3 , Roland M. Schmid 1 , Bernhard Ku ¨ ster 2,6 , Axel Walch 3 , Jens T. Siveke 1 * 1 II. Medizinische Klinik, Technische Universita ¨t Mu ¨ nchen, Munich, Germany, 2 Chair of Proteomics and Bioanalytics, Center of Life and Food Sciences, Technische Universita ¨t Mu ¨ nchen, Munich, Germany, 3 Institute of Pathology, Helmholtz Center Munich - German Research Center for Environmental Health, Neuherberg, Germany, 4 Institute of Pathology, Technische Universita ¨t Mu ¨ nchen, Munich, Germany, 5 Department of Surgery, Technische Universita ¨t Mu ¨ nchen, Munich, Germany, 6 Center for Integrated Protein Science Munich, Munich, Germany Abstract The identification of new biomarkers for preneoplastic pancreatic lesions (PanINs, IPMNs) and early pancreatic ductal adenocarcinoma (PDAC) is crucial due to the diseases high mortality rate upon late detection. To address this task we used the novel technique of matrix-assisted laser desorption/ionization (MALDI) imaging mass spectrometry (IMS) on genetically engineered mouse models (GEM) of pancreatic cancer. Various GEM were analyzed with MALDI IMS to investigate the peptide/protein-expression pattern of precursor lesions in comparison to normal pancreas and PDAC with cellular resolution. Statistical analysis revealed several discriminative m/z-species between normal and diseased tissue. Intraepithelial neoplasia (PanIN) and intraductal papillary mucinous neoplasm (IPMN) could be distinguished from normal pancreatic tissue and PDAC by 26 significant m/z-species. Among these m/z-species, we identified Albumin and Thymosin- beta 4 by liquid chromatography and tandem mass spectrometry (LC-MS/MS), which were further validated by immunohistochemistry, western blot, quantitative RT-PCR and ELISA in both murine and human tissue. Thymosin-beta 4 was found significantly increased in sera of mice with PanIN lesions. Upregulated PanIN expression of Albumin was accompanied by increased expression of liver-restricted genes suggesting a hepatic transdifferentiation program of preneoplastic cells. In conclusion we show that GEM of endogenous PDAC are a suitable model system for MALDI-IMS and subsequent LC-MS/MS analysis, allowing in situ analysis of small precursor lesions and identification of differentially expressed peptides and proteins. Citation: Gru ¨ ner BM, Hahne H, Mazur PK, Trajkovic-Arsic M, Maier S, et al. (2012) MALDI Imaging Mass Spectrometry for In Situ Proteomic Analysis of Preneoplastic Lesions in Pancreatic Cancer. PLoS ONE 7(6): e39424. doi:10.1371/journal.pone.0039424 Editor: Frank T. Kolligs, University of Munich, Germany Received January 15, 2012; Accepted May 20, 2012; Published June 26, 2012 Copyright: ß 2012 Gru ¨ ner et al. This is an open-access article distributed under the terms of the Creative Commons Attribution License, which permits unrestricted use, distribution, and reproduction in any medium, provided the original author and source are credited. Funding: This work was supported by the German Research Foundation (SFB824-C4), the German Federal Ministry of Education and Research (BMBF; # 01GS08115) and the Association of Cancer Research (AICR; # 07-0543); all to JTS. The funders had no role in study design, data collection and analysis, decision to publish, or preparation of the manuscript. Competing Interests: The authors have declared that no competing interests exist. * E-mail: [email protected] ¤ Current address: Department of Genetics and Department of Pediatrics, Stanford University Medical School, Stanford, California, United States of America Introduction Pancreatic ductal adenocarcinoma (PDAC) is the fourth leading cause of cancer death in the western world [1]. Due to the advanced stage at diagnosis and the high intrinsic resistance to therapy, the incidence of PDAC corresponds with its mortality with a median survival of less than 6 month and an overall 5-year- survival rate below 5% [2]. Identification of proteins expressed in preneoplastic lesions may help identify the disease in a preinvasive state, a clinically highly relevant goal as resection remains the only curative approach often frustrated by early undetected metastasis or locally advanced disease [2]. Clinical and histopathological studies have identified three PDAC precursor lesions: pancreatic intraepithelial neoplasia (PanIN), intraductal papillary mucinous neoplasm (IPMN) and mucinous cystic neoplasm (MCN). The by far most common precursors are PanIN lesions, although due to improved imaging modalities cystic neoplasms such as IPMNs and, to a lesser extent, MCNs are increasingly diagnosed [3,4]. The identification and classification of PanINs as precursors of PDAC [5] has enabled the development of a morphological and genetic progression model (overview in [3]). These advances have contributed to the development of sophisticated Cre/lox-based genetically engineered mice (GEM) for endogenous PDAC [6]. A well-established mouse model recapitulating the molecular and morphological stages of human PDAC development is the Kras G12D model, in which oncogenic Kras G12D is activated in the endogenous Kras locus. Mice develop locally invasive and metastatic PDAC through defined PanIN lesions progressing from PanIN1 to PanIN3 [7]. Additional activation of EGFR signaling leads to an accelerated development of PDAC through PanIN and IPMN lesions, extending the spectrum of clinically relevant PDAC mouse models [8]. Because of the defined genetic background and the experimentally addressable time course of preneoplastic lesion development and progression to PDAC, we hypothesized these models to be PLoS ONE | www.plosone.org 1 June 2012 | Volume 7 | Issue 6 | e39424

Welcome message from author
This document is posted to help you gain knowledge. Please leave a comment to let me know what you think about it! Share it to your friends and learn new things together.
Transcript

MALDI Imaging Mass Spectrometry for In Situ ProteomicAnalysis of Preneoplastic Lesions in Pancreatic CancerBarbara M. Gruner1, Hannes Hahne2, Pawel K. Mazur1¤, Marija Trajkovic-Arsic1, Stefan Maier2,3,
Irene Esposito3,4, Evdokia Kalideris1, Christoph W. Michalski5, Jorg Kleeff5, Sandra Rauser3,
Roland M. Schmid1, Bernhard Kuster2,6, Axel Walch3, Jens T. Siveke1*
1 II. Medizinische Klinik, Technische Universitat Munchen, Munich, Germany, 2 Chair of Proteomics and Bioanalytics, Center of Life and Food Sciences, Technische
Universitat Munchen, Munich, Germany, 3 Institute of Pathology, Helmholtz Center Munich - German Research Center for Environmental Health, Neuherberg, Germany,
4 Institute of Pathology, Technische Universitat Munchen, Munich, Germany, 5 Department of Surgery, Technische Universitat Munchen, Munich, Germany, 6 Center for
Integrated Protein Science Munich, Munich, Germany
Abstract
The identification of new biomarkers for preneoplastic pancreatic lesions (PanINs, IPMNs) and early pancreatic ductaladenocarcinoma (PDAC) is crucial due to the diseases high mortality rate upon late detection. To address this task we usedthe novel technique of matrix-assisted laser desorption/ionization (MALDI) imaging mass spectrometry (IMS) on geneticallyengineered mouse models (GEM) of pancreatic cancer. Various GEM were analyzed with MALDI IMS to investigate thepeptide/protein-expression pattern of precursor lesions in comparison to normal pancreas and PDAC with cellularresolution. Statistical analysis revealed several discriminative m/z-species between normal and diseased tissue.Intraepithelial neoplasia (PanIN) and intraductal papillary mucinous neoplasm (IPMN) could be distinguished from normalpancreatic tissue and PDAC by 26 significant m/z-species. Among these m/z-species, we identified Albumin and Thymosin-beta 4 by liquid chromatography and tandem mass spectrometry (LC-MS/MS), which were further validated byimmunohistochemistry, western blot, quantitative RT-PCR and ELISA in both murine and human tissue. Thymosin-beta 4was found significantly increased in sera of mice with PanIN lesions. Upregulated PanIN expression of Albumin wasaccompanied by increased expression of liver-restricted genes suggesting a hepatic transdifferentiation program ofpreneoplastic cells. In conclusion we show that GEM of endogenous PDAC are a suitable model system for MALDI-IMS andsubsequent LC-MS/MS analysis, allowing in situ analysis of small precursor lesions and identification of differentiallyexpressed peptides and proteins.
Citation: Gruner BM, Hahne H, Mazur PK, Trajkovic-Arsic M, Maier S, et al. (2012) MALDI Imaging Mass Spectrometry for In Situ Proteomic Analysis ofPreneoplastic Lesions in Pancreatic Cancer. PLoS ONE 7(6): e39424. doi:10.1371/journal.pone.0039424
Editor: Frank T. Kolligs, University of Munich, Germany
Received January 15, 2012; Accepted May 20, 2012; Published June 26, 2012
Copyright: � 2012 Gruner et al. This is an open-access article distributed under the terms of the Creative Commons Attribution License, which permitsunrestricted use, distribution, and reproduction in any medium, provided the original author and source are credited.
Funding: This work was supported by the German Research Foundation (SFB824-C4), the German Federal Ministry of Education and Research (BMBF; #01GS08115) and the Association of Cancer Research (AICR; # 07-0543); all to JTS. The funders had no role in study design, data collection and analysis, decision topublish, or preparation of the manuscript.
Competing Interests: The authors have declared that no competing interests exist.
* E-mail: [email protected]
¤ Current address: Department of Genetics and Department of Pediatrics, Stanford University Medical School, Stanford, California, United States of America
Introduction
Pancreatic ductal adenocarcinoma (PDAC) is the fourth leading
cause of cancer death in the western world [1]. Due to the
advanced stage at diagnosis and the high intrinsic resistance to
therapy, the incidence of PDAC corresponds with its mortality
with a median survival of less than 6 month and an overall 5-year-
survival rate below 5% [2]. Identification of proteins expressed in
preneoplastic lesions may help identify the disease in a preinvasive
state, a clinically highly relevant goal as resection remains the only
curative approach often frustrated by early undetected metastasis
or locally advanced disease [2].
Clinical and histopathological studies have identified three
PDAC precursor lesions: pancreatic intraepithelial neoplasia
(PanIN), intraductal papillary mucinous neoplasm (IPMN) and
mucinous cystic neoplasm (MCN). The by far most common
precursors are PanIN lesions, although due to improved imaging
modalities cystic neoplasms such as IPMNs and, to a lesser extent,
MCNs are increasingly diagnosed [3,4]. The identification and
classification of PanINs as precursors of PDAC [5] has enabled the
development of a morphological and genetic progression model
(overview in [3]). These advances have contributed to the
development of sophisticated Cre/lox-based genetically engineered
mice (GEM) for endogenous PDAC [6]. A well-established mouse
model recapitulating the molecular and morphological stages of
human PDAC development is the KrasG12D model, in which
oncogenic KrasG12D is activated in the endogenous Kras locus. Mice
develop locally invasive and metastatic PDAC through defined
PanIN lesions progressing from PanIN1 to PanIN3 [7]. Additional
activation of EGFR signaling leads to an accelerated development
of PDAC through PanIN and IPMN lesions, extending the
spectrum of clinically relevant PDAC mouse models [8]. Because
of the defined genetic background and the experimentally
addressable time course of preneoplastic lesion development and
progression to PDAC, we hypothesized these models to be
PLoS ONE | www.plosone.org 1 June 2012 | Volume 7 | Issue 6 | e39424

valuable study tools for establishing a preclinical early detection
biomarker identification approach.
Matrix-assisted laser desorption/ionization (MALDI) imaging
mass spectrometry (IMS) has evolved as a novel technique and
promising tool in biomarker discovery and translational oncology
[9]. Examples include Parkinsons [10] and Alzheimer’s [11]
disease as well as several cancers including gliomas [12,13,14,15],
ovarian [16], prostate [17], breast [18] and colon cancer [19]. By
providing a molecular ex vivo view of the resected tissue, the label-
free tracking of endogenous compounds with spatial resolution and
molecular specificity is enabled (overview in [9,20]).
In this study, we applied MALDI-IMS to examine the feasibility
of this technique for the identification of potential novel
biomarkers in PanIN lesions. We characterized two PanIN-
specific peaks, which were identified as ALB1 and TMSB4X. We
further substantiate ALB1 expression as part of a hepatic
transdifferentiation program of precursor lesions and provide
evidence for increased serum levels of TMSB4X in mice with
PanIN lesions.
Materials and Methods
Ethics StatementThe study was approved by the Ethics committee of the Faculty
of Medicine of the Technical University of Munich. Written
informed consent was obtained from all patients prior to inclusion
in the study.
All animal experiments were conducted in accordance with
German Federal Animal Protection Laws and approved by the
Institutional Animal Care and Use Committee at the Technical
University of Munich.
Mouse StrainsKras+/LSL2G12D, Ptf1a+/Cre, Ela-Tgfa and Trp53+/LSL2R172H strains
have been described previously [7,8,21,22,23]. Mice were interbred to
obtain the mouse lines Ptf1a+/Cre;Kras+/G12D;Ela-Tgfa; Ptf1a+/Cre;
Kras+/G12D and Ptf1a+/Cre;Kras+/G12D;Ela-Tgfa;Trp53+/LSL2R172H and
were backcrossed to C57BL/6J background for at least four
generations. C57BL/6J mice served as control.
Human SamplesSerum samples were obtained from 57 subjects with a
histologically proven diagnosis of pancreatic ductal adenocarcino-
ma (21 women, 26 men, median age 67.1 years). Whole blood was
collected prior to surgery. Control serum samples were taken from
10 healthy subjects (2 women, 8 men, median age 66.2 years) and
from 12 patients with chronic pancreatitis (3 women, 9 men,
median age 55.8 years).
MALDI-IMS on Tissue Sections from Mouse PancreataFor MALDI-IMS pancreata were resected and snap-frozen in
liquid nitrogen without any pretreatment. 10 mm cryosections
were cut and transferred to Indium-Tin-Oxide (ITO) coated glass
slides pretreated with poly-lysine 1:1 in water with 0.1% NP-40.
Sections were fixed in 70% ethanol and 100% ethanol for one
min. Matrix (10 g/l sinapinic acid in 60% acetonitrile and 0.2%
trifluoroacetic acid) was uniformly deposited on the slide using the
ImagePrep device (Bruker Daltonics). Mass spectra were measured
using the MALDI TOF/TOF Analyzer Ultraflex III (Bruker
Daltonics) with a spatial resolution of 70 mm in linear mode. Ions
were detected in a mass range of m/z 2500 to 25000 with a
sampling rate of 0.1 GS/s. A ready-made protein standard (Bruker
Daltonics) was employed for calibration of spectra, which was
done externally on the same target before each measurement.
After measurement the slides were washed in 70% ethanol to
remove the matrix and counterstained with hematoxylin/eosin
(H&E). High-resolution images of stained sections were taken
using the Mirax Scan system (Carl Zeiss) and co-registered with
the MALDI-IMS data to correlate mass spectra with the
histological features of the same section.
Statistical Analysis of MALDI-IMS DataMALDI-IMS data were obtained and analyzed using the
FlexControl 3.0, FlexImaging 3.0 and the ClinProTools 2.2
software (Bruker). With the FlexImaging software regions of
interest (ROI) were defined according to the morphology (PanIN,
IPMN, PDAC, WT) and 40 randomly chosen single spectra per
mouse per ROI-group were exported to ClinProTools for further
analysis. Respective lesions were classified by an expert pancreatic
pathologist (I.E.). The extracted mass spectra were recalibrated on
common ‘‘background’’ peaks (spectral alignment) and normalized
on their total ion count. In all analyses, the spectra of two groups
of ROIs were compared and p values were calculated with the
combined Wilcoxon rank-sum test for two non-parametric,
ordinal, independent samples and Benjamini-Hochberg corrected.
P values #0.05 were considered significant.
For validation of discriminating peaks the Significance Analysis
of Microarrays (SAM) test was performed and features with a false
discovery rate less than 0.001 were considered significant. The
optimal discriminating threshold was determined using Receiver
Operating Characteristics (ROC) analysis. Validation was per-
formed with an independent set of samples (Fisher exact t-test,
p,0.001).
Peptide and Protein Identification by LiquidChromatography and Tandem Mass Spectrometry (LC-MS/MS)
Peptides and proteins were extracted directly from sinapinic
acid prepared tissue sections. For the extraction, 1 ml of 30%
acetonitrile in 0.1% trifluoroacetic acid was applied onto the slice,
removed and either mixed with an equal volume of a-cyano-4-
hydroxy-cinnamic acid solution (10 mg/ml in 30% acetonitrile,
0.1% trifluoroacetic acid) on a stainless steel MALDI target for
initial MALDI MS measurement or diluted into 10 ml of 0.1%
formic acid for subsequent LC-MS/MS measurements.
To obtain accurate m/z values for the m/z species of interest,
matrix extracts from adjacent sections of mouse pancreata with a
high intensity of the respective m/z species were analyzed by
positive ion reflector mode MALDI MS. The measurements were
performed on an ultrafleXtreme MALDI-TOF/TOF mass
spectrometer equipped with a 1 kHz Smartbeam-II laser (Bruker
Daltonics). Each spectrum was externally calibrated using the
Peptide Calibration Standard II (Bruker Daltonics) and the ‘‘cubic
enhanced’’ calibration function, typically yielding mass accuracy
,20 ppm.
LC-MS/MS analysis of matrix extracts were performed on an
LTQ Orbitrap mass spectrometer (Thermo Fisher Scientific)
coupled to a nano-HPLC (nanoLC Ultra, Eksigent Technologies).
Peptides were separated on a self-packed 75 mm640 cm reversed-
phase column (Reprosil, Dr. Maisch) using a 25 min linear
gradient (2–35% acetonitrile in 0.1% formic acid, flow rate
300 nl/min). Intact masses of eluting peptides were determined at
30,000 resolution and the three most intense peaks were selected
for further fragmentation by collision-induced dissociation (CID)
and acquisition of fragment spectra with low resolution (1,000).
Singly charged ions as well as ions with unknown charge state were
rejected. Dynamic exclusion was enabled and dynamic exclusion
MALDI-IMS of Pancreatic Cancer Precursor Lesions
PLoS ONE | www.plosone.org 2 June 2012 | Volume 7 | Issue 6 | e39424

Figure 1. MALDI-IMS on wild type pancreas and definition of ROIs on H&E sections. (A) Overview of the MALDI-IMS workflow. (B) Re-visualization of the molecular ion of insulin [M+H+] at 5808 (red bar) in the average spectrum of a pancreatic section from a C57Bl/6 mouse measuredin MALDI-IMS. The intensity of the measured signal is color coded, where red color means highest intensity at the regarding position on the section.The peak of insulin co-localizes with the pancreatic islets (magnified in excerpt). (C) Definition of ROIs on H&E stained sections after MALDI-IMSmeasurement. Upper panel: H&E stained sections of a Ptf1a+/Cre;Kras+/G12D (CK) and a Ptf1a+/Cre;Kras+/G12D;Tgfa (CKT) mouse. Black lines circle exocrine
MALDI-IMS of Pancreatic Cancer Precursor Lesions
PLoS ONE | www.plosone.org 3 June 2012 | Volume 7 | Issue 6 | e39424

duration was set to 10 seconds. Peaklist files were generated using
Mascot Distiller version 2.2.1.0 (Matrix Science) and database
searches were performed using the Mascot search engine version
2.2.04 (Matrix Science) against the IPI mouse database (version
3.26). Search result files were imported into Scaffold (Proteome
Software).
Immunofluorescence and ImmunohistochemistryImmunofluorescence or immunohistochemistry were performed
according to standard protocols. The following antibodies were
used: ALB1 (Santa Cruz Biotechnology, and Thermo Fisher
Scientific), HepPar1 (DAKO), TMSB4X [24,25] (Immundiagnos-
tics, Bensheim) and CK19 (TROMA-III; Developmental Studies
Hybridoma Bank).
Quantitative RT-PCRReal-Time PCR was performed as previsouly described [8].
Cyclophilin was used for normalization. P values were calculated
with the Wilcoxon test. The following primers were used:
Cyclophillin-F/2R ATGGTCAACCCCACCGTGT/
TTCTGCTGTCTTTGGAACTTTGTC
Tmsb4x-F/2R CCTCTGCCTTCAAAAGAAACA/
GGGCAGCACAGTCATTTAAAC
Alb1-F/2R TTGGTCTCATCTGTCCGTCA/
GGCAGCACTCCTTGTTGACT
Transferrin-F/2R ATCAAGGCCATTTCTGCAAGT/
GGTTCAGCTGGAAGTCTGTTCC
Alpha-Fetoprotein-F/2R GGAGGCTATGCATCACCAGT/
CATGGTCTGTAGGGCTTTGC
Apolipoprotein A4-F/2R AGAGCCTGAGGGAGAAGGTC/
AGGTGTCTGCTGCTGTGATG
ELISA –Enzyme Linked Immunosorbent AssayThe ELISA kit for quantitative determination of TMSB4X
concentrations in serum was obtained from Immundiagnostics
(Bensheim). ELISA was performed according to the manufacturers
protocol.
Western BlotWestern Blot analysis was performed according to standard
protocols with antibodies against ALB1 (Santa Cruz Biotechnol-
ogy) and HSP90 (Cell Signaling).
Results
MALDI-IMS in Preneoplastic Lesions and PDAC of GEMModels
To identify novel biomarkers for the two most common
preneoplastic pancreatic lesions, PanIN and IPMN, we resected
pancreata from established GEM of PDAC: 13 Ptf1a+/Cre;Kras+/G12D,
8 Ptf1a+/Cre;Kras+/G12D;Ela-Tgfa and 5 Ptf1a+/Cre;Kras+/G12D;
Ela-Tgfa;Trp53+/LSL-R172H mice of mixed age (3 to 18 month,
depending on the genotype). These mice develop PanIN and IPMN
lesions progressing to invasive and metastatic PDAC with different
onset and aggressiveness [7,8,23]. Four C57Bl/6J mice served as
wild type control. All pancreata were measured in an Ultraflex III
MALDI TOF/TOF Analyzer with a spatial resolution of 70 mm.
The MALDI-IMS workflow is depicted in Figure 1A. To test the
accuracy of the method we first re-visualized the already known
molecular ion of insulin [M+H+] at 5808 on pancreata of wild type
mice. The insulin signal, which is given as a heat map illustration
(where blue means lowest and red highest relative intensity), nicely
co-localized with the islets of Langerhans (Figure 1B), demonstrat-
ing the correct correlation of measured m/z-species to morpholog-
ical features with MALDI-IMS.
To compare the spectra of different morphological areas,
regions of interest (ROI) for PanIN, IPMN, PDAC, and normal
exocrine tissue were defined by an expert in pancreatic pathology
on the pancreata using the FlexImaging software and were used
for comparison of the spectra of respective regions from the same
section as well as from other sections to each other. Figure 1C
gives examples of the definition of regions on measured sections
(Figure 1C upper panel) and the distinct morphological features
(Figure 1C, lower panel). The single spectra of these ROIs were
exported to ClinProTools analysis software. As a first control
experiment we compared the spectra of normal pancreatic tissue
(acini and ducts) from wild type (WT) mice with phenotypically
normal appearing acinar and ductal tissue from Ptf1a+/Cre;Kras+/
G12D mice harboring the oncogenic KrasG12D mutation. No
differences in the spectra between these two groups were
detectable, therefore ensuring that there are no detectable
variances in the spectra of WT and GEM (Table 1). For further
analysis, phenotypically normal ROIs from both genotypes were
classified as ‘‘normal’’.
We next analyzed spectra from normal tissue of C57Bl/6J and
Ptf1a+/Cre;Kras+/G12D mice (n = 11) against spectra from preneo-
plastic lesions of Ptf1a+/Cre;Kras+/G12D and Ptf1a+/Cre;Kras+/G12D;Ela-
Tgfa mice (PanINs and IPMNs, n = 24). These two groups could
be distinguished by 76 statistically significant peaks (Wilcoxon
rank-sum test, p values Benjamini-Hochberg corrected) of which
26 were lesion-specific (i.e. specific for IPMNs and PanINs) and 50
normal-specific with p values between 0.000001 and 0.05. For
PanINs we found 25 (p = 0.000001 to p = 0.05) and for IPMNs 18
(p = 0.03 to p = 0.05) specific m/z-species respectively, which could
discriminate them from normal tissue. Also, IPMNs and PanINs
could be discriminated from each other by 6 PanIN-specific peaks
(p = 0.02 to p = 0.05, n = 19 vs. 13 mice). When comparing the
preneoplastic lesions with PDAC (n = 24 vs. 10 mice) we detected
57 lesion-specific and 11 PDAC-specific masses (p = 0.00169 to
p = 0.038). Table 1 provides an overview of all compared groups,
the number of discriminating m/z-species, the corresponding p
values and the number of animals used. Supplementary Table S1
provide detailed information of all significantly identified m/z-
species of the most important comparisons.
m/z-species 2790, 2812 and 2829 are Specifically Foundin PanIN Lesions
Closer examination of PanIN-specific peaks revealed that the
m/z-species 2790, 2812 and 2829 were discriminating PanINs
from normal tissue (Figure 2A). The overlay of the average spectra
from PanINs and normal pancreatic tissue revealed that in the
latter the peaks were nearly not detectable (Figure 2A). Further
statistical examination of these peaks (Wilcoxon test, Bonferroni
correction) revealed p values below 0.00001. The distribution Box
Plot and Principle Component Analysis (PCA) of PanINs and
exocrine tissue depicted clear discrimination between the two
groups (Figure 2B+C).
We next visualized m/z 2829 on the tissue sections demonstrat-
ing specificity of this peak for PanIN regions in the heat map
tissue, green lines PanIN1, yellow lines PanIN2, orange lines PanIN3, blue lines IPMN and red lines PDAC diagnosed regions in the respective section.Scale bar represents 1 cm. Lower panel: examples of the different morphological ROIs as indicated below. Scale bars represent 50 mm.doi:10.1371/journal.pone.0039424.g001
MALDI-IMS of Pancreatic Cancer Precursor Lesions
PLoS ONE | www.plosone.org 4 June 2012 | Volume 7 | Issue 6 | e39424

illustration (Figure 2D, upper panel), whereas a peak at m/z 6645,
which was unique for normal tissue specifically re-visualized in
regions with morphologically normal pancreatic tissue (Figure 2D,
lower panel).
Validation of Significant Discriminating Peaks in anIndependent Sample Set
To validate the significance of m/z species 2790 and 2829 in an
independent sample set, we performed Receiver Operating
Characteristics (ROC) analysis with these peaks to determine the
optimal discriminating thresholds. With these thresholds it was
possible to distinguish tissue from 10 independent mouse
pancreata (4 Ptf1a+/Cre;Kras+/G12D and 6 wild type littermates at
an age of 6 months) with an accuracy of 100% (Fisher test,
p,0.001).
Protein Identification of the Three Most SignificantSpecies by LC-MS/MS
For protein identification of discriminating PanIN-specific
significant m/z species, peptides were directly extracted from
MALDI-IMS slides and initially analyzed by reflector mode
MALDI MS to obtain accurate masses (,20 ppm) for the MALDI
IMS species prior to LC-MS/MS analyses. Sequence database
search of the LC-MS/MS results using the Mascot search engine
allowed the identification of three highly significant m/z species
pointing to two different proteins. The m/z 2790 species was
identified as a peptide representing the amino-terminus of the
mature form of serum Albumin (ALB1), whereas both, the m/z
2812 and the m/z 2829 species represented two different peptides
belonging to the carboxy-terminus of Thymosin beta-4
(TMSB4X). The identification of TMSB4X was further supported
by identification of an additional four different peptides of the
protein’s carboxy-terminal region. The manually verified peptide
identifications of ALB1 and TMSB4X and the corresponding
MS/MS spectra are listed in Table 2 and available in the
Supplemental Material (Figure S1).
Closer Investigation and Validation of IdentifiedCandidates
To investigate whether ALB1 and TMSB4X are also present on
transcriptional level in tumorigenic pancreata, we isolated total
pancreatic RNA from 8 Ptf1a+/Cre;Kras+/G12D and 6 wild type
littermates at mixed age between 4.5 and 9 months and performed
quantitative RT-PCR analysis for these two candidates. The
expression of both transcripts was significantly upregulated in
Ptf1a+/Cre;Kras+/G12D in comparison to wild type mice (p#0.05,
Figure 3B and 4A).
To validate correct ALB1 identification immunohistological
staining and Western Blot analysis for ALB1 were performed.
ALB1 expression on sections from Ptf1a+/Cre;Kras+/G12D mice was
observed in PanIN lesions but not in normal pancreatic ducts and
acinar cells (n = 10). Also, immunofluorescence analysis for ALB1
and the ductal marker CK19 on cryosections from Ptf1a+/Cre;Kras+/
G12D and Ptf1a+/Cre;Kras+/G12D;Ela-Tgfa mice demonstrated co-
localization of the two proteins in PanIN lesions (Figure 3A).
Importantly, the m/z species 2790 did not re-visualize on small
and large vessels of MALDI-IMS measured sections (Figure S2).
Also Western Blot analysis of whole pancreatic lysates revealed
increased ALB1 protein expression in Ptf1a+/Cre;Kras+/G12D and
Ptf1a+/Cre;Kras+/G12D mice in comparison to wild type controls
(Figure 3C).
It was previously reported that pancreatic exocrine cells can
transdifferentiate to hepatocytes and that hepatic foci can be found
in adult pancreas and in PDAC [26,27,28,29]. Therefore we were
intrigued to know whether the highly increased ALB1 signal
identified by MALDI-IMS could be due to a hepatic transdiffer-
entiation process of KrasG12D-activated pancreatic cells. To test this
Table 1. Statistical analysis of the different ROI groups for discriminating m/z species using ClinProTools.
compared groups number of discriminating m/z-species p valuesTotal number of animals(different genotypes)
Acini GEM vs Acini WT 0 – 6 vs 4
PanIN + IPMN vs normal 26 PanIN + IPMN 0.000001–0.05 24 vs 11
50 normal
PanIN vs normal 25 PanIN 0.00001–0.05 19 vs 11
67 normal
IPMN vs normal 18 IPMN 0.00005–0.05 13 vs 11
28 normal
PDAC vs normal 17 PDAC 0.0001–0.05 10 vs 11
31 normal
PanIN vs IPMN 6 PanIN 0.03–0.05 19 vs 13
0 IPMN
PanIN + IPMN vs PDAC 5 PanIN + IPMN 0.00169–0.037 24 vs 10
11 PDAC
IPMN vs PDAC 7 IPMN 0.01–0.05 13 vs 10
2 PDAC
PanIN vs PDAC 15 PanIN 0.00082–0.045 19 vs 10
15 PDAC
Listed are the compared groups, number of identified m/z-species specific for the indicated groups, the range of the corresponding p-values and the number of animalsanalyzed per group.doi:10.1371/journal.pone.0039424.t001
MALDI-IMS of Pancreatic Cancer Precursor Lesions
PLoS ONE | www.plosone.org 5 June 2012 | Volume 7 | Issue 6 | e39424
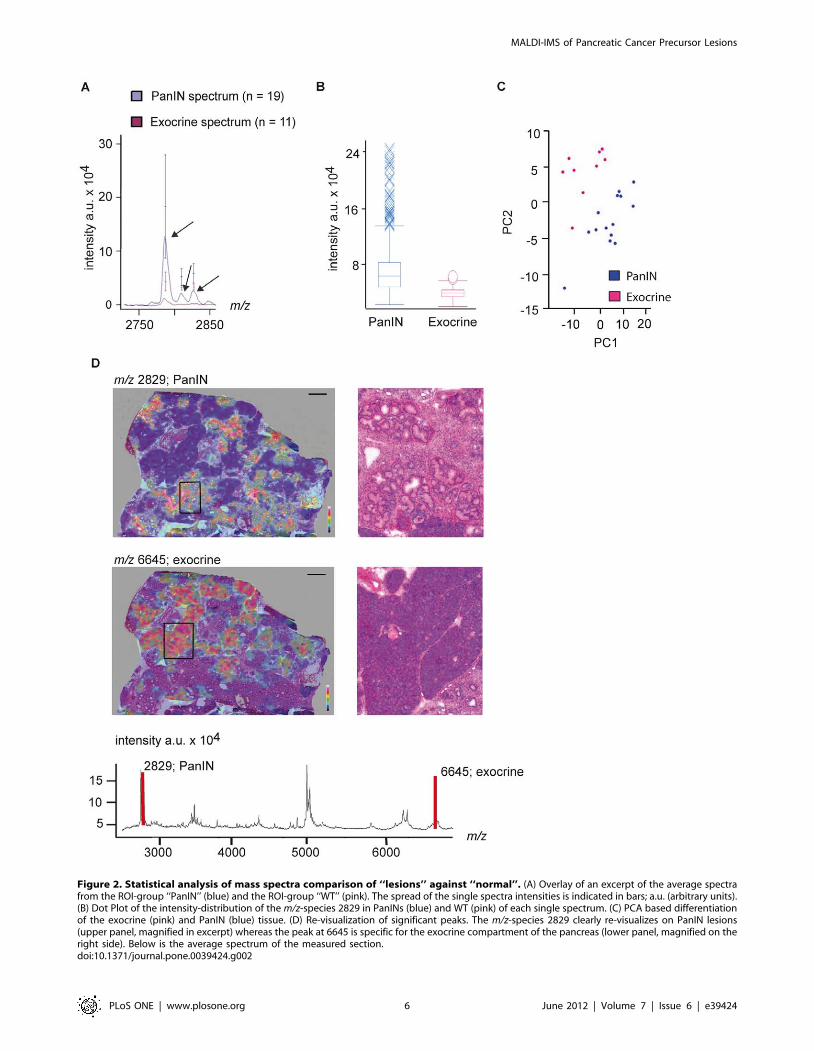
Figure 2. Statistical analysis of mass spectra comparison of ‘‘lesions’’ against ‘‘normal’’. (A) Overlay of an excerpt of the average spectrafrom the ROI-group ‘‘PanIN’’ (blue) and the ROI-group ‘‘WT’’ (pink). The spread of the single spectra intensities is indicated in bars; a.u. (arbitrary units).(B) Dot Plot of the intensity-distribution of the m/z-species 2829 in PanINs (blue) and WT (pink) of each single spectrum. (C) PCA based differentiationof the exocrine (pink) and PanIN (blue) tissue. (D) Re-visualization of significant peaks. The m/z-species 2829 clearly re-visualizes on PanIN lesions(upper panel, magnified in excerpt) whereas the peak at 6645 is specific for the exocrine compartment of the pancreas (lower panel, magnified on theright side). Below is the average spectrum of the measured section.doi:10.1371/journal.pone.0039424.g002
MALDI-IMS of Pancreatic Cancer Precursor Lesions
PLoS ONE | www.plosone.org 6 June 2012 | Volume 7 | Issue 6 | e39424

hypothesis we isolated RNA from whole pancreata of Ptf1a+/Cre;
Kras+/G12D and wild type mice between 4.5 and 9 month and
performed quantitative RT-PCR for the liver specific markers
Transferrin (Tfn), Alfa-fetoprotein (Afp) and Apolipoprotein A4 (ApoA4).
The expression level of these markers were significantly increased in
Ptf1a+/Cre;Kras+/G12D compared to wild type mice indicating a
possible transdifferentiation process occurring in PanINs (p#0.05,
Figure 3B). Additionally we performed immunohistochemical
analysis for the liver-specific marker HepPar1 on 14 PanIN1, 4
PanIN2 and 4 PanIN3 lesions. Two PanIN3 lesions were positively
stained for HepPar1 (Figure 3D), indicating hepatic cell features in
high-grade PanINs.
Regarding the second identified protein, we validated TMSB4X
expression in murine and human PanIN lesions and PDAC but
not in acinar, ductal and islet cells (Fig. 4B). For quantification we
stained sections from 10 Ptf1a+/Cre;Kras+/G12D mice with PanINs
and found all of them to be positive for TMSB4X. Of note,
expression was high already in low-grade PanINs and stayed in
malignant lesions, supporting the results of our MALID-IMS-
based approach for identification of preneoplastic lesion markers
that are still present in PDAC. Since TMSB4X is a small molecule
and has been detected in body fluids previously, we next
investigated whether it may be detectable by ELISA in serum
samples of mice with PanIN lesions. Interestingly, we found
significantly upregulated blood levels in Ptf1a+/Cre;Kras+/G12D
compared to control WT mice, supporting the principal value of
the presented marker detection strategy (Fig. 4C). However, when
we performed an analysis using a set of human samples from
donors and patients with chronic pancreatitis and PDAC, no
significant difference was notable between these groups (Fig. 4D).
Discussion
Because of the ongoing failure of therapeutic approaches to
improve survival in PDAC patients, early detection is of key
importance for better outcome in this otherwise fatal disease. In
this study, we applied MALDI Imaging Mass Spectrometry
(MALDI-IMS) with spatial resolution for in situ proteomic analysis
of preneoplastic lesions of the pancreas in GEM with endogenous
PDAC. We specifically addressed the question whether it is
possible to identify proteins or peptides that can discriminate
between morphologically normal pancreatic tissue, PanIN/IPMN
precursor lesions and PDAC.
While the need for early detection of PDAC, ideally in a
preinvasive state, is of obvious importance, proteomic analysis in
humans are hindered by inherent interindividual and intratumoral
genetic variations as well as confounding factors including
environmental and nutritional conditions. In addition, obtaining
pancreatic tissue with preneoplastic PanIN or IPMN lesions is not
feasible for obvious reasons. Thus, GEM recapitulating human
pancreatic carcinogenesis provide an excellent study platform and
have been utilized for the detection of serum biomarkers using
SELDI-TOF analysis [7]. In another study, Pdx1-Cre;Kras+/
G12D;Ink4a/Arflox/lox mice were used for plasma proteomic analysis
and candidates were validated in the blood of patients with PDAC
[30]. A recent study from Taguchi and colleagues compared
plasma protein profiles of four mouse models of lung cancer with
profiles of models of pancreatic, ovarian, colon, prostate, and
breast cancer and two models of inflammation. They showed
relevance to human lung cancer of the protein signatures identified
on the basis of mouse models [31]. We therefore hypothesized
these GEM to be a suitable platform for biomarker identification
using MALDI-IMS.
MALDI-IMS is a rapidly developing approach for molecular
tissue analysis with high potential for clinically relevant questions
including identification of biomarkers, tumor classification, ther-
apy response monitoring and drug imaging
[14,16,32,33,34,35,36]. In comparison to conventional mass
spectrometry, a major advantage of this technique is the possibility
of histology-directed tissue profiling with localization of identified
m/z-species to specific tissue compartments such as preneoplastic
lesions.
Laser-capture microdissection (LCM) followed by shotgun
proteomics is a powerful alternative for the analysis of tissue
sections, and routinely enables the identification of hundreds of
proteins from low numbers of cells. However, in contrast to
MALDI IMS, LCM-based proteomics does not retain the
information of the spatial distribution of different analytes on the
tissue. Moreover, LCM targets specific tissue compartments, while
MALDI IMS enables a global view of all different tissue types and
morphologies present on the measured section.
The spatial resolution of 70 mm as used in this study is clearly
far away from the resolution achieved in conventional
histological and light-microscopical analyses or with LCM.
However, it still allowed the analysis of small PanIN lesions and
even larger normal ducts, enabling us to identify m/z species
selectively expressed in the respective compartments. At present,
spatial resolution in MALDI IMS of 25 mm can be achieved
and is mostly limited by matrix crystal size [37]. Further, the
employed resolution is a compromise of laser beam size and ion
Table 2. Overview of identified m/z species.
SignificantMALDI-IMSspecies Peptide sequence Protein name
Mascot ionscore Observed m/z
Calculated peptidemass/Da
Expected peptidemass/Da
Deviation/ppm
2790 EAHKSEIAHRYNDLGEQHFKGLVL ALB1 65.2 931.1487 2790.4226 2790.4204 0.80
2812 SKLKKTETQEKNPLPSKETIEQEK TMSB4X 32.5 704.1362 2812.5137 2812.5187 21.77
2829 KTETQEKNPLPSKETIEQEKQAGES TMSB4X 38.4 708.1087 2828.4037 2828.4044 20.24
KETIEQEKQAGES TMSB4X 47.0 738.8627 1475.7098 1475.7106 20.53
KNPLPSKETIEQEKQAGES TMSB4X 33.7 705.0310 2112.0696 2112.0702 20.27
KTETQEKNPLPSKETIEQEKQ TMSB4X 36.3 829.0988 2484.2729 2484.2712 0.69
KTETQEKNPLPSKETIEQEKQAG TMSB4X 41.1 654.0902 2612.3296 2612.3298 20.07
Depicted are the MALDI-IMS candidates, the identified peptide sequences and the proteins they belong to, as well as the corresponding Mascot ion scores ofidentification and the calculated and expected peptide masses with their deviation in ppm.doi:10.1371/journal.pone.0039424.t002
MALDI-IMS of Pancreatic Cancer Precursor Lesions
PLoS ONE | www.plosone.org 7 June 2012 | Volume 7 | Issue 6 | e39424

yield, with narrower laser beams enabling higher resolution but
lower peak intensities.
At the current stage, MALDI IMS usually covers a range of
detection from 500 to 25,000 m/z [38], thereby inevitably
excluding a large proportion of the intact proteome. Nonetheless,
about 150 m/z species could be observed and spatially resolved in
the present study. Among the differentially expressed m/z species,
we found m/z 2790, 2812 and 2829 to be highly specific for PanIN
lesions. This enrichment was validated in an independent test
sample of pancreatic tissue with PanIN-bearing vs. normal
pancreatic tissue, demonstrating the discriminatory ability of the
identified peaks.
Clearly, the identification of proteins behind the discriminant
peaks observed in MALDI IMS still represents a major bottleneck
of this technique and no routine method for this task is available.
Moreover, most MALDI IMS studies are confined to elaborate
statistical analyses and only in rare cases report protein
identifications. Here, we identified two proteins, namely ALB1
and TMSB4X, which represent statistically significant MALDI
IMS peaks. Given the small amount of sample (i. e. 1 ml of matrix
extract) used for the LC-MS/MS analysis, it is not surprising to
identify solely peptides originating from abundant proteins. Future
methodological refinements and more sensitive MS instruments
may enable the routine identification of many more interesting
MALDI IMS species.
Figure 3. Identification and validation of ALB1. (A) Immunohistochemical analysis of ALB1 shows specific staining of PanIN lesions of Ptf1a+/Cre;Kras+/G12D (CK) mice but not ductal cells (n = 10 mice). Immunofluorescence staining for ALB1 and the ductal marker CK19 demonstrates co-localization of the two proteins. All scale bars represent 50 mm. (B) mRNA of Alb1 and of the hepatic genes Alpha-Fetoprotein (Afp), Apolipoprotein A4(ApoA4) and Transferrin (Tfn) are all significantly upregulated in pancreata from CK mice compared to wild type control (p = 0.04 for Alb1, p = 0.008 forAfp, p = 0.04 for ApoA4, p = 0.004 for Tfn, n = 7 vs. 5 mice). Expression levels are normalized to samples of wild type mice. All error bars indicate thestandard deviations normalized to the mean of the wild type. (C) Western Blot for ALB1 on whole pancreatic lysates from wild type and CK mice(n = 3). ALB1 expression in preneoplastic tissue is robustly increased comparing to normal pancreas. (D) Immunohistochemical analysis of the hepaticmarker HepPar1 in a human PanIN3 lesion.doi:10.1371/journal.pone.0039424.g003
MALDI-IMS of Pancreatic Cancer Precursor Lesions
PLoS ONE | www.plosone.org 8 June 2012 | Volume 7 | Issue 6 | e39424

TMSB4X is a protein known to be upregulated in human
PDAC cells [39,40] and in the developing pancreas [41]. Recent
functional and expression studies suggest an important role of this
protein during organogenesis and in many cellular processes
including progenitor cell regulation [25,42]. While functional
analysis is beyond the scope of this study, TMSB4X may play a
role in early preneoplastic and/or progenitor cell transformation
under oncogenic stress. Interestingly, it has been identified in
proteomic screens in various diseases and tissues, probably because
of its small size, cleavage and high expression levels.
Figure 4. Expression analysis of TMSB4X. (A) TMSB4X mRNA is significantly increased in Ptf1a+/Cre;Kras+/G12D (CK) mice compared to wild typecontrol (p = 0.01, n = 8 vs. 6 mice). Expression levels are normalized to wild type. Error bars indicate the standard deviations normalized to the mean ofthe wild type. (B) Staining for TMSB4X on tissue samples from 10–30 week old CK mice (n = 10) shows expression in PanINs (arrowhead) but not inacinar (asterisk) cells (i). High-grade mPanIN3 express TMSB4X (ii). Expression in human PanIN3 (iii) and human PDAC (iv) is also detectable. Scale barsrepresent 50 mm. (C) ELISA for TMSB4X from serum samples of wild type and CK mice (n = 7 vs. 14 mice). The serum concentration of TMSB4X issignificantly upregulated in CK mice (p = 0.043, Wilcoxon test). (D) ELISA for TMSB4X from serum samples of PDAC and CP patients as well as healthydonors. Medians are marked by red lines.doi:10.1371/journal.pone.0039424.g004
MALDI-IMS of Pancreatic Cancer Precursor Lesions
PLoS ONE | www.plosone.org 9 June 2012 | Volume 7 | Issue 6 | e39424

In addition to TMSB4X, ALB1 was identified from the mass
2790. Both candidates were analysed with quantitative RT-PCR
in total pancreatic lysates, demonstrating a significant upregulation
also of the transcripts of these proteins in Ptf1a+/Cre;Kras+/G12D mice
in a preneoplastic state. The confirmation of increased ALB1 and
TMSB4X expression on protein level using Western Blot and
immunohistological stainings in murine and human PanIN lesions
verifies the principal ability of MALDI-IMS and subsequent LC-
MS/MS analysis to identify the respective proteins or peptides
from peaks measured in situ. These results demonstrate the utility
of the method to identify potential biomarkers even from small
amounts of tissue such as PanIN lesions. ALB1 has previously been
identified to be present in pancreatic tumor tissue sections by
direct MALDI-IMS-MS/MS [43]. Its identification in PanIN
lesions may be due to several reasons. Potentially, ALB1 may be
attracted and bound by the mucinous content of PanIN lesions as
has been described for the transepithelial transport of serum
proteins to the intestinal mucus [44]. While identification of
murine ALB1 rules out contamination by fetal calf serum, serum
ALB1 from blood vessels may potentially be recruited or associate
with PanINs. However, in our view this is an unlikely scenario
especially since m/z 2790 was not detectable in blood vessels.
Alternative possibilities include expression of ALB1 from quiescent
pancreatic stellate cells [45], located in the stroma surrounding the
PanIN lesions. However, we did not detect ALB1 expression by re-
visualization or by immunohistochemistry in the PanIN-surround-
ing stromal tissue. Detecting ALB1 specifically in PanIN lesions
may therefore suggest a regulatory mechanism that warrants
further investigation. Previous reports have shown that pancreatic
exocrine cells can transdifferentiate to hepatocytes and that
hepatic foci can be found in adult pancreas and in PDAC
[26,27,28,29]. The transdifferentiated hepatocyte-like cells express
a variety of proteins normally present in mature hepatocytes
among which are ALB1, acute phase proteins and the liver-specific
markers Transferrin, Alpha-Fetoprotein and Apolipoprotein A4
[46,47,48]. In a recent paper, MacDonald and colleagues provide
evidence that acinar cells start to express liver-restricted genes after
modulation of the acinar cell specifying complex PTF1 [49]. Thus,
activation of oncogenic KrasG12D in acinar cells may lead to
downregulation of PTF1 activity and subsequent expression of
liver-restricted genes.
The confirmation of increased TMSB4X expression in sera
from mice harboring preneoplastic lesions verifies the principal
ability of MALDI-IMS and subsequent LC-MS/MS analysis to
identify the respective proteins or peptides from peaks measured in
situ. However, the subsequent approach of its utility as human
serum biomarker for PDAC identification failed to show
significant differences, although staining for TMSB4X on human
tissue depicted specific expression in PanINs and PDAC tissue.
Thus, it likely represents an imperfect biomarker. Nevertheless,
this approach demonstrates the principal utility of the method to
identify potential biomarkers in this disease and future work will
focus on identifying additional proteins from the identified masses.
Obviously, clinically useful biomarkers need to be measured
distantly, i.e. in easily accessible body fluids like serum or
pancreatic juice, to ensure applicability of screening approaches.
ALB1 is no suitable candidate for obvious reasons, while
TMSB4X is a protein that has been identified in a variety of
pathological conditions, potentially arguing against this protein as
specific enough within the aimed clinical context. The identifica-
tion of many lesion-specific peaks of yet unknown proteins may
hopefully lead to the detection of clinically meaningful biomarkers.
In addition, with the advantage of a spatially-resolved proteomic
approach, this method is suitable to define lesion-specific protein
signatures, which is subject of future studies. Our approach as a
proof-of-concept study may be valuable for several reasons: (i) it is
one of the very few studies that have identified proteins from
masses; (ii) we have identified several and in some instances a long
list of significant discriminating peaks when comparing the various
lesion subtypes and disease conditions, enabling the future
identification of potentially more suitable biomarker candidates;
(iii) although PanIN- or IPMN-specific proteins may not be
detectable in peripheral blood, they may still be detectable in other
compartments such as pancreatic juice or cyst fluid helping to
identify patients at risk for harboring preneoplastic pancreatic
lesions. As such we consider MALDI-IMS on sections from
endogenous mouse models of PDAC a valuable approach for
proteomic investigations of diseased tissue.
Supporting Information
Figure S1 Supplemental information on peptide andprotein identifications by LC-MS/MS.
(DOC)
Figure S2 Re-visualization of the m/z species 2790.
(TIF)
Table S1 Listing of all significant m/z-species from thevarious comparisons.
(DOC)
Acknowledgments
We thank Benjamin Balluff, Mareike Elsner, Stephan Meding for help in
performing the MALDI-IMS experiments and M. Neuhofer and S. Ruberg
for excellent technical assistance.
Author Contributions
Conceived and designed the experiments: BMG RMS AW BK JTS.
Performed the experiments: BMG HH PKM MT-A SM EK. Analyzed the
data: BMG HH IE SR. Contributed reagents/materials/analysis tools:
CWM JK. Wrote the paper: BMG JTS.
References
1. Jemal A, Siegel R, Ward E, Hao Y, Xu J, et al. (2008) Cancer statistics, 2008.
CA Cancer J Clin 58: 71–96.
2. Schneider G, Siveke JT, Eckel F, Schmid RM (2005) Pancreatic cancer: basic
and clinical aspects. Gastroenterology 128: 1606–1625.
3. Hezel AF, Kimmelman AC, Stanger BZ, Bardeesy N, Depinho RA (2006)
Genetics and biology of pancreatic ductal adenocarcinoma. Genes Dev 20:
1218–1249.
4. Canto MI, Goggins M, Hruban RH, Petersen GM, Giardiello FM, et al. (2006)
Screening for early pancreatic neoplasia in high-risk individuals: a prospectivecontrolled study. Clin Gastroenterol Hepatol 4: 766–781; quiz 665.
5. Hruban RH, Takaori K, Klimstra DS, Adsay NV, Albores-Saavedra J, et al.(2004) An illustrated consensus on the classification of pancreatic intraepithelial
neoplasia and intraductal papillary mucinous neoplasms. Am J Surg Pathol 28:
977–987.
6. Hruban RH, Adsay NV, Albores-Saavedra J, Anver MR, Biankin AV, et al.
(2006) Pathology of genetically engineered mouse models of pancreatic exocrinecancer: consensus report and recommendations. Cancer Res 66: 95–106.
7. Hingorani SR, Petricoin EF, Maitra A, Rajapakse V, King C, et al. (2003)
Preinvasive and invasive ductal pancreatic cancer and its early detection in themouse. Cancer Cell 4: 437–450.
8. Siveke JT, Einwachter H, Sipos B, Lubeseder-Martellato C, Kloppel G, et al.(2007) Concomitant pancreatic activation of Kras(G12D) and Tgfa results in
cystic papillary neoplasms reminiscent of human IPMN. Cancer Cell 12: 266–279.
9. Schwamborn K, Caprioli RM (2010) Molecular imaging by mass spectrometry–looking beyond classical histology. Nat Rev Cancer 10: 639–646.
10. Pierson J, Norris JL, Aerni HR, Svenningsson P, Caprioli RM, et al. (2004)
Molecular profiling of experimental Parkinson’s disease: direct analysis of
MALDI-IMS of Pancreatic Cancer Precursor Lesions
PLoS ONE | www.plosone.org 10 June 2012 | Volume 7 | Issue 6 | e39424

peptides and proteins on brain tissue sections by MALDI mass spectrometry.
J Proteome Res 3: 289–295.11. Stoeckli M, Staab D, Staufenbiel M, Wiederhold KH, Signor L (2002)
Molecular imaging of amyloid beta peptides in mouse brain sections using mass
spectrometry. Anal Biochem 311: 33–39.12. Chaurand P, Schwartz SA, Billheimer D, Xu BJ, Crecelius A, et al. (2004)
Integrating histology and imaging mass spectrometry. Anal Chem 76: 1145–1155.
13. Stoeckli M, Chaurand P, Hallahan DE, Caprioli RM (2001) Imaging mass
spectrometry: a new technology for the analysis of protein expression inmammalian tissues. Nat Med 7: 493–496.
14. Schwartz SA, Weil RJ, Johnson MD, Toms SA, Caprioli RM (2004) Proteinprofiling in brain tumors using mass spectrometry: feasibility of a new technique
for the analysis of protein expression. Clin Cancer Res 10: 981–987.15. Schwartz SA, Weil RJ, Thompson RC, Shyr Y, Moore JH, et al. (2005)
Proteomic-based prognosis of brain tumor patients using direct-tissue matrix-
assisted laser desorption ionization mass spectrometry. Cancer Res 65: 7674–7681.
16. Lemaire R, Menguellet SA, Stauber J, Marchaudon V, Lucot JP, et al. (2007)Specific MALDI imaging and profiling for biomarker hunting and validation:
fragment of the 11S proteasome activator complex, Reg alpha fragment, is a
new potential ovary cancer biomarker. J Proteome Res 6: 4127–4134.17. Cazares LH, Troyer D, Mendrinos S, Lance RA, Nyalwidhe JO, et al. (2009)
Imaging mass spectrometry of a specific fragment of mitogen-activated proteinkinase/extracellular signal-regulated kinase kinase kinase 2 discriminates cancer
from uninvolved prostate tissue. Clin Cancer Res 15: 5541–5551.18. Cornett DS, Mobley JA, Dias EC, Andersson M, Arteaga CL, et al. (2006) A
novel histology-directed strategy for MALDI-MS tissue profiling that improves
throughput and cellular specificity in human breast cancer. Mol Cell Proteomics5: 1975–1983.
19. Chaurand P, DaGue BB, Pearsall RS, Threadgill DW, Caprioli RM (2001)Profiling proteins from azoxymethane-induced colon tumors at the molecular
level by matrix-assisted laser desorption/ionization mass spectrometry. Proteo-
mics 1: 1320–1326.20. Walch A, Rauser S, Deininger SO, Hofler H (2008) MALDI imaging mass
spectrometry for direct tissue analysis: a new frontier for molecular histology.Histochem Cell Biol 130: 421–434.
21. Nakhai H, Sel S, Favor J, Mendoza-Torres L, Paulsen F, et al. (2007) Ptf1a isessential for the differentiation of GABAergic and glycinergic amacrine cells and
horizontal cells in the mouse retina. Development 134: 1151–1160.
22. Sandgren EP, Luetteke NC, Palmiter RD, Brinster RL, Lee DC (1990)Overexpression of TGF alpha in transgenic mice: induction of epithelial
hyperplasia, pancreatic metaplasia, and carcinoma of the breast. Cell 61: 1121–1135.
23. Hingorani SR, Wang L, Multani AS, Combs C, Deramaudt TB, et al. (2005)
Trp53R172H and KrasG12D cooperate to promote chromosomal instabilityand widely metastatic pancreatic ductal adenocarcinoma in mice. Cancer Cell 7:
469–483.24. Cha HJ, Philp D, Lee SH, Moon HS, Kleinman HK, et al. (2010) Over-
expression of thymosin beta 4 promotes abnormal tooth development andstimulation of hair growth. Int J Dev Biol 54: 135–140.
25. Spurney CF, Cha HJ, Sali A, Pandey GS, Pistilli E, et al. (2010) Evaluation of
skeletal and cardiac muscle function after chronic administration of thymosinbeta-4 in the dystrophin deficient mouse. PLoS One 5: e8976.
26. Reddy JK, Rao MS, Qureshi SA, Reddy MK, Scarpelli DG, et al. (1984)Induction and origin of hepatocytes in rat pancreas. J Cell Biol 98: 2082–2090.
27. Dabeva MD, Hurston E, Shafritz DA (1995) Transcription factor and liver-
specific mRNA expression in facultative epithelial progenitor cells of liver andpancreas. Am J Pathol 147: 1633–1648.
28. Paner GP, Thompson KS, Reyes CV (2000) Hepatoid carcinoma of thepancreas. Cancer 88: 1582–1589.
29. Cingolani N, Shaco-Levy R, Farruggio A, Klimstra DS, Rosai J (2000) Alpha-
fetoprotein production by pancreatic tumors exhibiting acinar cell differentia-
tion: study of five cases, one arising in a mediastinal teratoma. Hum Pathol 31:
938–944.
30. Faca VM, Song KS, Wang H, Zhang Q, Krasnoselsky AL, et al. (2008) A mouse
to human search for plasma proteome changes associated with pancreatic tumor
development. PLoS Med 5: e123.
31. Taguchi A, Politi K, Pitteri SJ, Lockwood WW, Faca VM, et al. (2011) Lung
cancer signatures in plasma based on proteome profiling of mouse tumor
models. Cancer Cell 20: 289–299.
32. Meistermann H, Norris JL, Aerni HR, Cornett DS, Friedlein A, et al. (2006)
Biomarker discovery by imaging mass spectrometry: transthyretin is a biomarker
for gentamicin-induced nephrotoxicity in rat. Mol Cell Proteomics 5: 1876–
1886.
33. Yanagisawa K, Shyr Y, Xu BJ, Massion PP, Larsen PH, et al. (2003) Proteomic
patterns of tumour subsets in non-small-cell lung cancer. Lancet 362: 433–439.
34. Reyzer ML, Hsieh Y, Ng K, Korfmacher WA, Caprioli RM (2003) Direct
analysis of drug candidates in tissue by matrix-assisted laser desorption/
ionization mass spectrometry. J Mass Spectrom 38: 1081–1092.
35. Reyzer ML, Caldwell RL, Dugger TC, Forbes JT, Ritter CA, et al. (2004) Early
changes in protein expression detected by mass spectrometry predict tumor
response to molecular therapeutics. Cancer Res 64: 9093–9100.
36. Caprioli RM (2005) Deciphering protein molecular signatures in cancer tissues
to aid in diagnosis, prognosis, and therapy. Cancer Res 65: 10642–10645.
37. Jaskolla TW, Karas M, Roth U, Steinert K, Menzel C, et al. (2009) Comparison
between vacuum sublimed matrices and conventional dried droplet preparation
in MALDI-TOF mass spectrometry. J Am Soc Mass Spectrom 20: 1104–1114.
38. Watrous JD, Alexandrov T, Dorrestein PC (2011) The evolving field of imaging
mass spectrometry and its impact on future biological research. J Mass Spectrom
46: 209–222.
39. Zhang Y, Feurino LW, Zhai Q, Wang H, Fisher WE, et al. (2008) Thymosin
Beta 4 is overexpressed in human pancreatic cancer cells and stimulates
proinflammatory cytokine secretion and JNK activation. Cancer Biol Ther 7:
419–423.
40. Paciucci R, Berrozpe G, Tora M, Navarro E, Garcia de Herreros A, et al. (1996)
Isolation of tissue-type plasminogen activator, cathepsin H, and non-specific
cross-reacting antigen from SK-PC-1 pancreas cancer cells using subtractive
hybridization. FEBS Lett 385: 72–76.
41. Nemolato S, Cabras T, Cau F, Fanari MU, Fanni D, et al. (2010) Different
thymosin Beta 4 immunoreactivity in foetal and adult gastrointestinal tract.
PLoS One 5: e9111.
42. Smart N, Risebro CA, Melville AA, Moses K, Schwartz RJ, et al. (2007)
Thymosin beta4 induces adult epicardial progenitor mobilization and neovas-
cularization. Nature 445: 177–182.
43. Djidja MC, Claude E, Snel MF, Scriven P, Francese S, et al. (2009) MALDI-ion
mobility separation-mass spectrometry imaging of glucose-regulated protein
78 kDa (Grp78) in human formalin-fixed, paraffin-embedded pancreatic
adenocarcinoma tissue sections. J Proteome Res 8: 4876–4884.
44. Lukie BE (1986) Serum protein content of rat small-intestinal mucus. Dig Dis Sci
31: 73–78.
45. Kim N, Yoo W, Lee J, Kim H, Lee H, et al. (2009) Formation of vitamin A lipid
droplets in pancreatic stellate cells requires albumin. Gut 58: 1382–1390.
46. Lardon J, De Breuck S, Rooman I, Van Lommel L, Kruhoffer M, et al. (2004)
Plasticity in the adult rat pancreas: transdifferentiation of exocrine to hepatocyte-
like cells in primary culture. Hepatology 39: 1499–1507.
47. Shen CN, Seckl JR, Slack JM, Tosh D (2003) Glucocorticoids suppress beta-cell
development and induce hepatic metaplasia in embryonic pancreas. Biochem J
375: 41–50.
48. Shen CN, Slack JM, Tosh D (2000) Molecular basis of transdifferentiation of
pancreas to liver. Nat Cell Biol 2: 879–887.
49. Masui T, Swift GH, Deering T, Shen C, Coats WS, et al. (2010) Replacement of
Rbpj with Rbpjl in the PTF1 complex controls the final maturation of pancreatic
acinar cells. Gastroenterology 139: 270–280.
MALDI-IMS of Pancreatic Cancer Precursor Lesions
PLoS ONE | www.plosone.org 11 June 2012 | Volume 7 | Issue 6 | e39424
Related Documents