l Equity Research l Important disclosures can be found in the Disclosures Appendix All rights reserved. Standard Chartered Bank 2011 http://research.standardchartered.com Malaysia | Emerging Companies - Healthcare 30 June 2011 KPJ Healthcare Berhad Steady and defensive OUTPERFORM (initiating coverage) PRICE as at 29 June 2011 MYR4.57 PRICE TARGET MYR5.00 Bloomberg code Reuters code KPJ MK KPJH.KL Market cap 12 month range MYR2,594m (US$855m) MYR3.18 - 4.72 EPS est. change n.a. We initiate coverage of KPJ Healthcare (KPJ) with an OUTPERFORM rating and a price target of MYR5.0 KPJ is the largest private hospital operator in Malaysia and is leveraged to the structural growth of healthcare spending in the country. We like KPJ for its market leadership, structural growth, and defensive qualities Although our 12m price target offers only 9% upside, we note that KPJ is highly defensive, outperformed the KLCI by 21% during the financial crisis, and our valuation on a DCF basis would be MYR6.59 per share Year end: Dec 2010 2011E 2012E 2013E Sales (MYRm) 1,655 1,920 2,179 2,473 EBIT (MYRm) 144 178 207 237 EBIT DA (MYRm) 203 247 277 324 Pretax profit (MYRm) 168 199 235 266 Earnings (MYRm) 119 139 164 186 Dilut ed EPS (MYR sen) 20. 3 21.2 25.0 28.3 DPS (MYR sen) 15. 0 8.5 10.0 11.3 Revenue growth ( %) 13. 6 16.1 13.5 13.4 EPS growth (%) -6.2 4.4 18.0 13.2 EBITDA margin (%) 12.3 12.9 12.7 13.1 EBIT margin (%) 8. 7 9.2 9.5 9.6 Net margin (%) 7. 2 7.2 7.5 7.5 Div payout (%) 73. 9 40.0 40.0 40.0 Book value / share (MYR) 1.37 1.52 1.70 1.92 Debt/ Equity (%) 46.3 41.5 37.0 32.9 ROE (%) 17. 0 17.1 18.0 18.1 ROCE (%) 11. 8 12.2 13.1 13.5 FCF (MYRm) 33 213 10 36 EV/EBITDA (x) 14.4 11.8 10.5 9.0 PBR (x) 3.3 3.0 2.7 2.4 PER (x) 22.5 21.6 18.3 16.1 Dividend yield (%) 3.3 1.9 2.2 2.5 Source: Company, Standard Chartered Research estimates Share price performance 3.2 3.4 3.6 3.8 4.0 4.2 4.4 4.6 4.8 Jun-10 Sep-10 Dec-10 Mar-11 Jun-11 KPJ Healthcare Berhad KUALA LUMPUR COMP INDEX (rebased) Share price (%) -1 mth -3 mth -12 mth Ordinary shares 7 24 41 Relative to Index 3 11 17 Relative to Sector - - - Major shareholder Johor Corp (41.9%) Free float 34% Average turnover (US$) 1,154,969 Leveraged to structural growth in private healthcare spending. The public healthcare system in Malaysia is highly stretched, with only 46% of overall healthcare sector expenditure but 74% of admissions. We expect a continued spillover into private healthcare especially with sustained growth in GDP per capita. Malaysia also has one of the fastest growing populations in Asia, and like most countries, an ageing population. In the last decade, private healthcare spending has grown at 16% p.a. Market leadership. KPJ operates the largest private hospital network in Malaysia with 20 hospitals and over 2,500 licensed beds. The closest competitors are Pantai and Columbia Asia, but they are much smaller with 10 and 9 hospitals respectively. KPJ focuses on community-based hospitals and targets opening 1-2 new hospitals per year as it continues to expand its network. Asset light. KPJ’s strategy is to offload profitable hospitals into Al-‘Aqar REIT (Not rated, last close MYR1.17, which it owns 49%. This allows KPJ to stay asset light and recycle its capital for future growth. Rental rate is based on a formula linked to the market value of the properties, but is stable as the maximum revision is 2% per year. Steady and defensive. Although near-term price appreciation appears limited, we believe KPJ’s defensive qualities will be appreciated in the current uncertain markets. In the last ten years, KPJ has compounded its earnings at 27% p.a. and grown earnings every year. During the financial crisis (from beginning 2008 to March 2009), KPJ’s shares outperformed KLCI by 21%. A potential catalyst for the stock may be the expected relisting of Parkway as Integrated Healthcare as it was privatised at PER27x forward earnings (based on our estimates). Source: Company, Bloomberg Stephen Hui [email protected] 65 6596 8514

Welcome message from author
This document is posted to help you gain knowledge. Please leave a comment to let me know what you think about it! Share it to your friends and learn new things together.
Transcript

l Equity Research l
Important disclosures can be found in the Disclosures Appendix All rights reserved. Standard Chartered Bank 2011 http://research.standardchartered.com
Malaysia | Emerging Companies - Healthcare 30 June 2011
KPJ Healthcare Berhad Steady and defensive
OUTPERFORM (initiating coverage) PRICE as at 29 June 2011
MYR4.57PRICE TARGET
MYR5.00
Bloomberg code Reuters codeKPJ MK KPJH.KL
Market cap 12 month rangeMYR2,594m (US$855m) MYR3.18 - 4.72
EPS est. change n.a.
We initiate coverage of KPJ Healthcare (KPJ) with an OUTPERFORM rating and a price target of MYR5.0
KPJ is the largest private hospital operator in Malaysia and is leveraged to the structural growth of healthcare spending in the country.
We like KPJ for its market leadership, structural growth, and defensive qualities
Although our 12m price target offers only 9% upside, we note that KPJ is highly defensive, outperformed the KLCI by 21% during the financial crisis, and our valuation on a DCF basis would be MYR6.59 per share
Year end: Dec 2010 2011E 2012E 2013ESales (MYRm) 1,655 1,920 2,179 2,473EBIT (MYRm) 144 178 207 237EBITDA (MYRm) 203 247 277 324Pretax profit (MYRm) 168 199 235 266Earnings (MYRm) 119 139 164 186Diluted EPS (MYR sen) 20.3 21.2 25.0 28.3DPS (MYR sen) 15.0 8.5 10.0 11.3Revenue growth (%) 13.6 16.1 13.5 13.4EPS growth (%) -6.2 4.4 18.0 13.2EBITDA margin (%) 12.3 12.9 12.7 13.1EBIT margin (%) 8.7 9.2 9.5 9.6Net margin (%) 7.2 7.2 7.5 7.5Div payout (%) 73.9 40.0 40.0 40.0Book value / share (MYR) 1.37 1.52 1.70 1.92Debt/ Equity (%) 46.3 41.5 37.0 32.9ROE (%) 17.0 17.1 18.0 18.1ROCE (%) 11.8 12.2 13.1 13.5FCF (MYRm) 33 213 10 36EV/EBITDA (x) 14.4 11.8 10.5 9.0PBR (x) 3.3 3.0 2.7 2.4PER (x) 22.5 21.6 18.3 16.1Dividend yield (%) 3.3 1.9 2.2 2.5
Source: Company, Standard Chartered Research estimates Share price performance
3.23.43.63.84.04.24.44.64.8
Jun-10 Sep-10 Dec-10 Mar-11 Jun-11
KPJ Healthcare Berhad
KUALA LUMPUR COMP INDEX (rebased)
Share price (%) -1 mth -3 mth -12 mthOrdinary shares 7 24 41Relative to Index 3 11 17Relative to Sector - - -Major shareholder Johor Corp (41.9%)Free float 34%Average turnover (US$) 1,154,969
Leveraged to structural growth in private healthcare spending. The public healthcare system in Malaysia is highly stretched, with only 46% of overall healthcare sector expenditure but 74% of admissions. We expect a continued spillover into private healthcare especially with sustained growth in GDP per capita. Malaysia also has one of the fastest growing populations in Asia, and like most countries, an ageing population. In the last decade, private healthcare spending has grown at 16% p.a.
Market leadership. KPJ operates the largest private hospital network in Malaysia with 20 hospitals and over 2,500 licensed beds. The closest competitors are Pantai and Columbia Asia, but they are much smaller with 10 and 9 hospitals respectively. KPJ focuses on community-based hospitals and targets opening 1-2 new hospitals per year as it continues to expand its network.
Asset light. KPJ’s strategy is to offload profitable hospitals into Al-‘Aqar REIT (Not rated, last close MYR1.17, which it owns 49%. This allows KPJ to stay asset light and recycle its capital for future growth. Rental rate is based on a formula linked to the market value of the properties, but is stable as the maximum revision is 2% per year.
Steady and defensive. Although near-term price appreciation appears limited, we believe KPJ’s defensive qualities will be appreciated in the current uncertain markets. In the last ten years, KPJ has compounded its earnings at 27% p.a. and grown earnings every year. During the financial crisis (from beginning 2008 to March 2009), KPJ’s shares outperformed KLCI by 21%. A potential catalyst for the stock may be the expected relisting of Parkway as Integrated Healthcare as it was privatised at PER27x forward earnings (based on our estimates).
Source: Company, Bloomberg
Stephen Hui [email protected] 65 6596 8514

KPJ Healthcare Berhad l 30 June 2011
l Equity Research l 2
Contents
Investment highlights 3
Valuation 4
Peer comparison 8
Company overview 11
Structural drivers 15
Strong market position 18
Competitor analysis and positioning 21
High barriers to entry 23
Growth drivers 24
Healthcare education 26
REIT funds expansion 28
Group financials 30
Corporate information 35
Disclosures appendix 38

KPJ Healthcare Berhad l 30 June 2011
l Equity Research l 3
Investment highlights We initiate coverage of KPJ Healthcare with an OUTPERFORM rating and a price target of MYR5.0 per share, offering a potential total return of 11.6% (9.4% from share price appreciation, 2.2% from dividend yield). Our investment thesis is based on the following:
Structural growth. The Malaysian public healthcare system is highly stretched with only 46% of overall healthcare sector expenditure but 74% of admissions. As Malaysian household income steadily grows, we expect a spillover to private healthcare. From 2000 to 2008, Malaysian GDP per capita grew at 9% p.a. and private healthcare expenditure at 16% p.a.
Demographic drivers. Private healthcare expenditure is also driven by Malaysia’s growing and ageing population. According to Global Demographics, from 2010 to 2020, Malaysia’s population is expected to grow at 2% p.a. and the percentage of the population over 65 is expected to rise from 5% to 8%.
Market leadership. KPJ Healthcare is the leading private hospital operator in Malaysia with 20 hospitals and over 2,500 beds (as at end-2010). We estimate KPJ has a leading 20% share of private hospital beds in Malaysia and a leading 25% share of private inpatient admission. Over the eight years from 2000 to 2008, KPJ’s revenue share of the private healthcare market steadily increased from 2% to 7%.
Defensive community-based strategy. KPJ operates hospitals in communities of over 200k where it is typically the main hospital in the area. KPJ believes this creates strong customer loyalty and limits competition as it would be very difficult for a competitor to enter the market. The Ministry of Health’s guideline of a minimum distance of 20km between private hospitals also precludes competitors from entering KPJ’s communities.
High barriers to entry. Doctors are in shortage in Malaysia and KPJ has an established relationship with the largest panel of doctors. As KPJ also has the largest network of hospitals, it is the key beneficiary of Malaysia’s Private Healthcare Facilities and Services Act.
Secular growth. KPJ plans to open 1-2 hospitals per year in Malaysia over the next five years. The overall occupancy of the group’s hospitals is about 70% so there is further room to drive patient volume at existing hospitals. In addition, in the last five years, average revenue per patient has compounded at 7% p.a.
Asset-light expansion. KPJ set up Al-‘Aqar KPJ REIT (Al-‘Aqar REIT) in 2006 and owns 49%. KPJ’s strategy is to offload profitable hospitals into Al-’Aqar REIT and recycle its capital for future growth. Rental rate has a maximum revision of 2% per year. Since the establishment of Al-’Aqar REIT in 2006, KPJ’s net gearing has fallen from 57% to 23% at end-2010.
Reasonable valuations. KPJ is trading on PER18x 2012E while the average valuation of peers is at PER20x 2012E. We believe that for investors with a long time horizon, a discounted cash flow reflects the future growth of the group’s cash flows. Our discounted cash flow model shows a fair value of MYR6.59 per share.
High M&A valuations. We note that for industry participants, valuations paid for acquisitions in Asian hospitals are high. Parkway was privatised at PER31x forward earnings; Thomson was acquired at PER27x forward earnings. A potential future catalyst for KPJ’s stock may be the expected relisting of Parkway as Integrated Healthcare.
Steady and defensive. In the last ten years, KPJ has compounded its earnings at 27% p.a. and has grown its revenues and earnings every year. In 2010-2013E, we expect an earnings CAGR of 16%. During the financial crisis (from beginning 2008 to March 2009), KPJ’s shares were down by 19% and outperformed the KLCI by 21%.
Key risks. As KPJ is owned by Johor Corp, it is a government-linked corporation and may be used to advance the national agenda. However, KPJ has a good track record with all hospitals in Malaysia currently profitable.
KPJ Healthcare Berhad l 30 June 2011
l Equity Research l 4
Valuation Our price target for KPJ Healthcare is MYR5.0 per share, offering a potential total return of 11.6% (9.4% from share price appreciation, 2.2% from dividend yield). KPJ is trading on PER18x 2012E, while our price target is based on a PER target multiple of 20x 2012E.
PER valuation
Our price target multiple of 20x 2012E is based on a 20% discount to our price target multiple of 25x 2012E for Raffles Medical (RFMD SP, Outperform, last close SGD2.26, price target: SGD2.83). We note that this also corresponds to the average valuation for Asian hospitals of PER 20x 2012E.
Fig 1: Peer comparison
Target
price Price Market
cap
3M avg value
traded Last PE
2 year EPS
EV/EBITDA
Div. Yield
%
Last Reported
ROCEName Rating (LCY) (LCY) (USDm) (USDm) FYE 2010 2011 2012 CAGR PEG 2010 2011 2011 (%)
KPJ HEALTHCARE OP 5.00 4.57 855 1.24 12/10 22.5 21.6 18.3 11.0 2.0 14.4 11.8 1.9 11.8
Asia
HEALTHWAY MEDICA IL 0.127 0.10 161 0.22 12/10 59.4 23.8 19.0 76.8 0.3 36.7 19.0 0.0 1.9
RAFFLES MEDICAL OP 2.83 2.26 967 1.01 12/10 26.6 23.2 19.9 15.4 1.5 18.8 16.4 1.8 15.6
APOLLO HOSPITALS NR 481.00 1,336 1.32 03/11 32.4 27.2 21.9 21.6 1.3 15.6 na 1.0 8.6
FORTIS HEALTHCAR NR 157.80 1,424 2.12 03/11 51.4 36.6 25.8 41.1 0.9 224.3 na 0.0 6.0
BANGKOK DUSIT MD NR 52.00 2,611 5.11 12/10 27.7 22.0 18.3 23.0 1.0 17.2 55.0 na 10.4
BUMRUNGRAD HOSPI NR 36.75 870 1.16 12/10 21.2 19.1 17.9 9.0 2.1 13.8 11.7 2.7 17.8
BANGKOK CHAIN HO NR 5.60 363 0.74 12/10 17.7 15.9 14.4 10.8 1.5 9.2 8.4 3.9 19.0
Average 33.8 23.9 19.6 1.2 47.9 22.1 1.6 11.3
Global
KINDRED HEALTHCA NR 21.69 1,127 18.43 12/10 15.2 11.0 9.2 28.4 0.4 6.5 18.3 na 4.9
GENERALE DE SANT NR 11.93 970 0.06 12/10 18.9 17.7 15.0 12.3 1.4 6.8 6.7 10.6 5.4
RHOEN-KLINIKUM NR 16.56 3,298 10.95 12/10 16.4 14.5 13.0 12.3 1.2 9.4 34.8 na 6.6
MEDICLIN AG NR 4.15 284 0.03 12/10 19.8 16.3 14.3 17.5 0.9 7.7 7.3 1.3 6.1
GLOBAL HEALTH PA NR 12.95 134 0.15 12/10 86.3 18.0 13.2 155.6 0.1 10.5 na na 3.6
POLMED SA NR 2.74 28 - 12/10 25.1 19.6 15.2 28.5 0.7 14.8 10.7 1.5 10.4
NETCARE LTD NR 1,473 3,096 6.83 09/10 15.2 13.6 11.6 14.4 0.9 9.8 10.1 3.6 9.6
MEDI-CLINIC CORP NR 3,051 2,909 1.47 03/11 15.6 14.2 11.7 15.7 0.9 9.8 8.8 2.7 7.8
LIFE HEALTHCARE NR 1,760 2,681 14.12 09/10 27.3 15.1 12.9 45.3 0.3 11.8 8.3 3.7 17.8
Average 26.6 15.6 12.9 0.8 9.7 13.1 3.9 8.0
Average 30.2 19.8 16.3 1.0 28.8 17.6 2.7 9.7Note: Share prices as at 29 June 2011 OP = OUTPERFORM, UP = UNDERPERFORM, IL = IN-LINE, NR = NOT RATED Source: Company, Bloomberg consensus for non-rated (NR) stocks, Standard Chartered Research estimates for rated stocks
Discounted cash flow valuation
Discounted cash flow For those with a longer-term investment horizon, we believe a DCF valuation better captures the future growth of KPJ’s cash flows. Our DCF model shows the fair value at MYR6.59, which offers 44% potential upside.
Assumptions Our DCF model uses a risk-free rate of 5% as compared to the Malaysian 10-year bond rate of 4.16%. We use a cost of debt of 4.5%, similar to KPJ’s effective interest rate of 3.5% in 2010. The weighted average cost of capital works out to be 8.2%. We assume a terminal growth rate of 2% based on our view of the long-term growth potential of the group beyond our explicit forecast period of 2020. We believe this is conservative as the historical growth in revenue per patient alone has been 7% p.a.
DCF shows fair value at MYR6.59, or 44% potential upside

KPJ Healthcare Berhad l 30 June 2011
l Equity Research l 5
Included REIT injections In our free cash flow calculation, we have included expected future proceeds from disposals of hospitals into Al-’Aqar REIT as this is a core part of KPJ’s strategy. We have estimated the GFA of future hospitals and assumed a value based on a valuation of MYR2,142 per square meter, a 20% discount to the average valuation of the past four tranches of injections into Al-’Aqar REIT.
Premium to PER valuation Our DCF valuation is significantly higher than our PER-based valuation, due to the strong expected future cash flow and steady compounding of earnings. We expect KPJ to compound earnings at 16% p.a. over 2010-2013E. The business has a negative working capital with payables days more than offsetting receivable and inventory days.
Fig 2: DCF valuation MYRm 2010 2011E 2012E 2013E 2014E 2015E 2016E 2017E 2018E 2019E 2020E
EBIT 144 178 207 237 266 304 324 351 399 421 445
EBIT (1-tax) 108 133 155 178 199 228 243 263 299 316 334
(+) Depreciation and amort. 59 70 70 87 104 116 135 147 141 155 169
(-) Change in working capital 31 39 1 (0) (1) 1 1 1 1 1 1
(-) Net capital expenditure (228) (11) (203) (213) (149) (234) (155) 72 (171) (179) (89)
Unlevered free cash flow (30) 231 24 52 154 110 224 483 270 292 415
Present Value of FCF's 222 21 43 117 77 145 290 150 149 196
Terminal value 6,829
2012E WACC assumptions
DCF of operations 1,409 Risk-free rate 5.00%
NPV of the terminal value 3,231 Cost of debt 4.50%
Fair value of the operations 4,641 Equity risk premium 4.50%
Net cash/(debt) (224) Tax rate 25%
Minorities (99) Target debt to firm value 15%
Equity value 4,318 Equity beta 0.90
Shares outstanding 656 Cost of debt (after tax) 3.38%
Fair value per share (MYR) 6.59 Cost of equity 9.05%
Current price * 4.57 WACC 8.20%
Upside/(downside) 44% Terminal growth rate 2.00% * Price as at 29 June 2011 Source: Company, Standard Chartered Research estimates
Fig 3: Sensitivity of fair value WACC
7.2% 7.7% 8.2% 8.7% 9.2%
1.0% 7.10 6.43 5.86 5.36 4.93
1.5% 7.60 6.84 6.20 5.64 5.17
2.0% 8.19 7.32 6.59 5.97 5.44
2.5% 8.91 7.88 7.04 6.34 5.75 Ter
min
al g
row
th
3.0% 9.80 8.57 7.59 6.78 6.11 Source: Company, Standard Chartered Research estimates
Fig 4: Upside/downside from current price WACC
7.2% 7.7% 8.2% 8.7% 9.2%
1.0% 55% 41% 28% 17% 8%
1.5% 66% 50% 36% 24% 13%
2.0% 79% 60% 44% 31% 19%
2.5% 95% 73% 54% 39% 26%Ter
min
al g
row
th
3.0% 114% 88% 66% 48% 34%Source: Company, Standard Chartered Research estimates
Future REIT injections valued at 20% discount to historical average of past four tranches
DCF valuation reflects strong cash flow and steady compounding

KPJ Healthcare Berhad l 30 June 2011
l Equity Research l 6
Historical valuation
In the last 5 years, KPJ has traded in the range of PER 4x to 19x on 12-month forward earnings. KPJ’s share price has rallied 11% since the beginning of May.
Fig 5: PER band chart M
YR
0.0
0.5
1.0
1.5
2.0
2.5
3.0
3.5
4.0
4.5
5.0
Jan-06 Jul-06 Jan-07 Jul-07 Jan-08 Jul-08 Jan-09 Jul-09 Jan-10 Jul-10 Jan-11
19x
12x
10x
8x
6x
16x
14x
4x
* Priced as at 29 June 2011 Source: Company, Bloomberg, Standard Chartered Research estimates
During the financial crisis (from beginning 2008 to March 2009), KPJ’s shares were down by 19% and outperformed the KLCI by 21%.
Fig 6: KPJ’s share price performance relative to KLCI
50%
65%
80%
95%
110%
Jan-08 Mar-08 May-08 Jul-08 Sep-08 Nov-08 Jan-09 Mar-09 May-09
KPJ MK rebased KLCI rebased
Source: Bloomberg
Historically, KPJ traded at very low valuations as the market overlooked its growth prospects

KPJ Healthcare Berhad l 30 June 2011
l Equity Research l 7
Merger and acquisition valuation
Key M&A deals in both Singaporean and Malaysian hospital sectors have been executed in an implied PER range of 23x-32x over the last 6 years. Our target PER20x 2012E is at a 30% discount to the average PER multiple of 29x. We believe the high industry acquisition multiples reflect the steady growth, high predictability, and strong cash flow generation of the businesses.
Previous acquisition valuation: Pantai Holdings. Khazanah and Parkway Holdings acquired Pantai Holdings in 2006 at
PER23x 2005 net profit. Khazanah and Parkway formed a 51:49 joint venture for the acquisition.
Apollo Hospitals. (APHS IN, Not rated, last close INR483.1) In 2005, Khazanah paid INR1,925m (USD44.2m) for a 13.2% stake in Apollo Hospitals of India. This translates to PER32x 3/2006 net profit.
Parkway Holdings (unlisted). In 2010, Khazanah Nasional Bhd increased its stake in Parkway Holdings in a deal valued at SGD2.8bn at an implied PER27x.
Thomson Medical (unlisted). Sasteria Pte Ltd gained full control over Thomson Medical with two deals in Nov 2010 and Jan 2011. The initial deal was valued at SGD202m, at PER27x, and the final deal was valued at SGD292m, translating to PER26x.
Integrated Healthcare (unlisted). Mitsui acquired a 30% stake in Integrated Healthcare Holdings from Khazanah Nasional Bhd for a sum of MRY3.3bn. Integrated Healthcare’s holdings include Parkway Hospitals and Pantai Hospitals.
Fig 7: Historical M&A deals and valuation
Deal
valueNet
profit Date Target Acquirer Description Currency (m) (m) Year Valuation
8-May-11 Integrated Healthcare Mitsui & Co Ltd Minority purchase MYR 3,300 Na na na
24-Jan-11 Thomson Medical Centre Sasteria Pte Ltd Company takeover SGD 292 19 2011E PER26x 2011E profit
24-Nov-10 Parkway Holdings Khazanah Nasional Additional stake to obtain control SGD 2,841 162 2011E PER27x 2011E profit
9-Nov-10 Thomson Medical Centre Sasteria Pte Ltd Acquisition of minority SGD 202 19 2011E PER27x 2011E profit
14-May-08 Parkway Holdings Khazanah Nasional Additional stake SGD 532 119 2009 PER27x 2009 profit
27-Nov-06 Pantai Holdings Bhd Khazanah Nasional Additional stake to obtain control MYR 868 63 2005 PER23x 2005 profit
3-Aug-05 Apollo Hospitals Khazanah Nasional Minority purchase INR 1,925 457 3/2006 PER32x 3/2006 profitSource: Bloomberg, Standard Chartered Research estimates
Major M&A deals at an implied PER of 11x-56x

KPJ Healthcare Berhad l 30 June 2011
l Equity Research l 8
Peer comparison KPJ’s margins and average revenue per bed are lower than the sector average as it is less leveraged to high-end specialist healthcare. However, KPJ’s ROCE is similar to the sector average due to its asset-light model with disposal of properties to Al-’Aqar REIT.
Gross margin KPJ’s reported gross margin of 31% in FY2010 is close to the sector average of 38% (only for the peers in the below chart). However, a more accurate reflection of KPJ’s margins would be to exclude consultation revenue as KPJ only retains 5-10% as a hospital management fee. If we exclude the fees paid to consultants from the total revenue, KPJ’s adjusted margin improves to 42% for 2010. (We assume fees paid to consultants to be 92.5% of consultation income.)
Fig 8: Gross margin FY2010
0%
10%
20%
30%
40%
50%
Ave
rage
Tho
mso
nM
edic
al
Ban
gkok
Dus
itM
edic
al
KP
JH
ealth
care
-A
djus
ted
Bum
rung
rad
Hos
pita
l
Ban
gkok
Cha
inH
ospi
tals
KP
JH
ealth
care
-R
epor
ted
Note: Average excludes KPJ Healthcare’s adjusted margin Source: Companies, Bloomberg
Net margins KPJ’s net margin of 7.2% in FY2010 is at the lower end of the sector and below the Asian hospitals average of 12.2%. However, KPJ’s adjusted margin was 9.9% in 2010, closer to the sector average.
Fig 9: Net margins FY2010
0%
3%
6%
9%
12%
15%
18%
21%
Ave
rage
Tho
mso
nM
edic
al
Raf
fles
Med
ical
Ban
gkok
Cha
inH
ospi
tals
Bum
rung
rad
Hos
pita
l
Par
kway
KP
JH
ealth
care
-A
djus
ted
Ban
gkok
Dus
itM
edic
al
For
tisH
ealth
care
KP
JH
ealth
care
-R
epor
ted
Apo
lloH
ospi
tals
Note: Average excludes KPJ Healthcare’s adjusted margin Source: Companies, Bloomberg
KPJ’s gross margin of 31% is close to the sector average of 35%
KPJ’s net margin dragged down by lower EBIT per licensed bed

KPJ Healthcare Berhad l 30 June 2011
l Equity Research l 9
ROCE KPJ’s ROCE of 12% in FY2010 is equal to the Asian Hospital sector average despite lower gross and net margins. This is mainly due to the asset-light nature of the business with most of its hospitals owned by the KPJ Al-‘Aqar REIT.
Fig 10: ROCE FY2010
0%
5%
10%
15%
20%
Ave
rage
Ban
gkok
Cha
inH
ospi
tals
Bum
rung
rad
Hos
pita
l
Raf
fles
Med
ical
Tho
mso
nM
edic
al
KP
JH
ealth
care
Ban
gkok
Dus
itM
edic
al
Apo
lloH
ospi
tals
For
tisH
ealth
care
Source: Companies, Bloomberg
Number of licensed beds KPJ has over 2,500 beds in 20 hospitals as of June 2011. Apollo Hospitals is one of the largest in the region in terms of number of licensed beds with over 8,500 beds in 54 hospitals.
Fig 11: Number of licensed beds as at June 2011
0
1,500
3,000
4,500
6,000
7,500
9,000
Ave
rage
Apo
lloH
ospi
tals
Ban
gkok
Dus
itM
edic
al
Par
kway
For
tisH
ealth
care
KP
JH
ealth
care
-R
epor
ted
Ban
gkok
Cha
inH
ospi
tals
Bum
rung
rad
Hos
pita
l
Raf
fles
Med
ical
Num
ber
of li
cens
ed b
eds
Source: Companies, Google Finance
Revenue per licensed bed KPJ’s average revenue per licensed bed is significantly below Raffles Medical and Parkway as it is less leveraged to high-end specialist care. KPJ’s revenue per licensed bed is similar to Bangkok Dusit Medical (BGH TB, Not rated, last close THB52.00), perhaps because both have a strategy of building a network of hospitals across the country. In contrast, Bumrungrad (BH TB, Not rated, last close THB36.75) and Raffles Medical have the highest revenue per licensed bed as they focus on one flagship hospital in the city centre and are more focused on high-end care. This difference in strategy is also reflected in average operating profit per licensed bed with Bumrungrad and Raffles Medical at the top, and KPJ at a very similar level to Bangkok Dusit Medical.
KPJ’s sector-average margin of 12% is due to the asset-light nature of operations
KPJ is the fifth largest hospital in the region in terms of licensed beds
KPJ’s closest peer is perhaps Bangkok Dusit as both build nationwide networks

KPJ Healthcare Berhad l 30 June 2011
l Equity Research l 10
Fig 12: Revenue per licensed bed in FY2010
0
100
200
300
400
500
600
Ave
rage
Bum
rung
rad
Hos
pita
l
Raf
fles
Med
ical
Par
kway
KP
JH
ealth
care
-R
epor
ted
Ban
gkok
Dus
itM
edic
al
KP
JH
ealth
care
-A
djus
ted
For
tisH
ealth
care
Ban
gkok
Cha
inH
ospi
tals
Apo
lloH
ospi
tals
US
D (
'000
)
Note: Bumrungrad, Raffles Medical, Bangkok Dusit and Apollo are based on segmental revenue while others are based on total revenue Source: Companies, Bloomberg
Fig 13: Operating profit per licensed bed in FY2010
0
20
40
60
80
100
120
Ave
rage
Bum
rung
rad
Hos
pita
l
Raf
fles
Med
ical
Par
kway
Ban
gkok
Dus
itM
edic
al
Ban
gkok
Cha
inH
ospi
tals
KP
JH
ealth
care
For
tisH
ealth
care
Apo
lloH
ospi
tals
US
D (
'000
)
Note: Raffles Medical, and Apollo are based on segmental operating profit while others are based on total operating profit Source: Companies, Bloomberg

KPJ Healthcare Berhad l 30 June 2011
l Equity Research l 11
Company overview KPJ Healthcare Berhad is the leading private healthcare provider in Malaysia with 20 hospitals and over 2,500 beds. KPJ is part of Johor Corporation, a corporate linked to the Johor State Government. KPJ is the leading private hospital operator in Malaysia by number of hospitals, beds, and number of affiliated doctors. KPJ also owns 49% of Al-’Aqar REIT, a separately listed entity to allow KPJ to dispose of its hospitals into.
History
KPJ Healthcare commenced operations in 1981 with its first hospital in Johor. KPJ was listed on the Bursa Malaysia on 29 November 1994 and was the first healthcare company to be listed on the Main Board of Bursa Malaysia. In 2006, KPJ established Al-’Aqar REIT and to date has injected 4 tranches of properties into the REIT.
Business segments
KPJ discloses its segmental revenue by hospital income, consultation income, sale of pharmaceutical, medical and surgical products, and other hospital income.
Hospital Income – 2010: 38.6% of revenue Hospital Income grew by 22% p.a over 2000-2010 to MYR638m in 2010 from MYR84m in 2000. This was driven by an increase in number of hospitals to 21 in 2010 from two in 2000. The number of inpatients rose to 222,758 in 2010 from 28,484 in 2000, growing at 23% p.a.
Consultation Income – 2010: 29.6% of revenue Consultation income grew by 28% p.a. over 2000-2010 to MYR490m in 2010 from MYR40m in 2000. This was mainly attributable to an increase in number of medical consultants from 95 in 2000 to 750 in 2010; and growth in number of outpatients by 24% p.a. over the period.
Sale of pharmaceutical, medical and surgical products – 2010: 30.7% of revenue Revenue from the sale of pharmaceutical, medical and surgical products increased to MYR507m in 2010 from MYR5m in 2002, growing at 58% p.a. over 2002-2010.
Other hospital income – 2010: 1.1% of revenue The other hospital income segment includes income from clinic rental, laboratory test fees, investment income and others. Other hospital income grew by 39% p.a. over 2000-2010 to MYR19m in 2010 from MYR1m in 2000.
Revenue breakdown
The 2010 revenue breakdown was 38.6% hospital income, 29.6% consultation income, 30.7% sale of pharmaceutical, medical and surgical products; and other hospital income 1.1%.
Fig 14: Revenue breakdown in 2010
Hospital Income 38.6%
Consultation Income 29.6%
Sale of pharmaceutical, medical and surgical products 30.7%
Other hospital income 1.1%
Legend: segments listed clockw ise from top
Source: Company
Hospital income accounted for 38.6% of total revenue in 2010
KPJ was the first healthcare company to be listed on the Main Board of Bursa Malaysia

KPJ Healthcare Berhad l 30 June 2011
l Equity Research l 12
We also show adjusted revenue breakdown excluding 92.5% of consultation income as KPJ provides centralised collection for its specialist doctors. This adjusted revenue is more reflective of KPJ’s actual income.
Fig 15: Adjusted revenue breakdown in 2010
Hospital Income 53.1%
Consultation Income 3.1%
Sale of pharmaceutical, medical and surgical products 42.2%
Other hospital income 1.6%
Legend: segments listed clockw ise from top
Note: The consultation income excludes the revenue received on behalf of consultants Source: Company
Geographic breakdown
KPJ generates most of its revenue from the operation of hospitals in Malaysia, which accounted for 92.6% of total revenue in 2010. Assuming all support services are based in Malaysia, Malaysia accounted for 99.8% of the total revenue of KPJ Healthcare in 2010.
Fig 16: Geographic breakdown in 2010
Operating of specialist hospitals - Malaysia 92.6%
Operating of specialist hospitals - Indonesia 0.2%
Support services 7.2%
Legend: segments listed clockw ise from top
Source: Company

KPJ Healthcare Berhad l 30 June 2011
l Equity Research l 13
Porter’s five forces
Fig 17: Malaysian private healthcare industry: Porter’s five competitive forces model Malaysia has a tight supply of
specialist doctors so their bargaining power is high. KPJ is relatively well positioned to peers as it already has the largest panel of specialist doctors and has an established working system with doctors (centralised collection, etc).
KPJ sources medical equipment from the few manufacturers globally but enjoys economies of scale as the group centralises purchasing.
The healthcare sector in Malaysia is highly regulated (by the Private Healthcare Facilities and Services Act) and regulatory approval is required to set up a private hospital.
Due to the limited supply of specialist doctors, hospital groups with a strong reputation and established systems (centralised collection and billing) have an edge in recruiting doctors.
The Ministry of Health recommends a 20km distance between private hospitals and this largely precludes new entrants into communities with an existing private hospital.
Suppliers Potential entrants
Bargaining power of suppliers
HIGH
Threat of new entrants
MEDIUM Industry competitors
Rivalry among existing firms
MEDIUM
Substitutes Buyers
Threat of substitute products
LOW
Bargaining power of buyers
MEDIUM
Public healthcare is an alternative, but it only receives 46% of the sector expenditure while accepting 74% of admissions. As a result, the public healthcare system is highly stretched and we expect those who can afford it to shift to private healthcare.
For medical tourism, Thailand and Singapore are more popular medical tourism destinations, but medical tourism is a small portion of Malaysia’s private healthcare market (for KPJ it is about 6%).
There are several hospital operators
with sizeable networks in Malaysia, with KPJ having the largest (20) followed by Pantai (10) and Columbia Asia (9).
However, due to the Ministry of Health’s recommendation of zoning with a 20km distance between private hospitals, direct competition is limited.
Conventional economics also may not apply to healthcare due to ‘information asymmetry’ (doctors have superior knowledge to their patients).
For the private healthcare market, patients are generally less sensitive to pricing as they seek the best healthcare service provider.
As KPJ operates community hospitals where it is generally the main hospital for the community, it seeks to be the first hospital of choice for its patients.
Adapted from: Porter 1980 p.4. Source: Company, Standard Chartered Research

KPJ Healthcare Berhad l 30 June 2011
l Equity Research l 14
SWOT
Fig 18: SWOT analysis – KPJ Healthcare
Strengths
Market leadership – KPJ Healthcare is the largest private hospital operator in Malaysia with 20 hospitals and over 2,500 beds (as at end-2010). We estimate KPJ has a leading 20% share of private hospital beds in Malaysia and a leading 25% share of private inpatient admission.
Strong relationship with doctors – In 2010, KPJ healthcare had 750 medical consultants, which translates to a 7% share of private doctors in Malaysia. KPJ has an established and reputable system in place for centralised payment and billing, helping it in recruitment of doctors.
Brand and reputation – As the largest private hospital operator in Malaysia, KPJ has an established reputation. For example, its Damansara hospital is regarded as one of the best in Malaysia.
Private nursing college – KPJ has its own nursing college. As nurses are in short supply, this gives KPJ a competitive advantage in sourcing nurses.
Strong parent – KPJ’s parent, Johor Corporation, is one of Malaysia’s leading conglomerates and provides potential synergies with KPJ. For example, for its upcoming Iskandar hospital, KPJ’s sister company, Johor Land, will build and own the hospital while KPJ will lease.
Weaknesses
Failure in overseas expansion – KPJ has failed to manage the operation of its hospitals in Bangladesh and Saudi Arabia.
Accreditation – While 10 of KPJ’s 20 hospitals in Malaysia have obtained Malaysian Society for Quality in Health (MSQH) accreditation, none of KPJ’s hospitals have obtained JCI accreditation. This limits KPJ’s ability to attract medical tourists, although three of its hospitals are currently seeking accreditation.
Government link – As KPJ is ultimately owned by the state of Johor, KPJ may be used to advance a national agenda to the detriment of minority shareholders. However, to date KPJ has had a good track record with all hospitals in Malaysia profitable.
Opportunities
Structural growth of private healthcare. With the public healthcare system highly stretched (46% of the sector expenditure but 74% of the admissions), we expect Malaysians who can afford it to shift to private healthcare. In addition, Malaysia has a rapidly growing and ageing population.
Healthcare insurance – The rise in income levels and public awareness has led to increased demand for healthcare insurance as customers seek medical and health protection.
Potential for medical tourism – The Malaysia government has plans to spur growth in the medical tourism market. Although we have not factored in robust growth, this could be significant if successful.
Healthcare education – KPJ’s nursing college is currently still small with a capacity for 2,500 while Masterskill has over 18,000 students. KPJ has plans to expand the capacity of its college to 10,000 in 5 years.
Threats
Increasing competition – More aggressive expansion and competition from existing players such as Parkway and Columbia Asia may hurt KPJ. However, we note that each has slightly different positioning.
Shortage of healthcare professionals – There is a lack of qualified doctors and nurses to cater to the growing demand for healthcare services.
Insurance companies are negotiating for more discounts – Along with growth and increasing penetration of health insurance, insurance companies are negotiating for bigger discounts with private healthcare providers.
Source: Company. Standard Chartered Research
KPJ Healthcare Berhad l 30 June 2011
l Equity Research l 15
Structural drivers
Growing population
Although Malaysia has a small population of only 29m, it is one of the fastest-growing nations in Asia. From 2000 to 2010, Malaysia’s population grew from 23.5m to 29m, a CAGR of 2.2%. This is close to the Singapore growth rate of 2.1% but significantly higher than 1.5% for India, 1.3% for Indonesia, 0.8% for Thailand, and 0.6% for China.
Fig 19: Malaysia population and growth Fig 20: Population growth CAGR 2000-10
0
5,000
10,000
15,000
20,000
25,000
30,000
35,000
2000
2001
2002
2003
2004
2005
2006
2007
2008
2009
2010
0.0%
0.5%
1.0%
1.5%
2.0%
2.5%
Population (000's) (LHS) Growth rate (RHS)
0.0%
0.5%
1.0%
1.5%
2.0%
2.5%
Mal
aysi
a
Sin
gapo
re
Indi
a
Aus
tral
ia
Indo
nesi
a
Bra
zil
US
A
Tha
iland
Fra
nce
Chi
na
Source: Global Demographics Source: IMF, Global Demographics
Ageing population
According to Global Demographics, in 2000, 4% of Malaysians were over 65 years old and by 2010, this percentage reached 5%. Global Demographics expects the percentage of Malaysians over 65 to further increase to 8% by 2020.
Fig 21: Population breakdown by age group 2010-2020
30%
30%
29%
29%
28%
28%
27%
27%
27%
26%
26%
65%
65%
65%
65%
66%
66%
66%
66%
66%
66%
66%
5% 5% 6% 6% 6% 6% 7% 7% 7% 8% 8%
0%
20%
40%
60%
80%
100%
2010 2011 2012 2013 2014 2015 2016 2017 2018 2019 2020
< 15 years 15 - 64 years 65 years and above
Source: Global Demographics
Stretched public healthcare system
The Malaysian public healthcare system is highly subsidised by the government and is generally offered free to the needy, civil servants and pensioners. In 2009, Malaysia spent 4.6% of GDP (4.74% in 2008) on healthcare. The public sector accounted for 46% of total healthcare expenditure in 2008 but serviced 74% of admissions with 78% of hospital beds and only 55% of doctors.
Public sector accounted for 46% of total healthcare expenditure in 2008 but serviced 74% of admissions
Population grew at 2.2% p.a. over 2000-2010.
Percentage over 65 years old expected to grow from 5% in 2010 to 8% in 2020.

KPJ Healthcare Berhad l 30 June 2011
l Equity Research l 16
Fig 22: Public-Private sector distribution of resources and workload - 2008
55%
78%
74%
46%
45%
22%
26%
54%
Doctors *
Hospital beds
Admissions
Hospital expenditure
Public Private
22,087 doctors
53,118 hospital beds
MYR18bn
2.95m admissions
* Total number of doctors excluding housemen Source: Ministry of Health
Private healthcare gaining share
In 2000, 53% of healthcare spending was on public healthcare but the private sector has been steadily gaining share. By 2008, public healthcare only accounted for 46% of sector spending. From 2000 to 2008, private healthcare grew at 16% p.a. while public healthcare grew at 13% p.a.
Fig 23: Public and Private healthcare expenditure in Malaysia
Fig 24: Number of doctors in Malaysia
53%
59%
59%
54%
50%
44%
45%
44%
46%
47%
46%
47%
45%
50%
56%
56%
56%
54%
0%
20%
40%
60%
80%
100%
2000 2001 2002 2003 2004 2005 2006 2007 2008
Public healthcare expenditure Private healthcare expenditure
39%
40%
40%
34%
61%
60%
60%
66%
0%
20%
40%
60%
80%
100%
2006 2007 2008 2009
Private doctors Public doctors
Source: Ministry of Health Source: Ministry of Health
Fig 25: Public healthcare expenditure Fig 26: Private healthcare expenditure
0
2,500
5,000
7,500
10,000
12,500
15,000
17,500
2000 2001 2002 2003 2004 2005 2006 2007 2008
MY
Rm
-10%
0%
10%
20%
30%
40%
Public healthcare expenditure (LHS) Growth (RHS)
CAGR 2000-08 13%
0
2,500
5,000
7,500
10,000
12,500
15,000
17,500
20,000
2000 2001 2002 2003 2004 2005 2006 2007 2008
MY
Rm
-5%
5%
15%
25%
35%
45%
Private healthcare expenditure (LHS) Growth (RHS)
CAGR 2000-08 16%
Source: Ministry of Health Source: Ministry of Health
Growing household income
Malaysia’s GDP per capita grew at 6.2% p.a. over 2000 to 2009 to reach USD6,950 in 2009, according to the International Monetary Fund (IMF). It dropped in 2009 due to the impact of the global recession on Malaysia. In 2008, GDP per capita stood at USD8,143. The IMF expects Malaysia’s GDP per capita to grow at 7% p.a. over 2009 to 2015.
GDP per capita of USD6,950 in 2009
Private healthcare compounded at 16% p.a. from 2000-2008.

KPJ Healthcare Berhad l 30 June 2011
l Equity Research l 17
Fig 27: Malaysia’s GDP per capita
0
2,000
4,000
6,000
8,000
10,000
12,000
2000
2001
2002
2003
2004
2005
2006
2007
2008
2009
2010
E
2011
E
2012
E
2013
E
2014
E
2015
E
US
D
-20%
-15%
-10%
-5%
0%
5%
10%
15%
20%
Malaysia's GDP per capita (LHS) Grow th rate (RHS)
Source: IMF

KPJ Healthcare Berhad l 30 June 2011
l Equity Research l 18
Strong market position
Leading market share
KPJ is the largest private hospital operator in Malaysia with 20 hospitals and growing. KPJ has the leading share of the market by every category from number of hospitals and number of beds, to admissions.
Hospitals. KPJ has 20 hospitals in Malaysia while the closest competitors, Pantai and Columbia Asia, only have 10 and 9, respectively.
Beds. KPJ has a 20% share of private hospital beds in Malaysia. (KPJ has over 2500 licensed beds as at June 2011 while there were 12,216 private hospital beds as of 2009).
Share of medical consultants. At end-2010, KPJ had a 7% share of private doctors and a 2% share of total doctors in Malaysia. (This share is dragged down by the number of general practitioners as KPJ does not operate in the family clinic space.)
Inpatient admissions. In 2009, KPJ had a 25% share of private hospital admissions and a 7% share of total nationwide admissions (both public and private).
Fig 28: Share of private hospital beds Fig 29: Share of private medical consultants
KPJ Healthcare 20%
Pantai 14%
Columbia Asia 4%
Prince Court 2%
Tropicana 2%
Others 58%
Legend: segments listed clockwise from top
KPJ Healthcare 7%
Pantai 5%
Columbia Asia 1%
Tropicana 0%
Others 93%
Legend: segments listed clockwise from top
Note: Number of licensed beds as of June 2011, Private hospital beds for 2009 as reported by Ministry of Health Source: Companies, Ministry of Health
Note: Number of consultants as of June 2011, Private medical consultants for 2009 as reported by Ministry of Health Source: Companies, Ministry of Health
Fig 30: Share of private inpatient admissions - 2009
Fig 31: Share of private outpatient admissions - 2009
KPJ Healthcare 25%
Others 75%
Legend: segments listed clockwise from top
KPJ Healthcare 69%
Others 31%
Legend: segments listed clockwise from top
Source: Company, Ministry of Health Source: Company, Ministry of Health
KPJ has a 20% share of private hospital beds, 7% share of private doctors, and 25% share of private hospital admissions
KPJ Healthcare Berhad l 30 June 2011
l Equity Research l 19
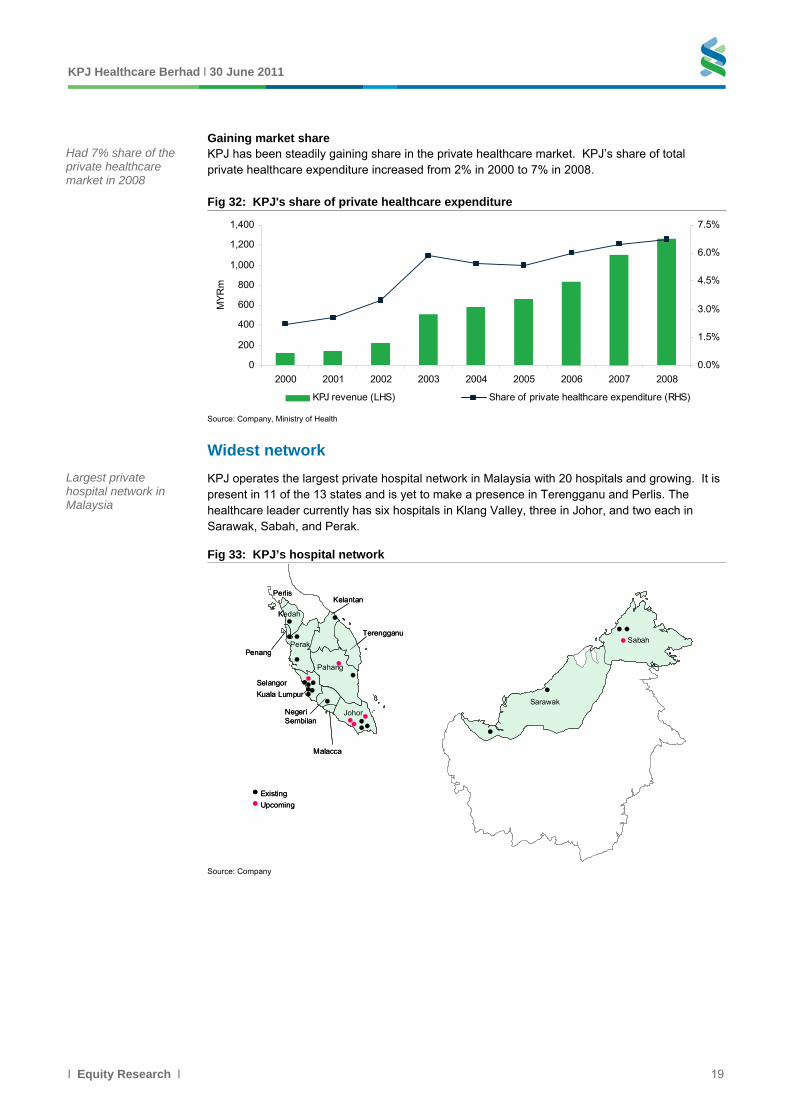
Gaining market share KPJ has been steadily gaining share in the private healthcare market. KPJ’s share of total private healthcare expenditure increased from 2% in 2000 to 7% in 2008.
Fig 32: KPJ's share of private healthcare expenditure
0
200
400
600
800
1,000
1,200
1,400
2000 2001 2002 2003 2004 2005 2006 2007 2008
MY
Rm
0.0%
1.5%
3.0%
4.5%
6.0%
7.5%
KPJ revenue (LHS) Share of private healthcare expenditure (RHS)
Source: Company, Ministry of Health
Widest network
KPJ operates the largest private hospital network in Malaysia with 20 hospitals and growing. It is present in 11 of the 13 states and is yet to make a presence in Terengganu and Perlis. The healthcare leader currently has six hospitals in Klang Valley, three in Johor, and two each in Sarawak, Sabah, and Perak.
Fig 33: KPJ’s hospital network
Sabah
Sarawak
Terengganu
Pahang
Johor
Malacca
Negeri Sembilan
Selangor
Perak
Kelantan
Penang
Kedah
Perlis
Kuala Lumpur
Upcoming
Existing
Sabah
Sarawak
Terengganu
Pahang
Johor
Malacca
Negeri Sembilan
Selangor
Perak
Kelantan
Penang
Kedah
Perlis
Kuala Lumpur
Upcoming
Existing
Source: Company
Largest private hospital network in Malaysia
Had 7% share of the private healthcare market in 2008

KPJ Healthcare Berhad l 30 June 2011
l Equity Research l 20
Current hospital details
10 of the hospitals in Malaysia have obtained Malaysian Society for Quality in Health (MSQH) certification while 7 are ISO certified. Currently, Ampang Puteri Hospital and Seremban Specialist Hospital are working towards Joint Commission International (JCI) accreditation.
Fig 34: KPJ Hospitals
No. Name of hospital State Year of build /
acquisitionBuilt /
AcquiredNumber of
beds Accreditations
Malaysia 1 KPJ Johor Specialist Hospital Johor 1981 Built 200 MSQH2 Puteri Specialist Hospital Johor 1993 Acquired 146 3 Kluang Utama Specialist Hospital Johor 2008 Acquired 40 4 KPJ Ampang Puteri Specialist Hospital Selangor 1995 Built 217 ISO 9001:2000, MSQH 5 KPJ Damansara Specialist Hospital Selangor 1997 Built 158 ISO 9001:2000, MSQH 6 KPJ Selangor Specialist Hospital Selangor 2006 Acquired 169 ISO 9001:2000, MSQH 7 KPJ Kajang Specialist Hospital Selangor 2006 Acquired 110 MSQH8 KPJ Tawakkal Specialist Hospital Selangor 1984 Built 147 ISO 9001:20009 Sentosa Medical Centre Selangor 2006 Acquired 135 10 KPJ Perdana Specialist Hospital Kelantan 2002 Built 83 MSQH11 Kedah Medical Centre Kedah 1991 Acquired 98 ISO 9001:2000, MSQH 12 KPJ Seremban Specialist Hospital Negeri Sembilan 2004 Built 130 MSQH13 KPJ Ipoh Specialist Hospital Perak 1989 Acquired 250 ISO 9001:2000, MSQH 14 Taiping Medical Centre Perak 2008 Acquired 46 15 KPJ Penang Specialist Hospital Penang 1985 236 MSQH16 Kuantan Specialist Hospital Pahang 1990 Acquired 72 ISO 900217 Kuching Specialist Hospital Sarawak 2003 Built 80 18 Sibu Specialist Medical Centre Sarawak 2011 Acquired 50 19 Kota Kinabalu Specialist Hospital Sabah 2005 Acquired 43 20 Sabah Medcial Centre Sabah 2010 Acquired 95 Total number of beds - Malaysia 2,505 Indonesia 21 RS Bumi Serpong Damai 2010 60 22 RS Medika Permata Hijau 1995 80 Total number of beds - Indonesia 140 Total number of beds 2,645 Source: Company
Upcoming hospitals
KPJ is planning to invest MYR250m over the next two years on four key new projects which should expand the total KPJ network of hospitals to 24 by the end of 2013. It is also building a new hospital to replace Sabah Medical Centre, which should be completed by 2012. The company has also announced plans to build a 400-bed specialist hospital in Iskandar in Johor.
Fig 35: Upcoming hospitals Hospital Name Location Status Year of completion No. of beds
Bandar Baru Klang Specialist Hospital Selangor New 2011 200
Muar Specialist Hospital Johor New 2012 90
Pasir Gudang Specialist Hospital Johor New 2012 90
Tanjung Lumpur, Kuantan - Preliminary Pahang New 2013 90
New Sabah Medical Centre Sabah Replacement 2012 95
Iskandar Specialist Hospital Johor New na 400Source: Company, Business Times
10 of the 20 hospitals have MSQH certification
Four new projects in progress at a cost of MYR250m, and a fifth on the pipeline

KPJ Healthcare Berhad l 30 June 2011
l Equity Research l 21
Competitor analysis and positioning
Operation comparison
KPJ is the largest private hospital operator in Malaysia with 20 hospitals and over 2,500 licensed beds across Malaysia. Its closest competitor, Pantai has 10 hospitals and 1,739 beds while Columbia Asia has 9 hospitals and 444 beds.
Fig 36: Hospital operator comparison KPJ Pantai Columbia Asia Sime Darby Prince Court Tropicana
Number of Hospitals 20 10 9 1 1 2
Number of Beds 2,505 1,739 444 393 300 204
Number of specialist doctors 750 500 112 160 na 50
Number of nurses 8,000 1,800 na na na naSource: Companies' websites as at 31 May 2011
Fig 37: Number of private hospitals by operator
Fig 38: Number of licensed beds by operator
20
10 9
20
2
4
6
8
10
12
14
16
18
20
KPJhealthcare
Pantai Columbia Asia Tropicana
Num
ber
of h
ospi
tals
2505
1739
444204
0
300
600
900
1,200
1,500
1,800
2,100
2,400
2,700
KPJhealthcare
Pantai ColumbiaAsia
Tropicana
Num
ber
of li
cens
ed b
eds
Source: Companies Source: Companies, Ministry of Health
Positioning comparison
KPJ is positioned as a mid-tier hospital, with an average charge of MYR234 per single-bed room (ranging from MYR100 to MYR368 per single-bed room as of May 2011). Pantai hospitals are higher end with an average rate of MYR317 per single-bed room while Columbia Asia appears to be positioned lower with an average rate of MYR160 per single-bed room. KPJ’s closest peer in terms of positioning may be Prince Court at MYR203 per single-bed room.
Fig 39: Average charges of the hospitals 2010 KPJ Pantai Columbia Asia Prince Court Tropicana
Avg. charge per single bed room 234 317 160 203 250
Avg. charge per double bedded room 140 149 110 na 130
Avg. charge per suite 621 959 na 800 455Note: Average of all the hospitals Source: Companies' websites as at 31 May 2011
KPJ is the largest hospital operator in Malaysia with 20 hospitals and over 2,500 licensed beds
KPJ is positioned as a mid-tier hospital

KPJ Healthcare Berhad l 30 June 2011
l Equity Research l 22
Fig 40: Average charge per single bed room
0
50
100
150
200
250
300
350
Pantai Tropicana KPJ Prince Court Columbia Asia
MY
R
Note: Average of all the hospitals Source: Companies' websites as at 31 May 2011

KPJ Healthcare Berhad l 30 June 2011
l Equity Research l 23
High barriers to entry The private healthcare sector in Malaysia is difficult to enter as there are several high barriers to entry.
Private Healthcare Facilities and Services Act
Regulates construction of new hospitals The Private Healthcare Facilities and Services Act was announced in 1998 but enforced in 2006 and regulates all private healthcare facilities and services in Malaysia. The act requires approval to be granted before a new private healthcare facility can be established.
Zoning restricts competition As specified in the act, when deciding whether to grant approval for a new private healthcare facility, the body will assess “the extent to which the healthcare facilities or services are already available in an area.” The intention of the act is to encourage healthcare resources to be spread out across the country, otherwise healthcare providers would all focus on the wealthier Klang Valley region. But as KPJ operates community-based hospitals, the act has helped limit direct competition. The typical requirement is that there is a 20km distance between private hospitals.
Exception for specialist hospitals The exception to the 20km zoning requirement is if a group builds a new private centre of excellence. A centre of excellence refers to a medical centre with a specialty in a particular field such as cardiology. Going forward, KPJ may explore building centres of excellence.
Doctors
KPJ has strong relationship with its specialist doctors A significant barrier to entry in the private hospital sector is the difficulty in securing private specialists. KPJ’s consultant specialists pay a one-time practising rights fee of MYR25k-MYR50k in order to practice at KPJ’s hospitals. The practising rights fee is refunded upon death or retirement.
Doctors are in shortage According to the Malaysian government’s economic transformation programme, there is a significant shortage of specialist doctors in several key areas – in particular, anaesthesiology, cardiology, and plastic surgery.
Fig 41: Shortage of specialist doctors -Anaesthesiology
Fig 42: Shortage of specialist doctors - Cardiology
0
200
400
600
800
1,000
1,200
1,400
1,600
1,800
2,000
2010 2020
Demand Supply Shortfall
0
100
200
300
400
500
600
700
2010 2020
Demand Supply Shortfall
Source: Economic Transformation Program Source: Economic Transformation Program
Established centralised collection and billing KPJ also has a well-established centralised system in place for collection and billing. KPJ collects the consultant’s income and pays the doctor twice a month. KPJ charges the doctors 5-10% of their income as a hospital management fee.
The act requires minimum distance of 20km between private hospitals
Malaysia is short of doctors and KPJ has established relationship with large team of doctors

KPJ Healthcare Berhad l 30 June 2011
l Equity Research l 24
Growth drivers
Network expansion
Further room for growth KPJ operates community-based hospitals in areas with a population over 200k. KPJ’s hospitals are typically the largest (and often the only) hospital for the community. We estimate there are 40 communities in Malaysia with a population over 200k. Considering KPJ, Pantai, and Columbia Asia’s networks, we estimate there are 19 communities where KPJ could establish a presence.
Fig 43: Communities with population over 200k No. of hospitals by operator Districts
State District Population ('000) 2010
KPJ Healthcare Pantai
Columbia Asia
without any presence
Johor Bahru 1,464 2 - 1
Batu Pahat 406 - 1 -
Muar 398 - - - √
Kluang 317 1 - -
Kota Tinggi 252 - - - √
Johor
Segamat 209 - - - √
Kuala Muda 428 - - 1
Kota Setar 423 1 - -
Kulim 251 - - - √
Kedah
Kubang Pasu 230 - - - √
Kota Bharu 509 1 - - Kelantan
Pasir Mas 211 - - - √
Melaka Melaka Tengah 475 - 1 -
N. Sembilan Seremban 469 1 - 1
Pahang Kuantan 416 1 - -
Timur Laut 524 - - - √
S.P. Tengah 387 - - - √
S.P. Utara 310 1 - -
Pulau Pinang
Barat Daya 216 - - - √
Kinta 852 1 1 -
Larut & Matang 341 1 - 1
Manjung 239 - - - √
Perak
Hilir Perak 233 - - - √
Perlis Perlis 240 - - - √
Petaling 1,509 2 - 3
Hulu Langat 1,150 1 1 1
Klang 833 - 1 -
Gombak 681 - - - √
Kuala Langat 242 - - - √
Selangor
Kuala Selangor 202 1 - -
Terengganu K. Terengganu 341 - - - √
Kuala Lumpur Kuala Lumpur 1,722 2 3 -
Kuching 600 1 - -
Miri 281 1 - 1
Sibu 258 - - - √
Sarawak
Bintulu 200 - - 1
Sandakan 454 - - - √
Kota Kinabalu 436 2 - -
Tawau 402 - - - √
Sabah
Lahad Datu 213 - - - √
Total number of districts without any hospitals by key operators 19 Source: Department of Statistics, Malaysia; Standard Chartered Research estimates
At least 19 more communities where KPJ could open a hospital

KPJ Healthcare Berhad l 30 June 2011
l Equity Research l 25
Growth in patient volume
Robust volume growth From 2005 to 2010, KPJ’s annual inpatient and outpatient volume both grew by 14% p.a. (annual inpatients from 117,539 to 222,758; annual outpatients from 1,162,585 to 2,196,769).
Fig 44: Number of inpatients Fig 45: Number of outpatients
0
25,000
50,000
75,000
100,000
125,000
150,000
175,000
200,000
225,00020
00
2001
2002
2003
2004
2005
2006
2007
2008
2009
2010
0%
20%
40%
60%
80%
100%
120%
140%
Number of in-patients (LHS) YoY growth (RHS)
0
250,000
500,000
750,000
1,000,000
1,250,000
1,500,000
1,750,000
2,000,000
2,250,000
2000
2001
2002
2003
2004
2005
2006
2007
2008
2009
2010
0%
20%
40%
60%
80%
100%
120%
140%
160%
Number of out-patients (LHS) YoY growth (RHS)
Source: Company Source: Company
Growth in revenue per patient
Room to drive revenue intensity From 2005 to 2010, KPJ’s average revenue per inpatient grew at 7% p.a from MYR2,035 to MYR2,865. Before it was privatised, Parkway’s average revenue per inpatient for its Singapore hospitals was SGD5,660/MYR13,867 for 2009. Parkway is clearly much more focused on high-end-specialist care, but we believe the vast differential between the two (KPJ is at a 79% discount to Parkway) reflects the opportunity for KPJ to move up the value chain.
Fig 46: KPJ’s hospital revenue per inpatient Fig 47: Revenue per inpatient- KPJ vs. Parkway FY2010
0
500
1,000
1,500
2,000
2,500
3,000
2005 2006 2007 2008 2009 2010
MY
Rm
-10%
-5%
0%
5%
10%
15%
20%
Hospital income per in-patient (LHS) YoY growth (RHS)
0
2,000
4,000
6,000
8,000
10,000
12,000
14,000
KPJ Parkway
Source: Company Source: Companies
Total number of inpatients grew at 14% p.a. in 2005-10
Hospital income per inpatient grew at 7% p.a. in 2005-10.

KPJ Healthcare Berhad l 30 June 2011
l Equity Research l 26
Healthcare education KPJ established its own nursing college in 1991. Today, the nursing school is called KPJ International College of Nursing with the main campus at Kotai Seriemas, Nilai, Negeri Sembilan.
Strategic importance
Shortage of nurses in Malaysia KPJ’s involvement in nursing education is strategically important due to the chronic shortage of nursing staff in Malaysia. According to the World Health Organization (WHO), Malaysia has only 27 nurses per 10k population compared to 59 in Singapore and a global average of 30. KPJ College gives KPJ a competitive advantage in securing nurses for its hospitals.
Fig 48: Nurse density per 10K population
0
10
20
30
40
50
60
Singapore Global average Malaysia Indonesia Thailand South East AsiaRegion
Per
10k
pop
ulat
ion
Source: WHO - World Health Statistics 2011
Growing the business
Campus expansion KPJ College’s campus currently has a capacity of up to 2,500 students. The group plans to expand this capacity to 5,000 students in 3 years and 10,000 in 5 years. The main campus is at Nilai, Negeri Sembilan, with a branch campus in Johor Bahru in the South. A new branch campus in the North in Bukit Mertajam will open in 2011.
Highly profitable business
High-margin business According to KPJ management, KPJ College generates revenues of about MYR35m with a net margin of about 20%.
Comparison with Masterskill Masterskill is the only listed comparable for the education business in Malaysia. In 2010, Masterskill had about 18,400 students and generated revenue of MYR316m and a net profit of MYR102m. The business is highly profitable, with a net profit margin of 32%, and generates a return on equity of 20%. The business also appears to be highly scalable as Masterskill has compounded revenue and earnings at 36% and 26% in the last 4 years.
Fig 49: Masterskill – summary financials MYRm 2007 2008 2009 2010 CAGR 2007-10
Revenue 127 203 273 316 36%
Net profit 51 72 97 102 26%
Net margin 41% 36% 36% 32%
ROE 42% 37% 33% 20% Source: Masterskill Education Group Bhd
Masterskill had 18k students and generated MYR102m of net profit in 2010
Vertical integration into nursing college gives KPJ strategic advantage.
College capacity to grow from 2,500 to 10,000 in 5 years

KPJ Healthcare Berhad l 30 June 2011
l Equity Research l 27
High regulatory risk One of the key risks for the education business is government regulation. Taking Masterskill as an example, about 95% of its students are financed by the Malaysian government’s PTPTN student loan scheme. Any changes to the size and terms of the loans could significantly affect demand for courses. For KPJ College, about half of the students are funded by PTPTN while the other half is funded by scholarships from KPJ’s hospitals.
Most students dependent on government funding

KPJ Healthcare Berhad l 30 June 2011
l Equity Research l 28
REIT funds expansion KPJ set up the Al-’Aqar KPJ REIT (Al-’Aqar REIT) in 2006 to allow the group to become asset-light. Al-’Aqar REIT was the first healthcare REIT in Asia and the first Islamic REIT in the world. Today, KPJ owns 49% of Al-‘Aqar KPJ REIT.
Asset-light expansion
KPJ sees the Al-’Aqar REIT as a key part of its strategy for expansion as it allows it to free up cash flow to fund further growth. Below are some key highlights of Al-’Aqar REIT:
Al-’Aqar REIT was listed on 10 August 2006
Tranche 1 (2006): 6 properties were injected into the REIT and KPJ raised MYR481m
Tranche 2 (2008): 5 properties were injected for MYR170m.
Tranche 3 (2009): 8 properties were injected for MYR292m.
Tranche 4 (planned 2011): Shareholders have approved injection of 3 properties for MYR139m
Revision of rental rate
The rental that KPJ pays to Al-’Aqar REIT is based on a fixed formula as per below:
(10-year MGS + 238 bps) x market value of the properties
Minimum rental of MYR33m per annum
Maximum 2% increment over the preceding year’s rental amount.
Rental as percentage of revenue The rental amount paid to Al-’Aqar REIT from 2006 to 2010 translated to MYR27-73m p.a. The rate has been steadily rising from 1.6% of revenue in 2006 (only for 6 months from the date of establishment) to 4.4% of revenue in 2010, corresponding with the number of properties injected into the REIT.
Fig 50: Rental expenses
0
50
100
150
200
250
2006 2007 2008 2009 2010
MY
R
0.0%
0.5%1.0%
1.5%
2.0%2.5%
3.0%
3.5%
4.0%4.5%
5.0%
Average rental rate per sqm % of KPJ revenue (RHS)
Note: Rent paid refers to the gross rental income of Al-’Aqar KPJ REIT, Number of sqm is adjusted for timing of injection into REIT Source: Companies
Property portfolio
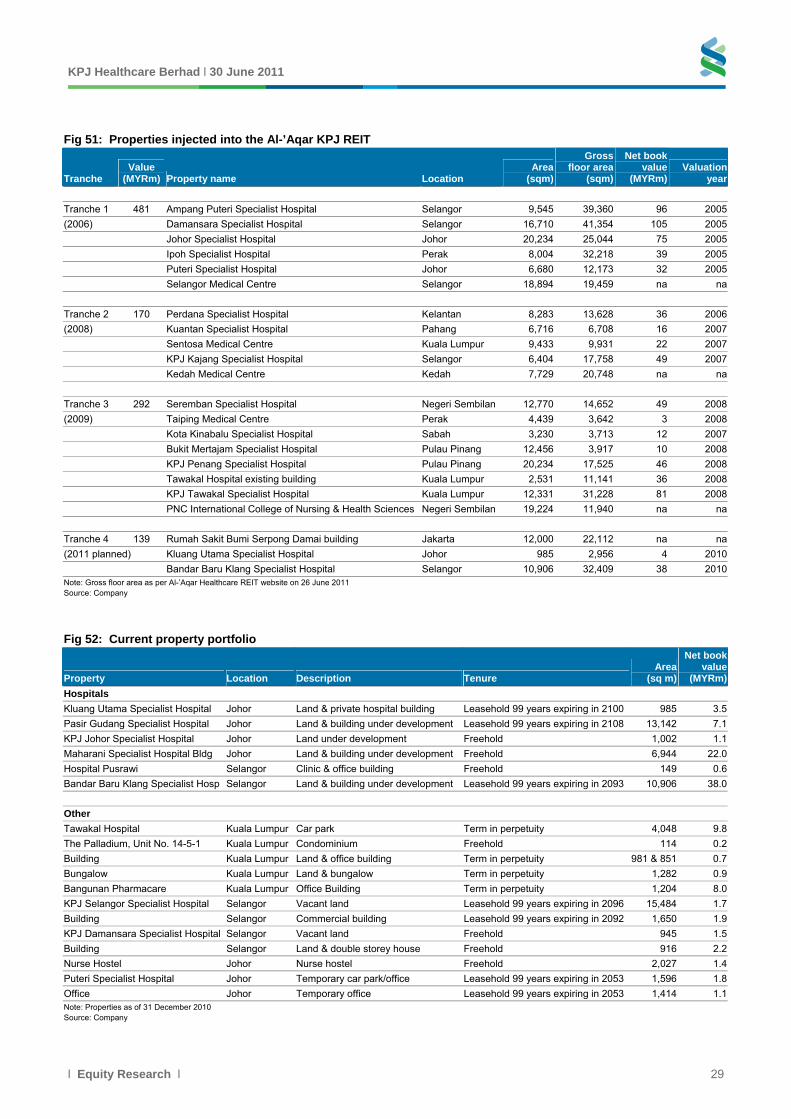
KPJ has injected 19 hospitals into the Al-’Aqar REIT as at June 2011 and three more are in the pipeline planned for injection in 2011 in tranche 4 for total proceeds of MYR139m.
Maximum 2% increment from preceding year rental.
Rental paid to REIT equivalent to 4.4% of revenue in 2010
19 of the 20 existing hospitals injected into Al-Aqar REIT
KPJ Healthcare Berhad l 30 June 2011
l Equity Research l 29
Fig 51: Properties injected into the Al-’Aqar KPJ REIT
Tranche Value
(MYRm) Property name Location Area
(sqm)
Gross floor area
(sqm)
Net book value
(MYRm)Valuation
year
Tranche 1 481 Ampang Puteri Specialist Hospital Selangor 9,545 39,360 96 2005
(2006) Damansara Specialist Hospital Selangor 16,710 41,354 105 2005
Johor Specialist Hospital Johor 20,234 25,044 75 2005
Ipoh Specialist Hospital Perak 8,004 32,218 39 2005
Puteri Specialist Hospital Johor 6,680 12,173 32 2005
Selangor Medical Centre Selangor 18,894 19,459 na na
Tranche 2 170 Perdana Specialist Hospital Kelantan 8,283 13,628 36 2006
(2008) Kuantan Specialist Hospital Pahang 6,716 6,708 16 2007
Sentosa Medical Centre Kuala Lumpur 9,433 9,931 22 2007
KPJ Kajang Specialist Hospital Selangor 6,404 17,758 49 2007
Kedah Medical Centre Kedah 7,729 20,748 na na
Tranche 3 292 Seremban Specialist Hospital Negeri Sembilan 12,770 14,652 49 2008
(2009) Taiping Medical Centre Perak 4,439 3,642 3 2008
Kota Kinabalu Specialist Hospital Sabah 3,230 3,713 12 2007
Bukit Mertajam Specialist Hospital Pulau Pinang 12,456 3,917 10 2008
KPJ Penang Specialist Hospital Pulau Pinang 20,234 17,525 46 2008
Tawakal Hospital existing building Kuala Lumpur 2,531 11,141 36 2008
KPJ Tawakal Specialist Hospital Kuala Lumpur 12,331 31,228 81 2008
PNC International College of Nursing & Health Sciences Negeri Sembilan 19,224 11,940 na na
Tranche 4 139 Rumah Sakit Bumi Serpong Damai building Jakarta 12,000 22,112 na na
(2011 planned) Kluang Utama Specialist Hospital Johor 985 2,956 4 2010
Bandar Baru Klang Specialist Hospital Selangor 10,906 32,409 38 2010Note: Gross floor area as per Al-’Aqar Healthcare REIT website on 26 June 2011 Source: Company
Fig 52: Current property portfolio
Property Location Description Tenure Area
(sq m)
Net book value
(MYRm)
Hospitals
Kluang Utama Specialist Hospital Johor Land & private hospital building Leasehold 99 years expiring in 2100 985 3.5
Pasir Gudang Specialist Hospital Johor Land & building under development Leasehold 99 years expiring in 2108 13,142 7.1
KPJ Johor Specialist Hospital Johor Land under development Freehold 1,002 1.1
Maharani Specialist Hospital Bldg Johor Land & building under development Freehold 6,944 22.0
Hospital Pusrawi Selangor Clinic & office building Freehold 149 0.6
Bandar Baru Klang Specialist Hosp Selangor Land & building under development Leasehold 99 years expiring in 2093 10,906 38.0
Other
Tawakal Hospital Kuala Lumpur Car park Term in perpetuity 4,048 9.8
The Palladium, Unit No. 14-5-1 Kuala Lumpur Condominium Freehold 114 0.2
Building Kuala Lumpur Land & office building Term in perpetuity 981 & 851 0.7
Bungalow Kuala Lumpur Land & bungalow Term in perpetuity 1,282 0.9
Bangunan Pharmacare Kuala Lumpur Office Building Term in perpetuity 1,204 8.0
KPJ Selangor Specialist Hospital Selangor Vacant land Leasehold 99 years expiring in 2096 15,484 1.7
Building Selangor Commercial building Leasehold 99 years expiring in 2092 1,650 1.9
KPJ Damansara Specialist Hospital Selangor Vacant land Freehold 945 1.5
Building Selangor Land & double storey house Freehold 916 2.2
Nurse Hostel Johor Nurse hostel Freehold 2,027 1.4
Puteri Specialist Hospital Johor Temporary car park/office Leasehold 99 years expiring in 2053 1,596 1.8
Office Johor Temporary office Leasehold 99 years expiring in 2053 1,414 1.1Note: Properties as of 31 December 2010 Source: Company

KPJ Healthcare Berhad l 30 June 2011
l Equity Research l 30
Group financials
Income statement
Fig 53: Income statement MYRm FY2006 FY2007 FY2008 FY2009 FY2010 FY2011E FY2012E FY2013E
Group Revenue 831 1,108 1,267 1,456 1,655 1,920 2,179 2,473
Cost of goods sold (589) (781) (899) (1,037) (1,151) (1,335) (1,515) (1,712)
Gross profit 243 327 368 419 504 586 665 760
Selling, general, & admin. (152) (205) (229) (244) (313) (351) (399) (444)
Other income 17 13 16 12 12 13 13 14
EBITDA 108 136 155 187 203 247 279 330
Depreciation & amortisation (33) (43) (42) (46) (59) (70) (70) (87)
EBIT 75 93 114 140 144 178 209 243
Finance costs (20) (20) (19) (17) (14) (16) (16) (16)
Finance income - - - 3 7 6 11 9
Associates 5 12 19 19 30 32 33 35
Pretax profit 60 85 114 145 168 199 237 272
Zakat - - - (1) (1) (2) (2) (2)
Taxation (19) (7) (25) (29) (40) (50) (59) (67)
Minorities (0) (4) (4) (4) (7) (9) (10) (11)
Net profit 41 74 86 111 119 139 166 192
Net profit (adjusted) 41 74 86 111 119 139 164 186Source: Company, Standard Chartered Research estimates
Revenue
From 2000 to 2010, KPJ compounded its revenues at 29% p.a.. KPJ recorded exceptional growth of 129% in 2003 given it was the first full operational year following the completion of its corporate restructuring exercise undertaken in 4Q2002. For the restructuring, KPJ added 12 specialist hospitals and 5 support companies compared to only 2 hospitals at the beginning of 2002. We expect revenue to grow by 14% p.a. over the next three years to reach MYR2,473m in 2013E.
Fig 54: Revenue and revenue growth
0
500
1,000
1,500
2,000
2,500
2000 2001 2002 2003 2004 2005 2006 2007 2008 2009 2010 2011E 2012E 2013E
MY
Rm
0%
20%
40%
60%
80%
100%
120%
140%
Hospital Consultation
Pharmaceutical, medical & surgical products Other hospital income
Rvenue grow th (RHS)
Source: Company, Standard Chartered Research estimates
Profitability
Stable EBIT margin Over the last six years, KPJ reported an average EBIT margin of 8.9%. However, we expect EBIT margin to gradually improve to 9.6% in 2013E from 8.7% in 2010 as KPJ continues to gain economies of scale, and occupancy levels increase for the group.

KPJ Healthcare Berhad l 30 June 2011
l Equity Research l 31
Fig 55: EBIT margin
0
50
100
150
200
250
2005 2006 2007 2008 2009 2010 2011E 2012E 2013E
MY
Rm
0%
2%
4%
6%
8%
10%
EBIT (LHS) EBIT margin (RHS)
Source: Company, Standard Chartered Research estimates
Remarkable net profit growth From 2005 to 2010, KPJ’s net profit grew 29% p.a. We expect the group’s net profit to continue to grow at 16% p.a. over 2010-2013E as the group continues to expand its hospital network (1-2 per year) and average revenue per patient grows at 7% p.a. from 2011 to 2013.
Fig 56: Net profit and growth
0
25
50
75
100
125
150
175
200
2005 2006 2007 2008 2009 2010 2011E 2012E 2013E
MY
Rm
0%
10%
20%
30%
40%
50%
60%
70%
80%
90%
Net prof it (LHS) Net profit grow th (RHS)
Source: Company, Standard Chartered Research estimates

KPJ Healthcare Berhad l 30 June 2011
l Equity Research l 32
Balance sheet
Fig 57: Balance sheet MYRm FY2006 FY2007 FY2008 FY2009 FY2010 FY2011E FY2012E FY2013E
Assets
Property, plant & equipment 512 464 304 447 537 478 610 736
Goodwill & intangibles 101 100 110 116 136 136 136 136
Associates 180 167 227 239 307 339 373 408
Others 54 164 295 144 150 150 150 150
Long term assets 847 895 936 946 1,131 1,104 1,269 1,430
Cash & cash equivalents 95 100 106 144 197 362 315 287
Inventories 22 27 30 30 42 46 52 58
Receivables 131 153 195 243 298 307 348 395
Others 7 29 11 9 12 12 12 12
Total current assets 255 310 342 426 550 727 727 752
Total assets 1,102 1,205 1,278 1,372 1,680 1,831 1,996 2,182
Liabilities and Equity
Payables 173 210 236 261 308 359 408 461
Short term debt 52 91 114 95 399 399 399 399
Others 26 17 2 1 18 18 18 18
Current liabilities 251 318 352 356 725 776 824 878
Long term debt 323 307 268 303 37 37 37 37
Deferred income tax 31 14 19 23 41 41 41 41
Others 10 10 11 13 14 14 14 14
Total liabilities 615 650 650 695 817 868 916 969
Minorities 45 46 48 45 95 103 113 125
Shareholders funds 443 509 581 632 769 860 967 1,088
Total liabilities and equity 1,102 1,205 1,278 1,372 1,680 1,831 1,996 2,182Source: Company, Standard Chartered Research estimates
Fig 58: Assets – 1Q2011 Fig 59: Liabilities - 1Q2011
Fixed assets 33%
Other non-curr. Assets 35%
Receivables 18%
Inventories 3%
Cash 10%
Other curr. Assets 1%
Legend: segments listed clockwise from top
Creditors 17%
Total debt 24%
Other liabilities 7%
Equity 52%
Legend: segments listed clockwise from top
Source: Company Source: Company
Fixed assets accounted for only 33% of KPJ’s total assets in 1Q2011 reflecting the asset-light nature of the operations given the injection of hospitals into the Al-’Aqar REIT. KPJ’s capital structure was equally balanced between liabilities (48%) and equity (52%) at the end of 1Q2011.
Debt KPJ’s net gearing steadily decreased from 78% in 2005 to 23% in 2010 due to the strong cash flow of the business, particularly with the setup of Al-’Aqar REIT in 2006 allowing the group to dispose of its hospitals into the REIT.

KPJ Healthcare Berhad l 30 June 2011
l Equity Research l 33
Fig 60: Total debt and net gearing
0
50
100
150
200
250
300
350
400
450
2002 2003 2004 2005 2006 2007 2008 2009 2010
MY
Rm
0%
10%
20%
30%
40%
50%
60%
70%
80%
90%
Total debt (LHS) Net gearing (RHS)
Source: Company, Standard Chartered Research estimates
Cash flow
Fig 61: Cash flow statement MYRm FY2006 FY2007 FY2008 FY2009 FY2010 FY2011E FY2012E FY2013E
Cash flows from operating activities
Profit before tax 41 74 86 111 119 139 164 186
Depreciation & amortisation 32 42 41 46 59 70 70 87
(Gains)/loss on disposals (5) (1) (0) (6) (2) - - -
Interest income (1) (3) (6) (3) (7) (6) (11) (9)
Interest expenses 20 20 19 17 14 16 16 16
Share of profits of associates (5) (12) (19) (19) (24) (32) (33) (35)
Share options & other 23 15 45 39 48 60 71 80
Op. cash flow before working capital 105 136 165 186 207 247 277 324
Receivables (41) (29) (32) (36) (5) (8) (41) (47)
Inventories (5) (5) (3) (0) (7) (4) (6) (7)
Payables 37 36 16 21 44 51 48 53
Other (3) 2 2 - - - - -
Op. cash flow after working capital 93 140 148 172 238 286 278 324
Interest received 1 3 6 3 7 6 11 9
Interest paid (22) (22) (20) (17) (13) (16) (16) (16)
Zakat - - - (1) (1) (2) (2) (2)
Income taxes (17) (25) (5) (23) (36) (50) (59) (67)
Others - - 1 2 1 - - -
Net operating cash flow 56 96 130 135 195 224 212 248
Net capex (70) (101) (79) (9) (163) (11) (203) (213)
Others, investing 109 62 12 (57) (44) - - -
Issue of shares 4 5 0 2 55 - - -
Change in debt (78) 17 (27) 2 31 - - -
Dividends paid (16) (21) (26) (32) (26) (48) (57) (64)
Others, financing - - - 4 (0) - - -
Net cash flow 6 57 10 46 48 165 (47) (29)
Cash & equivalents at open 28 34 91 101 142 197 362 315
Net effect of exchange rate changes - - - (5) 2 - - -
Pledged fixed deposits 59 3 3 2 5 - - -
Bank overdrafts 3 6 2 0 0 - - -
Cash & equivalents as per bal. sheet 95 100 106 144 197 362 315 287
Free cash flow (14) (6) 51 127 33 213 10 36Source: Company, Standard Chartered Research estimates

KPJ Healthcare Berhad l 30 June 2011
l Equity Research l 34
Working capital cycle Historically, KPJ has had a negative working capital cycle due to long payable days (98 days in 2010). In 2010, receivable days were 66 and inventory days were 13, resulting in a working capital cycle of negative 19 days.
Fig 62: Working capital
-120-100-80-60-40-20
020406080
2005 2006 2007 2008 2009 2010 2011E 2012E 2013E
-40
-30
-20
-10
0
Inventory days (LHS) Receivables days (LHS) Payables days (LHS) WCC (RHS)
Source: Company, Standard Chartered Research estimates
Free cash flow After factoring in proceeds from disposals into Al-’Aqar REIT (net capex = capex + proceeds), KPJ has generated positive free cash flow since 2008. We expect the group to continue to generate free cash flow as the group’s larger base of hospitals provides steady cash flow to support expansionary capex.
Fig 63: Free cash flow
-250
-175
-100
-25
50
125
200
275
2005 2006 2007 2008 2009 2010 2011E 2012E 2013E
Operating cash flow Free cash f low Net capex
Source: Company, Standard Chartered Research estimates
Past capital raising
Fig 64: Previous capital raising Year Description Amount MYRm
2002 Rights issue 48.0
2003 Rights issue 10.6
2004 Exercise of share options 0.0
2005 Exercise of share options 0.1
2006 Exercise of share options 3.9
2007 Exercise of share options 5.0
2008 Exercise of share options 2.3
2009 Exercise of share options 2.1
2010 Issue of share warrants 54.9Source: Company

KPJ Healthcare Berhad l 30 June 2011
l Equity Research l 35
Corporate information
Shareholding structure
Johor Corporation, the investment arm of the Johor State Government, owns 42% of KPJ. The Employees Provident Fund owns 9.9%, Nomura Asset Management 8.9%, Skim Amanah Saham 8.9% and Kumpulan Waqaf 8.2%. Hence, the effective free float is only 22%.
Fig 65: Current shareholders
Johor Corporation 42.0%
Employees Provident Fund 9.9%
Nomura Asset Management 8.9%
Skim Amanah Saham 8.9%
Kumpulan Waqaf 8.2%
Free f loat 22.1%
Legend: segments listed clockw ise from top
Source: Bloomberg
Board of directors
Four of the 10 directors have served on the board since 1994. The board of KPJ comprises four main committees: audit committee, building committee, medical advisory committee, and remuneration and nomination committee.
Fig 66: Board of directors
Name Designation Audit committee
Remuneration & nomination committee
Year of appointment
No of shares held
Kamaruzzaman Abu Kassim Chairman n.a. Chairman 2011 n.a.
Datin Paduka Siti Sa’diah Sheikh Bakir Managing Director n.a. Member 1993 1,130,750
Tan Sri Dato’ Seri Arshad Ayub Independent NED Chairman n.a. 1994 3,716,000
Dr Yoong Fook Ngian Independent NED n.a. n.a. 2005 325,000
Rozan Mohd Sa’at Non Independent NED n.a. n.a. 2009 500
Ahamad Mohamad Non Independent NED n.a. n.a. 2005 750
Datuk Dr Hussein Awang Independent NED Member n.a. 1994 n.a.
Datuk Azzat Kamaludin Independent NED Member n.a. 1994 60,000
Zainah Mustafa Independent NED Member Member 2004 n.a.
Dr Kok Chin Leong Independent NED n.a. n.a. 2005 138,000 Source: Company, Bloomberg
Fig 67: Board service Name Designation 2004 2005 2006 2007 2008 2009 2010 2011
Kamaruzzaman Abu Kassim Chairman
Datin Paduka Siti Sa’diah Sheikh Bakir Managing Director
Tan Sri Dato’ Seri Arshad Ayub Independent NED
Dr Yoong Fook Ngian Independent NED
Rozan Mohd Sa’at Non Independent NED
Ahamad Mohamad Non Independent NED
Datuk Dr Hussein Awang Independent NED
Datuk Azzat Kamaludin Independent NED
Zainah Mustafa Independent NED
Dr Kok Chin Leong Independent NED
Source: Company
Effective free float is only 22%

KPJ Healthcare Berhad l 30 June 2011
l Equity Research l 36
Income statement (MYRm) Balance sheet (MYRm)Year end: Dec 2009 2010 2011E 2012E 2013E Year end: Dec 2009 2010 2011E 2012E 2013EGroup Revenue 1,456 1,655 1,920 2,179 2,473 Property, plant & equipment 447 537 478 610 736Cost of goods sold -1,037 -1,151 -1,335 -1,515 -1,712 Goodwill & intangibles 116 136 136 136 136Gross profit 419 504 586 665 760 Others 384 457 489 523 558SG&A -244 -313 -351 -399 -444 Long term assets 946 1,131 1,104 1,269 1,430Other income 12 12 13 13 14 C&CE 144 197 362 315 287EBITDA 187 203 247 279 330 STI - - - - - Depr. and amort. -46 -59 -70 -70 -87 Inventories 30 42 46 52 58EBIT 140 144 178 209 243 Receivables 243 298 307 348 395Finance income 3 7 6 11 9 Others 9 12 12 12 12Finance costs -17 -14 -16 -16 -16 Total current assets 426 550 727 727 752Associates 19 30 32 33 35 Total assets 1,372 1,680 1,831 1,996 2,182Pretax profit 145 168 199 237 272Zakat -1 -1 -2 -2 -2 Payables 261 308 359 408 461Taxation -29 -40 -50 -59 -67 ST debt 95 399 399 399 399Minorities -4 -7 -9 -10 -11 Others 1 18 18 18 18Net profit 111 119 139 164 186 Current liabilities 356 725 776 824 878Net profit (adjusted) 111 119 139 164 186 LT debt 303 37 37 37 37
Deferred income tax 23 41 41 41 41EPS basic (MYR sen) 21.7 22.6 24.7 29.1 32.9 Others 13 14 14 14 14EPS diluted (MYR sen) 21.7 20.3 21.2 25.0 28.3 Total liabilities 695 817 868 916 969DPS (MYR sen) 20.0 15.0 8.5 10.0 11.3 Minorities 45 95 103 113 125
Shareholders funds 632 769 860 967 1,088Gross liabilities + equity 1,372 1,680 1,831 1,996 2,182
Cash Flow (MYRm) Key ratiosYear end: Dec 2009 2010 2011E 2012E 2013E Year end: Dec 2009 2010 2011E 2012E 2013ECash flows from operating activities GrowthPAT 111 119 139 164 186 Revenue growth (%) 14.9 13.6 16.1 13.5 13.4Depreciations 46 59 70 70 87 Gross profit growth (%) 13.8 20.2 16.2 13.5 14.4Gains / Disposals -5 -3 - - - EBIT growth (%) 23.3 2.5 23.3 17.5 16.6Interest income -3 -7 -6 -11 -9 Diluted EPS growth (%) 6.1 -6.2 4.4 18.0 13.2Interest expenses 17 14 16 16 16 MarginsFX 0 0 - - - Gross profit margins (%) 28.8 30.5 30.5 30.5 30.8Share options & other 20 25 28 38 45 EBIT margins (%) 9.6 8.7 9.2 9.6 9.8Op CF, pre WC 186 207 247 277 324 Net profit margins (%) 7.6 7.2 7.2 7.5 7.5Receiveables -36 -5 -8 -41 -47 OthersInventories 0 -7 -4 -6 -7 Effective tax rate (%) 20.1 24.1 25.0 24.8 24.4Payables 21 44 51 48 53 Payout (%) 92.4 73.9 40.0 40.0 40.0Other - - - - - ProfitabilityOp CF, after WC 172 238 286 278 324 ROE (%) 18.3 17.0 17.1 18.0 18.1Interest received 4 8 6 11 9 ROCE (%) 12.5 11.8 12.2 13.1 13.5Interest paid -17 -13 -16 -16 -16 DebtIncome taxes -23 -36 -50 -59 -67 Net debt (m) 254 238 73 120 149Zakat -1 -1 -2 -2 -2 Net debt to equity (%) 37.5 27.6 7.6 11.1 12.3Net OP CF 135 195 224 212 248 Interest cover (x) 8.4 10.6 11.1 13.1 15.2Capex -222 -228 -150 -203 -213 ValuationsOther, investing 156 21 139 - - PER (x) 21.1 22.5 21.6 18.3 16.1Change in equity capital 6 55 - - - PBR (x) 3.1 3.3 3.0 2.7 2.4Change in debt 2 31 - - - EV/EBITDA (x) 15.6 14.4 11.8 10.4 8.8Dividends paid -32 -26 -48 -57 -64 Dividend yield (%) 4.4 3.3 1.9 2.2 2.5Others, financing - (0) - - - FCF Yield (%) -3.7 -1.2 2.5 0.3 1.2Net cash flow 46 48 165 -47 -29
Cash & equivalents at open 101 142 197 362 315Others -5 2 - - - Cash & equivalents at close 142 192 362 315 287
Free cashflow -86 -32 74 10 36 Source: Company, Standard Chartered Research estimates

KPJ Healthcare Berhad l 30 June 2011
l Equity Research l 37
This page is intentionally blank.

KPJ Healthcare Berhad l 30 June 2011
l Equity Research l 38
Disclosures appendix
Global disclaimer
The information and opinions in this report were prepared by Standard Chartered Bank (Hong Kong) Limited, Standard Chartered Bank Singapore Branch, Standard Chartered Securities (India) Limited and/or one or more of its affiliates (together with its group of companies, “SCB”) and the research analyst(s) named in this report. SCB makes no representation or warranty of any kind, express, implied or statutory regarding this document or any information contained or referred to in the document. DISCLOSURES INCLUDING THOSE REQUIRED BY THE UNITED STATES The research analysts responsible for the content of this research report certify that:
The view expressed and attributed to the research analyst or Analysts in the research report accurately reflect their personalopinion(s) about the subject securities and issuers and/or other subject matter as appropriate; and
No part of his or her compensation and other benefits was, is or will be directly related to the specific recommendations or viewscontained in this research report. On a general basis, the efficacy of recommendations is a factor in the performance appraisalsof analysts.
Our ratings are under constant review.
Additional information with respect to any securities referred to herein will be available upon request. THIS RESEARCH HAS NOT BEEN PRODUCED IN THE UNITED STATES. Disclosures Appendix Where “disclosure date” appears below, this means the day prior to the report date. All share prices quoted are the closing price for the business day prior to the date of the report, unless otherwise stated. Company Raffles Medical Group
As at the disclosure date, the following applies:
Raffles Medical Group - current rating is: OUTPERFORM
1.61.82.02.22.42.62.83.03.2
Jun 10 Jul 10 Aug 10 Sep 10 Oct 10 Nov 10 Dec 10 Jan 11 Feb 11 Mar 11 Apr 11 May 11 Jun 11 Jul 11
16/09/10 OP : SGD2.50
01/11/10 OP : SGD3.03
23/02/11 OP : SGD2.83
Source: FactSet prices / SCB ratings and price targets Company Healthway Medical Corp. Ltd.
As at the disclosure date, the following applies:
Healthway Medical Corp. Ltd. - current rating is: IN-LINE
0.08
0.10
0.12
0.14
0.16
0.18
0.20
Jun 10 Jul 10 Aug 10 Sep 10 Oct 10 Nov 10 Dec 10 Jan 11 Feb 11 Mar 11 Apr 11 May 11 Jun 11 Jul 11
16/09/10 IL : SGD0.19
28/04/11 IL : SGD0.12
Source: FactSet prices / SCB ratings and price targets

KPJ Healthcare Berhad l 30 June 2011
l Equity Research l 39
Recommendation Distribution and Investment Banking Relationships
% of covered companies currently assignedthis rating
% of companies assigned this rating with whichSCB has provided investment banking services overthe past 12 months
OUTPERFORM 62.0% 14.9%
IN-LINE 30.1% 10.0%
UNDERPERFORM 7.9% 8.8%
Research Recommendation Terminology Definitions
OUTPERFORM (OP) The total return on the security is expected to outperform the relevant market index by 5% or more over the next 12 months
IN-LINE (IL) The total return on the security is not expected to outperform or underperform the relevant market index by 5% or more over the next 12 months
UNDERPERFORM (UP) The total return on the security is expected to underperform the relevant market index by 5% or more over the next 12 months
SCB uses an investment horizon of 12 months for its price targets.

KPJ Healthcare Berhad l 30 June 2011
l Equity Research l 40
Country-Specific Disclosures If you are receiving this document in any of the countries listed below, please note the following: United Kingdom and European Economic Area: Standard Chartered Bank is authorised and regulated by the Financial Services Authority. This communication is not directed at Retail Clients in the European Economic Area as defined by Directive 2004/39/EC. Nothing in this document constitutes a personal recommendation or investment advice as defined by Directive 2004/39/EC. Australia: The Australian Financial Services Licence for Standard Chartered Bank is Licence No: 246833 with the following Australian Registered Business Number (ARBN: 097571778). Australian investors should note that this document was prepared for wholesale investors only (as defined by Australian Corporations legislation). Hong Kong: This document is being distributed in Hong Kong by, and is attributable to, Standard Chartered Bank (Hong Kong) Limited which is regulated by the Hong Kong Monetary Authority. India: This document is being distributed in India by Standard Chartered Securities (India) Limited which is a SEBI registered broker and a member of the Bombay Stock Exchange Limited and The National Stock Exchange of India Limited. Singapore: This document is being distributed in Singapore by Standard Chartered Bank Singapore Branch only to accredited investors, expert investors or institutional investors, as defined in the Securities and Futures Act, Chapter 289 of Singapore. Recipients in Singapore should contact Standard Chartered Bank Singapore Branch in relation to any matters arising from, or in connection with, this document. United States: Except for any documents relating to foreign exchange, FX or global FX, Rates or Commodities, distribution of this document in the United States or to US persons is intended to be solely to major institutional investors as defined in Rule 15a-6(a)(2) under the US Securities Act of 1934. All US persons that receive this document by their acceptance thereof represent and agree that they are a major institutional investor and understand the risks involved in executing transactions in securities. Any US recipient of this document wanting additional information or to effect any transaction in any security or financial instrument mentioned herein, must do so by contacting a registered representative of Standard Chartered Securities (North America) Inc., 1 Madison Avenue, New York, N.Y. 10010, US, tel + 1 212 667 0700. WE DO NOT OFFER OR SELL SECURITIES TO U.S. PERSONS UNLESS EITHER (A) THOSE SECURITIES ARE REGISTERED FOR SALE WITH THE U.S. SECURITIES AND EXCHANGE COMMISSION AND WITH ALL APPROPRIATE U.S. STATE AUTHORITIES; OR (B) THE SECURITIES OR THE SPECIFIC TRANSACTION QUALIFY FOR AN EXEMPTION UNDER THE U.S. FEDERAL AND STATE SECURITIES LAWS NOR DO WE OFFER OR SELL SECURITIES TO U.S. PERSONS UNLESS (i) WE, OUR AFFILIATED COMPANY AND THE APPROPRIATE PERSONNEL ARE PROPERLY REGISTERED OR LICENSED TO CONDUCT BUSINESS; OR (ii) WE, OUR AFFILIATED COMPANY AND THE APPROPRIATE PERSONNEL QUALIFY FOR EXEMPTIONS UNDER APPLICABLE U.S. FEDERAL AND STATE LAWS. GENERAL DISCLAIMER The information on this document is provided for information purposes only. It does not constitute any offer, recommendation or solicitation to any person to enter into any transaction or adopt any hedging, trading or investment strategy, nor does it constitute any prediction of likely future movements in rates or prices or any representation that any such future movements will not exceed those shown in any illustration. The stated price of the securities mentioned herein is as of the date indicated and is not any representation that any transaction can be effected at this price. While all reasonable care has been taken in preparing this document, no responsibility or liability is accepted for errors of fact or for any opinion expressed herein. The contents of this document may not be suitable for all investors as it has not been prepared with regard to the specific investment objectives or financial situation of any particular person. Any investments discussed may not be suitable for all investors. Users of this document should seek professional advice regarding the appropriateness of investing in any securities, financial instruments or investment strategies referred to in this document and should understand that statements regarding future prospects may not be realised. Opinions, forecasts, assumptions, estimates, derived valuations and price target(s) contained in this document are as of the date indicated and are subject to change at any time without prior notice. The value and income of any of the securities or financial instruments mentioned in this document can fall as well as rise and an investor may get back less than invested. Future returns are not guaranteed, and a loss of original capital may be incurred. Foreign-currency denominated securities and financial instruments are subject to fluctuation in exchange rates that could have a positive or adverse effect on the value, price or income of such securities and financial instruments. Past performance is not indicative of comparable future results and no representation or warranty is made regarding future performance. While we endeavour to update on a reasonable basis the information and opinions contained herein, there may be regulatory, compliance or other reasons that prevent us from doing so. Accordingly, information may be available to us which is not reflected in this material, and we may have acted upon or used the information prior to or immediately following its publication. SCB is not a legal or tax adviser, and is not purporting to provide you with legal or tax advice. If you have any queries as to the legal or tax implications of any investment you should seek independent legal and/or tax advice. SCB, and/or a connected company, may have a position in any of the securities, instruments or currencies mentioned in this document. SCB has in place policies and procedures and physical information walls between its Research Department and differing public and private business functions to help ensure confidential information, including ‘inside’ information is not publicly disclosed unless in line with its policies and procedures and the rules of its regulators. Data, opinions and other information appearing herein may have been obtained from public sources. SCB makes no representation or warranty as to the accuracy or completeness of such information obtained from public sources. You are advised to make your own independent judgment (with the advice of your professional advisers as necessary) with respect to any matter contained herein and not rely on this document as the basis for making any trading, hedging or investment decision. SCB and/or any member of the SCB group of companies or its respective officers, directors, employee benefit programmes or employees, including persons involved in the preparation or issuance of this document may at any time, to the extent permitted by applicable law and/or regulation, be long or short any securities or financial instruments referred to in this document and on the website or have a material interest in any such securities or related investment, or may be the only market maker in relation to such investments, or provide, or have provided advice, investment banking or other services, to issuers of such investments. Within the last three years, SCB may also have acted as manager or co-manager for a public offering of securities of issuers referred to herein. SCB may have received or may expect to receive remuneration for investment banking services from companies mentioned herein. SCB accepts no liability and will not be liable for any loss or damage arising directly or indirectly (including special, incidental, consequential, punitive or exemplary damages) from your use of this document, howsoever arising, and including any loss, damage or expense arising from, but not limited to, any defect, error, imperfection, fault, mistake or inaccuracy with this document, its contents or associated services, or due to any unavailability of the document or any part thereof or any contents or associated services. This material is for the use of intended recipients only and the contents may not be reproduced, redistributed, or copied in whole or in part for any purpose without SCB’s prior express consent. In any jurisdiction in which distribution to private/retail customers would require registration or licensing of the distributor which the distributor does not currently have, this document is intended solely for distribution to professional and institutional investors. Copyright: Standard Chartered Bank 2011. Copyright in all materials, text, articles and information contained herein is the property of, and may only be reproduced with permission of an authorised signatory of, Standard Chartered Bank. Copyright in materials created by third parties and the rights under copyright of such parties are hereby acknowledged. Copyright in all other materials not belonging to third parties and copyright in these materials as a compilation vests and shall remain at all times copyright of Standard Chartered Bank and should not be reproduced or used except for business purposes on behalf of Standard Chartered Bank or save with the express prior written consent of an authorised signatory of Standard Chartered Bank. All rights reserved. © Standard Chartered Bank 2011.
Related Documents