A Joint Publication of the Association of International Pharmaceutical Manufacturers in Russia and Group of Companies Remedium MACROECONOMIC INDICES Inflation According to Federal State Statistics Service’s data, in February 2013, the Consumer Price Index was estimated as 100.6% compared to the previ- ous month For the period from start of the year, it escalated to 101.5% (in January-February 2012 – 100.9%). In February, the Industrial Producer Price Index was 100.8%, whereas a month ago it amounted to 99.6%. Figure 1. Consumer Price Index (compared with the previous period) Living standard According to preliminary Federal State Statistics Service’s data, in Febru- ary 2013 a gross monthly average salary per worker reached RUB 27,110 (USD 885.37) which accounted for 101.0% compared to the previous month and 112.6% compared to February 2012. The real salary in Febru- ary 2013 accounted for 105.0% as compared with the same period in 2012. In February 2013, the real value of cash incomes accounted for 105.7% compared to the same period of 2012 (Fig. 2). Retail turnover In February 2012 the retail turnover was equal to RUB 1,675.3 bln, which in stock accounted for 102.5% as compared to the same period a year ago (Fig. 2) Figure 2. Real values of cash incomes, salary and retail turnover in Feb- ruary 2013 Manufacture of industrial products According to Federal State Statistics Service’s data, in February 2013 the Industrial Production Index accounted for 97.9% compared to the same period a year ago, 99.2% to the previous period of 2013, 98.5% in Janu- ary-February 2013. Domestic production The top 10 domestic manufacturers by production volume at February- end 2013 are shown in Table 1. The total production volume by top ten manufacturers was estimated at USD 244.9 mln. Table 1. Top ten chemical and pharmaceutical manufacturers by pro- duction volume in February 2013. Rank Manufacturer Production volume, $mln 1 Pharmstandart 91.0 2 Stada 29.6 3 Valenta 23.8 4 KRKA-RUS 20.4 5 Akrihin 16.2 6 Materia Medica 15.2 7 Sotex 14.8 8 Pharm-Center 14.8 9 Microgen 9.8 10 Polisan 9.4 Table 2 provides pharmacy sales data from 10 regions of the Russian Federation. In January 2013 compared to December 2012, reduction in pharmacy sales (in terms of roubles) was observed in all analysed re- gions. The lowest performance was observed in Moscow (-22%), the highest one in Tatarstan (-3%). Table 2. Pharmacy sales in the regions, 2012-2013 Region Pharmacy sales, $mn (whole- sale prices) Growth gain, % (roubles) Nov 2012 Dec2012 Jan2013 Nov/ October 2012 Dec/ November 2012 Jan13/ Dec2012 Moscow 185.6 228.2 181.0 0.5% 20% -22% St Petersburg 45.9 56.6 49.5 -10% 20% -13% Krasnodarsky Krai 36.1 38.8 35.1 -4% 5% -11% Novosibirsk aya Oblast 22.3 26.3 24.9 0% 16% -7% Tatarstan 27.3 32.4 31.7 -15% 16% -3% Krasnoyarsky Krai 19.1 21.7 19.3 -3% 11% -12% Rostov skaya Oblast 23.9 26.8 23.2 -6% 9% -15% Voronezhskaya Oblast 17.9 19.8 18.0 -8% 9% -10% Perm 6.9 7.6 7.3 49% 9% -6% Tyumen 6.6 8.0 7.6 -10% 18% -5% Advertising The largest advertisers and pharmaceutical trade names highly publicized in mass media (TV, radio, press, outdoor advertising) are shown in Tables 3 & 4. Table 3. Top five advertisers in mass media in February 2013 Rank Company* Quantity of broad- casts 1 Novartis 10,314 2 Pharmstandart 8,107 3 Berlin-Chemie Menarini Group 5,970 4 Evalar 5,758 5 Bayer AG 5,440 Source – TNS Gallup AdFact Table 4. Top five trade names in mass media in February, 2013 Rank Trade name* Quantity of broad- casts 1 Evalar 5,758 2 Grippferon 2,312 3 Supradin 2,087 4 Arbidol 1,877 5 ACC 1,601 Source – TNS Gallup AdFact * Only products registered with State Register of Medicines were considered 100,5% 100,4% 101,0% 100,6% 100% 101% 102% January February 2012 2013

Welcome message from author
This document is posted to help you gain knowledge. Please leave a comment to let me know what you think about it! Share it to your friends and learn new things together.
Transcript

A Joint Publication of the Association of International Pharmaceutical Manufacturers in Russia and Group of Companies Remedium
MACROECONOMIC INDICES
Inflation
According to Federal State Statistics Service’s data, in February 2013, the Consumer Price Index was estimated as 100.6% compared to the previ-ous month For the period from start of the year, it escalated to 101.5% (in January-February 2012 – 100.9%).
In February, the Industrial Producer Price Index was 100.8%, whereas a month ago it amounted to 99.6%.
Figure 1. Consumer Price Index (compared with the previous period)
Living standard
According to preliminary Federal State Statistics Service’s data, in Febru-ary 2013 a gross monthly average salary per worker reached RUB 27,110 (USD 885.37) which accounted for 101.0% compared to the previous month and 112.6% compared to February 2012. The real salary in Febru-ary 2013 accounted for 105.0% as compared with the same period in 2012. In February 2013, the real value of cash incomes accounted for 105.7% compared to the same period of 2012 (Fig. 2).
Retail turnover
In February 2012 the retail turnover was equal to RUB 1,675.3 bln, which in stock accounted for 102.5% as compared to the same period a year ago (Fig. 2)
Figure 2. Real values of cash incomes, salary and retail turnover in Feb-ruary 2013
Manufacture of industrial products
According to Federal State Statistics Service’s data, in February 2013 the Industrial Production Index accounted for 97.9% compared to the same period a year ago, 99.2% to the previous period of 2013, 98.5% in Janu-ary-February 2013.
Domestic production
The top 10 domestic manufacturers by production volume at February-end 2013 are shown in Table 1. The total production volume by top ten manufacturers was estimated at USD 244.9 mln.
Table 1. Top ten chemical and pharmaceutical manufacturers by pro-duction volume in February 2013.
Rank Manufacturer Production volume,
$mln 1 Pharmstandart 91.0 2 Stada 29.6 3 Valenta 23.8 4 KRKA-RUS 20.4 5 Akrihin 16.2 6 Materia Medica 15.2 7 Sotex 14.8 8 Pharm-Center 14.8 9 Microgen 9.8 10 Polisan 9.4
Table 2 provides pharmacy sales data from 10 regions of the Russian Federation. In January 2013 compared to December 2012, reduction in pharmacy sales (in terms of roubles) was observed in all analysed re-gions. The lowest performance was observed in Moscow (-22%), the highest one in Tatarstan (-3%).
Table 2. Pharmacy sales in the regions, 2012-2013
Region
Pharmacy sales, $mn (whole-sale prices)
Growth gain, % (roubles)
Nov 2012 Dec2012 Jan2013 Nov/
October 2012
Dec/ November
2012
Jan13/ Dec2012
Moscow 185.6 228.2 181.0 0.5% 20% -22% St Petersburg 45.9 56.6 49.5 -10% 20% -13% Krasnodarsky Krai
36.1 38.8 35.1 -4% 5% -11%
Novosibirsk aya Oblast
22.3 26.3 24.9 0% 16% -7%
Tatarstan 27.3 32.4 31.7 -15% 16% -3% Krasnoyarsky Krai
19.1 21.7 19.3 -3% 11% -12%
Rostov skaya Oblast
23.9 26.8 23.2 -6% 9% -15%
Voronezhskaya Oblast
17.9 19.8 18.0 -8% 9% -10%
Perm 6.9 7.6 7.3 49% 9% -6% Tyumen 6.6 8.0 7.6 -10% 18% -5%
Advertising
The largest advertisers and pharmaceutical trade names highly publicized in mass media (TV, radio, press, outdoor advertising) are shown in Tables 3 & 4.
Table 3. Top five advertisers in mass media in February 2013
Rank Company* Quantity of broad-
casts 1 Novartis 10,314 2 Pharmstandart 8,107 3 Berlin-Chemie Menarini Group 5,970 4 Evalar 5,758 5 Bayer AG 5,440
Source – TNS Gallup AdFact
Table 4. Top five trade names in mass media in February, 2013
Rank Trade name* Quantity of broad-
casts 1 Evalar 5,758 2 Grippferon 2,312 3 Supradin 2,087 4 Arbidol 1,877 5 ACC 1,601
Source – TNS Gallup AdFact
* Only products registered with State Register of Medicines were considered
100,5% 100,4%
101,0%
100,6%
100%
101%
102%
January February
2012 2013
AIPM - Remedium Market Bulletin, page 2 Issue 3, March 2013
KAZAKHSTAN PHARMACY MARKET: 2012 RESULTS
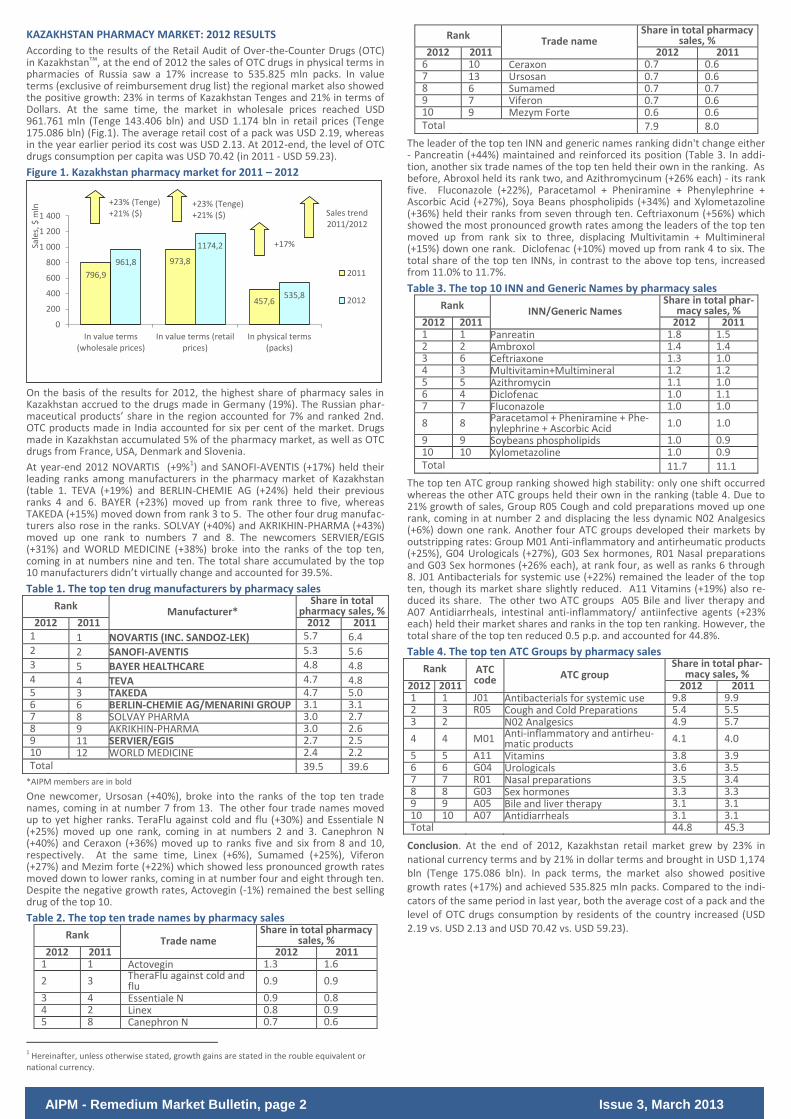
According to the results of the Retail Audit of Over-the-Counter Drugs (OTC) in Kazakhstanтм, at the end of 2012 the sales of OTC drugs in physical terms in pharmacies of Russia saw a 17% increase to 535.825 mln packs. In value terms (exclusive of reimbursement drug list) the regional market also showed the positive growth: 23% in terms of Kazakhstan Tenges and 21% in terms of Dollars. At the same time, the market in wholesale prices reached USD 961.761 mln (Tenge 143.406 bln) and USD 1.174 bln in retail prices (Tenge 175.086 bln) (Fig.1). The average retail cost of a pack was USD 2.19, whereas in the year earlier period its cost was USD 2.13. At 2012-end, the level of OTC drugs consumption per capita was USD 70.42 (in 2011 - USD 59.23).
Figure 1. Kazakhstan pharmacy market for 2011 – 2012
On the basis of the results for 2012, the highest share of pharmacy sales in Kazakhstan accrued to the drugs made in Germany (19%). The Russian phar-maceutical products’ share in the region accounted for 7% and ranked 2nd. OTC products made in India accounted for six per cent of the market. Drugs made in Kazakhstan accumulated 5% of the pharmacy market, as well as OTC drugs from France, USA, Denmark and Slovenia.
At year-end 2012 NOVARTIS (+9%1) and SANOFI-AVENTIS (+17%) held their leading ranks among manufacturers in the pharmacy market of Kazakhstan (table 1. TEVA (+19%) and BERLIN-CHEMIE AG (+24%) held their previous ranks 4 and 6. BAYER (+23%) moved up from rank three to five, whereas TAKEDA (+15%) moved down from rank 3 to 5. The other four drug manufac-turers also rose in the ranks. SOLVAY (+40%) and AKRIKHIN-PHARMA (+43%) moved up one rank to numbers 7 and 8. The newcomers SERVIER/EGIS (+31%) and WORLD MEDICINE (+38%) broke into the ranks of the top ten, coming in at numbers nine and ten. The total share accumulated by the top 10 manufacturers didn’t virtually change and accounted for 39.5%.
Table 1. The top ten drug manufacturers by pharmacy sales
Rank Manufacturer*
Share in total pharmacy sales, %
2012 2011 2012 2011 1 1 NOVARTIS (INC. SANDOZ-LEK) 5.7 6.4 2 2 SANOFI-AVENTIS 5.3 5.6 3 5 BAYER HEALTHCARE 4.8 4.8 4 4 TEVA 4.7 4.8 5 3 TAKEDA 4.7 5.0 6 6 BERLIN-CHEMIE AG/MENARINI GROUP 3.1 3.1 7 8 SOLVAY PHARMA 3.0 2.7 8 9 AKRIKHIN-PHARMA 3.0 2.6 9 11 SERVIER/EGIS 2.7 2.5 10 12 WORLD MEDICINE 2.4 2.2 Total 39.5 39.6
*AIPM members are in bold
One newcomer, Ursosan (+40%), broke into the ranks of the top ten trade names, coming in at number 7 from 13. The other four trade names moved up to yet higher ranks. TeraFlu against cold and flu (+30%) and Essentiale N (+25%) moved up one rank, coming in at numbers 2 and 3. Canephron N (+40%) and Ceraxon (+36%) moved up to ranks five and six from 8 and 10, respectively. At the same time, Linex (+6%), Sumamed (+25%), Viferon (+27%) and Mezim forte (+22%) which showed less pronounced growth rates moved down to lower ranks, coming in at number four and eight through ten. Despite the negative growth rates, Actovegin (-1%) remained the best selling drug of the top 10.
Table 2. The top ten trade names by pharmacy sales
Rank Trade name
Share in total pharmacy sales, %
2012 2011 2012 2011 1 1 Actovegin 1.3 1.6
2 3 TheraFlu against cold and flu 0.9 0.9
3 4 Essentiale N 0.9 0.8 4 2 Linex 0.8 0.9 5 8 Canephron N 0.7 0.6
1 Hereinafter, unless otherwise stated, growth gains are stated in the rouble equivalent or national currency.
Rank Trade name
Share in total pharmacy sales, %
2012 2011 2012 2011 6 10 Ceraxon 0.7 0.6 7 13 Ursosan 0.7 0.6 8 6 Sumamed 0.7 0.7 9 7 Viferon 0.7 0.6 10 9 Mezym Forte 0.6 0.6 Total 7.9 8.0
The leader of the top ten INN and generic names ranking didn't change either - Pancreatin (+44%) maintained and reinforced its position (Table 3. In addi-tion, another six trade names of the top ten held their own in the ranking. As before, Abroxol held its rank two, and Azithromycinum (+26% each) - its rank five. Fluconazole (+22%), Paracetamol + Pheniramine + Phenylephrine + Ascorbic Acid (+27%), Soya Beans phospholipids (+34%) and Xylometazoline (+36%) held their ranks from seven through ten. Ceftriaxonum (+56%) which showed the most pronounced growth rates among the leaders of the top ten moved up from rank six to three, displacing Multivitamin + Multimineral (+15%) down one rank. Diclofenac (+10%) moved up from rank 4 to six. The total share of the top ten INNs, in contrast to the above top tens, increased from 11.0% to 11.7%.
Table 3. The top 10 INN and Generic Names by pharmacy sales
Rank INN/Generic Names
Share in total phar-macy sales, %
2012 2011 2012 2011 1 1 Panreatin 1.8 1.5 2 2 Ambroxol 1.4 1.4 3 6 Ceftriaxone 1.3 1.0 4 3 Multivitamin+Multimineral 1.2 1.2 5 5 Azithromycin 1.1 1.0 6 4 Diclofenac 1.0 1.1 7 7 Fluconazole 1.0 1.0
8 8 Paracetamol + Pheniramine + Phe-nylephrine + Ascorbic Acid 1.0 1.0
9 9 Soybeans phospholipids 1.0 0.9 10 10 Xylometazoline 1.0 0.9 Total 11.7 11.1
The top ten ATC group ranking showed high stability: only one shift occurred whereas the other ATC groups held their own in the ranking (table 4. Due to 21% growth of sales, Group R05 Cough and cold preparations moved up one rank, coming in at number 2 and displacing the less dynamic N02 Analgesics (+6%) down one rank. Another four ATC groups developed their markets by outstripping rates: Group M01 Anti-inflammatory and antirheumatic products (+25%), G04 Urologicals (+27%), G03 Sex hormones, R01 Nasal preparations and G03 Sex hormones (+26% each), at rank four, as well as ranks 6 through 8. J01 Antibacterials for systemic use (+22%) remained the leader of the top ten, though its market share slightly reduced. A11 Vitamins (+19%) also re-duced its share. The other two ATC groups A05 Bile and liver therapy and A07 Antidiarrheals, intestinal anti-inflammatory/ antiinfective agents (+23% each) held their market shares and ranks in the top ten ranking. However, the total share of the top ten reduced 0.5 p.p. and accounted for 44.8%.
Table 4. The top ten ATC Groups by pharmacy sales
Rank ATC code ATC group
Share in total phar-macy sales, %
2012 2011 2012 2011 1 1 J01 Antibacterials for systemic use 9.8 9.9 2 3 R05 Cough and Cold Preparations 5.4 5.5 3 2 N02 Analgesics 4.9 5.7
4 4 M01 Anti-inflammatory and antirheu-matic products 4.1 4.0
5 5 A11 Vitamins 3.8 3.9 6 6 G04 Urologicals 3.6 3.5 7 7 R01 Nasal preparations 3.5 3.4 8 8 G03 Sex hormones 3.3 3.3 9 9 A05 Bile and liver therapy 3.1 3.1 10 10 A07 Antidiarrheals 3.1 3.1 Total 44.8 45.3
Conclusion. At the end of 2012, Kazakhstan retail market grew by 23% in national currency terms and by 21% in dollar terms and brought in USD 1,174 bln (Tenge 175.086 bln). In pack terms, the market also showed positive growth rates (+17%) and achieved 535.825 mln packs. Compared to the indi-cators of the same period in last year, both the average cost of a pack and the level of OTC drugs consumption by residents of the country increased (USD 2.19 vs. USD 2.13 and USD 70.42 vs. USD 59.23).
796,9
973,8
457,6
961,8
1174,2
535,8
0
200
400
600
800
1 000
1 200
1 400
In value terms(wholesale prices)
In value terms (retailprices)
In physical terms(packs)
Sale
s, $
mln
2011
2012
+17%
Sales trend 2011/2012
+23% (Tenge) +21% ($)
+23% (Tenge) +21% ($)
AIPM - Remedium Market Bulletin, page 3 Issue 3, March 2013
PHARMACY OTC MARKET IN RUSSIA: 2012 RESULTS
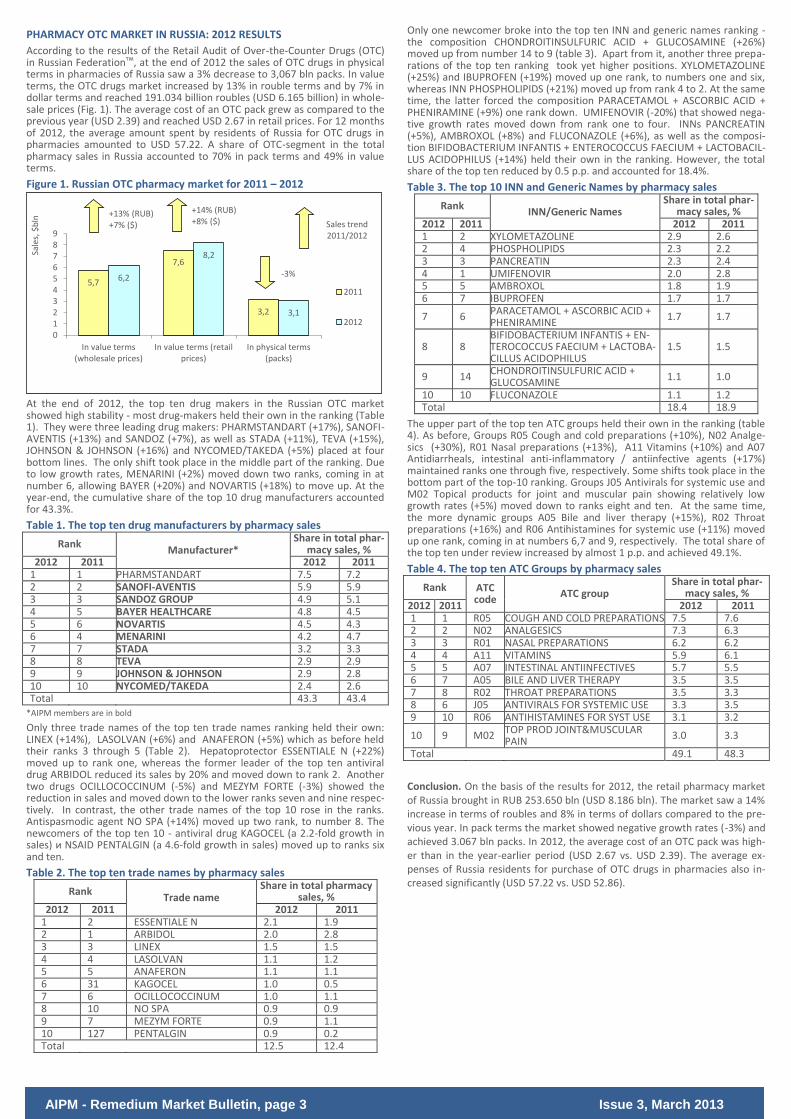
According to the results of the Retail Audit of Over-the-Counter Drugs (OTC) in Russian Federationтм, at the end of 2012 the sales of OTC drugs in physical terms in pharmacies of Russia saw a 3% decrease to 3,067 bln packs. In value terms, the OTC drugs market increased by 13% in rouble terms and by 7% in dollar terms and reached 191.034 billion roubles (USD 6.165 billion) in whole-sale prices (Fig. 1). The average cost of an OTC pack grew as compared to the previous year (USD 2.39) and reached USD 2.67 in retail prices. For 12 months of 2012, the average amount spent by residents of Russia for OTC drugs in pharmacies amounted to USD 57.22. A share of OTC-segment in the total pharmacy sales in Russia accounted to 70% in pack terms and 49% in value terms.
Figure 1. Russian OTC pharmacy market for 2011 – 2012
At the end of 2012, the top ten drug makers in the Russian OTC market showed high stability - most drug-makers held their own in the ranking (Table 1). They were three leading drug makers: PHARMSTANDART (+17%), SANOFI-AVENTIS (+13%) and SANDOZ (+7%), as well as STADA (+11%), TEVA (+15%), JOHNSON & JOHNSON (+16%) and NYCOMED/TAKEDA (+5%) placed at four bottom lines. The only shift took place in the middle part of the ranking. Due to low growth rates, MENARINI (+2%) moved down two ranks, coming in at number 6, allowing BAYER (+20%) and NOVARTIS (+18%) to move up. At the year-end, the cumulative share of the top 10 drug manufacturers accounted for 43.3%.
Table 1. The top ten drug manufacturers by pharmacy sales
Rank Manufacturer*
Share in total phar-macy sales, %
2012 2011 2012 2011 1 1 PHARMSTANDART 7.5 7.2 2 2 SANOFI-AVENTIS 5.9 5.9 3 3 SANDOZ GROUP 4.9 5.1 4 5 BAYER HEALTHCARE 4.8 4.5 5 6 NOVARTIS 4.5 4.3 6 4 MENARINI 4.2 4.7 7 7 STADA 3.2 3.3 8 8 TEVA 2.9 2.9 9 9 JOHNSON & JOHNSON 2.9 2.8 10 10 NYCOMED/TAKEDA 2.4 2.6 Total 43.3 43.4
*AIPM members are in bold
Only three trade names of the top ten trade names ranking held their own: LINEX (+14%), LASOLVAN (+6%) and ANAFERON (+5%) which as before held their ranks 3 through 5 (Table 2). Hepatoprotector ESSENTIALE N (+22%) moved up to rank one, whereas the former leader of the top ten antiviral drug ARBIDOL reduced its sales by 20% and moved down to rank 2. Another two drugs OCILLOCOCCINUM (-5%) and MEZYM FORTE (-3%) showed the reduction in sales and moved down to the lower ranks seven and nine respec-tively. In contrast, the other trade names of the top 10 rose in the ranks. Antispasmodic agent NO SPA (+14%) moved up two rank, to number 8. The newcomers of the top ten 10 - antiviral drug KAGOCEL (a 2.2-fold growth in sales) и NSAID PENTALGIN (a 4.6-fold growth in sales) moved up to ranks six and ten.
Table 2. The top ten trade names by pharmacy sales
Rank Trade name
Share in total pharmacy sales, %
2012 2011 2012 2011 1 2 ESSENTIALE N 2.1 1.9 2 1 ARBIDOL 2.0 2.8 3 3 LINEX 1.5 1.5 4 4 LASOLVAN 1.1 1.2 5 5 ANAFERON 1.1 1.1 6 31 KAGOCEL 1.0 0.5 7 6 OCILLOCOCCINUM 1.0 1.1 8 10 NO SPA 0.9 0.9 9 7 MEZYM FORTE 0.9 1.1 10 127 PENTALGIN 0.9 0.2 Total 12.5 12.4
Only one newcomer broke into the top ten INN and generic names ranking - the composition CHONDROITINSULFURIC ACID + GLUCOSAMINE (+26%) moved up from number 14 to 9 (table 3). Apart from it, another three prepa-rations of the top ten ranking took yet higher positions. XYLOMETAZOLINE (+25%) and IBUPROFEN (+19%) moved up one rank, to numbers one and six, whereas INN PHOSPHOLIPIDS (+21%) moved up from rank 4 to 2. At the same time, the latter forced the composition PARACETAMOL + ASCORBIC ACID + PHENIRAMINE (+9%) one rank down. UMIFENOVIR (-20%) that showed nega-tive growth rates moved down from rank one to four. INNs PANCREATIN (+5%), AMBROXOL (+8%) and FLUCONAZOLE (+6%), as well as the composi-tion BIFIDOBACTERIUM INFANTIS + ENTEROCOCCUS FAECIUM + LACTOBACIL-LUS ACIDOPHILUS (+14%) held their own in the ranking. However, the total share of the top ten reduced by 0.5 p.p. and accounted for 18.4%.
Table 3. The top 10 INN and Generic Names by pharmacy sales
Rank INN/Generic Names
Share in total phar-macy sales, %
2012 2011 2012 2011 1 2 XYLOMETAZOLINE 2.9 2.6 2 4 PHOSPHOLIPIDS 2.3 2.2 3 3 PANCREATIN 2.3 2.4 4 1 UMIFENOVIR 2.0 2.8 5 5 AMBROXOL 1.8 1.9 6 7 IBUPROFEN 1.7 1.7
7 6 PARACETAMOL + ASCORBIC ACID + PHENIRAMINE
1.7 1.7
8 8 BIFIDOBACTERIUM INFANTIS + EN-TEROCOCCUS FAECIUM + LACTOBA-CILLUS ACIDOPHILUS
1.5 1.5
9 14 CHONDROITINSULFURIC ACID + GLUCOSAMINE
1.1 1.0
10 10 FLUCONAZOLE 1.1 1.2 Total 18.4 18.9
The upper part of the top ten ATC groups held their own in the ranking (table 4). As before, Groups R05 Cough and cold preparations (+10%), N02 Analge-sics (+30%), R01 Nasal preparations (+13%), A11 Vitamins (+10%) and A07 Antidiarrheals, intestinal anti-inflammatory / antiinfective agents (+17%) maintained ranks one through five, respectively. Some shifts took place in the bottom part of the top-10 ranking. Groups J05 Antivirals for systemic use and M02 Topical products for joint and muscular pain showing relatively low growth rates (+5%) moved down to ranks eight and ten. At the same time, the more dynamic groups A05 Bile and liver therapy (+15%), R02 Throat preparations (+16%) and R06 Antihistamines for systemic use (+11%) moved up one rank, coming in at numbers 6,7 and 9, respectively. The total share of the top ten under review increased by almost 1 p.p. and achieved 49.1%.
Table 4. The top ten ATC Groups by pharmacy sales
Rank ATC code
ATC group Share in total phar-
macy sales, % 2012 2011 2012 2011 1 1 R05 COUGH AND COLD PREPARATIONS 7.5 7.6 2 2 N02 ANALGESICS 7.3 6.3 3 3 R01 NASAL PREPARATIONS 6.2 6.2 4 4 A11 VITAMINS 5.9 6.1 5 5 A07 INTESTINAL ANTIINFECTIVES 5.7 5.5 6 7 A05 BILE AND LIVER THERAPY 3.5 3.5 7 8 R02 THROAT PREPARATIONS 3.5 3.3 8 6 J05 ANTIVIRALS FOR SYSTEMIC USE 3.3 3.5 9 10 R06 ANTIHISTAMINES FOR SYST USE 3.1 3.2
10 9 M02 TOP PROD JOINT&MUSCULAR PAIN
3.0 3.3
Total 49.1 48.3
Conclusion. On the basis of the results for 2012, the retail pharmacy market of Russia brought in RUB 253.650 bln (USD 8.186 bln). The market saw a 14% increase in terms of roubles and 8% in terms of dollars compared to the pre-vious year. In pack terms the market showed negative growth rates (-3%) and achieved 3.067 bln packs. In 2012, the average cost of an OTC pack was high-er than in the year-earlier period (USD 2.67 vs. USD 2.39). The average ex-penses of Russia residents for purchase of OTC drugs in pharmacies also in-creased significantly (USD 57.22 vs. USD 52.86).
5,7
7,6
3,2
6,2
8,2
3,1
0123456789
In value terms(wholesale prices)
In value terms (retailprices)
In physical terms(packs)
Sale
s, $
bln
2011
2012
-3%
Sales trend 2011/2012
+14% (RUB) +8% ($)
+13% (RUB) +7% ($)
AIPM - Remedium Market Bulletin, page 4 Issue 3, March 2013
RUSSIAN BIOLIGICALLY ACTIVE ADDITIVE (BAA) MARKET: 2012 RESULTS
According to the results of the Retail Audit of BAA in Russian Federa-tion
тм, at year-end 2012 the volume of pharmacy sales in Russia
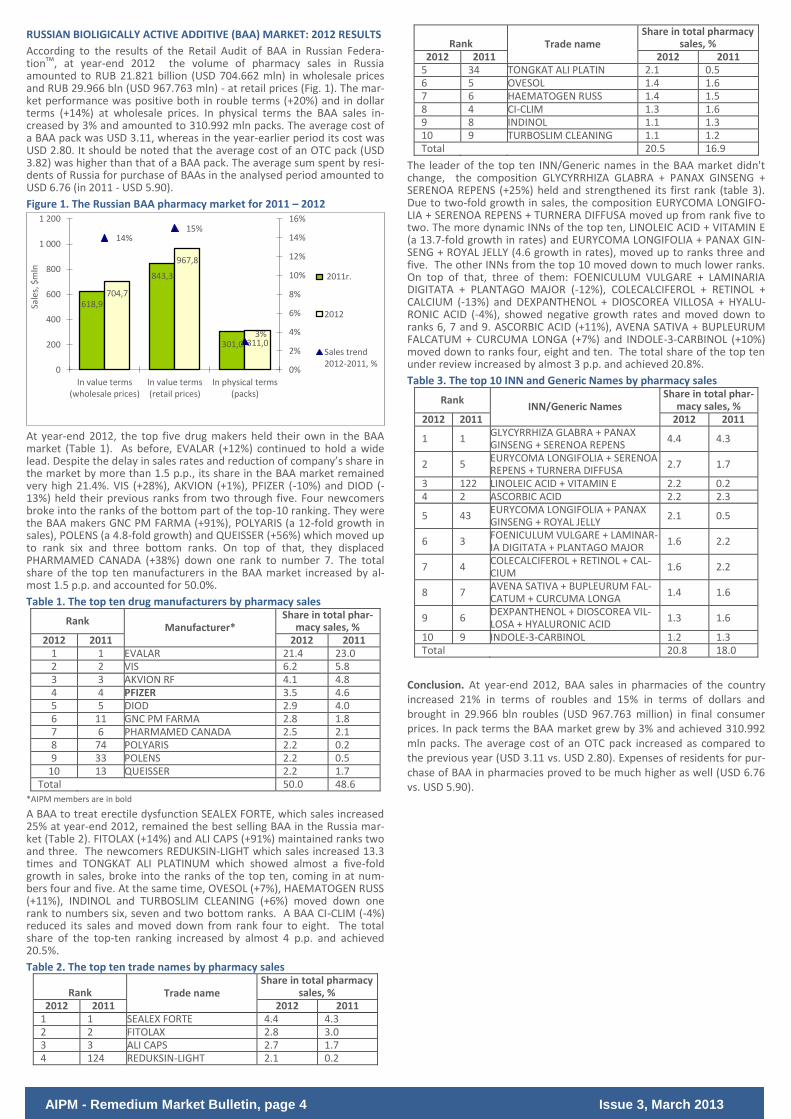
amounted to RUB 21.821 billion (USD 704.662 mln) in wholesale prices and RUB 29.966 bln (USD 967.763 mln) - at retail prices (Fig. 1). The mar-ket performance was positive both in rouble terms (+20%) and in dollar terms (+14%) at wholesale prices. In physical terms the BAA sales in-creased by 3% and amounted to 310.992 mln packs. The average cost of a BAA pack was USD 3.11, whereas in the year-earlier period its cost was USD 2.80. It should be noted that the average cost of an OTC pack (USD 3.82) was higher than that of a BAA pack. The average sum spent by resi-dents of Russia for purchase of BAAs in the analysed period amounted to USD 6.76 (in 2011 - USD 5.90).
Figure 1. The Russian BAA pharmacy market for 2011 – 2012
At year-end 2012, the top five drug makers held their own in the BAA market (Table 1). As before, EVALAR (+12%) continued to hold a wide lead. Despite the delay in sales rates and reduction of company’s share in the market by more than 1.5 p.p., its share in the BAA market remained very high 21.4%. VIS (+28%), AKVION (+1%), PFIZER (-10%) and DIOD (-13%) held their previous ranks from two through five. Four newcomers broke into the ranks of the bottom part of the top-10 ranking. They were the BAA makers GNC PM FARMA (+91%), POLYARIS (a 12-fold growth in sales), POLENS (a 4.8-fold growth) and QUEISSER (+56%) which moved up to rank six and three bottom ranks. On top of that, they displaced PHARMAMED CANADA (+38%) down one rank to number 7. The total share of the top ten manufacturers in the BAA market increased by al-most 1.5 p.p. and accounted for 50.0%.
Table 1. The top ten drug manufacturers by pharmacy sales
Rank Manufacturer*
Share in total phar-macy sales, %
2012 2011 2012 2011 1 1 EVALAR 21.4 23.0 2 2 VIS 6.2 5.8 3 3 AKVION RF 4.1 4.8 4 4 PFIZER 3.5 4.6 5 5 DIOD 2.9 4.0 6 11 GNC PM FARMA 2.8 1.8 7 6 PHARMAMED CANADA 2.5 2.1 8 74 POLYARIS 2.2 0.2 9 33 POLENS 2.2 0.5
10 13 QUEISSER 2.2 1.7 Total 50.0 48.6
*AIPM members are in bold
A BAA to treat erectile dysfunction SEALEX FORTE, which sales increased 25% at year-end 2012, remained the best selling BAA in the Russia mar-ket (Table 2). FITOLAX (+14%) and ALI CAPS (+91%) maintained ranks two and three. The newcomers REDUKSIN-LIGHT which sales increased 13.3 times and TONGKAT ALI PLATINUM which showed almost a five-fold growth in sales, broke into the ranks of the top ten, coming in at num-bers four and five. At the same time, OVESOL (+7%), HAEMATOGEN RUSS (+11%), INDINOL and TURBOSLIM CLEANING (+6%) moved down one rank to numbers six, seven and two bottom ranks. A BAA CI-CLIM (-4%) reduced its sales and moved down from rank four to eight. The total share of the top-ten ranking increased by almost 4 p.p. and achieved 20.5%.
Table 2. The top ten trade names by pharmacy sales
Rank Trade name Share in total pharmacy
sales, % 2012 2011 2012 2011
1 1 SEALEX FORTE 4.4 4.3 2 2 FITOLAX 2.8 3.0 3 3 ALI CAPS 2.7 1.7 4 124 REDUKSIN-LIGHT 2.1 0.2
Rank Trade name Share in total pharmacy
sales, % 2012 2011 2012 2011
5 34 TONGKAT ALI PLATIN 2.1 0.5 6 5 OVESOL 1.4 1.6 7 6 HAEMATOGEN RUSS 1.4 1.5 8 4 CI-CLIM 1.3 1.6 9 8 INDINOL 1.1 1.3 10 9 TURBOSLIM CLEANING 1.1 1.2 Total 20.5 16.9
The leader of the top ten INN/Generic names in the BAA market didn't change, the composition GLYCYRRHIZA GLABRA + PANAX GINSENG + SERENOA REPENS (+25%) held and strengthened its first rank (table 3). Due to two-fold growth in sales, the composition EURYCOMA LONGIFO-LIA + SERENOA REPENS + TURNERA DIFFUSA moved up from rank five to two. The more dynamic INNs of the top ten, LINOLEIC ACID + VITAMIN E (a 13.7-fold growth in rates) and EURYCOMA LONGIFOLIA + PANAX GIN-SENG + ROYAL JELLY (4.6 growth in rates), moved up to ranks three and five. The other INNs from the top 10 moved down to much lower ranks. On top of that, three of them: FOENICULUM VULGARE + LAMINARIA DIGITATA + PLANTAGO MAJOR (-12%), COLECALCIFEROL + RETINOL + CALCIUM (-13%) and DEXPANTHENOL + DIOSCOREA VILLOSA + HYALU-RONIC ACID (-4%), showed negative growth rates and moved down to ranks 6, 7 and 9. ASCORBIC ACID (+11%), AVENA SATIVA + BUPLEURUM FALCATUM + CURCUMA LONGA (+7%) and INDOLE-3-CARBINOL (+10%) moved down to ranks four, eight and ten. The total share of the top ten under review increased by almost 3 p.p. and achieved 20.8%.
Table 3. The top 10 INN and Generic Names by pharmacy sales
Rank INN/Generic Names
Share in total phar-macy sales, %
2012 2011 2012 2011
1 1 GLYCYRRHIZA GLABRA + PANAX GINSENG + SERENOA REPENS
4.4 4.3
2 5 EURYCOMA LONGIFOLIA + SERENOA REPENS + TURNERA DIFFUSA
2.7 1.7
3 122 LINOLEIC ACID + VITAMIN E 2.2 0.2 4 2 ASCORBIC ACID 2.2 2.3
5 43 EURYCOMA LONGIFOLIA + PANAX GINSENG + ROYAL JELLY
2.1 0.5
6 3 FOENICULUM VULGARE + LAMINAR-IA DIGITATA + PLANTAGO MAJOR
1.6 2.2
7 4 COLECALCIFEROL + RETINOL + CAL-CIUM
1.6 2.2
8 7 AVENA SATIVA + BUPLEURUM FAL-CATUM + CURCUMA LONGA
1.4 1.6
9 6 DEXPANTHENOL + DIOSCOREA VIL-LOSA + HYALURONIC ACID
1.3 1.6
10 9 INDOLE-3-CARBINOL 1.2 1.3 Total 20.8 18.0
Conclusion. At year-end 2012, BAA sales in pharmacies of the country increased 21% in terms of roubles and 15% in terms of dollars and brought in 29.966 bln roubles (USD 967.763 million) in final consumer prices. In pack terms the BAA market grew by 3% and achieved 310.992 mln packs. The average cost of an OTC pack increased as compared to the previous year (USD 3.11 vs. USD 2.80). Expenses of residents for pur-chase of BAA in pharmacies proved to be much higher as well (USD 6.76 vs. USD 5.90).
618,9
843,3
301,0
704,7
967,8
311,0
14% 15%
3%
0%
2%
4%
6%
8%
10%
12%
14%
16%
0
200
400
600
800
1 000
1 200
In value terms(wholesale prices)
In value terms(retail prices)
In physical terms(packs)
Sale
s, $
mln
2011г.
2012
Sales trend2012-2011, %
AIPM - Remedium Market Bulletin, page 5 Issue 3, March 2013
NOVOSIBIRSK PHARMACY MARKET: 2012 RESULTS
According to Federal State Statistics Service, as of January 1, 2012, the popu-lation of Novosibirsk was estimated as 1.499 mln, which accounted for 1.0% of the total Russian Federation population and 7.8% of Siberian FO (SFO). According to Federal State Statistics Service’s data, at year-end 2012 the average salary in the Novosibirsk Oblast was RUB 23,528.5 (USD 759.72), which is 12% lower than the average salary in Russia (RUB 26,822.3).
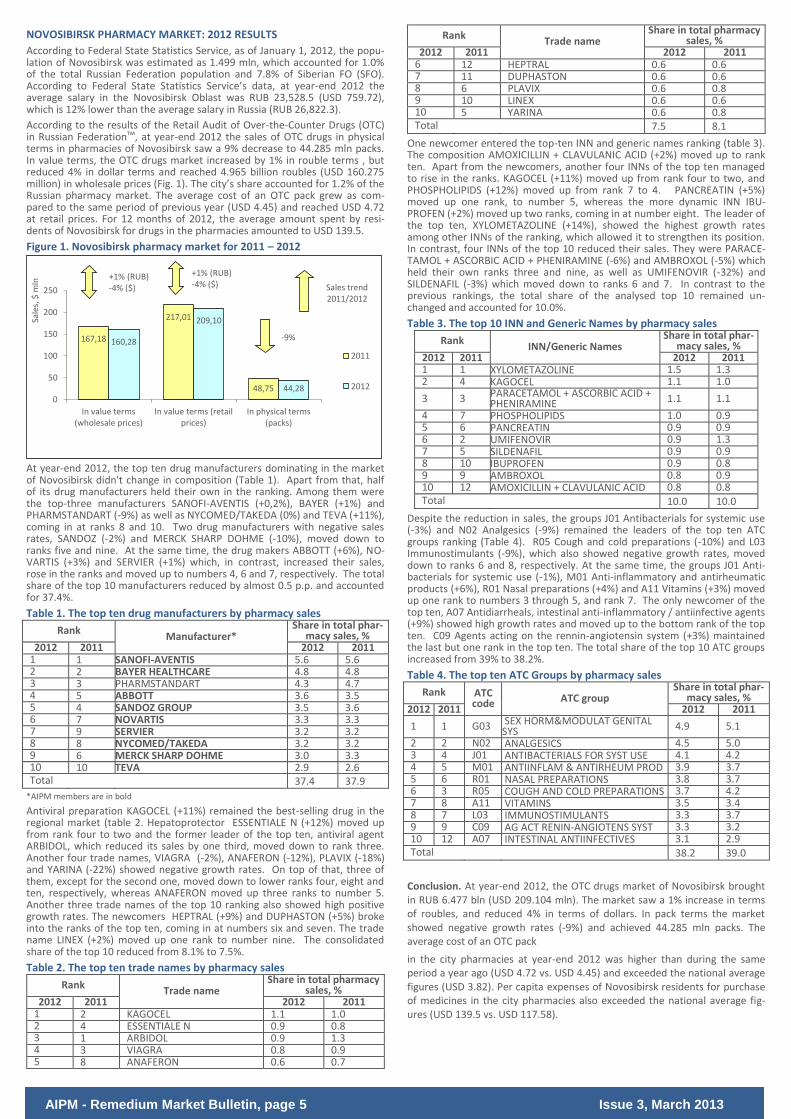
According to the results of the Retail Audit of Over-the-Counter Drugs (OTC) in Russian Federationтм, at year-end 2012 the sales of OTC drugs in physical terms in pharmacies of Novosibirsk saw a 9% decrease to 44.285 mln packs. In value terms, the OTC drugs market increased by 1% in rouble terms , but reduced 4% in dollar terms and reached 4.965 billion roubles (USD 160.275 million) in wholesale prices (Fig. 1). The city’s share accounted for 1.2% of the Russian pharmacy market. The average cost of an OTC pack grew as com-pared to the same period of previous year (USD 4.45) and reached USD 4.72 at retail prices. For 12 months of 2012, the average amount spent by resi-dents of Novosibirsk for drugs in the pharmacies amounted to USD 139.5.
Figure 1. Novosibirsk pharmacy market for 2011 – 2012
At year-end 2012, the top ten drug manufacturers dominating in the market of Novosibirsk didn't change in composition (Table 1). Apart from that, half of its drug manufacturers held their own in the ranking. Among them were the top-three manufacturers SANOFI-AVENTIS (+0,2%), BAYER (+1%) and PHARMSTANDART (-9%) as well as NYCOMED/TAKEDA (0%) and TEVA (+11%), coming in at ranks 8 and 10. Two drug manufacturers with negative sales rates, SANDOZ (-2%) and MERCK SHARP DOHME (-10%), moved down to ranks five and nine. At the same time, the drug makers ABBOTT (+6%), NO-VARTIS (+3%) and SERVIER (+1%) which, in contrast, increased their sales, rose in the ranks and moved up to numbers 4, 6 and 7, respectively. The total share of the top 10 manufacturers reduced by almost 0.5 p.p. and accounted for 37.4%.
Table 1. The top ten drug manufacturers by pharmacy sales
Rank Manufacturer*
Share in total phar-macy sales, %
2012 2011 2012 2011 1 1 SANOFI-AVENTIS 5.6 5.6 2 2 BAYER HEALTHCARE 4.8 4.8 3 3 PHARMSTANDART 4.3 4.7 4 5 ABBOTT 3.6 3.5 5 4 SANDOZ GROUP 3.5 3.6 6 7 NOVARTIS 3.3 3.3 7 9 SERVIER 3.2 3.2 8 8 NYCOMED/TAKEDA 3.2 3.2 9 6 MERCK SHARP DOHME 3.0 3.3 10 10 TEVA 2.9 2.6 Total 37.4 37.9
*AIPM members are in bold
Antiviral preparation KAGOCEL (+11%) remained the best-selling drug in the regional market (table 2. Hepatoprotector ESSENTIALE N (+12%) moved up from rank four to two and the former leader of the top ten, antiviral agent ARBIDOL, which reduced its sales by one third, moved down to rank three. Another four trade names, VIAGRA (-2%), ANAFERON (-12%), PLAVIX (-18%) and YARINA (-22%) showed negative growth rates. On top of that, three of them, except for the second one, moved down to lower ranks four, eight and ten, respectively, whereas ANAFERON moved up three ranks to number 5. Another three trade names of the top 10 ranking also showed high positive growth rates. The newcomers HEPTRAL (+9%) and DUPHASTON (+5%) broke into the ranks of the top ten, coming in at numbers six and seven. The trade name LINEX (+2%) moved up one rank to number nine. The consolidated share of the top 10 reduced from 8.1% to 7.5%.
Table 2. The top ten trade names by pharmacy sales
Rank Trade name
Share in total pharmacy sales, %
2012 2011 2012 2011 1 2 KAGOCEL 1.1 1.0 2 4 ESSENTIALE N 0.9 0.8 3 1 ARBIDOL 0.9 1.3 4 3 VIAGRA 0.8 0.9 5 8 ANAFERON 0.6 0.7
Rank Trade name
Share in total pharmacy sales, %
2012 2011 2012 2011 6 12 HEPTRAL 0.6 0.6 7 11 DUPHASTON 0.6 0.6 8 6 PLAVIX 0.6 0.8 9 10 LINEX 0.6 0.6 10 5 YARINA 0.6 0.8 Total 7.5 8.1
One newcomer entered the top-ten INN and generic names ranking (table 3). The composition AMOXICILLIN + CLAVULANIC ACID (+2%) moved up to rank ten. Apart from the newcomers, another four INNs of the top ten managed to rise in the ranks. KAGOCEL (+11%) moved up from rank four to two, and PHOSPHOLIPIDS (+12%) moved up from rank 7 to 4. PANCREATIN (+5%) moved up one rank, to number 5, whereas the more dynamic INN IBU-PROFEN (+2%) moved up two ranks, coming in at number eight. The leader of the top ten, XYLOMETAZOLINE (+14%), showed the highest growth rates among other INNs of the ranking, which allowed it to strengthen its position. In contrast, four INNs of the top 10 reduced their sales. They were PARACE-TAMOL + ASCORBIC ACID + PHENIRAMINE (-6%) and AMBROXOL (-5%) which held their own ranks three and nine, as well as UMIFENOVIR (-32%) and SILDENAFIL (-3%) which moved down to ranks 6 and 7. In contrast to the previous rankings, the total share of the analysed top 10 remained un-changed and accounted for 10.0%.
Table 3. The top 10 INN and Generic Names by pharmacy sales
Rank INN/Generic Names
Share in total phar-macy sales, %
2012 2011 2012 2011 1 1 XYLOMETAZOLINE 1.5 1.3 2 4 KAGOCEL 1.1 1.0
3 3 PARACETAMOL + ASCORBIC ACID + PHENIRAMINE 1.1 1.1
4 7 PHOSPHOLIPIDS 1.0 0.9 5 6 PANCREATIN 0.9 0.9 6 2 UMIFENOVIR 0.9 1.3 7 5 SILDENAFIL 0.9 0.9 8 10 IBUPROFEN 0.9 0.8 9 9 AMBROXOL 0.8 0.9 10 12 AMOXICILLIN + CLAVULANIC ACID 0.8 0.8 Total 10.0 10.0
Despite the reduction in sales, the groups J01 Antibacterials for systemic use (-3%) and N02 Analgesics (-9%) remained the leaders of the top ten ATC groups ranking (Table 4). R05 Cough and cold preparations (-10%) and L03 Immunostimulants (-9%), which also showed negative growth rates, moved down to ranks 6 and 8, respectively. At the same time, the groups J01 Anti-bacterials for systemic use (-1%), M01 Anti-inflammatory and antirheumatic products (+6%), R01 Nasal preparations (+4%) and A11 Vitamins (+3%) moved up one rank to numbers 3 through 5, and rank 7. The only newcomer of the top ten, A07 Antidiarrheals, intestinal anti-inflammatory / antiinfective agents (+9%) showed high growth rates and moved up to the bottom rank of the top ten. C09 Agents acting on the rennin-angiotensin system (+3%) maintained the last but one rank in the top ten. The total share of the top 10 ATC groups increased from 39% to 38.2%.
Table 4. The top ten ATC Groups by pharmacy sales
Rank ATC code ATC group
Share in total phar-macy sales, %
2012 2011 2012 2011
1 1 G03 SEX HORM&MODULAT GENITAL SYS 4.9 5.1
2 2 N02 ANALGESICS 4.5 5.0 3 4 J01 ANTIBACTERIALS FOR SYST USE 4.1 4.2 4 5 M01 ANTIINFLAM & ANTIRHEUM PROD 3.9 3.7 5 6 R01 NASAL PREPARATIONS 3.8 3.7 6 3 R05 COUGH AND COLD PREPARATIONS 3.7 4.2 7 8 A11 VITAMINS 3.5 3.4 8 7 L03 IMMUNOSTIMULANTS 3.3 3.7 9 9 C09 AG ACT RENIN-ANGIOTENS SYST 3.3 3.2 10 12 A07 INTESTINAL ANTIINFECTIVES 3.1 2.9 Total 38.2 39.0
Conclusion. At year-end 2012, the OTC drugs market of Novosibirsk brought in RUB 6.477 bln (USD 209.104 mln). The market saw a 1% increase in terms of roubles, and reduced 4% in terms of dollars. In pack terms the market showed negative growth rates (-9%) and achieved 44.285 mln packs. The average cost of an OTC pack
in the city pharmacies at year-end 2012 was higher than during the same period a year ago (USD 4.72 vs. USD 4.45) and exceeded the national average figures (USD 3.82). Per capita expenses of Novosibirsk residents for purchase of medicines in the city pharmacies also exceeded the national average fig-ures (USD 139.5 vs. USD 117.58).
167,18
217,01
48,75
160,28
209,10
44,28 0
50
100
150
200
250
In value terms(wholesale prices)
In value terms (retailprices)
In physical terms(packs)
Sale
s, $
mln
2011
2012
-9%
Sales trend 2011/2012
+1% (RUB) -4% ($)
+1% (RUB) -4% ($)

AIPM - Remedium Market Bulletin, page 6 Issue 3, March 2013
KRASNOYARSK PHARMACY MARKET: 2012 RESULTS
According to Federal State Statistics Service, as of January 1, 2012 the popula-tion of Krasnoyarsk was estimated as 997.316 ths, which accounted for 0.7% of the total Russian Federation population and 5.2% of Siberian FO (SFO). According to Federal State Statistics Service’s data, in the twelve months of 2012 the average salary in the region was RUB 28,734.3 (USD 927.81), which is 7% higher than the average salary in Russia (RUB 26,822.3).
According to the results of the Retail Audit of Over-the-Counter Drugs (OTC) in Russian Federationтм, at year-end 2012 the sales of OTC drugs in physical terms in the pharmacies of Krasnoyarsk saw a 2% decrease to 33.211 mln packs. In value terms, the city pharmacy market (exclusive of State Reim-bursement Program) saw a +16% increase in terms of roubles and +10% in terms of dollars compared to 2011 and reached RUB 3.587 bln (USD 115.697 mln) in wholesale prices (Fig.1). The city share in the total volume of all-Russia pharmacy market accounted for 0.9%. The average cost of a pack in the pharmacies of Krasnoyarsk was USD 4.44 (in a year-earlier period – USD 3.97). For twelve months of 2012, the average amount spent by residents of the city for OTC drugs amounted to USD 147.75.
Figure 1. Krasnoyarsk pharmacy market for 2011 – 2012
On the basis of the results for 2012, SANOFI-AVENTIS (+19%) and BAYER (+13%) remained the leading drug manufacturers of the regional market (Table 1). Another two drug manufacturers, SANDOZ (+14%) and MERCK SHARP DOHME (+22%), didn't change their positions, holding their own ranks four and six. Three trade names of the top 10 managed to rise in the ranks. SERVIER (+24% moved up to rank three from five, and the newcomers of the top ten TEVA (+38%) and ABBOTT (+26%) moved up to ranks seven and ten. At the same time, NOVARTIS (+20%) and NYCOMED/TAKEDA (+18%) moved down one rank, to numbers 8 and 9, respectively. In addition, PHARMSTANDART (-8%) showing negative growth rates moved down from rank three to five. The total share accumulated by the top ten drug manufac-turers reduced from 38.3% to 38.6%.
Table 1. The top ten drug manufacturers by pharmacy sales Rank
in the top ten Manufacturer* Share in total pharmacy
sales, % 2012 2011 2012 2011
1 1 SANOFI-AVENTIS 5.8 5.7
2 2 BAYER HEALTHCARE 5.0 5.1
3 5 SERVIER 4.2 3.9
4 4 SANDOZ GROUP 4.1 4.2
5 3 PHARMSTANDART 3.7 4.7
6 6 MERCK SHARP DOHME 3.5 3.4
7 13 TEVA 3.2 2.7
8 7 NOVARTIS 3.1 3.0
9 8 NYCOMED/TAKEDA 3.0 3.0
10 12 ABBOTT 3.0 2.8
Total 38.6 38.3 *AIPM members are in bold
Four newcomers broke into the ranks of the top ten trade names ranking (table 2. ALFLUTOP (+45%), PEGINTRON (+37%) and KAGOCEL, which sales grew 3.2 times, moved up to ranks 6 through 8. One more newcomer CON-COR (+24%) moved up to the bottom rank of the top ten. Due to outperfor-mance, ESSENTIALE N (+42%) and ACTOVEGIN (+28%) also rose in the ranks, coming in at numbers one and five. TROPICAMID (-13%), VIAGRA (-7%) and ARBIDOL (-31%) reduced their sales. On top of that, the first two trade names held their previous ranks two and three, and the latter moved down three ranks, coming in at number four. Despite the growth in sales, KETONAL (+6%) moved down two ranks to number 9 under the pressure of more dy-namic trade names.
Table 2. The top ten trade names by pharmacy sales Rank
in the top ten Trade name
Share in total pharmacy sales, %
2012 2011 2012 2011
1 4 ESSENTIALE N 1.3 1.1
2 2 TROPICAMID 1.0 1.3
3 3 VIAGRA 0.9 1.1
4 1 ARBIDOL 0.8 1.4
Rank in the top ten
Trade name
Share in total pharmacy sales, %
2012 2011 2012 2011
5 8 ACTOVEGIN 0.7 0.7
6 12 ALFLUTOP 0.7 0.6
7 11 PEGINTRON 0.7 0.6
8 78 KAGOCEL 0.6 0.2
9 7 KETONAL 0.6 0.7
10 19 CONCOR 0.5 0.5
Total 7.9 8.1
High growth in INN sales was the dominating trend of the top 10 INN and generic names ranking , as seven INNs moved up to higher ranks (Table 3). PHOSPHOLIPIDS (+40%), KETOPROFEN (+15%), XYLOMETAZOLINE (+33%) and PANCREATIN (+18%) moved up to ranks one through four, respectively. PA-RACETAMOL + ASCORBIC ACID + PHENIRAMINE (+8%) and BISOPROLOL (+25%) moved up one rank, to numbers 7 and 9, respectively. The only new-comer INN BLOOD (+29%) broke into the ranks of the top ten, coming in at number ten. At the same time, two INNs with negative growth rates, TROPI-CAMIDE (-12%) and UMIFENOVIR (-31%) moved down to ranks 5 and 8, re-spectively. INN SILDENAFIL (+1%) held its previous rank six. The total share of the top ten under review also reduced, in this case by almost 0.5 p.p. and accounted for 10.2%.
Table 3. The top 10 INN and Generic Names by pharmacy sales Rank
in the top ten Trade name
Share in total pharmacy sales, %
2012 2011 2012 2011
1 4 PHOSPHOLIPIDS 1.4 1.2
2 3 KETOPROFEN 1.2 1.2
3 7 XYLOMETAZOLINE 1.2 1.0
4 5 PANCREATIN 1.1 1.1
5 1 TROPICAMIDE 1.0 1.4
6 6 SILDENAFIL 1.0 1.1
7 8 PARACETAMOL + ASCORBIC ACID + PHENIRAMINE 0.8 0.9
8 2 UMIFENOVIR 0.8 1.4
9 10 BISOPROLOL 0.8 0.7
10 12 BLOOD 0.8 0.7
Total 10.2 10.7
The Groups N02 Analgesics (-6%) and M01 Anti-inflammatory and antirheu-matic products (+22%) remained the leaders of the top ten ATC groups rank-ing (Table 4). Despite the reduction in sales, as before R05 Cough and cold preparations (-1%) held its previous rank five. Due to outstripping growth rates, the Groups C09 Agents acting on the rennin-angiotensin system (+24%), R01 Nasal preparations (+18%) and L03 Immunostimulants (+21%) moved up to ranks six, seven and nine, respectively. At the same time, they displaced A11 Vitamins (+14%) and S01 Ophthalmologicals (+3%) to ranks eight and ten. Another shift took place in the top part f the ranking: the more dynamic J01 Antibacterials for systemic use (+12%) moved up one rank, com-ing in at number 3. G03 Sex hormones (+10%) which showed lower growth rates moved down to rank 4. The total share of the top 10 decreased by al-most 2 p.p. and accounted for 38.9%.
Table 4. The top ten ATC Groups by pharmacy sales
Rank ATC code
ATC group Share in total phar-
macy sales, % 2012 2011 2012 2011
1 1 N02 ANALGESICS 4.8 5.9
2 2 M01 ANTIINFLAM & ANTIRHEUM PROD 4.7 4.5
3 4 J01 ANTIBACTERIALS FOR SYST USE 4.3 4.5
4 3 G03 SEX HORM&MODULAT GENITAL SYS 4.2 4.5
5 5 R05 COUGH AND COLD PREPARA-TIONS 3.8 4.4
6 9 C09 AG ACT RENIN-ANGIOTENS SYST 3.6 3.4
7 8 R01 NASAL PREPARATIONS 3.5 3.4
8 7 A11 VITAMINS 3.4 3.4
9 10 L03 IMMUNOSTIMULANTS 3.3 3.2
10 6 S01 OPHTHALMOLOGICALS 3.3 3.7
Total 38.9 40.8
Conclusion. On the basis of the results for 2012, the retail pharmacy market of Krasnoyarsk brought in RUB 4.568 bln (USD 147.357 mln). At the same time, the market performance was positive both in rouble terms (+16%) and in dollar terms (+10%). In physical terms, the sales decreased by 2% and amounted to 33.211 mln packs. The average cost of an OTC pack in the city pharmacies increased as compared to the previous year (USD 4.44 vs. USD 3.97), however it was higher than the average indicator in Russia (USD 3.82). Per capita expenses for purchase of medicines in pharmacies amounted to USD 147.75 which is higher than on the average in the country (USD 117.58).
105,00
134,16
33,78
115,70
147,36
33,21 0
20406080
100120140160
In value terms(wholesale prices)
In value terms (retailprices)
In physical terms(packs)
Sale
s, $
mln
2011
2012
-2%
Sales trend 2011/2012
+16% (RUB) +10% ($)
+16% (RUB) +10% ($)
AIPM - Remedium Market Bulletin, page 7 Issue 3, March 2013
BARNAUL PHARMACY MARKET: 2012 RESULTS
According to Federal State Statistics Service, as of January 1, 2012 the popula-tion of Barnaul was estimated as 621.669 ths, which accounted for 0.4% of the total Russian Federation population and 3.2% of Siberian FO (SFO). Ac-cording to Federal State Statistics Service’s data, the average salary in the Altaiski Krai was RUB 16,007.8 (USD 516.88), which is 40% lower than the average salary in Russia (RUB 26,822.3).
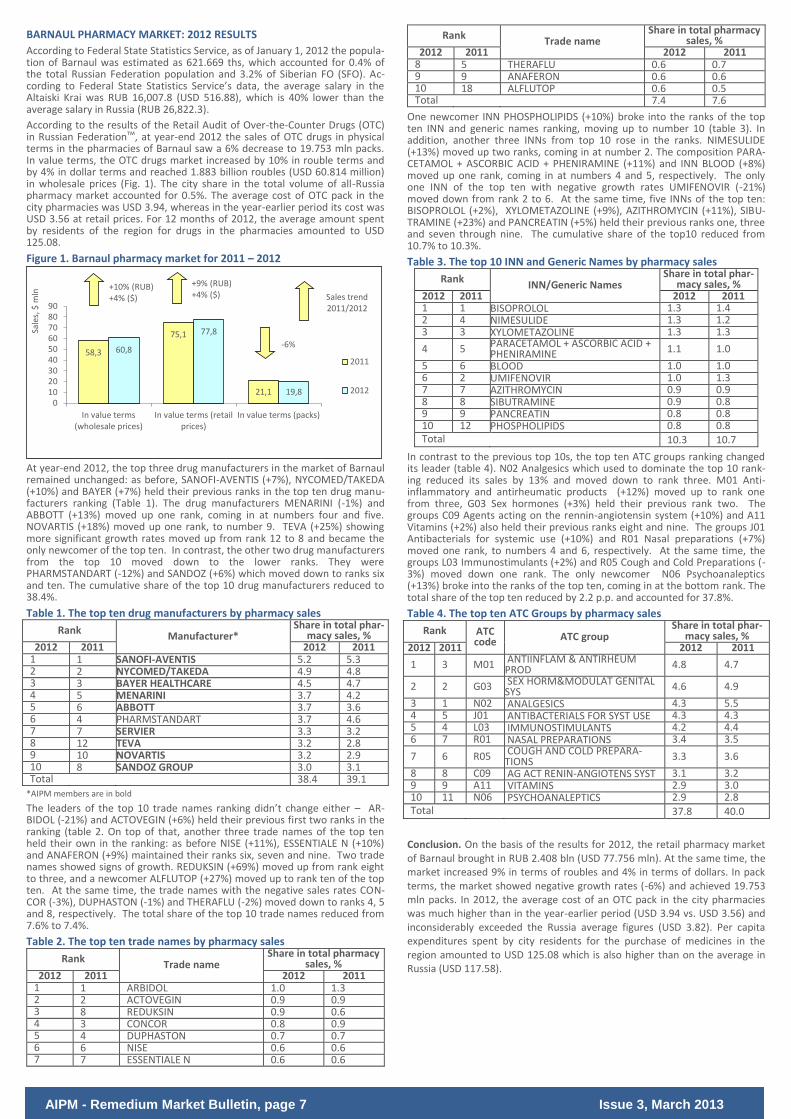
According to the results of the Retail Audit of Over-the-Counter Drugs (OTC) in Russian Federationтм, at year-end 2012 the sales of OTC drugs in physical terms in the pharmacies of Barnaul saw a 6% decrease to 19.753 mln packs. In value terms, the OTC drugs market increased by 10% in rouble terms and by 4% in dollar terms and reached 1.883 billion roubles (USD 60.814 million) in wholesale prices (Fig. 1). The city share in the total volume of all-Russia pharmacy market accounted for 0.5%. The average cost of OTC pack in the city pharmacies was USD 3.94, whereas in the year-earlier period its cost was USD 3.56 at retail prices. For 12 months of 2012, the average amount spent by residents of the region for drugs in the pharmacies amounted to USD 125.08.
Figure 1. Barnaul pharmacy market for 2011 – 2012
At year-end 2012, the top three drug manufacturers in the market of Barnaul remained unchanged: as before, SANOFI-AVENTIS (+7%), NYCOMED/TAKEDA (+10%) and BAYER (+7%) held their previous ranks in the top ten drug manu-facturers ranking (Table 1). The drug manufacturers MENARINI (-1%) and ABBOTT (+13%) moved up one rank, coming in at numbers four and five. NOVARTIS (+18%) moved up one rank, to number 9. TEVA (+25%) showing more significant growth rates moved up from rank 12 to 8 and became the only newcomer of the top ten. In contrast, the other two drug manufacturers from the top 10 moved down to the lower ranks. They were PHARMSTANDART (-12%) and SANDOZ (+6%) which moved down to ranks six and ten. The cumulative share of the top 10 drug manufacturers reduced to 38.4%.
Table 1. The top ten drug manufacturers by pharmacy sales
Rank Manufacturer*
Share in total phar-macy sales, %
2012 2011 2012 2011 1 1 SANOFI-AVENTIS 5.2 5.3 2 2 NYCOMED/TAKEDA 4.9 4.8 3 3 BAYER HEALTHCARE 4.5 4.7 4 5 MENARINI 3.7 4.2 5 6 ABBOTT 3.7 3.6 6 4 PHARMSTANDART 3.7 4.6 7 7 SERVIER 3.3 3.2 8 12 TEVA 3.2 2.8 9 10 NOVARTIS 3.2 2.9 10 8 SANDOZ GROUP 3.0 3.1 Total 38.4 39.1
*AIPM members are in bold
The leaders of the top 10 trade names ranking didn’t change either – AR-BIDOL (-21%) and ACTOVEGIN (+6%) held their previous first two ranks in the ranking (table 2. On top of that, another three trade names of the top ten held their own in the ranking: as before NISE (+11%), ESSENTIALE N (+10%) and ANAFERON (+9%) maintained their ranks six, seven and nine. Two trade names showed signs of growth. REDUKSIN (+69%) moved up from rank eight to three, and a newcomer ALFLUTOP (+27%) moved up to rank ten of the top ten. At the same time, the trade names with the negative sales rates CON-COR (-3%), DUPHASTON (-1%) and THERAFLU (-2%) moved down to ranks 4, 5 and 8, respectively. The total share of the top 10 trade names reduced from 7.6% to 7.4%.
Table 2. The top ten trade names by pharmacy sales
Rank Trade name
Share in total pharmacy sales, %
2012 2011 2012 2011 1 1 ARBIDOL 1.0 1.3 2 2 ACTOVEGIN 0.9 0.9 3 8 REDUKSIN 0.9 0.6 4 3 CONCOR 0.8 0.9 5 4 DUPHASTON 0.7 0.7 6 6 NISE 0.6 0.6 7 7 ESSENTIALE N 0.6 0.6
Rank Trade name
Share in total pharmacy sales, %
2012 2011 2012 2011 8 5 THERAFLU 0.6 0.7 9 9 ANAFERON 0.6 0.6 10 18 ALFLUTOP 0.6 0.5 Total 7.4 7.6
One newcomer INN PHOSPHOLIPIDS (+10%) broke into the ranks of the top ten INN and generic names ranking, moving up to number 10 (table 3). In addition, another three INNs from top 10 rose in the ranks. NIMESULIDE (+13%) moved up two ranks, coming in at number 2. The composition PARA-CETAMOL + ASCORBIC ACID + PHENIRAMINE (+11%) and INN BLOOD (+8%) moved up one rank, coming in at numbers 4 and 5, respectively. The only one INN of the top ten with negative growth rates UMIFENOVIR (-21%) moved down from rank 2 to 6. At the same time, five INNs of the top ten: BISOPROLOL (+2%), XYLOMETAZOLINE (+9%), AZITHROMYCIN (+11%), SIBU-TRAMINE (+23%) and PANCREATIN (+5%) held their previous ranks one, three and seven through nine. The cumulative share of the top10 reduced from 10.7% to 10.3%.
Table 3. The top 10 INN and Generic Names by pharmacy sales
Rank INN/Generic Names
Share in total phar-macy sales, %
2012 2011 2012 2011 1 1 BISOPROLOL 1.3 1.4 2 4 NIMESULIDE 1.3 1.2 3 3 XYLOMETAZOLINE 1.3 1.3
4 5 PARACETAMOL + ASCORBIC ACID + PHENIRAMINE 1.1 1.0
5 6 BLOOD 1.0 1.0 6 2 UMIFENOVIR 1.0 1.3 7 7 AZITHROMYCIN 0.9 0.9 8 8 SIBUTRAMINE 0.9 0.8 9 9 PANCREATIN 0.8 0.8 10 12 PHOSPHOLIPIDS 0.8 0.8 Total 10.3 10.7
In contrast to the previous top 10s, the top ten ATC groups ranking changed its leader (table 4). N02 Analgesics which used to dominate the top 10 rank-ing reduced its sales by 13% and moved down to rank three. M01 Anti-inflammatory and antirheumatic products (+12%) moved up to rank one from three, G03 Sex hormones (+3%) held their previous rank two. The groups C09 Agents acting on the rennin-angiotensin system (+10%) and A11 Vitamins (+2%) also held their previous ranks eight and nine. The groups J01 Antibacterials for systemic use (+10%) and R01 Nasal preparations (+7%) moved one rank, to numbers 4 and 6, respectively. At the same time, the groups L03 Immunostimulants (+2%) and R05 Cough and Cold Preparations (-3%) moved down one rank. The only newcomer N06 Psychoanaleptics (+13%) broke into the ranks of the top ten, coming in at the bottom rank. The total share of the top ten reduced by 2.2 p.p. and accounted for 37.8%.
Table 4. The top ten ATC Groups by pharmacy sales
Rank ATC code ATC group
Share in total phar-macy sales, %
2012 2011 2012 2011
1 3 M01 ANTIINFLAM & ANTIRHEUM PROD 4.8 4.7
2 2 G03 SEX HORM&MODULAT GENITAL SYS 4.6 4.9
3 1 N02 ANALGESICS 4.3 5.5 4 5 J01 ANTIBACTERIALS FOR SYST USE 4.3 4.3 5 4 L03 IMMUNOSTIMULANTS 4.2 4.4 6 7 R01 NASAL PREPARATIONS 3.4 3.5
7 6 R05 COUGH AND COLD PREPARA-TIONS 3.3 3.6
8 8 C09 AG ACT RENIN-ANGIOTENS SYST 3.1 3.2 9 9 A11 VITAMINS 2.9 3.0 10 11 N06 PSYCHOANALEPTICS 2.9 2.8 Total 37.8 40.0
Conclusion. On the basis of the results for 2012, the retail pharmacy market of Barnaul brought in RUB 2.408 bln (USD 77.756 mln). At the same time, the market increased 9% in terms of roubles and 4% in terms of dollars. In pack terms, the market showed negative growth rates (-6%) and achieved 19.753 mln packs. In 2012, the average cost of an OTC pack in the city pharmacies was much higher than in the year-earlier period (USD 3.94 vs. USD 3.56) and inconsiderably exceeded the Russia average figures (USD 3.82). Per capita expenditures spent by city residents for the purchase of medicines in the region amounted to USD 125.08 which is also higher than on the average in Russia (USD 117.58).
58,3
75,1
21,1
60,8
77,8
19,8 0
102030405060708090
In value terms(wholesale prices)
In value terms (retailprices)
In value terms (packs)
Sale
s, $
mln
2011
2012
-6%
Sales trend 2011/2012
+9% (RUB) +4% ($)
+10% (RUB) +4% ($)

AIPM - Remedium Market Bulletin, page 8 Issue 3, March 2013
VLADIVOSTOK PHARMACY MARKET: 2012 RESULTS
According to Federal State Statistics Service, as of January 1, 2012 Vladivos-tok’s estimated population was 597.476 thd, which accounted for 0.4% of the total Russian Federation population and 9.5% of Far Eastern FO (FFO). Ac-cording to Federal State Statistics Service’s data, in 2012 the average salary in the Primorski Krai was RUB 27,453.4 (USD 886.45), which is 2% higher than the average salary in Russia (RUB 26,822.3).
According to the results of the Retail Audit of Over-the-Counter Drugs (OTC) in Russian Federationтм, at year-end 2012 the sales of OTC drugs in physical terms in Vladivostok pharmacies saw a 8% decrease to 15.677 mln packs. In value terms, the OTC drugs market reduced by 2% in rouble terms and by 7% in dollar terms and reached 2.008 billion roubles (USD 64.979 million) in wholesale prices (Fig. 1). The average cost of an OTC pack increased as com-pared to a year earlier (USD 5.33) and reached USD 5.40 at retail prices. For 12 months of 2012, the average amount spent by residents of Vladivostok for drugs amounted to USD 141.56.
Figure 1. Vladivostok pharmacy market for 2011 – 2012
Based on the results for 2012, half of the drug manufacturers of the top ten in the market of Vladivostok held their own in the ranking (Table 1). Among them were the top-three manufacturers SANOFI-AVENTIS (-3%), SERVIER (-8%) and SANDOZ (-4%), as well as NOVARTIS (+5%) and NYCOMED/TAKEDA (-0.3%) placed at numbers 6 and 7. Despite the negative growth rates, BAYER (-3%) moved up to rank four from five, whereas PHARMSTANDART (-11%) which used to be at that number earlier, showed more pronounced reduction in sales and moved down to rank 5. A newcomer TEVA (+8%) broke into the ranks of the top ten, coming it at number eight. The drug manufacturers with negative sales rates GEDEON RICHTER (-9%) and PFIZER (-11%) moved down to ranks nine and ten. The cumulative share of the top 10 manufacturers reduced from 38.3% to 37.7%.
Table 1. The top ten drug manufacturers by pharmacy sales
Rank Manufacturer*
Share in total phar-macy sales, %
2012 2011 2012 2011 1 1 SANOFI-AVENTIS 5.3 5.3 2 2 SERVIER 4.5 4.7 3 3 SANDOZ GROUP 4.4 4.5 4 5 BAYER HEALTHCARE 3.8 3.9 5 4 PHARMSTANDART 3.7 4.1 6 6 NOVARTIS 3.6 3.3 7 7 NYCOMED/TAKEDA 3.3 3.3 8 11 TEVA 3.3 2.9 9 8 GEDEON RICHTER 3.0 3.2 10 9 PFIZER 2.8 3.1 Total 37.7 38.3
*AIPM members are in bold
Two newcomers broke into the ranks of the top ten trade names ranking (table 2). They were LASOLVAN (-5%) and HEPTRAL (+3%) which moved up to ranks eight and ten. LINEX (+5%) and OCILLOCOCCINUM (-3%) also moved up to higher ranks, coming in at numbers two and six, respectively. Hepatopro-tector ESSENTIALE N (+0.2%) remained the leader of the regional market, whereas ACTOVEGIN (+1%), SUMAMED (+6%) and ALFLUTOP (-9%) as before held their previous ranks three, five and six. Antiviral ARBIDOL reduced its sales by 34%, considerably decreasing its market share, and moved down from rank two to four. The total share of the top 10 trade names also reduced from 7.9% to 7.6%.
Table 2. The top ten trade names by pharmacy sales
Rank Trade name
Share in total pharmacy sales, %
2012 2011 2012 2011 1 1 ESSENTIALE N 1.3 1.3 2 4 LINEX 0.9 0.8 3 3 ACTOVEGIN 0.9 0.9 4 2 ARBIDOL 0.8 1.2 5 5 SUMAMED 0.8 0.7 6 6 ALFLUTOP 0.6 0.7 7 10 OCILLOCOCCINUM 0.6 0.6 8 11 LASOLVAN 0.6 0.6 9 16 HEPTRAL 0.6 0.5
Rank Trade name
Share in total pharmacy sales, %
2012 2011 2012 2011 10 9 CIALIS 0.6 0.6 Total 7.6 7.9
The top 10 INN and generic names ranking changed its leader. The most dy-namic INN of the top ten XYLOMETAZOLINE (+12%) moved up to rank one (table 3). The former leader of the top ten PHOSPHOLIPIDS (-1%) reduced their sales and moved down to rank 2. Another three trade names of the top ten also showed the negative growth rates: PANCREATIN (-2%), which moved up to rank 3, as well as UMIFENOVIR (-34%) and FLUCONAZOLE (-11%) which, by contrast, moved down to ranks 7 and 9 respectively. Positive sales rates of AZITHROMYCIN (+7%) and BLOOD (+1%), as well as the composition BIFIDOBACTERIUM INFANTIS + ENTEROCOCCUS FAECIUM + LACTOBACILLUS ACIDOPHILUS (+5%) and AMOXICILLIN + CLAVULANIC ACID (+1%) allowed them to move up to higher ranks 3, 4, 6 and 8 respectively. PARACETAMOL + ASCORBIC ACID + PHENIRAMINE (+1%) retained rank ten. The cumulative share of the top 10 didn’t change and accounted for 10.4%.
Table 3. The top 10 INN and Generic Names by pharmacy sales
Rank INN/Generic Names
Share in total phar-macy sales, %
2012 2011 2012 2011 1 2 XYLOMETAZOLINE 1.5 1.3 2 1 PHOSPHOLIPIDS 1.5 1.4 3 4 PANCREATIN 1.2 1.2 4 5 AZITHROMYCIN 1.1 1.0 5 6 BLOOD 0.9 0.9
6 8 BIFIDOBACTERIUM INFANTIS + EN-TEROCOCCUS FAECIUM + LACTOBA-CILLUS ACIDOPHILUS
0.9 0.8
7 3 UMIFENOVIR 0.8 1.2 8 9 AMOXICILLIN + CLAVULANIC ACID 0.8 0.8 9 7 FLUCONAZOLE 0.8 0.9
10 10 PARACETAMOL + ASCORBIC ACID + PHENIRAMINE 0.8 0.8
Total 10.4 10.4
Most ATC groups of the top 10 retained their previous ranks (table 4). They were J01 Antibacterials for systemic use (-1%), L03 Immunostimulants (-11%), R01 Nasal preparations (+1%) and M01Anti-inflammatory and antirheumatic products (-1%) which topped the ranking. As before, R05 Cough and cold preparations (-2%) and A05 Bile and liver therapy (-4%) held their previous ranks seven and ten. The most significant negative growth rates were demon-strated by the group G03 Sex hormones (-13%), which reduced its market share and moved down to rank nine from five. A11 Vitamins (-3%) that had held that rank earlier reduced its sales, but not that much which allowed it to move up one rank to number 8. Due to positive sales rates, the groups A07 Antidiarrheals, intestinal anti-inflammatory / antiinfective agents and N02 Analgesics (+6% each) moved up to ranks five and six. The total share of the analysed top 10 remained unchanged and accounted for 35.2%.
Table 4. The top ten ATC Groups by pharmacy sales
Rank ATC code ATC group
Share in total phar-macy sales, %
2012 2011 2012 2011 1 1 J01 ANTIBACTERIALS FOR SYST USE 5.1 5.0 2 2 L03 IMMUNOSTIMULANTS 3.8 4.2 3 3 R01 NASAL PREPARATIONS 3.8 3.7
4 4 M01 ANTIINFLAM & ANTIRHEUM PROD 3.7 3.7
5 6 A07 INTESTINAL ANTIINFECTIVES 3.4 3.1 6 8 N02 ANALGESICS 3.4 3.1
7 7 R05 COUGH AND COLD PREPARA-TIONS 3.1 3.1
8 9 A11 VITAMINS 3.0 3.0
9 5 G03 SEX HORM&MODULAT GENITAL SYS 2.9 3.3
10 10 A05 BILE AND LIVER THERAPY 2.9 2.9 Total 35.2 35.1
Conclusion. On the basis of the results for 2012, the retail pharmacy market of Vladivostok brought in RUB 2.614 bln (USD 84.577 mln). The market re-duced 2% in terms of roubles and 6% in terms of dollars. In pack terms the market also showed negative growth rates (-8%) and achieved 15.677 mln packs. In 2012, the average cost of an OTC pack was higher than in the year-earlier period (USD 5.40 vs. USD 5.33). The average expenses of city residents for medicines in the pharmacies considerably exceeded the national average figures (USD 141.56 vs. USD 117.58).
69,8
90,3
17,0
65,0
84,6
15,7 0
102030405060708090
100
In value terms(wholesale prices)
In value terms (retailprices)
In physical terms(packs)
Sale
s, $
mln
2011
2012
-8%
Sales trend 2011/2012
-2% (RUB) -6% ($)
-2% (RUB) -7% ($)
AIPM - Remedium Market Bulletin, page 9 Issue 3, March 2013
KHABAROVSK PHARMACY MARKET: 2012 RESULTS
According to Federal State Statistics Service, as of January 1, 2012 Khaba-rovsk’s estimated population was 585.556 thd, which accounted for 0.4% of the total Russian Federation population and 9.3% of Far Eastern FO (FFO). According to Federal State Statistics Service’s data, in 2012 the average sala-ry in the Khabarovski Krai was RUB 30,908.4 (USD 998.01), which is 15% high-er than the average salary in Russia (RUB 26,822.3).
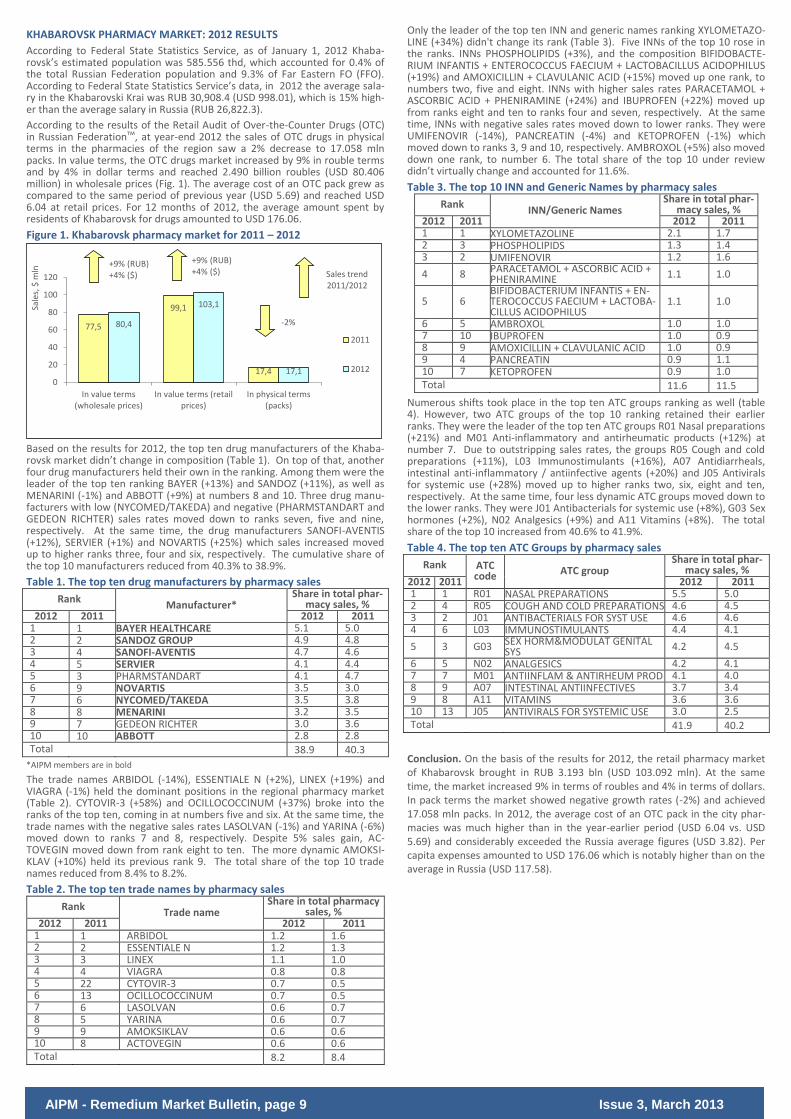
According to the results of the Retail Audit of Over-the-Counter Drugs (OTC) in Russian Federationтм, at year-end 2012 the sales of OTC drugs in physical terms in the pharmacies of the region saw a 2% decrease to 17.058 mln packs. In value terms, the OTC drugs market increased by 9% in rouble terms and by 4% in dollar terms and reached 2.490 billion roubles (USD 80.406 million) in wholesale prices (Fig. 1). The average cost of an OTC pack grew as compared to the same period of previous year (USD 5.69) and reached USD 6.04 at retail prices. For 12 months of 2012, the average amount spent by residents of Khabarovsk for drugs amounted to USD 176.06.
Figure 1. Khabarovsk pharmacy market for 2011 – 2012
Based on the results for 2012, the top ten drug manufacturers of the Khaba-rovsk market didn’t change in composition (Table 1). On top of that, another four drug manufacturers held their own in the ranking. Among them were the leader of the top ten ranking BAYER (+13%) and SANDOZ (+11%), as well as MENARINI (-1%) and ABBOTT (+9%) at numbers 8 and 10. Three drug manu-facturers with low (NYCOMED/TAKEDA) and negative (PHARMSTANDART and GEDEON RICHTER) sales rates moved down to ranks seven, five and nine, respectively. At the same time, the drug manufacturers SANOFI-AVENTIS (+12%), SERVIER (+1%) and NOVARTIS (+25%) which sales increased moved up to higher ranks three, four and six, respectively. The cumulative share of the top 10 manufacturers reduced from 40.3% to 38.9%.
Table 1. The top ten drug manufacturers by pharmacy sales
Rank Manufacturer*
Share in total phar-macy sales, %
2012 2011 2012 2011 1 1 BAYER HEALTHCARE 5.1 5.0 2 2 SANDOZ GROUP 4.9 4.8 3 4 SANOFI-AVENTIS 4.7 4.6 4 5 SERVIER 4.1 4.4 5 3 PHARMSTANDART 4.1 4.7 6 9 NOVARTIS 3.5 3.0 7 6 NYCOMED/TAKEDA 3.5 3.8 8 8 MENARINI 3.2 3.5 9 7 GEDEON RICHTER 3.0 3.6 10 10 ABBOTT 2.8 2.8 Total 38.9 40.3
*AIPM members are in bold
The trade names ARBIDOL (-14%), ESSENTIALE N (+2%), LINEX (+19%) and VIAGRA (-1%) held the dominant positions in the regional pharmacy market (Table 2). CYTOVIR-3 (+58%) and OCILLOCOCCINUM (+37%) broke into the ranks of the top ten, coming in at numbers five and six. At the same time, the trade names with the negative sales rates LASOLVAN (-1%) and YARINA (-6%) moved down to ranks 7 and 8, respectively. Despite 5% sales gain, AC-TOVEGIN moved down from rank eight to ten. The more dynamic AMOKSI-KLAV (+10%) held its previous rank 9. The total share of the top 10 trade names reduced from 8.4% to 8.2%.
Table 2. The top ten trade names by pharmacy sales
Rank Trade name
Share in total pharmacy sales, %
2012 2011 2012 2011 1 1 ARBIDOL 1.2 1.6 2 2 ESSENTIALE N 1.2 1.3 3 3 LINEX 1.1 1.0 4 4 VIAGRA 0.8 0.8 5 22 CYTOVIR-3 0.7 0.5 6 13 OCILLOCOCCINUM 0.7 0.5 7 6 LASOLVAN 0.6 0.7 8 5 YARINA 0.6 0.7 9 9 AMOKSIKLAV 0.6 0.6 10 8 ACTOVEGIN 0.6 0.6 Total 8.2 8.4
Only the leader of the top ten INN and generic names ranking XYLOMETAZO-LINE (+34%) didn't change its rank (Table 3). Five INNs of the top 10 rose in the ranks. INNs PHOSPHOLIPIDS (+3%), and the composition BIFIDOBACTE-RIUM INFANTIS + ENTEROCOCCUS FAECIUM + LACTOBACILLUS ACIDOPHILUS (+19%) and AMOXICILLIN + CLAVULANIC ACID (+15%) moved up one rank, to numbers two, five and eight. INNs with higher sales rates PARACETAMOL + ASCORBIC ACID + PHENIRAMINE (+24%) and IBUPROFEN (+22%) moved up from ranks eight and ten to ranks four and seven, respectively. At the same time, INNs with negative sales rates moved down to lower ranks. They were UMIFENOVIR (-14%), PANCREATIN (-4%) and KETOPROFEN (-1%) which moved down to ranks 3, 9 and 10, respectively. AMBROXOL (+5%) also moved down one rank, to number 6. The total share of the top 10 under review didn’t virtually change and accounted for 11.6%.
Table 3. The top 10 INN and Generic Names by pharmacy sales
Rank INN/Generic Names
Share in total phar-macy sales, %
2012 2011 2012 2011 1 1 XYLOMETAZOLINE 2.1 1.7 2 3 PHOSPHOLIPIDS 1.3 1.4 3 2 UMIFENOVIR 1.2 1.6
4 8 PARACETAMOL + ASCORBIC ACID + PHENIRAMINE 1.1 1.0
5 6 BIFIDOBACTERIUM INFANTIS + EN-TEROCOCCUS FAECIUM + LACTOBA-CILLUS ACIDOPHILUS
1.1 1.0
6 5 AMBROXOL 1.0 1.0 7 10 IBUPROFEN 1.0 0.9 8 9 AMOXICILLIN + CLAVULANIC ACID 1.0 0.9 9 4 PANCREATIN 0.9 1.1 10 7 KETOPROFEN 0.9 1.0 Total 11.6 11.5
Numerous shifts took place in the top ten ATC groups ranking as well (table 4). However, two ATC groups of the top 10 ranking retained their earlier ranks. They were the leader of the top ten ATC groups R01 Nasal preparations (+21%) and M01 Anti-inflammatory and antirheumatic products (+12%) at number 7. Due to outstripping sales rates, the groups R05 Cough and cold preparations (+11%), L03 Immunostimulants (+16%), A07 Antidiarrheals, intestinal anti-inflammatory / antiinfective agents (+20%) and J05 Antivirals for systemic use (+28%) moved up to higher ranks two, six, eight and ten, respectively. At the same time, four less dynamic ATC groups moved down to the lower ranks. They were J01 Antibacterials for systemic use (+8%), G03 Sex hormones (+2%), N02 Analgesics (+9%) and A11 Vitamins (+8%). The total share of the top 10 increased from 40.6% to 41.9%.
Table 4. The top ten ATC Groups by pharmacy sales
Rank ATC code ATC group
Share in total phar-macy sales, %
2012 2011 2012 2011 1 1 R01 NASAL PREPARATIONS 5.5 5.0 2 4 R05 COUGH AND COLD PREPARATIONS 4.6 4.5 3 2 J01 ANTIBACTERIALS FOR SYST USE 4.6 4.6 4 6 L03 IMMUNOSTIMULANTS 4.4 4.1
5 3 G03 SEX HORM&MODULAT GENITAL SYS 4.2 4.5
6 5 N02 ANALGESICS 4.2 4.1 7 7 M01 ANTIINFLAM & ANTIRHEUM PROD 4.1 4.0 8 9 A07 INTESTINAL ANTIINFECTIVES 3.7 3.4 9 8 A11 VITAMINS 3.6 3.6 10 13 J05 ANTIVIRALS FOR SYSTEMIC USE 3.0 2.5 Total 41.9 40.2
Conclusion. On the basis of the results for 2012, the retail pharmacy market of Khabarovsk brought in RUB 3.193 bln (USD 103.092 mln). At the same time, the market increased 9% in terms of roubles and 4% in terms of dollars. In pack terms the market showed negative growth rates (-2%) and achieved 17.058 mln packs. In 2012, the average cost of an OTC pack in the city phar-macies was much higher than in the year-earlier period (USD 6.04 vs. USD 5.69) and considerably exceeded the Russia average figures (USD 3.82). Per capita expenses amounted to USD 176.06 which is notably higher than on the average in Russia (USD 117.58).
77,5
99,1
17,4
80,4
103,1
17,1 0
20
40
60
80
100
120
In value terms(wholesale prices)
In value terms (retailprices)
In physical terms(packs)
Sale
s, $
mln
2011
2012
-2%
Sales trend 2011/2012
+9% (RUB) +4% ($)
+9% (RUB) +4% ($)
AIPM - Remedium Market Bulletin, page 10 Issue 3, March 2013
REGIONAL DIGEST
State Reimbursement Program//Procurement of Necessary Drugs, Gov-ernment Control
March 4. 2013, The Vedomosti
Ministry of Public Health to try out pharmaceutical benefits schemes in the regions in 2015-2016
The Russian transition to Pharmaceutical Reimbursement Strategy will begin in 2017. In 2015-2016, different pharmaceutical benefits schemes will be tried out in the regions, but it is not yet decided in which ones. The more detailed information is provided in the Pharmaceutical Reimbursement Strat-egy until 2025, which was approved by the Ministry of Public Health Veronika Skvortsova on February 13. Before, the pilot schemes in the regions were scheduled for launch in 2014, and one of the pharmaceutical reimbursement schemes - for introduction in 2016.
March 11, 2013, ITAR-TASS
Government allocated RUB 5.5 bln to the Russian Federation's constit-uent entities for co-funding of expenditures for high-tech medical care
The Prime-Minister of Russia Dmitri Medvedev approved the distribution of subsidies to be provided in 2013 from the federal budget to the budgets of Russian Federation's constituent entities for co-funding of expenditures for high-tech medical care to the population of the Russian Federation. As is reported on the Official Internet Portal of Legal Information, the amount of subsidies allocated from the federal budget for these purposes totalled to RUB 5.5 bln. Earlier on, the Head of Ministry of Public Health Veronika Skvortsova said that this year the high-tech medical care can be provided to 150 thousand people, for which purposes the regions will allocate RUB 4.5 bln more than in the year-earlier period.
March 11, 2013, RIA News
The Government considers it premature to specify names of particular drugs in the tender documents
The Government of Russia considers it premature to introduce amendments into the Law Concerning the Placing of Orders for Supplies of Goods, the Per-formance of Work and the Rendering of Services for State and Municipal Requirements, according to which in certain cases the names of particular drugs are proposed to be specified in the tender documents, according to the public affairs office of the Cabinet of Ministers of the Russian Federation. The draft law proposes to specify in the tender documents the names of drugs which are intended for patients with abnormal disease progression, complica-tions of basic diseases and comorbidities, when dangerous drug combinations are assigned, and when intolerance to medication is developed, only by the medical panel decision. In these cases, no equivalents are supposed to be used.
March 14. 2013, The Vedomosti
Roszdravnadzor to maintain a register of drugs released to free circula-tion
The Ministry of Public Health proposes to the drug manufacturers to report to the Federal Service for the Supervision of Public Health and Social Develop-ment (Roszdravnadzor) for each batch of drug released. Roszdravnadzor will maintain a register of drugs released to free circulation. If a drug is not in-cluded into the register, it cannot be sold. Such proposals are included in the amendments to the Law Concerning Circulation of Drugs published on the website of the Ministry of Public Health. According to the spokesperson of the Ministry, the proposals relate to the receipt of data on each batch or lot of drugs which comes onto the market. Data confirming a release of another batch or lot of drugs will be included into the register of Roszdravnadzor.
March 19, 2013, The Novye Izvestia
Ministry of Public Health to change the procedure for pricing vital and essential drugs
The law shall prohibit pharmaceutical manufacturers from changing prices for vital and essential drugs more frequently than once a year. It is detailed in the amendments to the Law Concerning Circulation of Drugs published by the Ministry of Public Health yesterday. However, the experts feel doubt wheth-er this will make medication more affordable. Drug manufacturers will in-clude allowances for any and all risks in their prices once a year and, in addi-tion, will make good the possible losses at the cost of other drug categories.
March 19, 2013, The Vedomosti
Ministry of Public Health proposed to consider biologicals to be inter-changeable
According to the draft amendments to the Law Concerning Circulation of Drugs published on the website of the Ministry of Public Health, the biologi-cals (medicinal preparations made from living organisms and their products, e.g. insulin) may be interchangeable. It means that biosimilars (i.e. medicinal preparations that are produced using similar production process, or similar substances, etc. as original biological preparations) will be proscribed and bought instead of the original preparations.
Mach 19, 2013, RBK.ru
Patients' Association opposed substitution of drugs for biosimilars
Russian Patients' Association opposed a new version of amendments to the Law Concerning Circulation of Drugs proposed by the Ministry of Public Health. It is stated in the open letter of the Association to the Prime Minister of Russian Federation Dmitri Medvedev. According to the proposal of Minis-
try of Public Health, Item 12 of Article 4 gives that "a substitute is a medicinal preparation which has proven therapeutic equivalence with the original me-dicinal preparation". Patients' Association believes that the new version of the Article became absolutely anti-patient. It "makes biosimilars inter-changeable and it is not important which reserve clauses are used", the let-ter says.
March 25, 2013, The Pharmatsevticheski Vestnik
State Duma passed the draft law concerning federal purchasing system in a third reading
On March 22, State Duma passed the draft law concerning the system of public procurement contracts in a third final reading. A part of provisions in that document relates to the purchase of medicinal preparations. In particu-lar, the document contains a number of conditions under which a participant of purchasing shall be excluded from participation in the selection of suppli-ers or conclusion of a contract with a winner shall be refused at any time before the conclusion of a contract when purchasing medicinal preparations included into the VED List. The draft Law Concerning the System of Public Procurement Contracts for Products, Work or Services for State and Munici-pal Needs is scheduled to be considered in the The Council of Federation of the Federal Assembly of the Russian Federation on March 2013.
NEWS FROM COMPANIES
March 4, 2013, GMPnews
Geropharm-Bio intends to start production of human insulin in the Moscow Region in 2013
The task of designing production facilities for genetically-engineered insulin that hasn't been implemented for many years will be translated into reality in the Southern Moscow Region. This year Geropharm-Bio will open a human insulin production facility in Obolensk. The area of pharmaceutical complex will total to 9.4 thousand sq m. New industrial complex will make it possible to produce not only insulin, but also develop production of new drugs for treatment and prevention of diabetes and other socially significant diseases. The plant is expected to produce about 25 mln vials and 5 mln cartridges of insulin per year.
March 20, 2013, The Vedomosti
Abbott is awaiting approval for purchasing a vaccine maker Petrovax
Abbott Laboratories agreed on the purchase of Petrovax Pharm. The respec-tive agreement was signed by the parties in the middle of the last year. In August 2012, Abbott applied to the Federal Anti-monopoly Service (FAS) for permission to buy Petrovax Pharma. FAS haven't considered the application yet, as the transaction should be first approved by the government commis-sion on foreign investment, the sources close to both companies said. A spokeswoman for Abbott, Irina Gushchina, explained that the planned trans-action was a follow-up of long-term cooperation between Abbott and Pe-trovax Pharma in Russia. Pharmstandart filed its application for purchase of Petrovax Pharma in January, but FAS postponed consideration of the applica-tion until April 30.
March 25, 2013, Remedium
Leaders of the 2012 rating of influence of the Russian pharmaceutical market entities have been determined
At year-end 2012, the drug makers Pharmstandart, Stada and Akrikhin be-came the leaders of the annual rating of influence of the Russian pharmaceu-tical market entities. The companies were nominated in the category Local Pharmaceutical Manufacturer. The rating is one-of-a-kind for the pharmaceu-tical industry. It reflects not actual results of the business development (for example, the traditional comparison of the volume of sales or production), but the most important regularities in the information space of the local pharmaceutical industry.
PERSONS
March 11. 2013, The Vedomosti
Mikhail Murashko appointed to the management of Roszdravnadzor
Elena Telnova has stood down as head of Russia's federal healthcare products surveillance agency, Roszdravnadzor, since 2010. She is replaced by Mikhail Murashko, the former deputy of Telnova, since March 7, the Ministry of Pub-lic Health and Roszdravnadzor reported. "The usefulness of transformations became particularly evident after more frequent perversions of procedures for providing medical care approved by the Ministry of Public Health, closures of separate health care facilities without preparation of infrastructure and transport conditions for optimization of public health service", the Ministry explained on its website.
All rights reserved to AIPM – Remedium (Remedium Group) Source of information – IMS Health If you have questions or comments, please contact: Vladimir Grigorievich Shipkov, Executive Director of AIPM Tel: 933 70 40 Information of AIPM in Internet: http://www.aipm.org Ekaterina Korduban, Director for PR and Remedium Group Develop-ment Tel: 780 34 25, fax: 780 34 26 Information of Remedium Group in Internet: http://www.remedium.ru
Related Documents