Welcome message from author
This document is posted to help you gain knowledge. Please leave a comment to let me know what you think about it! Share it to your friends and learn new things together.
Transcript

Making The Numbers Count:
Why Proprietary School Performance Data Doesn’t Add Up and What Can Be Done About It Written by: Deanne Loonin, Staff Attorney, National Consumer Law Center Julia Devanthéry, Research Assistant, National Consumer Law Center
ACKNOWLEDGMENTS The authors wish to thank Tanya Both, Svetlana Ladan, Di Lu, Elizabeth Renuart, and Steve Tripoli and Will Ogburn of NCLC for their substantive contributions, editing, and production assistance. Although too numerous to name here, we thank the many individuals, including state licensing and accreditation agency staff and higher education data experts who generously contributed their time and insight to this project. National Consumer Law Center is a non-profit organization specializing in consumer issues on behalf of low-income consumers. NCLC works with thousands of legal services, government and private attorneys, as well as community groups and organizations that represent low-income and elderly individuals on consumer issues.

Table of Contents
FINDINGS AND EXECUTIVE SUMMARY ................................................................... 1 FOCUS OF THIS REPORT ............................................................................................... 5 STUDENT PROFILES....................................................................................................... 8 A TROUBLED HISTORY............................................................................................... 10
The Government Response ........................................................................................... 10 CURRENT PROBLEMS AND TRENDS........................................................................ 11 JOB PLACEMENT AND COMPLETION RATES: AN IN-DEPTH INVESTIGATION........................................................................................................................................... 14
The Companies Studied ................................................................................................ 14 1. Apollo Group (University of Phoenix) ................................................................ 14 2. ITT Educational Services..................................................................................... 17 3. Career Education Corporation (CEC).................................................................. 19 4. Corinthian Colleges ............................................................................................. 22 5. Education Management Corporation (EDMC).................................................... 23
JOB PLACEMENT AND COMPLETION CLAIMS: EMPTY NUMBERS THAT MISLEAD STUDENTS ................................................................................................... 25
The Law of Job Placement and Completion Data ........................................................ 25 KEY FINDINGS............................................................................................................... 26
Investigation Methodology: .......................................................................................... 27 ACCESS TO PLACEMENT AND COMPLETION INFORMATION IS SEVERELY LIMITED .......................................................................................................................... 28
Information From the Schools ...................................................................................... 28 Information From State Licensing Agencies ................................................................ 29 Information From Accreditation Agencies ................................................................... 29 Information From The U.S. Department of Education................................................. 30
COMPARING THE NUMBERS: PUBLICLY REPORTED RATES VS. RATES REPORTED TO THE GOVERNMENT.......................................................................... 31 KEY PROBLEMS WITH COMPLETION AND JOB PLACEMENT DATA ............... 36
1. The Calculation Formula is Flawed......................................................................... 36 2. Too Few Campuses Collect and Report Data .......................................................... 37 3. The information is self-reported and thus impossible to verify............................... 38 4. Lack of Enforcement of Data Collection and Reporting Mandates......................... 38
States ......................................................................................................................... 39 Accreditation Agencies............................................................................................. 39 U.S. Department Of Education ................................................................................. 41
POLICY RECOMMENDATIONS .................................................................................. 42


FINDINGS AND EXECUTIVE SUMMARY
• Problems in the for-profit higher education sector are by no means just a legacy of the past. In particular, consolidation of the industry and the focus on growth poses a serious risk factor for abuse. In recent years, numerous companies have been the subject of private lawsuits and government investigations alleging marketing abuses and other serious violations. Misrepresentations frequently involve inflated claims that students will graduate and find jobs.
• It is extremely difficult to get completion rate or placement information
from the schools and state licensing agencies. In addition, the accreditation agencies in our survey claimed that the information was completely private.
• There is a federal data base for completion rates only. This data base is
promising, but is not publicized widely and contains outdated information. The federal Department of Education does not even collect job placement information.
• The for-profit sector aggressively markets their schools as gateways to
employment. Job placement numbers, in particular, are cited at very high levels, usually above 80%. We found that despite federal mandates, schools are not reporting job placement information as required and are not making the data they do collect publicly available.
• In site visits conducted for this report, no admissions representatives gave
official completion rate statistics, even though they are required to do so by law and even though they were specifically asked for this information.
• The completion and placement information that is given out is generally
misleading and in many cases inaccurate. For example, schools will generally inflate completion rates. In fact, the most recently federal reported completion rate information for the five schools in this study showed strikingly low numbers: For four year programs, Apollo Group’s rate was 7%; Corinthian’s was 31%; Education Management Corporation’s was 47%; ITT’s was 49%; and Career Education Corporation’s was 59%.
• There are serious flaws with both the accuracy of the publicly reported
information and government data. The calculation formula for completion and placement rates is flawed and subject to manipulation; too few campuses collect and report data; the information is self-reported and thus impossible to verify; and enforcement by states, the federal government, and accreditation agencies is dismal.
1

• The regulatory triad of the federal Department of Education, state
licensing agencies, and accreditation agencies is failing to protect students. The promise of for-profit education for these students can only be fulfilled if and when the schools, accreditation agencies, and government regulators understand and enforce the accurate measuring and reporting of school performance information. Recommendations for reaching this goal are presented below.
Vast improvement in job placement and completion data integrity is needed in order to make this information useful and meaningful.
Suggested improvements include:
• Companies with less than 75% of total, eligible campuses reporting completion rates should be placed on probation by the federal Department of Education, state agencies, and accreditation agencies. During this probation period, the schools should be prohibited from making any claims about company-wide completion data. Individual campuses may continue to report data as they long as they have provided such data to the National Center on Education Statistics (NCES). The company must also disclose to students that it cannot provide them with company-wide completion data because they are on probation with regulatory agencies.
• Require NCES to collect and make available job placement as well as
completion data. Schools must substantiate placement rates, as required in the regulations, including statements from employers and income tax forms as long as student privacy is adequately respected. These records must be retained for a reasonable period of time.
• Reduce the exclusions in the completion rate calculation formulas and
require schools to report the number of students placed in each exclusion category, such as numbers on active military duty or permanently and totally disabled.
• Include selected part-time students in the completion rate calculations.
• Any company that reports a company wide job placement rate of over
80% for two consecutive years should automatically be audited by the federal Department of Education or appropriate state agency. A similar standard should be set for completion rates.
• Any company that reports a company wide job placement rate of 35% or
less for two consecutive years should automatically be audited by the federal Department of Education or appropriate state agency. A similar standard should be set for completion rates.
2

Once data integrity is considered sufficient, improve the availability of the data. Recommendations include:
• The Department of Education seems to provide a good potential infrastructure for public access to institutional performance data. NCES should find ways to keep this data as updated as possible and inclusive of accurate completion and job placement rates. Students and the public should also be made aware of this resource.
• States must also be required to provide links to the federal data to any member of
the public who is interested in examining the performance of proprietary institutions.
• As the General Accounting Office recommended in 1996, require accrediting
agencies to develop and make public uniform, performance-based consumer protection standards, including but not limited to job placement and completion rates.
Reporting mandates must be rigorously enforced. Recommendations to expand and preserve existing protections against proprietary school fraud include:
• Immediately undertake a non-partisan study of current fraud and abuse in federal financial aid programs and of the effectiveness of the current protections.
• Preserve the protections that have been effective in curbing fraud and abuse.
• Restore the most effective protections, such as cohort default rates and incentive
compensation, to full strength.
• Revise the formula for calculating cohort default rates to more accurately reflect actual default rates.
• Consider changes to existing protections on a demonstration project basis only and
carefully measure the results of these projects. For example, the Distance Education Demonstration Project has played an effective gate-keeping role in testing the distance education waters without opening the door to widespread fraud and abuse.
• Expand student loan debt cancellation remedies for victims of proprietary school
abuses.
3

4

Making the Numbers Count: Why Proprietary School Performance Data
Doesn’t Add Up and What Can Be Done About It
June 2005
INTRODUCTION
Equal access to quality education is fundamental to American society. This general principle has very practical implications. Studies consistently show that education is one of the most important indicators of economic status in our society. Education after high school is more than just a fulfilling experience; it is often the difference between basic financial independence and poverty.
In order to promote educational opportunities, the government has opened up federal financial assistance program over the years to the neediest students, including many students attending vocational schools. The motivations for these policies are generally laudable. And in many cases, federal funds have given students unprecedented access to higher education.
Unfortunately, this is not the end of the story. Federal aid for education can become an insurmountable burden rather than a benefit. This is especially true in the for-profit higher education sector where all too often, schools prey on vulnerable students’ dreams of betterment through education. As a result, the financial assistance that was intended to help these students does little more than bury them in debt.
As Congress debates the reauthorization of the Higher Education Act, it is more important than ever to ensure that the dream of accessible higher education can be a reality. In a time when the American workforce is aging, with college-educated baby boomers retiring, and too few new skilled workers to meet business needs, it is essential that vocational education teach real skills and provide a true gateway to employment.
FOCUS OF THIS REPORT
This report focuses on the for-profit or proprietary higher education sector because this is where abuses have been most prevalent in the past and because serious problems persist. It is also becoming the sector of choice for many
5

working adults and other “non-traditional” students seeking to further their education while remaining in the workforce and raising families.
The proprietary sector holds out the promise of flexible courses and employment-oriented education. In some cases, these promises are real. In all cases, it is essential for prospective students to have access to as much information as possible about a school, especially prior to enrolling. Whether students can actually obtain this information and whether this information is useful and meaningful is the subject of this report.
The focus of our investigation is on job placement and completion information. If this data is flawed, and we find that it is seriously flawed, students suffer. Further, if the incentive to inflate numbers or misrepresent numbers in order to maintain and grow profits takes over, the data becomes no more than a tool to lure in students.
Education is expensive and increasingly out of reach of many lower-income and even middle-income Americans. As with other expensive services, it is critical that consumers know what they are getting. If they are looking for a school that is likely to help them get a better job, they need to know the school’s track record of graduating students and the track record of employment for its graduates. Unfortunately, we found that it is extremely difficult for students to access this information.
As described in detail below, our investigation included site visits to selected local campuses; phone conversations with enforcement personnel at the state and federal levels and at accreditation agencies; examination and analysis of federal completion rate data; additional interviews; reviews of company annual reports and web sites.
The importance of performance data cannot be underestimated. The ability of an institution to produce good results is a clear indication of whether a student will get a valuable education and employment or become mired in debt. The stakes are huge for both students and taxpayers. Most students incur significant debt in order to invest in education. If a school is inferior, or if a student is not well-suited for the school, she almost always has to repay those loans, regardless of the quality of the education, generally regardless of whether she was able to complete the course, and regardless of whether she finds employment.
In general, only treason, murder, and student loan collection have no statute of limitations in this country. A loan taken out by a twenty-five year old single mother for a worthless program of study will likely haunt her until she reaches retirement age and beyond. Even a portion of her Social Security income can be seized to pay back delinquent loans. It is extremely difficult to discharge a federal student loan and it is only getting harder. Clearly the government has an
6

important interest in collecting student loans, but its powers in this area are far beyond the powers of any private creditor. There is little recourse available to students who are victims of school misrepresentations and other abuses.
The harm to taxpayers arises from the enormous dependence on federal aid dollars to fuel growth. In annual reports and other information to investors, the companies repeatedly note their reliance on federal student aid to stay in business and to grow. Forbes Magazine, for example, described Career Education Corporation (CEC) as a “company built to swallow Title IV [federal student assistance] funds in the way a whale gathers up plankton.”1 In March 2005, Department of Education Chief Operating Officer Theresa Shaw reported in a presentation to the career college trade association that federal student assistance funding for proprietary schools increased by 54% between 2001-02 and 2003-04, with a 70% increase for publicly held schools.2
Schools that abuse the financial aid system by forging student signatures or by enrolling ineligible students waste taxpayer money. Schools with high student default rates also cost the taxpayers money.
The ultimate tragedy is the shattering of student’s dreams. Many of these students are uniquely vulnerable because they have not previously performed well in school or are from disadvantaged backgrounds. Everyone deserves a chance. But everyone also deserves the opportunity to get clear information before putting their financial futures on the line. Vulnerable students need to know whether a particular school is likely to fulfill the lofty promises that it uses to bring the students in the door.
1 Daniel Kruger, “Blackboard Jungle,” Forbes Magazine, Dec. 13, 2004. 2Theresa S. Shaw, Chief Operating Officer, “Federal Student Aid Update,” Presentation to Career College Association, March 16, 2005. Available on-line at: http://www.career.org/Template.cfm?Section=News_You_Can_Use&CONTENTID=2967&TEMPLATE=/ContentManagement/ContentDisplay.cfm#15 (last visited June 2005).
7

Student Profiles
Jennifer Henley Like many potential students Jennifer Henley saw ads for Laptop Training Solutions (LTS) of San Diego, a proprietary computer training school, on television. Henley’s situation made her a prime target for the advertisement: she was unemployed and increasingly feeling that she lacked marketable skills. According to media reports, LTS’ advertisements claimed that students would receive quality classroom instruction and would graduate to high paying jobs that were in great demand. Henley said she was promised a starting salary of at least $38,000. LTS promoted itself as “America’s No. 1 Rated Computer Training Company” on the internet-an apparently empty claim, as Henley soon discovered. After enrolling and taking out a $12,000 loan for her Microsoft Certification program, Henley was handed a laptop computer and several CD-ROMs and sent home. Instead of the traditional classroom instruction they had advertised, LTS offered only independent home study. “I didn’t understand a thing,” she said. “I kept reviewing the disks but could not get past the first one.” Henley dropped out of the program after two frustrating weeks of home study. According to news reports and a recent lawsuit, LTS refused to refund her tuition. An audit by the California Bureau for Private Post-Secondary and Vocational Education uncovered several shortcomings at LTS including: uncertified instructors, missing student files, false advertising, and failure to pay required dues to the Student Tuition Recovery Fund. The state gave the school a deadline to correct its deficiencies, but LTS instead filed for bankruptcy and closed its doors. Henley has joined other distressed former students in a class-action suit against LTS. The suit claims that the school engaged in false advertising, unfair business practices, and several violations of the California education code. Doug Campion, the attorney handling Henley’s class action suit against LTS, called the case “one of the most egregious frauds I’ve ever seen.” According to Campion, a former LTS trainer revealed that of the 800-1,000 students enrolled in LTS, only 12 students ever passed the Microsoft Certification exam for which the course was meant to train students. Sources: Michael Louie, Laila Weir and Lisa P. White, “State Lax for Vocational Schools,” The Sacramento Bee, (8/18/04); www.10News.com, The San Diego Channel, 9/15/03, Media Center Offers Free Computer Training Courses; www.10News.com, The San Diego Channel, 9/24/04, Laptop Training School Closes With No Warning; June 2005 Interview with Douglas J. Campion, Esq., Law Office of Douglas J. Campion, San Diego, CA.
8

Janice Doe Janice completed her liberal arts bachelor's degree after age 62 and was going back into the work-force. She immediately began to look into getting a master's degree. She believed that a master's degree in art therapy would allow her to provide counseling services to disabled adults. After researching career opportunities, she learned that there would be very few opportunities strictly as an art therapist. However, a master's degree in counseling would broaden her job prospects and still enable her to provide counseling services that utilize art therapy. A master's level counseling program was not available at Southwest College in Santa Fe, where she was currently pursing her master’s. She interviewed staff at the University of Phoenix who assured her that the approximately 58 credit hours she previously earned from Southwest College would transfer to the University of Phoenix and be counted towards her degree requirements in counseling. Even though the bulk of her course work at Southwest College was in counseling, she was required to take a three month long "orientation" in counseling at the University of Phoenix at the cost of $1000. This orientation did not carry any credits that were applied to her master's degree. During the orientation, Janice was not allowed to enroll in any regular credited classes that would fulfill her counseling requirements. Following three months of the mandatory orientation, Janice enrolled in her first counseling courses at the University of Phoenix. Not until she completed her first semester did she learn that virtually none of the credits she earned would be counted towards her counseling requirements. The University of Phoenix would transfer 3/4 of a credit for each class she took at Southwest. But the licensing department of New Mexico, and presumably other states, would not accept only a partial credit for a class to count towards the licensing requirements. Janice was never told that her prior class work would not be applicable to a counseling degree. Frustrated and infuriated, Janice decided to transfer out of the University of Phoenix. She was disappointed to find, however, that the school she planned to transfer to would only recognize the number of credits that her prior institution claimed she had. Janice, who will be 64 years old when she finishes later this year, will owe upwards of about $75,000 in student loans on her two year master’s degree. Source: Interview with Patricia Wagner, June 2005, Attorney, Senior Center Law Office, Bernalillo County, New Mexico.
9

A TROUBLED HISTORY
Abuses in the proprietary sector have been a tremendous source of frustration, financial loss, and loss of opportunity for consumers striving to get ahead. These problems were particularly widespread during the 1980’s and early 1990’s when student financial assistance became more widely available for non-high school graduates and for vocational training. The abuses were fueled by a federal student loan system that created a con artist’s perfect dream. Schools were able to pressure vulnerable and low-income consumers into signing documents obligating them to thousands of dollars. Many schools promised that students would not have to repay loans until they got high paying jobs. The schools then literally took the money and ran, leaving collection to third parties and the government. The range of problems discovered at that time included:
• Deceptive recruitment practices, • False claims and representations to prospective students, • Falsification of admission and financial aid records, • Disbursement of aid to ineligible students, and • Non-existent or inadequate teaching infrastructure.3
The Government Response
Although it took a great deal of time and ruined the lives of countless students, the government eventually addressed most of the worst abuses. This was accomplished largely due to an increased enforcement presence as well as a number of new protections. Among the most important new laws Congress passed during this time:
• Default Rate Sanctions: Penalizing schools with consistently high loan default rates.
• The 90/10 (formerly 85/15) Rule: Requiring schools to limit the percentage of revenues received from federal financial assistance to no more than 90 percent.
• Limits on Student Aid for Schools that Offer Predominantly Correspondence and
Telecommunications Courses.
• Minimum Instructional Time Requirements.
• Minimum Completion and Job Placement Rate Requirements (discussed in detail in this report).
3For general information about past abuses, see National Consumer Law Center, Student Loan Law ch. 9 (2d ed. 2002 and Supp.); Testimony of Barmak Nassirian, Associate Executive Director, American Association of College Registrars and Admissions Officers, U.S. House Committee on Education and the Workforce ( June 16, 2004). Available on-line at: http://edworkforce.house.gov/hearings/108th/fc/heaprop061604/nassirian.htm (Last visited June 2005).
10

• Incentive Compensation Ban: Prohibiting commissions, bonuses, and other incentive
payments to school employees and recruiters.
• Limited Loan Forgiveness for Victims of Fraud: Writing off federal loans for many of the students hurt by school closings, false certifications of eligibility, and unpaid refunds.
Despite the persistence of serious problems in the for-profit education sector, many of these
protections have been substantially weakened or eliminated. Others are currently under attack. For example, Congress and the U.S. Department of Education have steadily expanded the ability of schools to appeal their default rate and have eliminated certain types of loans from the default rate calculations. In addition, current legislation proposes to eliminate the 90/10 rule; and the Department, through its own rulemaking, added 12 major loopholes to the incentive compensation ban.
CURRENT PROBLEMS AND TRENDS
Problems in the proprietary higher education section are by no means just a legacy of the past. New abuses are now emerging, in many cases, more serious than ever. Department of Education Inspector General John P. Higgins testified in May 2005 that the student financial assistance program is a high risk area that remains vulnerable. He explained that, “while fraud and abuse does occur at non-profit and public sector institutions, historically, fraud and abuse predominantly involves proprietary schools. In fact, over the last six completed fiscal years the majority--approximately 74 percent--of our institutional fraud cases involved proprietary schools.”4 Further, the Inspector General has concluded that the Department’s institutional assessment model is an ineffective tool for identifying “at risk” institutions.5
The proprietary school sector looks significantly different than it did in the previous heyday of abuses. The most significant change is toward a consolidation among very large, publicly traded corporations. Publicly traded postsecondary education stocks rose 460 percent over the period of 2000-2003, compared to a 24 percent loss for the Standard & Poor’s 500-stock index.6 According to Investor’s Business Daily, the for-profit educational providers are among the fastest-growing and best-performing businesses in the U.S.7 The Education and Training industry currently has a market capitalization of $32.8 billion. The five companies highlighted in this report (Apollo Group, Education Management Corporation, Corinthian Colleges, Career
4 Statement of John P. Higgins, Jr., Inspector General, Department of Education, Before the House Committee on Government Reform, May 26, 2005. Available on-line at: http://reform.house.gov/UploadedFiles/Dept%20of%20Ed%20IG%20-%20Higgins%20Testimony.pdf (Last visited June 2005). 5 United States Department of Education, Office of Inspector General, “Final Audit Report: Case Management and Oversight’s Monitoring of Postsecondary Institutions,” Control No. ED-OIG/A04-D0014 (Sept. 30, 2004). 6 Eryn Brown, “Can For-Profit Schools Pass an Ethics Test?,” New York Times, December 12, 2004. 7 Brian Deagon, “ITT Education Searched, Subpoenaed, Hitting Shares, But Reason Isn’t Clear; School Lender Sells Off 33%; US Seeks Lots of Records; Mystery Scares Investors, Rivals Tumble in Sympathy,” Investor’s Business Daily, February 26, 2004.
11

Education Corporation and ITT Educational Services) make up about 74% of that enormous business.8
Department of Education Chief Operating Officer Theresa Shaw reported in March 2005 that the number of proprietary school campuses increased by more than 21% from 2001-02 through the current year. The campuses of publicly held corporations grew by more than 37%. The comparable increase for all school types during this same period was 13%.9 Increased Number of Campus Locations-Proprietary Schools
More Than 21% Increase for All More Than 37% Increase for Publicly Held
1,319
2,349
1,462
2,470
1,745
2,660
1,812
2,651
0
500
1,000
1,500
2,000
2,500
3,000
2001-02 2002-03 2003-04 Current
Publicly Held Privately Held
Source: Theresa S. Shaw, Chief Operating Officer, “Federal Student Aid Update,” Presentation to Career College Association, March 16, 2005.
8 Yahoo! Finance, Industry Browser, Services, Education and Training, Company List, http://biz.yahoo.com/p/766conameu.html (last visited June, 2005). 9 Theresa S. Shaw, Chief Operating Officer, “Federal Student Aid Update,” Presentation to Career College Association, March 16, 2005. Available on-line at: http://www.career.org/Template.cfm?Section=News_You_Can_Use&CONTENTID=2967&TEMPLATE=/ContentManagement/ContentDisplay.cfm#15 (last visited June 2005).
12

Increased Title IV Funding Levels-Proprietary Schools
Source: Theresa S. Shaw, Chief Operating Officer, “Federal Student Aid Update,” Presentation to Career College Association, March 16, 2005.
There is no question that the schools are focused on growth. Annual reports are filled with detailed graphs and tables showing growth in enrollment, growth in campuses, and growth in profits. It is likely that there are benefits to this market model. Some say that market orientation allows proprietaries to be more innovative and flexible. There is certainly potential for this to occur. However, this same profit motive can, unless constrained by reasonable protections for consumers and taxpayers, induce schools to engage in practices that harm their students and taxpayers.10 Even the Department of Education’s Inspector General has warned that rapid growth is a risk factor for abuse in the federal financial aid programs.11
Serious problems arise when schools pursue their bottom lines at the expense of
providing worthwhile educations. A former dean at a campus of Career Education Corporation summarized the problem in discussing his former employers: “Everything is a numbers game with them, it’s not about education.”12
10 See, Testimony of Barmak Nassirian, Associate Executive Director, American Association of College Registrars and Admissions Officers, U.S. House Committee on Education and the Workforce (June 16, 2004); News from Congressman George Miller, “Republican Higher Education Bill Removes Barriers to Fraud and Waste, Says Representative Miller,” Press Release (June 16, 2004). Available on-line at: http://edworkforce.house.gov/democrats/releases/rel61604b.html (Last Visited June 2005). 11 Statement of John P. Higgins, Jr., Inspector General, Department of Education, Before the U.S. House Committee on Government Reform (May 26, 2005). 12 Sam Kennedy, “School’s Pursuit of Profit Leaves Students Behind,” The Morning Call, April 24, 2005.
$3.28$2.98
$4.18
$3.52
$5.56
$4.15
$0.00
$1.00
$2.00
$3.00
$4.00
$5.00
$6.00
$7.00
2001-02 2002-03 2003-04
Publicly Held Privately Held
54% Increase for All 70% Increase for Publicly Held
13

JOB PLACEMENT AND COMPLETION RATES: AN IN-DEPTH INVESTIGATION
The Companies Studied
In constructing the sample for this study, we aimed to select the companies with the most financial clout in the industry. Additionally, we chose to focus on the companies with the largest impact on the public—serving large numbers of students and marketing to the general population of potential students. The selection of Apollo Group, Career Education Corporation, ITT Educational Services, Corinthian Colleges, and Education Management Corporation was made after examining their financial records and noting their enrollment and campus growth. These companies best represent the enormous growth potential of this sector. They are emblematic of companies that have developed a highly profitable business model for education services.
Among for-profit higher education companies as of 2005, Apollo Group was the leader in market capitalization, CEC was number two and Education Management Corporation, number three. ITT was not far behind at number 5 and Cornithian placed seventh.13 Apollo was also the leader in total revenue, with $2.0 billion, followed once again by CEC with $1.8 billion and Education Management with $979.9 million. Corinthian was in fourth place with $949 million and ITT in seventh, with $636.3 million. Detailed information about each company is presented below.
1. Apollo Group (University of Phoenix)
Company Name
Sample tuition (4 years)
2004 net income
2003 net income
2002 net income
% of revenue from Title IV $
2004 Enrollment
2003 Enrollment
2002 Enrollment
Apollo $40,000 for BA in Business
$ 278 million
$ 247 million
$ 161 million
“less than 90%”* 255,000 200,100 157,800
* We were unable to find the precise figure. Apollo reported in its annual report that the revenue percentage was less than 90%. Sources for Table: Apollo Group 2004 Annual Report; Annual Report 2003; Apollo Group 2004 10-K; University of Phoenix prospective student information packet.
Apollo Group, the parent corporation of the University of Phoenix (UOP), is the largest postsecondary proprietary school corporation. Posting $278 million in net income for fiscal year 2004 (by far the largest among the corporations in this sample) Apollo Group epitomizes the incredible growth and income capacity of the proprietary school sector. The heavy advertising for University of Phoenix, especially electronically, has made it one of the most ubiquitous and 13 Yahoo! Finance, Industry Browser, Services, Education and Training Services, Leaders and Laggards, Market Capitalization and Total Revenue lists, http://biz.yahoo.com/ic/ll/766pip.html (last visited June 2005).
14

recognizable names in the industry. University of Phoenix is not Apollo’s only brand, but it is by far the program with the most campuses (150 in the U.S. and British Columbia) and the most students (255,000).
There are two characteristics that set University of Phoenix apart from many of its highly specialized for-profit peers: first, it offers only bachelors and master’s degrees, and second, it targets and serves a predominantly working, adult student population. As opposed to providing vocational or trade education, Apollo Group has designed a career-oriented BA that differs drastically from a liberal art’s degree, but includes enough general education requirements to be considered a legitimate bachelor’s by accrediting and certifying bodies. Along with being older and more middle class on average, typical students are adult professionals who are working full time and seeking a highly flexible course of study that both fits their schedule and improves their skill set. University of Phoenix has also been at the forefront of the distance education movement.14
Recent Investigations and Problems
• A false claims (“whistleblower”) lawsuit filed in California in 2003 by former employees alleges that UOP falsely represents that it is in compliance with the Higher Education Act’s prohibition against using incentive payment for recruiters. Instead, according to the complaint, UOP compensates enrollment counselors based directly upon enrollment activities. The complaint alleges that UOP is aware of the illegality because, among other reasons, they openly brag to employees about duping the federal government. The case was dismissed on procedural grounds in 2004, but is on appeal. The Justice Department filed an amicus brief asking the court to reverse the dismissal.15
• A Department of Education Program Review Report from August 2003 details numerous
violations of incentive compensation regulations.16 UOP reached an agreement with the Department, which acknowledged no admission or concession of any liability and settled by paying $9.8 million. Findings are discussed in greater detail below.
• Numerous shareholder class actions were filed against the Apollo Group in 2004.17
Plaintiffs alleged violations of the Securities and Exchange Act based on the company’s alleged issuance of false and misleading statements, largely in connection with failure to publicly disclose the contents of the DOE Program Review.
14 Apollo Group Annual Report, p. 13, About Us from www.apollogroup.com. 15 U.S. ex. Rel. Hendow and Albertson v. University of Phoenix, Case # Civ. 5-03-0457 (E.D. Ca. complaint filed March 7, 2003). The Justice Department’s argument is based on procedural issues regarding filing of false claims suits and is not tied to the specific allegations in this complaint. See also Goldie Blumenstyk, “Justice Department Supports $1-Billion False Claims Suit Against University of Phoenix,” Chronicle of Higher Education, January 28, 2005 at A32. 16 U.S. Department of Education, “Student Financial Assistance Program Review Report”, PRCN 200340922254, University of Phoenix, Site Visit of 8/18/03-8/22/03. Hereafter “DOE Review Report.” 17 See, e.g., Sekuk Global Ent. V. Apollo Group, Case #CV04-2147 (D. AZ. Complaint filed Oct. 12, 2004); Carmona et al. v. Apollo Group, Case #CV04-2204 (D. AZ. Complaint filed Oct. 18, 2004).
15
Marketing Structure
A 2003 Department of Education program review provides a detailed look at the University of Phoenix marketing structure. In this review, the Department found extensive use of incentive compensation based on enrollments for those involved in recruiting or admission activities, in violation of the Higher Education Act requirements.18
More than 70% of the recruiters in the review reported that they were unaware of any basis for compensation other than enrollment numbers and recruiting activities.19 Literally every recruiter interviewed randomly or outside of the work premises said that enrollment numbers determined their salary. All stressed that UOP had previously been more student and education oriented. After its Wall Street debut, however, UOP eliminated the focus on students and became increasingly aggressive in its obsession with numbers, according to employees interviewed for the Department’s review.20 The Department also found many improprieties involving federal student assistance funding that occurred because recruiters wanted to receive credit for enrollments.
Overall, the review describes an aggressive marketing campaign that sells education at all costs. Recruiters are given intensive sales training that deals with sales techniques and has little or nothing to do with academically advising students. Promotions to higher levels are based on sales.
One recruiter stated that “the culture in the organization gravitated away from quality education and quality counseling, to getting bodies in the door. The number of enrollments is what counts.”21 According to the report, the enrollment director was quoted as telling recruiters, “It’s all about the numbers. It will always be about the numbers. But we need to show the Department of Education what they want to see.”22 The review raises repeated concerns that students are kept in class even when they are unable to perform, and that there is pressure to enroll unqualified students.
In addition, in the 2003 false claims lawsuit referred to above, a former counselor alleged serious violations of the incentive compensation rules as part of an overall marketing scheme that places extreme pressure on admissions recruiters to put students in seats (or in front of computers). For example, the lawsuit alleges that UOP urges counselors to enroll students without reviewing their transcripts to determine their academic qualifications. Salaries, according to the complaint, are tied to a matrix where counselors are rated based upon enrollments and enrollment activities. The counselor in this lawsuit was one of the highest paid counselors. She alleges that she was promised salary increases based upon enrollment activities. Counselors are also rewarded with trips and contest awards, according to the lawsuit, and low enrollment numbers leads to termination.
18 DOE Review Report 19 DOE Review Report, p. 17. 20 Id. pp. 24, 26. 21 Id. p. 10. 22 Id. p. 10.
16

2. ITT Educational Services
Company Name
Sample tuition (2 years)
2004 net income
2003 net income
2002 net income
% of revenue from Title IV $
2004 Enrollment
2003 Enrollment
2002 Enrollment
ITT *could not be obtained
$75 million
$59 million
$44 million
66% 40,876 37,076 32,631
*Admissions counselor refused to disclose the total cost of tuition in site visit, but according to the College Opportunities On-Line database an Associate’s degree (which is less than two years) costs about $13,248. Sources for Table: ITT Educational Services Annual Report 2004; ITT Educational Services 2004 10-K; perspective student information packet.
ITT Educational Services, Inc. operates ITT Technical Institute in thirty states throughout the country. With a focus on preparing students for careers in technical fields, ITT’s curriculum is organized around teaching the practical application of computer skills and knowledge. Students attend class in long time blocks three times a week and have the option of taking some online courses. ITT delivers education services to about 40,876 students at 77 different campuses. Experiencing burgeoning growth immediately after becoming publicly traded in 1994, ITT’s profits have consistently climbed, reaching a peak of $75 million in fiscal year 2004.23
Recent Investigations and Problems
• Federal agents on behalf of the U.S. Department of Justice (DOJ) raided the headquarters of ITT and 10 campuses in February 2004.24 According to news reports, the FBI and other federal agents said they were looking into allegations that ITT was inflating student enrollment data to secure government funding.25 ITT reported in its 2004 annual report that the DOJ investigation is ongoing and that no formal charges have been filed. The company also reported that it established an internal review committee which was completed and reported that it had found no evidence that senior management had engaged in any violations.
• A false claim suit was filed against ITT in April 2004. The case alleges that ITT
knowingly used false records and statements relating to, among other things, student recruitment, admission, enrollment, attendance, grading, graduate placement, and course materials.26
23 ITT Educational Services Inc., Annual Report 2004, p. 2; Overview of ITT, from www.ittesi.com.
24 ITT reported the raid in its 2004 annual report. 25 See, e.g., Adelia Cellini Linecker, “Industry Worries Don’t Slow Educator Down,” Investor’s Business. Daily, June 17, 2004, A06. 26 U.S. ex rel. Robert Olson v. ITT Educational Services, Inc (S.D. Ind. Complaint filed April 8, 2004) and reported in ITT’s 2004 Annual Report. ITT reported that the U.S. Department of Justice had declined to intervene in the litigation.
17

• Numerous shareholder lawsuits have been filed against ITT, alleging that ITT failed to disclose in various earnings reports that they systematically falsified records, including records related to enrollment, graduation, and job placement rates, in order to artificially inflate reported operational and financial performance and that a portion of the Company’s revenues were derived through fraudulent business practices, such as financial aid payments secured through falsified records.27 In one of the complaints, plaintiff City of Austin Police Retirement System alleges that they interviewed more than a dozen former employees and found a “host of tricks” to falsify student information, including inflated enrollment figures, counting students as “enrolled” who never attended, double counting enrollees, and misrepresenting attendance and placement rates.28
• In addition to the federal raids noted above, on March 9, 2004, the company revealed that
it was being investigated by the Securities and Exchange Commission (SEC) and by the California Attorney General.29 The company reported that the California Attorney General had been investigating since October 2002, focusing on whether ITT falsified student grades and attendance records.
ITT acknowledged in its 2004 annual report that the corporation had accrued $25.1 million of
special legal and other investigation costs associated with the DOJ and SEC investigations. Marketing Structure
In one lawsuit against ITT, former employees complained that ITT set unrealistic goals for enrollment, retention, and placement and exerted enormous pressure to enroll students.30 The complaint quotes a former admissions representative, characterizing the job as similar to selling “used cars.”31 Overall, the former employees bringing the suit describe a culture where enrollment figures were manipulated, many “enrollees” never attended school, attendance and grades were inflated, and placement rates were misrepresented.
27 See, e.g., Coffin v. ITT, Case #1:04CV00386 (D.D.C. complaint filed March 9, 2004); Segalia v. ITT, Case #1:04-Cv-0422 (S.D. Ind. Complaint filed March 3, 2004); Lowson v. ITT, Case # 1:04-CV-0591 (S.D. Ind. Complaint filed March 29, 2004); Norton v. ITT, Case # 1:04-CV-0593 (S.D. Ind. Complaint filed April 1, 2004). 28 City of Austin Police Retirement System v. ITT Educational Services, Civ. Action # 1:04-cv-00380 (S.D. Ind. Complaint filed February 26, 2004). 29 In an e-mail from the SEC to NCLC in May 2005, the agency said that no legal action had been brought to date against CEC. However, the SEC cannot deny or confirm the existence of an investigation that has not been a matter of public record. 30 City of Austin Police Retirement System v. ITT Educational Services, Civ. Action # 1:04-cv-00380 (S.D. Ind. Complaint filed February 26, 2004). 31 Id.
18

3. Career Education Corporation (CEC)
Company Name
Sample tuition
2004 net income
2003 net income
2002 net income
% of revenue from Title IV $
2004 Enrollment
2003 Enrollment
2002 Enrollment
CEC Could not be obtained*
$179,619 million
$112,804 million
$61,819 million
58% 97,300 79,500 50,400
*Admissions counselor refused to disclose the total cost of tuition in site visit, but according to the College Opportunities On-Line database an Associate’s degree (which is less than two years) costs about $19,700. Sources for Table: Career Education Corporation 2003 Annual Report; 2002 Annual Report; Career Education Corporation 2004 10-K; investor relations email inquiry.
CEC’s schools aim to equip students for careers in everything from culinary arts to medical assisting. The most commonly recognized of CEC’s brands is Katherine Gibbs College, but it also counts 23 other schools in its corporate family. The business model that drives CEC’s approach to growth is highly acquisition oriented. The 2004 Annual Report sets the ambitious goal of purchasing two to three new schools a year, which has led to 26 acquisitions over the course of its 10 year history. CEC has also thrown itself into the online education market with American Intercontinental University (launched in 2001) and reports that growth since then has been “meteoric, propelling CEC to the number two ranking for-profit online providers of 2003.”32 As of 2003, CEC had 72 US locations and 79,500 students—21,000 of whom are enrolled in distance education programs. This multifaceted corporate model has led CEC to break revenue records every quarter since it first went public in 1998; net income for 2004 was a mammoth $119 million.33
Recent Investigations and Problems
• In 2005, CEC reported that it was the subject of investigations by both the Justice Department and the SEC and a defendant in four lawsuits filed since July 2004.34 The SEC investigation followed a complaint made by a former registrar of a campus in California who in her resignation letter alleged that “many staff members have been asked by management to commit forgery, fraud, perjury, or whatever else is necessary” in order to keep the school’s accreditation, which is needed to be eligible for federal student loans.35 According to news reports, the accreditation agency, Accrediting Council of Independent Colleges and Schools, found no wrongdoing. In addition, an internal review
32 CEC Annual Report, 2003, pp. 7 & 21; Profile, from www.careered.com.
33CEC Annual Report, 2003, pp. 7 & 21; Profile, from www.careered.com.
34 “Some Things You Just Can’t Teach,” New York Times, May 15, 2005. 35 See Stephen Schurr, “For-profit Education Faces Big Test”, Financial Times, June 24, 2004; “Some Things You Just Can’t Teach,” New York Times, May 15, 2005.
19

of allegations of securities laws violations concluded that there was no support for claims that senior management had violated securities laws.36
• In December 2004, California’s overseer of career colleges issued a critical report of the
practices at CEC’s Brooks Institute of Photography, where it discovered in November that student withdrawal forms had been tampered with and job placement numbers overstated.37 The state agency found that this campus of Brooks Institute conferred unapproved educational titles in violation of state law. The agency also noted serious problems with the information in the school catalog and with enrollment agreements. Further, the Agency found that the school did not have a school performance fact sheet with data required by state law including completion and placement rates. The Agency also cited violations of law based on admitting obviously unqualified students with no reasonable prospect of completing the program.38
• There are also a series of shareholder class action lawsuits filed against the company.39
Among other claims, the suits allege that the company misled investors because it failed to disclose that CEC had been regularly falsifying student records in order to increase graduation rates and enrollment, conceal problems that could have threatened accreditation, and to allow it to increase profits. Among other allegations, the complaints claim that CEC’s schools graduated students who had not completed required courses and regularly credited and billed students for taking courses the students had never attended.
• A group of former employees sued CEC in Massachusetts in 2004.40 The lawsuit alleges
that the employees observed CEC’s illegal policies and practices aimed at enrolling unqualified students for profit, and then failing to adequately train them for their roles as medical professionals.
• A story on the CBS television news show, 60 Minutes, in January 2005 highlighted
misrepresentations by CEC. A number of Brooks College graduates interviewed for the school told 60 Minutes that the school robbed them and lied to them about job placement.41
36 “Some Things You Just Can’t Teach,” New York Times, May 15, 2005. 37 Stephen Schurr, CEC Faces Further Fraud Claims, Financial Times, December 15, 2004; California Bureau for Private Postsecondary and Vocational Education, Renewal Application and Compliance Visit, December 1, 2004. (on file with authors). 38 California Bureau for Private Postsecondary and Vocational Education, Renewal Application and Compliance Visit, December 1, 2004 (on file with authors). 39 A number of cases were consolidated and later dismissed without prejudice and leave to amend. See Taubenfeld v. Career Education Corp., 2005 WL 350339 (N.D. Ill. Feb. 11, 2005). See also Jaffee v. CEC, Civ. 04C 1024 (N.D. Ill. Complaint filed 2/10/04). 40 Millio v. Whitman Educ. Group Inc., CEC et al., Case # 3:04-CV-30130 (D. Ma. Complaint filed July 9, 2004). 41 CBS News Transcripts, 60 Minutes, January 30, 2005, “An Expensive Lesson; Career Education Corporation Schools.”
20

Marketing Structure
According to the numerous media reports, lawsuits, and other investigations listed above, CEC sets specific quotas for its recruiters. For example, a 2003 letter from the president of one CEC school states that recruiters had quotas of 125 calls daily and 10 recruits a month.42 Lawsuits filed by former employees allege that the schools falsified student records and regularly graduated students who did not complete courses, among other questionable tactics, in order to ensure consistent growth in enrollment.
The former night dean at one CEC school complained that, “everything is a numbers game with them, it’s not about education.” The dean reported numerous misleading sales tactics, explaining that, “they want you to do anything to takes to bring in students and retain them as long as possible, even if the students can’t be successful.”43
In the 60 Minutes story discussed above, former employees explained that they were not admissions representatives, despite their title, but really sales people. Reporter Steve Kroft cited a report by the Western Association of Schools and Colleges that only about 38% of Brooks’ students ever finish the program and the average starting salary for all graduates is less than $11/hour or around $22,000 annually. According to the report, admissions representatives were expected to enroll three high school graduates a week, regardless of their ability to complete the course work. If they didn’t meet those quotas, they were out of a job.44
42 Sam Kennedy, “School’s Pursuit of Profit Leaves Students Behind,” The Morning Call, April 24, 2005. 43 Id. 44 CBS News Transcripts, 60 Minutes, January 30, 2005, “An Expensive Lesson; Career Education Corporation Schools.”
21
4. Corinthian Colleges
Company Name
Sample tuition (less than 2 years)
2004 net income
2003 net income
2002 net income
% of revenue from title IV $
2004 Enrollment
2003 Enrollment
2002 Enrollment
Corinthian $11,430 for a medical assisting certificate
$82 million
$66 million
$39 million
81% 65,000 43,000 34,000
Table Sources: Corinthian Colleges Inc. Annual Report 2004; Corinthian Colleges Inc. 2004 10-K; prospective student information packet.
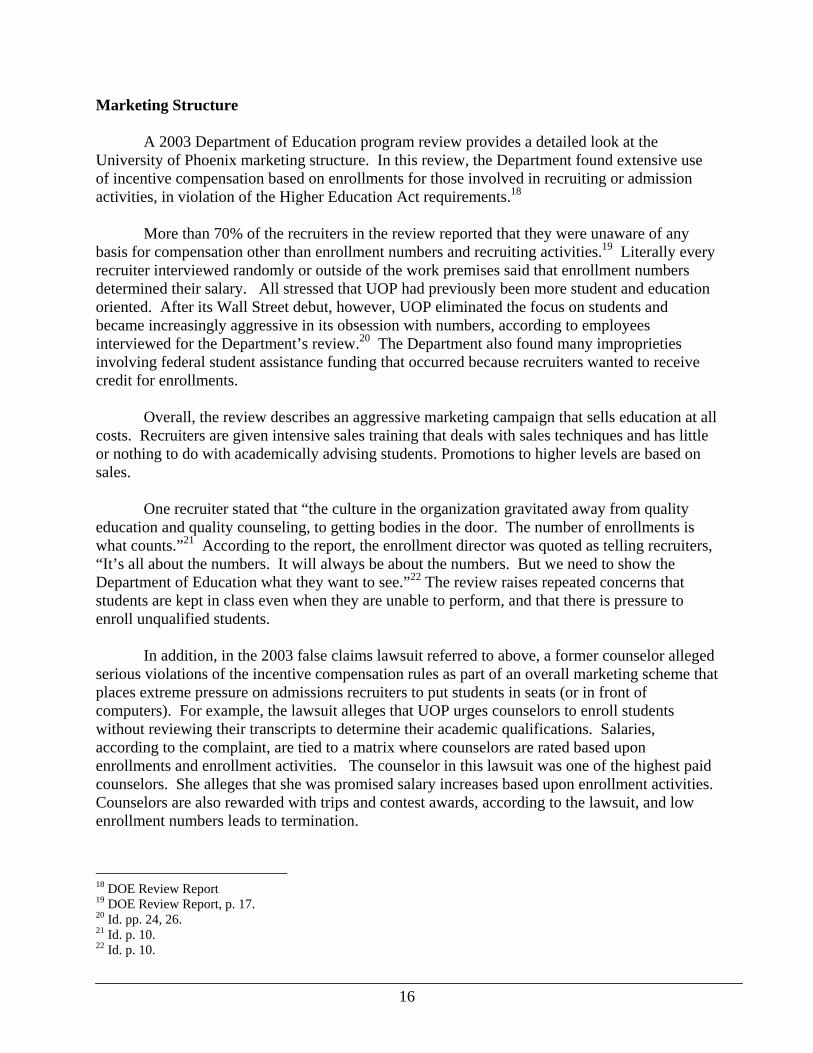
Under Corinthian Colleges Inc.’s umbrella are 19 different trade and professional school chains in 91 different locations around the country and in Canada. There is a heavy concentration of Corinthian schools in California, but their presence is felt throughout North America. Fifty-two of the company’s current locations are purchases from competing providers of vocational education that have subsequently been integrated into the Corinthian family.
The programs available at Corinthian Colleges are generally focused on the healthcare,
business, criminal justice, and information technology fields. Corinthian has recently begun offering students the opportunity to take classes in an online environment, which has allowed the corporation to tap into the high growth potential of distance education. Corinthian shareholders have been profiting handsomely, sharing in the 110% growth that has taken place over the course of the past two fiscal years. The company’s 2004 net profit was $82 million.45
Recent Investigations and Problems
• The company reported that the Department of Education’s western regional staff conducted a program review at the Bryman San Jose campus in December 2003. The Department said that it found violations in how the college administered federal aid programs.46
• A class action was filed in Florida in 2004 alleging that employees at a Corinthian
campus misrepresented to students that they would easily be able to transfer credits from that institution. Corinthian sued the plaintiff’s attorney for defamation. In May 2005, a California Court of Appeal dismissed Corinthian’s suit against the class action attorney.47
45 Corinthian Colleges Inc. Annual Report, 2004, pp. 2, 56; About Corinthian from www.cci.edu.
46 Id. 47 Corinthian Colleges v. Price, 2005, WL 1199069 (Cal. App. May 20, 2005).
22

• In a lawsuit filed against the company in May 2003, the Plaintiff alleged that she spent countless hours and dollars to obtain vocational training in diagnostic medical sonography at Nova Institute of Health Technology. 48 In the end, according to the complaint, she discovered that she was deceived about the qualifications of faculty, job prospects, and transferability of credits to mainstream colleges.
• The company reported that it met with representatives from the California Attorney
General office in July 2004 and provided them with information about previously settled lawsuits.49
Marketing Structure
A former Corinthian employee testifying before Congress in March 2005 stated that, “it was not until I stepped in the position and began learning the process by which Corinthian operated that I realized the extent of the unethical and underhanded proceedings that took place, all for the sake of mere admission enrollment numbers and quotas, regardless of the student’s needs, desires, and hopes for a better future.”50 She testified further that many times, attendance records were adjusted and altered to suit the need of the school to increase enrollments and that prospective students were enticed to visit the campus with the idea of attending one particular program, and if that program was not offered, strong-armed into attending another.
5. Education Management Corporation (EDMC)
Company Name
Sample tuition (4 years)
2004 net income
2003 net income
2002 net income
% of revenue from Title IV $
2004 Enrollment
2003 Enrollment
2002 Enrollment
EDMC $70,300 for BA in Interior Design
$77 million
$56 million
$42 million
68.2% 58,828 43,784 32,180
Table Sources: Education Management Corporation Annual Report 2004; EDMC 2004 10-K; New England Institute of Art prospective student packet.
Education Management Corporation has been providing postsecondary education for forty years. With a focus on the arts (The Art Institutes are EDMC’s largest chain) students can study communication, design, fashion, and culinary arts at EDMC schools. There are also programs in information technology, education, health care, and business available at EDMC institutions.
48 Estrada v. Corinthian Schools, Inc., Case No. VC039522 (Sup. Ct. Cal. First amended complaint filed May 29, 2003). The company reported in its 2004 Annual Report that the case was settled. 49 Corinthian Colleges, Inc., 2004 Annual Report, p. 77. 50 Testimony of Paula Dorsey, “Enforcement of Federal Anti-Fraud Laws in For-Profit Education,” Hearing Before the U.S. House Committee on Education and the Workforce, March 1, 2005. Available on-line at: http://edworkforce.house.gov/hearings/109th/fc/60minutes030105/dorsey.htm (last checked June 2005).
23

The company’s growth has been substantial: its net income has more than doubled since
2000 (when it was $22 million) to $77 million in 2004. The company’s 66,000 students are enrolled at 70 campus locations and these numbers are also increasing at a rapid rate. Since becoming publicly traded eight years ago the school has increased student enrollment at an average annual rate of 21% and each year the company has either created or acquired a handful of new schools.51
Recent Investigations and Problems
• 326 students sued EMC, the Art Institutes International in March 2000 alleging false claims and misrepresentations regarding nature and quality of credits, instruction, sufficiency of instructors, and job placement services.52
Marketing Structure The EDMC marketing model is described in a discrimination lawsuit against the company. Although the case centers on allegations of race discrimination, it also describes a system that requires admissions employees to meet enrollment targets that are set by management. 53 According to the complaint, missing enrollment targets can result in escalating levels of discipline, from a poor evaluation, to the issuance of a letter of concern, to placement on probation, to termination.
51About EDMC from www.edmc.com; Dream Big: Education Management Corporation Annual Report 2004 pp. 1-3.
52 In re Education Management Corporation, Inc., 14 S.W. 3d 418 (Ct. App. Tx. 2000) (decision related to arbitration). 53 Legrand v. New York Restaurant School, 2004, WL 1555102 (S.D.N.Y. July 12, 2004).
24

JOB PLACEMENT AND COMPLETION CLAIMS: EMPTY NUMBERS THAT MISLEAD STUDENTS
The lawsuits and investigations described above paint a picture of aggressive marketing
that is at a minimum deceptive and misleading and in some cases illegal. Misrepresentations frequently involve inflated claims that students will graduate and find jobs. There are repeated charges that schools inflate or misrepresent this information in order to attract students. These are among the most serious abuses because students, for the most part, go to these schools because they want better, higher paying jobs. Further, they are recruited with claims of high graduation and placement rates.
Prospective students are repeatedly given advice to do their homework before signing up for a school. Specifically, the federal Department of Education on its website urges students to consider performance data when shopping for a career college or technical school.54 The Federal Trade Commission (FTC) advises prospective students to get some idea of the program's success rate. The FTC advises students to: “Ask what percentage of students complete the program. A high dropout rate could mean that students don't like the program. How many graduates find jobs in their chosen field? What is the average starting salary?”55 In addition, the Better Business Bureau cautions students to compare the courses, rates of completion, and job placement percentages with those being offered in the community by public schools, community colleges, nonprofit, and for-profit schools.56 This is all sound advice, but can students follow it? Our investigation set out to explore the reality behind this straightforward advice, focusing on whether completion and placement information is made available to students by schools, state and federal regulators, and accreditation agencies. Further, even if the information is available, we examine whether it can be relied upon or whether these are just empty numbers.
The Law of Job Placement and Completion Data Proprietary schools that participate in federal student aid programs have an explicit
directive to prepare students for employment in recognized occupations. While this is an important goal for all higher education institutions, only proprietary schools are required by law to fulfill this mission. Specifically, programs at a proprietary institution of higher education may be eligible for federal financial assistance only if the school provides an eligible program of training to prepare students for gainful employment in a recognized occupation and is accredited by a nationally recognized accrediting agency.57
54 See http://www.ed.gov/students/prep/college/consumerinfo/considerations.html (Last visited June 2005). 55 Federal Trade Commission, “Facts for Consumers Choosing a Career or Vocational School,” available on-line at http://www.ftc.gov/bcp/conline/pubs/services/votech.htm (May 2001) (Last visited June 2005). 56 Better Business Bureau, “Choosing the Right Career Training School”, available on-line at: http://www.bbb.org/alerts/article.asp?ID=278 (Sept. 6, 2001) (Last visited June 2005). 57 20 U.S.C. §1002(b).
25

There are a number of additional regulatory requirements that at a minimum mandate that schools collect and retain data on completions and job placement and in some cases require that this information be disclosed to prospective students. Key requirements are summarized below. 1. Minimum Placement and Completion Standards: Proprietary schools offering educational programs of at least 300 clock hours of instruction, but less than 600 hours, offered during a minimum of 10 weeks, are not eligible to participate in the main federal student loan programs unless they have a verified completion rate for those programs of at least 70% and a verified job placement rate of at least 70%.58 2. Accreditation Agency Standards. Accreditation agencies are required to demonstrate that they have rigorous standards. The regulations set out factors that accreditation agencies must address in evaluating the quality of an institution including success with respect to student achievement, and as appropriate, consideration of course completion, state licensing examination, and job placement rates.59
3. Disclosure Requirements for Completion and Placement. Institutions must sign agreements with the Secretary of Education in order to participate in federal student assistance programs. Institutions that advertise job placement rates as a means of attracting students to enroll must make available to prospective students, at or before the time that those students apply for enrollment, the most recent available data concerning employment statistics, graduation statistics, and any other information necessary to substantiate the truthfulness of the advertisements.60
4. Completion Disclosure Requirements. An institution must make available to any enrolled student or prospective student, on request, through appropriate publications, mailings, or electronic media information concerning financial assistance and the institution’s completion or graduation rate and if applicable its transfer-out rate. In the case of a prospective student, the information must be made available prior to the student’s enrolling or entering into any financial obligation with the institution.61
5. Annual Reporting of Completion Rates. Institutions must make completion or graduation rates available annually.62
KEY FINDINGS
Having isolated job placement and completion rates as two of the most critical measures
of proprietary vocational school success, we set out to evaluate the performances of the 58 20 U.S.C. §1088(b)(2)(A). 59 34 C.F.R. §602.16. 60 34 C.F.R. §668.14. 61 34 C.F.R. §668.41. 62 34 C.F.R. §668.45.
26

corporations in our sample. There are four main sources through which we expected to find access to this information: the schools themselves, including advertisements and web sites, accreditation agencies, state certification offices, and the federal Department of Education.
As discussed in detail below, through a series of site visits, phone interviews, and other inquiries, we discovered that prospective students do not have easy access to verifiable information about the success of proprietary schools. The U.S. Department of Education statistics are incomplete and unreliable, state licensure processes differ in rigor and do not publicize results, and accreditation agencies guard the data they collect from schools closely, considering it private.
Investigation Methodology: Tester Site Visits
In order to collect information from the schools, we designed a survey methodology that was carried out through site visits. The aim of these visits was to determine the accuracy of the information provided to prospective students. An NCLC employee set up an appointment with the admissions office at a local campus for each of the five corporations in our study. The site visits were conducted in April 2005. In each interview, she explicitly asked about completion and job placement rates. She developed a narrative that reflected the experiences of someone who would be seeking a better future through career-oriented training: a 2000 high school graduate who lives at home and has been working in retail for four years. She described her academic record as mediocre, but characterized herself as someone who was now ready and motivated to succeed, having tasted the difficulty of working low-level jobs. The narrative was presented consistently at each school. The campuses visited: School Parent Company Focus Location Gibbs Career Education
Corporation Administrative Assisting Boston, MA
The New England Institute of Art
Educational Management Corporation
Communications/Visual Art Brookline, MA
University of Phoenix Apollo Group BA in Business/ Information Tech Westborough, MA Bryman Institute Corinthian Colleges, Inc Medical/ Dental Assisting Brighton, MA ITT Tech ITT Educational
Services, Inc Technical Training Woburn, MA
Survey of State Licensing Agencies and Accreditation Agencies
In order to uncover whether or not job placement and completion rates are used as criteria for evaluation by State Certification departments and accrediting agencies, several phone interviews were conducted. Both licensing and accrediting staff were asked whether their agency
27

tracks completion rates or job placement rates of for-profit schools that operate in their jurisdiction. The licensing department sample is made up of geographically, demographically, and politically diverse states. The accrediting bodies were chosen on the basis of the fact that they accredit one of the five proprietary school companies that we focus on in this report (Career Education Corporation, Apollo, Corinthian, Education Management Corp., or ITT). Survey of Federal Department of Education
The National Center for Educational Statistics (NCES) administers the Integrated Postsecondary Education Data System (IPEDS). This is an online data collection program that compiles information on all identified postsecondary institutions in the U.S. It is part of the Department of Education, Institute of Education Sciences. IPEDS contains institutional data such as tuition and salaries of instructional staff, as well as student data, which includes enrollment numbers and the race and gender of students. Institutions self-report this information electronically each year.63 There are three major ways to view IPEDS: the highly specialized and sophisticated Peer Analysis and Data Cutting Tools, and the more user friendly College Opportunities On-Line (COOL) tool. Examination of the statistics available from the Department of Education was done through phone interviews with staff at NCES. This guidance from NCES staff was essential as the database is extremely complex and difficult for someone with little experience to navigate.
ACCESS TO PLACEMENT AND COMPLETION INFORMATION IS SEVERELY LIMITED
Information From the Schools
For all of the discussion about the advantages of career-oriented training and the focus on practical, marketable skills, the admissions counselors at the campuses visited by and large evaded the question of how many graduates from their schools were placed in jobs that were relevant to their courses of study. Moreover, they hesitated to comment on the likelihood that an enrolled student would complete the course of study, mostly refusing to disclose completion rates. Completion No admissions representative gave official completion rate statistics. The various verbal responses to the question “So, how many people graduate” were: “I don’t know, but I can find out and give you a call if you want,” “I am not allowed to talk to you about hard data, but in your next admissions meeting they’ll be able to tell you,” “The rate is really high, I just don’t know it off the top of my head!” The one representative who gave a verbal answer in the form of a rate made clear it was just an approximation and not the actual number; he wanted to double check it. 63 See About IPEDS: http://nces.edu.gov/ipeds/.
28

Only the University of Phoenix gave out written material which included a brochure in which the average completion rate of all campuses was given. The rate was in tiny print on the back of the brochure, which was never discussed in the course of the interview. At Gibbs the representative said that the completion rates were not satisfactory because of students from Dorchester and Roxbury (lower socioeconomic areas of Boston) who “have multiple kids” and cannot fulfill the course requirements. Job Placement and Expected Earnings Job placement rates were equally difficult to obtain. Most admissions officers would not give placement in the form of a rate. At the Gibbs campus we visited, prospective students are given a printout from the U.S. Department of Labor which details the average salaries of workers in the field of interest. At the time of our visit, this was the only information that was given out or otherwise posted at the campus regarding employment possibilities for graduates. The ITT campus visited displayed lists of companies that employ its graduates on a large billboard in a campus hallway, but no rates or salary information was given to prospective students. The University of Phoenix admissions officer offered no information about employment after completion and the campus that was visited did not in fact have a career resource center. In two cases, at the New England Institute of Art and the Bryman Institute, the representative gave official placement rates. These numbers were both above 85%, which may be why they were offered. The New England Institute of Art reported an 88.1% placement average placement rate across its programs and a $26,014 starting salary. At Bryman, 85% of students who graduated were placed in relevant professional fields, according to the school. As noted below, there is no way to verify whether these job placement numbers reflect reality.
Information From State Licensing Agencies
We interviewed staff at ten state licensing agencies, Arizona, California, Colorado, Florida, Illinois, Massachusetts, Minnesota, New York, Texas, and Tennessee. Only eight even require schools to annually report completion and job placement data. Among these eight, state employees conceded that the results of a school’s completion and placement reporting were a matter of public record. However, in each of these states, the employees reported that information was not published on a web site or in a newsletter. The consensus among state contacts was that if a prospective student wanted information that could only be found in these reports, he or she could request to see them in person. On the spot perusal would be permitted, but that is the extent to which the data is made public. Furthermore, no department of education employee in the sample could recall a student making such an inquiry. In addition, none of the state employees directed us to the federally collected data.
Information From Accreditation Agencies
As discussed above, accreditation agencies are required by law to evaluate institutions on several measures, including completion and job placement. Most accreditation agencies collect data relating to institutional performance, yet none in our study considered the information to be
29

public. Although they may have the most information on the proprietary schools they accredit, these agencies rely on the institution to self-report the data. According to our interview with selected agencies, on-site investigations take place more in a disciplinary context in response to serious complaints and are less likely to occur on a regular basis for quality control purposes. This result is especially discouraging given that the General Accounting Office recommended in 1996 that accrediting agencies develop and make public uniform, performance-based consumer protection standards, including information on completion and placement rates.64 This was a key recommendation in response to the tragic abuses of the late 1980’s and early 1990’s, yet it appears that it is still not being taken seriously.
Information From The U.S. Department of Education
Under the Student Right to Know Act disclosure requirements, discussed above, postsecondary institutions, including private for-profits, must make completion rates available to both enrolled and prospective students. Schools are expected to disseminate this data through a publication on an annual basis. Any prospective student should receive the most recent completion data in writing.
Peer Analysis and Data Cutting Tool: A potential student interested in investigating the performance of schools could theoretically go to the NCES website and explore Integrated Postsecondary Education Data System (IPEDS). In order to access the greater IPEDS survey, a member of the public must log on through the Peer Analysis tool or the Data Cutting Tool. The most recent cohort enrollments and completions can be found here, although rates are not calculated by the schools or NCES. However, despite the fact that the data is available and access is formally unfettered, there are several barriers students will encounter.
Because of the quantity of data collected, coded and maintained through IPEDS, the database has an enormous universe. There are several levels of variable selection, which requires the visitor to understand variable names and codes that are sometimes quite complicated. Both the Peer Analysis and the Data Cutting Tool require experience and skill with statistical databases that the general public does not have. Without the aid of NCES staff, we would not have been able to locate specific information that we were interested in. Yet this was the only way to access the most recent data. We were only able to harness the critical IPEDS information by enlisting the support of a statistical expert and NCES staff. This speaks to the difficulty of understanding and maneuvering the database. The Executive Peer Tool allows investigators to take short-cuts to certain desired data, which could be promising. Although the Executive Peer Tool makes access to completion data more easily accessible than the broader Peer Analysis Tool, the data continues to be out of reach 64 U.S. General Accounting Office, “Department of Education: Status of Actions to Improve the Management of Student Financial Aid,” GAO/HEHS-96-143 (July 1996).
30

for lay people. IPEDS remains an effective resource only for those who are trained in statistics or in the field of education, but does not seem to serve as an appropriate way of providing information to the public or prospective students. College Opportunities On-Line (COOL)
NECES also provides another information service to the public that details certain data on postsecondary schools—including for-profit institutions. The mission of the College Opportunities On-Line database seems to be to inform prospective students about institutions in their geographic area or program of interest.
The information available through COOL ranges from tuition costs to accreditation status, and includes graduation rates. There is some truly useful numbers provided by COOL such as number of students receiving financial aid and the cohort default rates, as well as a campus safety report (which is stipulated in the Student Right to Know Act). However, as of mid-2005, this data was from the 2000 IPEDS survey, which is clearly outdated and does not reflect the current performance of an institution.
Although there are serious flaws with the completion data itself and the reporting of completion data, it is at least collected in some consistent way. This is not the case with job placement data. NCES does not collect job placement rates for any type of institution. A staff member at the Office of the Inspector General (IG) confirmed in a phone message to NCLC that he was not aware of any office at the Department of Education that collects placement rates. He noted that the NCES collects graduation/completion rates, but not placement rates and referred us to the accreditation agencies. However, as discussed in this report, the accreditation agencies in our study consider any placement data, or other data about schools, to be private information. The fact that the Inspector General’s office referred us to the accreditation agencies was either a brush-off or an indication that that the IG believes that the accreditation agencies will give that information to the public. In either case, this is a serious problem that needs to be addressed.
COMPARING THE NUMBERS: PUBLICLY REPORTED RATES VS. RATES REPORTED TO THE GOVERNMENT
In order to compare data given out by the schools, it is first necessary to get that information from the schools. We found that it is very difficult for prospective students to find out about graduation rates from a particular institution, and job placement rates are even harder to obtain.
Through our site visits reported above, we were able to get completion rates from only one of the schools in our survey, University of Phoenix. With few exceptions, the schools we visited did not give out this information in response to our requests. We also searched more broadly in the various corporations’ annual reports and web sites to examine whether they give out data in those publications and whether that information is accurate.
31

Apollo: Apollo did not give actual completion or placement numbers in its 2004 annual report or 2004 Fact Book. However, as noted above, the campus we visited as part of our investigation gave out a brochure that reported completion rates. The completion rate was in tiny print on the back of the brochure, which was never discussed in the course of the interview. The brochure reported: "As a result of reauthorization of the US Higher Education Act of 1965, each educational institution must publish its student completion rates for first-time undergraduate students (i.e., students with no prior college / university experience). The completion rate for all University of Phoenix students averages 63% across all programs. The completion rate for just "first-time" undergraduate students who started between 9/01/95 and 8/31/96 was 15%. These "first-time" students made up less than 3% of the University's enrollment." The text is reprinted below.
32

33

The school took great pains to emphasize the higher number (63%) when in fact the
lower number, 15%, represents the completion rate as it is required to be calculated by the Department of Education. Even the 15% rate is higher than the most recent rate reported by NCES. The actual numbers from the most recently available data from NCES (2002), included in the table below, show a 7% completion rate for Apollo students in four year programs. CEC: CEC reported in 2003 that approximately 93% of on-campus and 97% of online graduates who were available for employment were employed in their field of study. We were not able to find CEC completion rates from the campus we visited or after searching the company’s annual reports and web site. ITT: ITT reported that it obtains data on the number of students employed after graduation, but the reliability of the data depends largely on information students and employers report.65 This appears to ignore the regulatory requirement, discussed earlier, that proprietary schools retain documentation of placement rates.
Based on this admittedly shaky data, ITT reported that approximately 69% of its employable graduates in 2003 obtained employment in positions that required the direct or indirect use of skills taught in their programs of study. This too is a distortion of the regulatory requirements. For programs in which job placement standards must be met in order to participate in the federal aid programs, the regulations define a successful placement as one in which the graduate obtains employment in the recognized occupation for which they were trained or in a related comparable recognized occupation. This appears to be quite different than a job in which a graduate directly OR indirectly uses skills taught. Corinthian: In its 2004 annual report, the company reported that it believes approximately 81% of its graduates in the U.S. in 2003 who were available for placement, were placed in a job for which they were trained. We were not able to obtain completion rate information from the school we visited or from the school’s publications. EDMC: In its 2004 annual report, the corporation reports that at The Art Institutes, of the total available graduates during the calendar year ended December 31, 2003, over 88% obtained employment in their fields of study, or in related field, within six months of graduation, with average starting salary up more than 3% compared to the prior year. The annual report did not provide completion rates. The company instead reported a net annual persistence rate, which measures the number of students who were enrolled during a fiscal year and either graduated or advanced to the next fiscal year.66 This is not the same as a completion rate, but there are some similarities. EMC reported a persistence rate in fiscal 2003 of 70.2% and approximately 68% in fiscal 2004. The NCES 2002 data, displayed in the table
65 Form 10-K, ITT Educational Services Inc. (December 31, 2004). 66 Education Management Corporation, Form 10-K for FY ending June 30, 2004, p. 5.
34

below, shows a completion rate for EDMC of 47% for four year programs and 44% for two year programs. In the 60 Minutes story on CEC, an employee told a CBS employee posing as a prospective student that the school’s completion rate was about 89%.67 The actual 2002 NCES data shows that CEC had a completion rate for four year programs of 59% and 69% for two year programs. The data for ITT and Corinthian for both two year and four programs is below 50%.
It is difficult to compare the information provided by the schools, if any, with the actual data. It is virtually impossible in the case of job placement since there is no central repository for job placement information. The only way to make the job placement comparison would be if the school happened to be in a state that required schools to report this data and retained the data. Even then, the schools generally rely on self-reported data.
Although schools are required to maintain certain placement rates in order to sustain
eligibility for federal assistance programs, the disclosure requirements are actually greater for completion rates. Yet, as discussed above, the schools were even less likely to give out completion information. Unlike placement rates, there is a federal data base for completion that technically should allow students to verify any school claim about completion. Completion rates are accessible through COOL, a potentially empowering tool for students. There are, however, serious problems with accessing the COOL data and with the data itself. First, the data is outdated, making accurate comparisons of advertised rates versus officially reported rates nearly impossible. NCES staff told us that the data was not worth using for analysis because it was outdated. This is an indication of its questionable utility to students who are trying to make decisions about their futures. Moreover it is not clear that this electronic resource is even accessible in a practical sense since it is not highly publicized or emphasized by the US Department of Education. Although it appears in a link on a page called ‘Finding Schools That Match Your Interests and Goals’, COOL is not mentioned anywhere on the ‘Special Considerations’ page which encourages students to find out about job placement and complaints filed against the school. The fact that COOL could be a tool used by a student to evaluate the performance of the school he or she is interested in is never articulated. In addition, no state official or accreditation body staff in our survey indicated that COOL existed in their responses to questions regarding obtaining institution information. Potential students cannot make use of a resource if they are not made aware that it exists. With assistance from data experts and from NCES staff, we were able to obtain more recent data. As of mid-2005, the most recent data available was from 2002. The rates from the 2002 IPEDS survey for each school we investigated are provided below: The rates from the 2002 NCES survey for each school are provided below: 67 CBS News Transcripts, 60 Minutes, January 30, 2005, “An Expensive Lesson; Career Education Corporation Schools.”
35

Company 4 year (BA) # of campuses
reporting 2 year (associates) # of campuses
reporting Apollo 7% 14 n/a n/a CEC 59% 8 69% 26 EDMC 47% 18 44% 6 ITT 49% 36 42% 33 Corinthian 31% 9 44% 18 The “four year” data from the 2002 NCES survey is supposed to consist of the number of students enrolled in 1996 minus students who left for acceptable reasons (e.g. Peace Corp, death, military, church mission) divided by the number who completed. The two year rate uses the same formula, but includes the number of students enrolled in 1999. These low completion rates are especially surprising given that the data is self-reported and given the much higher numbers presented publicly. Perhaps the schools simply are not that worried about the official numbers since they can, at their discretion, publicly produce whatever numbers they choose. It is also difficult to conceive that there could be a 55% percentage point range in completion rates among similar institutions, as shown in the table above. There are at least three ways to account for the discrepancy: either schools are under reporting (as discussed below) or they are reporting their numbers inaccurately due to errors, or finally, some institutions are simply inflating their completion rates to appear more successful than they are. Whatever the explanation, it is extremely difficult for researchers, students, enforcement officials, and policy makers to make use of the federally collected data.
KEY PROBLEMS WITH COMPLETION AND JOB PLACEMENT DATA
1. The Calculation Formula is Flawed The completion/graduation rate is calculated based on the adjusted cohort enrollment of
first time, full time students. The adjusted cohort is the number of students who enrolled minus those that have left for a series of “acceptable reasons.” Legitimate departures could be due to the death or permanent disability of a student, enrollment in the military or Peace Corp, or participation in a church mission. Transfer rates are calculated separately, but transfer students are rolled into the non-completing group. Departures for other reasons are reflected in the completion data point. A completer is a student who has completed his or her program within 150% of the normal time for the course of study.68 These exclusions seriously dilute the numbers. This is at least partially because there seems to be no standardized methodology for tracking students that leave postsecondary 68 FSA Handbook, Volume 2: School Eligibility and Operation, Chapter 6, Providing Consumer Information, Sept. 14, 2004, p. 2-87-2-95 http://www.ifap.ed.gov/sfahandbooks/attachments/0405Vol2Ch6ConsumerInformation.pdf
36
institutions. Are they dropping out or leaving for legitimate reasons? Evidence of this inconsistent tracking is found in the IPEDS data on transfers. The numbers vary widely with some schools showing zero students transferred, and others reporting fairly high rates. The ‘acceptable departure’ category appears to be a black box, making the definition of ‘completion rate’ somewhat fuzzy. The worst case scenario is that institutions are using this category as a shelter to improve their completion rate. But at best, with no misrepresentation, the current formula for completion rate yields an imprecise rate. In addition, completion rates are calculated based on the cohort’s full-time students. Since many students that enroll in proprietary vocational or professional programs are working adults, using full-time students only to calculate graduation rate leaves out a large portion of the student population. This means that the completion statistic is not as descriptive as it could be, and also provides another opportunity for discretionary decisions by the institution about which students are recorded as full time and which are enrolled as part time. With respect to placement, as noted above, the Department does not even retain the information. Accreditation agencies are supposed to require it, but our study found that they will not release it to the public. Some states require reporting of placement rates, but they too do not regularly make it available. Because there is little or no oversight, there is tremendous room for the schools to manipulate the placement rates. The 60 Minutes story about CEC described ways in which school officials pump up placement rates by including students placed in any job, not necessarily jobs they were trained for. A former CEC employee interviewed for that story said that it may be that students are considered “placed” when they are actually folding T-shirts at the Gap rather than working in fashion design. One of the lawsuits against ITT alleges that the company regularly inflated job placement rates by counting students as placed who already held jobs when they began school and continued in those jobs after completion. The complaint also alleges that the company switched students from two year to four year programs in many cases when the students were unable to find employment.69
The lack of enforcement occurs not only with respect to reporting of data, but also with
respect to investigating whether the school is substantiating data. The schools are supposed to document placement information by for example retaining written statements from a student’s employer, or signed copies of state or federal income tax forms. Although not a panacea, this type of documentation at least provides one way of evaluating the types of employment reported.
2. Too Few Campuses Collect and Report Data
With the focus on growth, companies are eager to boast about opening and acquiring new campuses and each discuss their expansion in great lengths throughout their annual reports. However, the number of campuses reporting to the Department of Education is tiny compared to the number of campuses actually operating under each company. It is impossible to draw any conclusions or extrapolations based on such measly samples. 69 City of Austin Police Retirement System v. ITT Educational Services, Civ. Action # 1:04-cv-00380 (S.D. Ind. Complaint filed February 26, 2004).
37

It is difficult to precisely determine the numbers of campuses reporting to NCES. Some schools may combine data from multiple campuses. Others may double-count students by combining data from two year and four year programs. It is also possible that some of the existing campuses were so new that they did not yet have a full cohort through their programs. However, rough calculations show serious under-reporting. Based on our estimates using NCES 2002 data, for example, Apollo reported data from only about 12% of its campuses and Corinthian from about 44% of campuses. Only ITT came close to reporting information from all of its campuses.
3. The information is self-reported and thus impossible to verify The reliability of the numbers in IPEDS is based solely on the reporting done by the institutions themselves. This is extremely problematic as it leaves nearly absolute discretion in the hands of schools that have every incentive to inflate the numbers. The lack of enforcement of reporting standards, discussed below, contributes to this problem as school officials know that there are unlikely to be consequences for failure to report data or for reporting erroneous or unsubstantiated data.
4. Lack of Enforcement of Data Collection and Reporting Mandates The current regulatory structure for schools participating in federal financial assistance programs is often referred to as the “triad.” The three “arms” of the triad consist of the federal Department of Education, state agencies, and accrediting agencies. The Department (DOE) relies heavily on the other two arms to determine program standards. State regulation varies widely. Some states have developed standards setting, for example, minimum qualifications for teachers. Others have created state tuition recovery funds. Overall, nearly every state agency is understaffed and under funded. The role of the accrediting agencies has been particularly controversial. During Senate hearings in the 1990s, the Senate noted the inherent conflict of interest in accreditation: once an agency approves a school for accreditation, the agency thereafter assumes the role of the school's advocate. An audit by the Office of the Inspector General (OIG) in July 2003 found multiple deficiencies with respect to the Accrediting Agency Evaluation Unit within the DOE. The OIG reserved the worst criticism for the Unit’s oversight of regional and national accrediting agencies which were overseeing trade schools and recommended that no new agencies be approved until protections were in place.70 Even the Department’s Inspector General’s office has testified that that the triad is not working as effectively as it could be.71 For example, according to the Inspector General, state 70 U.S. Department of Education, Office of Inspector General, “Office of Postsecondary Education, Accrediting Agency Evaluation Unit’s Review of Selected Accrediting Agency Standards and Procedures,” ED-OIG/A09-C0014 (July 2003). 71 Statement of Thomas A. Carter, Deputy Inspector General, “Enforcement of Federal Anti-Fraud Laws in For-Profit Education,” Hearings before the U.S. House Committee on Education and the Workforce (March 1, 2005).
38

policies for licensing and evaluating the schools vary significantly. Accrediting agencies have not established consistent and clear standards for measuring program length or student achievement and there is inconsistent oversight by the federal Department.72 Despite these consistent reports of problems with enforcement, the basic model persists. We found enforcement was dismal in all arms of the triad.
States Of the ten states in our survey, only eight even require schools to annually report completion and job placement data. Only a few states set specific standards. Tennessee, for example, requires that a proprietary school maintain a completion rate above 66% and a job placement rate above 75% in order to receive authorization to operate in the state. A few states, such as California, require schools to provide students with separate disclosures including information about salaries of graduates, and completion and job placement performance. However, even states that monitor this data generally rely on self-reported information from the schools that is calculated using the flawed formulas discussed above. Eight of the ten states responded to our survey about enforcement. All eight respondents reported that they could not recall a single enforcement action or penalty against a school in their state for problems with completion or placement rate or collection or misrepresentation.
Accreditation Agencies
As reported above, all of the accreditation agencies in our survey claimed that completion and job placement information was proprietary and not to be released to the public. This is especially troubling given that the General Accounting Office recommended in 1996 that accrediting agencies develop and make public uniform, performance-based consumer protection standards, including information on completion and placement rates.73 It is important to emphasize that accreditation agencies are not required simply to collect data that schools provide. The Higher Education Act requires that the agencies establish, consistently apply, and enforce standards for eligible institutions, including standards related to performance. Recent audit reports by the Inspector General have concluded that the regional accreditation agencies investigated had not established minimum graduation, placement, and licensure rates for any of their institutions providing vocational education programs. For all education programs, these regional agencies permitted schools to establish their own standards for student achievement. As a result, the schools are not only allowed to collect and report their own data with impunity, they are also setting the minimum standards for the data.
72 Id. 73 U.S. General Accounting Office, “Department of Education: Status of Actions to Improve the Management of Student Financial Aid,” GAO/HEHS-96-143 (July 1996).
39

The OIG also found that the national agencies had established minimum graduation, placement, and state licensure rates, but the OIG identified problems in the methodology by which the rates were calculated that caused them to be overstated.74
Based on interviews with accreditation agency staff, the specific information regarding
each agency and collection of job placement and completion information is presented below.
• New England Associations of Schools and Colleges (accredits EDMC schools) NEASC has no specific reporting standards for proprietary schools. Each institution applying for membership or accreditation from NEASC must craft a mission-specific report that evaluates the school’s performance. These “self-studies” are used by the accreditation body to measure the school’s progress by that school’s own standards of student and institutional achievement. NEASC then conducts a three day site visit to verify the results of the self study. The schools are supposed to report each year.
• NCA Higher Learning Commission (accredits Apollo schools)
NCA only accredits degree granting schools and does not have specific reporting criteria for proprietary institutions. An annual report is required to inform the agency of the school’s basic statistics such as enrollment and financial standing, but each institution is responsible for determining its own measure of student success. Career-oriented schools have reason to use job placement as an evaluation criteria, but are not required to by NCA. Site visits take place in a ten year cycle and sometimes occur even less frequently than that.
• Accrediting Commission of Career Schools and Colleges of Technology (accredits
Corinthian schools)
Proprietary schools accredited by the Accrediting Commission of Career Schools and Colleges of Technology report on both completion and placement rates in an annual report. The agency demands this information in the form of charts that compare the previous year’s results to the current year’s results. Despite receiving this information annually, ACCSCT’s standard accreditation cycle is about five years. Schools are expected to comply with staff and peer site visits that follow-up the submission of a self-evaluation report.
• Accrediting Council for Independent Colleges and Schools (accredits ITT and CEC
schools)
ACICS requires annual reports which include completion rates and job placement rates from institutions that wish to maintain their accreditation. ACICS has very specific definitions of “completers”: someone who has achieved a GPA of at least 2.0, completed
74 Reports cited in Statement of Thomas A. Carter, Deputy Inspector General, “Enforcement of Federal Anti-Fraud Laws in For-Profit Education,” Hearings before the U.S. House Committee on Education and the Workforce (March 1, 2005).
40

the minimum number of credits for a course of study, attained the required competencies, and satisfied the non-academic requirements (such as financial obligations). Each of these completers must be accounted for in a placement report—even if the school has no career resource center. ACICS stipulates that anyone not documented as placed in a job must be counted as not working.
U.S. Department Of Education
As discussed above, the Department does not even collect job placement information, only completion rates. Based on a review of publicly available investigations and audits by the Inspector General and decisions by the Secretary and the Office of Hearings and Appeals, NCLC found only one example in the past five years of an investigation or decision against a proprietary school involving problems with failure to comply with data collection requirements. However, this case involved a failure to file surveys as part of the Integrated Postsecondary Education Data System. The school was fined a total of $2,000.75 The Department appears to rely heavily on accreditation agencies to police this area. The Inspector General’s office, for example, referred us to these agencies to get job placement data. The key problem is that the Department appears to allow accreditation agencies to fly under the radar. For example, the OIG has found that the policies of the Accrediting Agency Evaluation Unit at the Department of Education do not even require regional accrediting agencies to establish quantitative student achievement standards for institutions offering vocational education programs.76 Almost ten years ago, when the GAO recommended that the Department develop a process to collect and compile performance data from accrediting agencies, the Department voiced its disagreement, arguing that this would impose a considerable burden on accrediting agencies.77 The Department’s opposition at that time and continued failure to enforce these mandates begs the question: Is the Department more concerned about additional work for accrediting agencies than it is about the impact of misleading information on vulnerable students? The regulatory triad is failing to protect students and they are suffering as a result. The promise of for-profit education for these students can only be fulfilled if and when the schools, accreditation agencies, and government regulators understand and enforce the accurate measuring and reporting of school performance information. Recommendations for reaching this goal are presented below.
75 U.S. Department of Education, In the Matter of Powder Springs Beauty College, Docket No. 04-41-SF (April 20, 2005). 76 U.S. Department of Education, Office of Inspector General, “Office of Postsecondary Education, Accrediting Agency Evaluation Unit’s Review of Selected Accrediting Agency Standards and Procedures,” ED-OIG/A09-C0014 (July 2003). 77 U.S. General Accounting Office, “Department of Education: Status of Actions to Improve the Management of Student Financial Aid,” GAO/HEHS-96-143 (July 1996).
41

POLICY RECOMMENDATIONS Thomas Carter, Deputy Inspector General suggested in Congressional testimony that the Department move toward placement goals or completion rate goals that should be imposed on schools.78 In fact, these standards already exist for most schools, as discussed above. However, it is critical to dramatically improve these standards, including improved data integrity, increased access to the data, and aggressive enforcement of the mandates. Performance Data Recommendations Vast improvement in job placement and completion data integrity is needed in order to make this information useful and meaningful. Suggested improvements include:
• Companies with less than 75% of total, eligible campuses reporting completion rates should be placed on probation by the federal Department of Education, state agencies and accreditation agencies. During this probation period, the schools should be prohibited from making any claims about company-wide completion data. Individual campuses may continue to report data as they long as they have provided such data to the National Center on Education Statistics (NCES). The company must also disclose to students that it cannot provide them with company-wide completion data because they are on probation with regulatory agencies.
• Require NCES to collect and make available job placement as well as completion data.
Schools must substantiate placement rates, as required in the regulations, including statements from employers and income tax forms as long as student privacy is adequately respected. These records must be retained for a reasonable period of time.
• Reduce the exclusions in the completion rate calculation formulas and require schools to
report the number of students placed in each exclusion category, such as numbers on active military duty or permanently and totally disabled.
• Include selected part-time students in the completion rate calculation.
• Any company that reports a company wide job placement rate of over 80% for two
consecutive years should automatically be audited by the federal Department of Education or appropriate state agency. A similar standard should be set for completion rates.
• Any company that reports a company wide job placement rate of 35% or less for two
consecutive years should automatically be audited by the federal Department of
78 “Enforcement of Federal Anti-Fraud Laws in For-Profit Education”, Hearings before the U.S. House Committee on Education and the Workforce (March 1, 2005), at 53.
42

Education or appropriate state agency. A similar standard should be set for completion rates.
Once data integrity is considered sufficient, improve the availability of the data. Recommendations include:
• COOL seems to provide a good potential infrastructure for public access to institutional performance data. NCES should find ways to keep it as updated as possible and inclusive of accurate completion and job placement rates. Students and the public should also be made aware of this resource.
• States must also be required to provide links to the federal data to any member of the
public who is interested in examining the performance of proprietary institutions.
• As the GAO recommended in 1996, require accrediting agencies to develop and make public uniform, performance-based consumer protection standards, including but not limited to job placement and completion rates.
Reporting mandates must be rigorously enforced. Recommendations to expand and preserve existing protections against proprietary school fraud include:
• Immediately undertake a non-partisan study of current fraud and abuse in federal financial aid programs and of the effectiveness of the current protections.
• Preserve the protections that have been effective in curbing fraud and abuse such as the
90/10 rule and the rule limiting participation in federal aid programs for schools that offer predominantly correspondence or telecommunications courses.
• Restore the most effective protections, such as cohort default rates and incentive
compensation, to full strength.
• Revise the formula for calculating cohort default rates. Under current rules, the numerator of the cohort default calculation includes all loans that enter repayment in the cohort fiscal year and go into default by the end of the following year. The denominator includes all loans that enter repayment in the cohort fiscal year. The denominator includes loans that are in deferment or forbearance status even though borrowers with these loans are not in repayment status and the loans are not subject to a risk of default during that time period. Thus, the number of loans in default is divided by a number that is larger than the total number of loans in repayment. This skews the cohort default rate. Further distorting the statistics, loans that are in deferment or forbearance in a particular cohort year are not placed in subsequent cohorts and are never included in calculations
43

of a school’s default rate even if the loans go into default after the deferment or forbearance period is over.
• Consider changes to existing protections on a demonstration project basis only and
carefully measure the results of these projects. For example, the Distance Education Demonstration Project has played an effective gate-keeping role in testing the distance education waters without opening the door to widespread fraud and abuse.
• Expand student loan debt cancellation remedies for victims of proprietary school abuses.
44

Related Documents