AUTHORS Frank A. Verrastro Michelle Melton Sarah O. Ladislaw Lisa Hyland Kevin Book Delivering the Goods FEBRUARY 2015 A Report of the CSIS Energy and National Security Program Making the Most of North America’s Evolving Oil Infrastructure

Welcome message from author
This document is posted to help you gain knowledge. Please leave a comment to let me know what you think about it! Share it to your friends and learn new things together.
Transcript
authorsFrank A. VerrastroMichelle MeltonSarah O. LadislawLisa HylandKevin Book
1616 Rhode Island Avenue NW | Washington, DC 20036
t. 202.887.0200 | f. 202.775.3199 | www.csis.org
ROWMAN & LITTLEFIELDLanham • Boulder • New York • Toronto • Plymouth, UK
4501 Forbes Boulevard, Lanham, MD 20706
t. 800.462.6420 | f. 301.429.5749 | www.rowman.com
Cover photo: Shutterstock; Credit: AlexussK.
Delivering the Goods
v*:+:!:+:!ISBN 978-1-4422-4070-4
FEBRUARY 2015
A Report of the CSIS Energy and National Security Program
Making the Most of North America’sEvolving Oil Infrastructure
Ë|xHSLEOCy240704z

Blank
ROWMAN & LITTLEFIELDLanham • Boulder • New York • London
Delivering the GoodsMaking the Most of North America’s Evolving Oil Infrastructure
Authors
Frank A. Verrastro Michelle Melton sarah o. Ladislaw Lisa hyland Kevin Book
A Report of the CSIS Energy and National Security Program
February 2015
594-60736_ch00_4P.indd 1 2/6/15 10:04 AM
hn hk io il sy sY eh ekhn hk io il sy SY eh ekhn hk io il sy SY eh ekhn hk io il sy SY eh ekhn hk io il sy SY eh ekhn hk io il sy SY eh ek
hn hk io il sy SY eh ekhn hk io il sy SY eh ek
Center for Strategic & International Studies Rowman & Littlefield1616 Rhode Island Ave nue, NW 4501 Forbes BoulevardWashington, DC 20036 Lanham, MD 20706202-887-0200 | www.csis.org 301 - 459 - 3366 | www.rowman.com
About CSISFor over 50 years, the Center for strategic and International studies (CsIs) has worked to develop solutions to the world’s greatest policy challenges. today, CsIs scholars are providing strategic insights and bipartisan policy solutions to help decisionmakers chart a course toward a better world.
CSIS is a nonprofit or ga ni za tion headquartered in Washington, D.C. The Center’s 220 full- time staff and large network of affiliated scholars conduct research and analy sis and develop policy initiatives that look into the future and anticipate change.
Founded at the height of the Cold War by David M. Abshire and Admiral Arleigh Burke, CSIS was dedicated to finding ways to sustain American prominence and prosperity as a force for good in the world. Since 1962, CSIS has become one of the world’s preeminent international institutions focused on defense and security; regional stability; and transnational challenges ranging from energy and climate to global health and economic integration.
Former u.s. senator sam Nunn has chaired the CsIs Board of trustees since 1999. Former deputy secretary of defense John J. hamre became the Center’s president and chief executive officer in 2000.
CSIS does not take specific policy positions; accordingly, all views expressed herein should be understood to be solely those of the author(s).
© 2015 by the Center for Strategic and International Studies. All rights reserved.
ISBN: 978-1-4422-4070-4 (pb); 978-1-4422-4071-1 (eBook)
594-60736_ch00_4P.indd 2 2/6/15 10:04 AM
| III
Acknowledgments iv
Executive summary v
Introduction 1
1. the Changing Energy Landscape 6
the North American Energy Context 6 New Production Challenges: Volume, Location, and Quality 8 uncertainty about Production remains 13 the Changing Midstream 14 three New trends 17
2. The Changing U.S. Policy and Regulatory Landscape 23
transportation safety 24 the strategic Petroleum reserve 33 Crude oil Exports 40 the Jones Act 46 Climate Change 52
Conclusion 55
About the Authors 56
Contents
594-60736_ch00_4P.indd 3 2/6/15 10:04 AM
IV |
hn hk io il sy sY eh ekhn hk io il sy SY eh ekhn hk io il sy SY eh ekhn hk io il sy SY eh ekhn hk io il sy SY eh ekhn hk io il sy SY eh ek
hn hk io il sy SY eh ekhn hk io il sy SY eh ek
Acknowledgments
the Center for strategic and International studies (CsIs) is grateful for the generous support it receives from individuals, foundations, corporations, the u.s. government,
and foreign governments. our donors enable us to provide strategic insights and bipartisan policy solutions to help decisionmakers chart a course toward a better world. however, CSIS represents no outside interests. Our staff of scholars, former government officials, and private-sector professionals conduct analytic research and develop policy prescriptions independent of any donor. this report would not have been possible without the generous support of ConocoPhillips, ExxonMobil, Pioneer, transCanada, the government of Alberta, as well as general support to CsIs.
This project would not have been possible without the dedicated work of David Pumphrey, former codirector of the CsIs Energy and National security Program. the authors would like to acknowledge the assistance of their CsIs colleagues, including Guy Caruso, Charlie Curtis, Annie Hudson, Jane Nakano, Molly Walton, Ferrando Ferreira, and Mariah Deters. We would also like to thank our outside reviewers for providing comments that greatly strengthened the final product. Any errors that remain are our own.
594-60736_ch00_4P.indd 4 2/6/15 10:04 AM
| V
In recent years, the changing oil production and consumption landscape in North Amer-ica has led to new developments in the infrastructure that brings oil to market— the
pipelines, gathering systems, storage facilities, rail networks, and marine- based transport networks that comprise what is referred to as the industry’s midstream. Realizing the full benefits of the continent’s vast oil resources requires developing and maintaining safe, efficient, and cost- effective midstream infrastructure. These new market conditions and changes in infrastructure raise a host of important policy considerations that may ultimately influence the ability to optimize the benefits of increased North American oil production within the broader context of u.s. economic, environmental, and security priorities.
the purpose of this report is twofold. First, it seeks to provide a snapshot of the complex changes under way in North America’s oil supply system. the growth in North American oil production is best understood as part of a larger shift in the volume, location, and quality of the continent’s oil supply. Production growth is due to the ability to exploit the geological potential of the continent’s tight oil (oil released from low- permeable sandstone, carbonate, and shale rock); new production is coming from both traditional and nontradi-tional production centers. Moreover, much of the tight oil production in the united states is light density oil, different from the heavier quality crude previously expected to make up a growing share of North American production. The quality of new production has im-portant implications for the economics of production and refining as well as for North American crude oil import trends. these supply changes, in turn, alter the direction and modality (i.e., train and barge movement) of midstream infrastructure and crude and petroleum product flows. Whether these directional and modality changes are temporary or more permanent is still an open question and depends on a range of dynamic factors in the market.
the second goal of this report is to explain how the changes in midstream infrastruc-ture may affect a specific set of energy policy and regulatory issues. Given the relative novelty of the tight oil production surge in the united states, the uncertainty of the ulti-mate production potential of tight oil along with the development of other oil resources in Canada, Mexico and the united states, and the po liti cal sensitivity and/or longstanding nature of some of the policies for which we recommend action or review, this report is meant to serve as a guide for industry and policymakers seeking insights into the strategic context and status of the debates that surround each issue.
Executive Summary
594-60736_ch00_4P.indd 5 2/6/15 10:04 AM
vI | veRRASTRO, MeLTON, LADISLAW, HyLAND, AND BOOk
hn hk io il sy sY eh ekhn hk io il sy SY eh ekhn hk io il sy SY eh ekhn hk io il sy SY eh ekhn hk io il sy SY eh ekhn hk io il sy SY eh ek
hn hk io il sy SY eh ekhn hk io il sy SY eh ek
Policymakers and regulators have been confronted by the need to distinguish between those issues that require policy action and those for which the market may provide a ready and acceptable solution. We have identified five core areas of regulation and policymaking that are affected by and can have important impacts on the changing oil infrastructure. this report does not attempt to resolve each of these policy issues but instead tries to pre-sent in an even and balanced way the key points that policymakers should take into consid-eration. We contend that the time is ripe for undertaking a broad strategic review of each issue in light of the dynamic energy landscape:
• Transportation Safety. the strug gle for industry and regulators to keep pace with change is especially critical for rail transit. the rapid growth of crude oil traveling by rail has led to an increase in spills, several high profile accidents, and greater public awareness and concern. the nature of these concerns and the public demand for attention and appropriate action require a swift and thorough response. The regulatory response to safety concerns is well under way (making this the most advanced of the five areas considered in this paper), but constant vigilance and cooperation in the industry and among regulators is necessary to ensure safe deliv-ery of crude by rail.
• The Strategic Petroleum Reserve. the North American production surge and its impact on midstream infrastructure raise an immediate issue regarding the u.s. Strategic Petroleum Reserve (SPR)— specifically, whether the dramatic shifts in infrastructure will limit the ability to move the sPr oil resources as needed or intended. But the immediate question of whether the SPR is able to function opti-mally in a time of disruption triggers even more uncertainty: is it worth the cost to upgrade the logistical system vital to the sPr’s functioning? Addressing the structure of the SPR would require an answer to the question of what the SPR’s purpose is in a world in which u.s. oil consumption is declining and production is increasing— a question that has emerged only recently in light of new production changes. The SPR requires further attention both in terms of ensuring its immediate usability and in the long- term vision for its utility in light of oil market changes.
• Crude Oil Exports. the increased volume of u.s. tight oil production has affected the economics of oil production and use throughout the value chain in North America. rapid increases in production, infrastructure constraints, and changing market conditions have created complex commercial dynamics for market participants seeking the highest return on investment. the practical result has been a surge in u.s. exports of both crude and petroleum products and a decline in imports (the U.S. is still a net importer and will likely remain so for some time). Despite growing volumes of crude oil exports to Canada, significant legal and regulatory bar-riers to unrestricted exports of crude oil from the united states remain. No such restrictions exist on petroleum products, and upstream oil producers have urged that the barriers to crude oil exports be revisited. The question in front of policy-makers is whether the current export restrictions should be modified, and if so, how to proceed. the debate thus far has centered on the potential distribution of costs
594-60736_ch00_4P.indd 6 2/6/15 10:04 AM
DeLIveRING THe GOODS | vII
and benefits resulting from the removal or continuation of current policy. While the quantifiable economic impacts have been studied by a variety of groups, the barriers to action are po liti cal as well as economic. A review of the current export policy in light of its resilience to various market conditions and strategic priorities over time is warranted.
• The Jones Act: Merchant Marine Shipping Act of 1920 (Section 27). rising domestic production and production in new locations of supply have increased the importance of moving oil in and around u.s. domestic waterways. one complicating factor in these waterborne domestic trade flows is section 27 of the Merchant Marine Act of 1920, more commonly referred to as the Jones Act. The Jones Act stipulates that cargo shipped between u.s. ports can only be carried by ships that are u.s. built, u.s. flagged and owned, and U.S. crewed. As such, the cost of shipping between U.S. ports is more expensive than it would other wise be due to higher building, maintenance, and labor costs in the united states. on some occasions, lack of Jones Act– compliant vessels has made shipping difficult. While promoting a robust merchant marine may be in the u.s. national security interest, doing so comes at a cost. As production increases and the united states increases its reliance on waterborne transportation of crude oil, the Jones Act is another example where policymakers may want to assess the strategic value of the existing policy and weigh it against the commercial impacts of that policy.
• Climate Change. Concerns have also been raised about the role midstream infrastruc-ture expansion plays in facilitating the production and delivery of additional fossil fuels and the impact of this infrastructure on climate change. Climate scientists may disagree about the duration and proximity of the win dow of opportunity for action, but most believe substantial action must be taken in the near term to prevent the most harmful impacts of climate change. What is less clear is the role that incremen-tal North American oil production plays in the broader climate problem. on one side, activists claim that every drop pulled out of the ground is meaningful in the broader context of carbon emissions, resulting in more fossil fuels burned and prolonged dependence on a fossil- dominated system in the future. others claim that u.s. supply is small in the overall global scheme of emissions, and that light tight oil coming from shale plays in the united states has a lower emissions impact than heavier or more carbon intensive fuels that would other wise be consumed. It would be ideal if the United States undertook a strategic review to consider the costs and benefits of a climate policy and assessed how unconventional oil production fits into the larger picture, but it seems unlikely that a reconciliation of viewpoints on this divisive issue is possi ble at this stage. It is also clear that there are a lack of scalable, near- term replacements for the current fossil- based energy system and an equitable regime to drive down global emissions is not currently available. u.s. policymakers are not likely to be able to resolve these core tensions in the near term. In the interim, however, keeping the current energy system robust and operational and the invest-ment environment as clear as possi ble (by providing policies and regulations that
594-60736_ch00_4P.indd 7 2/6/15 10:04 AM
vIII | veRRASTRO, MeLTON, LADISLAW, HyLAND, AND BOOk
hn hk io il sy sY eh ekhn hk io il sy SY eh ekhn hk io il sy SY eh ekhn hk io il sy SY eh ekhn hk io il sy SY eh ekhn hk io il sy SY eh ek
hn hk io il sy SY eh ekhn hk io il sy SY eh ek
provide long- term guidance about how emissions will be regulated over the lifetime of an asset) while managing the transition to something new is a tactical way of navi-gating this debate.
ultimately, the scope and pace of future oil production growth in North America will be determined by many factors, including geology, access to resources, the pace of technologi-cal innovation, the global opportunity pool, commodity prices, demand growth, and social and environmental costs. Policies must be robust enough to accommodate a variety of possi ble future scenarios while seeking to balance economic, environmental, and security outcomes.
594-60736_ch00_4P.indd 8 2/6/15 10:04 AM
| 1
Introduction
This report is the result of a pro ject on midstream oil infrastructure initiated by the CSIS Energy and National Security Program in the spring of 2013. Using information
gleaned from workshops and public and private meetings, we have sought a better understanding of how the development of unconventional oil resources has reshaped North America’s infrastructure needs. Our intent is to provide a useful snapshot of the evolving changes under way in North America’s oil delivery system, ask questions about the possible future direction of those changes, and provide guidance to policymakers and other stakeholders who are considering the economic, environmental, and security implications of unconventional oil production in North America in the near, medium, and long terms.
Attention has been focused on the shifting North American production landscape . . . There is justifiably a great deal of excitement about the oil production potential being realized in North America. The unpre ce dented and sustained surge in U.S. tight oil production has surprised even the most optimistic analysts and created significant economic opportunities across the oil value chain. North America is undergoing robust growth in oil and natural gas production, which has, in turn, allowed for a new sense of enthusiasm concerning the continent’s production potential and a heightened focus on the physical, economic, and policy transitions that are necessary to sustain and take advantage of this emerging reality. In addition to light tight oil coming from the United States and from shale basins in Canada, production from Canadian oil sands continues to advance, with even greater expectations for growth in the coming de cades; in addition, other liquids growth (natural gas liquids and biofuels) is adding to rec ord levels of North American production. Meanwhile, representing a break with the past 70 years, Mexico has ushered in broad reforms that are opening its energy sector to more expansive private participation and investment— both of which could bring a surge in new onshore and offshore production in that country.
This real time transformation and the uncertainty of the future production forecast pose unique challenges to decisionmakers engaged in near term and more strategic long term commercial, policy, and regulatory determinations. As new production comes on line, oil industry participants and local, state, and federal policymakers are working hard to
594-60736_ch01_4P.indd 1 2/6/15 10:06 AM
hn hk io il sy SY eh ekhn hk io il sy SY eh ekhn hk io il sy SY eh ekhn hk io il sy SY eh ekhn hk io il sy SY eh ekhn hk io il sy SY eh ek
hn hk io il sy SY eh ekhn hk io il sy SY eh ek
2 | VErrASTrO, MElTON, lAdISlAw, HYlANd, ANd BOOk
understand and address the implications of these production changes for the transportation, refining, and marketing of these resources.
. . . But the midstream is vital to the oil value chain, and plays a central role in resource development.while attention has been focused on the remarkable production (also referred to as “upstream”) growth, the transformation of the “midstream”— defined as the storage, wholesale marketing, and physical movement of crude oil from its place of production to its place of pro cessing by pipeline, truck, tanker, barge, and rail— remains critically important to realizing the benefits of production increases. Profound changes in North American midstream oil infrastructure are not simply technical or economic; they require strategic thinking about U.S. energy policy, including in the context of other U.S. policy priorities.
Abrupt, extensive changes to large, complex infrastructure systems are rare, but fast- moving changes in North American oil production— coupled with more gradual but no less profound changes in consumption patterns— have created a unique need for new and expanded midstream oil infrastructure in North America. Owing to the time lags between production growth, new midstream investment and infrastructure build out, and the development of “downstream” (refining and end- use) market and infrastructure, increased oil production has overwhelmed the capacity of existing transportation infrastructure in both producing and receiving regions, forcing industry players and policymakers to think creatively about moving supplies safely and efficiently to pro cessing centers and demand hubs. As a result, the entire infrastructure system, from major long haul pipelines and railroad systems to more localized connecting pipelines, gathering systems, and field pro cessing facilities, has been adjusting to changing market dynamics in real time.
while the speed and timing of these adjustments is important, any proposed changes to midstream infrastructure will prompt close scrutiny because of the societal issues related to resource development. Midstream infrastructure matters in the larger context of resource development for three reasons: (1) in the short run, the relative availability of infrastructure helps to determine the pace of development and commerciality of the resource base; (2) the environmental and safety rec ord of that infrastructure help shape societal perceptions of resource development overall; and (3) infrastructure investments often yield long- lived assets that influence economic preferences within the energy system over de cades. while infrastructure can be redirected, repurposed, or replaced, the building of infrastructure usually anchors a longer term commitment to certain commercial activity by advantaging energy resources that utilize access to existing infrastructure and disadvantaging those that do not.
594-60736_ch01_4P.indd 2 2/6/15 10:06 AM
dElIVErINg THE gOOdS | 3
The Government Influences Midstream Oil Infrastructure developmentUltimately, the scope and pace of future unconventional oil production growth in North America will be determined by many factors, including geology, access to resources, the pace of technological innovation, the global opportunity pool, commodity prices, demand growth, and social and environmental costs. But policy matters, too. while most of the changes currently taking place in the oil midstream are driven by private sector decisions and investments, governments at all levels (federal, state, and local) also influence the scope and pace of midstream development and, by extension, have an impact on the economics of the entire oil supply chain. In the United States, governments generally do not play a direct role in the financing of midstream oil infrastructure. Although investors in midstream petroleum infrastructure may benefit from tax credits or other economic inducements (e.g., master limited partnerships, or MlPs), such infrastructure is funded, with few exceptions, by private capital.1 local, state, and federal governments do, however, influence the development of the petroleum supply delivery system— and, therefore, the system’s ultimate environmental and economic impact— through regulatory and policy decisions across a range of issues.
On the regulatory side, governments exercise this ability by issuing permits and environmental assessments, as well as through their management of the safety and environmental impacts of midstream infrastructure. The federal government also influences infrastructure development through the review of cross border facilities and regulations on exports.
On the policy side, government decisions driven by goals such as energy security or economic growth affect the market by creating economic incentives for production and midstream build- out (e.g., tax credits), by dictating where the crude oil and refined products can and cannot go (e.g., beyond U.S. borders or by determining land access), how it can get there (e.g., restrictions on transportation), how it can be used (e.g., fuel quality and emissions specifications), and the pace at which it is built and utilized.
The Midstream Influences U.S. PolicyJust as policies influence and shape the markets, new production and midstream expansion in the market has an impact on the three main energy policy priorities of the United States: affordability and economic growth, energy security, and environmental sustainability.
In general, new unconventional oil resources have already offered significant economic benefits, including direct and indirect employment, lower energy prices for consumers, a lower trade deficit, and improved balance of payments. And, by providing additional
1. There are notable exceptions. The state of Alaska, for example, has recently entered into an agreement with private companies to help finance a natural gas pipeline in exchange for an equity stake in the pro ject.
594-60736_ch01_4P.indd 3 2/6/15 10:06 AM
hn hk io il sy SY eh ekhn hk io il sy SY eh ekhn hk io il sy SY eh ekhn hk io il sy SY eh ekhn hk io il sy SY eh ekhn hk io il sy SY eh ek
hn hk io il sy SY eh ekhn hk io il sy SY eh ek
4 | VErrASTrO, MElTON, lAdISlAw, HYlANd, ANd BOOk
barrels to the world market and thus minimizing market instability by diversifying supplies, unconventional oil has enhanced U.S. energy security while providing North America with an economic boost. The proper infrastructure is necessary in order to fully realize the potential of unconventional oil resources for both security and economic reasons. Building this infrastructure safely and efficiently enables the United States to take full advantage of its resource base, enhances its economic position, and optimizes the economic and security benefits of unconventional oil in the short and medium term.
The massive scale of the necessary midstream infrastructure build out also raises environmental and safety concerns. while some observers have focused on the upstream environmental and local impacts of unconventional resource development (the topic of an earlier CSIS Energy and National Security program study),2 the most immediate concerns regarding midstream impacts have been those associated with the release of oil during transit. Crude by rail safety issues have received the most attention recently, but with the expanded traffic flow and the high visibility of accidents, concerns have increased for all modes of transport (e.g., rail, pipeline, boat, and truck). There are longer term environmental risks as well, especially related to climate change. Midstream infrastructure figures into this equation because it provides long- term cost efficiency improvements for producing more oil and delivering products to market. without a policy framework designed to promote low carbon development commensurate with long term climate change goals, or even a combination of market and technological changes that encourage the use of lower cost and scalable low carbon alternatives, this infrastructure could enable a continuation of a hydrocarbon dependent future.
The ongoing and rapid changes in the midstream pre sent policymakers with a unique opportunity to assess how to best manage resource development in a way that balances economics, energy security, and environmental/safety concerns. It is also an opportunity to reassess whether long- standing energy policies make sense in the context of an evolving supply landscape.
Structure of the reportPart 1 of this report provides a snapshot of the changes under way in North America’s energy supply system; the discussion centers on production trends as they relate to volume, location, and quality of oil, along with the impact of these supply changes on midstream infrastructure and crude and petroleum product flows. Part 2 addresses policy questions related to midstream infrastructure by examining five core areas of regulation and policymaking: transportation safety, the Strategic Petroleum Reserve, crude oil exports, the Merchant Marine Shipping Act of 1920 (the Jones Act), and climate change and environmental impacts. All five areas are affected by— and can have important impacts on— the changing oil infrastructure, and we believe they require attention from policymakers.
2. Sarah ladislaw et al., Realizing the Potential of U.S. Unconventional Natural Gas (washington, dC: CSIS, April 2013), http:// csis . org / files / publication / 130409 _ Ladislaw _ RealizingPotentialUnconGas _ Web . pdf .
594-60736_ch01_4P.indd 4 2/6/15 10:06 AM
dElIVErINg THE gOOdS | 5
while we attempt to address a broad range of issues in this report, we recognize that the U.S. oil midstream does not exist in isolation. The evolution of the system depends a great deal on oil supply and distribution trends in Canada, Mexico, and, to a lesser degree, elsewhere in the world. This report does not attempt to comprehensively address the energy market, policy, and infrastructure dynamics for each of these locations or supply sources; rather, it deals with each in the context of how it interfaces with the midstream developments in the United States. we are mindful of the interconnected nature of the U.S. infrastructure system with those of both Mexico and Canada. Canadian oil production is an important part of the North American energy market, and the two countries’ oil infrastructure is integrated; the same is true, to a lesser degree, of Mexico. As the prospects for successful reform of the latter’s energy sector and renewed production become clearer, cross border impacts will also become apparent. Additionally, we recognize that growth of other liquids such as biofuels and natural gas liquids figure into the North American liquids supply and demand equation. This report does not address overarching policies for any of these energy sources or their related midstream infrastructure.
594-60736_ch01_4P.indd 5 2/6/15 10:06 AM
6 |
hn hk io il sy SY eh ekhn hk io il sy SY eh ekhn hk io il sy SY eh ekhn hk io il sy SY eh ekhn hk io il sy SY eh ekhn hk io il sy SY eh ek
hn hk io il sy SY eh ekhn hk io il sy SY eh ek
The Changing Energy Landscape
The North American Energy ContextThe data make clear that North America’s energy sector is undergoing a significant transformation— appropriately dubbed an “unconventional revolution” by some— that will have major economic and geopo liti cal consequences.1 while the economic impacts on North American and global energy markets are already being felt, a more complete understanding of the range of possi ble implications is currently emerging and will doubtlessly reverberate over the coming de cades. These developments, alongside the more gradual but no less important changes in demand, have already challenged the most basic and deeply held assumptions about the medium and long term North American oil supply outlook.
Over the past several de cades, the oil trade relationship between the three countries of North America— Canada, Mexico, and the United States— has taken place largely within the NAFTA framework and has generally been characterized by Canadian and Mexican oil flowing to the United States to meet growing U.S. demand (although trade in energy goods and ser vices flows in both directions).2 In addition to the theoretical framework underpinning trade in North America, trade is facilitated by a well developed network of cross border infrastructure.3
For much of the last de cade, the overriding market and energy security policy objectives within all three countries encouraged greater investment in oil production. At the time, the predominant outlook was relatively gloomy: Canadian oil sands proved eco nom ically unappealing, Mexico did not stem its decline in production, and the United States grew increasingly oil import dependent as consumption rose and production declined.
1. The geopo liti cal consequences of unconventional production are explored in another CSIS report. Sarah ladislaw et al., New Energy, New Geopolitics: Balancing Stability and Leverage (washington, dC: CSIS, April 2014), http:// csis . org / files / publication / 140514 _ Ladislaw _ NewEnergyNewGeopolitics _ REVISED . pdf .
2. The energy provisions of NAFTA are outlined in chapter 6 of the agreement. That provision requires energy goods and cross border suppliers of energy ser vices to be afforded national treatment. NAFTA built on a preexisting free trade in energy agreement between Canada and the United States that was established in the 1980s. NAFTA allows the Mexican government the right to exclude private investment in Mexico’s energy sector.
3. In this res pect, the proposed cross border keystone Xl pipeline is just like other cross border energy projects that have, over the years, helped bring about an integrated North American energy market. For more on keystone Xl, see Part 2 of this report. Cross border infrastructure includes not only oil pipelines, but also natural gas pipelines, electricity transmission lines, and nonphysical infrastructure such as integrated power grids and joint own ership of some energy assets, among others.
1
594-60736_ch01_4P.indd 6 2/6/15 10:06 AM
dElIVErINg THE gOOdS | 7
In the past several years, however, there has been a reversal of fortunes. All three countries now appear poised for production growth, but the pace and scope varies by country. The North American production surge is essentially a staggered phenomenon happening at three different speeds and magnitudes. The onset of significant volumes of Canadian unconventional oil production (both light tight oil and Canadian oil sands) preceded the unconventional oil boom in the United States (but is not moving at anywhere near the pace and scale of tight oil production in the United States).4 Mexico, on the other hand, is now in a good position to reverse a de cade of decline and eventually increase its production, but the pace and scale will depend on, among other things, regulatory and governance factors as well as on commodity prices. The onset of this production is not expected until later in this de cade at the very earliest; still, Mexico’s ultimate production potential could be significant.
These unforeseen developments have changed the supply demand balance of North America and will likely further influence trade and investment flows within and outside the continent. The United States is Mexico’s primary energy trade partner, and energy trade between Mexico and the United States accounted for 13 percent of the overall trade between the two countries (worth $65 billion) in 2012.5 Energy trade between Canada and the United States is even greater, exceeding US$100 billion in 2011.6 Canada and Mexico combined now provide nearly one out of every two barrels imported into the United States, up from less than one out of three in 2008, partially due to diminished imports from other countries but also due to volumetric increases from Canada.7 Canada alone accounts for more than one- third of U.S. crude oil imports, exporting a rec ord 2.5 million barrels per day to the United States in 2013— making Canada, by far, the United States’ largest source of oil imports.8 U.S. crude oil imports from Mexico, meanwhile, have declined by 47 percent from a de cade ago.9 The United States is the main export destination for both Mexico and Canada, taking in about 70 percent of Mexico’s exports and 97 percent of Canadian crude.10
4. The Canadian Association of Petroleum Producers (CAPP) projects Canadian oil production will reach 6.4 million barrels per day by 2030, while Canada’s National Energy Board (NEB) predictions are a more modest (but still remarkable) 5.8 million barrels per day by 2035. See CAPP, Crude Oil Forecast, Markets, and Transportation (Ottawa: CAPP, June 2014), http:// www . capp . ca / getdoc . aspx ? DocId = 247759 & DT = NTV; NEB, Canada’s Energy Future 2013: Energy Supply and Demand Projections to 2035 (Ottawa: NEB, 2013), https:// www . neb one . gc . ca / nrg / ntgrtd / ftr / 2013 / 2013nrgftr eng . pdf .
5. U.S. Energy Information Administration (EIA), “Mexico Week: U.S. Is Mexico’s Primary Energy Trade Partner amid Shifting Trade Dynamics,” May 13, 2013, http:// www . eia . gov / todayinenergy / detail . cfm ? id = 11231 .
6. Embassy of the U.S. in Ottawa, Canada, “U.S. Canada relations: Energy,” http:// canada . usembassy . gov / canada us relations / energy . html .
7. EIA, “U.S. Crude Oil Imports Fall, but Share of Top Three Suppliers Highest in Four de cades,” April 4, 2014, http:// www . eia . gov / todayinenergy / detail . cfm ? id = 15711 .
8. In September 2014, Canada provided more than 40 percent of total U.S. crude oil imports. Mexico and Canada combined accounted for over half of U.S. crude oil imports in September 2014. See EIA, “U.S. Crude Oil Imports by Country of Origin,” http:// www . eia . gov / dnav / pet / pet _ move _ impcus _ a2 _ nus _ epc0 _ im0 _ mbbl _ m . htm .
9. EIA, “U.S. Petroleum Product Exports to Mexico Rise While Mexican Crude Exports to the U.S. Fall,” May 28, 2014, http:// www . eia . gov / todayinenergy / detail . cfm ? id = 16451 .
10. NEB, “Estimated Canadian Crude Oil Exports by Type and Destination,” last modified December 12, 2014, https:// www . neb - one . gc . ca / nrg / sttstc / crdlndptrlmprdct / stt / stmtdcndncrdlxprttpdstn - eng . html .
594-60736_ch01_4P.indd 7 2/6/15 10:06 AM
hn hk io il sy SY eh ekhn hk io il sy SY eh ekhn hk io il sy SY eh ekhn hk io il sy SY eh ekhn hk io il sy SY eh ekhn hk io il sy SY eh ek
hn hk io il sy SY eh ekhn hk io il sy SY eh ek
8 | VErrASTrO, MElTON, lAdISlAw, HYlANd, ANd BOOk
The differences in pace, timing/onset, and ultimate potential of the oil production trajectory in each country makes infrastructure decisions difficult to anticipate. As of early 2015, the sheer pace and size of the U.S. oil production surge is having an outsized impact on the regional oil markets and is forcing oil producers in Canada and Mexico to reassess the long term supply/demand balance of the North American market and the most competitive investment and infrastructure decisions in light of those changes. The decisions made in the United States will also have an impact on the decisions about infrastructure in both Mexico and Canada. For example, if the United States decides to allow crude oil exports, Mexico is likely to begin importing more U.S. crude oil, possibly requiring pipelines or a change in port facilities. At the same time, the decision to export crude may affect U.S. product exports to Mexico. Success in bringing more Mexican oil on line, however, could dampen demand for U.S. products and crude oil. whether or not new infrastructure is built depends entirely on these rapidly changing market dynamics. From a strictly economic optimization standpoint, operating as one coherent market may rationalize some of the infrastructure and investment decisions. Thus, while infrastructure investments are necessary, the development and further integration of the North American energy infrastructure system is dependent on a host of interrelated factors.
New Production Challenges: Volume, location, and Qualitywhile the production changes in North America are unfolding at different paces, the crude oil supply picture in the United States has changed in dramatic ways since 2008, thanks to a combination of high prices for much of the last de cade, innovative technology applications, and an evolving industrial and regulatory environment. These production changes can be grouped into three distinct categories: volume, location, and quality. Significant changes in any one of these categories alone would have had important ramifications for policymakers as well as for upstream, midstream, and downstream industry participants. Cumulatively, they represent one of the most profound and rapid changes in the U.S. oil production system in at least half a century.
Volume
Until recently, the volume of U.S. crude oil production had been dropping steadily from its peak in October 1970 of just over 10 million barrels per day; U.S. production hovered around 5 million barrels per day between 2006 and 2008. As recently as 2008, new U.S. production was expected to come mainly from the Gulf of Mexico and was anticipated to slow but not reverse the downward trend in overall production. Beginning in 2009, however, and accelerating over the next few years, significant volumes of new production came on line. Crude oil production has been rising at an unpre ce dented clip; the United States alone added over 2.4 million barrels per day between 2008 and 2013. By September 2014, the United States was producing 8.9 million barrels per day of crude oil—up 16 percent year on year, reaching levels not seen since 1986— while total liquids production (including
594-60736_ch01_4P.indd 8 2/6/15 10:06 AM
dElIVErINg THE gOOdS | 9
crude oil, fuel ethanol, biodiesel, refinery gains, and natural gas plant liquids) reached 12.29 million barrels per day in 2013.11 This rapid reversal is the largest production increase in history, and it is due entirely to the production growth from a handful of unconventional oil plays.12
The differences in timing with regard to volume in the rest of North America are evident. Canadian oil production has expanded more slowly than production in the United States, rising from 2.5 million barrels per day in 2003 to 3.4 million barrels per day in 2013 and reaching an average of 3.6 million barrels per day through April 2014. while Canadian production growth is driven mostly by oil sands, Canadian light tight oil production doubled between 2011 and early 2014 to more than 400,000 barrels per day.13
The upward production trend is expected to continue at least through the early 2020s in both Canada and the United States although this outlook depends on many factors including oil price levels.14 Mexican production has been heading in the opposite direction, but new energy sector reforms have sparked optimism about reversing Mexico’s declining production over the next de cade. It remains unclear whether these reforms will be successful in spurring growth, but Mexico has the geologic potential for significant production expansion. The U.S. Energy Information Administration (EIA) estimates that Mexican production could rise to 3.7 million barrels per day by 2040, depending on the success of the reforms.15 Above ground factors rather than geologic potential are likely to determine whether the country will realize this potential.
11. See EIA, “U.S. Field Production of Crude Oil,” last modified November 26, 2014, http:// www . eia . gov / dnav / pet / hist / LeafHandler . ashx ? n = PET & s = MCRFPUS2 & f = M. For total liquids data, see EIA, Short- Term Energy Outlook (washington, dC: EIA, May 2014), http:// www . eia . gov / forecasts / steo / archives / may14 . pdf. The 2014 total liquids numbers are even higher; the third quarter totals are 14.2 million barrels per day, while the EIA estimates that the yearly average liquids production is 13.9 million barrels per day; see EIA, Short- Term Energy Outlook (Washington, DC: EIA, December 2014), http:// www . eia . gov / forecasts / steo / pdf / steo _ full . pdf .
12. “Unconventional oil” refers to oil that has been produced using nonconventional techniques. It does not refer to the chemical or physical properties of the oil itself (which is referred to as oil quality). There is no consensus on what constitutes unconventional oil; different organizations define unconventional differently. In this report, we use unconventional oil to mean oil extracted using hydraulic fracturing and oil that is mined or produced in situ.
13. Conventional crude production has grown 9.3 percent year on year in Alberta and Saskatchewan. Oil sands production grew 8.2 percent. See EIA, “Canada, Production of Crude Oil, Including lease Condensate,” http:// www . eia . gov / cfapps / ipdbproject / iedindex3 . cfm ? tid = 5 & pid = 57 & aid = 1 & cid = CA, & syid = 2008 & eyid = 2013 & unit = TBPD; EIA, “Crude Oil Production,” last modified November 26, 2014, http:// www . eia . gov / dnav / pet / pet _ crd _ crpdn _ adc _ mbblpd _ a . htm. For Canadian statistics, see NEB, “Canadian Energy Overview 2013— Energy Briefing Note,” last modified June 2014, https:// www . neb - one . gc . ca / nrg / ntgrtd / mrkt / vrvw / 2013 / index - eng . html; NEB, “Canadian Energy Dynamics 2013— Energy Market Assessment,” last modified March 2014, https:// www . neb - one . gc . ca / nrg / ntgrtd / mrkt / dnmc / 2013 / index - eng . html; NEB, “Market Snapshot: Canadian Tight Oil Production Update,” last modified October 22, 2014, https:// www . neb - one . gc . ca / nrg / ntgrtd / mrkt / snpsht / 2014 / 10 01tghtl eng . html .
14. EIA estimates that Canadian production will increase by 3 million barrels per day between 2010 and 2040, mostly from the oil sands in Alberta. EIA, International Energy Outlook (washington, dC: EIA, September 2014), 9, http:// www . eia . gov / forecasts / ieo / pdf / 0484(2014) . pdf .
15. For more information on Mexico’s energy sector reforms and production potential, see EIA, Interna-tional Energy Outlook; also see EIA, “Energy Reform Could Increase Mexico’s Long- Term Oil Production by 75%,” August 25, 2014, http:// www . eia . gov / todayinenergy / detail . cfm ? id = 17691 .
594-60736_ch01_4P.indd 9 2/6/15 10:06 AM
hn hk io il sy SY eh ekhn hk io il sy SY eh ekhn hk io il sy SY eh ekhn hk io il sy SY eh ekhn hk io il sy SY eh ekhn hk io il sy SY eh ek
hn hk io il sy SY eh ekhn hk io il sy SY eh ek
10 | VErrASTrO, MElTON, lAdISlAw, HYlANd, ANd BOOk
location
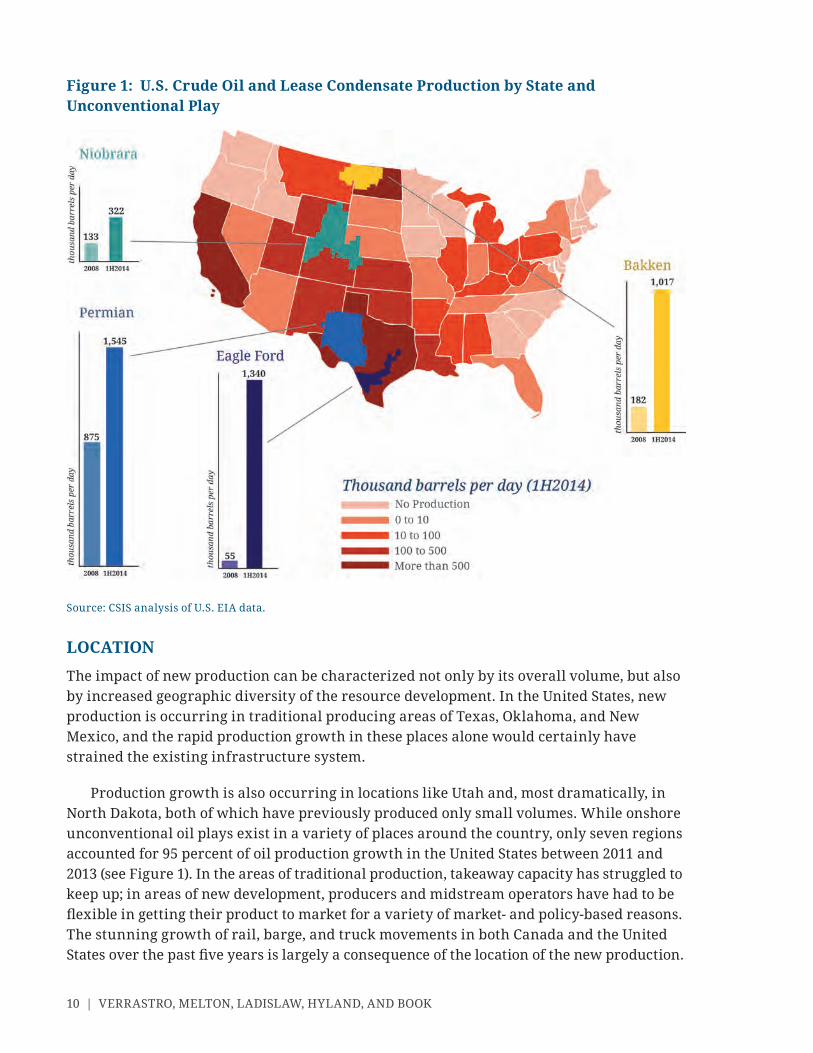
The impact of new production can be characterized not only by its overall volume, but also by increased geographic diversity of the resource development. In the United States, new production is occurring in traditional producing areas of Texas, Oklahoma, and New Mexico, and the rapid production growth in these places alone would certainly have strained the existing infrastructure system.
Production growth is also occurring in locations like Utah and, most dramatically, in North dakota, both of which have previously produced only small volumes. while onshore unconventional oil plays exist in a variety of places around the country, only seven regions accounted for 95 percent of oil production growth in the United States between 2011 and 2013 (see Figure 1). In the areas of traditional production, takeaway capacity has strug gled to keep up; in areas of new development, producers and midstream operators have had to be flexible in getting their product to market for a variety of market- and policy- based reasons. The stunning growth of rail, barge, and truck movements in both Canada and the United States over the past five years is largely a consequence of the location of the new production.
Figure 1: u.S. crude oil and lease condensate Production by State and unconventional Play
Source: CSIS analysis of U.S. EIA data.
594-60736_ch01_4P.indd 10 2/6/15 10:06 AM
dElIVErINg THE gOOdS | 11
In Canada, the geographic changes have been less pronounced, although they still pose challenges. western Canada (Alberta and Saskatchewan) continues to serve as the main production hub for much of the country, but the potential to expand tight oil production beyond the region is now being explored.16 geography matters in more indirect ways for Canadian producers, however, as the market dynamics introduced by surging U.S. production and cross border infrastructure challenges makes the static location of Canada’s production surge an important ele ment in midstream infrastructure decisions. Canadian oil sands projects have long time frames and require large amounts of upfront capital that make large infrastructure projects a crucial ele ment to delivering product to market. As new U.S. sources of production have arisen in the United States across a range of locations, the market dynamics for selling and transporting Canadian oil have changed as well. Mexico represents a mixture of the U.S. and Canadian experiences; while much production is likely to come from the Gulf of Mexico, a traditional producing region, shale development would likely be across the border from Texas.
QualitY
Surging production volumes and production in new locations have affected the configuration and flows of the midstream, but the quality of the new crude being produced in large volumes is also having a significant impact on the downstream.
Most of the new U.S. unconventional oil production growth and some of the Canadian oil production growth has been light and sweet (see Crude Quality box).17 The growth of oil of a different quality than previously expected has changed how some refiners use the oil and is altering their approach to investment, planning, and output. Even though both Canada and Mexico have a range of crude oil qualities, the predominant cross- border trade occurs in heavier and medium oil from both countries. Canadian crude supply is projected to get heavier, with the share of overall light oil production expected to decline from 42 percent in 2013 to 24 percent in 2030.18
Crude quality matters because refiners develop commercial strategies based on the price of their crude inputs and the investments they have made in pro cessing equipment. Refiners attempt to maximize the difference between the cost of their crude oil inputs and the value of the products they market. while crude quality is only one aspect of this complex decision— others include domestic and global demand and refinery configuration—it is an important one.
Prior to the unconventional tight oil boom, many U.S. refiners had anticipated the global crude slate becoming heavier and more sour in the future; consequently, they made
16. New conventional discoveries off the eastern coast of Canada are also potentially significant in terms of regional market development going forward.
17. According to Canadian government statistics, in 2013 about one third of Canadian crude oil production was conventional light crude oil and condensate, about 40 percent was non upgraded bitumen and conventional heavy crude, and 26 percent was synthetic crude oil. See NEB, “Canadian Energy Overview 2013— Energy Briefing Note.”
18. CAPP, Crude Oil Forecast, Markets, and Transportation.
594-60736_ch01_4P.indd 11 2/6/15 10:06 AM
hn hk io il sy SY eh ekhn hk io il sy SY eh ekhn hk io il sy SY eh ekhn hk io il sy SY eh ekhn hk io il sy SY eh ekhn hk io il sy SY eh ek
hn hk io il sy SY eh ekhn hk io il sy SY eh ek
12 | VErrASTrO, MElTON, lAdISlAw, HYlANd, ANd BOOk
significant strategic investments in equipment to be able to optimize the value of converting heavier, sour barrels into higher value refined products. The unexpected growth of oil of a different quality is having an impact on how U.S. refiners use the oil and, in turn, affects their decisions regarding future investment, planning, and output.19
despite this mismatch between the quality of oil being produced and the quality of oil that refiners are set up to pro cess, the tight oil revolution in the United States has already had a positive impact on some domestic refiners. In addition, the competitive economics of many U.S. refining operations have improved dramatically as access to low cost natural gas, used as both a source of fuel and as a feedstock to produce hydrogen, has grown. The rapid growth in the availability of domestically sourced light tight oil has backed out similar quality imports, improving the U.S. balance of trade and reinvigorating those refiners (mostly on the East Coast) previously tied to higher cost light oil imports primarily from Nigeria, Angola, and Algeria. In the pro cess, displaced west African crudes have been redirected to other non- U.S. refineries and have helped offset the loss of supply globally. At the same time, U.S. petroleum demand has declined, leaving U.S. refiners with surplus refining capacity. The result has been a surge in refined product exports, especially distillate/diesel fuel out of the U.S. Gulf Coast, where lower input costs and higher export prices have improved margins for some refiners. This is not to say that imports will come to a halt even if production rises; while refiners have been importing less lighter crude oil, they continue to import greater volumes of heavier crudes. Thus, while overall imports are declining in the United States, refiners are importing even more heavy crude than before.
19. For more information, see EIA, “Regional refinery trends continue to evolve,” This Week in Petroleum, January 7, 2015, http:// www . eia . gov / petroleum / weekly / .
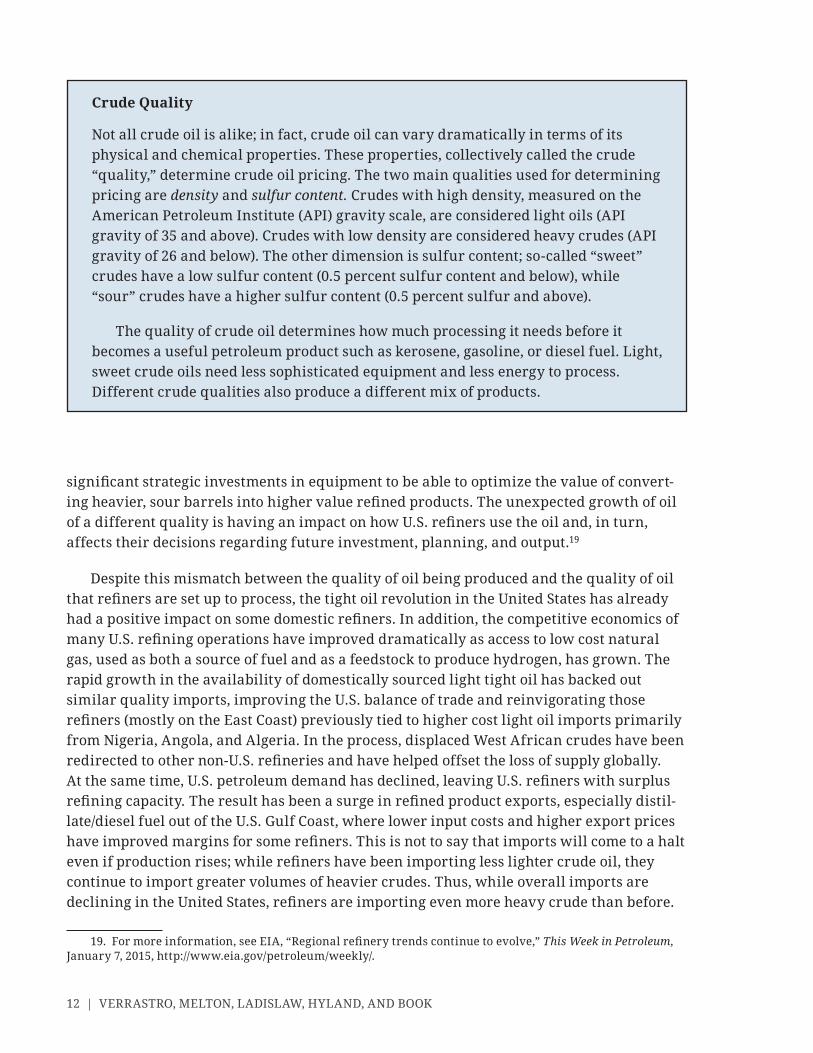
crude Quality
Not all crude oil is alike; in fact, crude oil can vary dramatically in terms of its physical and chemical properties. These properties, collectively called the crude “quality,” determine crude oil pricing. The two main qualities used for determining pricing are density and sulfur content. Crudes with high density, mea sured on the American Petroleum Institute (API) gravity scale, are considered light oils (API gravity of 35 and above). Crudes with low density are considered heavy crudes (API gravity of 26 and below). The other dimension is sulfur content; so- called “sweet” crudes have a low sulfur content (0.5 percent sulfur content and below), while “sour” crudes have a higher sulfur content (0.5 percent sulfur and above).
The quality of crude oil determines how much pro cessing it needs before it becomes a useful petroleum product such as kerosene, gasoline, or diesel fuel. light, sweet crude oils need less sophisticated equipment and less energy to pro cess. Different crude qualities also produce a different mix of products.
594-60736_ch01_4P.indd 12 2/6/15 10:06 AM
dElIVErINg THE gOOdS | 13
The potential problem forecast by many analysts, however, is the mismatch between the quality and volume of the lighter unconventional oils and the domestic refining system, particularly in the Gulf Coast, which is currently configured to run heavier, sour crudes. In an attempt to take advantage of lower light oil input costs, some refiners may choose to add or modify equipment to increase crude runs, or they may seek alternative light and heavier crudes to “blend” to correspond with equipment and product slate requirements. These choices are evaluated according to estimated return on investment, a calculation highly dependent on forecast prices for inputs and outputs. Other high conversion refineries, however, are unlikely to make those changes, especially if suitable quality crudes (from import sources or the U.S. outer continental shelf) are likely to remain available and competitively priced. Therefore, the policies and infrastructure developments that determine the availability of various crude qualities— and the price of these crudes— will have a strong impact on the refining sector.
In addition, the volumes and characteristics of various plays (e.g., dry gas, liquids rich gas, and oil plays) have prompted producers to look for ways to maximize their output value. In some cases, this leads to separating production streams (oil, liquids, and gas) and developing attendant infrastructure and demand markets (sometimes vertically integrated) to move those products. As oil production has risen, the volume of associated gas has grown enormously. Similarly, in liquids rich plays, where the price of condensate/gas liquids has improved the economics, gas flows have remained high.
Uncertainty about Production remainsFurther increases in crude output in existing producing areas and in new regions are expected, but the shape of the extended production profile remains unknown. The upheavals reconfiguring North American supply and energy trade flows are far from over.
Even so, there is considerable geologic and economic uncertainty about the future of new North American production. In par tic u lar, the downturn in oil prices beginning in the middle of 2014 and accelerating in the second half of that year has called into question the price responsiveness of oil production for higher cost resources like certain tight oil plays and Canadian oil sands production. The resilience of this production to low prices is likely to be tested, assuming prices remain low.
Current U.S. tight oil projections are based on fields that only have a few years’ worth of production data; extrapolating long- term conclusions regarding a resource with such a short production history can distort the accuracy of results. Production could increase beyond current expectations if recovery rates improve, technological innovation outpaces declines, or new frontiers are discovered (assuming prices are high enough to encourage investment). However, it could flatten or decline over the next 15 to 20 years for a variety of reasons. In fact, EIA’s 2014 Annual Energy Outlook projects a decline in U.S. oil production starting in 2018, based on current knowledge of the resource base, well productivity, and recovery rates. At the same time, there are other known unconventional oil plays that have
594-60736_ch01_4P.indd 13 2/6/15 10:06 AM
hn hk io il sy SY eh ekhn hk io il sy SY eh ekhn hk io il sy SY eh ekhn hk io il sy SY eh ekhn hk io il sy SY eh ekhn hk io il sy SY eh ek
hn hk io il sy SY eh ekhn hk io il sy SY eh ek
14 | VErrASTrO, MElTON, lAdISlAw, HYlANd, ANd BOOk
yet to be developed, both in North America and globally. In North America, all three countries have potentially promising plays that have not yet been developed, among them the Duvernay in Alberta, Canada, the Mexican side of the Ea gle Ford, and even new areas in the United States such as the variety of basins in the Permian (in Texas and New Mexico). Each new play comes with its own set of characteristics and challenges that determine its production potential. Furthermore, as seen over the past 30 years, new technologies may further expand access to the resource base in ways not currently anticipated and that may require further changes to the existing midstream oil infrastructure.
In the Canadian context, there is significant production uncertainty around its own unconventional light tight oil, as well as its oil sands production. while oil sands production has proved itself resilient to previous oil price declines due to the long term nature of investment and operating structure, the high cost nature of its production relative to other types of oil does make it susceptible to curtailment of investments designed to bring on new production. Uncertainty is perhaps greatest in terms of Mexico’s production outlook, given the still undetermined investment framework and the broader oil price environment driving capital expenditure decisions for companies looking to enter the Mexican oil sector. while the production outlook for all three North American countries carries fair degrees of uncertainty, the pace and magnitude of U.S. production growth and the possi ble economic, geologic, and technological uncertainties at play in those developments make outcomes in the United States the most significant driver of infrastructure shifts for the near to medium term future.
The Changing MidstreamAll the changes upstream have had significant reverberations for North American oil infrastructure and the crude oil delivery system. For de cades, midstream infrastructure in North America has been dominated by large pipelines that move crude oil and petroleum products from long- standing places of production along established routes to fixed destinations. In the past few years, however, the changes in volume, location, and quality in the upstream (described earlier) have resulted in new midstream movements. Petroleum trade flows in the United States are traveling in new directions and utilizing different modes of transportation. The question on the minds of market participants and other interested observers is whether the midstream oil infrastructure system in the United States is in the midst of a permanent shift, and, if so, what the new system will look like. For example, will the new system be dominated by pipelines centered on the gulf Coast (as was the old one), or will it be distinguished as a system where flows are multidirectional, remain fluid, and utilize many different modes of transit?
Optionality and flexibility are key for producers looking to move their refined products to the market that yields the highest returns and for refiners intent on making the mix of products that yields the greatest margin relative to the cost of their crude oil inputs. It is important to note that while the new system is emerging rapidly due to changes upstream, the system that ultimately emerges will also be influenced by the shifting nature and
594-60736_ch01_4P.indd 14 2/6/15 10:06 AM
dElIVErINg THE gOOdS | 15
growing complexity of the refined products market, which has seen demand centers grow in emerging economies and the build- out of major new refining complexes in Asia and the Middle East.
u.S. crude FlowS PaSt and Pre Sent
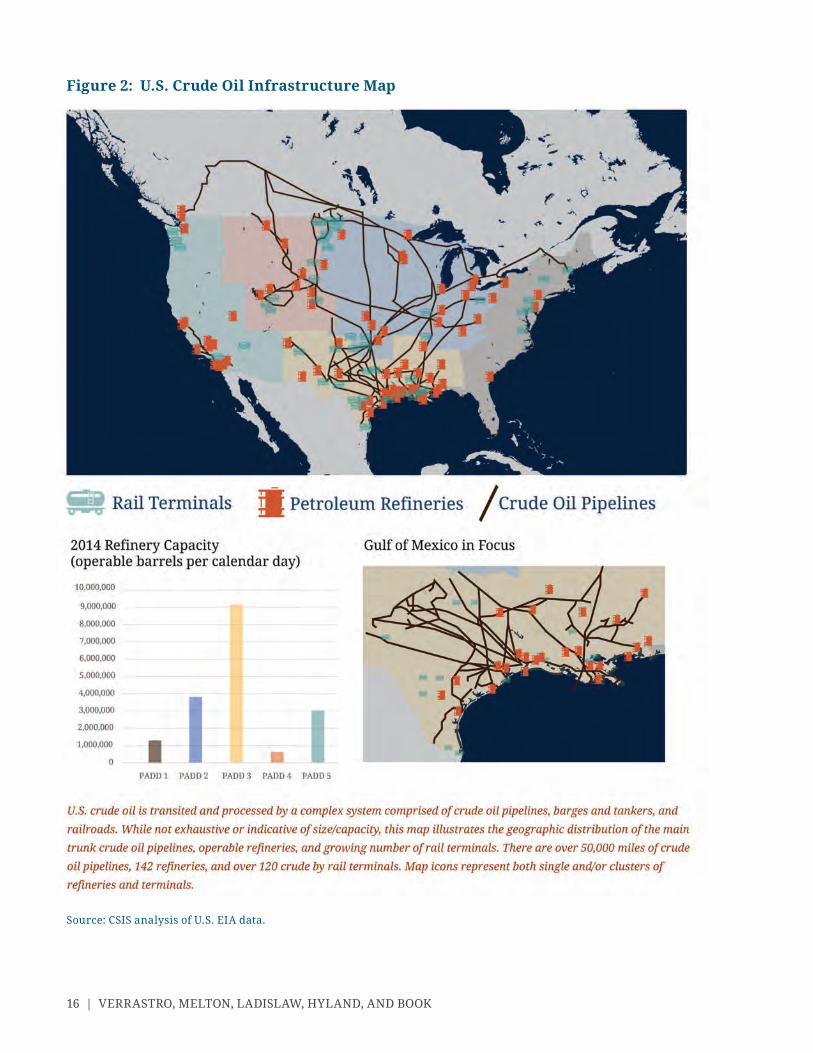
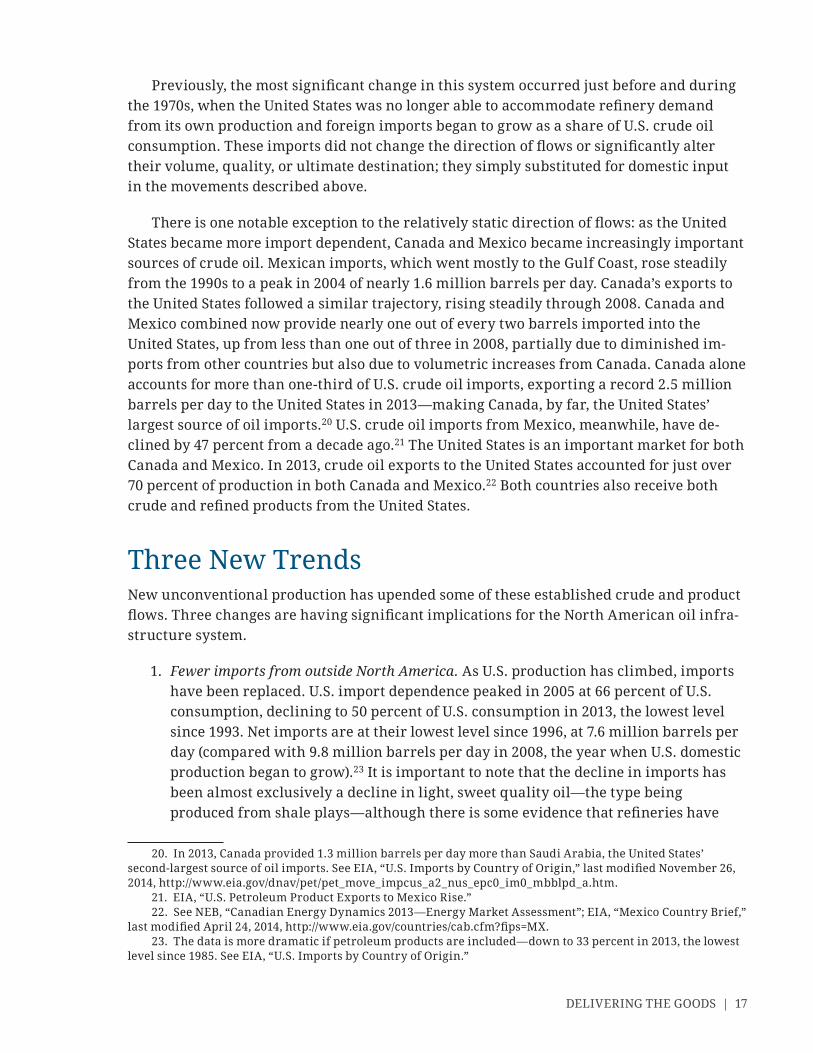
Until unconventional production came online earlier in the de cade, domestic crude oil flows were relatively fixed, reflecting the somewhat static nature of domestic oil production, refining centers, and demand trends. Historically, 80 percent of U.S. production came from four states (Texas, Alaska, California, and Louisiana) and the offshore Gulf of Mexico. Petroleum product demand, meanwhile, was centered along the coasts and near population centers in the midcontinent. Refining and pipeline infrastructure developed to deliver fuels to consumers. Established production centers fed each region’s refineries via a variety of major pipelines (supplemented in much smaller volumes by waterborne trade) that, east of the Rockies, flowed typically from south to north and northeast. As the East Coast had little indigenous production of crude oil and high demand for gasoline, consumer demand was met through pipelines from the gulf Coast and imports of lighter products in major centers like New York Harbor and Philadelphia. The western part of United States (beyond the rockies) was relatively in de pen dent of the region east of the rockies. Crude oil movements in the United States fell into four major groups:
1. Gulf Coast to Midwest. About 75 percent of all crude oil moved by pipeline in the United States in 2010 traveled from the gulf Coast into the Midwest. Most major trunk pipelines in the United State serve this route.
2. Intra- Gulf Coast. Includes movement from production centers in the Southwest (such as Oklahoma, New Mexico, and Colorado) and from production centers in Texas and Louisiana to the Gulf Coast for refining. In later years, once offshore Gulf Coast production became an important contributor to overall U.S. production, from offshore Gulf Coast to local Gulf refineries for transshipment or refining.
3. Gulf Coast to East Coast. From southwestern crude oil production centers and gulf Coast refining hubs for transshipment to the East Coast and from refining centers on the gulf Coast to consumption centers on the East Coast.
4. Intra- West Coast. From production in California to local refineries, and, in later years, once Alaskan production became an important contributor to overall U.S. production, from Alaska to refineries on the West Coast for refining and consumption therein.
The refineries in each of the regions adjusted their configurations to accommodate the quality of oil from these established flows; when domestic production could no longer meet demand, the regions adjusted to imports. Also, over time, many small refineries closed and larger refineries, particularly on the Gulf Coast, expanded.
594-60736_ch01_4P.indd 15 2/6/15 10:06 AM
hn hk io il sy SY eh ekhn hk io il sy SY eh ekhn hk io il sy SY eh ekhn hk io il sy SY eh ekhn hk io il sy SY eh ekhn hk io il sy SY eh ek
hn hk io il sy SY eh ekhn hk io il sy SY eh ek
16 | VErrASTrO, MElTON, lAdISlAw, HYlANd, ANd BOOk
Figure 2: u.S. crude oil infrastructure map
Source: CSIS analysis of U.S. EIA data.
594-60736_ch01_4P.indd 16 2/6/15 10:06 AM
dElIVErINg THE gOOdS | 17
Previously, the most significant change in this system occurred just before and during the 1970s, when the United States was no longer able to accommodate refinery demand from its own production and foreign imports began to grow as a share of U.S. crude oil consumption. These imports did not change the direction of flows or significantly alter their volume, quality, or ultimate destination; they simply substituted for domestic input in the movements described above.
There is one notable exception to the relatively static direction of flows: as the United States became more import dependent, Canada and Mexico became increasingly important sources of crude oil. Mexican imports, which went mostly to the Gulf Coast, rose steadily from the 1990s to a peak in 2004 of nearly 1.6 million barrels per day. Canada’s exports to the United States followed a similar trajectory, rising steadily through 2008. Canada and Mexico combined now provide nearly one out of every two barrels imported into the United States, up from less than one out of three in 2008, partially due to diminished imports from other countries but also due to volumetric increases from Canada. Canada alone accounts for more than one- third of U.S. crude oil imports, exporting a rec ord 2.5 million barrels per day to the United States in 2013— making Canada, by far, the United States’ largest source of oil imports.20 U.S. crude oil imports from Mexico, meanwhile, have declined by 47 percent from a de cade ago.21 The United States is an important market for both Canada and Mexico. In 2013, crude oil exports to the United States accounted for just over 70 percent of production in both Canada and Mexico.22 Both countries also receive both crude and refined products from the United States.
Three New TrendsNew unconventional production has upended some of these established crude and product flows. Three changes are having significant implications for the North American oil infrastructure system.
1. Fewer imports from outside North America. As U.S. production has climbed, imports have been replaced. U.S. import dependence peaked in 2005 at 66 percent of U.S. consumption, declining to 50 percent of U.S. consumption in 2013, the lowest level since 1993. Net imports are at their lowest level since 1996, at 7.6 million barrels per day (compared with 9.8 million barrels per day in 2008, the year when U.S. domestic production began to grow).23 It is important to note that the decline in imports has been almost exclusively a decline in light, sweet quality oil— the type being produced from shale plays— although there is some evidence that refineries have
20. In 2013, Canada provided 1.3 million barrels per day more than Saudi Arabia, the United States’ second- largest source of oil imports. See EIA, “U.S. Imports by Country of Origin,” last modified November 26, 2014, http:// www . eia . gov / dnav / pet / pet _ move _ impcus _ a2 _ nus _ epc0 _ im0 _ mbblpd _ a . htm .
21. EIA, “U.S. Petroleum Product Exports to Mexico Rise.”22. See NEB, “Canadian Energy Dynamics 2013— Energy Market Assessment”; EIA, “Mexico Country Brief,”
last modified April 24, 2014, http:// www . eia . gov / countries / cab . cfm ? fips = MX . 23. The data is more dramatic if petroleum products are included— down to 33 percent in 2013, the lowest
level since 1985. See EIA, “U.S. Imports by Country of Origin.”
594-60736_ch01_4P.indd 17 2/6/15 10:06 AM
hn hk io il sy SY eh ekhn hk io il sy SY eh ekhn hk io il sy SY eh ekhn hk io il sy SY eh ekhn hk io il sy SY eh ekhn hk io il sy SY eh ek
hn hk io il sy SY eh ekhn hk io il sy SY eh ek
18 | VErrASTrO, MElTON, lAdISlAw, HYlANd, ANd BOOk
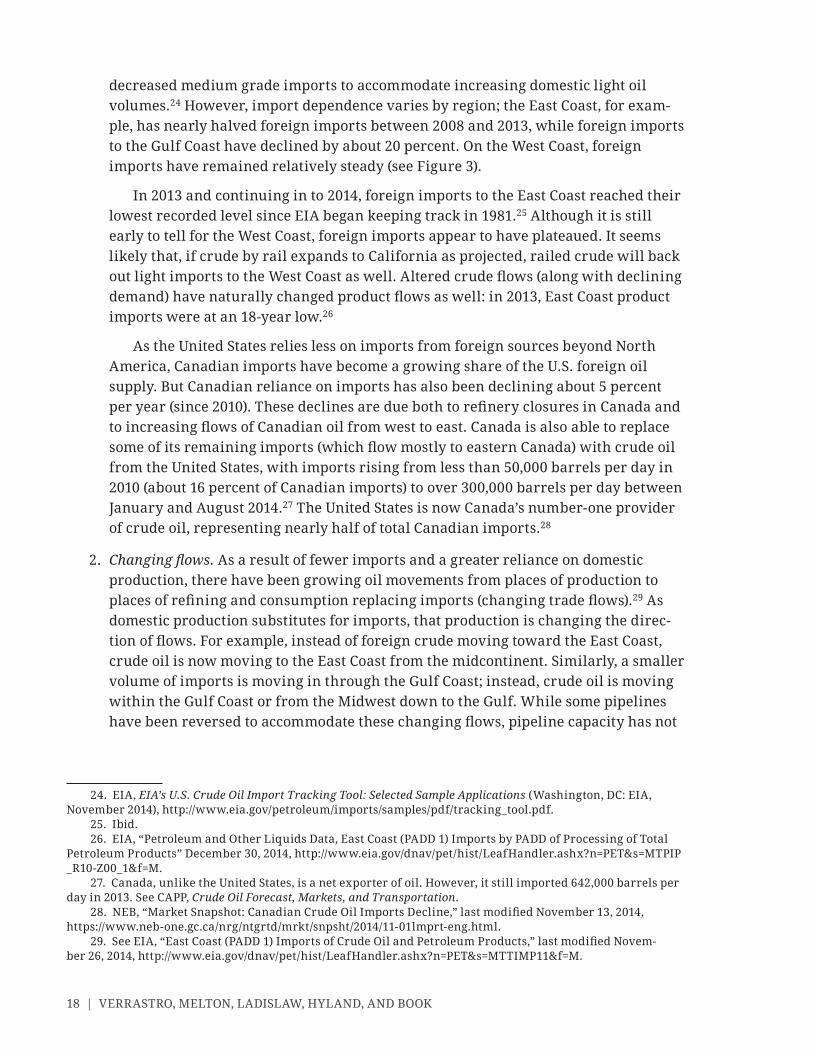
decreased medium grade imports to accommodate increasing domestic light oil volumes.24 However, import dependence varies by region; the East Coast, for example, has nearly halved foreign imports between 2008 and 2013, while foreign imports to the gulf Coast have declined by about 20 percent. On the west Coast, foreign imports have remained relatively steady (see Figure 3).
In 2013 and continuing in to 2014, foreign imports to the East Coast reached their lowest recorded level since EIA began keeping track in 1981.25 Although it is still early to tell for the west Coast, foreign imports appear to have plateaued. It seems likely that, if crude by rail expands to California as projected, railed crude will back out light imports to the West Coast as well. Altered crude flows (along with declining demand) have naturally changed product flows as well: in 2013, East Coast product imports were at an 18 year low.26
As the United States relies less on imports from foreign sources beyond North America, Canadian imports have become a growing share of the U.S. foreign oil supply. But Canadian reliance on imports has also been declining about 5 percent per year (since 2010). These declines are due both to refinery closures in Canada and to increasing flows of Canadian oil from west to east. Canada is also able to replace some of its remaining imports (which flow mostly to eastern Canada) with crude oil from the United States, with imports rising from less than 50,000 barrels per day in 2010 (about 16 percent of Canadian imports) to over 300,000 barrels per day between January and August 2014.27 The United States is now Canada’s number one provider of crude oil, representing nearly half of total Canadian imports.28
2. Changing flows. As a result of fewer imports and a greater reliance on domestic production, there have been growing oil movements from places of production to places of refining and consumption replacing imports (changing trade flows).29 As domestic production substitutes for imports, that production is changing the direction of flows. For example, instead of foreign crude moving toward the East Coast, crude oil is now moving to the East Coast from the midcontinent. Similarly, a smaller volume of imports is moving in through the Gulf Coast; instead, crude oil is moving within the gulf Coast or from the Midwest down to the gulf. while some pipelines have been reversed to accommodate these changing flows, pipeline capacity has not
24. EIA, EIA’s U.S. Crude Oil Import Tracking Tool: Selected Sample Applications (washington, dC: EIA, November 2014), http:// www . eia . gov / petroleum / imports / samples / pdf / tracking _ tool . pdf .
25. Ibid.26. EIA, “Petroleum and Other liquids data, East Coast (PAdd 1) Imports by PAdd of Pro cessing of Total
Petroleum Products” December 30, 2014, http:// www . eia . gov / dnav / pet / hist / LeafHandler . ashx ? n = PET & s = MTPIP _ R10 - Z00 _ 1 & f = M .
27. Canada, unlike the United States, is a net exporter of oil. However, it still imported 642,000 barrels per day in 2013. See CAPP, Crude Oil Forecast, Markets, and Transportation.
28. NEB, “Market Snapshot: Canadian Crude Oil Imports Decline,” last modified November 13, 2014, https:// www . neb one . gc . ca / nrg / ntgrtd / mrkt / snpsht / 2014 / 11 01lmprt eng . html .
29. See EIA, “East Coast (PADD 1) Imports of Crude Oil and Petroleum Products,” last modified November 26, 2014, http:// www . eia . gov / dnav / pet / hist / LeafHandler . ashx ? n = PET & s = MTTIMP11 & f = M .
594-60736_ch01_4P.indd 18 2/6/15 10:06 AM
dElIVErINg THE gOOdS | 19
been able to keep up with demand; as a result, there is a growing reliance on new modes of transportation.30
Particularly significant is the reversal of the south to north/northeast flow of crude oil. In the Midwest, North Dakota is now sending significantly more crude oil south to the Gulf Coast and east to East Coast, and, for the first time, crude is increasingly flowing west from North Dakota to the West Coast. And it is not just North Dakota crude oil that is flowing south, east, and west; Canadian crude oil is flowing in those same directions in larger and larger volumes. Historic crude oil flows between the Midwest and the gulf Coast have also changed. during the 1990s, the gulf Coast received around 15 million barrels per year of crude oil from the Midwest. That number rose to 172 million barrels per year in 2013 (a similar trend is observed for petroleum products). Crude oil flows to the Midwest have declined. In 2004, the
30. This has changed flows not just domestically but internationally; new U.S. production, predominantly of lighter grades, has backed out foreign crude oil imports of a similar quality— especially from Nigeria, Angola, and Algeria. As a result, waterborne light oil that used to flow west to the United States and Eu rope is now flowing mostly to Asia.
Figure 3: Source of crude oil by Padd, 2008 and 2013
Source: CSIS analysis of U.S. EIA data.
594-60736_ch01_4P.indd 19 2/6/15 10:06 AM
hn hk io il sy SY eh ekhn hk io il sy SY eh ekhn hk io il sy SY eh ekhn hk io il sy SY eh ekhn hk io il sy SY eh ekhn hk io il sy SY eh ek
hn hk io il sy SY eh ekhn hk io il sy SY eh ek
20 | VErrASTrO, MElTON, lAdISlAw, HYlANd, ANd BOOk
gulf Coast sent about 696 million barrels per year to the Midwest. less than ten years later in 2013, that number was down to 331 million barrels per year— a decline of more than 50 percent. The Midwest is also sending larger volumes of crude oil to the rocky Mountain region.
Canadian oil production, centered in Alberta (77 percent of Canada’s oil production comes from Alberta), was expected to flow down to the U.S. Gulf Coast. As U.S. flows change, and in part due to difficulties with the Keystone XL pipeline, Albertan
Gulf coast congestion
The extraordinary surge in domestic oil (and gas) production brought on by the shale revolution has generated considerable press coverage and speculation about possi ble U.S. oil in de pen dence. while much attention has rightly been paid to the marked reduction in net U.S. oil imports on a national basis, the gross flow of import and export traffic on the Gulf Coast remains high and on pace to grow; in 2013, the United States imported 7.6 million barrels of crude oil per day and 2.1 million barrels per day of petroleum products. That accounts for some 9 million barrels per day out of total domestic demand of a bit more than 18 million barrels per day. While this is a smaller volume than in 2008, U.S. exports of crude oil, condensates, and refined petroleum products are also on the rise, potentially taxing infrastructure (ports, docks, tankers, barges, storage, etc.) as cumulative gross petroleum movements increase.
Add to this the prospect of liquefied natural gas (LNG) exports moving out of the Gulf Coast beginning in the next few years, along with logistics issues surrounding the movement of oil in or out of the SPr and the United States, and the result may be an (over)taxing of Gulf Coast pipelines, ports, storage facilities, ship channels, and ships themselves— and that does not even take into consideration any delays caused by accidents or storms closing port facilities and backing up tanker traffic. According to one report, an average day in the Houston ship channel in 2013 saw 38 tankers, 22 freighters, a cruise ship, 345 towboats, 6 public vessels, 297 ferries, 25 other transits, and 75 ships in port. Moreover, the region expects an estimated expansion of US$35 billion in new energy and chemical com pany projects.1
From an infrastructure and investment perspective, this is important: the increased traffic caused by increases in gross flows results in greater congestion, the need for more investment in infrastructure, and a greater understanding of potential market distortions due to bottlenecks.
1. Isaac Arnsdorf and Dan Murtaugh, “Big Ships Play Texas Chicken in Congested Houston Channel,” Bloomberg Businessweek, February 27, 2014, http:// www . businessweek . com / articles / 2014 02 27 / houston ship channel congested by u dot s dot oil and gas boom .
594-60736_ch01_4P.indd 20 2/6/15 10:06 AM
dElIVErINg THE gOOdS | 21
producers (much like their Bakken counter parts) are exploring sending their oil east and west instead of south.
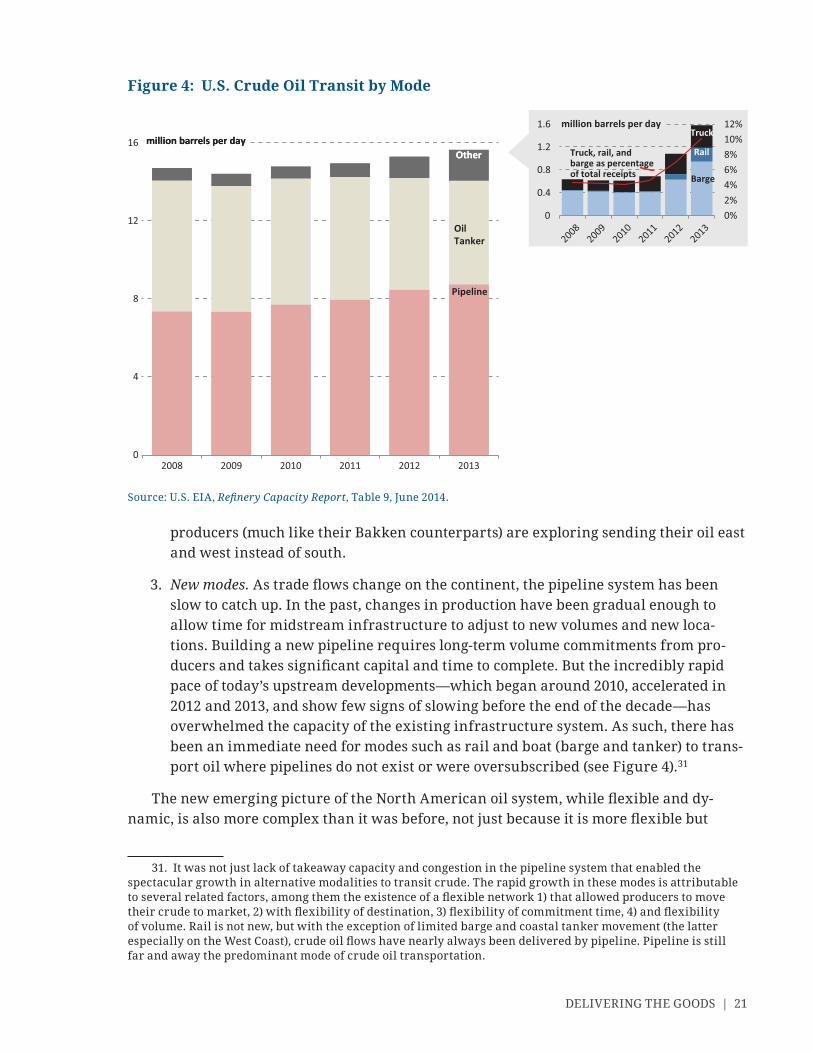
3. New modes. As trade flows change on the continent, the pipeline system has been slow to catch up. In the past, changes in production have been gradual enough to allow time for midstream infrastructure to adjust to new volumes and new locations. Building a new pipeline requires long term volume commitments from producers and takes significant capital and time to complete. But the incredibly rapid pace of today’s upstream developments— which began around 2010, accelerated in 2012 and 2013, and show few signs of slowing before the end of the decade— has overwhelmed the capacity of the existing infrastructure system. As such, there has been an immediate need for modes such as rail and boat (barge and tanker) to transport oil where pipelines do not exist or were oversubscribed (see Figure 4).31
The new emerging picture of the North American oil system, while flexible and dynamic, is also more complex than it was before, not just because it is more flexible but
31. It was not just lack of takeaway capacity and congestion in the pipeline system that enabled the spectacular growth in alternative modalities to transit crude. The rapid growth in these modes is attributable to several related factors, among them the existence of a flexible network 1) that allowed producers to move their crude to market, 2) with flexibility of destination, 3) flexibility of commitment time, 4) and flexibility of volume. Rail is not new, but with the exception of limited barge and coastal tanker movement (the latter especially on the West Coast), crude oil flows have nearly always been delivered by pipeline. Pipeline is still far and away the predominant mode of crude oil transportation.
Figure 4: u.S. crude oil transit by mode
16 million barrels per day8%10%12%
1.2
1.6 million barrels per day
Other
Truck
RailTruck, rail, andbarge as percentageof total receipts
12
million barrels per day
0%2%
4%6%
0
0.4
0.8
2008
2009
2010
2011
2012
2013
Other
Oil Tanker
Barge
4
8Pipeline
02008 2009 2010 2011 2012 2013
Source: U.S. EIA, Refinery Capacity Report, Table 9, June 2014.
594-60736_ch01_4P.indd 21 2/6/15 10:06 AM
hn hk io il sy SY eh ekhn hk io il sy SY eh ekhn hk io il sy SY eh ekhn hk io il sy SY eh ekhn hk io il sy SY eh ekhn hk io il sy SY eh ek
hn hk io il sy SY eh ekhn hk io il sy SY eh ek
22 | VErrASTrO, MElTON, lAdISlAw, HYlANd, ANd BOOk
because there are more types of oil and products moving around in larger volumes. given the market dynamics, it is far from clear whether this is a new system emerging or one that is simply still in flux. For example, certain modalities make commercial sense in the current market (whether due to production uncertainty, current price differentials and price levels, regulatory uncertainty, or lack of existing and more desirable infrastructure), but they may not persist. The factors driving new modes, moreover, may lead to a longer lasting midstream solution. Alternatively, producers and marketers may grow accustomed to flexibility and seek to maintain options in their crude marketing decisions. For now, it has become a far more complex landscape for commercial actors to navigate.
594-60736_ch01_4P.indd 22 2/6/15 10:06 AM
| 23
The Changing U.S. Policy and Regulatory Landscape
For more than five years, the United States has been grappling with the strategic implications of new North American liquids production. To be clear, the new U.S. domestic
production profile is a good news story from nearly every vantage point; finding an appropriate response to it, however, has challenged market participants and policymakers alike. In the beginning, the challenge was to evaluate the magnitude of the change: the size of the production surge and resource potential. The subsequent challenge was to understand the commercial and environmental impacts of the new production and further determine its longevity. Today, policymakers and industry are incorporating new production into their understanding of market and policy realities and trends. Now that the resource potential has been identified, determined to be real and potentially long- lasting, and is beginning to have transformative impacts on pipelines, rail lines, barges, boats, and refineries, the next step for policymakers and market players is to derive as much value— security, economic, and environmental— from the resource as possi ble.
The first priority is to ensure that these resources are distributed to market in a manner that is both safe and efficient. In an ideal world, policymakers and regulators work together with industry and civil society to ensure this safety and efficiency. Given the recent pace and scale of the infrastructure changes under way, ensuring a proper balance between safety and efficiency has been a par tic u lar challenge. Nowhere has the strug gle for industry and regulators to keep pace with change been more acute than with res pect to crude oil transported by rail, where the transportation of huge volumes of crude oil traveling by rail infrastructure has led to an increase in spills and several high profile accidents. The nature of these concerns and the public demand for attention and appropriate action require a swift and thorough response.
The second priority is to address strategic issues that arise as a result of infrastructure changes, which include reassessing currently accepted understandings of broader notions of security, economic efficiency, and longer range environmental impacts. Examples of the strategic concerns raised by infrastructure changes include the U.S. management of strategic petroleum stocks, crude oil delivery through Jones Act vessels between U.S. ports, the prohibition of nearly all crude oil exports outside the United States, and implications of continued fossil fuel use globally on the climate. while none of these issues are new, the midstream changes currently under way point to the need for a significant strategic and tactical rethink
2
594-60736_ch01_4P.indd 23 2/6/15 10:06 AM
hn hk io il sy SY eh ekhn hk io il sy SY eh ekhn hk io il sy SY eh ekhn hk io il sy SY eh ekhn hk io il sy SY eh ekhn hk io il sy SY eh ek
hn hk io il sy SY eh ekhn hk io il sy SY eh ek
24 | VErrASTrO, MElTON, lAdISlAw, HYlANd, ANd BOOk
about how policymakers and industry conceive the broader energy market landscape. The intent in this report is not to offer policy solutions but instead to suggest areas where policymakers should undertake broad strategic reviews to ensure the optimal approach given the array of changes already occurring. It is also noted that market forces are moving at a rapid pace and in ways that are often hard to predict, requiring policymakers to strive to understand the limits of policymaking that may apply in such circumstances.
Transportation SafetyAll parties, including producers, refiners, shippers, regulators, and consumers, have an interest in and responsibility for safe transportation of oil from production centers to final destinations. It is important that regulators align incentives to maximize safety among all modes of transit. Ensuring safe transit of goods requires constant vigilance on the part of both industry and regulators. Two questions for policymakers are whether existing regulations may be under stress from the sheer pace and volume of change and whether current regulatory pro cesses are adequate.
The focus here is on the safety considerations related to the delivery of crude oil by rail, although we are aware that pipeline safety remains an important issue for regulators, as does the safety and integrity of waterborne transit (see box). We do not believe the challenges of regulating the safe transit of crude oil are unique to rail; however, the rate and severity of recent crude by rail accidents have made crude by rail a focus of regulatory and public scrutiny.1
1. There is an ongoing debate about the relative safety merits of shipping crude by rail versus pipeline. Over the past two de cades, both modes have demonstrated improved safety rec ords even as greater volumes of hazardous materials are carried. Both modes deliver more than 99 percent of their crude product safely. Comparisons between the two modes are difficult because of different reporting requirements. All sides agree, however, that safety is paramount.
Pipeline and crude by water Safety issues
Concerns about transporting crude oil via pipeline and water center on preventing incidents, especially fatalities and serious injuries, and mitigating the impact of an accidental release of crude oil on human and natural environments. Over the last two de cades, safety has improved among all modes of hazardous liquids transit, even as mileage/freight tonnage has increased.
There are over 186,000 miles of pipeline (onshore and offshore) that carry hazardous liquids. while pipelines are generally considered a very safe way to transport crude oil, no mode of transportation is without incident. There were 116 liquid pipeline spills with environmental consequences in 2011 (and one death). Both the federal Pipelines and Hazardous Materials Safety Administration (PHMSA), which oversees hazardous pipeline safety and industry, have been
594-60736_ch01_4P.indd 24 2/6/15 10:06 AM
dElIVErINg THE gOOdS | 25
working to improve pipeline safety. In 2011, Congress passed a bill that initiated a suite of reforms targeting pipeline safety that PHMSA is still working to implement. Recent significant crude oil pipeline incidents (most prominently in Arkansas in March 2013 and an October 2013 spill in North dakota) demonstrate the continued need for vigilance by industry and regulators. In addition to concerns about oil releases (i.e., spills), attention is needed to minimize the release of other hazardous liquids such as natural gas liquids and wastewater from hydraulically fractured wells. A 2013 Congressional research Ser vice (CrS) report highlighted several key issues for improved safety, including “pipeline agency staff resources, automatic pipeline shutoff values, and penalties for safety violations,” among others.1 The National Transportation Safety Board (NTSB), an investigative body with no regulatory authority, listed enhancing pipeline safety on its annual top ten “most wanted” list in both 2013 and 2014 (NTSB recommendations cover both hazardous liquid and natural gas pipelines).2 NTSB argues that, on the industry side, companies can strengthen operational practices and expand the use of pipeline inspection tools, as well as incorporate hydrostatic testing. regulators, according to NTSB, can enhance their role, and both sides can enhance communication with communities through which pipelines travel. As pipeline build out and reversals increase to accommodate liquids production growth, Congress may choose to revisit its 2011 law in light of the shifting infrastructure landscape.
while marine transportation (i.e., by tanker or barge) has long been an important component of the crude oil and products trade in specific regions of the country (especially from Alaska to the west Coast and from Vancouver to the United States), crude by water has become increasingly appealing for producers in the Midwest and Gulf Coast. In 2013, 16 percent of crude oil was delivered to refineries by water, up from 14.5 percent in 2008. As larger volumes of crude oil (and other petroleum products) move by boat, growing congestion within inland waterways and at ports raises concerns about the potential for incidents and spills. This concern was heightened in the wake of a March 2014 incident in the Houston Ship Channel, where two ships collided, resulting in a release of about 4,000 barrels of fuel oil and the closure of the busy waterway for three days.
The U.S. Coast guard (USCg) has the primary role in preventing marine oil spills though its regulatory authority; it oversees the safety of vessels and the training and working conditions of crews. A recent Congressional research Ser vice report has raised concerns about whether the USCg is issuing safety regulations at an adequate pace, as well as whether the USCg is able to provide effective safety oversight.3 EPA also has regulatory authority to prevent, prepare for, and respond to oil spills in U.S. inland waters (the USCg has this responsibility in coastal waters and deepwater ports), including oversight of storage facilities that have the potential to discharge hazardous materials into inland waterways. These issues are not unique
594-60736_ch01_4P.indd 25 2/6/15 10:06 AM
hn hk io il sy SY eh ekhn hk io il sy SY eh ekhn hk io il sy SY eh ekhn hk io il sy SY eh ekhn hk io il sy SY eh ekhn hk io il sy SY eh ek
hn hk io il sy SY eh ekhn hk io il sy SY eh ek
26 | VErrASTrO, MElTON, lAdISlAw, HYlANd, ANd BOOk
BackGround on crude BY rail Growth
Rail transportation of crude oil— previously considered too expensive to compete with pipelines— has received significant attention due to its exponential growth.2 Although transporting crude oil by railroad is not new, crude by rail comprised a very small share of midstream petroleum movements until recently. In 2008, volumes of crude traveling by rail were negligible (less than 9,400 carloads of crude3). This began to change around 2010, accelerating significantly beginning in 2011 to 66,000 carloads in the United States. In 2013, over 430,000 carloads of crude oil were moved in the United States, up 74 percent from 2012.4 Petroleum and petroleum product loadings in the United States have increased 13 percent between 2013 and 2014 (January through October). rail now accounts for more than 11 percent of U.S. crude oil movements, up from 1 percent in 2008.5 Canada has also seen a surge in crude by rail volumes; crude exports by rail have risen to over 163,000 barrels per day, up from less than 16,000 in the first quarter of 2012.6 Increased rail use in both countries is driven by pipeline constraints and a desire to reach coastal markets not served by pipelines.
Because the North American liquids pipeline network was built to connect gulf Coast production and imports with the refining and demand centers in the Midwest, there was no short term alternative to move light, sweet Bakken crude to these destinations, where demand for it was highest. Crude by rail was initially utilized exclusively to move crude out of the Bakken to refineries in the East, but its success there has led producers in other
2. The Congressional Research Ser vice recently released an excellent primer on crude by rail. See John Frittelli et al., U.S. Rail Transportation of Crude Oil: Background and Issues for Congress (washington, dC: CrS, december 4, 2014), http:// fas . org / sgp / crs / misc / r43390 . pdf .
3. A carload is about 25,000–30,000 gallons, or about 600–700 barrels of crude oil, depending on the size of the car, the thickness of the steel, and how fully the car is loaded.
4. Associated Press, “Crude Oil Shipments by rail Increased 83 Percent in 2013,” New York Times, March 13, 2014, http:// www . nytimes . com / 2014 / 03 / 14 / business / crude oil shipments by rail increased 83 percent in 2013 . html .
5. Sandy Fielden, “I’ve Been working on the railroad— Crude by rail— An rBN Energy drill down report,” RBN Energy, January 8, 2014, https:// rbnenergy . com / i ve been working on the railroad crude by rail an rbn energy drill down report .
6. NEB, “Market Snapshot: Crude Oil Exports by Rail,” last modified October 22, 2014, https:// www . neb - one . gc . ca / nrg / ntgrtd / mrkt / snpsht / 2014 / 10 - 02crdxprt - eng . html .
to the safety of moving petroleum products, but as increasing volumes of these commodities move by water, it may be an area for more focused congressional and regulatory attention.
1. Paul w. Parfomak, Keeping America’s Pipelines Safe and Secure: Key Issues for Congress (washington, dC: CrS, January 9, 2013), 34.
2. See the NTSB Most Wanted List 2014, Enhance Pipeline Safety, http:// app . ntsb . gov / safety / mwl5 _ 2014 . html. Full list available at http:// app . ntsb . gov / safety / mwl2014 / MWL2014 _ broc _ Web . pdf; for 2013, see http:// www . ntsb . gov / safety / mwl / Pages / mwl7 _ 2012 . aspx.
3. John Frittelli, Shipping U.S. Crude Oil by Water: Vessel Flag Requirements and Safety Issues (washington dC: CrS, July 21, 2014).
594-60736_ch01_4P.indd 26 2/6/15 10:06 AM
dElIVErINg THE gOOdS | 27
regions to expand their rail capabilities. In just a few short years, rail has become an increasingly important alternative to pipelines in several areas of production, as both loading and unloading capacity has increased across North America (see Figure 2). The crude oil moved by rail is delivered mostly to refineries or to unloading terminals for loading onto another mode of transportation to travel to a refinery. While rail can deliver crude to any region, it has been most competitive in serving the west and East Coasts due to the lack of pipelines serving these markets. Because of the lack of pipelines in these regions, crude by rail is competing on price directly with foreign imports.
while rail remains dominant in North dakota— nearly 70 percent of the state’s crude oil was transported by rail in 2013, peaking at 800,000 barrels per day in October 20137— rail loading is also expanding quickly in Western Canada, Texas, New Mexico, Colorado, Wyoming, and Utah. There is also some indication that rail may be further connecting the west Coast with the rest of the United States. According to California State data, crude by rail into that state has increased by 90.5 percent year on year. while rail comprises less than 1 percent of total crude imports into that state, California projects that it could carry 23 percent of imports as soon as 2016.8
rail is likely to remain an important mode for moving crude oil for many years to come, although how large a role it will play and over what time period is currently the subject of debate. The continued use of rail is extremely sensitive to multiple economic and regulatory factors.9
rail SaFetY iSSueS
Transportation safety issues are not new to this latest round of midstream development, of course. But as discussed earlier, the volume of crude traveling by rail in the United States has increased quickly over the past five years, and the number of major accidents has grown.
Not all stakeholders are convinced that crude by rail shipment has reached the very high standard of safety required. Several high- profile rail accidents have raised questions among policymakers, in the media, and among the general public about whether there is adequate regulation in place to ensure that crude oil traveling by rail can move safely between production centers and pro cessing centers.10 regulators and industry participants
7. Bridget Hunsucker, “North dakota Crude by rail Shipments Fall,” Platts Oilgram News, April 14, 2014.8. California has 16 existing or proposed rail unloading facilities and receives crude by rail from North
Dakota, New Mexico, Utah, Wyoming, and Canada, among other centers. See California Energy Commission, “Crude Imports by Rail 2014,” http:// energyalmanac . ca . gov / petroleum / statistics / 2014 _ crude _ by _ rail . html .
9. The research firm IHS issued a study in 2014 that found railroads could carry 1.5 million barrels per day of crude oil in 2015; however, it also concluded that crude by rail volumes will peak between 2015 and 2017 and will gradually be displaced by pipelines, except in circumstances where refineries are unlikely to be connected to pipelines, as on the East Coast. See kevin Burn et al., Crude by Rail: The New Logistics of Tight Oil and Oil Sands Growth (washington, dC: IHS Energy, december 2014), https:// www . ihs . com / pdf / IHS Oil Sands - Dialogue - Crude - by - rail - dec - 2014 _ 210390110913052132 . pdf .
10. See david Pumphrey, lisa Hyland, and Michelle Melton, “Safety of Crude Oil by rail” (washington, dC: CSIS, March 2014), http:// csis . org / files / publication / 140306 _ Pumphrey _ SafetyCrudeOilRail _ Web . pdf; Sarah
594-60736_ch01_4P.indd 27 2/6/15 10:06 AM
hn hk io il sy SY eh ekhn hk io il sy SY eh ekhn hk io il sy SY eh ekhn hk io il sy SY eh ekhn hk io il sy SY eh ekhn hk io il sy SY eh ek
hn hk io il sy SY eh ekhn hk io il sy SY eh ek
28 | VErrASTrO, MElTON, lAdISlAw, HYlANd, ANd BOOk
are working to improve safety conditions, while local communities are determined to have access to the information and resources necessary to protect themselves in the case of an incident.
regulation falls primarily to the federal government, which is solely responsible for regulating the safety of railroads (through the Federal railroad Administration, or FrA) and the transit of hazardous materials (through the Pipeline and Hazardous Materials Safety Administration, or PHMSA). States and substate localities have a role in preparing first responders and permitting rail facilities, as well as partnering with the federal government in rail inspections. getting rail safety regulation right is important in the immediate term to ensure the safety of communities and the environments through which oil trains pass. But getting it right is also important because of the impact it will have on the future development of crude by rail; regulation will have long- lasting impacts on the cost of anticipated investments in new rail infrastructure such as rail lines, cars, and terminals.
The regulatory questions before governments and industry revolve around two issues: first, whether shippers are meeting current regulatory standards, and second, whether those standards are adequate. In the first category are issues related to enforcement— primarily whether shippers are properly classifying their shipments and whether the federal government is clear enough in what it requires and robust enough in enforcing those standards.11 within the second category are issues including tank car standards, operational standards, stabilization, and state/local emergency response. Federal and, in some instances, state regulators have been working to address both issues. Most prominently, following months of ad hoc regulatory action and enforcement, PHMSA and FrA jointly issued a draft notice of proposed rulemaking in July 2014 that seeks to address these regulatory matters. A final rule is expected in May 2015; although Congress demanded finalization by January 2015, that deadline was not met.
PHMSA and FrA’s draft rule attempts to address nearly all outstanding safety issues.12 It does so by creating a new regulatory category: the high- hazard flammable train (HHFT),
ladislaw et al., “North America Crude by rail Safety Update” (washington, dC: CSIS, May 2014), http:// csis . org / files / publication / 140522 _ Ladislaw _ NorthAmericaCrudeByRail . pdf .
11. Classification— assigning the material to the appropriate group based on its chemical properties—is required for all hazardous materials.
12. There is one outstanding area that NTSB recommended FrA and PHMSA address that is not included in the rule. Federal regulations currently require railroads to have a comprehensive written response plan outlining responses to potential incidents if their cars carry more than certain volume of crude oil. The NTSB has found that the threshold volume is so high that most carriers did not have a comprehensive spill response plan, even if their trains might pose a significant risk. The NTSB recommended that PHMSA revise the requirement to close the loophole so that carriers must have a comprehensive spill response plan and also recommended that the FrA have an auditing program in place to ensure that adequate provisions are in place to respond to an accident. while PHMSA and FrA did not address this issue in their NPrM (notice of proposed rulemaking), they did issue a simultaneous advanced NPrM (known as an ANPrM) asking for comment on whether to change the threshold requirement for comprehensive spill response plans and requesting information about costs that such a threshold would incur. In addition, PHMSA solicited comment on whether such plans should be made available to state entities responsible for emergency response. The comment period on that ANPrM has closed, but it is not clear if or when PHMSA will issue an NPrM or whether FrA has an intention of putting in place a program to audit these plans per NTSB recommendation. Regardless, the extent
594-60736_ch01_4P.indd 28 2/6/15 10:06 AM
dElIVErINg THE gOOdS | 29
defined as a train comprised of 20 or more carloads of flammable liquids. When the rule becomes effective, HHFTs will have additional regulatory requirements related to operations. In addition, the rule requires enhanced tank cars for carry ing crude, expands requirements around testing and classification for crude before it is shipped, and codifies standards for information sharing between railroads and state emergency planning committees.
There have been a range of responses to the FrA PHMSA proposed rule. Environmentalists have charged that the rule does not go far enough, fast enough. while certain industry groups have come together to propose regulatory solutions, there has not been broad consensus among all industry groups on certain aspects of the proposals or the implementation timeline. Many stakeholders are also concerned about the unintended impact of the proposed rule on nonhazardous cargo (e.g., increased costs or other operational impacts resulting from the new standards).
State iSSueS
In addition to the federal efforts, states such as North dakota, California, and New York have taken steps to ensure crude by rail safety. State action falls into several categories. First, states have tried to in de pen dently assess the risk that crude by rail poses to their communities while simultaneously urging the federal government to do its part in enhancing rail safety. washington, for instance, has issued a comprehensive draft report aimed at developing recommendations to foster rail and marine transport safety and environmental protection.13 California officials undertook a similar exercise, as did county officials in California’s San luis Obispo County.14
Second, states have attempted to fill the gaps perceived in federal safety regulations. Many are looking to increase the bud get for track inspectors and develop voluntary speed limitations, in addition to slowing down the permitting pro cess for some infrastructure. There has also been a vigorous debate about whether there is a need to “stabilize” (strip out flammable gases, making crude less volatile and combustible) crude oil originating in North dakota’s Bakken formation. Federal regulators have indicated that while this is an issue they are watching closely, it was not included in the recent round of rulemaking. In December 2014, North Dakota finalized rules requiring stabilization before crude oil is loaded on trains (taking effect April 2015).
to which state and local entities are informed about crude oil transiting through their communities is likely to continue to be an issue.
13. washington State department of Ecol ogy, Washington State Marine and Rail Oil Transportation Study: Preliminary Findings and Recommendations (Olympia: washington State department of Ecol ogy, October 1, 2014), http:// www . ecy . wa . gov / programs / spills / OilMovement / 2014MarinerailOilTransportStudydraftFindings . pdf .
14. California has also made information available about rail movements, including an interactive map with rail and refinery locations and rail routes. See State of California, “Rail Risk and Response,” http:// california . maps . arcgis . com / apps / OnePane / basicviewer / index . html ? appid = 928033ed043148598f7e511a95072b89; State of California Interagency Rail Safety Working Group, “Oil by Rail Safety in California: Preliminary Findings and recommendations,” June 10, 2014, http:// www . caloes . ca . gov / HazardousMaterials / documents / Oil%20By%20rail%20Safety%20in%20California . pdf .
594-60736_ch01_4P.indd 29 2/6/15 10:06 AM
hn hk io il sy SY eh ekhn hk io il sy SY eh ekhn hk io il sy SY eh ekhn hk io il sy SY eh ekhn hk io il sy SY eh ekhn hk io il sy SY eh ek
hn hk io il sy SY eh ekhn hk io il sy SY eh ek
30 | VErrASTrO, MElTON, lAdISlAw, HYlANd, ANd BOOk
Third, states and counties are taking action to increase emergency readiness. State concerns are multiple. First, state and local officials are concerned that they are inadequately informed of the risks posed by crude by rail in their communities and inadequately prepared should an accident occur. residents in communities through which crude trains pass have mobilized around hazmat safety and preparedness. Specifically, local first responders, including volunteer firefighters and local fire chiefs, have drawn attention to the challenges first responders face when accidents occur. Fire chiefs and local first responders testified before Congress and the NTSB that: (1) they lack information about the materials passing through their communities and therefore may not know the best way to respond and react to a hazardous materials fire; (2) they lack the training to respond to a hazardous materials fire; and (3) they lack the equipment and resources necessary to respond and react to a hazardous materials fire.
The FrA has worked to address such concerns, issuing an Emergency Order in May 2014 requiring information about trains carry ing 1 million gallons or more of crude oil originating the Bakken in North dakota be made available to state emergency response committees (although it does not address railroad response plan requirements, local community training, or equipment staging). In its draft rule on crude by rail safety, the department of Transportation codifies that order, requiring trains containing 1 million gallons of Bakken crude to notify the State Emergency response Commissions (SErCs) or other appropriate entities about the operation of these trains through their states. It is unlikely that this information will assuage all state concerns; Oregon, for example, has asked for this information about all trains carry ing crude oil, not only those with 1 million gallons or more originating in the Bakken. The department of Transportation is taking comments on this issue.15
In addition to seeking more information, states are working to enhance emergency response capabilities. For example, New York’s Office of Fire Prevention and Control revised its guidance for firefighters battling oil train fires; that guidance advises firefighters to let the fire burn if more than three cars are on fire and there is no threat to human life.16 States are also developing these response strategies in partnership with the federal government. North dakota recently started hosting training sessions for emergency responders on how to deal with derailments involving hazardous cargoes paid for with federal funds.17 California has imposed a per tank fee that will go toward oil spill prevention and cleanup.18
15. Some nonprofit groups have also argued that the information provided to the SERCs should be made public; disclosure requirements vary by state and are not addressed in the recent proposed rule beyond DOT’s stated preference that information provided to SERCs be kept confidential.
16. New York has had at least four oil train derailments in the first three quarters of 2014, with none resulting in a fire or explosion. See Scott Waldman, “State to First Responders: Stay Back from Burning Oil Trains,” Capital New York, October 10, 2014, http:// www . capitalnewyork . com / article / albany / 2014 / 10 / 8554321 / state - first - responders - stay - back - burning - oil - trains .
17. Patrick Springer, “Area Emergency responders to Train on Special rail Tanker Car,” Prairie Business, October 7, 2014, http:// www . prairiebizmag . com / event / article / id / 21169 / .
18. The fee is being challenged by the state’s railroads, who argue that the state is usurping federal authority. See Tony Bizjak, “California to Impose Fee on Crude Oil Rail Shipments; Funds to Be Used for Spill
594-60736_ch01_4P.indd 30 2/6/15 10:06 AM
dElIVErINg THE gOOdS | 31
Finally, it is possi ble that federal regulatory action will address some, but not all, of the concerns coming from states and localities about the pace and scope of crude by rail infrastructure build out. States and localities do not have jurisdiction over rail safety and operations, but they do generally oversee the development of associated rail infrastructure such as ports, rail terminals, and pro cessing facilities. States and municipalities have started regulating rail loading and unloading facilities in an attempt to exert more control over crude by rail development, in terms of where and how infrastructure is developed by the operational standards and procedures inside their jurisdiction. In one case, a Sacramento official revoked a permit from the Sacramento Metropolitan Air Quality Management district allowing a local fuel distributor to unload crude by rail.19 Environmental groups are also getting involved. The air quality permit revoked in Sacramento was the result of a lawsuit filed by an environmental or ga ni za tion. These issues are about local planning and reflect a desire to exert control over resources moving in and out of the state, but they also (in some instances) reflect a concern about ongoing reliance on fossil fuels. where the objections to crude by rail are primarily about local planning, local pollution, or climate, federal regulatory action will do little to assuage concerns.
FactorS aFFectinG the Future oF crude BY rail reGulation
While the pending PHMSA/FRA regulation is a significant step toward enhancing crude by rail safety, the future of crude rail safety will be determined by multiple factors. Issues that could ultimately affect the regulatory landscape for policymakers and/or the commercial impact of the soon- to-be finalized rule on regulated entities include:
1. Accident rate and impact. The most important factor affecting the future of regulatory action is whether forthcoming regulation succeeds in reducing the incidence of crude by rail accidents. If the rate and severity of crude by rail accidents do not abate, calls for more drastic regulatory action may increase. If, on the other hand, shippers and offerers are able to consistently demonstrate that crude oil can be shipped without major incident, regulators’ primary duty will be to maintain and enforce regulatory standards.
2. The future of oil prices. Producers’ decisions about shipping by rail are influenced by both absolute and relative oil prices. If oil prices drop to low enough levels for sustained periods of time, some producers could slow capital investments in production, which would have an impact on production levels and result in lower crude by rail shipments. Even if prices are not low enough to affect production, lower prices could make pipelines more attractive relative to rail. This could, in turn, affect the growth rate of crude by rail. The price responsiveness of various areas of tight oil production
Prevention, Cleanup,” Sacramento Bee, June 16, 2014, http:// www . sacbee . com / news / politics government / article2601500 . html; Tony Bizjak, “Railroads Sue California over New Crude Oil Rules,” Sacramento Bee, October 8, 2014, http:// www . sacbee . com / news / business / article2623795 . html .
19. Tony Bizjak and Curtis Tate, “Sacramento crude oil transfers halted; air quality official says permit was granted in error,” Sacramento Bee, October 22, 2014, http:// www . sacbee . com / news / local / transportation / article3229042 . html .
594-60736_ch01_4P.indd 31 2/6/15 10:06 AM
hn hk io il sy SY eh ekhn hk io il sy SY eh ekhn hk io il sy SY eh ekhn hk io il sy SY eh ekhn hk io il sy SY eh ekhn hk io il sy SY eh ek
hn hk io il sy SY eh ekhn hk io il sy SY eh ek
32 | VErrASTrO, MElTON, lAdISlAw, HYlANd, ANd BOOk
is a complex and evolving issue. Even within the same geographic location, prices can vary a great deal; furthermore, costs are not fixed and have come down as drilling techniques improve with experience. In short, to the extent that a rapid surge in production drove the need for crude by rail transport options, a slowdown in production or a shift in the relative cost of pipe versus rail transport options could alleviate pressure on the crude by rail transport system.
3. Exports and changing flows. If the United States decides to allow unrestricted crude oil exports, then the price of domestic crude should be roughly the same (minus transportation and adjusted for quality) as crude priced internationally. Crude by rail to the East Coast had been made attractive by large differentials between the price of international and domestic crudes (a differential that was still large even accounting for the relatively high cost of transit by rail). However, if the differential disappears, crude by rail could decrease over the long term, especially to East Coast markets. At the same time, allowing some or all exports could be expected to increase dependence on rail, at least in the short term, as crude pipelines are “not oriented to serve export ports.”20
4. Harmonization of U.S. and Canadian standards. The interest of safety is shared across borders, but the Canadian and U.S. regulatory pro cesses have moved at different paces. Canadian regulators were well ahead of their counter parts in pushing out crude by rail safety regulations. Transport Canada, the U.S. department of Transportation’s Canadian counterpart, issued interim regulations in April 2014 mandating more stringent tank car standards, among other things, with compliance by 2017.
The U.S. and Canadian rail systems are functionally one North American system, as trains and the goods they carry move relatively seamlessly across the border. Therefore, in the interest of a safe and efficient rail system, and to avoid undue burden on industry, it makes sense for the United States and Canada to harmonize both their regulatory standards and the timeline for implementation. regulators have stated that they are working together to ensure that tank car standards are the same across borders, but that is not currently the case on all issues. It is unclear, for example, whether tank car standards and the implementation schedule for these cars will be the same in both countries, although there have been media reports that Canadian and U.S. officials are coordinating on timeline and standards.21 regulators appear to understand the need to ensure that their standards, as well as their other efforts, are not duplicative. Information sharing is essential; for instance, Canadian regulators have put in place their own crude testing system and have issued a directive requiring a minimum number of hand brakes on railcars carry ing oil. Ultimately, it would be both confusing and inefficient for industry to have to meet two
20. Frittelli et al., U.S. Rail Transportation of Crude Oil.21. Patrick rucker and david ljunggren, “U.S., Canada Transport Chiefs to Meet on Oil Train Safety,”
reuters, december 11, 2014, http:// www . reuters . com / article / 2014 / 12 / 11 / us usa railway canada idUSkBN0JP2dN 20141211 .
594-60736_ch01_4P.indd 32 2/6/15 10:06 AM
dElIVErINg THE gOOdS | 33
separate standards when the rail lines and the oil passes so frequently between the two countries.
Stakeholders and regulators should necessarily treat safety as an ongoing challenge— not a problem to be definitively fixed but an issue that must constantly be monitored, especially during times of significant change in volumes transiting by different modes. As technology changes and production evolves, regulators, policymakers, and industry will need to remain vigilant about safety across all modes of transportation. New rail regulations are the first step, but infrastructure upgrades and constant attention to operational safety are essential and ongoing investments requiring cooperation across industries.
The Strategic Petroleum reserveThe North American production surge and its impact on midstream infrastructure raise an immediate question regarding the U.S. Strategic Petroleum reserve (SPr): whether the shifts in midstream infrastructure under way limit the ability to move SPr oil resources to market as needed or intended in the event of a disruption. But the immediate question of whether the SPr is able to function optimally in a time of disruption triggers another: is it worth the cost to upgrade the logistical system so vital to the SPR’s functioning? Undertaking changes in the structure of the SPr requires new consideration of the SPr’s purpose in a world in which U.S. consumption is declining and production is increasing.
The SPr is a longstanding investment designed to insulate the United States from the economic impact of a supply disruption, but through the de cades its purpose and strategic value and use have been hotly debated. However, given the changes under way in the North American production and midstream system, questions about the merits, costs, and benefits of the SPR have resurfaced. The last governmental strategic review was undertaken in early 2006, when U.S. crude demand growth was rising and domestic supply was shrinking— the opposite of what is happening today; therefore, a strategic review of the SPR’s purpose, size, and composition is warranted. The SPR will likely remain a fixture on the energy policy landscape, not least because of the United States’ international obligations to hold and coordinate releases of supply in times of emergency. But policymakers should still undertake an assessment of the costs, benefits, and strategic value of the SPR given changing U.S. production and consumption patterns.
BackGround on the SPr
The United States began discussing oil stockpiles as early as world war II. Then, in 1973, the Or ga ni za tion of Arab Petroleum Exporting Countries imposed an oil embargo on the United States in retaliation for supporting Israel in the 1973 Yom kippur war. The embargo caused a significant spike in oil prices and contributed to a recession in the United States, which was then heavily dependent on oil both for transportation and for electricity generation. Major oil consuming nations responded to the economic disruption of the 1973 embargo by creating the International Energy Agency (IEA), a new international or ga ni za tion under the rubric of the Or ga ni za tion for Economic Cooperation and development (OECd).
594-60736_ch01_4P.indd 33 2/6/15 10:06 AM
hn hk io il sy SY eh ekhn hk io il sy SY eh ekhn hk io il sy SY eh ekhn hk io il sy SY eh ekhn hk io il sy SY eh ekhn hk io il sy SY eh ek
hn hk io il sy SY eh ekhn hk io il sy SY eh ek
34 | VErrASTrO, MElTON, lAdISlAw, HYlANd, ANd BOOk
IEA is dedicated to promoting energy security by increasing market transparency, reducing demand in consuming countries, and providing an international legal framework for responding to supply disruptions through the coordinated release of strategic stocks. Consuming nations are bound by the treaty to hold emergency supplies equivalent to 90 days of net imports of petroleum.22 It was left to individual countries to determine the composition of the stocks (crude oil versus products) and how the stocks would be held (through the government or privately held stocks).23
In order to comply with the IEA treaty and to bolster U.S. energy security, Congress created the Strategic Petroleum reserve. The SPr’s primary mission is to provide an emergency response tool to support U.S. energy security by storing and supplying crude oil to mitigate the impact of a severe crude oil supply disruption. The SPr section of the Energy Policy and Conservation Act (EPCA) of 1975 (42 U.S. Code § 6234) is the domestic implementing legislation that delineates how the United States will fulfill its international obligations under the Agreement on an International Energy Program.24 The legislation authorized the U.S. department of Energy to manage the reserves up to a capacity of 750 million ( later revised to 1 billion) barrels of crude oil (the U.S. government holds limited product stocks25). EPCA allows a drawdown of these stocks either due to a supply disruption or to carry out obligations under the IEA’s international energy program. In order to authorize a release of SPR oil, the president must find that there is a “severe energy supply interruption” (in response to the Exxon Valdez oil spill, SPR was amended in 1990 to allow for drawdowns in the event of domestic interruption) or find that the drawdown is required by international obligations. The legislation therefore gives the president significant discretion about when to release oil from the SPr. what constitutes a severe supply interruption has been the subject of intense debate.26
Currently, the SPr holds about 691 million barrels of crude oil at four sites on the U.S. gulf Coast, with an effective capacity of 700 million barrels.27 At the time it was conceived, it was imagined that SPr oil would be replacing foreign imports to the gulf Coast.
22. In the initial treaty, it was 60 days and was later revised upwards. In some countries, the agreement has treaty status; in the United States, though, it was not ratified by the Senate and has the legal status of an international agreement.
23. For more on the background and history of the International Energy Agency (IEA), see IEA; “History,” http:// www . iea . org / aboutus / history / .
24. The full agreement is available online. See IEA, “Agreement on an International Energy Program, as Amended 25 September 2008,” https:// www . iea . org / media / ieawebsite / about / iep . pdf .
25. The United States does have a 2 million barrel privately held but government owned home heating oil reserve in the Northeast, and it has announced plans to create a 1 million barrel privately held but government owned gasoline reserve. However, the recent FY2015 spending bill prohibits the department of Energy from creating any crude product reserves without appropriated funds from Congress.
26. The law further states that a severe energy supply interruption “shall be deemed to exist if the President determines that— A) an emergency situation exists and there is a significant reduction in supply which is of significant scope and duration; B) a severe increase in the price of petroleum products has resulted from such an emergency situation; and C) such price increase is likely to cause a major adverse impact on the national economy” (42 U.S. Code § 6241), which doesn’t clarify the matter much.
27. John Shages, The Strategic Petroleum Reserve: Policy Challenges in Managing the Nation’s Strategic Oil Stock (washington, dC: Energy Policy research Foundation, July 2014), http:// eprinc . org / wp content / uploads / 2014 / 07 / EPrINC Shages SPr July 11 2014 . pdf .
594-60736_ch01_4P.indd 34 2/6/15 10:06 AM
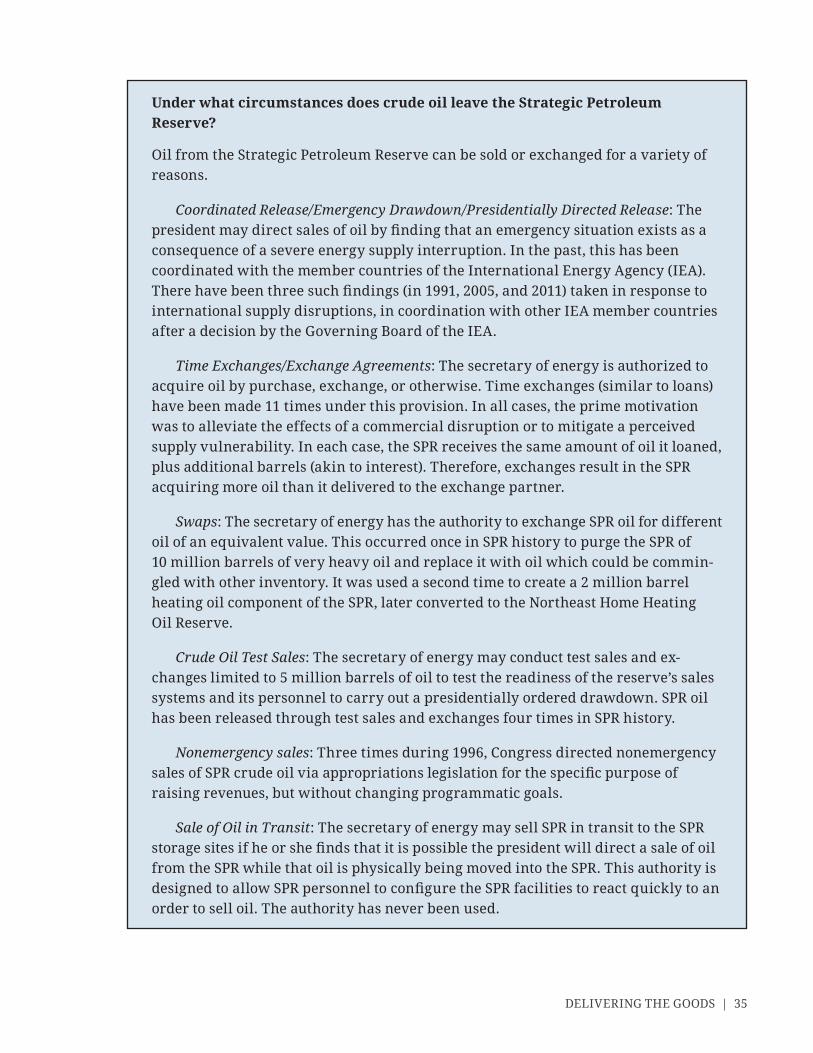
dElIVErINg THE gOOdS | 35
under what circumstances does crude oil leave the Strategic Petroleum reserve?
Oil from the Strategic Petroleum Reserve can be sold or exchanged for a variety of reasons.
Coordinated Release/Emergency Drawdown/Presidentially Directed Release: The president may direct sales of oil by finding that an emergency situation exists as a consequence of a severe energy supply interruption. In the past, this has been coordinated with the member countries of the International Energy Agency (IEA). There have been three such findings (in 1991, 2005, and 2011) taken in response to international supply disruptions, in coordination with other IEA member countries after a decision by the governing Board of the IEA.
Time Exchanges/Exchange Agreements: The secretary of energy is authorized to acquire oil by purchase, exchange, or other wise. Time exchanges (similar to loans) have been made 11 times under this provision. In all cases, the prime motivation was to alleviate the effects of a commercial disruption or to mitigate a perceived supply vulnerability. In each case, the SPr receives the same amount of oil it loaned, plus additional barrels (akin to interest). Therefore, exchanges result in the SPR acquiring more oil than it delivered to the exchange partner.
Swaps: The secretary of energy has the authority to exchange SPR oil for different oil of an equivalent value. This occurred once in SPr history to purge the SPr of 10 million barrels of very heavy oil and replace it with oil which could be commingled with other inventory. It was used a second time to create a 2 million barrel heating oil component of the SPr, later converted to the Northeast Home Heating Oil reserve.
Crude Oil Test Sales: The secretary of energy may conduct test sales and exchanges limited to 5 million barrels of oil to test the readiness of the reserve’s sales systems and its personnel to carry out a presidentially ordered drawdown. SPr oil has been released through test sales and exchanges four times in SPR history.
Nonemergency sales: Three times during 1996, Congress directed nonemergency sales of SPR crude oil via appropriations legislation for the specific purpose of raising revenues, but without changing programmatic goals.
Sale of Oil in Transit: The secretary of energy may sell SPr in transit to the SPr storage sites if he or she finds that it is possi ble the president will direct a sale of oil from the SPr while that oil is physically being moved into the SPr. This authority is designed to allow SPR personnel to configure the SPR facilities to react quickly to an order to sell oil. The authority has never been used.
594-60736_ch01_4P.indd 35 2/6/15 10:06 AM
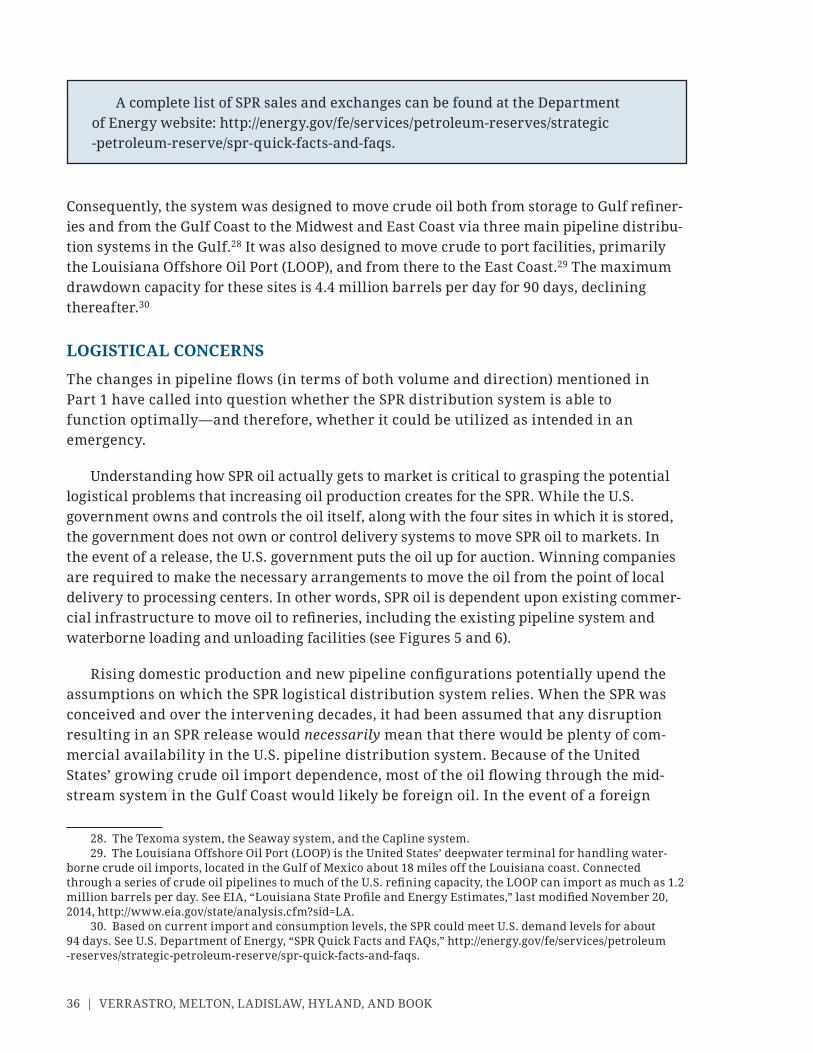
hn hk io il sy SY eh ekhn hk io il sy SY eh ekhn hk io il sy SY eh ekhn hk io il sy SY eh ekhn hk io il sy SY eh ekhn hk io il sy SY eh ek
hn hk io il sy SY eh ekhn hk io il sy SY eh ek
36 | VErrASTrO, MElTON, lAdISlAw, HYlANd, ANd BOOk
Consequently, the system was designed to move crude oil both from storage to Gulf refineries and from the gulf Coast to the Midwest and East Coast via three main pipeline distribution systems in the gulf.28 It was also designed to move crude to port facilities, primarily the louisiana Offshore Oil Port (lOOP), and from there to the East Coast.29 The maximum drawdown capacity for these sites is 4.4 million barrels per day for 90 days, declining thereafter.30
loGiStical concernS
The changes in pipeline flows (in terms of both volume and direction) mentioned in Part 1 have called into question whether the SPr distribution system is able to function optimally— and therefore, whether it could be utilized as intended in an emergency.
Understanding how SPr oil actually gets to market is critical to grasping the potential logistical problems that increasing oil production creates for the SPr. while the U.S. government owns and controls the oil itself, along with the four sites in which it is stored, the government does not own or control delivery systems to move SPr oil to markets. In the event of a release, the U.S. government puts the oil up for auction. winning companies are required to make the necessary arrangements to move the oil from the point of local delivery to pro cessing centers. In other words, SPR oil is dependent upon existing commercial infrastructure to move oil to refineries, including the existing pipeline system and waterborne loading and unloading facilities (see Figures 5 and 6).
Rising domestic production and new pipeline configurations potentially upend the assumptions on which the SPr logistical distribution system relies. when the SPr was conceived and over the intervening de cades, it had been assumed that any disruption resulting in an SPr release would necessarily mean that there would be plenty of commercial availability in the U.S. pipeline distribution system. Because of the United States’ growing crude oil import dependence, most of the oil flowing through the midstream system in the gulf Coast would likely be foreign oil. In the event of a foreign
28. The Texoma system, the Seaway system, and the Capline system.29. The louisiana Offshore Oil Port (lOOP) is the United States’ deepwater terminal for handling water
borne crude oil imports, located in the Gulf of Mexico about 18 miles off the Louisiana coast. Connected through a series of crude oil pipelines to much of the U.S. refining capacity, the LOOP can import as much as 1.2 million barrels per day. See EIA, “Louisiana State Profile and Energy Estimates,” last modified November 20, 2014, http:// www . eia . gov / state / analysis . cfm ? sid = LA .
30. Based on current import and consumption levels, the SPr could meet U.S. demand levels for about 94 days. See U.S. department of Energy, “SPr Quick Facts and FAQs,” http:// energy . gov / fe / services / petroleum reserves / strategic petroleum reserve / spr quick facts and faqs .
A complete list of SPR sales and exchanges can be found at the Department of Energy website: http:// energy . gov / fe / services / petroleum reserves / strategic petroleum reserve / spr quick facts and faqs.
594-60736_ch01_4P.indd 36 2/6/15 10:06 AM
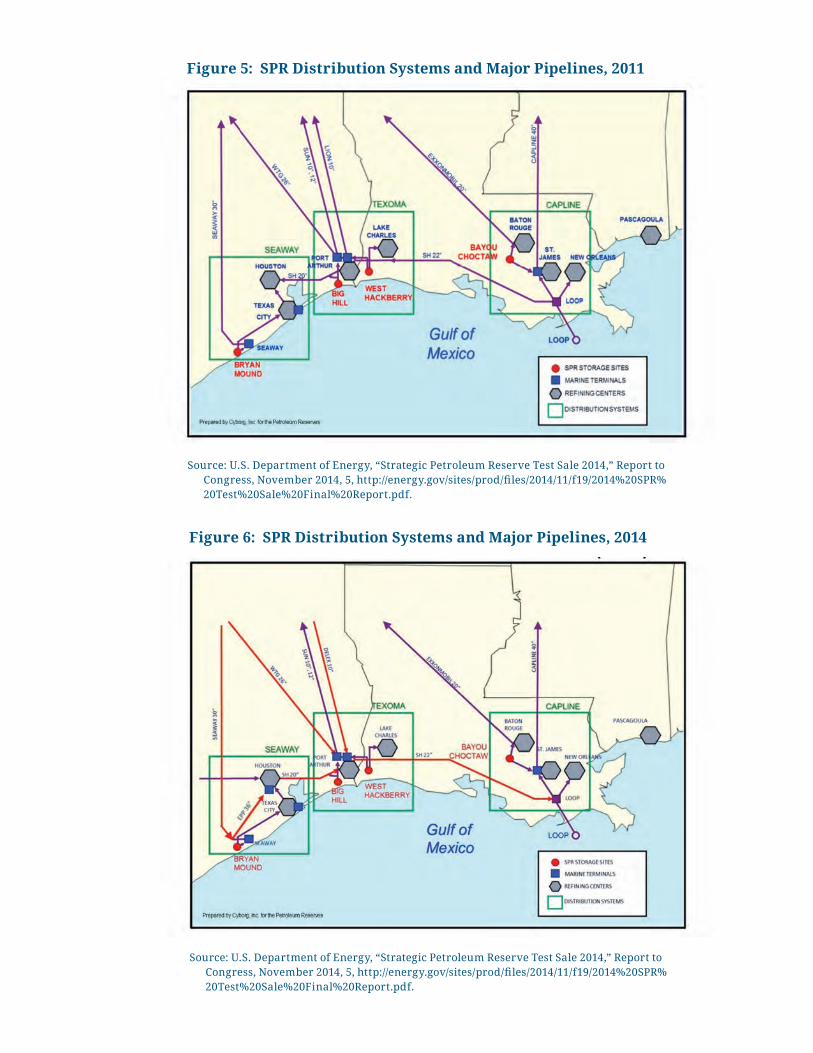
Source: U.S. department of Energy, “Strategic Petroleum reserve Test Sale 2014,” report to Congress, November 2014, 5, http:// energy . gov / sites / prod / files / 2014 / 11 / f19 / 2014%20SPR% 20Test%20Sale%20Final%20report . pdf .
Figure 5: SPr distribution Systems and major Pipelines, 2011
Figure 6: SPr distribution Systems and major Pipelines, 2014
Source: U.S. department of Energy, “Strategic Petroleum reserve Test Sale 2014,” report to Congress, November 2014, 5, http:// energy . gov / sites / prod / files / 2014 / 11 / f19 / 2014%20SPR% 20Test%20Sale%20Final%20report . pdf .
594-60736_ch01_4P.indd 37 2/6/15 10:06 AM
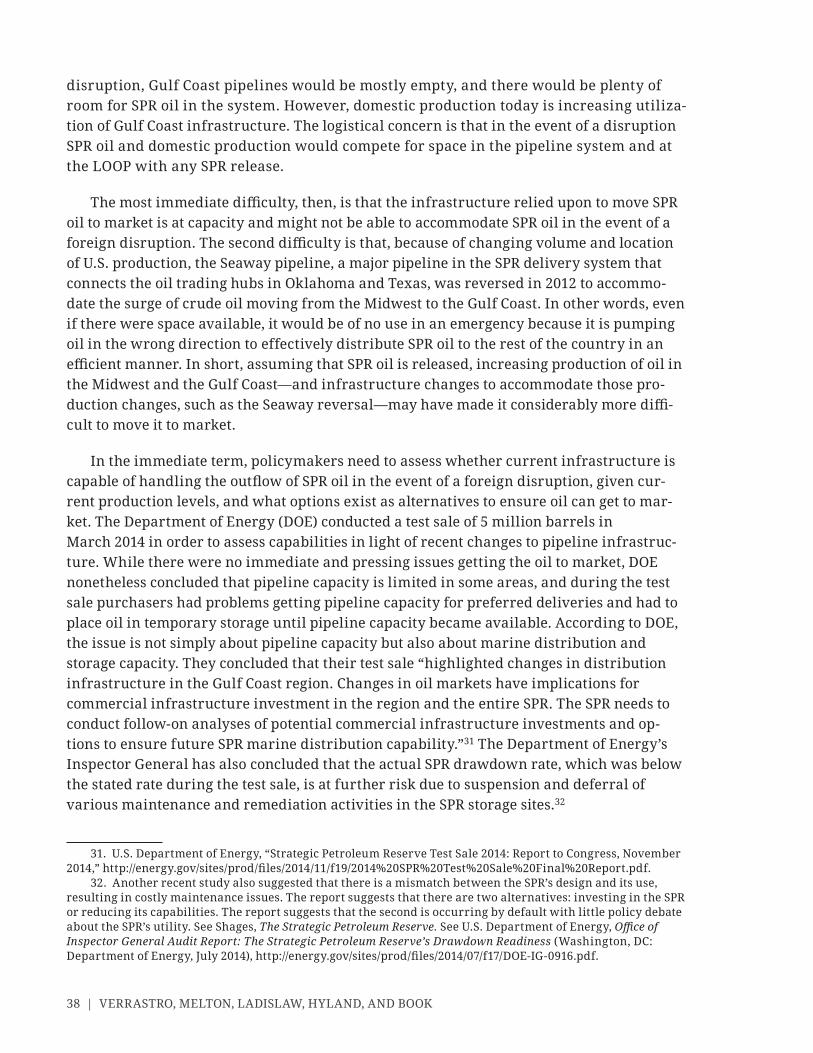
hn hk io il sy SY eh ekhn hk io il sy SY eh ekhn hk io il sy SY eh ekhn hk io il sy SY eh ekhn hk io il sy SY eh ekhn hk io il sy SY eh ek
hn hk io il sy SY eh ekhn hk io il sy SY eh ek
38 | VErrASTrO, MElTON, lAdISlAw, HYlANd, ANd BOOk
disruption, gulf Coast pipelines would be mostly empty, and there would be plenty of room for SPr oil in the system. However, domestic production today is increasing utilization of gulf Coast infrastructure. The logistical concern is that in the event of a disruption SPr oil and domestic production would compete for space in the pipeline system and at the lOOP with any SPr release.
The most immediate difficulty, then, is that the infrastructure relied upon to move SPR oil to market is at capacity and might not be able to accommodate SPr oil in the event of a foreign disruption. The second difficulty is that, because of changing volume and location of U.S. production, the Seaway pipeline, a major pipeline in the SPr delivery system that connects the oil trading hubs in Oklahoma and Texas, was reversed in 2012 to accommodate the surge of crude oil moving from the Midwest to the gulf Coast. In other words, even if there were space available, it would be of no use in an emergency because it is pumping oil in the wrong direction to effectively distribute SPr oil to the rest of the country in an efficient manner. In short, assuming that SPR oil is released, increasing production of oil in the Midwest and the gulf Coast— and infrastructure changes to accommodate those production changes, such as the Seaway reversal— may have made it considerably more difficult to move it to market.
In the immediate term, policymakers need to assess whether current infrastructure is capable of handling the outflow of SPR oil in the event of a foreign disruption, given current production levels, and what options exist as alternatives to ensure oil can get to market. The department of Energy (dOE) conducted a test sale of 5 million barrels in March 2014 in order to assess capabilities in light of recent changes to pipeline infrastructure. while there were no immediate and pressing issues getting the oil to market, dOE nonetheless concluded that pipeline capacity is limited in some areas, and during the test sale purchasers had problems getting pipeline capacity for preferred deliveries and had to place oil in temporary storage until pipeline capacity became available. According to dOE, the issue is not simply about pipeline capacity but also about marine distribution and storage capacity. They concluded that their test sale “highlighted changes in distribution infrastructure in the gulf Coast region. Changes in oil markets have implications for commercial infrastructure investment in the region and the entire SPr. The SPr needs to conduct followon analyses of potential commercial infrastructure investments and options to ensure future SPr marine distribution capability.”31 The department of Energy’s Inspector general has also concluded that the actual SPr drawdown rate, which was below the stated rate during the test sale, is at further risk due to suspension and deferral of various maintenance and remediation activities in the SPr storage sites.32
31. U.S. department of Energy, “Strategic Petroleum reserve Test Sale 2014: report to Congress, November 2014,” http:// energy . gov / sites / prod / files / 2014 / 11 / f19 / 2014%20SPR%20Test%20Sale%20Final%20Report . pdf .
32. Another recent study also suggested that there is a mismatch between the SPr’s design and its use, resulting in costly maintenance issues. The report suggests that there are two alternatives: investing in the SPr or reducing its capabilities. The report suggests that the second is occurring by default with little policy debate about the SPr’s utility. See Shages, The Strategic Petroleum Reserve. See U.S. department of Energy, Office of Inspector General Audit Report: The Strategic Petroleum Reserve’s Drawdown Readiness (washington, dC: Department of Energy, July 2014), http:// energy . gov / sites / prod / files / 2014 / 07 / f17 / DOE - IG - 0916 . pdf .
594-60736_ch01_4P.indd 38 2/6/15 10:06 AM
dElIVErINg THE gOOdS | 39
StrateGic iSSueS
The potential for infrastructure constraints and the concerns about the lack of a bud get for sustained and necessary SPr maintenance raised by the dOE test sale report and the Inspector general’s report inevitably lead to broader questions about the SPr’s strategic utility. In other words, assessing whether to invest the money necessary for the continued operational effectiveness of the SPr necessarily presumes that the United States still wants, needs, and should pay for an SPr. whether Congress and/or the Obama administration acts or not, a decision is likely to be made by default.
These issues raise the need for a broad policy conversation about both the overall need for an SPR and its appropriate composition (i.e., crude oil or products or a mix of the two), size (i.e., the volume of oil stored), and quality (i.e., the type of crude oil stored).
While the original objective of the SPR was to address potential significant and sustained disruptions of foreign oil supplies, the reserve has never been used to respond to that type of scenario.33 Instead, the major and minor drawdowns that have taken place have been shorter and smaller than the type for which it was originally intended. Two of the largest drawdowns experienced, moreover, were triggered by domestic supply disruptions resulting from hurricanes that disrupted facilities in the U.S. Gulf of Mexico— not by international supply disruptions. whether the SPr was serving its purpose, then, has been far from clear.
Even before the recent supply surge in North America, se nior U.S. policymakers were questioning the practices governing the strategic use of the SPr.34 The new energy posture of the United States is likely to strengthen both ends of the debate about the future of the SPr, with some voices likely to argue for downsizing and others advocating for its upkeep and continued utility.
There are three reasons that an SPr is likely to remain an important asset for U.S. policymakers. First, the SPR is a U.S. policy within the context of U.S. IEA obligations to hold strategic stocks. The utility of the SPr will likely be evaluated by policymakers not only in its domestic context but also in the context of energy security among IEA members, international IEA obligations, and energy security globally. Second, despite rising North American production, the United States still imports considerable volumes of crude oil from outside of North America (54 percent of U.S. crude oil imports in July 2014 came from outside North America) and the possibility of North American supply disruption also exists. Third, the rapid and unanticipated reversal in U.S. crude oil supply and demand underscores that U.S. policymakers are not omniscient when it comes to predicting shifting energy landscapes. It is not possi ble to rule out another rapid and
33. It is possi ble that the SPr is an effective deterrent to a po liti cally motivated oil production slowdown or embargo, but it is nearly impossible to demonstrate its deterrent value.
34. U.S. Senate Committee on Energy and Natural resources, “Bingaman on lack of a Strategic Petroleum reserve Policy,” Demo cratic News, March 3, 2003, http:// www . energy . senate . gov / public / index . cfm / democratic - news ? ID = 78056395 - 6794 - 4bb6 - 928c - 0c3062cad6a7 .
594-60736_ch01_4P.indd 39 2/6/15 10:06 AM
hn hk io il sy SY eh ekhn hk io il sy SY eh ekhn hk io il sy SY eh ekhn hk io il sy SY eh ekhn hk io il sy SY eh ekhn hk io il sy SY eh ek
hn hk io il sy SY eh ekhn hk io il sy SY eh ek
40 | VErrASTrO, MElTON, lAdISlAw, HYlANd, ANd BOOk
unanticipated reversal in the U.S. supply demand balance. Of course, arguing that the SPR is valuable is not the same as arguing that the benefits outweigh the costs (this is an especially tricky calculation, because the costs are quantifiable while the benefits tend to be qualitative).
In October 2014, the Obama administration announced its intention to launch a strategic review of the SPr in light of domestic and international market changes, the current market related infrastructure challenges highlighted earlier, and a recognized need to make longer term decisions about issues raised by the Inspector general concerning the maintenance of the existing reserve facilities and issues raised by the Government Accountability Office. Such a review should be undertaken in a way that assesses both the value of the SPR and its net benefit. Some of the core issues to be deci ded in such a review include the overall size, composition (crude quality and product), tactical versus strategic use, and own ership and operational structure. While the executive branch can undertake a review of the SPr and may reduce its size, it is up to Congress to decide the ultimate fate of the SPr or undertake any major changes to its composition or purpose.
A strategic review that takes into account the array of possi ble energy supply demand balances for the United States, changes to the global strategic stock system and oil markets, and evolving expectations and lessons about supply disruption expectations is essential to making the right decision about the future of the SPr.
Crude Oil ExportsThe increased volume of U.S. tight oil production has had an impact on the economics of oil production and use throughout the value chain in North America. rapid increases in production, infrastructure constraints, and changing market conditions have created complex commercial dynamics for market participants seeking the highest return on investment. The practical result has been a surge in U.S. exports of both crude and petroleum products and a decline in imports. The United States is currently exporting rec ord volumes of crude oil and petroleum products, although these are small relative to the potential volume the United States could export and relative to U.S. imports. Crude oil exports— destined mostly for Canada— reached their highest level in decades—400,000 barrels per day—in July 2014. Petroleum product exports are also reaching new heights; in July 2014, U.S. refiners exported nearly 2.9 million barrels per day.35
In spite of current U.S. exports of both crude oil and petroleum products, there are significant legal and regulatory barriers to unfettered exports of crude oil (no such restrictions exist on petroleum products). Crafted in the era of decreasing production and increasing demand, the ban on exports was aimed at ensuring that U.S. consumers would be able to access domestic supply, reducing import dependence. The question before policymakers is whether the current restrictions on crude oil exports should be modified, and if so, how
35. U.S. Energy Information Administration (EIA), “Exports,” last modified November 26, 2014, http:// www . eia . gov / dnav / pet / pet _ move _ exp _ dc _ NUS - Z00 _ mbblpd _ m . htm .
594-60736_ch01_4P.indd 40 2/6/15 10:06 AM
dElIVErINg THE gOOdS | 41
to go about it. There is a vigorous debate under way about the merits of easing crude oil export restrictions: many producers argue that easing restrictions would allow for free market pricing— a benefit to both consumers and producers; but some refiners argue that using oil domestically is the best economic and strategic choice for consumers. Both sides of this debate claim that energy security will be enhanced and consumers will benefit if policymakers take their side.
Current U.S. policy governing crude oil exports is complicated. The EPCA passed in 1975 grants the president authority to restrict exports of U.S. crude oil. While the anchor of U.S. crude export policy is EPCA, however, there are several regulations under a disparate set of statutory authorities that also circumscribe exports.36
Under current law and policy, entities that wish to export crude oil must obtain a license from the department of Commerce’s Bureau of Industry and Security (BIS). Over the years, the president and Congress have carved out limited exceptions to the ban. Consequently, BIS approves applications for licenses to export crude oil only under the following circumstances:
• crude from Alaska’s North Slope that travels through the Trans- Alaska Pipeline System (TAPS) (authorized by Congress);
• heavy crude oil (API gravity of 20 or less) from certain fields in California, up to 25,000 barrels per day (enacted in the early 1990s after a long intergovernmental review pro cess approved by the president);
• crude to Canada for consumption or use therein;
• crude from Alaska’s Cook Inlet;
• crude that is of foreign origin that has not been mixed with U.S. oil (i.e., re- exports that the Department of Commerce can determine are not of U.S. origin);
• some instances of swaps with Mexico and/or Canada;
• crude exported in connection with refining or exchange of oil in the SPR if it is determined that such exports will directly result in the importation into the United States of refined products that are needed and that would other wise not be available for importation without the export of SPR crude (or if the crude oil stored by the SPR is owned by a foreign government).37
With the exception of crude oil in those categories listed above, crude oil exports are prohibited. The ban is neither absolute nor fixed, however. While Congress may change the
36. Certain other statutes also govern the export of crude, restricting or allowing crude exports based on production location. These various statutes include the Mineral Leasing Act, the Export Administration Act, the Exports of Alaskan North Slope Oil Title (technically part of the Mineral Leasing Act), the Outer Continental Shelf lands (OCS) Act, and the Naval Petroleum reserves Production Act.
37. U.S. department of Commerce, Bureau of Industry and Security, “Short Supply Controls,” June 2014, https:// www . bis . doc . gov / index . php / forms - documents / doc _ view / 425 - part - 754 - short - supply - controls .
594-60736_ch01_4P.indd 41 2/6/15 10:06 AM
hn hk io il sy SY eh ekhn hk io il sy SY eh ekhn hk io il sy SY eh ekhn hk io il sy SY eh ekhn hk io il sy SY eh ekhn hk io il sy SY eh ek
hn hk io il sy SY eh ekhn hk io il sy SY eh ek
42 | VErrASTrO, MElTON, lAdISlAw, HYlANd, ANd BOOk
statutes at any time, EPCA itself gives the president the authority to grant exemptions based on the purpose of the export, the class of seller or purchaser, the country of destination, or other “reasonable classifications” consistent with the national interest.38
Until recently, these rules and the accumulation of exemptions have not had a significant impact on domestic production or prices because U.S. consumption far outstripped production, requiring substantial foreign imports. As domestic production rises, however, the impact of the export ban on domestic crude oil market and refinery needs has triggered a debate about the export ban’s merits.
Those seeking to overturn the ban make several arguments. First, they argue that the ban results in an artificially depressed domestic price, which in turn sends a weak price signal to oil producers that could lead them to curtail production and future investment. In a lower oil price environment, there is greater urgency for producers on this claim. The second argument touted in favor of exports is that the U.S. refining sector is receiving discounted inputs, perpetuating operations at some refineries under uncompetitive conditions and encouraging incremental refinery investment in light oil pro cessing. They further argue that without being exposed to the discipline of the market, some refiners may be vulnerable to later changes in the market. In addition, proponents argue that the United States is acting against the arguments about free trade in energy it has continuously and vociferously made over the past several de cades. Finally, proponents of lifting the ban argue that increasing the supply of crude oil on the international market will, all else being equal, lower gasoline prices for consumers. There have been several studies that have confirmed the latter point, although the size of the impact on affected parties is debated, highly dependent on the volume of total exports, contingent on multiple factors related to the global oil market beyond policymaker control, and, overall, small in the context of global oil markets.39 For example, the Congressional Bud get Office reported, “Perhaps counterintuitively, U.S. consumers of gasoline, diesel fuel, and other oil products would probably benefit, along with domestic oil producers, if the ban was repealed; domestic refiners would be adversely affected, as would foreign oil producers. Consumers would
38. 42 CFr § 6212.39. Congressional Bud get Office (CBO), The Economic and Bud getary Effects of Producing Oil and Natural Gas
from Shale (Washington DC: CBO, December 2014), https:// www . cbo . gov / sites / default / files / cbofiles / attachments / 49815 - Effects _ of _ Shale _ Production . pdf; Robert Baron, et al., Economic Benefits of Lifting the Crude Oil Export Ban (submitted by NErA Economic Consulting to the Brookings Institution, September 2014), www . nera . com / 67 _ 8673 . htm; ICF International, The Impacts of U.S. Crude Oil Exports on Domestic Crude Production, GDP, Employ-ment, Trade, and Consumer Costs (submitted to the American Petroleum Institute, March 2014), http:// tinyurl . com / nnr8hxg; Thomas Duesterberg, et al., Lifting the Crude Oil Export Ban: The Impact on U.S. Manufacturing (Washington, DC: Aspen Institute, October 2014), https:// www . politicopro . com / f / ? f = 30822 & inb; IHS, U.S. Crude Oil Export Decision: Assessing the Impact of the Export Ban and Free Trade on the U.S. Economy (washington, dC: IHS, May 2014); Government Accountability Office (GAO), “Changing Crude Oil Markets: Allowing Exports Could Reduce Consumer Fuel Prices, and the Size of the Strategic Reserves Should Be Reexamined,” GAO-14-807, http:// www . gao . gov / products / GAO - 14 - 807; Stephen Brown et al., Crude Behavior: How Lifting the Export Ban Reduces Gasoline Prices in the United States (washington, dC: resources for the Future, February 2014), http:// www . rff . org / rFF / documents / rFF IB 14 03 rEV . pdf. Additional note: the most anticipated study is the U.S. Energy Information Administration study on the impact of crude oil exports on domestic prices, which is due out in 2015.
594-60736_ch01_4P.indd 42 2/6/15 10:06 AM
dElIVErINg THE gOOdS | 43
benefit from small reductions—5 to 10 cents per gallon . . . [whereas refiner] profits would fall.”40
Opponents of the ban dispute many of these claims. They argue that there is no evidence that producers will curtail production in the face of relatively lower prices and contend that refiners are capable of handling the influx of ultralight, sweet crude oil. Some refiners have also disputed the economic advantages of exporting crude oil, arguing that the domestic price advantage created by a ban on crude oil exports creates a higher value added export (in effect, arguing that it is better to export manufactured products than raw commodities).41
Finally, both proponents and opponents of lifting the crude oil ban argue that their position will enhance energy security. Those who support lifting the ban argue that injecting U.S. crude oil exports into international markets would be a stabilizing factor on global markets. Opponents reject that assertion, if not on princi ple then in practice, where the volume of U.S. crude exports would be only one of multiple disparate factors affecting global oil prices. In addition, opponents argue that oil should be kept at home, as maintaining a linked but separate oil market in the United States buffers consumers against the volatility of global oil prices.
In purely theoretical terms, the crude export ban is an economic inefficiency and eco nom ically irrational, but the question of whether to lift the crude export ban is a po liti-cal one, not simply an economic one. While it may be more efficient to lift the ban for the nation as a whole, there are significant distributional consequences and income transfers (both by economic sector and regionally) as a result of either action or inaction. For policymakers, making such a decision might be easier if it was possi ble to assess and prepare for the consequences of such distributional impacts. Unfortunately, such impacts are difficult to evaluate because of the uncertainty about both the future domestic production profile and the future behavior of other market participants. In short, the uncertainty around long- term U.S. production and global market trends means that it is difficult to evaluate the long- term economic costs and benefits of lifting the export ban and the differential impacts by sector and region, enhancing the po liti cal appeal of the status quo.
Despite the uncertain economics and potentially difficult politics of lifting the export ban, policymakers have several potential options. All deviations from the status quo require active policy engagement, and some are risky for market participants and policymakers.
1. BIS could issue more rulings, reducing uncertainty and providing flexibility to address individual cases. However, such rulings are confidential, are administratively burdensome, and, if numerous, could create inconsistent applications of the law.
40. CBO, The Economic and Bud getary Effects of Producing Oil and Natural Gas from Shale, 8–10.41. daniel weiss and Miranda Peterson, Keep American Crude Oil at Home (washington, dC: Center for
American Progress, January 2014), https:// www . americanprogress . org / issues / green / report / 2014 / 01 / 28 / 82987 / keep american crude oil at home / .
594-60736_ch01_4P.indd 43 2/6/15 10:06 AM
hn hk io il sy SY eh ekhn hk io il sy SY eh ekhn hk io il sy SY eh ekhn hk io il sy SY eh ekhn hk io il sy SY eh ekhn hk io il sy SY eh ek
hn hk io il sy SY eh ekhn hk io il sy SY eh ek
44 | VErrASTrO, MElTON, lAdISlAw, HYlANd, ANd BOOk
the issues around condensates
Generally defined, condensates are light liquid hydrocarbons— lighter than light oil, but heavier than gas. There are two possi ble angles to approach a more specific definition of condensates: derivation and characteristics. In the former case, lease condensates are defined as liquids recovered from natural gas wells; in the latter case, lease condensates are defined according to their API gravities. However, both definitions leave something to be desired. Derivation ignores the condensates suspended in gas that can eventually be separated out in stabilizers, and for characteristics, consensus is yet to be reached on the specific gravity to distinguish condensates. Condensates can be as light as 80 degrees API, and some would argue as heavy as 45 degrees API (with some definitions even outside this range).
Condensates can further be divided into two categories: lease condensate and plant condensate. lease condensate is collected either when gas and liquids are typically separated at the wellhead or after the remaining “wet gas” has gone through a stabilizer unit, removing some heavier condensate hydrocarbons. Plant condensate, or natural gasoline, is produced after the “wet gas” is transported to a natural gas pro cessing plant and further divided into its components. lease condensate and plant condensate are very similar in their chemical qualities. Those qualities are further shared by light naphtha, which can be the result either of an oil refinery or a condensate splitter (a form of distillation tower).
despite the similar chemical qualities shared by all three, however, the Commerce department’s Bureau of Industry and Security (BIS)— the agency responsible for crude oil export licenses— includes lease condensate in its definition of crude oil, while plant condensate and light naphtha are considered a natural gas liquid and refined product, respectively. Lease condensate is thus restricted from export, while plant condensate and light naphtha are not.
To complicate things even further, the U.S. Energy Information Administration does not separate lease condensates from its crude oil statistics (although they have started a pro cess to collect condensate data), stating that lease condensate “normally enters the crude oil stream after production.”1 Thus, condensate production estimates range from 1–1.6 million barrels per day. The lack of an accurate accounting for condensate production has delayed awareness of the key issue of growing condensate production, particularly from the Ea gle Ford in Texas.
As a result, companies have been investing in condensate splitters and stabilizers in the field to separate the components in order to qualify more condensates for export. In mid-2014, BIS approved export of condensate that had been pro cessed through a distillation tower, sparking a debate over (1) precisely what counts as processed condensate, (2) whether this was a change in policy or past approach, and (3)
594-60736_ch01_4P.indd 44 2/6/15 10:06 AM
dElIVErINg THE gOOdS | 45
2. BIS could issue interpretive guidance, explaining basic principles applicable in general situations, but not change the regulations themselves. BIS released a Frequently Asked Questions guidance document in December 2014 to explain what characterizes pro cessed condensate.
3. BIS could amend the definition of crude oil to exclude condensates. This is only likely to happen at the direction of po liti cal leadership at the department of Commerce and the white House.
4. Industry could self classify, avoiding the need for policy or regulatory action, but exposing companies to burden and regulatory risk. At least one com pany has already taken this option using the pro cessed condensate definition.42
5. Congress could make statutory changes to allow some or all crude oil exports. Although some members have voiced support for repealing the ban and introduced legislation, wider congressional support for such action is yet unclear and potentially difficult to achieve.
6. Per EPCA, the president could issue a finding that some or all crude exports are in the U.S. national interest and not in short supply. For example, the finding could expand the countries to which the United States can export crude oil to those with which the United States has a free trade agreement, it could limit exports to certain crude qualities, or it could cap exports at a certain volume, as the CBO report suggests.43 Any finding could be revoked.
7. Status quo.
It is worth noting that even though the decision to act or not act will be made primarily with domestic politics in mind, any decision also has implications for international oil markets and, potentially, for diplomatic relationships with countries that want unlimited access to U.S. crude oil exports.44
42. Jennifer A. Dlouhy, “BHP Billiton to Export Condensate Overseas,” FuelFix, November 4, 2014, http:// fuelfix . com / blog / 2014 / 11 / 04 / bhp - billiton - to - export - condensate - overseas / .
43. CBO, The Economic and Bud getary Effects of Producing Oil and Natural Gas from Shale.44. There have been questions about the legality of the export ban under the WTO, although a legal
challenge is unlikely. According to media reports, the Office of the U.S. Trade Representative and the National Security Council have discussed free trade challenges to the export ban, and the United States has received
how much pro cessed condensate might be exported as a result and what the broader impacts would be on the domestic market and future investment decisions. BIS has not issued additional guidance on this issue, and recent reports indicate that other companies have chosen to self classify their own pro cessed condensate for export (i.e. not await BIS approval).
1. See EIA’s online glossary: http:// www . eia . gov / tools / glossary / index . cfm ? id = Lease .
594-60736_ch01_4P.indd 45 2/6/15 10:06 AM
hn hk io il sy SY eh ekhn hk io il sy SY eh ekhn hk io il sy SY eh ekhn hk io il sy SY eh ekhn hk io il sy SY eh ekhn hk io il sy SY eh ek
hn hk io il sy SY eh ekhn hk io il sy SY eh ek
46 | VErrASTrO, MElTON, lAdISlAw, HYlANd, ANd BOOk
regardless of which option policymakers chose to pursue, the domestic supply landscape is quickly shifting, and the downward trajectory of oil prices in the second half of 2014 complicates the picture. Policymakers should assess any change or lack thereof within the new context of surging domestic production. Without certainty about the future direction of either U.S. or global demand and supply, policymakers must instead rely on the framework through which they view energy policy and energy security. The last major strategic vision, articulated in the 1970s, reflects a view of the world and the markets that has not caught up to the current reality. A new strategic vision is needed, whether to pursue crude exports or to justify policy inaction in the face of considerably altered domestic supply circumstances.
The Jones Actrising domestic production and production in new locations of supply has increased the importance of moving oil in and around U.S. domestic waterways. One complicating factor in these waterborne domestic trade flows is section 27 of the Merchant Marine Act of 1920, more commonly referred to as the Jones Act.45 The Jones Act stipulates that cargo being shipped between U.S. ports can only be carried by vessels that are U.S. built, U.S. flagged and owned, and U.S. crewed. As such, the cost of shipping between U.S. ports is more expensive than it would other wise be due to higher building, maintenance, and labor costs in the United States. Media reports suggest that shipping costs have also been driven up by the relative scarcity of available Jones Act– compliant vessels; on some occasions, the lack of such vessels has made even securing a ship on the spot market difficult or impossible, as most are on long term charter.46 while promoting a robust merchant marine may be in the U.S. national security interest, doing so comes at a cost. As production increases and the United States increases its reliance on waterborne transportation of crude oil, the Jones Act is another example where policymakers may want to reexamine the strategic value of the existing policy.
The Jones Act applies to all cargo shipped by water between two U.S. ports (or between two U.S. ports with one international stop in between), meaning that any oil transiting inland or coastal waterways must be carried on the Jones Act– compliant fleet.47 This requirement increases the cost of domestically shipping oil beyond what it would be without the Jones Act and alters the relative economics of other transportation modes. For example, a refiner (or producer) shipping its product to demand centers on the East Coast has
pressure from other countries to end the ban. See Timothy gardner and Valerie Volcovici, “U.S. Considering Options if Oil Export Ban Challenged,” Reuters, September 17, 2014, http:// www . reuters . com / article / 2014 / 09 / 17 / us - oil - exports - trade - exclusive - idUSKBN0HC10O20140917 .
45. The Jones Act technically refers to two separate sections of the Merchant Marine Act of 1920. The first governs requirements for shipping between U.S. ports, and the second refers to the rights of seamen to make claims on their employers. we use the term “Jones Act” to refer to the former.
46. “regulation and Environment: The Ever Enduring Jones Act Isn’t going Away,” The Barrel (blog), Platts, September 9, 2013, http:// blogs . platts . com / 2013 / 09 / 09 / jones act / .
47. Cabotage provisions are also in place in the aviation, rail, and trucking sectors in the United States; however, no U.S.- build requirement exists for these other modes of transportation.
594-60736_ch01_4P.indd 46 2/6/15 10:06 AM
dElIVErINg THE gOOdS | 47
traditionally done so by pipeline because of the prohibitive cost of shipping via water. The Jones Act is a primary reason why, until recently, it was more eco nom ical for the East Coast to import refined products from Eu rope rather than from the Gulf Coast.
The Jones Act fleet consists of over 38,000 vessels operating on inland waterways and the great lakes, as well as a more limited number of ocean going vessels (of which 44 are tankers).48 Inland waterway vessels make up the vast majority of the Jones Act– eligible fleet, reflecting the overall demand for inland navigation (73 percent of total tonnage was internal and lakewise).49 Oil travels along inland routes along the Mississippi, Ohio, and Illinois rivers between the Midwest and the gulf Coast. By tonnage, about half of crude oil and a little over a third of petroleum products travel coastwise,50 but the crude oil and petroleum products trade are disproportionately important to the coastwise trade overall—in 2011, trade in crude oil and petroleum products accounted for 71 percent of all coastwise trade.51
The primary purpose of the law is to foster an effective and healthy U.S. merchant marine, thus ensuring the United States has an adequate supply of skilled labor for both crewing and building or repairing ships so that the country would not be caught in a national emergency without adequate sealift capacity. The law was passed during a time when the U.S. inadequacy in this area was obvious and the need for a robust merchant marine was particularly acute.52 Most recently revised in 2006, the law states that “it is
48. For updated fleet information, see U.S. Maritime Administration (MARAD), “Maritime Statistics– Fleet Statistics,” http:// www . marad . dot . gov / library _ landing _ page / data _ and _ statistics / Data _ and _ Statistics . htm .
49. Inland is defined as “vessel movements (origin and destination) which take place solely on inland and inter coastal waterways. An inland waterway is geo graph i cally located within the boundaries of the contiguous 48 states or within the boundaries of the State of Alaska. It also includes vessel movements on both inland waterways and the Great Lakes; those occurring between offshore areas and inland waterways (e.g., oil rig supplies and fish); and those taking place within Delaware Bay, Chesapeake Bay, Puget Sound, and the San Francisco Bay, which are considered internal bodies of water rather than arms of the ocean.” See U.S. Navigation Data Center, “U.S. Waterway Data: Waterborne Commerce of the United States Terminology,” last modified April 24, 2013, http:// www . navigationdatacenter . us / data / dictionary / ddwcust . htm .
50. “Coastwise” is defined as “domestic traffic receiving a carriage over the ocean, or the Gulf of Mexico, and traffic between Great Lakes ports and seacoast ports, when having a carriage over the ocean.” See U.S. Navigation data Center, “U.S. waterway data.”
51. See John Frittelli, Shipping U.S. Crude Oil by Water: Vessel Flag Requirements and Safety Issues (washington, DC: CRS, July 21, 2014), http:// fas . org / sgp / crs / misc / R43653 . pdf; MARAD, 2011 U.S. Water Transportation Statistical Snapshot (Washington, DC: MARAD, November 2013), http:// www . marad . dot . gov / documents / US _ Water _ Transportation _ Statistical _ snapshot . pdf; U . S. Army Corps of Engineers, “The U.S. Waterway System: Transportation Facts & Information,” November 2012, http:// www . navigationdatacenter . us / factcard / factcard12 . pdf .
52. At the outset of World War I, commercial trade relied to a great extent on foreign- owned ships. Both industry and government were caught flat- footed by the outbreak of war; the interruption of ocean shipping and the rapid rise in freight rates meant that U.S. exports to Eu rope virtually stopped. Moreover, the government’s naval fleet was small relative to its needs. The Merchant Marine Act of 1916 created the U.S. Shipping Board to promote a U.S. merchant marine, and the board created the Emergency Fleet Corporation (EFC) to deal with the shortage of ships. The EFC undertook a massive shipbuilding program; nonetheless, by the time the United States entered the war the following year, there was still a significant shortage of U.S. sealift capacity. The EFC undertook a massive shipbuilding program, spending $3 billion for ship construction. due to the relatively long rampup time in the shipbuilding industry, the armistice was signed before a single ship was delivered. The program continued, however, until 1921, providing the United States with a vast fleet of nearly 2,300 ships. The U.S. government found itself with the world’s largest merchant marine with no war to fight and a depressed domestic market.
594-60736_ch01_4P.indd 47 2/6/15 10:06 AM
hn hk io il sy SY eh ekhn hk io il sy SY eh ekhn hk io il sy SY eh ekhn hk io il sy SY eh ekhn hk io il sy SY eh ekhn hk io il sy SY eh ek
hn hk io il sy SY eh ekhn hk io il sy SY eh ek
48 | VErrASTrO, MElTON, lAdISlAw, HYlANd, ANd BOOk
necessary for the national defense . . . that the United States have a merchant marine” in order to maintain the flow of waterborne domestic and foreign commerce at all times, in order to serve as a naval and military auxiliary in time of war or national emergency.53
Today, the law’s proponents argue that the Jones Act contributes to U.S. national security by maintaining the capacity of U.S. shipyards and encouraging shipyard modernization, as well as providing the U.S. military “assured access to vessels and related transportation resources.”54 In the event of a national security emergency, the skills and infrastructure of the shipbuilding industry and merchant marine could be easily mobilized. Moreover, it also ensures the retention of a skilled workforce, both in shipbuilding and a trained cadre of mariners. Jones Act proponents argue that the nation’s merchant marine and shipbuilding capacity are critical infrastructure, and that the Jones Act ensures that the asset is available and maintained consistent with the U.S. national interest. Proponents worry that without the act, the quality and capabilities of the U.S. shipbuilding industry and mariner fleet would deteriorate, threatening the ability to ramp up in a time of national security emergency and, therefore, leaving the United States vulnerable. As recently as 2010, the U.S. Navy publicly opposed repealing the Jones Act.55 According to the U.S. Government Accountability Office (GAO), U.S. military strategy “relies on the use of commercial U.S.- flag ships and crews and the availability of a shipyard industrial base to support national defense needs.”56
In addition to maintaining preparedness and an effective civilian reserve capable of building, repairing, and manning Navy vessels, the Jones Act is an economic boon to the maritime industry. According to the U.S. Maritime Administration, U.S. shipyards directly employ over 100,000 people and contribute $9.8 billion to gdP. Including direct, indirect, and induced impacts, the employment figure is over 400,000, with a $36 billion impact on gdP in 2011.57
Many countries, including OECd nations, have laws that either directly or indirectly support their shipbuilding industries or vessel operations, including operating subsidies, construction subsidies, cargo preference requirements, and cabotage, among others.58 The international community generally accepts the right of a country to exclude foreign vessels from its domestic maritime trade. Nonetheless, it is indisputable that the Jones Act imposes strict requirements that are expensive to accommodate.59 The law has made it more expensive than it would other wise be to build and operate ships in the United
53. The U.S. Merchant Marine Act, 1920 U.S. Code 46 USC § 861.54. MArAd, 2011 U.S. Water Transportation Statistical Snapshot, 15.55. Seafarers International Union, “U.S. Navy Backs Jones Act,” October 2010, https:// www . seafarers . org
/ seafarerslog / 2010 / 10 _ Oct / NavyJonesAct . htm . 56. gAO, Characteristics of the Island’s Maritime Trade and Potential Effects of Modifying the Jones Act
(washington, dC: gAO, March 2013), 5, http:// www . gao . gov / assets / 660 / 653046 . pdf . 57. MArAd, The Economic Importance of the U.S. Shipbuilding and Repairing Industry (washington, dC:
MARAD, May 30, 2013), http:// www . marad . dot . gov / documents / MARAD _ Econ _ Study _ Final _ Report _ 2013 . pdf . 58. See Sumanta Panigrahi, “Asian Shipbuilding: A dynamic Market,” Citigroup, http:// www . citigroup . com
/ transactionservices / home / trade _ svcs / docs / asian _ shipbuilding . pdf . 59. Cabotage provisions apply in other industries in the United States as well, including rail, aviation, and
trucking. However, there are no U.S. build requirements for those other modes of transportation.
594-60736_ch01_4P.indd 48 2/6/15 10:06 AM
dElIVErINg THE gOOdS | 49
States— exactly how much more cannot be determined because there is no basis of comparison (though it is likely similar to the cost differential in foreign trade).60 For example, according to a 2011 U.S. Maritime Administration (MArAd) report, on average it costs 2.7 times more to operate a U.S.- flag vessel in foreign commerce than a foreign- flag equivalent.61 Shipbuilding costs are estimated to be three times higher than if ships were built internationally.62
Critics of the Jones Act therefore allege that the law is a hindrance to free trade that creates inefficiency in the transportation system and fails to recognize the changed global security environment.63 A report commissioned by MArAd in 2009 concluded that current U.S. maritime policy (including, but not exclusive to, the Jones Act) unduly focuses on the U.S.- flag fleet and “does not consider the role of international and domestic waterborne commerce in national wealth creation.”64 Moreover, some critics of the Jones Act question the military value of maintaining a fleet comprised overwhelmingly of river barges and doubt whether a crew equipped to handle barge operations is qualified to work on deep- sea vessels in war time. Finally, there is concern about competition within the industry; a recent CrS report states that “the Jones Act may also facilitate collusion among carriers because the lack of available U.S. built vessels inhibits entry by potential competitors.”65
As crude production patterns change, the Jones Act has proved to be an economic challenge for producers, especially those located in the Ea gle Ford in Texas. While waterborne trade has increased over the past few years (see Chapter 2), it is likely that it would have picked up faster without the Jones Act restrictions. due to the limited capacity of the Jones Act fleet, charter rates for these ships have risen dramatically, causing a crude oil supply glut on the gulf Coast. This comes at an economic cost to producers.
The economic and broader market impact of the Jones Act cannot be assessed in de pendently; it must be evaluated in the context of the other policies. Although, by itself, the Jones Act has the effect of making energy markets less efficient, its distortionary impact multiplies when combined with other U.S. policies discussed earlier. The Jones Act exacerbates the market distortions of the crude oil ban by making it virtually impossible (or
60. MArAd, Comparison of U.S. and Foreign- Flag Operating Costs (washington, dC: MArAd, November 2011), http:// www . marad . dot . gov / documents / Comparison _ of _ US _ and _ Foreign _ Flag _ Operating _ Costs . pdf .
61. Operating costs include crew cost, maintenance and repair costs, insurance costs, overhead costs, and costs associated with stores and lubes.
62. MArAd, Comparison of U.S. and Foreign- Flag Operating Costs. Cost and build time is also higher for U.S. built vessels. According to a survey among carriers, this is attributed to maintenance, repair, and U.S. shipyard costs. The fact that U.S. shipbuilders “do not enter into firm fixed price contracts or do not contract to firm completion dates . . . may create uncertainty in carrier build costs and schedules and may result in additional cost and lost time delays.” Ibid., 50.
63. Malia Blom Hill, “The Sinking Ship of Cabotage,” Beforeitsnews . com, April 7, 2013, http:// capitalresearch . org / 2013 / 04 / the sinking ship of cabotage how the jones act lets unions and a few companies hold the economy hostage / .
64. IHS global Insight, “An Evaluation of Maritime Policy in Meeting the Commercial and Security Needs of the United States, Prepared for the U.S. Maritime Administration,” January 7, 2009, http:// www . ihsglobalinsight . com / gcpath / MArAdPolicyStudy . pdf .
65. John Frittelli, Federal Freight Policy: In Brief (washington, dC: CrS, december 16, 2013), https:// www . fas . org / sgp / crs / misc / r42764 . pdf .
594-60736_ch01_4P.indd 49 2/6/15 10:06 AM
hn hk io il sy SY eh ekhn hk io il sy SY eh ekhn hk io il sy SY eh ekhn hk io il sy SY eh ekhn hk io il sy SY eh ekhn hk io il sy SY eh ek
hn hk io il sy SY eh ekhn hk io il sy SY eh ek
50 | VErrASTrO, MElTON, lAdISlAw, HYlANd, ANd BOOk
excessively costly) to move oil inter- regionally (and especially to and from the West Coast). This has been recognized by some U.S. refiners, who argue that any removal of the U.S. crude oil export ban should be accompanied by repealing the cabotage provisions of the Jones Act. If exports are addressed without the Jones Act, refiners have made the argument that Eu ro pean refiners will have access to U.S. crude originating in the Gulf Coast for cheaper prices than U.S. East Coast– based refiners.66 Some refiners have argued that repealing the crude ban without removing the Jones Act (or expanding the ability to get waivers) therefore imperils refiners, especially on the East Coast. Some consider the ongoing operation of these refineries to be a strategic asset.
Likewise, if there is a supply disruption and the existing pipeline and tanker distribution infrastructure of the SPR is insufficient to supply domestic markets, the Jones Act makes moving crude to pro cessing and demand centers more complicated, less timely, and more expensive. In short, the Jones Act makes these policies more problematic than they would other wise be, thereby exacerbating economic inefficiencies.
The real questions for policymakers are whether the Jones Act: 1) fulfills the policy purpose it is intended to meet in a way that justifies the cost; and 2) whether that policy purpose strikes an appropriate balance between U.S. security and economic priorities. Answering these questions requires an in de pen dent assessment of the national security value of a merchant marine in today’s security context and defense- related bud get needs as well as an assessment of the economic beneficiaries and losers of any policy change.
66. Brian Scheid, “Could a Jones Act Waiver Move U.S. Crude Export Policy?,” The Barrel (blog), Platts, October 3, 2014, http:// blogs . platts . com / 2014 / 10 / 03 / jones act waivers / .
merchant marine act of 1920 Section 27 (Jones act) waiver authority
Section 27 of the Merchant Marine Act (46 U.S.C. 551) requires that ships traveling between U.S. ports must be U.S built, U.S. flagged, and U.S. crewed. Under very narrow circumstances, this requirement can be waived in the interest of national defense. Waivers are time- limited and cargo- specific propositions. The Jones Act may not be waived simply because there are not enough ships to satisfy demand or because of commercial necessity. Waivers are not granted because a qualified vessel is unavailable or for commercial reasons.
If the Secretary of defense requests a waiver, the waiver is granted. For all other waiver requests, the Secretary of Homeland Security is authorized to grant a waiver if it meets two conditions: a) the waiver must be determined to be necessary in the interest of national defense; and b) the Maritime Administration must determine that there are no Jones Act– eligible vessels available. (If the Secretary of defense requests a waiver, there is no consideration of Jones Act– eligible vessel availability.) Congress (by concurrent resolution) or the president may also waive the Jones Act.
594-60736_ch01_4P.indd 50 2/6/15 10:06 AM
dElIVErINg THE gOOdS | 51
This waiver authority may only be used in times of national emergency or in the interest of national defense. The law (46 U.S.C. § 501) is exceptionally clear on this point: the Secretary of Homeland Security must waive the cabotage provisions of the Jones Act upon the request of the Secretary of Defense “to the extent the Secretary considers necessary in the interest of national defense.” The Secretary of Homeland Security may waive it whenever he “considers it necessary in the interest of national defense . . . to the extent, in the manner, and on the terms the individual [the Secretary of Homeland Security], in consultation with [what] the [MARAD] Administrator . . . prescribes.”
Before a waiver may be granted, CPB must consult with MArAd to assess whether Jones Act– compliant vessels are available to carry the cargo under consideration. MARAD then must canvass the U.S.- flag domestic shipping market to locate suitable vessels to make a determination. If a suitable vessel is located, no waiver can be granted. Only if MARAD finds that there is no U.S. vessel that can carry the cargo may a waiver be granted. Of course, what constitutes a suitable vessel, and in what period of time it is available, are important considerations.
There are limited exceptions to the waiver authority:
■ MArAd can, by itself, waive the U.S. build requirements for certain small passenger vessels, and, in rare circumstances, foreign built launch barges. MArAd can also issue waivers for foreign anchor handling vessels operating in the Beaufort and Chukchi Seas.
■ Certain statutory exceptions allow the Coast Guard to issue limited coastwise endorsements to specific vessels or for specific purposes.
■ A foreign flagged oil spill response vessel can conduct certain planned operations on an emergency and temporary basis for the purpose of recovering, transporting, and unloading oil discharged as a result of an oil spill in U.S. waters, as long as certain conditions are met.1
Congress tightened the waiver authority in 2008, and again in 2012 in response to the accusation that in 2011, a waiver was issued despite the availability of Jones Act– eligible vessels. The stricter standard requires MArAd to include information on the actions that could be taken to enable Jones Act– eligible vessels to carry cargo for which a waiver is sought, publish that information on the Internet, and notify Congress when a waiver is requested or issued.
requests for waivers are currently reviewed on a case by case basis and have been granted sparingly.
1. 46 USC § 55113. Those conditions are: (1) that there are not an adequate number of U.S. vessels for that task; and (2) the flag country of the vessel accords vessels of the United States the same privileges.
594-60736_ch01_4P.indd 51 2/6/15 10:06 AM
hn hk io il sy SY eh ekhn hk io il sy SY eh ekhn hk io il sy SY eh ekhn hk io il sy SY eh ekhn hk io il sy SY eh ekhn hk io il sy SY eh ek
hn hk io il sy SY eh ekhn hk io il sy SY eh ek
52 | VErrASTrO, MElTON, lAdISlAw, HYlANd, ANd BOOk
Climate ChangeChanges to midstream oil infrastructure in North America have elicited environmental concerns. These include local issues, such as the adequacy of regulations and enforcement concerning spill prevention and response, noise and land disturbance, and wildlife protection. Concerns have also been raised about the relationship between midstream infrastructure expansion, resource development, and climate change, specifically the role infrastructure plays in facilitating the production and delivery of additional fossil fuels.
given the long life of infrastructure investments, some observers are concerned that building midstream infrastructure is tantamount to locking in a decision to rely on fossil fuels well into the future. Some environmentalists have argued that further oil development in North America will make it more difficult to reduce the world’s consumption of fossil fuels. Building infrastructure makes hydrocarbon resources more cost competitive, which may make policymakers and the general public more complacent about the need to shift away from fossil fuels.
Climate scientists may disagree about the duration and proximity of the win dow of opportunity for action on emissions mitigation, but most believe substantial action must be taken in the near term to prevent the most harmful impacts of climate change. what is less clear is the role that incremental North American oil production plays in the broader climate problem. On one side, activists claim that every drop pulled out of the ground is meaningful in the broader context of carbon emissions, resulting in more fossil fuels burned and prolonging dependence on a fossil dominated future. Others claim that U.S. supply is small in the overall global scheme of emissions, and that light tight oil coming from shale plays in the United States has a lower emissions impact than heavier fuels that would other wise be consumed. Still others claim that emissions reductions should be gained through policies that seek to promote the development and deployment of scalable fuels and technology applications that can serve as replacements or supplements to a fossil- based system rather than artificially trying to constrain the build- out of the existing system. Finally, many energy producers argue that targeting oil related infrastructure is not an eco nom ically optimal path toward emissions reduction. while infrastructure does drive economic competitiveness for a given fuel or system, the infrastructure associated with crude oil delivery is not necessarily the infrastructure that needs to be “avoided most” in terms of developing cost effective emissions reduction options relative to other potential abatement options. For example, combustion of transportation fuels in vehicles is responsible for nearly 80 percent of total life cycle emissions from vehicle transportation.67
Two facts must be reconciled in the conversation about the North American oil boom and the environment. First, it is clear that North America has a lot of oil (and gas). This
67. National Energy Technology laboratory (NETl), Development of Baseline Data and Analy sis of Life Cycle Green house Gas Emissions of Petroleum- Based Fuels (washington, dC: U.S. department of Energy, November 2008), http:// www . netl . doe . gov / File%20library / research / Energy%20Analysis / Publications / dOE NETl 2009 1346 lCAPetr BasedFuels Nov08 . pdf
594-60736_ch01_4P.indd 52 2/6/15 10:06 AM
dElIVErINg THE gOOdS | 53
abundance is a new factor in the preexisting debate about the long- term fuel structure of the U.S. economy. Second, the United States is increasingly on a path toward constraining green house gas emissions. One notable recent sign of this commitment was President Obama’s pledge to reduce U.S. CO2 emissions 2628 percent by 2025. while some doubt the ability of the administration—or, more important, future administrations—to meet this goal, it is important to remember that the accumulation of policy, regulatory, and commercial drivers to reduce emissions are already having an impact on energy investments even absent this overarching target.
These two realities— hydrocarbon abundance and policy constraints on emissions— are not necessarily irreconcilable, at least over the next few de cades. In the IEA’s World Energy Outlook 450 world scenario (in which warming is limited to 2 degrees), unconventional oil production in non OPEC member countries grows to 9.2 million barrels per day by 2035.68 In other words, it is possi ble to envision a scenario in which North American oil production grows and the world achieves the goal, though North American production growth would likely come at the expense of oil production growth from other producers.
But while the North American oil supply boom and a global lower carbon future are not necessarily at odds, they are also not necessarily complementary; in the absence of po liti-cal consensus about what the U.S. carbon future looks like, these facts reside in an uneasy coexistence.69 with no clear global policy or commercial path toward decarbonization, the bottomup, ad hoc nature of emissions reduction strategies is likely to increase rather than decrease tension over investments and infrastructure by diffusing the strug gle over low carbon versus more carbon intensive pathways down to the pro ject level.
The most pronounced North American example of this tension has been the fight over the keystone Xl pipeline (a pipeline designed to bring Canadian oil sands and Bakken light crude to refineries in the Gulf Coast). The pro ject has become a po liti cal symbol of the decision to perpetuate a fossil based energy system or force a transition to lower carbon alternatives. The pipeline in and of itself is not likely to perpetuate the existing system through its existence nor create new transportation fuel options by its absence (the analy-sis done as part of the State department review pro cesses shows that the impacts in this regard are not significant in either direction; i.e., that alternative oil transport infrastructure is likely to be built and that more government support and market transition is needed
68. IEA, World Energy Outlook 2013 (Paris: IEA, 2013), 458.69. In the IEA’s 2013 450 parts per million scenario, unconventional oil production in non OPEC countries
grows less between 2012 and 2035 than in the New Policies scenario, but it still grows from 4.4 to 9.2 million barrels per day. Conventional non OPEC crude production declines, however, from 38.4 million barrels per day in 2012 to 25.4 million barrels per day in 2035. See IEA, World Energy Outlook 2013, 458. Another modeling exercise also demonstrates that oil production can grow even as emissions are constrained. Trevor Houser and Shashank Mohan modeled a carbon tax for the United States and found that a modest tax— $15 a ton growing at 5 percent a year— reduced CO2 emissions 23 percent below 2005 levels by 2035, but actually increased U.S. oil and gas production (Tables 7.2 and 7.3). So, from a U.S. perspective, it is possi ble to have both increased oil production and emissions reduction. See Trevor Houser and Shashank Mohan, Fueling Up: The Economic Implications of America’s Oil and Gas Boom (washington, dC: Peterson Institute for International Economics, 2014).
594-60736_ch01_4P.indd 53 2/6/15 10:06 AM
hn hk io il sy SY eh ekhn hk io il sy SY eh ekhn hk io il sy SY eh ekhn hk io il sy SY eh ekhn hk io il sy SY eh ekhn hk io il sy SY eh ek
hn hk io il sy SY eh ekhn hk io il sy SY eh ek
54 | VErrASTrO, MElTON, lAdISlAw, HYlANd, ANd BOOk
to generate new transportation options70). In reality, in the absence of a more structured policy framework for dealing with climate change, the tension surrounding infrastructure (as a means to influence that policy) is unlikely to abate for the foreseeable future. In the absence of po liti cal consensus and a coordinated climate policy at either the federal or international level, there are several potential pathways forward, and it is not yet clear which will materialize:
1. Carbon opportunism. The patchwork of emissions reduction policies and strategies could continue in a way that reduces emissions on an opportunistic basis rather than one justified by the cost competitiveness of abatement options (in other words, seeking the most cost- effective emissions reductions, like energy efficiency or reducing coal use in power generation).
2. Fuel food fight. Policies, incentives, and investments could gravitate away from par tic u lar high carbon investment activity (the most visible sign of this is the current investment framework for new coal power generation in certain parts of the world) and drive further investment toward lower carbon options such as promoting renewables, increasing efficiency, and perhaps even supporting natural gas. On a carbon basis, oil falls in the middle range of these options.
3. Hedge your bets. Individual po liti cal bodies and communities could become less confident in the ability to meet meaningful emissions reduction targets. While they may not abandon mitigation as a goal, the uncertainty about the future of climate policy and adaptation costs could lead them to build up their economy as best as they can, regardless of emissions, in order to be able to afford the costs of future needs.
It would be ideal if the United States undertook a strategic review to weigh these options, consider the costs and benefits of a climate policy, and assess how unconventional oil production fits in, but it seems unlikely that a reconciliation of viewpoints on this divisive issue is possi ble at this stage. It is also clear that there are a lack of scalable, near term replacements for the current fossil based energy system and the absence of an equitable regime to drive down global emissions. U.S. policymakers are not likely to be able to resolve these core tensions in the near term. In the interim, keeping the current energy system robust and operational and the investment environment as clear as possi ble (by providing clear policies and regulations that provide enough long term guidance about how emissions will be regulated over the lifetime of an asset) while managing the transition to something new is a tactical way of navigating this debate.
70. U.S Department of State, Bureau of Oceans and International Environmental and Scientific Affairs, Final Supplemental Environmental Impact Statement for the Keystone XL Pro ject (washington, dC: gPO, January 2014), http:// keystonepipeline - xl . state . gov / finalseis / .
594-60736_ch01_4P.indd 54 2/6/15 10:06 AM
| 55
Conclusion
The realization of the oil production potential in North America is one of the most important oil market– related developments in recent history. with the addition of growth
in Canada and the potential for growth in Mexico, a vastly different future than previously imagined is now emerging for North America.
This real time transformation, along with the uncertainty of the future production forecast, poses unique challenges to those making near term and more strategic long term commercial, policy, and regulatory decisions. As new production comes on line, oil industry participants and local, state, and federal policymakers are working to understand and address the implications of these production changes for the transportation, refining, and marketing of these resources.
The ongoing and rapid changes in the midstream pre sent policymakers with a unique opportunity to assess how best to manage resource development in a way that balances economics, energy security, and environmental/safety concerns. It is also an opportunity to reassess whether long- standing energy policies make sense in the context of an evolving supply landscape. In this report, we have highlighted several key policy areas that require either immediate attention or strategic review. In these early days of new production potential for North America, a strategic review of core areas of policymaking that influence and are affected by midstream oil infrastructure decisions is warranted to ensure the best chance of making the most of this resource opportunity.
594-60736_ch01_4P.indd 55 2/6/15 10:06 AM
56 |
hn hk io il sy SY eh ekhn hk io il sy SY eh ekhn hk io il sy SY eh ekhn hk io il sy SY eh ekhn hk io il sy SY eh ekhn hk io il sy SY eh ek
hn hk io il sy SY eh ekhn hk io il sy SY eh ek
About the Authors
Kevin Book is a nonresident se nior associate of the CSIS Energy and National Security Program. He also heads the research team at ClearView Energy Partners, LLC, an in de pendent firm providing energy policy insights to institutional investors and corporate strategists. Mr. Book’s research focuses on macro trends in oil, natural gas, coal, and biofuels. He appears frequently in print and broadcast media and actively contributes to public and private policy forums in Washington and around the world. In addition to testifying before committees of the U.S. House of Representatives and Senate, Mr. Book has presented to the boards and se nior management teams of oil, natural gas, power, mining, and industrial companies and to numerous energy industry trade associations. In 2012, he was appointed by the U.S. secretary of energy to the National Petroleum Council, a federally chartered and privately funded advisory committee to the Department of Energy. Mr. Book worked previously as se nior vice president of energy policy, oil, and alternative energy research at FBR Capital Markets Corporation. His prior employment history also includes roles at the Motley Fool, Andersen Consulting, and the Advisory Board Com pany. He holds an MA degree in law and diplomacy from the Fletcher School of Law and Diplomacy and a bachelor’s degree in economics from Tufts University.
Lisa Hyland is associate director for the CSIS Energy and National Security Program, where she provides analy sis on a range of domestic and global energy trends, particularly those concerning unconventional fuels, emerging technologies, North American markets, and the Asia- Pacific region. As associate director, she oversees development and management of short- and long- term pro ject timelines and overall program goals. She is a former board section chair for marketing/communications and editor of the newsletter for the Women’s Council on Energy and the Environment. She holds a bachelor’s degree in po liti cal science and history from Creighton University.
Sarah O. Ladislaw is a se nior fellow and director of the Energy and National Security Program at CSIS, where she concentrates on the geopolitics of energy, energy security, energy technology, and climate change. She has been involved with CSIS’s work on the geopolitics portion of the 2007 National Petroleum Council study and the CSIS Smart Power Commission, focusing primarily on energy security and climate issues. She has written papers on U.S. energy policy, global and regional climate policy, and clean energy technology, as well as on Eu ro pean and Chinese energy issues. Ms. Ladislaw is also an adjunct professor at the George Washington University.
594-60736_ch99_4P.indd 56 2/6/15 10:05 AM
DELIvERING THE GooDS | 57
Prior to joining CSIS, Ms. Ladislaw was with the Department of Energy’s office of Policy and International Affairs, where she covered a range of economic, po liti cal, and energy issues in the Americas. She also worked briefly for Statoil as se nior director for International Affairs in their Washington office. Ms. Ladislaw received her bachelor’s degree in international affairs/East Asian studies and Japa nese and her master’s degree in international affairs/international security, both from the George Washington University.
Michelle Melton is a research associate with the Energy and National Security Program at CSIS. She provides research and analy sis on a wide range of projects associated with domestic and global energy trends, including the global oil market; unconventional fuels; U.S. energy policy; Iraq, U.S., and international electricity markets; and global climate change. Prior to joining CSIS, Ms. Melton held a number of positions in the nonprofit, private, and public sectors, including with Statoil, the Government Accountability office, and the Georgetown University Center on Education and the Workforce. She was also a Peace Corps volunteer in Zambia. Ms. Melton received two master’s degrees from Georgetown University and a bachelor’s degree from the Johns Hopkins University.
Frank A. Verrastro is se nior vice president and holds the James R. Schlesinger Chair for Energy and Geopolitics at CSIS. From 2003 to 2012, he served as director of the CSIS Energy and National Security Program. He has extensive energy experience, having spent more than 35 years in energy policy and pro ject management positions in the U.S. government and the private sector. His past government ser vice has consisted of staff positions in the White House and with the Department of the Interior and the Department of Energy, including the role of deputy assistant secretary for international energy resources. In the private sector, he has served as director of refinery policy and crude oil planning for ToSCo (formerly the nation’s largest in de pen dent refiner) and more recently as se nior vice president for Pennzoil. Responsibilities at Pennzoil included government affairs activity (both domestic and international), corporate planning, risk assessment, and international negotiations. In addition, he served on the com pany’s Executive Management and operating Committees, as well as on the Environmental, Safety, and Health Leadership Council.
Mr. verrastro holds a bachelor’s degree in biology/chemistry from Fairfield University and a master’s degree from Harvard University; he also completed the executive management program at the Yale School of Management. He has been an adjunct professor at the Elliott School of International Affairs at the George Washington University and has lectured at Harvard’s Kennedy School. He has also served as an expert witness in testimony before the U.S. House of Representatives and Senate and currently serves as an adviser to the National Intelligence Council staff. He has written extensively on energy markets and security topics, served on the advisory board for the National Renewable Energy Laboratory (NREL) in Golden, Colorado, and is a member of both the National Petroleum Council and the Council on Foreign Relations.
594-60736_ch99_4P.indd 57 2/6/15 10:05 AM

hn hk io il sy SY eh ekhn hk io il sy SY eh ekhn hk io il sy SY eh ekhn hk io il sy SY eh ekhn hk io il sy SY eh ekhn hk io il sy SY eh ek
hn hk io il sy SY eh ekhn hk io il sy SY eh ek
594-60736_ch99_4P.indd 58 2/6/15 10:05 AM

Blank
authorsFrank A. VerrastroMichelle MeltonSarah O. LadislawLisa HylandKevin Book
1616 Rhode Island Avenue NW | Washington, DC 20036
t. 202.887.0200 | f. 202.775.3199 | www.csis.org
ROWMAN & LITTLEFIELDLanham • Boulder • New York • Toronto • Plymouth, UK
4501 Forbes Boulevard, Lanham, MD 20706
t. 800.462.6420 | f. 301.429.5749 | www.rowman.com
Cover photo: Shutterstock; Credit: AlexussK.
Delivering the Goods
v*:+:!:+:!ISBN 978-1-4422-4070-4
FEBRUARY 2015
A Report of the CSIS Energy and National Security Program
Making the Most of North America’sEvolving Oil Infrastructure
Ë|xHSLEOCy240704z
Related Documents