1 Revised Draft Making SAFTA a Success: The Role of India R. S. Ratna* Geetu Sidhu # * Director (Regional and Multilateral Trade Relations), Department of Commerce, Government of India; Email: [email protected] # Deputy Adviser, Planning Commission, Government of India; Email: [email protected] This paper is written under a research grant from the Economic Affairs Division of the Commonwealth Secretarial, London to CUTS International, Jaipur. Views expressed in this paper are those of the authors and not necessarily reflect those of their institutions and of the Commonwealth Secretariat and CUTS International.

Welcome message from author
This document is posted to help you gain knowledge. Please leave a comment to let me know what you think about it! Share it to your friends and learn new things together.
Transcript
1
Revised Draft
Making SAFTA a Success: The Role of India
R. S. Ratna*
Geetu Sidhu#
* Director (Regional and Multilateral Trade Relations), Department of Commerce, Government of India; Email: [email protected] # Deputy Adviser, Planning Commission, Government of India; Email: [email protected]
This paper is written under a research grant from the Economic Affairs Division of the Commonwealth Secretarial, London to CUTS International, Jaipur. Views expressed in this paper are those of the authors and not necessarily reflect those of their institutions and of the Commonwealth Secretariat and CUTS International.

2
Table of Content
ACRONYMS AND ABBREVIATIONS...............................................................................4
1. Introduction.......................................................................................................................5
2. SAARC: An overview of cooperation................................................................................7
3. Trade Agreements in SAARC region.................................................................................9
4. India’s Trade with SAARC Members .............................................................................. 19
5. Role of India in SAFTA: What does the Literature Say? .................................................. 31
6. Non-Tariff Barriers: Addressing them to Ensure Secured Market Access......................... 36
7. India’s Engagements in Other RTAs vis-à-vis SAFTA..................................................... 41
8. Regionalism versus Multilateralism ................................................................................. 46
9. SAFTA and India: The Road to Success .......................................................................... 49
10. Conclusion .................................................................................................................... 52
Annexure 1: India’s Imports: SAARC and Global – A Comparison..................................... 56
Annexure 2: Top 10 Commodities Exported to India ........................................................... 57
Annexure 3: India’s Imports from Bangladesh..................................................................... 62
3
List of Tables
Table 1: Sensitive lists of SAFTA members ........................................................................ 12 Table 2: India’s FTAs commitments: a comparison ............................................................. 13 Table 3: India’s trade with SAARC members ...................................................................... 17 Table 4: Major commodities traded ..................................................................................... 18 Table 5: Trade coverage analysis of SAFTA sensitive list.................................................... 21 Table 6: Global trade export composition of SMCs ............................................................. 25 Table 7: Global trade import composition of SMCs ............................................................. 25 Table 8: WITS SMART simulation estimates ..................................................................... 26 Table 9: Types of non-tariff barriers .................................................................................... 32 Table 10: India’s RTAs: a summary .................................................................................... 39
List of Boxes
Box 1: India–Sri Lanka Free Trade Agreement and FDI ...................................................... 8
4
ACRONYMS AND ABBREVIATIONS
AFTA ASEAN Free Trade Area
CECA Comprehensive Economic Co-operation Agreement
CEPA Comprehensive Economic Partnership Agreement
COE Committee of Experts
EHS Early Harvest Scheme
FTA Free Trade Agreement or Free Trade Area
GATT General Agreement on Tariffs and Trade
GSP Generalised System of Preferences
GSTP Global System of Trade Preferences
ISLFTA India-Sri Lanka Free Trade Agreement
LDC Least Developed Countries
MFN Most Favoured Nation
MoP Margin of Preference
MRAs Mutual Recognition Arrangements
NTBs Non-tariff Barriers
PRoO Preferential Rules of Origin
PTA Preferential Trade Agreement
RoO Rules of origin
RTA Regional Trade Agreement
SAARC South Asian Association for Regional Cooperation
SAPTA SAARC Preferential Trading Agreement
SAFTA South Asian Free Trade Area
SPS WTO Agreement on the Application of Sanitary and Phyto-sanitary Measures
TBT WTO Agreement on Technical Barriers to Trade
WTO World Trade Organisation

5
Making SAFTA a Success: The Role of India
1. Introduction
In recent years, the analysis of economic liberalisation has occupied the main focus of debate
in development economics. Till the late 1980s while a select group of countries moved ahead
on the road of the Regional Trade agreements (RTAs), most of the developing countries
continued with their objectives of economic liberalisation through the rule based multilateral
trading system. However, subsequent to the Uruguay Round, the world trading system
experienced a surge in RTAs, which fundamentally altered the world trade landscape. The
developed as well as developing countries are actively participating in the RTAs. At present,
the number of agreements notified to the WTO is more than 2001, a rise of six folds in just
two decades. Given the rush to conclude RTAs, it is expected that the number would touch
300 in a couple of years. Today, with the exception of Mongolia, all the WTO Members are
participating in one or more RTA negotiations2. Since the 1990s, the South Asian countries
also made efforts to enhance the trade and investment flows with their neighbours, with the
larger objectives of achieving a reduction in poverty and enhancing development in the
region.
South Asian Association for Regional Cooperation (SAARC) was established in 1985 as a
grouping of seven countries, namely, Bangladesh, Bhutan, India, Maldives, Nepal, Pakistan
and Sri Lanka. South Asia has great economic strength in terms of its market potential (one
third of humanity resides in this area) and in terms of the rich natural resources and capable
human resources. Recognising the potential of the role of trade and investment flows in the
process of regional economic integration, a trade block among SAARC members was formed
with the signing of SAARC Preferential Trading Arrangement (SAPTA) in April, 1993. Four
rounds of negotiations were held and tariff concessions were exchanged by member countries
on a number of products, however, the intra-regional trade remained modest.
The decision to convert SAARC into a Free Trade Area (FTA) was taken in the 9th SAARC
Summit in May 1997 in Male. Subsequently, at the 11th SAARC Summit held in Nepal in
1 Recent accession of new members to EU has reduced the total number of RTAs. (Source: WTO) 2 Source: WTO website
6
January 2002, the Heads of State or Government directed the Council of Ministers to finalise
the text of the Draft Treaty Framework by the end of 2002. They also directed that in moving
towards the goal of South Asia Free Trade Agreement (SAFTA), the Member States expedite
action to remove tariff and non-tariff barriers (NTBs) and structural impediments to free
trade. Finally, after extensive negotiations among member countries, the SAFTA Agreement
was signed in January 2004 and was implemented with effect from January 01, 2006, though
the tariff liberalisation started from July 01, 2006.
SAPTA was not able to achieve the desired results of enhancing the trade and investment
linkages amongst the SAARC nations. Many believed that the failure of SAPTA to increase
the intra-regional trade was a result of the limited product coverage and the limited extent of
tariff concessions exchanged among member countries. And, accordingly, SAFTA, with the
objective of bringing down the tariffs to zero, raised the hopes of millions of people for
converting South Asia into a high trade region.
Will SAFTA provide meaningful market access to its members? Will it increase the
economic activity in the region to foster the overall development? What are the lessons that
the member countries learn from SAPTA? What role should the SAARC Member Countries
(SMCs) play in achieving these goals? How should a policy maker look into these issues?
Can India, as the largest economy in the region, play an important role in making SAFTA a
success? This paper attempts to address some of these issues.
Section 2 provides a brief introduction of various cooperation activities in SAARC, while
Section 3 gives an account of India’s bilateral agreements with the SAARC members, the
process of economic integration in South Asia and the progress from SAPTA to SAFTA. An
analysis of India’s trade with SAARC Member Countries is dealt in Section 4, which also
highlights India’s bilateral trade with its South Asian neighbours and assesses the bearing of
bilateral agreements on the implementation of SAFTA. Section 5 deals with a review of the
existing literature on the potential implication of SAFTA, while Section 6 deals with issues
relating to non-tariff barriers (NTBs) and suggests measures to address them so that they do
not impede the intra-SAARC trade. A brief account of India’s other bilateral or regional
engagements have been explained in Section 7. The issue of regionalism versus
multilateralism is presently the most debated topic on which a brief discussion has been
presented in Section 8. Finally, in view of the above background, the paper attempts to
7
provide an insight of how meaningful is SAFTA and what role can India play in making
SAFTA a success.
2. SAARC: An overview of cooperation
The idea of a “regional forum” in South Asia was first proposed by Bangladesh in 1980. The
rationale was primarily predicated on the premise that regional experiences elsewhere in the
globe had been highly successful and that the countries in the South Asian region would
benefit enormously from such cooperation as it would strengthen their competitive position –
both individually and as a group.
Initially SAARC's activities were confined to nine non-controversial areas of regional
cooperation in transport, communication, science and technology, education, culture, health,
population, sports and arts etc. A SAARC Integrated Programme of action was constituted
initially and a Regional Integrated Programme of Action was adopted in 2004. Some of the
important achievements can be highlighted in the following manner:
• A Technical Committee on Agriculture and Rural Development was constituted. The
Committee has been helpful in bridging critical knowledge gaps and identified
specific areas for pursuing regional actions and projects. With few projects of Food
and Agriculture Organisation (FAO) are being implemented, an important one relates
to Regional Strategy & Regional Programme for Food Security.
• Apart from Technical Committee, Working Groups were created in new areas in
Energy, Tourism, information and communication technology (ICT), intellectual
property rights (IPRs) & biotechnology.
• Recognising the importance of regional cooperation in Biotechnology, a proposal to
draw a regional framework for Bio-safety Procedures and Protocols is being
considered. Meetings of experts are being convened to develop common regional
strategies and concrete plan of action on the basis of state-of-the–art Reports on
Selected Rural Technologies, and Biotechnology.
• Recognising that telecommunications would be looked upon as a multifaceted process
enhancing socio-economic development in the region, the SAARC Communication
Ministers adopted a Plan of Action in their First Conference in 1998. Subsequently,
in view of rapid and innovative developments in the telecommunication sector, a

8
revised Plan of Action was adopted in 2004. A common position on issues of concern
to the region was adopted and the same was presented at the World Summit for
Information Society in November 2005.
• In the areas of cooperation in energy, several projects and studies have been
commissioned. A possibility of setting up a SAARC Energy Centre is being explored.
The modalities in creating a South Asia Energy Cooperation, including the concept of
an Energy Ring are also being worked out. SAARC – ASEAN Cooperation in the
energy sector has been finalised which provides that the SAARC Experts can visit the
relevant ASEAN institutions.
• In another important area of cooperation, i.e., Environment, several studies were
carried out. Studies have made specific recommendations on measures to protect and
manage the environment; strengthening disaster management capabilities; and their
implementation mechanisms. An Action Plan at Regional and National Levels has
been prepared. It also endeavours for studying the feasibility of a Regional Treaty on
Environment. Two Regional Centers of Excellence in the field of environment has
been approved, a Costal Zone Management Center has come up in Maldives and
SAARC Forestry Centre was set up in Bhutan.
• In the field of Science & Technology, efforts are underway to finalise a SAARC
Technology Initiative with a focus on identifying and implementing specific regional
projects in rural areas which would have direct impact on improving day-to-day life
of people.
• A South Asian Development Fund (SADF) was created in 1996. It started with a
resource base of US$5mn and has a fund of about US$6.6mn. The fund is to be
utilised for projects in one or more SAARC countries which are of significant
economic interest to two or more countries.
The experience of the growth and consolidation of various regional blocks world over (in
early 1990s) brought to the fore the realisation that core economic areas need to be brought
within the scope of SAARC activities if the objective of bringing about accelerated social and
economic development in the region through mutual cooperation was to materialise. Thus,
SAPTA was finalised and signed during the Seventh Summit held in Dhaka in 1993. The
signing of SAPTA was a landmark achievement of the Seventh SAARC Summit. The
9
Agreement reflected the desire of the member States to promote and sustain mutual trade and
economic cooperation within the SAARC region through the exchange of concessions.
At the 10th SAARC Summit held in Colombo in July 1998, the Heads of the SAARC
States/Governments decided to set up a Committee of Experts (COE) to draft a
comprehensive treaty framework for creating an FTA within the region, taking into
consideration the asymmetries in development within the region and bearing in mind the need
to fix realistic and achievable targets. The COE first met in August 1999 but it took four
years to reach an agreement on SAFTA, which was signed on January 06, 2004 during the
12th SAARC Summit in Islamabad. The Agreement entered into force with effect from
January 01, 2006.
3. Trade Agreements in SAARC region
Bilateral Trade Agreements
The relationship between India and other SAARC member countries is historical. India’s
trade with Bangladesh, Bhutan, Maldives, Nepal and Sri Lanka are governed by the bilateral
treaties/agreements. The India-Bangladesh Bilateral Trade Agreement signed on October 04,
1980, has been extended from time to time and presently the agreement is valid till March 31,
2009. This Agreement provides for expansion of trade and economic cooperation, making
mutually beneficial arrangement for the use of waterways, railways and roadways, passage
of goods between two places in one country through the territory of the other, exchange of
business and trade delegations and consultation to review the working of the Agreement at
least once a year.
In the bilateral trade talks, issues for recognising Bangladesh’s accredited agencies like
Bangladesh Standards and Testing Institution (BSTI) for certifying biscuits, processed food,
and cement are being discussed. A lab for testing Hilsa fish at Petrapole border has been set
up as a measure for bilateral cooperation. Earlier Bangladesh imposed restriction on import of
yarn from India through land route. This issue was also resolved mutually in 2006 when
Bangladesh lifted the ban on movement of yarn through Petrapole for yarn used by export
oriented industry which consumes major share of total import of yarn from India.
Recognising that promoting business linkages between the sides are essential to promote
economic activity, a task force has been constituted between the Apex Chambers, i.e. PBCCI
10
and FICCI in April, 2006. The bilateral talks are held at regular intervals with the objectives
of removing infrastructural bottlenecks and non-tariff restrictions. At present, no negotiation
for a bilateral FTA is being held.
The first formal Agreement on Trade and Commerce between India and Bhutan was
concluded in 1972. It was renewed periodically, with mutually agreed modifications. The
current Agreement between the two countries on Trade, Commerce and Transit was signed
on July 28, 2006 and is operational from July 29, 2006 for a period of 10 years. The
Agreement provides for free trade and commerce between the two countries. The new
agreement also provides for movement of Bhutanese goods from one part of Bhutan to
another part of Bhutan through India. As a token of friendship, Chukha Hydel Project was
commissioned. Bhutan earns nearly 25 percent of its revenue through export of electricity to
India. Efforts are being made to develop a Residue Monitoring Plant in Bhutan for fruits and
vegetables so that the testing etc., can be done there itself and the consignments are not held
at Indian border check posts.
Indo-Maldives trade relations are governed by the Trade Agreement signed on March 31,
1981 initially valid for a period of one year with the provision that it shall progressively
remain in force until it is modified or terminated by either country on giving three months`
notice to the other. The Agreement provides for Most Favoured Nation (MFN) treatment to
each other in trade and merchant vessels, promotion of commercial and technical cooperation
through exchange of delegations and participation in trade fairs and exhibitions and supply of
essential commodities by Government of India to Government of Maldives on annual quota.
As per the agreement, India supplies essential commodities annually at the request of
Maldives. These commodities usually consist of eggs, potatoes, rice, onion, wheat flour,
sugar, etc., and despite having export restrictions on some of items, India continues to supply
them to Maldives.
India and Nepal have signed the Treaty of Trade to regulate bilateral trade, which was re-
negotiated and renewed for five years with effect from March 06, 2002. The Treaty of Trade
has been renewed in the existing form for a further period of five years with effect from
March 06, 2007. The treaty provides India and Nepal to exempt primary products from each
other from the basic custom duty/quantitative restrictions. India has also undertaken to
promote industrial development of Nepal, by granting duty free access to Nepalese goods, on

11
non-reciprocal basis. The treaty on the other hand, provides Nepal to exempt wholly/partially
Indian imports from customs duty/quantitative restriction to the extent feasible.
India and Nepal have also entered into a Treaty of Transit to facilitate each other’s trade with
third countries through territory of the other which was renewed and signed on January 05,
1999 for a period of seven years. The Treaty has further been extended for a period of seven
years up to January 05, 2013. In addition, there exists an Agreement of Cooperation to
Control Unauthorised Trade between the two countries which was renewed for a period of
five years with effect from March 06, 2002. India is the largest investor to Nepal with
investments of Indian Rupees 6 billion (US$152mn). An inter-Government Committee has
been set up which meets every year to discuss the issues relating to bilateral trade, trade
facilitation and unauthorised trade. Nepal being a ‘land locked country’ needs technical
assistance to resolve issues relating to food quarantine regulations of India. Efforts are on for
providing better infrastructural facilities at borders and to address Nepal’s exports concerns
relating to Indian Sanitary and Phyto-sanitary (SPS) and Technical Barrier to Trade (TBT)
measures. Discussions are being held for establishing Special Economic Zones (SEZs) in
Nepal, oil pipelines, cross- border power transmissions grid etc. In case of services, efforts
are on cooperation in IT, Tourism, Education and Healthcare.
After independence, India and Pakistan signed a standstill agreement under which goods
from one country to another were exempted from customs duty. Between 1965 and 1975,
there was trade embargo between the two countries. A trade protocol (Shimla Agreement)
was signed for lifting the trade embargo with effect from December 07, 1974. India accorded
MFN status to Pakistan in 1996 and in the same year Pakistan increased its positive list of
600 items that could be imported from India. The present Positive List of Pakistan specifies
1075 items which are importable from India. The rest of the items are though allowed for
imports into Pakistan from India but only against a specific import permit or licence, while
these items are freely importable from rest of the world. Pakistan is yet to grant MFN status
to India despite its obligations, including under the WTO, and has cited extraneous political,
economic and other reasons for this. The issue of grant of MFN status continues to be flagged
by India during the bilateral trade talks. Despite signing of the SAFTA, exports from India to
Pakistan are governed by this positive list of imports as Pakistan’s bilateral import policy for
India supersedes SAFTA. Currently, this issue is being discussed at various levels of
SAARC meetings. Meanwhile, in order to enhance the economic and commercial

12
cooperation, Secretary Level Talks are now being held between India and Pakistan. Also,
Pakistan has indicated that it would process the Indian Bank’s applications to open branches
in Pakistan expeditiously and a regular exchange of tea exporters and imports would be held
so that Pakistan can import Indian tea.
Sri Lanka, having an adverse trade balance with India for the last several years, was seeking
India’s support for finding ways and means to reduce the trade gap. Over the years, Sri Lanka
had been suggesting a bilateral faster track for free trade so as to facilitate increased exports
from their country to India. During the SAARC Summit held in Colombo in July 1998, Prime
Minister of India conveyed India’s willingness to conclude FTAs with the willing SAARC
Member State on a bilateral basis. Sri Lanka responded to this offer and held consultations
with India after which a bilateral FTA was signed between the two countries on December
28, 1998. Under this Agreement, which was made operational in February-March, 2000, both
countries committed to eliminating tariffs in a phased manner on all items except for items in
the Negative List and items under the tariff rate quota mechanism. While India has completed
its tariff elimination programme in 2003 as envisaged in the FTA, Sri Lanka will complete
the tariff liberalisation programme in the year 2008.
Historically, Foreign Direct Investment (FDI) from India to Sri Lanka had been low;
however, there was a dramatic increase after the signing of the bilateral FTA. A major
attraction for Indian investors has been the ability to re-export to India while benefiting from
lower tariffs on raw materials in Sri Lanka. India became the biggest FDI investor in Sri
Lanka in 2002 and 2003. For 2004, India slipped to 4th place behind Switzerland (Holcim
cements), Malaysia (Dialog mobile network) and UK (HSBC BPO) which invested in some
large projects. Seeing the potential for investments from India, the Sri Lankan Board of
Investments opened its first overseas branch in Bangalore on May 23, 2005.
The study of UNCTAD (see Box 1) explains how the India Sri Lanka FTA has
affected the sourcing opportunities and investment decisions:
Box 1: India–Sri Lanka Free Trade Agreement and FDI
FTA gives duty-free market access to India and Sri Lanka on a preferential basis.
Covering 4,000 products, it foresaw a gradual reduction of import tariffs over three

13
years for India and eight years for Sri Lanka. To qualify for duty concessions in either
country, the Rules of Origin (RoO) criteria spelled out value added at a minimum of 35
percent for eligible imports. For raw materials sourced from either country, the value-
added component would be 25 percent.
Sri Lankan exports to India increased from US$71mn in 2001 to US$168mn in 2002.
And India’s exports to Sri Lanka increased from US$604mn in 2001 to US$831mn in
2002. Although the agreement does not address investment, it has stimulated new FDI
for rubber-based products, ceramics, electrical and electronic items, wood-based
products, agricultural commodities and consumer durables. Because of the agreement,
37 projects are now in operation, with a total investment of US$145mn.
Source: World Investment Report (2003) published by UNCTAD
India and Sri Lanka have signed an agreement on the US$100mn Line of Credit in January
2001 to enable Sri Lankan importers to source goods and services from India under soft loan
terms. The credit is only for items of Indian manufacture and services. The credit covers
import of capital goods; import of consumer durables and five specified food items, i.e. sugar,
wheat flour, rice, red split lentils and wheat grains, as well as consultancy services. India and
Sri Lanka are now engaged in negotiating a CEPA with the objective of widening the ambit
of the FTA to include services and investment. Both sides are also negotiating for reducing
the size of Negative List so that the market access opportunities could be enhanced.
SAPTA
The SAPTA came into force in December 1995 after conclusion of First Round of
negotiations in April 1995. Since then three more rounds were concluded and tariff
concessions were exchanged on around 5000 products. Each Round contributed to an
incremental trend in the product coverage and the deepening of tariff concessions over the
previous Rounds. The SAPTA Agreement made a distinction between the least developed
and other developing member countries with the former consisting of Bangladesh, Bhutan,
Maldives and Nepal and the latter consisting of India, Pakistan and Sri Lanka.
The negotiations for SAPTA were held on the basis of “request and offer” approach; where
the exporting Party came up with a ‘country-specific’ request list of its exportable (real as
well as potential) items on which it would seek preferential market access. The other Party

14
would then make an offer on items from ‘request-list’ and indicate the extent of tariff
concessions in terms of Margin of Preference (MoP). At the end of each Round, these offers
were multilateralised to all SAARC members. The least developed country (LDC) members
got concessions on a large number of products with deeper MoP, without reciprocating with
equivalent concession to other developing countries under the special and differential
treatment (S&DT) provision of SAPTA. Since India had a better bilateral agreement with
Bhutan and Nepal, bilateral negotiations in SAPTA were held only with Bangladesh and
Maldives. Negotiations were also held with Pakistan & Sri Lanka (up to the Third Round as
bilateral FTA was concluded with Sri Lanka before the Fourth Round). In the Third Round
negotiations, India offered maximum number of concessions to the LDCs (effectively to
Bangladesh & Maldives). Bangladesh made a request on textiles and textile products as well
as manufactured goods. Maldives made a request on few items relating to fisheries. The total
number of concessions offered by India was on 2656 products at 6-digit HS with average
MoP of 50 percent for LDCs. India’s offer on maximum number of items comprised the
request made by Bangladesh. It is worth noting that though a number of products exported by
Bangladesh to India were limited, on most these items tariff concessions were available to
them under SAPTA. A similar situation existed after the Fourth Round where the product
coverage for tariff concessions were increased to 2700 and the margin of preference to LDCs
were deepened to 60-75 percent. It was therefore evident that despite getting the tariff
concessions on more than 2500 items and MoP ranging from of 50-75 percent, Bangladesh
could not utilise the concessions to its advantage and was not able to substantially increase
the number of products for exports to India over the years. This could be illustrated by the
fact that in the year 2005-06, Bangladesh’s total exports to India for US$127.03mn
comprised only 48 products at 6-digit HS level. Few attribute this to the NTBs imposed by
India, while some cite the supply-side constraints of Bangladesh.
The poor performance of intra-SAARC trade flows was also due to several structural as well
as policy induced constraints. Structural constraints were manifested in low capacity to
supply exports, especially in LDCs of the region, e.g. Bangladesh, Bhutan, Maldives and
Nepal, lack of investments due to low savings rate, technological backwardness and lack of
backward-forward linkages of the industries. In some sectors, the SAARC members were
competing with each other in global markets. The policy-induced constraints include the
presence of trade barriers, inadequate trade facilitation (TF) mechanisms and regulated
investment regimes.
15
SAFTA
The Agreement on SAFTA was signed in January 2004 with the understanding that the
sensitive lists, RoO, mechanism for compensation of revenue losses for LDCs and areas for
technical assistance for LDCs would be negotiated for implementation subsequently. The
Committee of Experts (COE) concluded negotiations on these areas in December 2005 and
SAFTA came into force on January 01, 2006. However, there was a delay in commencement
of trade liberalisation programme due to procedural requirements for ratification of the
Agreement. It was therefore agreed that tariff reduction programme would commence on July
01, 2006. The Agreement provides for Special and Differential Treatment (S&DT) for the
LDCs in various forms.
Other schemes like Revenue Compensation Mechanism have also been finalised and are
implemented by all Members including India. The mechanism for Compensation of Revenue
Loss (MCRL) for the SAARC LDCs prescribes:
a. The compensation to LDCs would be available for four years. However, for Maldives
it would be available for six years.
b. The compensation would be in the form of grant in US dollar.
c. The compensation shall be subject to a cap of 1, 1, 5 and 3 percent of customs
revenue collected on non sensitive items under bilateral trade in the base year, i.e.,
average of 2004 and 2005.
d. The compensation shall be administered by the COE.
This scheme generated lot of attention when the SAFTA was signed. However, after this
scheme has been finalised, it does not appear to have met the expectations of LDC members
as it has a very limited scope and is in place for a limited period. By the time the LDCs would
grant duty-free market access to other members of SAFTA, thereby incurring major revenue
losses, the mechanism will no longer be in place.
The Agreement provides member countries to maintain sensitive lists, consisting of items
which are not subject to tariff reduction. Only three countries namely Bangladesh, India and
Nepal maintain different sensitive lists for LDCs and Non-LDCs. Besides, the LDCs maintain
16
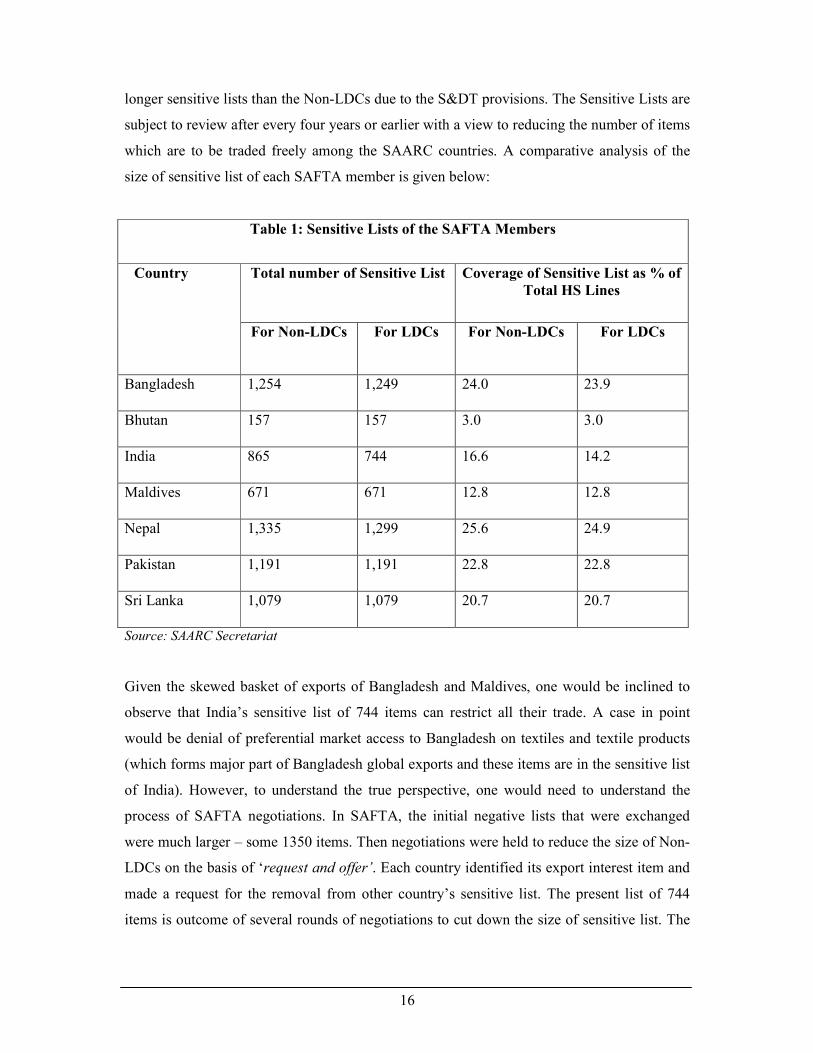
longer sensitive lists than the Non-LDCs due to the S&DT provisions. The Sensitive Lists are
subject to review after every four years or earlier with a view to reducing the number of items
which are to be traded freely among the SAARC countries. A comparative analysis of the
size of sensitive list of each SAFTA member is given below:
Table 1: Sensitive Lists of the SAFTA Members
Total number of Sensitive List Coverage of Sensitive List as % of
Total HS Lines Country
For Non-LDCs For LDCs For Non-LDCs For LDCs
Bangladesh 1,254 1,249 24.0 23.9
Bhutan 157 157 3.0 3.0
India 865 744 16.6 14.2
Maldives 671 671 12.8 12.8
Nepal 1,335 1,299 25.6 24.9
Pakistan 1,191 1,191 22.8 22.8
Sri Lanka 1,079 1,079 20.7 20.7
Source: SAARC Secretariat
Given the skewed basket of exports of Bangladesh and Maldives, one would be inclined to
observe that India’s sensitive list of 744 items can restrict all their trade. A case in point
would be denial of preferential market access to Bangladesh on textiles and textile products
(which forms major part of Bangladesh global exports and these items are in the sensitive list
of India). However, to understand the true perspective, one would need to understand the
process of SAFTA negotiations. In SAFTA, the initial negative lists that were exchanged
were much larger – some 1350 items. Then negotiations were held to reduce the size of Non-
LDCs on the basis of ‘request and offer’. Each country identified its export interest item and
made a request for the removal from other country’s sensitive list. The present list of 744
items is outcome of several rounds of negotiations to cut down the size of sensitive list. The

17
TRQ on textiles to Bangladesh was outcome of such a process. A detail analysis of the
impact of the size of sensitive list is dealt in subsequent paragraphs.
At the 14th SAARC Summit, the Prime Minister of India stated that as the largest country in
the region, India was ready to accept asymmetrical responsibilities including opening her
markets to her South Asian neighbours without insisting on reciprocity. He also announced
that before the end of the current year, India would allow the LDCs among its South Asian
neighbours duty free access to its markets (in SAFTA Agreement the commitment is for
bringing the duties to 0-5 percent). It will also further reduce the sensitive list in respect of
these countries. As per this announcement, India would reduce tariffs to zero (duty-free) for
the LDC members by December 31, 2007 whereas as per the SAFTA tariff liberalisation
programme, the reduction to 0-5 percent for the LDCs was to be completed by December 31,
2008. India has since eliminated tariffs for the LDC members by advancing the tariff
liberalisation programme through suitable Custom Notifications (Notification No.125/2007-
Customs & 126/2007-Customs both dated 31.12.2007). India is also in the process of
reducing its Sensitive List for LDCs. Bangladesh and Maldives would be the major
beneficiary of this move to get duty free access to the Indian market.
India’s Bilateral FTAs with SAARC Members and SAFTA: A Comparison
With the implementation of SAFTA as a regional agreement, an interesting question comes
up: whether the bilateral agreements become redundant or they continue to play a more
prominent role than SAFTA in governing the trade flows. A case study of India was done. A
comparison of India’s commitment in bilateral FTAs with SAARC Members vis-à-vis
SAFTA is illustrated in Table 2.
Table 2: India’s FTAs Commitments: A Comparison
Size of India’s
Sensitive List
Timeframe (
0-5% level)
Timeframe
(zero duty)
Rules of Origin Country
SAFTA Bilateral SAFTA Bilateral SAFTA Bilateral
Bhutan 744 Nil 01.01.2009* Already CTH+30% Manufactures
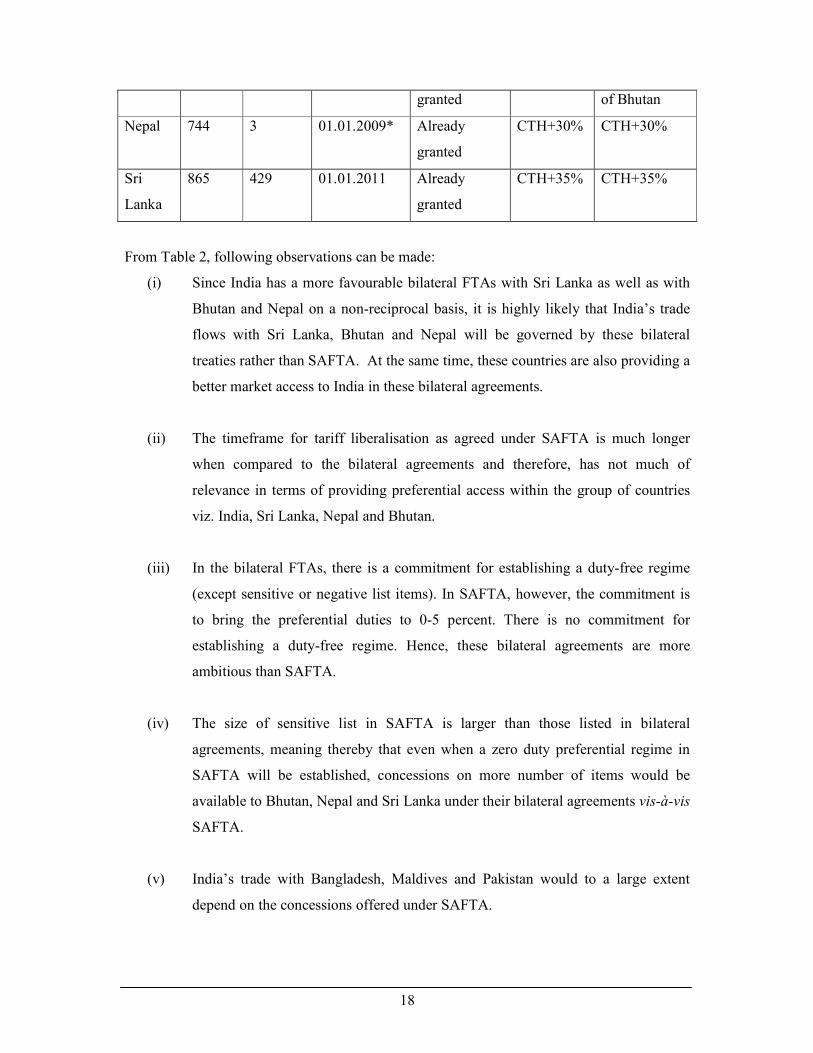
18
granted of Bhutan
Nepal 744 3 01.01.2009* Already
granted
CTH+30% CTH+30%
Sri
Lanka
865 429 01.01.2011 Already
granted
CTH+35% CTH+35%
From Table 2, following observations can be made:
(i) Since India has a more favourable bilateral FTAs with Sri Lanka as well as with
Bhutan and Nepal on a non-reciprocal basis, it is highly likely that India’s trade
flows with Sri Lanka, Bhutan and Nepal will be governed by these bilateral
treaties rather than SAFTA. At the same time, these countries are also providing a
better market access to India in these bilateral agreements.
(ii) The timeframe for tariff liberalisation as agreed under SAFTA is much longer
when compared to the bilateral agreements and therefore, has not much of
relevance in terms of providing preferential access within the group of countries
viz. India, Sri Lanka, Nepal and Bhutan.
(iii) In the bilateral FTAs, there is a commitment for establishing a duty-free regime
(except sensitive or negative list items). In SAFTA, however, the commitment is
to bring the preferential duties to 0-5 percent. There is no commitment for
establishing a duty-free regime. Hence, these bilateral agreements are more
ambitious than SAFTA.
(iv) The size of sensitive list in SAFTA is larger than those listed in bilateral
agreements, meaning thereby that even when a zero duty preferential regime in
SAFTA will be established, concessions on more number of items would be
available to Bhutan, Nepal and Sri Lanka under their bilateral agreements vis-à-vis
SAFTA.
(v) India’s trade with Bangladesh, Maldives and Pakistan would to a large extent
depend on the concessions offered under SAFTA.
19
(vi) There is a commonality; however, on the RoO between SAFTA and these bilateral
agreements, with the exception of Bhutan. Therefore, if a product can qualify
under one agreement, it can qualify under the SAFTA as well or vice versa. This
harmonisation on the RoO is a positive sign for the exporters, who would not be
required to maintain separate inventories for qualification of a product for
preferences.
It is clear that in the present form, the bilateral agreements are more favourably placed and to
that effect they undermine SAFTA. Given the fact that the trade in goods will continue to
take place under the bilateral agreements, in order to make SAFTA meaningful for the region
one would need to expand the scope of SAFTA. To this effect, to make it more lucrative,
issues like trade facilitation measures and removing the NTBs would be required to be taken
up on priority. Secondly, if SAFTA can widen its base like further reducing the items in
sensitive lists, expands its scope to cover services and investments agreements and addresses
the issues relating to NTBs, it would provide greater opportunity than the bilateral
agreements (except to the India-Sri Lanka where the negotiations for a Comprehensive
Agreement is at advance stage).
4. India’s Trade with SAARC Members
South Asia’s intra-regional trade as a share of total trade remained below five percent in the
1980s and 1990s and continues to be around the same level at present. At a broad level, the
available data of the major South Asian countries indicate that industrial countries continue to
assume a major share of the region’s trade, while developing countries outside South Asia
have been the second most important group, although their importance has been steadily
diminishing.
India’s import from SAARC for the period 1996-97 to 2005-06 is given in Annexure 1.
Though the imports from SAARC increased steadily during the period and have quadrupled,
it remained around one percent of India’s global imports since 1998-99. Despite the fact that
most of its neighbours are import-dependent, India’s trade with its neighbouring countries has
not been very impressive, both in terms of volume and as a percentage of its global trade.
India’s intra-SAARC trade is approximately 2.6 percent of its total trade, with India’s exports
to SAARC countries constituting roughly 5 percent of its total exports and India’s imports

20
from the SAARC countries constituting only 0.9 percent of its total imports. Even though the
trade volume has increased in the recent years, it is much below the true potential. Given the
size of the Indian economy and its geographical positioning at the centre of the region, the
success of trade initiatives taken in the SAARC region greatly depends on India and
therefore, India needs to play a greater role in ensuring that the goals of SAFTA are achieved.
India’s trade with the SAARC countries is shown in Table 3 and 4. As evident from Table 3,
while India has a favourable balance of trade with all countries in the South Asian region, it
has a huge trade surplus with Bangladesh, Sri Lanka, Pakistan and Nepal. However, it is
important to note here that the official accounts of South Asia’s international trade statistics
are flawed by the high incidence of informal trade between India and its neighbours. The data
merely captures the formal trade which takes place among the neighbouring countries.
Studies have shown that huge informal trade takes place through the bordering countries, for
instance, the informal trade between India and Pakistan was estimated to be US$1bn for the
year 2004-2005 (Taneja 20053). According to the World Bank Report on ‘India-Bangladesh
Trade, Trade Policies and Potential Free Trade Agreement’, very approximate estimates
based on surveys in Bangladesh during 2002, total smuggled exports from India to
Bangladesh may have been around US$500mn, about 42 percent of Bangladesh’s recorded
imports from India in 2002-03, or about 30 percent of total imports (recorded plus smuggled).
Most of the smuggled imports came by the land border. Similarly, informal exports to India
from Bangladesh, Nepal, and Sri Lanka are also relatively high though they comprise a
sizable share of third-country goods. These national guesstimates of informal trade based on a
sample survey of key locations may have high error margins and, hence, may not be fully
reliable4. However, the available information on the informal trade does not significantly
alter the pattern of intra-regional trade.
3 Taneja, Nisha (2005): Informal trade in South Asia? How to channelise to a formal route? CUTS briefing paper RECSA 5/2005. 4 World Bank Policy Research Working Paper 3497, February 2005: What Does Regional Trade in South Asia Reveal about Future Trade Integration? Some Empirical Evidence by Nihal Pitigala
21
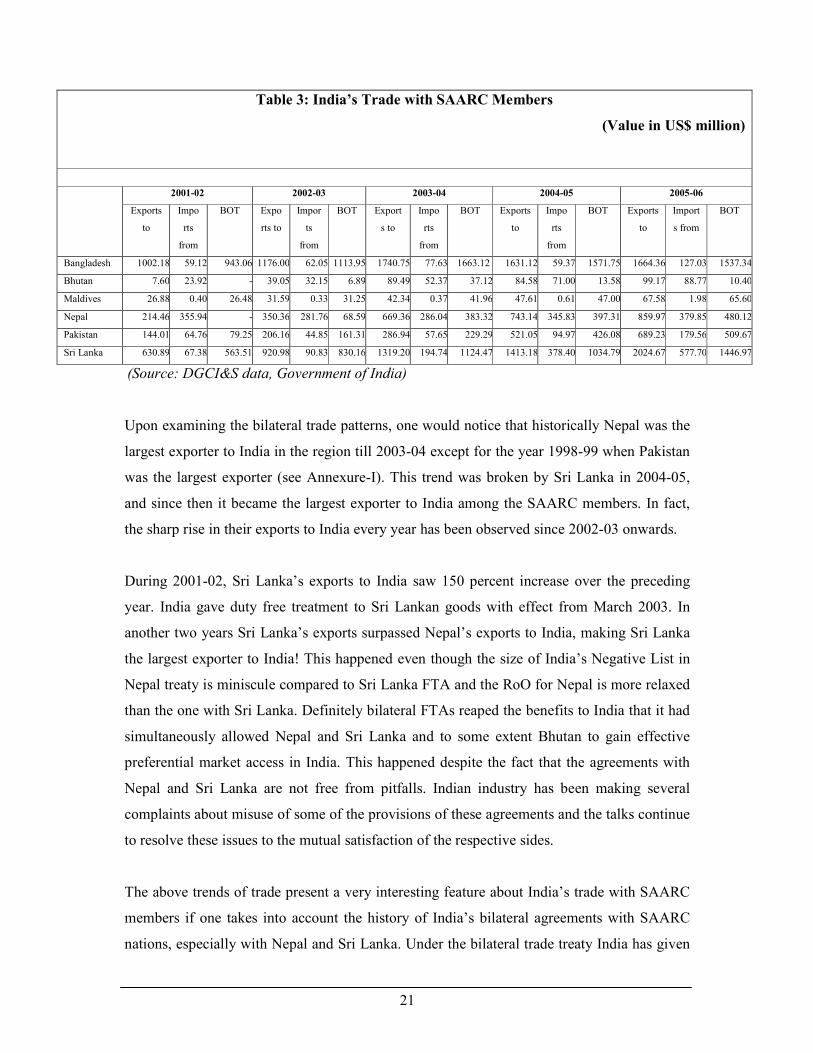
Table 3: India’s Trade with SAARC Members
(Value in US$ million)
2001-02 2002-03 2003-04 2004-05 2005-06
Exports
to
Impo
rts
from
BOT Expo
rts to
Impor
ts
from
BOT Export
s to
Impo
rts
from
BOT Exports
to
Impo
rts
from
BOT Exports
to
Import
s from
BOT
Bangladesh 1002.18 59.12 943.06 1176.00 62.05 1113.95 1740.75 77.63 1663.12 1631.12 59.37 1571.75 1664.36 127.03 1537.34
Bhutan 7.60 23.92 - 39.05 32.15 6.89 89.49 52.37 37.12 84.58 71.00 13.58 99.17 88.77 10.40
Maldives 26.88 0.40 26.48 31.59 0.33 31.25 42.34 0.37 41.96 47.61 0.61 47.00 67.58 1.98 65.60
Nepal 214.46 355.94 - 350.36 281.76 68.59 669.36 286.04 383.32 743.14 345.83 397.31 859.97 379.85 480.12
Pakistan 144.01 64.76 79.25 206.16 44.85 161.31 286.94 57.65 229.29 521.05 94.97 426.08 689.23 179.56 509.67
Sri Lanka 630.89 67.38 563.51 920.98 90.83 830.16 1319.20 194.74 1124.47 1413.18 378.40 1034.79 2024.67 577.70 1446.97
(Source: DGCI&S data, Government of India)
Upon examining the bilateral trade patterns, one would notice that historically Nepal was the
largest exporter to India in the region till 2003-04 except for the year 1998-99 when Pakistan
was the largest exporter (see Annexure-I). This trend was broken by Sri Lanka in 2004-05,
and since then it became the largest exporter to India among the SAARC members. In fact,
the sharp rise in their exports to India every year has been observed since 2002-03 onwards.
During 2001-02, Sri Lanka’s exports to India saw 150 percent increase over the preceding
year. India gave duty free treatment to Sri Lankan goods with effect from March 2003. In
another two years Sri Lanka’s exports surpassed Nepal’s exports to India, making Sri Lanka
the largest exporter to India! This happened even though the size of India’s Negative List in
Nepal treaty is miniscule compared to Sri Lanka FTA and the RoO for Nepal is more relaxed
than the one with Sri Lanka. Definitely bilateral FTAs reaped the benefits to India that it had
simultaneously allowed Nepal and Sri Lanka and to some extent Bhutan to gain effective
preferential market access in India. This happened despite the fact that the agreements with
Nepal and Sri Lanka are not free from pitfalls. Indian industry has been making several
complaints about misuse of some of the provisions of these agreements and the talks continue
to resolve these issues to the mutual satisfaction of the respective sides.
The above trends of trade present a very interesting feature about India’s trade with SAARC
members if one takes into account the history of India’s bilateral agreements with SAARC
nations, especially with Nepal and Sri Lanka. Under the bilateral trade treaty India has given

22
duty free access to Nepal, which utilised the agreement to its advantage by continuously
maintaining its status of being the largest exporter in SAARC to India. Nepal’s exports to
India in value terms also remained much higher than any other SAARC member. The fact
that India is one of the largest exporters to Nepal, one would be inclined to attribute this to
the constraints which a land-locked country faces. The literature suggests that in such cases
the neighbours are the most important natural trading partners and one would need to assume
that it would not only be the tariff preferences that make India the principal trade partner of
Nepal but also the geographical proximity. However, the trade data illustrates the fact that the
reverse trend is also true i.e. Nepal is the largest exporter to India from among the SAARC
Member Countries. Similarly, Sri Lanka became the largest exporter to India post bilateral
FTA implementation (see Table 3 ), which again is a small–island country. Therefore, one
would be inclined to argue that tariff concessions indeed play a significant role in
determining the trade flows, even for a land-locked or small-island neighbouring country.
Table 4: Major Commodities Traded
Country India’s export commodities India’s import commodities
Bangladesh Fabrics, engineering goods, chemicals
and pharmaceuticals, transport
equipment, cement, fruits and
vegetables and coal.
Raw jute, glycerin, leather, fabric
yarn, Jamdani sarees, etc
Bhutan Machinery and Instruments;
Manufactures of Metals; Transport
Equipments; Primary and Semi-
finished Iron and Steel; Electronic
Goods.
Primary Steel, Pig Iron based items;
Inorganic Chemicals; Wood and
Wood Products; Non-ferrous metals;
Man-made filament/spun yarn
Maldives Plastic and Linoleum Products; Drugs,
Pharmaceuticals and Fine chemicals;
Rice (other than Basmati); Machinery
and Instruments; Paper/Wood
Products.
Metalifers Ores & Metal Scrap;
Printed books, newspapers, journals;
Professional instruments,. except
electronic; Machinery except
electrical and electronic; Artificial
resins, plastic materials, etc
Nepal Petroleum Products; Transport Iron and Steel; Man-made

23
Equipments; Drugs/ pharmaceuticals/
fine chemicals; Glass/Glass wares,
Ceramics/Cement; Machinery and
instruments; Primary and semi-
finished iron and steel, etc.
filament/spun yarn; Essential oil and
cosmetic preparation; Artificial
resins, plastic materials; Other
textile yarn, fabrics,, made-up
artificial; Non-ferrous metals etc.
Pakistan Organic chemicals, cotton, plastics
and articles thereof, rubber and
articles thereof, iron & steel, sugar and
sugar confectionery, edible vegetables,
mineral fuels etc.
Edible vegetables, cotton, edible
fruits &nuts, organic chemicals,
sugar & sugar confectionery, copper
and articles thereof, man-made
staple fibers, lead and articles
thereof, wool and woven fabrics etc.
Sri Lanka Petroleum products, transport
equipment, cotton yarn, fabrics, made-
ups, sugar, machinery and
instruments, paper/wood products.
Spices, non-ferrous metals,
metaliferous ores and metal scrap.
(Source: DGCI&S Data, Government of India)
A tabular statement of major commodities that are exported to India over the period 1997-98
to 2005-06 can be seen in Annexure 2. It is apparent from this statement that the export
baskets of SAARC members have diversified over the years. It may be difficult to clearly
establish that the diversification is only on account of FTA with India and could be attributed
to their global export diversification. However, given the fact that most of the countries have
strong export interest in India, the bilateral FTAs would have played some role in such
diversification.
Though several studies (Kemal5 2002; Baysan, Panagariya and Pitigala6 2006) have raised
doubts over the trade complementarity among SAARC members and the economic logic of
SAFTA, others have identified that despite the pattern of revealed comparative advantage
being quite similar across SAARC Member countries, there is some trade complementarity
5 Kemal A.R, Musleh-ud-Din, Abbas Kalbe, Qadir Usman (2002): A plan to strenthen regional trade cooperation in South Asia (Trade, Finance and Investment in South Asia, edited by T.N.Srinivasan). 6 Baysan T, Panagariya A, Pitigala N (2006): Preferential Trading in South Asia, World Bank Policy Research Working Paper – 3813.
24
among them (Mukherji7 2005). It has been pointed out the trade potential in each of the
SAARC Country, for example Bangladesh’s export potential is in a variety of fish products,
vegetables, tea and mate, jute fibers, fertilisers, leather, textile yarn, cotton fabrics, woven,
made up articles of textile materials, floor coverings, etc. India’s export potential is more
diversified and has been identified in meat, rice, fruits and nuts, coffee, spices, animal feed,
oilseeds, stone and gravel, iron ores and concentrates, crude vegetable materials, a number of
chemical and pharmaceutical products, pig iron and flat rolled products, machinery and
transport equipment, etc. Nepal has export potential in oilseeds and oleaginous fruits.
Pakistan’s potential exports to the region consist of sugar, molasses, honey cotton, and
surgical instruments. Sri Lanka’s export potential to the region includes synthetic rubber, raw
or processed textile fibers, rubber articles, wood manufactures, residual petroleum products,
etc.
In another study, Mukherji8 had identified a number of products with high potential trade
between pairs of SAARC countries on the basis of supply capabilities and market size. Some
of the products with India as a supplier and Bangladesh as a market, included cotton-not
carded or combed, petroleum oils, and denim fabrics of cotton, etc. Bangladeshi products
with high export potential for the Indian market included urea, anhydrous ammonia, bovine
and equine leather, etc. Similarly, as a supplier to the Sri Lankan market, the potential export
products of India included petroleum oils, diamonds non-industrial, denim fabrics of cotton,
etc. On the other hand, Sri Lanka’s potential export products to the Indian market included
diamonds, non-industrial parts and accessories of automatic data processing machines,
diamonds-non-industrial un-worked. Pakistan’s export potential for the Indian market
included instruments and appliances used in medicine, petroleum oils from bitumen, cotton
not carded or combed, etc.
From the Table 4 it is apparent that the items exported by India to an individual SAARC
Member country are different than the items which are imported to India from them.
However, there are certain sectors where the two-way trade is taking place (e.g. iron and steel
products, machinery and equipments and yarns & fabrics). This scenario can be best
explained by the fact that each country is exporting to the other a specialized product (at
7 Mukherji I.N. (2005): Regional Trade Agreements in South Asia, South Asian Yearbook of Trade and Development, CENTAD. 8 Mukherji I.N. (2000): Charting a Free Trade Area in South Asia: Instruments and Modalities.
25
different 6 or 8-digit HS Level). This may also mean that the industries in these countries are
also in a process of establishing a backward-forward linkage amongst themselves. In one way
this explains that there is an existence of some complementarity between India and other
SAARC Nations.
Likewise there is an existence of services trade in the SAARC region, especially between
India and its neighbouring countries. Most of this trade is through informal channel. There is
no official statistics on sector-wise services trade, but the fact that the nationals of
Bangladesh, Bhutan and Nepal travel to India for education or medical treatment is well
known. Workers of Bangladesh come to India to do skilled/unskilled work. Studies have
shown that the SAARC Member Countries have revealed comparative advantage in different
sectors covering transport, travel and other services (Mukherji 20059). It is observed that
while Pakistan and Sri Lanka have comparative advantage in transport services, Maldives has
this advantage in travel and tourism, while India’s advantage lies on other services which are
essentially IT and IT enabled services (ITES).
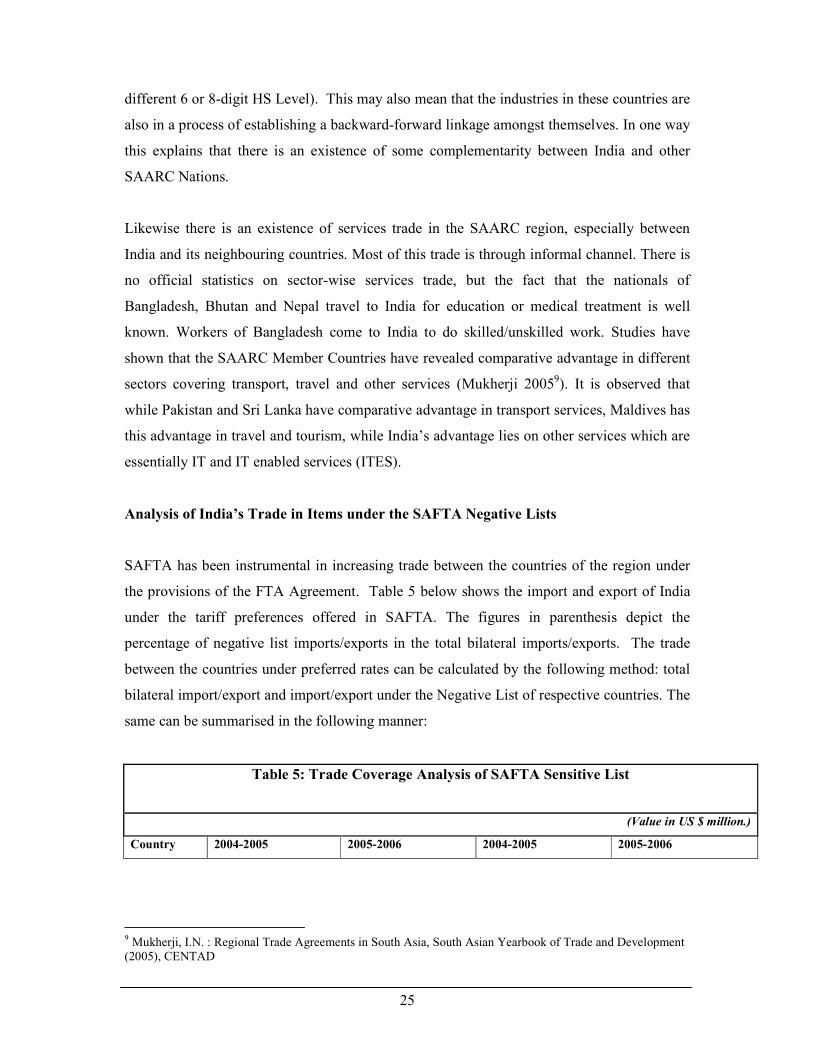
Analysis of India’s Trade in Items under the SAFTA Negative Lists
SAFTA has been instrumental in increasing trade between the countries of the region under
the provisions of the FTA Agreement. Table 5 below shows the import and export of India
under the tariff preferences offered in SAFTA. The figures in parenthesis depict the
percentage of negative list imports/exports in the total bilateral imports/exports. The trade
between the countries under preferred rates can be calculated by the following method: total
bilateral import/export and import/export under the Negative List of respective countries. The
same can be summarised in the following manner:
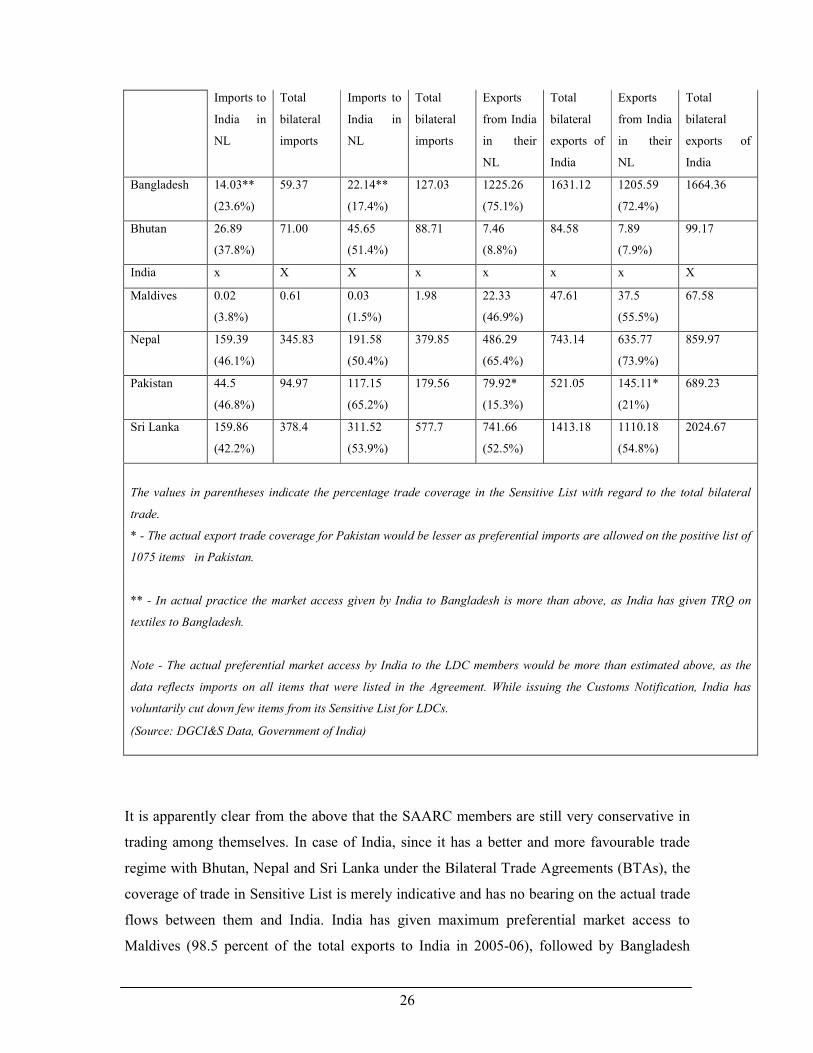
Table 5: Trade Coverage Analysis of SAFTA Sensitive List
(Value in US $ million.)
Country 2004-2005 2005-2006 2004-2005 2005-2006
9 Mukherji, I.N. : Regional Trade Agreements in South Asia, South Asian Yearbook of Trade and Development (2005), CENTAD
26
Imports to
India in
NL
Total
bilateral
imports
Imports to
India in
NL
Total
bilateral
imports
Exports
from India
in their
NL
Total
bilateral
exports of
India
Exports
from India
in their
NL
Total
bilateral
exports of
India
Bangladesh 14.03**
(23.6%)
59.37 22.14**
(17.4%)
127.03 1225.26
(75.1%)
1631.12 1205.59
(72.4%)
1664.36
Bhutan 26.89
(37.8%)
71.00 45.65
(51.4%)
88.71 7.46
(8.8%)
84.58 7.89
(7.9%)
99.17
India x X X x x x x X
Maldives 0.02
(3.8%)
0.61 0.03
(1.5%)
1.98 22.33
(46.9%)
47.61 37.5
(55.5%)
67.58
Nepal 159.39
(46.1%)
345.83 191.58
(50.4%)
379.85 486.29
(65.4%)
743.14 635.77
(73.9%)
859.97
Pakistan 44.5
(46.8%)
94.97 117.15
(65.2%)
179.56 79.92*
(15.3%)
521.05 145.11*
(21%)
689.23
Sri Lanka 159.86
(42.2%)
378.4 311.52
(53.9%)
577.7 741.66
(52.5%)
1413.18 1110.18
(54.8%)
2024.67
The values in parentheses indicate the percentage trade coverage in the Sensitive List with regard to the total bilateral
trade.
* - The actual export trade coverage for Pakistan would be lesser as preferential imports are allowed on the positive list of
1075 items in Pakistan.
** - In actual practice the market access given by India to Bangladesh is more than above, as India has given TRQ on
textiles to Bangladesh.
Note - The actual preferential market access by India to the LDC members would be more than estimated above, as the
data reflects imports on all items that were listed in the Agreement. While issuing the Customs Notification, India has
voluntarily cut down few items from its Sensitive List for LDCs.
(Source: DGCI&S Data, Government of India)
It is apparently clear from the above that the SAARC members are still very conservative in
trading among themselves. In case of India, since it has a better and more favourable trade
regime with Bhutan, Nepal and Sri Lanka under the Bilateral Trade Agreements (BTAs), the
coverage of trade in Sensitive List is merely indicative and has no bearing on the actual trade
flows between them and India. India has given maximum preferential market access to
Maldives (98.5 percent of the total exports to India in 2005-06), followed by Bangladesh

27
(83.6 percent of the total exports to India in 2005-06). However, Maldives and Bangladesh
have not given meaningful preferential market access to India as the coverage of preferential
trade (India’s exports to them) are 44.5 percent and 25.4 percent respectively, during the
same period. From the above it would also appear that Pakistan has given to India more better
preferential market access than what India has offered to Pakistan (79 percent vis-à-vis 44.8
percent) . This however, may not reflect a true picture since the actual exports from India to
Pakistan is governed by Pakistan’s import policy regime of positive list of 1075 items only.
Therefore one would need to examine carefully the trade coverage on these 1075 items.
For India, between 2004-05 and 2005-06, the share of non-negative list exports to countries
other than Bangladesh and Bhutan decreased, as depicted by the export figures of the table.
In both periods India has allowed greater preferential market access than it received from
countries like Bangladesh, Nepal, Maldives and Sri Lanka. On the other hand, Pakistan and
Bhutan had lesser preferential market access to India than they conceded in the same period.
From Table 5 it is evident that India experienced favourable terms of terms of trade with the
rest of the countries of South Asia in both 2004-05 and 2005-06. Even though, India’s trading
partners are improving their exports to India, they are accounting for more imports from India
as well, thereby widening the trade gap. The trade gap reduced, even though minimally, for
Bangladesh and Bhutan between 2004-05 and 2005-06. The rest of the countries had higher
negative trade gaps in the same period. Therefore there is huge potential to improve trade
between South Asian countries.
The above estimates are only on the basis of trends of bilateral trade. However, the actual
potential would be only known if the global trade volumes on the items in the Sensitive Lists
are evaluated. For example, only about 1.5 percent of Maldives and 17.4 percent of
Bangladesh exports to India are under Sensitive list. However, on these items Bangladesh or
Maldives may have much greater value of global exports, then in that case, if these items are
removed form India’s Sensitive List, their exports to India may increase several times. To
assess the significance of SAFTA for Bangladesh and Maldives and to assess the extent to
which India provides meaningful market access to these LDCs, the global export values were
examined and the top traded items were matched with India’s sensitive list of SAFTA. The
top 20 items at 6-digit HS level that India imports from Bangladesh and Maldives and their
28
top 50 global export items were examined, in this regard. A comparison has been made with
India’s SAFTA sensitive list for LDCs. The list of these items is given in Annexure – III.
India’s total imports from Bangladesh during the period 2005-06 were US$127.03mn. Top 20
items that were imported from Bangladesh amounted to US$60.16mn (47 percent of the total
imports from Bangladesh). Out of these 20 items there are 10 items which are in India’s
sensitive list for LDCs under SAFTA. These 10 items constitute US$9.25mn and represent
7.28 percent of the total imports from Bangladesh. These figures reflect that substantial
market access has been given to Bangladesh under SAFTA. However, this scenario changes
if one looks at Bangladesh’s global exports. The top 50 items of Bangladesh’s global exports
in the year 2004 (UNCTAD) constitutes US$6.7bn (81.11 percent of its global exports,
US$8.26bn), mainly items of textiles & textile materials, and shrimp. Therefore, under
SAFTA a preferential market access to Indian market on items where Bangladesh has global
comparative advantage is limited. Out of these top 50 items, 31 items (comprising US5.7$bn,
equivalent to 69 percent of their total global exports) are in India’s sensitive list for SAFTA
LDCs. Of these 31 items, on 29 items relating to textiles and textile products, India has given
a preferential market access through TRQ of eight million pieces, the remaining two items
are in effective Sensitive List. Bangladesh’s exports of these two items are worth US$3.93bn,
which is 47.5 percent of its total global exports. Removal of these items from India’s
sensitive list would entail larger market access benefits to Bangladesh.
A similar exercise was carried out for Maldives. Of their top 12 items which they export to
India (US$1.98mn, comprising 100 percent of their exports) there is only one item which is
in India’s Sensitive List under SAFTA (insignificant import value). Maldives total exports is
worth US$135.603mn and their top 27 items cover almost 100 percent of their total exports.
There are only four items which are in India’s Sensitive List and the total imports from
Maldives is to the tune of US$0.861mn, i.e. 0.5 percent of its total global exports. Therefore,
substantial market access is already available to Maldives under SAFTA.
From the above analysis, it appears very clear that reduction in the size of Sensitive List of
India, especially the items relating to fisheries and textiles and textile products would provide
larger benefit to Bangladesh. An analysis was also made on SAARC Members’ global export
commodities. Their respective global export and import composition can be summarized in
the following manner.
29
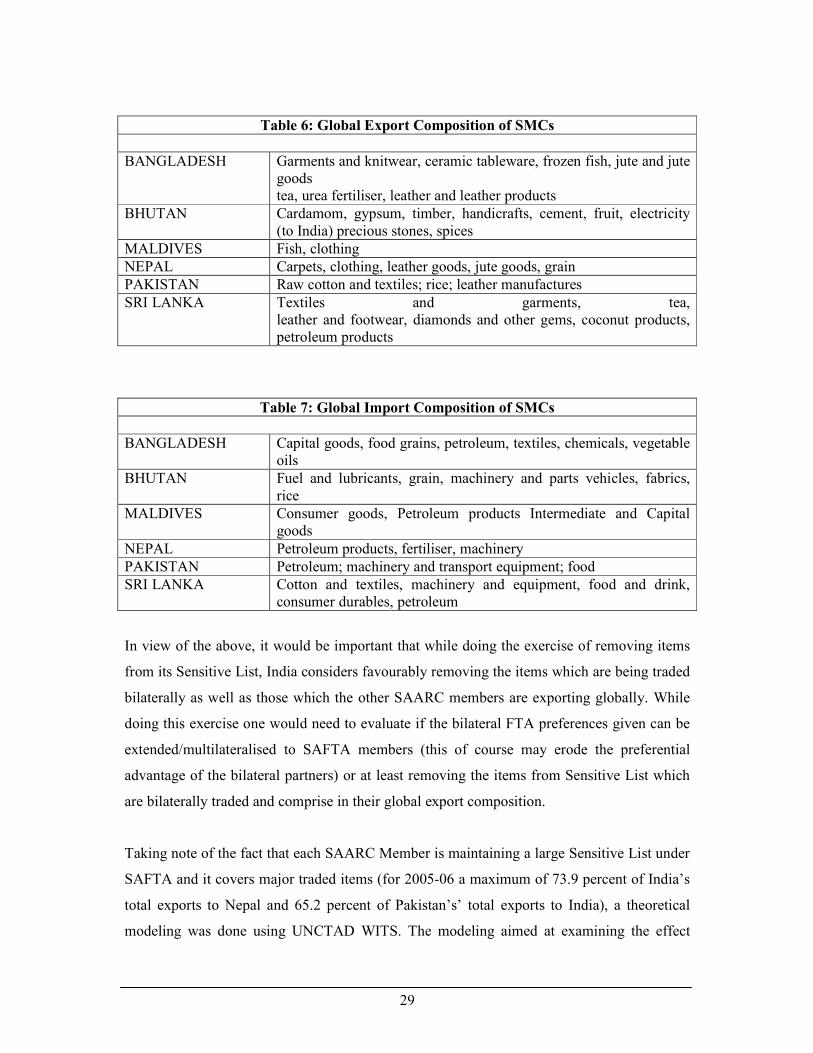
Table 6: Global Export Composition of SMCs
BANGLADESH Garments and knitwear, ceramic tableware, frozen fish, jute and jute goods tea, urea fertiliser, leather and leather products
BHUTAN Cardamom, gypsum, timber, handicrafts, cement, fruit, electricity (to India) precious stones, spices
MALDIVES Fish, clothing
NEPAL Carpets, clothing, leather goods, jute goods, grain
PAKISTAN Raw cotton and textiles; rice; leather manufactures
SRI LANKA Textiles and garments, tea, leather and footwear, diamonds and other gems, coconut products, petroleum products
Table 7: Global Import Composition of SMCs
BANGLADESH Capital goods, food grains, petroleum, textiles, chemicals, vegetable oils
BHUTAN Fuel and lubricants, grain, machinery and parts vehicles, fabrics, rice
MALDIVES Consumer goods, Petroleum products Intermediate and Capital goods
NEPAL Petroleum products, fertiliser, machinery
PAKISTAN Petroleum; machinery and transport equipment; food
SRI LANKA Cotton and textiles, machinery and equipment, food and drink, consumer durables, petroleum
In view of the above, it would be important that while doing the exercise of removing items
from its Sensitive List, India considers favourably removing the items which are being traded
bilaterally as well as those which the other SAARC members are exporting globally. While
doing this exercise one would need to evaluate if the bilateral FTA preferences given can be
extended/multilateralised to SAFTA members (this of course may erode the preferential
advantage of the bilateral partners) or at least removing the items from Sensitive List which
are bilaterally traded and comprise in their global export composition.
Taking note of the fact that each SAARC Member is maintaining a large Sensitive List under
SAFTA and it covers major traded items (for 2005-06 a maximum of 73.9 percent of India’s
total exports to Nepal and 65.2 percent of Pakistan’s’ total exports to India), a theoretical
modeling was done using UNCTAD WITS. The modeling aimed at examining the effect
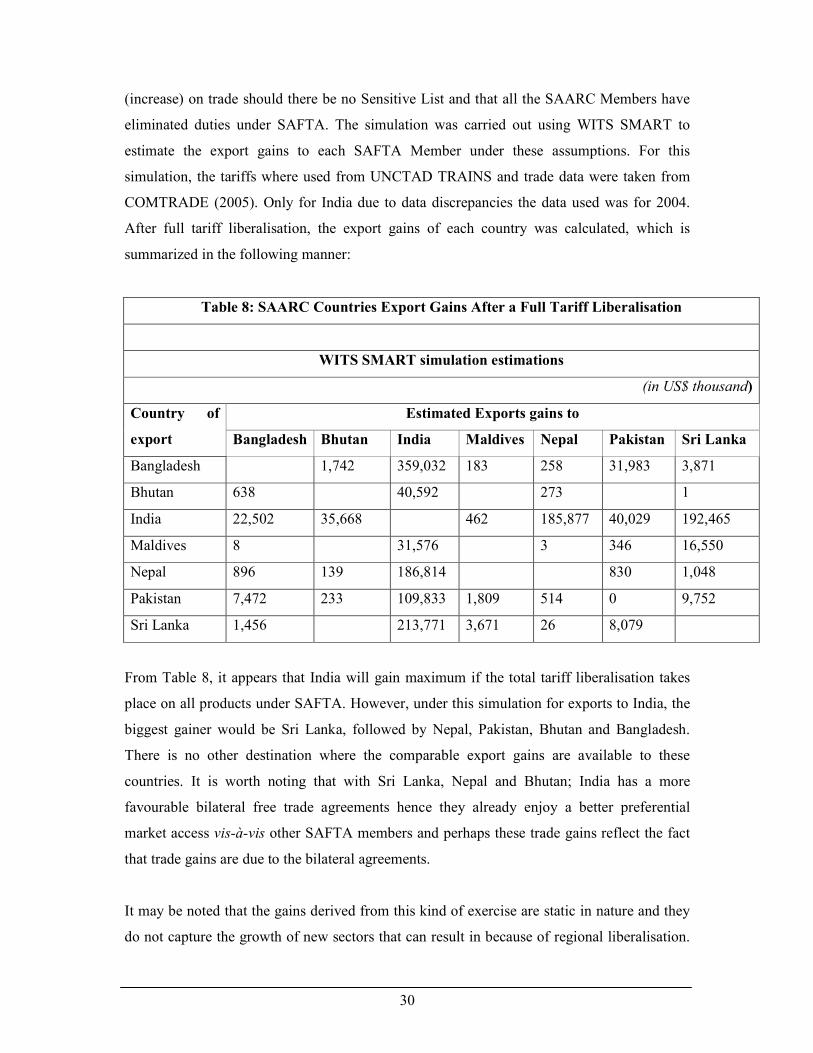
30
(increase) on trade should there be no Sensitive List and that all the SAARC Members have
eliminated duties under SAFTA. The simulation was carried out using WITS SMART to
estimate the export gains to each SAFTA Member under these assumptions. For this
simulation, the tariffs where used from UNCTAD TRAINS and trade data were taken from
COMTRADE (2005). Only for India due to data discrepancies the data used was for 2004.
After full tariff liberalisation, the export gains of each country was calculated, which is
summarized in the following manner:
Table 8: SAARC Countries Export Gains After a Full Tariff Liberalisation
WITS SMART simulation estimations
(in US$ thousand)
Estimated Exports gains to Country of
export Bangladesh Bhutan India Maldives Nepal Pakistan Sri Lanka
Bangladesh 1,742 359,032 183 258 31,983 3,871
Bhutan 638 40,592 273 1
India 22,502 35,668 462 185,877 40,029 192,465
Maldives 8 31,576 3 346 16,550
Nepal 896 139 186,814 830 1,048
Pakistan 7,472 233 109,833 1,809 514 0 9,752
Sri Lanka 1,456 213,771 3,671 26 8,079
From Table 8, it appears that India will gain maximum if the total tariff liberalisation takes
place on all products under SAFTA. However, under this simulation for exports to India, the
biggest gainer would be Sri Lanka, followed by Nepal, Pakistan, Bhutan and Bangladesh.
There is no other destination where the comparable export gains are available to these
countries. It is worth noting that with Sri Lanka, Nepal and Bhutan; India has a more
favourable bilateral free trade agreements hence they already enjoy a better preferential
market access vis-à-vis other SAFTA members and perhaps these trade gains reflect the fact
that trade gains are due to the bilateral agreements.
It may be noted that the gains derived from this kind of exercise are static in nature and they
do not capture the growth of new sectors that can result in because of regional liberalisation.

31
The case in point could be illustrated by the exponential growth in exports of Vanaspati and
copper from Sri Lanka to India under the bilateral FTA. Let us assume that this simulation
can accurately predict the effect of trade on liberalization of all items in the Sensitive List of
India. As per this model, the total increase in India’s imports from SAARC members would
be to the tune of US$477.003mn, which is only 0.25 percent of its current total global imports
(2006-2007). Would it therefore be too worrying for India to remove the items from its
Sensitive List, especially for items of export interest to the LDCs? Another issue which
would need consideration is TRQ of eight million pieces for garments to Bangladesh. Given
the fact that Bangladesh’s principal item of global export is garments the figure of eight
million pieces does not provide greater market access opportunity to the Bangladesh’s
exporters.
A similar situation may be noticed if one examines the sensitive list of other SAFTA
member. It is therefore imperative that given its location, economic condition and size of its
market, India plays a major role in making SAFTA a success by providing greater
opportunities to other SAARC members, especially the LDCs. It is, therefore, very important
that the scope of SAFTA is deepened by reducing the size of Sensitive List, unilaterally or
after negotiations and widened to enable other members of SAARC to increase their share of
exports to India as well as other SAARC members.
5. Role of India in SAFTA: What does the Literature Say?
Thought South Asia has not achieved the required economic growth and prosperity as
compared to other economic regions such as Europe, North America and South East Asia, it
has great economic strength in terms of its market potential (one third of humanity resides in
this area) and in terms of the rich natural resources and capable human resources. South
Asian countries, with the highest number of poor in the world, cannot afford to keep SAARC
as a meaningless coalition. The need of the hour is to make SAARC a strong economic bloc,
setting aside bilateral disputes. Under these circumstances, progress towards SAFTA is very
important. To reap the benefits of increased regional trade, however, all SAARC states have
to prepare themselves for the new challenges of the free trade area. The importance of India
in ensuring the success of SAFTA is derived both from the country’s geographic position at
the centre of the region and the size of its economy. The studies show that without open
32
trade involving India, the prospects of SAFTA being meaningful in enhancing trade is
limited.
This view is reiterated by Mukherji10 (2000) who underlined the importance of India in
ensuring any South Asia wide regional arrangements through an exhaustive analysis of trade
liberalisation under SAPTA. The analysis uses different criteria like the product coverage,
trade value coverage, revenue forgone criterion depict the possible role of India in improving
the intra- regional trade in the area. He contents that India has offered concessions on
maximum number of products and may incur the maximum revenue loss due to the
concession offered to other members of SAPTA.
However, studies by Baysan et.al,11 (2006), Pitigala12(2005) and Srinivasan13 (2001) draws
from both existing literature and own analysis to argue that an economic case for a free trade
area in South Asia is relatively weak due to reasons like the small size of the economies
(other than India), lack of openness and higher transaction costs of doing formal trade.
Baysan, et.al (2006), holds the view that political rather than economic reasons were behind
the creation of the SAFTA, a view finds echo in other studies as well. The paper argues that
the trade preferences under SAFTA may be more trade diverting than trade creating. In order
to limit the potential adverse effects and maximize the benefits of SAFTA, the countries of
the region are advised to:
• take steps to minimize the sectoral/product exceptions;
• have ‘rules of origin’ that are very liberal, simple, transparent, and remain the same
for all products;
• have clear rules against tariff-rate quotas; and
• India and Pakistan move to MFN-based trade
10 Mukherji, Indra Nath (2000), Charting a Free Trade Area in South Asia: Instruments and Modalities, in Srinivasan T.N., Trade, Finance and Investment in South Asia, Social Science Press:New Delhi 4 Tercan Baysan, et.al (2006) Tercan Baysan, Arvind Panagariya, and Nihal Pitigala(2006) PREFERENTIAL TRADING IN SOUTH ASIA, World Bank Policy Research Working Paper 3813, World Bank: Washington DC
12 Pitigala, Nihal (2005) What Does Regional Trade in South Asia Reveal about Future Trade Integration?: Some Empirical Evidence, World Bank Policy Research Working Paper 3497, World Bank: Washington D C 13 Srinivasan, T. N (2001). Preferential Trade Agreements with Special Reference to Asia . available at http://www.econ.yale.edu/~srinivas/PrefTradeAgreements.pdf
33
The analysis of the impact of bilateral trade within the region on the regional process is
highlighted by case studies of India-Bangladesh trade (World Bank, 2006)14 and India-Sri
Lanka Bilateral FTA (Kelagama & Mukherji15, 2007, Baysan et.al, 2006). The World Bank
(2006) study asserts that Bangladesh is the only relevant beneficiary of India’s LDC-only
SAPTA preferences. It also tests the possible scenarios of trade and concludes that due to
lower levels of economic liberalisation and productivity, Bangladesh may not register high
growth of exports to India. The SAPTA tariff preferences did not enable Bangladesh to
increase its exports to India as compared to its international competitors who faced higher
tariffs. The findings of the study point to a genuine lack of comparative advantage for
Bangladesh and in turn the other less developed countries of the region. Therefore, it is
important that there are higher tariff reductions from India for the rest of the South Asian
countries. in order the regional process to be effective.
On the other hand, an ex- post analysis by Kelagama & Mukherji, 2007 on the Indo-Sri
Lanka Bilateral FTA (ISLFTA) records increase in two way trade during the period of
analysis. The boom in preferential exports under ISLFTA resulted in India becoming the third
largest export destination for Sri Lanka since 2003, where as it was only 16th largest in 2000.
According to the authors, there is trade creation and entry of new goods into the Indian
market through the preferential route offered by the ISLFTA.
Bysan et.al (2006) find that bilateral trade between India and Sri Lanka rose dramatically
despite the apparent limited grant of preferences by the two sides, especially in goods
covered by preferential tariffs. Much of the expansion of bilateral trade between India and Sri
Lanka since the FTA comes from new products that were not previously exported by Sri
Lanka to India at all. The paper vests the responsibility with the process of negotiation of
FTAs, where in existing imports from the partner country face higher political economy
pressures to be left out of the liberalization process and goods that the partner country does
not supply at the time of the negotiations do not pose an obvious threat and therefore manage
14 World Bank (2006), India-Bangladesh Trade, Trade Policies and Potential Free Trade Agreement, World Bank: Washington D C 15 Saman Kelegama and Indra Nath Mukherji (2007) India-Sri Lanka Bilateral Free Trade Agreement: Six Years Performance and Beyond, Research and Information Systems for Non-Aligned and Other Developing Countries, Discussion Paper 119, New Delhi: RIS

34
to receive significant preferences. In fact the traditional exports items lost the share in total
exports dramatically from 50 percent in 1999 to just 19 percent in 2002.
The analysis of the literature suggests a peculiar trend and forces one to conclude that South
Asia could be a nadir of trade analysts. Almost all the ex-ante analysis like Pitigala(2005),
Srinivasan (2001) and World Bank(2006) on trade within the region has been proven wrong
by increased trade volumes in the successive years and ex-post analysis. This is further
reinforced by the findings of the present study that also offers a preliminary analysis of trade
data during the period SAFTA has been in operation.
From the above studies, it becomes amply clear that the trade analysts have a divided opinion
on SAFTA. However, each analysis has taken into account the pre-SAFTA developments and
the real evaluation could be made only when the actual trends of trade have become
available. Despite having vast natural resources in this region, the failure to utilise them
optimally and efficiently has led some analysts to believe that no trade complementarity
exists amongst the SAARC nations. Another reason that substantiates this argument is the
belief that SAFTA is in existence due to political objectives of SAARC and not due to the
economic logic.
One would be encouraged to note that even the trade on items under the sensitive list is also
growing. Therefore, if the objective of creating sensitive list was to protect domestic industry
through retarding import growth, India’s sensitive list has fallen short of their objectives. It
further shows that there are inherent potential to trade within the region even if minimal
impetus were offered in terms of reduced tariff. Therefore, it will be worth exploring
accelerated reduction of tariff and elimination of negative lists under SAFTA to encourage
trade in the South Asian region. However, the question remains whether this increase in trade
is the result of diversion of trade from other regions or genuine trade creation, which needs
further analysis and is beyond the scope of this paper.
The data shows that except for Pakistan, the major share of India’s exports to the SAFTA
countries is under the negative lists of respective countries. This can be viewed in two ways:
a) That the negative lists effectively captured the most traded items, and
b) The negative lists are ineffective in checking trade.
35
This provides an indication to the SAARC member countries that reducing the size of the
sensitive list would be in the overall interest and has the potential for increasing intra-regional
trade.
Other than protecting the domestic industries another major reason could be to minimise the
likelihood of loss of revenue due to preferential tariff on highly traded items. Another reason
given by some of the SAARC member countries is to attract investments on items in the
sensitive list. During discussions, several delegations have expressed their views that an item
is kept in their sensitive list so that inward investment flow in the future accrues to them. If
tariffs are eliminated on these items, no FDI will come to them in these sectors. However,
one of the reasons for the growth in the exports on items which are in the sensitive list could
be attributed to the price comparative advantage that comes to SAARC member countries due
to their geographical proximity. If the hurdles in the form of sensitive lists are eliminated,
there could be higher volume of trade flows within the region, provided the SAFTA tariffs
and import requirements remain lower compared to those for the rest of the world.
The studies have also pointed out that the RoO should be simple and easy to operate. To this
effect, SAFTA has been successful in addressing this issue. The Product Specific Rules,
which are complicated and often used as trade policy instrument, are only on 190 items, and
on all other products the General Rule prevails. There is also a provision for lesser value
addition threshold for LDCs (30 percent) and Sri Lanka (35 percent). There is no doubt that
tremendous potential and opportunity exists in SAARC to promote intra-regional trade &
investment flows. The advantage of geographical proximity has also not been optimally
utilized so far. At the same time some of the impediments to the trade relate to the issues of
non-tariff barriers and infrastructural bottlenecks. Despite all these factors, the fact of the
matters is the volume of trade in SAARC is in rise for the last couple of years, which is a
positive sign. The increased trade flows justify that the complementarity also exists among
the SAARC nations in several sectors, however, one of the pre-conditions to make this
grouping successful is to believe in themselves to trade among themselves.
The studies that point to the limitations of SAFTA also highlight the conditions that would be
required for turning SAFTA into a successful regional grouping. From the diverse literature
available, it can, therefore, be concluded that SAFTA does have significant trade potential,
particularly in an environment which is increasingly becoming liberalised with the economies

36
of the region opening up slowly to external competition. The potential, however, can be
realized in a meaningful manner if the product exceptions are limited, NTBs to trade are
removed and transaction costs reduced through simpler and transparent procedures, as is
rightfully argued in some studies.
6. Non-Tariff Barriers: Addressing them to Ensure Secured Market Access
Non Tariff-Barriers (NTBs) are evolving as an area of serious concern to the developing
countries. The benefits of reduction in tariffs may be impeded due to various non-tariff
related barriers. Under the current Doha Round negotiations, removal/elimination of NTBs
are now at the core of discussions, though the term “Non-Tariff Barriers” has not been clearly
defined under the WTO. However, this is not to say that there is not any requirement for
addressing these issues under the regional and bilateral trade liberalisation initiatives taken by
countries. Whether under the MFN or preferential trade, existence of NTBs not only limits
trade between the RTA members, unless addressed directly, they also defy the primary
purpose engaging in the activity which is enhancing intra-regional trade between the treaty
partners.
Table 9: Types of Non-Tariff Barriers
i. Import Policy Barriers
ii. Standards, Testing, Labeling and Certification requirements
iii. Anti-dumping & Countervailing Measures
iv. Export Subsidies and Domestic Support
v. Government procurement
vi. Services barriers (including those on Movement of Natural Persons)
vii. Lack of adequate protection to Intellectual Property Rights
viii. Other barriers
Import Policy Barriers
One of the most commonly known NTB is the prohibition or restrictions on imports
maintained through the import licensing requirements. Article XI of the General Agreement
on Tariff and Trade (GATT) requires WTO Members not to impose any prohibitions or
37
restrictions other than duties, taxes or other charges, whether made effective through quotas,
import or export licences or other measures for any reason, other than specified exceptions.
Any form of import licensing (other than an automatic license) is, therefore, to be considered
as an import restriction.
Certain restrictions on imports can also be imposed in accordance with Article XX of the
GATT 1994. Similarly, Article XVIII (B) of the GATT allows import restrictions to be
maintained on grounds of ‘Balance of Payment’ (BOP) problems. Presently only six
countries maintain import restrictions on account of BOP problems. They are: Bangladesh,
Nigeria, Pakistan, the Philippines, Sri Lanka and Tunisia. Some agricultural products also
suffer from quota regimes. These restrictions can be used as a tool to restrict the market
access opportunities.
Standards, Testing, Labeling & Certification Requirements
The agreement on the application of SPS measures and the agreement on TBT, deal with the
trade related measures necessary to protect human, animal or plant life or health, to protect
environment and to ensure quality of goods. Standards, Testing, Labelling and Certification
requirements are insisted upon for ensuring quality of goods seeking an access into the
domestic markets but many countries use them as protectionist measures.
Both the agreements also envisage special and differential treatment to the developing
country Members taking into account their special needs. However, the trade of developing
country Members has often faced more restrictive treatment in the developed countries where
barriers have often been raised against developing countries on one pretext or the other.
Anti-Dumping & Countervailing Measures
Anti-dumping and countervailing measures are permitted by the WTO Agreements in
specified situations to protect the domestic industry from serious injury arising from dumped
or subsidized imports. The way these measures are used may, however, have a great impact
on the exports from the targeted countries. When used as protectionist measures, they act as
some of the most effective NTBs. The number of anti-dumping investigations in the recent
past has increased manifolds. Not every investigation results in the finding of dumping and/or
38
injury to the domestic industry. But the period for which the investigations are on, and this
period may be up to 18 months, the exports from the country investigated suffer severely.
Anti-dumping and countervailing duties being product specific and source specific, the
importers will prefer switching over to other sources of supply.
Export Subsidies & Domestic Support
Both export subsidies and domestic support have a great bearing on the trade competitiveness
of other countries. While export subsidies have the effect of displacing exports from other
countries into the third country markets, domestic support acts as a direct barrier against
access to the domestic market of trade partners and also indirectly impinge on the export
competitiveness of other’s products into third country markets. Generally, the developing
countries lack resources to grant subsidies or domestic support.
Procurement
Government procurement and bulk procurement policies followed by some of the countries
act as an NTB, since they follow the peculiar purchasing practices in the government sector,
which are neither transparent nor uniform.
Services Barriers
Some of the measures which fall in this category include restrictive visa regimes maintained
by nation states, the local sponsorship requirement for visas, stringent and often
discriminatory qualification and licensing/certification requirements and procedures in host
countries, citizenship and nationality requirements for delivery of professional services, lack
of transparency in standards and other mandatory requirements, etc.
Lack of Adequate Protection to Intellectual Property Rights
Lack of adequate protection to Intellectual Property Rights (IPRs) in some countries hurts the
exports of other countries. For example, piracy of motion pictures, video cassettes, audio
cassettes, computer software etc., is widely practiced in a large number of countries.
Other Barriers
39
Some of the other main NTBs are discriminatory on account of use of child labour,
investment barriers, language barriers, Super and Special 301 measures under the Omnibus
Trade Act by the US etc. In particular, use of labour and environmental standards is
increasingly growing and has become a matter of serious concern in many countries.
Impact of NTBs
The WTO trade data report has recognized that developing countries are increasingly
becoming important players in world trade. In the last decade, their share in world
merchandise exports increased from 17 percent to 27 percent. Intra-regional trade within
developing countries is also rising. Yet, existence of and increasingly strident use of NTBs
hamper key developing country exports, making it difficult for them to take full advantage of
the benefits of increasing global integration and trade liberalisation. Furthermore, it has been
found that NTBs are most prevalent in merchandise products and sectors identified relatively
frequently as having potential for helping spur and sustain future export growth of developing
countries, viz. textiles and apparel, fish and fisheries products, chemicals and
pharmaceuticals, information technology (IT) products, and electrical and other heavy
machinery.
An analysis of the disputes in the WTO indicate that the NTBs that registered the highest
number of disputes presented by developing countries pertain to trade remedies (43 cases),
quantitative restrictions (18 cases), customs and administrative barriers (13 cases), and
charges on imports (12 cases). There are also a not insignificant number of cases in the area
of technical barriers to trade (TBTs, 9 cases) and government participation in trade (7
barriers). The number of cases against customs and administrative procedures increased
fourfold in the period 2000-2004 with respect to the period 1995-1999. Substantial increases
are also evident for cases on trade remedies (50 percent), charges on imports (50 percent),
and SPS measures (100 percent). By contrast, cases regarding quantitative restrictions (QR)
decreased significantly (by two thirds) during this period of time.
India, being a WTO member, can not use the non-tariff restrictions which are contrary to its
WTO GATT obligations. Some of such regulations that India maintains are State Trading
Enterprises, Tariff Rate Quotas (TRQs), technical standards and regulations, SPS, other
40
health and (environmental) safety regulations, etc. Important regulations that govern imports
under the present Foreign Trade Policy can be summarised in the following manner:
(i) State Trading Enterprises: The products which are traded in bulk, the imports
are governed through the State Trading Enterprises (STEs). Some of the examples are urea
and fertiliser, and refined petroleum products.
(ii) Tariff Rate Quotas: Items like powdered milk, crude sunflower and safflower oils,
refined rape, colza and mustard oil; are allowed to be imported through global quota. These
are compatible with India’s WTO commitments under Agreement on Agriculture. Likewise
preferential imports of tea and textile items under the ISLFTA; textiles imports from
Bangladesh under SAFTA etc., are governed under TRQs. The TRQs allow only a limited
market access opportunities to the exporting countries. The export procedures are
cumbersome and time consuming and thereby making exports costly.
(iii) Technical standards and regulations (administered by BIS): These are used on
approximately 150 products and product groups that are or have been on the list include food
ingredients, powdered milk and other milk products, cements, steel tubes, steel sheets and
other steel products, X-ray equipment, gas cylinders, dry batteries, electrical equipment, and
household electrical appliances. The key deterrents to imports in this system are the
obligation on the foreign manufacturer to establish an Indian office, the required visits to the
foreign factories by BIS inspectors, and in the case of Indian importers, the requirement to
establish their own testing laboratories and the discretion of the BIS to pre-certification of
components and visits to the foreign factories. Apart from the cost of all these procedures,
there is obviously considerable potential for delay when foreign visits and the establishment
of Indian branch or liaison offices are involved. One obvious way to change this outcome
would be action by BIS to accept international standards or standards in the exporting
countries, through mutual recognition agreements with them.
(iv) Sanitary and Phytosanitary (SPS) Rules: India continues to maintain import
licensing on approximately 500 items justified under the ‘need to ensure human, animal or
plant life or health’. Currently imports of nearly all livestock, agricultural, and food products
require some kind of phytosanitary or sanitary certificate issued under the general supervision
of the Ministry of Agriculture. Though these regulations reflect legitimate national concerns,
they have considerable potential to restrict imports. It would be necessary that the Indian
authorities do the risk analysis (as prescribed and allowed under the SPS Agreement) on
priority basis on items that are of SAFTA members’ export interests.

41
As has been discussed earlier, the tariff liberalisation on goods alone, as prescribed presently
under SAFTA may not achieve the desired results more so because the intra-SAARC trade is
approximately five percent of their total global trade. The fact that the intra-regional trade is
less, illustrates that one would need to have a closer look to identify the exact reasons for
such a low trade flow. Is it because of non-tariff barriers, lack of infrastructural support at
border, lack of supply side constraints or any other reason? It is, therefore, very important
that India identifies country-specific constraints and addresses through mutual cooperation.
7. India’s Engagements in Other RTAs vis-à-vis SAFTA
In the past, India had adopted a very cautious and guarded approach to regional arrangements
and was initially engaged in only a few bilateral/regional initiatives, mainly through
Preferential Trading Arrangements like the Bangkok Agreement (signed in 1975 now known
as ‘Asia Pacific Trade Agreement’) to exchange tariff concessions in the ESCAP region, the
Global System of Trade Preferences (GSTP - signed in 1988) to exchange tariff concessions
among G-77 member countries, and the SAARC Preferential Trading Arrangement (SAPTA
- signed in 1993) to liberalise trade in South Asia. However, these engagements achieved
limited results in terms of increasing trade volumes with the member countries. With its
smaller neighbours like Bhutan and Nepal, India has free trade arrangements on a non-
reciprocal basis mainly with a view to ensuring social, economic and political stability across
the border. The first FTA was signed with Sri Lanka in 1998 and is in operation since March
2000. Here also Sri Lanka, being a small island neighbour, was given more flexibility in
terms of the size of the negative list and the period of tariff liberalisation.
Recognising that RTAs would continue to feature permanently in world trade, India got
engaged with its trading partners/blocs with the intention of expanding its export market and
began concluding, in principle agreements for moving in some cases towards a CECA which
covers FTA in goods (i.e. having a zero customs duty regime within a fixed time frame on
items covering substantial trade and a relatively small negative list of sensitive items on
which no or limited duty concessions are available), services, investment and identified areas
of economic cooperation. Framework Agreements have already been entered into with a
number of trading partners with specific road maps to be followed and specified time frames
by which the negotiations are to be completed.
42
India has already concluded a CECA with Singapore, which has been implemented from
August 01, 2005. Framework Agreement on Comprehensive Economic Cooperation between
ASEAN and India, Framework Agreement for BIMSTEC FTA, India-Thailand Framework
Agreement have also been signed and FTA on Goods, Services and Investment are under
negotiation. Framework Agreements on economic cooperation followed by PTA have also
been entered into with MERCOSUR and Chile. India is also engaged with Gulf Cooperation
Council (GCC) and Mauritius for FTA/CEPA and. Separate Joint Task Force that have been
set up to negotiate a CEPA between India and Korea and India and Japan.
India has also taken its trade relations with the European Union to new heights. During the 6th
India-EU Summit held in New Delhi, it was decided to launch India-EU Joint Action Plan for
Strategic Partnership. Within the Joint Action Plan, a High Level Trade Group (HLTG) was
set up and it was mandated to explore ways and means to deepen and widen the Bilateral
Trade and Investment Relationship. The HLTG was also tasked with examining the
possibility of launching negotiations on a broad based Trade and Investment Agreement. It
was also decided that HLTG would report to the 2006 India-EU Summit to be held in
Helsinki in October, 2006. The 7th India-EU Summit held at Helsinki accepted the report of
the HLTG and agreed that both sides move towards negotiations. India and EU are now
negotiating a broad based bilateral trade and investment agreement.
The implications of SAFTA for India need to be viewed in this background of India’s current
engagements in several FTAs. While SAFTA, like any other FTA, has been entered into with
a view to enhancing the regional trade and investment flows between the countries by
providing better market access, the results would, inter-alia, depend upon the coverage and
depth of engagement in other RTAs. In this regard, it may be worth mentioning that India
has, in recent years, adopted a comprehensive approach towards RTAs. In all its RTAs it is
negotiating FTAs in goods, services, investments, bilateral safeguards, bilateral disputes, etc.
In these negotiations, through identified areas of economic cooperation it is pursuing its goal
to address the issue of NTBs on its export interest items, by obtaining MRAs, equivalence
and accreditation of its agencies etc. A summary of India’s RTAs and their scope of coverage
are as follows:
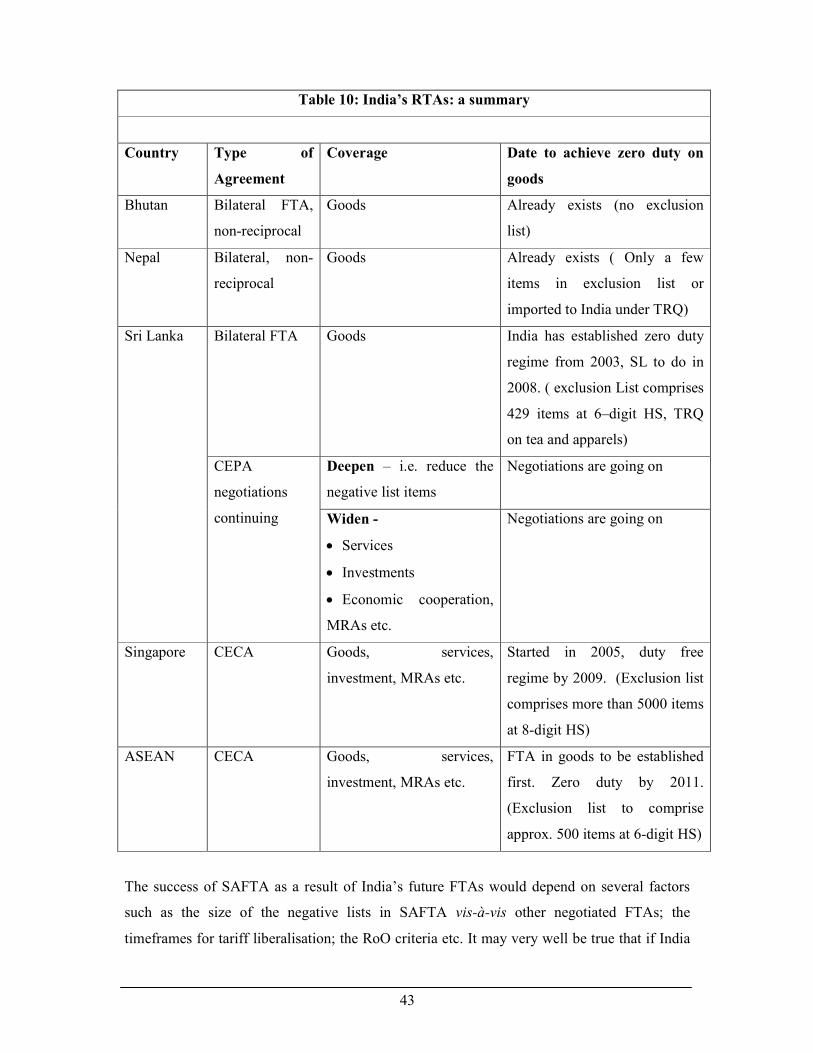
43
Table 10: India’s RTAs: a summary
Country Type of
Agreement
Coverage Date to achieve zero duty on
goods
Bhutan Bilateral FTA,
non-reciprocal
Goods Already exists (no exclusion
list)
Nepal Bilateral, non-
reciprocal
Goods Already exists ( Only a few
items in exclusion list or
imported to India under TRQ)
Bilateral FTA
Goods
India has established zero duty
regime from 2003, SL to do in
2008. ( exclusion List comprises
429 items at 6–digit HS, TRQ
on tea and apparels)
Deepen – i.e. reduce the
negative list items
Negotiations are going on
Sri Lanka
CEPA
negotiations
continuing Widen -
• Services
• Investments
• Economic cooperation,
MRAs etc.
Negotiations are going on
Singapore CECA Goods, services,
investment, MRAs etc.
Started in 2005, duty free
regime by 2009. (Exclusion list
comprises more than 5000 items
at 8-digit HS)
ASEAN CECA Goods, services,
investment, MRAs etc.
FTA in goods to be established
first. Zero duty by 2011.
(Exclusion list to comprise
approx. 500 items at 6-digit HS)
The success of SAFTA as a result of India’s future FTAs would depend on several factors
such as the size of the negative lists in SAFTA vis-à-vis other negotiated FTAs; the
timeframes for tariff liberalisation; the RoO criteria etc. It may very well be true that if India
44
and its future FTA partners get a better preferential market access in each other’s markets and
the tariff liberalisation period is shorter, the SAARC members may be locked out of Indian
market and the intra-SAARC trade flows would further decline. While several of India’s
ongoing engagements like ASEAN and BIMSTEC, cover free trade in goods, services and
investment, SAFTA is constrained by the fact that it covers only trade in goods.
The SAFTA treaty is subject to some serious constraints, each of which may be viewed in
comparison with India’s future FTAs, to assess the relative importance of SAFTA. First, the
Negative Lists of member countries are very long which points to the caution with which
they are opening up their economies, notwithstanding the BoP Measures (Article 15) and
Safeguard Measures (Article 16) incorporated in the text of the Agreement. This pre-empts a
large volume of regional trade under the Tariff Liberalisation Programme.
Second, the timeframe for tariff liberalisation as envisaged under the Agreement is fairly
long. The phase-out plan under the TLP provides the phase-out of customs of tariffs (zero to
five percent) for all non-LDCs in 7 (2013) years from the date of implementation (2006).
The phase-out period is eight years for Sri Lanka (2014) and for LDCs 10 years (2016).
Noting the pace of trade liberalisation has been faster under various competing bilateral,
regional and multilateral forays, the TLP under SAFTA could most likely become both
irrelevant and redundant.
Third, the non-inclusion of services and investment similarly pre-empts a significant share of
the intra-regional trade. A section on trade in services would be beneficial for SAARC
members especially for the LDCs. Unlike the concept on trade in goods where generally
exports are perceived as welfare enhancing, in services trade the import could be beneficial
for any SAARC member especially the LDCs. For example, import of Indian teachers to
Bangladesh or Nepal to teach English or Software programmes would be more cost effective
and welfare enhancing to Bangladesh or Nepal compared to the teachers coming from
developed countries. Similarly, opening up of branches of Indian business process
outsourcing (BPOs) or Financial Institutions would create better employment and other
business opportunities to them and the welfare aspect would be greater. Likewise an
agreement on investments would facilitate the intra-SAARC investment flows in several
sectors which would increase the manufacturing base of SAARC members, provide
45
backward-forward linkage among industries in the region. It would also facilitate the transfer
of technology, up-gradation of R&D activities etc.
Another implication which needs to be studied more seriously relates to India’s attempt to get
duty free market access through FTAs to other countries especially with whom presently the
SAARC LDCs are trading heavily. In some of the markets (like EU, Japan and US) the
SAARC LDCs are able to export majority of their products due to the duty-free quota-free
market access. If India enters into FTA with them and starts getting duty free market access,
the preferences of LDCs may be eroded. A case in point is export of textiles and textile
materials from Bangladesh to EU under Generalised System of Preferences (GSP). Once
India or other developing countries start getting equivalent concessions under FTAs, the
exports of Bangladesh may get adversely affected and Bangladesh may be locked out of the
market of EU.
On the basis of the WTO Hong Kong Ministerial decision, India is considering for granting
unilateral tariff preferences to all the LDCs. This Scheme, however, may exclude certain
items from the tariff concessions. It is not known when and how this Scheme will be
implemented, but given the fact that the Indian Prime Minister has announced fast-tracking
India’s duty-free regime for SAARC LDCs, the time frame for tariff elimination under the
unilateral scheme may be longer than for SAFTA LDCs. Therefore, the SAFTA window
would be advantageous to Bangladesh and Maldives. It would also be interesting to see what
would be size of exclusion list and RoO and what are the differences with SAFTA. Any
similarity would though give advantage to Bangladesh in terms of time frame, but ultimately
both the arrangements would harmonise after reaching the transition period of tariff
liberalisation, at least on those items where the tariffs would be reduced to zero.
Another important point that is to be noted is India’s tariff liberalisation on a multilateral
basis, either unilateral or under WTO (after successful conclusion of Doha Round) would
have a bearing on its FTA concessions including SAFTA as the difference between MFN
applied duty and preferential duty would become lesser. Bangladesh, though at present poised
against Nepal and Bhutan (as they are enjoying the duty-free market access to India), would
get better market access against other trading partners or other LDCs of other regions, namely
ASEAN. However, this situation would continue only till the transition period of each
respective agreement. As the preferential tariffs on products would become zero to other
46
LDCs, all the SAARC LDCs would be poised at par with other LDC. At that time, though the
SAARC LDCs would continue to have the advantage of their geographical proximity; to
some extent, there would be erosion of their market access opportunities.
Notwithstanding the shortcomings of the SAFTA Agreement, there is immense potential for
expanding trade within the region. South Asia, with a population of 1.4 billion, is expected to
be the biggest free trade area of the world. The region has been experiencing a GDP growth
rate of six to seven percent in the last five years. It has an increasing middle class of 400
million people – 200 million in India, 55 million in Pakistan, 45 million in Bangladesh, and
100 million in the other four member countries. All these indicators point to the immense
potential for these countries to expand their intra-regional trade, as the path towards the goal
of a free trade area and the pre-conditions under the SAFTA Treaty have been defined.
However, given the fact that there are several shortcomings in the Treaty, the need of the
hour is to identify them and rectify them to make the SAFTA a success. In order to prevent
SAFTA form becoming a failure, it is necessary to learn lessons from other regional
groupings, one such example is the AFTA. Coping with bilateral disputes separately, AFTA
took product coverage, investment, services and dispute settlement simultaneously for
opening up of regional trade.
8. Regionalism versus Multilateralism
India has always stood for an open, equitable, predictable, non-discriminatory and rule based
international trading system. RTAs, in India’s point of view, should be ‘building blocks’
towards the overall objective of trade liberalisation and should complement the multilateral
trading system. Some of the studies have pointed out that many factors, some are explicitly
stated and some are not so publicly admitted, have been responsible for the recent spurt in
regionalism. These are:
• A desire to obtain more secure, quick and preferential access to major markets.
• The pressures of globalisation, forcing firms and countries to seek efficiency through
larger markets, increased competition, and access to foreign technologies and
investment.
• Governments’ desire to maintain sovereignty by pooling it with others in areas of
economic management where most nation-states are too small to act alone.
47
• Governments’ wish to bind themselves to better policies and to signal such bindings
to domestic and foreign investors.
• A desire to jog the multilateral system into faster and deeper action in selected areas
by showing that the GATT/WTO was not the only game in town and by creating more
powerful blocs that would operate within the GATT/WTO system.
• A desire to help neighbouring countries stabilises and prospers, both for altruistic
reasons and to avoid spillovers of unrest and population.
• The fear of being left out while the rest of the world swept into regionalism, either
because this would be actually harmful to the excluded countries or just because “if
everyone else is doing it, shouldn’t we”?
Political considerations also feature in the decisions to establish RTAs, especially when
governments seek to consolidate peace and increase regional security as well as to acquire
greater bargaining power in multilateral negotiations by first tying in partner countries
through regional commitments.
India has been a late starter to FTAs, though it had been signatory to some of the very old
Preferential Trade Agreements like GSTP (UNCTAD initiative) and Bangkok Agreement.
These were signed to expand the market access for the developing countries on purely
economic reasons. These agreements, however, did not enhance the market access
opportunities for India. While some of the reasons given above are true for India others are
not. SAFTA was signed to reach twin objectives of generating political goodwill as well as
helping the neighbouring countries to prosper in the region by giving them greater market
access. India’s engagement with ASEAN is necessary given the present geo-political
developments in East Asia and enhancing the trade and investment linkages between India
and ASEAN. Its engagements with EU, Republic of Korea and Japan are with the aim to
secure greater preferential market access to enhance its trade and investment flows.
From a development perspective, the WTO remains the best-available forum to discipline the
use of trade-distorting policies. RTAs can complement the WTO efforts by cooperating on
behind-the-border policies, especially on regulation-intensive issues such as services, trade
facilitation, and the investment climate. Developing countries like India are likely to have the
greatest success in harnessing trade for growth and poverty reduction if they adopt a three-
48
pronged strategy that involves autonomous liberalisation, active multilateralism, and open
regionalism.
Apart from the debate about the reasons behind the recent surge in regionalism, there is
another big debate in the current international trade literature about whether regionalism can
help or hinder the multilateral trading system. The question is, whether regional trading
blocks are “building blocks” or “stumbling blocks” of the multilateral trading system. It is
interesting to note that most of the criticisms against the PTAs are labelled against the
regional or bilateral agreements where a developed country is involved in the treaty.
However, many developing countries are now looking for RTAs among themselves just to
avoid the frustration with the multilateral trading system. The dejection of developing
countries about the functioning of WTO is not unnatural because since the implementation of
the Uruguay Round agreements, these countries have not gained any meaningful increase in
market access in the key areas where they have comparative advantage (textiles and
agriculture). The overwhelming dominance of developed countries in the WTO decision
making process has not helped the cause of developing countries either. Given the failure of
WTO, it is clear that for developing countries the choice is between a multilateral trading
system which is extremely unbalanced and PTAs, mostly South-South PTAs, which help
these countries to expand market access without compromising on national policy autonomy.
It is not surprising that many developing countries are now looking for South-South PTAs to
expand their market access. These RTAs are likely to be beneficial for developing countries
because lower dependence on developed country markets will not only help these countries to
resist the pressures of hegemonic economic powers but also it will help them forge and foster
stronger South-South alliances at the multilateral trade negotiations. Given the fact that a
clear North-South division has appeared in WTO, this is likely to have a strong impact on the
multilateral trading system.
However, in India’s view still the rule based multilateral trading regime is the best option
available to all the countries. RTAs are seen as ‘building blocks’ towards our overall
multilateral process of trade liberalisation. It is not a substitute to globalisation rather a
supplement to it. RTAs provide good opportunities to test the waters of the domestic industry
as world over the RTAs have acted as healthy precursors to free trade. It provides a healthy
49
and competitive environment to the industry as well as varied choice to the consumers. RTAs
also provide opportunity to the government to reform its policies, especially those which are
difficult in view of political set up of the country. Most of the debate leading to such
comparison is not warranted, as they are trying to compare ‘the best’ – multilateral trading
system to the ‘second best’ – the RTAs.
Features that would guide the success of SAFTA relates to its coverage and scope. As has
been stated earlier India’s other FTA negotiations cover comprehensive coverage of services,
investments and MRAs in addition to conventional goods agreements. Indian industry,
especially in the goods sector steel, drugs and pharmaceuticals, chemicals and allied
products, dairy and dairy products, textiles, automobiles, engineering items etc. have
offensive interests. Similarly in services, market access for Mode 1 and Mode 4 has an
ambitious agenda, including across the board horizontal commitments on sectors of its
interest. In SAARC India being the largest economy will have a positive agenda on these
issues. It is essential that the scope and coverage of SAARC is broaden to match the levels of
other comprehensive FTAs that India is negotiating, or else SAFTA would lag behind those
agreements. In the long run it would be disadvantageous to other SAARC members only as
their other competitor countries would have an edge over them.
9. SAFTA and India: The Road to Success
Over the past decade, globalization and Asia’s impressive economic performance, driven
mainly by strong GDP growth of China and India, have created an unprecedented
environment for the growth of intra-regional trade and investment. In the region Pakistan and
Bangladesh have also registered high growth rates.
Trade and investment flows have played a crucial role in the economic integration of other
regions of the world, and they have the potential to do the same in South Asia. The realities
on the ground with respect to trade among the region’s neighbours are, however, still
sobering; left to themselves, they could continue to deter regional economic integration. In
terms of intra-regional trade and investment in goods and services, South Asia lags far behind
other regions. There have been several studies16 on the economic gains that would accrue
16 Mukherjee I.N.(2004): Regional Trade Agreements in South Asia, South Asian Yearbook of Trade and Development (CENTAD).
50
from SAFTA. Most indicate significant advantages to both India and ‘smaller’ countries,
particularly Bangladesh and Pakistan. However, there is much variation across studies in the
magnitude predicted for these advantages. Furthermore, these SAFTA gains are not large in
either absolute or relative (to total exports) terms, because most models used in the free-trade
policy simulations are constrained by the existing parameters – the current small volume of
trade among these countries. As such, any computation of the response of trade to rapid GDP
growth and liberalisation based on these volumes would not do justice to the potential impact
of SAFTA.
Broadening the current SAFTA agreement beyond trade in goods to include areas of services
and investment is equally important. Evidence from other regional groupings shows that
investment flows play at least as significant a role as trade in promoting integration of
economies. While free trade alone will yield gains, these are unlikely to be great. However,
dynamic long-term effects can be significant, particularly if combined with aggressive trade-
facilitation measures, removal of NTBs, opening up the services sectors and, in particular,
liberalisation of the investment regime. The full realisation of the gains of freer trade and
investment would also require continuous and massive investment in physical infrastructure
to connect the region more efficiently.
India being the largest country in South Asia in terms of land area, population, and the size of
its economy and being the most advanced country considering its industrial base can play a
pivotal role in regional integration. But so far India has been slightly reluctant to play the lead
role, perhaps due to her dilemma over such a role because of the possible conflict it may
create in the SAARC process and the anticipated negative reaction to such a role by other
members. Another reason can be attributed to India’s relationship with Pakistan which at
times had slowed down the overall progress. India seems to have changed its stance recently
and has shown willingness to play a bigger role. The acceptance of the Mechanism for
Compensation for Revenue Loss (MCRL) by India is one such instance. India, being the
larger and relatively more developed economy, knew that it would bear the major chunk of
the cost in paying compensation. India has also agreed to offer TRQ of 8 million pieces of
garments at zero duty to Bangladesh and to the proposal of the LDCs for technical assistance
in areas like capacity building in standards, product certification, training of human resource,
improvement of legal system and administration, customs procedures and trade facilitation.
One of the reasons cited for Bangladesh’s textile exports not entering into the Indian market
51
despite getting SAPTA concessions on these items related to mixed import duty structure on
garments. This issue would be settled as the duties would be eliminated on such products
under SAFTA and therefore, the specific duty would lose the relevance in SAFTA. This
would provide greater opportunity to Bangladesh to export these items to India. The flow of
trade would, however, depend on several factors like the RoO on these items, supply side
constraints and infrastructural bottlenecks.
Many exporters from South Asian LDCs allege that India maintains some critical NTBs on
their exports. For example, studies have indicated that many exporters from Bangladesh
consider NTBs in India, not the tariffs in India, as the major constraint for their export
expansion in India. Though such measures may be totally WTO compatible, the fact is that it
creates difficulty to the exporters of neighbouring countries, causing irritation. Delays in
testing and certification at border check points have more damaging impact on the export of
perishable items. It would therefore be important for India to address such concerns in the
spirit and goodwill of SAFTA. The customs procedures would need to be streamlined, testing
facilities would need to be built at the border check points and the infrastructure at both ends
of borders would need to be improved. Given its size and importance in SAARC, it is
important that India provides technical and financial assistance for building these facilities at
both the ends. India recognised these problems and even though efforts are made in this
regard, the slow progress on these issues has caused dissatisfaction to India’s neighbours
especially the LDC members.
In order to give a thrust to the process of trade liberalisation under SAFTA, the
announcement made by the Indian Prime Minister to reduce the items from its sensitive list
voluntarily is timely and appropriate. Since India has a favourable balance of trade with the
SAARC LDCs, it needs to give preferential market access in such a manner that this gap is
reduced. It would therefore be important that items where the LDC members have global
exports are removed from its sensitive list. The commitment in SAFTA is to bring the duties
down to the range of 0-5 percent. Therefore a country can maintain its SAFTA preferential
duties at five percent even at the end of tariff liberalisation period. This may deny substantial
market access opportunities to the LDCs, as the preferential import duty of five percent may
not provide them meaningful market access to other SAARC Member Countries. India’s
announcement to eliminate duties for LDCs under SAFTA with an advancement of its tariff
liberalisation programme is another positive step.
52
10. Conclusion
In order to make SAARC a meaningful coalition and a strong economic block, substantial
progress towards its economic integration is very important. SAARC countries, as
geographically proximate neighbours need to take advantage of their close proximity to
increase their trade and investment flows. The complementarities on different dimensions
need to be explored so that the entire region progresses and the benefits are balanced.
India, being the largest economy in SAARC, its role is widely regarded as crucial in
determining the effectiveness of SAFTA and therefore, it will have to play a pro-active and
leading role in drawing the future agenda or the road map of SAFTA. In this regard, the
following actions, if taken by India would give the much needed boost to intra-regional trade
under SAFTA:
(i) India drastically cuts down the size of its sensitive list. The top global export
items of LDCs are deleted during such pruning of the sensitive list so that
effective preferential market access could be provided to them especially on items
where they are globally competitive.
(ii) The issues relating to non-tariff measures should be addressed in a time bound
manner. Fast track approach could be taken for finalising equivalence, conformity
assessment procedures, mutual recognition agreements etc., through the identified
agencies/institutions of the other SAARC members.
(iii) In cases where such agencies/institutions are not established, efforts for providing
technical assistance and building capacity for setting up the agencies/institutions
to be made. The possibility of providing financial support should also be explored.
(iv) Facilitate intra-regional trade through regional cumulation by encouraging
sourcing of inputs from other SAARC members.
(v) Take efforts for promoting investments in other SAARC members especially the
LDCs so that overall economic activity is generated and greater employment
opportunities are created.
(vi) Provide better infrastructure and support at the boarder check posts of customs.

53
In order to promote intra-SAARC trade and investment flows, the SAARC Member
Countries would also need to take necessary measures. To meet the above objectives the
following recommendations are made:
(i) Reduction of the size of sensitive list and time frame for tariff liberalisation:
The present size of the sensitive list is much larger than any successful RTA. To
facilitate the intra-regional trade and investment flows it is important that the size
of the sensitive list of each SAFTA member is reduced drastically. At the same
time, the currently prescribed long time frame for tariff liberalisation needs to be
shortened, implying advancement in the tariff liberalisation schedule.
(ii) Duty free market access: The present SAFTA treaty does not prescribe for a
mandatory duty-free market access (the commitment is for bringing duties to 0-5
percent). It is important that all members decide to make it a duty-free agreement,
as a duty reduction to five percent may deny adequate preferential market access.
(iii) Regional cumulation: The present RoO of SAFTA provides that in order to
utilise the Regional Cumulation benefits the total regional value addition should
be 10 percent higher than the normal value addition and the exporting Party
should have a minimum value addition of 20 percent. A similar provision which
existed in SAPTA did not stimulate intra-regional trade; hence a concept of full
cumulation without any value addition obligation to the exporting Party be
explored.
(iv) Addressing non-tariff barriers:: With the general decline in customs tariffs
regionally and multilaterally, new forms of trade restrictions in the nature of non-
tariff barriers are emerging, largely nullifying the space created by the former.
The SAFTA text merely provides for the notification by Contracting States all
non-tariff and para-tariff measures to their trade on an annual basis. Efforts should
be made to eliminate all such WTO non-compliant barriers in a phased and time-
bound manner.
(v) Expanding the scope of SAFTA: SAFTA must swiftly move towards deeper
integration that characterises most recently emerging RTAs by moving beyond
trade in goods. This calls for incorporating services, adopting a blueprint for a
SAARC Investment Area and enacting agreements/protocols for trade and
investment facilitation.
54
(vi) Trade facilitation: Studies17 have pointed out that the cost of doing business
through formal channels in the region is higher than through informal channels.
The countries in the region could cooperate on bringing down the costs of trade.
This will also generate positive externalities for trade costs with extra-union
partners. Trade facilitation would thus pave the way to enhance the intra-SAARC
trade. Moves should be initiated for standard setting and mutual recognition of
standards through accredited testing laboratories. Setting up a time frame for the
identification and where required, removal of NTBs that cause undue hindrance to
the free movement of goods across borders would enhance the intra-regional trade
and investment flows.
(vii) Customs Cooperation: The Customs Cooperation agreement has been signed by
all the SAARC Members. It is important that timely implementation schedule for
harmonisation of import/export documentation, customs procedures are done on
priority. Other issue that needs to be addressed relates to harmonisation of
national customs classification based on HS nomenclature. Efforts for
simplification of customs clearance procedures and cooperation to resolve
disputes at customs entry points are other issues which are required to be
addressed on priority.
(viii) Cooperation in infrastructure: Another area of importance in SAARC is
infrastructure. There can be issues of road and railway construction, building of
bridges and telecommunication development in which the countries in the region
have common interest. Of course, the SAFTA does not explicitly provide for it but
may play a facilitating role. Preferential trade already tilts the balance in favour of
intra-regional trade and such move would further facilitate the intra regional trade.
Joint projects for development of ports and land customs infrastructure for
facilitating movement of goods through shortest routes should be initiated on
priority.
(ix) Transit treaty: Since there are some landlocked countries, there is a need to build
institutional arrangement for movement of goods within SAARC region. Even for
countries which are not landlocked, it may be economical advantage to transport
17 Taneja, Nisha, Muttukrishna Sarvanathan and Sanjib Pohit. 2003. “India-Sri Lanka Trade: Transacting Environments in Formal and Informal Trading.” Economic and Political Weekly, July 19, 3095-98.
55
goods through the land route, transiting through other SAFTA Member. Though
India has bilateral transit treaties with Nepal, Bhutan etc., in order to facilitate the
free movement of goods in SAARC region there is a need for a regional
framework or treaty for promoting transit to promote unhindered movement of
goods across borders. This would not only enhance the intra-regional trade but
would also facilitate several economic activities in the region.
To make SAFTA a successful regional block, efforts made by India alone will not be
sufficient and a collective developmental goal would need to be set up by all the SAARC
member countries. A comprehensive action plan, therefore, is needed to make SAFTA a
meaningful and effective regional trading block.
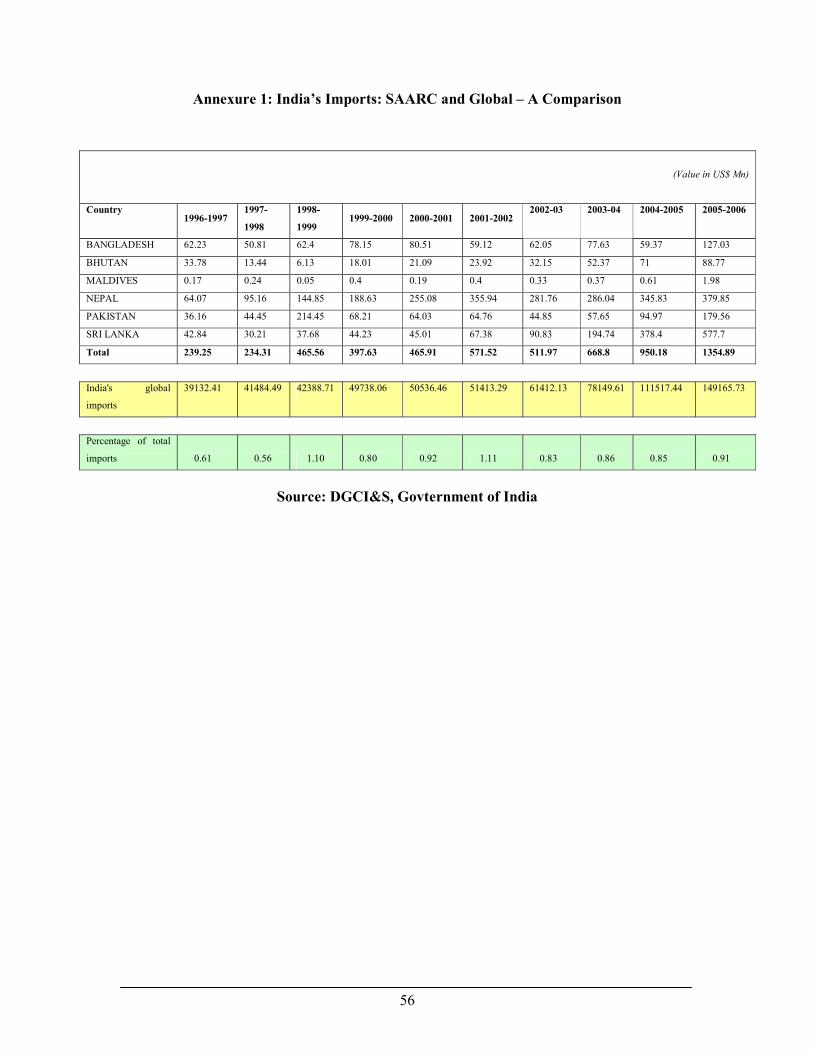
56
Annexure 1: India’s Imports: SAARC and Global – A Comparison
(Value in US$ Mn)
Country 1996-1997
1997-
1998
1998-
1999 1999-2000 2000-2001 2001-2002
2002-03 2003-04 2004-2005 2005-2006
BANGLADESH 62.23 50.81 62.4 78.15 80.51 59.12 62.05 77.63 59.37 127.03
BHUTAN 33.78 13.44 6.13 18.01 21.09 23.92 32.15 52.37 71 88.77
MALDIVES 0.17 0.24 0.05 0.4 0.19 0.4 0.33 0.37 0.61 1.98
NEPAL 64.07 95.16 144.85 188.63 255.08 355.94 281.76 286.04 345.83 379.85
PAKISTAN 36.16 44.45 214.45 68.21 64.03 64.76 44.85 57.65 94.97 179.56
SRI LANKA 42.84 30.21 37.68 44.23 45.01 67.38 90.83 194.74 378.4 577.7
Total 239.25 234.31 465.56 397.63 465.91 571.52 511.97 668.8 950.18 1354.89
India's global
imports
39132.41 41484.49 42388.71 49738.06 50536.46 51413.29 61412.13 78149.61 111517.44 149165.73
Percentage of total
imports 0.61 0.56 1.10 0.80 0.92 1.11 0.83 0.86 0.85 0.91
Source: DGCI&S, Govternment of India
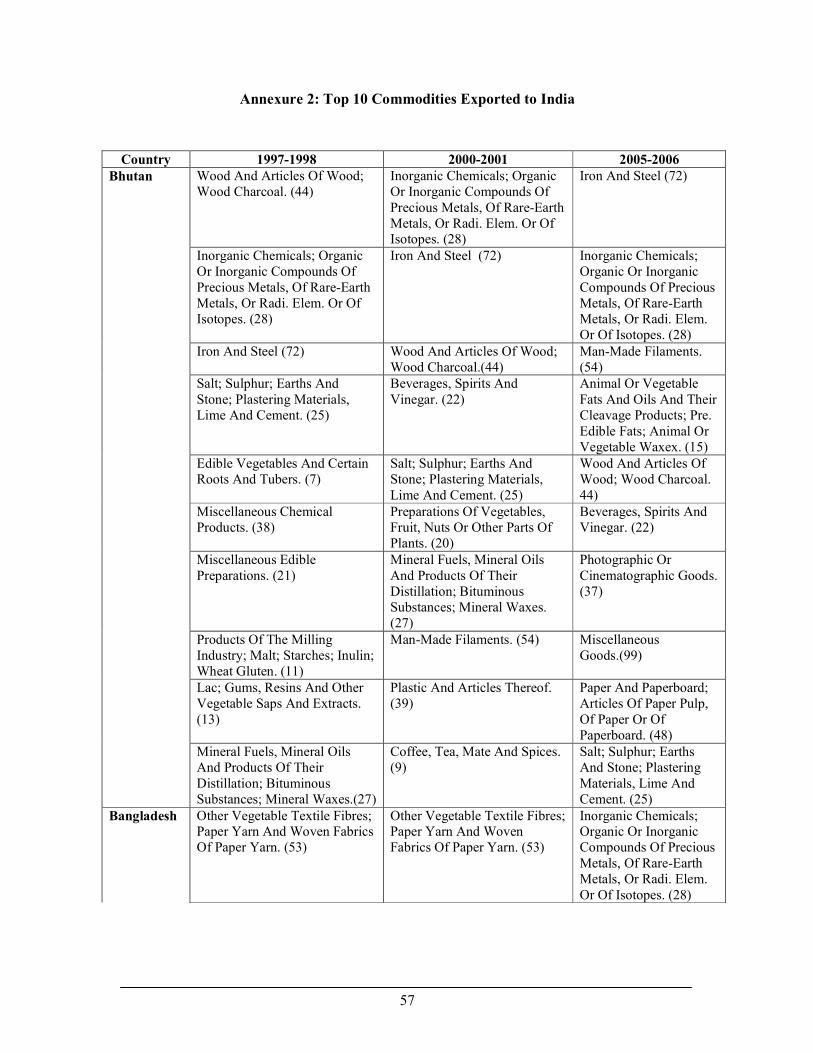
57
Annexure 2: Top 10 Commodities Exported to India
Country 1997-1998 2000-2001 2005-2006
Wood And Articles Of Wood; Wood Charcoal. (44)
Inorganic Chemicals; Organic Or Inorganic Compounds Of Precious Metals, Of Rare-Earth Metals, Or Radi. Elem. Or Of Isotopes. (28)
Iron And Steel (72)
Inorganic Chemicals; Organic Or Inorganic Compounds Of Precious Metals, Of Rare-Earth Metals, Or Radi. Elem. Or Of Isotopes. (28)
Iron And Steel (72) Inorganic Chemicals; Organic Or Inorganic Compounds Of Precious Metals, Of Rare-Earth Metals, Or Radi. Elem. Or Of Isotopes. (28)
Iron And Steel (72) Wood And Articles Of Wood; Wood Charcoal.(44)
Man-Made Filaments. (54)
Salt; Sulphur; Earths And Stone; Plastering Materials, Lime And Cement. (25)
Beverages, Spirits And Vinegar. (22)
Animal Or Vegetable Fats And Oils And Their Cleavage Products; Pre. Edible Fats; Animal Or Vegetable Waxex. (15)
Edible Vegetables And Certain Roots And Tubers. (7)
Salt; Sulphur; Earths And Stone; Plastering Materials, Lime And Cement. (25)
Wood And Articles Of Wood; Wood Charcoal. 44)
Miscellaneous Chemical Products. (38)
Preparations Of Vegetables, Fruit, Nuts Or Other Parts Of Plants. (20)
Beverages, Spirits And Vinegar. (22)
Miscellaneous Edible Preparations. (21)
Mineral Fuels, Mineral Oils And Products Of Their Distillation; Bituminous Substances; Mineral Waxes. (27)
Photographic Or Cinematographic Goods. (37)
Products Of The Milling Industry; Malt; Starches; Inulin; Wheat Gluten. (11)
Man-Made Filaments. (54) Miscellaneous Goods.(99)
Lac; Gums, Resins And Other Vegetable Saps And Extracts. (13)
Plastic And Articles Thereof. (39)
Paper And Paperboard; Articles Of Paper Pulp, Of Paper Or Of Paperboard. (48)
Bhutan
Mineral Fuels, Mineral Oils And Products Of Their Distillation; Bituminous Substances; Mineral Waxes.(27)
Coffee, Tea, Mate And Spices. (9)
Salt; Sulphur; Earths And Stone; Plastering Materials, Lime And Cement. (25)
Bangladesh
Other Vegetable Textile Fibres; Paper Yarn And Woven Fabrics Of Paper Yarn. (53)
Other Vegetable Textile Fibres; Paper Yarn And Woven Fabrics Of Paper Yarn. (53)
Inorganic Chemicals; Organic Or Inorganic Compounds Of Precious Metals, Of Rare-Earth Metals, Or Radi. Elem. Or Of Isotopes. (28)
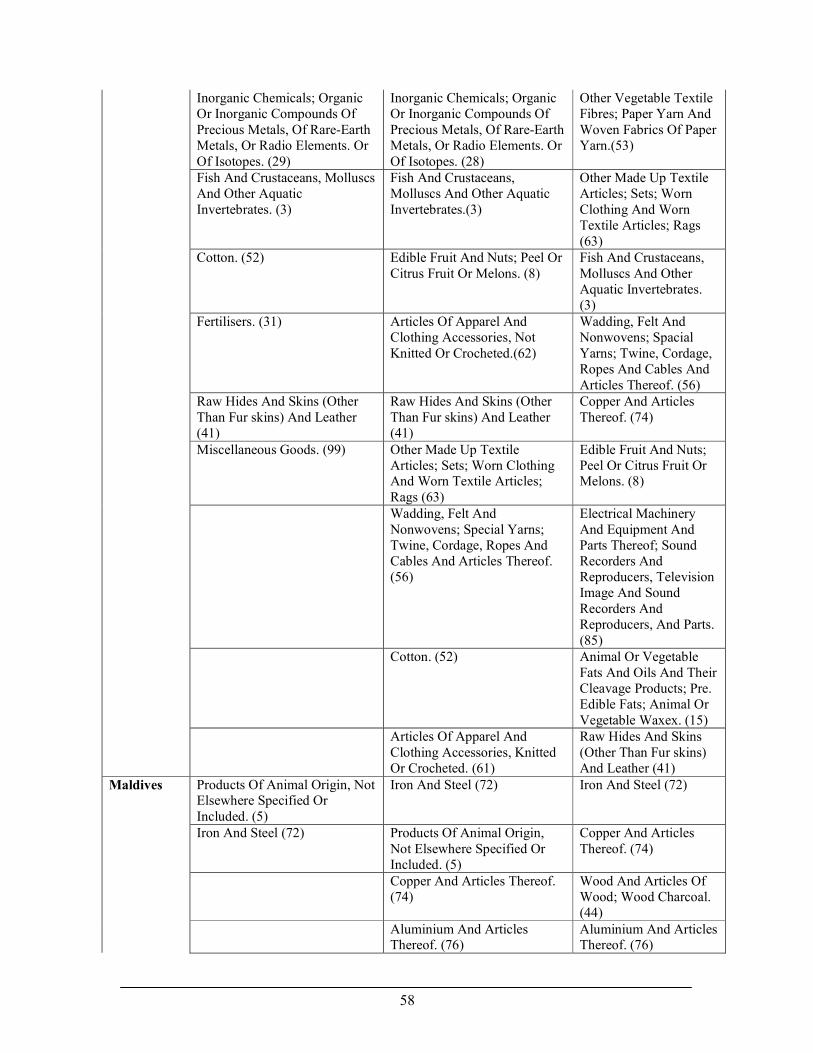
58
Inorganic Chemicals; Organic Or Inorganic Compounds Of Precious Metals, Of Rare-Earth Metals, Or Radio Elements. Or Of Isotopes. (29)
Inorganic Chemicals; Organic Or Inorganic Compounds Of Precious Metals, Of Rare-Earth Metals, Or Radio Elements. Or Of Isotopes. (28)
Other Vegetable Textile Fibres; Paper Yarn And Woven Fabrics Of Paper Yarn.(53)
Fish And Crustaceans, Molluscs And Other Aquatic Invertebrates. (3)
Fish And Crustaceans, Molluscs And Other Aquatic Invertebrates.(3)
Other Made Up Textile Articles; Sets; Worn Clothing And Worn Textile Articles; Rags (63)
Cotton. (52) Edible Fruit And Nuts; Peel Or Citrus Fruit Or Melons. (8)
Fish And Crustaceans, Molluscs And Other Aquatic Invertebrates. (3)
Fertilisers. (31) Articles Of Apparel And Clothing Accessories, Not Knitted Or Crocheted.(62)
Wadding, Felt And Nonwovens; Spacial Yarns; Twine, Cordage, Ropes And Cables And Articles Thereof. (56)
Raw Hides And Skins (Other Than Fur skins) And Leather (41)
Raw Hides And Skins (Other Than Fur skins) And Leather (41)
Copper And Articles Thereof. (74)
Miscellaneous Goods. (99) Other Made Up Textile Articles; Sets; Worn Clothing And Worn Textile Articles; Rags (63)
Edible Fruit And Nuts; Peel Or Citrus Fruit Or Melons. (8)
Wadding, Felt And Nonwovens; Special Yarns; Twine, Cordage, Ropes And Cables And Articles Thereof. (56)
Electrical Machinery And Equipment And Parts Thereof; Sound Recorders And Reproducers, Television Image And Sound Recorders And Reproducers, And Parts. (85)
Cotton. (52) Animal Or Vegetable Fats And Oils And Their Cleavage Products; Pre. Edible Fats; Animal Or Vegetable Waxex. (15)
Articles Of Apparel And Clothing Accessories, Knitted Or Crocheted. (61)
Raw Hides And Skins (Other Than Fur skins) And Leather (41)
Products Of Animal Origin, Not Elsewhere Specified Or Included. (5)
Iron And Steel (72) Iron And Steel (72)
Iron And Steel (72) Products Of Animal Origin, Not Elsewhere Specified Or Included. (5)
Copper And Articles Thereof. (74)
Copper And Articles Thereof. (74)
Wood And Articles Of Wood; Wood Charcoal. (44)
Maldives
Aluminium And Articles Thereof. (76)
Aluminium And Articles Thereof. (76)
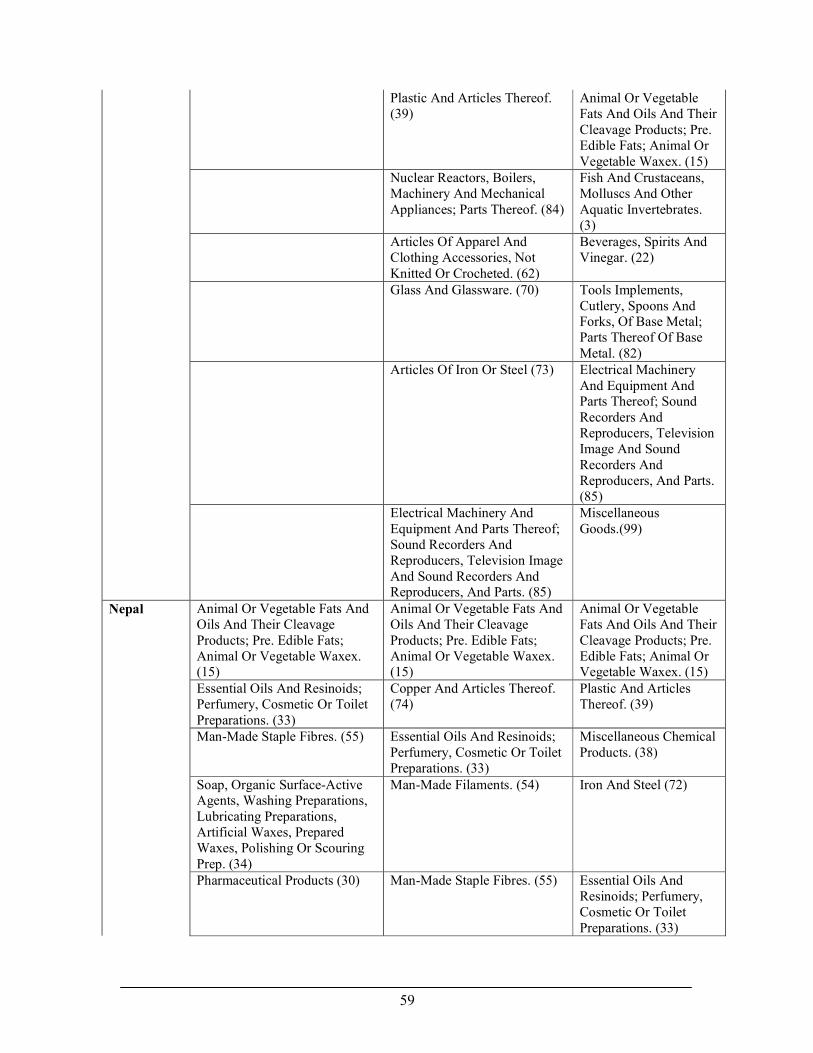
59
Plastic And Articles Thereof. (39)
Animal Or Vegetable Fats And Oils And Their Cleavage Products; Pre. Edible Fats; Animal Or Vegetable Waxex. (15)
Nuclear Reactors, Boilers, Machinery And Mechanical Appliances; Parts Thereof. (84)
Fish And Crustaceans, Molluscs And Other Aquatic Invertebrates. (3)
Articles Of Apparel And Clothing Accessories, Not Knitted Or Crocheted. (62)
Beverages, Spirits And Vinegar. (22)
Glass And Glassware. (70) Tools Implements, Cutlery, Spoons And Forks, Of Base Metal; Parts Thereof Of Base Metal. (82)
Articles Of Iron Or Steel (73) Electrical Machinery And Equipment And Parts Thereof; Sound Recorders And Reproducers, Television Image And Sound Recorders And Reproducers, And Parts. (85)
Electrical Machinery And Equipment And Parts Thereof; Sound Recorders And Reproducers, Television Image And Sound Recorders And Reproducers, And Parts. (85)
Miscellaneous Goods.(99)
Animal Or Vegetable Fats And Oils And Their Cleavage Products; Pre. Edible Fats; Animal Or Vegetable Waxex. (15)
Animal Or Vegetable Fats And Oils And Their Cleavage Products; Pre. Edible Fats; Animal Or Vegetable Waxex. (15)
Animal Or Vegetable Fats And Oils And Their Cleavage Products; Pre. Edible Fats; Animal Or Vegetable Waxex. (15)
Essential Oils And Resinoids; Perfumery, Cosmetic Or Toilet Preparations. (33)
Copper And Articles Thereof. (74)
Plastic And Articles Thereof. (39)
Man-Made Staple Fibres. (55) Essential Oils And Resinoids; Perfumery, Cosmetic Or Toilet Preparations. (33)
Miscellaneous Chemical Products. (38)
Soap, Organic Surface-Active Agents, Washing Preparations, Lubricating Preparations, Artificial Waxes, Prepared Waxes, Polishing Or Scouring Prep. (34)
Man-Made Filaments. (54) Iron And Steel (72)
Nepal
Pharmaceutical Products (30) Man-Made Staple Fibres. (55) Essential Oils And Resinoids; Perfumery, Cosmetic Or Toilet Preparations. (33)

60
Coffee, Tea, Mate And Spices (9).
Plastic And Articles Thereof. (39)
Man-Made Staple Fibres. (55)
Wadding, Felt And Nonwovens; Spacial Yarns; Twine, Cordage, Ropes And Cables And Articles Thereof. (56)
Soap, Organic Surface-Active Agents, Washing Preparations, Lubricating Preparations, Artificial Waxes, Prepared Waxes, Polishing Or Scouring Prep. (34)
Beverages, Spirits And Vinegar. (22)
Other Vegetable Textile Fibres; Paper Yarn And Woven Fabrics Of Paper Yarn. (53)
Articles Of Iron Or Steel (73) Salt; Sulphur; Earths And Stone; Plastering Materials, Lime And Cement. (25)
Man-Made Filaments. (54) Coffee, Tea, Mate And Spices. (9)
Coffee, Tea, Mate And Spices.(9)
Preparations Of Cereals, Flour, Starch Or Milk; Pastry cooks Products. 19
Pharmaceutical Products 30 Articles Of Iron Or Steel 73
Iron And Steel (72) Coffee, Tea, Mate And Spices. (9)
Animal Or Vegetable Fats And Oils And Their Cleavage Products; Pre. Edible Fats; Animal Or Vegetable Waxes. (15)
Coffee, Tea, Mate And Spices (9).
Copper And Articles Thereof. (74)
Copper And Articles Thereof. (74)
Pulp Of Wood Or Of Other Fibrous Cellulosic Material; Waste And Scrap Of Paper Or Paperboard. (47)
Plastic And Articles Thereof. (39)
Electrical Machinery And Equipment And Parts Thereof; Sound Recorders And Reproducers, Television Image And Sound Recorders And Reproducers, And Parts. (85)
Rubber And Articles Thereof. (40)
Iron And Steel (72) Coffee, Tea, Mate And Spices. (9)
Animal Or Vegetable Fats And Oils And Their Cleavage Products; Pre. Edible Fats; Animal Or Vegetable Waxex. (15)
Electrical Machinery And Equipment And Parts Thereof; Sound Recorders And Reproducers, Television Image And Sound Recorders And Reproducers, And Parts. (85)
Rubber And Articles Thereof. (40)
Man-Made Filaments. (54) Nuclear Reactors, Boilers, Machinery And Mechanical Appliances; Parts Thereof.(84)
Aluminium And Articles Thereof. (76)
Nuclear Reactors, Boilers, Machinery And Mechanical Appliances; Parts Thereof. (84)
Paper And Paperboard; Articles Of Paper Pulp, Of Paper Or Of Paperboard. (48)
Articles Of Stone, Plaster, Cement, Asbestos, Mica Or Similar Materials. (68)
Sri Lanka
Copper And Articles Thereof. (74)
Pulp Of Wood Or Of Other Fibrous Cellulosic Material; Waste And Scrap Of Paper Or Paperboard. (47)
Nuclear Reactors, Boilers, Machinery And Mechanical Appliances; Parts Thereof. (84)

61
Zinc And Articles Thereof. 79 Animal Or Vegetable Fats And Oils And Their Cleavage Products; Pre. Edible Fats; Animal Or Vegetable Waxex. (15)
Wood And Articles Of Wood; Wood Charcoal. (44)
Plastic And Articles Thereof. (39)
Rubber And Articles Thereof. (40)
Pulp Of Wood Or Of Other Fibrous Cellulosic Material; Waste And Scrap Of Paper Or Paperboard. (47)
The figures in parentheses indicate the Tariff Chapters based on the Harmonised System.
Source: DGCI&S, Government of India

62
Annexure 3: India’s Imports from Bangladesh
HSCode Commodity 2005-06 US
$ million
position in
NL
281410 Anhydrous ammonia 39.18
30269 Other fish fish/chld excl livrs & roes 7.37
80290 Other nuts fresh or dried 2.91 NL
30420 Fish fillets(whether or nt minced)frzn 2.15 NL (APTA - 100%)
151620 Vegetable fats & oils & their fractns 1.42 NL
251710 Pebbles grvl brkn/crshd stone commonly usdfr concrte agrgts fr ro mtlng/rly/othr balast shingle & flint w/n heat-treated
0.98
220290 Other sweetened flavourd waters 0.89
170310 Cane molses rsltd frm extrctn/rfng of sugr 0.87
150790 Other soya bean oil & its fractions 0.75 NL
340111 Soap and orgnc surface actv prdcts etc for tiolet use (incl medicated prdcts)
0.69 NL
252329 Other portland cement 0.55
310420 Potassium chloride 0.46
230990 Othr prpns of a kind used in anml feeding 0.36 NL
50610 Ossein & bones treated with acid 0.33 NL
30559 Other dried fish w/n salted nt smoked 0.3
340119 Othr surface actv prdcts and prpns 0.23 NL
30613 Shrimps & prawns frozen 0.22 NL
230220 Bran sharps & other residues of rice 0.19 NL
152000 Glycerol, crude; glycerol waters & lyes 0.16
200410 Potatoes prpd/prsvd, frzn 0.15 Source: DGCI&S, Government of India
INDIA’S IMPORTS FROM MALDIVES ( Total imports of 1.98 US $ mn)
HSCode Commodity 2005-2006
US $ million
position in
NL
720449 Other waste and scrap 0.72
720429 Waste & scrap of other alloy steel 0.41
740400 Copper waste & scrap 0.41
440399 Other wood in rough 0.16
760200 Aluminium waste and scrap 0.16
150410 Fish liver oils & their fractions 0.03
220429 Wine of fresh grapes(excl sparkling wine) 0.02 NL
722611 Flt-rld products of silicon electrical stl grain-oriented 0.02
820210 Hand saws 0.02
30420 Fish fillets(whether or not minced)frzn 0.01
854810 Waste & scrap of primary cells, batteries & electric acumulators,spent primary cells batteries & spent electric accumulators.
0.01
999300 Special transactions & commodities not classified according to kind
0.01
(Source: WITS, UNCTAD)

63
BANGLADESH EXPORT TO WORLD 2004 WITS Total value for all products US$
8267482023
Product
Code
Description Trade Value
($ '000)
position
in NL
610910 Of cotton 1,171,789.889 NL
620342 Of cotton 752,464.388 NL
611090 Of other textile materials 576,527.693 NL
620520 Of cotton 407,792.437 NL
30613 Shrimps and prawns 355,716.212 NL
620590 Of other textile materials 330,932.551 NL
620462 Of cotton 326,417.422 NL
611020 Of cotton 200,533.210 NL
610510 Of cotton 187,679.262 NL
620349 Of other textile materials 161,955.611 NL
530710 Single 113,774.531
620690 Of other textile materials 111,481.069 NL
611030 Of manmade fibres 110,055.640 NL
620333 Of synthetic fibres 100,972.397 NL
620343 Of synthetic fibres 100,188.703
620630 Of cotton 100,134.625 NL
620469 Of other textile materials 99,549.238 NL
530310 Jute and other textile bast fibres, raw or retted 86,318.902
610990 Of other textile materials 72,910.734 NL
410449 Other 70,092.895
610590 Of other textile materials 69,702.207 NL
650590 Other 61,567.881
310210 Urea, whether or not in aqueous solution 56,174.257
580219 Other 55,337.885
610610 Of cotton 54,485.018 NL
630229 Of other textile materials 52,577.609
620452 Of cotton 49,225.379 NL
620339 Of other textile materials 48,878.539 NL
610342 Of cotton 46,252.384 NL
610821 Of cotton 46,167.547 NL
871200 Bicycles and other cycles (including delivery tricycles), not motorised.
45,231.899
610711 Of cotton 44,117.265 NL
531010 Unbleached 43,968.710
630510 Of jute or of other textile bast fibres of heading 53.03
43,453.256
610339 Of other textile materials 43,369.876
620463 Of synthetic fibres 42,985.867 NL
410711 Full grains, unsplit 42,042.442
620439 Of other textile materials 40,301.202 NL
410719 Other 38,565.125
70990 Other 38,007.526 NL
560710 Of jute or other textile bast fibres of heading 53.03 36,321.540
620432 Of cotton 35,085.941
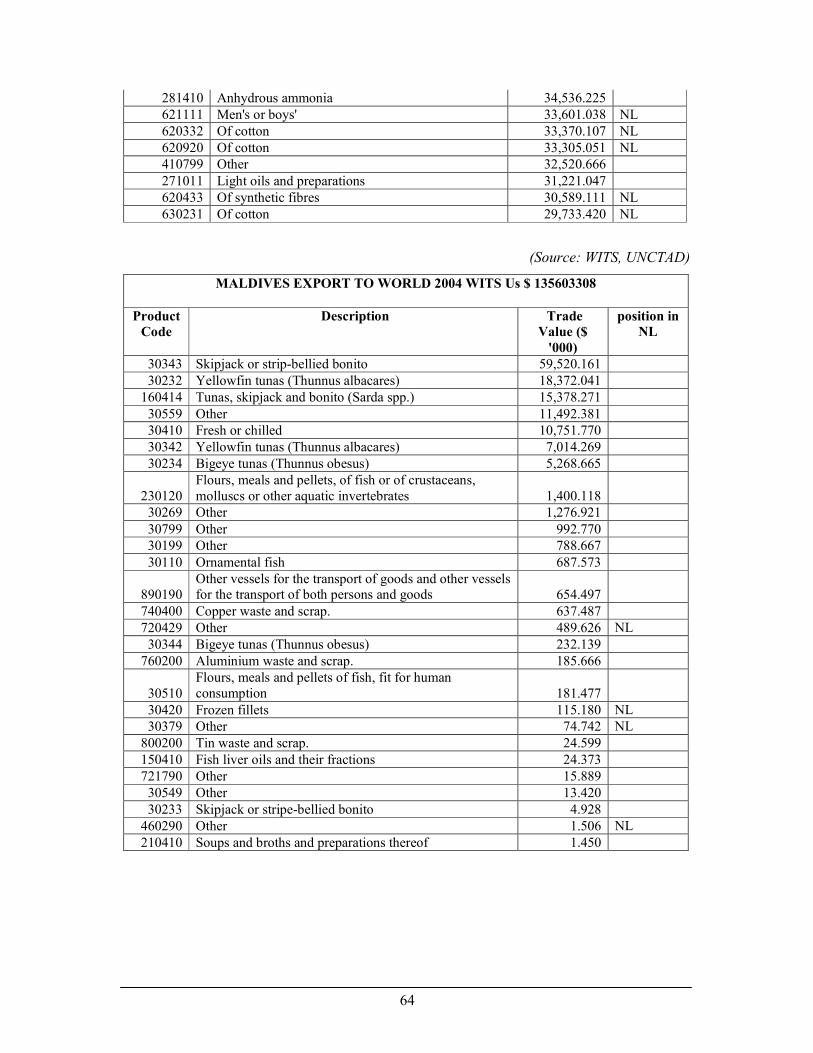
64
281410 Anhydrous ammonia 34,536.225
621111 Men's or boys' 33,601.038 NL
620332 Of cotton 33,370.107 NL
620920 Of cotton 33,305.051 NL
410799 Other 32,520.666
271011 Light oils and preparations 31,221.047
620433 Of synthetic fibres 30,589.111 NL
630231 Of cotton 29,733.420 NL
(Source: WITS, UNCTAD)
MALDIVES EXPORT TO WORLD 2004 WITS Us $ 135603308
Product
Code
Description Trade
Value ($
'000)
position in
NL
30343 Skipjack or strip-bellied bonito 59,520.161
30232 Yellowfin tunas (Thunnus albacares) 18,372.041
160414 Tunas, skipjack and bonito (Sarda spp.) 15,378.271
30559 Other 11,492.381
30410 Fresh or chilled 10,751.770
30342 Yellowfin tunas (Thunnus albacares) 7,014.269
30234 Bigeye tunas (Thunnus obesus) 5,268.665
230120 Flours, meals and pellets, of fish or of crustaceans, molluscs or other aquatic invertebrates 1,400.118
30269 Other 1,276.921
30799 Other 992.770
30199 Other 788.667
30110 Ornamental fish 687.573
890190 Other vessels for the transport of goods and other vessels for the transport of both persons and goods 654.497
740400 Copper waste and scrap. 637.487
720429 Other 489.626 NL
30344 Bigeye tunas (Thunnus obesus) 232.139
760200 Aluminium waste and scrap. 185.666
30510 Flours, meals and pellets of fish, fit for human consumption 181.477
30420 Frozen fillets 115.180 NL
30379 Other 74.742 NL
800200 Tin waste and scrap. 24.599
150410 Fish liver oils and their fractions 24.373
721790 Other 15.889
30549 Other 13.420
30233 Skipjack or stripe-bellied bonito 4.928
460290 Other 1.506 NL
210410 Soups and broths and preparations thereof 1.450
Related Documents