Making advanced travel forecasting models affordable through model transferability 14th TRB Conference on Transportation Planning Applications May 5-9, 2013, Columbus, Ohio John L Bowman, Mark Bradley, Joe Castiglione, Supin Yoder

Making advanced travel forecasting models affordable through model transferability 14th TRB Conference on Transportation Planning Applications May 5-9,
Dec 23, 2015
Welcome message from author
This document is posted to help you gain knowledge. Please leave a comment to let me know what you think about it! Share it to your friends and learn new things together.
Transcript

Making advanced travel forecasting models affordable through model
transferability
14th TRB Conference on Transportation Planning Applications
May 5-9, 2013, Columbus, Ohio
John L Bowman, Mark Bradley, Joe Castiglione, Supin Yoder
Acknowledgments
• Sponsored by FHWA under the STEP program
• Data provided by• California DOT• Fehr & Peers• Florida DOT• Fresno County COG• Sacramento Area COG• San Joaquin County COG• San Diego Association of Governments
TRB Planning Apps Conf May 2013 Bowman, et al 2

TRB Planning Apps Conf May 2013 Bowman, et al 3
Outline
• Introduction• Transferability testing methods• Results

TRB Planning Apps Conf May 2013 Bowman, et al 4
Objective
• Empirically test and demonstrate the transferability of activity-based (AB) models between regions
• Why? Reduce AB development costs• large household survey• estimating entirely new models

Six regions in study
TRB Planning Apps Conf May 2013 Bowman, et al 5
Sacramento
San Diego
Northern San Joaquin Valley
Jacksonville
Tampa
Fresno

Activity-Based Models: 1993-2012 John L Bowman, Ph.D. (www.JBowman.net) 6
Within-Day Choice (once per person-day)
Tours(once per person-tour)
Half-tours(twice per person-tour)
Intermediate stops and trips(once per trip)
Activity/ Trip Time of DayTrip Mode
Activity Location
Primary Activity Time of Day
Long Term Choice (once per household)
Usual locations (once per person)
School(All students)
Work(Student workers)
Auto Ownership(Household)
Day Pattern(activities & Home-based tours for each
person-day)
Work(Non-student workers)
Main Mode
Number & Purpose of Intermediate Stops
No./ Purp. Of Wk-Based SubTours
Primary Activity Destination
Aggr. LogSums
Aggr. LogSums LogSums
AB Model Framework

Fifteen tested model components
TRB Planning Apps Conf May 2013 Bowman, et al 7
Model Type Number of coefficientsUsual work location 48Auto ownership 24Person-day tour generation 126Exact number of tours 86Work tour time of day 69Work tour mode (detailed LOS) 58Work tour mode (combined LOS) 31Work-based subtour generation 14School tour mode 32Other tour destination 62Other tour time of day 86Other tour mode 41Intermediate stop generation 100Intermediate stop location 66Trip time of day 45Total 888

Seven untested model components
TRB Planning Apps Conf May 2013 Bowman, et al 8
Model TypeUsual school locationWork tour destinationEscort tour modeWork-based subtour modeSchool tour time of dayWork-based subtour time of dayTrip mode

Eleven variable types
TRB Planning Apps Conf May 2013 Bowman, et al 9
Variable TypeNumber of coefficients
A-constant 192P-person 184H-household 149D-day pattern 76T-tour/trip 199I-impedance 110U-land use 99W-time window 45C-logsum 24G-size variable 35L-log size multiplier 3Total 1116

Transferability testing:two approaches
• Application-Based• Apply model system developed for
another region• Compare predictions to observed
aggregate outcomes• Estimation-Based
• Estimate coefficients for both regions• Compare them for statistical differences
TRB Planning Apps Conf May 2013 Bowman, et al 10

Strengths of the estimation-based approach
• Explicit statistical tests• Can address a wide variety of
hypotheses• Can test transferability of specific
variable types and model components
TRB Planning Apps Conf May 2013 Bowman, et al 11

Data issues
• Data problems can confound transferability test results• Inconsistent data• Small samples
TRB Planning Apps Conf May 2013 Bowman, et al 12

Estimability questions
• What estimation sample size is adequate?
• How does combining samples improve estimability?
• Which models are more estimable at the regional level?
TRB Planning Apps Conf May 2013 Bowman, et al 13

TransferabilityHypothesis 1
Variables that apply to population segments defined by characteristics of individuals and/or their situational context (i.e. segment-specific variables) will tend to be more transferable than variables that are more generic and apply to all individuals.
TRB Planning Apps Conf May 2013 Bowman, et al 14
TransferabilityHypothesis 2
Variables that are segment-specific will tend to be more transferable than alternative-specific constants.
TRB Planning Apps Conf May 2013 Bowman, et al 15

TransferabilityHypothesis 3
Models that deal with social organization (activity generation and scheduling) will be more transferable than models that deal mainly with spatial organization (mode choice and location choice)
TRB Planning Apps Conf May 2013 Bowman, et al 16

TransferabilityHypothesis 4
Models for different regions within the same state will tend to be more transferable than models for regions in different parts of the country
TRB Planning Apps Conf May 2013 Bowman, et al 17

TRB Planning Apps Conf May 2013 Bowman, et al 18
Outline
• Introduction• Transferability testing methods• Results

Testing method overview
• Prepare data• Estimate separate models• Estimate comparison models• Tabulate and analyze results
TRB Planning Apps Conf May 2013 Bowman, et al 19

Data preparation overview
TRB Planning Apps Conf May 2013 Bowman, et al 20
NHTSZonal or Parcel
Attributes
Zone OD skim data
Transform into AB model
input format
Transform into microzone
scale and AB model format
Specify format for AB model
For each region:

NHTS Sample SizesRegion Number of
HouseholdsFresno 380Northern San Joaquin Valley 660Sacramento 1,310San Diego 6,000California Total 8,350Jacksonville 1,050Tampa 2,500Florida Total 3,550Two-state total 11,900
TRB Planning Apps Conf May 2013 Bowman, et al 21

Testing method overview
• Prepare data• Estimate separate models• Estimate comparison models• Tabulate and analyze results
TRB Planning Apps Conf May 2013 Bowman, et al 22

Estimating separate models
• Generate base model specs• Estimate 90 separate models
(15 models x 6 regions)• Constrain inestimable coefficients
TRB Planning Apps Conf May 2013 Bowman, et al 23

Testing method overview
• Prepare data• Estimate separate models• Estimate comparison models• Tabulate and analyze results
TRB Planning Apps Conf May 2013 Bowman, et al 24

Estimating comparison models
For each of the 15 models:• Combine data for all regions• Estimate 36 versions of each model
• 12 base model versions• 24 difference model versions
TRB Planning Apps Conf May 2013 Bowman, et al 25

Utility functions
• Base model:
• Difference model:
R is a dummy variable specific to the difference region
TRB Planning Apps Conf May 2013 Bowman, et al 26

Testing Method Overview
• Prepare data• Estimate separate models• Estimate comparison models• Tabulate and analyze results
TRB Planning Apps Conf May 2013 Bowman, et al 27

TRB Planning Apps Conf May 2013 Bowman, et al 28
Outline
• Introduction• Transferability testing methods• Results
• Hypotheses tested• Most important conclusion

Transferability hypotheses• (Hypothesis 1) Segment-specific variables
will tend to be more transferable than variables that are more generic and apply to all individuals. (accepted)
• (Hypothesis 2) Variables that are segment-specific will tend to be more transferable than alternative-specific constants. (rejected)
TRB Planning Apps Conf May 2013 Bowman, et al 29

TRB Planning Apps Conf May 2013 Bowman, et al 30

Transferability hypotheses
• (Hypothesis 3) Models that deal with social organization (activity generation and scheduling) will be more transferable than models that deal mainly with spatial organization (mode choice and location choice)(accepted)
TRB Planning Apps Conf May 2013 Bowman, et al 31

1
TRB Planning Apps Conf May 2013 Bowman, et al 32
Transferability hypotheses• (Hypothesis 4) Models for different
regions within the same state will tend to be more transferable than models for regions in different parts of the country
California—accepted (weakly)Florida—rejected, Jacksonville more transferable with California than with Tampa
TRB Planning Apps Conf May 2013 Bowman, et al 33

TRB Planning Apps Conf May 2013 Bowman, et al 34
Outline
• Introduction• Transferability testing methods• Results
• Hypotheses tested• Most important conclusions

Most Important Conclusions• evidence of broad comparability among all the
regions, with one region, Tampa, standing out as less comparable than the others
• sample sizes of 6,000 households or more provide much better information for estimating coefficients than samples of 2,500 or less.
Better to transfer models based on large sample from comparable region than to estimate new models using a much smaller local sample
TRB Planning Apps Conf May 2013 Bowman, et al 35

Comparability—2 state
TRB Planning Apps Conf May 2013 Bowman, et al 36

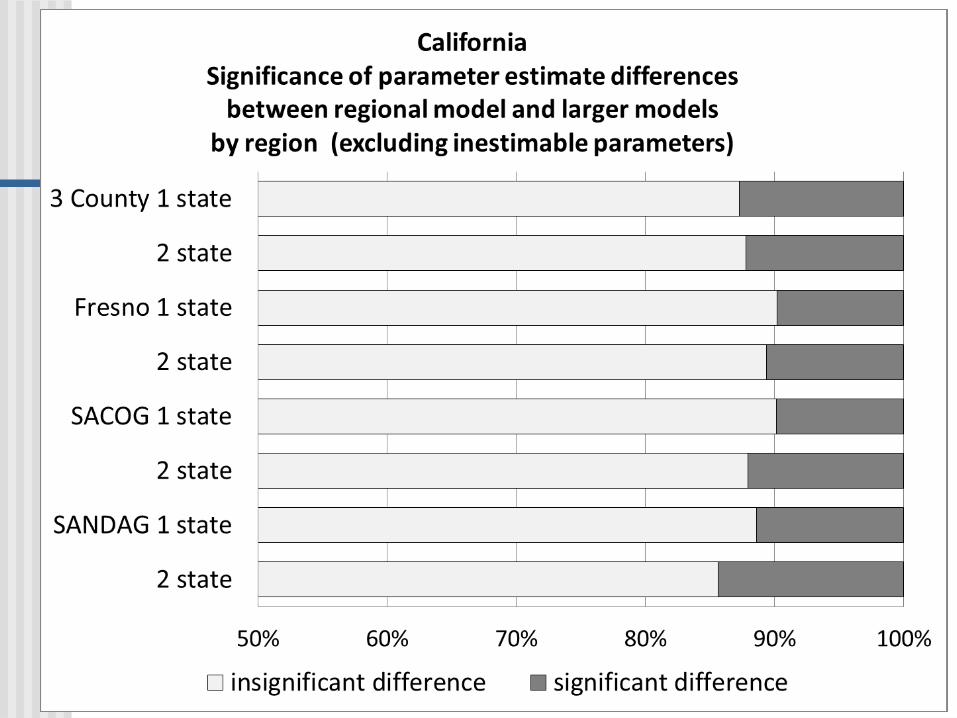
Comparability within state
TRB Planning Apps Conf May 2013 Bowman, et al 37

Most Important Conclusions• evidence of broad comparability among all the
regions, with one region, Tampa, standing out as less comparable than the others
• sample sizes of 6,000 households or more provide much better information for estimating coefficients than samples of 2,500 or less.
Better to transfer models based on large sample from comparable region than to estimate new models using a much smaller local sample
TRB Planning Apps Conf May 2013 Bowman, et al 38

Need for large samples
TRB Planning Apps Conf May 2013 Bowman, et al 39
Most Important Conclusions• evidence of broad comparability among all the
regions, with one region, Tampa, standing out as less comparable than the others
• sample sizes of 6,000 households or more provide much better information for estimating coefficients than samples of 2,500 or less.
Better to transfer models based on large sample from comparable region than to estimate new models using a much smaller local sample
TRB Planning Apps Conf May 2013 Bowman, et al 40

TRB Planning Apps Conf May 2013 Bowman, et al 41

12 Base model versions
• 6 region-specific versions• 2 2-state versions
• With region-specific ASCs• Without region-specific ASCs
• 2 FL versions (with & without region ASCs)
• 2 CA versions (with & without region ASCs)
TRB Planning Apps Conf May 2013 Bowman, et al 42
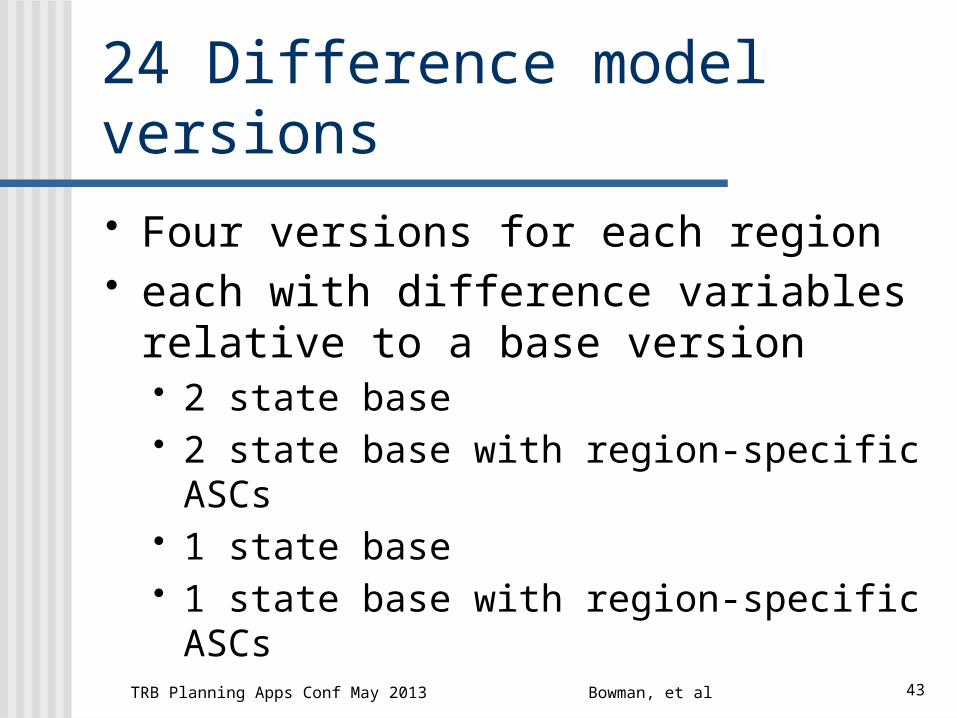
24 Difference model versions
• Four versions for each region• each with difference variables
relative to a base version• 2 state base• 2 state base with region-specific ASCs• 1 state base• 1 state base with region-specific ASCs
TRB Planning Apps Conf May 2013 Bowman, et al 43
TRB Planning Apps Conf May 2013 Bowman, et al 44

TRB Planning Apps Conf May 2013 Bowman, et al 45
Related Documents