SMITHS GROUP PLC Annual Report FY2020 MAKING A SAFER, MORE EFFICIENT AND BETTER CONNECTED WORLD

Welcome message from author
This document is posted to help you gain knowledge. Please leave a comment to let me know what you think about it! Share it to your friends and learn new things together.
Transcript

SMITHS GROUP PLC Annual Report FY2020
MAKING A SAFER, MORE EFFICIENT AND BETTER CONNECTED WORLD

S M I T H S G R O U P P L C A N N U A L R E P O R T F Y 2 0 2 0
O V E R V I E W
Smiths is a world leader in the practical application of advanced technologies, creating transformative products and services that make a safer, more efficient and better connected world.
Our businesses share the same characteristics which shape how we create value. These characteristics are underpinned by the Smiths values, a culture driven by excellence and innovation, and our commitment to doing business responsibly and sustainably for the benefit of society at large and our stakeholders.
It’s the Smiths way.
Our purpose
MAKING A SAFER, MORE EFFICIENT AND BETTER CONNECTED WORLD
1
0 1S M I T H S G R O U P P L C A N N U A L R E P O R T F Y 2 0 2 0
2
3
44
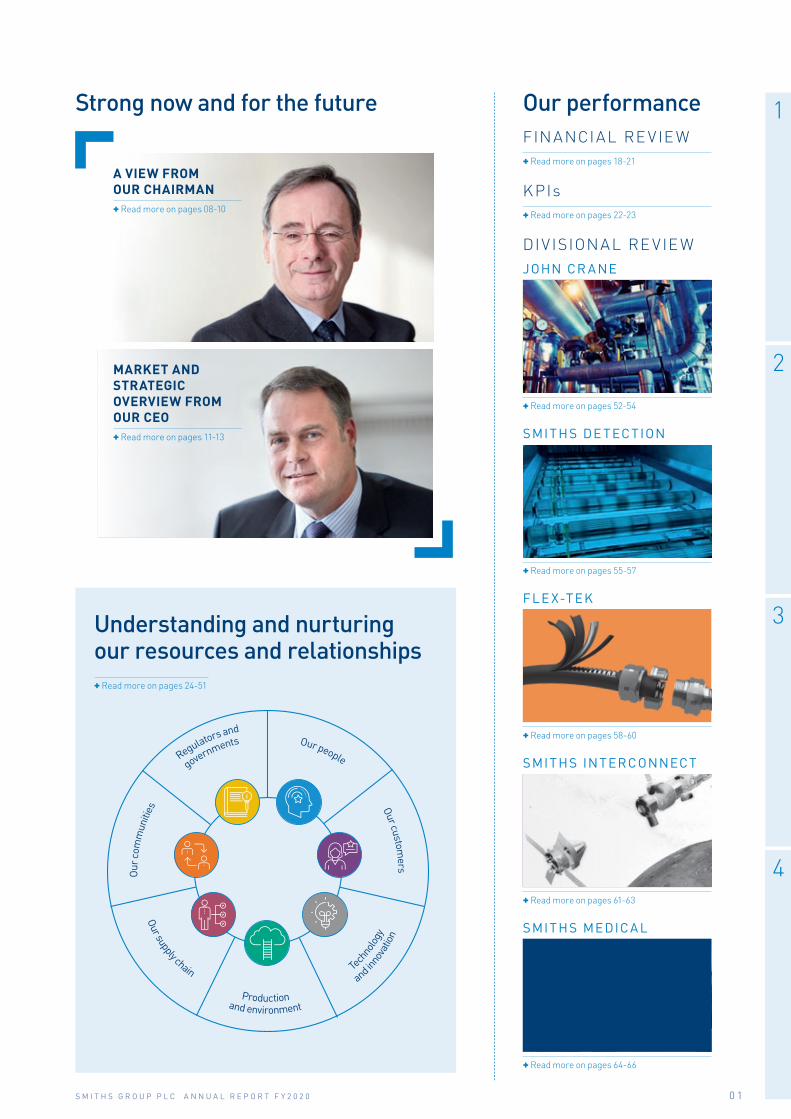
Strong now and for the future
Understanding and nurturing our resources and relationships+ Read more on pages 24-51
Our performanceFINANCIAL RE VIE W + Read more on pages 18-21
KPIs+ Read more on pages 22-23
DIV ISIONAL RE VIE W JOHN CR A NE
+ Read more on pages 52-54
SMITHS DE TECTION
+ Read more on pages 55-57
FLE X-TEK
+ Read more on pages 58-60
SMITHS INTERCONNECT
+ Read more on pages 61-63
SMITHS MEDICA L
+ Read more on pages 64-66
A VIEW FROM OUR CHAIRMAN+ Read more on pages 08-10
MARKET AND STRATEGIC OVERVIEW FROM OUR CEO+ Read more on pages 11-13
Our
com
mun
ities
Our people
Our customers
Our supply chain
Production
Te
chno
logy
and inn
ovat
ion
governmentsRegulators and
and environment

www.smiths.com

C O N T E N T S
1 OV ER V IE WOur purpose IFC
In this year’s report 01
FY2020 financial summary 02
Our business at a glance 04
2 S TR ATEGIC REP ORTOur business model 06
Chairman’s statement 08
Chief Executive’s Q&A 11
Our Executive Committee 14
Our strategy 15
Strong financial framework 18
Key performance indicators 22
Resources and relationships 24
– Ethics and our values 26
– Our people 27
– Our customers 34
– Technology and innovation 37
– Production and environment 40
– Our supply chain 46
– Our communities 48
– Regulators and governments 51
Divisional review 52
– John Crane 52
– Smiths Detection 55
– Flex-Tek 58
– Smiths Interconnect 61
– Smiths Medical 64
Risk management 67
Going Concern and Viability Statement 77
Non-Financial Information Statement 79
Section 172 Statement 80
3 GOV ERN A NCEChairman’s introduction 82
Directors’ biographies 84
Board governance 88
Engagement with stakeholders 90
Board activity in FY2020 92
Nomination & Governance Committee Report 96
Audit & Risk Committee Report 102
Remuneration Committee Report 108
Directors’ Report 130
Statement of Directors’ responsibilities 132
4 F IN A NCI A L S TATEMENT SIndependent auditors’ report 135
Consolidated primary statements 144
Accounting policies 149
Notes to the accounts 158
Unaudited five-year Group financial record 205
Unaudited US dollar primary statements 206
Smiths Group plc Company accounts 212
Subsidiary undertakings 220
Shareholder information 229
Some of the photographs used in this Annual Report were taken before the COVID-19 pandemic

O V E R V I E W
0 2 S M I T H S G R O U P P L C A N N U A L R E P O R T F Y 2 0 2 0
F Y 2 0 2 0 F I N A N C I A L S U M M A R Y
Headline1 Statutory
FY2020£m
FY2019£m
Reportedgrowth
Underlying2
growthFY2020
£mFY2019
£mReported
growth
Smiths Continuing Operations3
Revenue 2,548 2,498 +2% (1)% 2,548 2,498 +2%
Operating profit ex. restructuring and write-downs4 382 427 (11)% (13)%
Operating profit 327 427 (23)% (13)% 241 326 (26)%
Smiths Medical – Discontinued Operations3
Revenue 918 874 +5% +4%
Profit after tax 139 112 +24% (3)% 200 85 +135%
Total Group5
Profit for the year 338 385 (12)% 267 227 +18%
Basic EPS 84.8p 96.8p (12)% (12)% 66.9p 56.8p +18%
Free cash-flow6 273 234 +17%
Dividend 35.0p 45.9p (24)% 35.0p 45.9p (24)%
The following definitions are applied throughout the document and are Alternative Performance Measures (APMs) as defined in note 30 to the financial statements:
1 Headline: In addition to statutory reporting, the Group reports on a headline basis. Definitions of headline metrics, and information about the adjustments to statutory measures are provided in note 3 to the financial statements.
2 Underlying modifies headline performance to adjust prior year to reflect an equivalent period of ownership for divested businesses, exclude the effects of foreign exchange, acquisitions, restructuring costs and write-downs, and add back the depreciation and amortisation of discontinued operations for comparability purposes. Alternative performance measures are defined in note 30 to the financial statements.
3 Continuing Operations excludes Smiths Medical which is accounted for as ‘discontinued operations – businesses held for distribution to owners’. Discontinued Operations is defined in note 28 to the financial statements.
4 Restructuring and write-downs as defined in note 2 to the financial statements. Alternative performance measures are defined in note 30 to the financial statements.
5 Total Group comprises Continuing Operations and Discontinued Operations.
6 Defined in Note 30 to the Financial Statements.
The Group delivered a robust performance in uncertain markets, supported by its market-leading positions and flexible business model.
FY2020 financial summary+ Read more in the Strong financial framework section
on pages 18-21

1
0 3S M I T H S G R O U P P L C A N N U A L R E P O R T F Y 2 0 2 0
UNDERLYING REVENUE GROWTH*
FY2019: +3%
(1)%A resilient performance driven by strong order books and a high proportion of aftermarket revenue.
HE A DLINE UNDERLY ING OPER ATING M A RGIN*
FY2019: 17.1%
15.0%Margin decline driven by lower volumes combined with temporarily higher costs to ensure business continuity during the pandemic.
FREE CA SH-FLOW 1 ( TOTA L GROUP)
FY2019: £234m
£273mStrong cash generation is a key characteristic of the Group, with free cash-flow up 17% and cash conversion1 at 123%, an outstanding performance.
NE T DEBT 1/EBITDA1 ( TOTA L GROUP)
FY2019: 1.8x
1.7xNet debt/EBITDA at 1.7x, 1.9x including restructuring costs and write-downs, reflecting the Group’s robust balance sheet.
* Continuing Operations. See page 02 for definition of underlying
BA SIC HE A DLINE EP S ( TOTA L GROUP)
FY2019: 96.8p
84.8pBasic headline EPS down (12)% to 84.8p driven by reduced profitability.
DI V IDEND PER SH A RE ( TOTA L GROUP)
FY2019: 45.9p
35.0pTotal dividend of 35 pence per share reflecting delayed interim dividend of 11 pence per share and proposed final dividend of 24 pence per share.
* Continuing Operations. See page 02 for definition of underlying
1 Defined in Note 30 to the Financial Statements 1 Defined in Note 30 to the Financial Statements

O V E R V I E W
0 4 S M I T H S G R O U P P L C A N N U A L R E P O R T F Y 2 0 2 0
O U R B U S I N E S S A T A G L A N C E
We have operations in more than 50 countries
Energy
Security and defence
Space and aerospace
General industry
Serving our target global markets
Through our four core divisions
Security and defenceOur threat detection equipment helps keep people and assets safe. Demand in the security market is mainly driven by persistent and evolving terror threats and changing security regulations. Aftermarket opportunities rise as the installed base grows. The defence market is served by Smiths Detection through imaging and sensing detection products and by Smiths Interconnect through secure connectivity solutions. Growth in this market is primarily driven by defence and security spending.
General industryCustomers put their trust in our products and services to support a wide range of general industrial applications in sectors including petrochemical, mining, pulp & paper, water treatment, semiconductor testing, heating elements, automotive and rail transportation. These sectors and others are served by John Crane, Smiths Interconnect and Flex-Tek, with growth generally tracking increases in GDP worldwide.
EnergyJohn Crane’s mechanical seals and systems support energy operations worldwide including downstream and midstream oil & gas and power generation. Growth is driven by long-term increases in global demand for energy, productivity, and enhanced environmental and safety requirements. There is a growing requirement for aftermarket and service contracts.
Space and aerospaceSatellite launches, deep space exploration and emerging activities such as asteroid mining are driving demand for high-reliability solutions in the space market. Growth in aerospace is coming from new fuel-efficient aircraft and increasing passenger numbers, freight traffic and military spend. Flex-Tek provides hydraulic hoses and fuel lines for airframes and engines and Smiths Interconnect supplies ultra high-quality connectors, microwave components and antenna systems for aircraft and satellite communications.
John Crane
Flex-Tek
Smiths Interconnect
Smiths MedicalDiscontinued Operations
Smiths Detection
G R O U P R E V E N U E
36.8%
G R O U P R E V E N U E
32.4%
G R O U P R E V E N U E
23.5%
G R O U P R E V E N U E
7.3%
R E S T O F T H E W O R L D
9%
A S I A P A C I F I C
18%
A M E R I C A S
50%
E U R O P E
23%
R E V E N U E B Y D E S T I N A T I O N *
£2,548m

1
0 5S M I T H S G R O U P P L C A N N U A L R E P O R T F Y 2 0 2 0
R E S T O F T H E W O R L D
3%
A S I A P A C I F I C
18%
A M E R I C A S
46%
E U R O P E
33%
E M P L O Y E E S B Y R E G I O N * + Read more about our divisions on pages 52-66
Mission-critical solutions for global energy and process industries
Innovative components to heat and move fluids and gases
Solutions for high-speed, secure connectivity in demanding applications
Quality medical devices and consumables that are vital to patient care
– A global leader in mission-critical technology for rotating equipment
– Strong proprietary technology and expertise in applied engineering
– Broad installed base in energy and industrials
– Strong aftermarket service offering with more than 200 sales and service centres
– Long-term customer relationships
– High performance products – Leading capability in design and manufacture
– A leader in residential gas tubing products – High performance flexible tubing for aerospace
– Strong customer relationships
– Innovative and technically differentiated products
– High-reliability solutions used in demanding applications
– Strong research and engineering capabilities
– Customer intimacy and product customisation
– Global reach and support
– A category leader in served segments – Trusted brands with a reputation for safety – Strong, defensible intellectual property – C.80% of revenue from single-use devices and proprietary consumables
– Strong customer relationships and extensive global sales network
R E V E N U E
£955mH E A D L I N E U N D E R L Y I N G O P E R A T I N G P R O F I T M A R G I N
21.5%
R E V E N U E
£478mH E A D L I N E U N D E R L Y I N G O P E R A T I N G P R O F I T M A R G I N
17.6%
R E V E N U E
£309mH E A D L I N E U N D E R L Y I N G O P E R A T I N G P R O F I T M A R G I N
10.1%
Detection and screening technologies for the identification of safety and security threats
– A global market leader with differentiated technologies leveraged across a broad range of markets
– Significant R&D capability – Operating in regulated markets that require product certification
– Increasing digitisation and aftermarket revenue
– Long-term customer relationships
R E V E N U E
£806mH E A D L I N E U N D E R L Y I N G O P E R A T I N G P R O F I T M A R G I N
13.9%
R E V E N U E
£918mH E A D L I N E U N D E R L Y I N G O P E R A T I N G P R O F I T M A R G I N
15.5%
>14,000
* Continuing Operations

0 6 S M I T H S G R O U P P L C A N N U A L R E P O R T F Y 2 0 2 0
S T R A T E G I C R E P O R TO U R B U S I N E S S M O D E L
We actively manage our portfolio of businesses. They operate in growing markets where we can achieve a sustainable top three leadership position. Our businesses share the same characteristics which shape how we create value.
Our businesses are defined by four characteristics
TECHNOLOGY DIFFERENTIATION
HIGH PROPORTION OF AFTERMARKET
AND SERVICES
INCREASING DIGITISATION
SUSTAINABLY COMPETITIVE AND
ASSET LIGHT
Underpinned by the Smiths values and our commitment to doing business responsibly and sustainably
Our operating model is supported and driven by the Smiths Excellence System (SES).
Our shared operating model and culture is centred on People, Innovation and Execution
+
Our business model – the Smiths Way
Our Smiths values guide how we behave. Our values and our commitment to doing business responsibly are more than just words. They influence every decision and help to make Smiths a place where people want to work, an organisation that is valued, and one that people want to do business with.
InnovationTechnology and innovation are driving the future of Smiths. Our Group-wide innovation framework fosters a disciplined, future-focused culture aligned with our purpose and strategy. This helps us translate our expertise and insight into transformative new ways of working, products, services and business models.
PeopleOur people are vital to the success of Smiths. We work to attract, retain, develop, engage and inspire the very best.
ExecutionWe aim for consistent and flawless execution. Capability, collaboration across internal and external expert networks, and a relentless focus on continuous improvement enable us to move fast and deliver solutions, quality and value for our stakeholders.

0 7S M I T H S G R O U P P L C A N N U A L R E P O R T F Y 2 0 2 0
2
Maximising value for our stakeholders
Measures above based on Total Group
PeopleB E L O N G I N G S C O R E
70My Say engagement survey: I feel a sense of belonging at Smiths
S A F E T Y R I R
0.30Recordable incident rate per 100 colleagues
Society and the environmentD I R E C T E C O N O M I C C O N T R I B U T I O N
£2.8bnEmployee costs + supplier costs + tax paid
G H G R E D U C T I O N
(46)%Greenhouse gas reduction since FY2007
Customers and suppliersO T I F
86%On time in full
C O P Q
1.4%Cost of poor quality
ShareholdersU N D E R L Y I N G E P S
84.8pFY2019: 96.8p
+ See underlying definition on page 02
D I V I D E N D
35.0pFY2019: 45.90p
ExcellenceThe Smiths Excellence System is
embedded into our operations and functions. Supported by the SES
Academy, it has created one language for excellence at Smiths that is advancing
skills, best practice and continuous improvement across our SES pillars:
Customer, People, Technology, Programme, Production and Supply.
+ Read more on our stakeholders in the Resources and relationships section on pages 24-51

0 8 S M I T H S G R O U P P L C A N N U A L R E P O R T F Y 2 0 2 0
S T R A T E G I C R E P O R TC H A I R M A N ’ S S T A T E M E N T
Seeing round the corner
During that previous ‘08–’09 recession, I was the Chairman and Chief Executive Officer of 3M Co in Minnesota, USA. It’s helpful to contrast these two difficult periods and translate the lessons learned from the Lehman downturn to the impacts of the COVID-19 pandemic. Something which has probably been forgotten is that we were then suffering another epidemic caused by the Influenza A, subtype H1N1 ‘Swine Flu’ virus. That lasted from March 2009 until April 2010 while we were all busily distracted by the economic downturn. In the United States alone, there were about 60 million people infected by the H1N1 virus, with around 275,000 hospitalisations but, luckily, there were only 12,000 deaths, all tragic of course. Six hundred million people were infected by H1N1 worldwide.
In crises like these, there are always two primary forecasting challenges. The first is to understand how long an economic contraction will last, and the second is to know how deep it will go. In ‘08-’09, the difficult problem was to calculate the length of the contraction, while the easier part was to figure out how deep it would become. The opposite is the case in the COVID-19 contraction.
Because pandemics and epidemics are what engineers and physicists call ‘diffusion phenomena’, the mathematics is well understood and relatively predictable for a single disease outbreak. The curve of disease penetration in the population has the classic elongated ‘ess’ shape over time, and the number of active infections closely approximates a ‘Normal’ distribution (often called a Bell curve), with time on the horizontal axis. A single contained outbreak lasts about four and one-half months.
More difficult to predict is the compounding impact of secondary outbreaks – always likely – because they overlap and extend the duration of the pandemic. The rate of infection curve looks like multiple Normal distributions added together, not unlike the shape of the double humps on a Bactrian camel. We know the only way to prevent secondary outbreaks, pre-vaccination, is to restrict human contact in larger groups or to provide suitable PPE protection. Secondary, tertiary, or even further disease episodes will continue until an effective vaccine is found and a vaccination programme completed. Alternatively, we must wait until a state of ‘herd immunity’ is reached. That requires about 70% of the population to be infected with the disease. Hardly something for us to look forward to at the mortality rates we’ve been seeing. The safety of our employees and communities is paramount in these circumstances, and that has been an enormous focus for Smiths during the current pandemic crisis.
Inventory control and cash collection in downturnsHealth conditions apart, the big challenge over the next two to three years will be maintaining or improving a company’s cash position. In typical soft economic downturns, those driven by normal cyclicality, cash generation usually gets better as the economy contracts, and end market demand falls. Why? Cash isn’t needed to grow, inventory can be sold off, and receivables collected. Production line rates are cut to control inventory, so cost absorption decreases and operating income falls. Although EPS falls, cash generation is still strong in mild downturns. However, in severe downturns like the one in ‘08–‘09, it’s a very different proposition. Cash generation can be much weaker because demand falls sharply, so liquidating inventory is difficult, and debtors may be unable to pay. It’s why companies must take vigorous countermeasures to these problems early and why it dictates companies do nothing which can upset, temporarily or otherwise, their cash-flow.
Supply chain demand transientsBut it can get much worse. These situations are highly dynamic. Depending on the length of the supply chain, demand falls much faster than the end markets as each step in the supply chain overcompensates for falling demand and amplifies its effect. This is sometimes called the Forrester Effect. Demand contraction is much worse than economic forecasts suggest. To give readers an idea of scale, this transient amplification factor is about 3.0–4.0 for typical industrial companies. So, if the end market falls by 10%, this exhibits itself as a 30–40% fall at the OEM level. A staggering loss of demand to deal with. The same phenomenon occurs when markets recover, except demand then overshoots, as new inventory is being built.
The next question is, how long will this amplified fall in demand last? The answer depends on the efficiency of the supply chain. A 100% efficient supply chain will clear excess inventory in one turn. But no supply chain is ever 100% efficient. If it were a more practical 50%, the excess would be removed in two turns etc. For an industrial company with three or four inventory turns annually, these effects might last for six months to one year.
The COVID-19 pandemic has had the most significant economic and social impact on the world since the so-called ‘Lehman’ global financial crisis and economic downturn in 2008-2009. It may yet prove to be the most impactful since the great depression of the 1930s.

0 9S M I T H S G R O U P P L C A N N U A L R E P O R T F Y 2 0 2 0
2
The most significant strategic decision we’ve taken in the last six months is to postpone the separation of our Medical business. The most urgent challenge was to deal with the COVID-19 pandemic and all that it implies, both in end market demand, employee safety, supply chain challenges and cash management, etc. You can imagine the enormous demands on management and Board time as we wrestled with the vicious COVID-19 tiger. The number of Board level meetings tripled, and management meetings quadrupled, all dealt with using the newly emerging video conferencing and collaboration tools. Outside of our factories, most of it done working from home in roughly 20 different time zones across the world.
The challenge a company faces at times like these is to understand whether, figuratively, they are falling off a 4,000-foot cliff or just into a 4-foot ditch. And you don’t know which until you reach the bottom. Prudence, therefore, dictated we postpone the Medical business separation and focus our efforts on managing the impacts of COVID-19. In any event, capital markets were uncertain and cash was tight or unsure. We did this until the effects of the pandemic became more transparent and the economic environment more stable. Unfortunately, COVID-19 and its economic effects are not finished with us yet.
When might stability return?The ‘main event’ on the pandemic stage is developing an effective vaccine, ramping up manufacturing capacity to meet global demand, and completing a worldwide vaccination programme. Even then, confidence needs time to build before people act more positively at home or work, creating needed demand. Almost certainly, immunity will not be 100% and will need to be boosted periodically, just like winter flu and tetanus shots. Undoubtedly some people will even refuse vaccination on principle. The US Government has placed orders with us for around 80 million hypodermic syringes and has contracted for vast amounts of vaccine doses from pharmaceutical companies. When might all that be in place?
Meanwhile, it feels like the company is selling into a market much worse than the GDP or IPI numbers suggest. Financial planners need to consider these dynamics, not just the GDP or IPI averages. And when cash generation is under pressure, the transients can be the difference between a company’s strength and a company’s struggle. In any real-life structure or system, it’s the point loading that causes failure, not the average. So it will be with a company’s cash management.
What will happen to Smiths individual reporting segments?As I mentioned a couple of years ago, Niels Bohr once said that “forecasting is difficult, especially when it concerns the future”. Nevertheless, no matter how difficult it is, companies are obliged to give the best advice they can to investors about the future as they see it.
Luckily, Smiths has a wide range of end markets and it is this diversity which helps limit volatility to some degree. Pure-play companies often grow faster than conglomerates in expanding economies, but conglomerates are usually better performers in downturns because their risks are more widely spread. In 2009, the US automotive OEM component market fell by 50%, while the automotive aftermarket fell by only 4%. People still drove cars and had accidents that needed to be repaired, and vehicles experienced wear and tear. Discretionary consumer electronics fell by 80%, but the industrial electronics market only lost 9%, very much in line with the shrinking GDP number. In 2009, in the healthcare field, discretionary orthodontics demand fell by 10%, while the dental market dropped by only 2%.
In contrast, medical supply increased by 4%, because people can’t choose when they get sick. For completeness, food staples fell by 0.5%. So, you can see the wide variability of end market demand contractions, even inside conglomerates.
Smiths largest markets are in airport and airline security, oil & gas, aerospace and the medical segments. All these markets will contract, except medical, which is still doing well. The aerospace industry, including airlines, will be the worst affected, and by most estimates will take four or more years to recover fully. While holiday and incidental travel are likely to rebuild reasonably quickly, an anticipated fall in business travel is expected to cause a slow recovery for the airline and associated industries because this is where their profits are the largest. There is also worrying evidence that long haul flights are a source of infection clusters via aerosol transmission and this is bound to elicit caution.
This isn’t the complete picture for Smiths by any means, because we service other smaller markets in defence, telecommunications, construction and medical capital equipment, significantly spreading the risk. Moreover, we have invested heavily in innovation and, though progress has been slower than we would like, in time it will enable us to take market share and provide above-market growth. On the other hand, we are not immune to demand perturbations in the markets we serve.

1 0 S M I T H S G R O U P P L C A N N U A L R E P O R T F Y 2 0 2 0
S T R A T E G I C R E P O R TC H A I R M A N ’ S S T A T E M E N T C O N T I N U E D
There are reputed to be hundreds of vaccine development programmes underway worldwide for COVID-19 with thirty at an advanced stage. At the time of writing, scores of thousands of people are involved in phase 2/3 clinical trials across the world. The UK Secretary of State for Health has said he does not expect a vaccine to be available until 2021, though other countries are more optimistic. We have already experienced the challenge of COVID-19 testing, so administering billions of vaccination shots will inevitably run into problems. Any delay there will produce delays in economic recovery. An educated guess is the vaccination programme will not be completed until late summer or possibly autumn of 2021. It’s only after this point that we can begin to think about a gradual, and perhaps still extended return to economic normality, whatever ‘normal’ means. GDP cycles are – please forgive the mathematics speak – sinusoidal, so are ‘soft bottomed’. And IMF forecasts are suggesting a much slower return to normal than had hitherto been thought.
EconomicsThe IMF forecast for the UK economy in 2020 is a contraction of 10.2% and for the US a fall of 8.0%. These are equivalent year-over-year GDP swings of about 13% and 11% respectively. Recognising that the first calendar quarter of 2020 was unaffected by COVID-19, correcting for the full-year effects would make the year-over-year swing around 16% and 14% respectively. Unemployment rates will lag GDP but will reach similar levels if income support is not renewed, and we should fear this more than anything. These numbers are almost 50% larger than the contraction we saw in 2009, so 2021 and possibly 2022 and beyond are going to be very difficult economically. It’s like having the entire Chinese economy removed from the world economy. This recession is going to hurt – and for some time.
There is a simple rule in economics which states that ‘if there are no buyers, then there will be no sellers’. In other words, it’s all about demand and, therefore, it’s about government stimulus packages, unemployment support and the consequent timing and strength of a recovery. If governments do not act decisively, there is the prospect of high unemployment and potential problems with poverty, hunger, social unrest, and falling prices. Not even rich governments can afford to support significant numbers of their population very long. So, getting the various economies back to work is essential.
In conclusion2021 will be another challenging year economically, and it will probably take several years to recover to the same economic level as 2019. So, for now, prudence will be the order of the day in managing Smiths. However, we’ve seen that the winners in this COVID-19 downturn are the innovators. It’s been the innovators in health care (Astra Zeneca, Pfizer etc.), electronics (ARM) and communications (Teams, Zoom, Vidyo), in delivery systems (Amazon), in grocery supply (Ocado), and in consumer goods (Reckitt Benckiser) who have done well in this pandemic. So it will be in the future. Right now, innovation is the cheapest and fastest way to change the future.
Rapid innovation is straightforward in electronics, software and service. However, in some areas of heavy manufacturing even great engineering companies like Rolls-Royce, through no fault of their own, have been hurt by a narrow focus on air transport and their long-term, high capital development needs. Similarly, so for Boeing and Airbus. Giant oil and gas companies are equally challenged, as are many mining companies. Economics does not treat companies with long development cycles very well.
Finding new profitable growth will be much more challenging for the next few years than it has been previously. But as Smiths innovation programmes begin to bear more fruit – and it is still early days in that regard – we are better positioned than many industrial companies. Prudence remains the immediate order of the day, together with careful cash management and innovation. These are the recipes for survival and success. Innovation is where we need to execute better and faster.
Thank you for maintaining your support of Smiths in this challenging time for all. It is very much appreciated.
George W BuckleyCHAIRMAN
PRUDENCE REMAINS THE IMMEDIATE ORDER OF THE DAY, TOGETHER WITH CAREFUL CASH MANAGEMENT AND INNOVATION. THESE ARE THE RECIPES FOR SURVIVAL AND SUCCESS.

1 1S M I T H S G R O U P P L C A N N U A L R E P O R T F Y 2 0 2 0
2
C H I E F E X E C U T I V E ’ S Q & A
Strong now and for the future
The strength and flexibility we have built into our business, and the benefits of the Group’s strategic positioning, underpinned a robust performance in challenging market conditions.
Our priorities remain the safety of our people and keeping the business running flawlessly to support customers. I’m incredibly grateful to our amazing people for their dedication in difficult times, which ensured we delivered in the year and continue to maximise opportunities for future growth.
We have continued to enhance the Group’s strategic positioning, through execution of the restructuring programme, completion of three further bolt-on acquisitions and our unchanged commitment to separate Smiths Medical.
We are seeing a stabilisation of recent trends; but we are not complacent and are continuing to strengthen the business to deliver sustainable outperformance in the future.
Q How has Smiths fared during the COVID-19 pandemic?A Our business has proven itself to be resilient by design during a period of unprecedented global disruption. Our market-leading positions, flexible business model and focused strategy have provided the momentum to support our performance in the short term and the agility to maximise opportunities for future growth. This has not been by chance, but part of the planned and strategic changes we have made to the Group over the last five years.
We have focused Smiths on businesses with the same core characteristics: technologically differentiated with increasing digitisation; a high proportion of aftermarket and services; and sustainably competitive and asset light. All things we do very well and make great business sense. These characteristics have supported our resilience with products and services that are at the forefront of their markets, with recurrent aftermarket revenues and an inherently low fixed cost base to maximise our flexibility.
Having defined the types of business we want to own and run, we have applied a consistent strategy to maximise value creation. The three pillars of our strategy are: outperforming our chosen markets; delivering world-class competitiveness; and maintaining our strong financial framework. We do this through a simple and clear approach to innovation, operational excellence and people.
We’ve actively managed our portfolio of businesses to be targeted in growing markets where we can sustainably achieve a position of top three leadership, with 90% of the Group now well positioned; up from 60% in 2016. It is these leadership positions that provided momentum for the business at the outset of the pandemic and that have helped us continue to win new business. This has resulted in Smiths achieving reported growth of 3%, despite significant global disruption arising from the pandemic in some of our end markets.
I’m incredibly proud of the way Smiths has performed this year, including how we are responding during the unprecedented period of the COVID-19 pandemic. Our priorities throughout the pandemic have been the safety of our people, keeping our business running, and supporting our customers. Thanks to the amazing dedication and professionalism of our people, we have responded with great agility and demonstrated the strength and resilience we have built into our company and our ability to move fast and decisively, taking advantage of the opportunities which presented themselves.
Smiths entered the COVID-19 pandemic from a position of strength operationally, financially and strategically. While we remain vigilant, and are not complacent about the ongoing uncertainty, we are confident that we’re managing today well and taking the right actions to continue enhancing the strength of the Group so that we’re better positioned to deliver consistent market outperformance in the long term.
I convey my sincere and heartfelt thanks to everyone at Smiths, a formidable team. I could not have asked for more from anyone.

1 2 S M I T H S G R O U P P L C A N N U A L R E P O R T F Y 2 0 2 0
S T R A T E G I C R E P O R TC H I E F E X E C U T I V E ’ S Q & A C O N T I N U E D
We are focused on consistent and flawless execution through our shared operating model (the Smiths Excellence System), and on driving sustainable competitiveness through targeted investment in innovation and disciplined M&A. This focus has enabled us to rapidly adapt our processes and working practices and to maintain exceptional customer service despite difficulties across the world in our supply chains. These adapted processes have come with higher consequential costs, which have temporarily impacted our operating margins, but we are laser-focused on mitigating these and improving operational efficiency as we move forward.
We’ve remained committed to delivering innovative solutions for our customers, driven by our technological differentiation and this, in turn, has led to new business wins, such as Smiths Detection’s automatic baggage tray disinfection system using UVC light which has already been installed at two leading airports in the UK and is being trialled at multiple airports globally.
Underpinning our performance this year, and every year, is our strong financial framework. The cash generative nature of our businesses and the highly focused efforts of the team, day in day out, to manage cash during the pandemic drove strong cash conversion of 123% this year. We continue to have a strong balance sheet with more than £1bn of liquidity headroom and net debt to EBITDA of 1.7x at the end of the year.
Q What actions has the business taken in response to COVID-19?A Led by our Smiths Group Crisis Core team, our response has been focused on keeping our people safe, keeping the business running, and supporting our customers. Infection control measures are in place right across our operations and I’ve seen some amazing examples of collaboration and innovation to support this; for example, colleagues at John Crane 3D printing elbow-operated door handle attachments and the in-house production of face coverings.
Supporting our team practically, nurturing wellbeing, and communicating comprehensively have been another important focus. With alternating shift patterns, no travel, and many people working from home, our strong enterprise IT response and bespoke COVID communication resources have kept our teams connected with universal access to guidance and support materials.
Since the start of the pandemic, we’ve managed our operational response through our Operations and Supply Nerve Centre (OSNC), helping over 90% of our manufacturing sites to remain in production through the pandemic. Our frontline workers have worked safely around the clock to create and distribute products and support our customers. We have continued to drive these new ways of working as the operational disruption has stabilised to ensure the great collaboration and best practice sharing continues globally.
We’re especially proud of the collaborative efforts to produce products to help the fight against COVID-19. These include the significant ramp up in production of Smiths Medical paraPAC plus™ ventilators and other devices, and Smiths Interconnect and Flex-Tek’s production of critical connectors and hoses for ventilators.
Maintaining continuity of service in our aftermarket activities, while keeping our people safe, has also been a vital part of our response. This has included finding new ways to deliver services, for example the introduction of remote inspection of seals at customer sites by John Crane using Augmented Reality.
Q Why was the separation of Smiths Medical postponed and when will it restart?A The previously announced separation of Smiths Medical, that was on track to be delivered in the first half of calendar year 2020, had to be postponed. It was simply not practicable to complete the separation during such an uncertain time. We needed to focus on navigating the external challenges presented by COVID-19 – including the delivery of ventilators and other critical care devices.
Maintaining this operational focus has been validated by Smiths Medical’s performance this year, with underlying revenue growth of 4%. The intention and rationale to separate remains unchanged and the process will be restarted later this year.
Q Have there been any changes to your strategy for future Smiths?A Our strategy and ambition are unchanged. We continue to execute against our plan, taking the necessary actions and making the required investments to shape the future of Smiths and deliver long-term growth and outperformance.
We are, however, very focused on ensuring we take advantage of the organic and inorganic opportunities which the crisis presents, including new business models and ideas for the new ways of working which are emerging around the world.
Targeted investment in innovation will remain a key driver of the business as we address new trends and meet the needs of a changing world, making it safer, more efficient and better connected. There have been some great examples of innovation across the Group this year including Smiths Interconnect’s new laboratory with the unique capability to replicate the environmental pressures of deep space for product testing, as well as continued work from our Digital Forge centre of excellence on accelerating the digital transformation of the Group.
This organic capability will continue to be complemented by a parallel path of disciplined M&A to accelerate our progress. A recent example of this was Smiths Detection’s bolt-on technology acquisition of PathSensors Inc..
OUR STRATEGY AND AMBITION ARE UNCHANGED. WE CONTINUE TO EXECUTE AGAINST OUR PLAN, TAKING THE NECESSARY ACTIONS AND MAKING THE REQUIRED INVESTMENTS TO SHAPE THE FUTURE OF SMITHS AND DELIVER LONG-TERM GROWTH AND OUTPERFORMANCE.
1 3S M I T H S G R O U P P L C A N N U A L R E P O R T F Y 2 0 2 0
2
This acquisition strengthens our biological detection capability, building on our existing expertise. The technology can detect the presence of a virus in an individual and the viral load in the air in confined spaces. It is a great example of externalising R&D investment, where it would have simply taken us too long internally.
In June, we announced an important strategic restructuring programme which brought together initiatives already under development across the Group aimed at increasing our flexibility and speed and helping accelerate progress towards our target margin range of 18-20%. While the programme was not a response to the COVID-19 situation, the resulting improvements will help us to emerge stronger and better positioned for consistent market outperformance in the long term.
The programme spans all of our divisions and includes a number of actions to improve the efficiency of our Group support functions, as well as optimising our global footprint and supply chains. It has led to some very tough decisions and, regrettably, some job losses across the organisation, although this has affected only a small percentage of our workforce overall.
These were difficult but necessary steps to build further resilience and ensure that Smiths is able to continue to deliver long-term growth and outperformance, while providing secure and stable employment to as many colleagues as possible.
Q How important is the Group’s environmental and social impact to your overall strategy?A We believe that doing business responsibly is the right thing to do for our stakeholders. Through our innovative technology and services and our people, bringing solutions which serve sustainability and efficiency, higher safety and security, and the connectivity of the world in all its forms, is our driving purpose. It underpins our business performance and the long-term sustainability and resilience of Smiths and, rightly, is governed at the highest levels of our organisation.
We have a strong track record on environmental performance. Through an ambitious goal setting process in place since 2007, Smiths is proud to have achieved significant emission reductions from 2007 to present. We also support more transparency on environmental matters as a catalyst for driving change.
Innovation is at the heart of everything we do at Smiths and this is also true of our approach to our environmental and social impact. We have many examples in our portfolio of technologies and new product development that will enable a smarter, greener future, such as John Crane’s dry gas seals that help to reduce methane emissions. We continue to look for ways to reduce our own emissions and use of precious resources such as energy and water, supported by ambitious targets. We are currently discussing our FY2022-FY2024 goals.
We also want to be positive contributors to our local communities, playing a beneficial role by supporting job creation, operating safely and ethically, and engaging directly through fundraising, charitable giving and educational initiatives. After a successful pilot by Smiths Interconnect in 2019, our planned Group-wide adoption of the Beyond Boundaries initiative, where colleagues are empowered to spend a working day supporting good causes in their communities, was unfortunately put on hold due to the pandemic. Strong relationships with our communities are both positive for business and promote a sense of pride in our people as they live our Smiths values.
The safety and security of our people and operations has always been our number one priority and has remained our key focus throughout COVID-19. We have a very robust safety culture and strive for a zero-harm workplace, with safety considerations fully integrated into all our activities. I’m extremely pleased to report that we recorded our best-ever safety performance this year.
I’d like to pay tribute to the amazing dedication, commitment and contribution our colleagues have made to keeping themselves and others safe while helping us to continue to operate and serve our customers. Much effort has gone into understanding, respecting and supporting individual circumstances and balancing these with the needs of the business. Through our actions and words, I believe we’ve truly demonstrated that we’re one Smiths family living the Smiths Way culture and values every day.
Q How is the Group positioned for FY2021?A Guidance remains withdrawn, given the uncertain depth and duration of the COVID-19 pandemic.
We are seeing a stabilisation of recent trends, with Total Group underlying revenue of (5)% for May-August 2020 (continuing operations (8)%).
The first half of FY2021 will continue to cycle against pre-COVID comparators. The Group’s seasonality normally results in a second-half weighted revenue profile.
It is anticipated that the restructuring programme will incur £(30)m of costs spread evenly through the year, whilst the matching savings will be 70% weighted to the second half.
This is all underpinned by the Group’s strong financial framework and robust balance sheet, and supports confidence that we will deliver long-term sustainable outperformance.
Andy Reynolds SmithCHIEF EXECUTIVE
I’D LIKE TO PAY TRIBUTE TO THE AMAZING DEDICATION, COMMITMENT AND CONTRIBUTION OUR COLLEAGUES HAVE MADE TO KEEPING THEMSELVES AND OTHERS SAFE WHILE HELPING US TO CONTINUE TO OPERATE AND SERVE OUR CUSTOMERS.

1 4 S M I T H S G R O U P P L C A N N U A L R E P O R T F Y 2 0 2 0
S T R A T E G I C R E P O R TO U R E X E C U T I V E C O M M I T T E E
1239 8 7 5 46
Our Executive Committee
+ More information is available on our website
Our Executive Committee is responsible for implementing our strategy, ensuring consistent execution, and embedding our culture and values.
2. JOHN SHIPSEY Chief Financial OfficerJoined Smiths in 2017. Background: CFO at Dyson for 12 years; 13 years in senior finance and strategy roles at Diageo plc. For full biography see page 84.
5. JULIAN FAGGEGroup Strategy and M&A DirectorPresident, Flex-TekJoined Smiths in 2013 as Group Financial Controller. Appointed Group Strategy and M&A Director in 2017. Appointed President of Flex-Tek in 2019. Background: Royal Caribbean Cruises; Procter & Gamble; PwC.
8. MEL ROWLANDSGroup General Counsel Joined Smiths in 2013. Appointed Group General Counsel in 2018. Previously Company Secretary and Deputy Group General Counsel. Background: BG Group plc; Linde AG; Edwards Group; Centrica plc.
1. ANDY REYNOLDS SMITHChief ExecutiveJoined Smiths in 2015. Background: Chief Executive, Automotive, GKN plc; Ingersoll Rand; Siebe plc and Delphi Automotive Systems. For full biography see page 84.
4. ROLAND CARTERPresident, Smiths Detection President, Asia Pacific Joined Smiths in 1991. Appointed President of Asia Pacific in 2017 and President of Smiths Detection in 2018; previously President of Smiths Interconnect and Managing Director for Smiths Connectors.
7. JEHANZEB NOORChief Executive Officer, Smiths MedicalJoined Smiths in 2019. Background: Vice President and General Manager of Healthcare for Amcor Flexibles Americas; Partner at McKinsey & Company.
3. KAREN BOMBAPresident, Smiths Interconnect Joined Smiths in 2017. Background: President and CEO of Morpho Detection; CEO of Labinal; COO of Zoltek; CEO of Messier-Bugatti, USA.
6. SHEENA MACKAYGroup HR DirectorJoined Smiths in 2016. Background: Group HR Director at Aggreko plc, BBA Aviation plc and SSL International plc, and HR roles at GEC plc.
9. JEAN VERNETPresident, John CraneJoined Smiths in 2017. Background: CFO of Expro; Grid Net and Formfactor; Director of Risk at Rio Tinto Alcan; Schlumberger.

1 5S M I T H S G R O U P P L C A N N U A L R E P O R T F Y 2 0 2 0
2
O U R S T R A T E G Y
DEF
INE
FOCUSMAXIM
ISE
INN
OVATEENGAGE
EXECUT
1
3
2
E
+ Read more about our KPIs on pages 22-23
We are seeing comprehensive benefits from implementing our three key strategic objectives.
Outperform our chosen markets
Deliver world-class competitiveness
+ Read more on page 16
+ Read more on pages 18-21
+ Read more on page 17
Outperform our chosen markets
We actively manage our portfolio of businesses. They operate in growing markets where we can achieve a sustainable top three leadership position.
DEFINE OUR BUSINESSES
Our businesses share the same characteristics: technology differentiation; increasing digitisation; sustainably competitive and asset light; and high proportion of aftermarket and services.
FOCUS ON ATTRACTIVE MARKETS
We focus the portfolio on attractive markets with strong long-term growth drivers.
MAXIMISE GROWTH
We maximise growth through organic investment and a highly disciplined approach to acquisitions, disposals and integration
Deliver world-class competitiveness
We drive discernible, sustained competitive advantage through focused deployment of innovation and investment; attracting and retaining the best talent; and relentless execution through our shared operating model and the Smiths Excellence System (SES).
INNOVATE TO EXCEED CUSTOMER EXPECTATIONS
Our Group innovation framework drives change and helps our businesses to nurture key projects, which deliver meaningful benefits for customers.
ENGAGE OUR PEOPLE TO DRIVE THE BEST PERFORMANCE
Our People Plan is focused on building a learning organisation which attracts and retains talent; engages, develops and inspires our people; and embeds our values.
EXECUTE CONSISTENTLY
SES ensures that we focus on continuous improvement, speed and efficiency. Our operating model optimises global business services for maximum effectiveness.
Strong financial framework
We maintain a strong financial framework by:
– Focusing the portfolio on sustainably competitive and asset light businesses
– Delivering profitable growth with sustainable margins
– Maintaining balance sheet strength and investing with strong financial discipline.
Strong financial framework
1
2
3

1 6 S M I T H S G R O U P P L C A N N U A L R E P O R T F Y 2 0 2 0
S T R A T E G I C R E P O R TO U R S T R A T E G Y C O N T I N U E D
Outperform our chosen markets
DEFINE OUR BUSINESSESFOCUS ON ATTRACTIVE MARKETSMAXIMISE GROWTH
What we said we would do in FY2020 – Continue to invest effectively in R&D to drive market share
– Maintain percentage of the Group that is well positioned in attractive markets via continued focus on the portfolio
– Maintain a disciplined approach to acquisitions that will enhance our capabilities and leadership
– Continue to integrate previous acquisitions successfully
– Further embed new operating model and execute strategy in Asia Pacific
– Seek further growth opportunities in China and India
THE ACQUISITION OF PATHSENSORS IN AUGUST 2020 ACCELERATES SMITHS DETECTION’S BIOLOGICAL DETECTION CAPABILITIES THROUGH THE ADDITION OF HIGH-SPEED, HIGHLY SENSITIVE BIOTHREAT SOLUTIONS FOR PATHOGEN DETECTION
How we did in FY2020 – Organic investment continued to increase with R&D up 20bps to 4.7% of sales. Key new product launches are outlined in the divisional sections
– Completed the operational integration of United Flexible in Flex-Tek
– Completed Smiths Interconnect’s acquisition of Reflex Photonics in October 2019 and Smiths Detection’s acquisition of PathSensors in August 2020
– Signed multiple new contracts in the Group’s higher-growth regions
FY2021 priorities – Strategic intent to separate Smiths Medical unchanged.
– Reassess the attraction of each of our end use markets and the position of our businesses within them
– Continue to invest in R&D and targeted capital expenditure1 to drive organic growth
– Use acquisitions and disposals to continue to shape the portfolio and enhance the position of our businesses in attractive markets
– Seek further growth opportunities in China and India
1 Defined in Note 30 to the Financial Statements

1 7S M I T H S G R O U P P L C A N N U A L R E P O R T F Y 2 0 2 0
2
Deliver world-class competitiveness
INNOVATE TO EXCEED CUSTOMER EXPECTATIONS
What we said we would do in FY2020 – Drive further improvement in our Vitality Index through expanded capabilities, new revenue streams and product lines
– Execute learnings from future scenario planning to deliver new products and services
– Drive the culture of innovation deeper into the organisation
– Accelerate innovation and commercialisation via expansion of strategic partner network
How we did in FY2020 – Vitality at 20%, a 700bps increase driven by new products in Smiths Detection (CTiX), Flex-Tek (Flashshield+TM) and Smiths Interconnect
– In FY2020, the Forge has delivered technology and minimum viable products for condition-based-monitoring; signal, image and video analytics for security applications; and IoT capabilities for distributed sensors to monitor moisture, methane and other environmental factors
– The acquisition of PathSensors in Smiths Detection broadens its capabilities to detect pathogens for broad end market applications
FY2021 priorities – Develop new future scenarios for customer demand and refine product and technology roadmaps
– Accelerate innovation and commercialisation via expansion of strategic partner network
– Continue to drive and build the culture of innovation throughout the organisation
– The Forge focus for FY2021 includes physical cybersecurity; embedded technology for wireless sensor networks; and augmented analytics capabilities in the cloud
– Seek sustained improvement in the Vitality Index through expanded capabilities, new revenue streams and product lines
ENGAGE OUR PEOPLE TO DRIVE THE BEST PERFORMANCE
What we said we would do in FY2020 – Progress our People Plan and continue to execute our diversity and inclusion strategy
– Build on Leadership@Smiths with the ongoing global roll out of the Accelerate programme and additional modules of e-learning
– Implement finance graduate programme in the UK, US and Asia Pacific
How we did in FY2020 – Implemented comprehensive employee safety, support and communications programme during the COVID-19 pandemic
– Launched Learning@Smiths, our internal learning portal
– Started global review of benefits
– Broadened the lean six sigma programme to support functional excellence
– Continued to build Accelerate leadership learning programme to a cohort of more than 620 colleagues
– Established cross-divisional Respect, Diversity and Inclusion Council
– Rolled out our finance graduate programme globally and Graduate Development Week
FY2021 priorities – Our fundamental priority remains the health, safety and wellbeing of our colleagues and their families
– Complete and implement findings from global benefits review
– Cross-divisional review of leader talent pipeline for succession planning
– Continue to develop SES Academy programme, targeting 1,000 belted colleagues by the end of FY2022
– Continue to focus on colleague communication activities
EXECUTE CONSISTENTLY
What we said we would do in FY2020 – Safety and zero-harm remain our top priority
– Continue to focus on expanding Group-wide capability and driving continuous improvement at all levels
– Execute IT roadmaps
– Accelerate business performance using further SES projects to drive best practice
How we did in FY2020 – FY2020 was a record year for safety with a recordable incident rate (RIR) of 0.30 and a stable lost time incident rate (LTIR) of 0.14
– Delivered £34m of procurement savings
– Creation of supply chain nerve centres to manage the COVID-19 crisis to maximise business continuity and reduce the risk of supply chain disruption
FY2021 priorities – Safety and zero-harm remain our top priority
– Stress test our supply chains and manufacturing footprint to ensure long-term resilience
– Refine our operating model to optimise the delivery of global business services for maximum effectiveness
– Accelerate business performance using the SES framework across three pillars: customer and commercial; supply chain; and production and aftermarket
› Specific business projects/problem solving
› Company-wide improvement projects

1 8 S M I T H S G R O U P P L C A N N U A L R E P O R T F Y 2 0 2 0
S T R A T E G I C R E P O R TS T R O N G F I N A N C I A L F R A M E W O R K
Strong financial framework
Continuing Operations – excluding Smiths Medical Revenue The Group delivered a robust overall performance for the year. Underlying revenue for continuing operations was down (1)%, comprising +3% in the first half and (4)% in the second half. In a period of unprecedented global disruption, the Group’s overall performance reflects its resilience founded on its market-leading positions and a high proportion of aftermarket revenues.
Reported revenue increased +2% to £2,548m (FY2019: £2,498m). This included +£15m of favourable foreign exchange translation and +£61m from the acquisition of United Flexible.
Operating profit and marginUnderlying headline operating profit was down (13)% driven by lower volumes in the second half as well as additional costs to support business continuity and uninterrupted customer service during the pandemic. Central costs were flat year-on-year at £(51)m.
Reported headline operating profit decreased (23)% to £327m (FY2019: £427m). This included +£2m of favourable foreign exchange translation, +£9m contribution from the United Flexible acquisition, £(31)m of restructuring costs and £(24)m of write-downs relating to trade receivables and impairment of capitalised development projects.
Headline operating margin decreased (210)bps to 15.0% on an underlying basis and (430)bps on a reported basis including the impact of restructuring and write-downs.
The £(86)m difference between headline and statutory operating profit is non-headline1 items as defined in note 3 to the financial statements. The largest constituents relate to amortisation of acquisition related intangible assets and provision for asbestos litigation in John Crane, Inc. On a statutory basis, after taking into account all items excluded from headline performance, operating profit of £241m was £(85)m lower than last year (FY2019: £326m), reflecting the lower headline profit.
It has been a challenging year and the pandemic continues to disrupt many of our end markets. But we have weathered those challenges well; Smiths is resilient by design and these results demonstrate that.
FY2020
£2,548m£(26)m£61m£15m£2,498m
FY2019 FX Acquisitions& disposals*
Underlying
£327m £(86)m
£241m
£(55)m
£(56)m
£9m£2m£427m
FY2020Headline
FY2020Statutory
FY2019Headline
FX Acquisitions& disposals*
Restructuringand write-downs
Underlying Non-headline1
R E V E N U E
O P E R A T I N G P R O F I T
* Includes disposals and FY2020 performance from acquisitions that do not have comparators for the prior year
1 Defined in Note 30 to the Financial Statements

1 9S M I T H S G R O U P P L C A N N U A L R E P O R T F Y 2 0 2 0
2
Strategic restructuring programme and write-downsThe Group announced on 30 June that it is undertaking a strategic restructuring programme which brings together a number of pre-COVID initiatives to ensure that it is better positioned for long-term growth and consistent outperformance. The programme will support the achievement of our goal to deliver operating margins of 18-20%.
It impacts all divisions and is now well underway, with costs of £(35)m and a cash outflow of £(12)m in FY2020. Of the £(35)m charged, £(30)m related to headcount reduction and £(5)m related to footprint optimisation.
Flex-Tek recorded £(2)m of restructuring for its commercial aerospace business which has been accounted for in the non-headline integration costs of the United Flexible acquisition.
The total cost of the programme is anticipated to be c.£(65)m spread across FY2020 and FY2021. Savings are expected to offset costs in FY2021; £(30)m of remaining costs will be spread evenly through the year, whilst the matching savings will be 70% weighted to the second half. We expect to deliver full annualised benefits of approximately £70m from FY2022 onwards.
Finance costs Headline finance costs of £(49)m (FY2019: £(51)m) were £2m lower than last year. This reflects the impact of early repayment of higher coupon debt in the prior year, which more than offset the inclusion of lease interest of £(4)m following the adoption of IFRS 16. Statutory finance costs were £(108)m (FY2019: £(22)m) mainly due to a £(62)m foreign exchange loss on an intercompany loan with Smiths Medical; the matching credit in discontinued operations nets out to zero in total Group earnings.
Taxation The principles of the Group’s approach to taxation remain unchanged. The Group manages the cost of taxation in a responsible manner to protect its competitive position. The fundamental principle of our approach to managing our tax affairs is to engage with tax authorities around the world transparently, cooperatively and on the basis of legal compliance. Through this responsible management of our tax affairs we aim to enhance long-term shareholder value while contributing to public expenditure and the overall welfare of the communities in which we operate.
The headline tax charge for the year of £(79)m (FY2019: £(103)m) represents an effective rate of 28% (FY2019: 27%). The Total Group headline effective tax rate was 26% (FY2019: 26%).
Non-headline taxation items of £13m (FY2019: £(59)m) related to tax on the non-headline loss. The statutory effective tax rate was 50% (FY2019: 53%) due to the non-headline items. Please refer to notes 3 and 6 of the financial statements for further details.
R&D and capex The income statement cost of R&D (excluding restructuring and write-downs) of £(89)m was broadly in line with last year (FY2019: £(93)m), excluding R&D write-downs. The cash cost increased to £(119)m or 4.7% of sales (FY2019: £(111)m or 4.5%), as the Group continues to invest for future growth.
Our Vitality Index measures the effectiveness of organic investment, tracking revenue from new products launched in the last three years. Our Total Group Vitality Index was 20% (FY2019: 13%), driven by new products in Smiths Detection (CTiX) and in Flex-Tek (Flashshield+TM).
Capex of £(67)m (FY2019: £(68)m) represented 1.2x depreciation and amortisation (FY2019: 1.3x), excluding the impact of additional depreciation following the adoption of IFRS 16.
Portfolio The Group continues to invest in disciplined, complementary acquisitions.
In October 2019, Smiths Interconnect completed the acquisition of Reflex Photonics (‘Reflex’) for an enterprise
value of CAD$40m. Reflex’s technological leadership in ruggedised fibre optics significantly strengthens Smiths Interconnect’s product offering in defence, space, aerospace and industrial market segments. For more information, please see note 27 of the financial statements.
In August 2020, Smiths Detection completed the acquisition of PathSensors Inc, which complements and accelerates its biological capability to detect pathogens for broad end market applications.
The Group recorded £(24)m of write-downs, which are unrelated to restructuring. £(12)m relates to the cancellation of capitalised development projects in Smith Detection that are no longer deemed commercially viable.
The balance of £(12)m of write-downs comprises trade receivables that were written off in John Crane, Smiths Detection and Smiths Interconnect.
FY2020
Continuing operations
Smiths Medical
Total Group FY2021 Total
Restructuring costs (31) (4) (35) (30) (65)
Cash outflow (8) (4) (12) (65)Annualised savings – – – 30 (70)
FY2020
Capitalised development projects (12)Receivables (12)
Write-downs (24)

2 0 S M I T H S G R O U P P L C A N N U A L R E P O R T F Y 2 0 2 0
S T R A T E G I C R E P O R TS T R O N G F I N A N C I A L F R A M E W O R K C O N T I N U E D
Discontinued Operations – Smiths Medical As disclosed on 31 March 2020, the Board decided to delay the previously announced separation of Smiths Medical due to the uncertain market conditions. The strategic intent and rationale remain unchanged.
Accounting standards require the Group to stop charging depreciation and amortisation within Smiths Medical, since it has been reclassified as discontinued operations. For comparability purposes, depreciation and amortisation of £(45)m have been included in the calculation of underlying measures.
Smiths Medical continued its return to growth with underlying revenue up +4%. This growth accelerated in the second half to +7%, including +5% from participation in Ventilator Challenge UK. During the year, Smiths Medical signed a c.$20m investment agreement from the U.S Government to expand syringe and needle device production to support COVID-19 vaccine efforts. Reported revenue was up +5% with +£12m of favourable foreign exchange translation and a £(3)m revenue impact from prior year disposals.
Headline operating profit of £184m was down (3)% on an underlying basis, with increased volumes offset by margin dilution from Ventilator Challenge UK, a one-off legal settlement and COVID-19 costs (including expedited freight, labour incentives and protective equipment). Reported headline operating profit was up +25% thanks to the exclusion of £(45)m of depreciation and amortisation, and +£2m of favourable foreign exchange, partially offset by £(1)m from prior year disposals and £(4)m of restructuring costs. Restructuring costs include delayering and decentralisation to increase efficiency and effectiveness. Reported headline operating margin was up +330bps to 20.1%, mainly driven by the exclusion of depreciation and amortisation, but was down (120)bps on an underlying basis.
The difference between statutory and headline operating profit comprised separation costs.
In May 2020, Smiths Medical acquired the business of Access Scientific LLC. The acquisition extends Smiths Medical’s vascular access portfolio and enhances its infection prevention capabilities.
Total Group debtNet debt at 31 July 2020 was £1,141m, a decrease of £(56)m in the period, despite the £148m impact of capitalised operating leases under IFRS16. EBITDA from continuing and discontinued operations was £610m. Net debt to EBITDA was 1.7x after inclusion of leases (1.9x including restructuring costs and write-downs).
Gross debt1 was £1,609m (FY2019: £1,512m), including the impact of leases. There are no covenants associated with this debt. The weighted average maturity was 4.2 years and there are no maturities before October 2022. Cash balances were £386m (FY2019: £315m).
An $800m (c.£610m at the period-end exchange rate) revolving credit facility (‘RCF’) remains undrawn. $110m of the RCF extends until November 2023 and $690m until November 2024. The only covenant relates to interest cover which must be greater than or equal to 3 times, compared with 11 times at the year end. Taking cash and the RCF together, total liquidity was approximately £1bn at the year end.
Strong cash conversion and a conservative balance sheet enable us to face the challenges of the present crisis with our eyes firmly fixed on creating sustainable, long-term shareholder value.
Total Group Total profit and EPS Total headline profit after tax decreased by (12)% on a reported basis. Headline basic EPS was down (12)% on an underlying basis and reported basis. Total statutory profit after tax increased by +18% to £267m (FY2019: £227m), driven by lower non-headline items. Statutory basic EPS was also up +18% to 66.9p (FY2019: 56.8p).
Cash-flowStrong cash generation is a key characteristic of our business. Headline operating cash-flow1 was £575m (FY2019: £474m). This strong performance was achieved despite the disruption associated with the COVID-19 pandemic. Operating headline cash conversion was 123% (FY2019: 83%), including a benefit from IFRS 16, restructuring and write-downs.
Free cash-flow of £273m (FY2019: £234m) increased by £39m, underpinned by the strong operating cash-flow. Tax payments have increased to £113m in the year due to timing differences and the repatriation of foreign dividends.
Statutory net cash inflow from operating activities was £429m (FY2019: £346m). See note 29 to the financial statements for a reconciliation of headline operating cash-flow to statutory cash-flow.
Dividend The Group maintains a progressive dividend policy, aiming to increase dividends in line with long-term underlying growth in earnings and cash-flow. The policy enables us to retain sufficient cash-flow to finance investment in the drivers of growth and meet our financial obligations. In setting the level of dividend payments, the Board considers prevailing economic conditions and future investment plans, along with the objective to maintain minimum dividend cover1 of around 2 times.
In March the Board considered it prudent not to declare an interim dividend for HY2020 until such time as trading conditions became clearer and there was less uncertainty. Reflecting the Group’s strong performance and financial position, the Board is now recommending a total dividend of 35.0p per share for the year. This reflects a delayed interim dividend of 11.0p and a proposed final dividend of 24.0p.
1 Defined in Note 30 to the Financial Statements

2 1S M I T H S G R O U P P L C A N N U A L R E P O R T F Y 2 0 2 0
2
Litigation Smiths Group faces different types of litigation in different jurisdictions. Please see below an update on the two significant litigation provisions. For more information, refer to note 23 of the accounts.
John Crane, Inc. litigation John Crane, Inc. (JCI), a subsidiary of the Group, continues to actively monitor the conduct and effect of its current and expected asbestos litigation, including the effective presentation of its ‘safe product’ defence, and intends to resist asbestos cases based on this defence. Approximately 297,000 claims against JCI have been dismissed before trial over the last 40 years. JCI is currently a defendant in cases involving approximately 25,000 claims. Despite these large numbers of claims, since the inception of asbestos litigation against JCI it has had final judgments against it in 149 cases, and has had to pay awards amounting to approximately $175m.
At 31 July 2020, the aggregate provision for JCI asbestos litigation, including for adverse judgments and defence costs, amounted to £231m (FY2019: £237m) expressed at the then current exchange rate. In deciding upon the amount of the provision, JCI has relied on independent expert advice from a specialist.
Titeflex Corporation litigation Titeflex Corporation, a subsidiary of the Group in the Flex-Tek division, has received a number of claims in recent years from insurance companies seeking recompense on a subrogated basis for
the effects of damage allegedly caused by its flexible gas piping products being energised by lightning strikes. It has also received a number of product liability claims relating to this product, some in the form of purported class actions. Titeflex Corporation believes that its products are a safe and effective means of delivering gas when installed in accordance with the manufacturer’s instructions and local and national codes; however some claims have been settled on an individual basis without admission of liability.
At 31 July 2020, a provision of £66m (FY2019: £74m) has been made for the costs which the Group expects to incur in respect of these claims.
For the Group’s litigation provisions, because of the significant uncertainty associated with the future level of claims and of the costs arising out of the related litigation, there is no guarantee that the assumptions used to estimate the provision will result in an accurate prediction of the actual costs that may be incurred.
Return on capital employed (ROCE)1
ROCE was 11.8% (FY2019: 14.4%). The decrease reflects lower profitability, including restructuring costs and write-downs, recent investments (such as the acquisition of United Flexible, which are expected to generate superior returns over the longer-term) and the adoption of IFRS 16, partially offset by the absence of depreciation and amortisation in discontinued operations. For further detail of its calculation, please refer to note 30 to the financial statements.
IFRS 16 – Leases The Group has adopted IFRS 16 from 1 August 2019 and elected to apply the modified retrospective transition approach, requiring no restatement of the comparative period. The main changes include recognition of right of use assets and lease liabilities with a value of £144m (of which £48m relates to discontinued operations), and a marginal increase in operating profit due to reclassification of the financing charges inherent in operating lease costs to finance costs.
Foreign exchangeThe results of overseas operations are translated into sterling at average exchange rates. The net assets are translated at period-end rates. The Group is exposed to foreign exchange movements, mainly the US Dollar and the Euro.
BrexitWith over 95% of revenue originating outside the UK, the Group expects limited impact from Brexit but monitors the ongoing negotiations between the UK and the EU as part of its risk management process. Preparations have been made and mitigation measures have been put in place to meet potential scenarios.
John Shipsey CHIEF FINANCIAL OFFICER
Pension The net accounting pension surplus increased to £372m (FY2019: £311m), principally driven by higher returns on assets and life expectancy decreases, partially offset by a lower discount rate. Taken together, the two UK schemes were fully funded on a technical provisions basis as at their last formal updates.
Pension contributions for the year were £(33)m (FY2019: £(36)m). For FY2021, we expect total cash contributions of up to £(38)m across all schemes.
The two main UK pension schemes are well positioned to withstand a volatile market environment. They are well hedged, so that a movement in liabilities is largely offset by the movement in assets. As at 31 July 2020, approximately 35% of the liabilities had been de-risked through the purchase of annuities from third party insurers. Approximately 90% of assets are invested in third-party annuities, government bonds and
investment grade credit. Only around 2% of assets is invested in equities.
On 10 September 2020, the TIGPS Trustee secured a further bulk annuity, which has insured the benefits of a further 1,200 pensioners. Across the two UK schemes, approximately 65% of pensioner liability (37% of total liabilities) is now de-risked through bulk annuities.
1 Defined in Note 30 to the Financial Statements

2 2 S M I T H S G R O U P P L C A N N U A L R E P O R T F Y 2 0 2 0
S T R A T E G I C R E P O R TK E Y P E R F O R M A N C E I N D I C A T O R S
Why we measure Performance AmbitionStrategic objective
Portfolio strengthas measured by % revenue from top three positions
FY2018 ~80%
>90%FY2019
90%FY2020 R E V E N U E F R O M T O P T HR E E P O SI T I O N S IN AT T R AC T I V E M A R K E T S
90%+We continuously review our portfolio of businesses to target top three leadership positions in attractive markets.
In FY2020, 90% of our business continued to be well positioned.
Aftermarket and servicesas measured by Aftermarket % of sales
FY2018 48%
49%FY2019
49%FY2020 A F T E R M A R K E T R E V E N U E
50%+as a percentage of total revenue
Aftermarket is a core characteristic of a Smiths business; part of our DNA.
In FY2020, aftermarket revenues represented 49% of total revenue, stable year-on-year.
Effective innovationas measured by Vitality Index
FY2018 13%
13%FY2019
20%FY2020 R E V E N U E F R O M P R O D U C T S L A U N C H E D I N T H E L A S T T H R E E Y E A R S
~20%as a percentage of total revenue
Following a period of accelerated reinvestment into the business, we are focusing on measuring the effectiveness of our investment.
In FY2020, Vitality Index increased to 20%. The year-on-year improvement was driven by revenues from Smiths Detection’s CTiX and Flex-Tek’s Flashield+TM.
Operational excellenceas measured by stock turns1
FY2018 3.7x
3.4xFY2019
3.0xFY2020 S T O C K T U R N S
6.0xStock turns measure speed and efficiency in the business.
In FY2020, stock turns reduced to 3.0x due to the operational disruptions associated with the COVID-19 pandemic.
Employee engagementas measured by employee engagement score
FY2018 73
73FY2019
73FY2020 C R E A T E A N U R T U R I N G A N D I N C L U S I V E W O R K I N G E N V I R O N M E N T
One focus of our People Plan is colleague engagement, which we measure twice annually in a confidential survey.
In FY2020, 87% of colleagues responded and we retained our healthy engagement score of 73.
Safetyas measured by RIR
FY2018 0.39
0.41FY2019
0.30FY2020 C R E A T E T H E S A F E S T W O R K I N G E N V I R O N M E N T
Health and safety remains our top priority. Our key metric is recordable incident rate (RIR) per 100 colleagues.
In FY2020, RIR reached a record low at 0.30 emphasising our continued work on health and safety.
OPER ATIONAL PERFORMANCE
L I N K T O S T R A T E G I C O B J E C T I V E S
+ Read more about our strategy on pages 15-21
Key performance indicators
Performance against our key performance indicators (KPIs) reflects the Group’s strength and resilience in very challenging market conditions.
Operational and financial KPIs above the dotted lines are shown on a Continuing Operations basis. Operational and financial KPIs below the dotted lines are shown on a Total Group basis as they are the key measures of the Group’s cash and returns performance.
1 Defined in Note 30 to the Financial Statements

2 3S M I T H S G R O U P P L C A N N U A L R E P O R T F Y 2 0 2 0
2
L I N K T O R E M U N E R A T I O NOur KPIs are aligned with our strategic objectives. Progress against them is monitored by our management processes and they drive our executive Remuneration Policy.
See page 110 where we show the impact of the headline operating cash conversion, organic revenue growth and ROCE KPIs from total operations on the FY2020 annual bonus and the LTIP for the three years ending 31 July 2020.
Why we measure Performance AmbitionStrategic objective
Growthas measured by underlying1 revenue growth
FY2018 3%
3%FY2019
(1)%FY2020 O U T P E R F O R M O U R C H O S E N M A R K E T S
Growth is a top priority for the Group and a key part of management incentives.
The Group delivered a resilient performance in very challenging conditions.
Performanceas measured by headline operating margin
FY2018 16.7%
17.1%FY2019
15.0%FY2020 H E A D L I N E O P E R A T I N G P R O F I T M A R G I N 1
18-20%Growth needs to be delivered with a strong margin.
In FY2020, headline underlying operating margin was 15.0%, down (210)bps, driven by volume and costs of business continuity.
Returnsas measured by ROCE
FY2018 14.6%
14.4%FY2019
11.8%FY2020 R O C E T H R O U G H T H E C Y C L E
16-18%Measuring ROCE ensures we are focused on the efficient use of assets and capital, but can be distorted by M&A activity.
In FY2020, ROCE of 11.8% was impacted by lower profitability including the impact of restructuring and write-downs, recent acquisitions such as United Flexible and the impact of IFRS16 partially offset by impact of no depreciation and amortisation in Smiths Medical.
Asset lightas measured by working capital % sales2
FY2018 26%
26%FY2019
28%FY2020 W O R K I N G C A P I T A L A S A P E R C E N T A G E O F T O T A L R E V E N U E
~20%Working capital measures speed and efficiency in the business from manufacturing to debt collection. Working capital translates into cash.
In FY2020, working capital represented 28% of revenue, a 200bps increase year-on-year due to operational disruptions associated with the COVID-19 pandemic notably in inventory which was partially offset by strong receivables collection.
Strong cash generationas measured by headline operating cash conversion
FY2018 99%
83%FY2019
123%FY2020 H E A D L I N E O P E R A T I N G C A S H C O N V E R S I O N
100%+Our focus on cash demonstrates our focus on efficiency as well as enabling us to fund future growth.
In FY2020, headline operating cash conversion was very strong at 123%, including tailwinds from the impact of IFRS16 and the strategic restructuring programme.
1 See underlying definition on page 02
2 Calculated as the 12-month rolling average of inventory, trade receivables contract assets, trade payables and contract liabilities as a percentage of total annual sales. Working capital is defined in Note 30 to the Financial Statements
FINANCIAL PERFORMANCE

2 4 S M I T H S G R O U P P L C A N N U A L R E P O R T F Y 2 0 2 0
S T R A T E G I C R E P O R TR E S O U R C E S A N D R E L A T I O N S H I P S
Understanding and nurturing our resources and relationships
External alignment and recognition on sustainability mattersWe understand the importance of reporting on sustainability matters in a transparent way and meeting external guidance when doing so. We are generally aligned with the Global Reporting Initiative (GRI) reporting principles for environmental matters and with the Task Force on Climate-related Financial Disclosures (TCFD), for which a recent formal assessment by an external party has indicated that we meet all 11 recommendations. We also continue to receive favourable external ratings for our Environment, Social and Governance (ESG) performance.
External recognitionScore
June 2020
Constituent
August 2020
Governance 1 Environment 2
Social 2(Scale 1-9; 1 = leader)
2018data
B Management – taking co-ordinated action
November 2019
AA Leader in the sector
September 2019
34 points67th percentile
Governance and collaborationThe majority of our resource and relationship strands are managed through strategic oversight and collaboration models that bring together the skills and knowledge of our central teams and our divisional experts to champion critical issues and drive innovation, quality and best practice right across Smiths. Some areas are further supported by senior groups such as the Executive Environmental Roundtable which was set up to advise the Board and Executive Committee on environmental matters.
The Smiths Excellence System (SES)Our efforts in this area are underpinned by SES which is building capabilities and driving excellence and continuous improvement across each of our SES pillars: Customer, People, Technology, Programme, Production and Supply. Excellence is in our DNA and is a fundamental part of how we do business at Smiths.
We believe in doing business responsibly, to the benefit of society at large and our stakeholders.
Nurturing the resources on which we depend and building strong and positive relationships is in line with our purpose and values. This underpins business performance and the long-term sustainability and resilience of Smiths.
It’s the Smiths Way and it connects, guides and inspires everyone at Smiths.
Our critical resources and relationships
and environment
Regulators and
and i
nnov
ation
governments Our people
Our customers
Te
chno
logy
Production
Our supply chain
Our
com
mun
ities
Figures in this section are for Total Group unless otherwise stated

UN SDGs
UN SDGs
UN SDGs
UN SDGs
UN SDGs
UN SDGs
UN SDGs
2 5S M I T H S G R O U P P L C A N N U A L R E P O R T F Y 2 0 2 0
2
+ Read more about our people and how we support them on pages 27-33
+ Read more about our customers and how we work with them on pages 34-36
+ Read more about how we approach production and environmental governance and performance on pages 40-45
+ Read more about our communities and how we support them on pages 48-50
+ Read more about our technology capabilities and innovation culture on pages 37-39
+ Read more about our suppliers and how we work with them on pages 46-47
+ Read more about how we meet the requirements of regulators and governments on page 51
Sustainability focus areas and the United Nations (UN) Sustainable Development Goals (SDGs)We believe that business has a vital role to play in delivering the UN SDGs. For some years our environmental targets have been proactively aligned with goals 6, 12, 13 and 14 covering responsible production and consumption, greenhouse gas (GHG) emissions and water conservation.
The further aspects of sustainability that are most relevant and/or material to us and to our stakeholders are described here and we are pleased to report progress on each during FY2020.
The symbols shown in the square boxes are the UN’s adopted icons for its 17 SDGs.
Our peopleFocus areas – Safety and security – Employee wellbeing and engagement
– Learning organisation – Diversity and inclusion
Key highlights in FY2020 – Record low safety incidents – Comprehensive colleague support through COVID-19
– Launch of Learning@Smiths – Respect, Diversity and Inclusion Council
Our customersFocus areas – Voice of the customer – Quality and service
Key highlights in FY2020 – Continuity of production and service to customers through COVID-19
– On time in full measure – 86%
Production and environmentFocus areas – Quality and efficiency – Environmental governance – Environmental performance
Key highlights in FY2020 – Smiths lean toolbox and upgrade to SESAME CI tool
– Progress towards FY2021 environmental goals
– Climate risk assessments
Our communitiesFocus areas – Impact on communities
Key highlights in FY2020 – Community donations during the COVID-19 pandemic
– Internal and external promotion of International Women in Engineering Day
– Participation in UK Ventilator Challenge
Technology and innovationFocus areas – Culture, capabilities and collaboration
– Enterprise IT
Key highlights in FY2020 – Vitality Index 20% – University partnerships on future-focused technology
– Enterprise IT response to business needs through COVID-19
Our supply chainFocus areas – Total value – Relationships and resilience
Key highlights in FY2020 – Real-time management of supply chain through COVID-19
– Record level of procurement savings
Regulators and governmentsFocus areas – Ethical behaviour, governance and compliance
Key highlights in FY2020 – Continuing development and implementation of ethics and compliance policies
– Ongoing relationship building to support business objectives

2 6 S M I T H S G R O U P P L C A N N U A L R E P O R T F Y 2 0 2 0
S T R A T E G I C R E P O R TR E S O U R C E S A N D R E L A T I O N S H I P S C O N T I N U E D
Ethics and our values
Our values guide how we behave.
Our values influence every decision and help to make Smiths a place where people want to work, an organisation that is valued, and one that people want to do business with. Our values are embedded across the Group and are promoted at every opportunity.
Behaving ethically and with integrity is a fundamental part of our values. It is the right thing to do and it enhances our reputation with our stakeholders. Our people, suppliers and other partners are required to understand and uphold our high ethical standards.
Ethics governanceOur Code of Business Ethics provides guidance for colleagues to recognise and deal appropriately with legal and ethical issues they encounter in the course of their work. This is supplemented by a suite of policies and procedures relating to specific ethics and compliance issues, and associated training, some of which is mandatory for all colleagues.
Our central ethics and compliance function oversees our ethics and compliance programmes, determines a common language for ethics across Smiths and focuses work on new and/or higher risk areas. Internal Audit verifies that procedures and responsibilities are understood and functioning correctly. Other compliance matters and day-to-day responsibility for ethics and compliance are held by our divisional operational and Legal teams. The Smiths Board and Executive Committee are engaged through our risk management processes and encourage direct and open discussion should a matter require attention.
The Smiths Business Ethics Council (BEC) has been in place for more than ten years. It comprises senior, cross-functional leaders from across Smiths and acts as an advisory panel for new policies and how best to implement them. The BEC sets annual objectives to aid continuous improvement. For example, in FY2020 the BEC proposed improvements to the process for identifying and reporting potential conflicts of interest, which have been rolled out across Smiths.
The central ethics team also works closely with our HR functions on investigations into such matters as labour standards and allegations of employee harassment and discrimination.
+ Read more about human rights and tackling modern slavery on page 50
+ Read more about other compliance matters on page 51
Engagement and trainingEngaging and communicating on ethical matters is vitally important, as is trust in our procedures. Colleagues are encouraged to report behaviour inconsistent with our Code of Business Ethics, or our values, through their line manager, HR or the Legal team, or through our confidential ‘Speak Out’ reporting line. This is emphasised in regular communications.
Our Ethics Ambassadors network comprises grassroots colleagues from across Smiths. We look to our Ethics Ambassadors to come up with ideas and communications, for example how to promote ethics on our annual Smiths Day, to bring ethics to life and help us reach the widest possible audience. We are looking forward to the role of the Ambassadors evolving over time.
Our ethics training operates in two tiers – online modules developed with our Business Information Services team that are available to colleagues, and face-to-face training activities (now, due to COVID-19, likely to be delivered online) covering specific subjects. Our online ethics training modules are available in all of our core languages and approximately 37,000 courses were taken by colleagues during FY2020.
Additionally, we run ethics workshops which are an opportunity for leaders from across Smiths to discuss ethics and compliance challenges specific to their markets and geographies and how to navigate them. During FY2020 we ran workshops in the Middle East, South Africa, Brazil, Mexico and France.
We achieved a strong score of 72 for ethics/integrity in our most recent My Say engagement survey and the values related questions in the survey have been rising over time.

2 7S M I T H S G R O U P P L C A N N U A L R E P O R T F Y 2 0 2 0
2SMITHS SAFETY CARDINAL BEHAVIOURS – Stay fit and focused at work – Identify and manage safety hazards – Always use machinery safely – Stop work if it isn’t safe – Take care when using electrical equipment – Follow safety protocol in vehicles – Take care when working at heights – Always wear protective gear – Report all safety incidents and near misses – Minimise our environmental impact
Keeping our colleagues as safe and well as we practically can has been a key concern during the COVID-19 pandemic. This work has been led by our Smiths Group Crisis Core team and our Global Head of HSE co-ordinating directly the efforts of our local HSE teams and through dedicated workstreams helping to steer the response of our entire business. A number of employees have become ill during the pandemic and it is a matter of great sadness for the whole of the Smiths team that a very small number of colleagues have died. Support was given to the families of these colleagues and to their grieving colleagues.
The health, safety and security of our people and our operations have always been our number one priority and have been a key focus during the COVID-19 pandemic. We have a strong and robust safety culture and strive for a zero-harm workplace, with safety considerations fully integrated into all of our activities.
Health, safety, security Keeping our people safe at work is in the Smiths DNA and is something we are passionate about.
Governance and strategy on safety matters flow from the Smiths Board and Executive Committee to every Smiths site via our collaborative HSE (Health, Safety, Environment) Technical Committee which includes representatives from across Smiths. Safety and compliance with our policies are then supported locally by our divisional HSE specialists with responsibility held by our site and divisional leaders. Our safety policies also extend to our suppliers and business partners.
Smiths colleagues, at all levels, also have personal responsibility to take due care of their own safety and to follow our safety rules. They also have a responsibility to warn others of potential hazards and unsafe behaviours. Fulfilling these obligations is a condition of employment.
Smiths has an extensive set of Health and Safety policies and procedures that all operations are required to follow. Performance against these policies is overseen by an audit process that also covers all Smiths production facilities including ISO 18001 management systems. Smiths did not receive any significant1 safety or health fines or penalties in FY2020 from any regulatory agencies.
We are extremely pleased to report that Smiths has not recorded a serious safety incident, including work-related employee fatalities, or a serious physical security event during FY2020 and that this year Smiths has recorded its best ever safety performance.
1 Over £10,000
Our global family of diverse and talented colleagues creates, delivers and supports our products with passion and an innovative and collaborative spirit, underpinned by our relentless focus on continuous improvement and excellence.
We aim to attract, retain, develop, engage and inspire the very best by delivering a people experience based on respect, personal growth, empowerment and a sense of belonging and purpose. Engaging our people in this way is the right thing to do and the most effective way of delivering our business objectives.
Our people
Our people are vital to the success of Smiths.

2 8 S M I T H S G R O U P P L C A N N U A L R E P O R T F Y 2 0 2 0
S T R A T E G I C R E P O R TR E S O U R C E S A N D R E L A T I O N S H I P S C O N T I N U E D
Safety programmesAdvancing safety and security is an ongoing investment for Smiths as we implement new programmes and training activities to continuously improve performance and reduce risk. Our HSE teams also work regularly with HR colleagues to support health and wellbeing initiatives.
During FY2020 we relaunched our safety lookout peer to peer observation programme with full roll out being delayed by the COVID-19 pandemic. We also launched a global hand safety campaign focusing on five checks to keep your hands safe. Our new Alert driver safety awareness training for drivers of company vehicles is underway in all divisions apart from Smiths Medical. Over 2,500 Smiths colleagues are registered for the programme.
Safety measurement and performanceWe monitor our recordable incident rate (RIR) – where incidents require medical attention beyond first aid – and lost time incident rate (LTIR) – where a colleague is unable to work following an incident – per 100 colleagues, per year across Smiths. In FY2020 we achieved an RIR of 0.30 and an LTIR of 0.14. According to company policy, Smiths reports all injuries globally in accordance with US OSHA guidance.
Each of our divisions is also required to set completion targets for the Safety Leading Indicator (SLI) proactive and preventative safety measures most relevant to their operations, with an expectation of achieving 95% of target annually. SLIs include activities such as safety inspections, training and the safety look out peer to peer observation programme.
SecurityWith locations all over the world, and colleagues regularly travelling and/or working remotely, the security of our sites and teams is an important issue. We have physical security plans in place at all locations and risk assessments are undertaken regularly, as are reviews of our business continuity plans.
We closely monitor colleague trips to high and extreme risk locations, with all travel pre-approved per policy, albeit travel has been significantly curtailed during the COVID-19 pandemic. The ISOS (International SOS) app, introduced this year, allows colleague locations to be tracked when travelling or working remotely, with ‘take cover’ and ‘check in’ alerts issued in the event of local danger, for example storms, earthquakes, political issues and violence. Colleagues can also use the app to reach Smiths in an emergency.
L O S T T I M E I N C I D E N T R A T Eper 100 colleagues
0.14
Our people continued
PROMOTING COLLEAGUE WELLBEING WITH THRIVEThis year we launched our new global wellness initiative THRIVE. Developed originally by Smiths Detection and Smiths Interconnect, the programme has now been rolled out across the whole of Smiths to help educate colleagues on how to practice self-care both at home and at work.
We have focused on seven pillars of wellness:
– Physical: Taking care of your body and mind through physical activity, a healthy diet and sleep
– Social: Having a supportive and interactive social network breeds success at home and at work
– Environmental: Respecting your surroundings and taking care of our planet
– Emotional: Looking after yourself to help you live your best life
– Financial: Having the tools to manage your money now and for the future
– Occupational: Enriching your job experience for personal fulfilment
– Intellectual: Exploring new ideas and challenging yourself
We provide hints and tips, interesting facts and links to helpful information, as well as fun activities planned by our site Ambassadors.
Our mission is to do what we can to help empower our colleagues to look after themselves, give them access to information they may not have known about, and create an environment where people feel safe to talk about the things that are important to them.
By taking care of our wellbeing, we can THRIVE both inside and outside of work.
R E C O R D A B L E I N C I D E N T R A T Eper 100 colleagues
0.30FY2020 0.30
FY2019 0.41
FY2018 0.39
FY2017 0.38
FY2016 0.47
FY2020 0.14
FY2019* 0.19
FY2018* 0.18
FY2017 0.19
FY2016 0.16
* FY2018 and FY2019 data restated due to reclassification of incidents
USE MACHINE GUARDS
BE AwARE of CoNvEyoRS
USE BLADES wITH CAUTIoN
CHECKS To KEEp yoUR HANDS SAfE
wEAR THE CoRRECT ppE
USE powER TooLS wITH CARE
554
1
3
2
safety is in
hands

2 9S M I T H S G R O U P P L C A N N U A L R E P O R T F Y 2 0 2 0
2Supporting our people and our leaders through this extraordinary period has been a key responsibility of the Smiths leadership team. We pay tribute to the amazing dedication, commitment and contribution our colleagues have made to keeping themselves and others safe and well while helping us continue to operate and serve our customers.
The response to COVID-19 has been led by a dedicated Crisis Core team, leading a number of sub-groups made up of functional and divisional experts (sites also have local response teams). Our main aim throughout has been to keep our colleagues as safe and well as possible.
Much effort has gone into understanding and respecting individual personal circumstances and balancing these with the needs of the business. This has been coupled with the provision of practical support on the ground to ensure colleague wellbeing and safety.
A regular cadence of internal communications using a variety of mediums has ensured our colleagues have remained well informed and in regular dialogue with our leadership teams, further reinforcing a sense of belonging to Smiths, integral to our culture.
A values-led approach was adopted from the beginning of the crisis ensuring trust, integrity and serving the needs of our customers were at the core of the approach.
The response from our workforce has been outstanding and it is thanks to them that the business remains strong and able to continue to serve the needs of our customers with passion and excellence.
THE POSITIVE NATURE OF THE SMITHS PEOPLE APPROACH HAS BEEN EXEMPLIFIED IN OUR RESPONSE TO THE COVID-19 PANDEMIC.
Practical examples of the measures put in place include:
– An absolute focus on providing the safest possible working environments for those needing to be on our premises and those visiting customers and partners including:
> Group-wide HSE committee ensuring compliance with local requirements and sharing best practices across the Group
> 24-hour monitored safety at Smiths email
– Enabling and supporting those able to work from home to do so
– Producing face coverings in-house and distributing employee PPE proactively
– Pursuing a consistent approach, in relation to COVID-19, for health benefits, life insurance, sick pay and absence; aligning our divisions and regions as much as possible
– Partnering with ISOS (International SOS) medical staff on safety guidance and promoting use of the ISOS app for local safety information
– Implementing a new colleague emergency contact details tool
– The creation of bespoke COVID-19 resource sites on our intranet and our Smiths Now colleague app for universal access to COVID-19 related guidance and support materials, including a regularly updated FAQ, translated into all our core languages
– Extending our Smiths Now app for desktop use for easy access to news and information
– Regular and two-way communication including: > Weekly all-colleague update containing the latest guidance and information from the Crisis Core team. This received an 89% approval rating from colleagues
> Board, Chief Executive and Executive Committee email and video communications
> #thankyoufrontline social campaign on Smiths Now
– Resilience webinars and hints and tips for leaders
– Wellness materials delivered through the new cross-Group THRIVE programme
Through our actions and our words, we believe that we have truly demonstrated that we are one Smiths family and that every member of our global team is valued.

3 0 S M I T H S G R O U P P L C A N N U A L R E P O R T F Y 2 0 2 0
S T R A T E G I C R E P O R TR E S O U R C E S A N D R E L A T I O N S H I P S C O N T I N U E D
Our people continued
People leadership and planningOur divisional people leaders work collaboratively with our people Centre of Excellence teams to create and deliver HR programmes that support our People Plan and meet common business needs. Many programmes – for example the SES Academy – are rolled out globally, while other needs are met locally with assistance from our central specialists.
Engagement and communicationStrong engagement and a clear understanding of what it means to be Smiths is a powerful combination and drives pride, energy and ownership of our purpose and strategy.
Our annual Smiths Excellence Awards recognise achievement across our six SES pillars; outstanding contributions to HSE, to our communities, and to innovation; and include our highest honour, the Smiths Cup. Making the 2020 Awards was postponed due to the COVID-19 pandemic but a new record total of 604 entries was reached this year.
Our annual Smiths Day global celebration of Smiths culture also did not take place due to the pandemic, along with planned meetings with our Smiths European Forum, a collection of employee representatives we meet with twice yearly in normal circumstances.
My Say SurveyUsing our My Say survey we have been tracking engagement since 2017. Results from the biannual survey drive central programme planning and are provided to managers who are empowered to create action plans for local improvements. For example, John Crane Korea organised company team building workshops and provided colleague suggestion boxes to promote ongoing feedback.
Our latest survey conducted in October 2019 (the May 2020 survey did not take place due to the COVID-19 pandemic) delivered a high response rate, with 87% of colleagues taking part and around 36,000 comments submitted.
Our overall engagement measure was stable at 73 (May 2019: 73), one point away from the benchmark of 74 for businesses of our type and scale, as indicated by Glint, the external third party which manages the survey process for us. Other measures where we continue to score highly are safety, customer focus, authenticity, respect and integrity.
We intend to undertake our next survey before the end of the 2020 calendar year.
CommunicationOur global communications activities support our strategy and engagement plans and aim to promote open, two-way communication between our colleagues and our leadership teams. Key communication materials, including those during the COVID-19 pandemic period, and many of our Group-wide training materials, are translated into our 11 core languages.
Our Smiths Signal fortnightly newsletter shares company news and the Smiths Now app and web portal is an innovative platform for colleagues to read news from the business and share their own stories and photos via the Smiths Social Wall. We use Smiths Now and the Social Wall to engage our teams in internal campaigns, for example around International Women’s Day and International Women in Engineering Day.
To bring our key messages even closer to the front line we are currently working up a pilot for the use of digital signage for offices and production sites.
+ Read more about International Women in Engineering Day on page 49
CONTINUOUS IMPROVEMENT IN SMITHS FUNCTIONSTereza Njingo’s SES Academy green belt project in our EMEA region demonstrates how continuous improvement techniques are being used to support our functions.
Our Group HR People Operations function provides vital support to our business process infrastructure, by empowering our people managers worldwide with the process and diligence necessary for leading their teams every day.
To optimise our processes across EMEA we chartered a project to develop a new HR policy handbook for the region which consolidated all local HR policies into a single, readily accessible reference document.
The new policy handbook enabled our EMEA HR teams to work more efficiently and garnered recognition across Smiths.
O C T O B E R 2 0 1 9 S U R V E Y
36,000colleague comments (2020 survey cancelled due to the COVID-19 pandemic)
E N G A G E M E N T M E A S U R E
73May 2019: 73

3 1S M I T H S G R O U P P L C A N N U A L R E P O R T F Y 2 0 2 0
2
Learning and developmentWe are building a learning organisation by making learning and development opportunities available to everyone at Smiths so that all colleagues are empowered to build their skills and take ownership of their future. Through this we are sustaining and growing the capabilities of the Group – and driving excellence across our operational disciplines and our functions.
Our new Learning@Smiths portal was launched during the year. It holds all of our online training modules, including both SES Academy and Leadership@Smiths materials, and provides a consistent look and feel to the Smiths learning journey.
The portal has supported us as we adopt a change in our learning philosophy to deliver a broader range of shorter and bitesize learning activities that grow capability through practical application rather than large training events.
We have concentrated much of this year’s formal development activities on our middle managers, including continuing to build our Accelerate leadership capability learning programme which has now engaged more than 620 participants since launch. Further extension has been delayed by the COVID-19 pandemic, but we have successfully continued to work with the existing cohort online. We also launched an Inclusive Leadership online module to complement our existing suite of e-learning modules and a People Leader Pulse monthly newsletter with development hints for leaders.
We plan to grow the Accelerate programme in FY2021 as well as launch a new orientation module for new and joining leaders.
Our people have visibility of career opportunities across Smiths through our Careers@Smiths portal and an ongoing project to calibrate and enhance job architecture for functional and technical roles across the Group will further support career path planning and learning needs.
During FY2020 we continued to roll out our finance and engineering graduate programmes, hiring into Asia Pacific, Europe and the US. Supporting our global graduate hires, we ran our Graduate Development Week in May, delivering this virtually due to the COVID-19 pandemic.
SES AcademyThe SES Academy and our lean six sigma belted programme were born from the vision of our Chairman and Chief Executive to drive excellence at Smiths by actively building the capabilities of the organisation through our people. Academy materials are widely available to colleagues and range from bitesize modules to focused and practical courses supporting skills development priorities in our SES pillars and areas such as project management and change management.
Our lean awareness e-learning module, created in-house and available in multiple languages, has been promoted widely at Smiths and forms part of our new joiner training. The module has now been completed by more than 19,400 colleagues.
Lean six sigma is a highly regarded and proven approach to process improvement in operations and core business functions. Working with the University of Oxford, we have created a tailored lean six sigma belted programme which offers recognition and is delivering accelerated and tangible change in our business. The unique programme combines the best of traditional lean six sigma skills with additional content, for example machine learning, that will drive specific value for Smiths.
The courses also enable colleagues with shared specialisms to meet, collaborate and make everlasting connections.
During FY2020 lean six sigma has been extended to drive functional process excellence. We held our first ever green belt training for Group functions in February 2020, with 20 colleagues from HR, communications, insurance and company secretariat taking part.
We currently have more than 500 colleagues with yellow, green or black belt qualifications and are targeting 1,000 qualifications by the end of FY2022. We are also reviewing how we might deliver some of the programme virtually.
For the wider Academy we have identified opportunities to develop courses/qualifications in project management and design thinking.
As at the end of July, we had a total of 317 continuous improvement projects on record, of which 174 projects are currently active and 143 projects have been delivered.
A financial validation process to quantify the total savings from the projects was launched during the year. The benefit of delivered and ongoing projects is estimated to be in the region of £7.5 million to £10 million per annum.
+ Read more about design thinking on page 38
SES ACADEMY LEAN SIX SIGMA BELTED PROGRAMMEYellow belt: One-day interactive lecture style presentation covering lean six sigma fundamentals. Colleagues are encouraged to self-nominate for the course which is then approved by the SES pillar lead.
Green belt: One-week course to become a lean six sigma practitioner/change agent. Structured around a hands-on improvement project with participants working collaboratively to fix a business process. Colleagues are nominated for the course by a senior manager.
Black belt: Two-week course split around the implementation of a three-month project. Designed to create change leaders who can inspire, coach and mentor as well as being custodians of excellence. Learning integrates four key disciplines – lean thinking, design thinking, agile thinking and systems thinking. Nominations made by divisional presidents based on business needs, with project quality reviewed at the centre.

3 2 S M I T H S G R O U P P L C A N N U A L R E P O R T F Y 2 0 2 0
S T R A T E G I C R E P O R TR E S O U R C E S A N D R E L A T I O N S H I P S C O N T I N U E D
Our people continued
Reward and recognitionRecognising and rewarding colleagues in a fair, open and meaningful way drives engagement and helps us to attract and retain the talent we need. Our reward structure must also work effectively to deliver Group strategy.
We are currently conducting a major global benefits review. This has involved reviewing the benefits we have available, understanding the areas that are working effectively, maximising cost efficiency, and benchmarking in sectors and markets. Our aim is to offer a core set of benefits, including Employee Assistance Programmes, consistently across divisions and territories.
Our long-term objective will be to build in greater flexibility so that colleagues have the opportunity to choose what works best for them.
In the UK we operate an all-employee Sharesave Scheme and the annual invitation to eligible employees to participate encourages colleague involvement in our performance.
We have been an accredited living wage employer in the UK since 2018.
We will undertake a full Remuneration Policy review in FY2021, with the Directors’ Remuneration Policy being submitted for shareholder approval at the 2021 AGM.
Restructuring programmeIn June we announced a strategic restructuring programme. Information on the programme can be found in the Chief Executive Q&A on pages 11-13 and in the Strong financial framework section on pages 18-21
Diversity and inclusionDiversity of thought and perspective, coming from a team with a wide variety of backgrounds, is an important driver of our success. Embracing difference supports our understanding of our stakeholders, our markets and our territories, accelerates new thinking and ideas, and promotes a sense of belonging in our colleagues. It is also in line with our values to promote diversity matters, work to eliminate bias and support equal opportunities.
We have made a great deal of progress, but it is recognised that we can do more.
It is our policy to provide equal employment opportunities. We recruit, support and promote our people on the basis of their qualifications, skills, aptitude and attitude. In employment-related decisions, we comply with all applicable anti-discrimination requirements in the relevant jurisdictions. We have zero tolerance for discrimination and harassment.
People with disabilities are given full consideration for employment and subsequent training (including retraining, if needed, for people who have become disabled), career development and promotion on the basis of their aptitude and ability. We endeavour to find roles for those who are unable to continue in their existing job because of disability.
During FY2020 our Respect, Diversity and Inclusion Council was established to provide strategic direction and tactical plans on diversity and inclusion matters, meeting four times a year. The Council is chaired by Karen Bomba, President, Smiths Interconnect and the Executive Sponsor for Diversity and Inclusion at Smiths. It’s important for us to have different perspectives guiding this work and so Council members have been carefully selected to give us a diverse mix of functions, regions, backgrounds and experience.
We also refreshed our internal support materials which are available on a dedicated intranet site and engaged with Stonewall, a leading international charity which advises institutions on building a fully inclusive workplace for LGBT+ colleagues.
We provide PwC’s respected ‘blind spots’ unconscious bias training to all colleagues with a Smiths or a divisional email address worldwide. The course has now been completed by more than 95% of invitees.
We marked World Mental Health Day, International Women’s Day and International Women in Engineering Day across Smiths through internal communication campaigns and activities, posts on our social media channels and content on our website.
RECOGNISING AND APPRECIATING COLLEAGUE CONTRIBUTIONSWe want our people to feel their contributions are recognised and appreciated. We celebrate colleagues for their work and for embodying our values.
Recognition can and should happen every day, which is why appreciation is embedded in our leadership behavioural commitments. We have a wide range of formal recognition activities, including peer to peer thank you e-cards, long service and on-the-spot
recognition, as well as certificates and badges with our Smiths Excellence System programmes and accreditations.
Each year we host our annual Smiths Excellence Awards, showcasing and celebrating the very best colleague achievements and projects across Smiths. This culminates in the award of the Smiths Cup to the project or team which best demonstrates our values in action.
We understand that when our colleagues feel valued, their satisfaction and productivity increases, they are motivated to maintain or improve their good work, and they are more engaged.
In the last two years of our My Say employee feedback survey, recognition has improved by 5 points, demonstrating the success of our programmes.

3 3S M I T H S G R O U P P L C A N N U A L R E P O R T F Y 2 0 2 0
2
Male 8
Female 4
B O A R D O F D I R E C T O R S 1
Male 6
Female 3
E X E C U T I V E C O M M I T T E E 1
Male 330
Female 72
S E N I O R M A N A G E R S 2
Male 14,014
Female 8,548
C O L L E A G U E S ( T O T A L ) 3
1 Andy Reynolds Smith and John Shipsey are included in both Board of Directors and the Executive Committee.
2 Senior managers as defined by the Companies Act 2006 (Strategic Report and Directors’ Report) Regulations 2013. At Smiths, senior managers are defined as colleagues who are grade 15 and above. The Board of Directors and Executive Committee are not included in these numbers.
3 The Executive Committee are included in these numbers.
In recognition of the Black Lives Matter movement our Chief Executive issued a communication to all colleagues reminding them that across Smiths we stand for harmonious relations between all people, and for respect, equality and justice for all without violence. We stand against all actions which threaten or undermine these principles which are inherent in the values we live by.
In FY2021 we intend to launch a Group-wide initiative ‘Inspire to Succeed’ to promote awareness of diversity and inclusion matters and oversee delivery of activities which focus on support for affinity communities in Smiths.
As required by the UK Government, we report every year on our UK gender pay gap. Our most recent report is on the Smiths website.
Information on our Board diversity policy can be found on page 97.
+ Read more about ethical matters on page 26
Gender diversity in the Group

3 4 S M I T H S G R O U P P L C A N N U A L R E P O R T F Y 2 0 2 0
S T R A T E G I C R E P O R TR E S O U R C E S A N D R E L A T I O N S H I P S C O N T I N U E D
Our customers
The voice of the customer is an innate part of everything we do at Smiths.
Meeting customer needs and exceeding their expectations, not just on products, quality and service, but in the way we conduct business and pay attention to the things that matter to them – for example, ethics and environmental performance – is a fundamental part of our operating model and our values.
We marshall all of our resources and relationships in support of building strong and enduring customer relationships that will sustain Smiths into the future.
We have many different types of relationships with our customers – from fully integrated partnerships where we co-develop new products and services, and long-term sales and aftermarket contracts, to transactional and built to order arrangements. Our drive for innovation and flawless execution is applied to all so that we build our reputation as a supplier of choice.
Many of our customers are in critical industries and customers have been at the centre of our considerations during the COVID-19 pandemic. Our aim has been to prove that we stand by them no
matter what, making every effort possible to fulfil our obligations and, through excellent people and processes, meet the high standards they have come to expect from Smiths.
Response to COVID-19Managing our operations and our supply chain to enable continuity of supply to our customers has been a key principle during the COVID-19 pandemic. This has meant bringing together expert workstream groups from across Smiths, led by the Crisis Core team, and involving all members of our Executive Committee.
Standing with our customers, and with our people, has been the right thing to do, whilst enhancing the reputation of Smiths in the long term.
Since the start of the pandemic we have managed our operational response through our Operations and Supply Nerve Centre (OSNC). Over 90% of our manufacturing sites remained in production throughout the pandemic.
Maintaining continuity of service in our aftermarket activities, while keeping our people as safe as possible, has also been a vital part of our response. This has included finding new ways to deliver services, for example remote inspection activities at John Crane customer sites.
Creating customer valueOur aim is to create innovative and transformative products and services that add value to our customers’ operations and contribute to their goals, supported by consistently high product quality, excellent service, and appropriate pricing.
Our Smiths Excellence System customer pillar brings together our customer excellence processes, tools and materials which our divisions leverage to continuously improve our offer, our performance, and the overall customer experience.
Customer relationships are typically held in our divisions at an appropriate level. We aim to form strong bonds and work in close partnership with many customers so that we better understand their goals and needs, and are able to move fast to respond to opportunities and/or to improve the way we work.
INNOVATING TO SUPPORT CUSTOMERS DURING THE COVID-19 PANDEMICRestrictions resulting from the COVID-19 pandemic required John Crane to quickly adapt and develop new ways to support customer needs.
Innovative ways of undertaking critical inspection work have eliminated the need for travel, allowing parties to save on time and cost, while staying safe.
When the need arises for John Crane’s customers to inspect and approve highly-engineered mechanical seals and system components, both parties would typically meet at a John Crane site to monitor and analyse the equipment while it is put through various performance tests.
COVID-19 restrictions made it impossible for these in-person tests to happen.
The team at John Crane Bangalore, India devised a strategy to conduct seal gas panel tests remotely using a live video feed (complete with various camera angles), as well as the display of digital gauges and the ability for customers to ask real-time questions and make requests.
The John Crane Slough, UK team implemented a system where the gas seal static and dynamic test is streamed to the customer with key test information and the opportunity for direct communication with the test technician during the test.
In March 2020, John Crane France had many witness test inspections planned for high-performance couplings to be installed on ships in oil & gas and marine applications. Inspection tests are normally witnessed by the customer and a third-party inspector.
In just one week, the team developed an alternative remote solution, sourcing high-quality cameras to capture the fine details surrounding performance tests, a reliable connection source and a viable software solution.
Inspections were successfully completed remotely, on time and with approval from all sides.

3 5S M I T H S G R O U P P L C A N N U A L R E P O R T F Y 2 0 2 0
2
Aftermarket services are a characteristic of Smiths businesses and represent almost half of Smiths revenue. As well as being a driver of revenue, our aftermarket relationships enable us to engage more deeply with our customers, build relationships over longer periods of time, and better understand customer needs and respond to them.
In FY2021 we will establish new customer pillar objectives and deliver these through our Customer Pillar Steering Group, which will formally bring together senior customer leaders from across Smiths to share their experience and identify common opportunities to advance our practices.
Voice of the customerWe bring the voice of the customer into our business in many different ways, with the aim of using every touchpoint as an opportunity to deepen knowledge.
We use formal feedback activities such as surveys, quarterly business reviews and senior team meetings with key customers, and defined processes for managing and responding to information collected from customer scorecards. We also integrate informal feedback from the conversations our operational and our field service teams are having with our customers every day. And, in addition to research that takes place for new products, we work with focus groups such as the Smiths Medical nursing panel to better understand how end users are using our products and experiencing our service.
Innovation and product lifecycleOur innovation culture is directed to creating new products and services that respond to customer need, or that will meet a future predicted need. We design new products and services by thinking holistically from customer/societal need and problem definition, through product conception and product introduction, to support in service, to end of life. We engage and partner with many customers early in the product lifecycle to identify and leverage opportunities for collaboration and bespoke development to meet specific requirements. This has recently included Smiths Interconnect working with Boeing on bespoke connectors for NASA’s Orion spacecraft and Lunar Gateway.
We aim for flawless product launches. Cross-functional project teams are formed at the beginning of each new product introduction (NPI) project so that all operational workstreams and the supply chain are aligned in support from project initiation.
+ Read more about technology and innovation on pages 37-39
+ Read more about Smiths Interconnect and the Orion spacecraft and Lunar Gateway on page 62
A ‘Voice of Customer’ programme was developed at Smiths Medical to instil rigour and consistency across the division in customer feedback, product value definition, strategic pricing, and go-to-market plan execution for new products.
The new Voice of Customer research workstream outlines best-in-class principles and customer touchpoints to be gathered and reviewed before a project starts.
Tools including a Voice of Customer framework, research archetypes, and template documents were created to guide research and feedback that are inputs into Smiths Medical’s technical requirements for R&D.
Standard financial models were created to align with product development phases, as well as a new pricing review process to help incorporate customer input into pricing strategies.
Standard templates were also created to define product value and outline an appropriate go-to-market strategy to ensure that project financial milestones are met after launch.
CLOSE WORKING SECURES ADDITIONAL VOLUMES FOR FLEX-TEK AND A DISTRIBUTOR CUSTOMERWhen a Texas-based wholesale distributor of residential and commercial construction and industrial supplies and materials was seeking a new supplier of flexible ducting Flex-Tek sought to build a strong relationship. This resulted in the initial securing of distribution contracts in Houston, Dallas, San Antonio and Austin.
Through continued close working with the distributor, the team was able to secure additional contractor base volume for both partners, adding Fort Worth to the list of locations, and increasing sales to over $15 million.
Flex-Tek is now building the relationship nationally, as the team work to open more locations across the US.
BRINGING THE VOICE OF THE CUSTOMER INTO THE PRODUCT DEVELOPMENT PIPELINE

3 6 S M I T H S G R O U P P L C A N N U A L R E P O R T F Y 2 0 2 0
S T R A T E G I C R E P O R TR E S O U R C E S A N D R E L A T I O N S H I P S C O N T I N U E D
Service and qualityWe aim to deliver a timely and high-quality response to customers interacting with Smiths – from account queries to urgent repair requests – and deliver customer orders as agreed.
We use Key Account Management (KAM) structures across our business. These bring together our operational and functional teams on key accounts to drive ownership of the customer relationship deeper into the business and manage accounts holistically.
We are continuing to leverage our Customer Relationship Management (CRM) capabilities through leading CRM tools and associated training. Over time, we have been introducing new technology to support our go-to-market strategies – for example, webinars to introduce new products and online training for customer technicians. This process has accelerated as a result of the COVID-19 pandemic.
Our divisions use robust quality processes to minimise product safety and quality issues during production. We use advanced supply chain management techniques to optimise flow across the value chain, including outbound logistics, so that we are able to supply customers according to demand and respond quickly to any change.
+ Read more about production on pages 40-41
+ Read more about our supply chain on pages 46-47
O N T I M E I N F U L L ( O T I F ) F Y 2 0 2 0
86%FY2019: 84%
A responsible businessOur customers expect Smiths to operate responsibly. They have a growing expectation of supplier transparency on ethical and environmental matters, as well as ongoing and strict compliance with local and international law and an appropriate approach to cyber security and the protection of information. This is likely to be reflected in contractual arrangements.
We encourage customers to contact us should they have any concerns at all on these matters. Customers may also use our confidential ‘Speak Out’ reporting line.
+ Read more about ethics and compliance on page 26
+ Read more about environmental matters on pages 40-45
DIGITAL TRANSFORMATION OF SMITHS DETECTION’S SERVICE
During the year Smiths Detection launched a Service Management System (SMS) project to improve the quality of customer care by revolutionising the way the service team operates.
Part of this project is the digitalisation of field service management through a mobile application that provides the service team with a single interface for completing several service administration tasks – including scheduling and dispatch, risk assessment, and reporting – which are then automatically updated onto central systems.
Over the next 12 months Smiths Detection will roll out SMS by region, enabling a smooth transition to go-live. The project, which is one of the division’s largest digital transformation initiatives to date, will not only drive efficiencies around service and maintenance processes globally, but is intended to increase first time fix rates and ensure service delivery matches its industry-leading product lines.

3 7S M I T H S G R O U P P L C A N N U A L R E P O R T F Y 2 0 2 0
2
Innovation frameworkOur Group-wide innovation framework assists us in delivering a disciplined approach to innovation and a culture that supports our ambition and our strategy from horizon scanning, understanding megatrends and ideas generation through to new product introduction (NPI). The framework helps us aim for a balanced investment profile between core, next generation and transformational product development.
Our Vitality Index is a Group KPI and measures the percentage of total revenue derived from products launched in the last three years.
Each of our divisions establishes a Vitality Index target and our stage-gate NPI process is tailored for each market and product. This helps to ensure that all parts of the value chain are considered so that we are commercially effective and deliver value for customers. We are also increasingly focused on environmental matters in the NPI process – in relation to both the footprint of products and the production processes used to make them.
+ Read more about production and environmental matters on pages 40-45
We are a world leader in the practical application of advanced technologies. Our organic capability to identify new trends and create products that meet emerging societal and customer needs delivers value both immediately and for the long term.
In pursuit of excellence we embrace technology and innovation across the organisation – from applications that drive continuous improvement in the way we work to resourcing research into ambitious new projects.
Technology and innovation
Technology and innovation are driving the future of Smiths.
SMITHS INTERCONNECT LABORATORY REPLICATES DEEP SPACE
In December 2019, Smiths Interconnect celebrated the opening of its new Qualification and Test laboratory in Dundee, Scotland. The new laboratory offers a one-stop shop for critical qualification and testing of Smiths Interconnect’s products in Europe.
The facility has a unique capability to replicate the environmental pressures of deep space with high power amplifiers and vacuum systems and to assess products against the same extreme vacuum and heat pressures they would have to withstand in space.
The facility offers testing which analyses high power radio frequency devices and breakdown phenomena in vacuum or near-vacuum conditions, and utilises radioactive sources to simulate the cosmic radiation that can often trigger the onset of these phenomena. This is an important factor in the reliability or operation of a satellite or other space-based equipment.
The new laboratory facility is also able to replicate the G-force for a rocket launch to assess the effects on products at launch. At maximum shock testing, shock testing equipment generates up to 105dB+ of noise and requires a special soundproof room.
Being able to offer these complex tests is a major benefit and a real point of competitive differentiation for Smiths Interconnect.
I N V E S T M E N T I N R & D F Y 2 0 2 0 *
4.7%FY2019*: 4.5%* Continuing Operations
V I T A L I T Y I N D E X F Y 2 0 2 0
20%FY2019: 13%
+ Dame Ann Dowling, Board sponsor of the Smiths Innovation Strategy Board, attends the December 2019 meeting hosted by the Digital Forge.

3 8 S M I T H S G R O U P P L C A N N U A L R E P O R T F Y 2 0 2 0
S T R A T E G I C R E P O R TR E S O U R C E S A N D R E L A T I O N S H I P S C O N T I N U E D
Technology and innovation continued
Driving capabilities and collaborationDriving our innovation capability and collaborating across Smiths is vitally important, helping ensure we make the most of current and future trends.
Smiths Innovation Strategy Board (SISB)The Smiths Innovation Strategy Board (SISB) connects colleagues from across Smiths in an ecosystem for innovative thinking, research and action in support of new opportunities. The SISB has undertaken work on megatrends and long-range targeting and forecasting, and collaboration plans with key universities – including Imperial College, London – for co-development and investment in future-focused technology and talent acquisition are underway. The SISB has also been working on an ‘adjacencies’ project to identify opportunities in line with the Smiths purpose and values that may not naturally fit into one of the Smiths divisions, or that is creating a new sector. When a project is identified it is resourced as relevant and taken forward under the guidance of the SISB.
Digital ForgeOur Digital Forge centre of excellence opened in 2018 and is accelerating the growth of digital products in our portfolio and driving efficiency and speed through common development and common platforms and tools that can be repurposed across Smiths product lines. The Digital Forge is sponsored by our Chief Executive and the Smiths Digital Advisory Committee (comprising members of the Smiths Executive Committee) determines strategy and governs our digital activities.
The Forge is predominantly focused on developing bespoke interface solutions that digitise products by connecting them to the internet/cloud and enabling the flow of data with a high degree of cyber security. This has included smart products at Smiths Medical and John Crane SenseTM condition-based seal monitoring technology, for which capability has been significantly extended in FY2020 to support large scale, high volume and high-pressure dry gas seals.
Future development includes smart heater interfaces for Flex-Tek and methane monitoring products.
Design ThinkingWe are also supporting our innovation culture through the SES Academy and are moving forward with a Design Thinking programme to support cognitive skills and creative thinking to bring new products and services to life. A pilot Design Thinking awareness course (delivered online during the COVID-19 pandemic) has been taken by around 160 colleagues and a formal programme is planned for FY2021.
+ Read more about the SES Academy on page 31
DIGITAL FORGE DRIVES ENTHUSIASM FOR MACHINE LEARNING
The Digital Forge is helping drive innovation and digital transformation at Smiths. One of its aims is to build core capabilities in artificial intelligence (AI) and machine learning, data analytics, connectivity and data security across the Group.
During FY2020, the Forge ran a competition to help colleagues improve their machine learning skills and encourage those not from science or engineering backgrounds to learn more about it. The challenge was to build a self-driving algorithm and teach a remote-controlled model car how to navigate a racecourse by itself, as fast as possible.
The competition was embraced by 35 teams from all over the world. Seven winners from different divisions competed at the Digital Forge, in San Francisco, to race against each other to decide the ultimate Smiths Self-Driving Car Champion.
Some of the model cars achieved speeds of up to 10mph. Our Chief Executive, Chief Financial Officer and JehanZeb Noor, Chief Executive, Smiths Medical all attended the final and awarded the trophy to the winning team.
The competition was a great success, driving enthusiasm for machine learning and highlighting internal collaboration opportunities within the business. It also opened new career paths for some participants as a result of them demonstrating their exceptional software engineering skills.
EXPANDING THE DIGITAL TEAM TO ACCELERATE DIGITAL TRANSFORMATIONIn recent years, Smiths Detection has been pursuing digital transformation, developing solutions such as iCMORE and Checkpoint.Evoplus to bring greater screening capabilities and operational advantage to security operations.
To accelerate the development of digital solutions and reduce dependence on external developers, Smiths Detection established a global technology centre of excellence in Singapore and a technology development centre in Bangalore, India.
The Bangalore team works collaboratively with experts and product development teams at other centres
of excellence in order to develop and improve Smiths Detection’s digital technology capabilities.
Smiths Detection also continues to establish partnerships with universities around the globe to research security projects.
In 2020, the division established a research relationship with Imperial College London to collaborate on a joint PhD project to develop deep learning techniques to improve automated threat detection in airport baggage scanners. The project is funded by the UK Government’s Department for Transport and the Home Office.

3 9S M I T H S G R O U P P L C A N N U A L R E P O R T F Y 2 0 2 0
2
Enterprise ITSmiths has a mature and optimised IT infrastructure environment with an advanced internal capability which leverages core external partners to develop and deliver services and applications that support business priorities and needs. Expertise is held at the centre in the Smiths Business Information Services (BIS) team which collaborates with the Smiths functions and our divisional operational and IT specialists to drive innovation and efficiency and leverage scale.
This structure and capability means that Smiths is able to manage in-house the IT delivery of significant programmes such as the Smiths Excellence System. For SES, our internal team developed and built everything from the SES knowledge portal to supporting applications such as the SESAME tool and, working with HR, our suite of creative training materials for the SES Academy.
Our IT capability supported an accelerated response to the challenges presented by the COVID-19 pandemic. This included the global roll out of secure technology in support of home working, the development of dashboards providing data analysis for the Smiths Group Crisis Core team and the Operations and Supply Nerve Centre (OSNC), and the rapid delivery of a self-service emergency contact details recording system.
FY2021 projects include working with our HR operations team to create a digital HR experience to help us better manage data and produce relevant analysis to aid delivery of our People Plan.
SESAME toolThe SESAME (Smiths Excellence System Assessment Module) diagnostic tool was developed by our BIS applications team to support continuous improvement across our SES pillars. SESAME analyses the performance of every Smiths site on the SES fundamentals using data from 150 questions completed by the site leader and provides management information from site up to division level.
An upgrade to the tool with new questions, a more granular assessment method, and the inclusion of guidance on improvement resolution actions, was launched in February 2020.
Enterprise and product cyber securityCyber security is a principal risk area for Smiths. It is vital – from both a regulatory and business continuity perspective – that we do everything possible to maintain the confidentiality, integrity and availability of our IT systems and the data held on them. We apply a proactive and globally unified approach to the security of our IT environment, managed by BIS and overseen by the Board, and supported by global partnerships with external providers such as AT&T. This ensures that every part of the organisation is aligned on best practice as it evolves.
Cyber security efforts during FY2020 focused on delivering improved processes and controls, with additional work to deliver enhanced systems for the protection of Smiths data. The introduction of new capabilities, monitoring, and security awareness campaigns during the COVID-19 pandemic has also been an important focus for the team. In addition, we have implemented an enhanced requirement for compliance to industry security standards where we gained or renewed ISO/IEC 27001 information security management and Cyber Essentials certification for select operations. Preparation also began for the US Cyber security Maturity Model Certification (CMMC), which will replace NIST 800-171 in FY2021.
Smiths products are used in many mission-critical applications in highly regulated industries, thus requiring continued focus on ensuring that our products meet the highest standards of cyber security. Meeting product cyber security regulations is the responsibility of our divisions, with governance and risk management residing with the Smiths central team, which hosts systems and performs an advisory role on critical matters such as data privacy.
+ Read more about how we protect our business from cyber attacks on page 74
SMITHS MEDICAL R&D PILOTS COLLABORATION WORKSHOPSContinuous improvement (CI) is an important part of the culture at Smiths Medical. A key element of CI is seeking ideas and feedback to improve processes and procedures and taking action based on the feedback received.
During the year Smith Medical’s R&D department created three teams to lead workshops focused on developing collaboration, retention and communication skills in support of CI activities.
Their goals were to create an open, ongoing discussion about collaboration; help all colleagues to learn and apply specific strategies and behaviours that contribute to effective collaboration; and build a supportive and professional culture that acknowledges the patience, courage and practice required to collaborate effectively.
The teams ran a series of two-hour, in-person workshops involving more than 200 R&D colleagues at four Smiths Medical sites between October 2019 and January 2020. The interactive workshops were delivered to groups of 15 to 25 colleagues, with a variety of small and large group activities, discussions and collaboration scenario strategy sessions.
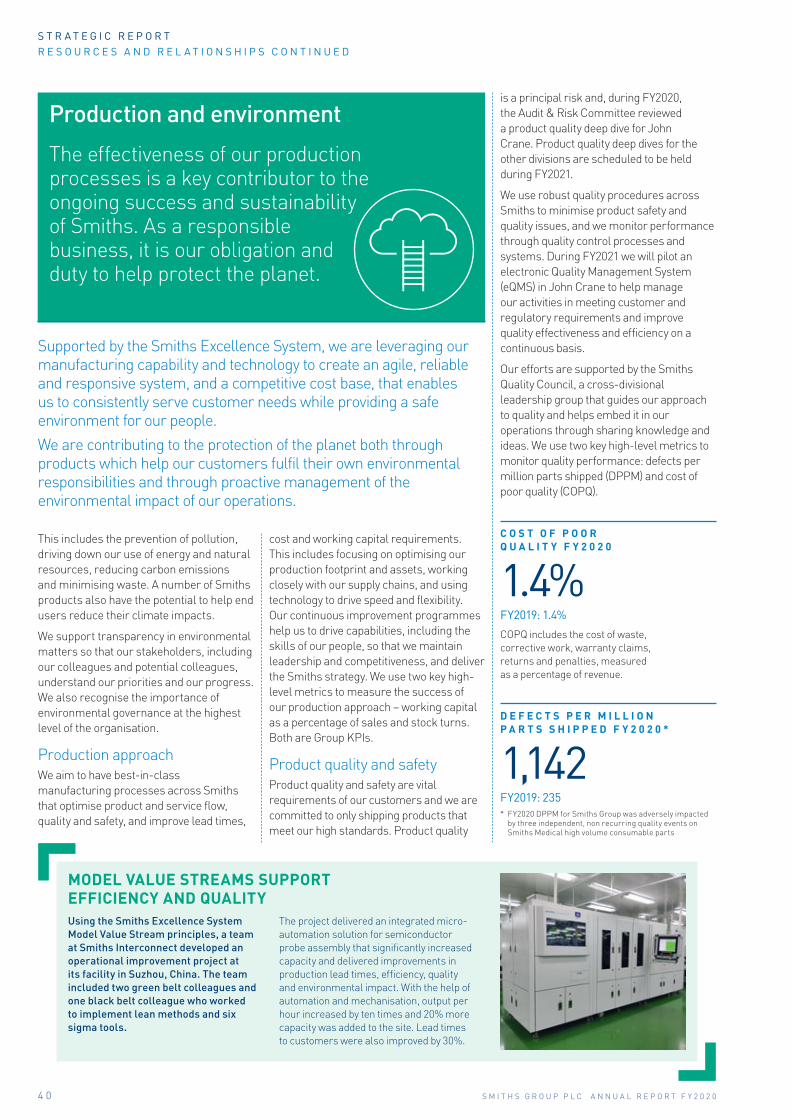
4 0 S M I T H S G R O U P P L C A N N U A L R E P O R T F Y 2 0 2 0
S T R A T E G I C R E P O R TR E S O U R C E S A N D R E L A T I O N S H I P S C O N T I N U E D
Production and environment
The effectiveness of our production processes is a key contributor to the ongoing success and sustainability of Smiths. As a responsible business, it is our obligation and duty to help protect the planet.
Supported by the Smiths Excellence System, we are leveraging our manufacturing capability and technology to create an agile, reliable and responsive system, and a competitive cost base, that enables us to consistently serve customer needs while providing a safe environment for our people.
We are contributing to the protection of the planet both through products which help our customers fulfil their own environmental responsibilities and through proactive management of the environmental impact of our operations.
This includes the prevention of pollution, driving down our use of energy and natural resources, reducing carbon emissions and minimising waste. A number of Smiths products also have the potential to help end users reduce their climate impacts.
We support transparency in environmental matters so that our stakeholders, including our colleagues and potential colleagues, understand our priorities and our progress. We also recognise the importance of environmental governance at the highest level of the organisation.
Production approachWe aim to have best-in-class manufacturing processes across Smiths that optimise product and service flow, quality and safety, and improve lead times,
cost and working capital requirements. This includes focusing on optimising our production footprint and assets, working closely with our supply chains, and using technology to drive speed and flexibility. Our continuous improvement programmes help us to drive capabilities, including the skills of our people, so that we maintain leadership and competitiveness, and deliver the Smiths strategy. We use two key high-level metrics to measure the success of our production approach – working capital as a percentage of sales and stock turns. Both are Group KPIs.
Product quality and safetyProduct quality and safety are vital requirements of our customers and we are committed to only shipping products that meet our high standards. Product quality
is a principal risk and, during FY2020, the Audit & Risk Committee reviewed a product quality deep dive for John Crane. Product quality deep dives for the other divisions are scheduled to be held during FY2021.
We use robust quality procedures across Smiths to minimise product safety and quality issues, and we monitor performance through quality control processes and systems. During FY2021 we will pilot an electronic Quality Management System (eQMS) in John Crane to help manage our activities in meeting customer and regulatory requirements and improve quality effectiveness and efficiency on a continuous basis.
Our efforts are supported by the Smiths Quality Council, a cross-divisional leadership group that guides our approach to quality and helps embed it in our operations through sharing knowledge and ideas. We use two key high-level metrics to monitor quality performance: defects per million parts shipped (DPPM) and cost of poor quality (COPQ).
C O S T O F P O O R Q U A L I T Y F Y 2 0 2 0
1.4%FY2019: 1.4%
COPQ includes the cost of waste, corrective work, warranty claims, returns and penalties, measured as a percentage of revenue.
D E F E C T S P E R M I L L I O N P A R T S S H I P P E D F Y 2 0 2 0 *
1,142FY2019: 235* FY2020 DPPM for Smiths Group was adversely impacted
by three independent, non recurring quality events on Smiths Medical high volume consumable parts
MODEL VALUE STREAMS SUPPORT EFFICIENCY AND QUALITY Using the Smiths Excellence System Model Value Stream principles, a team at Smiths Interconnect developed an operational improvement project at its facility in Suzhou, China. The team included two green belt colleagues and one black belt colleague who worked to implement lean methods and six sigma tools.
The project delivered an integrated micro-automation solution for semiconductor probe assembly that significantly increased capacity and delivered improvements in production lead times, efficiency, quality and environmental impact. With the help of automation and mechanisation, output per hour increased by ten times and 20% more capacity was added to the site. Lead times to customers were also improved by 30%.

+ Members of the Smiths Interconnect Tijuana team complete a CI training course on practical problem solving
4 1S M I T H S G R O U P P L C A N N U A L R E P O R T F Y 2 0 2 0
2
Continuous improvement (CI)Our SES production pillar supports innovation and CI in our manufacturing processes. It provides standards, content, training and tools based on acknowledged best practice focused on lean methodology.
Our Production Steering Group, which comprises director level production representatives from our divisions and the Smiths production pillar lead, meets regularly to agree priorities and ensure that efforts are aligned with business needs. Work is focused on developing production excellence in three key areas – leveraging best practices, developing capabilities and embedding CI everywhere and includes production/lean excellence learning. We will develop a tailored production excellence learning package for plant leaders in FY2021.
We are also continuing to transform our manufacturing sites through the development of Model Value Streams, which aim to push the boundaries of what can be achieved through the use of new technologies, lean manufacturing techniques and other best practices. We have implemented 21 Model Value Streams, empowering our people and enabling us to test the effectiveness of technologies and lean manufacturing techniques in a live environment.
Our CI culture also works to support delivery of our environmental goals.
+ Read more about the SES Academy on page 31
The lean toolbox and SESAMEThe Smiths lean toolbox comprises 26 lean tools and, along with the SESAME diagnostic tool, is helping us embed a CI mindset at every level of Smiths in support of all SES pillars. Key tools from the toolbox are being deployed through our living lean initiative, which features guidelines, training modules and templates, all in one online portal, supported by an active communications programme.
+ Read more about the SESAME tool on page 39
W O R K I N G C A P I T A L % O F S A L E S F Y 2 0 2 0
28%FY2019: 26%
Working capital measures speed and efficiency in the business from manufacturing to debt collection. Working capital translates into cash.
S T O C K T U R N S F Y 2 0 2 0
3.0xFY2019: 3.4x
Stock turns measure speed and efficiency in the business.
Environmental governanceEnvironmental governance flows from the Smiths Board to every Smiths site. The Board and Executive Committee oversee planning and target setting, and monitor environmental performance and environmental matters via a report that is prepared for every Board and Executive Committee meeting. The Smiths Global Head of HSE (Health, Safety, Environment) is invited to present to the Board twice a year and a presentation is made at every Executive Committee meeting. The Board also monitors environmental and climate risk through the Smiths risk management process.
JOHN CRANE PARTNERS ON METHANE EMISSIONS MONITORING
John Crane, along with two other investors – OGCI Climate Investments and Energy Innovation Capital- led a Series C funding round for Kairos Aerospace, Inc., a leading provider of large-scale aerial monitoring of methane emissions, to expand Kairos’ operations and grow its geographic footprint.
Kairos provides actionable data on major sources of methane emissions, supporting global industry need for more visibility on emissions in response to evolving standards.
The company’s environmental technology enables the capture of critical, reliable and archivable data that will facilitate the efficient reduction of global methane emissions across industries.
This partnership further adds to John Crane’s portfolio of solutions to monitor and mitigate greenhouse gases and is a testament to the division’s commitment to be a proactive agent of greenhouse gas emissions reduction and environmental sustainability.

4 2 S M I T H S G R O U P P L C A N N U A L R E P O R T F Y 2 0 2 0
S T R A T E G I C R E P O R TR E S O U R C E S A N D R E L A T I O N S H I P S C O N T I N U E D
The Smiths Executive Environmental Roundtable (EER) was established by our Chief Executive in FY2019 with the aim of accelerating our environmental efforts and agenda. The EER is chaired by the Smiths Global Head of HSE and reports to the Executive Committee. It has the responsibility for developing environmental strategy, target setting, reporting and risk management and reporting performance, including:
– The governance framework for environmental risk and performance
– Considering if environmental controls are operating effectively
– Oversight of programmes and any emerging critical issues of an environmental nature
– Reviewing the effectiveness of performance reporting procedures
– Reviewing external reporting on environmental matters
– Seeking the views of stakeholders on environmental practices
– Ensuring appropriate training is provided
– Reviewing policies in relation to environmental performance
– Making recommendations to the Executive Committee for action
The work of the EER is supported by our external sustainability partner which collaborates with us on environmental disclosures, benchmarking and alignment with external reporting frameworks.
The EER oversaw the completion of near- and long-term climate sensitivity risk assessments during FY2020 and is currently working on refreshing the Group’s existing environmental policy.
The new Environmental Sustainability Policy will be implemented in FY2021. The EER is also leading a study into onsite electricity generation looking into options for generating renewable power at some Smiths locations. More than 20 high usage sites have been identified for evaluation.
OUR COLLEAGUESMany Smiths colleagues are passionate about the environment and how our business can contribute to global goals. Overseen by the EER, the launch of our refreshed Environmental Sustainability Policy and our next environmental goals will be used as an opportunity to promote further engagement through a communications programme and closer alignment with the SES Academy and other SES materials. We will also launch an environmental awareness training module in FY2021 and increase colleague focus on our FY2021 recycling target.
EXECUTIVE ENVIRONMENTAL ROUNDTABLE

Risk Management
Metrics and Targets
Strategy
Governance
4 3S M I T H S G R O U P P L C A N N U A L R E P O R T F Y 2 0 2 0
2
Alignment with external reporting frameworksIt is recognised that corporate disclosure and transparency are key catalysts for driving change.
Smiths is generally aligned with the Global Reporting Initiative (GRI) reporting principles for environmental matters, and we have in place a comprehensive portfolio of policies which include biodiversity protection, emission reductions and product compliance. Performance against these policies is overseen by audit processes, including all our ISO 14001 production sites with over 50 colleagues.
We are committed to continued alignment with the Task Force on Climate-related Financial Disclosures (TCFD) for our governance, risk management, strategic planning and execution around climate risk/GHG reduction. During FY2020 our external partner conducted a formal review of our position against all 11 recommendations of the TCFD and confirmed our alignment with all.
Climate risk assessmentDuring FY2020 each of our divisions completed a systematic climate-related risk assessment with a five-year time horizon. This was supplemented by a risk assessment workshop held centrally to review Group climate-related risk on a 20-year time horizon. The results of these risk assessments were presented to the Board and Executive Committee.
The assessment did not identify any near-term significant climate-related risks from internal operations. However, the EER intends to further develop this area of work.
FY2020 progress FY2021 priorities
GovernanceSmiths governance around climate-related risk and opportunities.
– Continuing work of EER – Enhanced reporting to the Board and Executive Committee
– Updating Environmental Sustainability Policy (from Environmental Emissions Reduction Policy)
StrategyThe processes used by Smiths to identify, assess and manage climate-related risks.
– Assess opportunities for onsite renewable energy generation at key locations
– Engaging colleagues to increase recycling programmes
– Investigate product stewardship opportunities including life-cycle analysis pilot projects
Risk managementThe actual and potential impacts of climate-related risks and opportunities on Smiths businesses, strategy, and financial planning,
– 5 and 20-year climate risk assessments
– Update and expand climate risk assessments
– Investigate reporting challenges on Scope 3 GHG reporting
Metrics and targetsThe metrics and targets used to assess and manage relevant climate-related risks and opportunities.
– Achieved FY2019-FY2021 renewable electricity target
– Prepare FY2022-FY2024 goals
– Meet or exceed all four FY2021 targets
– Launch FY2022-FY2024 goals
Aligning with the TCFD
THE MAIN ACCOMPLISHMENT IS THAT SMITHS WENT THROUGH THE PROCESS OF SYSTEMATICALLY SCREENING THE PHYSICAL AND TRANSITION RISKS OF CLIMATE CHANGE TO THEIR DIVISIONS.
FOCUSING ON RISKS ACROSS DIFFERENT CATEGORIES, TIME PERIODS AND CLIMATE PARAMETERS IS AN IMPORTANT EXERCISE SO THAT NOTHING IS OVERLOOKED.
RambollSmiths external environmental partner
We also submit information to external parties for benchmarking of our processes and performance against others. In FY2020 we again participated in the Carbon Disclosure Project (CDP) global environmental reporting initiative in which we received a score of A- in 2017 and B in 2018, putting us in the CDP management category indicating that we are taking co-ordinated action on climate issues. We are currently preparing our latest (2019) CDP submission for both GHG and water.
We have also received favourable ratings from other external parties for our Environment, Social and Governance (ESG) performance including FTSE4Good, ISS, MSCI and Dow Jones.
+ See our external ratings on page 24

4 4 S M I T H S G R O U P P L C A N N U A L R E P O R T F Y 2 0 2 0
S T R A T E G I C R E P O R TR E S O U R C E S A N D R E L A T I O N S H I P S C O N T I N U E D
Production and environment continued
Environmental managementThe leaders of our divisions, on behalf of the Chief Executive, have overall responsibility for environmental performance in their businesses. They are supported by divisional HSE experts and the HSE Technical Committee which include representatives from across Smiths.
We closely monitor energy and water use, waste generation, recycling and GHG emissions to identify tailored plans for improvement and collaborate on action plans and best practice.
Our production processes and the way we manage our sites aim to decrease waste and energy consumption and reduce emissions. We are also investing in low-carbon and energy efficient technologies to drive improvement in our performance. We have improved energy efficiency by over 17% and reduced GHG emissions by over 46% since FY2007. In the same period we have also reduced total water use by 44% and non-recyclable waste by 49%.
All divisions also participate in a regular forum to share best practices and ensure compliance with global restricted substance regulations including WEEE, RoHS, Prop65, TSCA and Responsible Minerals.
Our Supplier Code of Conduct sets out the environmental conditions we require of suppliers, and environmental performance (with a focus on GHG emissions) is reviewed as part of the due diligence process relating to acquisitions.
Environmental goals and performanceSmiths aims for continuous improvement in environmental performance and we have had reduction targets for environmental metrics since FY2007.
Our current FY2019 to FY2021 Group environmental improvement targets are to reduce greenhouse gas (GHG) emissions and water consumption in stressed areas by 5% over the period and increase our use of renewable electricity by 5% and our recycling rate by 5%. We also have a long-range target to use more than 75% renewable electricity by 2040.
Reduction targets are compared to the FY2018 baseline year and GHG and water are normalised to FY2018 revenue. Renewable electricity and recycling are rate-based and therefore are not normalised. Water consumption targets are focused on our 13 locations in stressed areas as defined by UNESCO, as well as certain locations in China, India and Mexico where water is constrained.
DRIVING SUSTAINABILITY THROUGH PACKAGING CHOICES AT FLEX-TEKTo build sustainability in its supply chain, Flex-Tek’s Thermaflex business has proactively sought environmentally friendly options for packaging.
This has resulted in the use of packaging from supplier Pratt Industries made from 100% recycled paper.
As a result of the partnership Thermaflex was awarded a 2019 Environmental Impact Award by Pratt Industries and made the following environmental savings in 2019: – 3,983,600 gallons of water – 16,930 trees – 293.79 tons of CO2 prevented – 2,987,700 kWh of power – 2,490 yd3 diverted from landfill
Performance against FY2019-FY2021 environmental goalsTwo years into the current goal period, we have exceeded both our greenhouse gas and renewable electricity goals. We are undertaking energy efficiency projects, including lighting and/or air conditioning upgrades at multiple locations and, during the year, our Smiths Detection Wiesbaden site completed an upgrade to its boiler system.
We are close to our water target with one year remaining to make our 5% reduction goal. Our recycling target will be a key focus over the next year. There are current challenges as global geopolitical matters affect recycling rates.
FY2019– FY2021
target
FY2020 outcome
vs FY2019
FY2020 outcome
vs FY2018 Progress
Use of renewable electricity1
5% increase to 48%
12% 12% Reached in FY2020
Greenhouse gas emissions
5% reduction 2% -6% Reached in FY2019
Recycling rate 5% increase to 71%
1% -2% Striving to meet goal in FY2021
Water consumption in stressed areas (13 locations)
5% reduction 6% -4% Striving to meet goal in FY2021
1 Non GHG producing electric sources including hydroelectric and nuclear

4 5S M I T H S G R O U P P L C A N N U A L R E P O R T F Y 2 0 2 0
2
Energy use and GHG emissionsEnergy use and greenhouse gas emissions are up in FY2020 due to the inclusion of the acquired facilities of United Flexible. Normalised GHG emissions are down 6% from FY2018.
Smiths includes its Streamlined Energy and Carbon Reporting (SECR) below for FY2020 including our emissions and global energy use (multiple years) and intensity metric. For the SECR the GHG Protocol Corporate Standard has been used.
In FY2020, the UK was responsible for 22% (59,043,990 KWh) of Group energy usage, 6.1% (1,010 tonnes) of Scope 1 emissions and 0.7% (355 tonnes) of Scope 2 emissions.
Our GHG emissions calculations and reporting follows the Greenhouse Gas protocol (operational approach) and covers emissions from all sources under our control, grouped under: Scope 1 – direct GHG emissions from owned assets; and Scope 2 – GHG emissions from supplied electricity. Our Scope 1 emissions are primarily driven by fossil fuel powered facility heating systems where there are very few reliable and available green alternatives.
FY2022-FY2024 goalsThe EER has begun discussing short and long-term goals for the next goal period from FY2022 and alignment between them. This has included benchmarking our targets against comparable businesses.
It is probable that the next goal period will include some focus on suppliers, and packaging and product stewardship, as well as continued focus on emissions.
FY2020 FY2019 FY2018 FY2017
Global energy use KWh 262,843,580 247,258,350 255,467,620 256,112,390
Emissions
Absolute values
Scope 1 (direct emissions)
t CO2e 16,640 14,929 15,670 15,169
Scope 2 (indirect emissions)
t CO2e 52,647 47,312 54,489 62,072
Total t CO2e 69,287 62,241 70,158 77,241
Normalised values
Scope 1 (direct emissions)
t CO2e/£m revenue
4.71 4.57 4.67 5.09
Scope 2 (indirect emissions)
t CO2e/£m revenue
14.92 14.47 16.23 20.83
Totalt CO2e/£m
revenue19.63 19.04 20.90 25.92
Previous year emissions data has been restated in accordance with up-to-date emissions factors.
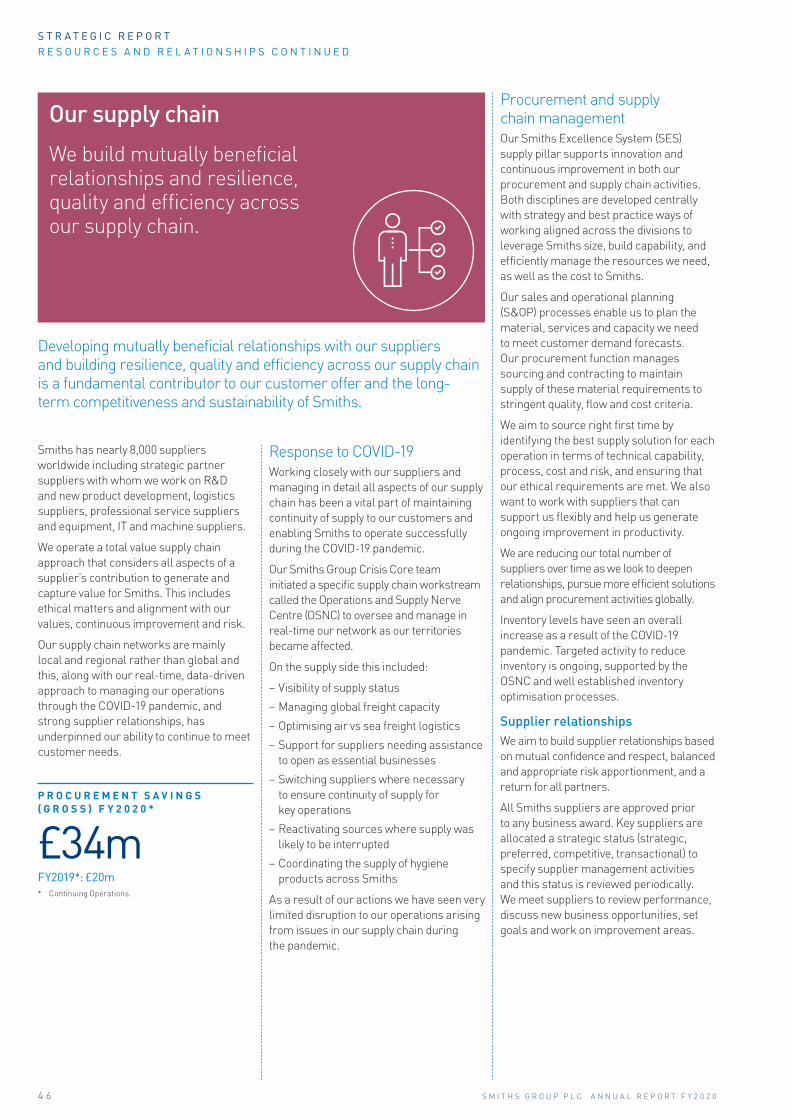
4 6 S M I T H S G R O U P P L C A N N U A L R E P O R T F Y 2 0 2 0
S T R A T E G I C R E P O R TR E S O U R C E S A N D R E L A T I O N S H I P S C O N T I N U E D
Our supply chain
We build mutually beneficial relationships and resilience, quality and efficiency across our supply chain.
Developing mutually beneficial relationships with our suppliers and building resilience, quality and efficiency across our supply chain is a fundamental contributor to our customer offer and the long-term competitiveness and sustainability of Smiths.
Smiths has nearly 8,000 suppliers worldwide including strategic partner suppliers with whom we work on R&D and new product development, logistics suppliers, professional service suppliers and equipment, IT and machine suppliers.
We operate a total value supply chain approach that considers all aspects of a supplier’s contribution to generate and capture value for Smiths. This includes ethical matters and alignment with our values, continuous improvement and risk.
Our supply chain networks are mainly local and regional rather than global and this, along with our real-time, data-driven approach to managing our operations through the COVID-19 pandemic, and strong supplier relationships, has underpinned our ability to continue to meet customer needs.
P R O C U R E M E N T S A V I N G S ( G R O S S ) F Y 2 0 2 0 *
£34mFY2019*: £20m* Continuing Operations.
Response to COVID-19Working closely with our suppliers and managing in detail all aspects of our supply chain has been a vital part of maintaining continuity of supply to our customers and enabling Smiths to operate successfully during the COVID-19 pandemic.
Our Smiths Group Crisis Core team initiated a specific supply chain workstream called the Operations and Supply Nerve Centre (OSNC) to oversee and manage in real-time our network as our territories became affected.
On the supply side this included:
– Visibility of supply status
– Managing global freight capacity
– Optimising air vs sea freight logistics
– Support for suppliers needing assistance to open as essential businesses
– Switching suppliers where necessary to ensure continuity of supply for key operations
– Reactivating sources where supply was likely to be interrupted
– Coordinating the supply of hygiene products across Smiths
As a result of our actions we have seen very limited disruption to our operations arising from issues in our supply chain during the pandemic.
Procurement and supply chain managementOur Smiths Excellence System (SES) supply pillar supports innovation and continuous improvement in both our procurement and supply chain activities. Both disciplines are developed centrally with strategy and best practice ways of working aligned across the divisions to leverage Smiths size, build capability, and efficiently manage the resources we need, as well as the cost to Smiths.
Our sales and operational planning (S&OP) processes enable us to plan the material, services and capacity we need to meet customer demand forecasts. Our procurement function manages sourcing and contracting to maintain supply of these material requirements to stringent quality, flow and cost criteria.
We aim to source right first time by identifying the best supply solution for each operation in terms of technical capability, process, cost and risk, and ensuring that our ethical requirements are met. We also want to work with suppliers that can support us flexibly and help us generate ongoing improvement in productivity.
We are reducing our total number of suppliers over time as we look to deepen relationships, pursue more efficient solutions and align procurement activities globally.
Inventory levels have seen an overall increase as a result of the COVID-19 pandemic. Targeted activity to reduce inventory is ongoing, supported by the OSNC and well established inventory optimisation processes.
Supplier relationshipsWe aim to build supplier relationships based on mutual confidence and respect, balanced and appropriate risk apportionment, and a return for all partners.
All Smiths suppliers are approved prior to any business award. Key suppliers are allocated a strategic status (strategic, preferred, competitive, transactional) to specify supplier management activities and this status is reviewed periodically. We meet suppliers to review performance, discuss new business opportunities, set goals and work on improvement areas.

4 7S M I T H S G R O U P P L C A N N U A L R E P O R T F Y 2 0 2 0
2
During FY2020 we initiated a process to put in place a logistics agreement with one third party logistics provider to manage inland logistics flows and forward orders across all divisions in the US.
Managing riskOur integrated supply chain is identified as a principal risk and is managed accordingly through the Smiths risk management process.
We have accelerated the deployment of a supplier risk management system following the COVID-19 pandemic. This will assess suppliers on the basis of criticality of contribution and likelihood of interruption/collapse and is an extension of the work already undertaken for sole source suppliers.
The requirement to comply with our Supplier Code of Conduct (see right) aims to limit the risk of damage to our reputation or customer service from an ethical breach on the part of a supplier.
Continuous improvementWe aim for continuous improvement in our procurement and supply chain practices by building the capabilities of our people, advancing our data and our systems, and working with our suppliers to improve quality and performance.
We offer APICS and CIPS accredited procurement and supply chain professional development programmes, as well as discipline-specific learning through the SES Academy and SES materials in our supply knowledge portal.
We have continued with the development of our S&OP process and its deployment to our divisions to improve visibility on the upstream supply chain.
We have standardised KPIs across the organisation and our relaunched SESAME diagnostic tool is assisting us to generate CI plans to improve our key KPIs. We have also developed a new 9 Box tool which provides a structured method to deploy inventory optimisation techniques at site and divisional levels. A 9 Box diagnostic and heatmap tool is under development.
+ Read more about the SESAME diagnostic tool on page 39
For supplier delivery and quality performance we are currently focused on lead time and involving our suppliers further in the management of upstream inventory.
In FY2020 we broke our annual record for procurement savings during the year. This has been driven by consolidating our supply base and working with suppliers to improve processes, often sharing the benefits of reduced costs.
Ethics and complianceResponsible procurement and supply chain transparency is part of the Smiths ethical framework. Our Supplier Code of Conduct makes clear our expectations of suppliers and sub-suppliers when it comes to ethical behaviour and compliance with the law, treatment of personnel, and materials from socially and environmentally responsible sources.
For the last three years we have been auditing tier 1 suppliers across the world for modern slavery.
+ Read more about human rights and tackling modern slavery on page 50
For our higher value and/or more complex products we engage with our suppliers at the highest level to partner on R&D, new product introduction, quality and continuous improvement projects, and we aim to be the customer of choice for supplier innovations.
An example CI process is Smiths Detection Hemel Hempstead’s collaborative work with key vendors supplying components for the IONSCAN 600 portable trace detector for narcotics and explosives. Utilising Value Analysis and Value Engineering (VA/VE) principles - including design simplification and design for service - incoming supply chains have been shortened, total cost of components has been lowered, and COPQ has been reduced.
Supplier contract models and payment terms vary depending on the size and type of relationship. Our Smiths terms and conditions describe our general approach to working with suppliers. We are currently exploring options for a supplier finance initiative which will bring benefit to our suppliers at the same time as reducing working capital.
Our planned FY2020 supplier conference did not take place due to the COVID-19 pandemic.
LogisticsLogistics has been a key area of focus in recent years as we look to optimise our inbound, internal and outbound network model. Moving goods efficiently and responsively is as critical to Smiths and to our customers as managing the inbound supply of materials. We are currently working on logistics optimisation projects to consolidate flows/providers where practical to enhance responsiveness and maximise use of capacity, with the added benefit of the positive environmental impact of fewer vehicle movements.
APAC LOGISTICS SUPPLIER CONSOLIDATIONDanli Shen’s lean six sigma black belt project in our Asia-Pacific (APAC) region is a testament to how change leaders are transforming our operations.
Danli, in partnership with our APAC China Council, led a data-driven initiative that consolidated multiple freight suppliers covering various
divisional operations in the region into an aligned and complementary group of supply entities.
This business process innovation resulted in substantial cost savings, contractual leverage, and synergies across our APAC business.

4 8 S M I T H S G R O U P P L C A N N U A L R E P O R T F Y 2 0 2 0
S T R A T E G I C R E P O R TR E S O U R C E S A N D R E L A T I O N S H I P S C O N T I N U E D
TENNESSEE TORNADO RESPONSE
On 3 March 2020, a powerful tornado moved across Cookeville, Tennessee, home to Flex-Tek’s TUTCO facility.
The tornado destroyed hundreds of homes and took the lives of 18 people, including five children, in the Putnam County community.
This was the strongest tornado recorded in the US over the past three years. Several TUTCO employees and their families were personally affected, with their homes completely destroyed or damaged.
The TUTCO team rallied together to support affected team members as well as the wider community. Their first task was to locate and ensure all team members were safe and accounted for. Those affected were contacted to assess their individual needs such as food, shelter or clothing. The team prepared meals and collected donations for the families, whilst others searched the area for personal items, cut trees and moved debris. Temporary accommodation and storage were arranged for colleagues in need.
A fundraising account was also established, with all proceeds going to colleagues affected by the tornado.
Our communities
We aim to contribute positively to local communities in every area that we operate.
This involves playing a beneficial role in local economies through job creation and procurement, operating safely, environmentally responsibly and ethically, and engaging directly through fundraising, charitable giving and education initiatives.
Healthy and prosperous communities and strong relationships are aligned with our Smiths values, are positive for business, and inspire and promote a sense of pride and ownership in our people.
Direct economic contributionSmiths direct economic contribution to communities around the world through taxes paid, employee costs and supplier costs was £2.8 billion in FY2020 (FY2019: £2.6 billion).
£2.8bnE M P L O Y E E C O S T S
£1,112mS U P P L I E R C O S T S
£1,544mT A X P A I D
£186mGetting involved in our communitiesCommunity engagement is managed locally, with each division focusing on markets and communities that are important to them. We celebrate the best of these initiatives through the Smiths Excellence Awards and communicate inspiring ideas and stories in the Smiths Signal e-newsletter and on our Smiths Now colleague smartphone app.
Recognising the efforts of colleagues and sharing new ideas is an important part of being a member of the Smiths family.
During the COVID-19 pandemic many of our efforts have been directed towards supporting local communities through the disease, including contributing aid and equipment to local services. The pandemic led to the postponement of the planned adoption of the Beyond Boundaries globally aligned community outreach programme across Smiths, which we now hope to run next year.
Promoting engineering as a careerSmiths is committed to encouraging the engineers of tomorrow and to promoting engineering as an exciting and fulfilling career that is open to all. We have a number of specialist programmes, including our graduate engineering programme, to attract young people and women to the sector and position Smiths as an employer of choice. We support members of our team that wish to engage with external programmes and organisations with similar aims. We also highlight and contribute to events such as International Women in Engineering Day.

4 9S M I T H S G R O U P P L C A N N U A L R E P O R T F Y 2 0 2 0
2
To mark this year’s International Women in Engineering Day and celebrate the achievements of leading women in the field, we asked our four female Non-executive Directors to share their views on what it means to be a woman in engineering.
Board members Karin Hoeing, Tanya Fratto, Pam Cheng and Dame Ann Dowling recorded a video message, which was shared with colleagues worldwide, and externally, in which they reflected on their own careers and the reasons why more women should pursue engineering.
Engineering is at the very core of what we do at Smiths and we hope videos like this will help inspire the next generation of women engineers who can help #ShapeTheWorld.
SMITHS BOARD MEMBERS SUPPORT INTERNATIONAL WOMEN IN ENGINEERING DAY
+ Dr Selina Kolokytha, Physicist Engineer, Smiths Detection – winner of our International Women in Engineering Day #ShapeTheWorld competition
I’M VERY PROUD TO BE MAKING A DIFFERENCE IN AN INDUSTRY THAT SAVES LIVES AND IMPROVES HUMAN HEALTH WHILE BEING ABLE TO RAISE A FAMILY. MY MESSAGE TO ALL YOUNG GIRLS AND TEENAGERS OUT THERE – YOU’VE GOT THIS, YOU CAN DO IT, SO PLEASE GO FOR IT!
Pam Cheng,Smiths Non-executive Director.
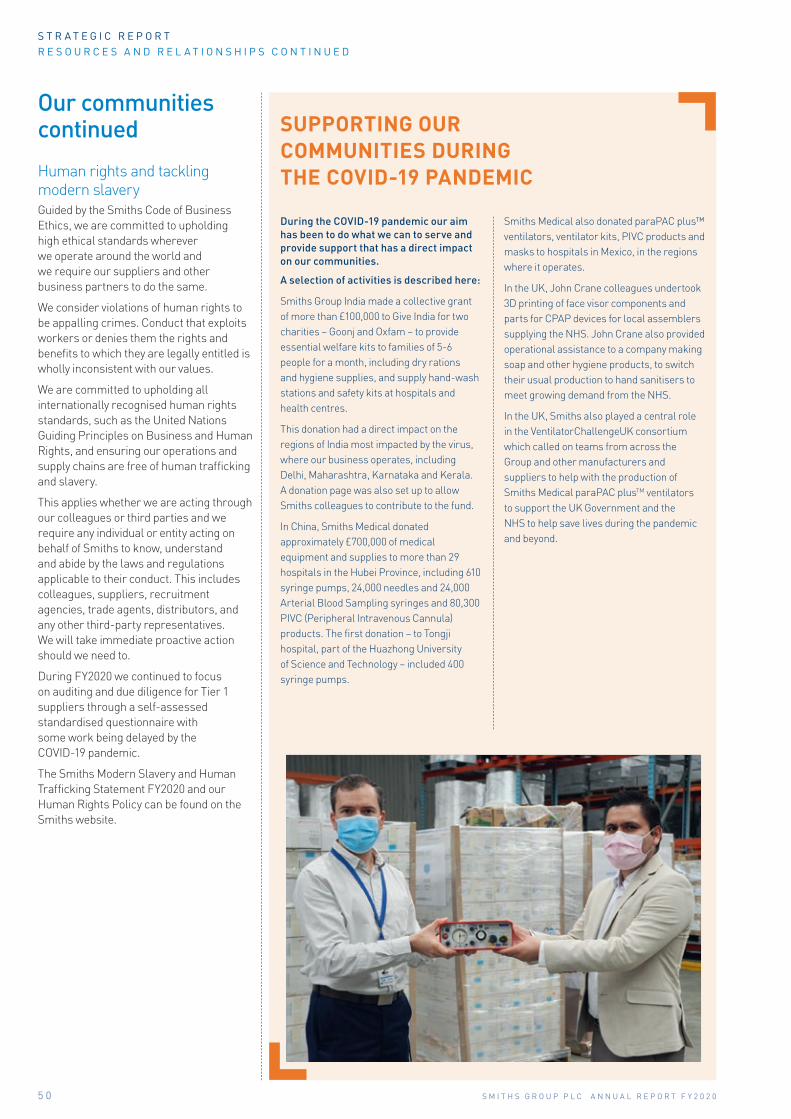
5 0 S M I T H S G R O U P P L C A N N U A L R E P O R T F Y 2 0 2 0
S T R A T E G I C R E P O R TR E S O U R C E S A N D R E L A T I O N S H I P S C O N T I N U E D
Human rights and tackling modern slaveryGuided by the Smiths Code of Business Ethics, we are committed to upholding high ethical standards wherever we operate around the world and we require our suppliers and other business partners to do the same.
We consider violations of human rights to be appalling crimes. Conduct that exploits workers or denies them the rights and benefits to which they are legally entitled is wholly inconsistent with our values.
We are committed to upholding all internationally recognised human rights standards, such as the United Nations Guiding Principles on Business and Human Rights, and ensuring our operations and supply chains are free of human trafficking and slavery.
This applies whether we are acting through our colleagues or third parties and we require any individual or entity acting on behalf of Smiths to know, understand and abide by the laws and regulations applicable to their conduct. This includes colleagues, suppliers, recruitment agencies, trade agents, distributors, and any other third-party representatives. We will take immediate proactive action should we need to.
During FY2020 we continued to focus on auditing and due diligence for Tier 1 suppliers through a self-assessed standardised questionnaire with some work being delayed by the COVID-19 pandemic.
The Smiths Modern Slavery and Human Trafficking Statement FY2020 and our Human Rights Policy can be found on the Smiths website.
Our communities continued SUPPORTING OUR
COMMUNITIES DURING THE COVID-19 PANDEMIC
During the COVID-19 pandemic our aim has been to do what we can to serve and provide support that has a direct impact on our communities.
A selection of activities is described here:
Smiths Group India made a collective grant of more than £100,000 to Give India for two charities – Goonj and Oxfam – to provide essential welfare kits to families of 5-6 people for a month, including dry rations and hygiene supplies, and supply hand-wash stations and safety kits at hospitals and health centres.
This donation had a direct impact on the regions of India most impacted by the virus, where our business operates, including Delhi, Maharashtra, Karnataka and Kerala. A donation page was also set up to allow Smiths colleagues to contribute to the fund.
In China, Smiths Medical donated approximately £700,000 of medical equipment and supplies to more than 29 hospitals in the Hubei Province, including 610 syringe pumps, 24,000 needles and 24,000 Arterial Blood Sampling syringes and 80,300 PIVC (Peripheral Intravenous Cannula) products. The first donation – to Tongji hospital, part of the Huazhong University of Science and Technology – included 400 syringe pumps.
Smiths Medical also donated paraPAC plus™ ventilators, ventilator kits, PIVC products and masks to hospitals in Mexico, in the regions where it operates.
In the UK, John Crane colleagues undertook 3D printing of face visor components and parts for CPAP devices for local assemblers supplying the NHS. John Crane also provided operational assistance to a company making soap and other hygiene products, to switch their usual production to hand sanitisers to meet growing demand from the NHS.
In the UK, Smiths also played a central role in the VentilatorChallengeUK consortium which called on teams from across the Group and other manufacturers and suppliers to help with the production of Smiths Medical paraPAC plusTM ventilators to support the UK Government and the NHS to help save lives during the pandemic and beyond.

5 1S M I T H S G R O U P P L C A N N U A L R E P O R T F Y 2 0 2 0
2
Product certification and ongoing regulatory complianceMany of our products require certification/ approval prior to launch and ongoing monitoring to ensure continued compliance with regulations. Certifications are handled by our divisional teams who have direct relationships with the relevant regulatory bodies and, with our legal teams, track new legislation and standards to ensure that we comply.
Trade complianceWe operate a global trade compliance policy that covers export controls, import law, financial and trade sanctions, and anti-boycott law compliance. The policy sets out a specific prior-review process for authorised transactions that involve certain sanctioned countries, which provides corporate oversight of such transactions.
We have a network of trade compliance officers (TCOs) across Smiths who are responsible for overseeing and ensuring the compliance of Smiths activities with applicable trade regulations, laws, and Smiths policy. The TCOs also monitor upcoming changes in regulation.
We provide in-person and online training to our TCOs and other relevant colleagues, and our TCOs meet or otherwise communicate regularly with each other to share best practices and discuss emerging issues. We also regularly assess trade activities at site level to identify risks and review controls.
Anti-bribery and anti-corruptionBribery and corruption matters are covered by our Code of Business Ethics and we also have specific policies/procedures relating to a number of activities that create bribery and corruption risks. These are included in a new umbrella anti-bribery and corruption policy that has recently been implemented to provide a single view of our approach to bribery and corruption. These policies cover, among many other things, the giving and receiving of gifts, meals and hospitality, invitations to government officials, our approach to facilitation payments, and matters in relation to the appointment of distributors and agents. We have a gift register to monitor compliance. During FY2020 our teams in China developed a country specific anti-bribery and anti-corruption policy to align with local cultural expectations, particularly around gifts.
Anti-trustWe are committed to competing fairly in the markets we operate and have an Anti-trust Policy and training modules for colleagues whose roles may expose them to competition law risk. Our divisions also use a Trade and Industry Event Register to ensure that colleagues attending events with competitors are made fully aware of what they may and may not discuss. During FY2020 we worked with our external advisers to develop bespoke anti-trust training which will be rolled out during FY2021.
GDPR and privacyOur approach to complying with GDPR and privacy regulations has been to establish a common set of principles, policies and processes to ensure that our teams are aware of their responsibilities relating to them. This will continue as new regulations emerge. We have a network of Data Privacy Champions whose role is to cascade into their respective division any new process requirements. Training around GDPR and privacy is provided through our online training platform as well as face to face (for specific functions).
Building relationshipsOur Group Corporate Affairs team leads our outreach and relationship programme with the aim of promoting a deeper understanding of the Smiths business and culture; our capabilities and critical products; and developing long-term relationships with decision-making groups to support our business objectives and facilitate specific opportunities.
The team comprises corporate affairs specialists based in the UK, US, Europe and Asia who guide and support our relationships with key regulators, local policymakers, budget holders and industry groups. As a FTSE 100 Company we have a strong relationship with the UK Government’s Department for International Trade which promotes the interests of UK businesses around the world.
These relationships and the profile of the Group have played an important role in supporting the business during the COVID-19 pandemic, for example by helping our sites to gain essential status and stay open. They also helped Smiths Medical to secure its biggest ever order for needles and syringes to aid vaccination plans in the US.
We have in place expert teams to manage these matters and we operate robust due diligence and compliance processes to reduce the likelihood of an ethical, legal or regulatory breach impacting our business. In the normal course of business, we build relationships with governments, policymakers and regulators across the world. We do this at both Group and at divisional level so that we are able to operate effectively, our interests and those of the industries in which we operate are represented in decision making, and in order to contribute our expertise when appropriate. In some cases, governments are our customer and we engage with them as we would any other customer.+ Read more our Code of Business Ethics on page 26
Regulators and governments
We operate in highly regulated markets and sectors requiring strict adherence to local and international laws and regulations, and strong ethical practices.

5 2 S M I T H S G R O U P P L C A N N U A L R E P O R T F Y 2 0 2 0
S T R A T E G I C R E P O R TD I V I S I O N A L R E V I E W
John Crane
Mission-critical solutions for global energy and process industries
John Crane is a global leader in rotating equipment solutions, supplying engineered technologies and services to process industries including oil & gas, pharmaceutical, chemical, petrochemical, power generation, mining, water treatment, pulp & paper, and turbomachinery. John Crane designs and manufactures a variety of products including mechanical seals and systems, couplings, filtration systems and predictive digital monitoring technologies. John Crane sales and service is accessed through a global network of more than 200 sales and service facilities in over 50 countries.
Divisional strategy Our strategy is to reinforce our global leadership in technologies and services for rotating equipment, with a competitively differentiated offering that will deliver above-market, long-term growth in the most attractive process industries.
We will maintain differentiation by investing in product development, continuing to diversify into industrial segments and higher-growth regions, furthering deployment of digital solutions, and broadening our aftermarket value proposition. We will also evaluate strategic bolt-on acquisitions to accelerate growth.
We will further drive competitiveness through operational improvements based on safety, quality and improved lead times.
Link to Group strategy1 Outperform our chosen markets – Industrial market penetration such as chemical, mining, pulp & paper, etc.
– Product development to support end-market diversification, digitisation and environmental considerations
– Continued focus on higher-growth regions with contract wins in Asia Pacific and the Middle East
– Strong new product pipeline and constant portfolio review
2 Deliver world-class competitiveness – Continue to implement the SES framework to drive performance improvements across the whole business
– Focus on business process standardisation using automated systems
– Continue to optimise and position our manufacturing and service footprint close to our customers and to continually improve service levels
Competitive strengths – A global leader in mission-critical technology for rotating equipment
– Strong proprietary technology and expertise in applied engineering
– Broad installed base in energy and industrials
– Strong aftermarket service offering with more than 200 sales and service centres
– Long-term customer relationships
Growth drivers – Long-term underlying energy demand, especially in emerging markets
– Pent-up demand for maintenance and upgrades, including environmental safeguarding, in oil & gas and petrochemical
– Expansion in higher-growth markets – Need for operational improvements in industrial process industries
– Disruptive innovations, including materials science advancements and digital transformation
– Unique footprint which allows John Crane to support and service customers as well as meet local content requirements and align with customer strategies
Competitors Competitors range from large multinationals to small, more focused companies across the product portfolio. Examples include Flowserve, EagleBurgmann, AES, Danaher, Hydac, Rexnord.
* Underlying modifies headline performance to: adjust prior year to reflect an equivalent period of ownership for divested businesses; exclude the effects of foreign exchange, acquisitions, restructuring costs and write-downs; and add back depreciation and amortisation of discontinued operations for comparability purposes
F Y 2 0 2 0 P E R F O R M A N C E
R E V E N U E+2%*
£955m
R E V E N U E B Y S E C T O R R E V E N U E M I X
O R I G I N A L E Q U I P M E N T
33%
E N E R G Y
63%
A F T E R M A R K E T
67%I N D U S T R I A L S
37%H E A D L I N E O P E R A T I N G P R O F I T(6)%*
£187mH E A D L I N E O P E R A T I N G M A R G I N *(180)bps
21.5%
1
3
2

5 3S M I T H S G R O U P P L C A N N U A L R E P O R T F Y 2 0 2 0
2
COVID-19 Demand shock and prolonged oil price declines have caused many of our customers to delay new projects. However, we expect our aftermarket business to remain strong.
From the onset of the COVID-19 pandemic, John Crane has executed a comprehensive response plan that maximises the safety of our people and minimises disruption of our supply chain to maintain business continuity and serve our customers.
Products Our comprehensive product portfolio includes mechanical seals, seal support systems, power transmission couplings, specialised filtration systems and digital monitoring. These engineered solutions drive improvements in reliability and reduced environmental impact in our customers’ operations.
Our large installed base – built over the last century across a number of vertical markets – drives significant aftermarket demand. We have one of the largest networks of global sales and service centres, ensuring proximity and rapid service to customers. These centres provide a range of services, including repair and refurbishment, upgrades and retrofits, root cause analysis of incidents, and alignment and condition monitoring to improve equipment performance and reduce operational downtime.
Markets where we operateEnergy: Following the oil price decline and the COVID-19 crisis, we expect the energy market to enter a period of downturn. Typically, given the critical nature of our products and services, aftermarket is more resilient than original equipment (OE) which tends to have a lagged impact given the large downstream nature of our portfolio. Increased focus on environmental considerations, efficiency, and the need to address energy needs for a growing population will drive the demand in the medium to long term.
Industrials: We also have a significant presence in other process industries, including pharmaceutical, chemical, power generation, mining, water treatment, and pulp & paper. We expect these verticals will continue to grow in the medium term, helped by increasing demand in higher-growth regions.
Original equipment (OE) is cyclical and is linked to new capacity coming onstream, as well as improved efficiency in existing locations where higher-performance seals are installed.
Aftermarket: We continue to expand our footprint through new service centres in selected higher-growth markets, as well as best-in-class field service teams. We continue to support and partner with our customers, delivering long-term solutions and reliability contracts, focusing on operational efficiencies and environmental stewardship.
Trends shaping innovation Our Group purpose guides our approach to innovation, and we believe that megatrends, such as the global demand for energy and efficiencies and increased digitalisation and connectivity, will continue to generate demand for our products over the longer term.
Megatrend Innovation in FY2020
Energy demand and efficiencies
Environmental Sustainability: Our partnership with Kairos Aerospace, Inc. further adds to our portfolio of solutions to monitor and mitigate greenhouse gases
Increased digitisation and connectivity
Continued development of John Crane’s Sense™ predictive diagnostics systems
INNOVATING TO SPEED THE SEAL TEST PROCESSJohn Crane’s spin test rig in Slough, UK utilises gas flows to spin seal components up to high speeds to validate that they can cope with the significant forces they are likely to experience during service.
To complete a comprehensive test, certain seal components are required to be spun at higher speeds, and these could not be achieved with the existing rig capability. This resulted in components having to be shipped to external sub-contractors for spin testing, adding cost and increasing product lead times.
To enable spin testing to move in-house, the John Crane team designed and manufactured a new 3D-printed casing
which improves the air flow around the impeller driving the spinning process, enabling higher speeds to be achieved on the rig. Two design iterations were created, manufactured and tested over just a one-week period.
The internal shape and flow distribution are difficult and expensive to achieve with conventional machining and the single 3D-printed piece replaces an assembly of 22 components and is cheaper to manufacture.
The upgraded rig can now be used for testing all seal components, reducing test costs and lead time for customers compared to contractor spin testing.

5 4 S M I T H S G R O U P P L C A N N U A L R E P O R T F Y 2 0 2 0
S T R A T E G I C R E P O R TD I V I S I O N A L R E V I E W C O N T I N U E D
FY2020 Financial performanceFY2020
£mFY2019
£mReported
growth
H1 underlying
growth
H2 underlying
growth
FY underlying
growth
Revenue 955 945 1% +6% (2)% +2%Original Equipment 314 313 +8% (6)% –Aftermarket 641 632 +5% – +2%
Headline operating profit 187 220 (15)% +4% (15)% (6)%Statutory operating profit 154 191 (19)%Return on capital employed 19.0% 23.4% (440)bpsR&D cash costs % sales 1.9% 1.7% +20bps
Revenue(£m)
FY2019 reported
Foreign exchange
Acquisitions &disposals Underlying
FY2020 reported
Revenue 945 (6) – 16 955
John Crane’s market-leading positions and the strength of its global service network supported its robust performance, despite the challenges in the energy market and COVID-19 disruptions. Revenue was up +2% on an underlying basis. Reported revenue was up +1% as foreign exchange had a £(6)m adverse impact.
Underlying revenue from John Crane’s Energy segment was up c.4%. After a strong first half with growth of c.11%, underlying revenue from Energy declined c.(2)% in the second half, impacted by the downturn in the energy sector and COVID-19 disruptions. Underlying revenue from Industrial activities was down c.(2)%, throughout the year due to strong comparators and COVID-19 disruptions.
Headline operating profit of £187m decreased by (6)% on an underlying basis, with higher volumes being more than offset by the increased costs associated with COVID-19 disruptions. Reported headline operating profit declined (15)% due to £(14)m of restructuring costs and £(4)m of receivables write-downs. The restructuring actions in John Crane are focused on enhancing its flexibility to withstand the cyclicality of its end markets and improve its efficiency.
Underlying revenue from Original Equipment (‘OE’) was flat year-on-year as the very strong start to the year (+8%) reversed in the second half ((6)%). Despite a slower rate of tenders, John Crane secured multiple new contracts, many of which were in the higher-growth regions of Asia-Pacific and the Middle East. These contract wins reflect John Crane’s exemplary customer service and focus on business continuity despite the difficult operating conditions. John Crane’s large installed base and leading service offering position it well to support the demand for aftermarket repairs, maintenance and upgrades. Underlying aftermarket revenue was resilient and grew +2% during the year, representing 67% of John Crane’s revenue (FY2019: 66%).
Reported headline operating margin was 19.6%, down (370)bps on a reported basis but down only (180)bps to 21.5% on an underlying basis, excluding the impact of the restructuring costs and write-downs. The difference between statutory and headline operating profit includes the net cost in relation to the provision for John Crane, Inc. asbestos litigation.
ROCEROCE was down (440)bps at 19.0%, due to the lower profitability and the adverse impact of IFRS 16 adoption.
R&DCash R&D expenditure during the year represented 1.9% of sales, +20bps higher than last year. John Crane’s innovation is primarily focused on enhancing efficiency, performance and sustainability by using materials science advancements, coatings and additive manufacturing. John Crane is also leveraging the Group’s digital expertise to support the development of predictive diagnostic platforms and other innovative digital technologies.
During the year, John Crane introduced several new technologies, including a booster and filter to support dry gas seals on turbo compressors and further product developments to reduce the effects of friction and extreme pressure on pipeline applications.
Operating profit
(£m)FY2019
reportedForeign
exchangeAcquisitions &
disposalsRestructuring
costs UnderlyingFY2020
reported
Headline operating profit 220 (1) – (18) (14) 187Headline operating margin 23.3% 21.5% 19.6%

5 5S M I T H S G R O U P P L C A N N U A L R E P O R T F Y 2 0 2 0
2
Smiths Detection
Detection and screening technologies for the identification of safety and security threats
Smiths Detection is a global leader in detection and screening technologies that protect people and assets, thereby supporting safety, security and freedom of movement in today’s world. We work with customers in a broad range of markets including aviation, ports & borders, defence and urban security, providing solutions that address existing and emerging threats. Smiths Detection’s reputation is underpinned by extensive experience, differentiated technology, and a strong track record of success.
Divisional strategy Our strategy is to maintain our position as a leading technology provider by building high-integrity detection solutions that outperform our chosen markets, that are technologically advanced and – most importantly – that deliver customer intimacy.
We will accelerate growth by working closely with our partners, suppliers and regulatory bodies to deliver a highly agile approach to constantly changing safety and security threats. To achieve this, we will invest selectively in adjacent markets, develop cost-effective solutions and services that will be built on systems and processes that will make it easier for customers to do business with us.
Link to Group strategy1 Outperform our chosen markets – At least maintaining our share of the installed base during recapitalisation periods
– Continued product development and certifications to support growth, including innovations to address specific customer needs in response to COVID-19
– Continued focus on higher-growth regions supported by contract wins
– Invest selectively in technology and innovation to expand portfolio in attractive markets close to the core
2 Deliver world-class competitiveness – Globalise, standardise and streamline our internal processes, utilising continuous improvement initiatives and leveraging global best practices using the Smiths Excellence System (SES)
– Focus on supplier development and the reduction of costs through improvements to systems, processes and products
Competitive strengths – A global market leader with differentiated technologies leveraged across a broad range of markets
– Significant R&D capability
– Operating in regulated markets that require product certification
– Increasing aftermarket services
– Enhanced digital capabilities
– Long-term customer relationships
Growth drivers – Persistent and evolving terror threats
– Changing security regulations in the aviation market
– Evolving threats to public safety and critical infrastructure
– Global growth in e-commerce
– Equipment replacement cycle, typically 8–10 years
– Growth of transportation infrastructure in Asia, Latin America and Africa
Competitors Across the product portfolio, our competitors range from large multinationals to smaller, single-product companies. Examples include: Rapiscan, Leidos, Nuctech.
* Underlying modifies headline performance to: adjust prior year to reflect an equivalent period of ownership for divested businesses; exclude the effects of foreign exchange, acquisitions, restructuring costs and write-downs; and add back depreciation and amortisation of discontinued operations for comparability purposes
F Y 2 0 2 0 P E R F O R M A N C E
R E V E N U E0%*
£806m
R E V E N U E B Y S E C T O R R E V E N U E M I X
O R I G I N A L E Q U I P M E N T
55%
A V I A T I O N
72%
A F T E R M A R K E T
45%
O T H E R S E C U R I T Y S Y S T E M S
28%H E A D L I N E O P E R A T I N G P R O F I T(12)%*
£82mH E A D L I N E O P E R A T I N G M A R G I N *(210)bps
13.9%
1
3
2

5 6 S M I T H S G R O U P P L C A N N U A L R E P O R T F Y 2 0 2 0
S T R A T E G I C R E P O R TD I V I S I O N A L R E V I E W C O N T I N U E D
COVID-19 Smiths Detection continues to shape its response to the pandemic, ensuring that the company reacts quickly to the evolving situation, prioritising the safety and wellbeing of our colleagues, customers and suppliers while managing demand. The pace and shape of recovery is likely to be gradual because of the impact that COVID-19 has had on our key markets, notably aviation. We respond to the pandemic by driving digital products and by investing selectively in chemical and biological detection technologies to support our customers with their changing requirements and operational priorities. To illustrate, we are already supporting our aviation customers to build resilience in their checkpoints by utilising Smiths Detection technologies to improve efficiencies, enable social distancing and reduce contact between passengers and between passengers and staff. We also rapidly introduced a UV-C solution for passenger checkpoints, which uses ultraviolet-C light to disinfect trays in tray-handling systems (see below).
Products Our comprehensive product portfolio comprises x-ray and computed tomography (CT) scanners for hold baggage and checkpoint, people-screening scanners, tray-handling solutions and trace-detection devices for secondary screening at checkpoints. We produce portable devices for chemical, explosive and narcotic detection and identification. Our product portfolio also includes stationary and mobile inspection systems for heavy-cargo vehicles. Our growing range of digital solutions includes an integration and analytics platform that hosts a range of purpose-built digital applications to connect assets, analyse systems, detect threats and manage incidents through to resolution.
Markets where we operateDemand for trace and detection equipment and service is forecast to continue to grow over the long term. In the context of continuing geopolitical unrest and evolving terrorist and criminal threats – and with the growing advancement of biological, chemical and cyber threats – our security measures continue to evolve to keep ahead of these threats. But there is a geographical variation within our markets.
Aviation, our largest market, has been heavily impacted by the COVID-19 pandemic and seen an almost complete halt in passenger travel so far in 2020. As airports and the aviation industry seek to restore passenger confidence, they will be driven to improve hygiene standards and create a contactless passenger experience at checkpoints and to adopt technologies that help to create operational efficiencies and reduce operational costs without compromising security.
In Other Security Systems we have three sub-segments:
In ports & borders, the growth of worldwide trade volumes is expected to increase demand for security screening equipment and digital solutions that drive inspection processing speeds. Powerful digital technologies and next generation connected hardware are needed to enhance inspection effectiveness and detect more in less time in order to minimise threats, without affecting global trade.
In defence, emerging threats are generating global demand for mobile and adaptable detection equipment for chemical warfare agents and other threat specific sensors in key NATO-orientated markets. This market is affected by the nature of its associated procurement cycles.
Urban security is a large but fragmented and mainly unregulated sector. Critical infrastructure, mass transit and crowded spaces have specific customer needs and challenges. Demand is growing – driven by an increase in criminal activity towards traditionally more vulnerable targets and by the response of both the public and the private sectors to an ever-growing range of threats – for solutions that allow the public to go about their lives as normal, with the peace of mind that their security and welfare are being protected.
Almost half of our customers are government-funded and, consequently, budget constraints affect revenues. Original equipment (OE) drives the programmatic nature of our business. The lifecycle of OE is typically 8 to 10 years. Aftermarket as a percentage of revenue is increasingly driven by our growing installed base, advances in our digital capability, and our focus on providing a complete solution to our customers.
Trends shaping innovation Our Group purpose drives our approach to innovation, and we believe that megatrends – such as increasing digitisation and connectivity, artificial intelligence, cyber security and mobility and globalisation – are likely to continue to generate demand for our products over the longer term.
Megatrend Innovation in FY2020
Increasing digitisation and connectivity
Data-integration and cognitive-analytics platform, delivering shared threat and anomaly detection capabilities.
Artificial intelligence iCMORE portfolio, delivering automatic detection of an ever-expanding list of dangerous, prohibited and contraband goods.
Mobility and globalisation Advances in threat-detection capability with expansion into chemical, biological, radiological and nuclear (‘CBRNE’) and adjacent markets.
IMPROVING SAFETY AT AVIATION SECURITY WITH ULTRAVIOLET LIGHTA study showed that baggage trays at security checkpoints have the highest levels of pathogens of any other surface in an airport.
In response to the COVID-19 pandemic and to support hygiene improvements at airport security screening, Smiths Detection developed a proprietary ultraviolet (UV-C) light tray disinfection kit capable of killing up to 99.9% of bacteria and virus-carrying micro-organisms, including coronavirus. The kits can be installed into any tray return system, regardless of vendor.
Trials are underway in Asia Pacific and Europe and results have proven the solution’s ability to destroy micro-organisms. A specially designed casing and other safety measures mean the UV-C lights pose no exposure risk to staff or passengers and can be installed quickly and easily into existing systems. Demonstrating greater hygiene standards will be important as airports seek to restore the confidence of travellers and staff during and in the aftermath of the COVID-19 pandemic.

5 7S M I T H S G R O U P P L C A N N U A L R E P O R T F Y 2 0 2 0
2
FY2020 Financial performanceFY2020
£mFY2019
£mReported
growth
H1 underlying
growth
H2 underlying
growth
FY underlying
growth
Revenue 806 798 +1% +4% (3)% –Aviation 577 522 +5% +8% +6%Other Security Systems 229 276 +3% (26)% (13)%
Headline operating profit 82 127 (36)% +4% (24)% (12)%Statutory operating profit 57 91 (37)%Return on capital employed 7.2% 11.5% (430)bpsR&D cash costs % sales 9.2% 8.4% +80bps
Revenue(£m)
FY2019 reported
Foreign exchange
Acquisitions & disposals Underlying
FY2020 reported
Revenue 798 8 – – 806
The strength of Smiths Detection’s market position and its leading technology supported its resilient performance with underlying revenue flat year-on-year.
The delivery of previously announced contract wins drove Original Equipment (‘OE’) up +2% on an underlying basis, with strong first half growth of +8% moderating to (2)% in the second half. Aftermarket revenue declined (2)% on an underlying basis, with first half growth of +1% being offset by (5)% in the second half as service and maintenance levels reduced during the COVID-19 pandemic. Reported revenue was up +1%, including +£8m of favourable foreign exchange translation.
Revenue from Aviation activities increased +6% on an underlying basis. Aviation is Smiths Detection’s largest segment, representing 72% of total revenue. We continued to see demand for hold baggage systems (‘HBS’) across Europe, as a result of the ECAC standard-3 regulation, and globally, as airports upgrade their fleets. Demand is also driven by Computed Tomography (‘CT’) based screening systems for cabin baggage, which allow laptops and liquids to remain
in bags. Deliveries included part of the previously announced contracts with Aena in Spain, Airports Authority India (AAI) and with the TSA in the US. Despite a slower rate of new tenders, Smiths Detection continues to secure contract wins, including for Kuwait International Airport and Singapore Changi Airport.
Underlying revenue from Other Security Systems declined by (13)%. This performance reflects both the strong comparator and the impact of COVID-19. Smiths Detection continues to respond to the pandemic by driving its digital portfolio and investing selectively in chemical and biological detection capabilities that will support a safer post COVID-19 world. New contract wins include an order from U.S Customs and Border Protection for high-energy X-ray inspection scanners used to screen moving rail carriages for dangerous or illegal cargo, and with the US Department of Defence (US DoD) for Solid Liquid Adaptors which add new capabilities to Joint Chemical Agent Detectors (JCADs), securing Smiths Detection as a global supplier of JCADs to the US DoD for several more years to come.
Operating profit(£m)
FY2019 reported
Foreign exchange
Acquisitions & disposals
Restructuring costs Underlying
FY2020 reported
Headline operating profit 127 1 – (30) (15) 82Headline operating margin 16.0% 13.9% 10.2%
Headline operating profit decreased (12)% on an underlying basis, reflecting a higher proportion of OE - at competitive pricing and COVID-19 related costs including reduced aftermarket services. Reported headline operating profit of £82m was down (36)% year-on-year, including £(14)m of restructuring and £(17)m of R&D and receivables write-down costs. Restructuring costs consist of headcount
reduction combined with footprint optimisation. Reported headline operating margin was 10.2%, down (580)bps on a reported basis but only down (210)bps to 13.9% on an underlying basis, excluding the impact of the restructuring costs and write-downs. The difference between statutory and headline operating profit primarily reflects amortisation of acquired intangibles.
Portfolio In August 2020, Smiths Detection completed the bolt-on acquisition of PathSensors Inc, which enhances its biological capability to detect pathogens for broad end market applications.
ROCEROCE decreased by (430)bps to 7.2%, impacted by reduced profitability.
R&DCash R&D expenditure during the year was 9.2% of sales, +80bps higher than last year. R&D excluding customer funding was 6.9% for FY2020 (FY2019: 6.6%). Our new checkpoint scanner (CTiX) contributed positively to the Group’s Vitality Index.
We continue to invest in the development of the next generation of detection devices for the defence market, new algorithms to improve the detection of dangerous goods for cargo applications and operational efficiency, and digital solutions to strengthen our aftermarket proposition to make people and infrastructure safer.
Certain programmes are co-funded by strategic customers seeking next-generation solutions to security challenges. In the year, Smiths Detection launched its new ultraviolet (UV-C) light kits, capable of destroying up to 99.9% of microorganisms present on baggage trays at the security checkpoint. Demonstrating heightened hygiene standards will be important, as airports seek to restore the confidence of travellers and staff during and after the COVID-19 pandemic.

5 8 S M I T H S G R O U P P L C A N N U A L R E P O R T F Y 2 0 2 0
S T R A T E G I C R E P O R TD I V I S I O N A L R E V I E W C O N T I N U E D
Flex-Tek
Innovative components to heat and move fluids and gases
Flex-Tek is a global provider of engineered components that heat and move fluids and gases for the aerospace, medical, industrial, construction and domestic appliance markets. Our flexible hosing and rigid tubing provide safe fluid management for fuel and hydraulic applications on commercial and military aircraft, deliver gas and conditioned air in residential and commercial buildings, and enable respiratory care in medical applications. Flex-Tek heating elements and thermal systems improve the performance and efficiency of medical and diagnostic equipment as well as that of domestic appliances such as clothing tumble dryers and HVAC equipment.
Divisional strategy Our strategy is to outperform our chosen markets through technological differentiation, with the need for safer, more energy-efficient and smart/digital solutions providing opportunities for us to establish leadership positions across our segments.
We aim to do this by developing our product portfolio through strong customer intimacy, expanding in our target regions, growing existing market share and driving operational excellence to increase competitiveness. We also consider aligned strategic bolt-on acquisitions to support growth.
Specific focus areas include growing our share in the US housing market segment, expanding our international markets for gas tubing and securing positions on next generation aircraft.
We drive competitiveness through operational improvements.
Link to Group strategy1 Outperform our chosen markets – Continue to launch new innovative products
– Progress in international expansion
2 Deliver world-class competitiveness – Continue the lean transformation of all sites, including the newly acquired United Flexible sites using the Smiths Excellence System site development guide
– Focus on quality by adopting a formal supplier quality methodology and optimise supply base
Competitive strengths – High performance products
– Leading capability in design and manufacture
– A leader in residential gas tubing products
– High performance flexible tubing for aerospace
– Strong customer relationships
Growth drivers – Through-cycle growth of the US housing construction market segment
– Expanding international market for corrugated stainless steel tubing for housing
– Long-term increase in commercial and defence aircraft production
– Growth of medical devices, especially for the treatment of sleep apnoea and respiratory conditions
– Expansion in higher-growth markets
– Expanding innovation in heat industrial solutions
Competitors Competitors range from large multinationals through to small, more focused companies across the product portfolio. Examples include: Parker-Hannifin, Eaton, Omega Flex, Nibe.
* Underlying modifies headline performance to: adjust prior year to reflect an equivalent period of ownership for divested businesses; exclude the effects of foreign exchange, acquisitions, restructuring costs and write-downs; and add back depreciation and amortisation of discontinued operations for comparability purposes
F Y 2 0 2 0 P E R F O R M A N C E
R E V E N U E(6)%*
£478m
R E V E N U E B Y S E C T O R R E V E N U E M I X
O R I G I N A L E Q U I P M E N T
49%
A E R O S P A C E
28%
A F T E R M A R K E T
51%I N D U S T R I A L S
72%H E A D L I N E O P E R A T I N G P R O F I T(14)%*
£83mH E A D L I N E O P E R A T I N G M A R G I N *(160)bps
17.6%
1
3
2

5 9S M I T H S G R O U P P L C A N N U A L R E P O R T F Y 2 0 2 0
2
COVID-19 Our utmost priority has been to keep our employees safe whilst maximising business continuity with our suppliers and servicing our customers. The pandemic has slowed most of our end markets, with the exception of medical where we supply hoses for ventilators. In order to respond to the high demand, we have converted lines. Whilst most of our end markets are expected to recover relatively swiftly, commercial aerospace is expected to take two to three years to return to pre-COVID-19 level.
Products In Aerospace, we are a leading provider of specialty tubing assemblies that provide reliable, efficient delivery of hydraulic fluids and jet fuel for commercial and military aircraft globally.
In Industrials, we are one of the world’s largest manufacturers of open coil heating elements, supplying electric resistance heating and controls for a broad range of applications, including compressors, clothes dryers, duct heaters, heat pumps, window air conditioners, and vending machines. We also provide flexible ducting for commercial and residential HVAC applications, hoses for medical applications including ventilators, hoses for the automotive market to deliver fuel and brake fluid, as well as corrugated stainless steel tubing that supplies natural gas or low-pressure gas to appliances.
Markets where we operateKey market segments include US residential and commercial construction, global aerospace tubing and hoses, and electrical heating elements.
Our business performance generally follows macroeconomic indicators such as US GDP, US housing growth, healthcare spending and capital goods expenditure. Population growth drives residential construction and domestic appliance demand in the US. In the long term, increasing air passenger and freight volumes and investment in next-generation aircraft are expected to drive the growth in commercial aerospace. The diverse nature of our markets reduces our reliance on any specific technology, although we are primarily exposed to the US economy.
In Aerospace, the market for commercial aircraft following the COVID-19 pandemic is expected to be challenging for the next two to three years.
In Industrials, growth is driven by the US housing market segment, along with an increasing number of specialty heating applications and flexible gas piping and HVAC ducting in North America and Asia. Our products are also used in the manufacture of medical devices such as sleep apnoea devices and devices for respiratory conditions (including ventilators), where increasing global healthcare spend is driving growth.
Trends shaping innovation Our Group purpose guides our approach to innovation and we believe that megatrends, such as energy demand and efficiencies, and mobility and globalisation, will continue to generate demand for our products over the longer term.
Megatrend Innovation in FY2020
Energy demand and efficiencies
Energy efficient heating, lower weight aerospace products and more sustainable building practices
Mobility and globalisation Expanding in Europe with Gastite and leveraging the United Flexible European footprint Expanding product breadth in China to support industrial applications
BUILDING THE MARKET FOR SAFER GAS TUBINGThe further development of Flashshield+, including investments in new machinery and technology, and a full range of sizes, has led to successful contracts with new distributors, contractors and large-scale construction projects. Transition to Flashshield+ has been high due to the range of features incorporated into the product.
The FlashShield+ system for supplying natural gas and propane in residential and commercial structures was designed after extensive voice of customer and engineering research, utilising innovation from the food industry.
The corrugated stainless steel tubing (CSST) has four layers of protection that are bonded together using specially engineered adhesives. Each layer has a specific function to address multiple safety points and protect the CSST. The product has a simplified installation process through further innovation around earthing connections, a key output from the voice of customer research, as well as being better performing.
FlashShield+ is also the only product of its kind to have industry-leading lightning protection as well as household fault current protection.

6 0 S M I T H S G R O U P P L C A N N U A L R E P O R T F Y 2 0 2 0
S T R A T E G I C R E P O R TD I V I S I O N A L R E V I E W C O N T I N U E D
FY2020 Financial performanceFY2020
£mFY2019
£mReported
growth
H1 underlying
growth
H2 underlying
growth
FY underlying
growth
Revenue 478 436 +10% +3% (13)% (6)%Industrials 345 315 +2% (5)% (2)%Aerospace 133 121 +5% (31)% (18)%
Headline operating profit 83 84 (1)% +9% (29)% (14)%Statutory operating profit 52 68 (24)%Return on capital employed 17.5 % 23.3% (580)bpsR&D cash costs % sales 0.5% 0.6% (10)bps
Revenue(£m)
FY2019 reported
Foreign exchange
Acquisitions & disposals* Underlying
FY2020 reported
Revenue 436 8 61 (27) 478
Flex-Tek’s underlying revenue decreased (6)%. After a good first half, underlying revenue declined (13)% in the second half, reflecting the downturn in commercial aerospace as well as a temporary disruption to US construction - which has since recovered. On a reported basis, revenue increased +10%, including +£61m incremental revenue associated with the acquisition of United Flexible, and +£8m favourable foreign exchange translation.
Industrials revenue was down (2)% despite increased sales of medical hoses and strong customer conversions to Flashshield+TM, an innovative new flexible gas tubing product, which contributed positively to the Group’s Vitality Index. Aerospace revenue was down (18)% on an underlying basis for the year, driven by the downturn in commercial aerospace in the second half. However defence aerospace was more resilient.
Headline operating profit decreased (14)% on an underlying basis, impacted by lower volumes partially offset by strong cost controls. Reported headline operating profit was down (1)% at £83m, benefiting from +£2m favourable foreign exchange and +£9m from the United Flexible acquisition.
Reported headline operating margin was 17.3%, down (190)bps. The difference between statutory and headline operating profit is due to amortisation of acquired intangible assets, provision for Titeflex Corporation subrogation claims, and integration costs for the United Flexible acquisition.
Operating profit(£m)
FY2019 reported
Foreign exchange
Acquisitions & disposals*
Restructuring costs Underlying
FY2020 reported
Headline operating profit 84 2 9 – (12) 83Headline operating margin 19.2% 17.6% 17.3%
ROCEROCE decreased (580)bps to 17.5%, mainly driven by the impact of lower volumes on profit and the acquisition of United Flexible in the prior year.
R&DCash R&D expenditure remained broadly consistent at 0.5% of sales. R&D is focused on new products for HVAC line sets, duct innovation in Thermaflex, and an expanded product offering in aerospace.
* Includes disposals and FY2020 performance from acquisitions that do not have comparators for the prior year

1
3
2
6 1S M I T H S G R O U P P L C A N N U A L R E P O R T F Y 2 0 2 0
2
Smiths Interconnect
Solutions for high-speed, secure connectivity in demanding applications
Smiths Interconnect is a leading provider of technically differentiated electronic components, subsystems, microwave and radio frequency products that provide secure connectivity of critical applications in the defence, aerospace, communications and industrial markets. Our advanced, high-quality solutions ensure high-speed connectivity, reliability and safety for demanding applications operating in harsh environments.
Divisional strategy Our strategy is to outperform our chosen market segments through customer focus, new technology, operational excellence and targeted geographical investment. We aim to be a partner of choice to customers that value our broad portfolio of innovative and technically differentiated connectivity solutions by having strong key account partnerships and efficient channels to market.
We will continue to focus on specific market segments including defence and space, communications and industrial applications. We will drive competitiveness through research and development (R&D), and we will fund our investments through improved efficiency.
Link to Group strategy1 Outperform our chosen markets – Continued emphasis on key account management to develop customer focus and intimacy
– Increased focused R&D investment of over 7.7% of sales to drive growth in our Vitality Index
– Build presence in India, focusing on defence, satcom, space and rail market segments
– Continued focus on higher-growth regions and market segments
2 Deliver world-class competitiveness – Continuous improvement and lean manufacturing through six sigma process improvement, deployment of mechanised/automated processes, and use of disruptive technologies to enable new manufacturing methods
– Simplified global operational structure through unified enterprise resource planning (ERP) implementation, legal entity simplification and network optimisation (regional end-to-end supply chain)
Competitive strengths – Innovative and technically differentiated products
– High-reliability solutions used in demanding applications
– Strong research and engineering capabilities
– Customer intimacy and product customisation
– Global reach and support
Growth drivers – Increased connectivity in space
– Growing urbanised population requiring transport and infrastructure
– Increasing geopolitical uncertainty
– Extension of internet connectivity to improve efficiency and data accuracy (Internet of Things, Industry 4.0)
– Increased focus on healthcare and ageing populations
Competitors Competitors range from large multinationals through to small, more focused companies across the product portfolio. Examples include: Amphenol, TE Connectivity, Molex, WinWay, Cobham, Honeywell, Leeno.
* Underlying modifies headline performance to: adjust prior year to reflect an equivalent period of ownership for divested businesses; exclude the effects of foreign exchange, acquisitions, restructuring costs and write-downs; and add back depreciation and amortisation of discontinued operations for comparability purposes
F Y 2 0 2 0 P E R F O R M A N C E
R E V E N U E(5)%*
£309m
R E V E N U E M I X
O R I G I N A L E Q U I P M E N T
98%
A F T E R M A R K E T
2%H E A D L I N E O P E R A T I N G P R O F I T(35)%*
£26mH E A D L I N E O P E R A T I N G M A R G I N *(460)bps
10.1%

6 2 S M I T H S G R O U P P L C A N N U A L R E P O R T F Y 2 0 2 0
S T R A T E G I C R E P O R TD I V I S I O N A L R E V I E W C O N T I N U E D
COVID-19 Our primary concern being always the safety of our people and of all those we work with, each of our sites supported employees in taking appropriate precautions to protect their health. As our products and services are instrumental to the continued operation of essential industries such as medical/healthcare, aerospace, defence, rail, communications and digital infrastructure, our sites have remained open during the COVID-19 pandemic, whilst taking appropriate precautions to protect the health of site workers.
We have closely monitored the potential impact that this unprecedented situation could have on our supply chain and taken the appropriate measures to minimise any effect on product manufacture and delivery to customers. This has resulted in minimal disruption of our operations and consequently very limited impact on our customer base.
Products We provide technologically differentiated electronic components, subsystems, microwave and radio frequency products that connect, protect and control critical applications in harsh environments in our focus market segments.
Our products are used in radar, communication and surveillance systems that are mission-critical and operate in extreme environments in aerospace and defence. Our solutions in engine systems, power distribution and avionics ensure reliability in flight-critical systems. Our microwave components and connectors ensure optimal performance, durability and safety in space, including LEO, MEO and GEO (Low, Medium and Geostationary Earth Orbit) satellites.
Our semi-conductor test products are used to test highly sophisticated semi-conductors and electronic circuits in use in communication systems, gaming products and computing devices. Our in-flight antenna systems give passengers internet connectivity gate-to-gate on planes around the world. Our connectivity solutions are used in surgical and monitoring systems, imaging systems and disposables applications. Our products control the reliable operation of train rolling stock (driver cabin braking systems) and ensure the integrity and speed of data transmission in signalling (train monitoring by satellites).
Markets where we operateIncreasing geopolitical uncertainty and operations in extreme environments create a platform for growth for defence applications. Increased demand for communication and data transmission requires additional satellites, especially LEO and MEO. Air transportation is impacted by COVID-19, which will result in delays to the upgrade of fleets.
The growth in big data, which requires more bandwidth and increased computing power, combined with a high rate of technology refresh with increased functionality and connectivity, creates further opportunities for our products.
Technology and Artificial Intelligence are transforming healthcare and will drive the demand for home-based, more connected medical devices.
Sustainable development in industrial applications will be a big driver of Internet of Things (“IoT”) and micro-electronics, driven by the need for productivity improvements
Increasing focus on sustainable energy will result in increased needs for electricity storage and battery back-up power.
Trends shaping innovation Our Group purpose guides our approach to innovation and we believe that megatrends, such as increased digitisation and connectivity and mobility and globalisation, are likely to continue to generate demand for our products over the longer term.
Megatrend Innovation in FY2020
Increased digitisation and connectivity
High-speed data, smaller packaging, increased power needs, smart devices, intelligent systems
Mobility and globalisation Space constellations, telemedicine, increased bandwidth, big data and 5G
CONNECTORS SUPPORTING THE EXPLORATION OF SPACESmiths Interconnect was recently awarded a contract by Boeing to design, manufacture and supply bespoke connectors to transfer power, signal and communications to different modules aboard NASA’s Orion spacecraft and Lunar Gateway for the Artemis crewed spaceflight programme.
The Orion spacecraft will take up to four astronauts to the Lunar Gateway where they will board a human landing system for exploration missions to the surface of the Moon. The Lunar Gateway is an in-development spaceship which is intended to orbit around the Moon. It will be a solar-powered communication hub, with living quarters for astronauts, a lab
for science and research, ports for visiting spacecraft, and a holding area for rovers and other robots.
The spaceship will be a temporary home and office for astronauts, a five-day, 250,000-mile commute from Earth. It will provide NASA and its partners access to more of the lunar surface than ever before, supporting both human and robotic missions on the Moon and, eventually, to Mars.
With many phases of the Artemis programme still to come, it is hoped that Interconnect’s partnership with Boeing will extend to many decades as humans explore Mars and the wonders that the planet has to offer.

6 3S M I T H S G R O U P P L C A N N U A L R E P O R T F Y 2 0 2 0
2
FY2020 Financial performanceFY2020
£mFY2019
£mReported
growth
H1 underlying
growth
H2 underlying
growth
FY underlying
growth
Revenue 309 319 (3)% (7)% (3)% (5)%Headline operating profit 26 47 (45)% (50)% (25)% (35)%Statutory operating profit 23 45 (49)%Return on capital employed 6.4% 12.8% (640)bpsR&D cash costs % sales 7.7% 7.2% +50bps
Revenue(£m)
FY2019 reported
Foreign exchange
Acquisitions & disposals Underlying
FY2020 reported
Revenue 319 5 – (15) 309
Smiths Interconnect revenue declined (5)% on an underlying basis, primarily reflecting the pre-COVID slowdown in its end markets. After a challenging first half with underlying revenue down (7)%, the trajectory improved in the second half with underlying revenue of (3)% and an increase in orders supporting the division’s return to growth in the fourth quarter. On a reported basis, revenue decreased by (3)%, including +£5m favourable foreign exchange translation.
The volume decline reflects a general slowdown in Interconnect’s markets, which were impacted by the China-US trade dispute from the start of the financial year.
The commercial aerospace and general industrial market segments were particularly badly impacted by the COVID-19 pandemic. Sales in the defence and space market segments also declined due to programme delays. Partly offsetting these declines was cyclical growth in semiconductor test as customers increased production of graphics cards for games consoles, and one-off orders for ventilator components in the medical segment.
During the year, Smiths Interconnect received significant orders for its space applications including for NASA projects and commercial satellite constellations.
Operating profit(£m)
FY2019 reported
Foreign exchange
Acquisitions & disposals
Restructuring costs Underlying
FY2020 reported
Headline operating profit 47 1 – (5) (17) 26Headline operating margin 14.7% 10.1% 8.4%
Headline operating profit decreased (35)% on an underlying basis, reflecting lower volumes and the cost of relocating and rationalising production capacity. Reported headline operating profit was down (45)% in the year to £26m, including +£1m favourable foreign exchange and £(2)m of restructuring costs to optimise the operational footprint, and £(3)m of receivables write-downs.
Reported headline operating margin was 8.4%, down (630)bps on a reported basis and (460)bps to 10.1% on an underlying basis, excluding the impact of the restructuring costs. The difference between statutory and headline operating profit reflects adjustments for amortisation of acquired intangibles and acquisition costs.
PortfolioIn October 2019, Smiths Interconnect completed the acquisition of Reflex Photonics (“Reflex”) for an enterprise value of CAD$40m. Reflex’s technological leadership in shock-resistant fibre optics significantly strengthens Smiths Interconnect’s product offering in the defence, space, aerospace and industrial market segments.
ROCEROCE decreased (640)bps to 6.4%, driven by lower profitability.
R&DCash R&D expenditure increased to 7.7% of sales (7.0% excluding customer funded R&D, FY2019: 6.4%), as we continued to invest in technology-led growth. R&D is focused on bringing to market new products that improve connectivity in difficult operating environments. Product launches included connectors for power transmission in harsh environments and efficient probe heads for the semiconductor packaging industry. Smiths Interconnect opened a new Qualification and Test laboratory in Dundee, offering a one-stop shop for critical qualification and testing for space applications.

6 4 S M I T H S G R O U P P L C A N N U A L R E P O R T F Y 2 0 2 0
S T R A T E G I C R E P O R TD I V I S I O N A L R E V I E W C O N T I N U E D
Smiths Medical
Discontinued operations
Quality medical devices and consumables that are vital to patient care
Divisional strategy Smiths Medical’s strategy is to become a leading medication management solutions company with a complementary vital care offering. We believe we will achieve this with commercially focused innovation, differentiation in our customer support model, and delivery of complete solutions that optimise patient outcomes. We will continue to enhance both our own R&D and our external partnerships to execute our strategy in line with healthcare megatrends.
In order to invest in our future, we will continue to improve efficiency and operational excellence. Part of this investment, besides customer solutions, will include further developing our people.
We will drive growth in developed markets through investments in premium product segments. We will also continue to improve our capabilities in emerging markets outside of North America and Western Europe, enhancing our current global footprint and sales reach. In addition, we will continue to pursue channel optimisation in hospitals and alternate sites of care.
Competitive strengths – A category leader in served segments
– Trusted brands with a reputation for safety
– Strong, defensible intellectual property
– C.80% of revenue from single-use devices and proprietary consumables
– Strong customer relationships and extensive global sales network
Growth drivers – Ageing populations with increasing personalised healthcare and patient expectation/quality of life
– Increasing incidence of chronic diseases
– Increasing need for connected systems and data analytics
– Growth of alternate site and home-based healthcare
– Growing healthcare spend in developing markets
Competitors Competitors range from large multinationals through to small, more focused companies across the product portfolio. Examples include: Becton Dickinson, Baxter, B-Braun, Medtronic.
* Underlying modifies headline performance to: adjust prior year to reflect an equivalent period of ownership for divested businesses; exclude the effects of foreign exchange, acquisitions, restructuring costs and write-downs; and add back depreciation and amortisation of discontinued operations for comparability purposes
F Y 2 0 2 0 P E R F O R M A N C E
R E V E N U E+4%*
£918m
H E A D L I N E O P E R A T I N G P R O F I T(3)%*
£184mH E A D L I N E O P E R A T I N G M A R G I N *(130)bps
15.5%
R E V E N U E B Y S E C T O RR E V E N U E M I X
O R I G I N A L E Q U I P M E N T
20%
I N F U S I O N S Y S T E M S
35%
C O N S U M A B L E S
80%
V A S C U L A R A C C E S S
30%V I T A L C A R E A N D S P E C I A L T Y P R O D U C T S
35%

6 5S M I T H S G R O U P P L C A N N U A L R E P O R T F Y 2 0 2 0
2
COVID-19 The global COVID-19 pandemic has and is driving unprecedented impacts on the Smiths Medical business. Demand for items such as ventilators and supporting accessories, other airway management products and infusion pumps and accessories, which are used to treat and care for impacted patients, saw substantial demand increases. At the same time, elective procedures have been restricted, if not altogether cancelled, resulting in worldwide decreasing demand on other segments of the business, also impacting inventory. We believe we are well positioned to support our customers and their patients for subsequent waves of the pandemic.
Products In Infusion Systems, Smiths Medical products deliver medication treatment for conditions including acute and chronic pain, cancer, pulmonary hypertension and Parkinson’s disease. Products are used in acute settings, surgery centres, oncology centres, and home settings and we have strong positions in ambulatory infusion and in the syringe pump segment.
In Vascular Access, products cover a range of venous access methods including blood draw, as well as catheters, ports, and needles for the infusion of fluids and blood. In May 2020, Smiths Medical acquired the business of Access Scientific LLC in order to further strengthen its vascular access portfolio.
Vital Care and Specialty Products cover a wide range of critical-care and chronic disease management products including tracheostomy, temperature management, general anaesthesia, respiratory and bronchial hygiene.
Markets where we operateThe medical device industry remains attractive, with strong growth drivers. The global market served by Smiths Medical is estimated to be c.£7.3bn and growing around 3% annually, with growth drivers such as expansion of developing markets, ageing populations, increasing need for connected systems and data analytics, and growth of alternate site and home-based healthcare and innovation.
In Infusion Systems, an increasing rate of chronic conditions and outpatient treatment favour ambulatory infusion solutions. Healthcare providers are advancing digital integration between infusion devices and their respective hospital information systems.
In Vascular Access, continued growth is expected due to safety regulations driving to prevent needlestick injuries, blood exposure, and hospital-acquired infections.
In Vital Care and Specialty Products, key growth drivers include the expansion of enhanced recovery after surgery and the prevalence of chronic obstructive pulmonary disease (COPD).
Trends shaping innovation Megatrends, such as ageing populations and healthcare demand and increased digitisation and connectivity are expected to continue to generate demand for Smiths Medical products over the longer term.
Megatrend Innovation in FY2020
Ageing populations and healthcare demand
– Focus on alternate site and home-based healthcare in developed markets
– Developing focused technologies targeting chronic conditions through patient-friendly design
Increased digitisation and connectivity
– Smart pump programming with electronic medical record system integration
– Evolving data access and connectivity models
RESPONDING EFFECTIVELY TO THE DEMANDS OF THE COVID-19 PANDEMICThe Smiths Medical COVID-19 SWAT team was formed at the beginning of the COVID-19 pandemic to facilitate and drive an accelerated response to customer needs and demand for medical products and devices including ventilators across the world. The five-strong team met daily with Smiths Medical CEO, JehanZeb Noor, to share information and discuss priorities, and were empowered to execute decisions on all aspects of the response, including strategy, resourcing and investment, supply and building external partnerships.
Weekly leadership meetings were held with the SWAT team to monitor the spread of the pandemic and align the global team on strategy and messaging. Cross-functional
teams were supported to respond operationally to changes in demand and prepare forward plans. The SWAT team co-ordinated efforts to enlist new suppliers and facilitated capital investment at locations across the Smiths Medical network to support increased output. They also set up a workstream to deliver online and interactive customer training materials for ventilator use.
The SWAT team played a role in securing an order for 78.6 million syringes to support the US Government’s vaccination plans and in the UK Ventilator Challenge consortium.
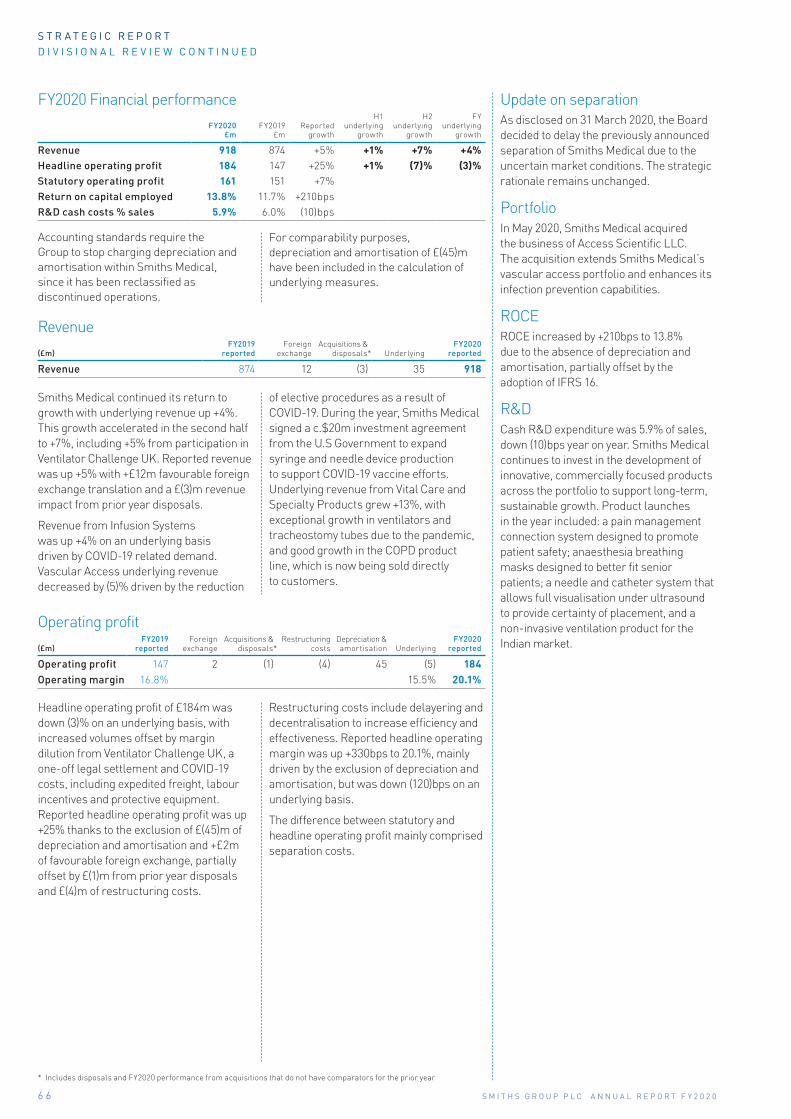
6 6 S M I T H S G R O U P P L C A N N U A L R E P O R T F Y 2 0 2 0
S T R A T E G I C R E P O R TD I V I S I O N A L R E V I E W C O N T I N U E D
FY2020 Financial performanceFY2020
£mFY2019
£mReported
growth
H1 underlying
growth
H2 underlying
growth
FY underlying
growth
Revenue 918 874 +5% +1% +7% +4%Headline operating profit 184 147 +25% +1% (7)% (3)%Statutory operating profit 161 151 +7%Return on capital employed 13.8% 11.7% +210bpsR&D cash costs % sales 5.9% 6.0% (10)bps
Accounting standards require the Group to stop charging depreciation and amortisation within Smiths Medical, since it has been reclassified as discontinued operations.
For comparability purposes, depreciation and amortisation of £(45)m have been included in the calculation of underlying measures.
Revenue(£m)
FY2019 reported
Foreign exchange
Acquisitions & disposals* Underlying
FY2020 reported
Revenue 874 12 (3) 35 918
Restructuring costs include delayering and decentralisation to increase efficiency and effectiveness. Reported headline operating margin was up +330bps to 20.1%, mainly driven by the exclusion of depreciation and amortisation, but was down (120)bps on an underlying basis.
The difference between statutory and headline operating profit mainly comprised separation costs.
Update on separation As disclosed on 31 March 2020, the Board decided to delay the previously announced separation of Smiths Medical due to the uncertain market conditions. The strategic rationale remains unchanged.
PortfolioIn May 2020, Smiths Medical acquired the business of Access Scientific LLC. The acquisition extends Smiths Medical’s vascular access portfolio and enhances its infection prevention capabilities.
ROCEROCE increased by +210bps to 13.8% due to the absence of depreciation and amortisation, partially offset by the adoption of IFRS 16.
R&DCash R&D expenditure was 5.9% of sales, down (10)bps year on year. Smiths Medical continues to invest in the development of innovative, commercially focused products across the portfolio to support long-term, sustainable growth. Product launches in the year included: a pain management connection system designed to promote patient safety; anaesthesia breathing masks designed to better fit senior patients; a needle and catheter system that allows full visualisation under ultrasound to provide certainty of placement, and a non-invasive ventilation product for the Indian market.
Operating profit(£m)
FY2019 reported
Foreign exchange
Acquisitions & disposals*
Restructuring costs
Depreciation & amortisation Underlying
FY2020 reported
Operating profit 147 2 (1) (4) 45 (5) 184Operating margin 16.8% 15.5% 20.1%
Headline operating profit of £184m was down (3)% on an underlying basis, with increased volumes offset by margin dilution from Ventilator Challenge UK, a one-off legal settlement and COVID-19 costs, including expedited freight, labour incentives and protective equipment. Reported headline operating profit was up +25% thanks to the exclusion of £(45)m of depreciation and amortisation and +£2m of favourable foreign exchange, partially offset by £(1)m from prior year disposals and £(4)m of restructuring costs.
Smiths Medical continued its return to growth with underlying revenue up +4%. This growth accelerated in the second half to +7%, including +5% from participation in Ventilator Challenge UK. Reported revenue was up +5% with +£12m favourable foreign exchange translation and a £(3)m revenue impact from prior year disposals.
Revenue from Infusion Systems was up +4% on an underlying basis driven by COVID-19 related demand. Vascular Access underlying revenue decreased by (5)% driven by the reduction
of elective procedures as a result of COVID-19. During the year, Smiths Medical signed a c.$20m investment agreement from the U.S Government to expand syringe and needle device production to support COVID-19 vaccine efforts. Underlying revenue from Vital Care and Specialty Products grew +13%, with exceptional growth in ventilators and tracheostomy tubes due to the pandemic, and good growth in the COPD product line, which is now being sold directly to customers.
* Includes disposals and FY2020 performance from acquisitions that do not have comparators for the prior year

6 7S M I T H S G R O U P P L C A N N U A L R E P O R T F Y 2 0 2 0
2
R I S K M A N A G E M E N T
We understand the risks we face and take a proactive approach to risk management in order to maximise opportunities, drive better commercial decision-making, and protect our people and our businesses.
Risk governanceThe Board and its Committees set the culture and approve the strategy of the Group. The Board ensures appropriate oversight and monitoring through a number of mechanisms, including strategy reviews, Committee meetings, management reports and focused reviews of selected risk areas.
On behalf of the Board, the Audit & Risk Committee is responsible for reviewing and assessing the effectiveness of the Group’s risk management and internal control systems. The review process covers the Group’s principal risks, as well as financial, operational and compliance controls.
The Executive Committee is responsible for designing the Enterprise Risk Management (ERM) framework and ensuring that it is effectively deployed throughout the Group. The Executive Committee also ensures that the Board’s risk appetite is understood by risk owners and decision-makers, ensures risks are adequately managed, and conducts an annual assessment of strategic risk. Principal risks are owned by members of the Executive Committee.
The Enterprise Risk Management (ERM) process
We operate across a number of markets and geographies. We are prepared to accept certain levels of risk to realise our ambitions, and our purpose to make a safer, more efficient and better connected world.
A proactive approach to risk
Figures in this section are for total Group unless otherwise stated
Risk ownership and mitigation
Operational teams – Understanding roles and responsibilities
– Establishing and applying internal control systems
– Complying with policies – Following risk management processes
1S T L INE O F D E F E N C E
B OA R D A ND AU D I T & R I SK C O MMI T T E E
– Approving the strategy and setting the culture and risk appetite of the Group
– Reviewing and assessing the effectiveness of risk management and internal control systems
– Monitoring through Board processes and good governance
Monitoring and compliance
Risk and compliance functions – Developing and managing the ERM process
– Monitoring risks – Developing and managing policies and control frameworks
– Monitoring controls – Ensuring financial, legal and ethical compliance
– Ensuring security, quality and health and safety
4T H L INE O F D E F E N C E
2 ND L INE O F D E F E N C E
Independent assurance
Internal audit function – Providing assurance on internal controls, programmes, systems and risk management processes
3 R D L INE O F D E F E N C E
Regulators and external audit
E X EC U T I V E C O MMI T T E E A ND SE NI O R M A N AG E ME N T
– Designing and establishing risk management and internal control systems
– Ensuring that the risk appetite of the Board is understood by risk owners and decision-makers
– Ensuring risks are adequately managed

6 8 S M I T H S G R O U P P L C A N N U A L R E P O R T F Y 2 0 2 0
S T R A T E G I C R E P O R TR I S K M A N A G E M E N T C O N T I N U E D
Running a business involves continual assessment and management of risks – it is an integral part of day-to-day operations. Our ERM process supports open communication on risk between the Board and Audit & Risk Committee, the Executive Committee, our divisions, functions and sites. It enables us to manage and monitor the risks which threaten successful execution of our Group strategy and ensures our strategic, financial, compliance and operational risks are appropriately considered by the Executive Committee and by the Board.
Within the ERM framework, we operate a ‘four lines of defence approach’. This ensures that the four lines – risk ownership and mitigation, monitoring and compliance, independent assurance, and oversight – are clearly defined and work effectively.
Our divisional and functional teams are responsible for day-to-day management and reporting of risks. They identify new and emerging risks, escalate where appropriate, and take action to ensure risks are managed as required. Our divisions also conduct annual assessments of the strategic, financial, compliance and operational risks they face. In FY2020 these were updated to ensure that the latest views of COVID-19 risks were presented and considered.
Internal audit provides independent and objective assurance to both the Audit & Risk and Executive Committees on the adequacy and effectiveness of our risk management and internal control processes. It facilitates the ERM process and provides site-based controls and assurance reviews of key programmes, processes and systems.
The Audit & Risk Committee, on behalf of the Board, reviews the effectiveness of the risk management process: considering emerging risks; the principal risks and uncertainties; actions taken by management to manage those risks; and the Board’s risk appetite in respect of each risk.
During FY2020 the Executive Committee agreed the ERM timetable and the risks selected for ‘deep-dive’ discussions at Executive and Audit & Risk Committee meetings. These were: product quality; cyber security; customers; and integrated supply chain. The Group’s list of principal risks was also discussed and recalibrated by the Executive Committee.
The requirement for risk owners to demonstrate how they get assurance that controls are working effectively was maintained following its introduction last year. Examples are provided in the following tables of principal risks.
In addition, a further 42 risk workshops were facilitated at operational sites during the year to support the bottom-up view of risk that has fed into divisional and functional risk assessments.
The Directors consider the risk management process to be effective. The Audit & Risk Committee recognises that this is an ongoing process and work will continue in FY2021.
Emerging risks Emerging risks and horizon scanning are integrated into the ERM process. Functions in the business often take the lead in identifying and promoting risk awareness and mitigation activities.
An example is climate change and the potential impact this may have on the business strategy. This is championed by the HSE function and now forms part of risk reporting and risk management in the business. See page 43 for more details.
The UK is expected to withdraw from the European Union (EU) at the end of 2020. The Group continues to monitor the ongoing negotiations between the UK and the EU. Preparations have been made and mitigation measures have been put in place to meet potential scenarios. However, due to the nature and structure of the Group’s business model, operations, supply chain and the location of our customers, Brexit on a ‘hard’ or ‘soft’ basis is not anticipated to have a material impact on the Group’s operations or its financial performance. As such Brexit is not in itself deemed to represent a principal risk and the impact of Brexit has not been included in the scenarios developed to assess the Group’s going concern or viability (see pages 77-78).
COVID-19 IMPACTThe COVID-19 pandemic is having, and will continue to have, an impact across the business. This is inherently reflected in each risk and mitigating actions.
Separately, its emergence resulted in process changes, with the Audit & Risk Committee’s Customer risk ‘deep dive’ being incorporated into the Board’s strategic business reviews, and the divisional Product Quality ‘deep-dives’ being limited to a focus on John Crane.
The Audit & Risk Committee will consider Product Quality deep-dives for the other divisions during FY2021.
Time was spent at all Executive Committee, Audit & Risk Committee and Board meetings from January 2020 onward considering the impact of COVID-19 on our business and our people. In addition, the Executive Committee met on a weekly basis to review reports from: the business, and the Smiths Group Crisis Core team and its sub-groups established to direct
and oversee the Group’s response to the impact of COVID-19. Regular updates were provided to the Board.
As part of the ERM process it was agreed that disease pandemic would move from being an element of the integrated supply chain risk where it had formerly been included, to being a stand-alone COVID-19 principal risk, giving an overview of the direct uncertainties, potential impacts on the Group, and our responses. This continues to be closely monitored.

P R IN C IPA L R I SK S
1 . C O V I D - 1 9 ( N e w )
2 . T E C H N O L O G Y
3 . E C O N O M Y A N D G E O P O L I T I C S
4 . G R O U P P O R T F O L I O
5 . L I Q U I D I T Y ( N e w )
6 . P R O D U C T Q U A L I T Y
7 . C U S T O M E R S
8 . P E O P L E
9 . C Y B E R S E C U R I T Y
1 0 . I N T E G R A T E D S U P P L Y C H A I N
1 1 . M A R K E T S
1 2 . E T H I C A L B R E A C H
1 3 . C O N T R A C T U A L O B L I G A T I O N S
High LowMedium
R E S I D U A L I M P A C T
Increase from FY2019
No change Decrease from FY2019
T R E N D ( N E T P O S I T I O N O F R I S K v s F Y 2 0 1 9 )
High Low
L I K E L I H O O D
V E L O C I T Y
High LowMedium
PE
OP
LE
OPERATION
AL
STR ATEGIC
1 New
11
4
9
10
5 New
6
7
2
12 8
13
3
6 9S M I T H S G R O U P P L C A N N U A L R E P O R T F Y 2 0 2 0
2
Principal risks and uncertainties
We maintain a register of principal risks and uncertainties covering the strategic, financial, operational and compliance risks faced by the Group.
We review each risk and rate a number of factors: gross impact, applying the hypothetical assumption there are no mitigating controls in place; residual impact and likelihood, taking into account existing mitigating controls; target impact; the reputational impact of a risk; and its velocity, which reflects the expected time we would have to react should a risk materialise. These, in turn, drive mitigation priorities. A trend metric shows the net position of the risk year-on-year.
In FY2020 we formalised consideration of the relationship between risks to help understand the potential for one risk to have an impact on another. This is presented against each risk in the form of ‘risk relationship’ charts indicating the strength of linkage between each principal risk and others on the list. This has been used as an input to the viability statement assessment and will be used more widely in future risk scenario planning and mitigation work.
We updated our register of principal risks and uncertainties following review by the Executive Committee and approval by the Board. As stated earlier, COVID-19 was added as a new principal risk, disease pandemic having previously been reported as part of the integrated supply chain risk. Additionally, in the light of the impact of COVID-19, liquidity has been promoted to the list in recognition of the large gross impact this might have. Mitigating actions result in this risk being considered low likelihood.
Due to the long-term nature of climate change this is not considered a principal risk. However, the Board recognises the importance of considering climate change in its decision-making, notably on longer-term strategic topics. See page 43 for more details.
While we continue to monitor and manage a wider range of risks, the risk map above and the tables that follow summarise those risks considered to have the greatest potential impact if they were to materialise.

1. COVID-19 (New)
Strong
Moderate
7 0 S M I T H S G R O U P P L C A N N U A L R E P O R T F Y 2 0 2 0
S T R A T E G I C R E P O R TR I S K M A N A G E M E N T C O N T I N U E D
2
3
4
5
67
8
9
10
11
12
13 1
2
3
4
5
67
8
9
10
11
12
13 1
R I SK O W NE RMel Rowlands
T R E NDNew
IN C L U D E D IN V I A BIL I T Y A S SE S SME N T:
R E L AT I O N SHIP T O O T HE R P R IN C IPA L R I SK S
1
3
2
L I N K T O R E S O U R C E S A N D R E L A T I O N S H I P S
+ Read more about our Resources and relationships on pages 24-51
L I N K T O S T R A T E G I C O B J E C T I V E S
+ Read more about our strategy on pages 15-21
COVID-19 is impacting our colleagues, customers, suppliers and operations to varying degrees across different territories and different parts of our business. This includes, but is not limited to: risks to the wellbeing of our people, their families and communities; our customers, who have in many cases revised their demand forecasts; our suppliers, whose businesses have had challenges maintaining continuity of supply; and our own operations which have had to deal with all the combined challenges of the pandemic.
How this could impact our strategy or business model – Exceptional external circumstances arising, including significant adverse consequences arising from the evolving pandemic and associated economic dislocation may impact the separation of Smith Medical
– Significant reduction in global demand for our products
– Disruption to our ability to deliver products and services to customers in the event of interruptions to our supply chain and manufacturing operations
Examples of how we manage this risk – Smiths Group Crisis Core team was mobilised during the first six months of the crisis overseeing various workstream sub-groups and reporting to the Executive Committee
– Workstreams comprise: Divisions, HSE, HR, Communications, Operations and Supply Chain (OSNC), Legal, Finance, Systems/Infrastructure and Government Relations
– Divisional Crisis Teams and Site Emergency Response Teams operationalised
– Smiths support network including partnerships with third parties providing pandemic related advice and support e.g. engaged an expert medic
Examples of how we know the controls are working effectively – OSNC continues to provide real-time updates on status of operations, supply chain and logistics through dashboards
– Fast track issue spotting, escalation and resolution through Group and cross-divisional resources
– Over 90% of manufacturing facilities operational throughout early stages of crisis (January through to June)
– Group HSE monitoring employee health across sites and within countries/regions. Proactive case management of employee health in relation to COVID-19 regularly reported and acted upon
1 32
2. TECHNOLOGY
R I SK O W NE RAndy Reynolds Smith
T R E NDNo change
IN C L U D E D IN V I A BIL I T Y A S SE S SME N T:N/A
R E L AT I O N SHIP T O O T HE R P R IN C IPA L R I SK S
Differentiated new products and services are critical to our success. We may be unable to maintain technological differentiation or to meet customers’ needs and may face disruptive innovation by a competitor.
How this could impact our strategy or business model – Material adverse effect on margin and profitable growth
– Erosion of our reputation as a leader in our markets and of our ability to attract and retain talent
Examples of how we manage this risk – Proactive repositioning of the portfolio around the most attractive markets where we can sustainably hold a top three position based on technology leadership
– Diversified technology portfolio serving a range of sectors and geographies, mitigating exposure to any one sector or area
– Continuing and smarter investment in R&D (FY2020: 5.0% of Total Group revenue, FY2019: 4.8%)
– Focus on building a culture of innovation with a long-range technology roadmap for each division
– Focus on next generation and transformational initiatives
– New Product Introduction (NPI) process operating across divisions to accelerate projects
– Digital Forge works to accelerate digital transformation across the Group
– Vitality Index as a KPI
– Robust IP protection via patents and other protections, and litigation where appropriate
Examples of how we know the controls are working effectively – Vitality data is reviewed by the Smiths Innovation Strategy Board (SISB) and is part of the SES dashboard
– Adherence to NPI process is audited and embedded in systems with monthly ‘pipeline’ overview provided by divisions
– Technology roadmap is part of the Group strategic cycle
– Digital Advisory Committee as a governance mechanism to ensure the Digital Forge is working on the most value-creating projects for the Group
1 32
Strong
Moderate

7 1S M I T H S G R O U P P L C A N N U A L R E P O R T F Y 2 0 2 0
2
2
3
4
5
67
8
9
10
11
12
13 1
2
3
4
5
67
8
9
10
11
12
13 1
3. ECONOMY AND GEOPOLITICS
Strong
Moderate
R I SK O W NE RJohn Shipsey
T R E NDNo change
IN C L U D E D IN V I A BIL I T Y A S SE S SME N T:
R E L AT I O N SHIP T O O T HE R P R IN C IPA L R I SK S
COVID-19 has triggered a highly significant global economic downturn. In many sectors, demand has reduced. There is a likelihood that the impact on demand will be prolonged, especially in commercial aerospace. The collapse in both the oil price and oil consumption may trigger a downturn in demand (particularly OE) for John Crane. A global recession may also lead to an increase in bankruptcies of both customers and suppliers. Conversely, the crisis is opening up new opportunities, most obviously in Smiths Medical and Smiths Detection; and inorganic opportunities are likely to arise more frequently and at better values. Geopolitical tensions continue to rise, most notably between China and the US, but also affecting other Governments, which pose threats to the free movement of goods, capital and people.
How this could impact our strategy or business model – Significant and prolonged reduction in global demand for our products
– Geopolitical tensions, most notably relating to China, the US, India, the Middle East, South Korea and North Korea, adversely impact trade
– Adverse impact on business performance due to the imposition of tariffs
– The consequences of Brexit are uncertain. Potential effects, applicable to many businesses, include economic and operational uncertainty, volatility of currency exchange, regulatory changes and the imposition of tariffs on trade between the UK and the Eurozone
– Governments continue to look for ways to improve tax revenues to ease fiscal budget pressures
Examples of how we manage this risk – Identification and application of learnings from past downturns through the cycle
– Diversified portfolio of businesses which mitigates exposure to any one country or sector
– Geographic spread which mitigates the impact of trade barriers between regions
– Divisions monitor order flows and other leading indicators so that they may respond
quickly to deteriorating trading conditions and tariffs/barriers to free trade
– Representation of our interests by the Corporate Affairs team
– Network of trade compliance officers across the Group who monitor upcoming changes in regulation and oversee import and export activities
– Monitoring of the ongoing negotiations between the UK and the EU in order to assess the potential impact of Brexit
– Sustainable tax strategy to optimise the Group’s position
Examples of how we know the controls are working effectively – Impact of US tariffs to date has been absorbed – Order tracking reported and monitored – Business indicators reported weekly – Brexit coordination group working effectively, Group has relatively little exposure to Brexit
1 32
4 . GROUP PORTFOLIO
Strong
Moderate
R I SK O W NE RJohn Shipsey
T R E NDNo change
IN C L U D E D IN V I A BIL I T Y A S SE S SME N T:N/A
R E L AT I O N SHIP T O O T HE R P R IN C IPA L R I SK S
Our strategy is predicated primarily on organic growth. However, acquisitions/divestments can also play a role in building and/or strengthening competitive positions.
Acquisitions bring risk as well as opportunity. We may invest substantial funds and resources in acquisitions which fail to deliver on expectations – due to incorrect appraisal of the target and/or poor execution. The opposite risk is that (perhaps through an excess of caution) we miss out on opportunities to build market-leading positions and growth.
Divestments also carry risk. We may divest an asset at the wrong time, or may not realise appropriate value for the asset. Separation may be complex and, if poorly executed, may impact the wider business.
How this could impact our strategy or business model – Poor acquisitions/divestments, or poorly managed integrations/separations, lead directly to financial damage and indirectly to loss of shareholder confidence
– Newly-acquired products and solutions deliver less value, fewer synergies, or require more investment than anticipated
– Fall in our return on capital employed measure – Financial performance suffers from goodwill or other acquisition-related impairment charges or inheritance of material unknown liabilities
Examples of how we manage this risk – Investment in greater internal capability for the evaluation and execution of transactions
– Regular reviews of the acquisition pipeline and a stage-gated M&A process
– Detailed due diligence and integration work in accordance with our acquisitions and disposals policy
– Detailed separation planning, in accordance with our acquisitions and disposals policy
– Governance ensures multi-disciplinary sign off – Larger transactions approved by the full Board – Post-transaction reviews with lessons learned incorporated into future projects
– Use of external advisers
Examples of how we know the controls are working effectively – Technology acquisitions have established a strong track record
– Strong internal team – Proper governance and oversight – Learnings from previous acquisitions considered and applied
– Ongoing evaluation measured against original business case
1 3

5. LIQUIDIT Y (New)
Strong
Moderate
7 2 S M I T H S G R O U P P L C A N N U A L R E P O R T F Y 2 0 2 0
S T R A T E G I C R E P O R T
2
3
4
5
67
8
9
10
11
12
13 1
2
3
4
5
67
8
9
10
11
12
13 1
R I S K M A N A G E M E N T C O N T I N U E D
Principal risks and uncertainties continued
6. PRODUCT QUALIT Y
R I SK O W NE RDivisional Presidents
T R E NDDecrease
IN C L U D E D IN V I A BIL I T Y A S SE S SME N T:
R E L AT I O N SHIP T O O T HE R P R IN C IPA L R I SK S
In the ordinary course of business we are potentially subject to product liability claims and lawsuits, including potential class actions. The mission-critical nature of many of our solutions makes the potential consequences of failure more serious than may otherwise be the case.
How this could impact our strategy or business model – Damage to our reputation amongst customers and reduction in market acceptance of, and demand for, our products from an adverse event involving one of our products
– Recall of products due to manufacturing flaws, component failures, damage to persons/property, and/or design defects
– Exposure to losses in the event of a cyber security breach relating to our products
– Customers’ losses but also losses arising from a potentially large class of third parties
Examples of how we manage this risk – Divisional quality risk assessments that address product failures, product compliance, regulatory compliance, product performance, product safety and market authorisation risks
– Quality assurance processes embedded in manufacturing locations for critical equipment, supporting compliance with industry regulations
– Quality development and quality integration built into NPI processes
– Risk analysis and mitigation processes relating to product cyber resilience embedded in the product lifecycle process. Proactive steps taken to ensure product cyber related risks are continually monitored and managed
– Insurance cover for product liability – Material litigation managed under the oversight of the Group General Counsel
Examples of how we know the controls are working effectively – Quality measures (e.g. DPPM, COPQ) are measured and action plans put in place to drive their improvement – these are regularly reported
– Group and divisional governance frameworks (including Delegation of Authority) ensure a close working relationship between legal and commercial teams (includes quality) to manage risks
– Fewer quality issues at launch of new products
2
Strong
Moderate
R I SK O W NE RJohn Shipsey
T R E NDNew
IN C L U D E D IN V I A BIL I T Y A S SE S SME N T:
R E L AT I O N SHIP T O O T HE R P R IN C IPA L R I SK S
COVID-19 has triggered a highly significant global economic downturn. In many sectors, demand has reduced, in some cases close to zero. We, along with our customers and suppliers, have also faced disruption to operations and higher costs. If disruption were to be deep and sustained over many months, our financial position could be eroded by lower revenues, higher costs and cash write-offs (e.g. non-payment by customers). We might not be able to rely on access to committed facilities, either through breach of our financial covenant or because lenders were unable to meet their obligations.
How this could impact our strategy or business model – Inability to fund our operations – Inability to invest in medium to longer-term drivers of growth
– Reduced competitiveness of our businesses
Examples of how we manage this risk – Diversified portfolio of businesses that mitigates exposure to any one country or sector
– Strongly cash generative businesses – Capital expenditure and working capital are embedded in performance management and reward
– Conservative financing policy with a self-imposed limit of 2x net debt to EBITDA and significant liquidity headroom
– Strong and diversified lending group – strong loan documentation with only one interest cover covenant on the revolving credit facility
– Ability to flex cost base in the face of reduced revenues with 60% of Cost Of Goods Sold being variable
Examples of how we know the controls are working effectively – Resilient performance of the business – Strong free cash-flow – Liquidity headroom of £1bn – Average debt maturity of 4.2 years – Net EBITDA of 1.9x – Cash of £386m and undrawn $800m RCF
1 32

7 3S M I T H S G R O U P P L C A N N U A L R E P O R T F Y 2 0 2 0
2
2
3
4
5
67
8
9
10
11
12
13 1
2
3
4
5
67
8
9
10
11
12
13 1
7. CUSTOMERS
R I SK O W NE RJulian Fagge
T R E NDNo change
IN C L U D E D IN V I A BIL I T Y A S SE S SME N T:N/A
R E L AT I O N SHIP T O O T HE R P R IN C IPA L R I SK S
Our markets are evolving at a fast pace, creating potential for customers to change their business models as they look to deliver products and services at higher quality, with better service and at lower cost.
Failure of the Group to keep pace with customer changes/requirements (innovation, go-to-market strategies) could have a materially adverse impact on Group performance.
How this could impact our strategy or business model – Loss of market share and adverse impact on Group results
– Material adverse effect on profitable growth – Erosion of our reputation as a leader in our markets
Examples of how we manage this risk – As part of the Group innovation framework and our approach to potential technology disruption, we include customer disruption as well as competitor and product disruption
– New product innovation feedback through market research and direct feedback from existing and potential customers
– Developing business models is a core component of the Group-wide training agenda
Examples of how we know the controls are working effectively – Megatrend workshops and disruption risks reviewed annually
– Customer input gathered on a frequent basis – Pilot programmes to test products, business models and partnerships
– Strategic review process; divisional deep dives
1
Strong
Moderate
8. PEOPLE
R I SK O W NE RSheena Mackay
T R E NDNo change
IN C L U D E D IN V I A BIL I T Y A S SE S SME N T:N/A
R E L AT I O N SHIP T O O T HE R P R IN C IPA L R I SK S
People are our only truly sustainable source of competitive advantage and competition for key skills is intense, especially around science, technology, engineering and mathematics (STEM) disciplines. We may not be successful in attracting, retaining, developing, engaging and inspiring the right people with the right skills to achieve our growth ambitions.
How this could impact our strategy or business model – Inability to attract key talent leading to a loss of competitive advantage
– Difficulty in retaining personnel, at all levels of the organisation, leading to a loss of competitive advantage
– In acquisitions, losing key personnel from the newly-acquired business which may significantly impact performance and value
Examples of how we manage this risk – Investment to build a learning organisation with a focus on culture, reward and recognition
– Implementation of the right HR infrastructure – Delivery of a range of learning and development opportunities at all levels of the organisation
– Talent and succession plan reviews – Remuneration packages evaluated regularly against market trends
– Chief Executive assessment of the leadership team
– Annual performance management reviews for the majority of employees using best-practice processes such as 360-degree feedback surveys
– Formal career counselling for senior people in the business
– A clearly defined people integration plan for acquisitions
– People Plan oversight by the Board – Diversity and Inclusion plan and initiatives
Examples of how we know the controls are working effectively – Participation rates in the Smiths learning and development programmes measured. Capability and performance of alumni are tracked
– Benchmarking ratio of hires into senior roles from internal and external sources
– Formal and informal measures of culture, for example regular engagement surveys with follow-up action planning
– Measurement of the effectiveness of the Executive education programme through post-completion evaluation tests
– Post-acquisition and lessons learned reviews
2
Strong
Moderate

7 4 S M I T H S G R O U P P L C A N N U A L R E P O R T F Y 2 0 2 0
S T R A T E G I C R E P O R T
2
3
4
5
67
8
9
10
11
12
13 1
2
3
4
5
67
8
9
10
11
12
13 1
R I S K M A N A G E M E N T C O N T I N U E D
Principal risks and uncertainties continued
9. CYBER SECURIT Y
R I SK O W NE RJohn Shipsey
T R E NDNo change
IN C L U D E D IN V I A BIL I T Y A S SE S SME N T:
R E L AT I O N SHIP T O O T HE R P R IN C IPA L R I SK S
Cyber attacks seeking to compromise the confidentiality, integrity and availability of IT systems and the data held on them are a continuing risk. We operate in markets and product areas which are known to be of interest to criminals.
How this could impact our strategy or business model – Compromised confidentiality, integrity and availability of our assets resulting from a cyber attack, impacting our ability to deliver to customers and, ultimately, financial performance and reputation
– Exposure to significant losses in the event of a cyber security breach relating to our security or medical products. These include not only customer losses, but also those of a potentially large class of third parties
Examples of how we manage this risk – Board oversight of the approach to mitigating cyber risk
– Proactive focus on information and cyber security risks supported by a strong governance framework
– Group-wide assessment of critical information assets and protection to enhance security
– Information Security Awareness programme – Security monitoring to provide early detection of hostile activity on Smiths networks and an incident management process
– Partnership and monitoring arrangements in place with critical third parties, including communications service providers
– Cyber risk analysis and mitigation processes embedded in the product lifecycle process to increase resilience
Examples of how we know the controls are working effectively – Formal reviews with the Executive Committee and the Board
– Vulnerability scanning/event reporting – External reviews of vulnerability controls – Mandatory staff training – Compliance with recognised standards – Cyber leads at divisions
2
Strong
Moderate
10. INTEGR ATED SUPPLY CHAIN
R I SK O W NE RSheena Mackay
T R E NDNo change
IN C L U D E D IN V I A BIL I T Y A S SE S SME N T:
R E L AT I O N SHIP T O O T HE R P R IN C IPA L R I SK S
Timely, efficient supply of raw materials and purchased components is critical to our ability to deliver to our customers. Manufacturing and supply chain continuity are exposed to external events that could have significant adverse consequences, including natural catastrophes, civil or political unrest, changes in regulatory conditions, terrorist attacks and disease pandemics – this applies to our own manufacturing sites and those of our key component suppliers.
Disease pandemics were highlighted as a key component of this risk in FY2019 and in prior reports. Following the COVID-19 pandemic, a new principal risk was added capturing not only the supply chain impacts of the risk, but other consequences and our responses. See risk 1.
How this could impact our strategy or business model – Inability to deliver products/solutions to customers, impacting financial performance and reputation
Examples of how we manage this risk – Supply excellence pillar of our SES operating model delivers increased focus on efficient, resilient and cost-effective supply
– Business continuity and disaster recovery plans in place and tested for critical locations
– Regular evaluation of key sites for a range of risk factors using externally benchmarked assessments – risk reduction measures for critical products and dual manufacturing capabilities
– Mitigation plans for sole source suppliers, sub-contractors and service providers developed and deployed by divisions to include qualification of alternative sources of suppliers where appropriate
– Property damage and business interruption insurance
Examples of how we know the controls are working effectively – Business continuity planning (BCP) testing and results
– Mitigation plans reviewed and reported by divisions
– Externally provided business interruption risk surveys of operational sites
– Insurance requirements driven by the risk appetite of the Group and divisions is validated at least annually
2
Strong
Moderate

7 5S M I T H S G R O U P P L C A N N U A L R E P O R T F Y 2 0 2 0
2
2
3
4
5
67
8
9
10
11
12
13 1
2
3
4
5
67
8
9
10
11
12
13 1
11. MARKE TS
R I SK O W NE RRoland Carter
T R E NDNo change
IN C L U D E D IN V I A BIL I T Y A S SE S SME N T:N/A
R E L AT I O N SHIP T O O T HE R P R IN C IPA L R I SK S
A significant proportion of our revenue comes from the US and European markets, with a notable proportion coming from governments. In addition to geographical markets, there is a risk we do not focus on attractive sectors where we have, or could have, a sustainable position.
How this could impact our strategy or business model – Failure to develop other markets and geographies impacts strategic progress and financial performance
– Significant disruption to government budgets results in fewer contracts being awarded to Smiths, impacting financial performance
Examples of how we manage this risk – A diversified portfolio of businesses mitigates exposure to any one country, sector or customer
– Growth strategy which places emphasis on expanding operations in higher-growth markets and regions which are currently underserved, including Asia
– Strategic process to capture continuing opportunities in current and adjacent markets
– Government relations function which collaborates with colleagues across the Group to advise on developments
– More resilient services and consumable components built into some of our government-related business
Examples of how we know the controls are working effectively – Strong and long-term customer relationships provide assurance
– Managing Director councils established in India and China
– Carefully crafted JV and Partnership arrangements in China
1
Strong
Moderate
12. E THICAL BRE ACH
R I SK O W NE RMel Rowlands
T R E NDNo change
IN C L U D E D IN V I A BIL I T Y A S SE S SME N T:
R E L AT I O N SHIP T O O T HE R P R IN C IPA L R I SK S
We have more than 22,000 employees in more than 50 countries. Individuals may not all behave in accordance with the Group’s values and ethical standards. We operate in highly regulated markets requiring strict adherence to laws with risk areas including:
– Bribery and corruption; – Anti-trust matters; – International trade laws and sanctions; – Human rights, modern slavery and international labour standards;
– General Data Protection Regulation (GDPR); and
– Government contracting regulations.
How this could impact our strategy or business model – Failure to comply with export regulations leads to significant fines and a loss of export privileges
– Failure to meet strict conditions within government contracts, particularly in the US, could have serious financial and reputational consequences
– Increased risk of illegal anti-competitive activity such as collusion with competitors
– US fines and penalties imposed for price fixing, bid rigging and other cartel-type activities can exceed $100m per violation
– Ethics or compliance breach causes harm to our reputation, financial performance, customer relationships and our ability to attract and retain talent
Examples of how we manage this risk – Group-wide ethics framework which includes our values, the Code of Business Ethics and the Supplier Code of Conduct
– Policies and procedures to mitigate distributor and agent related risks including due diligence, contractual controls and internal approvals
– Anti-bribery and corruption training for all employees supported by the ‘Speak Out’ line encouraging the reporting of ethics violations (includes ability to report anonymously and a non-retaliation policy)
– Reporting and investigation mechanisms – Anti-trust training programmes and guidance
– Network of trade compliance officers across the Group who monitor upcoming changes in regulation and oversee import and export activities
– Monitoring and acting on upcoming legislative changes
– Modern Slavery and Transparency Statement and procedures to reduce the risk of modern slavery within the Group and our supply chain
– Multi-functional programme for GDPR compliance
Examples of how we know the controls are working effectively – Multiple sources to assess culture including My Say results, ‘Speak Out’ reports, internal audit findings, exit interviews and ethics questions in performance reviews
– Monitoring and reporting on compliance with ethics and compliance policies
– Tracking of online ethics training and compliance modules
– Reporting non-compliance cases to business, Executive and Audit & Risk Committees
2
Strong
Moderate

7 6 S M I T H S G R O U P P L C A N N U A L R E P O R T F Y 2 0 2 0
S T R A T E G I C R E P O R T
2
3
5
67
8
9
10
11
12
113
R I S K M A N A G E M E N T C O N T I N U E D
13. CONTR ACTUAL OBLIGATIONS
R I SK O W NE RMel Rowlands
T R E NDNo change
IN C L U D E D IN V I A BIL I T Y A S SE S SME N T:N/A
R E L AT I O N SHIP T O O T HE R P R IN C IPA L R I SK S
We may fail to deliver the products and services, or fail in our contractual execution due to delays or breaches by our suppliers or other counterparties.
How this could impact our strategy or business model – Production delays, unexpected increases in costs of materials, freight, quality and warranty issues resulting from differences between estimated and actual costs in our medium and long-term contracts
– Breach of contract resulting in significant expenses due to disputes and claims, loss of customers, damage to our reputation with other customers/prospective customers, and loss of revenue and profit due to higher costs, liquidated damages or other penalties
– Contracts, particularly those with governments, may include terms that provide for unlimited liabilities, including for loss of profits, IP indemnities, perpetual warranties or allowing the counterparty to cancel, modify or terminate unilaterally and seek alternative sources of supply at our expense
Examples of how we manage this risk – Contracts managed and delivered by programme management teams that regularly review risks and take appropriate action
– Review and approval process for significant and higher-risk contracts in place at Group and divisional levels
– Diversified nature of the Group mitigates exposure to any single contract
– Programmes in place across the Group which harmonise the contract review process
– Cross-divisional US Government working group determines and shares best practice on government contracting
Examples of how we know the controls are working effectively – Divisional legal teams embedded in the business, working cross-functionally throughout the contract lifecycle
– Review and approval process for contracts determined by adherence to the Delegation of Authority matrix
– Insurance programme tailored to reflect the risk appetite of the Group
– Uniform diligence and contracting process in place for agents and distributors
2
Strong
Moderate
Principal risks and uncertainties continued
4

7 7S M I T H S G R O U P P L C A N N U A L R E P O R T F Y 2 0 2 0
2
G O I N G C O N C E R N A N D V I A B I L I T Y S T A T E M E N T
Going Concern and Viability Statement
The Group’s business activities, together with the factors likely to affect its future development, performance and position are set out in the Strategic Report on pages 06-80. The financial position of the Company, its cash-flows, liquidity position and borrowing facilities are described on pages 18-21. In addition, the notes to the financial statements include the Company’s objectives, policies and processes for managing its capital; its financial risk management objectives; details of its financial instruments and hedging activities; and its exposures to credit risk and liquidity risk.
The Group has undertaken a detailed going concern review with a severe but plausible downside scenario taking into account everything that has been learnt since March 2020.
At 31 July 2020 the net debt of the Group was £1,141m, a £56m decrease from 31 July 2019. At the end of July the Group had available cash and short-term deposits of £386m. These liquid resources are immediately available with 91% invested with the Group’s global banking partners. The Group’s debt profile shows an average maturity of 4.2 years (from 5.2 years at 31 July 2019). There are no scheduled repayments of debt due until October 2022.
The Group maintains a core US$800m committed revolving credit facility from these banks which was undrawn at 31 July 2020 and which has not been drawn since its last renewal in November 2017. US$110m of this committed facility matures in November 2023 and US$690m in November 2024. This facility has an interest cover financial covenant, however this is not forecast to prevent utilisation at the Group’s discretion if required.
The Directors, having made appropriate enquiries, have a reasonable expectation that the Company and the Group have
adequate resources to continue in operation for a period of at least twelve months from the date of this report. Thus they continue to adopt the going concern basis of accounting in preparing the financial statements of the Company and the Group.
In accordance with the requirements of the 2018 UK Corporate Governance Code, the Directors have assessed the longer-term prospects of the Group, taking into account its current position and a range of internal and external factors, including the principal risks detailed on pages 69 to 76 (the ‘viability assessment’).
The Directors have determined that a three-year period to 31 July 2023 is an appropriate timeframe for the viability assessment. The selected period is considered to be appropriate as, based on the historical performance of the Group, a three-year outlook represents an optimum balance of long-term projection and acceptable forecasting accuracy. The three-year viability assessment timeframe also takes into account considerations such as the maturity of the Group’s borrowing facilities and the cyclicality of the performance of the Group’s underlying markets. In making this viability assessment, the Directors have considered the current financial position and prospects of the Group, including the current year business performance, the detailed operating plan for 2021 and forecasts for 2022 and 2023. Against these financial projections, the Directors took into account the principal risks (as outlined on pages 69 to 76) to develop a set of plausible scenarios (as set out overleaf) with potentially high-impact outcomes, and where relevant included the loss of revenue arising from the separation of Smiths Medical.
In addition to the scenario specific assumptions (detailed overleaf) the principal assumptions for this three-year viability assessment are as follows: – FY2021 forecasts are based on the detailed operating plan reflecting the actual FY2020 performance, including the impact of COVID-19;
– FY2022 & FY2023 are based on forecast percentage growth rates from the FY2021 forecast;
– Smiths Medical has not been included in the assumptions after January 2021;
– The severe but plausible downside scenario for the recurrence of COVID-19 disruption has been modelled assuming a significant decline in demand and supply chain disruption (as outlined in the going concern section on page 149); and
– No mitigating activities such as further restructuring or the access to additional financing have been reflected in the forecast estimates.
Consideration was then given to the magnitude of the gross risks and their potential impact, directly or indirectly, on the Group’s future performance and liquidity. The assessment included stress testing of the Group’s financial capacity to absorb the impact of such adverse events, either individually or in combination, and what mitigating actions the Group could take to respond to them in order to protect its business.
The Directors also considered the Group’s ability to raise additional liquidity. In performing this assessment the Directors have taken comfort from the diversity of the Group’s businesses across different markets, industries, geographies, products and customers and its performance in the recent six-month period when COVID-19 was impacting Group operations. In order to ensure consistency, the base case used for the three-year viability assessment has also been reconciled against divisional impairment review models.
With over 95% of revenue originating outside the UK, Brexit is not anticipated to have a significant impact on the Group’s operations or its financial position, therefore its impact on the going concern or viability assessments has been immaterial. See page 68 for more information.
Based on the robust assessment, the Directors confirm that they have a reasonable expectation the Group will remain viable for the period being assessed and will continue to operate and meet its liabilities as they fall due. The Directors have no reason to doubt that the Group will continue in business beyond the period under assessment.

7 8 S M I T H S G R O U P P L C A N N U A L R E P O R T F Y 2 0 2 0
S T R A T E G I C R E P O R TG O I N G C O N C E R N A N D V I A B I L I T Y S T A T E M E N T C O N T I N U E D
Scenarios modelled
Scenarios Link to principal risks Scenario-specific assumptions
Scenario 1A global event, such as COVID-19 disruption, leads to the enforced closure of key production sites for a two month period with ongoing supply chain disruption, low customer demand and recessionary circumstances extending into the following year.
COVID-19, Economy and geopolitics
– 25% fall in revenue across all divisions in FY2021 – against FY2020 performance
– Marginal FY2022 revenue increase over FY2021 but still amounting to 10% reduction from FY2020
– FY2023 revenue equal to FY2022 revenue at budgeted growth rates
– Days of Sales Outstanding (DSO) extended by 30 days over historical rolling average
– No mitigating activities such as restructuring and headcount reductions
Scenario 2One of John Crane’s mechanical seals is identified as faulty and the cause of an explosion at a major refinery causing the deaths of two staff and significant damage to the plant. John Crane is sued for the costs of repair and restoration of the plant in addition to the consequential losses of plant closure.
Product quality – Significant costs plus material one-off settlement payments in F20Y22
– Restoration costs spread over the three-year assessment period
– Insurance claim rejected
Scenario 3Following a product cyber-attack, a terrorism-related incident occurs at a US airport. As a consequence, the US Government revokes Smiths Detection’s licence. Sales of Smiths Detection’s products to the US military and all other governmental contracts are banned and due to the reputational damage, the impact of the ban spreads to all other divisions.
Cyber security – Immediate loss of all US based Government contracts within Smiths Detection
– 25% fall in other Smiths Detection revenue over the three-year assessment period
– Loss of 50% of Smiths Interconnect’s North American revenue
– Material legal and settlement costs – Insurance claim under product liability is not met or delayed outside of the review period
Scenario 4Smiths Detection is found guilty of bribing government officials in Asian countries in order to land significant contracts. This damages the Group’s reputation and leads to worldwide regulators imposing significant sanctions on the Group.
Ethical breach – Material global regulatory fines – Loss of all future revenue in both China and Japan – 10% sales erosion in Smiths Detection’s US and EMEA markets due to reputational damage
– Severance and recruitment costs amounting to 20% of annual labour costs
– 10% fall in revenue within other Smiths businesses due to the reputational impact
Scenario 5An earthquake in Tijuana, Mexico renders Smiths Medical’s manufacturing facility unusable, causing severe disruption to production. Production temporarily relocated to US.
Integrated supply chain – Loss of six months’ US revenue and margin in FY2021
– Material refurbishment and repair costs in Mexico (net of insurance claims)
– Costs of relocating production to US – Capital expenditure on replacement equipment in Mexico (net of insurance claims)
– Labour costs increase due to US labour market being more expensive
Scenario 6Combination of scenarios 2 and 3.
Product quality and Cyber security
As above

7 9S M I T H S G R O U P P L C A N N U A L R E P O R T F Y 2 0 2 0
2
N O N - F I N A N C I A L I N F O R M A T I O N S T A T E M E N T
Non-Financial Information StatementThe table below sets out where information relevant to the Non-Financial Reporting Directive can be found in our FY2020 Annual Report.
Our Code of Business Ethics (the Code) underpins everything we do at Smiths. It applies our shared values and ensures we comply with all applicable international and local rules and regulations. It provides guidance, including through real-life scenarios, to help colleagues address challenging and ethical issues they may encounter at work. The Code is available on our website, and our Group policies support and enhance our behaviour in line with the principles set out in the Code.
Additional information about the areas covered in this Non-Financial Information Statement can be found in the Resources and relationships section on pages 24-51.
Reporting requirement Policies and standards which govern our approach Relevant information Page
Environmental matters Conflict Minerals PolicyEnvironmental Emissions Reduction PolicyHealth, Safety and Environmental PolicyHSE Audits PolicyHSE Management Systems PolicyHSE Reporting PolicyHSE Roles and Responsibilities PolicyHSE Technical Minimum Standards Policy
Production and environment
40-45
Employees Fair Employment PolicyGlobal Mobility Assignment PolicyRecruitment Policy
Our people 27-33
Human rights Human Rights PolicyModern Slavery and Human Trafficking StatementTransparency in the Supply Chain Statement
Our communitiesEthics and our values
48-5026
Social matters Data Protection and Privacy PolicyData Protection Code of Conduct
Government and regulators
51
Anti-corruption and anti-bribery Agreements with Agents and Distributors PolicyAnti-Corruption PolicyAnti-Facilitation of Tax Evasion PolicyChina Anti-Bribery and Corruption PolicyFacilitation Payments PolicyGifts, Meals and Hospitality PolicyInvitations to Government Officials PolicySupplier Code of Conduct
Government and regulators
51
Business model Our business model 6-7
Principal risks and impact of business activity
Risk Management 67-78
Non-financial key performance indicators
Key performance indicators
22-23
Smiths operates an effective ‘Speak Out’ line and encourages its employees and other stakeholders to use it (anonymously if required) to report any ethics issues or concerns. This is critical to assessing the effectiveness of its policies. All reports to the ‘Speak Out’ line are investigated, and metrics associated with reporting monitored.
In FY2020 we reviewed the effectiveness of certain of our policies, including:
– Regularly auditing expenses to check that, where appropriate, they were registered in the Gifts, Meals and Hospitality Register
– Providing PwC’s ‘blind spots’ unconscious bias training to all colleagues with a Smiths or a divisional email address worldwide, in support of our Diversity & Inclusion commitment
– Launching an information resource accessible to all colleagues to raise awareness of the requirement to conduct due diligence on new recruitment suppliers
– Launching a cross-divisional Career Returners Programme in the UK, focused on enhancing colleague diversity in specific functions
– Initiating a formal review of our global policies and processes in the area of international global mobility assignment management
– Conducting our first climate risk sensitivity assessment across the divisions and the global business as a whole for both five and 20 year horizons, in support of our Environmental Emissions Reduction Policy

8 0 S M I T H S G R O U P P L C A N N U A L R E P O R T F Y 2 0 2 0
S T R A T E G I C R E P O R T
The Strategic Report was approved by the Board on 23 September 2020.
By order of the Board
Andy Reynolds SmithCHIEF EXECUTIVE
Section 172 Statement The Board, in line with their duties under section 172 of the Companies Act 2006, must act in the way they consider, in good faith, would most likely promote the success of the Company for the benefit of the shareholders. Our Directors must also have regard to the likely long-term consequences of their decisions, and the impact that these may have on the Company’s key stakeholders. Further information about how these duties have been applied can be found throughout the FY2020 Annual Report:
Section 172 duties Key examples Page
Consequences of decisions in the long term
Our StrategyCase study: Decision-making: Delay to the separation of Smiths MedicalCase study: Stakeholder engagement: Response to COVID-19Board activity in FY2020Strong Financial FrameworkGoing Concern and Viability StatementPrincipal Risks
15-219395
92-9518-2177-7869-76
Interests of employees Chief Executive Q&AOur people
11-1327-33
Fostering business relationships with suppliers, customers and others
Our customersOur supply chainDivisional reviews
34-3646-4752-66
Impact of operations on the community and the environment
Technology and innovationProduction and environmentOur communitiesGovernments and regulators
37-3940-4548-50
51
Maintaining high standard of business conduct
Ethics and our valuesNon-Financial Information Statement
2679
Acting fairly between members Shareholder engagement 94
The table on pages 90-91 sets out our key stakeholder groups and how they were engaged with directly and indirectly by the Board throughout the year. The Board activity report on pages 92-95 details how the Board considered the views of our key stakeholders in their decision-making.
S E C T I O N 1 7 2 S T A T E M E N T

3
8 1S M I T H S G R O U P P L C A N N U A L R E P O R T F Y 2 0 2 0
GOVERNANCEDIRECTORS’ BIOGR A PHIE S
CH A IRM A N’S INTRODUCTION
BOA RD GOV ERN A NCE
BOA RD ACTI V IT Y IN F Y2020
+ Page 84
+ Page 82
+ Page 88
+ Page 92
ENGAGEMENT W ITH S TA K EHOLDERS+ Page 90
NOMINATION & GOVERNANCE COMMIT TEE REP ORT+ Page 96
AUDIT & RISK COMMIT TEE REP ORT
REMUNER ATION COMMIT TEE REP ORT
DIRECTORS’ REP ORT
S TATEMENT OF DIRECTORS’ RE SP ONSIBIL IT IE S
+ Page 102
+ Page 108
+ Page 130
+ Page 132

8 2 S M I T H S G R O U P P L C A N N U A L R E P O R T F Y 2 0 2 0
G O V E R N A N C EC H A I R M A N ’ S I N T R O D U C T I O N
This section of the Annual Report covers our governance arrangements, the operation of the Board and its Committees, and describes how the Board discharged its collective responsibilities over the past year. Corporate governance is defined as “the system by which companies are directed and controlled. Boards of directors are responsible for the governance of their companies. The shareholders’ role in governance is to appoint the directors and the auditors and to satisfy themselves that an appropriate governance structure is in place”.
Corporate systems and structures across the world were understandably put under strain by the largely unexpected events of the last year. Your Board and its Committees have adapted, as we all did, to rapidly changing circumstances and new challenges and demands. Swiftly changing business outlooks, forecasts, supply chain issues and ensuring employee safety caused the Board to meet much more regularly than usual in the past few months.
However, it continues to be essential to give management the time and space to manage the business, while being there to offer advice and support when needed. How we did that is explained in the next few pages of this Report. I am grateful to my fellow Directors, Smiths employees and all our stakeholders for their support as we continue to navigate our way through this crisis.
The restrictions on travel and meeting sizes imposed around the world adversely affected plans for increasing our face-to-face stakeholder engagement in the year. But they also accelerated a transition to new ways of working and interactions within the Company and with stakeholders more broadly. The Directors engaged in numerous electronic meetings with investors, employees, customers and stakeholders more generally.
Adapting to rapidly changing circumstances and new challenges and demands.
Chairman’s introduction
Naturally, there is greater use of videoconferencing, but we feel there is still no better way of engaging with people than by meeting them face-to-face. Inevitably, some changes in the way we work will be temporary, while others are likely to become more permanent. We use a variety of electronic communications channels now widely available for business meetings and collaboration. However, we still feel these electronic meetings should be used to complement, not entirely replace, visits to sites and stakeholders as these increase the Directors’ knowledge and understanding of the business and its culture, but also importantly their visibility. These visits are especially helpful to Directors who are new to the Group. The Board is regularly refreshed with new members, and this is appropriately balanced by keeping the experience and knowledge of others, and you can see on page 98 that we now have the right balance of recent recruits and seasoned professionals.
Diversity of thought, background, national origin, gender and ethnicity is as vital for an effective Board as it is in other aspects of life, and I am pleased to report that we have made good progress in this area. We have met or exceeded all internal and external guidelines on diversity, and excitingly, some Directors are filling their first such role in a UK public company. This widens the available talent pool for Non-executive Directors and helps development at their parent companies and beyond.
In September we announced that Bruno Angelici and Olivier Bohuon would be retiring from the Board at the conclusion of the 2020 AGM. During his ten years service Bruno has provided an invaluable contribution to the Company and I would like to thank him for his wise counsel and unstinting hard work. While with us for a shorter period of time, Olivier’s deep knowledge of the healthcare field has been very impactful and we are grateful to him for everything he has done for us. On behalf of all the Directors and management I wish them every success in the future. More details on our succession planning are set out in the Nomination & Governance Committee Report.
I hope the following pages provide you with an insight into our work on your behalf. We are always interested to hear your thoughts on all our activities and governance is a key one of those.
Sir George BuckleyCHAIRMAN

8 3S M I T H S G R O U P P L C A N N U A L R E P O R T F Y 2 0 2 0
3
UK Corporate Governance Code ComplianceIn FY2020 the Company applied the Principles, and at the date of this report, complied with all Provisions of the UK Corporate Governance Code 2018 (the 2018 Code) in full. During the period the Company confirmed its post-employment shareholding policy in accordance with Provision 36. You can read more about this on page 111. Our Board considers that appropriate governance standards were in place throughout the year, as explained throughout this Report and set out below. A copy of the 2018 Code is available from the Financial Reporting Council’s website at frc.org.uk.
Board Leadership and Company Purpose Find out more about the members of our Board on pages 84-87
Division of responsibilities Read about our governance framework, stakeholder engagement and Board activity in FY2020 on pages 88-95
Composition, Succession and Evaluation Our report from the Nomination & Governance Committee and information about the FY2020 Board evaluation process can be found on pages 96-101
Audit, risk and internal control The Audit & Risk Committee report begins on page 102 and the Risk Management section is on pages 67-76
Remuneration The Directors’ Remuneration Report begins on page 108
The Board recognises the value and importance of workforce engagement in support of delivering the Group’s long-term strategic objectives and is committed to understanding and learning from the views of all our stakeholders. As reported to you last year, the Board agreed that I, as your Senior Independent Director, would be responsible for ensuring that the Board engages effectively with our workforce.
Due to the operational and geographic diversity of the Group, the Board agreed that each Non-executive Director would engage with the workforce on a functional basis, to better leverage their individual expertise and skills. Each Non-executive Director was also allocated a geographic region where they would take the co-lead on workforce engagement. To supplement this it was agreed that each Non-executive Director would also independently visit at least one site in the year.
COVID-19 has had a significant impact on our planned engagement activities including the cancellation of Smiths Day which was earmarked as a key Group-wide opportunity for Directors to meet with the workforce to discuss and understand how our culture and values are embedded.
Prior to travel restrictions being introduced, in FY2020 our Non-executive Directors visited a number of sites and met with employees at Flex-Tek in France, John Crane in the UK and the Digital Forge in the US. The intention was that the majority of site visits would take place in the second half of the year, from March onwards, and although this was not possible the Chairman and Directors have instead used other methods of engagement. These have included webcasts, videoconference meetings with employees from across the Group and two-way Q&A town halls. The videoconference meetings have varied in size from whole functions to three or four employees and sometimes one-on-one
meetings. We will continue to use these methods in FY2021 and will resume site visits when travel restrictions are lifted, always bearing in mind that the safety and wellbeing of our workforce is a key priority.
Engagement during these uncertain times has been crucial for ensuring the Board’s decision-making is as well informed as it can be and for ensuring that the workforce knows that we are aware of and appreciate their efforts to keep the business operating effectively. More information on our specific engagement activities with the workforce and other stakeholder groups is set out on pages 90-91.
All of the Board welcome and value feedback and so I thank those members of the workforce who have taken the time to engage with us and would encourage others to do so. We look forward to continuing our activities to further understand the culture in the business.
A MESSAGE FROM BILL SEEGER ON WORKFORCE ENGAGEMENT

8 4 S M I T H S G R O U P P L C A N N U A L R E P O R T F Y 2 0 2 0
G O V E R N A N C ED I R E C T O R S ’ B I O G R A P H I E S
Sir George Buckley Andy Reynolds Smith John ShipseyChairmanAppointed: 1 August 2013
N R I
Sir George has extensive experience of large, multi-industry businesses operating in global markets, and has had a long career in engineering and innovation. As Chairman, Sir George ensures effective communication with stakeholders, and that the Board provides leadership and guidance for executive management, especially with regard to the Group’s response to the COVID-19 pandemic. Sir George’s previous roles, including as Chairman and CEO of 3M, a US-based global technology company and Dow Jones 30 component, support his effective chairmanship of the Board. His other previous experience includes Chairman and CEO of Brunswick Corporation. Sir George currently serves as Non-executive Chairman of Stanley Black & Decker, Inc. and Non-executive Director of Hitachi Ltd. He has a PhD in Electrical Engineering.
on appointment as Chairman
Chief ExecutiveAppointed: 25 September 2015
Andy brings in-depth industry knowledge to the Board and spent over a decade at GKN plc, a complex global engineering group, prior to joining Smiths. At GKN plc he was Chief Executive of the Automotive division and a member of the Board from 2007. Earlier in his career, Andy held senior management roles at Ingersoll Rand, Siebe plc (now Schneider Electric) and Delphi Automotive Systems. His previous experience also includes a non-executive directorship at Morgan Advanced Materials, Chairman of the CBI Manufacturing Council and membership of the Government Ministerial Advisory Group for Manufacturing and green economy.
Chief Financial OfficerAppointed: 1 January 2018
John has valuable experience leading innovative companies, and prior to joining Smiths was Chief Financial Officer for Dyson, a diversified global technology company. At Dyson he was part of the team that lead their global growth, particularly in Asia. His previous experience includes 13 years at Diageo plc, a multinational alcoholic beverages company, in a number of senior finance and strategy roles. This included Finance Director for its Iberia region and Chief Financial Officer of Schieffelin & Somerset, a US joint venture between Diageo and LVMH. John is a Chartered Accountant.
The Board is collectively responsible for the long-term success of Smiths and the delivery of sustainable stakeholder value.
Our Board

8 5S M I T H S G R O U P P L C A N N U A L R E P O R T F Y 2 0 2 0
3
Bill Seeger Bruno Angelici Olivier BohuonSenior Independent DirectorAppointed: 12 May 2014
A N R I
Bill had a successful career in finance in the engineering sector and was Group Finance Director at GKN plc, a global engineering group, until 2014. As Senior Independent Director Bill has been responsible for ensuring the Board engages effectively with the workforce over the year and as chair of the Remuneration Committee for leading the Committee’s discussions on ensuring that developments in remuneration practices are considered and where appropriate acted upon. At GKN he also held the roles of CEO of the Propulsion Systems Division, and CFO of the Aerospace Division. Earlier in his career Bill spent 30 years at TRW, a US-based automotive and aerospace group, where he held various senior finance positions. This extensive experience in global engineering businesses supports his participation in robust decision-making by the Board. Bill has a BA in Economics and an MBA.
Other significant appointments – Senior Independent Director, Spectris plc
– Lecturer, UCLA Anderson School of Management
Non-executive DirectorAppointed: 1 July 2010
A N R I
Bruno will step down from the Board at the conclusion of the 2020 AGM and will not be standing for re-election.
During his career Bruno has held senior management roles in global pharmaceutical and medical device companies, bringing a deeper understanding of the healthcare environment and industry to the Board. This experience has enabled him to provide invaluable advice to the Group especially in relation to Smiths Medical. Until his retirement in 2010, Bruno was Executive Vice President, International, at AstraZeneca, where he was responsible for Europe, Asia Pacific, Latin America and MEA. Bruno has a degree in Law from Reims University and an MBA from Kellogg School of Management, Chicago.
Other significant appointments – Non-executive Chairman, Vectura Group plc
Non-executive DirectorAppointed: 1 July 2018
A N R I
Olivier will step down from the Board at the conclusion of the 2020 AGM and will not be standing for re-election.
Olivier has significant executive experience at global pharmaceutical and MedTech companies, enabling different perspectives to be considered during Board discussions. His knowledge of the MedTech industry has been especially useful regarding the Group’s plans for the separation of Smiths Medical. Prior to joining Smiths, Olivier was Chief Executive at Smith & Nephew plc, a multinational medical equipment manufacturing company. His previous roles include CEO at Pierre Fabre Group and President of Abbott Pharmaceuticals. Olivier is a member of the French Academy of Pharmacy and the French Academy of Technologies. He has an MBA and a doctorate in Pharmacy.
Other significant appointments – Non-executive Chairman, LEO Pharma
– Non-executive Director, Takeda Pharmaceutical Company Limited
– Non-executive Director, Virbac SA
Key
A Audit & Risk Committee member
N Nomination & Governance Committee member
R Remuneration Committee member
I Independent Director
Committee Chair

8 6 S M I T H S G R O U P P L C A N N U A L R E P O R T F Y 2 0 2 0
G O V E R N A N C ED I R E C T O R S ’ B I O G R A P H I E S C O N T I N U E D
Our Board continued
Pam Cheng Dame Ann Dowling Tanya FrattoNon-executive DirectorAppointed: 1 March 2020
A N R I
Pam will stand for election by shareholders at the AGM .
Pam is Executive Vice-President, Operations and Information Technology at AstraZeneca plc, a multinational pharmaceutical and biopharmaceutical company. Pam’s experience in manufacturing, supply chain and technology in large global businesses further strengthens the Board’s discussions on embedding world-class operations. In 2020 she provided valuable assistance and advice on supply chain logistics during COVID-19 and supported our celebration of International Women in Engineering Day. Pam’s previous roles include President of MSD (Merck & Co., Inc.) in China and Senior Vice President of Global Supply Chain Management & Logistics for Merck globally. Pam also held various engineering and project management positions at Universal Oil Products, Union Carbide Corporation and GAF Chemicals. Pam holds Bachelor’s and Master’s degrees in chemical engineering and has an MBA.
Non-executive DirectorAppointed: 19 September 2018
A N R I
Dame Ann is a Deputy Vice Chancellor and an emeritus professor of Mechanical Engineering at the University of Cambridge. She has had a distinguished academic career, and her contribution to engineering research and the practical application of new technology in industry is internationally recognised. Dame Ann has used her wide experience to inspire Smiths employees, including through her attendance at the John Crane’s Professional Women’s Network and her involvement in our support for International Women in Engineering Day. Dame Ann’s knowledge and background offer a different perspective to Board discussions, and her previous roles include five years as Head of Engineering at the University of Cambridge, and President and Chairman of Trustees of the Royal Academy of Engineering. Dame Ann has a degree in mathematics and a PhD in engineering.
Other significant appointments – Non-executive Director, BP plc
Non-executive DirectorAppointed: 1 July 2012
A N R I
Tanya has had a successful career running businesses over a 20+ year career with General Electric Corporation, a multinational conglomerate. Prior to joining the Smiths Board, she was the CEO of Diamond Innovations Inc, a manufacturer of industrial diamonds. In addition to her experience in manufacturing and operations, she brings insight into product innovation, sales and marketing across a range of sectors and an extensive knowledge of operating in the US, to Board discussions. As one of the longest serving members of the Board she has a deep knowledge of the Group and supported our celebration of International Women in Engineering Day. She is a qualified electrical engineer and has a BSc in Electrical Engineering.
Other significant appointments – Non-executive Director, Advanced Drainage Systems, Inc.
– Non-executive Director, Ashtead Group plc
– Non-executive Director, Mondi plc
JOHN MILLSCompany Secretary Appointed: 1 June 2018
John has gained corporate governance and legal experience in a wide range of international businesses. He previously held senior roles in a variety of sectors, most recently at Anglo American plc, RSA Insurance Group plc and Cadbury plc. He has an LLB and is a Fellow of the ICSA: Governance Institute and a qualified solicitor.

8 7S M I T H S G R O U P P L C A N N U A L R E P O R T F Y 2 0 2 0
3
Karin Hoeing Mark Seligman Noel TataNon-executive DirectorAppointed: 2 April 2020
R I
Karin will stand for election by shareholders at the AGM .
Karin Hoeing is Group Human Resources Director at BAE Systems plc, bringing current executive experience of defence, security, and aerospace to the Board. Since joining the Board she has provided valuable assistance and advice on people issues during the COVID-19 crisis and joined us in celebrating International Women in Engineering Day. Prior to joining BAE she led one of the major international business divisions at Schlumberger, a multinational oil services company. Karin spent 20 years at Schlumberger, where she held a number of senior HR, marketing, technology and line management leadership positions across Europe, the Middle East and Asia. Karin has a Diploma Geophysics degree.
Non-executive DirectorAppointed: 16 May 2016
A N R I
Mark’s extensive experience in corporate finance and capital markets supports Board discussion of the Group’s portfolio management. In 2020 he has engaged with a cross-divisional range of employees working in Finance and as Chair of the Audit & Risk Committee he led their oversight of the financial impacts of COVID-19 and the Group’s response to it. He is a former senior investment banker and during his executive career he held various roles at Credit Suisse, including Chairman of UK Investment Banking. Mark also brings his non-executive experience to the Board, having served as senior independent director and audit committee chairman at various FTSE 100 companies. Mark is a Chartered Accountant, and has an MA in Philosophy, Politics and Economics.
Other significant appointments – Senior Independent Director, Kingfisher plc
– Senior Independent Director, NatWest Group plc (formerly The Royal Bank of Scotland Group plc)
– Alternate member, Panel on Takeovers and Mergers for the Association for Financial Markets in Europe
Non-executive DirectorAppointed: 1 January 2017
A N R I
Noel has had a successful career in global business. He has extensive experience of the high-growth economies which are key markets for our growth strategy and has been invaluable in developing key strategic relationships in Asia since joining the Board. He is the Managing Director of Tata International Limited, a global trading and distribution company and a trading arm of the Tata Group, a privately-owned multinational holding company. Noel has a BA in Economics.
Other significant appointmentsWith the exception of Kansai Nerolac Paints Ltd, each of the following companies forms part of the Tata Group.
– Non-independent, Non-executive Chairman, Tata Investment Corporation
– Non-independent, Vice Chairman, Titan Company Ltd
– Non-independent, Non-executive Chairman, Trent Ltd
– Non-independent, Non-executive Chairman, Voltas Ltd
– Non-executive director, Kansai Nerolac Paints Ltd
NO OTHER DIRECTORS SERVED DURING FY2020.
Key
A Audit & Risk Committee member
N Nomination & Governance Committee member
R Remuneration Committee member
I Independent Director
Committee Chair

8 8 S M I T H S G R O U P P L C A N N U A L R E P O R T F Y 2 0 2 0
G O V E R N A N C EB O A R D G O V E R N A N C E
BOARD COMMITTEES
E XECUTI V E M A N AGEMENT COMMIT TEE S
GOV ERN A NCE MODEL
BOA RD
C H A IR M A N
C HIE F
E X EC U T I V E
SE NI O R IND E P E ND E N T
D IR EC T O R
N O N - E X EC U T I V E D IR EC T O R S
C O MPA N Y
SEC R E TA RY
Responsible for: – Advising the Board on governance matters
– Supporting the Chairman in the efficient and effective functioning of the Board and its Committees
– Ensuring the Board receives quality information in a timely manner
Responsible for: – Providing constructive challenge and strategic guidance to Board discussions
– Oversight of management and the business, including culture
– Offering specialist advice
– Assessing the effectiveness of systems of internal control and risk management
Responsible for: – Supporting the Chairman in the delivery of the Board’s objectives
– Being available to shareholders if they wish to raise any concerns
– Acting as an intermediary between the other Directors if necessary
– Overseeing workforce engagement
Responsible for: – Developing and proposing strategy to the Board
– Setting and communicating the culture, values and behaviours for the Group
– Leading the Executive Committee
– Managing relationships with our key stakeholders
Responsible for: – Ensuring the Board’s continued effectiveness
– Shaping boardroom culture and encouraging individual Director engagement
– Leading the Board and setting the Board agenda
– Leading the annual Board evaluation
BOA RD COMMIT TEE S
N O MIN AT I O N & G O V E R N A N C E C O MMI T T E E
Reviews and makes recommendations to the Board on the structure, size and composition of the Board and its Committees, and leads
the process for Director appointments and Director and senior management
succession planning.
Oversees the ongoing suitability of the Group’s governance framework and diversity
& inclusion performance.
AU D I T & R I SK C O MMI T T E E
Ensures the integrity of the Group’s financial reporting and audit processes, and the
maintenance of sound internal control and risk management systems.
Manages the relationship with the external auditor, including making recommendations to the Board and shareholders in relation to the appointment and re-appointment of the
external auditor.
R E M U NE R AT I O N C O MMI T T E E
Responsible for the Group’s remuneration strategy and reviews and oversees the
Group’s Remuneration Policy for the Directors and senior management.
Reviews any major changes in Group employee remuneration structures, including incentive arrangements that apply across the
wider employee population.
E X EC U T I V E C O MMI T T E E
Assists the Chief Executive in discharging his responsibilities
and collectively responsible for implementing strategy,
ensuring consistent execution and embedding the culture and values.
IN V E S T ME N T C O MMI T T E E
Assesses high-value and high-risk proposals, capital expenditure,
asset disposal and special revenue expenditure projects which require Chief Executive or Board approval.
D I S C L O S U R E C O MMI T T E E
Advises the Chief Executive and the Board on the identification of inside information, and the timing
and method of its disclosure.
AC Q U I SI T I O N S & D I V E S T ME N T S C O MMI T T E E
Approves mergers, acquisitions, disposals and joint ventures within defined authority limits agreed by
the Board.
+ Read more on pages 96-101 + Read more on page 102-107 + Read more on pages 108-129
Board governanceThe Board is ultimately accountable to our shareholders, and the Directors are responsible for ensuring that management actions are aligned with their and other stakeholders’ interests. The Board has approved a governance framework of systems and controls in order to effectively discharge its collective responsibility. This framework supports our Directors’ compliance with their duty to promote the success of the Company under section 172 of the Companies Act 2006 (the Act). The framework, including the delegation of specific authorities to the Board’s three principal Committees, the Nomination & Governance, Audit & Risk and Remuneration Committees, is subject to ongoing review to ensure that it remains fit for purpose.

8 9S M I T H S G R O U P P L C A N N U A L R E P O R T F Y 2 0 2 0
3
The Board is responsible for approving Group strategy consistent with our purpose and for overseeing its implementation, and, subject to applicable legislation and regulation and the Articles of Association, they may exercise all powers of the Company. The Board ensure that the strategy is in line with our values, while monitoring the internal controls, risk management and viability of the Company and considering the views of stakeholders, including but not limited to shareholders, the workforce, customers, our supply chain and the community. The Chief Executive is responsible for preparing and recommending the strategy and for the day-to-day management of the Company, including leading the Executive Committee. Biographies for our Executive Committee can be found on page 14. Executive management implement the Group’s strategy and provide the Chief Executive, and the Board as a whole, with the information they need to make decisions that will determine the long-term success of the Group.
There is a schedule of matters which are considered significant to Smiths and have therefore been reserved for the decision of the Board. This is due to their strategic, financial or reputational implications or consequences. The formal schedule can be found on our website and includes approval of Group purpose, strategy, values, business plans and budgets and oversight of Group culture.
During COVID-19 the Board reviewed its ways of working and rapidly adapted to the changing circumstances, challenges and demands. As a result there are a number of enhancements to the ways in which the Board and its Committees operate which will continue or will be implemented over the coming months.
The Terms of Reference for the three Board Committees, which were reviewed during the year, can be found on our website. The Transaction Committee, which was established in FY2019 in order to provide support and oversight of the separation of Smiths Medical, continued to meet throughout the year. and reported to the Board on its activities. The Committee is an ad hoc committee of the Board and currently consists of three Non-executive Directors, Bill Seeger (Chair), Bruno Angelici and Mark Seligman. Its role is to provide strategic input to the Executive Team in
relation to the separation of Smiths Medical and to act as a conduit for communication with the rest of the Board to ensure that they are apprised of the progress made to date. Other attendees at Committee meetings are the Chairman, Executive Directors and members of the Executive Team and the Group’s financial advisers when appropriate. The Committee met on fourteen occasions during the year.
Board and Committee meetingsThe Chairman sets the agenda and determines the style and tone of discussions at Board meetings. At each scheduled Board meeting the Chief Executive and the Chief Financial Officer present separate reports, detailing business performance and progress against strategy. These are supplemented by regular performance updates from the Chief Executive to the Directors between meetings. Invitations to Board meetings are extended to divisional presidents, business managers and heads of functions when appropriate, to ensure that the Board is kept up to date with management priorities and challenges. The attendance of senior executives also supports executive succession planning. External advisers are invited to attend as necessary.
Director attendance at Board and Committee meetings in FY2020 is set out below. All Board meetings during the year took place in London or via videoconference. In line with usual practice, the Directors had been due to meet in other locations where Smiths has a presence, but these were cancelled due to restrictions arising from COVID-19.
Additional Board meetings were held to consider the Group’s response to COVID-19. Throughout the crisis the use of videoconferencing supported efficient and effective ongoing communication between the Chairman and the Chief Executive, the Executive Directors and executive management, and the entire Board. The Board will continue to use videoconferencing going forward as a cost effective and efficient means of discharging its duties.
To ensure the continued effectiveness of the Board, the Chairman meets the Non-executive Directors without the Executive Directors present after each Board meeting. He also has separate meetings with the Senior Independent Director and the Audit & Risk and Remuneration Committee Chairs on a regular basis and with each of the other Non-executive Directors at least annually. The Senior Independent Director consults with the other Non-executive Directors without the Chairman present at least annually.
Director attendance
Board1
Nomination & Governance Committee
Audit & Risk Committee
Remuneration Committee
ChairmanSir George Buckley 9/9 4/4 – 5/5
Executive DirectorsAndy Reynolds Smith 9/9 – – –John Shipsey 9/9 – – –
Non-executive DirectorsBruno Angelici 9/9 4/4 4/4 5/5Olivier Bohuon 9/9 4/4 4/4 5/5Pam Cheng2 5/5 3/3 2/2 3/3Dame Ann Dowling 9/9 4/4 4/4 5/5Tanya Fratto 9/9 4/4 4/4 5/5Karin Hoeing3 4/4 – – 2/2Bill Seeger 9/9 4/4 4/4 5/5Mark Seligman 9/9 4/4 4/4 5/5Noel Tata 9/9 4/4 4/4 5/5
1 During the year there were six scheduled Board meetings and three ad hoc meetings. All meetings were attended in full.
2 Pam Cheng joined the Board on 1 March 2020. Pam attended the Board and Audit & Risk Committee meetings in September and the Remuneration Committee meeting in November as part of her induction before she joined the Board.
3 Karin Hoeing joined the Board on 2 April 2020. Karin is not a member of the Nomination & Governance Committee or the Audit & Risk Committee.

9 0 S M I T H S G R O U P P L C A N N U A L R E P O R T F Y 2 0 2 0
G O V E R N A N C EE N G A G E M E N T W I T H S T A K E H O L D E R S
Our stakeholders Direct Board engagement in FY2020 Indirect Board engagement in FY2020
OUR PEOPLE
OUR CUSTOMERS
The Chief Executive had extensive engagement with the UK Government regarding Smiths involvement in the VentilatorChallengeUK Consortium
The Board had intended to meet in the United Arab Emirates in early 2020. The Board’s itinerary included visits to Smiths Detection and John Crane operations and meetings with the employees and customers of these divisions. Unfortunately, due to events in the region earlier in the year, the trip was cancelled
OUR SUPPLY CHAIN
OUR COMMUNITIE S
REGUL ATORS AND GOVERNMENTS
The Chief Executive engaged with the UK Government regarding the Group’s involvement in the VentilatorChallengeUK Consortium
As referred to above, a planned visit to the United Arab Emirates in early 2020 was cancelled. The Board were scheduled to meet with local government representatives and locally based UK Government officials
Formal reports to the Board included:
– Reports from the Chief Executive on the Group’s response to COVID-19
– Reports from the Chief Financial Officer on the potential implications of Brexit on the individual divisions and the impact of international tariffs on the Group
– Updates on the regulatory process for the approval of new products
OUR SHAREHOLDERS
Stakeholder engagement takes place across the Group, both operationally within Smiths and by the Directors themselves. This engagement is critical to the success of any business, and where the engagement is indirect the Board rely on management reports for assurance that the relationship is being managed effectively. Where a Non-executive Director has had direct stakeholder engagement they will provide feedback to the other Directors at the next Board meeting.
The outcomes of stakeholder discussions, including their needs and any concerns, are reported to the Board and Board Committees on a regular basis as part of their annual calendar of work. This enables the Directors to better understand how the Group’s culture and values are embedded across all aspects of the Group’s activities and supports informed decision-making.
Read Bill Seeger’s report on page 83 for more information about how the Board has engaged with the workforce during the year.
Stakeholder engagement by the Board
Our key stakeholders at Smiths are our people, our customers, our supply chain, the communities in which we operate, regulators and governments, and our shareholders.

9 1S M I T H S G R O U P P L C A N N U A L R E P O R T F Y 2 0 2 0
3
Our stakeholders Direct Board engagement in FY2020 Indirect Board engagement in FY2020
OUR PEOPLE
OUR CUSTOMERS
The Chief Executive had extensive engagement with the UK Government regarding Smiths involvement in the VentilatorChallengeUK Consortium
The Board had intended to meet in the United Arab Emirates in early 2020. The Board’s itinerary included visits to Smiths Detection and John Crane operations and meetings with the employees and customers of these divisions. Unfortunately, due to events in the region earlier in the year, the trip was cancelled
OUR SUPPLY CHAIN
OUR COMMUNITIE S
REGUL ATORS AND GOVERNMENTS
The Chief Executive engaged with the UK Government regarding the Group’s involvement in the VentilatorChallengeUK Consortium
As referred to above, a planned visit to the United Arab Emirates in early 2020 was cancelled. The Board were scheduled to meet with local government representatives and locally based UK Government officials
Formal reports to the Board included:
– Reports from the Chief Executive on the Group’s response to COVID-19
– Reports from the Chief Financial Officer on the potential implications of Brexit on the individual divisions and the impact of international tariffs on the Group
– Updates on the regulatory process for the approval of new products
OUR SHAREHOLDERS
Participation at the European Employee Forum which included a presentation on the role of a Non-executive Director
Attendance at a Smiths Innovation Strategy Board (SISB) meeting
Attendance at Human Resources team meetings and Q&A sessions
Participation at a Financial Controllers Club session, a cross-divisional Finance forum
The Chief Executive had extensive engagement with other companies and key suppliers to the Group to form the consortium which supported the VentilatorChallengeUK
A Non-executive Director provided support and guidance to the Operations and Supply Nerve Centre (OSNC) in respect of our response to COVID-19
The Board determined that it was important for the Smiths Medical division to be fully focused on responding to the COVID-19 crisis and supporting the communities in which we operate. This was a key part of the decision-making process which culminated in deciding to postpone the separation of Smiths Medical. See our case study on page 93 for more information
The Chief Financial Officer engaged regularly with the Group’s Pension Trustees
Director attendance and interaction with shareholders at the 2019 AGM
Board approval of the FY2019 final dividend and the decision not to declare the FY2020 interim dividend at the half year
The Chief Executive and the Chief Financial Officer hosted Results presentations and Q&A sessions and met with a broad spread of the Group’s capital providers
The Chairman met with certain individual shareholders in FY2020
Formal reports to the Board included:
– An in-depth review of people strategy, talent management, people risk and workforce engagement
– The Diversity & Inclusion Plan, including MySay survey results and inclusion dashboards
– ‘Speak Out’ updates and other reports and statistics related to the Group’s ethical policies and performance
The Chief Executive’s updates to the Board covered people matters
– The Audit & Risk Committee received reports on Ethics & Compliance, including modern slavery and human rights updates and compliance with our Supplier Code of Conduct
– The Audit & Risk Committee undertook a deep dive on the Integrated supply chain principal risk, including how we monitor suppliers’ financial strength, and how we ensured our own actions have not threatened the viability of key suppliers
– Divisional reports to each scheduled Board meeting included updates on supplier matters
Formal reports to the Board included:
– Health, safety and environment and security updates, including activities in connection with the Task Force on Climate-related Financial Disclosures (TCFD)
– Executive Environmental Roundtable discussions
– Updates from the business on elements of the Group’s operations which impact the wider community, including the Group’s tax strategy
Formal reports to the Board, included:
– Share register analysis, including the Group’s ADR Programme
– Financial metric reporting included the views of debt investors and the rating agencies
Feedback from investor roadshows was discussed by the Board
Analyst and broker briefings, and reports of meetings with major or prospective shareholders, were circulated to Directors outside the formal Board meeting schedule
Formal reports to the Board included:
– Reports from the Chief Executive on the Group’s response to COVID-19
– Divisional reports submitted to each scheduled Board meeting included updates on customers, competitors and market challenges. Divisional COVID-19 update reports included information on how customer relationships were being managed
The Audit & Risk Committee undertook a deep-dive on product quality

9 2 S M I T H S G R O U P P L C A N N U A L R E P O R T F Y 2 0 2 0
G O V E R N A N C EB O A R D A C T I V I T Y I N F Y 2 0 2 0
1
3
2
+ Read more about our Resources and relationships on pages 24-51
+ Read more about our strategy on pages 15-21
Discussion and decision making by the Board takes the views of key stakeholders into account while continuing to promote the Group’s long-term sustainable success.
People and cultureMatters considered – Updates on workforce matters throughout the COVID-19 crisis
– The strategic restructuring programme
– The continued embedding of the Smiths Way values through the Chief Executive’s updates to the Board. Unfortunately, due to COVID-19, the annual Smiths Day celebration of the Group’s values was cancelled. All Directors had been invited to visit local sites on the day
– The Group HR Director presented the People Plan to the Board, covering talent and succession planning
– Employee engagement through the employee MySay survey results
– Diversity & Inclusion Plan and gender pay gap reporting in the UK
Outcome – In response to COVID-19 both the Chairman and the Non-executive Directors and the Executive Committee produced “thank you” videos issued to all employees recognising their efforts during the year. The Chief Executive also led global town hall sessions with each of the divisions
– Approved the strategic restructuring programme
– A video was issued to all employees introducing the Directors and explaining their role and responsibilities, followed by a Non-executive Director video on International Women in Engineering Day
– Arranged one-on-one discussions with high-potential individuals in the business to assess our talent and senior management succession planning
Key stakeholders
Our people
Link to strategy
2 Deliver world-class competitiveness
Financial performanceMatters considered – Regular updates to the Board on the Group’s financial performance including its liquidity, cash management and conversion, profits and costs
– Stress-testing of the Group’s resilience and the allocation of capital and access to external capital were considered in light of COVID-19
– An update on the Group’s Tax strategy from the Chief Financial Officer and the Group Tax Director
– An update on the Group’s Treasury Strategy, liquidity and funding from the Chief Financial Officer and the Group Treasurer
– An update on the Group’s defined benefit pension arrangements from the Chief Financial Officer
Outcome – Approval of the FY2019 Results and the FY2020 Interim Results
– Approval of the FY2021 financial plan
– Declaration of the FY2019 final dividend and the decision not to declare the FY2020 interim dividend at the half-year
– Enhanced viability and going concern processes adopted in response to COVID-19
– Establishment of a £1bn Euro-commercial paper programme in response to COVID-19
Key stakeholders
Our shareholders
Our people
Our communities
Link to strategy
1 Outperform our chosen markets
3 Strong financial framework
Board activity in FY2020

9 3S M I T H S G R O U P P L C A N N U A L R E P O R T F Y 2 0 2 0
3
Strategic progressMatters considered – The usual Board meeting dedicated to strategy scheduled for May 2020 was postponed until FY2021 while the Group focused on its response to COVID-19. The Board continued to receive reports on the Group’s strategic progress over the year, in the light of external economic and geopolitical events
– Detailed information on the proposed structure and framework of the Group after the separation of Smiths Medical. The Directors considered potential markets, customers and future investment opportunities and received regular updates from the business, the Transaction Committee and advisers on the Smiths Medical separation process
– Oversight of M&A activity, including updates on acquisition and divestiture activities at each scheduled Board meeting
Outcome – Agreed to delay the separation of Smiths Medical. Please see the case study below for more information
– Discussions regarding the Smiths Medical separation commenced with the Pension Trustees, however, this was put on hold due to the separation being delayed
– Oversight of M&A activity, including the acquisition of Reflex Photonics by Smiths Interconnect, Access Scientific by Smiths Medical and PathSensors by Smiths Detection
– Approved the strategic restructuring programme
Key stakeholders
Our people
Our customers
Our supply chain
Our shareholders
Link to strategy
1 Outperform our chosen markets
DECISION-MAKING: DELAY TO THE SEPARATION OF SMITHS MEDICALOn 31 March we announced that there would be a delay to the separation of Smiths Medical. The separation was on track to complete by the end of the first half of 2020, but COVID-19 was creating increased economic uncertainty and after careful consideration the Board agreed that it would no longer be practicable to deliver value for all stakeholders in that timeframe. The Directors agreed that Smiths and Smiths Medical needed to focus on responding to the external challenges facing both the Group and the communities in which it operates.
During the first half of FY2020, the Board received regular updates on the work to prepare for the separation. The Transaction Committee, established in FY2019 and comprised of Non-executive Directors, met regularly between Board meetings to provide support and oversight of the separation process.
The decision to delay the separation impacted various stakeholders, including people working for Smiths Medical and the remaining Smiths Group, Smiths Group plc shareholders and the wider community. Financial markets and our customers had reacted positively to
the proposed separation. However, the Board collectively agreed the proposed timetable would no longer be viable in the circumstances. In addition, there was an increased opportunity to support the wider community in the production of ventilators and other critical care devices. Direct engagement with stakeholders was limited due to the sensitivity of information, and the rapidly evolving external environment.
An additional Board meeting was scheduled for April 2020 in order to discuss, among other things, the stakeholder response to the
announcement. The Directors considered the long-term consequences of their decision to delay and it continues to be the Board’s intention to separate Smiths Medical. In the short term it was necessary for Smiths Medical to focus on providing medical equipment, fulfilling this obligation in line with the Smiths culture and values. The Group’s purpose and long-term aim to become the world’s leading technology company was balanced with this, while the Directors considered their duty to promote the success of Smiths for the benefit of our shareholders.

9 4 S M I T H S G R O U P P L C A N N U A L R E P O R T F Y 2 0 2 0
G O V E R N A N C EB O A R D A C T I V I T Y I N F Y 2 0 2 0 C O N T I N U E D
Board activity in FY2020 continued
Operational performanceMatters considered – An update on the Smiths Excellence System (SES), including strategic priorities and future developments, statistics on colleague completion of the Smiths lean six sigma belted programme, and current focus on site deployment to embed the associated tools
– Cyber Security Risk updates, including threats from the external environment. The reports covered enterprise and any product cyber incidents
– Reports from the Operations and Supply Nerve Centre
– Deep dives into divisional activities
Shareholder engagementOur Directors engaged with different groups of shareholders directly and indirectly over the year. All Directors attended the 2019 AGM where shareholders were invited to ask questions during the meeting and to meet the Directors after the formal proceedings were concluded. The 2019 AGM was webcast for the first time, allowing more shareholders to participate. All resolutions were voted on separately and passed with at least 90% of votes in favour.
Outcome – Endorsement of the Group’s response to COVID-19
– Approval of targeted initiatives at improving the Group’s working capital including inventory management
The Directors were kept up to date with the interests of institutional shareholders and other providers of capital and the Chief Financial Officer met and proactively communicated with committed lending banks and the rating agencies. After the FY2020 Interim Results the Chief Executive updated the Board on investor feedback following the decision to delay the separation of Smiths Medical and to not declare the FY2020 interim dividend.
The 2020 AGM will be held as a closed physical meeting on 16 November. The Notice of AGM can be found in a separate document which is sent out at least 20 working days before the AGM and made available on our website. More information about the AGM and Equiniti, the Company’s Share Registrar, can be found on page 229.
Key stakeholders
Our customers
Our suppliers
Our communities
Link to strategy
2 Deliver world-class competitiveness
United Kingdom 39%
US and Canada 32%
Rest of Europe 17%
Rest of World 12%
I N V E S T O R A N D A N A L Y S T M E E T I N G S I N F Y 2 0 2 0
BOARD PRIORITIES FOR FY2021In addition to the Board’s usual calendar of work, specific focus will be applied to the following areas:
– Continue to monitor COVID-19, its impact on global markets and their recovery
– Continue to review Group and divisional strategy in order to enhance their leadership positions
– Continued oversight of the separation of Smiths Medical, ensuring the right outcome for stakeholders
– Address the agreed actions from the Board evaluation process, with a particular focus on talent and succession planning
– Support the business in improving performance against KPIs
– Oversight of the strategic restructuring programme
– Continue to enhance the Board’s governance framework including stakeholder engagement activities
Key stakeholders
Our shareholders

9 5S M I T H S G R O U P P L C A N N U A L R E P O R T F Y 2 0 2 0
3
STAKEHOLDER ENGAGEMENT: RESPONSE TO COVID-19The Board received externally facilitated crisis management training in September 2019 and so were familiar with the Group’s crisis management framework when COVID-19 began to spread and impact the Group’s operations. It was agreed that the Board’s role was to retain a clear focus on the longer-term consequences of decisions, and the maintenance of the Group’s purpose and core values, while the executive management team managed the short-term priorities. In times of crisis Directors need to take on an active oversight role, and effective management reporting is critical to support this. They received regular written updates during the crisis.
Our peopleEffective communication channels to and from the workforce are critical. During the crisis the Board balanced keeping the workforce safe, supporting our customers and supply chain, business continuity and ensuring the positioning of the business remained strong for the long term. Updates on workforce communications were provided to the Board, who also had access to the weekly all-employee email updates and Smiths Now articles, the COVID-19 resources available online, including FAQs and site guidance, and the internal #Thankyoufrontline campaign.
At the March Board meeting the Chief Executive advised the other Directors that crisis management procedures had been activated, with the Smiths Group Crisis Core team meeting at least twice weekly with weekly Executive Committee meetings and a number of other meetings being held daily to manage the crisis within the crisis process framework. Regular management reports updated the Board on the detailed position at Smiths, including confirmed cases of COVID-19 amongst our employees and information about closed sites.
The HR Director presented a special report on the divisional critical role cover exercise to the April Board meeting. The Board enquired into government support for employees and the potential impact of COVID-19
on the strategic restructuring programme. Sadly a number of employees have become ill during the pandemic and a very small number have died. The Board ensured it received information about this and that support was given to their families and grieving colleagues.
Our customers, supply chain, communities, regulators and governmentsThe Chief Executive advised the March Board meeting that Smiths had been selected to lead one of the consortium groups supplying ventilators, as part of the VentilatorChallengeUK. An update on this significant government contract requiring a substantial increase in production was provided to the April Board meeting.
The regular divisional reports included updates on the impact COVID-19 was having on customers and their supply chains.
A special report on three COVID-19 initiatives was presented to the April Board meeting: the OSNC; in-house surgical mask production; and cost containment measures.
The Directors were updated on the impact of COVID-19 on the Group’s cyber capabilities in May, including threats to capacity and access issues due to increased homeworking.
Our shareholdersAt shareholder meetings in the second half of the year the Chief Executive and Chief Financial Officer covered the impact of COVID-19 on the Group and the Group’s response to the crisis.
As part of the review of the Group’s half yearly results in March the Directors were presented with a review of the impact of COVID-19 on Group viability. This included the results of liquidity stress testing using negative assumptions based on severe disruption to customer demand, supply chain and operational capacity. This information was used by the Board when considering the payment of the FY2020 interim dividend and has been updated and included in our Viability Assessment (see pages 77-78).
In April the Directors considered access to external capital and subsequently approved the establishment of a £1bn Euro-commercial paper programme.
Consequences of decisions in the long-termCOVID-19 has required the Board to balance the long-term consequences of decisions and the short-term requirements for operational resilience. In March the Directors considered the potential impact of COVID-19 on Smiths and broader markets, and it was considered in the best interests of key stakeholders to not declare the FY2020 interim dividend and to delay the separation of the Smiths Medical division.
The Chief Executive advised the Board that the Executive Committee had held a risk management session to consider the risks of COVID-19 related market disruption, and the long-term implications of a post COVID-19 world. The Board continues to receive regular reports on the impact of COVID-19 and the likelihood, timescale and speed with which the Group’s markets are likely to recover.

9 6 S M I T H S G R O U P P L C A N N U A L R E P O R T F Y 2 0 2 0
G O V E R N A N C EN O M I N A T I O N & G O V E R N A N C E C O M M I T T E E R E P O R T
Committee activities in FY2020Succession planning – Reviewed the Board skills and experience matrix and after consideration of this recommended the appointment of Karin Hoeing as a Non-executive Director to the Board
– Discussed succession planning for Board positions, which included a written Executive Director succession plan, and reviewed the Group’s senior management succession arrangements and talent pipeline with the Human Resources Director
– Discussed Board composition for Smiths and Smiths Medical following the planned separation
– To support their insight into culture and senior management succession planning, the Non-executive Directors met with members of local senior management prior to physical Board meetings and site visits
– The Chairman and other Non-executive Directors had one-on-one discussions with high-potential individuals in the business
Governance – Considered Director engagement with stakeholders, including the workforce
– Considered the external appointments of Directors and recommended to the Board that approval continues to be provided
– Recommended updated Terms of Reference to the Board for approval
– Considered the Board Committees’ membership and in doing so the independence and performance of the individual Non-executive Directors
– Reflected on suggestions raised through the ongoing review of the Group’s governance framework
Role of the CommitteeThe Nomination & Governance Committee reviews and makes recommendations to the Board on the structure, size and composition of the Board and its Committees. In fulfilling this role, the Committee considers the balance of skills, knowledge, experience and the diversity of gender, social and ethnic backgrounds, while having regard to the Group’s strategic objectives. The Committee has a formal, rigorous and transparent appointment process involving all Board members, and makes recommendations based on the merit of the individual candidates, having due regard for the need to ensure the effective functioning of the Board at all times. The Committee also considers Director and senior management succession planning and maintains oversight of the Group’s governance framework.
The members of the Committee and their meeting attendance during the year is set out on page 89. The Chief Executive is normally invited to attend Committee meetings and has attended each of the meetings in FY2020. Other members of senior management are invited to attend as necessary.
In order to fulfil its role the Committee: – Takes account of the Group’s strategy, business performance, current and future leadership needs, challenges and opportunities, and makes recommendations to the Board on its composition and that of its Committees
– Holds at least one meeting a year to review senior management succession plans and the quality of the talent pipeline across the Group
– Conducts on a periodic basis a review of the Board’s governance framework and recommends any changes to the Board
Performance evaluationIn FY2020, the performance of the Committee was considered as part of the internal Board evaluation process. Overall it was confirmed that the Committee continues to operate effectively.
Diversity of thought, background, national origin, gender and ethnicity is as vital for an effective Board as it is in other aspects of life.
Nomination & Governance Committee

9 7S M I T H S G R O U P P L C A N N U A L R E P O R T F Y 2 0 2 0
3
Board diversity performanceAt the date of this report 67% of our Directors have a birthplace or background outside the UK, and 42% of our Directors meet the combined measure of gender and ethnic diversity. 33% of our Directors are female. The Board therefore meets both of its diversity targets, and the Hampton-Alexander target of 33% representation of women on FTSE 350 Boards. Diversity information for the Board, Executive Committee, senior managers and the Group as a whole can be found on page 33. The Board will look to extend its work on diversity to senior leadership positions in the business and across the Group through oversight of the Diversity & Inclusion Plan which is available on our website.
In FY2020 external search firm Buchanan Harvey & Co. was used to support Director appointments and other senior level recruitment; the firm has no other connection to Smiths. Buchanan Harvey & Co. is a signatory to the Voluntary Code of Conduct for executive search firms.
IndependenceThe Board keeps the independence of the Non-executive Directors under continuous review. In July 2020, the Committee assessed the performance and independence of each of the Non-executive Directors and concluded that each of them contributed effectively to the operation of the Board. In considering the Directors’ independence the Committee reviewed the guidance contained in the 2018 Code.
Bruno Angelici was appointed as a Director on 1 July 2010 and as he had served on the Board for more than nine years a particularly rigorous review of his performance was undertaken. The Board concluded that he continued to demonstrate the qualities of objectivity and independence and contributed to constructive challenge and debate at meetings. It was therefore agreed that that he should continue as an independent Non-executive Director until his retirement at the 2020 AGM. Olivier Bohuon will also step-down from the Board at the conclusion of the 2020 AGM.
Board Diversity PolicySmiths supports the principles of the Hampton-Alexander and Parker reports on gender and ethnic diversity and maintains a diverse Board and, just as importantly, diverse management teams. Members of the Board and senior management will collectively possess a diverse range of skills, expertise, national birthplace, domain knowledge and ethnic and societal backgrounds. These are important ingredients for the effective operation of the Board and oversight of the Group. As a multinational Group with operations in more than 50 countries and over 95% of revenues originating outside the UK, diversity of thought and background is essential and will remain one of the key criteria by which candidates are selected for the Board and the pipeline for senior leadership positions.
In recognition of the value of diversity, the Board seeks to ensure that at least 50% of its members have a birthplace or background outside the UK and that
at least 40% of the Board is comprised of female plus historically under-represented ethnic groups. The Board will always seek to appoint the best qualified candidate, but between two candidates of equal merit the Board will, where there is a disproportionate under-representation of gender diversity on the Board, give preference to a female candidate when making an appointment.
In order to help achieve these aspirations the Nomination & Governance Committee endeavours to only use the services of executive search firms who have signed up to the Voluntary Code of Conduct on Gender Diversity. Executive search firms will also be required to ensure non-UK nationals, women and candidates from historically under-represented ethnic groups are represented on the shortlist for all Board positions.
The Board Diversity Policy was reapproved by the Board in March 2020.
Outside UK 8 (67%)
UK 4 (33%)
B I R T H P L A C E O R B A C K G R O U N D *
Target50%
Female 4 (33%)
Male 8 (67%)
G E N D E R B A L A N C E *
Current 5/12 (42%)
G E N D E R A N D E T H N I C I T Y *
Target40%
* as at 21 September 2020. Bruno Angelici and Olivier Bohuon will step-down from the Board at the conclusion of the 2020 AGM.

9 8 S M I T H S G R O U P P L C A N N U A L R E P O R T F Y 2 0 2 0
G O V E R N A N C EN O M I N A T I O N & G O V E R N A N C E C O M M I T T E E R E P O R T C O N T I N U E D
Tanya Fratto has served on the Board for eight years, Sir George Buckley for seven years and Bill Seeger for six years. As such, their continued objectivity and independence were also subject to rigorous review. It was agreed that Tanya, Sir George and Bill continue to be independent and objective.
Time commitmentAll Directors must allocate sufficient time to their work in order to discharge their responsibilities effectively. This has been particularly important in FY2020 as the Board prepared for the separation of Smiths Medical and then oversaw the Group’s global response to COVID-19. When Non-executive Directors join the Board the expected time commitment of 25 days per annum is set out in their letter of appointment. This includes making time to familiarise themselves with business priorities and challenges and to prepare for and attend Board and Committee meetings. In the normal course of business they are also expected to attend the AGM, engage with stakeholders and participate in the Board evaluation process. During a Director’s induction phase an additional time commitment is required. Executive Directors are not permitted to take on the chairmanship or more than one non-executive directorship in a FTSE 100 company, or any other significant appointment.
The Directors’ other significant commitments are detailed in their biographies on pages 84-87 and the Board considers these at least once a year. In FY2020 the Board concluded that the Chairman and the Non-executive Directors devoted sufficient time to fulfil their commitments to Smiths. Particular consideration was given to Sir George Buckley and Noel Tata’s other commitments.
Sir George is always available for consultation with management when required and was in frequent contact with management throughout the COVID-19 crisis. Following due consideration, the other Directors confirmed that he continues to demonstrate commitment to his role as Chairman. Noel is Managing Director of Tata International Limited, a trading arm of the Tata Group (a privately-owned multinational group of companies). He brings valuable and distinct experience to Board discussions, as a current executive with contacts in higher-growth countries which are a strategic focus for Smiths. In order to fulfil his executive responsibilities at Tata Group he is a director of various Tata companies. The Board believes that Sir George and Noel’s other commitments do not prevent them from committing sufficient time to their work as Directors, as evidenced by their full attendance and effective participation at all Board and Committee meetings held in the year. There was unanimous support from the Board to recommend to shareholders the re-election of Sir George Buckley and Noel Tata.
Information and trainingThe Board recognises the importance of ongoing training and our Directors are given the opportunity to update their skills and experience on a regular basis. Any individual development needs are discussed with the Directors at the annual performance evaluation. In order for the Directors to remain aware of business priorities and external developments, the Board is provided with formal reports and updates from the divisions and external advisers on a regular basis. During the year the Board received various externally facilitated training sessions, including on crisis management where the Directors were updated on the Group’s preparation for a crisis and received a presentation on good crisis discipline. They were also given an overview of the specific statutory and regulatory duties and responsibilities applicable to directors of a listed company.
The Company Secretary prepares a Governance Report for each scheduled Board meeting; over the year these covered changes to the regulatory environment and opportunities for our Non-executive Directors to attend externally facilitated seminars and roundtable events. The Directors are also obliged to complete annual online training on the Group’s Code of Conduct, information security and anti-bribery and corruption.
In order to operate effectively our Directors must receive accurate, timely and high-quality information. This supports their ability to make sound decisions and provide appropriate advice and challenge. The Company Secretary and his team assist the Chairman and Chief Executive in ensuring effective information flows and that the Board is provided with all relevant information. There are procedures in place to ensure that information the Board receives is presented in an appropriate format and contains the level of detail required for Directors to fulfil their responsibilities effectively.
Directors’ tenure*2010 2011 2012 2013 2014 2015 2016 2017 2018 2019 2020
Sir George Buckley
Andy Reynolds Smith
John Shipsey
Bruno Angelici
Olivier Bohuon
Pam Cheng
Dame Ann Dowling
Tanya Fratto
Karin Hoeing
Bill Seeger
Mark Seligman
Noel Tata
* as at 21 September 2020. Bruno Angelici and Olivier Bohuon will step-down from the Board at the conclusion of the 2020 AGM.

9 9S M I T H S G R O U P P L C A N N U A L R E P O R T F Y 2 0 2 0
3
Director inductionTo ensure that they are able to effectively contribute to discussion and decision-making, all of our Directors participate in an induction programme on joining the Board. Each induction programme is tailored to provide the individual Director with the necessary knowledge and understanding of the Group, based on their personal experience and background. Where possible, meetings with our key stakeholders will be built into Director induction schedules in future. Information about the Director inductions completed during the year can be found below.
Conflicts of interestAll of our Directors must avoid situations where they have a direct or indirect interest that conflicts, or may possibly conflict, with the best interests of Smiths. The Board has the authority to authorise conflicts and potential conflicts in accordance with our Articles of Association and the Act, and Board approval must be granted before a Director accepts a new external appointment, whether it amounts to a conflict or not.
The Company Secretary maintains a Register of Conflicts which forms the record of actual and potential conflicts and the Board authorisation granted. The Register is reviewed by the Directors at least twice a year and the Board retains the power to vary or terminate any authorisation previously provided.
Advice and insuranceOur Directors have access to the advice and services of the Company Secretary and are able to seek independent professional advice at the expense of Smiths to enable them to fulfil their obligations as members of the Board. In addition, the Directors and Officers of Smiths and its subsidiaries have the benefit of a Directors’ and Officers’ liability insurance policy.
During FY2020, and at the date of this report, qualifying third-party indemnity provisions (as defined by section 234 of the Act) have remained in force for the Directors of the Company and certain other employees in respect of their directorships of some subsidiary companies in relation to certain losses and liabilities which they may incur (or may have incurred) to third parties in the course of their professional duties for the Company, or a subsidiary.
Director re-electionEach year our Directors are subject to election or re-election by shareholders at our AGM. Non-executive Directors are appointed for a specified term of three years, subject to annual re-election at the AGM. Re-appointment for a second three-year term is not automatic, and any term for a Non-executive Director beyond six years is subject to a particularly rigorous review.
Our Chairman, on behalf of the Board, has confirmed that each Non-executive Director standing for re-election at this year’s AGM continues to be an effective member of the Board, and has demonstrated the commitment required. In addition, the Senior Independent Director has confirmed that the Chairman continues to be effective and supports his re-election to the Board at the AGM.
The rules regarding the appointment and replacement of Directors are determined by our Articles of Association and the Act. The Articles of Association can be found on our website and can only be amended by a special resolution of shareholders.
DIRECTOR INDUCTIONS DURING COVID-19Pam Cheng and Karin Hoeing joined the Board in March and April 2020 respectively. Normal practice is for a new Director to meet with the Chairman, the Company Secretary, Non-executive Directors and Executive Committee members, including the divisional presidents, and other senior executives. They may also meet with the external auditors and the Group’s key external advisers.
Ordinarily, a majority of these meetings would be in person, but due to restrictions arising from COVID-19 this was not always possible for Pam and Karin, so most meetings have been held via videoconference instead. Briefing documents are circulated in advance of induction meetings. Induction programmes would normally include visits to Smiths sites, which have also not been possible due to COVID-19.
To provide an insight into the Group’s strategy, culture and values, extensive information about the Group is made available to new Directors. Before formally joining the Board, in order to familiarise herself with its workings, Pam joined the Board and Audit & Risk Committee meetings in September and the Remuneration Committee meeting in November as an attendee.

1 0 0 S M I T H S G R O U P P L C A N N U A L R E P O R T F Y 2 0 2 0
G O V E R N A N C EN O M I N A T I O N & G O V E R N A N C E C O M M I T T E E R E P O R T C O N T I N U E D
An effective Board is essential to deliver the Group’s objectives and long-term sustainable value for stakeholders.
Board evaluation
PrinciplesEach year an evaluation of the Board and its Committees is conducted to monitor their effectiveness and to help identify any improvement opportunities. The annual evaluation of the performance of the Non-executive Directors and the Chief Executive is led by the Chairman. Feedback is given to the Chief Executive by the Chairman after each Board meeting and on an ad hoc basis throughout the year. The evaluation of the Non-executive Directors includes face-to-face meetings with the Chairman for each of them individually. The Senior Independent Director and the Chief Executive lead the evaluations for the Chairman and the Chief Financial Officer respectively. Additionally, the Board evaluation is independently facilitated every three years. Independent Audit Limited facilitated the FY2018 Board evaluation and assisted with the interpretation of the results from the questionnaires used to support the FY2019 and FY2020 internal evaluations. Independent Audit Limited have no other connection with the Company.
Building on the FY2019 evaluationAs reported in last year’s Annual Report, the Directors believed that the Board and its Committees continued to function very effectively, but there were areas where they agreed processes could still be enhanced. These centred on i) continuing to embed and develop executive succession planning processes, ii) the factors taken into consideration when making strategic decisions, and iii) better communication with Non-executive Directors by the Executive Directors.
Strategic decisions involve the consideration of many different factors and the Board wanted to ensure that these factors were all raised in a timely manner and in sufficient detail. Ways to ensure
this happens on a consistent basis, and that the general flow of information and exchange of ideas between management and the Board improves, were considered. The Nomination & Governance Committee had enhanced its effectiveness in the year but succession planning was a recurring theme from the FY2018 evaluation. Shortlists for Board appointments were deemed to be of good quality, but the Board wanted greater insight into the quality of the management talent pipeline within the Group.
The objective this year was to build on the findings of the FY2019 evaluation and assess through the answers to a series of questions (FY2019: 46; FY2020: 43 ) how well the Board discharged the fundamental role it plays, its dynamics, its coverage of strategy and risks, and how each of the Committees performed the roles delegated to them by the Board. Using similar questionnaires year on year allowed comparison with the results from the FY2019 evaluation for many areas, with additional questions on some of the key topics considered by the Board during the year. For example, in FY2020, the questionnaire contained a specific section on the operation of the Transaction Committee which had been formed to monitor and advise on the separation process for Smiths Medical. The answers to the questionnaire are compiled on a non-attributable basis and reviewed in detail by the Nomination & Governance Committee.
The process did not include a section on the Remuneration Committee as that had separately been internally evaluated earlier in the year. This was ahead of the appointment of new advisers to the Remuneration Committee to obtain feedback from Directors and senior management on the current remuneration consultancy arrangements, performance measures and Committee governance.
Each Director and member of senior management was independently interviewed by members of the Human Resources function, with the findings and performance of the Remuneration Committee considered by the Board as part of the overall evaluation process.
FY2020 evaluation assessment The results from the FY2020 evaluation showed encouraging improvements from those of the previous year, with nearly all questions achieving better scores than the already high ones in FY2019. There is a good cross-set of skills on the Board with a balance of expertise and experiences and diversity of background. The Board have open and engaged but robust discussions. The areas which the Board felt were most in need of attention were again in relation to strategic decision-making, executive succession planning and communication where although these areas had improved overall, there is still more which could be done. Progress against actions from FY2019 and those planned for FY2021 are set out on the opposite page.
The Audit & Risk and Nomination & Governance Committees both improved their scores from FY2019. As the evaluation of the Remuneration Committee was carried out separately using a different process there were no comparators for this Committee. It was agreed that the feedback from Committee members regarding the current Remuneration Policy would be used to identify priorities and inform work on the next Policy review for submission to shareholders. To assist in progressing matters between Remuneration Committee meetings, a working group consisting of three or more Directors assisted by management was established and in operation from May 2020, chaired by Bill Seeger and submitting matters to the Committee as a whole for approval.
FY2021 evaluationIt is the present intention that the Board evaluation will be independently facilitated in FY2021 as part of the three-year cycle.

1 0 1S M I T H S G R O U P P L C A N N U A L R E P O R T F Y 2 0 2 0
3
Strategic decision-makingActions from FY2019 evaluation – A particular focus in the evaluation had been on reviewing how the Board had handled key issues such as the decision to separate the Smiths Medical division. In FY2020 the Board used the newly-established Transaction Committee to provide a regular interface between management and the Board and give oversight of the separation process. The separation process was delayed in early 2020 to allow employees to focus on responding to the COVID-19 pandemic but also because of the challenging circumstances in some segments of the economy. The use of the Committee is felt to have significantly improved strategic decision-making, the flow of information and exchange of ideas between management and the Board and communication in general. The Committee has broadened its role to oversight of other acquisitions and disposals at least for the duration of the COVID-19 pandemic.
– Ensuring that the Board has access to all relevant information for its strategic discussions is an area for constant improvement. Not all the improvements planned for FY2020 were implemented due to the COVID-19 pandemic but these remain in place for implementation in FY2021. These include greater interactions with customers, suppliers and subject matter experts as part of the increase in direct stakeholder engagement and to understand how big trends and technology influence the markets in which we do or can operate.
FY2020 evaluation findings – More factors to be taken into consideration when making strategic decisions, including identifying the skills, characteristics and diversity the Group needs to underpin our strategy; and increasing the understanding of the strategic opportunities and risks from current and emerging technology, climate change and big shifts in behaviours and markets such as those experienced in the last year.
Actions planned for FY2021 – The annual strategy discussion was postponed in FY2020 and will now take place later this year by videoconference. We had hoped that an easing of the pandemic would allow the normal face-to-face meeting of the Board for this session, albeit delayed, but that turned out not to be possible. The interactions between the Board and divisional management have been extended and improved ahead of that meeting to give the Board more time to address the areas identified. As noted above, a few of the improvements identified in FY2019 which could not be implemented in FY2020, due to the restrictions and additional time constraints resulting from the COVID-19 pandemic, will now be introduced in FY2021.
– To allow more time for strategic discussions at the Board meetings themselves, and so that the Board can consider a broader range of topics which affect the strategy, agendas will be re-balanced and items which are not ‘time critical’ will be re-scheduled. Director training now takes place in scheduled ‘stand-alone’ sessions rather than during a regularly scheduled Board meeting with a number of excellent sessions having already taken place.
Executive succession planningActions from FY2019 evaluation
– To provide the Board with the desired insight into the talent pipeline within the Group for succession planning, more frequent updates from the Human Resources Director are now provided to the Nomination & Governance Committee with the most recent of these provided in July 2020. As noted below, this remains an area of focus for FY2021.
FY2020 evaluation findings
– Greater involvement with divisional management would improve their visibility to the Board for executive succession planning purposes and allow the Directors to assess the ‘bench strength’ of the senior management team. We have already implemented this action.
Actions planned for FY2021 – Increasing the frequency and depth of Board updates in this area started in 2020. Access for the Board to more divisional management employees is being significantly increased, including through greater use of videoconferencing facilities to minimise the need for travel. More face-to-face Board exposure for high-potential talent within the Group is being arranged once travel restrictions are lifted. This will also improve the Board’s knowledge and oversight of the corporate culture.
Board communicationActions from FY2019 evaluation – Communication between management and the Non-executive Directors outside of the formal Board meetings has improved with the embedding into our reporting processes of a regular, formal written report from the Chief Executive to them each month. Any matters needing more immediate communication continue to be dealt with by the most appropriate methods of interface on an ad hoc basis. There were more Board and Transaction Committee meetings in the second half of the year to keep the Board apprised of the response to the COVID-19 pandemic and to seek their counsel on the economy, forecasting, government relations and employee safety.
– As part of the evaluation feedback provided in July 2019, the Board asked for more information regarding the Group’s preparedness and processes in the event of a crisis. This was provided to them in September 2019 and the Group’s processes and ability to respond to a crisis were then utilised during the pandemic.
FY2020 evaluation findings – Well-structured and more timely delivery of Board papers will improve discussions during meetings.
– Continued development of communications from management between Board meetings to further improve Board oversight.
Actions planned for FY2021 – Process and procedure improvements around the creation, dissemination and consideration of Board papers are being addressed through a ‘lean six sigma green belt’ programme run internally. This will report to the Board later this year and the improvements will be implemented shortly thereafter.
– In addition to the now embedded Chief Executive monthly report, other formal and informal ways of improving information flows to and from the Board outside of the usual routine of meetings are being considered.

1 0 2 S M I T H S G R O U P P L C A N N U A L R E P O R T F Y 2 0 2 0
G O V E R N A N C EA U D I T & R I S K C O M M I T T E E R E P O R T
I am pleased to present the Committee’s report for FY2020. The Committee fulfils an important oversight role, monitoring the integrity of the Group’s financial reporting and the effectiveness of its system of internal control and risk management framework. The delivery of the Committee’s responsibilities during a period of considerable uncertainty has been critical in helping the Group demonstrate to our stakeholders and society at large the long-term sustainability and effectiveness of the Board’s strategy.
As mentioned elsewhere in this Annual Report, the undoubted challenge for Smiths and the Committee this year has been the impact of, and response to, the COVID-19 pandemic. This necessitated new ways of working, reporting and assurance activities in respect of the Group’s financial reporting, financial and non-financial control environment and the associated risk management framework. Culture can be critical to galvanising an organisation during difficult times and it is the view of the Committee that the Group’s culture helped the business to respond to COVID-19 in a timely and agile way, in line with our values.
As outlined in my report last year, KPMG was selected as the Group’s external auditor for FY2020 following a formal tender exercise. The external auditor plays a key role in supporting the Committee’s oversight of controls and the level of engagement and appropriately sceptical challenge displayed by KPMG since their appointment, during a transition period complicated by COVID-19, has been well received by the Committee and management alike. This report contains information on the activities undertaken by the Committee during the year which has enabled it to monitor and assess the effectiveness of the Group’s control environment.
I would like to thank the Smiths employees and my colleagues on the Committee for their contribution. I look forward to continuing our work in FY2021.
Mark Seligman CHAIR OF THE AUDIT & RISK COMMITTEE
Role of the CommitteeThe principal role of the Committee is to assist the Board in fulfilling its oversight responsibilities in relation to financial reporting, financial controls and audit, risk and internal controls. The Committee also manages the relationship with the external auditor, including making recommendations to the Board and our shareholders in relation to the reappointment of the external auditor. In addition, the Committee oversees the Group’s Ethics and Compliance annual work programme and investigates any material ethics and compliance issues that may arise.
Performance evaluationThe annual evaluation of the performance of the Committee was conducted as part of the Board evaluation process with the findings relating to the Committee being discussed with the Committee Chair. Overall, the Committee is considered to be performing well, and is rigorous and effective in discharging its responsibilities.
In order to fulfil its role the Committee: – Holds meetings scheduled to coincide with key dates within the financial reporting, audit and Enterprise Risk Management (ERM) cycles. The external auditor attends and reports to all meetings
– Receives presentations from divisional and functional heads to gain an understanding of the culture and risks present throughout the organisation
– Meets privately with internal and external audit after each Committee meeting
– Conducts an annual review of its performance and its Terms of Reference, and recommends any changes to the Board
The Committee oversaw a rapid review of how the business operated and reported in the light of COVID-19.
Audit & Risk Committee

1 0 3S M I T H S G R O U P P L C A N N U A L R E P O R T F Y 2 0 2 0
3
Committee membership and meetings The Committee met formally four times during FY2020, (two of which were virtual meetings) with three meetings timed to align with the financial reporting and audit cycles of the Group, namely: the approval of the FY2019 Annual Report and Accounts in September 2019; the approval of the half yearly results in March 2020; and the presentation of the pre-year-end report from the external auditor, KPMG, in July 2020. A meeting was also held in November 2019 at which the Committee undertook, amongst other things, its annual review of the Group’s insurance strategy. The Committee met again in September 2020, to consider the FY2020 Annual Report and Accounts and other matters. In addition, during FY2020 the Committee Chair devoted extra time to discuss the FRC’s support for the Financial Conduct Authority’s moratorium on corporate reporting issued in March 2020 and the Group’s reaction to COVID-19 with executive management and the external auditor. The Committee Chair is also a member of the Transaction Committee – see page 89 for more information.
All members of the Committee who served during the year are, in the view of the Board, independent Non-executive Directors and collectively have recent and relevant financial, accounting and sector experience. Committee member biographies and attendance at meetings during the year can be found on pages 84-87 and 89. In particular, the Board considers that Mark Seligman, who has a long history in corporate finance and knowledge of other listed company audit committees, as well as being a qualified accountant, has the recent and relevant financial experience required to chair the Committee. At the invitation of the Chair of the Committee, and in order to maintain effective communications, the Chairman, Chief Executive and Chief Financial Officer and the audit partners of KPMG attended all meetings. Other regular attendees included the Group Financial Controller, the Director of Internal Audit and the head of the Ethics & Compliance function. Divisional senior management were also invited to attend as appropriate. At the conclusion of meetings, KPMG and the Director of Internal Audit were each given the opportunity to discuss matters with the Committee without executive management being present.
The heads of Internal Audit and Ethics & Compliance, together with KPMG, have direct access to the Committee should they wish to raise any concerns outside formal Committee meetings. The Chair of the Committee reports formally to the Board on the Committee’s activities after each meeting.
Financial and narrative reporting The Committee is responsible for reviewing the half yearly results announcements and the Annual Report and Accounts before recommending them to the Board for approval. During the year, the Group has had internal control and risk management arrangements in place to support the financial reporting process and provide reasonable assurance that the financial statements are prepared in accordance with applicable standards. These arrangements include seeking divisional confirmation that their reported information gives a true and fair view of the results for the period, and ensuring that record keeping allows an accurate and fair reflection of transactions.
For the period under review, the Committee has considered information presented on significant matters of judgement, accounting estimates, and the interpretation of reporting standards in the adoption of policies. It has discussed with KPMG its audit reports and noted the key accounting matters and significant judgements and issues highlighted in respect of the financial statements and as detailed below. The Committee has examined key points of disclosure and presentation to ensure the adequacy, clarity and completeness of the Annual Report and Accounts and the half yearly results announcement and enhanced going concern and viability assessments in the light of COVID-19. The Committee also considered the delay to the release of the half yearly results in line with guidance issued by the FRC and the release of a trading statement in March to ensure investors were kept informed of developments within the business.
As part of the FRC’s regular oversight role on company reporting, in July 2020 the Company received a letter from the FRC whereby the FRC raised a limited number of queries in connection with disclosures contained in the FY2019 Annual Report. These queries were in relation to foreign exchange rate movements recognised in ‘other comprehensive income’ and ‘accumulated in equity’; the presentation of discontinued operations and the foreign exchange gains and losses on
intercompany loans between continuing and discontinued operations; and revenue recognition and the revenue recognised in respect of variable consideration. The Group’s response was overseen by the Committee Chair and discussed with PwC as the Group’s auditor for FY2019 and KPMG as the Group’s incumbent auditor. The FRC subsequently closed their enquiry in August 2020. We have taken the FRC’s constructive feedback into consideration by enhancing the FY2020 disclosures. The FRC notes that its review was based on the Group’s FY2019 Annual Report only and does not benefit from detailed knowledge of the Group’s business or an understanding of the underlying transaction.
The Committee also reviewed various materials to support the statements in the Annual Report on risk management and internal control, going concern, and the assessment of the Group’s long-term viability – see pages 77-78 for more details. In addition, the Committee assessed the fairness, balance and understandability of the Annual Report, and in doing so considered:
– the accuracy, integrity and consistency of the messages conveyed in the Annual Report;
– the appropriateness of the level of detail in the narrative reporting;
– the correlation between judgements, estimation of uncertainties and issues and the associated disclosures; and
– the explanations of the differences between statutory and headline reported results.
Following its review, the Committee agreed that the Annual Report is representative of the year and presents a fair, balanced and understandable overview, providing the necessary information for shareholders to assess the Group’s position, performance, business model and strategy.

1 0 4 S M I T H S G R O U P P L C A N N U A L R E P O R T F Y 2 0 2 0
G O V E R N A N C EA U D I T & R I S K C O M M I T T E E R E P O R T C O N T I N U E D
Presentation of headline profits and underlying growthThe Committee considered the policy, presentation and judgements in relation to the Group’s performance, in particular the separation of headline and non-headline items including the treatment of the strategic restructuring programme costs and consideration of which items related to the Group’s ongoing trading activity or those which should be recorded as non-headline.
In terms of the strategic restructuring programme, the Committee concurred with management’s conclusion that costs did not meet the criteria under the Group’s non-headline items policy which requires that non-headline items should only relate to either M&A activity or provisions for legacy issues. Restructuring costs are therefore reported in the headline performance. The Committee also agreed that it was appropriate to disclose an additional alternative performance measure to show operating profit excluding restructuring costs and asset write downs. See note 30 of the financial statements.
Other items included the amortisation of intangible assets and the impact of integration activity on acquired entities and material one-off items relating to pensions and other legacy provisions. In addition, the Committee also considered those judgements in connection with items to be reflected or adjusted in underlying performance. See note 3 of the financial statements.
Acquisitions and divestmentsThe Committee reviewed the treatment and presentation of the acquisition of Reflex Photonics. The Committee also considered the appropriateness of the recognition of business acquisition and disposal costs and post-acquisition integration programme costs between headline and non-headline profits.
Discontinued operation held for distributionThe continued treatment of Smiths Medical as a discontinued operation and a business held for distribution to owners was also considered and agreed.
The Committee recognised that a key IFRS 5 requirement for classifying a business as held for distribution to owners is that the distribution must be highly probable, with the expectation that it will be completed within one year from the date of classification.
It is recognised that unforeseen circumstances during FY2020 did not allow the distribution to occur; therefore further judgement was required to determine whether the Smiths Medical business continues to meet the criteria for classification as a discontinued operation given the delay in the demerger.
The Committee agreed that the separation was not completed in FY2020 due to exceptional external circumstances as stated in our trading update on 31 March 2020, that the Group remains committed to completing the separation within FY2021 and the recognition criteria of IFRS 5 continue to be fully met.
However, the Committee and the Board will give consideration to any exceptional external circumstances arising, including significant adverse consequences arising from the evolving pandemic and associated economic dislocation which may impact the separation of Smiths Medical.
Revenue recognitionThe Committee reviewed management’s revenue recognition judgements. The Committee noted that the timing of revenue recognition involves judgements as to when control of an asset passes to the customer or, particularly in Smiths Detection and Smiths Interconnect, as to the stage of completion of contract activity and whether the separate performance obligations have been fulfilled.
The Committee reviewed and concurred with management’s conclusions on the significant judgements for complex programmes and contract accounting. See note 1 of the financial statements.
TaxationThe assets and liabilities recognised in income and deferred tax, as well as the treatment of losses in the UK, were assessed. Particular focus was given to the recognition of UK deferred tax assets; deferred tax assets relating to the John Crane, Inc. asbestos provision; and the Titeflex Corporation CSST provision. The Committee noted the ongoing tax audits that are likely to conclude in the next 12 to 24 months, and the uncertainty associated with their outcome. The Committee noted that the final outcome may vary significantly from the amounts currently provided for tax risks. See note 6 of the financial statements.
ImpairmentThe intangible assets and the assumptions used to justify their carrying values, including ‘value in use’ and ‘fair value less costs to sell’ were reviewed. The applicable discount rate used for impairment testing purposes was also considered particularly where headroom had reduced in the year.
Smiths Detection and Smiths Interconnect were the only CGUs where the impairment headroom was limited for FY2020 and where a plausible downside scenario or a reasonable change in the key assumptions could have caused the carrying value to exceed its recoverable value. The limited impairment headroom for Smiths Detection was driven by lower forecast cash-flows due to the expected COVID-19 downturn in the aviation sector. The net impact is that long-term earnings growth projections have reduced from the FY2019 model but that the CGU recoverable amount exceeded its carrying value and therefore no impairment was necessary. The limited impairment headroom for Smiths Interconnect was driven by FY2020 performance and inherently uncertain future performance.
Significant accounting estimates and judgements An important responsibility of the Committee is to review and agree the most significant management accounting estimates and judgements which impact the financial statements. The key areas of judgement in the year are set out below. After receiving reports on the significant estimates and areas of judgement and after discussion with KPMG, the Committee agreed that the judgements made were appropriate and correctly reflected and presented in the Annual Report. More detailed information on the Group’s Accounting Policies and significant judgements can be found on pages 149-157.

1 0 5S M I T H S G R O U P P L C A N N U A L R E P O R T F Y 2 0 2 0
3
External audit The Committee places great importance on the quality, effectiveness and independence of the external audit process. Further to a tender process described in last year’s Annual Report, KPMG was appointed as the Company’s external auditor at the 2019 Annual General Meeting, replacing PwC which had been the Company’s auditor since 1997. Michael Maloney, KPMG’s audit partner, has led the engagement during the year and since their first appointment at the 2019 AGM. In line with ethical standards it is expected he will rotate off the Smiths audit within five years and no later than the conclusion of the FY2024 audit. In respect of the period, the Committee approved and monitored KPMG’s execution of the audit plan.
The Committee also considered KPMG’s report on its review of the FY2020 half yearly results announcement and its report on the FY2020 audit. It also discussed all significant matters identified in KPMG’s final report on the FY2020 audit including the key accounting judgements taken by management and management’s responses to any audit findings.
Due to PwC’s understanding of Smiths Medical’s financial reporting and internal control environment and the work necessary to support the separation of that business, the Committee agreed it was more efficient for PwC to continue to act as the auditor for those companies which comprise the Smiths Medical division and to report to KPMG.
The Committee confirms that the Company has complied with the provisions of the Statutory Audit Services Order 2014 relating to the UK audit market for large companies throughout the year under review and as at the date of this report.
Independence and effectiveness The Committee is responsible for the implementation and monitoring of the Group’s policies on external audit, which are designed to maintain the objectivity and safeguard the independence of the external auditor. These policies are reviewed annually. They cover the engagement of the external auditor for non-audit services and the appointment by the Group of former employees of the external auditor. The policies correspond with the European Commission’s recommendations on the auditor’s independence and with the Revised Ethical Standard issued by the FRC in the UK.
The Committee concurred with management’s conclusion that additional sensitivity disclosures on the impairment risk of the Smiths Detection CGU and the Smiths Interconnect CGU were required and reviewed the appropriateness of the disclosures proposed.
The carrying value of capitalised development expenditure, notably in respect of Smiths Detection and Smiths Medical, was reviewed and the treatment was considered reasonable.
The Committee provided significant focus and challenge to management on the progress achieved on Smiths Medical’s IntellifuseTM infusion pump(s) (Intellifuse) programme, which has been in development for a number of years. The Committee recognised that during FY2020 Smiths Medical experienced delays in achieving regulatory clearance for Intellifuse from the US Food and Drug Administration (FDA). The Committee agreed with management’s view that the delay in FDA approval, together with impact of expected competitor product launches, were indicators of potential impairment.
The Committee challenged management’s impairment review of Intellifuse before agreeing that the fair value less costs to sell of Intellifuse is in excess of the carrying value so no impairment remains appropriate.
The Committee reviewed and agreed the additional disclosures on Intellifuse within ‘Discontinued operations and businesses held for distribution to owners’. See note 11 of the financial statements.
New accounting standards – IFRS 16The Committee received updates on the adoption of IFRS 16 ‘Leases’ in the current year and in particular considered the impact of IFRS 16 on the Group’s cash conversion Alternative Performance Metric. The Committee approved the Group’s accounting policy and the proposed disclosures under the new standard.
Provisions for liabilities and chargesThe Committee considered the appropriateness of the level of the provisions held against John Crane, Inc. asbestos litigation and the Titeflex Corporation CSST claims. In particular, the Committee considered the treatment of potential liabilities, the changes to the assumptions made in calculating the provisions, sensitivities to changes in assumptions and met with the Group’s specialist external advisers and agreed the continued appropriateness of the ten-year time period for John Crane, Inc. asbestos litigation.
In the case of the John Crane, Inc. asbestos litigation, the Committee also agreed with the judgement that, whilst large numbers of claims are made against John Crane, Inc. and other defendants every year, due to both known and as yet unknown developments in the US legal system and other events that will impact the asbestos legal environment, a sufficiently reliable estimate cannot be made to cover the full period over which it is expected that costs will be incurred. In both these cases, it was determined that the assumptions fairly reflect the position. See note 22 of the financial statements.
Post-retirement benefitsThe Committee reviewed and agreed the methods, assumptions and benchmarks used by the actuaries to calculate the position of the UK and US schemes at 31 July 2020, which have continued to show a net accounting surplus position.
The Committee agreed the treatment and the corresponding disclosures on these matters. See note 8 of the financial statements.
Significant accounting estimates and judgements continued
1 0 6 S M I T H S G R O U P P L C A N N U A L R E P O R T F Y 2 0 2 0
G O V E R N A N C EA U D I T & R I S K C O M M I T T E E R E P O R T C O N T I N U E D
Notwithstanding developing practice being adopted by audit firms not to provide non-audit services to audit clients, the Committee recognises that certain permissible non-audit services can be completed more efficiently by, and be purchased more cost-effectively from, the incumbent auditor due to the audit firm’s existing knowledge of the Group and its systems. Under the policy approved by the Committee, it has delegated its responsibility for authorising the purchase of non-audit services from the external auditor to the Chair of the Committee and/or the Chief Financial Officer within specific limits.
Details of the fees paid to KPMG for the year ended 31 July 2020 can be found in note 2 of the financial statements on page 162. Non-audit fees as a percentage of audit fees totalled 9% (FY2019: 4% – this was in respect of fees paid to the Group’s previous external auditor PwC). The Group would not expect in the ordinary course of business for non-audit fees to exceed 20% of the average of the previous three years’ total Group audit fees unless exceptional circumstances existed. The Committee confirms that the non-audit work performed by KPMG, which included some supplementary audit work and work in preparation for the separation of Smiths Medical during the year, was properly assessed and authorised in accordance with the Group’s policy.
In addition to monitoring compliance with Group policies, the Committee’s review of KPMG’s independence included examining written confirmation from KPMG that they remained independent and objective within the context of applicable professional standards, and considering the performance of the audit engagement partner.
Audit effectiveness is assessed continually using a number of measures including: reviewing the quality and scope of the proposed audit plan and progress against the plan; responsiveness to changes in our businesses; appropriate scepticism and challenge of management; and monitoring the independence, professionalism and transparency of the audit. In addition, the Committee discussed the findings in the FRC’s 2020 Audit Quality Inspection Report with KPMG to understand those activities being undertaken to address the findings; and KPMG’s position regarding the various areas of audit reform which is currently under review. The processes whereby KPMG sought assurance on the audit work completed by PwC in respect of those companies forming the Smiths Medical division was also reviewed. The Committee concluded that KPMG and its audit process were effective, and that audit teams had provided effective and objective challenge. The Committee therefore agreed that it was appropriate to recommend to the Board that the reappointment of KPMG as the Company’s auditor for a further year be proposed to shareholders at the 2020 AGM. As this was KPMG’s first year as auditor a further in-depth review of their performance will be conducted ahead of their review of the FY2021 half year results.
Risk management and internal control The Board is responsible for ensuring that sound risk management and internal control systems are in place. The Executive Committee is responsible for designing the risk management and internal control systems and ensuring they are effectively deployed throughout the Group. The internal control system is a framework to manage risks and monitor compliance with procedures. It is designed to meet the Group’s particular needs and the risks to which it is exposed. However, it can provide only reasonable, not absolute, assurance against material loss to the Group or material misstatement in the financial statements. More detail can be found on pages 67-76.
In FY2020, the Committee, on behalf of the Board and with the assistance of the Internal Audit function, monitored, reviewed and assessed the effectiveness of the Group’s risk management and internal control systems in the context of the Group’s strategy, business model and risk appetite. The Committee also carried out a robust assessment of the principal risks facing the Group, including those that would threaten its business model, future performance, solvency and liquidity, notably in the light of COVID-19. A description of the principal risks facing the Group and how these were reviewed to assess the Group’s viability can be found on pages 69-76 and 77-78.
In fulfilling its responsibilities, the Committee received reports to enable an evaluation of the control environment and risk assurance framework and processes. No significant failings or weaknesses were identified. The Committee also received reports from the divisions on their risk management processes and a presentation on the risk registers and associated controls. The Committee undertakes deep-dive reviews on a rolling basis of the Group’s principal risks. During FY2020, deep-dives were carried out on: Integrated supply chain with a focus on the potential impact of COVID-19 and Product quality within John Crane. Product quality deep dives for the other divisions are scheduled to be held during FY2021. Separately, the full Board considered the People and Cyber security principal risks and due to COVID-19 a report on financial controls in respect of those risks deemed heightened during the pandemic. Consideration of the risk registers alongside the principal risk deep dives enables the Committee and full Board to understand the culture, risks and opportunities and assurance processes throughout the business and the potential impact on the Group.

1 0 7S M I T H S G R O U P P L C A N N U A L R E P O R T F Y 2 0 2 0
3
Internal Audit Internal Audit is independent of the business, and as such has no responsibility for operational business management. This ensures the integrity and objectivity of its annual Audit Plan, which is approved by the Committee. The authority of the Internal Audit function is derived from the Committee.
The Director of Internal Audit is accountable to the Board through the Committee Chair, although administratively the Director of Internal Audit reports to the Chief Financial Officer. In order to carry out the responsibilities, as set out in a charter approved by the Committee, the Internal Audit function has:
– full and unrestricted access to all records, property and personnel;
– independent access to the Committee Chair and members of the Committee;
– the right to request meetings with the Committee; and
– the authority and obligation to report significant findings or other concerns to the Committee.
During the period the Committee received progress reports on the execution of the FY2020 Internal Audit Plan, notably how the plan would be completed due to site and system access and travel restrictions imposed as a result of COVID-19. This was largely addressed by the increased use of technology and reviews being completed remotely.
Review findings and recommendations made by the Internal Audit function were discussed as well as the pace at which control enhancements were addressed by the business. The Committee also considered the remit of Internal Audit, its budget and resources and the nature and extent of any outsourcing to specialist co-source providers. It also approved the FY2021 Internal Audit Plan, including the proposed audit scope, approach, coverage and allocation of resources.
The Committee oversees the performance of the Internal Audit function through the Director of Internal Audit’s attendance at Committee meetings and a review of agreed KPIs which are reported to the Committee. In addition, an anonymous survey completed by the Board, management and the external auditor was conducted into the function’s effectiveness. Overall, Internal Audit is deemed to be effective and is seen as a valued assurance function throughout the Group. It is appropriately resourced and conforms with industry standards in its approach.
Ethics and compliance During the year, the Committee reviewed the Ethics and Compliance annual work programme, and provided oversight of performance in line with, and investigations into, allegations of non-compliance with the Code of Business Ethics. This included matters raised through the Group’s ethics reporting procedures including the Group’s ‘Speak-Out’ line which allows for anonymous reporting. Smiths ‘Speak Out’ system comprises a number of different channels (including call centres operated by an independent third party across the Group’s global operations) for employees and other stakeholders to report concerns. The Committee also provides oversight for any significant investigations. During the year there were no matters raised that required the Committee’s direct intervention or investigations which resulted in a material loss to the Group or a detrimental impact on our customers or suppliers. The Committee receives regular reports on the total number and nature of cases by region, the ratio of anonymous vs attributed ethics reports, and the ratio of substantiated to unsubstantiated cases. The anonymous vs attributed metric is used to monitor trust in the Group’s non-retaliation policy.
Accordingly, the Committee considered that the Group’s processes and arrangements for employees to report concerns, including anonymously and without retaliation, about any improprieties and the arrangements for any subsequent investigation as necessary, were both appropriate and effective.
During the year, the Committee provided oversight of a number of areas targeted by the Ethics and Compliance work programme. More information on the Group’s approach to Ethics & Compliance can be found on page 26.
Assessment of internal control and risk management arrangements The Committee was satisfied that the Group’s processes governing financial reporting and controls, its culture, ethical standards and its relationships with stakeholders continued to be effective. The Committee was also satisfied with the appropriateness and adequacy of the Group’s risk management arrangements, internal control framework and four lines of defence model.

1 0 8 S M I T H S G R O U P P L C A N N U A L R E P O R T F Y 2 0 2 0
G O V E R N A N C E
R E M U N E R A T I O N C O M M I T T E E R E P O R T
Role of the CommitteeThe Committee is responsible for the Group’s overall remuneration strategy and oversees the Group’s Remuneration Policy for Directors and senior management. The Committee seeks to achieve a strategy that attracts, motivates and retains executive management of the quality required to run the Group successfully. The strategy promotes the long-term success of Smiths, while reflecting the views of all stakeholders.
The Committee also approves the service contracts of the Executive Directors and reviews any major changes in Group employee remuneration structures, including the incentive arrangements that apply across the wider workforce.
In order to fulfil its role the Committee – Annually reviews the ongoing appropriateness and relevance of the Remuneration Policy
– Reviews business plans and performance to assess their potential impact on existing and future incentive arrangements
– Reviews remuneration of the wider workforce and related policies to ensure internal alignment of reward
– Considers environmental, social and governance (ESG) risks when determining remuneration policy
– Utilises external advisers to understand remuneration trends in the market. Deloitte LLP were appointed in January 2020 through a competitive tender process
– Conducts an annual review of the Committee’s performance and Terms of Reference
– Prepares a Remuneration Report annually for inclusion in the Annual Report
– Meets at least three times a year
I am pleased to present the Remuneration Report for the year to 31 July 2020.
We find ourselves living through extraordinary times. Our reward framework and related workforce policies have helped to keep our people safe and supported through the COVID-19 crisis. Our people and our business have demonstrated resilience in continuing to deliver for our customers and support vital industries, whilst carefully planning resources in the right way to ensure that the business is well placed for sustainable improvement.
Taking into consideration the evolving global market conditions, the strategic restructuring programme announced in the June trading statement and the impact on employees, a general salary freeze will apply for FY2021. This is a prudent step and will apply across all of Smiths Group, including Executive Directors and other Executive Committee members.
The Committee considered outcomes under the FY2020 annual bonus and FY2018 LTIP awards in the context of the wider external environment and stakeholder experience. In the light of the decision to pay a dividend this year, the positive share price reaction over the last few months and the Company’s early decision not to apply for UK furlough payments, the Committee considered it appropriate to award a bonus of 17.2% of maximum for FY2020 to the Executive Directors reflecting achievements against the performance targets set at the beginning of the financial year. One third of the bonus earned will be deferred into shares. The FY2018 LTIP award vested at 31.3% of maximum, reflecting performance over a three-year period. No discretion was exercised in respect of Executive Director incentive outcomes for the year.
Our objectives are to create clear alignment between remuneration and sustainable, long-term stakeholder interests. We take account of shareholder views and ensure that performance supports the delivery of business strategy through targeting our key performance indicators (KPIs).
OUR PEOPLE HAVE SHOWN RESILIENCE, CONTINUING TO SUPPORT CUSTOMERS AND VITAL INDUSTRIES.
Remuneration Committee
K E Y CONTENT SExecutive remuneration at a glance 109
Remuneration Policy Report 112
Annual Report on Remuneration (Policy implementation) 119
Single figure table 120
Statement of implementation of Policy in FY2021 126

1 0 9S M I T H S G R O U P P L C A N N U A L R E P O R T F Y 2 0 2 0
3
– Competitive reward package to attract, motivate and retain the best talent
– Performance measures aligned to business strategy and balanced between long-term and short-term performance
– Ability to apply appropriate discretion, withhold payments and recover sums already paid
Policy review – Implemented a number of amendments to the application of the Remuneration Policy including review of performance measures to remove duplication
– Considered changes to institutional shareholder guidelines and the impact of these on our approach to implementation of the Policy including retirement benefit provision
Fixed pay – Approved FY2021 salary freeze for the Executive Directors and other Executive Committee members and no increase in fees for the Chairman
– Reviewed and agreed a new retirement benefit policy for incumbent Executive Directors
Performance related pay – Considered and approved annual incentive plan payouts and set targets for the new financial year
– Determined vesting levels for LTIP awards and agreed basis for FY2021 long-term incentive awards
Activities of the Committee in FY2020
The key principles of our Policy
Elements of Executive Directors’ pay
Note: Figures are based on Chief Executive’s remuneration package for FY2020
T A R G E T P E R F O R M A N C E
M A X I M U M P E R F O R M A N C E
Fixed 41%
59%
63%
37%
31%
10%
22%
11%
26%
Performance related
Short term
Long term
Base salary
Benefits and pension
Annual bonus – Cash
Annual bonus – Shares
LTIP
Fixed
Performance related
Short term
Long term
Base salary
Benefits and pension
Annual bonus – Cash
Annual bonus – Shares
LTIP
20%
80%
39%
61%
15%
5%
19%
9%
52%
Executive remuneration at a glanceThe steps we have previously taken to grant long-term incentive plan awards based on a fixed number of shares continue to deliver alignment with shareholder interests.
We have made a commitment to further reduce incumbent Executive Director pension provisions. As announced in 2019, both Executive Directors agreed to freeze the monetary value of their pensions at the FY2019 level. Executive Director pension levels will be further reduced on a phased basis to be aligned with rates available to the wider workforce by the end of 2022, in line with investor guidelines.
During the year we reconfirmed our policy relating to post-employment shareholding requirements, further details of which are set out on page 111. As part of the 2021 Remuneration Policy review, we are also committed to further developing our approach to post-employment shareholding requirements.
During FY2020 we initiated a detailed review of our global benefits to ensure that by the end of FY2021 we have a coherent and fully aligned employee benefit offering protecting and supporting colleagues across Smiths.
Looking forward, we will undertake a thorough review of the Remuneration Policy and intend to consult with shareholders on any proposed changes, prior to presenting the revised Policy for approval at the 2021 AGM.
Bill SeegerCHAIR OF THE REMUNERATION COMMITTEE

1 1 0 S M I T H S G R O U P P L C A N N U A L R E P O R T F Y 2 0 2 0
G O V E R N A N C E
R E M U N E R A T I O N C O M M I T T E E R E P O R T C O N T I N U E D
Performance outcome and linkage to strategy
Single total figure of remuneration for Executive Directors
C H I E F E X E C U T I V EFY2020 £000
C H I E F F I N A N C I A L O F F I C E RFY2020£000
T H E T H R E E K E Y S T R A T E G I C O B J E C T I V E S F O R T H E B U S I N E S S A R E :
Outperform our chosen markets
Deliver world-class competitiveness Strong financial framework
Annual bonus – FY2020
EPS after tax40% weighting
Headline operating cash conversion
20% weighting
Personal objectives
10% weighting
8%9.2%0%
Above target Between threshold and target Below threshold
Organic sales growth 30% weighting
0%
Performance measures driving remuneration
LTIP – 3 years ending 31 July 2020
EPS growth before tax
35% weighting
Return on Capital Employed
35% weighting
Headline operating cash conversion
30% weighting
19.4%11.9%0%
DEF
INE
FOCUSMAXIM
ISE
INN
OVATEENGAGE
EXECUT
1
3
2
E
Outperform our chosen markets
+ Read more on page 16
+ Read more on page 17
Strong financial framework
+ Read more on pages 18-21
Deliver world-class competitiveness
1
2
3
1 321 32 321 32 323231
Fixed pay £1,106
Annual bonus £260
Long-term incentives £830
Total £2,196
Fixed pay £681
Annual bonus £139
Long-term incentives £373
Total £1,193

1 1 1S M I T H S G R O U P P L C A N N U A L R E P O R T F Y 2 0 2 0
3
The table below summarises how the Remuneration Policy has been implemented in FY2020 and highlights any changes from previous reports.
Base salary Annual bonus Long-term incentive plan
Fixed remuneration which reflects required skills and expertise to deliver the Group’s objectives.
Increases to Executive Director salaries in FY2020 were below or in line with the average increase for UK employees of 2.9%.
– Maximum bonus opportunity remains unchanged at 180% of base salary for Chief Executive
– Maximum bonus opportunity remains unchanged at 150% of base salary for Chief Financial Officer
– FY2020 outcome of 17.2% of maximum – 33% of annual bonus deferred into shares for three years
Withholding and recovery provisions apply.
– Maximum award opportunity remains unchanged at 400% of base salary
– FY2020 award of 179,627 shares for Chief Executive (same number of shares as FY2019)
– FY2020 award of 95,837 shares for Chief Financial Officer (same number of shares as FY2019)
– 31.3% vesting level for three year performance period ending 31 July 2020
– Two year post-vesting holding period applies for all awards from FY2019
Withholding and recovery provisions apply.
Shareholding guidelines
Personal shareholdings (including deferred bonus shares and vested but unreleased shares, net of tax) for Chief Executive remain above the 250% of salary minimum guideline. Chief Financial Officer is expected to reach the minimum guideline of 200% of base salary within five years of appointment to the Board (1 January 2023).
During the year the Committee clarified its policy on post-employment shareholding requirements (Provision 36 in the UK Corporate Governance Code). The application of good leaver provisions for Executives will be conditional on retaining a number of shares equal to the in-employment shareholding guideline, or actual holding, if lower for a minimum holding period of two years from the date of leaving. No Executives to whom this policy would apply left the Group during the year. We will further develop our approach to post-employment shareholding requirements as part of our wider 2021 policy review.
Implementation of Remuneration Policy in FY2020
Summary of Executive Directors’ remuneration FY2020
Chief Executive (£000) Chief Financial Officer (£000)
FY2020 FY2019 FY2020 FY2019
Base salary 840 820 538 525Benefits 61 54 12 12Retirement allowance 205 205 131 131Annual bonus – cash 173 405 93 216 Annual bonus – deferred shares 87 203 46 108Long-term incentives 702 2,100 373 –Performance share award 128 346 – –
Total 2,196 4,133 1,193 992
Benefits
Market competitive benefits package consisting of healthcare, life and disability insurance and car benefit. No change in provision.
Retirement allowancePolicy is for new Executive Directors to receive same percentage allowance as wider workforce.
Executive Director pension levels were frozen at FY2019 monetary value. Pension levels will be further reduced to be aligned with rates available to the wider workforce on an phased basis by the end of 2022, in line with investor guidelines.

1 1 2 S M I T H S G R O U P P L C A N N U A L R E P O R T F Y 2 0 2 0
G O V E R N A N C E
Operation Opportunity Performance measures Policy guideline updates
Base salary
To attract, motivate and retain Executive Directors with the required skills and expertise to deliver the Group’s objectives.
Salaries are reviewed (but not necessarily adjusted) annually and benchmarked against comparable roles at companies of similar market capitalisation, revenues and complexity.
The review also takes into account individual performance and experience, the relative performance of the Company and the Remuneration Policy operated across the Group as a whole.
The salary increase date (if applicable) is 1 October.
Base salaries are adjusted according to the outcome of the annual review and will be disclosed in the Annual Report on Remuneration.
Salary increases for the Executive Directors will normally be in line with those awarded to Smiths wider employee population. Where increases are awarded in excess of this, for example if there is a material change in the responsibility, size or complexity of the role, or a significant change in the market competitiveness of salary, the Committee will provide the rationale in the relevant year’s Annual Report on Remuneration.
Not applicable None required
Benefits
To provide market-competitive benefits to Executive Directors.
Benefits comprise car benefit, life assurance and private healthcare insurance, and other such benefits as the Committee may from time to time determine are appropriate. These include, but are not limited to, relocation allowances, as well as any other future benefits made available either to all employees globally or all employees in the region in which the Executive Director is employed.
Benefits vary by role and individual circumstances.
Benefits in respect of the year under review are disclosed in the Annual Report on Remuneration.
It is not anticipated that the costs of benefits provided will increase significantly in the financial years over which this Policy will apply, although the Committee retains discretion to approve a higher cost in exceptional circumstances (e.g. to facilitate recruitment, relocation, expatriation, etc.) or in circumstances where factors outside the Group’s control have changed materially (e.g. market increases in insurance costs).
Not applicable None required
Remuneration Policy ReportThis section of the report sets out our Remuneration Policy for Directors, which shareholders approved at the AGM held on 14 November 2018 and which is effective for a period of up to three years from this date. The Policy Report below sets out where the Policy has been updated to take account of investor guidelines. The Remuneration Policy can be viewed in the corporate governance section of the Company’s website.
Remuneration Policy for the Executive Directors
R E M U N E R A T I O N C O M M I T T E E R E P O R T C O N T I N U E D

1 1 3S M I T H S G R O U P P L C A N N U A L R E P O R T F Y 2 0 2 0
3
Operation Opportunity Performance measures Policy guideline updates
Pensions
Enables Executive Directors to save for their retirement in a cost-efficient manner.
Executives may choose either to participate in the Company’s defined contribution pension plan or to receive a pension allowance in lieu thereof (and thus arrange their own pension provision).
Pension allowances for the all employee population are reviewed periodically to ensure market competitiveness.
Base salary is the only element of remuneration that is taken into account when determining pension contributions or allowances.
The maximum level of pension contribution (or allowance in lieu thereof) for new Executive Directors will be in line with the contribution level for the wider workforce in the relevant country.
Commitment to freeze monetary value or retirement allowance of incumbent Executive Directors and reduce to the same allowance as wider workforce no later than 31 December 2022, on a phased basis.
Not applicable The employment contracts of the two Executive Directors currently provide for a cash allowance of 25% of base salary in lieu of pension provision. Both Executive Directors have agreed to freeze the monetary value of the allowance at the FY2019 level, reducing the level of benefit to 24.4% of base salary for FY2020 and FY2021. The allowance will reduce to the contribution level for the wider workforce no later than 31 December 2022, on a phased basis.
Annual bonus
Incentivises short-term priorities in line with the Group’s business strategy.
Annual bonus payments are determined based upon performance against measures and targets set by the Committee at the start of each financial year.
After the end of the financial year, to the extent that the performance criteria have been met, up to 67% of the earned annual bonus is paid in cash. The balance is deferred into shares and released after a further period of three years, without further performance or other conditions. Dividends accrue and are payable in cash at the end of the deferral period.
The Committee may use its discretion to adjust payout of the annual bonus to Executive Directors, within the range of the minimum to maximum opportunity, including reducing it down to zero. Such discretion will only be used where the Committee believes that performance against the prescribed targets does not accurately reflect the Company’s underlying performance.
Cash payments will be subject to clawback and deferred share bonuses awarded will be subject to malus for a period of three years from the end of the relevant performance year, in case of misconduct or material misstatement in the published results of the Group.
The maximum annual bonus opportunity for Executive Directors is up to 180% of salary.
The annual bonus opportunities for the year under review and the coming year are disclosed in the Annual Report on Remuneration.
Under the financial element of the annual bonus, threshold performance must be exceeded before any annual bonus becomes payable. The percentage payout then increases according to the level of achievement against targets. Payment of 25% of maximum opportunity occurs on achievement of threshold performance and 60% of maximum opportunity on achievement of on-target performance.
Based on a combination of financial and non-financial performance measures linked to short-term objectives. Financial performance will account for no less than 70% of the bonus opportunity and may include, but is not limited to, profit, organic sales growth and cash measures.
A review of how dividends accrued on deferred bonus awards are payable (shares or cash) will be undertaken as part of the next Policy review.
For awards in FY2021 a minor change has been made to the performance measures to avoid duplication of short and long-term metrics (see page 126).

1 1 4 S M I T H S G R O U P P L C A N N U A L R E P O R T F Y 2 0 2 0
G O V E R N A N C E
Operation Opportunity Performance measures Policy guideline updates
Long-Term Incentive Plan (LTIP)
Incentivises long-term value creation for shareholders, sustainable growth and effective management of the balance sheet.
Awards of conditional shares are granted annually and vest after a performance period of at least three years, subject to the achievement of performance targets set by the Committee at the start of each cycle. For awards made in FY2019 onwards, vested shares will be subject to a two year post vesting holding period. Details of such holding period will be disclosed in the Annual Report on Remuneration for the year in which the relevant award is made.
To the extent that the performance targets are not met over the performance period, awards will lapse. No retesting of awards under any performance condition is permitted.
Dividends accrue and are paid in cash at the end of the vesting period, on shares that vest.
The Committee may use its discretion to adjust payout of the LTIP to Executive Directors, within the limits of the Plan rules. Such discretion will only be used where the Committee believes that performance against the prescribed targets does not accurately reflect the Company’s underlying performance.
Awards will be subject to malus over the vesting period and clawback from the vesting date for a period of five years from the date of grant, in case of misconduct or material misstatement in the published results of the Group.
The maximum LTIP award opportunity for Executive Directors is up to 400% of salary.
For awards made from FY2019 onwards, the award will be a fixed number of shares. In FY2019 this fixed number of shares was equivalent to 300% of salary for the Chief Executive and 250% of salary for the Chief Financial Officer. In subsequent years the Executive Directors will each be awarded the same fixed number of shares as in FY2019. In the event that the Company share price increases by more than 33% during the three year policy period, the fixed number of shares awarded will be restricted so that the value of the award is no more than 33% greater than the value of the FY2019 award at the date of grant. This will ensure that the maximum LTIP award opportunity is not exceeded.
LTIP award sizes for the year under review and the coming year are disclosed in the Annual Report on Remuneration.
At threshold performance against each measure, up to 25% of the award subject to that measure vests, increasing on a straight-line basis to 100% for achieving stretch targets.
Based on measures of performance that are aligned with the Group’s strategy.
To ensure continued alignment with the Company’s strategic priorities, the Committee may, at its discretion, vary the measures and their weightings from time to time (but will consult shareholders before making significant changes to the performance measures).
A review of how dividends accrued on LTIP awards are payable (shares or cash) will be undertaken as part of the next Policy review.
For awards in FY2021 a minor change has been made to the performance measures to avoid duplication of short and long-term metrics (see page 126).
Sharesave
Encourages ownership of shares in the Company and alignment with shareholder interests.
All UK employees (including Executive Directors) may save up to a maximum monthly savings limit (as determined by UK legislation, or other such lower limit as the Committee may determine at its discretion) for three years.
At the end of the savings period, participants may use their savings to exercise options to acquire shares, which may be granted at a discount of up to 20% to the market price on grant.
Not applicable None required
Shareholding guidelines
Encourages ownership of shares in the Company and alignment with shareholder interests.
Executive Directors must build a minimum shareholding of 250% (for the Chief Executive) or 200% (for other Executive Directors) of base salary within five years of appointment to the Board. 50% of any net vested share awards (after sales to meet tax liabilities) must be retained until the minimum shareholding requirements are met.
Shareholding guidelines also exist below Executive Director level.
Existing good leaver provisions in our share plan rules underpin a post-employment shareholding requirement in line with the above.
Not applicable Position on post-employment shareholding guidelines to be reconsidered as part of 2021 Policy review.
Remuneration Policy Report continued
Remuneration policy for the Executive Directors continued
R E M U N E R A T I O N C O M M I T T E E R E P O R T C O N T I N U E D

1 1 5S M I T H S G R O U P P L C A N N U A L R E P O R T F Y 2 0 2 0
3
Existing grants or entitlementsIt is the Company’s intention to honour all pre-existing commitments at the date of this Report and to honour all future obligations entered into, consistent with the approved Remuneration Policy in force at that time. In the case of internal promotion to the Board, the Committee intends to honour any pre-existing commitments made prior to becoming a member of the Board, including where these differ from the approved Remuneration Policy.
Performance measure selection and approach to target settingAnnual bonus measures are selected to reflect the Company’s short-term financial and non-financial priorities. At its discretion, the Committee may vary these measures at the start of each financial year to maintain close alignment between executive incentives and the annual operating plan.
The measures used in the Long-Term Incentive Plan are selected to reflect Smiths Group strategy and to reinforce the key drivers of value creation and growth highlighted elsewhere in this Annual Report: earnings per share, cash measures, organic sales growth and delivering sustainable return on capital.
Annual bonus and LTIP targets are reviewed annually, and take into account the Company’s strategic plan, analyst forecasts for Smiths and its sector comparators and external expectations for Smiths Group key markets. The Committee sets targets that it considers to be challenging but attainable and aligned to the Company’s business objectives over the short term, as reflected in the annual operating plan, and longer term, consistent with the strategic plan. On top of aligning incentives with strategy, targets are designed to ensure that participants’ interests are aligned with the interests of shareholders.
The linkage of the performance measures to business strategy is set out in the ‘Executive remuneration at a glance’ section on page 110.
Alignment of policy between Executive Directors and other employeesThe reward policy for other senior employees is broadly consistent with that for Executive Directors, and the Company does not currently operate any incentive plans in which only Executive Directors participate. The Committee reviews each year the all-employee pay and incentive trends and takes these into account in setting Executive Director remuneration levels. The principles of remuneration packages being market related, performance sensitive and driven by business needs are applied at all levels and geographies in the Group and the performance measures used in incentive plans apply generally across all levels of the business.
Alignment with the UK Corporate Governance CodeThe table below details how the Committee addresses the factors set out within Provision 40 of the UK Corporate Governance Code
Clarity – The Committee welcomes transparency and regular engagement with shareholders with regard to executive remuneration. During the upcoming review of Remuneration Policy in 2021, the Committee Chairman will consult with shareholders to fully understand their views on proposed changes
– The Committee Chairman has engaged with the workforce across multiple levels of the organisation via live video conferencing and joined the wider Smiths Board on pre-recorded video communications cascaded to all colleagues
Simplicity – Participants in incentive plans receive annual communications to confirm award levels and performance measures. Supporting guidance documents and instructional videos are available online. The Remuneration Policy for Executive Directors underpins that of the wider workforce and during the 2021 Policy review consideration will be given to further simplification of arrangements
Risk – The Committee considers the effective management of risk throughout the delivery of incentive plans, applying reasonable discretion to override formulaic outcomes if necessary
– The Committee considers that the structure of incentive arrangements does not encourage unnecessary risk taking
– For Executive Directors, one third of the annual bonus payment is deferred into shares with an additional three years until vesting
– Malus and clawback provisions are in place for incentive plans and are clearly communicated
Predictability – Our Policy clearly outlines the maximum award levels and vesting outcomes applicable to annual bonus and LTIP. As stated above under ‘risk’, the Committee has the ability to apply discretion to formulaic outcomes and clear malus and clawback provisions exist
Proportionality – There is a robust link between strategic business objectives and performance outcome, as outlined on page 110.
– Our Policy for annual bonus and LTIP outlines threshold, target and maximum opportunity levels, with actual outcomes dependent on performance achieved against robust, pre-determined measures.
– Through the design of the policy and the discretion of the Committee, poor performance is not rewarded.
Alignment to culture – Smiths Group values of passion, integrity, respect, ownership and customer focus underpin the design and operation of the incentive programmes. The clear business strategy that is shown in the diagram on page 110 is supported by these values which are widely communicated across the Company.

1 1 6 S M I T H S G R O U P P L C A N N U A L R E P O R T F Y 2 0 2 0
G O V E R N A N C E
R E M U N E R A T I O N C O M M I T T E E R E P O R T C O N T I N U E D
Pay scenariosThe graphs below provide estimates of the potential future reward opportunity for the Chief Executive and the Chief Financial Officer, and the potential mix between the different elements of remuneration under four different performance scenarios; ‘Minimum’, ‘On-Target’, ‘Maximum’ and ‘Maximum + Share Price growth’ (which assumes a 50% increase in share price over the LTIP vesting period and bonus deferral period).
Andy Reynolds Smith (£000)Minimum
Fixed Pay (salary, benefits and pension)
On-Target
Maximum
Maximum + share price growth
Cash bonus Deferred bonus LTIP
£1,110100%
42% 23% 12% 23%
20% 10% 48%
16% 12% 56%
22%
17%
£2,624
£5,039
£6,497
John Shipsey (£000)Minimum
Fixed Pay (salary, benefits and pension)
On-Target
Maximum
Maximum + share price growth
Cash bonus Deferred bonus LTIP
£683100%
46% 22% 11% 22%
19% 10% 46%
15% 11% 54%
25%
19%
£1,490
£2,779
£3,557
Potential opportunities illustrated above are based on the Policy, applied to the annualised base salaries in force from 1 October 2020. It should be noted that any awards granted under the LTIP in a year do not normally vest until the third anniversary of the date of grant. This illustration is intended to provide further information to shareholders on the relationship between executive pay and performance. Please note, however, that actual pay delivered will further be influenced by factors such as share price appreciation or depreciation and the value of dividends paid. The following assumptions have been made in compiling the above charts:
Minimum On-Target Maximum
Base salary Annual base salaryPension Company pension allowance
Other benefitsValue of
annual benefits providedCash bonus 0% of salary 72% (CEO), 60% (CFO) of salary 120% (CEO), 100% (CFO) of salary
Deferred bonus 0% of salary 36% (CEO), 30% (CFO) of salary 60% (CEO), 50% (CFO) of salary
LTIP 0% of salary 71% (CEO), 60% (CFO) of salary 286% (CEO), 238% (CFO) of salary
Operation OpportunityPerformance measures
Annual fee
To attract, motivate and retain Non-executive Directors with the required skills and expertise.
Fees may be paid in cash or a combination of cash and shares and are reviewed annually (but not necessarily increased) to ensure they compare appropriately to fees payable at companies of similar size and complexity to Smiths.
Additional fees are paid to the Chairs of the Nomination & Governance, Audit & Risk, and Remuneration Committees and to the Senior Independent Director to reflect the additional time commitment of these roles. Additional fees may also be paid to members of the Nomination & Governance, Audit & Risk, and Remuneration Committees but not members of other committees such as the Transaction Committee.
The additional fee paid to the Chairman of the Board is determined by the Committee, absent the Chairman, while the fees for all Non-executive Directors are agreed by the Executive Directors.
Fees are adjusted according to the outcome of the annual reviews.
The basic fee for Non-executive Directors is subject to the maximum aggregate annual fee of £1,000,000, as approved by shareholders in 2017 in the Company’s Articles of Association.
Not applicable
Other The Chairman and Non-executive Directors are not eligible for benefits or any pension provision, nor are they eligible for bonuses or participation in share schemes. To reflect the greater time commitments expected of the Non-executive Directors when attending overseas Board meetings, an additional fee is paid to them for each such meeting, and they are reimbursed for actual expenses incurred (transportation, hotels etc.). Modest retirement gifts may be provided for Non-executive Directors in appropriate circumstances.
Remuneration Policy Report continued
Remuneration policy for the Chairman and Non-executive Directors

1 1 7S M I T H S G R O U P P L C A N N U A L R E P O R T F Y 2 0 2 0
3
Executive DirectorsThe Committee approves the remuneration of each Executive Director on their appointment. In setting the remuneration during the recruitment of external appointments, the Committee will apply the following policy:
Pay element Policy on recruitment
Salary Salary on recruitment is determined based on the same principles as the annual salary review, as outlined in the policy table.
Pension As described in the policy table.
Benefits As described in the policy table.
Annual Bonus As described in the policy table and typically pro-rated for the proportion of year served.
Maximum annual award opportunity: 180% of salary with mandatory deferral of 33% into shares.
LTIP May be considered for an award under the LTIP on similar terms to other executives.
Maximum annual award opportunity: 400% of salary.
Other The Committee may make an award in recognition of incentive arrangements forfeited on leaving a previous employer. Any such award will take account of relevant factors including the fair value of awards forfeited, any performance conditions attached, the likelihood of those conditions being met and the proportion of the vesting period remaining. For the purposes of making such awards, but for no other reason, the Committee may avail itself of Listing Rule 9.4.2R. The Committee may also make payments to cover reasonable expenses in recruitment and relocation, and any other miscellaneous expenses including but not limited to housing, tax and immigration support.
In cases of appointing a new Executive Director by way of internal promotion, the policy will be consistent with that for external appointees, as detailed above. Any commitments made prior to an individual’s promotion will continue to be honoured even if they would not otherwise be consistent with the policy prevailing when the commitment is fulfilled, although the Company may, where appropriate, seek to revise an individual’s existing service contract on promotion to ensure it aligns with other Executive Directors and prevailing market best practice.
Disclosure on the remuneration structure of any new Executive Director (external or internal), including details of any exceptional payments, will be disclosed in the RNS notification made at the time of appointment and in the Annual Report on Remuneration for the year in which the recruitment occurred.
Respecting diversity is woven into everything we do. We ensure that equal opportunities are inherent when interviewing, recruiting and promoting employees with decisions made based on skills and expertise first and foremost.
Non-executive DirectorsIn recruiting a new Non-executive Director, the Committee will use the policy as set out in the table on page 116.
Executive Directors’ service contractsThe Company’s policy is that Executive Directors are normally employed on terms which include a one-year rolling period of notice from the Company and six months’ notice from the individual. The contract includes provision for the payment of a predetermined sum in the event of termination of employment in certain circumstances (but excluding circumstances where the Company is entitled to dismiss without compensation). In addition to payment of basic salary, pension allowance and benefits in respect of the unexpired portion of the one-year notice period, the predetermined sum would include annual bonus and share awards only in respect of the period they have served, payable following the end of the relevant performance period and subject to the normal performance conditions.
Andy Reynolds Smith is employed under a service contract with the Company dated 6 July 2015 and effective from 25 September 2015. John Shipsey is employed under a service contract with the Company dated and effective from 18 October 2017. He became an Executive Director on 1 January 2018.
The service contracts for both Executive Directors may be terminated by 12 months’ notice given by the Company or six months’ notice given by the Director. The Company may elect to terminate the contract by making a payment in lieu of notice equal to the Director’s base salary and benefits (including pension allowance) in respect of any unserved period of notice. The service contracts contain specific provisions enabling a reduction in any phased payments in lieu of notice, in the event that the Director finds alternative employment during the notice period. The service contracts are available for viewing at the Company’s Registered Office.
Approach to remuneration on recruitment and leaving
1 1 8 S M I T H S G R O U P P L C A N N U A L R E P O R T F Y 2 0 2 0
G O V E R N A N C E
Chairman’s and Non-executive Directors’ letters of appointmentThe Chairman and the Non-executive Directors serve the Company under letters of appointment and do not have contracts of service or contracts for services. Except where appointed at a general meeting, Directors stand for election by shareholders at the first AGM following appointment. The Board has resolved that all Directors who are willing to continue in office will stand for re-election by the shareholders each year at the AGM. Either party can terminate the appointment on one month’s written notice and no compensation is payable in the event of an appointment being terminated early. The letters of appointment or other applicable agreements are available for viewing at the Company’s Registered Office.
Non-executive Director Date of appointment
Sir George Buckley 1 August 2013Bruno Angelici 1 July 2010Olivier Bohuon 1 July 2018Pam Cheng 1 March 2020Dame Ann Dowling 19 September 2018Tanya Fratto 1 July 2012Karin Hoeing 2 April 2020Bill Seeger 12 May 2014Mark Seligman 16 May 2016Noel Tata 1 January 2017
Leaving and change-of-control provisionsFor those individuals regarded as ’bad leavers’ (e.g. voluntary resignation or dismissal for cause), annual bonus awards are forfeited, and outstanding awards under the LTIP automatically lapse. Deferred bonus awards are forfeited on dismissal for cause.
A ‘good leaver’ will typically remain eligible for a pro-rated annual bonus award to be paid after the end of the financial year and deferred bonus awards will be paid out at the normal vesting date. LTIP awards will typically vest at the normal vesting date to the extent that the associated performance conditions are met, but will normally be pro-rated on the basis of actual service within the performance period. In cases of death or disability, individuals are automatically deemed to be good leavers under the plan rules of the LTIP. All other good leavers will be defined at the discretion of the Committee on a case-by-case basis.
In the event of a change of control, LTIP awards will vest to the extent that each of the performance conditions is met based on the Committee’s assessment of performance over the performance period to the date of change of control. For internal performance measures, the Committee may exercise its judgement in determining the outcome based on its assessment of whether or not the performance conditions would have been met to a greater or lesser extent at the end of the full performance period. Awards will also normally be pro-rated to reflect the time that has elapsed between the grant of the award and the date of change of control.
The Committee retains discretion to vary these provisions on a case-by-case basis.
In connection with the termination of an Executive Director’s contract, the Company may make a payment on account of accrued but untaken leave and may pay outplacement and legal fees for support provided to the individual.
External appointmentsSubject to the overriding requirements of the Company, the Committee allows Executive Directors to accept one external appointment where it considers that such appointment will contribute to the Director’s breadth of knowledge and experience. Executive Directors are not permitted to take on the chairmanship of another FTSE 100 company or equivalent organisation. Directors are permitted to retain fees associated with such appointments. Non-executive Directors must obtain the approval of the Board before accepting any additional appointments once they have joined the Board.
Consideration of employment conditionsThe Committee always takes into account pay and employment conditions elsewhere in the Company. We do not consult directly with employees regarding Executive Director pay. However, the Committee is regularly, and at least annually, provided with information on pay trends and ratios of the wider employee population across the Group.
Consideration of shareholder viewsThe Committee has taken account of the views expressed by shareholders, both from feedback from the 2018 Policy review and from regular meetings with major shareholders. A number of changes have been implemented in FY2020 and the Committee will keep the Policy and its approach to implementation under review in the context of evolving market practice and investor expectations.
Remuneration Policy Report continued
R E M U N E R A T I O N C O M M I T T E E R E P O R T C O N T I N U E D

1 1 9S M I T H S G R O U P P L C A N N U A L R E P O R T F Y 2 0 2 0
3
Committee members and meeting attendance in FY2020The membership of the Committee and their meeting attendance during the year is set out on page 89 of this Report. Bill Seeger had served on a remuneration committee for at least 12 months prior to his appointment as Remuneration Committee Chair.
Sir George Buckley is absent when his own remuneration as Chairman of the Board is under consideration. The Chief Executive attends meetings of the Committee by invitation but he is not involved in the determination of his own remuneration, or present during consideration of any changes to it.
Advisers to the CommitteeDuring the year, the Committee received material assistance and advice from the Chief Executive, the Group HR Director, the Global Reward Director, Mercer | Kepler, Deloitte LLP and Freshfields Bruckhaus Deringer LLP. The Committee’s appointed independent remuneration adviser changed from Mercer | Kepler to Deloitte LLP, following a competitive tender in 2019, with effect from 1 January 2020. The Company Secretary is secretary to the Committee.
The Company paid a total fee of £4,823 to Mercer | Kepler and £78,050 to Deloitte LLP in relation to remuneration advice to the Committee during the year. Fees were determined on the basis of time and expenses.
During FY2020, Deloitte LLP provided the Committee with information on market trends including the impact of COVID-19, compliance support for this year’s Directors’ Remuneration Report and the provision of other advice relating to remuneration governance and market practice. Deloitte LLP is a founding member of the Remuneration Consultants Group and a signatory to its Code of Conduct. Deloitte LLP provided additional tax advisory services including global corporation tax compliance and employee mobility advice, as well as company secretarial, transaction advisory and internal audit co-source services. The Committee is satisfied that the advice provided by Deloitte LLP is objective and independent and that they do not have connections with the Group that may impair their independence.
Summary of shareholder binding vote on Directors’ Remuneration Policy (FY2019)The voting outcome in November 2018 for the Directors’ Remuneration Policy was as follows:
Votes for% of votes
cast forVotes
against% of votes
cast againstTotal
votes castVotes withheld
(abstentions)
230,167,925 81.61% 51,868,709 18.39% 282,036,634 24,949,627
Summary of shareholder advisory vote on Directors’ Remuneration Report (FY2020)The voting outcome in November 2019 for the Directors’ Remuneration Report was as follows:
Votes for% of votes
cast forVotes
against% of votes
cast againstTotal
votes castVotes withheld
(abstentions)
294,243,250 98.11% 5,671,458 1.89% 299,914,708 13,080,429
Annual Report on RemunerationThis section of the Remuneration Report details how our Policy was implemented in the year ended 31 July 2020.

1 2 0 S M I T H S G R O U P P L C A N N U A L R E P O R T F Y 2 0 2 0
G O V E R N A N C E
Directors’ single figure of annual remuneration (audited)Executive Directors
Salary/fees Benefits2
Payments in lieu of pension
contribution Total fixed Annual bonus3Long-term incentives4
Performanceshare award5
Total performance
related Total
FY2020 £000
FY2019 £000
FY2020 £000
FY2019 £000
FY2020 £000
FY2019 £000
FY2020 £000
FY2019 £000
FY2020 £000
FY2019 £000
FY2020 £000
FY2019 £000
FY2020 £000
FY2019 £000
FY2020 £000
FY2019 £000
FY2020 £000
FY2019 £000
Andy Reynolds Smith1 840 820 61 54 205 205 1,106 1,079 260 608 702 2,100 128 346 1,090 3,054 2,196 4,133
John Shipsey1 538 525 12 12 131 131 681 668 139 324 373 – – – 512 324 1,193 992
Chairman and Non-executive Directors
Salary/fees Benefits11 Total
FY2020 £000
FY2019 £000
FY2020 £000
FY2019 £000
FY2020 £000
FY2019 £000
Sir George Buckley6 454 443 92 138 546 581Bruno Angelici 75 74 4 13 79 87Olivier Bohuon 75 74 3 2 78 76Pam Cheng7 30 – – – 30 –Dame Ann Dowling 75 60 – 2 75 62Tanya Fratto 83 90 6 12 89 102Karin Hoeing7 24 – – – 24 –Bill Seeger8 123 124 4 18 127 142Mark Seligman9 95 94 1 1 96 95Noel Tata 87 94 – - 87 94Sir Kevin Tebbit10 – 33 – 5 – 38
1 There was no share price appreciation attributable to the FY2020 Long Term Incentives for Andy Reynolds Smith and John Shipsey (FY2019 9.2% for Andy Reynolds Smith, no award vested for John Shipsey). No discretion has been applied to the amounts attributable to share price appreciation.
2 Benefits for Executive Directors include car/chauffeur benefits, life assurance, disability insurance and private healthcare insurance.
3 Andy Reynolds Smith has deferred 33% of his bonuses earned since FY2016 into Smiths shares. John Shipsey has deferred 33% of his bonuses earned since FY2018 into Smiths shares. The total bonus paid during the year, including deferral, is captured under ‘annual bonus’ above. The deferral is for a three-year period and is not subject to any further performance or other conditions.
4 The Long Term Incentive value for FY2019 for Andy Reynolds Smith has been restated to show the actual amount (rather than the estimated amount in last year’s Report) and to include a dividend accrual payment of £164,364 which was paid on vesting. The total remuneration is also restated accordingly. The estimated Long Term Incentive values for FY2020 are calculated using the vesting percentage of 31.3% and the average share price over the 3 months to 31 July 2020 of 1,341.68p; they also include dividend accrual payments of £57,671 for Andy Reynolds Smith and £30,637 for John Shipsey, payable on vesting.
5 Andy Reynolds Smith was awarded 26,602 Performance shares in 2015 which vested in 2019 (the performance criteria for these shares was the same as the FY2017 LTIP Outcome of 75.0%). He was also awarded 26,602 Performance shares which vest in October 2020. The estimated value shown for FY2020 is calculated using the vesting percentage of 31.3% and the average share price over the 3 months to 31 July 2020 of 1,341.68p. The FY2020 figure also includes an amount of £16,355 in respect of the estimated value of 1,219 dividend equivalent shares.
6 Sir George Buckley’s fee comprised his Non-executive Director’s fee; an additional fee for being Chairman and his additional fee for chairing the Nomination & Governance Committee.
7 Pam Cheng and Karin Hoeing’s fees for FY2020 comprised Non-executive Director’s fees from the date of their respective appointments.
8 Bill Seeger’s fees for FY2020 comprised his Non-executive Director’s fee, his additional fee for chairing the Remuneration Committee and his additional fee as Senior Independent Director.
9 Mark Seligman’s fees comprised his Non-executive Director’s fee and his additional fee for chairing the Audit & Risk Committee.
10 Sir Kevin Tebbit’s fees for FY2019 comprised his Non-executive Director’s fee and his additional fee as Senior Independent Director until 14 November 2018 and benefits include a retirement gift to recognise his contribution to the Board.
11 Benefits for the Chairman and Non-executive Directors relate to reimbursed travel-related and other expenses (including flight costs where applicable), which are grossed-up for the UK income tax and National Insurance contributions paid by the Company on their behalf. Figures for FY2019 have been restated to be on a consistent basis.
Annual Report on Remuneration continued
R E M U N E R A T I O N C O M M I T T E E R E P O R T C O N T I N U E D

1 2 1S M I T H S G R O U P P L C A N N U A L R E P O R T F Y 2 0 2 0
3
Incentive outcomes for FY2020 FY2020 annual bonus outcome for Andy Reynolds Smith and John Shipsey:
The table below summarises the structure of the FY2020 annual bonus, our performance and the resulting annual bonus payout for each of the Executive Directors.
Earned bonus
Director Measure Weighting
Maximum Opportunity (% of salary)
(% of max. bonus) (% salary) £000
Andy Reynolds Smith EPS after tax 40% 72% 0% 0% 0Headline Operating Cash Conversion 20% 36% 9.2% 16.6% 139
Organic Sales Growth 30% 54% 0% 0% 0
Personal Objectives 10% 18% 8.0% 14.4% 121
Total 100% 180% 17.2% 31.0% 260
John Shipsey EPS after tax 40% 60% 0% 0% 0Headline Operating Cash Conversion 20% 30% 9.2% 13.8% 74
Organic Sales growth 30% 45% 0% 0% 0
Personal Objectives 10% 15% 8.0% 12.0% 65
Total 100% 150% 17.2% 25.8% 139
The table below summarises the financial targets and the Company’s actual performance (restated at budget exchange rates) against these for the FY2020 annual bonus.
Performance targets and actual performance
MeasureThreshold
25% payoutTarget
60% payoutMaximum
100% payout Actual
EPS after tax1 103.7p 106.1p 108.7p 77.9p
Headline Operating Cash Conversion2 H1 90% 100% 105% 90%FY 90% 100% 105% 101%
Organic Sales3 £3,571m £3,610m £3,692 £3,523m
1 The EPS result includes restructuring charges and balance sheet write downs (reported figure 84.8p)
2 50% of the maximum headline operating cash conversion opportunity is available for each of H1 and FY. Figures exclude accrued restructuring costs to avoid overstatement and are adjusted for the impact of IFRS16 which was not included in the original targets (reported figures H1 98%, FY 123%)
3 Organic sales is based on revenue (including Smiths Medical) restated at budget exchange rates (reported figure £3,466m)
Personal objectivesChallenging personal objectives are set each year for the Executive Directors, to reinforce the Company’s operating and strategic priorities. The personal objectives for the Executive Directors for FY2020 comprised a number of strategic long-term enablers, some of which remain commercially sensitive, together with short term projects aligned to innovation, operational excellence and capability planning.
Achievements against objectives in the year were as follows:
Achievements Bonus out-turn (10% weighting)
Chief Executive – Development of Smiths Group Vision based on achieving sustainable growth with strong returns through purpose, attractive market positions and the foundation elements of execution – People, Excellence and Innovation
– Continued implementation of the Group operating model and corporate structure
– Progression of Smiths Innovation and Strategy Board framework plan and actions for FY2020
– Continued development of the Group wide people capability plan with a focus on progression and succession
The extraordinary events of the past few months have affected progress on some objectives, especially in the area of growth and the delayed separation of the Medical business. However the Committee has taken account of the strong leadership of the Group through this period of crisis by the Executive Directors, helping to support the future sustainability of the business and developing strong cash generation. This leadership enabled continuity of service to our customers, particularly in the supply of vitally needed medical equipment, and also focused on ensuring the provision of safe working conditions for our employees. As a result the Committee determined that an overall out-turn of 80% of maximum was appropriate for personal performance during the year for both Andy Reynolds Smith and John Shipsey (8.0% of maximum overall bonus).
Chief Financial Officer – Advancement of internal operating model improvements and upgraded Group consolidation system
– Development of Group roadmap for improved efficiency in key identified areas
– Progress in addressing underlying risks to financial control in key identified areas
– Support development of new internal Information Systems & Technology model

1 2 2 S M I T H S G R O U P P L C A N N U A L R E P O R T F Y 2 0 2 0
G O V E R N A N C E
R E M U N E R A T I O N C O M M I T T E E R E P O R T C O N T I N U E D
FY2018 LTIP outcome (audited)Awards granted under the LTIP in October 2017 were subject to the following performance conditions:
Actual performance
Measure Weighting Performance period Performance % vesting Outturn (p.a) % vesting
Group EPS growth before tax 35% 1 August 2017 to 31 July 2020
< 3% p.a. 0% -5.4% 0%
3% p.a. 8.75%≥ 12% p.a. 35.0%
Straight-line vesting between these points
Average ROCE 35% 1 August 2017 to 31 July 2020
< 15% p.a. 0% 15.4% 11.9%15% p.a. 8.75%
≥ 18% p.a. 35.0%
Straight-line vesting between these points
Average headline operating cash conversion 30% 1 August 2017 to 31 July 2020
< 85% 0% 98.0% 19.4%85% 7.5%
≥ 100% 30.0%
Straight-line vesting between these points
Total 31.3%
FY2018 LTIP outcome for Executive Directors (audited)Interests held Vesting % Interests vesting Date of vesting Market price1 Value £0002
Andy Reynolds Smith 153,354 31.3% 47,999 Oct 2020 1,341.68p 702
Interests held Vesting % Interests vesting Date of vesting Market price1 Value £0002
John Shipsey 81,469 31.3% 25,499 Oct 2020 1,341.68p 373
1 Based on the average share price over the three months to 31 July 2020 of 1,341.68p.
2 In addition an accrued dividend of £57,671 is payable to Andy Reynolds Smith and an accrued dividend of £30,637 is payable to John Shipsey at vesting date.
Annual Report on Remuneration continued

1 2 3S M I T H S G R O U P P L C A N N U A L R E P O R T F Y 2 0 2 0
3
Scheme interests awarded in FY2020 (audited)
FY2020 LTIP
During the year ended 31 July 2020, the Executive Directors were awarded a fixed number of conditional share awards under the LTIP details of which are summarised in the table below.
Face value
Executive Form of award Date of grant
Number of shares awarded Award price1 £000
% of salary
Date of vesting
Andy Reynolds Smith Conditional shares 3 Oct 2019 179,627 1,524.5p 2,738 326% Oct 2022
John Shipsey Conditional shares 3 Oct 2019 95,837 1,524.5p 1,461 272% Oct 2022
1 The closing price on 3 October 2019.
The performance conditions attached to these FY2020 LTIP awards are as follows:
Vesting schedule
Measure Weighting Performance period Performance % vesting
Group EPS growth after tax 25% 1 August 2019 to 31 July 2022
< 4% p.a. 0%4% p.a. 6.25%
≥ 11% p.a. 25.0%
Straight-line vesting between these points
Average ROCE 20% 1 August 2019 to 31 July 2022
< 15% p.a. 0%15% p.a. 5.0%
≥ 18% p.a. 20.0%
Straight-line vesting between these points
Average headline operating cash conversion 25% 1 August 2019 to 31 July 2022
< 90% 0%90% 6.25%
≥ 105% 25.0%
Straight-line vesting between these points
Organic sales growth 30% 1 August 2019 to 31 July 2022
< 3% 0%3% 7.5%
≥ 6% 30.0%
Straight-line vesting between these points
Total
FY2020 Deferred bonus award
During the year ended 31 July 2020, Andy Reynolds Smith and John Shipsey were awarded conditional shares as deferred bonus awards in relation to the FY2019 annual bonus outcome, details of which are summarised in the table below. There are no performance conditions for these awards.
Face value
Form of award Date of grant
Number of shares awarded Award price1 £000
Date of vesting
Andy Reynolds Smith Conditional shares 3 Oct 2019 12,997 1,559.8p 203 Oct 2022
John Shipsey Conditional shares 3 Oct 2019 6,933 1,559.8p 108 Oct 2022
1 The five day average of the share price to 2 October 2019.

1 2 4 S M I T H S G R O U P P L C A N N U A L R E P O R T F Y 2 0 2 0
G O V E R N A N C E
R E M U N E R A T I O N C O M M I T T E E R E P O R T C O N T I N U E D
SAYEBoth Executive Directors participate in the Smiths Group Sharesave scheme. For Andy Reynolds Smith, 2,078 share options under this scheme vested on 1 August 2019 at the option price of 866p. A further 1,515 share options were granted in May 2019, effective from August 2019, at the option price of 1,188p (a discount of 20% to the market price) with a face value of £18,000 and a vesting date of August 2022.
John Shipsey has 1,969 share options under the scheme granted in May 2020, effective from August 2020, at the option price of 914p (a discount of 20% to the market price) with a face value of £18,000 and a vesting date of August 2023, after cancelling the previous award granted in May 2019.
Buyout awardsAndy Reynolds Smith was made certain buyout awards to replicate the structure and fair value of incentives forfeited as a consequence of joining Smiths.
He received an award of 86,893 restricted shares, the grant value of which was captured in the 2016 single figure. 30,412 shares vested on 30 June 2016 and the remaining 56,481 restricted shares vested on 30 June 2017 (at a share price of 1,597p). Andy Reynolds Smith also received awards of 79,806 and 26,602 which vested in October 2018 and 2019 respectively. He also received 26,602 conditional shares which vest, subject to performance conditions, in October 2020. The estimated value of the award vesting in October 2020 is included in this year’s single figure of remuneration table for Andy Reynolds Smith (see note 5 on page 120)
Percentage change in remuneration from FY2019 to FY2020Salary/Fees Benefits Bonus
Chief Executive remuneration 2.4% 13.0% -57%Chief Financial Officer remuneration 2.5% 0% -57%Non-executive Director remuneration 2.5% -43% 0%
Average of all employees 2.9% 2.9% -43%
‘All employees’ is defined as all UK Group employees, 206 employees at all grades.
Chief Executive pay ratiosThese ratios set out the comparison between the Chief Executive’s remuneration and that for employees in the UK workforce.
FY2020 FY2019
Year Method25th
percentile ratioMedian pay
ratio75th
percentile ratio25th
percentile ratioMedian pay
ratio75th
percentile ratio
Total remuneration B 75:1 53:1 34:1 133:1 97:1 65:1
Salary B 31:1 22:1 15:1 36:1 26:1 18:1
Salary (£)Total
Remuneration (£)
Chief Executive 839,817 2,195,84625th percentile employee 27,365 29,391Median employee 38,631 41.33575th percentile employee 57,027 64,101
Pay data for the Chief Executive is taken from the single figure of annual remuneration table on page 120. The pay data for employees in the UK workforce is based on the data used for gender pay reporting. The gender pay reporting basis comprises salary and benefits as at 15 April 2020 and incentive payments payable in respect of FY2020. It is assumed that the value of employee benefits is 7.0% of base salary.
The workforce remuneration figures are those paid to UK employees whose pay is at the 25th, median and 75th percentile of pay for the Group’s UK employees. Figures are shown on both the prescribed basis using total pay and also salary only which provides a useful ongoing comparison as it is a less volatile basis . The decrease in the ratios on a total pay basis is as a result of the reduction in the Chief Executive’s long-term incentive payments in FY2020 compared to FY2019. The Committee will monitor the ratios on an annual basis.
Annual Report on Remuneration continued

1 2 5S M I T H S G R O U P P L C A N N U A L R E P O R T F Y 2 0 2 0
3
Payments to past Directors (audited)There are no payments to past Directors attributable to FY2020.
Payments for loss of office (audited)There were no payments made for loss of office during the year.
Relative importance of spend on payThe table below shows shareholder distributions (i.e. dividends and share buybacks) and total employee pay expenditure for FY2019 and FY2020, and the percentage change.
FY2020 £m
FY2019 £m Change
Shareholder distributions 126 178 -29.2%
Employee costs 1,112 1,050 5.9%
TSR performanceThe following graph shows the Company’s total shareholder return (TSR) performance over the past ten years compared to the FTSE 100 Index. The FTSE 100 Index, of which the Company has been a member throughout the period, has been selected to reflect the TSR performance of other leading UK-listed companies. The values of hypothetical £100 investments in the FTSE 100 Index and Smiths Group plc shares at 31 July 2020 were £174.69 and £181.92 respectively.
Total Shareholder Return
Chief Executive’s remuneration for the last ten years
FY2020 A Reynolds
Smith
FY2019 A Reynolds
Smith
FY2018 A Reynolds
Smith
FY2017 A Reynolds
Smith
FY2016 A Reynolds
SmithFY2016
P BowmanFY2015
P BowmanFY2014
P BowmanFY2013
P BowmanFY2012
P BowmanFY2011
P Bowman
Total remuneration £000 2,196 4,130 3,251 2,320 2,964 1,602 4,195 3,912 3,864 5,026 4,776Annual bonus outcome (% max) 17% 41% 42% 96% 89% 88% 80% 43% 39% 79% 64%Common Investment Plan outcome (% max) n/a n/a n/a n/a n/a 100% 100% 100% 100% 100% 100%2007 Performance Share Plan outcome (% max) n/a n/a n/a n/a n/a n/a n/a n/a n/a n/a 33%
LTIP outcome (% max) 31% 75% 32% n/a n/a 18% 17% 18% n/a n/a n/a
Value of £100 invested on 31 July 2010
Smiths Group FTSE100
2010 2011
£118.35 £117.24
£140.94
£137.19£132.38
£151.41 £154.06£160.29
£186.05
£185.32
£199.46
£199.71
£136.34£123.54
£109.36 £101.94
2012 2013 2014 2015 2016 2017 202020192018
£220
£200
£100
£120
£140
£160
£180£199.33
£174.69
£205.91
£181.92

1 2 6 S M I T H S G R O U P P L C A N N U A L R E P O R T F Y 2 0 2 0
G O V E R N A N C E
R E M U N E R A T I O N C O M M I T T E E R E P O R T C O N T I N U E D
Base salary
Salaries are reviewed annually in October (but not necessarily increased) and benchmarked against comparable roles at other FTSE 100 companies of similar market capitalisation, revenues and complexity.
Having considered a number of important factors including evolving global market conditions and the Remuneration Policy, the Committee has determined to freeze the salaries of the Chief Executive at £843,780 and of the Chief Financial Officer at £540,225 which have been in effect since 1 October 2019. A similar general salary freeze has been applied at all levels across Smiths Group.
FY2020 FY2021
Andy Reynolds Smith £839,817 £843,780
John Shipsey £537,688 £540,225
Pension and benefits
The employment contracts of the two Executive Directors provide for a cash allowance of 25% of base salary in lieu of pension provision. Both Executive Directors have agreed to freeze the monetary value of the allowance at the FY2019 level maintaining the level of benefit at 24.4% of base salary for FY2021. The level of benefit will reduce to be in line with that of the wider UK workforce no later than 31 December 2022, on a phased basis.
Annual bonus
For FY2021, Andy Reynolds Smith will continue to have a maximum bonus opportunity of 180% of salary and John Shipsey 150%. 33% of any bonus earned will be deferred into shares for three years. Specific targets are not disclosed at this time due to the commercially sensitive nature of these objectives, but they will be disclosed at such time as the Committee deems them to no longer affect the commerciality of the Company.
Performance measures for the FY2021 annual bonus are as follows
Performance measure Weighting
Operating Profit1 40%Revenue 25%Headline Operating Cash Conversion 25%
Personal Objectives 10%
1 The operating profit measure replaces the EPS measure used in FY2020
Long-Term Incentive Plan (LTIP)
The LTIP is a conventional performance share plan under which an award over a capped number of shares will vest if demanding performance conditions are met. LTIP awards of conditional shares are granted to selected senior executives (including the Executive Directors) with face values of up to 400% of salary. Under the LTIP, for the FY2021 award, a fixed number of shares will be granted at the same level as in FY2019 and FY2020. This would be equivalent to 286% (327% for FY2019) of salary for the Chief Executive and 238% (272% for FY2019) of salary for the Chief Financial Officer, based on the average share price for the three months to 31 July 2020 of 1,341.68p.
The LTIP awards granted to Andy Reynolds Smith and John Shipsey in FY2021 will have the following performance measures. In the light of current market uncertainties, targets for threshold and maximum performance will be agreed before the end of 2020. These targets will be disclosed on the Company website.Performance measure Weighting
Three-year EPS growth after tax 25%Three-year average return on capital employed 25%Three-year average free cash flow 25%
Three-year average organic revenue sales growth 25%
1 The free cash flow measure replaces the headline operating cash conversion measure used in the FY2020 LTIP award as it provides a better measure of long term cash performance
Statement of implementation of Remuneration Policy in FY2021

1 2 7S M I T H S G R O U P P L C A N N U A L R E P O R T F Y 2 0 2 0
3
These performance measures apply to Group performance. In recognition of the delay in the planned separation of the Smiths Medical business, the Committee has also determined to include Smiths Medical performance within the FY2020 LTIP performance measures.
The Committee believes that the proposed structure provides an appropriate balance between earnings growth, returns, cash and sales growth. The Committee recognises that this balance of Group performance measures remains very important for many of our largest shareholders. The performance measures will be reviewed at the start of each future LTIP cycle to ensure they continue to reflect the Group’s strategic priorities.
Non-executive Director feesNon-executive Director fees paid during FY2020 are shown below and there will be no change in fees for FY2021:
FY2020
Non-executive Director base fee £71,250Additional fee payable to the Chairman of the Board £362,500Additional fee payable to the Senior Independent Director £20,000
Additional fees for Audit & Risk, Nomination & Governance and Remuneration Committee Chairs £20,000
Attendance allowance for meetings outside the Non-executive Director’s home continent £4,000 per meeting
Share ownership requirement Executive Directors are required, over time, to build up a shareholding with a value equal to at least 250% of base salary for the Chief Executive and 200% for the Chief Financial Officer. Executive Directors are required to retain at least 50% of any net vested share awards (after sales to meet tax liabilities) until those guidelines are achieved. Shares under deferred bonus awards and LTIP awards which have vested but are subject to a further holding period (net of assumed income tax) count towards the requirement. Awards that are still subject to performance conditions do not count towards the requirement.
During the year the Committee clarified its policy on post-employment shareholding requirements (Provision 36 in the UK Corporate Governance Code). The application of good leaver provisions for Executives will be conditional on retaining a number of shares equal to the in-employment shareholding guideline, or actual holding, if lower for a minimum holding period of two years from the date of leaving. No Executives to whom this policy would apply left the Group during the year. We will further develop our approach to post-employment shareholding requirements as part of our wider 2021 policy review.
There is no shareholding policy for Non-executive Directors.
Directors’ shareholdings (audited)The table below shows the shareholding of each Director and for Executive Directors the shareholding against their respective shareholding requirement as at 31 July 2020.
Shareholding requirement
(% FY2020 salary)
Shares owned
outright
Shares subject to
performance
Vested shares in
holding period
Shares arising from
bonus deferralSave As You Earn (SAYE)
Current shareholding
(% FY2020salary)1
Shareholding requirement met
Andy Reynolds Smith 250% 295,402 539,210 0 56,361 1,515 521% YesJohn Shipsey 200% 25,048 273,143 0 13,326 1,969 81% NoSir George Buckley 19,760Bruno Angelici 2,000Olivier Bohuon 2,972Pam Cheng 0Dame Ann Dowling 5,813Tanya Fratto 1,500Karin Hoeing 0Bill Seeger 10,000Mark Seligman 5,000Noel Tata 2,000
1 Shares owned outright (including vested shares in holding period), and the net of income tax value of shares arising from bonus deferral are taken into account for the shareholding requirement. Executive Directors have five years from the date of appointment to meet the required personal shareholding; John Shipsey therefore has until 31 December 2022 to meet the requirement.
In accordance with a binding commitment entered into on 19 July 2017, pursuant to which the Chairman purchases ordinary shares on a quarterly basis using a fixed proportion (20%) of the after-tax fees he receives from the Company, Sir George Buckley acquired 919 ordinary shares on 1 August 2020. Noel Tata acquired 2,000 ordinary shares on 4 August 2020. There have been no further changes to the Directors’ shareholdings between 1 August and 21 September 2020.
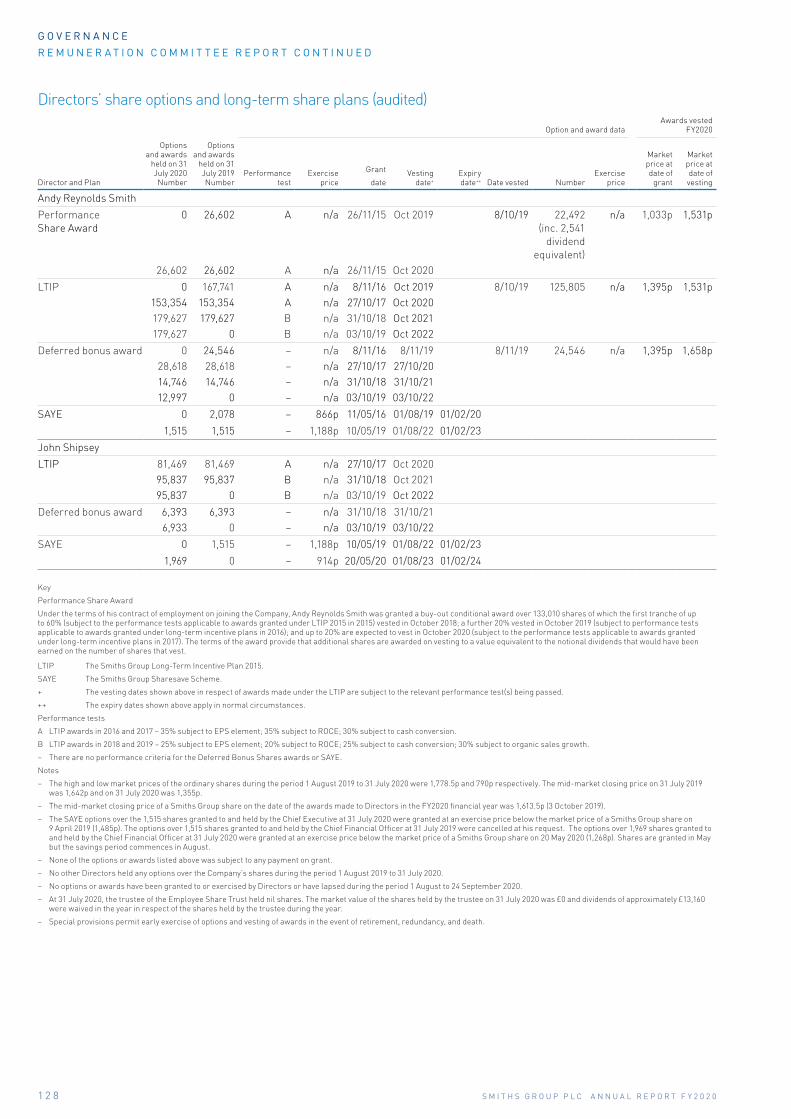
1 2 8 S M I T H S G R O U P P L C A N N U A L R E P O R T F Y 2 0 2 0
G O V E R N A N C E
R E M U N E R A T I O N C O M M I T T E E R E P O R T C O N T I N U E D
Directors’ share options and long-term share plans (audited)
Option and award dataAwards vested
FY2020
Director and Plan
Options and awards
held on 31 July 2020 Number
Options and awards
held on 31 July 2019 Number
Performance test
Exercise price
Grant
dateVesting
date+Expiry date++ Date vested Number
Exercise price
Market price at date of
grant
Market price at date of vesting
Andy Reynolds Smith
Performance Share Award
0 26,602 A n/a 26/11/15 Oct 2019 8/10/19 22,492 (inc. 2,541
dividend equivalent)
n/a 1,033p 1,531p
26,602 26,602 A n/a 26/11/15 Oct 2020
LTIP 0 167,741 A n/a 8/11/16 Oct 2019 8/10/19 125,805 n/a 1,395p 1,531p153,354 153,354 A n/a 27/10/17 Oct 2020179,627 179,627 B n/a 31/10/18 Oct 2021179,627 0 B n/a 03/10/19 Oct 2022
Deferred bonus award 0 24,546 – n/a 8/11/16 8/11/19 8/11/19 24,546 n/a 1,395p 1,658p28,618 28,618 – n/a 27/10/17 27/10/2014,746 14,746 – n/a 31/10/18 31/10/2112,997 0 – n/a 03/10/19 03/10/22
SAYE 0 2,078 – 866p 11/05/16 01/08/19 01/02/20
1,515 1,515 – 1,188p 10/05/19 01/08/22 01/02/23
John Shipsey
LTIP 81,469 81,469 A n/a 27/10/17 Oct 202095,837 95,837 B n/a 31/10/18 Oct 202195,837 0 B n/a 03/10/19 Oct 2022
Deferred bonus award 6,393 6,393 – n/a 31/10/18 31/10/216,933 0 – n/a 03/10/19 03/10/22
SAYE 0 1,515 – 1,188p 10/05/19 01/08/22 01/02/23
1,969 0 – 914p 20/05/20 01/08/23 01/02/24
Key
Performance Share Award
Under the terms of his contract of employment on joining the Company, Andy Reynolds Smith was granted a buy-out conditional award over 133,010 shares of which the first tranche of up to 60% (subject to the performance tests applicable to awards granted under LTIP 2015 in 2015) vested in October 2018; a further 20% vested in October 2019 (subject to performance tests applicable to awards granted under long-term incentive plans in 2016); and up to 20% are expected to vest in October 2020 (subject to the performance tests applicable to awards granted under long-term incentive plans in 2017). The terms of the award provide that additional shares are awarded on vesting to a value equivalent to the notional dividends that would have been earned on the number of shares that vest.
LTIP The Smiths Group Long-Term Incentive Plan 2015.
SAYE The Smiths Group Sharesave Scheme.
+ The vesting dates shown above in respect of awards made under the LTIP are subject to the relevant performance test(s) being passed.
++ The expiry dates shown above apply in normal circumstances.
Performance tests
A LTIP awards in 2016 and 2017 – 35% subject to EPS element; 35% subject to ROCE; 30% subject to cash conversion.
B LTIP awards in 2018 and 2019 – 25% subject to EPS element; 20% subject to ROCE; 25% subject to cash conversion; 30% subject to organic sales growth.
– There are no performance criteria for the Deferred Bonus Shares awards or SAYE.
Notes
– The high and low market prices of the ordinary shares during the period 1 August 2019 to 31 July 2020 were 1,778.5p and 790p respectively. The mid-market closing price on 31 July 2019 was 1,642p and on 31 July 2020 was 1,355p.
– The mid-market closing price of a Smiths Group share on the date of the awards made to Directors in the FY2020 financial year was 1,613.5p (3 October 2019).
– The SAYE options over the 1,515 shares granted to and held by the Chief Executive at 31 July 2020 were granted at an exercise price below the market price of a Smiths Group share on 9 April 2019 (1,485p). The options over 1,515 shares granted to and held by the Chief Financial Officer at 31 July 2019 were cancelled at his request. The options over 1,969 shares granted to and held by the Chief Financial Officer at 31 July 2020 were granted at an exercise price below the market price of a Smiths Group share on 20 May 2020 (1,268p). Shares are granted in May but the savings period commences in August.
– None of the options or awards listed above was subject to any payment on grant.
– No other Directors held any options over the Company’s shares during the period 1 August 2019 to 31 July 2020.
– No options or awards have been granted to or exercised by Directors or have lapsed during the period 1 August to 24 September 2020.
– At 31 July 2020, the trustee of the Employee Share Trust held nil shares. The market value of the shares held by the trustee on 31 July 2020 was £0 and dividends of approximately £13,160 were waived in the year in respect of the shares held by the trustee during the year.
– Special provisions permit early exercise of options and vesting of awards in the event of retirement, redundancy, and death.

1 2 9S M I T H S G R O U P P L C A N N U A L R E P O R T F Y 2 0 2 0
3
Share scheme dilution limitsThe Company complies with the guidelines laid down by the Investment Association. These restrict the issue of new shares under all the Company’s share schemes in any ten year period to 10% of the issued ordinary share capital and under the Company’s discretionary schemes to 5% in any ten year period. As at 31 July 2020 the headroom available under these limits was 8.53% and 4.09% respectively.
Performance evaluationThe annual evaluation of the Committee was conducted as part of the overall evaluation process of the Board and its Committees. However, the process by which the Committee’s performance was assessed was conducted separately to the main Board process ahead of the appointment of Deloitte LLP as the Committee’s adviser. More information can be found on page 100. The findings relating to the Committee were discussed with the Committee Chair. Overall, the Committee is viewed as effective and performing well and is rigorous in discharging its responsibilities.
The Directors’ Remuneration Report has been approved by the Board and signed on its behalf by:
Bill SeegerCHAIR OF THE REMUNERATION COMMITTEE
23 September 2020

1 3 0 S M I T H S G R O U P P L C A N N U A L R E P O R T F Y 2 0 2 0
G O V E R N A N C E
D I R E C T O R S ’ R E P O R T
Directors’ Report
The Strategic Report is a requirement of the Companies Act 2006 (the ‘Act’) and can be found on pages 6-80. The Company has chosen, in accordance with section 414 C(11) of the Act, to include certain matters in its Strategic Report that would otherwise be disclosed in this Directors’ Report. The Strategic Report and the Directors’ Report together are the management report for the purposes of Rule 4.1.8R of the Disclosure Guidance and Transparency Rules. Other information that is relevant to the Directors’ Report, and is incorporated by reference, can be found as follows:
Disclosure Location
Likely future developments Strategic Report pages 6-23 and 52-66
Directors’ dividend recommendation Strategic Report page 20
Research and development activities Strategic Report pages 52-66
Employment of disabled persons Resources and relationships page 32
Employee engagement Resources and relationships pages 27-33
Governance Report pages 83 and 91
Engagement with suppliers, customers and others in a business relationship with the company
Resources and relationships pages 34-36 and 46-51
Governance Report page 91
Political donations and expenditure Table on page 131
Greenhouse gas emissions, energy consumption and energy efficiency
Resources and relationships pages 40-45
Corporate governance statement Governance Report pages 82-132
Directors during FY2020 Governance Report pages 84-87
Director appointment Governance Report page 99
Amendment of Articles of Association Governance Report page 99
Indemnities Governance Report page 99
Change of control Remuneration Report page 118 Borrowings and net debt note page 182
Directors’ responsibility statement Statement of Directors’ responsibilities page 132
Disclosure of information to auditor Statement of Directors’ responsibilities page 132
Financial instruments Financial risk management note pages 181-188
Share capital disclosures Share capital note page 195
Powers of the Directors Governance Report page 89
Share capital note page 195
Post-balance sheet events Post-balance sheet event note page 219
Overseas branches Subsidiary undertakings note page 228

1 3 1S M I T H S G R O U P P L C A N N U A L R E P O R T F Y 2 0 2 0
3
Listing Rules disclosureInformation required by the Financial Conduct Authority’s Listing Rules can be found as set out below. There are no further disclosures required in accordance with Listing Rule 9.8.
Listing Rule Disclosure Location
9.8.4(1) Capitalised interest Discontinued operations note page 197
9.8.4(12)(13) Dividend waivers Dividend note page 196
9.8.6(1) Directors’ interests Remuneration Report page 127
9.8.6(2) Major shareholders’ interests Table on page 131
9.8.6(3)(a)(b) Going Concern and Viability Statements Strategic Report pages 77-78
9.8.6(4)(a) Purchase of own shares Share capital note page 195
9.8.6(5)(6) UK Corporate Governance Code compliance Governance Report page 83
9.8.6(7) Unexpired term of service contract Remuneration Report page 117
Political donationsThe Group did not give any money for political purposes in the UK, the rest of the EU or outside of the EU, nor did it make any political donations to political parties or other political organisations, or to any independent election candidates, or incur any political expenditure during the year.
In accordance with the US Federal Election Campaign Act, Smiths provides administrative support to a federal Political Action Committee (PAC) in the US funded by the voluntary political contributions of eligible employees. The PAC is not controlled by the Company and all decisions regarding the amounts and recipients of contributions are directed by a steering committee comprising Government Relations employees and reported to all eligible to contribute to the PAC. Contributions to political organisations reported by the PAC during FY2020 totalled $41,000 (FY2019: $50,534).
Major shareholders’ interestsAt 31 July 2020, the Company had been notified under the Financial Conduct Authority’s Disclosure Guidance & Transparency Rules, or had received disclosures pursuant to the Companies Act 2006, of the following holdings of voting rights in its shares:
Number of voting rights Number of voting rights % of total voting rights Date of notification
BlackRock, Inc. 23.3m 5.9 31 May 2018
Ameriprise Financial, Inc. 20.8m 5.3 3 October 2018
Artemis Investment Management LLP 19.8m 5.0 14 April 2020
Harris Associates L.P. 19.7m 5.0 22 July 2019
Dodge & Cox 19.6m 4.9 27 February 2019
Jupiter Asset Management 14.8m 3.8 22 September 2016
No further notifications were received between 1 August and 21 September 2020.
By order of the Board
John MillsCOMPANY SECRETARY
23 September 2020

1 3 2 S M I T H S G R O U P P L C A N N U A L R E P O R T F Y 2 0 2 0
G O V E R N A N C E
S T A T E M E N T O F D I R E C T O R S ’ R E S P O N S I B I L I T I E S
The Directors are responsible for preparing the Annual Report and the Group and Parent Company financial statements in accordance with applicable law and regulations.
Company law requires the Directors to prepare Group and Parent Company financial statements for each financial year. Under that law they are required to prepare the Group financial statements in accordance with International Financial Reporting Standards as adopted by the European Union (IFRSs as adopted by the EU) and applicable law and have elected to prepare the Parent Company financial statements in accordance with UK accounting standards, including IFRS 101 Reduced Disclosure Framework.
Under company law the Directors must not approve the financial statements unless they are satisfied that they give a true and fair view of the state of affairs of the Group and the Parent Company and of their profit or loss for that period. In preparing each of the Group and Parent Company financial statements, the Directors are required to:
– Select suitable accounting policies and then apply them consistently;
– Make judgements and estimates that are reasonable, relevant, reliable and prudent;
– For the Group financial statements, state whether they have been prepared in accordance with IFRSs as adopted by the EU
– For the Parent Company financial statements, state whether applicable United Kingdom Accounting Standards have been followed subject to any material departures disclosed and explained in the Parent Company financial statements;
– Assess the Group and parent Company’s ability to continue as a going concern, disclosing, as applicable, matters related to going concern; and
– Use the going concern basis of accounting unless they either intend to liquidate the Group or the Parent Company or to cease operations, or have no realistic alternative but to do so.
The Directors are responsible for keeping adequate accounting records that are sufficient to show and explain the Parent Company’s transactions and disclose with reasonable accuracy at any time the financial position of the Parent Company and enable them to ensure that its financial statements comply with the Companies Act 2006. They are responsible for such internal control as they determine is necessary to enable the preparation of financial statements that are free from material misstatement, whether due to fraud or error, and have general responsibility for taking such steps as are reasonably open to them to safeguard the assets of the Group and to prevent and detect fraud and other irregularities.
The Directors are responsible for the maintenance and integrity of the corporate governance and financial information included on the Company’s website. Legislation in the United Kingdom governing the preparation and dissemination of financial statements may differ from legislation in other jurisdictions.
Statement of Directors’ responsibilities in respect of the Annual Report and the financial statements
Signed on behalf of the Board of Directors:
Andy Reynolds Smith John ShipseyCHIEF EXECUTIVE CHIEF FINANCIAL OFFICER
23 September 2020
Directors’ responsibility statementEach of the Directors (who are listed on pages 84-87) confirms that to the best of his or her knowledge:
– The financial statements prepared in accordance with the applicable set of accounting standards, give a true and fair view of the assets, liabilities, financial position and profit or loss of the Company and the undertakings included in the consolidation taken as a whole;
– The Group Directors’ Report and Strategic Report include a fair review of the development and performance of the business and the position of the issuer and the undertakings included in the consolidation taken as a whole, together with a description of the principal risks and uncertainties that they face; and
– As at the date of this report there is no relevant audit information of which the Company’s auditor is unaware. Each Director has taken all the steps he or she should have taken as a Director in order to make himself or herself aware of any relevant audit information and to establish that the Company’s auditor are aware of that information
We consider the annual report and accounts, taken as a whole, is fair, balanced and understandable and provides the information necessary for shareholders to assess the group’s position and performance, business model and strategy.

4
INDEPENDENT AUDITORS’ REP ORT+ Pages 135-143
CONSOLIDATED PRIM A RY S TATEMENT S+ Pages 144-148
ACCOUNTING P OLICIE S+ Pages 149-157
SMITHS GROUP PLC COMPA N Y ACCOUNT S+ Pages 212-219
FINANCIAL STATEMENTS
1 3 3S M I T H S G R O U P P L C A N N U A L R E P O R T F Y 2 0 2 0

1 3 4 S M I T H S G R O U P P L C A N N U A L R E P O R T F Y 2 0 2 0
F I N A N C I A L S T A T E M E N T S
Financial statements contents
Independent auditors’ report 135
Consolidated primary statements
Consolidated income statement 144
Consolidated statement of comprehensive income 145
Consolidated balance sheet 146
Consolidated statement of changes in equity 147
Consolidated cash-flow statement 148
Accounting policies 149
Notes to the accounts
1 Segment information 158
2 Operating profit is stated after charging 161
3 Non-statutory profit measures 162
4 Net finance costs 165
5 Earnings per share 165
6 Taxation 166
7 Employees 168
8 Post-retirement benefits 169
9 Employee share schemes 174
10 Intangible assets 175
11 Impairment testing 176
12 Property, plant and equipment 178
13 Right of use assets 179
14 Inventories 179
15 Trade and other receivables 179
16 Trade and other payables 180
17 Financial assets 180
18 Borrowings and net debt 181
19 Financial risk management 182
20 Derivative financial instruments 188
21 Fair value of financial instruments 190
22 Commitments 191
23 Provisions and contingent liabilities 191
24 Share capital 195
25 Dividends 196
26 Reserves 196
27 Acquisitions 197
28 Discontinued operations and businesses held for distribution to owners 197
29 Cash-flow 201
30 Alternative performance measures 20231 Post Balance Sheet Events 204
Unaudited five-year Group financial record 205
Unaudited US dollar primary statements 206
Unaudited five-year Group US dollar financial record 211
Smiths Group plc Company accounts
Company balance sheet 212
Company statement of changes in equity 213
Company accounting policies 214
Notes to the Company accounts 216
Subsidiary undertakings 220

1 3 5S M I T H S G R O U P P L C A N N U A L R E P O R T F Y 2 0 2 0
4
I N D E P E N D E N T A U D I T O R S ’ R E P O R T
Independent auditors’ report to the members of Smiths Group plc
1 Our opinion is unmodified We have audited the financial statements of Smiths Group plc (“the Company”) for the year ended 31 July 2020 which comprise the consolidated income statement, consolidated statement of comprehensive income, consolidated balance sheet, consolidated statement of changes in equity, consolidated cash-flow statement, Company balance sheet, Company statement of changes in equity, and the related notes, including the accounting policies on pages 149-157 and 214-215.
In our opinion:
– the financial statements give a true and fair view of the state of the Group’s and of the parent Company’s affairs as at 31 July 2020 and of the Group’s profit for the year then ended;
– the Group financial statements have been properly prepared in accordance with International Financial Reporting Standards as adopted by the European Union;
– the parent Company financial statements have been properly prepared in accordance with UK accounting standards, including FRS 101 Reduced Disclosure Framework; and
– the financial statements have been prepared in accordance with the requirements of the Companies Act 2006 and, as regards the Group financial statements, Article 4 of the IAS Regulation.
Basis for opinion We conducted our audit in accordance with International Standards on Auditing (UK) (“ISA (UK)”) and applicable law. Our responsibilities are described below. We believe that the audit evidence we have obtained is a sufficient and appropriate basis for our opinion. Our audit opinion is consistent with our report to the Audit & Risk Committee.
We were first appointed as auditor by the shareholders on 13 November 2019. The financial year ended 31 July 2020 is our first year as auditor. We have fulfilled our ethical responsibilities and we remain independent of the Group in accordance with UK ethical requirements including the FRC Ethical Standard as applied to listed public interest entities. No non-audit services prohibited by that standard were provided.
OverviewMateriality: group financial statements as a whole
£12.2million
4.5% of Group profit before taxation from continuing operations normalised to exclude the effect of specific items and by averaging over the last three years as explained in section 3 of this report.
Coverage: 72% of Group profit before taxation from continuing operations
Key audit mattersPresentation of Smiths Medical as discontinued operations and as assets held for distribution to owners (Group)
Recoverability of capitalised development costs in regard to the Intellifuse programme (Group)
Goodwill valuation in respect of the Smiths Detection and Smiths Interconnect cash generating units (CGUs) (Group)
Valuation of litigation provisions for asbestos in John Crane, Inc. and flexible gas piping product in Titeflex Corporation (Group)
Revenue recognition in relation to multi-year contractual arrangements in the Smiths Detection and Smiths Interconnect divisions (Group)
Recoverability of deferred tax assets (Group)
Valuation of pension scheme liabilities (Parent Company)

1 3 6 S M I T H S G R O U P P L C A N N U A L R E P O R T F Y 2 0 2 0
F I N A N C I A L S T A T E M E N T SI N D E P E N D E N T A U D I T O R S ’ R E P O R T C O N T I N U E D
2 Key audit matters: our assessment of risks of material misstatementKey audit matters are those matters that, in our professional judgement, were of most significance in the audit of the financial statements and include the most significant assessed risks of material misstatement (whether or not due to fraud) identified by us, including those which had the greatest effect on: the overall audit strategy; the allocation of resources in the audit; and directing the efforts of the engagement team. We summarise below the key audit matters, in decreasing order of audit significance, in arriving at our audit opinion above, together with our key audit procedures to address those matters and, as required for public interest entities, our results from those procedures. These matters were addressed, and our results are based on procedures undertaken, in the context of, and solely for the purpose of, our audit of the financial statements as a whole, and in forming our opinion thereon, and consequently are incidental to that opinion, and we do not provide a separate opinion on these matters.
Presentation of Smiths Medical as discontinued operations and as assets held for distribution to owners (Group) (£1,279 million (2019: £1,216 million)) Refer to page 104 (Audit & Risk Committee report), page 154 (accounting policies) and page 197 (financial disclosures)
The risk – Subjective judgement The presentation of the Smiths Medical division as discontinued operations and as assets held for distribution to owners has a significant impact on the financial statements, including the requirement to present the results in the current and prior period separate from the continuing business and as profit from discontinued operations and associated additional disclosures.
The initial classification was made in the 31 July 2019 Group financial statements. However, the division was not distributed to shareholders within the first 12 months from initial classification as the Board of Directors had previously expected. As such, judgement is required in determining whether the Smiths Medical division continues to meet the criteria for classification as a discontinued operation. Specifically, judgement is required in assessing the likely timescale of the proposed distribution to owners and, therefore, whether management can be confident that the separation is highly probable and is expected to be completed by 31 July 2021.
Our response – Our procedures included: – Accounting analysis: Assessing the appropriateness of the classification as discontinued operations in line with criteria of the applicable financial reporting standard, including:
> whether the division is available for immediate distribution in its present condition;
> whether the distribution is highly probable; > whether the distribution is expected to be completed by 31 July 2021; and,
> whether the extension to the initial classification period of 12 months is appropriate in the circumstances.
In performing this assessment, we examined minutes of the Board and the Transactions Committee meetings, demerger plans, and the Company’s communications with the Group’s investors and shareholders.
– Evaluating Directors’ intent: Enquiring of the Board to determine whether the intention for separation of the Smiths Medical division as required by the applicable financial reporting standard remains in place, is highly probable and is expected to be completed by 31 July 2021.
– Assessing transparency: Considering the adequacy of the Group’s disclosures in relation to the judgement exercised.
Our resultsWe found the presentation of the Smiths Medical division as discontinued operations and as assets held for distribution to owners as at 31 July 2020 to be acceptable.
Recoverability of capitalised development costs in regard to the Intellifuse programme (Group) (£80 million (2019: £64 million)) Refer to page 104 (Audit & Risk Committee report), page 150 (accounting policies) and page 199 (financial disclosures)
The risk – Subjective estimateThe Group holds a material amount of capitalised development costs in relation to the Intellifuse programme within assets held for distribution to owners, the Smiths Medical division.
There is judgement whether the carrying amount of the intangible asset is recoverable based on an assessment of whether the programme remains technically feasible, in particular whether regulatory approval can be obtained from the US Food and Drug Administration (FDA), and whether the intangible asset will generate sufficient future economic benefits.
Management prepares an impairment model annually for the in-development intangible asset to assess the recoverability of the amount capitalised. Estimation is required to develop cash-flow forecasts, costs to complete the development, probability of achieving FDA approval, the size of the future market and the appropriate discount rate.
The effect of these matters is that, as part of our risk assessment, we determined that the recoverable amount of capitalised development costs in regards to the Intellifuse programme has a high degree of estimation uncertainty, with a potential range of reasonable outcomes greater than our materiality for the financial statements as a whole, and possibly many times that amount. The financial statements (note 28) disclose the sensitivity estimated by the Group.
Our response – Our procedures included: – Accounting policies: Assessing the appropriateness of the Group’s accounting policy for capitalisation of development costs by comparing with applicable accounting standards.
– Assessing methodology: Evaluating the methodology applied by the Directors in the impairment model supporting the recoverable amount of capitalised development expenditure to assess whether it is in line with applicable accounting standards and industry practice.
– Challenging technical and commercial feasibility: Evaluating and challenging the underlying cash-flow forecast by comparing growth and size of future market assumptions with potential target market penetration data prepared by the Group’s expert, and the probability of FDA approval by enquiring with the Directors and the Group’s expert to understand the stage of completion of the programme.
– Our sector experience: Using our own specialists to challenge the appropriateness of the discount rate used.
1 3 7S M I T H S G R O U P P L C A N N U A L R E P O R T F Y 2 0 2 0
4
– Sensitivity analysis: Performing sensitivity analysis on underlying key assumptions in respect of commercial feasibility.
– Assessing disclosures: Assessing whether the disclosures of the effect of reasonably possible changes in key assumptions on the outcome of the impairment assessment reflect the risks inherent in the valuation of the capitalised development costs in regard to the Intellifuse programme.
Our resultsWe found the resulting estimate of the carrying amount of capitalised development costs in respect of the Intellifuse programme to be acceptable.
Goodwill valuation in respect of the Smiths Detection and Smiths Interconnect cash generating units (CGUs) (Group) (£895 million (2019: £934 million)) Refer to page 104 (Audit & Risk Committee report), page 153 (accounting policies) and pages 175–178 (financial disclosures)
The risk – Subjective estimate and forecast-based valuationThe Group holds a significant amount of goodwill, especially in relation to the Smiths Detection and Smiths Interconnect cash generating units (CGUs). The value in use calculation for the CGUs, which represents the estimated recoverable amount, is subjective due to the inherent uncertainty involved in forecasting and discounting estimated future cash flows (specifically the key assumptions such as discount rate).
Estimation uncertainty has increased as a result of the impact of COVID-19 on the related markets.
The effect of these matters is that, as part of our risk assessment, we determined that the value in use of the two CGUs has a high degree of estimation uncertainty, with a potential range of reasonable outcomes greater than our materiality for the financial statements as a whole, and possibly many times that amount. The financial statements (note 11) disclose the sensitivity estimated by the Group. These disclosures give relevant information about the estimation uncertainty including the risk of a reduction in the headroom or need for an impairment as a result of a reasonably possible change in one or more of the key assumptions used in the value in use calculation for these CGUs.
Our response – Our procedures included:
– Assessing methodology: Testing the mathematical integrity of the models used in the Group’s impairment analysis.
– Benchmarking assumptions and historical comparison: Assessing and challenging the growth rate and EBIT percentage assumptions through retrospective review; comparison to external industry forecasts; and analysis of competitors’ analyst reports.
– Our sector experience: Using our valuations specialists to challenge the appropriateness of discount rates by deriving our own independent range and comparing perpetuity growth rates to external market data.
– Sensitivity analysis: Estimating the value in use utilising independent and more conservative forecasts and discount rates and assessed whether this resulted in impairment.
– Comparing valuations: Comparing the valuation per the value in use impairment model against expected enterprise valuations per analyst reports.
– Assessing transparency: Considering the adequacy of the Group’s disclosures in respect of the judgement and estimates around goodwill recoverability for the Smiths Detection
and Smiths Interconnect CGUs, including disclosures of the sensitivity in the value of use calculations to changes in the key assumptions.
Our resultsWe found the carrying amount of goodwill related to the Smiths Detection and Smiths Interconnect cash generating units and the disclosures, including the indication that other reasonably possible assumptions may reduce headroom, to be acceptable.
Valuation of litigation provisions for asbestos in John Crane, Inc. and flexible gas piping product in Titeflex Corporation (Group) (£297million (2019: £311million))
Refer to page 105 (Audit & Risk Committee report), page 154 (accounting policies) and pages 191-195 (financial disclosures)
The risk – Subjective valuationThere are significant judgements and estimates involved in the assumptions underlying the provisions in respect of John Crane, Inc. asbestos litigation and Titeflex Corporation CSST (corrugated stainless steel tubing) claims, including the projection period, the forecast number of future claims and associated claim and defence costs and the discount rate applied to the forecast.
The effect of these matters is that, as part of our risk assessment, we determined that the two litigation provisions have a high degree of estimation uncertainty, with a potential range of reasonable outcomes greater than our materiality for the financial statements as a whole. The financial statements (note 23) disclose the sensitivity estimated by the Group.
Our response – Our procedures included: – Our actuarial expertise: In the case of the John Crane, Inc. asbestos provision, challenging the key judgement of the ten-year projection period using our own actuarial specialist and our sector knowledge and expertise.
– Benchmarking assumptions: In the case of the John Crane, Inc. asbestos provision, using our own actuarial specialists, we derived our own independent range of the estimated provision. In the case of the Titeflex Corporation CSST provision, we compared assumption input data to historic settlement data. We compared other assumptions, such as statute of repose to external sources.
– Enquiry of lawyers: In the case of both provisions, we obtained external legal confirmations of ongoing claims.
– Assessed management’s expert: In the case of John Crane, Inc., we assessed the competency, knowledge and independence of the expert using our own specialist.
– Assessing methodology: Evaluating the methodology applied by management to the valuation of both provisions to assess that the methodology utilised is in line with industry practice.
– Historical comparison: Obtaining historical claim settlements to assess the accuracy of the provision.
– Assessing transparency: Assessing whether the disclosures of the effect of reasonably possible changes in key judgements and assumptions reflect the risks inherent in the provisions’ estimation.
Our resultsWe found the level of litigation provisioning and related disclosures in the financial statements in respect of John Crane Inc. asbestos and Titeflex Corporation CCST claims to be acceptable.

1 3 8 S M I T H S G R O U P P L C A N N U A L R E P O R T F Y 2 0 2 0
F I N A N C I A L S T A T E M E N T SI N D E P E N D E N T A U D I T O R S ’ R E P O R T C O N T I N U E D
Revenue recognition in relation to multi-year contractual arrangements in the Smiths Detection and Smiths Interconnect divisions (Group)Refer to page 104 (Audit & Risk Committee report), page 150 (accounting policies) and page 158 (financial disclosures)
The risk – Subjective estimateThe incentive and pressure on management to achieve bonus targets and/or market consensus increases the risk of fraudulent revenue recognition.
In particular, the Smiths Detection and Smiths Interconnect divisions conduct a significant portion of their business through long-term revenue contracts (programme revenue) and a significant portion of revenue is normally recognised in the last quarter of the year. Further, as a result of COVID-19 there is a risk of long-term contract revenue being understated in the year in order to achieve bonus targets and favourable market results in subsequent years, given that the in-year performance has already traded behind budgets for the year.
The estimation of the appropriate level of revenue to recognise in any single accounting period requires special consideration amongst others:
– the interpretation of contract terms concerning performance obligations;
– the allocation of transaction price to those performance obligations; and
– measuring progress towards complete satisfaction of performance obligations, primarily where the input method of accounting has been used.
The estimates involved are complex and could lead to a material error within the financial statements.
Our response – Our procedures included: – Accounting policies: Assessing the appropriateness of the Group’s revenue recognition accounting policies by comparing with applicable accounting standards.
– Test of details:
> Inspecting a sample of contracts to understand the terms and conditions that underpin the revenue recognition assumptions and challenging management’s judgements on the application of standards.
> In the case of the Smiths Interconnect division, for samples tested assessing and challenging the Group’s process of estimating the expected profitability of the contacts. Recalculating the revenue recognised based on measurement of progress towards complete satisfaction of a performance obligation using the input method and comparing the amount to revenue recognised.
– Journal entries: Testing journal entries posted to revenue accounts to identify any unusual or irregular items, especially during the year end closing period.
– Test of details: Performing procedures to assess inclusion of revenue transactions in the correct accounting year.
– Assessing transparency: Assessing the Group’s disclosures of the revenue recognition policies and of the key judgements applied.
Our resultsWe found the amount of the revenue recognised in relation to multi-year contractual arrangements in the Smiths Detection and Smiths Interconnect divisions to be acceptable.
Recoverability of deferred tax assets (Group) (£102 million (2019: £115 million))Refer to page 104 (Audit & Risk Committee report), page 153 (accounting policies) and pages 166-168 (financial disclosures)
The risk – Forecast based valuationThe Group recognises significant deferred tax assets on the balance sheet relating to trading losses. The recoverability of the Group’s deferred tax assets is dependent on future taxable profits and the ability of the Group to utilise those losses in the future.
The Group is forecasting future taxable profits in a number of tax jurisdictions in determining the amount of the deferred tax assets recognised. The achievement of such forecasts is inherently uncertain due to the level of estimation in developing forecasts.
Further, uncertainty over forecasted future taxable profits has increased as a result of COVID-19, increasing estimation uncertainty.
The effect of these matters is that, as part of our risk assessment, we determined that the recoverability and appropriateness of recognition of deferred tax assets have a high degree of estimation uncertainty, with a potential range of reasonable outcomes greater than our materiality for the financial statements as a whole.
Our response – Our procedures included: – Our tax expertise: Use of our own tax specialists to assist us in:
> Assessing the recoverability of the tax losses against the forecast future taxable profits, taking into account the Group’s tax position and our knowledge and experience of the application of relevant tax legislation.
> Assessing the robustness of evidence of available future taxable profits to support the deferred tax asset recognition for carried forward tax losses.
Our resultsWe found the level of deferred tax assets recognised to be acceptable.
Valuation of pension scheme liabilities (Parent Company) (£3,724 million (2019: £3,637 million))Refer to page 105 (Audit & Risk Committee report), page 215 (accounting policies) and page 219 (financial disclosures)
The risk – Subjective valuation Significant estimates are made in valuing the Company’s post retirement defined benefit plan obligations in particular the discount rates, the inflation rates, mortality and pension increase assumptions.
Small changes in the assumptions used to value the Company’s pension obligations would have a significant effect on the Company’s defined benefit obligation.

1 3 9S M I T H S G R O U P P L C A N N U A L R E P O R T F Y 2 0 2 0
4
The effect of these matters is that, as part of our risk assessment, we determined that the valuation of the Company’s pension scheme liabilities includes a high degree of estimation uncertainty, with a potential range of reasonable outcomes greater than our materiality for the financial statements as a whole, and possibly many times that amount. The financial statements (note 11 of the Company accounts) disclose the sensitivity of the liabilities to key assumptions estimated by the Company.
Our response – Our procedures included: – Benchmarking assumptions: Challenging the key assumptions applied in the calculation of the liability, including the discount rates, inflation rates, mortality and pension increases with the support of our own actuarial specialists by comparing against market data, including assessing the impact of COVID-19 on these key assumptions.
– Assessing actuary’s credentials: Assessing the competence, independence and integrity of the scheme’s actuary.
Our resultsWe found the valuation of the pension scheme liabilities to be acceptable.
3 Our application of materiality and an overview of the scope of our audit MaterialityMateriality for the Group financial statements as a whole was set at £12.2 million, determined with reference to a benchmark of Group profit before tax from continuing operations, normalised to exclude the specific items listed below and by averaging over the last three years due to the impact of the COVID-19 pandemic, of £272m:
– Restructuring costs
– Foreign exchange gain/loss on intercompany loan with discontinued operations
– Guaranteed Minimum Pension Equalisation
For this year’s restructuring costs and foreign exchange gain excluded from normalised group profit before tax, the component teams performed procedures on items relating to their components. The Group team performed procedures on the remaining excluded items.
Materiality for the Parent Company financial statements as a whole was set at £12 million, determined with reference to a benchmark of Parent Company total assets. It represents 0.3% of total assets.
We agreed to report to the Audit & Risk Committee any corrected or uncorrected identified misstatements exceeding £0.6 million, in addition to other identified misstatements that warranted reporting on qualitative grounds.
G R O U P P R O F I T B E F O R E T A X F R O M C O N T I N U I N G O P E R A T I O N S , N O R M A L I S E D T O E X C L U D E S P E C I F I C I T E M S A N D B Y A V E R A G I N G O V E R T H E L A S T T H R E E Y E A R S
£272m
G R O U P M A T E R I A L I T Y
£12.2m
£12.2mWhole financial statements materiality
£12mRange of materiality at 34 components (£0.2m – £12m)
£0.6mMisstatements reported to the Audit & Risk Committee
Group profit before tax from continuing operations, normalised to exclude specific items and by averaging over the last three years
Group materiality

1 4 0 S M I T H S G R O U P P L C A N N U A L R E P O R T F Y 2 0 2 0
F I N A N C I A L S T A T E M E N T SI N D E P E N D E N T A U D I T O R S ’ R E P O R T C O N T I N U E D
ScopeThe Group operates in more than 50 countries across six continents with the largest footprints being in the US, Europe and Asia. The Group is organised into five divisions: John Crane, Smiths Detection, Smiths Interconnect, Flex-Tek and Smiths Medical (discontinued operations) and is a consolidation of over 230 reporting components. We scoped the audit by obtaining an understanding of the Group and its environment and assessing the risk of material misstatement at the Group level. We have considered components on the basis of their contribution to Group revenue and Group profit before tax for continuing operations (therefore excluding Smiths Medical which was included separately as a full scope component) including whether we had sufficient coverage over each division and the specific risks in the components.
Of the Group’s 232 reporting components, we subjected 21 to full scope audits for Group purposes and 13 to audit of account balance revenue or specified risk-focused audit procedures. The components for which we performed audit of account balance revenue were not individually financially significant enough to
require a full scope audit for Group purposes but were included in the scope of our Group reporting work in order to provide further coverage over the Group’s results. The components for which we performed specified risk-focused procedures were not individually financially significant enough to require an audit for Group reporting purposes but did present specific individual risks that needed to be addressed.
We subjected 6 components to specified risk-focused audit procedures over a number of areas, including litigation provisions and defined benefit pension assets and liabilities.
We also subjected the Smiths Medical division (not included in the 21 full scope audits above), which is presented as discontinued operations and business held for distribution to owners as at 31 July 2020, to a full scope audit in order to obtain coverage of profit from discontinued operations and assets held for distribution to owners, including the information presented in note 28.
The components within the scope of our work accounted for the following percentages of the Group’s results for continuing operations:
G R O U P R E V E N U E F R O M C O N T I N U I N G O P E R A T I O N S
G R O U P T O T A L A S S E T S ( C O N T I N U I N G O P E R A T I O N S O N L Y )
G R O U P P R O F I T B E F O R E T A X F R O M C O N T I N U I N G O P E R A T I O N S
Full scope audit for Group reporting purposes
Specific risk focused audit procedures
Audit of account balances
Residual components
74%59%
15% 80
26%
10
72%51%
11%
28%
80
10%
10
77%70%
5%
24%
80
1%
10

1 4 1S M I T H S G R O U P P L C A N N U A L R E P O R T F Y 2 0 2 0
4
The remaining 26% of total Group revenue, 28% of Group profit before tax from continuing operations and 23% of total Group assets is represented by reporting components which individually did not represent more than 3% of any of total Group revenue for continuing operations, Group profit before tax for continuing operations or total Group assets. For these residual components, we performed an analysis at an aggregated Group level to re-examine our assessment that there were no significant risks of material misstatement within these components.
The Group audit team instructed component auditors as to the significant areas to be covered, including the relevant risks detailed above and the information to be reported back. The Group audit team set the component materialities, which ranged from £0.2 million to £12 million, having regard to the mix of size and risk profile of the Group across the components. The work on 33 of the 34 components was performed by component auditors and the audit of the Parent Company was performed by the Group team. The work on Smiths Medical was also performed by component auditors.
A senior member of the Group audit team visited three countries, covering six of the components in scope. Following the outbreak of COVID-19 and the related travel restrictions, we were unable to continue physical site visits to further components. To replace these, senior members of the Group audit team held regular video conference meetings with all in scope components. These meetings involved explanation of Group audit instructions, involvement in planning audit procedures, discussing progress updates and emerging findings, reviewing outcomes of testing performed and involvement in discussing audit findings with component management. The Group audit team routinely reviewed the audit documentation of all component audits through various stages of their audits. Due to travel restrictions imposed as a result of COVID-19, we were unable to visit one China component (not financially significant) and remote access to audit documentation is prohibited by local law. As a result of this restriction we extended our oversight of this component’s audit through extended discussion and expanded reporting.
4 We have nothing to report on going concern The Directors have prepared the Financial Statements on the going concern basis as they do not intend to liquidate the Company or the Group or to cease their operations, and as they have concluded that the Company’s and the Group’s financial positions mean that this is realistic. They have also concluded that there are no material uncertainties that could cast significant doubt over their ability to continue as a going concern for at least a year from the date of approval of the financial statements (“the going concern period”).
Our responsibility is to conclude on the appropriateness of the Directors’ conclusions and, had there been a material uncertainty related to going concern, to make reference to that in this audit report. However, as we cannot predict all future events or conditions and as subsequent events may result in outcomes that are inconsistent with judgements that were reasonable at the time they were made, the absence of reference to a material uncertainty in this auditor’s report is not a guarantee that the Group and the Company will continue in operation.
In our evaluation of the Directors’ conclusions, we considered the inherent risks to the Group’s and Company’s business model and analysed how those risks might affect the Group’s and Company’s financial resources or ability to continue operations over the going concern period. The risks that we considered most likely
to adversely affect the Group’s and Company’s available financial resources over this period were:
– Adverse trading conditions and impact on the Group’s operations or that of its suppliers and customers, such as delays and cancellations of orders and deliveries, as a result of the current COVID-19 pandemic, resulting in a significant deterioration in the Group’s liquidity position.
– Product quality failure which would result in reputational damage amongst customers and therefore reduction in orders and customer loss as well as potential significant liability claims raised against the Group.
As these were risks that could potentially cast significant doubt on the Group’s and the Company’s ability to continue as a going concern, we considered sensitivities over the level of available financial resources indicated by the Group’s financial forecasts taking account of reasonably possible (but not unrealistic) adverse effects that could arise from these risks individually and collectively and evaluated the achievability of the actions the Directors consider they would take to improve the position should the risks materialise. We also considered less predictable but realistic second order impacts, such as the impact of Brexit and the erosion of customer or supplier confidence, which could result in a rapid reduction of available financial resources.
Based on this work, we are required to report to you if:
– we have anything material to add or draw attention to in relation to the Directors’ statement in the Accounting Policies, on page 149, on the use of the going concern basis of accounting with no material uncertainties that may cast significant doubt over the Group and Company’s use of that basis for a period of at least twelve months from the date of approval of the financial statements; or
– the related statement under the Listing Rules set out on page 131 is materially inconsistent with our audit knowledge.
We have nothing to report in these respects, and we did not identify going concern as a key audit matter.
5 We have nothing to report on the other information in the Annual Report The Directors are responsible for the other information presented in the Annual Report together with the financial statements. Our opinion on the financial statements does not cover the other information and, accordingly, we do not express an audit opinion or, except as explicitly stated below, any form of assurance conclusion thereon.
Our responsibility is to read the other information and, in doing so, consider whether, based on our financial statements audit work, the information therein is materially misstated or inconsistent with the financial statements or our audit knowledge. Based solely on that work we have not identified material misstatements in the other information.
Strategic Report and Directors’ Report
Based solely on our work on the other information:
– we have not identified material misstatements in the Strategic Report and the Directors’ Report;
– in our opinion the information given in those reports for the financial year is consistent with the financial statements; and
– in our opinion those reports have been prepared in accordance with the Companies Act 2006.

1 4 2 S M I T H S G R O U P P L C A N N U A L R E P O R T F Y 2 0 2 0
F I N A N C I A L S T A T E M E N T SI N D E P E N D E N T A U D I T O R S ’ R E P O R T C O N T I N U E D
Directors’ Remuneration Report In our opinion the part of the Directors’ Remuneration Report to be audited has been properly prepared in accordance with the Companies Act 2006.
Disclosures of emerging and principal risks and longer-term viability Based on the knowledge we acquired during our financial statements audit, we have nothing material to add or draw attention to in relation to:
– the Directors’ confirmation within the Viability Statement page 77 that they have carried out a robust assessment of the emerging and principal risks facing the Group, including those that would threaten its business model, future performance, solvency and liquidity;
– the Principal Risks disclosures describing these risks and explaining how they are being managed and mitigated; and
– the Directors’ explanation in the Viability Statement of how they have assessed the prospects of the Group, over what period they have done so and why they considered that period to be appropriate, and their statement as to whether they have a reasonable expectation that the Group will be able to continue in operation and meet its liabilities as they fall due over the period of their assessment, including any related disclosures drawing attention to any necessary qualifications or assumptions.
Under the Listing Rules we are required to review the Viability Statement. We have nothing to report in this respect.
Our work is limited to assessing these matters in the context of only the knowledge acquired during our financial statements audit. As we cannot predict all future events or conditions and as subsequent events may result in outcomes that are inconsistent with judgements that were reasonable at the time they were made, the absence of anything to report on these statements is not a guarantee as to the Group’s and Company’s longer-term viability.
Corporate governance disclosures We are required to report to you if:
– we have identified material inconsistencies between the knowledge we acquired during our financial statements audit and the Directors’ statement that they consider that the Annual Report and financial statements taken as a whole is fair, balanced and understandable and provides the information necessary for shareholders to assess the Group’s position and performance, business model and strategy; or
– the section of the Annual Report describing the work of the Audit & Risk Committee does not appropriately address matters communicated by us to the Audit & Risk Committee.
We are required to report to you if the corporate governance statement does not properly disclose a departure from the provisions of the UK Corporate Governance Code specified by the Listing Rules for our review.
We have nothing to report in these respects.
6 We have nothing to report on the other matters on which we are required to report by exception Under the Companies Act 2006, we are required to report to you if, in our opinion:
– adequate accounting records have not been kept by the Parent Company, or returns adequate for our audit have not been received from components not visited by us; or
– the Parent Company Financial Statements and the part of the Directors’ Remuneration Report to be audited are not in agreement with the accounting records and returns; or
– certain disclosures of Directors’ remuneration specified by law are not made; or
– we have not received all the information and explanations we require for our audit.
We have nothing to report in these respects.
7 Respective responsibilities Directors’ responsibilities As explained more fully in their statement set out on page 132 the Directors are responsible for: the preparation of the financial statements including being satisfied that they give a true and fair view; such internal control as they determine is necessary to enable the preparation of financial statements that are free from material misstatement, whether due to fraud or error; assessing the Group and Parent Company’s ability to continue as a going concern, disclosing, as applicable, matters related to going concern; and using the going concern basis of accounting unless they either intend to liquidate the Group or the Parent Company or to cease operations, or have no realistic alternative but to do so.
Auditor’s responsibilities Our objectives are to obtain reasonable assurance about whether the financial statements as a whole are free from material misstatement, whether due to fraud or other irregularities (see below), or error, and to issue our opinion in an auditor’s report. Reasonable assurance is a high level of assurance, but does not guarantee that an audit conducted in accordance with ISAs (UK) will always detect a material misstatement when it exists. Misstatements can arise from fraud, other irregularities or error and are considered material if, individually or in aggregate, they could reasonably be expected to influence the economic decisions of users taken on the basis of the financial statements.
A fuller description of our responsibilities is provided on the FRC’s website at www.frc.org.uk/auditorsresponsibilities.
Irregularities – ability to detectWe identified areas of laws and regulations that could reasonably be expected to have a material effect on the financial statements from our general commercial and sector experience and through discussion with the Directors and other management (as required by auditing standards), and discussed with the Directors and other management the policies and procedures regarding compliance with laws and regulations. We communicated identified laws and regulations throughout our team and remained alert to any indications of non-compliance throughout the audit. This included communication from the Group audit team to component audit teams of relevant laws and regulations identified at Group level.

1 4 3S M I T H S G R O U P P L C A N N U A L R E P O R T F Y 2 0 2 0
4
The potential effect of these laws and regulations on the financial statements varies considerably.
Firstly, the Group is subject to laws and regulations that directly affect the financial statements including financial reporting legislation (including related companies legislation), distributable profits legislation, pension regulation and taxation legislation and we assessed the extent of compliance with these laws and regulations as part of our procedures on the related financial statement items.
Secondly, the Group is subject to many other laws and regulations where the consequences of non-compliance could have a material effect on amounts or disclosures in the financial statements, for instance through the imposition of fines or litigation. We identified the following areas as those most likely to have such an effect: health and safety, anti-bribery, employment law, environmental law, recognising the nature of the Group’s activities. Auditing standards limit the required audit procedures to identify non-compliance with these laws and regulations to enquiry of the Directors and other management and inspection of regulatory and legal correspondence, if any. Through these procedures, we became aware of actual or suspected non-compliance and considered the effect as part of our procedures on the related financial statement items.
Further detail in respect of litigations is set out in the key audit matter disclosures in section 2 of this report.
Owing to the inherent limitations of an audit, there is an unavoidable risk that we may not have detected some material misstatements in the financial statements, even though we have properly planned and performed our audit in accordance with auditing standards. For example, the further removed non-compliance with laws and regulations (irregularities) is from the events and transactions reflected in the financial statements, the less likely the inherently limited procedures required by auditing standards would identify it. In addition, as with any audit, there remained a higher risk of non-detection of irregularities, as these may involve collusion, forgery, intentional omissions, misrepresentations, or the override of internal controls. We are not responsible for preventing non-compliance and cannot be expected to detect non-compliance with all laws and regulations.
8 The purpose of our audit work and to whom we owe our responsibilities This report is made solely to the Company’s members, as a body, in accordance with Chapter 3 of Part 16 of the Companies Act 2006. Our audit work has been undertaken so that we might state to the Company’s members those matters we are required to state to them in an auditor’s report and for no other purpose. To the fullest extent permitted by law, we do not accept or assume responsibility to anyone other than the Company and the Company’s members, as a body, for our audit work, for this report, or for the opinions we have formed.
Michael Maloney (Senior Statutory Auditor) for and on behalf of KPMG LLP, Statutory Auditor Chartered Accountants 15 Canada Square London E14 5GL
23 September 2020

Consolidated income statement
Year ended 31 July 2020 Year ended 31 July 2019
NotesHeadline
£m
Non-headline (note 3)
£mTotal
£mHeadline
£m
Non-headline (note 3)
£mTotal
£m
CONTINUING OPERATIONSRevenue 1 2,548 – 2,548 2,498 – 2,498Cost of sales (1,559) – (1,559) (1,429) – (1,429)
Gross profit 989 – 989 1,069 – 1,069Sales and distribution costs (270) – (270) (267) – (267)Administrative expenses (392) (86) (478) (375) (101) (476)
OPERATING PROFIT 2 327 (86) 241 427 (101) 326
Interest receivable 6 – 6 11 – 11Interest payable (55) – (55) (62) – (62)Other financing gains/(losses) – (66) (66) – 18 18Other finance income – retirement benefits 8 – 7 7 – 11 11
Finance costs 4 (49) (59) (108) (51) 29 (22)
Continuing operations – profit before taxation 278 (145) 133 376 (72) 304
Taxation 6 (79) 13 (66) (103) (59) (162)
Continuing operations – profit for the year 199 (132) 67 273 (131) 142
Discontinued operationsProfit from discontinued operations 28 139 61 200 112 (27) 85
PROFIT FOR THE YEAR 338 (71) 267 385 (158) 227
Profit for the year attributable to: Smiths Group shareholders – continuing operations 197 (132) 65 271 (131) 140Smiths Group shareholders – discontinued operations 139 61 200 112 (27) 85Non-controlling interests 2 – 2 2 – 2
338 (71) 267 385 (158) 227
EARNINGS PER SHARE 5
Basic 66.9p 56.8pBasic – continuing 16.4p 35.4pDiluted 66.4p 56.5pDiluted – continuing 16.3p 35.1p
References in the consolidated income statement, consolidated statement of comprehensive income, consolidated balance sheet, consolidated statement of changes in equity and consolidated cash-flow statement relate to notes on pages 158 to 204, which form an integral part of the consolidated accounts.
1 4 4 S M I T H S G R O U P P L C A N N U A L R E P O R T F Y 2 0 2 0
C O N S O L I D A T E D P R I M A R Y S T A T E M E N T SF I N A N C I A L S T A T E M E N T S

Consolidated statement of comprehensive income
Notes
Year ended 31 July 2020
£m
Year ended 31 July 2019
£m
PROFIT FOR THE YEAR 267 227
Other comprehensive income: Re-measurement of post-retirement benefits assets and obligations 8 19 (76) Taxation thereon 6 (2) 13
Other comprehensive income and expenditure which will not be reclassified to the consolidated income statement 17 (63)
Other comprehensive income which will be reclassified and reclassifications: Exchange (losses)/gains (205) 191 Fair value gains/(losses) and reclassification adjustments: – on financial asset at fair value through other comprehensive income 2 2 – deferred in the period on cash-flow and net investment hedges 73 (77) – reclassified to income statement on cash-flow and net investment hedges (2) (4)Total other comprehensive income (115) 49Total comprehensive income 152 276
Attributable to: Smiths Group shareholders 151 272Non-controlling interests 1 4
152 276
Total comprehensive income attributable to Smiths Group shareholders arising from:
Continuing operations 59 148
Discontinued operations 92 124
151 272
1 4 5S M I T H S G R O U P P L C A N N U A L R E P O R T F Y 2 0 2 0
4
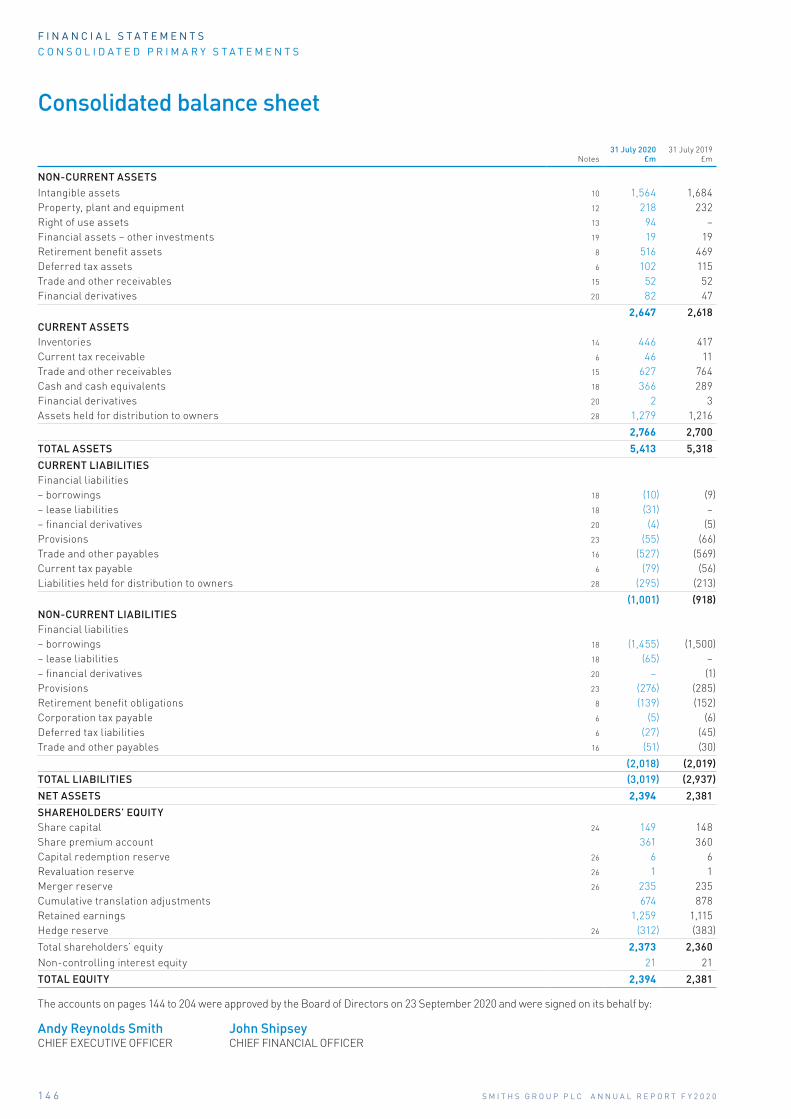
Consolidated balance sheet
Notes31 July 2020
£m31 July 2019
£m
NON-CURRENT ASSETSIntangible assets 10 1,564 1,684Property, plant and equipment 12 218 232Right of use assets 13 94 –Financial assets – other investments 19 19 19Retirement benefit assets 8 516 469Deferred tax assets 6 102 115Trade and other receivables 15 52 52Financial derivatives 20 82 47
2,647 2,618CURRENT ASSETSInventories 14 446 417Current tax receivable 6 46 11Trade and other receivables 15 627 764Cash and cash equivalents 18 366 289Financial derivatives 20 2 3Assets held for distribution to owners 28 1,279 1,216
2,766 2,700
TOTAL ASSETS 5,413 5,318
CURRENT LIABILITIESFinancial liabilities– borrowings 18 (10) (9)– lease liabilities 18 (31) –– financial derivatives 20 (4) (5)Provisions 23 (55) (66)Trade and other payables 16 (527) (569)Current tax payable 6 (79) (56)Liabilities held for distribution to owners 28 (295) (213)
(1,001) (918)NON-CURRENT LIABILITIESFinancial liabilities– borrowings 18 (1,455) (1,500)– lease liabilities 18 (65) –– financial derivatives 20 – (1)Provisions 23 (276) (285)Retirement benefit obligations 8 (139) (152)Corporation tax payable 6 (5) (6)Deferred tax liabilities 6 (27) (45)Trade and other payables 16 (51) (30)
(2,018) (2,019)TOTAL LIABILITIES (3,019) (2,937)
NET ASSETS 2,394 2,381
SHAREHOLDERS’ EQUITYShare capital 24 149 148Share premium account 361 360Capital redemption reserve 26 6 6Revaluation reserve 26 1 1Merger reserve 26 235 235Cumulative translation adjustments 674 878Retained earnings 1,259 1,115Hedge reserve 26 (312) (383)
Total shareholders’ equity 2,373 2,360Non-controlling interest equity 21 21
TOTAL EQUITY 2,394 2,381
The accounts on pages 144 to 204 were approved by the Board of Directors on 23 September 2020 and were signed on its behalf by:
Andy Reynolds Smith John ShipseyCHIEF EXECUTIVE OFFICER CHIEF FINANCIAL OFFICER
1 4 6 S M I T H S G R O U P P L C A N N U A L R E P O R T F Y 2 0 2 0
C O N S O L I D A T E D P R I M A R Y S T A T E M E N T SF I N A N C I A L S T A T E M E N T S

Consolidated statement of changes in equity
Notes
Share capital and share
premium £m
Other reserves
£m
Cumulative translation
adjustments £m
Retained earnings
£m
Hedge reserve
£m
Equityshareholders’
funds£m
Non-controlling
Interest £m
Total equity
£m
At 31 July 2019 508 242 878 1,115 (383) 2,360 21 2,381
Impact of adopting IFRS 16 – – – (1) – (1) – (1)
Impact of adopting IFRIC 23 – – – (4) – (4) – (4)
Profit for the year – – – 265 – 265 2 267 Other comprehensive income: – re-measurement of post-retirement benefits after tax – – – 17 – 17 – 17 – exchange losses net of recycling – – (204) (204) (1) (205) – fair value gains and related tax – – – 2 71 73 – 73
Total comprehensive income for the year – – (204) 284 71 151 1 152
Transactions relating to ownership interests: Exercises of share options 24 2 – – – – 2 – 2Purchase of own shares 26 – – – (18) – (18) – (18)Dividends:– equity shareholders 25 – – – (126) – (126) – (126)– non-controlling interest – – – – – – (1) (1)Share-based payment 9 – – – 9 – 9 – 9
At 31 July 2020 510 242 674 1,259 (312) 2,373 21 2,394
Notes
Share capital and share
premium £m
Other reserves
£m
Cumulative translation
adjustments (represented)
£m
Retained earnings
(represented) £m
Hedge reserve
£m
Equity shareholders’
funds £m
Non-controlling
Interest £m
Total equity
£m
At 31 July 2018 506 242 689 1,137 (302) 2,272 16 2,288
Profit for the year – – – 225 – 225 2 227 Other comprehensive income: – re-measurement of post-retirement benefits after tax – – – (63) – (63) – (63) – exchange losses net of recycling – – 189 – – 189 2 191 – fair value gains/(losses) and related tax – – – 2 (81) (79) – (79)
Total comprehensive income for the year – – 189 164 (81) 272 4 276
Transactions relating to ownership interests: Exercises of share options 24 2 – – – – 2 – 2Purchase of own shares 26 – – – (19) – (19) – (19)Dividends:– equity shareholders 25 – – – (178) – (178) – (178)– non-controlling interest – – – – – – (1) (1)Receipt of capital from non-controlling interest – – – – – – 2 2
Share-based payment 9 – – – 11 – 11 – 11
At 31 July 2019 508 242 878 1,115 (383) 2,360 21 2,381
Retained earnings in the comparatives for the year to 31 July 2019 have been represented to show the cumulative foreign exchange translation differences as a separate component of equity.
1 4 7S M I T H S G R O U P P L C A N N U A L R E P O R T F Y 2 0 2 0
4

Consolidated cash-flow statement
Notes
Year ended 31 July 2020
£m
Year ended 31 July 2019
£m
Net cash inflow from operating activities 29 429 346Cash-flows from investing activitiesExpenditure on capitalised development 10 (35) (27)Expenditure on other intangible assets 10 (14) (12)Purchases of property, plant and equipment 12 (61) (79)Disposals of property, plant and equipment 1 4Capital returned by/(investment in) financial assets – 2Acquisition of businesses 27 (24) (277)Acquisition of businesses – discontinued operations 28 (12) –Disposal of businesses – discontinued operations 1 30Tax paid on disposal of businesses – discontinued operations – (8)
Net cash-flow used in investing activities (144) (367)
Cash-flows from financing activitiesProceeds from exercise of share options 24 2 2Purchase of own shares 26 (18) (19)Settlement of cash settled share awards – (2)Dividends paid to equity shareholders 25 (126) (178)Payment of lease liabilities (47) –Cash inflow/(outflow) from matured derivative financial instruments 1 –
Reduction and repayment of borrowings 18 – (194)
Net cash-flow used in financing activities (188) (391)
Net increase/(decrease) in cash and cash equivalents 97 (412)Cash and cash equivalents at beginning of year 289 717Movement in net cash held in disposal group 6 (26)Foreign exchange rate movements (26) 10
Cash and cash equivalents at end of year 18 366 289
Cash and cash equivalents at end of year comprise:– cash at bank and in hand 173 153– short-term deposits 193 136
366 289
1 4 8 S M I T H S G R O U P P L C A N N U A L R E P O R T F Y 2 0 2 0
F I N A N C I A L S T A T E M E N T SC O N S O L I D A T E D P R I M A R Y S T A T E M E N T S

Accounting policies
Basis of preparationThe accounts have been prepared in accordance with the Companies Act 2006 applicable to companies reporting under International Financial Reporting Standards (IFRS) and International Financial Reporting Interpretations Committee (IFRIC) interpretations, as adopted by the European Union.
The consolidated financial statements have been prepared under the historical cost convention modified to include revaluation of certain financial instruments, share options and pension assets and liabilities, held at fair value as described below.
Going concernThe Directors are satisfied that the Group has adequate resources to continue to operate for a period not less than 12 months from the date of approval of the financial statements and that there are no material uncertainties around their assessment. Accordingly, the Directors continue to adopt the going concern basis of accounting.
The Group’s business activities, together with the factors likely to affect its future development, performance and position, are set out in the Strategic Report on pages 06 to 80. The Group’s financial position, cash flows, liquidity and borrowing facilities are described in the Strong financial framework section on pages 18 to 21.
Given the significant impact of COVID-19 on the macroeconomic conditions in which the Group is operating, the Directors have placed a particular focus on the appropriateness of adopting the going concern basis in preparing the financial statements for the year ended 31 July 2020.
In concluding that the going concern basis is appropriate, the Directors have modelled the impact of a severe but plausible downside scenario for COVID-19 whereby the Group experiences:
(i) Demand decline:
– a significant revenue decline in the first half of FY2021, resulting in a 25% year-on-year fall in revenue for FY2021. The decline being driven by a drop in demand in John Crane and Detection due to customer circumstances, weak demand in Flex-Tek and a reduction in Interconnect revenues due to a market slowdown and supply disruptions; and
– a further period of continued dampened demand for 12 months with a slow recovery beginning towards the end of FY2021 and into the first half of FY2022.
(ii) Supply chain disruption:
– supply chain disruptions assuming a closure of all manufacturing sites in November and December (with the exception of Medical);
– split shifts and inefficiency due to staff shortage thereafter; and
– ongoing supply chain disruption due to both ability of suppliers to continue to service and availability of freight forwarding to ship supplies.
This scenario assumes no additional mitigation than currently being enacted in terms of staff reductions, restructuring or government subsidies.
Throughout this severe but plausible downside scenario, the Group continues to have significant liquidity headroom on existing facilities and against the RCF financial covenant.
Other factors considered by the Board as part of their going concern assessment included the potential impact of Brexit trade talks, alongside inherent uncertainties in cash flow forecasts. Based on the above, the Directors have concluded that the Group is well placed to manage its financing and other business risks satisfactorily, and
they have a reasonable expectation that the Group will have adequate resources to continue in operation for at least 12 months from the signing date of these financial statements. They therefore consider it appropriate to adopt the going concern basis of accounting in preparing the financial statements.
Key estimates and significant judgements The preparation of the accounts in conformity with generally accepted accounting principles requires management to make estimates and judgements that affect the reported amounts of assets and liabilities and disclosure of contingent assets and liabilities at the date of the accounts and the reported amounts of revenues and expenses during the reporting period. Actual results may differ from these estimates.
The key sources of estimation uncertainty together with the significant judgements and assumptions used for these consolidated financial statements are set out below.
Sources of estimation uncertaintyImpairment reviews of intangible assetsIn carrying out impairment reviews of intangible assets, a number of significant assumptions have to be made when preparing cash-flow projections to determine the value in use of the asset or cash generating unit (CGU). These include the future rate of market growth, discount rates, the market demand for the products acquired, the future profitability of acquired businesses or products, levels of reimbursement and success in obtaining regulatory approvals. If actual results differ or changes in expectations arise, impairment charges may be required which would adversely impact operating results.
Critical estimates, and the effect of variances in these estimates, are disclosed in note 11 and note 28.
Retirement benefitsDetermining the value of the future defined benefit obligation involves significant estimates in respect of the assumptions used to calculate present values. These include future mortality, discount rate and inflation. The Group uses previous experience and independent actuarial advice to select the values for critical estimates.
The Group's principal defined benefit pension plans are in the UK and the US and these have been closed so that no future benefits are accrued. Critical estimates for these plans, and the effect of variances in these estimates, are disclosed in note 8.
Provisions for liabilities and chargesJohn Crane, Inc. (JCI), a subsidiary of the Group, is one of many co-defendants in litigation relating to products previously manufactured which contained asbestos. Provision of £231m (FY2019: £237m) has been made for the future defence costs which the Group is expected to incur and the expected costs of future adverse judgments against JCI. Whilst well-established incidence curves can be used to estimate the likely future pattern of asbestos-related disease, JCI’s claims experience is significantly impacted by other factors which influence the US litigation environment. These can include: changing approaches on the part of the plaintiffs’ bar; changing attitudes amongst the judiciary at both trial and appellate levels; and legislative and procedural changes in both the state and federal court systems. Because of the significant uncertainty associated with the future level of asbestos claims and of the costs arising out of the related litigation, there can be no guarantee that the assumptions used to estimate the provision will result in an accurate prediction of the actual costs that will be incurred.
1 4 9S M I T H S G R O U P P L C A N N U A L R E P O R T F Y 2 0 2 0
4
A C C O U N T I N G P O L I C I E S

In quantifying the expected costs JCI takes account of the advice of an expert in asbestos liability estimation. The following estimates were made in preparing the provision calculation:
– the period over which the expenditure can be reliably estimated is judged to be ten years, based on past experience regarding significant changes in the litigation environment that have occurred every few years and on the amount of time taken in the past for some of those changes to impact the broader asbestos litigation environment. See note 23 for a sensitivity showing the impact on the provision of reducing or increasing this time horizon;
– the future trend of legal costs, the rate of future claims filed, the rate of successful resolution of claims, and the average amount of judgments awarded have been projected based on the past history of JCI claims and well-established tables of asbestos incidence projections, since this is the best available evidence. Claims history from other defendants is not used to calculate the provision because JCI’s defence strategy generates a significantly different pattern of legal costs and settlement expenses. See note 23 for a sensitivity showing the range of expected future spend.
Titeflex Corporation, a subsidiary of the Group in the Flex-Tek division, has received a number of claims from insurance companies seeking recompense on a subrogated basis for the effects of damage allegedly caused by lightning strikes in relation to its flexible gas piping product. It has also received a number of product liability claims regarding this product, some in the form of purported class actions. Titeflex Corporation believes that its products are a safe and effective means of delivering gas when installed in accordance with the manufacturer’s instructions and local and national codes; however some claims have been settled on an individual basis without admission of liability. Provision of £66m (FY2019: £74m) has been made for the costs which the Group is expected to incur in respect of these claims. In preparing the provision calculation, key estimates have been made about the impact of safe installation initiatives on the level of future claims. See note 23 for a sensitivity showing the impact on the provision of reducing or increasing the expected impact. However, because of the significant uncertainty associated with the future level of claims, there can be no guarantee that the assumptions used to estimate the provision will result in an accurate prediction of the actual costs that may be incurred.
All provisions may be subject to potentially material revisions from time to time if new information becomes available as a result of future events.
TaxationThe Group has recognised deferred tax assets of £128m (FY2019: £106m) relating to losses and £75m (FY2019: £68m) relating to the John Crane, Inc. and Titeflex Corporation litigation provisions. The recognition of assets pertaining to these items requires management to make significant estimates as to the likelihood of realisation of these deferred tax assets and the phasing and attribution of future taxable profits. This is based on a number of factors, which management use to assess the expectation that the benefit of these assets will be realised, including expected future levels of operating profit, expenditure on litigation, pension contributions and the timing of the unwind of other tax positions.
Significant judgements made in applying accounting policies Business combinationsOn the acquisition of a business, the Group has to make judgements on the identification of specific intangible assets which are recognised separately from goodwill and then amortised over their estimated useful lives. These include items such as brand names and customer lists, to which value is first attributed at the time of acquisition. The capitalisation of these assets and the related amortisation charges are based on judgments about the value and economic life of such items.
Where acquisitions are significant, appropriate advice is sought from professional advisers before making such allocations.
Retirement benefitsAt 31 July 2020 the Group has recognised a retirement benefit asset of £516m (FY2019: £469m), principally relating to UK schemes, which arises from the rights of the employers to recover the surplus at the end of the life of the scheme.
The recognition of this surplus is a significant judgement. There is judgement required in determining whether an unconditional right of refund exists based on the provisions of the relevant trust deed and rules. Having taken legal advice with regards to the rights of the Group under the relevant Trust deed and rules, it has been determined that the surplus is recoverable by the Group and therefore can be recognised. If the pension schemes were wound up while they still had members, the schemes would need to buy out the benefits of all members. The buyouts would cost significantly more than the carrying value of the scheme liabilities within these financial statements which are calculated in accordance with IAS 19: Employee benefits.
Capitalisation of development costsExpenditure incurred in the development of major new products is capitalised as internally generated intangible assets only when it has been judged that strict criteria are met, specifically in relation to the products' technical feasibility and commercial viability (the ability to generate probable future economic benefits).
The assessment of technical feasibility and the future commercial viability of development projects requires significant judgement and the use of assumptions. Key judgements made in the assessment of future commercial viability include:
– Scope of work to achieve regulatory clearance (where required) – including the level testing evidence and documentation;
– Competitor activity – including the impact of potential competitor product launches on the market place and customer demand; and
– Launch timeline – including time and resource required to establish and support the commercial launch of a new product.
Revenue recognitionRevenue is recognised as the performance obligations to deliver products or services are satisfied and revenue is recorded based on the amount of consideration expected to be received in exchange for satisfying the performance obligations.
Smiths Detection and Smiths Interconnect have multi-year contractual arrangements for the sale of goods and services. Where these contracts have separately identifiable components with distinct patterns of delivery and customer acceptance, revenue is accounted for separately for each identifiable component. Judgement is applied in the identification of the performance obligations of the contract and the allocation of contract revenue to each performance obligation.
The Group enters into certain contracts for agreed fees that are performed across more than one accounting period and revenue is recognised over time. Judgement is required to assess the stage of completion of the contract activity at the balance sheet date.
1 5 0 S M I T H S G R O U P P L C A N N U A L R E P O R T F Y 2 0 2 0
F I N A N C I A L S T A T E M E N T SA C C O U N T I N G P O L I C I E S

This assessment requires the expected total costs of the contract and the costs to complete to be determined.
TaxationAs stated in the previous section 'Sources of estimation uncertainty'. The Group has recognised deferred tax assets of £128m (FY2019: £106m) relating to losses and £75m (FY2019: £68m) relating to the John Crane, Inc. and Titeflex Corporation litigation provisions. The decision to recognise deferred tax assets requires judgement and it has been concluded that there are sufficient taxable profits in future periods to support recognition.
Presentation of the Smiths Medical demergerFollowing the Group's decision to pursue a demerger of the Smiths Medical business, judgement is required to determine the most appropriate financial reporting presentation of the division and its performance.
The key judgement for this classification is that the following conditions were met at the balance sheet date:
– The Group is committed to distribute the assets;
– The assets are available for immediate sale in their present condition;
– Actions to complete the distribution have been initiated and shareholder approval is highly probable;
– The distribution must be expected to be completed within one year from the date of classification; and
– It should be unlikely that any significant changes will be made to the plan or that it will be withdrawn.
The IFRS 5 requirement above for the expected completion of the transaction within 12 months of the date of classification was not achieved in FY2020, as the demerger project was paused in March 2020 due to unprecedented circumstances of the second half of FY2020.
However management has determined that, as the Group remains demonstrably committed to the demerger project for Smiths Medical, the criteria for classification as discontinued and held for distribution to owners continue to be met.
As a result of this classification, the results of Smiths Medical are presented as profit from discontinued operations and the Smiths Medical assets and liabilities are reported in assets and liabilities held for distribution to owners in FY2020 and FY2019.
Presentation of headline profits and underlying growthIn order to provide users of the accounts with a clear and consistent presentation of the performance of the Group’s ongoing trading activity, the income statement is presented in a three column format with 'headline' profits shown separately from non-headline items. In addition, the Group reports underlying growth rates for sales and profit measures.
See note 1 for disclosures of headline operating profit and note 30 for more information about the alternative performance measures ('APMs') used by the Group.
Judgement is required in determining which items should be included as non-headline. The amortisation/impairment of acquired intangibles, legacy liabilities, material one-off items and certain re-measurements are included in a separate column of the income statement. See note 3 for a breakdown of the items excluded from headline profit.
Calculating underlying growth also requires judgement. Underlying growth excludes the effects of foreign exchange, acquisitions and disposals, restructuring charges, impairment of capitalised development and COVID related balance sheet write-downs.
Significant accounting policies
Basis of consolidationThe consolidated accounts incorporate the financial statements of Smiths Group plc (the ‘Company’) and its subsidiary undertakings, together with the Group’s share of the results of its associates. A list of the subsidiaries of Smiths Group plc is provided on pages 220 to 228.
Subsidiaries are all entities controlled by the Company. Subsidiaries are fully consolidated from the date on which control is obtained by the Company to the date that control ceases.
Associates are entities over which the Group has significant influence but which it does not control, generally accompanied by a share of between 20% and 50% of the voting rights. Investments in associates are accounted for using the equity method.
Foreign currenciesThe Company’s presentational currency and functional currency is sterling. The financial position of all subsidiaries and associates that have a functional currency different from sterling are translated into sterling at the rate of exchange at the date of that balance sheet, and the income and expenses are translated at average exchange rates for the period. All resulting foreign exchange rate movements are recognised as a separate component of equity.
On consolidation, foreign exchange rate movements arising from the translation of the net investment in foreign entities, and of borrowings and other currency instruments designated as hedges of such investments, are taken to shareholders’ equity. When a foreign operation is sold, the cumulative amount of such foreign exchange rate movements is recognised in the income statement as part of the gain or loss on sale.
Foreign exchange rate movements arising on transactions are recognised in the income statement. Those arising on trading are taken to operating profit; those arising on borrowings are classified as finance income or cost.
RevenueRevenue is measured at the fair value of the consideration received, net of trade discounts (including distributor rebates) and sales taxes. Revenue is discounted only where the impact of discounting is material.
When the Group enters into complex contracts with multiple, separately identifiable components, the terms of the contract are reviewed to determine whether or not the elements of the contract should be accounted for separately. If a contract is being split into multiple components, the contract revenue is allocated to the different components at the start of the contract. The basis of allocation depends on the substance of the contract. The Group considers relative stand-alone selling prices, contractual prices and relative cost when allocating revenue.
The Group has identified the following different types of revenue:
Sale of goods (i) – generic products manufactured by Smiths Generic products are defined as either;
– Products that are not specific to any particular customer;
– Products that may initially be specific to a customer but can be reconfigured at minimal cost, i.e. retaining a margin, for sale to an alternative customer; or
– Products that are specific to a customer but are manufactured at Smiths’ risk, i.e. we have no right to payment of costs plus margin if the customer refuses to take control of the goods.
1 5 1S M I T H S G R O U P P L C A N N U A L R E P O R T F Y 2 0 2 0
4

For established products with simple installation requirements, revenue is recognised when control of the product is passed to the customer. The point in time that control passes is defined in accordance with the agreed shipping terms and is determined on a case by case basis. The time of despatch or delivery of the goods to the customer is normally the point at which invoicing occurs. However for some generic products, revenue is recognised when the overall performance obligation has been completed, which is often after the customer has completed its acceptance procedures and has assumed control.
Products that are sold under multiple element arrangements, i.e. contracts involving a combination of products and services, are bundled into a single performance obligation unless the customer can benefit from the goods or services either on their own, or together with other resources that are readily available to the customer and are distinct within the context of the contract.
For contracts that pass control of the product to the customer only on completion of installation services, revenue is recognised upon completion of the installation.
An obligation to provide a refund for faulty products under the standard warranty terms is recognised as a provision. If the contract includes terms that either extend the warranty beyond the standard term or imply that maintenance is provided to keep the product working, these are service warranties and revenue is deferred to cover the performance obligation in an amount equivalent to the stand-alone selling price of that service.
Sale of goods (ii) – customer-specific products where the contractual terms include rights to payment for work performed to dateCustomer-specific products are defined as being:
– Products that cannot be reconfigured economically such that it remains profitable to sell to another customer;
– Products that cannot be sold to another customer due to contractual restrictions; and
– Products that allow Smiths to charge for the work performed to date in an amount that represents the costs incurred to date plus a margin, should the customer refuse to take control of the goods.
For contracts that meet the terms listed above, revenue is recognised over the period that the Group is engaged in the manufacture of the product, calculated using the input method based on the amount of costs incurred to date compared to the overall costs of the contract. The time of despatch or delivery of the goods to the customer is normally the point at which invoicing occurs.
An obligation to provide a refund for faulty products under the standard warranty terms is recognised as a provision. If the contract includes terms that either extend the warranty beyond the standard term or imply that maintenance is provided to keep the product working, these are service warranties and revenue is deferred to cover the performance obligation in an amount equivalent to the stand-alone selling price of that service.
Services relating to the installation, repair and ongoing maintenance of equipmentServices include installation, commissioning, testing, training, software hosting & maintenance, product repairs and contracts undertaking extended warranty services.
For complex installations where the supply of services cannot be separated from the supply of product, revenue is recognised upon acceptance of the combined performance obligation (see Sale of goods (i) above).
For services that can be accounted for as a separate performance obligation, revenue is recognised over time, assessed on the basis of the actual service provided as a proportion of the total services to be provided.
Depending on the nature of the contract, revenue is recognised as follows:
– Installation, commissioning and testing services (when neither linked to the supply of product nor subject to acceptance) is recognised rateably as the service is provided;
– Training services are recognised on completion of the training course;
– Software hosting & maintenance services are recognised rateably over the life of the contract;
– Product repair services, where the product is returned to Smiths premises for remedial action, are recognised when the product is returned to the customer and they regain control of the asset;
– On-site ad hoc product repair services are recognised rateably as the services are performed;
– Long-term product repair and maintenance contracts are recognised rateably over the contract term; and
– Extended service warranties are recognised rateably over the contract term.
Invoicing for services depends on the nature of the service provided with some services charged in advance and others in arrears.
Where contracts are accounted for under the revenue recognised over time basis, the proportion of costs incurred is used to determine the percentage of contract completion.
Contracts for the construction of substantial assets, which normally last in excess of one year, are accounted for under the revenue recognised over time basis, using an input method.
For fixed-price contracts, revenue is recognised based upon an assessment of the amount of cost incurred under the contract, compared to the total expected costs that will be incurred under the contract. This calculation is applied cumulatively with any over/under recognition being adjusted in the current period.
For cost-plus contracts, revenue is recognised based upon costs incurred to date plus any agreed margin.
For both fixed-price and cost-plus contracts, invoicing is normally based on a schedule with milestone payments.
Contract costsThe Group has taken the practical expedient of not capitalising contract costs as they are expected to be expensed within one year from the date of signing.
LeasesThe Group has adopted IFRS 16: Leases in the current year. The impact of adopting this new accounting standard on the Group's results, accounting policies and key judgements ais set out on pages 156 to 157.
1 5 2 S M I T H S G R O U P P L C A N N U A L R E P O R T F Y 2 0 2 0
F I N A N C I A L S T A T E M E N T SA C C O U N T I N G P O L I C I E S

TaxationThe charge for taxation is based on profits for the year and takes into account taxation deferred because of temporary differences between the treatment of certain items for taxation and accounting purposes.
Current income tax assets and liabilities are measured at the amount expected to be recovered from or paid to taxation authorities. Tax benefits are not recognised unless it is likely that the tax positions are sustainable. Once considered to be likely, tax benefits are reviewed to assess whether a provision should be made based on prevailing circumstances. Tax provisions are included in current tax liabilities. The tax rates and tax laws used to compute the amount are those that are enacted or substantively enacted, at the reporting date in the countries where the Group operates and generates taxable income.
The Group operates and is subject to taxation in many countries. Tax legislation is different in each country, is often complex and is subject to interpretation by management and government authorities. These matters of judgement give rise to the need to create provisions for uncertain tax positions which are recognised when it is considered more likely than not that there will be a future outflow of funds to a taxing authority. Provisions are made against individual exposures and take into account the specific circumstances of each case, including the strength of technical arguments, recent case law decisions or rulings on similar issues and relevant external advice.
The amounts are measured using one of the following methods, depending on which of the methods the Directors expect will better reflect the amount the Group will pay to the tax authority:
– The single best estimate method is used where there is a single outcome that is more likely than not to occur. This will happen, for example, where the tax outcome is binary or the range of possible outcomes is very limited;
– Alternatively, a probability weighted expected value is used where, on the balance of probabilities, there will be a payment to the tax authority but there are a number of possible outcomes. In this case, a probability is assigned to each of the outcomes and the amount provided is the sum of these risk-weighted amounts. In assessing provisions against uncertain tax positions, management uses in-house tax experts, professional firms and previous experience of the taxing authority to evaluate the risk.
Deferred tax is provided in full using the balance sheet liability method. A deferred tax asset is recognised where it is probable that future taxable income will be sufficient to utilise the available relief. Tax is charged or credited to the income statement except when it relates to items charged or credited directly to equity, in which case the tax is also dealt with in equity.
Deferred tax is provided on temporary differences arising on investments in subsidiaries and associates, except where the timing of the reversal of the temporary differences is controlled by the Company and it is probable that the temporary difference will not reverse in the foreseeable future.
Deferred tax liabilities and assets are not discounted.
Employee benefits
Share-based compensationThe fair value of the shares or share options granted is recognised as an expense over the vesting period to reflect the value of the employee services received. The fair value of options granted, excluding the impact of any non-market vesting conditions, is calculated using established option pricing models, principally binomial models. The probability of meeting non-market vesting conditions, which include profitability targets, is used to estimate the number of share options which are likely to vest.
For cash-settled share-based payment, a liability is recognised based on the fair value of the payment earned by the balance sheet date. For equity-settled share-based payment, the corresponding credit is recognised directly in reserves.
Pension obligations and post-retirement benefitsThe Group has defined benefit plans, defined contribution plans and post-retirement healthcare schemes.
For defined benefit plans and post-retirement healthcare schemes the liability for each scheme recognised in the balance sheet is the present value of the obligation at the balance sheet date less the fair value of any plan assets. The obligation is calculated annually by independent actuaries using the projected unit credit method. The present value is determined by discounting the estimated future cash outflows using interest rates of AA-rated corporate bonds that are denominated in the currency in which the benefits will be paid, and that have terms to maturity approximating to the terms of the related liability. Actuarial gains and losses arising from experience adjustments and changes in actuarial assumptions are recognised in full in the period in which they occur, outside of the income statement, and are presented in the statement of comprehensive income. Past service costs are recognised immediately in the income statement. Where relevant, the assets are valued on a fair value basis. The insured liabilities are valued by an external qualified actuary equal to the accounting valuation of corresponding liabilities insured.
For defined contribution plans, the Group pays contributions to publicly or privately administered pension insurance plans on a mandatory, contractual or voluntary basis. Contributions are expensed as incurred.
Intangible assets
GoodwillGoodwill represents the excess of the cost of an acquisition over the fair value of the Group’s share of the identifiable net assets of the acquired subsidiary at the date of acquisition.
The goodwill arising from acquisitions of subsidiaries after 1 August 1998 is included in intangible assets, tested annually for impairment and carried at cost less accumulated impairment losses. Gains and losses on the disposal of an entity include the carrying amount of goodwill relating to the entity sold. The goodwill arising from acquisitions of subsidiaries before 1 August 1998 was set against reserves in the year of acquisition.
Goodwill is tested for impairment at least annually. Any impairment is recognised immediately in the income statement. Subsequent reversals of impairment losses for goodwill are not recognised.
Research and developmentExpenditure on research and development is charged to the income statement in the year in which it is incurred with the exception of:
– Amounts recoverable from third parties; and
– Expenditure incurred in respect of the development of major new products where the outcome of those projects is assessed as being reasonably certain as regards viability and technical feasibility. Such expenditure is capitalised and amortised over the estimated period of sale for each product, commencing in the year that the product is ready for sale. Amortisation is charged straight line or based on the units produced, depending on the nature of the product and the availability of reliable estimates of production volumes.
The cost of development projects which are expected to take a substantial period of time to complete includes attributable borrowing costs.
1 5 3S M I T H S G R O U P P L C A N N U A L R E P O R T F Y 2 0 2 0
4

Intangible assets acquired in business combinationsThe identifiable net assets acquired as a result of a business combination may include intangible assets other than goodwill. Any such intangible assets are amortised straight line over their expected useful lives as follows:
Patents, licences and trademarks up to 20 yearsTechnology up to 13 yearsCustomer relationships up to 11 years
The assets’ useful lives are reviewed, and adjusted if appropriate, at each balance sheet date.
Software, patents and intellectual propertyThe estimated useful lives are as follows:
Software up to 7 years
Patents and intellectual property
shorter of the economic life and the period the right is legally enforceable
The assets’ useful lives are reviewed, and adjusted if appropriate, at each balance sheet date.
Property, plant and equipmentProperty, plant and equipment are stated at historical cost less accumulated depreciation and any recognised impairment losses.
Land is not depreciated. Depreciation is provided on other assets estimated to write off the depreciable amount of relevant assets by equal annual instalments over their estimated useful lives. In general, the rates used are:
Freehold and long leasehold buildings 2% per annumShort leasehold property over the period of the leasePlant, machinery, etc. 10% to 20% per annumFixtures, fittings, tools and other equipment 10% to 33% per annum
The cost of any assets which are expected to take a substantial period of time to complete includes attributable borrowing costs.
The assets’ residual values and useful lives are reviewed, and adjusted if appropriate, at each balance sheet date. An asset’s carrying amount is written down immediately to its recoverable amount if the asset’s carrying amount is greater than its estimated recoverable amount.
InventoriesInventories are stated at the lower of cost and net realisable value. Cost is determined using the first-in, first-out (FIFO) method. The cost of finished goods and work in progress comprises raw materials, direct labour, other direct costs and related production overheads (based on normal operating capacity). The cost of items of inventory which take a substantial period of time to complete includes attributable borrowing costs.
The net realisable value of inventories is the estimated selling price in the ordinary course of business, less applicable variable selling expenses. Provisions are made for any slow-moving, obsolete or defective inventories.
Trade and other receivablesTrade receivables and contract assets are initially recognised at fair value and subsequently measured at amortised cost, less any appropriate provision for expected credit losses.
A provision for expected credit losses is established when there is objective evidence that it will not be possible to collect all amounts due according to the original payment terms. Expected credit losses are determined using historical write-offs as a basis with a default risk multiplier applied to reflect country risk premium. The Group applies the IFRS 9 simplified lifetime expected credit loss approach for trade receivables and contract assets which do not contain a significant financing component.
ProvisionsProvisions are recognised when the Group has a present obligation (legal or constructive) as a result of a past event, it is probable that an outflow of resources embodying economic benefits will be required to settle the obligation, and a reliable estimate can be made of the amount of the obligation. Where the Group expects some or all of a provision to be reimbursed, for example under an insurance contract, the reimbursement is recognised as a separate asset but only when the reimbursement is virtually certain.
Provisions for warranties and product liability, disposal indemnities, restructuring costs, vacant leasehold property and legal claims are recognised when: the Company has a legal or constructive obligation as a result of a past event; it is probable that an outflow of resources will be required to settle the obligation; and the amount has been reliably estimated. Provisions are not recognised for future operating losses.
Provisions are discounted where the time value of money is material.
Where there is a number of similar obligations, for example where a warranty has been given, the likelihood that an outflow will be required in settlement is determined by considering the class of obligations as a whole. A provision is recognised even if the likelihood of an outflow with respect to any one item included in the same class of obligations may be small.
Businesses held for distribution to ownersBusinesses classified as held for distribution to owners are measured at the lower of carrying amount and fair value less costs to distribute. Impairment losses on initial classification as held for distribution and gains or losses on subsequent remeasurements are included in the income statement. No depreciation is charged on assets and businesses classified as held for distribution.
Businesses are classified as held for distribution to owners if their carrying amount will be settled principally through a demerger transaction rather than through continuing use and the following criteria are met:
– The business must be a separate major line of business, available for immediate distribution in its present condition;
– Management is committed to the plan, shareholder approval is highly probable and the plan is unlikely to be significantly changed or withdrawn; and
– Distribution is expected to be completed within 12 months of the balance sheet date.
The assets and liabilities of businesses held for distribution to owners are presented as separate lines on the balance sheet.
1 5 4 S M I T H S G R O U P P L C A N N U A L R E P O R T F Y 2 0 2 0
F I N A N C I A L S T A T E M E N T SA C C O U N T I N G P O L I C I E S

Discontinued operationsA discontinued operation is either:
– A component of the Group’s business that represents a separate major line of business or geographical area of operations that has been disposed of, has been abandoned or meets the criteria to be classified as held for distribution to owners; or
– A business acquired solely for the purpose of selling it.
Discontinued operations are presented on the income statement as a separate line and are shown net of tax.
In accordance with IAS 21, gains and losses on intragroup monetary assets and liabilities are not eliminated. Therefore foreign exchange rate movements on intercompany loans with discontinued operations are presented on the income statement as non-headline finance cost items.
Cash and cash equivalentsCash and cash equivalents include cash at bank and in hand and highly liquid interest-bearing securities with maturities of three months or less.
In the cash-flow statement, cash and cash equivalents are shown net of bank overdrafts, which are included as current borrowings in liabilities on the balance sheet.
Financial assetsThe classification of financial assets depends on the purpose for which the assets were acquired. Management determines the classification of an asset at initial recognition and re-evaluates the designation at each reporting date. Financial assets are classified as: measured at amortised cost, fair value though other comprehensive income or fair value through profit and loss.
Financial assets primarily include trade receivables, cash and cash equivalents (comprising cash at bank, money market funds and short term deposits), short term investments, derivatives (foreign exchange contracts and interest rate derivatives) and unlisted investments.
– Trade receivables are classified either as ‘held to collect’ and measured at amortised cost or as ‘held to collect and sell’ and measured at fair value through other comprehensive income (FVOCI). The Group may sell trade receivables due from certain customers before the due date. Any trade receivables from such customers that are not sold at the reporting date are classified as ‘held to collect and sell’.
– Cash and cash equivalents (consisting of balances with banks and other financial institutions, money-market funds, short-term deposits) and short-term investments are subject to low market risk. Cash balances and short-term investments are measured at amortised cost. Money market funds and short-term deposits are measured at fair value through profit and loss (FVPL).
– Derivatives are measured at FVPL.
– Unlisted investments are measured at FVOCI.
Financial assets are derecognised when the right to receive cash-flows from the assets has expired, or has been transferred, and the Company has transferred substantially all of the risks and rewards of ownership. When securities classified as available for sale are sold or impaired, the accumulated fair value adjustments previously taken to reserves are included in the income statement.
Financial assets are classified as current if they are expected to be realised within 12 months of the balance sheet date.
Financial liabilitiesBorrowings are initially recognised at the fair value of the proceeds, net of related transaction costs. These transaction costs, and any discount or premium on issue, are subsequently amortised under the effective interest rate method through the income statement as interest over the life of the loan and added to the liability disclosed in the balance sheet. Related accrued interest is included in the borrowings figure.
Borrowings are classified as current liabilities unless the Group has an unconditional right to defer settlement of the liability for at least one year after the balance sheet date.
Derivative financial instruments and hedging activities The Group uses derivative financial instruments to hedge its exposures to foreign exchange and interest rates arising from its operating and financing activities.
Derivative financial instruments are initially recognised at fair value on the date a derivative contract is entered into and are subsequently re-measured at their fair value. The method of recognising any resulting gain or loss depends on whether the derivative financial instrument is designated as a hedging instrument and, if so, the nature of the item being hedged.
Where derivative financial instruments are designated into hedging relationships, the Group formally documents the following:
– the risk management objective and strategy for entering the hedge;
– the nature of the risks being hedged and the economic relationship between the hedged item and the hedging instrument; and
– whether the change in cash-flows of the hedged item and hedging instrument are expected to offset each other.
Changes in the fair value of any derivative financial instruments that do not qualify for hedge accounting are recognised immediately in the income statement.
Fair value hedgeThe Group uses derivative financial instruments to convert part of its fixed rate debt to floating rate in order to hedge the risks arising from its external borrowings.
The Group designates these as fair value hedges of interest rate risk. Changes in the hedging instrument are recorded in the income statement, together with any changes in the fair values of the hedged assets or liabilities that are attributable to the hedged risk to the extent that the hedge is effective. Gains or losses relating to any ineffectiveness are immediately recognised in the income statement.
Cash-flow hedgeCash-flow hedging is used by the Group to hedge certain exposures to variability in future cash-flows.
The effective portions of changes in the fair values of derivatives that are designated and qualify as cash-flow hedges are recognised in equity. The gain or loss relating to any ineffective portion is recognised immediately in the income statement. Amounts accumulated in the hedge reserve are recycled in the income statement in the periods when the hedged items will affect profit or loss (for example, when the forecast sale that is hedged takes place).
If a forecast transaction that is hedged results in the recognition of a non-financial asset (for example, inventory) or a liability, the gains and losses previously deferred in the hedge reserve are transferred from the reserve and included in the initial measurement of the cost of the asset or liability. When a hedging instrument expires or is sold, or when a hedge no longer meets the criteria for hedge accounting, any cumulative gain or loss existing in the hedge reserve at that time remains in the reserve and is recognised when the forecast transaction is ultimately recognised in the income statement.
1 5 5S M I T H S G R O U P P L C A N N U A L R E P O R T F Y 2 0 2 0
4

When a forecast transaction is no longer expected to occur, the cumulative gain or loss that was reported in other comprehensive income is immediately transferred to the income statement.
Net investment hedgeHedges of net investments in foreign operations are accounted for similarly to cash-flow hedges. Any gain or loss on the hedging instrument relating to the effective portion of the hedge is recognised in other comprehensive income; the gain or loss relating to any ineffective portion is recognised immediately in the income statement. When a foreign operation is disposed of, gains and losses accumulated in equity related to that operation are included in the income statement for that period.
Fair value of financial assets and liabilitiesThe fair values of financial assets and financial liabilities are the amounts at which the instrument could be exchanged in a current transaction between willing parties, other than in a forced or liquidation sale.
‘IFRS 13: Fair value measurement’ requires fair value measurements to be classified according to the following hierarchy:
– level 1 – quoted prices in active markets for identical assets or liabilities;
– level 2 – valuations in which all inputs are observable either directly (i.e. as prices) or indirectly (i.e. derived from prices); and
– level 3 – valuations in which one or more inputs that are significant to the resulting value are not based on observable market data.
See note 21 for information on the methods which the Group uses to estimate the fair values of its financial instruments.
DividendsDividends are recognised as a liability in the period in which they are authorised. The interim dividend is recognised when it is paid and the final dividend is recognised when it has been approved by shareholders at the Annual General Meeting.
New accounting standards effective 2020The accounting policies adopted in the preparation of these consolidated financial statements are consistent with those followed in the previous financial year, except for the adoption of the new standards and policies applicable for the year ended 31 July 2020. The significant accounting policies adopted are set out below.
IFRS 16: LeasesThe Group adopted IFRS 16 – Leases with effect from 1 August 2019. The standard fundamentally changed the accounting treatment of leased assets, requiring that all material lease liabilities and corresponding ‘right of use’ assets are recognised on the balance sheet. The operating lease rental expense previously charged to operating profit in the income statement has been replaced by a depreciation charge for the ‘right of use’ assets recognised in operating profit and an interest charge on the lease liabilities recognised in finance costs.
The Group has adopted IFRS 16 using the modified retrospective transition approach, which allows the matching of the opening right of use assets with the opening lease liabilities on 1 August 2019. Under this approach, no restatement of comparative figures is required. On adoption of IFRS 16, the Group recognised lease liabilities in relation to leases which had previously been classified as ‘operating leases’ under the principles of IAS 17, ‘Leases’. These liabilities have been measured at the present value of the remaining lease payments, discounted using a weighted average incremental borrowing rate (IBR) on initial recognition at 1 August 2019 of 4.0%.
On transition the Group applied the following available practical expedients permitted by the standard:
– the exclusion of leases relating to low-value assets (less than £5,000 when new);
– the exclusion of short-term leases, being those with a lease term of 12 months or less; and
– applying the new definition of a lease only to contracts entered into after the transition date.
The impact of adoption of IFRS 16 on the Group’s financial results is set out below:
Year ended 31 July 2020 Consolidated income statement (extract)
Proforma IAS 17
£m
IFRS 16 adjustment
£m
As reported
£m
Headline operating profit 326 1 327Headline finance costs (45) (4) (49)
Continuing operations – headline profit before tax 281 (3) 278
Non-headline items (pre-tax) (145) - (145)Taxation (66) - (66)Profit from discontinued operations 189 11 200
Profit for the financial year 259 8 267
1 5 6 S M I T H S G R O U P P L C A N N U A L R E P O R T F Y 2 0 2 0
F I N A N C I A L S T A T E M E N T SA C C O U N T I N G P O L I C I E S

As at 1 August 2019 Consolidated balance sheet (extract)
Proforma IAS 17
£m
IFRS 16 adjustment
£m
As reported
£m
Non-current assetsRight of use assets - 106 106Current assetsAssets held for distribution to owners 1,216 41 1,257Current liabilitiesLease liabilities (3) (26) (29)Liabilities held for distribution to owners (210) (43) (253)Non-current liabilitiesLease liabilities - (79) (79)Other (1,378) - (1,378)
Net assets 2,381 (1) 2,380
Total equity 2,381 (1) 2,380
Within continuing operations during the year, lease interest of £4m has been recognised within finance costs and £33m of depreciation has been charged to the income statement. In total, payments of £34m were made under leasing contracts, of which £30m was made to repay the principal portion of the lease. Additionally, administrative expenses include £1m in respect of lease payments for short term and low value leases which are not included in the lease liabilities and payments disclosed above.
The impact of adopting IFRS 16 on discontinued operations is to increase profit by £11m. IFRS 16 has a greater impact on profits from discontinued operations than continuing operations, as in accordance with the requirements of IFRS 5, no depreciation is charged on assets classified as held for distribution.
Discounting the operating lease commitments at 31 July 2019 at the IBR reduced the lease liabilities by £21m, £20m of which was offset by increases in the lease liability arising from revised lease extension and termination assumptions.
IFRS 16: Accounting policy and key judgementsHaving adopted IFRS 16, the Group applies the following approach. At the commencement date of the lease, the Group recognises lease liabilities measured at the present value of lease payments to be made over the lease term, which includes periods covered by renewal options the Group is reasonably certain to exercise. In calculating the present value of lease payments, the Group uses the incremental borrowing rate at the lease commencement date.
The Group recognises right of use assets at the commencement date of the lease. Right of use assets are measured at cost including the amount of lease liabilities recognised and initial direct costs incurred, less any incentives granted by the lessor. Right of use assets are subject to impairment. Right of use assets are depreciated over the shorter of the lease term and the useful life of the right of use assets, unless there is a transfer of ownership or purchase option which is reasonably certain to be exercised at the end of the lease term, in which case depreciation is over the useful life of the underlying asset.
Leases of buildings typically have lease terms between 1 and 6 years, while plant and machinery generally have lease terms between 1 and 3 years. The Group also has certain leases of machinery with lease terms of 12 months or less and leases of office equipment with low value (typically below £5,000). The Group applies the ‘short-term lease’ and ‘lease of low-value assets’ recognition exemptions for these leases and recognises the lease payments associated with these leases as an expense on a straight-line basis over the lease term.
IFRIC 23: Uncertainty over income tax treatmentsThe Group adopted IFRIC 23 – Uncertainty over Income Tax Treatments on 1 August 2019. This interpretation is to be applied to the determination of taxable profit, tax bases, unused tax losses, unused tax credits and tax rates, when there is uncertainty over income tax treatments under IAS 12.
The interpretation specifically addresses the following:
– Whether an entity considers uncertain tax treatments separately;
– The assumptions an entity makes about the examination of tax treatments by taxation authorities;
– How an entity determines taxable profit (tax loss), tax bases, unused tax losses, unused tax credits and tax rates; and
– How an entity considers changes in facts and circumstances.
The Group already provides for tax uncertainties and following a detailed assessment the Group has determined that the adoption of this interpretation has not had a material impact on the Group’s financial statements.
New standards and interpretations not yet adoptedNo other new standards, new interpretations or amendments to standards or interpretations have been published which are expected to have a significant impact on the Group’s financial statements.
Parent CompanyThe ultimate Parent Company of the Group is Smiths Group plc, a company incorporated in England and Wales and listed on the London Stock Exchange.
The accounts of the Parent Company, Smiths Group plc, have been prepared in accordance with UK GAAP, applying Financial Reporting Standard 101, “Reduced Disclosure Framework”. The Company accounts are presented in separate financial statements on pages 212 to 219. The principal subsidiaries of the Parent Company are listed in the above accounts.
1 5 7S M I T H S G R O U P P L C A N N U A L R E P O R T F Y 2 0 2 0
4

Notes to the accounts
1 Segment information
Analysis by operating segmentThe Group is organised into five divisions: John Crane, Smiths Detection, Flex-Tek, Smiths Interconnect and Smiths Medical. These divisions design, manufacture and support the following products:
– John Crane – mechanical seals, seal support systems, power transmission couplings and specialised filtration systems;
– Smiths Detection – sensors and systems that detect and identify explosives, narcotics, weapons, chemical agents, biohazards and contraband;
– Flex-Tek – engineered components, flexible hosing and rigid tubing that heat and move fluids and gases;
– Smiths Interconnect – specialised electronic and radio frequency board-level and waveguide devices, connectors, cables, test sockets and sub-systems used in high-speed, high reliability, secure connectivity applications; and
– Smiths Medical – infusion systems, vascular access products, patient airway and temperature management equipment and specialised devices in areas of diagnostic and emergency patient transport.
The position and performance of each division are reported at each Board meeting to the Board of Directors. This information is prepared using the same accounting policies as the consolidated financial information except that the Group uses headline operating profit to monitor the divisional results and operating assets to monitor the divisional position. See note 3 for an explanation of which items are excluded from headline measures.
The Smiths Medical business is classified as a discontinued operation and the segmental information of the Smiths Medical division is disclosed in note 28.
Intersegment sales and transfers are charged at arm’s length prices.
Segment trading performanceYear ended 31 July 2020
John Crane
£m
Smiths Detection
£mFlex-Tek
£m
Smiths Interconnect
£m
Corporate costs
£mTotal
£m
Revenue 955 806 478 309 – 2,548
Divisional headline operating profit 187 82 83 26 – 378Corporate headline operating costs – – – – (51) (51)
Headline operating profit/(loss) 187 82 83 26 (51) 327Items excluded from headline measures (note 3) (33) (25) (31) (3) 6 (86)
Operating profit/(loss) 154 57 52 23 (45) 241
Year ended 31 July 2019
John Crane
£m
Smiths Detection
£mFlex-Tek
£m
Smiths Interconnect
£m
Corporate costs
£mTotal
£m
Revenue 945 798 436 319 – 2,498
Divisional headline operating profit 220 127 84 47 – 478Corporate headline operating costs – – – – (51) (51)
Headline operating profit/(loss) 220 127 84 47 (51) 427Items excluded from headline measures (note 3) (29) (36) (16) (2) (18) (101)
Operating profit/(loss) 191 91 68 45 (69) 326
Headline operating profit is stated after charging the following items:Year ended 31 July 2020
John Crane £m
Smiths Detection
£mFlex-Tek
£m
Smiths Interconnect
£m
Corporate and non-headline
£mTotal
£m
Depreciation – property, plant and equipment 15 12 7 6 1 41Depreciation – right of use assets 15 7 4 5 2 33Amortisation of capitalised development costs – 6 – – – 6
Amortisation of software, patents and intellectual property 4 – – 2 1 7Amortisation of acquired intangibles – – – – 57 57Share-based payment 3 2 1 1 3 10Strategic restructuring costs 14 14 – 2 1 31
Impairment of capitalised development costs – 12 – – – 12
Balance sheet write-downs – trade receivables 4 5 – 3 – 12
F I N A N C I A L S T A T E M E N T S
1 5 8 S M I T H S G R O U P P L C A N N U A L R E P O R T F Y 2 0 2 0
N O T E S T O T H E A C C O U N T S

Year ended 31 July 2019
John Crane £m
Smiths Detection
£mFlex-Tek
£m
Smiths Interconnect
£m
Corporate and non-headline
£mTotal
£m
Depreciation – property, plant and equipment 14 10 5 6 2 37Amortisation of capitalised development costs – 9 – – – 9Amortisation of software, patents and intellectual property 3 2 – 2 2 9Amortisation of acquired intangibles – – – – 42 42Share-based payment 4 3 1 1 5 14
The corporate and non-headline column comprise central information technology, human resources and head quarters costs and non-headline expenses (see note 3).
Segment assets and liabilities
Segment assets31 July 2020
John Crane £m
Smiths Detection
£mFlex-Tek
£m
Smiths Interconnect
£m
Corporate and non-headline
£mTotal
£m
Property, plant, equipment, right of use assets, development projects, other intangibles and investments 143 125 64 49 26 407Inventory, trade and other receivables 395 438 144 136 11 1,124
Segment assets 538 563 208 185 37 1,531
31 July 2019
John Crane £m
Smiths Detection
£mFlex-Tek
£m
Smiths Interconnect
£m
Corporate and non-headline
£mTotal
£m
Property, plant, equipment, development projects, other intangibles and investments 113 106 52 38 20 329Inventory, trade and other receivables 428 485 171 132 17 1,233
Segment assets 541 591 223 170 37 1,562
Non-headline assets comprise receivables relating to non-headline items, acquisitions and disposals. Further details of the assets held for distribution to owners are disclosed in note 28.
Segment liabilities31 July 2020
John Crane £m
Smiths Detection
£mFlex-Tek
£m
Smiths Interconnect
£m
Corporate and non-headline
£mTotal
£m
Divisional liabilities (142) (288) (60) (55) – (545)Corporate and non-headline liabilities – – – – (364) (364)
Segment liabilities (142) (288) (60) (55) (364) (909)
31 July 2019
John Crane £m
Smiths Detection
£mFlex-Tek
£m
Smiths Interconnect
£m
Corporate and non-headline
£mTotal
£m
Divisional liabilities (158) (287) (63) (56) – (564)Corporate and non-headline liabilities – – – – (386) (386)
Segment liabilities (158) (287) (63) (56) (386) (950)
Non-headline liabilities comprise provisions and accruals relating to non-headline items, acquisitions and disposals. Further details of the liabilities held for distribution to owners are disclosed in note 28.
Reconciliation of segment assets and liabilities to statutory assets and liabilities
Assets Liabilities
31 July 2020
£m
31 July 2019
£m
31 July 2020
£m
31 July 2019
£m
Segment assets and liabilities 1,531 1,562 (909) (950)Goodwill and acquired intangibles 1,489 1,606 – –Derivatives 84 50 (4) (6)Current and deferred tax 148 126 (111) (107)Retirement benefit assets and obligations 516 469 (139) (152)Cash and borrowings 366 289 (1,561) (1,509)
Assets and liabilities held for distribution to owners 1,279 1,216 (295) (213)
Statutory assets and liabilities 5,413 5,318 (3,019) (2,937)
4
1 5 9S M I T H S G R O U P P L C A N N U A L R E P O R T F Y 2 0 2 0

1 Segment information continued
Analysis by operating segment continuedSegment capital expenditure
The capital expenditure on property, plant and equipment, capitalised development and other intangible assets for each division is:
John Crane £m
Smiths Detection
£mFlex-Tek
£m
Smiths Interconnect
£m
Corporate and non-headline
£mTotal
£m
Capital expenditure year ended 31 July 2020 18 29 8 8 3 66Capital expenditure year ended 31 July 2019* 29 23 6 10 1 69
* represented to exclude amounts of capital expenditure relating to businesses held for distribution, which are disclosed in note 28.
Segment capital employed
Capital employed is a non-statutory measure of invested resources. It comprises statutory net assets adjusted to add goodwill recognised directly in reserves in respect of subsidiaries acquired before 1 August 1998 of £787m (FY2019: £787m) and eliminate post-retirement benefit assets and liabilities and litigation provisions relating to non-headline items, both net of related tax, and net debt. See note 30 for a reconciliation of net assets to capital employed.
The 12-month rolling average capital employed by division, which Smiths use to calculate divisional return on capital employed, is: 31 July 2020
John Crane £m
Smiths Detection
£mFlex-Tek
£m
Smiths Interconnect
£mTotal
£m
Average divisional capital employed 989 1,144 474 405 3,012Average capital employed – business held for distribution to owners 1,335
Average corporate capital employed (32)
Average total capital employed 4,315
31 July 2019
John Crane £m
Smiths Detection
£mFlex-Tek
£m
Smiths Interconnect
£mTotal
£m
Average divisional capital employed 938 1,113 359 368 2,778Average capital employed – business held for distribution to owners 1,253
Average corporate capital employed (59)
Average total capital employed 3,972
The Smiths Medical division has been accounted for as a business held for distribution to owners. Further details of the segmental assets and liabilities of the Smiths Medical division are disclosed in note 28.
Analysis of revenueThe revenue for the main product and service lines for each division is:
John Crane
Original equipment
£mAftermarket
£mTotal
£m
Revenue year ended 31 July 2020 314 641 955Revenue year ended 31 July 2019 313 632 945
Smiths Detection
Aviation security
£m
Other security systems
£mTotal
£m
Revenue year ended 31 July 2020 577 229 806Revenue year ended 31 July 2019 522 276 798
Flex-TekAerospace
£mIndustrials
£mTotal
£m
Revenue year ended 31 July 2020 133 345 478Revenue year ended 31 July 2019 121 315 436
Smiths Interconnect
Components, Connectors &
Subsystems £m
Revenue year ended 31 July 2020 309Revenue year ended 31 July 2019 319
N O T E S T O T H E A C C O U N T SF I N A N C I A L S T A T E M E N T S
1 6 0 S M I T H S G R O U P P L C A N N U A L R E P O R T F Y 2 0 2 0

The Group’s statutory revenue is analysed as follows:Year ended
31 July 2020 £m
Year ended 31 July 2019
£m
Sale of goods recognised at a point in time 2,027 1,984Sale of goods recognised over time 52 41Services recognised over time 469 473
2,548 2,498
Analysis by geographical areasThe Group’s revenue by destination and non-current operating assets by location are shown below:
Revenue
Intangible assets, right of use assets and property,
plant and equipment
Year ended 31 July 2020
£m
Year ended 31 July 2019
£m31 July 2020
£m31 July 2019
£m
Americas 1,263 1,243 1,231 1,299
Europe 580 558 553 533
Asia-Pacific 460 409 72 69
Rest of the World 245 288 20 15
2,548 2,498 1,876 1,916
Revenue by destination attributable to the United Kingdom was £85m (FY2019: £100m). Revenue earned in the United States of America is noteworthy totalling £1,068m (FY2019: £1,030m). Revenue by destination has been selected as the basis for attributing revenue to geographical areas as this is the geographic attribution of revenue used by management to review business performance.
Non-current assets located in the United Kingdom total £88m (FY2019: £67m). Significant non-current assets are held in the United States of America £1,177m (FY2019:£1,271m) and Germany £383m (FY2019: £397m).
2 Operating profit is stated after chargingYear ended
31 July 2020 £m
Year ended 31 July 2019
£m
Research and development expense 83 84Depreciation of property, plant and equipment 41 37Depreciation of right of use assets 33 –Amortisation of intangible assets 70 60Strategic restructuring programme and write-downs 55 –
Research and development (R&D) cash costs were £119m (FY2019: £111m) comprising £83m (FY2019: £84m) of R&D expensed to the income statement, £16m (FY2019: £9m) of capitalised costs and £20m (FY2019: £18m) of customer funded R&D.
Administrative expenses include £1m in respect of lease payments for short term and low value leases which are not included within right of use assets and lease liabilities.
Strategic restructuring programme and write-downs
In June 2020 the Group announced a strategic restructuring programme that will ensure it emerges stronger from the COVID-19 crisis and better able to deliver consistent outperformance. The programme is Group-wide and has an operating cash cost of c.£65m which will be spread across FY2020 and FY2021. Programme costs of £31m were recognised in continuing operations and £4m in discontinued operations during FY2020.
The table below shows the analysis of the costs recognised for the restructuring programme and asset write-downs and the calculation basis for headline operating profit excluding restructuring and write-downs:
Year ended 31 July 2020
£m
Year ended 31 July 2019
£m
Restructuring costs – severance costs and footprint rationalisation 31 –Impairment of capitalised development costs 12 –Balance sheet write-downs – trade receivables 12 –
Total strategic restructuring costs and write-downs 55 –
Operating profit – see note 30 for definition 241 326
Non-headline operating profit items – see note 3 86 101
Strategic restructuring costs and write-downs – see above 55 –
Headline operating profit excluding restructuring and write-downs 382 427
4
1 6 1S M I T H S G R O U P P L C A N N U A L R E P O R T F Y 2 0 2 0

2 Operating profit is stated after charging continuedAuditors' remuneration
The following fees were paid or are payable to the company’s auditors, KPMG LLP and other firms in the KPMG network, for the year ended 31 July 2020. Figures in the table and notes below for the year ended 31 July 2019 are in respect of fees paid to the company’s previous auditor, PricewaterhouseCoopers LLP ('PwC').
Payable to KPMG
Year ended 31 July 2020
£m
Payable to PwC
Year ended 31 July 2019
£m
Audit servicesFees payable to the Company’s auditors for the audit of the Company’s annual financial statements 2.3 4.0Fees payable to the Company’s auditors and its associates for other services:– the audit of the Company’s subsidiaries 3.6 1.5
5.9 5.5All other services 0.5 0.2
Other services comprise audit-related assurance services £0.3m (FY2019: £0.2m) and fees for reporting accountant services in connection with a class 1 disposal £0.2m (FY2019: £nil). Total fees for non audit services comprise 9% (FY2019: 4%) of audit fees. Audit-related assurance services include the review of the Interim Report.
3 Non-statutory profit measuresHeadline profit measuresThe Group has identified and defined a ‘headline’ measure of performance which is not impacted by material non-recurring items or items considered non-operational/trading in nature. This non-GAAP measure of profit is not intended to be a substitute for any IFRS measures of performance, but is a key measure used by management to understand and manage performance. See the disclosures on presentation of results in accounting policies for an explanation of the adjustments. The items excluded from 'headline' are referred to as ‘non-headline’ items.
Non-headline operating profit items
The non-headline items included in statutory operating profit for continuing operations are as follows:
Notes
Year ended 31 July 2020
£m
Year ended 31 July 2019
£m
Post-acquisition integration costs and fair value adjustment unwindIntegration programme costs (4) (17)Unwind of acquisition balance sheet fair value uplift – (6)Acquisition and disposal related transaction costs and provision releasesBusiness acquisition/disposal costs (3) (10)Release of acquisition related provisions – 4Legacy pension scheme arrangementsSettlement gain/(loss) on post-retirement benefit schemes 8 7 (1)Guaranteed Minimum Pension (GMP) equalisation 8 – (29)Non-headline litigation provision movementsMovement in provision held against Titeflex Corporation subrogation claims 23 (1) 6Provision for John Crane, Inc. asbestos litigation 23 (31) (17)Cost recovery for John Crane, Inc. asbestos litigation 3 11Other itemsAmortisation of acquisition related intangible assets 10 (57) (42)
Non-headline items in operating profit – continuing operations (86) (101)
Post-acquisition integration costs and fair value adjustment unwindThe £4m (FY2019: £17m) of integration programme costs relate to defined projects for the integration of United Flexible into the existing Flex-Tek business and Morpho Detection into the existing Smiths Detection business. Integration programme costs include the direct costs of organisational change, site rationalisation and entity closure costs. The United Flexible integration programme is due to conclude in 2021 whilst the Morpho Detection integration programme concluded in the current year. Integration costs are recognised as non-headline items because they are considered material and bear no relation to the ongoing performance of the acquired businesses.
The impact of unwinding the acquisition balance sheet fair value adjustments required by IFRS 3 'Business combinations' is recognised as non-headline as the charge does not relate to trading activity. The FY2019 charge of £6m was due to the unwind of fair value uplifts on the United Flexible and Morpho Detection acquisitions.
Acquisition and disposal transaction costs and provision releasesThe £3m of business acquisition/disposal costs (FY2019: £10m) represents incremental transaction costs on the acquisition of Reflex Photonics and additional payments now due on the acquisition of United Flexible following COVID-19 related changes to the US tax code. These costs do not include the cost of employees working on transactions and are reported as non-headline because they are dependent on the level of acquisition and disposal activity in the year.
N O T E S T O T H E A C C O U N T SF I N A N C I A L S T A T E M E N T S
1 6 2 S M I T H S G R O U P P L C A N N U A L R E P O R T F Y 2 0 2 0

The release of acquisition related provisions in FY2019 of £4m represented the release of excess accruals for deferred consideration on business acquisitions. These were reported as non-headline as the initial provision accrual was not recognised as a headline expense.
Legacy pension scheme arrangementsThe £7m settlement gain (FY2019: £1m settlement loss) is principally due to changes to the Group's US post-retirement healthcare plans as a result of the US Patient Protection and Affordable Care Act. In FY2019 £29m of past service costs were recognised following the UK High Court ruling that GMP equalisation is required. These items are included in non-headline as they are non-recurring and relate to legacy pension liabilities.
Non-headline litigation provision movementsThe following litigation costs and recoveries have been treated as non-headline items because the provisions were treated as non-headline when originally recognised and the subrogation claims and litigation relate to products that the Group no longer sells in these markets:
– The £1m net charge (FY2019: £6m credit) recognised by Titeflex Corporation in respect of changes to the estimated cost of future claims is principally due to discount rate movements following a reduction in US treasury bond yields . See note 22 for further details; and
– The £31m (FY2019: £17m) increase in John Crane, Inc. asbestos litigation provision is principally due to discount rate movements following a reduction in US treasury bond yields. The costs recovered via insurer settlements in the current year were £3m (FY2019: £11m). See note 22 for further details.
Other itemsAcquisition related intangible asset amortisation costs of £57m (FY2019: £42m) were recognised in the current year. This is considered to be a non-headline item on the basis that these charges result from acquisition accounting and are non-operational in nature.
Non-headline finance costs items
The non-headline items included in finance costs for continuing operations are as follows:
Notes
Year ended 31 July 2020
£m
Year ended 31 July 2019
£m
Unwind of discount on provisions 23 (5) (8)Other finance income – retirement benefits 8 7 11Foreign exchange (loss)/gain on intercompany loan with discontinued operations (62) 39Other financing gains/(losses) 1 (13)
Non-headline items in finance costs – continuing operations (59) 29
Continuing operations – non-headline loss before taxation (145) (72)
The financing elements of non-headline legacy liabilities, including the £5m (FY2019: £8m) unwind of discount on provisions, are excluded from headline finance costs because these provisions were originally recognised as non-headline and this treatment has been maintained for ongoing costs and credits.
Other finance income comprises £7m (FY2019: £11m) of financing credits relating to retirement benefits. These are excluded from headline finance costs because the ongoing costs and credits are a legacy of previous employee pension arrangements.
Foreign exchange gains or losses on intercompany financing between Smiths Medical and the continuing group are recognised on the face of the income statement as a non-headline item due to the classification of Smiths Medical division as a discontinued operation. The £62m foreign exchange loss in continuing operations (FY2019: £39m gain) matches the foreign exchange gain in discontinued operations. This is excluded from headline net finance costs as these fair value movements are non-operational in nature and are purely a consequence of the presentational requirements for discontinued operations.
Other financing gains represent the fair value movements on financial instruments, foreign exchange movements on borrowings and other financing activities which the Group excludes from headline net finance costs. The current year gain of £1m (FY2019: £13m) is due to the partial reversal of the prior year fair value and net investment hedge ineffectiveness, partially offset by foreign exchange revaluation losses on surplus currency cash balances and intercompany financing – see note 4 for a further breakdown of this balance. These fair value movements are excluded from headline net finance costs when the following requirements are met:
– Fair value gains and losses on the interest element of derivative financial instruments hedging the Group’s net debt exposures are excluded from headline as they will either reverse over time or be matched in future periods by interest charges.
– Fair value gains and losses on the currency element of derivative financial instruments hedging the Group’s net debt and exposures, and exchange gains and losses on borrowings are excluded as the relevant foreign exchange gains and losses on the commercially hedged items are recognised as a separate component of other comprehensive income in accordance with the Group’s foreign currencies accounting policy. 4
1 6 3S M I T H S G R O U P P L C A N N U A L R E P O R T F Y 2 0 2 0

3 Non-statutory profit measures continued Non-headline taxation items
The non-headline items included in taxation for continuing operations are as follows:
Notes
Year ended 31 July 2020
£m
Year ended 31 July 2019
£m
Tax on non-headline loss 6 15 12Tax on the repatriation of treasury legacy cash pools 6 – (17)US deferred tax asset derecognition 6 (5) (18)UK deferred tax asset re-recognition/(derecognition) 6 3 (36)
Non-headline items in taxation – continuing operations 13 (59)
Continuing operations – non-headline loss for the year (132) (131)
Tax on the repatriation of treasury legacy cash poolsA £17m tax charge was recognised in FY2019 on prior year undistributed overseas earnings following the adoption of a new Treasury cash repatriation policy. This cost was reported as non-headline because the impact of the policy change was material and non-recurring.
US deferred tax asset derecognition In FY2019 £18m of tax losses were derecognised following changes in US tax legislation which affected the Group's ability to utilise the losses. The losses equated to non-headline amortisation of intangibles and their derecognition was therefore treated as non-headline. Further net derecognition adjustments were made this year resulting in a charge of £5m following reassessment of future profitability.
UK deferred tax asset derecognition In FY2020 £3m of deferred tax was re-recognised due to movements in UK pension schemes and deferred tax thereon and is matched by a £3m deferred tax charge in equity. In FY2019 £36m of deferred tax was derecognised following the decision to separate Smiths Medical, which reduces the Group's profitability in the UK. These movements are reported as non-headline because recognition arises to match a non-headline deferred tax liability related to the UK legacy pension scheme surplus.
Non-headline items for discontinued operations
The non-headline items for discontinued operations are as follows:
Notes
Year ended 31 July 2020
£m
Year ended 31 July 2019
£m
Acquisition and disposal related transaction costs and provision releasesBusiness acquisition/disposal costs – (2)Medical separation costs (23) (8)Other itemsAmortisation of acquisition related intangible assets – (3)Profit on disposal of businesses – 17Non-headline finance costs items
Foreign exchange gain/(loss) on intercompany loan with parent 62 (39)Other financing gains – 1Non-headline taxation items
Tax on non-headline loss 28 22 8Tax on the repatriation of treasury legacy cash pools – (1)
Non-headline items in profit from discontinued operations 61 (27)
Profit for the year – non-headline items for continuing and discontinued operations (71) (158)
The £2m of business acquisition/disposal costs recognised in FY2019 comprised incremental deal costs and were reported as non-headline because they are dependent on the level of activity in the year.
The incremental costs incurred by the Group on the transaction to demerge the Smiths Medical business amounted to £23m (FY2019: £8m). This cost has been reported as non-headline as the full year effect of the transaction on the Group's financial statements is both material and non-recurring.
The £62m foreign exchange gain on intercompany loan with parent (FY2019: £39m loss) matches the foreign exchange loss in continuing operations. This is excluded from headline net finance costs as these fair value movements are non-operational in nature and are purely a consequence of the presentational requirements for discontinued operations.
The FY2019 profit on disposal of businesses of £17m related to the sale of Smiths Medical's sterile water bottling and EMEA kitting businesses. These are considered to be non-headline items since the profit and cash impacts are material and non-recurring arising from the sale of a business.
N O T E S T O T H E A C C O U N T SF I N A N C I A L S T A T E M E N T S
1 6 4 S M I T H S G R O U P P L C A N N U A L R E P O R T F Y 2 0 2 0

4 Net finance costs
Notes
Year ended 31 July 2020
£m
Year ended 31 July 2019
£m
Interest receivable 6 11
Interest payable:– bank loans and overdrafts, including associated fees (8) (7)– other loans (43) (55)– interest on leases (4) –
Interest payable (55) (62)
Headline net finance costs (49) (51)
Other financing gains/(losses):– valuation movements on fair value hedged debt 10 (52)– valuation movements on fair value derivatives (4) 42– foreign exchange and ineffectiveness on net investment hedges (1) (1)– retranslation of foreign currency bank balances (3) –– other items including counterparty credit risk adjustments and non-hedge accounted derivatives (1) (2)
Other financing gains/(losses) 3 1 (13)Foreign exchange gain on intercompany loan with discontinued operations 3 (62) 39Unwind of discount on provisions 3 (5) (8)Net interest income on retirement benefit obligations 8 7 11
Non-headline finance cost items (59) 29
Net finance costs (108) (22)
5 Earnings per shareBasic earnings per share are calculated by dividing the profit for the year attributable to equity shareholders of the Company by the average number of ordinary shares in issue during the year.
Year ended 31 July 2020
£m
Year ended 31 July 2019
£m
Profit attributable to equity shareholders for the year:– continuing 65 140– discontinued 200 85
Total 265 225
Average number of shares in issue during the year 396,193,310 395,936,520
Statutory earnings per share total – basic 66.9p 56.8p
Statutory earnings per share total – diluted 66.4p 56.5p
Statutory earnings per share continuing operations – basic 16.4p 35.4p
Statutory earnings per share continuing operations – diluted 16.3p 35.1p
Diluted earnings per share are calculated by dividing the profit attributable to ordinary shareholders by 398,814,030 (FY2019: 398,375,376) ordinary shares, being the average number of ordinary shares in issue during the year adjusted by the dilutive effect of employee share schemes. For the year ended 31 July 2020, zero options (FY2019: zero) were excluded from this calculation because their effect was anti-dilutive for continuing operations.
A reconciliation of statutory and headline earnings per share is as follows:Year ended 31 July 2020 Year ended 31 July 2019
£mBasic EPS
(p)Diluted EPS
(p) £mBasic EPS
(p)Diluted EPS
(p)
Total profit attributable to equity shareholders of the Parent Company 265 66.9 66.4 225 56.8 56.5Exclude: Non-headline items (note 3) 71 158
Headline earnings per share 336 84.8 84.2 383 96.8 96.1
Profit from continuing operations attributable to equity shareholders of the Parent Company 65 16.4 16.3 140 35.4 35.1Exclude: Non-headline items (note 3) 132 131
Headline earnings per share – continuing operations 197 49.7 49.4 271 68.4 68.0
4
1 6 5S M I T H S G R O U P P L C A N N U A L R E P O R T F Y 2 0 2 0

6 TaxationThis note only provides information about corporate income taxes under IFRS. Smiths companies operate in over 50 countries across the world. They pay and collect many different taxes in addition to corporate income taxes including: payroll taxes; value added and sales taxes; property taxes; product-specific taxes and environmental taxes. The costs associated with these other taxes are included in profit before tax.
Year ended 31 July 2020
£m
Year ended 31 July 2019
£m
The taxation charge in the consolidated income statement for the year comprises:
Continuing operations– current income tax charge 77 93– current tax adjustments in respect of prior periods 2 5
Current taxation 79 98Deferred taxation (13) 64
Total taxation expense – continuing operations 66 162
Discontinued operations– current income tax charge 11 36– deferred taxation 8 (11)
Total taxation expense – discontinued operations 19 25
Total taxation expense in the consolidated income statement 85 187
Year ended 31 July 2020
£m
Year ended 31 July 2019
£m
Tax on items charged/(credited) to equityDeferred tax:– retirement benefit schemes 2 (13)– foreign exchange (3) –– share-based payments 1 3
– (10)
Of the net £2m charge to equity for retirement benefits, a £3m charge relates to UK retirement schemes.
Current taxation liabilitiesCurrent tax
£m
At 31 July 2018 (34)
Foreign exchange losses (1)Charge to income statement (132)Reclassified to businesses held for distribution to owners (note 28) 9Tax paid 107
At 31 July 2019 (51)
Current tax receivable 11Current tax payable within one year (56)
Corporation tax payable after more than one year (6)
At 31 July 2019 (51)
Charge to income statement (79)Business acquired (note 27) (3)Tax paid 95
At 31 July 2020 (38)
Current tax receivable 46Current tax payable within one year (79)
Corporation tax payable after more than one year (5)
At 31 July 2020 (38)
Taxation liabilities include provisions of £29m (FY2019: £26m), the majority of which relates to the risk of challenge to the geographic allocation of profits by tax authorities.
In addition to the risks provided for, the Group faces a variety of other tax risks, which result from operating in a complex global environment, including the ongoing reform of both international and domestic tax rules, new and ongoing tax audits in the Group’s larger markets and the challenge to fulfil ongoing tax compliance filing and transfer pricing obligations given the scale and diversity of the Group’s global operations.
The Group anticipates that a number of tax audits are likely to conclude in the next 12 to 24 months. Due to the uncertainty associated with such tax items, it is possible that the conclusion of open tax matters, the final outcome may vary significantly from the amounts noted above.
N O T E S T O T H E A C C O U N T SF I N A N C I A L S T A T E M E N T S
1 6 6 S M I T H S G R O U P P L C A N N U A L R E P O R T F Y 2 0 2 0
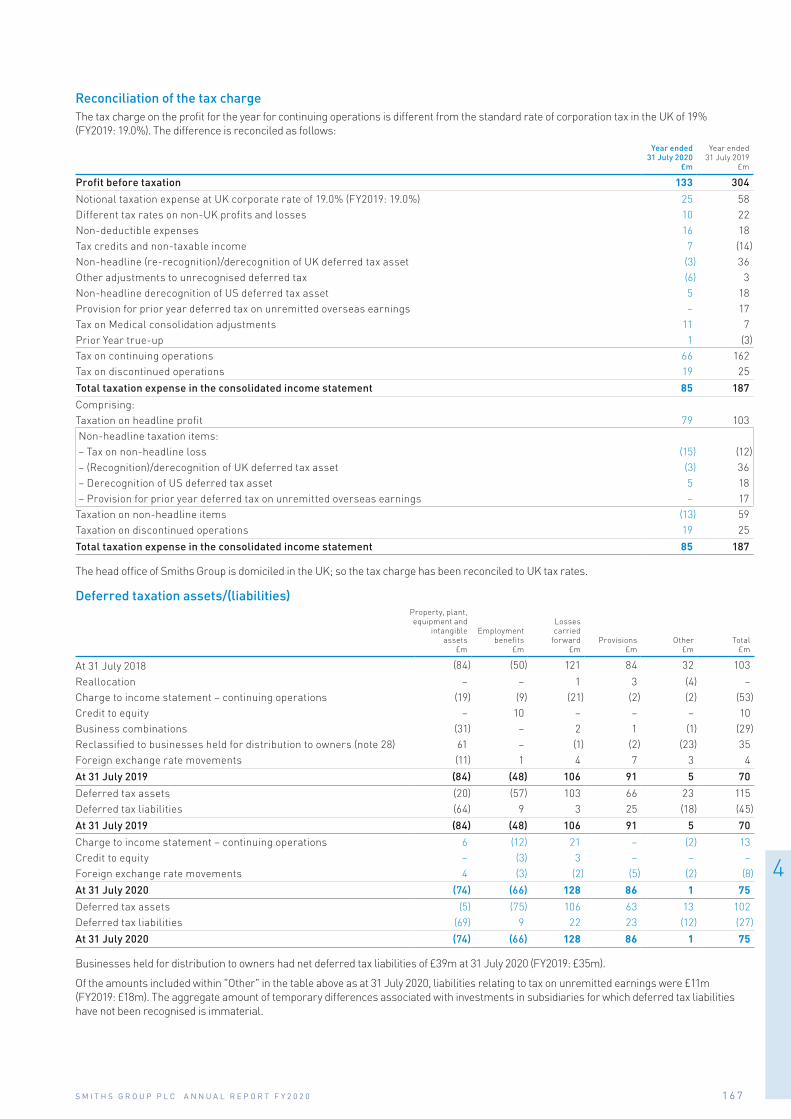
Reconciliation of the tax charge The tax charge on the profit for the year for continuing operations is different from the standard rate of corporation tax in the UK of 19% (FY2019: 19.0%). The difference is reconciled as follows:
Year ended 31 July 2020
£m
Year ended 31 July 2019
£m
Profit before taxation 133 304
Notional taxation expense at UK corporate rate of 19.0% (FY2019: 19.0%) 25 58Different tax rates on non-UK profits and losses 10 22Non-deductible expenses 16 18Tax credits and non-taxable income 7 (14)Non-headline (re-recognition)/derecognition of UK deferred tax asset (3) 36Other adjustments to unrecognised deferred tax (6) 3Non-headline derecognition of US deferred tax asset 5 18Provision for prior year deferred tax on unremitted overseas earnings – 17Tax on Medical consolidation adjustments 11 7Prior Year true-up 1 (3)Tax on continuing operations 66 162Tax on discontinued operations 19 25
Total taxation expense in the consolidated income statement 85 187
Comprising:Taxation on headline profit 79 103 Non-headline taxation items: – Tax on non-headline loss (15) (12) – (Recognition)/derecognition of UK deferred tax asset (3) 36 – Derecognition of US deferred tax asset 5 18 – Provision for prior year deferred tax on unremitted overseas earnings – 17Taxation on non-headline items (13) 59Taxation on discontinued operations 19 25
Total taxation expense in the consolidated income statement 85 187
The head office of Smiths Group is domiciled in the UK; so the tax charge has been reconciled to UK tax rates.
Deferred taxation assets/(liabilities)Property, plant, equipment and
intangible assets
£m
Employment benefits
£m
Losses carried
forward £m
Provisions £m
Other £m
Total £m
At 31 July 2018 (84) (50) 121 84 32 103
Reallocation – – 1 3 (4) –Charge to income statement – continuing operations (19) (9) (21) (2) (2) (53)Credit to equity – 10 – – – 10Business combinations (31) – 2 1 (1) (29)Reclassified to businesses held for distribution to owners (note 28) 61 – (1) (2) (23) 35Foreign exchange rate movements (11) 1 4 7 3 4
At 31 July 2019 (84) (48) 106 91 5 70
Deferred tax assets (20) (57) 103 66 23 115Deferred tax liabilities (64) 9 3 25 (18) (45)
At 31 July 2019 (84) (48) 106 91 5 70
Charge to income statement – continuing operations 6 (12) 21 – (2) 13Credit to equity – (3) 3 – – –Foreign exchange rate movements 4 (3) (2) (5) (2) (8)
At 31 July 2020 (74) (66) 128 86 1 75
Deferred tax assets (5) (75) 106 63 13 102Deferred tax liabilities (69) 9 22 23 (12) (27)
At 31 July 2020 (74) (66) 128 86 1 75
Businesses held for distribution to owners had net deferred tax liabilities of £39m at 31 July 2020 (FY2019: £35m).
Of the amounts included within "Other" in the table above as at 31 July 2020, liabilities relating to tax on unremitted earnings were £11m (FY2019: £18m). The aggregate amount of temporary differences associated with investments in subsidiaries for which deferred tax liabilities have not been recognised is immaterial.
4
1 6 7S M I T H S G R O U P P L C A N N U A L R E P O R T F Y 2 0 2 0

6 Taxation continuedThe deferred tax asset relating to losses has been recognised on the basis of strong evidence of future taxable profits against which the unutilised tax losses can be relieved or it is probable that they will be recovered against the reversal of deferred tax liabilities. Deferred tax relating to provisions includes £59m (FY2019: £50m) relating to John Crane Inc. litigation provision, and £16m (FY2019: £18m) relating to Titeflex Corporation litigation provision. See note 22 for additional information on provisions.
Included in other deferred tax balances above is a deferred tax asset related to inventory of £5m (FY2019: £6m) and deferred revenue of £1m (FY2019: £9m).
Unrecognised Deferred TaxThe Group, including Smiths Medical, has unrecognised deferred tax relating to losses amounting to £94m (FY2019: £243m).
The expiry date of operating losses carried forward is dependent upon the law of the various territories in which the losses arise. A summary of expiry dates for the unrecognised deferred tax on losses is set out below:
2020 £m
Expiry of losses
2019 £m
Expiry of losses
Restricted losses – Asia 27 2021–2026 29 2020–2026
Restricted losses – Americas 1 2021–2022 53 2020–2032
Unrestricted losses – operating losses 66 No expiry 161 No expiry
Total unrecognised deferred tax on losses 94 243
Franked Investment Income Group Litigation Order (FII GLO)Smiths Group plc is one of the companies enrolled in the FII GLO litigation against HMRC. The court actions first filed in 2003 are nearing an end and some claimants with different fact patterns have received payments. Smiths' recoveries are estimated at circa £25m (computed on a simple interest basis and after deducting 45% withholding tax). However there are further relevant legal actions that may impact this estimate.
The Group has not recognised any of this potential tax credit to the financial statements in the current period or the prior year.
EU Commission Investigation re Claims for Partial (75%) Exemption for Profits from qualifying loan relationshipsIn April 2019, the European Commission issued its decision in respect of a state aid investigation into the Group Financing Exemption in the UK controlled foreign company ("CFC") rules. The European Commission’s decision found that part of the Group Financing Exemption constitutes state aid. The Group Financing Exemption was introduced in legislation by the UK Government in 2013. In common with other UK-based international companies whose arrangements were in line with the then UK CFC legislation, Smiths Group may be affected by the ultimate outcome of this decision.
In December 2019, HMRC issued general guidance on reliefs which can be taken into account in computing the amount of State Aid. If the European Commission’s decision is ultimately upheld, Smiths should be able to use other tax attributes, including tax losses, such that it is expected that there will be no material cash outlay for Smiths. Nevertheless, the use of these attributes is not certain and the estimated maximum potential liability (which includes both tax and interest) remains at £15m. Based on our current assessment, no provision is being made in respect of this issue.
7 EmployeesYear ended 31 July 2020 Year ended 31 July 2019
Continuing operations
£m
Discontinued operations
£mTotal
£m
Continuing operations
£m
Discontinued operations
£mTotal
£m
Staff costs during the period
Wages and salaries 695 257 952 645 245 890Social security 84 25 109 80 25 105Share-based payments (note 9) 10 1 11 14 1 15Pension costs (including defined contribution schemes) (note 8) 28 12 40 27 13 40
817 295 1,112 766 284 1,050
The average number of persons employed, rounded to the nearest 50 employees, was:Year ended
31 July 2020Year ended
31 July 2019
John Crane 6,450 6,200Smiths Detection 3,000 2,850Flex-Tek 2,850 2,550Smiths Interconnect 2,450 2,350Corporate (including central/shared IT services) 300 300
Continuing operations 15,050 14,250
Discontinued operations – Smiths Medical 8,050 7,750Total 23,100 22,000
N O T E S T O T H E A C C O U N T SF I N A N C I A L S T A T E M E N T S
1 6 8 S M I T H S G R O U P P L C A N N U A L R E P O R T F Y 2 0 2 0

Key managementThe key management of the Group comprises Smiths Group plc Board Directors and Executive Committee members. Their aggregate compensation is shown below. Details of Directors’ remuneration are contained in the report of the Remuneration Committee on pages 108 to 129.
Year ended 31 July 2019
£m
Year ended 31 July 2018
£m
Key management compensationSalaries and short-term employee benefits 10.3 10.2Cost of post-retirement benefits 0.8 0.3Cost of share-based incentive plans 3.0 5.0
No member of key management had any material interest during the period in a contract of significance (other than a service contract or a qualifying third-party indemnity provision) with the Company or any of its subsidiaries.
Options and awards held at the end of the period by key management in respect of the Company’s share-based incentive plans were:Year ended 31 July 2020 Year ended 31 July 2019
Number of instruments
’000
Weighted average exercise
price
Number of instruments
’000
Weighted average
exercise price
SEP 270 231LTIP 1,494 1,463Restricted stock 96 178SAYE 13 £10.58 12 £10.63
Related party transactionsThe only related party transactions in FY2020 were key management compensation (FY2019: key management compensation).
8 Post-retirement benefitsSmiths provides post-retirement benefits to employees in a number of countries. This includes defined benefit and defined contribution plans and, mainly in the United Kingdom (UK) and United States of America (US), post-retirement healthcare.
Defined contribution plansThe Group operates defined contribution plans across many countries. In the UK a defined contribution plan has been offered since the closure of the UK defined benefit pension plans. In the US a 401(k) defined contribution plan operates. The total expense recognised in the consolidated income statement in respect of all these plans was £38m (FY2019: £37m).
Defined benefit and post-retirement healthcare plansThe principal defined benefit pension plans are in the UK and in the US and these have been closed so that no future benefits are accrued.
For all schemes, pension costs are assessed in accordance with the advice of independent, professionally qualified actuaries. These valuations have been updated by independent qualified actuaries in order to assess the liabilities of the schemes as at 31 July 2019. Contributions to the schemes are made on the advice of the actuaries, in accordance with local funding requirements.
The changes in the present value of the net pension asset in the period were: Year ended
31 July 2020 £m
Year ended 31 July 2019
£m
At beginning of period 311 381Foreign exchange rate movements 2 (4)Current service cost (3) (3)Scheme administration costs (5) (4)Past service cost, curtailments, settlements 8 (30)Finance income – retirement benefits 7 11Contributions by employer 33 36Actuarial gain/(loss) 19 (76)
Net retirement benefit asset 372 311
The £372m net retirement benefit asset includes £5m (FY2019: £6m) of pension obligations disclosed as liabilities held for distribution to owners.
UK pension schemes
Smiths funded UK pension schemes are subject to a statutory funding objective, as set out in UK pension legislation. Scheme trustees need to obtain regular actuarial valuations to assess the scheme against this funding objective. The trustees and sponsoring companies need to agree funding plans to improve the position of a scheme when it is below the acceptable funding level.
The UK Pensions Regulator has extensive powers to protect the benefits of members, promote good administration and reduce the risk of situations arising which may require compensation to be paid from the Pension Protection Fund. These include imposing a schedule of contributions or the calculation of the technical provisions, where a trustee and company fail to agree appropriate calculations.
4
1 6 9S M I T H S G R O U P P L C A N N U A L R E P O R T F Y 2 0 2 0

8 Post-retirement benefits continued Smiths Industries Pension Scheme ('SIPS')This scheme was closed to future accrual effective 1 November 2009. SIPS provides index-linked pension benefits based on final earnings at date of closure. SIPS is governed by a corporate trustee (S.I. Pension Trustees Limited, a wholly owned subsidiary of Smiths Group plc). The board of trustee directors currently comprises four company-nominated trustees and four member-nominated trustees, with an independent chairman selected by Smiths Group plc. Trustee Directors are responsible for the management, administration, funding and investment strategy of the scheme.
The most recent formal actuarial valuation of this Scheme has been performed using the Projected Unit Method as at 31 March 2017. As part of the 2017 valuation process, a long-term funding objective to reach full funding on a 'gilts + 0%' basis by 31 December 2028 was agreed with the Scheme’s Trustee. Under the funding plan for SIPS agreed in June 2018, Smiths will pay cash contributions of £1m a month until the long-term funding objective is achieved.
Work on the valuation of the scheme as at 31 March 2020 has commenced and experience gains and losses identified during the work on the 2020 valuation have been incorporated into the IAS 19 valuation. Any changes to the funding plan agreed after the 2020 valuation has been completed will be reported in next year’s annual report. Under the governing documentation of SIPS, any future surplus would be returnable to Smiths Group plc by refund, assuming gradual settlement of the liabilities over the lifetime of the scheme.
The duration of SIPS liabilities is around 23 years (FY2019: 23 years) for active deferred members, 22 years (FY2019: 23 years) for deferred members and 12 years (FY2019: 12 years) for pensioners and dependants. In FY2019 SIPS purchased a buy-in annuity policy with Canada Life for a premium of £176m. An actuarial loss of £14m was recognised in FY2019 as a result of this buy-in agreement.
TI Group Pension Scheme ('TIGPS')This scheme was closed to future accrual effective 1 November 2009. TIGPS provides index-linked pension benefits based on final earnings at the date of closure. TIGPS is governed by a corporate trustee (TI Pension Trustee Limited, an independent company). The board of trustee directors comprises four company-nominated trustees and four member-nominated trustees, with an independent trustee director selected by the Trustee. The Trustee is responsible for the management, administration, funding and investment strategy of the scheme.
The most recent actuarial valuation of this scheme has been performed using the Projected Unit Method as at 5 April 2017. As part of the 2017 valuation process, a long-term funding objective to reach full funding on a solvency (or “buy-out”) basis by 31 December 2028 was agreed with the Scheme’s Trustee. Under the funding plan for TIGPS agreed in June 2018, Smiths will pay cash contributions of £1m a month until the long-term funding objective is achieved.
Work on the valuation of the scheme as at 5 April 2020 has commenced and experience gains and losses identified during the work on the 2020 valuation have been incorporated into the IAS 19 valuation. Any changes to the funding plan agreed after the 2020 valuation has been completed will be reported in next year’s annual report. Under the governing documentation of TIGPS, any future surplus would be returnable to Smiths Group plc by refund, assuming gradual settlement of the liabilities over the lifetime of the scheme.
The duration of the TIGPS liabilities is around 25 years (FY2019: 25 years) for active deferred members, 22 years (FY2019: 22 years) for deferred members and 11 years (FY2019: 11 years) for pensioners and dependants. After the financial year-end, in September 2020, the TIGPS Trustee secured a further bulk annuity policy which has insured the benefits of a further 1,200 pensioners. The premium paid was £142m.
US pension plans
The valuations of the principal US pension and post-retirement healthcare plans were performed using census data at 1 January 2018.
The pension plans were closed with effect from 30 April 2009 and benefits were calculated as at that date and are not revalued. Governance of the US pension plans is managed by a Settlor Committee appointed by Smiths Group Services Corp, a wholly-owned subsidiary.
The duration of the liabilities for the largest US plan is around 19 years (FY2019: 18 years) for active deferred members, 19 years (FY2019: 18 years) for deferred members and 12 years (FY2019: 11 years) for pensioners and dependants.
Risk management
The pensions schemes are exposed to risks that:
– investment returns are below expectations, leaving the scheme with insufficient assets in future to pay all their pension obligations;
– members and dependants live longer than expected, increasing the value of the pensions the schemes have to pay;
– inflation rates are higher than expected, causing amounts payable under index-linked pensions to be higher than expected; and
– increased contributions are required to meet funding targets if lower interest rates increase the current value of liabilities.
These risks are managed separately for each pension scheme. However the Group has adopted a common approach of closing defined benefit schemes to cap members’ entitlements and supporting trustees in adopting investment strategies which aim to hedge the value of assets against changes in the value of liabilities caused by changes in interest and inflation rates.
TIGPSTIGPS has covered roughly 50% of liabilities with matching annuities, eliminating investment return, longevity, inflation and funding risks in respect of those liabilities. It has also adopted a Liability Driven Investment strategy to hedge interest and inflation risks of the scheme’s uninsured liabilities by investment in gilts together with the use of gilt repurchase arrangements. The strategy also takes into account the scheme’s corporate bond investments.
SIPSSIPS has covered roughly 30% of liabilities with matching annuities, eliminating investment return, longevity, inflation and funding risks in respect of those liabilities. It has also adopted a Liability Driven Investment strategy to hedge interest and inflation risks of the scheme’s uninsured liabilities by investment in gilts together with the use of gilt repurchase arrangements, total return swaps, inflation swaps and interest rate swaps. The strategy also takes into account the scheme’s corporate bond investments.
N O T E S T O T H E A C C O U N T SF I N A N C I A L S T A T E M E N T S
1 7 0 S M I T H S G R O U P P L C A N N U A L R E P O R T F Y 2 0 2 0

The principal assumptions used in updating the valuations are set out below:2020
UK2020
US2020
Other2019
UK2019
US2019
Other
Rate of increase in salaries n/a n/a 3.7% n/a n/a 3.3%Rate of increase for active deferred members 3.8% n/a n/a 4.2% n/a n/aRate of increase in pensions in payment 2.9% n/a 3.2% 3.3% n/a 3.1%Rate of increase in deferred pensions 2.9% n/a n/a 3.3% n/a n/aDiscount rate 1.4% 2.4% 3.0% 2.1% 3.5% 2.8%Inflation rate 2.9% n/a 2.9% 3.3% n/a 2.6%Healthcare cost increases 4.4% n/a n/a 4.7% n/a n/a
The assumptions used in calculating the costs and obligations of the Group’s defined benefit pension plans are set by the Group after consultation with independent professionally qualified actuaries. The assumptions used are estimates chosen from a range of possible actuarial assumptions which, due to the timescale covered, may not necessarily occur in practice. For countries outside the UK and USA, assumptions are disclosed as a weighted average.
Inflation rate assumptionsThe UK PRI assumption is based on an underlying 'break even' RPI assumption of 3.1% pa, derived consistently with the discount rate using the Aon UK Government RPI Curve with an Inflation Risk Premium of 0.2% pa. In September 2019, the UK Chancellor set out proposals to replace RPI with CPIH (Consumer Pricing Index, including housing costs), at some time from 2025-2030, and a consultation process was run until 21 August 2020. The Government and UKSA are expected to respond to the consultation during the Autumn. No specific allowance (beyond anything already priced into markets) has been factored into the RPI assumptions for potential changes. This approach will be kept under review, taking into account future market developments and further announcements from the Government and UKSA. The assumption for the long term gap between RPI and CPI has been reduced by 0.3% p.a. (from 1.0% p.a. last year to 0.7% p.a.) to reflect the Group’s view on the market pricing of this gap over the lifetime of the UK schemes’ liabilities. This has increased SIPS liabilities by £10m and TIGPS liabilities by £8m at the balance sheet date.
Discount rate assumptionsThe UK schemes use a discount rate based on the annualised yield on the Aon GBP Select AA Curve, using the expected cash-flows from a notional scheme with obligations of the same duration as that of the UK schemes.
Mortality assumptionsThe mortality assumptions used in the principal UK schemes are based on the “SAPS S3” birth year tables with relevant scaling factors based on the recent experience of the schemes. The assumption allows for future improvements in life expectancy in line with the 2019 CMI projections, with a smoothing factor of 7.0 and 'A' parameter of 0.5%/0.25% (SIPS/TIGPS) and blended to a long-term rate of 1.25%. The mortality assumptions used in the principal US schemes are based on the RP-2014 table for healthy employees and healthy annuitants, removing MP-2014 improvement projections from 2006-2014 and applying scale MP-2018 mortality improvements from 2006 on a generational basis.
Expected further years of life
UK schemes US schemes
Male 31 July 2020
Female 31 July 2020
Male 31 July 2019
Female 31 July 2019
Male 31 July 2020
Female 31 July 2020
Male 31 July 2019
Female 31 July 2019
Member who retires next year at age 65 22 23 22 24 21 22 21 23Member, currently 45, when they retire in 20 years’ time 23 24 23 25 22 24 22 24
Sensitivity Sensitivities in respect of the key assumptions used to measure the principal pension schemes as at 31 July 2020 are set out below. These sensitivities show the hypothetical impact of a change in each of the listed assumptions in isolation, with the exception of the sensitivity to inflation which incorporates the impact of certain correlating assumptions. In practice, such assumptions rarely change in isolation.
Profit before tax
for year ended
31 July 2020 £m
Increase/ (decrease) in
scheme assets
31 July 2020 £m
(Increase)/ decrease in
scheme liabilities
31 July 2020 £m
Profit before tax
for year ended
31 July 2019 £m
Increase/ (decrease) in
scheme assets
31 July 2019 £m
(Increase)/ decrease in
scheme liabilities
31 July 2019 £m
Rate of mortality – 1 year increase in life expectancy (2) 85 (216) (2) 86 (195)Rate of mortality – 1 year decrease in life expectancy 2 (84) 212 2 (85) 193Rate of inflation – 0.25% increase (1) 26 (107) (2) 26 (109)Discount rate – 0.25% increase 4 (33) 156 4 (33) 152Market value of scheme assets – 2.5% increase 1 81 – 2 76 –
The effect on profit before tax reflects the impact of current service cost and net interest cost. The value of the scheme assets is affected by changes in mortality rates, inflation and discounting because they affect the carrying value of the insurance assets.
Asset valuation The pension schemes hold assets in a variety of pooled funds, in which the underlying assets are invested in equities, diversified growth, credit and cash assets. These funds are valued. The price of the funds is set by administrators/custodians employed by the investment managers and based on the value of the underlying assets held in the funds. Details of pricing methodology is set out within internal control reports provided for each fund. Prices are updated daily, weekly or monthly depending upon the frequency of the fund’s dealing.
Bonds are valued using observable broker quotes. Gilt repurchase obligations are valued by the relevant manager, which derives the value using an industry recognised model with observable inputs.
4
1 7 1S M I T H S G R O U P P L C A N N U A L R E P O R T F Y 2 0 2 0

8 Post-retirement benefits continuedProperty is valued by specialists applying recognised property valuation methods incorporating current market data on rental yields and transaction prices. In light of the negative impact of the COVID-19 pandemic on financial markets, the valuer included material uncertainty clauses in respect of the UK property asset valuations. These valuations are still considered to be the best estimate of the valuation of the Property investments, but there is a higher degree of uncertainty compared to previous years.
Total return, interest and inflation swaps and forward FX contracts are bilateral agreements between counterparties and do not have observable market prices. These derivative contracts are valued using observable inputs.
Insured liabilities comprise annuity policies broadly matching the scheme obligation to identified groups of pensioners. These assets are valued by an external qualified actuary at the actuarial valuation of the corresponding liability, reflecting this matching relationship. The insurance policies are treated as qualifying insurance policies as none of the insurers are related parties of Smiths Group, and the proceeds of the policies can only be used to pay or fund employee benefits for the respective schemes, are not available to Smiths Group’s creditors and cannot be paid to Smiths Group.
Retirement benefit plan assets31 July 2020 – £m 31 July 2019 – £m
UK schemes
US schemes
Other countries Total
UK schemes
US schemes
Other countries Total
Cash and cash equivalents 106 1 1 108 45 1 1 47Pooled funds:– Pooled equity 38 – 2 40 60 – 1 61– Pooled Diversified Growth 48 – – 48 91 – – 91– Pooled credit 607 – – 607 668 – – 668Corporate bonds 797 212 – 1,009 704 196 3 903Government bonds/LDI 1,257 98 3 1,358 1,074 85 3 1,162Insured liabilities 1,300 – 1 1,301 1,343 – 1 1,344Property 78 – – 78 103 – 1 104Other 9 – 24 33 18 – 26 44
Total market value 4,240 311 31 4,582 4,106 282 36 4,424
The assets are unquoted. Government bonds/LDI portfolios contain £2,343m (FY2019:£2,229m) of UK Government bonds (Gilts), £1,063m (FY2019:£1,159m) of Gilt Repurchase obligations and £23m (FY2019:£4m) of interest and inflation swaps held by SIPS.
The UK bond portfolios include forward FX contracts with a net value of £11m (FY2019: £9m). These are held to hedge against foreign currency risk in respect of overseas bonds.
The scheme assets do not include any property occupied by, or other assets used by, the Group. Pooled equity funds include investments in broad-based equity indices, some of which may hold ordinary equity shares in Smiths Group plc as part of the underlying assets.
Present value of funded scheme liabilities and assets for the main UK and US schemes31 July 2020 – £m 31 July 2019 – £m
SIPS TIGPSUS
schemes SIPS TIGPSUS
schemes
Present value of funded scheme liabilities:– Active deferred members (44) (61) (95) (42) (60) (95)– Deferred members (961) (593) (138) (930) (587) (123)– Pensioners (1,178) (866) (81) (1,142) (857) (72)
Present value of funded scheme liabilities (2,183) (1,520) (314) (2,114) (1,504) (290)Market value of scheme assets 2,466 1,754 311 2,377 1,710 282
Surplus/(deficit) 283 234 (3) 263 206 (8)
Net retirement benefit obligations31 July 2020 – £m 31 July 2019 – £m
UK schemes
US schemes
Other countries Total
UK schemes
US schemes
Other countries Total
Market value of scheme assets 4,240 311 31 4,582 4,106 282 36 4,424 Present value of funded scheme liabilities (3,724) (314) (40) (4,078) (3,637) (291) (45) (3,973)
Surplus/(deficit) 516 (3) (9) 504 469 (9) (9) 451
Unfunded pension plans (55) (8) (60) (123) (56) (8) (59) (123)Post-retirement healthcare (5) (1) (3) (9) (5) (10) (2) (17)
Present value of unfunded obligations (60) (9) (63) (132) (61) (18) (61) (140)
Net pension asset/(liability) 456 (12) (72) 372 408 (27) (70) 311
Post-retirement assets 516 – – 516 469 – – 469 Post-retirement liabilities (60) (12) (67) (139) (61) (27) (64) (152)
Liabilities held for distribution to owners – – (5) (5) – – (6) (6)
Net pension asset/(liability) 456 (12) (72) 372 408 (27) (70) 311
N O T E S T O T H E A C C O U N T SF I N A N C I A L S T A T E M E N T S
1 7 2 S M I T H S G R O U P P L C A N N U A L R E P O R T F Y 2 0 2 0

Liabilities held for distribution to owners comprises £4m of unfunded pension plans and £1m deficit on defined benefit schemes within the Smiths Medical division.
Where any individual scheme shows a recoverable surplus under IAS 19, this is disclosed on the balance sheet as a retirement benefit asset. The IAS 19 surplus of any one scheme is not available to fund the IAS 19 deficit of another scheme. The retirement benefit asset disclosed arises from the rights of the employers to recover the surplus at the end of the life of the scheme.
Amounts recognised in the consolidated income statement Year ended
31 July 2020 £m
Year ended 31 July 2019
£m
Amounts charged to operating profitCurrent service cost 3 3Past service costs – Guaranteed Minimum Pension (GMP) equalisation – 29Settlement (gain)/loss (8) 1Scheme administration costs 5 4
– 37
The operating cost is charged as follows:Cost of sales 1 1Sales and distribution costs – 1Headline administrative expenses 6 5Non-headline settlement (gain)/loss (7) 1
Non-headline administrative expenses – 29
– 37
Amounts credited to finance costsNon-headline other finance income – retirement benefits (7) (11)
Amounts recognised directly in the consolidated statement of comprehensive income Year ended
31 July 2020 £m
Year ended 31 July 2019
£m
Re-measurements of the net defined benefit liabilityDifference between interest credit and return on assets 274 355Experience gains/(losses) on scheme liabilities 28 (4)Actuarial gains arising from changes in demographic assumptions 22 25Actuarial losses arising from changes in financial assumptions (305) (452)
19 (76)
Changes in present value of funded scheme assets 31 July 2020 – £m 31 July 2019 – £m
UK schemes
US schemes
Other countries Total
UK schemes
US schemes
Other countries Total
At beginning of period 4,106 282 36 4,424 3,867 239 33 4,139 Interest on assets 86 9 1 96 105 10 1 116 Actuarial movement on scheme assets 222 54 (2) 274 332 24 (1) 355 Employer contributions 24 – 2 26 24 5 1 30 Scheme administration costs (4) (1) – (5) (3) (1) – (4)Foreign exchange rate movements – (21) (3) (24) – 18 3 21 Benefits paid (194) (12) (3) (209) (219) (13) (1) (233)
At end of period 4,240 311 31 4,582 4,106 282 36 4,424
Changes in present value of funded defined benefit obligations31 July 2020 – £m 31 July 2019 – £m
UK schemes
US schemes
Other countries Total
UK schemes
US schemes
Other countries Total
At beginning of period (3,637) (291) (45) (3,973) (3,342) (250) (41) (3,633)Current service cost – – (1) (1) – – (1) (1)Past service costs – – – – (29) – – (29)Interest on obligations (75) (10) (1) (86) (91) (9) (2) (102)Actuarial movement on liabilities (206) (47) 2 (251) (394) (24) – (418)Foreign exchange rate movements – 22 2 24 – (21) (2) (23)Benefits paid 194 12 3 209 219 13 1 233
At end of period (3,724) (314) (40) (4,078) (3,637) (291) (45) (3,973)
4
1 7 3S M I T H S G R O U P P L C A N N U A L R E P O R T F Y 2 0 2 0

8 Post-retirement benefits continuedChanges in present value of unfunded defined benefit pensions and post-retirement healthcare plans
Assets Obligations
Year ended 31 July 2020
£m
Year ended 31 July 2019
£m
Year ended 31 July 2020
£m
Year ended 31 July 2019
£m
At beginning of period – – (140) (125)Current service cost – – (2) (2)Interest on obligations – – (3) (3)Actuarial movement – – (4) (13)Employer contributions 7 6 – –Foreign exchange rate movements – – 2 (3)Liabilities extinguished on settlements – – 8 –Benefits paid (7) (6) 7 6
At end of period – – (132) (140)
Cash contributions
Company contributions to the defined benefit pension plans and post-retirement healthcare plans totalled £33m (FY2019: £36m). This comprised regular contributions to funded schemes of £12m (FY2019: £12m) to SIPS, £12m (FY2019: £12m) to TIGPS, no contributions (FY2019: £5m) to funded US schemes and contributions to other schemes of £2m (FY2019: £1m). In addition, £7m (FY2019: £6m) was spent on providing benefits under unfunded defined benefit pension and post-retirement healthcare plans.
In 2021, the cash contributions to the Group’s schemes are expected to total about £38m, including £12m to SIPS and £12m to TIGPS, with the balance relating to the US scheme, unfunded schemes and post-retirement healthcare.
9 Employee share schemesThe Group operates share schemes and plans for the benefit of employees. The nature of the principal schemes and plans, including general conditions, is set out below:
Long-Term Incentive Plan (LTIP)The LTIP is a share plan under which an award over a capped number of shares will vest after the end of a three-year performance period if performance conditions are met. LTIP awards are made to selected senior executives, including the Executive Directors.
LTIP performance conditions
Each performance condition has a threshold below which no shares vest and a maximum performance target at or above which the award vests in full. For performance between ‘threshold’ and ‘maximum’, awards vest on a straight-line sliding scale. The performance conditions are assessed separately; so performance on one condition does not affect the vesting of the other elements of the award. To the extent that the performance targets are not met over the three-year performance period, awards lapse. There is no re-testing of the performance conditions.
LTIP awards have performance conditions relating to underlying revenue growth, growth in headline EPS, ROCE and cash conversion.
Smiths Share Matching Plan (SMP)Under the scheme, participants were required to invest between 25% and 50% of their post-tax bonus to purchase the Company’s shares at the prevailing market price. Matching shares granted in October 2015 vested during the year at a rate correlating to the performance of the Group LTIP issued for the same performance period. There were no SMP awards outstanding at 31 July 2020 or 31 July 2019 and no future awards will be made under the SMP.
Smiths Excellence Plan (SEP)In September 2016, the Smiths Excellence plan (SEP) was introduced. The SEP is designed to reinforce value creation over the medium term by focusing on specific objectives in key areas of operational performance. Awards vest after two years, depending on performance on the operational objectives during the first year and continued employment with the Group. There is no re-testing of performance. However, the Remuneration Committee has discretion to adjust vesting rates if material misstatements in reported performance are subsequently identified and awards are subject to clawback provisions in the event of misconduct.
Directors are not eligible to participate in the SEP.
Restricted stock Restricted stock is used by the Remuneration Committee, as a part of the recruitment strategy, to make awards in recognition of incentive arrangements forfeited on leaving a previous employer. If an award is considered appropriate, the award will take account of relevant factors including the fair value of awards forfeited, any performance conditions attached, the likelihood of those conditions being met and the proportion of the vesting period remaining.
Save as you earn (SAYE)The SAYE scheme is an HM Revenue & Customs approved all employee savings related share option scheme which is open to all UK employees. Participants enter into a contract to save a fixed amount per month of up to £500 in aggregate for three or five years and are granted an option over shares at a fixed option price, set at a discount to market price at the date of invitation to participate. The number of shares is determined by the monthly amount saved and the bonus paid on maturity of the savings contract. Options granted under the SAYE scheme are not subject to any performance conditions.
N O T E S T O T H E A C C O U N T SF I N A N C I A L S T A T E M E N T S
1 7 4 S M I T H S G R O U P P L C A N N U A L R E P O R T F Y 2 0 2 0

Long-term incentive
plans SMP SEPRestricted
stock
Save as you earn
scheme Total
Weighted average exercise
price £
Ordinary shares under option/award (’000)31 July 2018 3,911 413 1,359 304 962 6,949 £1.46Granted 1,602 – 928 24 315 2,869 £1.30Exercised (406) (331) (379) (79) (193) (1,388) £1.27Lapsed (1,215) (82) (621) (57) (72) (2,047) £0.41
31 July 2019 3,892 – 1,287 192 1,012 6,383 £1.77
Granted 1,379 – 924 48 695 3,046 £2.08Exercised (785) – (406) (95) (254) (1,540) £1.48Lapsed (549) – (510) (14) (246) (1,319) £2.22
31 July 2020 3,937 – 1,295 131 1,207 6,570 £1.89
Options and awards were exercised on an irregular basis during the period. The average closing share price over the financial year was 1,490.92p (FY2019: 1,479.21p). There has been no change to the effective option price of any of the outstanding options during the period.
Range of exercise prices
Total shares under options/awards
at 31 July 2020 (’000)
Weighted average remaining contractual
life at 31 July 2020 (months)
Total shares under options/awards
at 31 July 2019 (’000)
Weighted average remaining contractual
life at 31 July 2019 (months)
£0.00 – £2.00 5,363 14 5,370 15£6.01 – £10.00 744 40 312 10£10.01 – £12.00 463 22 700 36
For the purposes of valuing options to arrive at the share-based payment charge, the Black-Scholes option-pricing model has been used. The key assumptions used in the models for 2020 and 2019 are volatility of 25% to 20% (FY2019: 25% to 20%) and dividend yield of 2.8% (FY2019: 3.0%), based on historical data, for the period corresponding with the vesting period of the option. These generated a weighted average fair value for SEP of £14.39 (FY2019: £14.48), LTIP of £14.60 (FY2019: £14.52), and restricted stock of £14.04 (FY2019: £13.43). Staff costs include £11m (FY2019: £15m) for share-based payments, of which £10m (FY2019: £14m) relates to equity-settled share-based payment.
10 Intangible assets
Goodwill £m
Development costs
£m
Acquired intangibles
(see table below)
£m
Software, patents and intellectual
property £m
Total £m
CostAt 31 July 2018 1,704 360 582 207 2,853Foreign exchange rate movements 110 24 47 9 190Business combinations 127 – 148 – 275Additions – 30 – 12 42Disposals – – – (7) (7)Business disposals (7) – – – (7)Reclassified to assets held for distribution to owners (note 28) (622) (270) (212) (50) (1,154)
At 31 July 2019 1,312 144 565 171 2,192
Foreign exchange rate movements (69) (5) (34) (6) (114)Business combinations (note 27) 11 – 15 – 26Additions – 16 – 10 26Disposals – – – (1) (1)At 31 July 2020 1,254 155 546 174 2,129
Amortisation and impairmentsAt 31 July 2018 88 205 331 168 792Foreign exchange rate movements 5 14 24 6 49Charge for the year – 23 45 13 81Disposals – – – (6) (6)Reclassified to assets held for distribution to owners (note 28) (27) (143) (195) (43) (408)
At 31 July 2019 66 99 205 138 508
Foreign exchange rate movements (4) (5) (13) (2) (24)Amortisation charge for the year – 6 57 7 70Impairment charge for the year – 12 – – 12Disposals – – – (1) (1)At 31 July 2020 62 112 249 142 565
Net book value at 31 July 2020 1,192 43 297 32 1,564Net book value at 31 July 2019 1,246 45 360 33 1,684Net book value at 31 July 2018 1,616 155 251 39 2,061
4
1 7 5S M I T H S G R O U P P L C A N N U A L R E P O R T F Y 2 0 2 0

10 Intangible assets continuedIn addition to goodwill, the acquired intangible assets comprise:
Patents, licences
and trademarks
£mTechnology
£m
Customer relationships
£m
Total acquired
intangibles £m
CostAt 31 July 2018 57 214 311 582Foreign exchange rate movements 4 16 27 47Business combinations 13 – 135 148Reclassified to assets held for distribution to owners (note 28) (59) (90) (63) (212)
At 31 July 2019 15 140 410 565Foreign exchange rate movements (1) (9) (24) (34)Business combinations (note 27) 1 8 6 15At 31 July 2020 15 139 392 546
Amortisation
At 31 July 2018 39 121 171 331
Foreign exchange rate movements 3 10 11 24Charge for the year 3 12 30 45Reclassified to assets held for distribution to owners (note 28) (42) (90) (63) (195)
At 31 July 2019 3 53 149 205
Foreign exchange rate movements – (4) (9) (13)Charge for the year 1 11 45 57At 31 July 2020 4 60 185 249
Net book value at 31 July 2020 11 79 207 297Net book value at 31 July 2019 12 87 261 360Net book value at 31 July 2018 18 93 140 251
Individually material intangible assets comprise £131m of customer related intangibles attributable to United Flexible (remaining amortisation period: 6 years) and £105m of customer relationship intangibles attributable to Morpho Detection (remaining amortisation period: 12 years).
11 Impairment testingGoodwillGoodwill is tested for impairment at least annually or whenever there is an indication that the carrying value may not be recoverable.
Further details of the impairment review process and judgements are included in the “Significant judgements made in applying accounting policies” section of the “Basis of preparation” for the consolidated financial statements.
For the purpose of impairment testing, assets are grouped at the lowest levels for which there are separately identifiable cash flows, known as cash-generating units (CGUs), taking into consideration the commonality of reporting, policies, leadership and intra-divisional trading relationships. Goodwill acquired through business combinations is allocated to groups of CGUs at a divisional (or operating segment) level, being the lowest level at which management monitors performance separately.
The carrying value of goodwill at 31 July is allocated by division as follows:
2020 £m
2020 Number of
CGUs2019
£m
2019 Number of
CGUs
John Crane 136 1 140 1Smiths Detection 642 1 673 1Flex-Tek 161 1 171 1Smiths Interconnect 253 1 261 1Smiths Medical – classified as an asset held for distribution in 2020 and 2019 – 1 – 1
1,192 5 1,245 5
Smiths Interconnect acquired Reflex Photonics in October 2019 and a single management team has been established covering the Smiths Interconnect and Reflex Photonics businesses. The integration of the businesses since acquisition has progressed well and is such that they are considered to be a single CGU for impairment testing.
Key assumptions used in impairment testingThe recoverable amount for impairment testing is determined from the higher of fair value less costs of disposal and value in use of the CGU. In assessing value in use, the estimated future cash flows are discounted to their present value using a post-tax discount rate that reflects current market assessments of the time value of money, from which pre-tax discount rates are determined.
Fair value less costs of disposal is calculated using available information on past and expected future profitability, valuation multiples for comparable quoted companies and similar transactions (adjusted as required for significant differences) and information on costs of similar transactions. Fair value less costs to sell models are used when trading projections in the strategic plan cannot be adjusted to eliminate the impact of a major restructuring.
N O T E S T O T H E A C C O U N T SF I N A N C I A L S T A T E M E N T S
1 7 6 S M I T H S G R O U P P L C A N N U A L R E P O R T F Y 2 0 2 0

The value in use of CGUs is calculated as the net present value of the projected risk-adjusted cash-flows of each CGU. These cash-flow forecasts are based on the 2020-21 business plan (as approved by the Board) and the five year detailed divisional strategic projections which have been prepared by divisional management and approved by the Chief Financial Officer.
The key assumptions used in determining the value in use are:
– Sales: Projected sales are built up with reference to markets and product categories. They incorporate past performance, historical growth rates and projections of developments in key markets;
– Margins: Projected margins reflect historical performance and the impact of all completed projects to improve operational efficiency and leverage scale. The projections do not include the impact of future restructuring projects to which the Group is not yet committed;
– Projected capital expenditure: The cash-flow forecasts for capital expenditure are based on past experience and include committed ongoing capital expenditure consistent with the FY21 budget and the divisional strategic projections. The forecast does not include any future capital expenditure that improves/enhances the operation/asset in excess of its current standard of performance;
– Discount rate: The discount rates have been calculated based on the Group’s weighted average cost of capital and risks specific to the CGU being tested. In determining the risk adjusted discount rate, management has considered the systematic risk to each of the Group’s CGUs determined using an average of discount rates used by other companies for the industries that Smiths divisions operate. Pre-tax rates of 9.4% to 12.3% (FY2019: 9.9% to 13.9%) have been used for the impairment testing;
– Long-term growth rates: For the purposes of the Group’s value in use calculations, a long-term growth rate into perpetuity is applied immediately at the end of the five year forecast period. Growth rates for the period after the detailed forecasts are based on the long-term GDP projections of the primary market for each CGU. The average growth rate used in the testing was 1.9% (FY2019: 2.0%). These rates do not reflect the long-term assumptions used by the Group for investment planning; and
– COVID-19: The COVID-19 pandemic developed rapidly during 2020, with many countries requiring businesses to limit or suspend operations whilst implementing travel restrictions and quarantine measures. These virus containment measures have had a significant adverse impact on global economic activity. It remains extremely challenging to predict the full extent and duration of its impact on the Smiths businesses and the countries where Smiths operates. Based on information available as at 31 July 2020, management has made adjustments to the five year forecasts used in the Group’s impairment testing in order to reflect the estimated impact.
The assumptions used in the impairment testing of CGUs with significant goodwill balances are as follows: Year ended 31 July 2020
John CraneSmiths
Detection Flex-TekSmiths
InterconnectSmiths
Medical
Net book value of goodwill (£m) 136 642 161 253 563
Basis of valuation Value in use Value in use Value in use Value in use Value in use
Discount rate - pre-tax 12.3% 10.8% 11.3% 10.7% 9.4%- post-tax 9.3% 8.0% 8.7% 8.5% 7.5%
Period covered by management projections 5 years 5 years 5 years 5 years 5 yearsRevenue – average annual growth rate over projection period 4.3% 2.1% 3.2% 4.2% 2.0%Average earnings before interest and tax margin 24.1% 13.5% 17.5% 17.0% 18.1%Long-term growth rates 2.0% 1.7% 1.8% 2.1% 2.0%
Year ended 31 July 2019
John CraneSmiths
Detection Flex-TekSmiths
InterconnectSmiths
Medical
Net book value of goodwill (£m) 140 673 171 261 595
Basis of valuation Value in use Value in use Value in use Value in use Value in use
Discount rate - pre-tax 13.9% 11.2% 11.3% 12.6% 9.9%- post-tax 10.4% 8.2% 9.0% 9.9% 7.8%
Period covered by management projections 5 years 5 years 5 years 5 years 5 yearsLong-term growth rates 2.1% 2.1% 1.8% 1.8% 1.8%
Sensitivity analysisWith the exception of the Smiths Detection and Smiths Interconnect CGUs, the recoverable amount of all CGUs exceeded their carrying value, on the basis of the assumptions set out in the table above and any reasonably possible changes thereof.
The estimated recoverable amount of the Smiths Detection CGU exceeded the carrying value by £183m and the estimated recoverable amount the Smiths Interconnect CGU exceeded the carrying value by £285m. Any decline in estimated value-in-use in excess of those amounts would result in the recognition of impairment charges. If the assumptions used in the impairment reviews were changed to a greater extent than as presented in the following table, the changes would, in isolation, lead to impairment losses being recognised for the year ended 31 July 2020:
Change required for carrying value to equal recoverable amount Smiths Detection Smiths Interconnect
Forecast earnings before interest and tax –1,500 bps decrease –3,800 bps decreasePost-tax discount rate +110 bps increase +400 bps increaseLong-term growth rate –180 bps decrease –740 bps decrease
4
1 7 7S M I T H S G R O U P P L C A N N U A L R E P O R T F Y 2 0 2 0

11 Impairment testing continuedSensitivity analysis continuedForecast earnings before interest and tax have been projected using:
– expected future sales based on the strategic plan, which was constructed at a market level with input from key account managers, product line managers, business development and sales teams. An assessment of the market and existing contracts/programmes was made to produce the sales forecast; and
– current cost structure and production capacity. The projections do not include the impact of future restructuring projects to which the Group is not yet committed.
Property, plant and equipment, right of use assets and finite-life intangible assetsAt each reporting period date, the Group reviews the carrying amounts of its property, plant, equipment, right of use assets and finite-life intangible assets to determine whether there is any indication that those assets have suffered an impairment loss.
The Group has no indefinite life intangible assets other than goodwill. During the year, impairment tests were carried out for capitalised development costs that have not yet started to be amortised and acquired intangibles where there were indications of impairment. Value in use calculations were used to determine the recoverable values of these assets. In FY2020 Smiths Medical conducted a detailed impairment assessment on the Intellifuse programme, a summary of the basis for and conclusion of this assessment is included in note 28 'Discontinued operations and businesses held for distribution to owners'.
£12m of impairment charges have been incurred against capitalised development costs in Smiths Detection (FY2019: £nil), see note 2 for further details.
12 Property, plant and equipment
Land and buildings
£m
Plant and machinery
£m
Fixtures, fittings,
tools and equipment
£mTotal
£m
Cost or valuationAt 31 July 2018 207 637 194 1,038Foreign exchange rate movements 14 41 4 59Business combinations 3 8 – 11Additions 7 57 15 79Disposals (2) (38) (17) (57)Reclassified to assets held for distribution to owners (note 28) (43) (309) (58) (410)
At 31 July 2019 186 396 138 720
Foreign exchange rate movements (10) (25) (5) (40)Business combinations (note 27) – 2 – 2Additions 5 27 8 40Disposals (6) (17) (8) (31)
At 31 July 2020 175 383 133 691
DepreciationAt 31 July 2018 107 459 152 718Foreign exchange rate movements 6 31 2 39Charge for the year 10 33 13 56Disposals – (36) (14) (50)Reclassified to assets held for distribution to owners (note 28) (19) (216) (40) (275)
At 31 July 2019 104 271 113 488
Foreign exchange rate movements (6) (17) (4) (27)Charge for the year 10 23 8 41Disposals (6) (16) (7) (29)
At 31 July 2020 102 261 110 473
Net book value at 31 July 2020 73 122 23 218Net book value at 31 July 2019 82 125 25 232Net book value at 31 July 2018 100 178 42 320
N O T E S T O T H E A C C O U N T SF I N A N C I A L S T A T E M E N T S
1 7 8 S M I T H S G R O U P P L C A N N U A L R E P O R T F Y 2 0 2 0

13 Right of use assetsProperties
£mVehicles
£mEquipment
£mTotal
£m
Cost or valuationRight of use assets on transition 95 10 1 106
Foreign exchange rate movements (6) (1) – (7)Business combinations (note 27) 1 – – 1Recognition of right of use asset 21 5 – 26Derecognition of right of use asset (1) – – (1)At 31 July 2020 110 14 1 125
DepreciationForeign exchange rate movements (2) – – (2)Charge for the year 28 5 – 33At 31 July 2020 26 5 – 31
Net book value at 31 July 2020 84 9 1 94
14 Inventories31 July 2020
£m31 July 2019
£m
Inventories compriseRaw materials and consumables 122 146Work in progress 119 111Finished goods 205 160
446 417
In FY2020 continuing operations consumed £1,244m (FY2019: £1,174m) of inventory, £20m (FY2019: £16m) was charged for the write-down of inventory and £9m (FY2019: £7m) was released from provisions no longer required.
Discontinued operations consumed £299m (FY2019: £266m) of inventory, £4m (FY2019: £5m) was charged for the write-down of inventory and £nil (FY2019: £1m) was released from provisions no longer required. Further details of discontinued operations are disclosed in note 28.
Inventory provisioning31 July 2020
£m31 July 2019
£m
Gross inventory carried at full value 368 357Gross value of inventory partly or fully provided for 132 111
500 468Inventory provision (54) (51)
Inventory after provisions 446 417
15 Trade and other receivables31 July 2020
£m31 July 2019
£m
Non-currentTrade receivables – 1Contract assets 46 45Other receivables 6 6
52 52
CurrentTrade receivables 448 574Prepayments 23 25Contract assets 123 125Other receivables 33 40
627 764
Trade receivables do not carry interest. Management considers that the carrying value of trade and other receivables approximates to the fair value. Trade and other receivables, including prepayments, accrued income and other receivables qualifying as financial instruments are accounted for at amortised cost. The maximum credit exposure arising from these financial assets is £580m (FY2019: £713m).
Contract assets comprise unbilled balances not yet due on contracts, where revenue recognition does not align with the agreed payment schedule. The main movements in the year arise from increases in contract asset balances of £6m (FY2019: £14m) principally within Smiths Interconnect, offset by £7m of foreign currency translation losses (FY2019: £8m gain).
A number of Flex-Tek’s customers provide supplier finance schemes which allow their suppliers to sell trade receivables, without recourse, to banks. This is commonly known as invoice discounting or factoring. During FY2020 Flex-Tek collected £68m of receivables through these schemes (FY2019: £8m), the cash received via these schemes is classified as an operating cash inflow as it has arisen from operating activities.
4
1 7 9S M I T H S G R O U P P L C A N N U A L R E P O R T F Y 2 0 2 0

15 Trade and other receivables continuedTrade receivables are disclosed net of provisions for expected credit loss, with historical write-offs used as a basis and a default risk multiplier applied to reflect country risk premium. Credit risk is managed separately for each customer and, where appropriate, a credit limit is set for the customer based on previous experience of the customer and third party credit ratings. The Group has no significant concentration of credit risk, with exposure spread over a large number of customers. The largest single customer is the US Federal Government, representing 7% (FY2019: 6%) of Group revenue.
Ageing of trade receivables31 July 2020
£m31 July 2019
£m
Trade receivables which are not yet due 342 432Trade receivables which are between 1-30 days overdue 51 69Trade receivables which are between 31-60 days overdue 18 18Trade receivables which are between 61-90 days overdue 9 12Trade receivables which are between 91-120 days overdue 12 9Trade receivables which are more than 120 days overdue 51 58
483 598Expected credit loss allowance provision (35) (24)
Trade receivables 448 574
Movement in expected credit loss allowance31 July 2020
£m31 July 2019
£m
Brought forward loss allowance at the start of the period 24 24Exchange adjustments (2) 1Increase in allowance recognised in the income statement 18 6Amounts written off or recovered during the year (5) (7)
Carried forward loss allowance at the end of the year 35 24
16 Trade and other payables31 July 2020
£m31 July 2019
£m
Non-currentOther payables 15 15
Contract liabilities 36 15
51 30CurrentTrade payables 178 221Other payables 12 12Other taxation and social security costs 25 19Accruals 194 201Contract liabilities 118 116
527 569
Trade and other payables, including accrued expenses and other payables qualifying as financial instruments, are accounted for at amortised cost and are categorised as Trade and other financial payables in note 21.
Contract liabilities comprise deferred income balances of £154m (FY2019: £131m) in respect of payments being made in advance of revenue recognition. The movement in the year arises primarily from the long term contracts of the Smiths Detection division where invoicing under milestones precedes the delivery of the program performance obligations. Revenue recognised in the year includes £126m (FY2019: £85m) that was included in the opening contract liabilities balance. This revenue primarily relates to the delivery of performance obligations in the Smiths Detection business.
17 Financial assetsAt 31 July 2020, £11m (FY2019: £13m) was held on deposit with banks as security for liabilities or letters of credit.
The remaining balance of financial assets relates to the Group's investments in early stage businesses that are developing or commercialising related technology.
N O T E S T O T H E A C C O U N T SF I N A N C I A L S T A T E M E N T S
1 8 0 S M I T H S G R O U P P L C A N N U A L R E P O R T F Y 2 0 2 0

18 Borrowings and net debtThis note sets out the calculation of net debt, an important measure in explaining our financing position. The net debt figure includes accrued interest and fair value adjustments relating to hedge accounting.
31 July 2020 £m
31 July 2019 represented*
£m
Cash and cash equivalentsNet cash and deposits 366 289
Short-term borrowingsLease liabilities (31) –Interest accrual (10) (9)
(41) (9)
Long-term borrowings$400m 3.625% US$ Guaranteed notes 2022 (308) (329)€600m 1.25% Eurobond 2023 (546) (564)€650m 2.00% Eurobond 2027 (601) (607)Lease liabilities (65) –
(1,520) (1,500)
Borrowings (1,561) (1,509)
Derivatives managing interest rate risk and currency profile of the debt 82 45
Net debt (excludes net debt of £28m in discontinued operations (FY2019: net cash of £23m) ) (1,113) (1,175)
* The FY2019 comparatives have been represented to include the fair value of derivatives used for the management of net debt interest rate and currency risks as part of the net debt balance.
Movements in assets/(liabilities) arising from financing activities
Changes in net debt
Changes in other
financing items: FX contracts
£m
Cash and cash
equivalents £m
Other short-term borrowings
£m
Long-term borrowings
£m
Interest rate & cross-currency
swaps £m
Net debt* £m
Total liabilities
from financing activities
£m
At 31 July 2018 717 (203) (1,407) 43 (850) 4 (846)
Foreign exchange gains/(losses) 10 (4) (47) – (41) 5,733 5,692Net cash (outflow) (218) – – (30) (248) (5,733) (5,981)Repayment of borrowings (194) 194 – – – – –Capitalisation, interest accruals and unwind of capitalised fees – 2 (1) 30 31 – 31Fair value movement from interest rate hedging – – (46) – (46) – (46)Revaluation of derivative contracts – – – 2 2 (1) 1Reclassified to asset/liability held for distribution to owners (note 28) (26) 2 1 – (23) (4) (27)
At 31 July 2019 289 (9) (1,500) 45 (1,175) (1) (1,176)
Adoption of IFRS 16 – (26) (79) – (105) – (105)Sub-total 289 (35) (1,579) 45 (1,280) (1) (1,281)Foreign exchange gains/(losses) (26) 1 40 – 15 (3,780) (3,765)Net cash inflow from continuing operations ** 103 – – – 103 3,780 3,883Lease liabilities acquired – – (1) – (1) – (1)Net movement from lease modifications – (6) (20) – (26) – (26)Fair value movement from interest rate hedging – – 10 – 10 – 10Revaluation of derivative contracts – – – 37 37 (1) 36Interest expense taken to income statement*** – (4) (30) (13) (47) – (47)Interest paid – – 29 13 42 – 42Payment of lease liabilities – 34 – – 34 – 34Reclassification to short-term – (31) 31 – – – –At 31 July 2020 366 (41) (1,520) 82 (1,113) (2) (1,115)
* The FY2019 comparatives have been represented to include the fair value of derivatives used for the management of net debt interest rate and currency risks as part of the net debt balance.
** The £103m of net cash inflow from continuing operations excludes £6m of net cash outflow from discontinued operations. Net cash inflow for the total Group including discontinued operations was £97m.
*** The Group has also incurred £8m of bank charges that are expensed when paid and are not included in net debt.
4
1 8 1S M I T H S G R O U P P L C A N N U A L R E P O R T F Y 2 0 2 0

18 Borrowings and net debt continued
Cash and cash equivalents31 July 2020
£m31 July 2019
£m
Cash at bank and in hand 173 153Short-term deposits 193 136
Cash and cash equivalents 366 289
Cash and cash equivalents include highly liquid investments with maturities of three months or less. Borrowings are accounted for at amortised cost and are categorised as other financial liabilities. See note 18 for a maturity analysis of borrowings. Interest of £31m (FY2019: £36m) was charged to the consolidated income statement in the period in respect of public bonds.
Cash poolingCash and overdraft balances in interest compensation cash pooling systems are reported gross on the balance sheet. The cash pooling agreements incorporate a legally enforceable right of net settlement. However, as there is no intention to settle the balances net, these arrangements do not qualify for net presentation. At 31 July 2020 the total value of overdrafts on accounts in interest compensation cash pooling systems was £nil (FY2019: £nil). The balances held in zero balancing cash pooling arrangements have daily settlement of balances. Therefore netting is not relevant.
Secured loansLoans amounting to £nil (FY2019: £nil) were secured on plant and equipment with a book value of £nil (FY2019: nil).
Change of controlThe Company has in place credit facility agreements under which a change in control would trigger prepayment clauses. The Company also has bonds in issue, the terms of which would allow bondholders to exercise put options and require the Company to buy back the bonds at their principal amount plus interest if a rating downgrade occurs at the same time as a change of control takes effect.
19 Financial risk managementThe Group’s international operations and debt financing expose it to financial risks which include the effects of changes in foreign exchange rates, debt market prices, interest rates, credit risks and liquidity risks. The management of operational credit risk is discussed in note 15.
Treasury Risk Management PolicyThe Board maintains a Treasury Risk Management Policy, which governs the treasury operations of the Group and its subsidiary companies and the consolidated financial risk profile to be maintained. A report on treasury activities, financial metrics and compliance with the Policy is prepared monthly. This is circulated to the Chief Financial Officer each month and key elements to the Audit and Risk Committee on a semi-annual basis.
The Policy maintains a treasury control framework within which counterparty risk, financing and debt strategy, cash and liquidity, interest rate risk and currency translation management are reserved for Group Treasury, while currency transaction management is devolved to operating divisions.
Centrally directed cash management systems exist globally to manage overall liquid resources efficiently across the divisions. The Group uses financial instruments to raise financing for its global operations, to manage related interest rate and currency financial risk, and to hedge transaction risk within subsidiary companies.
The Group does not speculate in financial instruments. All financial instruments hedge existing business exposures and all are recognised on the balance sheet.
The Policy defines four treasury risk components and for each component a set of financial metrics to be measured and reported monthly compared against pre-agreed objectives.
Credit quality
The Group’s strategy is to maintain a solid investment-grade rating to ensure access to the widest possible sources of financing at the right time and to minimise the resulting cost of debt capital. The credit ratings at the end of July 2020 were BBB+ / Baa2 (both stable) from Standard & Poor’s and Moody’s respectively. An essential element of an investment-grade rating is consistent and robust cash-flow metrics. The Group’s objective is to maintain a net debt/headline EBITDA ratio at two times or lower over the medium term. Capital management is discussed in more detail in note 26.
Debt and interest rate
The Group’s risk management objectives are to ensure that the majority of funding is drawn from the public debt markets, the average maturity profile of gross debt is at or greater than three years, and between 40-60% of gross debt is at fixed rates. At 31 July 2020 these measures were 100% (FY2019: 100%), 4.2 years (FY2019: 5.2 years) and 53% (FY2019: 48%).
The Group remains in full compliance with all covenants within its external debt agreements. Interest rate risk management is discussed in note 19(b).
Liquidity management
The Group’s objective is to ensure that at any time undrawn committed facilities, net of short-term overdraft financing, are at least £300m and that committed facilities have at least 12 months to run until maturity. At 31 July 2020, these measures were £611m (FY2019: £655m) and 51 months (FY2019: 51 months). At 31 July 2020, net cash resources were £366m (FY2019: £289m). Liquidity risk management is discussed in note 19(d).
N O T E S T O T H E A C C O U N T SF I N A N C I A L S T A T E M E N T S
1 8 2 S M I T H S G R O U P P L C A N N U A L R E P O R T F Y 2 0 2 0

Currency management
The Group is an international business with the majority of its net assets denominated in foreign currency. We protect our balance sheet and reserves from adverse foreign exchange movements by financing our foreign currency assets where appropriate in the same currency. The Group’s objective for managing transaction currency exposure is to reduce medium-term volatility to cash-flow, margins and earnings. Foreign exchange risk management is discussed in note 18(a) below.
(a) Foreign exchange risk
Transactional currency exposure
The Group is exposed to foreign currency risks arising from sales or purchases by businesses in currencies other than their functional currency. It is Group policy that, when the net foreign exchange exposure to known future sales and purchases is material, this exposure is hedged using forward foreign exchange contracts. The net exposure is calculated by adjusting the expected cash-flow for payments or receipts in the same currency linked to the sale or purchase. This policy minimises the risk that the profits generated from the transaction will be affected by foreign exchange movements which occur after the price has been determined. Hedge accounting documentation and effectiveness testing are only undertaken if it is cost effective.
The following table shows the currency of financial instruments. It excludes loans and derivatives designated as net investment hedges.At 31 July 2020
Sterling £m
US$ £m
Euro £m
Other £m
Total £m
Financial assets and liabilitiesFinancial instruments included in trade and other receivables 26 293 116 145 580Financial instruments included in trade and other payables (37) (176) (62) (65) (340)Cash and cash equivalents 50 194 38 84 366Borrowings not designated as net investment hedges (21) (41) (31) (14) (107)
18 270 61 150 499Exclude balances held in operations with the same functional currency (16) (84) (60) (146) (306)Exposure arising from intra-group loans – (87) 23 (100) (164)Future forward foreign exchange contract cash flows 32 (161) 26 103 –
34 (62) 50 7 29
At 31 July 2019
Sterling £m
US$ £m
Euro £m
Other £m
Total £m
Financial assets and liabilitiesFinancial instruments included in trade and other receivables 35 380 130 168 713Financial instruments included in trade and other payables (47) (204) (70) (73) (394)Cash and cash equivalents 27 150 23 89 289
15 326 83 184 608Exclude balances held in operations with the same functional currency (15) (155) (75) (177) (422)Exposure arising from intra-group loans – (11) 55 (41) 3Forward foreign exchange contracts (17) (149) (19) 185 –
(17) 11 44 151 189
Financial instruments included in trade and other receivables comprise trade receivables, accrued income and other receivables which qualify as financial instruments. Similarly, financial instruments included in trade and other payables comprise trade payables, accrued expenses and other payables that qualify as financial instruments.
Based on the assets and liabilities held at the year-end, if the specified currencies were to strengthen 10% while all other market rates remained constant, the change in the fair value of financial instruments not designated as net investment hedges would have the following effect:
Impact on profit
for the year 31 July 2020
£m
Gain/(loss) recognised in
reserves 31 July 2020
£m
Impact on profit
for the year 31 July 2019
£m
Gain/(loss) recognised in
reserves 31 July 2019
£m
US dollar (8) (2) (10) 3Euro (3) 2 (3) (1)Sterling 3 (2) 10 (2)
These sensitivities were calculated before adjusting for tax and exclude the effect of quasi-equity intra-group loans.
4
1 8 3S M I T H S G R O U P P L C A N N U A L R E P O R T F Y 2 0 2 0

19 Financial risk management continued(a) Foreign exchange risk continued
Cash-flow hedging
The Group uses forward foreign exchange contracts to hedge future foreign currency sales and purchases. At 31 July 2020, contracts with a nominal value of £110m (FY2019: £54m) were designated as hedging instruments. In addition, the Group had outstanding foreign currency contracts with a nominal value of £203m (FY2019: £431m) which were being used to manage transactional foreign exchange exposures, but were not accounted for as cash-flow hedges. The fair value of the contracts is disclosed in note 20.
The majority of hedged transactions will be recognised in the consolidated income statement in the same period that the cash-flows are expected to occur, with the only differences arising because of normal commercial credit terms on sales and purchases. It is the Group’s policy to hedge 80% of certain exposures for the next two years and 50% of highly probable exposures for the next 12 months
Hedge effectiveness is determined at the inception of the hedge relationship, and through periodic prospective effectiveness assessments to ensure that an economic relationship exists between the hedged item and hedging instrument. The foreign exchange forward contracts have similar critical terms to the hedged items, such as the notional amounts and maturities. Therefore, there is an economic relationship and the hedge ratio is established as 1:1.
The main sources of hedge ineffectiveness in these hedging relationships are the effect of the counterparty and the Group’s own credit risk on the fair value of the foreign exchange forward contracts, which is not reflected in the fair value of the hedged item attributable to changes in foreign exchange rates and the risk of over-hedging where the hedge relationship requires re-balancing. No other sources of ineffectiveness emerged from these hedging relationships. Any hedge ineffectiveness is recognised immediately in the income statement in the period that it occurs. Of the foreign exchange contracts designated as hedging instruments, 98% are for periods of 12 months or less (FY2019: 100%).
The following table presents a reconciliation by risk category of the cash-flow hedge reserve and analysis of other comprehensive income in relation to hedge accounting:
Year ended 31 July 2020
£m
Year ended 31 July 2019
£m
Brought forward cash-flow hedge reserve at start of year – 2Foreign exchange forward contracts: Net fair value gains on effective hedges 1 2
Amount reclassified to income statement – revenue (2) (2)Amount reclassified to income statement – cost of sales 1 (2)
Carried forward cash-flow hedge reserve at end of year – –
The following tables set out information regarding the change in value of the hedged item used in calculating hedge ineffectiveness as well as the impacts on the cash-flow hedge reserve:
Cash-flow hedge reserve
Hedged item Hedged exposure Hedging instrument Financial year
Changes in value of the hedged item for calculating
ineffectiveness £m
Changes in value of the hedging instrument for
calculating ineffectiveness £m
Continued hedges
£m
Discontinued hedges
£m
Sales and purchases
Foreign currency risk
Foreign exchange contracts
FY2020 1 (1) 1 –
FY2019 2 (2) – –
Cash-flow hedges generated £nil of ineffectiveness in FY2020 (FY2019: £nil) which was recognised in the income statement through finance costs.
Translational currency exposure
The Group has significant investments in overseas operations, particularly in the United States and Europe. As a result, the sterling value of the Group’s balance sheet can be significantly affected by movements in exchange rates. The Group seeks to mitigate the effect of these translational currency exposures by matching the net investment in overseas operations with borrowings denominated in their functional currencies, except where significant adverse interest differentials or other factors would render the cost of such hedging activity uneconomic. This is achieved by borrowing primarily in the relevant currency or in some cases indirectly using cross-currency swaps.
Net investment hedges
The table below sets out the currency of loans and swap contracts designated as net investment hedges:At 31 July 2020 At 31 July 2019*
US$ £m
Euro £m
Total £m
US$ £m
Euro £m
Total £m
Loans designated as net investment hedges (303) (484) (787) (325) (490) (815)Cross-currency swap (572) – (572) (613) – (613)
(875) (484) (1,359) (938) (490) (1,428)
* The comparatives for the year to 31 July 2019 have been represented to show Euro hedging instruments at a summary net level in currency.
At 31 July 2020, cross-currency swaps hedged the Group’s exposure to US dollars and Euros (31 July 2019: US dollars and Euros). All the cross-currency swaps designated as net investment hedges are non-current (FY2019: non-current).
Swaps generating £329m of the US dollar exposure (FY2019: £353m) will mature in April 2023 and swaps generating £243m of the US dollar exposure (FY2019: £260m) will mature in February 2027.
N O T E S T O T H E A C C O U N T SF I N A N C I A L S T A T E M E N T S
1 8 4 S M I T H S G R O U P P L C A N N U A L R E P O R T F Y 2 0 2 0

In addition, non-swapped borrowings were also used to hedge the Group’s exposure to US dollars and euros (31 July 2019 US dollars and euros). Borrowings generating £303m of the US dollar exposure (FY2019: £325m) will mature in October 2022. Borrowings generating £536m of the euro exposure (FY2019: £543m) will mature in April 2023 and borrowings generating £308m of the euro exposure (FY2019: £312m) will mature in February 2027.
Hedge effectiveness is determined at the inception of the hedge relationship, and through periodic prospective effectiveness assessments to ensure that an economic relationship exists between the hedged item and hedging instrument. The swaps and borrowings have the same notional amount as the hedged items and therefore, there is an economic relationship with the hedge ratio established as 1:1.
The main sources of hedge ineffectiveness in these hedging relationships is the effect of the counterparty and the Group’s own credit risk on the fair value of the foreign exchange forward contracts which is not reflected in the fair value of the hedged item and the risk of over-hedging where the hedge relationship requires re-balancing. No other sources of ineffectiveness emerged from these hedging relationships. Any hedge ineffectiveness is recognised immediately in the income statement in the period that it occurs.
The following table presents a reconciliation by risk category of the net investment hedge reserve and analysis of other comprehensive income in relation to hedge accounting:
Year ended 31 July 2020
£m
Year ended 31 July 2019
£m
Brought forward net investment hedge reserve at start of year (383) (304)
Cross-currency swaps Net fair value gains on effective hedges 37 (35)Bonds Net fair value gains on effective hedges 32 (44)Carried forward net investment hedge reserve at end of year (314) (383)
The following table sets out information regarding the change in value of the hedged item used in calculating hedge ineffectiveness as well as the impacts on the net investment hedge reserve as at 31 July 2020 and 31 July 2019:
Net investment hedge reserve
Hedged item Hedged exposure Hedging instrument Financial year
Changes in value of the hedged item for calculating
ineffectiveness £m
Changes in value of the hedging instrument for
calculating ineffectiveness £m
Continued hedges
£m
Discontinued hedges
£m
Overseas operation
Foreign currency risk
Forward contracts FY2020 – - - -Cross-currency swaps FY2020 (37) 40 37 -Bonds FY2020 (32) 32 32 -
(69) 72 69 -
Overseas operation
Foreign currency risk
Forward contracts FY2019 – (1) – –Cross-currency swaps FY2019 35 (37) (35) –Bonds FY2019 44 (44) (44) –
79 (82) (79) –
Net investment hedges generated £3m of ineffectiveness in FY2020 (FY2019:£nil) which was recognised in the income statement through finance costs.
The fair values of these net investment hedges are subject to exchange rate movements. Based on the hedging instruments in place at the year-end, if the specified currencies were to strengthen 10% while all other market rates remained constant, it would have the following effect:
Loss recognised
in hedge reserve
31 July 2020 £m
Loss recognised
in hedge reserve
31 July 2019 £m
US dollar 97 104Euro 54 54
These movements would be fully offset by an opposite movement on the retranslation of the net assets of the overseas subsidiaries. These sensitivities were calculated before adjusting for tax.
(b) Interest rate riskThe Group operates an interest rate policy designed to optimise interest cost and reduce volatility in reported earnings. The Group’s current policy is to require interest rates to be fixed within a band of between 40% and 60 % of the level of gross debt. This is achieved through fixed rate borrowings and interest rate swaps. At 31 July 2020, 53% (FY2019: 48%) of the Group’s gross borrowings were at fixed interest rates, after adjusting for interest rate swaps and the impact of short maturity derivatives designated as net investment hedges.
The Group monitors its fixed rate risk profile against both gross and net debt. For medium-term planning, it focuses on gross debt to eliminate the fluctuations of variable cash levels over the cycle. The weighted average interest rate on borrowings and cross-currency swaps at 31 July 2020, after interest rate swaps, is 2.20% (FY2019: 3.22%).
4
1 8 5S M I T H S G R O U P P L C A N N U A L R E P O R T F Y 2 0 2 0

19 Financial risk management continuedInterest rate profile of financial assets and liabilities and the fair value of borrowings
The following table shows the interest rate risk exposure of investments, cash and borrowings, with the borrowings adjusted for the impact of interest rate hedging. The other financial assets and liabilities do not earn or bear interest and for all financial instruments except for borrowings the carrying value is not materially different from their fair value.
As at 31 July 2020 As at 31 July 2019
At fair value through
profit or loss £m
Cash and cash
equivalents £m
Borrowings £m
Fair value of borrowings
£m
At fair value through
profit or loss £m
Cash and cash
equivalents £m
Borrowings £m
Fair value of borrowings
£m
Fixed interest Less than one year – – (41) (41) – – – –
Between one and five years – – (423) (429) – – (384) (391)Greater than five years – – (322) (334) – – (314) (342)
Total fixed interest financial liabilities – – (786) (804) – – (698) (733)Floating rate interest financial assets/(liabilities)* 8 305 (775) (775) 6 238 (811) (811)
Total interest-bearing financial assets/(liabilities) 8 305 (1,561) (1,579) 6 238 (1,509) (1,544)Non-interest-bearing assets in the same category 11 61 – – 13 51 – –
Total 19 366 (1,561) (1,579) 19 289 (1,509) (1,544)
* Fair value gains and losses in this category of assets are recognised in other comprehensive income.
Interest rate hedging
The Group also has exposures to the fair values of non-derivative financial instruments such as EUR and USD fixed rate borrowings. To manage the risk of changes in these fair values, the Group has entered into fixed-to-floating interest rate swap and cross-currency interest rate swaps which for accounting purposes are designated as fair value hedges.
At 31 July 2020 and 31 July 2019, the Group had designated the following hedges against variability in the fair value of borrowings arising from fluctuations in base rates:
– $150m interest rate swap which matures on 12 October 2022 partially hedging the USD 2022 Guaranteed notes; and
– €400m of the fixed/floating element of EUR/USD interest rate swaps maturing on 28 April 2023 partially hedging the € 2023 Eurobond.
Additionally at 31 July 2020 the Group designated the following hedge against variability in the fair value of borrowings arising from fluctuations in base rates:
– €300m of the fixed/floating and € exchange exposure of EUR/USD interest rate swaps maturing on 23 February 2027 partially hedging the € 2027 Eurobond.
The fair values of the hedging instruments are disclosed in note 20. The effect of the swaps is to convert £745m (FY2019: £761m) debt from fixed rate to floating rate. The swaps have similar critical terms to the hedged items, such as the reference rate, reset dates, notional amounts, payment dates and maturities. Therefore, there is an economic relationship and the hedge ratio is established as 1:1. Hedge effectiveness is determined at the inception of the hedge relationship, and through periodic prospective effectiveness assessments to ensure that an economic relationship exists between the hedged item and hedging instrument.
The main sources of hedge ineffectiveness in these hedging relationships is the effect of the counterparty and the Group’s own credit risk on the fair value of the cross-currency and interest rate swaps and currency basis risk on cross-currency interest rate swaps which are not reflected in the fair value of the hedged item. No other sources of ineffectiveness emerged from these hedging relationships. Any hedge ineffectiveness is recognised immediately in the income statement in the period that it occurs.
The following table sets out the details of the hedged exposures covered by the Group's fair value hedges:Changes in value
of hedged item for calculating
ineffectiveness £m
Changes in value of the hedging instrument
for calculating ineffectiveness
£m
Carrying amountAccumulated fair value
adjustments on hedged item
Hedged item Hedged exposureFinancial year
Assets £m
Liabilities £m
Assets £m
Liabilities £m
Fixed rate bonds (a)
Interest rate risk FY2020 10 1 – 475 – 11Interest rate & currency rate risk FY2020 – (5) – 270 – 20
10 (4) – 745 – 31
Fixed rate bonds (a)
Interest rate risk FY2019 8 (5) – 123 – 2Interest rate & currency rate risk FY2019 44 (37) – 638 – 39
52 (42) – 761 – 41
(a) Classified as borrowings
Fair value hedges generated a £6m ineffectiveness gain in FY2020 (FY2019: £10m loss) which was recognised in the income statement through finance costs.
N O T E S T O T H E A C C O U N T SF I N A N C I A L S T A T E M E N T S
1 8 6 S M I T H S G R O U P P L C A N N U A L R E P O R T F Y 2 0 2 0

Sensitivity of interest charges to interest rate movements
The Group has exposure to sterling, US dollar and euro interest rates. However, the Group does not have a significant exposure to interest rate movements for any individual currency. Based on the composition of net debt and investments at 31 July 2020, and taking into consideration all fixed rate borrowings and interest rate swaps in place, a one percentage point (100 basis points) change in average floating interest rates for all three currencies would have less than £5m impact (FY2019: £5m impact) on the Group’s profit before tax.
(c) Financial credit riskThe Group is exposed to credit-related losses in the event of non-performance by counterparties to financial instruments, but does not currently expect any counterparties to fail to meet their obligations. Credit risk is mitigated by the Board-approved policy of only placing cash deposits with highly rated relationship bank counterparties within counterparty limits established by reference to their Standard & Poor’s long-term debt rating. In the normal course of business, the Group operates cash pooling systems, where a legal right of set-off applies.
The maximum credit risk exposure in the event of other parties failing to perform their obligations under financial assets, excluding trade and other receivables and derivatives, totals £385m at 31 July 2020 (FY2019: £308m).
31 July 2020 £m
31 July 2019 £m
Cash in AAA liquidity funds 160 85Cash at banks with at least a AA- credit rating 28 97Cash at banks with all other A credit ratings 164 97Cash at other banks 14 10Investments in bank deposits 11 13Other investments 8 6
385 308
At 31 July 2020, the maximum exposure with a single bank for deposits and cash is £124m (FY2019: £179m), whilst the maximum mark to market exposure with a single bank for derivatives is £29m (FY2019: £17m). These banks have AAA and AA- credit ratings respectively (FY2019: Both A+ & AA-).
(d) Liquidity risk
Borrowing facilities
The Board policy specifies the maintenance of unused committed credit facilities of at least £300m at all times to ensure it has sufficient available funds for operations and planned development. The Group has Revolving Credit Facilities of $110m maturing on 1 November 2023 and $690m maturing 1 November 2024. At the balance sheet date, the Group had the following undrawn credit facilities:
31 July 2020 £m
31 July 2019 £m
Expiring after more than two years 611 655
The Bank of England confirmed Smiths' eligibility to access the Covid Corporate Financing Facility ('CCFF') in principle from 30 April 2020 with an indicative aggregate group limit of £600m. Utilisation of the CCFF, which closes to new issuance on 23 March 2021, is not anticipated.
Cash deposits
As at 31 July 2020, £192m (FY2019: £136m) of cash and cash equivalents was on deposit with various banks of which £12m (FY2019: £32m) was on deposit with UK banks, £160m (FY2019: £85m) was in liquidity funds and £11m (FY2019: £13m) of investments comprised bank deposits held to secure liabilities and letters of credit.
Gross contractual cash-flows for borrowingsAs at 31 July 2020 As at 31 July 2019
Borrowings (note 18)
£m
Fair value adjustments
£m
Contractual interest
payments £m
Total contractual cash-flows
£m
Borrowings (note 18)
£m
Fair value adjustments
£m
Contractual interest
payments £m
Total contractual cash-flows
£m
Less than one year (41) – (30) (71) (9) – (31) (40)Between one and two years (20) – (30) (50) – – (31) (31)Between two and three years (870) 22 (24) (872) – – (31) (31)Between three and four years (10) – (12) (22) (893) 20 (25) (898)Between four and five years (8) – (12) (20) – – (12) (12)Greater than five years (612) 9 (24) (627) (607) 20 (36) (623)
Total (1,561) 31 (132) (1,662) (1,509) 40 (166) (1,635)
The figures presented in the borrowings column include the non-cash adjustments which are highlighted in the adjacent column. The contractual interest reported for borrowings is before the effect of interest rate swaps.
4
1 8 7S M I T H S G R O U P P L C A N N U A L R E P O R T F Y 2 0 2 0

19 Financial risk management continued Gross contractual cash-flows for derivative financial instruments
As at 31 July 2020 As at 31 July 2019
Receipts £m
Payments £m
Net cash-flow
£mReceipts
£mPayments
£m
Net cash-flow
£m
AssetsLess than one year 174 (175) (1) 217 (236) (19)Greater than one year 674 (595) 79 712 (652) 60LiabilitiesLess than one year 144 (144) – 241 (238) 3Greater than one year – 3 3 19 (18) 1
Total 992 (911) 81 1,189 (1,144) 45
This table presents the undiscounted future contractual cash-flows for all derivative financial instruments. For this disclosure, cash-flows in foreign currencies are translated using the spot rates at the balance sheet date. The fair values of these financial instruments are presented in note 20.
Gross contractual cash-flows for other financial liabilities
The contractual cash-flows for financial liabilities included in trade and other payables are £331m (FY2019: £384m) due in less than one year, £6m (FY2019: £6m) due between one and five years, and £3m (FY2019: £3m) due after more than five years.
20 Derivative financial instrumentsThe tables below set out the nominal amount and fair value of derivative contracts held by the Group, identifying the derivative contracts which qualify for hedge accounting treatment:
At 31 July 2020
Contract or underlying
nominal amount
£m
Fair value
Assets £m
Liabilities £m
Net £m
Foreign exchange contracts (cash-flow hedges) 110 1 (1) –Foreign exchange contracts (not hedge accounted) 203 1 (3) (2)
Total foreign exchange contracts 313 2 (4) (2)
Cross-currency swaps (fair value and net investment hedges) 572 78 – 78Interest rate swaps (fair value hedges) 114 4 – 4
Total financial derivatives 999 84 (4) 80
Balance sheet entries:
Non-current 690 82 – 82Current 309 2 (4) (2)
Total financial derivatives 999 84 (4) 80
At 31 July 2019
Contract or underlying
nominal amount
£m
Fair value
Assets £m
Liabilities £m
Net £m
Foreign exchange contracts (cash-flow hedges) 54 (2) (2)Foreign exchange contracts (not hedge accounted) 431 4 (3) 1
Total foreign exchange contracts 485 4 (5) (1)
Cross-currency swaps (fair value and net investment hedges) 613 46 46Interest rate swaps (fair value hedges) 123 (1) (1)
Total financial derivatives 1,221 50 (6) 44
Balance sheet entries:Non-current 777 47 (1) 46Current 444 3 (5) (2)
Total financial derivatives 1,221 50 (6) 44
N O T E S T O T H E A C C O U N T SF I N A N C I A L S T A T E M E N T S
1 8 8 S M I T H S G R O U P P L C A N N U A L R E P O R T F Y 2 0 2 0
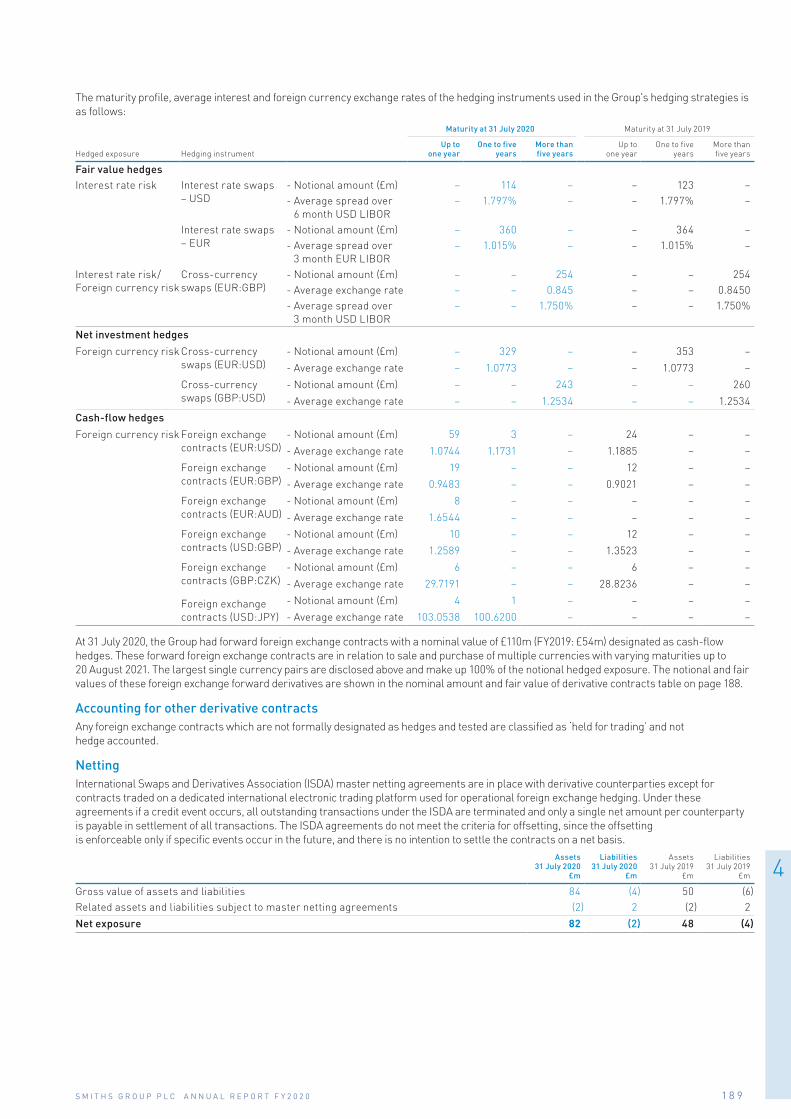
The maturity profile, average interest and foreign currency exchange rates of the hedging instruments used in the Group's hedging strategies is as follows:
Maturity at 31 July 2020 Maturity at 31 July 2019
Hedged exposure Hedging instrumentUp to
one yearOne to five
yearsMore than five years
Up to one year
One to five years
More than five years
Fair value hedgesInterest rate risk Interest rate swaps
– USD- Notional amount (£m) – 114 – – 123 –- Average spread over
6 month USD LIBOR– 1.797% – – 1.797% –
Interest rate swaps – EUR
- Notional amount (£m) – 360 – – 364 –- Average spread over
3 month EUR LIBOR– 1.015% – – 1.015% –
Interest rate risk/Foreign currency risk
Cross-currency swaps (EUR:GBP)
- Notional amount (£m) – – 254 – – 254- Average exchange rate – – 0.845 – – 0.8450- Average spread over
3 month USD LIBOR– – 1.750% – – 1.750%
Net investment hedges
Foreign currency risk Cross-currency swaps (EUR:USD)
- Notional amount (£m) – 329 – – 353 –
- Average exchange rate – 1.0773 – – 1.0773 –
Cross-currency swaps (GBP:USD)
- Notional amount (£m) – – 243 – – 260
- Average exchange rate – – 1.2534 – – 1.2534
Cash-flow hedges
Foreign currency risk Foreign exchange contracts (EUR:USD)
- Notional amount (£m) 59 3 – 24 – –
- Average exchange rate 1.0744 1.1731 – 1.1885 – –
Foreign exchange contracts (EUR:GBP)
- Notional amount (£m) 19 – – 12 – –
- Average exchange rate 0.9483 – – 0.9021 – –
Foreign exchange contracts (EUR:AUD)
- Notional amount (£m) 8 – – – – –
- Average exchange rate 1.6544 – – – – –
Foreign exchange contracts (USD:GBP)
- Notional amount (£m) 10 – – 12 – –
- Average exchange rate 1.2589 – – 1.3523 – –
Foreign exchange contracts (GBP:CZK)
- Notional amount (£m) 6 – – 6 – –
- Average exchange rate 29.7191 – – 28.8236 – –
Foreign exchange contracts (USD:JPY)
- Notional amount (£m) 4 1 – – – –
- Average exchange rate 103.0538 100.6200 – – – –
At 31 July 2020, the Group had forward foreign exchange contracts with a nominal value of £110m (FY2019: £54m) designated as cash-flow hedges. These forward foreign exchange contracts are in relation to sale and purchase of multiple currencies with varying maturities up to 20 August 2021. The largest single currency pairs are disclosed above and make up 100% of the notional hedged exposure. The notional and fair values of these foreign exchange forward derivatives are shown in the nominal amount and fair value of derivative contracts table on page 188.
Accounting for other derivative contractsAny foreign exchange contracts which are not formally designated as hedges and tested are classified as ‘held for trading’ and not hedge accounted.
NettingInternational Swaps and Derivatives Association (ISDA) master netting agreements are in place with derivative counterparties except for contracts traded on a dedicated international electronic trading platform used for operational foreign exchange hedging. Under these agreements if a credit event occurs, all outstanding transactions under the ISDA are terminated and only a single net amount per counterparty is payable in settlement of all transactions. The ISDA agreements do not meet the criteria for offsetting, since the offsetting is enforceable only if specific events occur in the future, and there is no intention to settle the contracts on a net basis.
Assets 31 July 2020
£m
Liabilities 31 July 2020
£m
Assets 31 July 2019
£m
Liabilities 31 July 2019
£m
Gross value of assets and liabilities 84 (4) 50 (6)Related assets and liabilities subject to master netting agreements (2) 2 (2) 2
Net exposure 82 (2) 48 (4)
4
1 8 9S M I T H S G R O U P P L C A N N U A L R E P O R T F Y 2 0 2 0

21 Fair value of financial instruments
As at 31 July 2020 Notes
Basis for determining
fair value
At amortised
cost £m
At fair value through profit
or loss £m
At fair value through OCI
£m
Total carrying
value £m
Total fair value
£m
Financial assetsOther investments 17 A – 11 – 11 11Other investments 17 E – – 8 8 8Cash and cash equivalents 18 A 206 160 – 366 366Trade and other financial receivables 15 A/B 679 – – 679 679Derivative financial instruments 20 B – 84 – 84 84Total financial assets 885 255 8 1,148 1,148Financial liabilitiesTrade and other financial payables 16 A (578) – – (578) (578)Short-term borrowings 18 C (10) – – (10) (10)Long-term borrowings 18 C (1,455) – – (1,455) (1,473)Leases liabilities 18 D (96) – – (96) (96)Derivative financial instruments 20 B - (4) – (4) (4)Total financial liabilities (2,139) (4) – (2,143) (2,161)
As at 31 July 2019 Notes
Basis for determining
fair value
At amortised
cost £m
At fair value through profit
or loss £m
Total carrying
value £m
Total fair value
£m
Financial assetsOther investments 17 A – 13 13 13Other investments 17 E – 6 6 6Cash and cash equivalents 18 A 153 136 289 289Trade and other financial receivables 15 A/B 816 – 816 816Derivative financial instruments 20 B – 50 50 50Total financial assets 969 205 1,174 1,174Financial liabilitiesTrade and other financial payables 16 A (599) – (599) (599)Short-term borrowings 18 C (9) – (9) (9)Long-term borrowings 18 C (1,500) – (1,500) (1,535)Finance leases D (3) – (3) (3)Derivative financial instruments 20 B – (6) (6) (6)Total financial liabilities (2,111) (6) (2,117) (2,152)
The fair value of a financial instrument is the price at which an asset could be exchanged, or a liability settled, between knowledgeable, willing parties in an arm's-length transaction. Fair values have been determined with reference to available market information at the balance sheet date, using the methodologies described below:
A Carrying value is assumed to be a reasonable approximation to fair value for all of these assets and liabilities (Level 2 as defined by IFRS 13 Fair Value Measurement).
B Fair values of derivative financial assets and liabilities and trade receivables held to collect or sell are estimated by discounting expected future contractual cash-flows using prevailing interest rate curves. Amounts denominated in foreign currencies are valued at the exchange rate prevailing at the balance sheet date. These financial instruments are included on the balance sheet at fair value, derived from observable market prices (Level 2 as defined by IFRS 13 Fair Value Measurement).
C Borrowings are carried at amortised cost. Amounts denominated in foreign currencies are valued at the exchange rate prevailing at the balance sheet date. The fair value of borrowings is estimated using quoted prices (Level 1 as defined by IFRS 13).
D Leases are carried at amortised cost. Amounts denominated in foreign currencies are valued at the exchange rate prevailing at the balance sheet date. The fair value of the lease contract is estimated by discounting contractual future cash-flows (Level 2 as defined by IFRS 13).
E The fair value of investments is estimated as Level 3 as defined by IFRS 13.
IFRS 13 defines a three level valuation hierarchy:
Level 1 – quoted prices for similar instruments Level 2 – directly observable market inputs other than Level 1 inputs Level 3 – inputs not based on observable market data
N O T E S T O T H E A C C O U N T SF I N A N C I A L S T A T E M E N T S
1 9 0 S M I T H S G R O U P P L C A N N U A L R E P O R T F Y 2 0 2 0

22 CommitmentsOperating lease commitments – minimum lease paymentsThe minimum uncancellable lease payments which the Group is committed to make are:
31 July 2019
Land and buildings
£mOther
£m
Payments due:– not later than one year 36 8– later than one year and not later than five years 84 9– later than five years 17 –
137 17
From 1 August 2019, the Group has recognised lease liabilities in accordance with IFRS 16 Leases in respect of leased properties, vehicles and equipment. See accounting policies and note 18 for further information.
Other commitmentsAt 31 July 2020, commitments, comprising bonds and guarantees arising in the normal course of business, amounted to £240m (FY2019: £209m), including pension commitments of £54m (FY2019: £54m). In addition, the Group has committed expenditure on capital projects amounting to £6m (2019: £14m).
23 Provisions and contingent liabilitiesTrading Non-headline and legacy Total
£m
John Crane, Inc.
litigation £m
Titeflex Corporation
litigation £m
Other £m £m
At 31 July 2018 23 223 78 14 338Foreign exchange rate movements 1 17 5 1 24Business combinations – – – 12 12
Provision charged 15 15 – – 30Provision released (6) – (6) – (12)Unwind of provision discount – 6 2 – 8Utilisation (12) (24) (5) (3) (44)Reclassified to liability held for distribution to owners (note 28) (3) – – (2) (5)
At 31 July 2019 18 237 74 22 351
Current liabilities 17 29 16 4 66Non-current liabilities 1 208 58 18 285
At 31 July 2019 18 237 74 22 351
Foreign exchange rate movements (1) (17) (5) (1) (24)Provision charged 9 30 1 3 43Provision released (4) – – (1) (5)Unwind of provision discount – 4 1 – 5Utilisation (8) (23) (5) (3) (39)At 31 July 2020 14 231 66 20 331
Current liabilities 12 26 13 4 55Non-current liabilities 2 205 53 16 276
At 31 July 2020 14 231 66 20 331
The John Crane, Inc. and Titeflex Corporation litigation provisions are the only provisions that are discounted.
TradingThe provisions included as trading represent amounts provided for in the ordinary course of business. Trading provisions are charged and released through headline profit.
Warranty provision and product liability
At 31 July 2020, the Group has warranty and product liability provisions of £13m (FY2019: £17m). Warranties over the Group’s products typically cover periods of between one and three years. Provision is made for the likely cost of after-sales support based on the recent past experience of individual businesses.
Commercial disputes and litigation in respect of ongoing business activities
The Group has on occasion been required to take legal action to protect its intellectual property and other rights against infringement. It has also had to defend itself against proceedings brought by other parties, including product liability and insurance subrogation claims. Provision is made for any expected costs and liabilities in relation to these proceedings where appropriate, though there can be no guarantee that such provisions (which may be subject to potentially material revision from time to time) will accurately predict the actual costs and liabilities that may be incurred.
4
1 9 1S M I T H S G R O U P P L C A N N U A L R E P O R T F Y 2 0 2 0

23 Provisions and contingent liabilities continuedContingent liabilities
In the ordinary course of its business, the Group is subject to commercial disputes and litigation such as government price audits, product liability claims, employee disputes and other kinds of lawsuits, and faces different types of legal issues in different jurisdictions. The high level of activity in the US, for example, exposes the Group to the likelihood of various types of litigation commonplace in that country, such as ‘mass tort’ and ‘class action’ litigation, legal challenges to the scope and validity of patents, and product liability and insurance subrogation claims. These types of proceedings (or the threat of them) are also used to create pressure to encourage negotiated settlement of disputes. Any claim brought against the Group (with or without merit) could be costly to defend. These matters are inherently difficult to quantify. In appropriate cases a provision is recognised based on best estimates and management judgement but there can be no guarantee that these provisions (which may be subject to potentially material revision from time to time) will result in an accurate prediction of the actual costs and liabilities that may be incurred. There are also contingent liabilities in respect of litigation for which no provisions are made.
The Group operates in some markets where the risk of unethical or corrupt behaviour is material and has procedures, including an employee ‘Ethics Alertline’, to help it identify potential issues. Such procedures will, from time to time, give rise to internal investigations, sometimes conducted with external support, to ensure that Smiths Group properly understands risks and concerns and can take steps both to manage immediate issues and to improve its practices and procedures for the future. The Group is not aware of any issues which are expected to generate material financial exposures.
Non-headline and legacy
John Crane, Inc.
John Crane, Inc. (JCI) is one of many co-defendants in numerous lawsuits pending in the United States in which plaintiffs are claiming damages arising from alleged exposure to, or use of, products previously manufactured which contained asbestos. Until 2006, the awards, the related interest and all material defence costs were met directly by insurers. In 2007, JCI secured the commutation of certain insurance policies in respect of product liability. Provision is made in respect of the expected costs of defending known and predicted future claims and of adverse judgments in relation thereto, to the extent that such costs can be reliably estimated.
The JCI products generally referred to in these cases consist of industrial sealing product, primarily packing and gaskets. The asbestos was encapsulated within these products in such a manner that causes JCI to believe, based on tests conducted on its behalf, that the products were safe. JCI ceased manufacturing products containing asbestos in 1985.
JCI continues to actively monitor the conduct and effect of its current and expected asbestos litigation, including the most efficacious presentation of its ‘safe product’ defence, and intends to continue to resist these asbestos claims based upon this defence. The table below summarises the JCI claims experience over the last 40 years since the start of this litigation:
Year ended 31 July 2020
Year ended 31 July 2019
Year ended 31 July 2018
Year ended 31 July 2017
Year ended 31 July 2016
JCI claims experienceClaims against JCI that have been dismissed 297,000 285,000 277,000 273,000 247,000Claims JCI is currently a defendant in 25,000 38,000 43,000 50,000 74,000Cumulative final judgments, after appeals, against JCI since 1979 149 144 140 138 137Cumulative value of awards ($’m) since 1979 175 168 164 160 158
The number of claims outstanding at 31 July 2020 reflects the benefit of 13,000 claims being dismissed in the year.
JCI has also incurred significant additional defence costs. The litigation involves claims for a number of allegedly asbestos-related diseases, with awards, when made, for mesothelioma tending to be larger than those for the other diseases. JCI’s ability to defend mesothelioma cases successfully is, therefore, likely to have a significant impact on its annual aggregate adverse judgment and defence costs.
John Crane, Inc. litigation provision
The provision is based on past history of JCI claims and well-established tables of asbestos-related disease incidence projections. The provision is determined using advice from asbestos valuation experts, Bates White LLC. The assumptions made in assessing the appropriate level of provision include: the period over which the expenditure can be reliably estimated; the future trend of legal costs; the rate of future claims filed; the rate of successful resolution of claims; and the average amount of judgments awarded.
Established incidence curves can be used to estimate the likely future pattern of asbestos-related disease. However, JCI’s claims experience is also significantly impacted by other factors which influence the US litigation environment. These can include: changing approaches on the part of the plaintiffs’ bar; changing attitudes amongst the judiciary at both trial and appellate levels in specific jurisdictions which move the balance of risk and opportunity for claimants; and legislative and procedural changes in both the state and federal court systems.
The projections use a limited time horizon on the basis that Bates White LLC consider that there is substantial uncertainty in the asbestos litigation environment. So probable expenditures are not reasonably estimable beyond this time horizon. Asbestos is the longest running mass tort litigation in American history and is constantly evolving in ways that cannot be anticipated. JCI's defence strategy also generates a significantly different pattern of legal costs and settlement expenses from other defendants. Thus JCI is in an extremely rare position, and evidence from other litigation cannot be used to improve the reliability of the projections. A ten year (FY2019: ten year) time horizon has been used based on past experience regarding significant changes in the litigation environment that have occurred every few years and on the amount of time taken in the past for some of those changes to impact the broader asbestos litigation environment.
N O T E S T O T H E A C C O U N T SF I N A N C I A L S T A T E M E N T S
1 9 2 S M I T H S G R O U P P L C A N N U A L R E P O R T F Y 2 0 2 0

The rate of future claims filed has been estimated using well-established tables of asbestos incidence projections to determine the likely population of potential claimants, and JCI’s past experience to determine what proportion of this population will make a claim against JCI. The JCI products generally referred to in claims had industrial and marine applications. As a result, the incidence curve used for JCI projections excludes construction workers, and is a composite of the curves that predict asbestos exposure-related disease from shipyards and other occupations. This is consistent with JCI’s litigation history.
The rate of successful resolution of claims and the average amount of any judgments awarded are projected based on the past history of JCI claims, since this is the best available evidence, given JCI’s unusual strategy of defending all claims.
The future trend of legal costs is estimated based on JCI’s past experience, adjusted to reflect the assumed levels of claims and trial activity, since the number of trials is a key driver of legal costs.
John Crane, Inc. litigation insurance recoveries
While JCI has certain excess liability insurance, JCI has met defence costs directly. The calculation of the provision does not take account of any potential recoveries from insurers.
John Crane, Inc. litigation provision history
The JCI asbestos litigation provision has developed over the last five years as follows: Year ended
31 July 2020 £m
Year ended 31 July 2019
£m
Year ended 31 July 2018
£m
Year ended 31 July 2017
£m
Year ended 31 July 2016
£m
John Crane, Inc. litigation provisionGross provision 235 257 251 260 267Discount (4) (20) (28) (23) (15)
Discounted pre-tax provision 231 237 223 237 252
Deferred tax (59) (50) (48) (79) (84)Discounted post-tax provision 172 187 175 158 168Operating profit charge/(credit)Increased provisions for adverse judgments and legal defence costs 14 7 13 17 8Change in US risk-free rates 16 8 (6) (13) 7Subtotal – items charged to the provision 30 15 7 4 15Litigation management, legal fees in connection with litigation against insurers and defence strategy
1 2 3 11 8
Recoveries from insurers (3) (11) – (6) (16)
Total operating profit charge 28 6 10 9 7
Cash-flowProvision utilisation – legal defence costs and adverse judgements (23) (24) (27) (24) (22)Litigation management expense (1) (2) (3) (11) (8)Recoveries from insurers 3 11 – 6 16
Net cash outflow (21) (15) (30) (29) (14)
John Crane, Inc. litigation provision sensitivities
The provision may be subject to potentially material revision from time to time if new information becomes available as a result of future events. There can be no guarantee that the assumptions used to estimate the provision will result in an accurate prediction of the actual costs that will be incurred because of the significant uncertainty associated with the future level of asbestos claims and of the costs arising out of related litigation.
Statistical reliability of projections over the ten year time horizon
In order to evaluate the statistical reliability of the projections, a population of outcomes is modelled using randomised verdict outcomes. This generated a distribution of outcomes with future spend at the 5th percentile of £214m and future spend at the 95th percentile of £271m (FY2019: £234m and £297m, respectively). Statistical analysis of the distribution of these outcomes indicates that there is a 50% probability that the total future spend will fall between £222m and £244m (FY2019: between £242m and £267m), compared to the gross provision value of £235m (FY2019: £257m).
4
1 9 3S M I T H S G R O U P P L C A N N U A L R E P O R T F Y 2 0 2 0
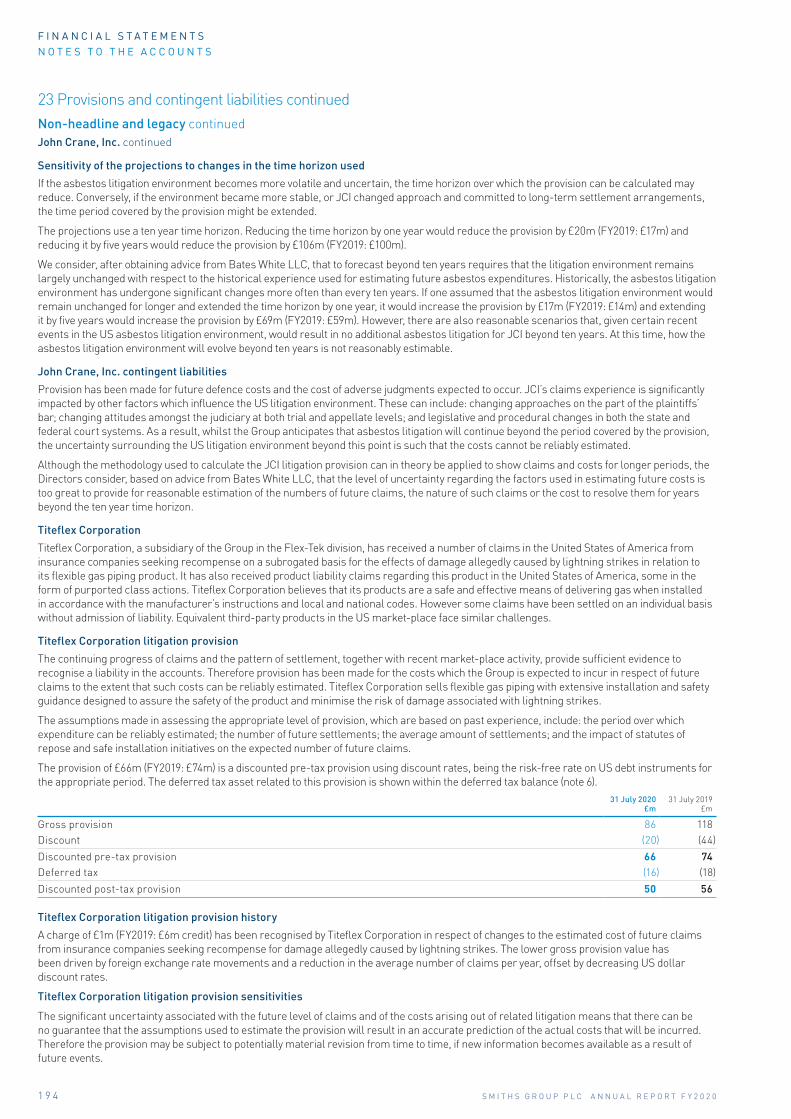
23 Provisions and contingent liabilities continuedNon-headline and legacy continuedJohn Crane, Inc. continued
Sensitivity of the projections to changes in the time horizon used
If the asbestos litigation environment becomes more volatile and uncertain, the time horizon over which the provision can be calculated may reduce. Conversely, if the environment became more stable, or JCI changed approach and committed to long-term settlement arrangements, the time period covered by the provision might be extended.
The projections use a ten year time horizon. Reducing the time horizon by one year would reduce the provision by £20m (FY2019: £17m) and reducing it by five years would reduce the provision by £106m (FY2019: £100m).
We consider, after obtaining advice from Bates White LLC, that to forecast beyond ten years requires that the litigation environment remains largely unchanged with respect to the historical experience used for estimating future asbestos expenditures. Historically, the asbestos litigation environment has undergone significant changes more often than every ten years. If one assumed that the asbestos litigation environment would remain unchanged for longer and extended the time horizon by one year, it would increase the provision by £17m (FY2019: £14m) and extending it by five years would increase the provision by £69m (FY2019: £59m). However, there are also reasonable scenarios that, given certain recent events in the US asbestos litigation environment, would result in no additional asbestos litigation for JCI beyond ten years. At this time, how the asbestos litigation environment will evolve beyond ten years is not reasonably estimable.
John Crane, Inc. contingent liabilities
Provision has been made for future defence costs and the cost of adverse judgments expected to occur. JCI’s claims experience is significantly impacted by other factors which influence the US litigation environment. These can include: changing approaches on the part of the plaintiffs’ bar; changing attitudes amongst the judiciary at both trial and appellate levels; and legislative and procedural changes in both the state and federal court systems. As a result, whilst the Group anticipates that asbestos litigation will continue beyond the period covered by the provision, the uncertainty surrounding the US litigation environment beyond this point is such that the costs cannot be reliably estimated.
Although the methodology used to calculate the JCI litigation provision can in theory be applied to show claims and costs for longer periods, the Directors consider, based on advice from Bates White LLC, that the level of uncertainty regarding the factors used in estimating future costs is too great to provide for reasonable estimation of the numbers of future claims, the nature of such claims or the cost to resolve them for years beyond the ten year time horizon.
Titeflex Corporation
Titeflex Corporation, a subsidiary of the Group in the Flex-Tek division, has received a number of claims in the United States of America from insurance companies seeking recompense on a subrogated basis for the effects of damage allegedly caused by lightning strikes in relation to its flexible gas piping product. It has also received product liability claims regarding this product in the United States of America, some in the form of purported class actions. Titeflex Corporation believes that its products are a safe and effective means of delivering gas when installed in accordance with the manufacturer’s instructions and local and national codes. However some claims have been settled on an individual basis without admission of liability. Equivalent third-party products in the US market-place face similar challenges.
Titeflex Corporation litigation provision
The continuing progress of claims and the pattern of settlement, together with recent market-place activity, provide sufficient evidence to recognise a liability in the accounts. Therefore provision has been made for the costs which the Group is expected to incur in respect of future claims to the extent that such costs can be reliably estimated. Titeflex Corporation sells flexible gas piping with extensive installation and safety guidance designed to assure the safety of the product and minimise the risk of damage associated with lightning strikes.
The assumptions made in assessing the appropriate level of provision, which are based on past experience, include: the period over which expenditure can be reliably estimated; the number of future settlements; the average amount of settlements; and the impact of statutes of repose and safe installation initiatives on the expected number of future claims.
The provision of £66m (FY2019: £74m) is a discounted pre-tax provision using discount rates, being the risk-free rate on US debt instruments for the appropriate period. The deferred tax asset related to this provision is shown within the deferred tax balance (note 6).
31 July 2020 £m
31 July 2019 £m
Gross provision 86 118Discount (20) (44)
Discounted pre-tax provision 66 74Deferred tax (16) (18)
Discounted post-tax provision 50 56
Titeflex Corporation litigation provision history
A charge of £1m (FY2019: £6m credit) has been recognised by Titeflex Corporation in respect of changes to the estimated cost of future claims from insurance companies seeking recompense for damage allegedly caused by lightning strikes. The lower gross provision value has been driven by foreign exchange rate movements and a reduction in the average number of claims per year, offset by decreasing US dollar discount rates.
Titeflex Corporation litigation provision sensitivities
The significant uncertainty associated with the future level of claims and of the costs arising out of related litigation means that there can be no guarantee that the assumptions used to estimate the provision will result in an accurate prediction of the actual costs that will be incurred. Therefore the provision may be subject to potentially material revision from time to time, if new information becomes available as a result of future events.
N O T E S T O T H E A C C O U N T SF I N A N C I A L S T A T E M E N T S
1 9 4 S M I T H S G R O U P P L C A N N U A L R E P O R T F Y 2 0 2 0

The projections incorporate a long-term assumption regarding the impact of safe installation initiatives on the level of future claims. If the assumed annual benefit of bonding and grounding initiatives were 0.5% higher, the provision would be £6m (FY2019: £5m) lower, and if the benefit were 0.5% lower, the provision would increase by £7m (FY2019: £6m).
The projections use assumptions of future claims that are based on both the number of future settlements and the average amount of those settlements. If the assumed average number of future settlements increased 10%, the provision would rise by £5m (FY2019: £6m), with an equivalent fall for a reduction of 10%. If the assumed amount of those settlements increased 10%, the provision would rise by £3m (FY2019: £3m), also with an equivalent fall for a reduction of 10%.
Other non-headline and legacy
Legacy provisions comprise provisions relating to former business activities and properties no longer used by Smiths. Non-headline provisions comprise all provisions that were disclosed as non-headline items when they were charged to the consolidated income statement. These provisions include non-headline reorganisation, disposal indemnities and litigation in respect of old products and discontinued business activities.
Reorganisation
At 31 July 2020, there were reorganisation provisions of £3m relating to the various restructuring programmes that are expected to be utilised in the next 18 months.
Property
At 31 July 2020, there were provisions of £12m (FY2019: £14m) related to actual and potential environmental issues for sites currently or previously occupied by Smiths operations and £3m (FY2019: £1m) of dilapidations provisions.
24 Share capital
Number of shares
Issued capital
£mConsideration
£m
Ordinary shares of 37.5p eachTotal share capital at 31 July 2018 395,761,227 148Exercise of share options 195,554 – 2
Total share capital at 31 July 2019 395,956,781 148
Exercise of share options 254,399 1 2
Total share capital at 31 July 2020 396,211,180 149
Share capital structureAs at 31 July 2020, the Company’s issued share capital was 396,211,180 ordinary shares with a nominal value of 37.5p per share, all of the issued share capital was in free issue and all issued shares are fully paid.
The Company’s ordinary shares are listed and admitted to trading on the Main Market of the London Stock Exchange. The Company has an American Depositary Receipt (ADR) programme and one ADR equates to one ordinary share. As at 31 July 2020, 7,120,155 ordinary shares were held by the nominee of the programme in respect of the same number of ADRs in issue.
The holders of ordinary shares are entitled to receive the Company’s Reports and Accounts, to attend and speak at general meetings of the Company, to appoint proxies and to exercise voting rights. None of the ordinary shares carry any special rights with regards to control of the Company or distributions made by the Company.
There are no known agreements relating to, or restrictions on, voting rights attached to the ordinary shares (other than the 48 hour cut-off for casting proxy votes prior to a general meeting). There are no restrictions on the transfer of shares, and there is no requirement to obtain approval for a share transfer. There are no known arrangements under which financial rights are held by a person other than the holder of the ordinary shares. There are no known limitations on the holding of shares.
Powers of DirectorsThe Directors are authorised to issue and allot shares and to buy back shares subject to annual shareholder approval at the AGM. Such authorities were granted by shareholders at the 2019 AGM, and at the 2020 AGM it will be proposed that the Directors be granted new authorities to allot and buy back shares.
Repurchase of sharesThe Company did not purchase any of its own shares in its own name during the financial year ended 31 July 2020, all share purchases have been made by an Employee Benefit Trust with the shares acquired used to satisfy Company share plan commitments. As at 21 September 2020 (the latest practicable date for inclusion in this report), the Company had an unexpired authority to repurchase ordinary shares up to a maximum of 40m ordinary shares. As at 21 September 2020, the Company did not hold any shares in treasury. Any ordinary shares purchased may be cancelled or held in treasury.
Employment share schemesShares acquired through Company share schemes and plans rank pari passu with the shares in issue and have no special rights. The Company operates an Employee Benefit Trust, with an independent trustee, to hold shares pending employees becoming entitled to them under the Company’s share schemes and plans. On 31 July 2020, the trust held no ordinary shares in the Company. The trust waived its dividend entitlement on its holding during the year, and the trust abstains from voting any shares held at general meetings.
4
1 9 5S M I T H S G R O U P P L C A N N U A L R E P O R T F Y 2 0 2 0

25 DividendsThe following dividends were declared and paid in the period:
Year ended 31 July 2020
£m
Year ended 31 July 2019
£m
FY2019 ordinary final dividend of 31.80p (FY2018: 30.75p) paid 15 November 2019 126 122FY2020 ordinary interim dividend of nil (FY2019: 14.10p) – 56
126 178
In March 2020, the Board considered it prudent not to declare an interim dividend for HY2020 until such time as trading conditions became clearer and there was less uncertainty. Reflecting the Group’s strong performance and financial position, the Board has recommended a total dividend of 35.0p per share for the year. This is comprised of a delayed interim dividend of 11.0p and a proposed final dividend of 24.0p.
Shareholders will be asked to approve the final dividend component of the total dividend at the 2020 AGM. If the final dividend is approved, it will be payable, along with the interim dividend, on 20 November 2020 to shareholders on the register of members at 6.00pm on 23 October 2020 (the record date). The interim dividend does not require the approval of shareholders and is therefore not included in the resolutions put to the AGM. As payment of these dividends will occur outside the period, they have not been included as a liability in these accounts.
Waiver of dividendsThe following waived all dividends payable in the year, and all future dividends, on their shareholdings in the Company:
– Wealth Nominees Limited (Smiths Industries Employee Share Trust)
– Reuter File Limited
26 ReservesRetained earnings include the value of Smiths Group plc shares held by the Smiths Industries Employee Benefit Trust. In the year the Company issued 1,234,907 (FY2019: 1,170,315) shares to the Trust, and the Trust purchased 1,181,849 shares (FY2019: 1,222,607 shares) in the market for a consideration of £18m (FY2019: £19m). At 31 July 2020, the Trust held nil (FY2019: 53,058) ordinary shares.
The capital redemption reserve, revaluation reserve and merger reserve arose from share repurchases, revaluations of property, plant and equipment, and merger accounting for business combinations before the adoption of IFRS, respectively.
Capital managementCapital employed comprises total equity adjusted for goodwill recognised directly in reserves, net post-retirement benefit related assets and liabilities, net litigation provisions relating to non-headline items and net debt. The efficiency of the allocation of the capital to the divisions is monitored through the return on capital employed (ROCE). This ratio is calculated over a rolling 12-month period and is the percentage that headline operating profit comprises of monthly average capital employed. The ROCE was11.8% (FY2019: 14.4%), see note 30.
The capital structure is based on the Directors’ judgement of the balance required to maintain flexibility while achieving an efficient cost of capital.
The ratio of net debt to headline EBITDA of 1.9 (FY2019: 1.8) is within the Group’s stated policy of 2.0 or less over the medium term. The Group’s robust balance sheet and record of strong cash generation is more than able to fund the immediate investment needs and other legacy obligations. See note 30 for the definition of headline EBITDA and the calculation of this ratio.
As part of its capital management the Group strategy is to maintain a solid investment grade credit rating to ensure access to the widest possible sources of financing and to minimise the resulting cost of capital. At 31 July 2020, the Group had a credit rating of BBB+/Baa2 (FY2019: BBB+/Baa2) with Standard & Poor’s and Moody’s respectively.
The Board has a progressive dividend policy for future pay-outs, with the aim of increasing dividends in line with the long-term underlying growth in earnings. In setting the level of dividend payments, the Board will take into account prevailing economic conditions and future investment plans, along with the objective to maintain minimum dividend cover of around 2 times.
Hedge reserve31 July 2020
£m31 July 2019
£m
The hedge reserve on the balance sheet comprises:– net investment hedge reserve from continuing operations net of £3m deferred tax (FY2019: £nil) (311) (383)– net investment hedge reserve from discontinued operations (1) –
(312) (383)
See transactional currency exposure risk management disclosures in note 19 for additional details of cash-flow hedges, and translational currency exposure risk management disclosure also in note 19 for additional details of net investment hedges.
Non-controlling interestThe Group has recorded a non-controlling interest of £21m in John Crane Japan Inc., representing a 30% interest. John Crane Japan Inc. generated operating profits of £9m in the period, cash inflows from operating activities of £11m and paid dividends of £2m and tax of £3m. At 31 July 2020, the company contributed £60m of net assets to the Group.
N O T E S T O T H E A C C O U N T SF I N A N C I A L S T A T E M E N T S
1 9 6 S M I T H S G R O U P P L C A N N U A L R E P O R T F Y 2 0 2 0

27 AcquisitionsOn 31 October 2019, Smiths Interconnect completed the acquisition of 100% of the share capital of Reflex Photonics Inc. for an enterprise value of CAD$40m. Reflex Photonics is a business that manufactures ruggedised high-speed optical products for space, aerospace, defence, avionics, and industrial applications. The acquisition strengthens Smiths Interconnect’s position in these markets. The intangible assets recognised on acquisition comprise customer relationships, intellectual property and technology. Goodwill represents the expected synergies from the strategic fit of the acquisition and the value of the expertise in the assembled workforce.
From the date of acquisition to 31July 2020, Reflex Photonics contributed £5m to revenue and less than £1m to profit before taxation. If the Group had acquired this business from the beginning of the financial year, the acquisition would have contributed £8m to revenue and less than £1m to profit before taxation. The provisional fair values at the date of acquisition are:
Total £m
Non-current assets – acquired intangible assets 15– plant and machinery 2– right-of-use assets 1
Current assets – inventory 2– trade and other receivables 1
Current liabilities – trade and other payables (3)
- current tax (3)
Non-current liabilities – lease liabilities (1)
Net assets acquired 14
Goodwill on current year acquisitions 10
Cash paid during the year 24Total consideration 24
Acquisitions in previous years
The Group acquired United Flexible in the prior year. Since the acquisition the Group has undertaken a thorough review of the business and has adjusted the fair value of assets and liabilities on the acquisition balance sheet, resulting in a £1m increase in the goodwill associated with this acquisition in the current year
28 Discontinued operations and businesses held for distribution to ownersThe Group formally committed to pursue a demerger of the Smiths Medical business and separately list it on the UK Stock Exchange in FY2019 and at 31 July 2019 it was determined that the project had progressed sufficiently for Smiths Medical business to be accounted for as a discontinued operation and as a business held for distribution to owners.
The demerger project was paused in March 2020 due to the unprecedented circumstances of the second half of FY2020. Management has determined that, as the Group remains demonstrably committed to the demerger of Smiths Medical, the criteria for classification as discontinued and held for distribution to owners continue to be met.
Discontinued operationsThe financial performance of the Smiths Medical business in the current and prior years is presented below:
Year ended 31 July 2020 Year ended 31 July 2019
Headline £m
Non-headline (note 3)
£mTotal
£mHeadline
£m
Non-headline (note 3)
£mTotal
£m
Revenue 918 – 918 874 – 874Cost of sales (418) – (418) (412) – (412)
Gross profit 500 – 462 – 462Sales and distribution costs (187) – (187) (183) – (183)Administrative expenses (129) (23) (152) (132) (13) (145)Profit on business disposal – – – – 17 17
Operating profit 184 (23) 161 147 4 151Finance costs (4) 62 58 (3) (38) (41)
Taxation (41) 22 (19) (32) 7 (25)
Profit from discontinued operations 139 61 200 112 (27) 85
£3m (FY2019: £3m) of interest was capitalised as part of the costs of Smiths Medical development projects. £1m (FY2019: £1m) of tax relief has been recognised as current tax relief in the period. The demerger of the Medical division is not anticipated to give rise to material tax charges. However, it is noted that the relevant regulatory filings and clearances are still in progress.
4
1 9 7S M I T H S G R O U P P L C A N N U A L R E P O R T F Y 2 0 2 0

28 Discontinued operations and businesses held for distribution to owners continuedBusinesses held for distribution to ownersThe carrying value of the assets and liabilities of the Smiths Medical business as at 31 July 2020 and 31 July 2019 is as follows:
31 July 2020 £m
31 July 2019 £m
Assets classified as held for distribution to owners:Intangible assets 734 746Property, plant and equipment 141 135Right of use assets 54 –Inventories 164 151Deferred tax assets 14 13Current tax receivable 3 2Trade and other receivables 148 138Cash and cash equivalents 20 26Financial derivatives 1 5
Assets classified as held for distribution to owners 1,279 1,216
Liabilities classified as held for distribution to owners:
Financial liabilities
– borrowings – (3)
- lease liabilities (48) –
– financial derivatives (4) (2)
Trade and other payables (167) (137)
Current tax payable (10) (11)
Deferred tax liabilities (53) (48)
Retirement benefit obligations (5) (6)
Provisions for liabilities and charges (8) (6)
Liabilities classified as held for distribution to owners (295) (213)
Acquisition of Access Scientific, LLCOn 12 May 2020, Smiths Medical completed the acquisition of 100% of the share capital of Access Scientific, LLC a broad-spectrum vascular access and infection prevention company. The acquisition of Access Scientific, LLC extends Smiths Medical’s vascular access product portfolio. The provisional fair values at the date of acquisition are:
Total £m
Intangible assets- technology and customer relationships 4Inventories 1Net assets acquired 5
Goodwill on acquisition 7
Cash paid during the year 12Total consideration 12
Contract liabilities from variable consideration agreementsSmiths Medical has a number of agreements with Group Purchasing Organisations and Individual Development Networks offering variable pricing arrangements on sales creating the need for rebates to be paid.
Included within trade and other payables are £41m of contract liabilities relating to variable consideration agreements (FY2019: £51m). These contract liabilities are estimated based on current sales and an applicable erosion rate. The erosion rate is based on historical rebate trends and adjusted for inventory maintained at distributor sites. There has been no recent history of material revisions to this contract liability.
N O T E S T O T H E A C C O U N T SF I N A N C I A L S T A T E M E N T S
1 9 8 S M I T H S G R O U P P L C A N N U A L R E P O R T F Y 2 0 2 0

Intangible assetsThe Smiths Medical intangible assets comprise:
31 July 2020 £m
31 July 2019 £m
Goodwill 564 594Development costs 140 127Acquired intangibles 20 17Software, patents and intellectual property 10 8Intangible assets 734 746
During the year impairment tests were carried out for capitalised development costs for products that were still under development and acquired intangibles where there were indications of impairment. Value in use calculations were used to determine the recoverability of these assets.
Intellifuse programme intangible assetThe Smiths Medical development costs above include £80m (FY2019: £64m) for the Intellifuse programme, which is considered to be an individually material intangible asset. Intellifuse is designed to be a multi-generational development programme to deliver a, rackable, stackable, interoperable, and extendable platform for both Large Volume Pumps and Syringe Pumps.
The US Food and Drug Administration (FDA) regulatory clearance path for infusion devices has become more challenging as the FDA has increased general scrutiny on all infusion technologies. During FY2020 Smiths Medical has experienced delays in achieving regulatory clearance for Intellifuse from the US FDA; competitors have also experienced such delays.
Although CE Mark regulatory approval for the sale of Intellifuse in the European Union was achieved in FY2020, the delay in US FDA regulatory clearance together with the assumed timetable of competitor launches has impacted the commercial viability and timelines for the launch of Intellifuse. Management remain confident on the technical feasibility of Intellifuse and the scope of work required to achieve FDA approval. However this delay is considered to be a potential indicator of impairment and therefore a detailed impairment review of the Intellifuse programme has been undertaken.
IAS 36 ‘Impairment of Assets’ states that the recoverable amount of an asset is the greater of its ‘fair value less costs to sell’ and its ‘value in use’. Therefore the impairment review for Intellifuse was completed using a fair value less cost to sell (Fair Value) valuation model. Since valuations of identical assets in active markets are not available, nor are market observables, the valuation is based on assumptions which a third party would use in estimating a fair value in an arm’s length sale process.
The result of this impairment testing is that the estimated Fair Value of Intellifuse exceeded the carrying value by £38m. Therefore no impairment charge has been recognised on the Intellifuse programme. This conclusion is supported by a separate impairment review undertaken on a value in use basis.
The Fair Value model utilised for impairment testing used the following key assumptions:
– 9% post-tax discount rate;
– 15.5% tax amortisation benefit;
– 1% cost to sell;
– an additional period of development to gain FDA clearance and prepare for commercial launch;
– 8 year sales forecast focused on North America only, being the expected primary market, excluding for modelling purposes the opportunities from other regions where CE Mark regulatory approval has already been obtained;
– 7 year annuity for related Disposables and Software Licenses in North America; and
– manufacturing and operating expenses priced as if they were outsourced to a third party, based on the third quartile of data points in third party benchmarking studies.
If the assumptions used in the impairment review were changed to a greater extent than as presented in the following table, the changes would, in isolation, lead to an impairment loss being recognised for the year ended 31 July 2020:
Change required for carrying value to equal recoverable amount
Delay in commercial launch of product 20 month further delayPost-tax discount rate +370 bps increaseVolume of sales achieved per annum –2,650 bps decrease
4
1 9 9S M I T H S G R O U P P L C A N N U A L R E P O R T F Y 2 0 2 0

28 Discontinued operations and businesses held for distribution to owners continued Cash-flow from discontinued operationsCash-flows from discontinued operations included in the consolidated cash-flow statement is as follows:
31 July 2020 £m
31 July 2019 £m
Net cash inflow from operating activities 141 149Net cash-flow used in investing activities (55) (28)Net cash-flow used in financing activities (83) (60)
3 61
Movement in net cash held in the disposal group includes £9m of foreign exchange losses, generating a total outflow of £6m.
Pro-forma balance sheet of the Group excluding Smiths Medical31 July 2020
£m
Non-current assetsIntangible assets 1,564Property, plant and equipment 218Right of use assets 94Financial assets – other investments 19Retirement benefit assets 516Deferred tax assets 102Trade and other receivables 52Financial derivatives 82
2,647Current assetsInventories 446Current tax receivable 46Trade and other receivables 627Cash and cash equivalents 366Financial derivatives 2
1,487Total assets 4,134Current liabilitiesFinancial liabilities (45)Provisions for liabilities and charges (55)Trade and other payables (527)Current tax payable (79)
(706)Non-current liabilitiesFinancial liabilities (1,520)Provisions for liabilities and charges (276)Retirement benefit obligations (139)Corporation tax payable (5)Deferred tax liabilities (27)Trade and other payables (51)
(2,018)
Total liabilities (2,724)
Net assets 1,410
N O T E S T O T H E A C C O U N T SF I N A N C I A L S T A T E M E N T S
2 0 0 S M I T H S G R O U P P L C A N N U A L R E P O R T F Y 2 0 2 0

Additional segmental information for discontinued operationsHeadline operating profit for discontinued operations is stated after charging depreciation £nil (FY2019: £19m), amortisation £nil (FY2019: £21m) and share based payments £1m (FY2019: £nil). The capital expenditure on property, plant and equipment, capitalised development and other intangible assets for discontinued operations is £46m (FY2019: £45m).
Revenue for the Smiths Medical discontinued operation is analysed by the following product lines: Infusion Systems £323m (FY2019: £307m), Vascular Access £275m (FY2019: £286m) and Vital Care/Other £320m (FY2019: £281m). Revenue by destination and non-current operating assets by location for discontinued operations is shown below:
Year ended 31 July 2020 Year ended 31 July 2019
Americas £m
Europe, Middle East
& Africa £m
Asia-Pacific £m
Total £m
Americas £m
Europe, Middle East
& Africa £m
Asia-Pacific £m
Total £m
Revenue 488 282 148 918 493 233 148 874Intangible assets, right of use assets and property, plant and equipment 780 96 53 929 772 64 45 881
Revenue by destination attributable to the United Kingdom was £69m (FY2019: £28m). Revenue earned in the United States of America is significant totalling £438m (FY2019: £447m). Revenue by destination has been selected as the basis for attributing revenue to geographical areas as this is the attribution used by management to review the performance of the business.
Non-current assets located in the United Kingdom total £33m (FY2019: £16m). Significant non-current assets are held in the United States of America totalling £732m (FY2019: £762m).
29 Cash-flowCash-flow from operating activities
Year ended 31 July 2020 Year ended 31 July 2019
Headline £m
Non-headline £m
Total £m
Headline £m
Non-headline £m
Total £m
Operating profit – continuing operations 327 (86) 241 427 (101) 326– discontinued operations 184 (23) 161 147 4 151
Amortisation of intangible assets 13 57 70 36 45 81Impairment of intangible assets 12 – 12 – – –Depreciation of property, plant and equipment 41 – 41 56 – 56Depreciation of right of use assets 33 – 33 – – –Loss on disposal of property, plant and equipment 3 – 3 4 – 4Profit on disposal of businesses – (1) (1) – (18) (18)Share-based payment expense 10 – 10 15 – 15Retirement benefits* 8 (41) (33) 7 (6) 1Decrease/(increase) in inventories (73) – (73) (52) 4 (48)Decrease/(increase) in trade and other receivables 76 4 80 (105) – (105)Increase/(decrease) in trade and other payables 49 (2) 47 60 6 66Increase/(decrease) in provisions 1 – 1 (7) (19) (26)Cash generated from operations 684 (92) 592 588 (85) 503Interest paid (57) – (57) (64) – (64)Interest received 7 – 7 6 – 6Tax paid (113) – (113) (99) – (99)Net cash inflow from operating activities 521 (92) 429 431 (85) 346 – continuing operations 356 (68) 288 277 (80) 197 – discontinued operations 165 (24) 141 154 (5) 149
* The retirement benefits non-headline operating cash-flows principally relate to employer contributions to legacy defined benefit and post-retirement healthcare plans.
4
2 0 1S M I T H S G R O U P P L C A N N U A L R E P O R T F Y 2 0 2 0

29 Cash-flow continuedHeadline cash measuresThe Group measure of headline operating cash includes capital expenditure supporting organic growth and excludes interest and tax.
Year ended 31 July 2020 Year ended 31 July 2019
Headline £m
Non-headline £m
Total £m
Headline £m
Non-headline £m
Total £m
Net cash inflow from operating activities 521 (92) 429 431 (85) 346Include:Expenditure on capitalised development, other intangible assets and property, plant and equipment (110) – (110) (118) – (118)Repayment of lease liabilities (47) – (47) – – –Disposals of property, plant and equipment 1 – 1 4 – 4Investment in financial assets relating to operating activities and pensions financing outstanding at the balance sheet date – – – 2 – 2Free cash-flow 273 234Exclude:Investment in financial assets relating to operating activities and pensions financing outstanding at the balance sheet date – – – (2) – (2)Repayment of lease liabilities 47 47Interest paid 57 – 57 64 – 64Interest received (7) – (7) (6) – (6)Tax paid 113 – 113 99 – 99
Operating cash-flow 575 (92) 483 474 (85) 389
Headline cash conversionHeadline operating cash conversion for the total Group is calculated as follows:
Year ended 31 July 2020
£m
Year ended 31 July 2019
£m
Headline operating profit – including discontinued operations 511 574Depreciation and amortisation of held for distribution assets (45) –
Pro-forma profit including depreciation and amortisation on held for distribution assets 466 574
Headline operating cash-flow 575 474
Headline operating cash conversion 123% 83%
Reconciliation of free cash-flow to total movement in cash and cash-equivalentsYear ended
31 July 2020 £m
Year ended 31 July 2019
£m
Free cash-flow 273 234Acquisition of businesses (36) (277)Disposal of businesses and discontinued operations 1 22Other net cash-flows used in financing activities (note: repayment of lease liabilities is included in free cash-flow) (141) (391)Net increase/(decrease) in cash and cash equivalents 97 (412)
30 Alternative performance measuresThe Group uses several alternative performance measures (‘APMs’) in order to provide additional useful information on underlying trends and the performance and position of the Group. APMs are non-GAAP and not defined by IFRS; therefore they may not be directly comparable with other companies’ APMs and should not be considered a substitute for IFRS measures.
The Group uses these measures, which are common across the industry, for planning and reporting purposes. The measures are also used in discussions with the investment analyst community and by credit rating agencies.
We have identified and defined the following key measures which are used within the business by management to assess the performance of the Group’s businesses:
Term Definition and purpose
Capital employed Capital employed is a non-statutory measure of invested resources. It comprises statutory net assets and is adjusted to add goodwill recognised directly in reserves in respect of subsidiaries acquired before 1 August 1998 and eliminate post-retirement benefit assets and liabilities and non-headline litigation provisions related to John Crane, Inc. and Titeflex Corporation, both net of deferred tax, and net debt. It is used to monitor capital allocation within the Group. See below for a reconciliation from net assets to capital employed.
Capital expenditure Comprises additions to property, plant and equipment, capitalised development and other intangible assets, excluding assets acquired through business combinations.
N O T E S T O T H E A C C O U N T SF I N A N C I A L S T A T E M E N T S
2 0 2 S M I T H S G R O U P P L C A N N U A L R E P O R T F Y 2 0 2 0

Term Definition and purpose
Headline cash conversion ratio
Comprises cash flow from operations before non-headline items as a percentage of headline operating profit.This measure is used to show the proportion of headline operating profit converted into cash flow from operations before investment, finance costs, non-headline items and taxation. The calculation is shown in note 29.
Dividend cover – headline Dividend cover is the ratio of headline earnings per share, see note 5, to dividend per share, see note 25.
Divisional headline operating profit ('DHOP')
DHOP comprises divisional earnings before central costs, finance costs and taxation. DHOP is used to monitor divisional performance. A reconciliation of DHOP to operating profit is shown in note 1.
Free cash-flow Free cash-flow is calculated by adjusting the net cash inflow from operating activities to include capital expenditure, the repayment of lease liabilities and proceeds from the disposal of property, plant and equipment.The measure shows cash generated by the Group before discretionary expenditure on acquisitions and returns to shareholders. A reconciliation of free cash-flow is shown in note 29.
Gross debt Gross debt is total borrowings (bank, bonds and lease liabilities). It is used to provide an indication of the Group's overall level of indebtedness.
Gross vitality Gross vitality is calculated as the percentage of revenue over the last 12 months derived from new products and services launched in the last three years.
Headline The Group has defined a 'headline' measure of performance that excludes material non-recurring items or items considered non-operational/trading in nature. Items excluded from headline are referred to as non-headline items. This measure is used by the Group to measure and monitor performance excluding material non-recurring items or items considered non-operational. See note 3 for an analysis of non-headline items.
Headline EBITDA EBITDA is a widely used profit measure, not defined by IFRS, being earnings before interest, taxation, depreciation and amortisation. A reconciliation of headline operating profit to headline EBITDA is shown in the note below.
Net debt Net debt is total borrowings (bank, bonds and lease liabilities) less cash balances and derivatives used to manage the interest rate risk and currency profile of the debt. This measure is used to provide an indication of the Group's overall level of indebtedness and is widely used by investors and credit rating agencies. See note 18 for an analysis of net debt.
Non-headline The Group has defined a 'headline' measure of performance that excludes material non-recurring items or items considered non-operational/trading in nature. Items excluded from headline are referred to as non-headline items. This is used by the Group to measure and monitor material non-recurring items or items considered non-operational. See note 3 for an analysis of non-headline items.
Operating cash-flow Comprises free cash-flow and excludes cash-flows relating to interest and taxation. The measure shows how cash is generated from operations in the Group. A reconciliation of operating cash-flow is shown in note 29.
Operating profit Operating profit is earnings before finance costs and tax. A reconciliation of operating profit to profit before tax is shown on the income statement on page 144. This common measure is used by the Group to measure and monitor performance.
Headline operating profit excluding restructuring and write-downs
Headline operating profit is adjusted for strategic restructuring programme costs and write-downs. See note 2 for a reconciliation.
Ratio of capital expenditure to depreciation and amortisation
Represents the amount of capital expenditure as a proportion of the depreciation and amortisation charge for the period. This measure shows the level of reinvestment into operations.
Return on capital employed ('ROCE')
Smiths ROCE is calculated over a rolling 12-month period and is the percentage that headline operating profit represents of the monthly average capital employed on a rolling 12-month basis. This measure of return on invested resources is used to monitor performance and capital allocation within the Group. See below for Group ROCE and note 1 for divisional headline operating profit and divisional capital employed.
Total Group stock turns
Total Group stock turns during the year is calculated as the last 12 month cost of sales divided by the 12 month average inventory. This measure is included as a key performance indicator of the Group to measure the efficiency of the Group
Underlying Underlying measures are calculated by excluding the effects of foreign exchange, disposals and acquisitions, strategic restructuring programme costs and write-downs (see note 2), and to include depreciation and amortisation charges for Smiths Medical. Underlying measures are used by the Group to monitor performance.
Working capital Working capital is calculated as the sum of the 12-month rolling average of inventory, trade receivables, contract assets, trade payables and contract liabilities.
4
2 0 3S M I T H S G R O U P P L C A N N U A L R E P O R T F Y 2 0 2 0

30 Alternative performance measures continuedCapital employed
Capital employed is a non-statutory measure of invested resources. It comprises statutory net assets adjusted to add goodwill recognised directly in reserves in respect of subsidiaries acquired before 1 August 1998 of £787m (FY2019: £787m) and eliminate post-retirement benefit assets and liabilities and non-headline litigation provisions related to John Crane, Inc. and Titeflex Corporation, both net of related tax, and net debt.
Notes31 July 2020
£m31 July 2019
£m
Net assets 2,394 2,381Adjust for: Goodwill recognised directly in reserves 787 787Post-retirement benefit assets and liabilities 8 (372) (311)Tax related to post-retirement benefit assets and liabilities 70 55John Crane, Inc. litigation provisions and related tax 23 172 187Titeflex Corporation litigation provisions and related tax 23 50 56Net debt (including £28m of net debt in discontinued operations (FY2019: £23m cash)) 18 1,141 1,152Derivatives managing interest rate and currency profile of the debt in the prior year* – 45
Capital employed 4,242 4,352
* The Group's definition of net debt has been updated in FY2020 to include the fair value of derivatives used for the management of interest rate and currency profile. The calculation basis for capital employed in FY2019 has not been represented for this change.
Return on capital employed
Notes
Year ended 31 July 2020
£m
Year ended 31 July 2019
£m
Headline operating profit for previous 12 months – including discontinued operations 511 574Average capital employed 1 4,315 3,972
ROCE 11.8% 14.4%
Credit metrics – total Group including discontinued operationsSmiths Group monitors the ratio of net debt to headline EBITDA as part of its management of credit ratings, see note 26 for details. This ratio is presented for the whole Group, including discontinued operations, and is calculated as follows:
Headline earnings before interest, tax, depreciation and amortisation (headline EBITDA) - total Group including discontinued operations
Notes
Year ended 31 July 2020
£m
Year ended 31 July 2019
£m
Headline operating profit 327 427Include: – headline operating profit of discontinued operations 28 184 147Exclude: – depreciation of property, plant and equipment 12 41 56- depreciation of right of use assets 13 33 –– amortisation and impairment of development costs 10 18 23– amortisation of software, patents and intellectual property 10 7 13
Headline EBITDA 610 666
£1m of software amortisation was charged to restructuring projects and treated as a non-headline cost.
Ratio of net debt to headline EBITDA – total Group including discontinued operations
Notes
Year ended 31 July 2020
£m
Year ended 31 July 2019
£m
Headline EBITDA 610 666Net debt – incl. £20m of net cash and £48m lease liabilities in discontinued operations (FY2019: £23m cash) 18 1,141 1,197
Ratio of net debt to headline EBITDA 1.9 1.8
31 Post Balance Sheet EventsDetails of the delayed interim dividend and proposed final dividend announced since the end of the reporting period are given in note 25.
In August 2020, Smiths Detection completed the acquisition of PathSensors Inc, which complements and accelerates its biological capability to detect pathogens for broad end-market applications.
N O T E S T O T H E A C C O U N T SF I N A N C I A L S T A T E M E N T S
2 0 4 S M I T H S G R O U P P L C A N N U A L R E P O R T F Y 2 0 2 0

Unaudited Group financial record 2016-2020
The headline income statement metrics shown below for the years ended 31 July 2018, 2017 and 2016 have been represented to show the results of Smiths Medical as a discontinued operation.
Year ended 31 July 2020
£m
Year ended 31 July 2019
£m
Year ended 31 July 2018
£m
Year ended 31 July 2017
£m
Year ended 31 July 2016
£m
Income statement metrics – headline*Continuing operations Revenue 2,548 2,498 2,328 2,329 2,075
Headline operating profit 327 427 388 355 292Headline profit before tax 278 376 333 296 234
Discontinued operations Revenue 918 874 869 951 874Headline operating profit 184 147 156 194 174Headline profit before tax 180 144 154 192 173
Income statement metrics – statutory**Revenue 2,548 2,498 2,328 3,280 2,949Operating profit 241 326 342 674 387Profit before taxation 133 304 287 601 346Profit for the year 267 227 279 572 261
Balance sheet metrics***Net debt (1,141) (1,197) (893) (967) (978)Shareholders’ equity 2,373 2,360 2,272 2,089 1,646Average capital employed 4,315 3,972 3,735 3,639 3,324
Ratios***Headline operating profit: revenue (%) 14.7 17.0 17.0 18.0 17.3Headline effective tax rate (%) 26.2 25.9 25.8 26.5 25.0 Return on capital employed (%) 11.8 14.4 14.6 16.2 15.3Return on shareholders’ funds (%) 10.8 12.3 12.1 14.5 14.3
Cash-flow metrics***Headline operating cash 575 474 538 695 520Headline operating cash conversion (%) 123 83 99 118 102
Free cash-flow 273 234 302 370 243Free cash-flow per share (p) 68.9 59.1 76.3 93.6 61.1
Earnings per share***Headline earnings per share (p) 84.8 96.8 90.7 97.6 85.2
Dividends and dividend cover***Pence per share 35.00 45.90 44.55 43.25 42.00Headline dividend cover 2.4 2.1 2.0 2.3 2.0
Number of employees (000s)***United Kingdom 1.6 1.6 1.5 1.5 1.5Overseas 21.5 20.5 20.2 20.4 20.5
23.1 22.0 21.7 21.9 22.0
* The headline income statement metrics in the above five year record have been presented to reflect the reclassification of the Smiths Medical business as a discontinued operation and the Group's current accounting policy of including restructuring and pension administration costs within headline profit. The discontinued operations comparatives for the year ended 31 July 2018 have also been restated for the adoption of IFRS 15.
** The statutory income statement metrics are presented based on continuing operations for both the current and comparative year. The years ended 31 July 2017 and 31 July 2016 are presented as originally published.
*** Balance sheet metrics, ratios, cash-flow metrics, earnings per share, dividend cover and number of employees are presented based on both continuing and discontinued operations for all years.
4
2 0 5S M I T H S G R O U P P L C A N N U A L R E P O R T F Y 2 0 2 0
U N A U D I T E D F I V E - Y E A R G R O U P F I N A N C I A L R E C O R D

Unaudited supplementary consolidated income statement – US dollar translation
Year ended 31 July 2020 Year ended 31 July 2019
Headline $m
Non-headline (note 3)
$mTotal
$mHeadline
$m
Non-headline (note 3)
$mTotal
$m
CONTINUING OPERATIONSRevenue 3,216 – 3,216 3,218 – 3,218Cost of sales (1,968) – (1,968) (1,841) – (1,841)
Gross profit 1,248 – 1,248 1,377 – 1,377Sales and distribution costs (341) – (341) (344) – (344)Administrative expenses (495) (108) (603) (483) (130) (613)OPERATING PROFIT/(LOSS) 412 (108) 304 550 (130) 420
Interest receivable 8 – 8 14 – 14Interest payable (69) – (69) (80) – (80)Other financing gains/(losses) – (83) (83) – 23 23Other finance charges – retirement benefits – 9 9 – 14 14
Finance costs (61) (74) (135) (66) 37 (29)
Continuing operations – profit before taxation 351 (182) 169 484 (93) 391
Taxation (100) 16 (84) (133) (76) (209)
Continuing operations – profit for the year 251 (166) 85 351 (169) 182
Discontinued operationsProfit on discontinued operations 175 77 252 144 (35) 109PROFIT FOR THE YEAR 426 (89) 337 495 (204) 291
Attributable to Smiths Group shareholders – continuing operations 248 (166) 82 348 (169) 179Smiths Group shareholders – discontinued operations 175 77 252 144 (35) 109Non-controlling interests 3 – 3 3 – 3
426 (89) 337 495 (204) 291
EARNINGS PER SHAREBasic 84.4c 73.2cBasic – continuing 20.7c 45.5cDiluted 83.9c 72.8cDiluted – continuing 20.6c 45.3c
Assets and liabilities have been translated into US dollars at the exchange rate at the date of that balance sheet and income, expenses and cash-flows are translated at average exchange rates for the period. This reflects the accounting approach that Smiths Group plc would use if the Group moved to reporting in US dollars without making any changes to its Group structure or financing arrangements.
U N A U D I T E D U S D O L L A R P R I M A R Y S T A T E M E N T SF I N A N C I A L S T A T E M E N T S
2 0 6 S M I T H S G R O U P P L C A N N U A L R E P O R T F Y 2 0 2 0

Unaudited supplementary consolidated statement of comprehensive income – US dollar translation
Year ended 31 July 2020
$m
Year ended 31 July 2019
$m
PROFIT FOR THE YEAR 337 291
Other comprehensive income: Re-measurement of post-retirement benefits assets and obligations 24 (98) Taxation (3) 17
Other comprehensive income and expenditure which will not be reclassified to the consolidated income statement 21 (81)
Other comprehensive income which will be reclassified and reclassifications: Exchange losses/(gains) (48) 30 Fair value gains/(losses) and reclassification adjustments: – on financial asset at fair value through other comprehensive income 2 2 – deferred in the year on cash-flow and net investment hedges 92 (99) – reclassified to income statement on cash-flow and net investment hedges (2) (5)Total other comprehensive income 65 (153)Total comprehensive income 402 138
Attributable to: Smiths Group shareholders 398 135Non-controlling interests 4 3
402 138
4
2 0 7S M I T H S G R O U P P L C A N N U A L R E P O R T F Y 2 0 2 0

Unaudited supplementary consolidated balance sheet – US dollar translation
31 July 2020 $m
31 July 2019 $m
NON-CURRENT ASSETSIntangible assets 2,049 2,057Property, plant and equipment 285 283Right of use assets 123 –Financial assets – other investments 25 23Retirement benefit assets 676 573Deferred tax assets 134 140Trade and other receivables 68 64Financial derivatives 107 57
3,467 3,197CURRENT ASSETSInventories 584 510Current tax receivable 60 14Trade and other receivables 820 933Cash and cash equivalents 480 353Financial derivatives 4 4
Assets held for distribution to owners 1,675 1,484
3,623 3,298
TOTAL ASSETS 7,090 6,495
CURRENT LIABILITIESFinancial liabilities– borrowings (13) (11)– lease liabilities (40) –– financial derivatives (4) (7)Provisions for liabilities and charges (72) (80)Trade and other payables (698) (695)Current tax payable (95) (69)
Liabilities held for distribution to owners (388) (259)
(1,310) (1,121)
NON-CURRENT LIABILITIESFinancial liabilities– borrowings (1,906) (1,831)– lease liabilities (85) –– financial derivatives (1) (1)Provisions for liabilities and charges (361) (349)Retirement benefit obligations (182) (186)Current tax payable (7) (9)Deferred tax liabilities (35) (55)Trade and other payables (67) (36)
(2,644) (2,467)TOTAL LIABILITIES (3,954) (3,588)
NET ASSETS 3,136 2,907
SHAREHOLDERS’ EQUITYShare capital 195 181Share premium account 472 440Capital redemption reserve 8 7Revaluation reserve 3 1Merger reserve 308 287Retained earnings 2,534 2,434Hedge reserve (413) (468)
Total shareholders’ equity 3,107 2,882Non-controlling interest equity 29 25
TOTAL EQUITY 3,136 2,907
U N A U D I T E D U S D O L L A R P R I M A R Y S T A T E M E N T SF I N A N C I A L S T A T E M E N T S
2 0 8 S M I T H S G R O U P P L C A N N U A L R E P O R T F Y 2 0 2 0

Unaudited supplementary consolidated statement of changes in equity – US dollar translation
Share capital and share
premium $m
Other reserves
$m
Retained earnings
$m
Hedge reserve
$m
Equity shareholders’
funds $m
Non-controlling
interest $m
Total equity
$m
At 31 July 2019 621 295 2,434 (468) 2,882 25 2,907
Impact of adopting IFRS 16 – – (1) – (1) – (1)Impact of adopting IFRIC 23 – – (5) – (5) – (5) Profit for the year – – 334 – 334 3 337 Other comprehensive income: – re-measurement of post-retirement benefits assets/obligations and tax - - 21 – 21 – 21 – exchange (losses)/gains net of recycling 43 24 (83) (34) (50) 2 (48) – fair value gains/(losses) and related tax – – 3 89 92 – 92
TOTAL COMPREHENSIVE INCOME FOR THE YEAR 43 24 275 55 397 5 402
Transactions relating to ownership interests: Exercises of share options 3 – – – 3 – 3Purchase of own shares – – (23) – (23) – (23)Dividends:– equity shareholders – – (159) – (159) – (159)– non-controlling interests – – – – – (1) (1)Share-based payment – – 13 – 13 – 13
At 31 July 2020 667 319 2,534 (413) 3,107 29 3,136
Share capital and share
premium $m
Other reserves
$m
Retained earnings
$m
Hedge reserve
$m
Equity shareholders’
funds $m
Non-controlling
interest $m
Total equity
$m
At 31 July 2018 663 318 2,398 (397) 2,982 21 3,003
Profit for the year – – 289 – 289 2 291 Other comprehensive income: – re-measurement of post-retirement benefits assets/obligations and tax – – (81) – (81) (81) – exchange (losses)/gains (44) (23) 63 33 29 1 30 – fair value gains/(losses) and related tax – – 2 (104) (102) – (102)
TOTAL COMPREHENSIVE INCOME FOR THE YEAR (44) (23) 273 (71) 135 3 138
Transactions relating to ownership interests: Exercises of share options 2 – – – 2 – 2 Purchase of own shares – – (24) – (24) – (24)Dividends:– equity shareholders – – (230) – (230) – (230)– non-controlling interests – – – – - (1) (1)Receipt of capital from non-controlling interest – – – – – 2 2 Share-based payment – – 17 – 17 – 17
At 31 July 2019 621 295 2,434 (468) 2,882 25 2,907
4
2 0 9S M I T H S G R O U P P L C A N N U A L R E P O R T F Y 2 0 2 0

Unaudited supplementary consolidated cash-flow statement – US dollar translation
Year ended 31 July 2020
$m
Year ended 31 July 2019
$m
Net cash inflow from operating activities 541 445Cash-flows from investing activitiesExpenditure on capitalised development (44) (35)Expenditure on other intangible assets (18) (15)Purchases of property, plant and equipment (77) (102)Disposals of property, plant and equipment 1 5Capital returned by/(investment in) financial assets – 3Acquisition of businesses (45) (357)Disposals of businesses – discontinued operations 1 39
Tax paid on disposal of business – discontinued operations – (10)
Net cash-flow used in investing activities (182) (472)
Cash-flows from financing activitiesProceeds from exercise of share options 3 3Purchase of own shares (23) (24)Settlement of cash settled options – (3)Dividends paid to equity shareholders (159) (230)Cash inflow from matured derivative financial instruments 1 –Reduction and repayment of borrowings – (250)
Reduction and repayment of lease liabilities (59) –
Net cash-flow used in financing activities (237) (504)
Net decrease in cash and cash equivalents 122 (531)Cash and cash equivalents at beginning of year 353 941Cash held in disposal group 8 (33)Exchange differences (3) (24)
Cash and cash equivalents at end of year 480 353
Cash and cash equivalents at end of year comprise:– cash at bank and in hand 227 187– short-term deposits 253 166
480 353
U N A U D I T E D U S D O L L A R P R I M A R Y S T A T E M E N T SF I N A N C I A L S T A T E M E N T S
2 1 0 S M I T H S G R O U P P L C A N N U A L R E P O R T F Y 2 0 2 0

Unaudited Group US dollar financial record 2016-2020
The headline income statement metrics shown below for the years ended 31 July 2018, 2017 and 2016 have been represented to show the results of Smiths Medical as a discontinued operation.
Year ended 31 July 2020
$m
Year ended 31 July 2019
$m
Year ended 31 July 2018
$m
Year ended 31 July 2017
$m
Year ended 31 July 2016
$m
Income statement metrics – headline*
Continuing operations Revenue 3,216 3,218 3,139 2,952 3,036
Headline operating profit 412 550 523 450 428
Headline profit before tax 351 484 449 375 343
Discontinued operations Revenue 1,159 1,126 1,172 1,206 1,279
Headline operating profit 232 189 210 246 255
Headline profit before tax 227 185 208 243 254
Income statement metrics – statutory**Revenue 3,216 3,218 3,139 4,158 4,315Operating profit 304 420 461 855 567Profit before taxation 169 391 386 762 506Profit for the year 337 291 375 715 382
Balance sheet metrics***Net debt (1,495) (1,462) (1,172) (1,275) (1,294)Shareholders’ equity 3,107 2,882 2,982 2,756 2,178Average capital employed 5,652 4,852 4,903 4,800 4,864
Ratios***Headline operating profit: revenue (%) 14.7 17.0 17.0 18.0 17.3Headline effective tax rate (%) 26.2 25.9 25.8 26.5 25.0Return on capital employed (%) 11.8 14.4 14.6 16.2 15.3Return on shareholders’ funds (%) 10.6 12.1 12.5 14.2 14.6
Cash-flow metrics***Headline operating cash 726 611 725 881 760Headline operating cash conversion (%) 123 83 99 118 102
Free cash-flow 345 301 407 469 356Free cash-flow per share (c) 68.9 76.1 102.9 118.6 89.4
Earnings per share***Headline earnings per share (c) 107.0 124.7 122.3 123.6 124.6
Dividends and dividend cover***Cents per share (c) 44.2 59.1 60.1 54.8 61.5Headline dividend cover 2.4 2.1 2.0 2.3 2.0
Number of employees (000s)***United States of America 7.3 7.2 7.1 7.7 7.9Rest of World 15.8 14.8 14.6 14.2 14.1
23.1 22.0 21.7 21.9 22.0
* The headline income statement metrics in the above five year record have been presented to reflect the reclassification of the Smiths Medical business as a discontinued operation and the Group's current accounting policy of including restructuring and pension administration costs within headline profit. The discontinued operations comparatives for the year ended 31 July 2018 have also been restated for the adoption of IFRS 15.
** The statutory income statement metrics are presented based on continuing operations for both the current and comparative year. The year ended 31 July 2017 and prior years are presented as originally published.
*** Balance sheet metrics, ratios, cash-flow metrics, earnings per share, dividend cover and number of employees are presented based on both continuing and discontinued operations for all years.
4
2 1 1S M I T H S G R O U P P L C A N N U A L R E P O R T F Y 2 0 2 0

Company balance sheet
Notes31 July 2020
£m31 July 2019
£m
Non-current assetsRight of use assets 2 7 –Investments and advances 3 3,273 3,519Financial assets 4 6 6Retirement benefit assets 11 516 469Debtors 6 – 1Financial derivatives 9 80 45
Total non-current assets 3,882 4,040
Current assetsDebtors 6 70 67Cash at bank and on deposit 8 176 90Financial derivatives 9 – 4
Total current assets 246 161
Current liabilitiesCreditors 7 (110) (76)Lease liabilities 8 (1) –Financial derivatives 9 – (2)
Net current assets 135 83
Total assets less current liabilities 4,017 4,123
Non-current liabilitiesBorrowings 8 (1,429) (1,461)Lease liabilities 8 (6) –Provisions for liabilities and charges 10 (2) (2)Retirement benefit liabilities 11 (60) (61)Deferred tax liabilities 5 (11) –Financial derivatives 9 – (2)
Total non-current liabilities (1,508) (1,526)
Net assets 2,509 2,597
Capital and reservesCalled up share capital 12 149 148Share premium account 12 361 360Capital redemption reserve 12 6 6Other reserves 12 181 181Profit and loss account 12 1,812 1,902
Shareholders’ equity 2,509 2,597
The Company's profit for the period was £32m (FY2019:£403m).
The accounts on pages 212 to 219 were approved by the Board of Directors on 23 September 2020 and were signed on its behalf by:
Andy Reynolds Smith John ShipseyCHIEF EXECUTIVE OFFICER CHIEF FINANCIAL OFFICER
Smiths Group plc – registered number 137013
S M I T H S G R O U P P L C C O M P A N Y A C C O U N T SF I N A N C I A L S T A T E M E N T S
2 1 2 S M I T H S G R O U P P L C A N N U A L R E P O R T F Y 2 0 2 0

Company statement of changes in equity
Share capital
£m
Share premium
£m
Capital redemption
reserve £m
Other reserves
£m
Retained profit
£m
Shareholders’ equity
£m
At 31 July 2019 148 360 6 181 1,902 2,597
Profit for the year – – – – 32 32
Other comprehensive income: – actuarial loss on retirement benefits – – – – 15 15 – taxation recognised on retirement benefits – – – – (4) (4)
Total comprehensive income for the year – – – – 43 43
Transactions with owners: Exercise of share options 1 1 – – – 2 Purchase of own shares – – – – (18) (18) Dividends paid to equity shareholders – – – – (126) (126) Share-based payment – – – – 11 11
Total transactions with owners recognised in equity 1 1 – – (133) (131)
At 31 July 2020 149 361 6 181 1,812 2,509
Share capital
£m
Share premium
£m
Capital redemption
reserve £m
Other reserves
£m
Retained profit
£m
Shareholders’ equity
£m
At 31 July 2018 148 358 6 181 1,738 2,431
Profit for the year – – – – 403 403
Other comprehensive income: – actuarial loss on retirement benefits – – – – (66) (66) – taxation recognised on retirement benefits – – – – 11 11
Total comprehensive income for the year – – – – 348 348
Transactions with owners: Exercise of share options – 2 – – – 2 Purchase of own shares – – – – (19) (19) Dividends paid to equity shareholders – – – – (178) (178) Share-based payment – – – – 13 13
Total transactions with owners recognised in equity – 2 – – (184) (182)
At 31 July 2019 148 360 6 181 1,902 2,597
4
2 1 3S M I T H S G R O U P P L C A N N U A L R E P O R T F Y 2 0 2 0

Company accounting policies
Basis of preparationThe accounts have been prepared in accordance with the Companies Act 2006 and Financial Reporting Standard 101, “Reduced Disclosure Framework” (FRS 101).
These accounts have been prepared on a going concern basis and under the historical cost convention modified to include revaluation of certain financial instruments, share options and pension assets and liabilities held at fair value.
As permitted by Section 408(3) of the Companies Act 2006, the Company’s income statement and statement of comprehensive income have not been presented. As permitted by Section 408(2), information about the Company’s employee numbers and costs is not presented.
Exemptions from the requirements of IFRS applied in accordance with FRS 101The following exemptions from the requirements of IFRS have been applied in the preparation of these financial statements, in accordance with FRS 101:
– Paragraphs 45(b) and 46 to 52 of IFRS 2, ‘Share-based payment’ (details of the number and weighted-average exercise prices of share options, and how the fair value of goods or services received was determined)
– IFRS 7, ‘Financial Instruments: Disclosures’
– Paragraphs 91 to 99 of IFRS 13, ‘Fair value measurement’ (disclosure of valuation techniques and inputs used for fair value measurement of assets and liabilities).
– Paragraph 38 of IAS 1, ‘Presentation of financial statements’ comparative information requirements in respect of:
› paragraph 79(a)(iv) of IAS 1; › paragraph 73(e) of IAS 16 ‘Property, plant and equipment’;
– The following paragraphs of IAS 1, ‘Presentation of financial statements’
› 10(d) (statement of cash flows), › 16 (statement of compliance with all IFRS), › 38A (requirement for minimum of two primary statements, including cash flow statements), › 38B-D (additional comparative information), › 111 (cash flow statement information), and › 134-136 (capital management disclosures)
– IAS 7, ‘Statement of cash flows’
– Paragraph 30 and 31 of IAS 8 ‘Accounting policies, changes in accounting estimates and errors’ (requirement for the disclosure of information when an entity has not applied a new IFRS that has been issued but is not yet effective)
– Paragraph 17 of IAS 24, ‘Related party disclosures’ (key management compensation)
– The requirements in IAS 24, ‘Related party disclosures’ to disclose related party transactions entered into between two or more members of a group.
– The requirements of paragraphs 52 and 58 of IFRS 16 Leases
Significant judgements, key assumptions and estimatesThe preparation of the accounts in conformity with generally accepted accounting principles requires management to make estimates and assumptions that affect the reported amounts of assets and liabilities and disclosure of contingent assets and liabilities at the date of the accounts and the reported amounts of revenues and expenses during the reporting period. Actual results may differ from these estimates. The key estimates and assumptions used in these parent company financial statements are set out below.
Taxation
The Company has recognised deferred tax assets of £72m (FY2019: £68m) relating to revenue losses brought forward. The recognition of these assets is dependent on the ability to recover them against the unwind of other tax positions and forecast UK taxable profits of the tax group. The treatment of these assets is reviewed regularly. Further detail on the Company’s deferred taxation position is included in note 5.
Retirement benefits
The financial statements include costs in relation to, and provision for, retirement benefit obligations. The costs and the present value of any related pension assets and liabilities depend on such factors as life expectancy of the members, the returns that plan assets generate and the discount rate used to calculate the present value of the liabilities. The Company uses previous experience and independent actuarial advice to select the values of critical estimates. The estimates, and the effect of variances in key estimates, are disclosed in note 8 to the consolidated accounts.
At 31 July 2020 there is a retirement benefit asset of £516m (FY2019: £469m) which arises from the rights of the employers to recover the surplus at the end of the life of the scheme. If the pension schemes were wound up while they still had members, the schemes would need to buy out the benefits of all members. The buyouts would cost significantly more than the present value of the scheme liabilities calculated in accordance with IAS 19: Employee benefits.
Foreign currenciesForeign currency transactions are recorded at the exchange rate ruling on the date of transaction. Foreign exchange gains and losses resulting from the settlement of such transactions, and from the retranslation at year-end exchange rates of monetary assets and liabilities denominated in foreign currencies, are recognised in the profit and loss account.
S M I T H S G R O U P P L C C O M P A N Y A C C O U N T SF I N A N C I A L S T A T E M E N T S
2 1 4 S M I T H S G R O U P P L C A N N U A L R E P O R T F Y 2 0 2 0

Property, plant and equipmentDepreciation is provided at rates estimated to write off the relevant assets by equal annual amounts over their expected useful lives. In general, the rates used are: Freehold and long leasehold property – 2%; Short leasehold property – over the period of the lease; Plant, machinery, etc. – 10% to 20%; Fixtures, fittings, tools and other equipment – 10% to 33%.
LeasesThe Company adopted IFRS 16 – Leases with effect from 1 August 2019.
At the commencement date of the lease, the Company recognises lease liabilities measured at the present value of lease payments to be made over the lease term, which includes periods covered by renewal options the Company is reasonably certain to exercise. In calculating the present value of lease payments, the Company uses the incremental borrowing rate at the lease commencement date.
The Company recognises right of use assets at the commencement date of the lease. Right of use assets are measured at cost including the amount of lease liabilities recognised and initial direct costs incurred, less any incentives granted by the lessor. Right of use assets are subject to impairment and are depreciated over the shorter of the lease term and the useful life of the right of use asset.
The Company has a buildings lease with a term of 8 years. Other leases with lease terms of 12 months or less and leases of office equipment with low value (typically below £5,000) are recognised as an expense on a straight-line basis over the lease term with the Company having applied ‘short-term lease’ and ‘lease of low-value assets’ recognition exemptions.
Investments in and loans to Group companiesThe Company’s investments in shares in Group companies are stated at cost less provision for impairment. Any impairment is charged to the profit and loss account as it arises.
The recoverability of intercompany loans is assessed applying the methodology of IFRS 9 by looking at the credit quality of the subsidiary and any support available to the entity. These calculations require the use of estimates including projected future cash-flows and other future events. The application of the expected credit loss model has not had a material impact on the Company's loan receivables provisioning position.
Financial instrumentsThe policies disclosed in the Group accounting policies on pages 151 to 157 for recognition, measurement and presentation of financial instruments are applied in the Company accounts.
TaxationDeferred tax is provided using the balance sheet liability method. A deferred tax asset is recognised where it is probable that future taxable income will be sufficient to utilise the available relief.
Deferred tax is provided on temporary differences arising on investments in subsidiaries, except where the timing of the reversal of the temporary difference is controlled by the Company and it is probable that the temporary difference will not reverse in the foreseeable future.
ProvisionsProvisions for disposal indemnities, restructuring costs, vacant leasehold property and legal claims are recognised when: the Company has a legal or constructive obligation as a result of a past event; it is probable that an outflow of resources will be required to settle the obligation; and the amount has been reliably estimated. Provisions are not recognised for future operating losses.
Provisions are discounted where the time value of money is material.
Post-retirement benefitsThe Company has both defined benefit and defined contribution plans. The policies disclosed in the Group accounting policies on pages 151 to 157 for recognition, measurement and presentation of post-retirement benefits are applied in the Company accounts. Note 8 to the consolidated accounts explains the valuation basis for the Company's post-retirement benefit schemes assets and liabilities.
Share-based paymentThe Company operates a number of equity-settled and cash-settled share-based compensation plans.
The fair value of the shares or share options granted is recognised over the vesting period to reflect the value of the employee services received. The charge relating to grants to employees of the Company is recognised as an expense in the profit and loss account and the charge for grants to employees of other group companies is recognised as an investment in the relevant subsidiary.
The fair value of options granted, excluding the impact of any non-market vesting conditions, is calculated using established option pricing models, principally binomial models. The probability of meeting non-market vesting conditions, which include profitability targets, is used to estimate the number of share options that are likely to vest.
For cash-settled share-based payment schemes, a liability is recognised based on the fair value of the payment earned by the balance sheet date. For equity-settled share-based payment schemes, the corresponding credit is recognised directly in reserves.
DividendsDividends are recognised as a liability in the period in which they are authorised. The interim dividend is recognised when it is paid and the final dividend is recognised when it has been approved by shareholders at the Annual General Meeting.
4
2 1 5S M I T H S G R O U P P L C A N N U A L R E P O R T F Y 2 0 2 0

Notes to the Company accounts
1 Audit feeThe audit fee paid to KPMG LLP for the Parent Company was £0.1m (FY2019: £0.1m paid to PricewaterhouseCoopers LLP).
2 Right of use assetsProperties
£m
Cost or valuationRight of use assets on transition 8
As at 31 July 2020 8DepreciationCharge for the year 1
At 31 July 2020 1
Net book value at 31 July 2020 7
3 Investments and loans due from subsidiariesShares in
subsidiary undertakings
£m
Loans due from
subsidiaries £m
Total £m
Cost or valuationAt 31 July 2018 2,414 844 3,258Foreign exchange rate movements – 76 76Contribution through share options 8 – 8Disposals (8) – (8)Increase in advances due from subsidiaries – 191 191
At 31 July 2019 2,414 1,111 3,525
Foreign exchange rate movements – (61) (61)Contribution through share options 7 – 7Disposals (11) – (11)Decrease in advances due from subsidiaries – (181) (181)
At 31 July 2020 2,410 869 3,279
Provision for impairment
At 31 July 2018, 31 July 2019 and 31 July 2020 5 1 6
Net book value at 31 July 2020 2,405 868 3,273Net book value at 31 July 2019 2,409 1,110 3,519
Loans due to subsidiaries are offset against loans due from subsidiaries to the extent that there is a legal right of set off and an intention to settle the balances net. At 31 July 2020 £2,790m of loans payable are offset against loans receivable (FY2019: £2,540m). The Company has large offsetting loan balances because it uses loans to reduce its foreign currency exposures and separately monitor net cash generated from trading activities.
The Company’s subsidiaries are largely held according to business lines by the following holding companies, which are incorporated in England:
Smiths Group International Holdings Limited Smiths Detection Group Limited John Crane Group LimitedFlex-Tek Group LimitedSmiths Interconnect Group Limited Smiths Medical Group Limited
S M I T H S G R O U P P L C C O M P A N Y A C C O U N T SF I N A N C I A L S T A T E M E N T S
2 1 6 S M I T H S G R O U P P L C A N N U A L R E P O R T F Y 2 0 2 0

The principal subsidiaries and their countries of incorporation are:
EnglandSmiths Detection – Watford LtdSmiths Medical International LimitedJohn Crane UK Limited
OtherSmiths Heimann GmbH (Germany)Smiths Detection (Asia-Pacific) Pte Ltd (Singapore)Smiths Medical Japan Limited (Japan)John Crane Middle East FZE (UAE)John Crane Technology (Tianjin) Co Limited (China)John Crane Saudi Arabia Ltd (Saudi Arabia)John Crane Canada Inc (Canada)
United StatesSmiths Detection, Inc.Smiths Medical ASD, Inc. John Crane, Inc. Titeflex CorporationFlexible Technologies, Inc. Tutco, LLC. Smiths Interconnect Americas, IncSmiths Interconnect, IncKreisler Manufacturing CorpSmiths Tubular Systems – Laconia Inc
Of the companies above, Smiths Group International Holdings Limited is 100% owned directly by the Company. The others are 100% owned through intermediate holding companies. Shareholdings are of ordinary shares or common stock. All of the above subsidiaries operate in their country of incorporation.
See pages 220 to 228 for a complete list of subsidiary undertakings.
4 Financial assetsAt 31 July 2020 £6m (FY2019: £6m) was held on deposit with banks as security for liabilities or letters of credit.
5 Deferred tax assets and liabilitiesThe Company has recognised the following deferred tax assets and liabilities:
Share- based
payment £m
Retirement benefit
obligations £m
Losses carried
forward £m
Other £m
Total £m
At 31 July 2019 – (70) 68 2 –(Charge)/credit to income statement 2 (14) 4 – (8)Charge to equity 1 (4) – – (3)At 31 July 2020 3 (88) 72 2 (11)
The Company is part of a UK tax group including all its UK-based subsidiaries. The Company has recognised deferred tax assets of £72m (FY2019: £68m) relating to revenue losses brought forward. The recognition of these assets is dependent on the ability to recover them against the unwind of other tax positions and forecast UK taxable profits of the tax group. The treatment of these assets is reviewed at each reporting date.
As at 31 July 2020 the Company has unrecognised deferred tax assets relating to share based payments of £nil (FY2019: £3m).
In March 2020, the previously enacted reduction in the rate of UK corporation tax to 17% was repealed and the rate remained at 19%. The deferred tax as at 31 July 2020 has been calculated at the 19% rate.
6 Debtors31 July 2020
£m31 July 2019
£m
Amounts falling due after one yearOther receivables – 1Amounts falling due within one yearAmounts owed by subsidiaries – repayable on demand 64 57Other receivables 6 10Debtors falling due within one year 70 67
7 Creditors31 July 2020
£m31 July 2019
£m
Amounts falling due within one yearLease liabilities (note 8) 1 –Amounts owed to subsidiaries 81 42Other creditors 16 20Accruals and deferred income 12 14
110 76
4
2 1 7S M I T H S G R O U P P L C A N N U A L R E P O R T F Y 2 0 2 0

8 Borrowings and net debt31 July 2020
£m31 July 2019
£m
Cash at bank 16 6Short-term deposits 160 84Cash and cash equivalents 176 90Lease liabilities falling due within one year (note 7) (1) –Lease liabilities falling due after one year (6) –Term loans due after more than one year (1,429) (1,461)Borrowings (1,436) (1,461)Net debt (1,260) (1,371)
Term loans and lease liabilitiesThe currency and coupons for the term loans are disclosed in note 18 of the Group accounts.
31 July 2020 £m
31 July 2019 £m
Less than one year 1 –Between one and two years – 868Between two and five years 847 –Greater than five years 588 593Smiths Group plc term loans and lease liabilities 1,436 1,461
See the liquidity risk disclosures in note 19 in the Group accounts for information on the cash and borrowing facilities available to the Group. Smiths has Revolving Credit Facilities of $110m maturing on 1 November 2023 and $690m maturing on 1 November 2024. The Bank of England confirmed Smiths' eligibility to access the Covid Corporate Financing Facility ('CCFF') in principle from 30 April 2020 with an indicative aggregate group limit of £600m. Utilisation of the CCFF, which closes to new issuance on 23 March 2021, is not anticipated.
9 DerivativesThe tables below set out the nominal amount and fair value of derivative contracts held by the Company:
At 31 July 2020
Contract or underlying nominal amount
£m
Fair value
Assets £m
Liabilities £m
Net £m
Foreign exchange contracts (not hedge accounted) 55 – – –Cross currency swaps (fair value and net investment hedges) 572 76 – 76Interest rate swaps (fair value hedges) 114 4 – 4
Total financial derivatives 741 80 – 80
Balance sheet entriesNon-current 80 – 80Current – – –
Total financial derivatives 80 – 80
At 31 July 2019
Contract or underlying nominal amount
£m
Fair value
Assets £m
Liabilities £m
Net £m
Foreign exchange contracts (not hedge accounted) 347 4 (3) 1Currency swaps (fair value and net investment hedges) 613 45 – 45Interest rate swaps (fair value hedges) 123 – (1) (1)
Total financial derivatives 1,083 49 (4) 45
Balance sheet entriesNon-current 45 (2) 43Current 4 (2) 2
Total financial derivatives 49 (4) 45
Derivatives, including forward exchange contracts, currency swaps, interest rate instruments and embedded derivatives are level 2 fair value instruments and are valued at the net present value of the future cash-flows calculated using market data at the balance sheet date (principally exchange rates and yield curves).
The credit to the income statement arising from change in fair value in the year was £37m (FY2019: £1m charge).
10 Provisions for liabilities and chargesAt
31 July 2019 £m
Charged against profit
£mUtilisation
£m
At 31 July 2020
£m
Disposals 2 – – 2
The closing disposal provision relates to warranties and other obligations in respect of a past disposal and is expected to be utilised within the next five years.
S M I T H S G R O U P P L C C O M P A N Y A C C O U N T SF I N A N C I A L S T A T E M E N T S
2 1 8 S M I T H S G R O U P P L C A N N U A L R E P O R T F Y 2 0 2 0

11 Post-retirement benefitsThe Company is the principal employer for the two major defined benefit plans in the UK. The Company is accounting for all the UK defined benefit schemes (funded and unfunded) and virtually all of the post-retirement healthcare schemes.
The retirement benefit assets and liabilities comprise: 31 July 2020
£m31 July 2019
£m
Market value of scheme assets 4,240 4,106Present value of funded scheme liabilities (3,724) (3,637)
Surplus 516 469
Unfunded pension plans (55) (56)Post-retirement healthcare (5) (5)
Present value of unfunded obligations (60) (61)
Net pension asset 456 408
Retirement benefit assets 516 469Retirement benefit liabilities (60) (61)
Net pension asset 456 408
See the disclosures for UK schemes in note 8 to the consolidated accounts for the circumstances of the major schemes, risk management, principal assumptions, assets and liabilities and the funding position of the two major schemes.
12 Share capital and reservesShare capital
Number of shares
Issued capital
£mConsideration
£m
Ordinary shares of 37.5p eachAt 31 July 2018 395,761,227 148Exercise of share options 195,554 – 2
At 31 July 2019 395,956,781 148Exercise of share options 254,399 – 2
Total share capital at 31 July 2020 396,211,180 148
At 31 July 2020, all of the issued share capital was in free issue. All issued shares are fully paid. See note 9 to the consolidated accounts for information about share schemes, including total shares under options and options exercisable at the balance sheet date. During the year, the Company received £2m (FY2019: £2m) on the issue of shares in respect of the exercise of options awarded under various share option schemes.
Smiths Industries Employee Benefit Trust
The retained earnings include the purchase of Smiths Group plc shares by the Smiths Industries Employee Benefit Trust, and the issue of these shares upon the exercise of share options. The consideration paid was £18m (FY2019: £19m) and £2m (FY2019: £2m) was received as a result of the issue of shares. At 31 July 2020 the Trust held nil (FY2019: 53,058) ordinary shares.
Distributable profits
The Company’s profit and loss reserve of £1,812m (FY2019: £1,902m) includes £822m (FY2019: £960m) of distributable profits. See note 26 in the Group accounts for a discussion of capital management and the factors which the Board considers when proposing dividends.
Other reserves
Other reserves arose from the cancellation of the share premium arising from an equity-funded acquisition in the year ended 30 July 1988.
Differential between consolidated and parent Company net assets
The Group's consolidated balance sheet shows net assets that are £115m (FY2019: £215m) lower than the net assets shown on the parent Company's balance sheet. This deficit principally arose in 2007 when the Group returned £2.1bn of capital to shareholders, creating a net asset deficit of £1.9bn. Earnings retained within the Group have subsequently reduced this deficit.
13 Contingent liabilitiesThe Company has provided guarantees and arranged letter of credit facilities to support the Group’s pension plans. The current amount outstanding under letters of credit is £54m (FY2019: £54m). The Company has guaranteed the US$800m revolving credit facility available to a subsidiary.
14 Post balance sheet eventIn March 2020, the Board considered it prudent not to declare an interim dividend for HY2020 until such time as trading conditions became clearer and there was less uncertainty. Reflecting the Group’s strong performance and financial position, the Board has recommended a total dividend of 35.0p per share for the year. This is comprised of a delayed interim dividend of 11.0p and a proposed final dividend of 24.0p.
Shareholders will be asked to approve the final dividend component of the total dividend at the 2020 AGM. If the final dividend is approved, it will be payable, along with the interim dividend, on 20 November 2020 to shareholders on the register of members at 6.00pm on 23 October 2020 (the record date). The interim dividend does not require the approval of shareholders and is therefore not included in the resolutions put to the AGM.
4
2 1 9S M I T H S G R O U P P L C A N N U A L R E P O R T F Y 2 0 2 0

Subsidiary undertakings
A full list of the Group's related undertakings as at 31 July 2020 is provided below. The entities are grouped by the country in which they are incorporated and details of their registered office address, classes(es) of shares and ownership is disclosed. Related undertakings includes subsidiaries, associated undertakings, joint ventures and associates.Name Security Direct (%) Total (%)
UNITED KINGDOM3 Melville Street, Edinburgh, EH3 7PEGeorge Maclellan Holdings Limited Ordinary 5p 100 10011-12 St James’s Square, London, SW1Y 4LBAir Log Limited Ordinary 1p 100EIS Group Plc Ordinary 25p 100 100Flex-Tek Group Limited Ordinary £1 100Flightspares Limited Ordinary 10p 100 100Francis Shaw And Company (Manchester) Limited Ordinary £1 100Francis Shaw P L C 37% 2nd Pref Ordinary 10p; 5.25% Cum
Pref £1; Dif 20p; Ordinary 10p100
Graseby Limited Ordinary 25p 100 100Roof Units (Group) Limited Ordinary 10p 100 100S.I. Pension Trustees Limited Ordinary £1 100 100SI Properties Limited Ordinary 25p 100 100SITI 1 Limited Common US$1 100Smiths Aerospace Components Tyseley Limited Ordinary £1 100 100Smiths Aerospace Gloucester Limited Ordinary 25p; Ordinary A 25p 100Smiths Finance Limited Ordinary £1; Red US$1 100Smiths Group Finance EU Limited Ordinary €1 100Smiths Group Finance US Limited Ordinary US$1 100Smiths Group Innovation Limited Ordinary £1 100Smiths Group International Holdings Limited Ordinary £1 100 100Smiths Industries Limited 7% Non Cum Pref; Ordinary £1 100 100Smiths Nominees Limited Ordinary £1 100 100Smiths Technologies Limited Ordinary £0.0000033 100Smiths Wolverhampton Limited Ordinary 25p 100TI Corporate Services Limited Ordinary £1 100 100TI Group Limited Ordinary 25p 100 100TI Guarantee Company Limited Limited By Guarantee 100TI Interest Limited Ordinary A £1 100 100Tigrup No. 7 Limited Ordinary £1 100 100Tigrup No. 14 Limited Ordinary 20p 100XDG Limited Ordinary 50p 100 100XDG Services Limited Ordinary £1 9929 Dunsinane Avenue, Dundee, DD2 3QFFlexible Ducting, Limited Ordinary £1 100Trak Microwave Limited Ordinary £1 10052 Grayshill Road, Westfield Industrial Area, Cumbernauld, G68 9HGAshfield Medical Systems Limited Ordinary £1 10054 Hagley Road, Edgbaston, Birmingham, B16 8PECVE Trustee Limited Ordinary £1 100 100Smiths Pensions Limited Ordinary £1 99 100TI Pension Trustee Limited Limited By Guarantee 1001500 Eureka Park, Lower Pemberton, Ashford, Kent, TN25 4BFGraseby Medical Limited Ordinary £1 100Medex Medical Limited Ordinary £1 100Pneupac Limited Ordinary 50p 100SI Overseas Holdings Limited Ordinary £1 100Smiths Medical 2020 Limited Ordinary £1 100Smiths Medical Group Limited Ordinary A £1; Ordinary B £1; Ordinary C £1 100Smiths Medical International Limited Ordinary £1 100Abercanaid, Merthyr Tydfil, Mid Glamorgan, CF48 1UXAmnitec Hose Limited Ordinary 1p 100Amnitec Limited Ordinary £1 100
F I N A N C I A L S T A T E M E N T S
2 2 0 S M I T H S G R O U P P L C A N N U A L R E P O R T F Y 2 0 2 0
S U B S I D I A R Y U N D E R T A K I N G S

Name Security Direct (%) Total (%)
Buckingham House, 361-366 Buckingham Avenue, Slough, Berkshire, SL1 4LUFlexibox International Limited Ordinary £1 100Flexibox Limited Ordinary £1 100John Crane Group Limited Ordinary £1 100John Crane Investments Limited Ordinary £1 100John Crane UK Limited Ordinary £1 100Project Sugar Limited Ordinary £1 100Building 7, Croxley Business Park, Hatters Lane, Watford, WD18 8PASmiths Business Information Services Limited Ordinary £10 100Century House, Maylands Avenue, Hemel Hempstead, Hertfordshire, HP2 7DESmiths Detection Group Limited Ordinary £1 100Smiths Detection Investments Limited Ordinary £1 100Smiths Detection Limited Ordinary £1 100 100Smiths Detection-Watford Limited Ordinary £1 100Smiths Heimann Limited Ordinary £1 100 100Grant Thornton, 30, Finsbury Square, London, EC2A 1AGSmiths Detection United Kingdom Limited (in liquidation) Ordinary £0.05 100No 1 Exchange, Market Street, Aberdeen, ScotlandJohn Crane Asset Management Solutions Limited Ordinary £1 100Unit 130 Centennial Park, Elstree, Hertfordshire, WD6 3TJHypertac Limited Ordinary £1 100Smiths Industries Industrial Group Limited Ordinary £1 100Smiths Interconnect Group Limited Ordinary £1 100Unit 3 & 4, Illuma House, Gelders Hall Road, Shepshed, Leicestershire, LE12 9NHGastite Systems Limited Ordinary £1 100
ANGOLARue Kwamme Nkrumah, Torres Impor-Africa, 3 Andar, Apt A, LuandaJohn Crane (Angola) Prestacao De Services Ltd Ordinary AOA 1 100
ARGENTINAAv. Leandro N. Alem 1110, 13 Floor, Baker Mackenzie Office, Buenos AiresJohn Crane Argentina SA Common $1 ARS 100TI Group Automotive Systems (Argentina) SA Ordinary $1 ARS 100
AUSTRALIA549 – 551, Somerville Road, Sunshine, Melbourne, VIC 3020Flexibox Pty Limited Ordinary AUS$ 100John Crane Australia Pty Limited Ordinary AUS$1 100Botany Grove Estate Unit 5, 14A Baker Street, Botany, NSW 2019Smiths Detection (Australia) Pty Ltd Ordinary AUD$1 100Suite 2.03, 97 Waterloo Road, Macquarie Park, NSW 2113Smiths Medical Australasia Pty Ltd Ordinary 100
AUSTRIACampus 21, Europaring, A 03 5 02, Brunn Am Gebirge, A-2345Smiths Medical Osterreich GmbH Ordinary €1 100
AZERBAIJAN REPUBLIC32, Dostluq Street, Salyan Highway PO Box AZ1023, BakuJohn Crane Baku LLC Ordinary US$10 100
BELGIUMPegasuslaan 5, Diegem, 1831Smiths Medical Belgium NV Registered Shares 100Glasstraat 37, Antwerpen, 2170John Crane Belgium NV Ordinary 100
BRAZILRua George OHM, 205-5 Andar-Conj. 51 E 52 Torre B, Cidade Moncoes – CEP 04576-020, São PauloSmiths Medical Do Brasil Produtos Hospitalares LTDA Ordinary R$1 100
4
2 2 1S M I T H S G R O U P P L C A N N U A L R E P O R T F Y 2 0 2 0

Name Security Direct (%) Total (%)
Rua Tabapoã, 422, 10th floor, conj. 101, Itaim Bibi, 04533-001Smiths Detection Brasil Comérico De Equipamentos LTDA Common R$1 100Industrial District of The City of Rio Claro, State of São Paulo, AV. Brasil Number 4.700, CEP 13505-600Smiths Brasil LTDA Ordinary R$1 100
CANADA301, Gough Road, Markham, Ontario, L3R 4Y8Smiths Medical Canada Ltd Common 100423, Green North Road, Stoney Creek, Ontario, L8E 3A1John Crane Canada Inc Common CAD$1 1003700, Stock Exchange Tower, P.O. Box 242, 800 Place Victoria, Montreal, PQ, H4Z 1E9Smiths Detection Montreal Inc. Class A Shares; Class B Shares 1004000-1 Place Ville-Marie, Montréal, PQ, H3B 4H4Smiths Interconnect Canada Inc Common 1004610, Eastgate Parkway, Unit 3, Mississauga, Ontario, L4W 3W6Flexible Technologies (Canada) Ltd. Ordinary $1 10016771, Sainte Marie Rd, Kirkland, Quebec, H9H 5H3Reflex Photonics Inc Class A Preferred Shares; Class B
Preferred Shares; Class C Preferred Shares; Class D Preferred Shares; Class E Preferred Shares; Series 1 Common Shares; Series 2 Common Shares; Series 3 Common Shares; Series 4 Common Shares; Series 5 Common Shares; Series 6 Common Shares; 100
CHILEAmerico Vespucio 2542, Complejo Empresarial El Cortijo, Conchali, SantiagoJohn Crane Chile SA Ordinary 1 Peso 100
CHINANo. 1, Lane 65, Huanlong Road, Pudong New District, ShanghaiSmiths (Shanghai) Management Co., Ltd Ordinary US$1 100No. 7, Factory Building, Maqiao Industrial Square, Changshu Economic Development Zone, Changshu, JiangsuChangshu Flex-Tek Thermal Fluid Systems Manufacturer Co. Ltd Ordinary US$1 100No.9, No. 1, Haitai Huake Road, Huayuan Industrial District (Outside The Ring), Binhai Hi-Tech, Industrial Park, TianjinJohn Crane Technology (Tianjin) Co Limited Ordinary US$1 100No. 14 Unit, No. 78, XingLin Road, Suzhou Industrial Park, Suzhou 215026Antares Advanced Test Technologies (Suzhou) Co. Ltd Ordinary US$1 100No. 26, The 3rd Avenue, Economic & Technological Development Area, HangzhouSmiths Medical Instrument (Zhejiang) Co. Ltd Ordinary CNY1 100No. 120, Sanjiang Avenue, Economic Development Zone, Mianyang, Sichuan ProvinceHuafeng Smiths Interconnect (Sichuan) Co., Ltd Ordinary RMB1 60Room 923B, No 55, Xili Road, Shanghai, (China) Pilot Free Trade ZoneSMO Detection Equipment (Shanghai) Co., Ltd Ordinary US$1 100Room 1668, No. 14F Floor 3 Datong Building, Huanghe Avenue, Nankai District, TianjinJohn Crane China Co Limited Ordinary CNY1 100Unit 2805, Tower 3, Jing An Kerry Centre, 1228 Middle Yan An Road, Shanghai, 200040Smiths Medical (Shanghai) Co., Ltd. Ordinary US$ 100Unit 3018, South Tower, Beijing Kerry Centre, 1, Guanghua Road, Chaoyang District, BeijingSmiths Medical (Beijing) Co. Ltd Ordinary US$1 100
S U B S I D I A R Y U N D E R T A K I N G SF I N A N C I A L S T A T E M E N T S
2 2 2 S M I T H S G R O U P P L C A N N U A L R E P O R T F Y 2 0 2 0

Name Security Direct (%) Total (%)
COLOMBIACalle 46A No 82-54 Int 14, Parque Empresarial San Cayetano, BogotaJohn Crane Colombia SA Ordinary COP$1 100
COSTA RICA33rd St. Number 777 Barrio Francisco Peralta, Central Avenue & 8th, San JoseSmiths Interconnect Sociedad Anonima Ordinary US$1 100
CZECH REPUBLICJana Sigmunda 78, Lutin, 78349John Crane A.S. Ordinary CZK 1M 100Olomoucka 306, Hranice I-Mesto, Hranice, 75301Smiths Medical Czech Republic A.S Ordinary CZK 100,000 100
DENMARKOrestads Boulevard 73, 2300 Kobenhavn SSmiths Medical Danmark ApS DKK 100 Shares 100
DOMINICAN REPUBLICCalle El Recodo, #2 Bella Vista, Santa DomingoJohn Crane Dominicana SA Ordinary DP$1 100
EGYPT139, Mogamaa El Masanea Street, El Amireya, CairoJohn Crane Egypt LLC Ordinary EGP 1 100John Crane Egypt Sealing Systems LLC Ordinary EGP 100 99Nile City Towers, North Tower, 22nd Floor, Ramlet Boulaq, Nile Cournich, CairoDetection Technologies Egypt Quotas 100
FINLANDPO Box 10, Punasillantie 15, Muurame, 40950John Crane Safematic Oy Ordinary €16.82 100
FRANCE3/5 Rue Du Pont Des Halles, Batiment A, Rungis, 94150Smiths Medical France S.A.S. €7.7 Shares 10022, Avenue Maurice Chevalier, 77833 Ozoir-La-Ferriere, ParisTiteflex Europe S.A.S. Ordinary $39 10031 Rue Isidore Maille, Saint-Aubin-Les-Elbeuf, 76410Hypertac S.A. Ordinary €76 10036 Rue Charles Heller, Vitry Sur Seine, F-94400Smiths Heimann S.A.S. €1 Shares 100114, Rue Jules Ferry, B.p.35, Deville-Les-Rouen, 76250John Crane France S.A.S. Ordinary €286 100T I S A (France) Ordinary €4.9 100
GERMANYAm Zirkus 2, Berlin, 10117John Crane Filtration Technologies GmbH Ordinary €1 100Bretonischer Ring 3, Grasbrunn, 85630Smiths Group Deutschland GmbH €1,491,400 Shares; €3,478,400 Shares;
€995,500 Shares100
Smiths Medical Deutschland GmbH €1,000 Shares; €27,000 Shares; €5,000 Shares; €500 Shares
100
Gewerbestraße 15 a, Graben, 86836Gastite Systems Deutschland GmbH Ordinary €1 100Im Herzen 4, Wiesbaden, 65205Smiths Detection GmbH €25,000 Share; €183,100 Share;
€791,900 Share100
Smiths Heimann GmbH Ordinary 100Neckarweg 3, Vellmar, 34246Herkules Holding GmbH Ordinary €1 100Seebach GmbH Ordinary €1 100Reepschlager Str., 10B, Lubeck, 23556Flexschlauch Produktions GmbH DM 11,000; DM 380,000; DM 9,000 100
4
2 2 3S M I T H S G R O U P P L C A N N U A L R E P O R T F Y 2 0 2 0

Name Security Direct (%) Total (%)
Tolzer Strasse, 15 82031, GrunwaldZamor KG Ordinary shares €1 48Ulrichsberger Strasse 17, Deggendorf, 94469Hypertac GmbH Ordinary €1 100Werner–Von–Siemens – Str.6, Fulda, 36041John Crane GmbH Ordinary €1 100
GREECE3 Stratigou Tobre Street, Municipality Of Agia Paraskevi, Athens, 153 42John Crane Hellas – Engineered Sealing Systems Monoprosopi EPE Ordinary €1 100
GUERNSEYLevel 5, Mill Court, La Charroterie, St Peter Port, GY1 1EJSmiths Group Insurance Limited Ordinary £1 100
HONG KONG806-807, 8/F, One Pacific Place, 88 QueenswaySmiths Interconnect Group (HK) Limited Ordinary US$1 100Smiths Interconnect Hong Kong Co Limited Ordinary US$1 100Suite 1106-8, 11/F Tai Yau Building, No 181 Johnston Road, WanchaiSmiths Detection Hong Kong Limited Ordinary 1 HKD 100Smiths Medical (Hong Kong) Limited Ordinary 1 HKD 100
HUNGARY2040 Budaors, Gyar U. 2John Crane Hungary Kft Ordinary €1 100
INDIA508/509, 5th Floor, Western Edge Ii, Western Express Highway, Borivali East, Mumbai, 400066Smiths Medical India Private Limited Ordinary INR 1 100D-196 Okhla Industrial Area, Phase-1, New Dehli, 110020Plenty India Limited Ordinary Shares 100No 11, 1st Phase, Peenya, Industrial Area, Bangalore, 560058John Crane Sealing Systems India Private Limited Ordinary INR 10 100Smiths Interconnect India Private Limited Ordinary INR 10 100No 38, Kiadb Industrial Area, Bangalor, 561203STS Titeflex India Pvt Ltd Ordinary INR 100 100Shirwal, Maharashtra 412801Seebach Filter Solutions India Pvt Ltd Ordinary INR 10 90Vardhman Crown Mall, Unit No. 300 3rd Floor, Sector 19 Dwarka, New Delhi 110075Smiths Detection Systems Private Limited Class A Equity Shares INR 10;
Class B Equity Shares INR 10100
INDONESIACilandak Commercial Estate Bldg 401A, Ji. Kko Cilandak, Jakarta, 12560PT John Crane Indonesia Ordinary IDR 1,000 99
IRELANDSuite 3, One Earlsfort Centre, Earlsfort Terrace, Dublin 2Graseby Medical Ireland Limited Ordinary €1.269738 100Smiths Detection Ireland Limited Ordinary €1.25; Ordinary B €1.269738;
Ordinary D €1.25; Series C €1.25100
T53/54, Shannon Industrial Estate, Shannon, Co. ClareJohn Crane (Ireland) Limited Ordinary €1 100
ITALYVia Da Bissone 7A, Genova, 16153Hypertac SpA Ordinary €5 100Via Della Stazione, 2, 04013 Latina Scalo, LatinaSmiths Medical Italia srl Ordinary €1 100Via Giotto 3, Muggio, 20835John Crane Italia SpA Ordinary €5.16 100Smiths Detection Italia srl Quota Value of Shares 100Smiths Group Italia Srl Ordinary €1 100
S U B S I D I A R Y U N D E R T A K I N G SF I N A N C I A L S T A T E M E N T S
2 2 4 S M I T H S G R O U P P L C A N N U A L R E P O R T F Y 2 0 2 0

Name Security Direct (%) Total (%)
JAPAN1-1-1 Uchisaiwaicho, Chiyoda-ku, TokyoSmiths Medical Japan Ltd Common Stock 100Smiths Detection Japan Gk Cash Contribution 1002222, Kamitoyama Ritto City, Ritto-Shi, Shiga-KenJohn Crane Japan Inc Ordinary JYP 1,000 70
KAZAKHSTANAtyrau Region, Gatyrau, Station K Arabathan, House Production Site 14, 060000John Crane Kazakhstan Ordinary KZT 100
KOREA, REPUBLIC OFMigeundong, Westgate Tower 15F, 70 Chungjeong-Ro, Seodaemun-Gu, SeoulJohn Crane Korea Co Ltd Ordinary Kwon 5,000 100
MALAYSIA207, Jalan Tun Razak, Suite 13.03, 13th Floor, Menara Tan & Tan, Kuala Lumpur, 50400John Crane Malaysia Sdn Bhd Ordinary RM1 100Flexible Ducting Malaysia Sdn Bhd (in liquidation) Ordinary RM1 100Menara LGB, 1, Jalan Wan Kadir Taman Tun Dr Ismail, 60000 Kuala Lumpur, WPKLSmiths Detection Malaysia Sdn Bhd Ordinary RM1 100
MEXICO679, Poniente 152, Vallejo Delegacion Azcapotzalco, Mexico City, 2300Industrias John Crane Mexico S.A. de C.V. Series A MXN 1; Series B MXN 1 100Av. Primero De Mayo Lote 3 Edificio 1B, Prologis Park, Reynosa, 88780Tutco De Mexico S de RL de CV Ordinary $1.00 100Ave Calidad No. 4, Parque Industrial, Internacional Tijuana, Tijuana, B.C., 22425Smiths Healthcare Manufacturing, S.A. de C.V. Series B 10 Pesos; Series B-1 Pesos 10 100Carretera Ciudad Victoria Matamoros, Km.173+600, Solonia San Fernando Centro, Tamaulipas, San Fernando, CP 87600John Crane Sociedad De Responsibilidad Limitada De Capital Variable Ordinary MXN $1 100Carretera Libre Antiguo Camino Tijuana 20221-B, Fideicomiso el Florido, Tijuana, Baja California, 22234Smiths Interconnect Mexico S. de Rl de C.v. Equity Quotas MEX $2,500 100Paseo De La Reforma 505, Col, Cuauhtemoc, 6500, Ciudad De MexicoSmiths Detection Mexico S. de Rl de C.v. PS US$1; PS US$2,999 100
NETHERLANDSAbraham van Stolkweg 118, Rotterdam, 3041 JAAmnitec BV Ordinary €1 100Bergen 9 – 17, Barendrecht, Zuid, 2993LRJohn Crane Holland BV Ordinary €1 100Smiths Detection Benelux BV Ordinary €1 100Buckingham House, 361-366 Buckingham Avenue, Slough, Berkshire, SL1 4LU, EnglandSmiths Group Holdings Netherlands BV Ordinary €1 100Hydrograaf 25, PO Box 442, 6900 Ak Zevenaar, Duiven, 6921 RSIndufil BV Ordinary €1 100Jagersbosstraat 28, 5241JT RosmalenSmiths Medical Nederland B.V. NLG100 shares 100
NEW ZEALANDDeloitte, Level 18, 80 Queen Street, Auckland 1010Smiths Detection New Zealand Limited Ordinary 100
PERUAv. Guillermo Dansey 2124, Urbanizacion Industrial Conde, LimaJohn Crane Peru SAC Common Shares PEN 1 100
POLAND1327, ul. Bielska, Poland, 43-374 BuczkowiJohn Crane Poland Sp Z O.O. Ordinary 50 PLN 100
4
2 2 5S M I T H S G R O U P P L C A N N U A L R E P O R T F Y 2 0 2 0

Name Security Direct (%) Total (%)
PORTUGALAvenida Engenheiro Duarte Pacheco, Amoreiras, Torre 2, 15º A, Campo De Ourique, Lisboa, 1070-102Smiths Medical (Portugal), Unipessoal Lda €505,000 Share 100
PUERTO RICO654 Plaza, Suite #933, 654 Munoz Rivera Ave, San Juan, 00918John Crane Caribe Ltd Common Shares US$1 100
RUSSIAN FEDERATION104 Oktyabrskayanab., Building 25, Litera AJ, Premises 4-H, Saint-Petersburg, 193079Smiths Heimann Rus LLC Ordinary RUB 1 100B.savvinsky Per, D.11, Moscow, 119435LLC John Crane Rus Ordinary RUR 1 100
SAUDI ARABIADammam Industrial City, Dammam, 3243John Crane Saudi Arabia Ltd Ordinary ZAR 1 100Building 7, Zone A, Airport road, Business Gate, P.O Box Riyadh 11683, 93597Smiths Detection Saudi Arabia Ltd 1,000 Saudi Riyals Shares 100
SINGAPORE6 Shenton Way, OUE Downtown #26-00, 068809John Crane Singapore Pte Limited Ordinary S$1 1006 Shenton Way, Oue Downtown #33-00, 068809Smiths Medical Singapore Pte. Limited Ordinary US$1 10020, Pasir Panjang Road, #13-26 Mapletree Business City, 117439Smiths Connectors Asia Pte. Ltd. Ordinary S$1 100Smiths Detection (Asia Pacific) Pte. Ltd Ordinary S$1 100
SLOVAKIADvorakovo nabrezie 10, Bratislava-mestska cast Stare Mesto, 811 02John Crane Slovakia SRO Ordinary €1 100
SOUTH AFRICA2, Jansen Road, Nuffield Industrial Sites, Springs Gauteng, 1559Flexibox (Pty) Limited Ordinary SAR 1 100John Crane Pty Ltd Ordinary ZAR 1 100
SPAINAv Diagonal, Num.635 P.1, Barcelona, 08028Smiths Medical Espana S.L. Shares €1 100Cemento 1, Torrejon De Ardoz, MadridJohn Crane Iberica SA Ordinary €6.010121 100
SWEDENKnivsta, 74180Habia Teknofluor AB SEK100 Shares 100Teknofluor Holding AB SEK100 Shares 100Box 1143, 164 22 KistaSmiths Medical Sverige AB SEK100 Shares 100Faltspatsgatan 4, Se-421 30 Vastra FrolundaJohn Crane Sverige AB Ordinary SEK 100 100
SWITZERLANDHohenrainstrasse 10, 4133 PrattelnJohn Crane (Switzerland) AG Ordinary 1 CHF 100Zurichstrasse 33, Adliswil, 8134Smiths Medical Schweiz AG Shares of CHF 10 100
TAIWAN324-4, Fong-Jen Road, Renwu District, Kaohsiung City 814John Crane Taiwan Co Ltd. Ordinary T$1 100
THAILAND9/311, 31st Floor, Um Tower, Ramkhamhaeng Road, Suanluang District, BangkokJohn Crane (Thailand) Limited Ordinary THB 1; Pref THB 25 10099/3 Moo 5, Kingkaew Road, Tambol Rajatheva, Amphoe Bangplee, Samutprakarn Province, 10540Smiths Detection (Thailand) Limited Pref THB 100; Ordinary THB 100 100
S U B S I D I A R Y U N D E R T A K I N G SF I N A N C I A L S T A T E M E N T S
2 2 6 S M I T H S G R O U P P L C A N N U A L R E P O R T F Y 2 0 2 0

Name Security Direct (%) Total (%)
TUNISIAZone Industrielle Route De Khniss, Monastir, 5000Smiths Connectors Tunisia SARL Ordinary 100 DT 100
TURKEYIstanbul Sariyer, Huzur Mahallesi, Ahmet Bayman Caddessi, Dis, Reklamcilik Apt No:17-19/1John Crane Endustriyel Sizdirmazlik Sistemleri Ltd Ordinary TRY 25 100
UNITED ARAB EMIRATESBuilding B10, Industrial Mussaffah, M44, Sector 15, Abu DhabiSmiths Detection Security Systems LLC AED 1,500 49Dubai Airport Free Zone, PO Box 48225, Building No. 8WA (West Side), 401, DubaiSmiths Detection Middle East FZE AED 1,000,000 Share 100S20113, Jebel Ali Free Zone, 61040John Crane Middle East FZE Ordinary AED 1 100
UNITED STATES OF AMERICA51 Growth Road, Laconia, NH, 03246Lakes Region Tubular Products Inc. Common Stock 100Scotia Acquisition Co Common Stock of US$0.01 100Scotia Real Estate LLC Limited Liability Company Interests 100116, Pine Street, 3rd Floor, Suite 320, Harrisburg, PA 17101Tutco, LLC Ordinary US$1 100180 Van Riper Avenue, Elmwood Park, NJ 07407Kreisler Industrial Corp Common Stock 100Kreisler Manufacturing Corp Common Stock of US$0.001 100208 S. Lasalle Street, Suite 814, Chicago, IL, 60604John Crane International Inc. Common Shares 1005200, Upper Metro Place, Dublin, OH, 43017Medex Cardio-Pulmonary, Inc Common Stock of US$0.01 100815 Forestwood Drive, Romeoville, IL 60446United Flexible, Inc. Common Stock of US$0.01 100US Hose Corp Common Stock 1001219 Stewart Plaza, Dunbar, WV, 25064Seebach Filtration USA, Inc. Ordinary US$25 1002801 Red Dog Lane, Knoxville, TN 37914Fulton Bellows LLC Limited Liability Company Interests 100Corporation Service Company, 2711 Centerville Rd, Suite 400, Wilmington, DE, 19808United Flexible Technologies, Inc. Common Stock of US$0.001 100The Corporation Trust Company, 1209 Orange Street, Wilmington, DE, 19801Flexible Technologies, Inc Ordinary Shares US$0.01 100Flex-Tek Group (US) LLC Ordinary 100John Crane Group, LLC Ordinary US$0.01 100John Crane Inc Common US$0.01; Preferred US$0.10 100John Crane USA, Inc Ordinary US$0.01 100MDII Investments LLC Ordinary 100Powercam-Houdaille, Inc. Common Shares US$1 100Smiths Business Information Services, Inc. Common Stock of US$0.01 100Smiths Detection International, LLC Equity Interests 100Smiths Detection US Holdings 2 Inc. Common Stock US$1 100Smiths Detection US Holdings, LLC Limited Liability Company Interests 100Smiths Detection US, LLC Ordinary US$1 100Smiths Group Services Corp. Common Stock US$0.01 100Smiths Interconnect Americas, Inc. Common Stock US$0.01 100Smiths Interconnect, Inc. Common Stock US$10 100Smiths US Innovation LLC Ordinary 100CT Corporation System, 9 Capitol Street, Concord, NH 03301Smiths Tubular Systems-Laconia, Inc Ordinary Shares US$1 100CT Corporation System, 155 Federal Street, Suite 700, Boston, MA 02110Titeflex Commercial, Inc. Ordinary US$0.01 100
4
2 2 7S M I T H S G R O U P P L C A N N U A L R E P O R T F Y 2 0 2 0

Name Security Direct (%) Total (%)
One Corporate Center, Hartford, CT 06103-3220Titeflex Corporation Ordinary US$1 100Registered Agent Solutions, Inc., 1679 Dupont Highway, Suite 100, Dover DE, 19901Smiths Medical ASD Inc. Common Stock $1 100The Corporation Trust Company of Nevada, 701 S Carson Street, Suite 200, Carson City, NV, 89701Smiths Detection Inc Common Stock of $0.0001 100
VENEZUELACarretera Vía A Perijá, Km 8 ½, Avenida 50, Local N° 185-72, Zona Industrial El Silencio, Maracaibo, 4001John Crane Venezuela CA Class A BSF1; Class B BSF1;
Common BSF1100
ASSOCIATESGERMANY
Steinmühlenweg 5, 65439 Florsheim am Main / Wicker
STI Security Training International GmbH Ordinary Shares 34
RUSSIAN FEDERATION
28, Academica Vedeneeva Street, Perm, Permskiy Region, 614038
LLC John Crane Iskra Ordinary RUR 1 50
Between 1 August and 21 September 2020:
– Smiths Interconnect Canada Inc. merged with and into Reflex Photonics Inc on 1 August 2020. Reflex Photonics Inc is the surviving entity
– PathSensors, Inc. was acquired by Smiths Detection on 3 August 2020 by way of a merger between Smiths Detection US Holdings 2 Inc. and PathSensors, Inc. PathSensors, Inc. is the surviving entity.
Overseas branchesThe Company does not operate through any branches. Some Group subsidiary companies have established branch operations outside the UK.
S U B S I D I A R Y U N D E R T A K I N G SF I N A N C I A L S T A T E M E N T S
2 2 8 S M I T H S G R O U P P L C A N N U A L R E P O R T F Y 2 0 2 0

Shareholder Information
20202021
(provisional)Announcement of FY2020 Results 24 SeptemberDividend ex-dividend date 22 OctoberDividend record date 23 October
Last DRIP election date 6 November
Annual General Meeting 16 NovemberDividend payment date 20 November
Announcement of FY2021 Interim Results 26 March Interim dividend ex-dividend date 8 April Interim dividend record date 9 April Last DRIP election date 23 April Interim dividend payment date 7 May FY2021 financial year end 31 JulyAnnouncement of FY2021 Results September
Registered OfficeSmiths Group plc 4th Floor 11-12 St James’s Square London SW1Y 4LB, UK
020 7004 1600
Incorporated in England Company No. 137013
www.smiths.com
RegistrarsOur share register is maintained by Equiniti. If you have any questions about your Smiths shares, please contact Equiniti by:
Visiting: www.shareview.co.uk.
Telephoning: T: 0371 384 2943 (in the UK) T: +44 (0)121 415 7047 (outside the UK) Textel: 0870 384 2255 Lines open 9:00am to 5:00pm (UK time), Monday to Friday (excluding public holidays in England and Wales)
Writing to: Equiniti Limited, Aspect House Spencer Road, Lancing, West Sussex, BN99 6DA
Equiniti offer the Shareview portfolio service to investors; visit www.shareview.co.uk to register for an account. Through Shareview you can access information about your investments, including balance movements and indicative share prices, as well as practical help about transferring your shares or updating your personal details.
DividendsSince November 2019 Smiths no longer issues dividend cheques. In order to have your dividends paid directly to your bank or building society account please contact Equiniti for a copy of the Bank Mandate Form, or register your nominated bank or building society account by visiting www.shareview.co.uk.
By registering your account all future dividends will be paid securely by direct credit on the dividend payment date.
Alternatively, Smiths offers a Dividend Reinvestment Plan. For more information please visit our website or contact Equiniti.
Ordinary sharesThe market value of an ordinary share of the Company on 31 March 1982 for the purposes of capital gains tax was 136.875p (taking into account the sub-division of 50p shares into 25p shares on 14 January 1985 and the sub-division and consolidation of 25p shares into 37.5p shares on 18 June 2007).
Annual General Meeting (AGM)Further to COVID-19 the 2020 Smiths Group plc AGM will be held as a closed physical meeting, meaning that shareholders will not be permitted to attend the meeting in person in line with government guidance. However, shareholders will be able to watch a webcast alongside the AGM presentation slides which will be made available electronically at 2.30pm on 16 November 2020. There will also be a facility available for shareholders to ask questions remotely. Instructions are detailed in the Notice of AGM which can be found in a separate document which is sent out at least 20 working days before the AGM and made available on our website. If you are in any doubt as to what action you should take in relation to the resolutions being proposed at the AGM, you are recommended to consult your stockbroker, bank manager, solicitor, accountant or other independent professional adviser authorised under the Financial Services and Markets Act 2000. A recording of the webcast will be available on our website shortly after the meeting concludes.
Voting at the AGMShareholders will be able to submit their voting instructions electronically through the webcast platform during the meeting. The Company provides electronic proxy voting for the AGM. Shareholders unable to vote at the meeting electronically on the day are encouraged to vote their shares by appointing a proxy and issuing voting instructions. Electronic and paper proxy appointments and voting instructions must be received by the Company’s Registrar not later than 48 hours before the AGM is held in order to be valid. Shareholders who are not CREST members can appoint a proxy and vote online by visiting www.sharevote.co.uk. CREST members, CREST personal members and other CREST-sponsored members should consult the CREST Manual or their sponsor or voting service provider for instructions on electronic proxy appointment and voting. Further instructions on how to vote your shares are set out in the Notice of AGM.
Financial calendar
4
2 2 9S M I T H S G R O U P P L C A N N U A L R E P O R T F Y 2 0 2 0
S H A R E H O L D E R I N F O R M A T I O N

2 3 0 S M I T H S G R O U P P L C A N N U A L R E P O R T F Y 2 0 2 0

Forward-looking statements This report contains certain forward-looking statements. They appear in a number of places throughout this document and include statements regarding the intentions, beliefs and/or current expectations of Smiths Group plc (the 'Company') and its subsidiaries (together, the 'Group') and those of their respective officers, directors and employees concerning, amongst other things, the results of operations, financial condition, liquidity, prospects, growth, strategies and the businesses operated by the Group. Forward-looking statements can be identified by the use of forward-looking terminology, including terms such as "believes", "estimates", "anticipates", "expects", "forecasts", "intends", "plans", "projects", "goal", "target", "aim", "may", "will", "would", "could" or "should" or, in each case, their negative or other variations or comparable terminology. By their nature, these statements involve uncertainty and are subject to known and unknown risks, including, without limitation, those discussed under the section titled ‘Principal risks and uncertainties’ in this report. Future events and circumstances can cause performance, results and developments to differ materially from those expressed, implied or anticipated. The past business and financial performance of the Group is not to be relied on as an indication of its future performance. The forward-looking statements reflect knowledge and information available at the date of preparation of this document and, unless otherwise required by applicable law, the Company undertakes no obligation to update or revise these forward-looking statements. Undue reliance should not be placed on such forward-looking statements. Nothing in this document should be construed as a profit forecast or be interpreted to mean that future earnings per share of the Company will necessarily match or exceed its historical published earnings per share. The Company and its Directors accept no liability to third parties. This document contains brands that are trademarks and are registered and/or otherwise protected in accordance with applicable law. Some of the products described in these materials are under development at Smiths Medical and are not available for sale. The products described are subject to FDA 510(k) Premarket Notification clearance and receipt of CE Mark prior to commercial distribution, and we make no definitive claims about the final features or benefits of these products. Designed and produced by Radley Yeldar.

LSE: SMINADR: SMGZY
SMITHS GROUP PLC 4th Floor11-12 St James’s SquareLondon SW1Y 4LB, UK+44 (0)20 7004 1600www.smiths.com
To view this report online go to www.smiths.com/investors @smithsgroupplc
Related Documents