Major Winter Weather Events during the 2012-2013 Cold Season Michael S. Ryan 1 , Amanda Fanning, Mary Beth Gerhardt, David Hamrick, Paul J. Kocin, Kwan-Yin Kong, Jason Krekeler, Richard Otto, Frank J. Pereira, Brendon Rubin-Oster NOAA/NWS/Weather Prediction Center, College Park, MD 1 Corresponding author address: Michael S. Ryan, NOAA/NWS/Weather Prediction Center, 5830 University Research Court, College Park, MD 20740; email: [email protected] 1

Welcome message from author
This document is posted to help you gain knowledge. Please leave a comment to let me know what you think about it! Share it to your friends and learn new things together.
Transcript
Major Winter Weather Events during the 2012-2013 Cold Season
Michael S. Ryan1, Amanda Fanning, Mary Beth Gerhardt, David Hamrick, Paul J. Kocin, Kwan-Yin Kong, Jason Krekeler, Richard Otto, Frank J. Pereira,
Brendon Rubin-Oster
NOAA/NWS/Weather Prediction Center, College Park, MD
1 Corresponding author address: Michael S. Ryan, NOAA/NWS/Weather Prediction Center, 5830 University Research Court, College Park, MD 20740; email: [email protected]
1
1. Introduction
Winter storms cause millions of dollars in damage and disrupt countless lives across the
United States every year. They directly cause an average of 24 deaths in the U.S. each year
(2003-2012 average), with an additional 27 deaths each year caused by cold temperatures (NWS
2013). Winter storms produce a variety of precipitation including snow, sleet, and freezing rain,
often with high winds, extreme cold, and coastal flooding in addition to the precipitation. Some
parts of the U.S. are more prepared than others, and thus the impact of winter storms varies
widely by region. Winter storm activity varies widely from year to year, in connection with
large-scale atmospheric phenomena such as the North Atlantic Oscillation (NAO), Arctic
Oscillation (AO), and El Nino-Southern Oscillation (ENSO).
Because winter storms cover spatial scales much larger than that of an individual NWS
office, WPC is well-positioned to provide guidance on these storms. One role of the WPC is to
provide winter storm specific forecasts for the U.S. These include quantitative precipitation
forecasts (QPF), low-tracks, and probabilistic heavy precipitation (rain, snow, freezing rain)
forecasts.
The WPC issues Storm Summary products for high-impact winter weather events that
affect multiple NWS county warning areas, affect commerce and transportation, and are likely to
attract media attention. Storm Summaries contain information on the current location and
intensity of a storm system, a summary of rain and snowfall accumulations, and a short term
forecast for the storm system. The purpose of this article is to provide an overview of the 2012-
2013 cold season and the most notable winter weather events for which the WPC issued Storm
Summaries. For the purposes of this article, the cold season is defined as September 15 - May 15.
2
These dates align with the dates that the Winter Weather Desk at the NOAA/NWS Weather
Prediction Center (WPC) is active.
Section two of the article describes the data used for the images in the article. Section
three of the article provides an overview of the large scale patterns that affected North America
during the cold season. Section four of the article discusses the individual details of the most
significant winter storms of the cold season. Finally, conclusions are given in section five.
2. Datasets
NCEP/NCAR Reanalysis data (Kalnay et al. 1996) were used to create the seasonal and
monthly anomaly graphics referenced in section three. Snowfall analyses shown are interpolated
snow analyses from the National Operational Hydrologic Remote Sensing Center (NOHRSC).
The NOHRSC analyses are created using observed snowfall data received in SHEF (Standard
Hydrometeorological Exchange Format) over AWIPS (Advanced Weather Interactive Processing
System) (NOHRSC 2005). The data are then interpolated temporally using preprocessed
RADAR (Radio Detection and Ranging) data (Stage II) as well as spatially using a weighting
function (NOHRSC 2005). Snowfall data are not interpolated above 1640 feet in elevation in the
eastern U.S. and above 5741 feet in the western U.S. In northern Idaho, Washington, and Oregon
snowfall data are not interpolated above 2625 feet. For further details on the data assimilation
and interpolation schemes used in the NOHRSC snowfall analyses the reader is referred to
NOHRSC 2005. An additional source of snowfall analyses used in this article is the Ridge II
snowfall analysis from NWS Southern Region, which incorporates CoCoRaHS (Community
Collaborative Rain, Hail and Snow Network) and NWS Cooperative Observer (COOP)
observations (http://www.srh.noaa.gov/ridge2/snow). Monetary damage and casualty reports
3
included in this article are taken from official NWS Storm Data publication, Storm Data and
Unusual Weather Phenomena (www.ncdc.noaa.gov/oa/climate/sd).
3. Seasonal Overview
The 2012-2013 cold season was a very active one for some portions of the contiguous
U.S. (CONUS), while relatively non-eventful for others. The season got an early start in late
October across the southern and central Appalachians as Hurricane/Post-Tropical Storm Sandy
interacted with an intense upper-level trough to bring a major winter storm to areas from North
Carolina to Pennsylvania. Barely a week after Hurricane Sandy, an early-season Nor’easter
brought a winter storm to areas that had just been devastated by coastal flooding and surge from
Sandy. From mid-November through much of December the winter storm activity shifted to the
western U.S. and the northern plains/Upper Midwest. In late December the stormy pattern shifted
eastward again, with several winter storms affecting areas from the South and the northern
plains/Great Lakes to the Northeast through the rest of the cold season.
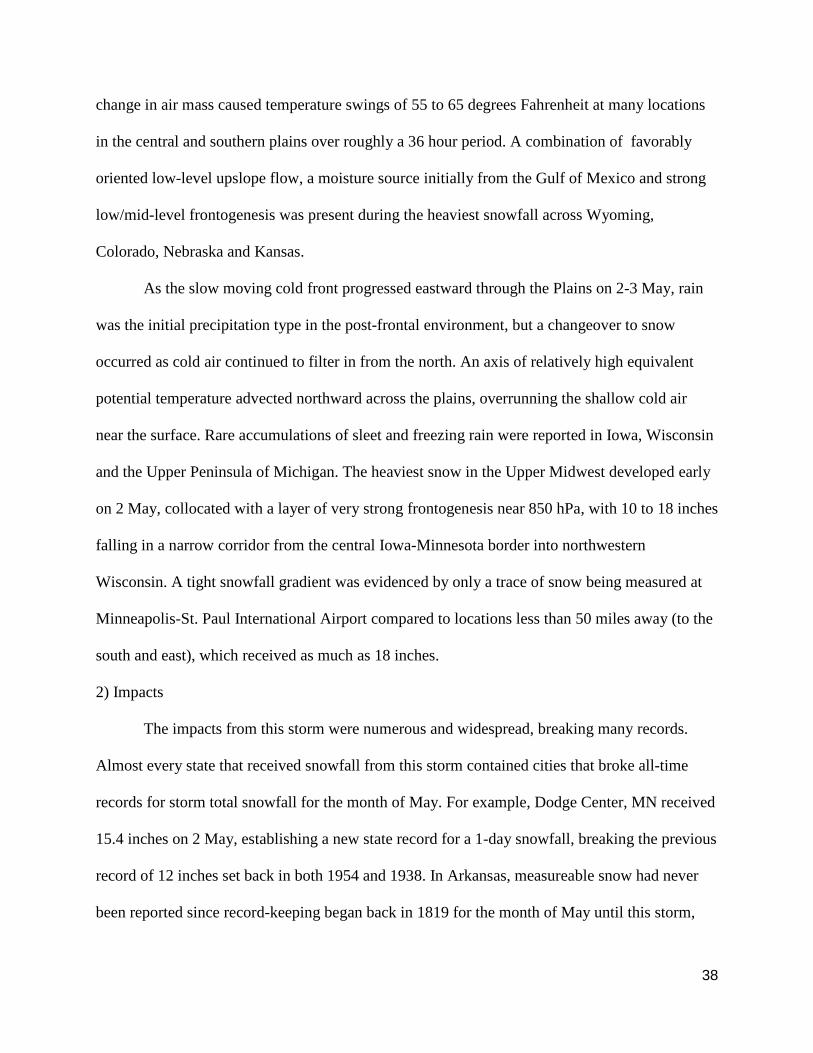
The seasonal mean 250 hPa winds showed a split flow pattern across the CONUS with
two distinct anomalous wind maxima evident. One 250 hPa wind maximum extended from the
Pacific Ocean into the northwestern states and northern U.S. Rockies, with a second Subtropical
jet maximum evident from near Hawaii to Baja California and into the south central CONUS
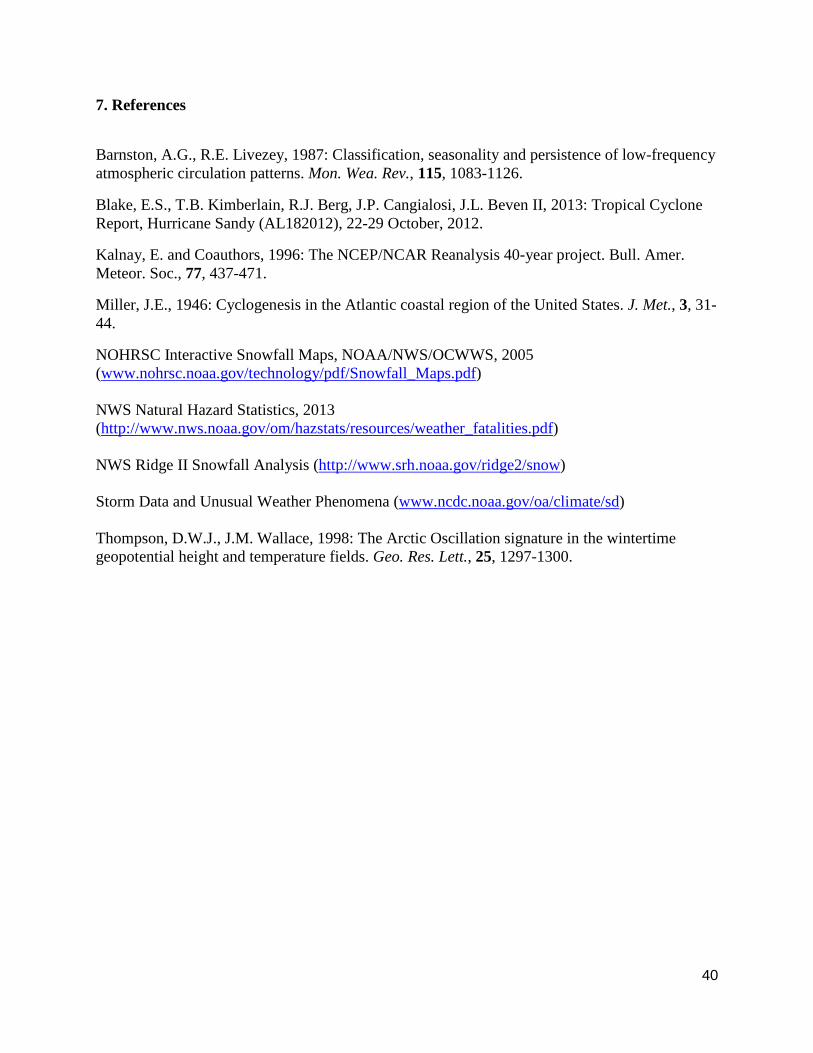
(Fig. 1). The 500 hPa pattern for the cold season (October-April) shows a ridge at 500 hPa over
Greenland and northeastern Canada, a mean trough from central Canada into the U.S. Midwest,
and another ridge over the north Pacific/Bering Sea and Alaska (Fig. 2). The North Atlantic
Oscillation (NAO, Barnston and Livezey, 1987) was negative very early in the season (October)
but then became largely neutral for the remainder of the cold season (Fig. 3). The Arctic
Oscillation (AO, Thompson and Wallace, 1998) was relatively neutral for much of the season
4

before turning more sharply negative in March (Fig. 3). The Pacific-North American (PNA,
Barnston and Livezey, 1987) index was also negative (albeit weakly) during most of the cold
season (Fig. 3).
4. Individual Event Summaries
a. Post-Tropical Storm Sandy (28-31 October)
1) Meteorological Overview
At the end of October, 2012, one of the most memorable storms in recent U.S. history
made landfall along the New Jersey coast. A negative NAO, or strong blocking pattern in the
north Atlantic, set the stage for this historic event. Sandy originated as a tropical depression in
the southwestern Caribbean Sea on Monday, 22 October. The storm quickly increased in size and
intensity while tracking north through the Caribbean, and by 15 UTC on 24 October, Sandy had
strengthened to a category one hurricane near Jamaica. Hurricane Sandy continued its northward
track into the Atlantic, and then on 27 October, the storm turned briefly northeastward away
from the United States. However, the strong ridge over the north Atlantic prevented Sandy from
going out to sea, and instead, the storm eventually began to interact with a mid-latitude trough
digging into the Ohio/Tennessee valleys and re-curved northwestward toward the U.S. East
Coast. This unique interaction between a tropical and mid-latitude low-pressure system
accelerated and strengthened Sandy as it approached the U.S. coast on Monday, 29 October.
The large wind field, combined with a long easterly fetch over the Atlantic, enhanced
storm surge along the Eastern Seaboard from the Chesapeake Bay to Cape Cod as the storm
approached the U.S. coast, and the full phase of the moon on 29 October aided in creating
extreme high tides and storm surges. Similar to most tropical events, winds increased with the
approaching storm, and anomalous moisture streaming inland allowed for heavy rains from
5

Virginia to New Jersey. The most significant rains fell over the Delmarva Peninsula, with a
maximum of 12.83 inches of rain reported in Bellevue, MD. According to the final report issued
by the National Hurricane Center (Blake et al., 2013), Sandy officially became the largest
hurricane to develop in the Atlantic since 1988, spanning nearly 1000 miles in diameter. On the
afternoon of 29 October, the storm was still offshore, but the minimum central pressure lowered
to 940 hPa. Also according to the Sandy report issued by the National Hurricane Center, at 2224
UTC, a 945.5 hPa pressure was recorded at Atlantic City, NJ, which set a record for the
minimum sea-level pressure ever recorded north of North Carolina in the United States. Sandy
made landfall just south of Atlantic City, New Jersey at around 00 UTC Tuesday, 30 October,
shortly after the National Hurricane Center declared it had transitioned from a hurricane to a
post-tropical storm (Fig. 4a).
The storm gradually weakened after making landfall, but the combination of strong
dynamic cooling from the deep-layered cyclone moving westward into the Mid-Atlantic States
and cold air advection from the west-northwest lowered temperatures enough to change rain over
to snow along the higher elevations of the central and southern Appalachians. An expansive area
of strong low-level winds surrounded the storm, and the northwesterly flow over the
Appalachians enhanced snowfall rates on the northwestern slopes of the terrain. Measurable
snow was reported from the Smoky Mountains in Tennessee and North Carolina into
southwestern Pennsylvania (Fig. 4b).
After tracking through southern New Jersey and westward across southern Pennsylvania,
Sandy took a turn to the north Tuesday evening, 30 October. The storm caused gusty winds,
lakeshore flooding, and some snow showers across portions of the Great Lakes as it moved north
6
through western Pennsylvania, and finally, Sandy crossed Lake Erie and exited the U.S. by
Wednesday morning, 31 October.
2) Impacts
Sandy impacted 24 U.S. states and caused over 50 billion dollars in damage. The hardest-
hit areas were along the New Jersey coastline and into Long Island, where rising ocean waters
washed out protective beaches and damaged hundreds of thousands of homes and businesses. In
New York City, storm surge and tropical storm strength winds closed subway stations and the
New York Stock Exchange. Also, the impacts from Sandy shut down multiple airports and train
stations across the Northeast, and residents of New York and northern New Jersey were faced
with a major gas shortage after the storm. Heavy rains and flash flooding were the main hazard
in the Chesapeake Bay area, where the storm closed several schools, business, and major
highways across the northern Mid-Atlantic States. Farther inland, record-breaking early-season
snow fell in the Appalachians from the Smoky Mountains to Western Maryland. The most
significant totals were over the higher elevations of West Virginia as well as North Carolina,
where three feet of snow were observed (Fig. 4b). The rain, snow, and winds from Sandy left
over 8 million people without power from the Atlantic coast to the Great Lakes, and some homes
in New York and New Jersey were without power for weeks after the storm. Damage from the
winter storm component alone from Sandy amounted to over $31 million. One death directly
resulted from the winter storm component of Sandy, when a tree fell on a person in West
Virginia due to the heavy snow and high winds.
Sandy also created a stir in the meteorological community. The unique hybrid storm left
room for debate on what exactly to call the storm, which was given labels such as
“Frankenstorm” and “Superstorm Sandy”. The National Weather Service referred to the storm as
7

“Post-Tropical Storm Sandy”. Even within the NWS, the uncertainty on the exact time Sandy
would transition from tropical to post-tropical led to some confusion as to which office should be
issuing statements on the storm and what types of watches and warnings should be posted across
the Mid-Atlantic and New England States. Despite the debates and uncertainty, Sandy was a very
well-forecast storm. NWS forecasters highlighted the event six days in advance, which provided
government responders and the public time to prepare for the event.
b. Early Season Nor’easter (6-7 November)
1) Meteorological Overview
A strong early November winter storm impacted areas of the coastal Northeast U.S.,
which only a week earlier dealt with the destructive impacts from Hurricane Sandy and its
extratropical transition. The pattern aloft during this period featured an anomalous ridge across
the central Great Basin/Desert Southwest which favored negative heights over the eastern states.
A split flow regime was in place with an active southern branch of the jet carrying shortwave
energy from the lower Mississippi valley to the Southeastern U.S. coast on 6 November. This
impulse turned northward in response to downstream ridging where the system gained a negative
tilt across the coastal Carolinas between 06-12 UTC on 7 November. During the following 12
hours, this intensifying disturbance would begin interacting with a northern stream shortwave
which led to further deepening of the surface low as it neared the 40°N/70°W benchmark (Fig.
5).
Further support for intensification existed as a 300 hPa jet streak tracked offshore of the
Carolina coast placing the coastal Mid-Atlantic in the favorable left-exit region of the jet. As the
low-level circulation continued gathering strength on its approach northward on the morning of 7
November, the 850 hPa moisture transport dramatically picked up strength offshore of southern
8

New England between 16-21 UTC on 7 November. This region was collocated within an
enhanced region of 850 hPa frontogenetic forcing with observations supporting a 14°C (~25°F)
gradient across the boundary. At the western fringe of this strong baroclinic zone was an area of
weakly negative equivalent potential vorticity (EPV) within the 800-750 hPa layer. In the
presence of a saturated lower-to-mid troposphere, the diminished EPV values resulted in
considerable conditional symmetric instability (CSI) across the coastal Northeastern U.S.
During this particular timeframe, much of the moderate to heavy snowfall commenced
from southern New Jersey north to eastern Massachusetts (Fig. 6). During this particular event,
snow was the dominant precipitation type given the further offshore low track. This in
conjunction with a surface ridge that set up across central Quebec allowed modified Arctic air to
advect into the northeastern U.S. Additionally, the tightening pressure gradient over the region
(particularly during the 18-00 UTC on 7-8 November timeframe) led to strong wind gusts along
coastal New England. Local wind observations suggested gusts up to 76 mph over Buzzards Bay,
MA during the height of the event, while 55-65 mph reports were commonplace elsewhere in the
region.
2) Impacts
A pair of embedded heavier snowfall amounts of up to 13.5 in. of snow was located
across central New Jersey and south-central Connecticut, where mesoscale banding was
observed (Fig. 6). As this region of the U.S. had just dealt with the impacts of Hurricane Sandy
only a week prior, it did not take much damage to further affect local infrastructure. The
combination of heavy precipitation, near hurricane force wind gusts, and high seas in excess of
8-ft at local beaches led to over 375,000 additional power outages across New Jersey, New York,
and Connecticut. By 14 UTC on 8 November, reports suggested up to 715,000 homes and
9
businesses over the Northeast were without power due to the combined impacts from these two
storms. Further, nearly 2,000 flights were cancelled from local airports; and a number of park
and coastal roads were closed. Monetary damages of $940 thousand were reported for this event,
primarily the result of high winds. No deaths or injuries were directly attributed to the winter
weather aspect of this event.
c. Western U.S. Heavy Precipitation (29 November – 5 December)
1) Meteorological Overview
During the last week of November, a longwave trough south of the Aleutian Islands
moved into the northeastern Pacific while a ridge began to build along the west coast of North
America. The long wave trough then evolved into a large cut-off low in the northeastern Pacific
and became nearly stationary. A series of low pressure systems developed to the south of this
circulation and were directed eastward towards the west coast of the U.S. This general pattern
lasted for more than a week before it ended. A total of five low pressure systems moved onshore
during this period and delivered considerable amounts of precipitation through the western
states.
System #1: Moisture from the first low pressure system rapidly approached the West
Coast on 28 November (Fig. 7a). Precipitation reached the coast of northern California and the
Pacific Northwest early in the morning and overspread these areas during the day. Energy then
began to split into two pieces and penetrated rapidly inland. By late in the afternoon, rain and
snow began to taper off. Overall, the bulk of the precipitation fell in northern California (Fig.
7b).
System #2: As soon as system #1 exited, another frontal system was rapidly moving in
from the Pacific. During the morning hours on 29 November, precipitation overspread the same
10

general regions that were affected by system #1. But unlike system #1, precipitation lingered
much longer over the northern half of California well into 30 November (Fig. 7c).
System #3: While system #2 was still affecting northern/central California, system #3 was
beginning to approach the Pacific Northwest (Fig. 7c, d). The bulk of the moisture precipitated
from the coastal section of Washington and Oregon eastward into the Cascades throughout the
night on the 30 November, and began to spread into northern California by early on 1 December
(Fig. 7d).
System #4: Just as system #3 began to lose its grip on the West Coast, system #4 was
forming off the coast of northern California on 1 December. Much of the precipitation fell along
the coast from northern California through Washington and became quite heavy by the evening
(Fig. 7e). A stronger push of the cold air behind this system advanced a frontal system well
inland. The associated precipitation moved into the Great Basin, the Intermountain West, and
eventually northern and central Rockies later on 2 December (Fig. 7f).
System #5: Behind system #4, a cool high pressure system built across much of the West,
allowing a welcome break in the recent spell of active weather on 3 December. However, some
light precipitation continued to linger in the Pacific Northwest (Fig. 7f). Meanwhile, another low
pressure system was strengthening in the Pacific, midway between the Hawaiian Islands and the
West Coast. A distinct plume of high moisture from the subtropics, known as an “atmospheric
river,” spread rapidly east-northeastward from the Hawaiian Islands into northern California by
late in the afternoon on the 3 December (Fig. 7g). By the evening hours, widespread heavy
precipitation inundated western Oregon and Washington. The intensity of the precipitation began
to lessen somewhat during the day on 4 December. However, a reinforcing surge of energy from
the Pacific sustained the heavy precipitation in northern California throughout the night on the 4
11

December (Fig. 7h) before this lengthy event finally tapered off during the day on 5 December
(Fig. 7i).
2) Impacts
The long duration of the entire event from multiple systems resulted in copious amount of
precipitation across a wide area of the West. This included reports of snowfall totals greater than
40 inches at a couple of mountainous locations in northern California and Idaho (Fig. 8). There
were also unconfirmed reports of more than 5 feet of snow in the high Sierra. Some of the lower
elevations in northern California received over 20 inches of rain resulting in sudden rise of water
in rivers and streams. Over 15 inches of rain fell in parts of Oregon and Washington as well. In
addition to heavy precipitation, hurricane force wind gusts up to 150 mph were recorded in the
mountainous terrain of California, Montana, Nevada, Oregon, and Utah. Monetary damages of
$402 thousand were reported for this event, primarily the result of high winds. No deaths or
injuries were directly attributed to the winter weather aspect of this event.
d. Northern Plains and Upper Midwest Snowstorm (9-10 December)
1) Meteorological Overview
An ideal weather pattern became established over much of South Dakota, Minnesota, and
Wisconsin for a significant winter storm. A vigorous 500 hPa shortwave moved from the
northern plains into the Upper Midwest on the morning of 9 December, along with significant
positive vorticity advection and deep layer ascent. At the surface, a 1035 hPa Arctic high from
Canada moved over the Dakotas by the afternoon of 9 December (Fig. 9), which provided the
cold air necessary for heavy snowfall. To the southeast of this ridge, a surface low began to
develop in western South Dakota during the evening of 8 December. The surface low moved
northeastward into extreme southern Minnesota with a pressure of 1008 hPa by 18 UTC on 9
12
December. Most of the snow fell north and east of the surface low before the low reached
Minnesota. By 18 UTC on 10 December, the low had moved to southern Quebec and
strengthened to 997mb.
2) Impacts
Heavy snow fell over much of South Dakota and the Upper Midwest on 9-10 December,
2012 (Fig. 10). The greatest snow amount occurred in the town of Sacred Heart, Minnesota,
where 17.3 inches of snow fell. A swath of greater than 10 inches occurred in eastern South
Dakota, southern Minnesota, and western Wisconsin, including Minneapolis with 10.5 inches
and East Farmington, WI, with 14.0 inches. In addition to the heavy snow that fell with this
system, there were also numerous reports of high wind gusts, including 53 mph at Kimball,
Nebraska, 52 mph at Ellsworth Air Force Base, South Dakota, and 50 mph at Huron, South
Dakota. The heavy snowfall affected transportation throughout the Upper Midwest. There were
about 150 flight cancellations at the Minneapolis-St. Paul International Airport. Also in
Minnesota, there were about 600 automobile accidents throughout the state during the event,
according to the Minnesota State Patrol. In South Dakota, blizzard conditions resulted in the
closure of sections of Interstates 29 and 90. Monetary damages reported for this event were
minor, amounting to less than $1 thousand. No deaths or injuries were directly attributed to the
winter weather aspect of this event.
e. Pacific Northwest Winter Storm (17 December)
1) Meteorological Overview
The most intense storm of the early 2012-2013 winter season moved ashore as an area of
deep low pressure in western Washington early on 17 December. This system was associated
with a rapidly moving shortwave trough that moved eastward across the eastern Pacific and was
13
associated with a 972 hPa surface low that came ashore around 09 UTC on 17 December before
heading eastward and weakening over the complex terrain of Washington (Fig. 11b).
The main effects of the storm were heavy rain, high winds and high elevation snow. As
the storm moved inland, numerous advisories and warnings were issued for much of the western
United States, including winter storm and blizzard warnings, storm warnings along the west
coast as well as high wind warnings across the Portland, Oregon metropolitan area.
2) Impacts
Some of the high wind reports included 101 mph at Mary’s Peak, OR, and 94 mph at
Crystal Mountain, WA, at high elevations. Winds also exceeded hurricane force in places along
the Oregon and Washington coast, including 84 mph at Cape Disappointment, WA, 81 mph in
Lincoln City, OR, 76 mph in Newport, OR and 69 mph in Seattle, WA. Some snowfall totals
(Fig. 11a) exceeded a foot across northern California and Idaho, 20 inches at Santiam Pass, OR
and over 18 inches near Leavenworth, WA, with as much as 2 to 3 feet in the Cascades.
This storm was responsible for generating high waves along the Washington and Oregon coasts,
where winds gusted in some areas above hurricane force. Power outages were common across
western Washington and Oregon, in and around Seattle and Portland. Travel across the Cascades
was dangerous to nearly impossible during the storm. Monetary damages of $1.1 million were
reported for this event, primarily the result of high winds. No deaths or injuries were directly
attributed to the winter weather aspect of this event.
f. Plains to Northeast Christmas Storm (25-28 December)
1) Meteorological Overview
A vigorous upper-level shortwave crossed the southern U.S. Rockies on Christmas Eve,
and exited into the southern plains on Christmas Day. The shortwave interacted with a
14
preexisting Arctic frontal zone draped in the lee of the Rockies, across central Texas, and into the
lower Mississippi River valley. As this interaction occurred, a surface low developed along the
Arctic frontal zone across southeastern Texas on Christmas morning. Snow and freezing rain
began to fall north of the developing surface low across Oklahoma early on Christmas morning
as Arctic air advected into the region on sustained northerly winds of 20 to 30 kt. Snow began
falling as far south as the Dallas metropolitan area Christmas evening as the surface low moved
into northern Louisiana. The storm system continued to intensify, and by 00 UTC on 26
December, the low pressure area became closed off below 500 hPa. The surface low tracked
northeastward to the Tennessee River valley by 12 UTC on 26 December (Fig. 12a), as it
deepened to a pressure of 994 hPa and the cyclone began to occlude. During the 12 hours ending
at 12 UTC, snow and freezing rain had spread into much of the Ohio River valley. Sustained
winds of 30 knots or higher caused blowing snow, with blizzard conditions reported in many
areas of the middle Mississippi and Ohio River valleys.
By the afternoon of 26 December, the surface low was centered over Kentucky. The
frontal wave had fully occluded and the surface low began to weaken. At the same time, a new
surface low developed and intensified over the coastal plain of North Carolina as the upper-level
low interacted with a coastal frontal zone, with snow and freezing rain spreading into the
northeastern U.S. Through the evening of 26 December and into the morning of 27 December,
this surface low tracked northeastward along the Mid-Atlantic coastline (Fig. 13) as it continued
to deepen. By 12 UTC on 27 December (Fig. 12b) the central pressure of the surface low had
deepened to 987 hPa, centered just south of eastern Long Island. The surface low continued to
move along the New England coastline through the day, reaching the Gulf of Maine by 00 UTC
15
on 28 December. A swath of moderate to heavy snow accompanied the system across most of
New England, with rain along the southern New England coast.
2) Impacts
The storm produced a large swath of 6 to 12 inches of snow from Texas to Maine (Fig.
13). Widespread 10 to 18 inch snowfall amounts occurred across northern Pennsylvania, Upstate
New York, and northern New England. The highest reported snowfall total from the storm of 27
inches was reported in Woodford, VT. Freezing rain accumulations of up to 0.50 inch occurred
over areas of Pennsylvania and West Virginia. Wind gusts in excess of 60 mph occurred across
much of the coastal Mid-Atlantic region, with a hurricane force wind gust of 74 mph measured
near Milton, MA. The high winds were associated with the intense pressure gradient between the
deepening Mid-Atlantic/Northeast coastal low and an expansive area of high pressure across
Ontario into the western Great Lakes.
The storm left hundreds of thousands of residents without power for several days in the
swath of heavy snow. Some of the worst power outages occurred in Arkansas where over 100
thousand residents were without power for days due to heavy snow and freezing rain.
Additionally, thousands of flights were delayed or cancelled due to the extreme winter weather
conditions. Monetary damages of nearly $120 million were reported for this event, from a
combination of heavy snow, high winds, and coastal flooding. Four fatalities were directly
attributed to the event, including three resulting from exposure/hypothermia and one as a result
of a fallen tree in strong wind.
g. Lower Mississippi River Valley to Northeast Winter Storm (16-18 January)
1) Meteorological Overview
16

From 16-18 January, 2013, as a deep upper-level low moved across the southern U.S.,
snow spread from Louisiana to southern Virginia (Fig. 14a). Long Island and southeastern New
England also received some light snow as the system moved offshore (Fig. 14b). This occurred
as moisture and a series of shortwave troughs propagated northeastward along the leading edge
of a large scale trough that extended from the northern plains into the Southwest.
On the evening of 15 January, a cutoff upper low developed in the base of the trough as it
moved east from the Southwest across the southern Rockies into the adjacent high plains. By the
morning of 16 January, a deep closed low developed and moved over central Texas, rotating into
the eastern parts of the state by that evening (Fig. 15). Snow fell across portions of the lower
Mississippi into the Tennessee valleys as moisture was lifted from the Gulf of Mexico. The
trough began to assume a slight negative tilt as it swung progressively from the lower
Mississippi valley to the southern Appalachians on 17 January. A frontal boundary that
represented the leading edge of the Arctic air mass that had moved into place earlier in the week,
lingered across the Carolinas into the central Gulf of Mexico. A surface low positioned along the
boundary began to strengthen over northern Georgia before tracking east-northeastward into the
Carolinas. In addition to strong upper divergence afforded by favorable upper jet dynamics,
strong low-level frontogenesis coinciding with an area of negative geostrophic equivalent
potential vorticity (EPVg) was noted across western North Carolina into far southern West
Virginia (Fig. 16). Interacting with moisture that continued to stream north from the Gulf of
Mexico, these ingredients are thought to have contributed to the heaviest snow accumulations
that occurred during this event. This precipitation was relatively short-lived however, with the
back edge of the precipitation shield progressing steadily across North Carolina and southern
Virginia, then moving off of the middle Atlantic coast during the early morning of hours of 18
17
January behind the departing low. As the system moved offshore, the northern edge of the
precipitation shield brushed Long Island and southern New England during the overnight hours.
2) Impacts
Up to 4 inches of snow fell across portions of central and northern Mississippi and
northern Alabama, an area unaccustomed to frequent snows, and resulted in several new daily
snowfall records. Snow accumulations of up to 6 inches were reported over far eastern Kentucky
and Tennessee. The heaviest amounts of the event fell across far northwestern North Carolina,
southwestern Virginia and far southern West Virginia, where accumulations of 12 to 15 inches
were reported, breaking numerous daily snowfall records, and resulting in numerous power
outages across the region. Monetary damages of $2 million were reported for this event, from a
combination of heavy snow, ice, and strong winds. No deaths or injuries were directly attributed
to the winter weather aspect of this event.
h. Great Lakes to Northeast Winter Storm (7-9 February)
1) Meteorological Overview
A major winter storm affected the Great Lakes with up to a foot of snow and the
Northeast with 1-3 feet of snow on 7-9 February (Fig. 17a). The storm underwent “bomb”
cyclogenesis, deepening 24 hPa in 24 hours from 994 hPa at 12 UTC on 8 February to 970 hPa at
12 UTC 9 February (Fig. 17b). The main culprit for the rapid intensification was the phasing of
the northern and southern stream jets and merging of their respective mid-level energy. The state
of the atmosphere on the days leading up to the intense cyclogenesis was characterized by zonal
flow, but an anomalous ridge in place in the North Atlantic and an upstream digging trough over
California led to a rapid amplification of the flow pattern across the U.S. from 6-9 February (Fig.
18).
18

Southern stream energy over the Mexican Plateau moved into the Gulf of Mexico by 06
UTC on 7 February, leading to the development of a surface cyclone off the Texas coast. The
northern stream energy originated in the Gulf of Alaska and crossed the northern Rockies before
a surface cyclone developed in Montana by 12 UTC on 7 February. A trough digging into the
southwest U.S. led to upstream amplification, including the simultaneous amplification of both
the southern and northern stream troughs moving into the eastern U.S. With downstream
blocking in place, the troughs were forced to phase along the Eastern Seaboard. The merging of
the two systems took place from roughly 00 to 06 UTC on 9 February and coincided with the
period of most intense snowfall rates and rapid deepening of the surface low in the Atlantic. The
confluence of the southern and northern stream 250 hPa jets began around 00 UTC on 9
February. By this time, the amplification of the flow pattern had turned the surface low
northeastward up the Mid-Atlantic coast to a position south of Cape Cod. The merging of the
mid-level vorticity maxima occurred between 00-06 UTC on 9 February with the strengthening
southern stream storm absorbing the northern stream energy. Another factor that led to the rapid
intensification at this time was strong upper-level divergence due to the coupled entrance/exit
regions of the jet streaks immediately upstream and downstream of the consolidating vorticity
center.
Strong surface frontogenesis created a low-level lifting mechanism for heavy snowfall to
develop. Anomalous high pressure in place across eastern Canada allowed the sub-freezing
surface temperatures to stay in place as the storm advected the warmer marine layer toward the
New England coast, allowing a strong front to set up in a north-south orientation along the coast.
At 850 hPa, a very strong easterly jet developed in response to the strong baroclinicity at the
surface. Easterly 850 hPa winds of 70 kt observed at Chatham, MA indicated a strong low-level
19
jet supplying Atlantic moisture westward into the cold sector of the storm. A strong mesoscale
banding feature set up across central Long Island and central Connecticut just west of the strong
surface frontal zone and at the nose of the 850 hPa jet. Snowfall rates of 3-4 inches per hour were
observed in this band, with one report of 6 inches in one hour in central Connecticut.
2) Impacts
Major impacts were felt across the Northeast where 1-3 feet of snow fell (Fig. 17a).
Portland, Maine had a record snowfall with 31.9 in., and Boston received its fifth highest total
with 24.9 in. Hartford received its second highest total with 22.8 in. Hamden, CT received 40 in.
of snow, which was the highest reported total of the storm. Hurricane-force winds along the
coast caused coastal flooding in Massachusetts; and Boston received its fourth highest storm
surge of 4.2 feet. Over 600,000 people lost power during the storm and over 6,000 flights were
cancelled. Monetary damages of $54 million were reported for this event, resulting primarily
from a combination of heavy snow/blizzard and coastal flooding. Seven fatalities were directly
attributed to the blizzard conditions that occurred during this event, making this the deadliest
winter storm of the season.
i. Northern Plains and Upper Midwest Winter Storm (10-11 February)
1) Meteorological Overview
A powerful winter storm moved through the north central U.S., bringing heavy snow,
gusty winds, and icing to portions of the northern plains and Upper Midwest. A mid-level trough
triggered the event as it lifted out of the Southwest and initiated surface cyclogenesis in the lee of
the Colorado Rockies beginning 00 UTC on 10 February (Fig. 19). The surface low deepened as
it tracked steadily northeastward through the central plains on 10 February, beneath the favorable
left exit region of an upper jet streak extending from the southern Rockies into Kansas (Fig. 20).
20

Cold (warm) advection west (east) of the surface low sharpened the 500 hPa trough and allowed
the surface low to continue to deepen while it moved into the Upper Midwest Sunday evening.
While the storm continued with its development cycle, surface winds increased as the
pressure gradient surrounding the low increased, and moisture from the Gulf of Mexico feeding
northward into the storm allowed for heavy rain and snow within the expansive precipitation
shield. The warm Gulf air overrunning a sub-freezing air mass in place led to pockets of freezing
rain and sleet across southern Minnesota and eastward into portions of the Upper Great Lakes.
As the sharpening 500 hPa trough became closed off over Nebraska, a band of intense snow
developed within a deformation zone over the eastern Dakotas and Minnesota. The mid-level
trough quickly became negatively tilted, and the surface low migrated into the cold air as the
system became vertically stacked. By 12 UTC on 11 February, the storm started to track across
southern Ontario, and the deep area of low pressure began to fill and weaken.
2) Impacts
This storm left a wide swath of greater than 4 inch snowfall accumulations stretching
from north-central Nebraska to northern Wisconsin and the Minnesota arrowhead (Fig. 3).
Several reports exceeding a foot of snow were recorded in the narrow deformation axis that set
up over the eastern Dakotas and Minnesota (Fig. 21). Strong sustained winds, with gusts in
excess of 50 mph, surrounded the deep surface cyclone. The high winds, combined with the
heavy snow, created dangerous whiteout conditions. Periods of freezing rain and sleet also made
for hazardous travel conditions over southern Minnesota eastward into the Upper Great Lakes.
Numerous roads and highways were forced to shut down across the region, including portions of
Interstate 90 and 29 in North and South Dakota. Monetary damages of $53 thousand were
reported for this event from a combination of the winter weather and high wind. One fatality was
21
directly attributed to the event, the result of exposure after a motorist left a vehicle after
becoming stranded in blizzard conditions.
j. Central U.S. Winter Storm (20-22 February)
1) Meteorological Overview
A multi-day winter storm brought wintry precipitation across a large portion of the Great
Plains through the Middle and Upper Mississippi valley and into the Great Lakes region. Early in
the period (12 UTC on 20 February), the synoptic pattern featured a highly amplified 500-hPa
flow with a ridge centered over the middle of the U.S., a closed low anchored the lower Great
Lakes, and a strong shortwave located over southern California (Fig. 22a). The progressive
nature of the mid-latitude flow allowed the California shortwave to reach the Texas/Oklahoma
panhandle within 24 hours while becoming negatively-tilted (Fig. 22b). At this point, radar
imagery indicated an expansion in the moderate to heavy precipitation as the 300 hPa flow
became increasingly diffluent over the central plains.
During this synoptic-scale deepening process, low-to-mid level frontogenetic forcing
increased significantly, and was vertically collocated with an axis of slightly negative equivalent
potential vorticity (EPV) values. RADAR and surface observations suggested a large axis of
banded precipitation with temperatures well below freezing, thus supporting snow as the
dominant hydrometeor type. As the broad shield of precipitation moved toward Missouri and
Arkansas, the storm transitioned into a mixed precipitation event. A large flux of above freezing
air between 900-650 hPa overrode a subfreezing boundary layer, resulting in widespread
freezing rain and sleet reports. Sufficient mid/upper-level instability resulting from steep vertical
lapse rates caused some of the precipitation to become convective in nature. Within this
22

convective precipitation, widespread ice accumulations of 0.25 to 0.50 inches were reported,
with isolated higher amounts (Fig. 23a).
Ahead of the intensifying shortwave, low-level moisture continued to overrun a surface
warm front near the Gulf Coast (Fig. 24), with mixed precipitation reported over much of the
Ohio valley. Farther north, across the middle Mississippi valley and Upper Great Lakes, vertical
temperature profiles were completely below freezing, thus maintaining snow throughout the
event. While 6 to 12 inches of snow was common over this region, a heavier band associated
with the deformation zone/comma-head set up across central Kansas. As the parent upper-level
low rapidly strengthened and became more negatively-tilted over Oklahoma and Kansas during
the afternoon of 21 February, mesoscale banding resulted in snowfall rates nearing 3 inches per
hour. There were also numerous reports of thundersnow. This heavier snow band occurred just
north and west of the surface low (Fig. 24) in association with the strongest mesoscale ascent.
Local snowfall measurements indicated a broad region of one foot across central Kansas, with a
maximum ranging from 19 to 22 inches just north and south of interstate 70 between Hays and
Russell, KS (Fig. 23b). Some locations reported near record amounts with Mid-Continent
Airport in Wichita, KS measuring 14.2 inches of snow, which ranked second highest from an
individual storm.
2) Impacts
Widespread snow and ice impacted a significant portion of the central U.S. and caused
numerous societal impacts. Reduced visibility within heavier snow bands caused sections of
Interstate 70 to be closed in Kansas and Missouri on 21 February. Many other roads were littered
with stalled/abandoned vehicles as the intense snowfall rates led to very hazardous driving
conditions. Additional impacts included the closure of Kansas City International Airport and
23

states of emergency issued for Kansas and Missouri. Monetary damages of $1.7 million were
reported for this event, largely the result of the freezing rain/ice storm component of the storm.
No deaths or injuries were directly attributed to the winter weather aspect of the event.
k. Plains to Northeast Winter Storm (25-28 February)
1) Meteorological Overview
During the period of 25-28 February, snow and blizzard conditions occurred in the plains
and the Northeast while the Gulf Coast experienced heavy rainfall. In the week prior to this
event, much of the plains and the middle Mississippi valley had already received impressive
snowfall amounts. This low-pressure system brought additional paralyzing snow to the middle
Mississippi valley and white-out blizzard conditions to the Texas Panhandle.
On the morning of 25 February, a closed and deeply layered 500-hPa low was located
over the Texas Panhandle and moved toward the middle and lower Mississippi valley. The mid-
level low followed a southern track and intensified as it moved over the southern plains. As the
surface low tracked to the south and southeast of Amarillo, it brought blizzard conditions,
including heavy snow and strong winds. The National Weather Service Weather Forecast Office
in Amarillo, TX reported 19 inches of snow on site with nearly 6 foot drifts; in addition, 75 mph
wind gusts and 50 feet visibilities were reported.
Once the 500 hPa low turned northeast toward the middle Mississippi valley, it gradually
began to weaken. Despite the weakening, a vorticity maximum assisted in producing up to 10
inches of snow. Thus, two snowfall maxima occurred northwest of the surface low in the Texas
Panhandle and Western Missouri (Fig. 25). In addition, a surface low also developed along the
Mid-Atlantic coast; this set up a freezing rain event along the Appalachians from Pennsylvania to
North Carolina. On 27 February, the 500 hPa low continued to weaken and the primary surface
24
low moved north from Virginia to northern Maine. Nonetheless, some snow fell in the interior of
the Northeast (Fig. 26).
2) Impacts
With such a historic event for the Texas and Oklahoma Panhandle, the public felt the
effects of such a significant system. This was the third largest snowfall event in Amarillo.
Interestingly, NWS Amarillo did not set a record for a calendar date. Although they received 19
inches of snow on that day, the record was 19.3 inches on 25 March, 1934. Thousands of people
lost power in both Texas and Oklahoma, hundreds of motorists were stranded on interstates, and
flights were cancelled at both Dallas-Fort Worth International Airport and Oklahoma City
Airport. By the time this system moved out of the Midwest and headed for the Northeast, over
1,000 flights were grounded at the Chicago O’Hare International Airport. Monetary damages of
$15.5 million were reported for this event, primarily the result of the blizzard conditions. Two
fatalities were directly attributed to the event, one the result of exposure to cold/wind chill and
the other the result of a tree falling on a vehicle in strong gradient winds behind the system.
l. Upper Midwest to Mid-Atlantic Winter Storm (5-8 March)
1) Meteorological Overview
A winter storm developed over the Upper Midwest on the morning of 5 March that
eventually traveled to the East Coast by the 7 March. The storm originated from an eastern
Pacific shortwave that moved across British Columbia and then tracked into the northern plains.
Around the same time as the surface low was producing wintry precipitation over the Upper
Midwest, lee cyclogenesis led to the development of a southern stream low that tracked from the
central plains and eventually merged with the northern stream disturbance. As a result, a strong
25

coastal low developed near the Virginia coast, and tracked slowly out to sea (Fig. 27). However,
the northern edge of the storm affected eastern parts of New England.
This storm proved difficult to forecast along the East Coast for a few reasons. Along the
Interstate 95 corridor, boundary layer temperatures proved to be the greatest factor in the amount
of snow that fell. Model forecasts depicted 850 hPa and 925 hPa temperatures cold enough for
snow in these areas, but they had difficulty resolving the warmer marine layer temperatures
below 925 hPa from the Atlantic Ocean. Similar precipitation type forecasting concerns arose in
coastal areas of New England as milder air from the Atlantic overspread the limited amount of
cold air already in place. Another forecast problem for the Northeast U.S. was the strength of the
downstream ridging and the ultimate track of the surface low. Most model guidance forecasted a
more eastward track, farther away from New England owing to a stronger-than-expected ridge.
These forecasts did not verify, as the ridge was weaker and allowed the storm to track farther
west.
2) Impacts
This winter storm had a significant impact on much of the Midwest, Ohio valley, Mid-
Atlantic, and eastern New England. There were numerous reports of at least 12 inches of snow in
northwestern Virginia, with some in excess of 20 inches. Another area of very heavy snow
occurred over eastern Massachusetts, where amounts on the order of 2 feet were observed (Fig.
28). Most of this snow was heavy and wet with low snow-to-liquid ratios. The weight of this
snow was enough to damage trees and power lines, resulting in numerous power outages. Along
the coast of Maine and Massachusetts, beach erosion from the strong onshore winds and high
waves damaged or destroyed many waterfront houses. Total monetary damages of $3.58 million
were reported for this event, the result of a combination of heavy snow/blizzard conditions and
26

coastal flooding. One fatality, the result of exposure to cold/wind chill in Wisconsin, was directly
attributed to the event.
m. New England Winter Storm (18-20 March)
1) Meteorological Overview
A split flow upper-level pattern was in place across the CONUS in mid-March 2013. On
18 March, a vigorous upper-level trough in the Polar jet and the associated occluded surface low
pressure system were moving across the Great Lakes. Meanwhile, a coastal “Miller-B” low-
pressure system developed along the Mid-Atlantic coastline late on 18 March as a shortwave in
the Subtropical jet interacted with a coastal baroclinic zone associated with cold air damming
east of the Appalachians (Miller 1946). At 12 UTC on 19 March the strengthening coastal
surface low was centered just south of Long Island, NY with a central pressure of 1004 hPa. By
this time, snow was already falling across much of southern and central New England. The most
intense snow fell during the day on 19 March as the surface low moved northward and continued
to deepen as the Polar and Subtropical systems partially phased. By 00 UTC on 20 March, the
low had moved northward to near Provincetown, MA with a central pressure of 998 hPa. During
the initial development of the surface low, deepening may have been inhibited by unfavorable
upper-level jet dynamics. Through late in the day on 19 March, the surface cyclone remained in
the right exit region of the 300-hPa jet. However, by the early morning hours of 20 March, the
surface cyclone was positioned in the divergent left exit region of the upper-level jet. The surface
low deepened 11 hPa in the 24 hours prior to 00 UTC on 20 March; and deepened an additional
13 hPa (to a central pressure of 986 hPa) in the following 12 hours, by 12 UTC on 20 March.
The rapid deepening was presumably aided by the enhanced upper-level divergence.
27
The heaviest snow fell within a band of strong 850 hPa frontogenetic forcing (Fig. 29).
This frontogenetic band slowly shifted north across New England from the early morning hours
of 20 March through much of the day as moderate to heavy snow fell. The frontogenetic band
persisted across Maine into the day on 20 March, much longer than across southern New
England, as the cyclone strengthened offshore and a well-defined “comma-head” feature
developed.
2) Impacts
Snowfall totals of greater than 4 inches were numerous across New England with the
event (Fig. 30). The heaviest snow fell across an area including portions of northern Vermont,
New Hampshire, and Maine where snowfall amounts averaged to 10 to 18 inches. Additionally,
freezing rain accumulations of up to 0.30” occurred over portions of northeastern Pennsylvania.
The most significant impacts of the storm remained north of Boston, which only received 1 to 3
inches of snow. Nonetheless, Boston public schools were closed during the event. Numerous
flights were cancelled at airports across the northeastern U.S. Total monetary damages of $364
thousand were reported for this event, primarily the result of heavy snow, high winds, and
coastal flooding. No fatalities or injuries were directly attributed to the winter weather
component of this event.
n. Central and Eastern U.S. Winter Storm (23-26 March)
1) Meteorological Overview
This late-March snow event occurred during a period of an anomalously low negative
North Atlantic Oscillation index when a large upper-level low remained anchored in southeastern
Canada. On 22 March, a shortwave embedded within a broad trough in western Canada began to
amplify and move southward into the western U.S. The best lifting mechanism began to set up
28
over the central Rockies where a surface low pressure center formed in the foothills of central
Colorado. On 23 March, snow developed quickly during the evening in northeastern Colorado
and expanded in coverage across Nebraska and Kansas. Meanwhile, low-level cold air continued
to advect southward into Colorado. Replenishing shortwave energy associated with the broad
upper-level trough acted to sustain the heavy snow in Colorado throughout much of the day on
23 March. Snow finally tapered off in the evening of 23 March after producing accumulations of
10 to 20 inches in northeastern Colorado. Late on 24 March, the last piece of shortwave energy
began to move around the base of the upper-level trough and exited the central Rockies. In
response, the surface low and associated precipitation accelerated eastward across the central
plains.
Early on 24 March, upper-level divergence ahead of the system began to induce the
formation of a secondary surface low pressure center near the border of Missouri and Arkansas.
An area of light to moderate snow developed and remained anchored to the northwest of the low
center. Meanwhile, the primary low pressure center over the central Gulf coast moved eastward
along the warm front. Widespread showers and thunderstorms developed as southerly flow
advected moisture from the Gulf of Mexico and instability increased in the vicinity of the warm
front. As a result, widespread heavy rain and thunderstorms swept across the Southeast on the
morning of 24 March. The moisture also spread northward over the cold air in Virginia where a
period of moderate snow fell in the afternoon over the central Appalachians. By the evening
hours, snow was exiting Virginia while mixed snow and sleet overspread the Mid-Atlantic
States. As the wide swath of precipitation swept across the Eastern Seaboard, the secondary low
in the middle Mississippi valley intensified rapidly and became the primary low pressure center
later on 24 March. The area of moderate to heavy snow on the northwestern quadrant of the low
29
expanded across the Midwest and into the Ohio valley. The heaviest snow fell near a surface
inverted trough located to the northwest of the low center (i.e. under the “trowal”). Thundersnow
was also observed during the height of the storm. The high snowfall rates broke 24-hour snowfall
records in central Illinois.
The intensification of this low was rather unusual, as it occurred within the polar air mass
without a preexisting surface frontal zone. It appeared that cyclogenesis commenced as an upper-
level front associated with the energized shortwave trough began to build down to the surface.
Surface analyses show that frontogenesis was most apparent to the south of the intensifying
surface low as the upper-low approached from the west.
The anomalous intensification of the secondary low was relatively short-lived as the
surface low center suddenly tracked northward into Ohio whereas the upper low center continued
to track eastward towards the Mid-Atlantic States during the night of 24 March (Fig. 33). The
sudden change of vertical tilt of the storm led to its rapid dissipation during the morning of 25
March. Meanwhile, the upper-level low continued to move eastward into the Mid-Atlantic region
and began to tap into Atlantic moisture. The antecedent primary surface low in the Southeast
began to intensify off the coast of North Carolina during the night of 24 March and early on 25
March as the Ohio valley low weakened (Fig. 31a). As this transfer of energy occurred, wet
snow started to develop in the Mid-Atlantic region before sunrise on 24 March with temperatures
hovering at or slightly above freezing under northwesterly winds. The snow then spread farther
north into New Jersey and Long Island during the day (Fig. 31b) and into the evening hours
before tapering off during the overnight hours as the storm deepened just off the Mid-Atlantic
coast (Fig. 33).
2) Impacts
30
The storm brought widespread significant snowfall across the country from the Rockies
to the East Coast with three distinct snowfall maxima (Figs. 32 and 33). In northeastern
Colorado, near-blizzard conditions prompted highway closures during the height of the storm. To
the north of Denver, a crash on Interstate 25 resulted in a pile-up with as many as 50 vehicles
involved. One positive aspect with the snow was that it brought much-needed precipitation to a
drought-stricken Colorado. Snow accumulations of more than 20 inches were observed in the
Foothills; up to about 18 inches were measured in the High Plains of northeastern Colorado. In
central Illinois, 18.5 inches of snow fell in Springfield, establishing a new 24-hour snowfall
record for the city. Schools were closed for the first time in two years due to snow. Over extreme
western Maryland and nearby West Virginia, a total of 16 inches was observed on the western
slopes of the central Appalachians. Lastly, Washington D.C. received its first one inch snowfall
on 25 March in the entire winter with 1.4 inches measured at Reagan National Airport. This
ended a recording-breaking streak of 788 days without an inch of snow on the ground at the
airport. Total monetary damages of $1.46 million were reported for this event, primarily the
result of high wind. No fatalities or injuries were directly attributed to the winter weather
component of the event.
o. Northern and Central Plains Winter Storm (8-12 April)
1) Meteorological Overview
A major spring snowstorm affected the northern and central plains April 8-12. A strong
cold front diving out of Canada created a strong thermal gradient in vicinity of the High Plains.
Temperatures ahead of the front reached the 60's and low 70's Fahrenheit across portions of
Colorado before falling into the 20's within a few hours. The strong thermal gradient combined
31

with coupled upper level jets and a deep mid-level trough provided the forcing for heavy
snowfall across a large region.
On 8 April at 1200 UTC, a trough at 250 hPa was digging into the western U.S. The jet
maximum quickly rounded the base of the trough and by 00 UTC on 9 April the downstream jet
began to intensify. The High Plains was situated in the left exit region of the jet maximum
exiting the trough, and the downstream jet’s right entrance region. The heaviest snowfall
occurred from approximately 00 UTC on 9 April through 00 UTC on 10 April. This time period
coincides with the best upper-level dynamics due to the coupled jets (Fig. 34a). Heavy snow
continued to fall across portions of the Upper Midwest as the coupled jet region pushed
northeastward. A shortwave trough at 500 hPa digging into the southwestern U.S. on 8 April
deepened to a 548 dm closed low over the southwest by 1200 UTC on 9 April. Strong diffluent
flow was evident at this time over the High Plains downstream of the closed low, likely aiding in
initiating strong vertical ascent over the region. The closed low slowly progressed northeastward,
tracking across the High Plains. A cold winter-like air mass moving southward out of Canada
collided with a warm and moist air mass from the southern plains. This resulted in a very strong
baroclinic zone over the central High Plains by 12 UTC on 9 April (Fig. 34b). Heavy
precipitation fell in the cold sector from northern Colorado to South Dakota where a strong north
northeasterly low-level jet of up to 40 knots was set up. As the 850 hPa low progressed into the
Upper Midwest, the strong baroclinic zone was oriented north/south from the low in Iowa and
then east/west extending into the Great Lakes. Heavy precipitation was observed along both
baroclinic zones. By 12 UTC on 10 April, the system became vertically stacked, and ceased
deepening. The mid-level trough took on a negative tilt and began to fill by 12 UTC on 11 April.
Heavy snow was still falling across the Upper Midwest along the TROWAL (Trough of warm
32

air aloft) feature that was evident by 12 UTC on 11 April. Without the aid of upslope flow,
snowfall totals only reached around a foot across the upper Midwest.
2) Impacts
More than a foot of snow fell across seven states with a maximum of 30 inches in South
Dakota (Fig. 35). Favorable conditions for heavy precipitation at each level of the atmosphere
were collocated in the same region and combined with upslope enhancement to produce
impressive snowfall totals. Major metropolitan areas affected included Denver and Minneapolis,
where 4 to 8 inches of snow fell. High winds, with gusts over 60 mph, were observed behind the
cold front as it cross the central U.S. A strong pressure gradient associated with the strong winds
was evident at 12 UTC on 9 April. Monetary damages of $208 million were reported for this
event, primarily the result of heavy snow, ice, and high winds. One fatality, in Nebraska, was
directly attributed to this event.
p. Northern Plains and Upper Midwest Winter Storm (13-15 April)
1) Meteorological Overview
From 13-15 April a deep upper level low developed and moved eastward across the
northern plains and the Upper Midwest, producing late-season, anomalous snow accumulations
across parts of the region (Fig. 36).
On 13 April a deep upper-level trough moved across western Canada and the
northwestern U.S. with a strong upper jet extending from the eastern Pacific into the Great Basin.
That evening an upper-level low within the trough began to weaken as it moved across southern
Alberta. Meanwhile, a second low center began to develop to its southeast (Fig. 37a). By the
morning of 14 April this newly formed center had rotated into southeastern Montana (Fig. 37b).
Moisture converging on the northwest side of this newly formed system fell as heavy snow
33

across portions of central and eastern Montana. Meanwhile, strong southerly flow ahead of the
low advected deep moisture into a region of strong low-level convergence and upper-level
divergence, which contributed to the development of heavy snows across parts of North Dakota
and northern South Dakota.
The upper low continued to deepen as it moved into the central Dakotas by the evening of
14 April (Fig. 37c). Snow moved east across Minnesota, Wisconsin and the Upper Peninsula of
Michigan along an axis of strong low-level frontogenesis, while support for heavy snow
continued across portions of the central and eastern Dakotas. The low moved east-northeastward
into northern Minnesota by the morning of 15 April (Fig. 37d). Precipitation ahead of the low
continued to move north through the upper Great Lakes region into southern Canada, while
precipitation to the west was reduced to some scattered light snows across eastern North Dakota.
2) Impacts
Up to 14 inches of snow fell across portions of northeastern Montana. Several new daily
snowfall records were set, including Glasgow International Airport which received 6.4 inches on
14 April. Widespread accumulations of over 12 inches, with local amounts of up 22 inches, were
reported across North Dakota and northern South Dakota, breaking numerous snowfall records
there as well. At Bismarck Municipal Airport, the record snowfall amount for any day of the year
was set when 17.3 inches fell on 14 April, breaking a previous record that stood for nearly 50
years. Blizzard conditions were reported in Bismarck, with visibilities dropping to 0.25 mile,
while winds gusted to over 35 mph on the morning of 14 April. A wintry mix fell further to the
south, with up to 0.25 inch ice accumulations reported over northeastern South Dakota. While
snow accumulations to the east were generally lighter, numerous daily snowfall records were set
across Minnesota and Wisconsin. The heaviest amounts across the region centered from the
34
southern Red River valley to the Arrowhead region of Minnesota, where widespread
accumulations of 4 to 8 inches were reported. Monetary damages reported for this event were
low, with less than $1 thousand. No fatalities or injuries were directly attributed to the event.
q. Western and Central U.S. Winter Storm (16-19 April)
1) Meteorological Overview
This storm was one of several that contributed to an exceptionally snowy April for
portions of the Rockies and Upper Midwest. An upper level trough amplified over the western
United States on 16 April as low pressure moved eastward from the Great Basin to southwestern
Colorado (Fig. 38a). An area of cold high pressure remained north of the Canadian border but
cold air spilled southward along the eastern slopes of the Rocky Mountains, allowing heavy
snow to fall especially heavily across Wyoming as temperatures fell from the 20s into the teens
Fahrenheit.
By early morning on 17 April the area of low pressure had moved southeastward across
northeastern New Mexico as snow continued from Colorado northward across Wyoming and
eastward into Nebraska and South Dakota. The upper-level trough continued to move very
slowly eastward while the surface low only moved slowly into northern Texas. A tremendous
temperature gradient was found across Texas as the front east of the low separated temperatures
in the 90s across western Texas from temperatures in the 30s across the northern Texas
Panhandle and temperatures in the teens and 20s from Colorado and the central plains into
Wyoming.
By the morning of 18 April the upper-level trough finally began to lift northeastward
while low pressure redeveloped northeastward along the strong front separating temperatures in
the 60s and 70s across the Ohio valley from much colder air behind the front. Low pressure
35
along the front began to consolidate northeastward toward Chicago with a pressure of around
1000 hPa. During the day, this low continued to intensify as the upper-level trough lifted
northeastward, deepening to 992 hPa over southern Wisconsin at 00 UTC on 19 April and then
to 982 hPa over the Upper Peninsula of Michigan by the morning of 19 April (Fig. 38b). During
this period of more rapid surface development, snowfall rates increased across the Upper
Mississippi valley to the Upper Midwest before the system moved into Canada later on 19 April
and into 20 April.
2) Impacts
Snow initially fell across the higher elevations of the Great Basin, especially across
Nevada into the Wasatch Range in Utah, leaving up to 20 inches in northern Nevada and 13
inches in Utah. However, the heaviest snow developed from northern Colorado into Wyoming,
where blizzard conditions and very heavy snowfall amounts crippled many of the area highways.
Fort Collins received over 23 inches of snow while Boulder received more than 19 inches.
Denver recorded slightly less than 10 inches. Snowfall totals were highest across Wyoming,
where up to 3 feet of snow was reported, including 36 inches at Centennial and between 17 and
19 inches at Casper, Cheyenne, Laramie and Landers.
Snowfall amounts (Fig. 39) were significant but not nearly as great over Nebraska and
South Dakota, where up to a foot of snow fell, with 8 inches at Rapid City (after 28 inches on 8-
10 April) and nearly 10 inches at Scottsbluff, Nebraska. However, once the surface low began to
redevelop northward along the advancing front, snows again became quite heavy, especially
across Minnesota into northwestern Wisconsin, where up to 2 feet of snow fell. While 7.3 inches
were measured at Minneapolis-St. Paul, snowfall amounts increased north of the city. St. Cloud
measured more than 12 inches while Duluth reported 17.7 inches, the heaviest 24 hour snowfall
36

ever in the month of April during the snowiest month of record, when 50.8 inches were totaled
by the end of April 2013. Monetary damages of $35 thousand were reported for this event,
primarily the result of high winds. No fatalities or injuries were directly attributed to the event.
r. Central Rockies to Upper Midwest Winter Storm (1-3 May)
1) Meteorological Overview
A late season snow storm occurred on 1-3 May, and was noteworthy both for producing
impressive snowfall in parts of the plains and Midwest, as well as producing measureable snow
across parts of the South at a time of the year when snow has typically long since ended for the
season. Three separate regions of the United States were significantly impacted from this system,
all receiving snowfall accumulations uncommon for early May. The higher elevations of the
Wyoming and the Colorado Rockies received over a foot of snow, followed by 4 to 8 inches into
the central High Plains, well removed from mountain influences (Figs. 40, 41). The second
region impacted was the Upper Midwest 24 to 36 hours, where a narrow band of snow helped to
blanket portions of Iowa into Wisconsin with 12 to 18 inches. Light to moderate accumulations
of freezing rain were also recorded across parts of the Midwest, a precipitation type which is rare
to see in May. Lastly, measurable snow was reported as far south as Oklahoma and Arkansas, a
first for Arkansas during the month of May since record-keeping began.
The storm began early on 1 May when a deep mid/upper-level trough began to evolve
over the northwestern U.S. as a north-northwesterly upper-level jet of 140 kt entered the Pacific
Northwest. The trough amplified as it reached the central U.S., with a closed low developing
over the central plains by 3 May. Bitter cold temperatures for early spring filtered southward into
the central High Plains behind a strong cold front on 1 May, with low level winds turning to an
upslope direction in the central High Plains, leading to the onset of precipitation. The strong
37
change in air mass caused temperature swings of 55 to 65 degrees Fahrenheit at many locations
in the central and southern plains over roughly a 36 hour period. A combination of favorably
oriented low-level upslope flow, a moisture source initially from the Gulf of Mexico and strong
low/mid-level frontogenesis was present during the heaviest snowfall across Wyoming,
Colorado, Nebraska and Kansas.
As the slow moving cold front progressed eastward through the Plains on 2-3 May, rain
was the initial precipitation type in the post-frontal environment, but a changeover to snow
occurred as cold air continued to filter in from the north. An axis of relatively high equivalent
potential temperature advected northward across the plains, overrunning the shallow cold air
near the surface. Rare accumulations of sleet and freezing rain were reported in Iowa, Wisconsin
and the Upper Peninsula of Michigan. The heaviest snow in the Upper Midwest developed early
on 2 May, collocated with a layer of very strong frontogenesis near 850 hPa, with 10 to 18 inches
falling in a narrow corridor from the central Iowa-Minnesota border into northwestern
Wisconsin. A tight snowfall gradient was evidenced by only a trace of snow being measured at
Minneapolis-St. Paul International Airport compared to locations less than 50 miles away (to the
south and east), which received as much as 18 inches.
2) Impacts
The impacts from this storm were numerous and widespread, breaking many records.
Almost every state that received snowfall from this storm contained cities that broke all-time
records for storm total snowfall for the month of May. For example, Dodge Center, MN received
15.4 inches on 2 May, establishing a new state record for a 1-day snowfall, breaking the previous
record of 12 inches set back in both 1954 and 1938. In Arkansas, measureable snow had never
been reported since record-keeping began back in 1819 for the month of May until this storm,
38

with Decatur picking up 5 inches. Heavy snow was responsible for numerous accidents, road
closures, the closing of schools and businesses as well as power outages from fallen trees and
power lines. Closures and power outage reports were widespread from Colorado to the Upper
Midwest, but numbered greatest from southeastern Minnesota into northwestern Wisconsin
within a narrow band of heavy snow resulting in 10 to 18 inches. Lastly, due to the anomalous
cold, characterized by 850 hPa temperature anomalies of -10 to -16 degrees C across the plains,
temperatures at the surface were more representative of mid-winter than early May. Record low
minimum and maximum temperatures for the month of May were set in locations from
Wyoming to Texas and as far east as Tennessee. Monetary damages of $444 million were
reported for this event, primarily the result of heavy snow and strong winds. No fatalities or
injuries were directly attributed to the event.
5. Summary
The winter weather season of 2012-2013 was a very active one. The events described in
this seasonal review directly resulted in a total of 17 fatalities and at least $444 million in
damages (Table 1). Both of these numbers were a significant increase over the previous winter
weather season of 2011-2012. The 2012-2013 winter weather season got off to an early start with
the winter storm component of Hurricane/Post-Tropical Storm Sandy, and ended late, with
significant snows impacting large parts of the country into early May. Overall, areas of the
northern plains and Midwest received significantly above average snowfall for the season, while
the central Rockies and portions of the Northeast received below average snowfall.
6. Acknowledgements: The authors would like to thank Wallace Hogsett and Mark Klein for
invaluable input and guidance throughout this project.
39
7. References
Barnston, A.G., R.E. Livezey, 1987: Classification, seasonality and persistence of low-frequency atmospheric circulation patterns. Mon. Wea. Rev., 115, 1083-1126.
Blake, E.S., T.B. Kimberlain, R.J. Berg, J.P. Cangialosi, J.L. Beven II, 2013: Tropical Cyclone Report, Hurricane Sandy (AL182012), 22-29 October, 2012.
Kalnay, E. and Coauthors, 1996: The NCEP/NCAR Reanalysis 40-year project. Bull. Amer. Meteor. Soc., 77, 437-471.
Miller, J.E., 1946: Cyclogenesis in the Atlantic coastal region of the United States. J. Met., 3, 31-44.
NOHRSC Interactive Snowfall Maps, NOAA/NWS/OCWWS, 2005 (www.nohrsc.noaa.gov/technology/pdf/Snowfall_Maps.pdf) NWS Natural Hazard Statistics, 2013 (http://www.nws.noaa.gov/om/hazstats/resources/weather_fatalities.pdf) NWS Ridge II Snowfall Analysis (http://www.srh.noaa.gov/ridge2/snow) Storm Data and Unusual Weather Phenomena (www.ncdc.noaa.gov/oa/climate/sd) Thompson, D.W.J., J.M. Wallace, 1998: The Arctic Oscillation signature in the wintertime geopotential height and temperature fields. Geo. Res. Lett., 25, 1297-1300.
40
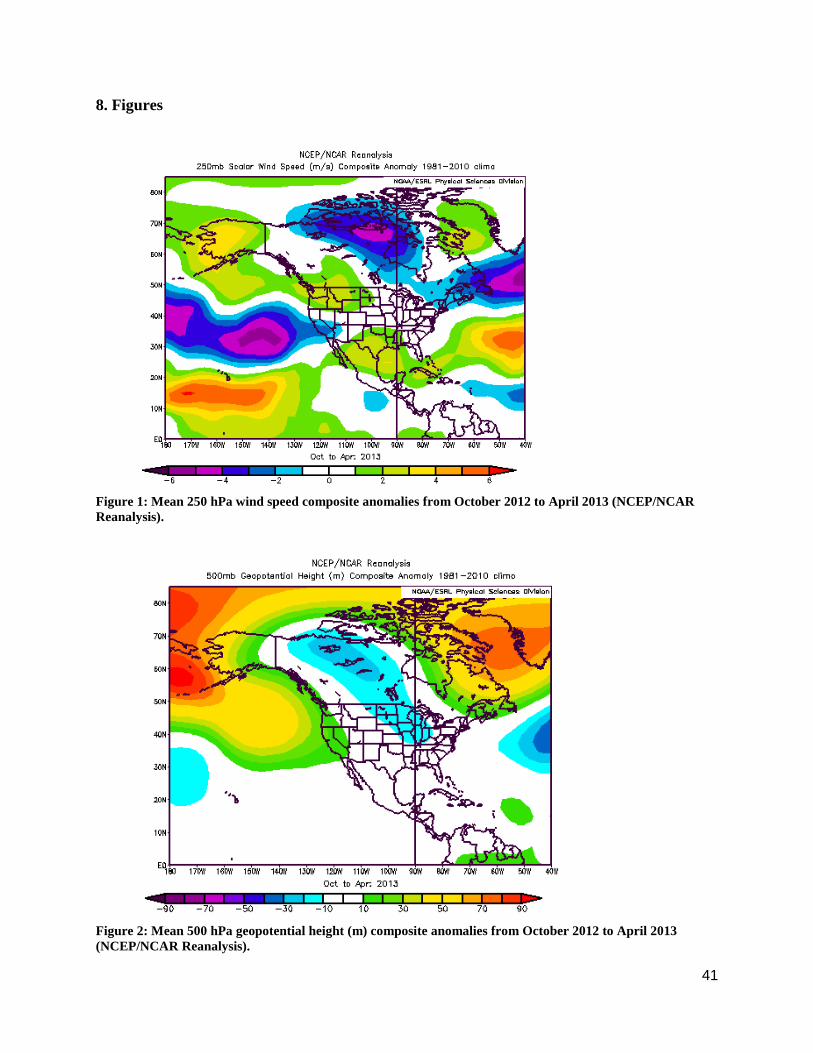
8. Figures
Figure 1: Mean 250 hPa wind speed composite anomalies from October 2012 to April 2013 (NCEP/NCAR Reanalysis).
Figure 2: Mean 500 hPa geopotential height (m) composite anomalies from October 2012 to April 2013 (NCEP/NCAR Reanalysis).
41
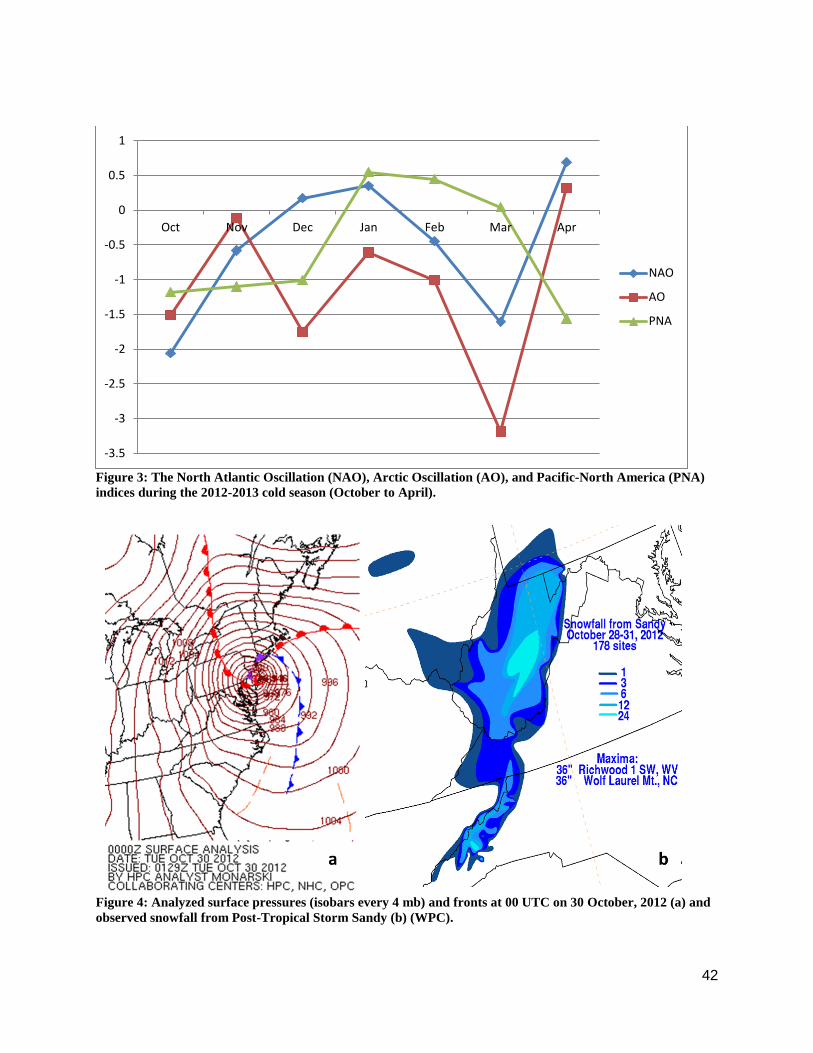
Figure 3: The North Atlantic Oscillation (NAO), Arctic Oscillation (AO), and Pacific-North America (PNA) indices during the 2012-2013 cold season (October to April).
Figure 4: Analyzed surface pressures (isobars every 4 mb) and fronts at 00 UTC on 30 October, 2012 (a) and observed snowfall from Post-Tropical Storm Sandy (b) (WPC).
-3.5
-3
-2.5
-2
-1.5
-1
-0.5
0
0.5
1
Oct Nov Dec Jan Feb Mar Apr
NAO
AO
PNA
42
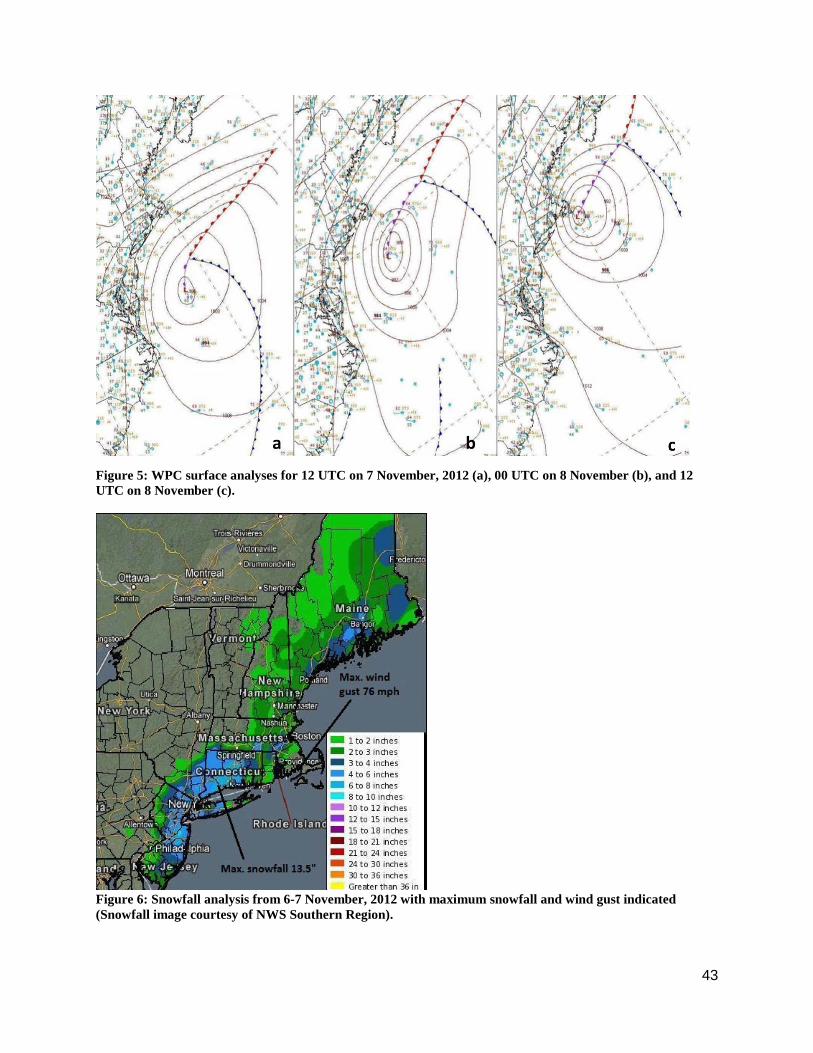
Figure 5: WPC surface analyses for 12 UTC on 7 November, 2012 (a), 00 UTC on 8 November (b), and 12 UTC on 8 November (c).
Figure 6: Snowfall analysis from 6-7 November, 2012 with maximum snowfall and wind gust indicated (Snowfall image courtesy of NWS Southern Region).
43
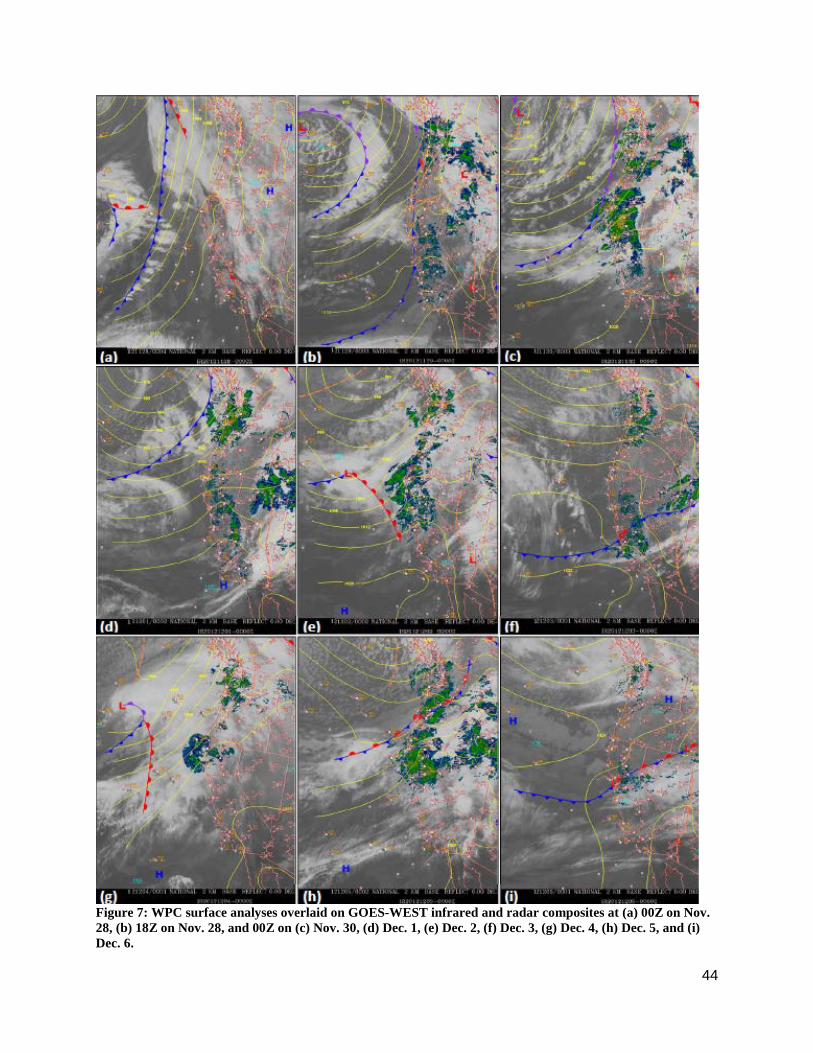
Figure 7: WPC surface analyses overlaid on GOES-WEST infrared and radar composites at (a) 00Z on Nov. 28, (b) 18Z on Nov. 28, and 00Z on (c) Nov. 30, (d) Dec. 1, (e) Dec. 2, (f) Dec. 3, (g) Dec. 4, (h) Dec. 5, and (i) Dec. 6.
44

Figure 8: Map of maximum snowfall locations and amounts in each of the affected states from 29 November to 5 December, 2012.
Figure 9: Surface analyses and infrared satellite imagery at a) 00 UTC December 9, 2012, b) 6 UTC December 9, 2012, c) 12 UTC December 9, 2012, and d) 18 UTC December 9, 2012.
a b c d
45

Figure 10: Snowfall accumulations across the Upper Midwest and eastern Dakotas on 9-10 December 2012 (Image courtesy of NWS Southern Region).
Figure 11: Snowfall accumulations (a) for the 24-hour period ending at 06 UTC on 18 December, 2012 (NOHRSC). WPC surface analysis valid at 00 UTC on 17 December, 2012 (b).
a b
46
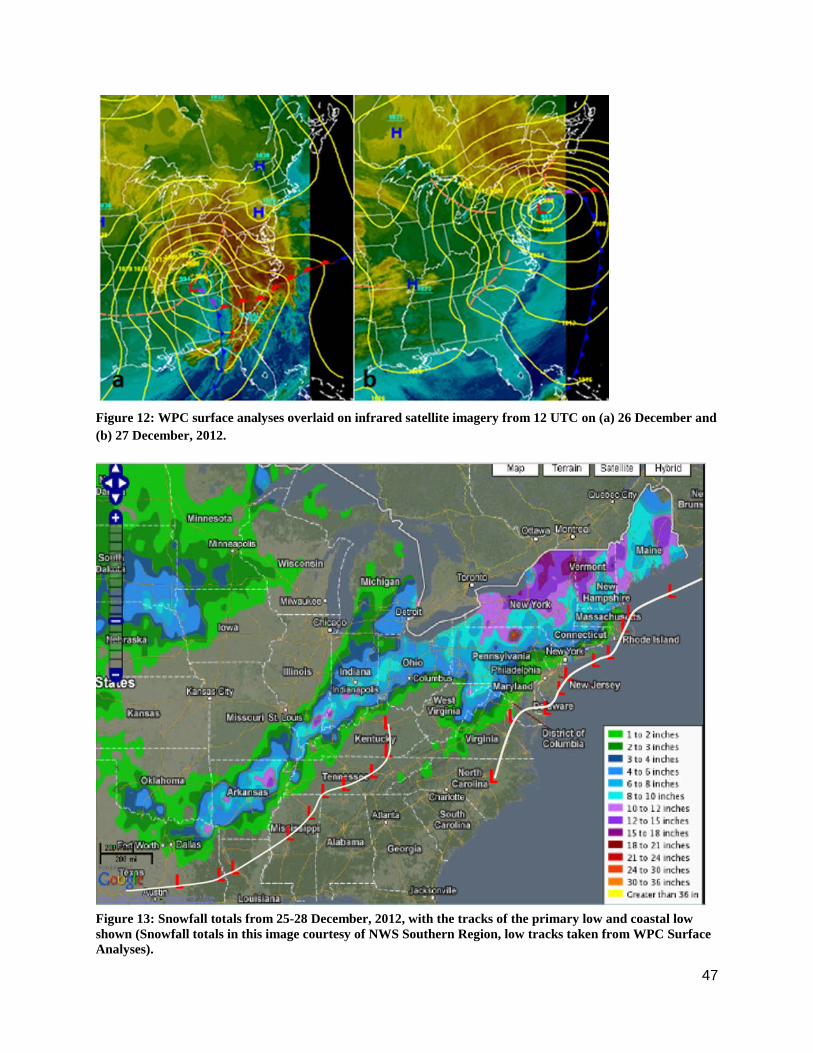
Figure 12: WPC surface analyses overlaid on infrared satellite imagery from 12 UTC on (a) 26 December and (b) 27 December, 2012.
Figure 13: Snowfall totals from 25-28 December, 2012, with the tracks of the primary low and coastal low shown (Snowfall totals in this image courtesy of NWS Southern Region, low tracks taken from WPC Surface Analyses).
47
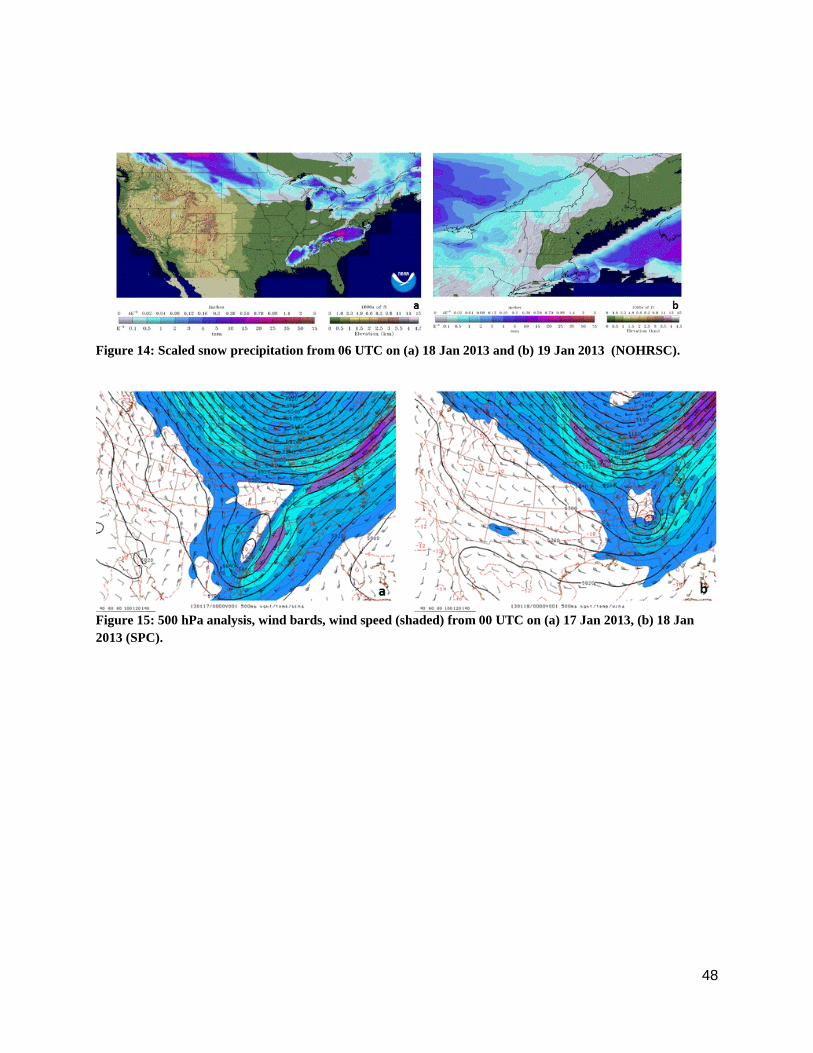
Figure 14: Scaled snow precipitation from 06 UTC on (a) 18 Jan 2013 and (b) 19 Jan 2013 (NOHRSC).
Figure 15: 500 hPa analysis, wind bards, wind speed (shaded) from 00 UTC on (a) 17 Jan 2013, (b) 18 Jan 2013 (SPC).
48
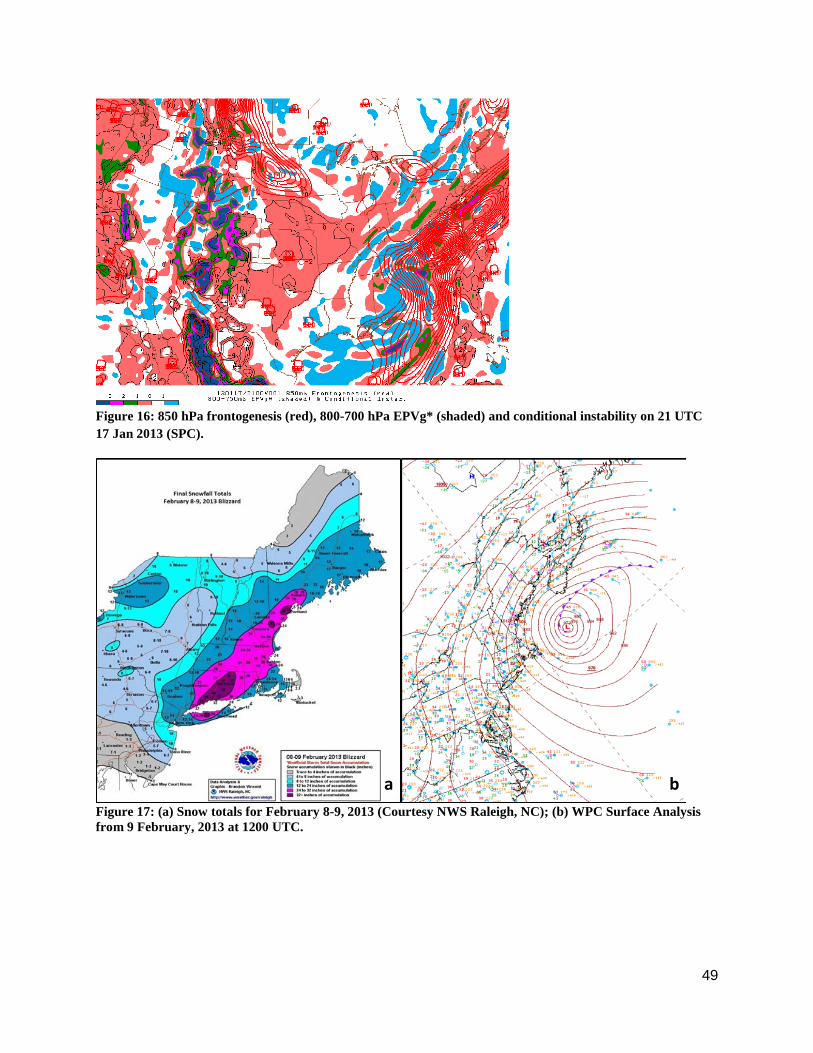
Figure 16: 850 hPa frontogenesis (red), 800-700 hPa EPVg* (shaded) and conditional instability on 21 UTC 17 Jan 2013 (SPC).
Figure 17: (a) Snow totals for February 8-9, 2013 (Courtesy NWS Raleigh, NC); (b) WPC Surface Analysis from 9 February, 2013 at 1200 UTC.
a b
49
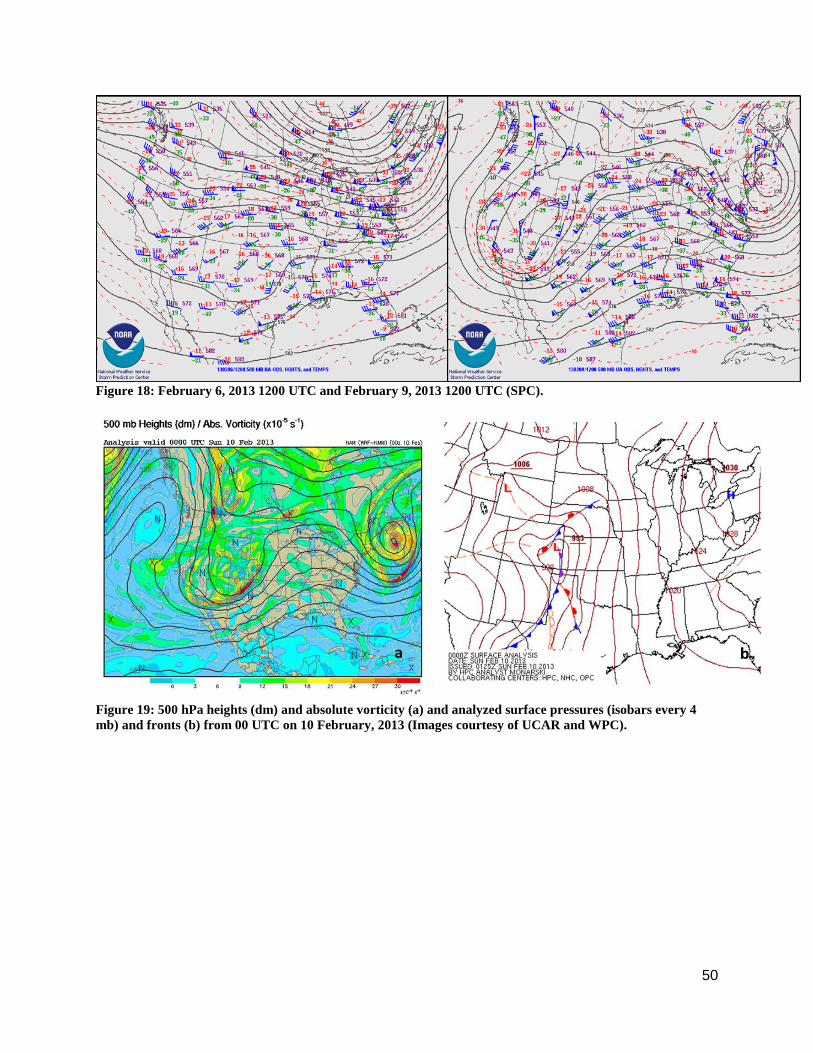
Figure 18: February 6, 2013 1200 UTC and February 9, 2013 1200 UTC (SPC).
Figure 19: 500 hPa heights (dm) and absolute vorticity (a) and analyzed surface pressures (isobars every 4 mb) and fronts (b) from 00 UTC on 10 February, 2013 (Images courtesy of UCAR and WPC).
50
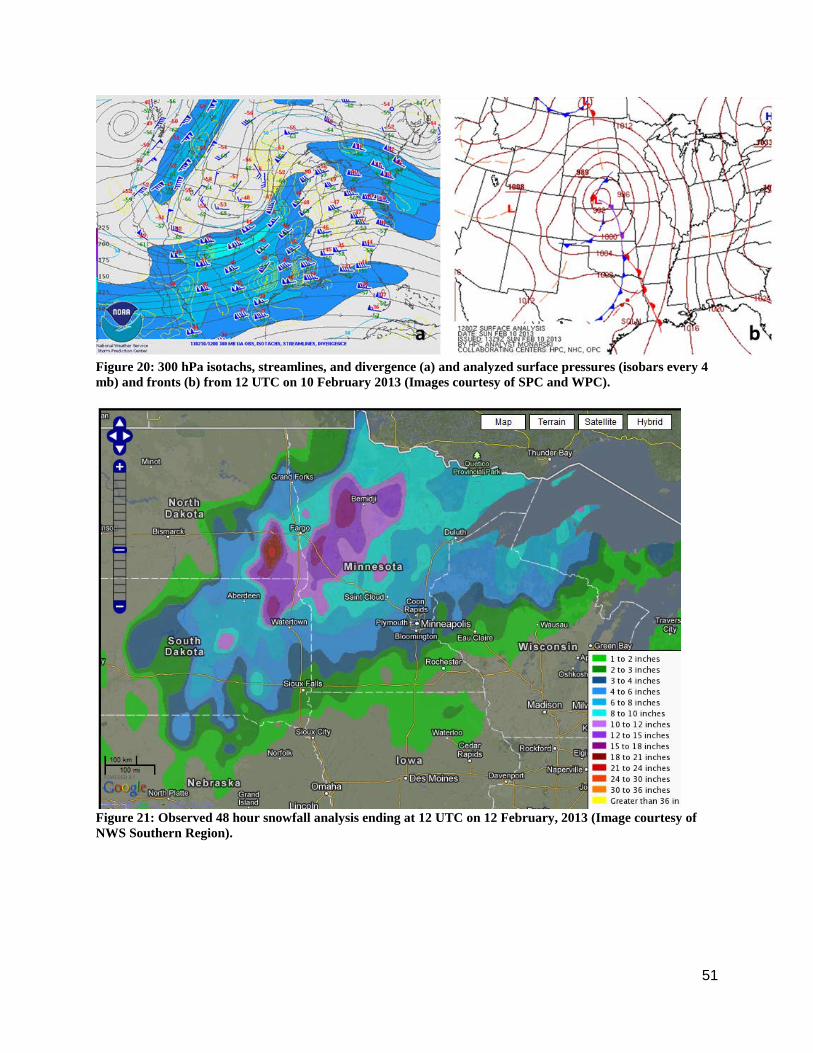
Figure 20: 300 hPa isotachs, streamlines, and divergence (a) and analyzed surface pressures (isobars every 4 mb) and fronts (b) from 12 UTC on 10 February 2013 (Images courtesy of SPC and WPC).
Figure 21: Observed 48 hour snowfall analysis ending at 12 UTC on 12 February, 2013 (Image courtesy of NWS Southern Region).
51
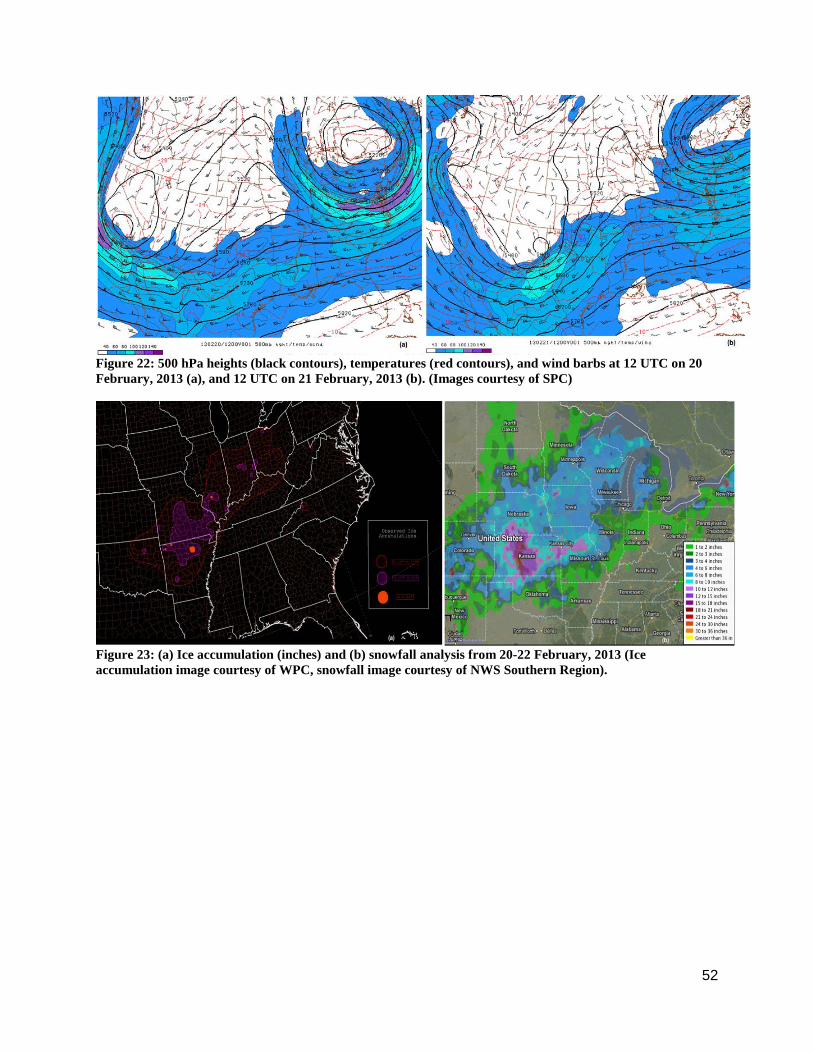
Figure 22: 500 hPa heights (black contours), temperatures (red contours), and wind barbs at 12 UTC on 20 February, 2013 (a), and 12 UTC on 21 February, 2013 (b). (Images courtesy of SPC)
Figure 23: (a) Ice accumulation (inches) and (b) snowfall analysis from 20-22 February, 2013 (Ice accumulation image courtesy of WPC, snowfall image courtesy of NWS Southern Region).
52

Figure 24: Surface analysis from 00 UTC on 22 February, 2013. (WPC)
Figure 25: Total accumulated snowfall from 25-28 February, 2013, with surface low track overlaid. (Snowfall graphic courtesy of NWS Southern Region Headquarters)
53

Figure 26: 24-hour snowfall for the northeastern U.S. ending at 06 UTC on 26 February, 2013. (NOHRSC)
Figure 27: Surface analysis (WPC) overlaid with infrared satellite imagery at (a) 00 UTC on 5 March, (b) 12 UTC on 5 March, (c) 00 UTC on 6 March, (d) 12 UTC on 6 March, (e) 00 UTC on 7 March, (f) 12 UTC on 7 March, 2013.
54
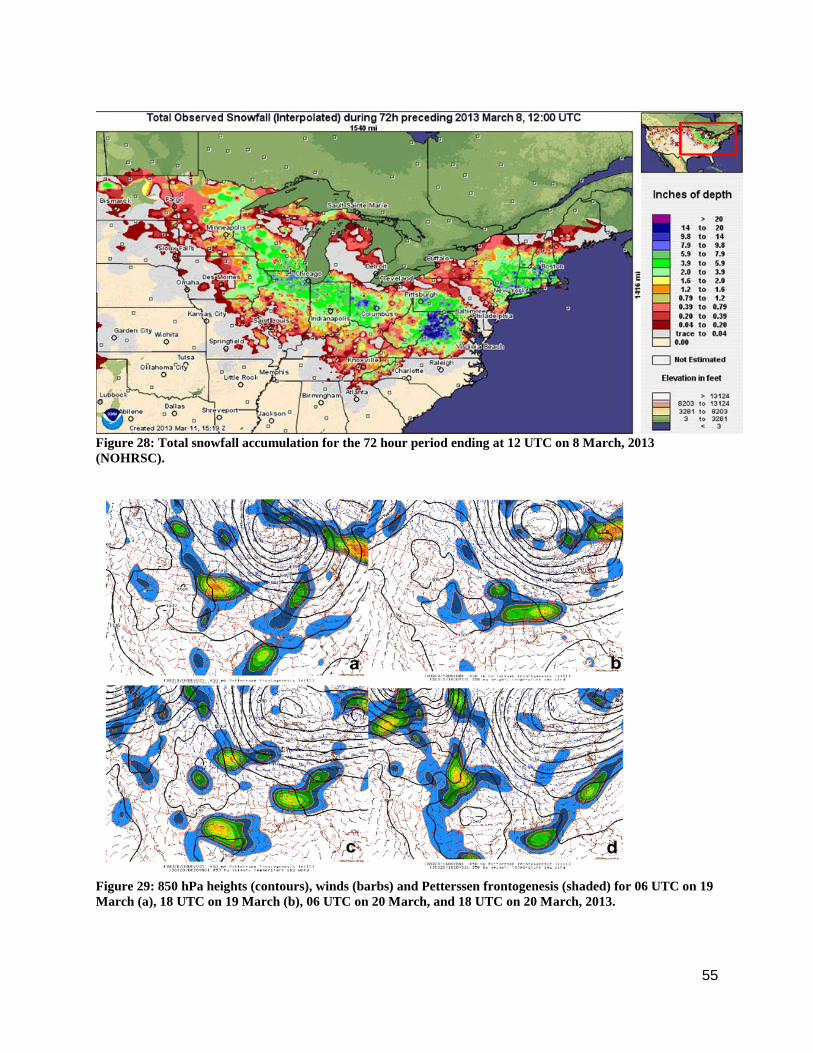
Figure 28: Total snowfall accumulation for the 72 hour period ending at 12 UTC on 8 March, 2013 (NOHRSC).
Figure 29: 850 hPa heights (contours), winds (barbs) and Petterssen frontogenesis (shaded) for 06 UTC on 19 March (a), 18 UTC on 19 March (b), 06 UTC on 20 March, and 18 UTC on 20 March, 2013.
55
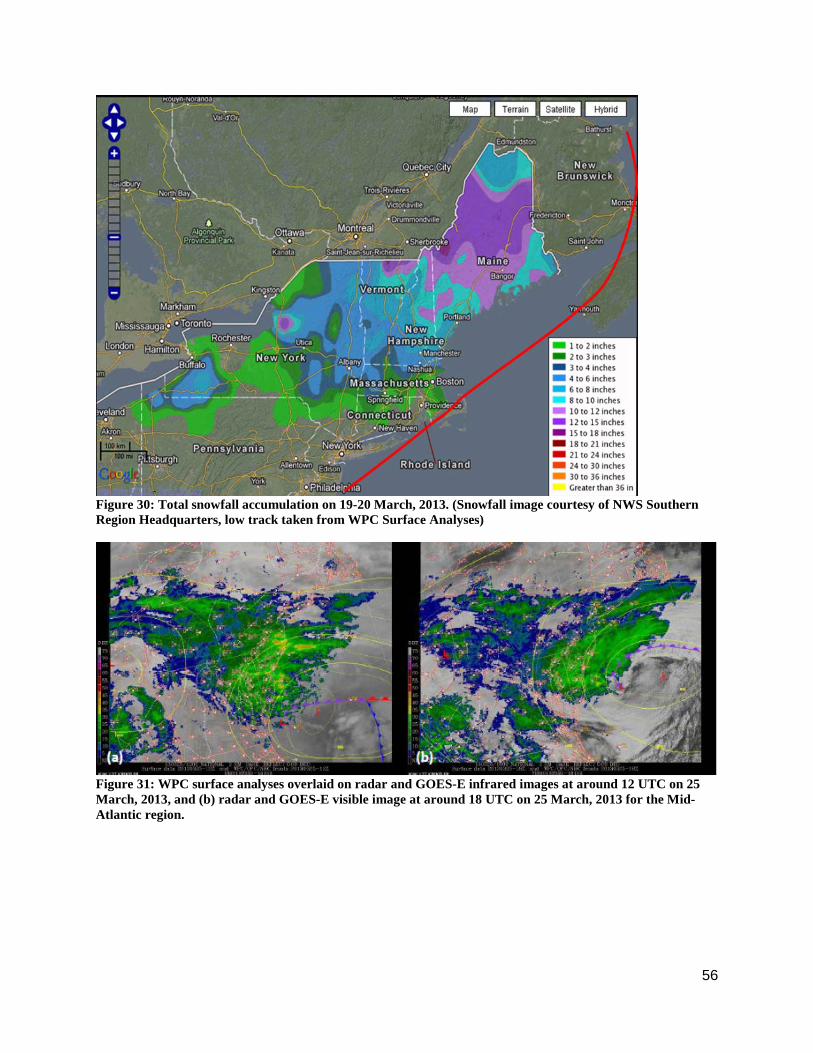
Figure 30: Total snowfall accumulation on 19-20 March, 2013. (Snowfall image courtesy of NWS Southern Region Headquarters, low track taken from WPC Surface Analyses)
Figure 31: WPC surface analyses overlaid on radar and GOES-E infrared images at around 12 UTC on 25 March, 2013, and (b) radar and GOES-E visible image at around 18 UTC on 25 March, 2013 for the Mid-Atlantic region.
56

Figure 32: 72-hour snowfall accumulation ending at 12 UTC on 24 March, 2013, with total observed snowfall at Jamestown and Burlington, CO. The 500 hPa (black) and surface (red) low tracks are also shown (Snowfall data courtesy of NOHRSC, low tracks taken from WPC Surface Analyses).
Figure 33: 72-hour snowfall accumulations ending at 12 UTC on 27 March, 2013 along with total observed snowfall at Springfield, IL and Redhouse, WV. The tracks of 500mb low centers (black), surface low pressure centers and their estimated central pressures (red) are also shown. (Snowfall image courtesy of NWS Southern Region, low tracks taken from WPC Surface Analyses).
57

Figure 34: (a) 250 hPa heights and winds and (b) 850 hPa heights, temperatures, and winds for 12 UTC on 9 April, 2013 (SPC).
Figure 35: Total snowfall accumulation for the 72 hour period ending at 12 UTC on 12 April, 2013 (NOHRSC).
58
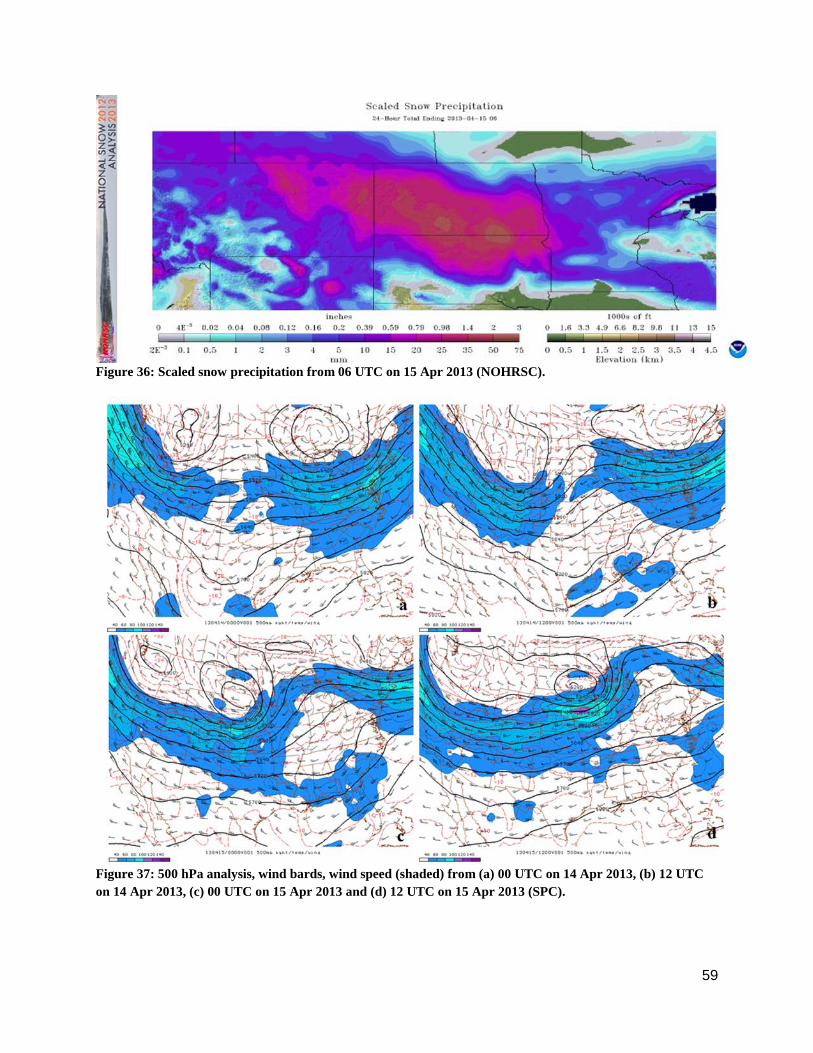
Figure 36: Scaled snow precipitation from 06 UTC on 15 Apr 2013 (NOHRSC).
Figure 37: 500 hPa analysis, wind bards, wind speed (shaded) from (a) 00 UTC on 14 Apr 2013, (b) 12 UTC on 14 Apr 2013, (c) 00 UTC on 15 Apr 2013 and (d) 12 UTC on 15 Apr 2013 (SPC).
59
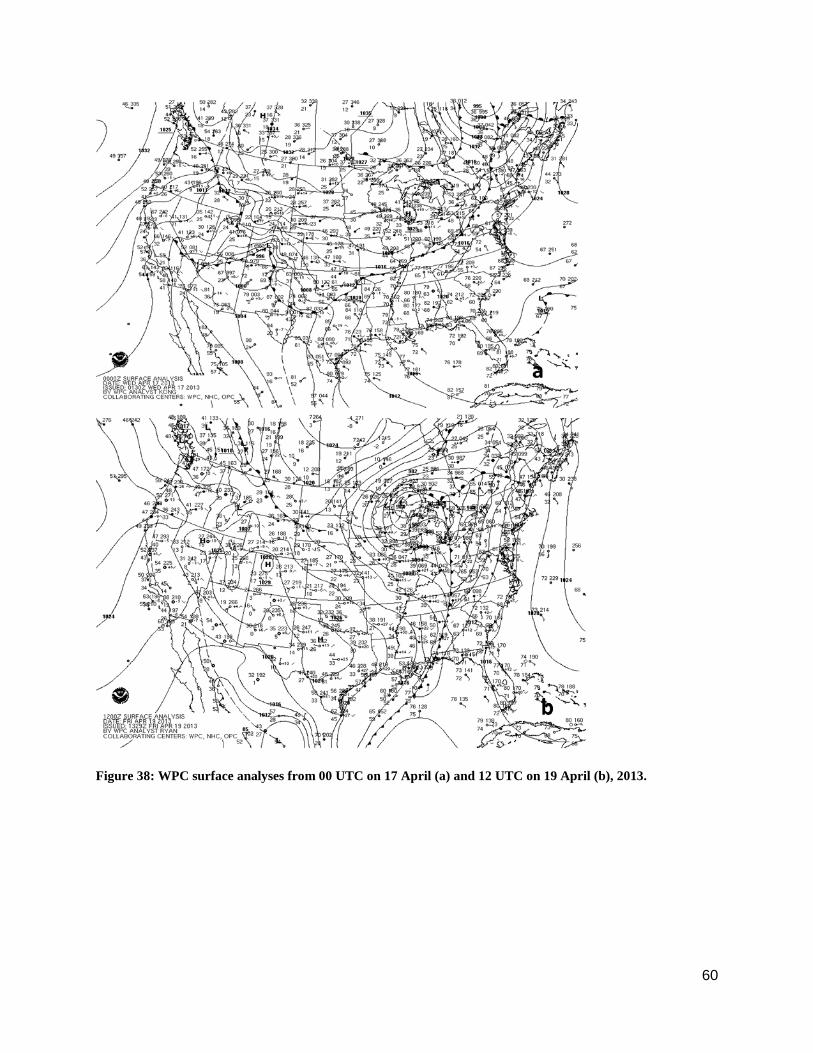
Figure 38: WPC surface analyses from 00 UTC on 17 April (a) and 12 UTC on 19 April (b), 2013.
60
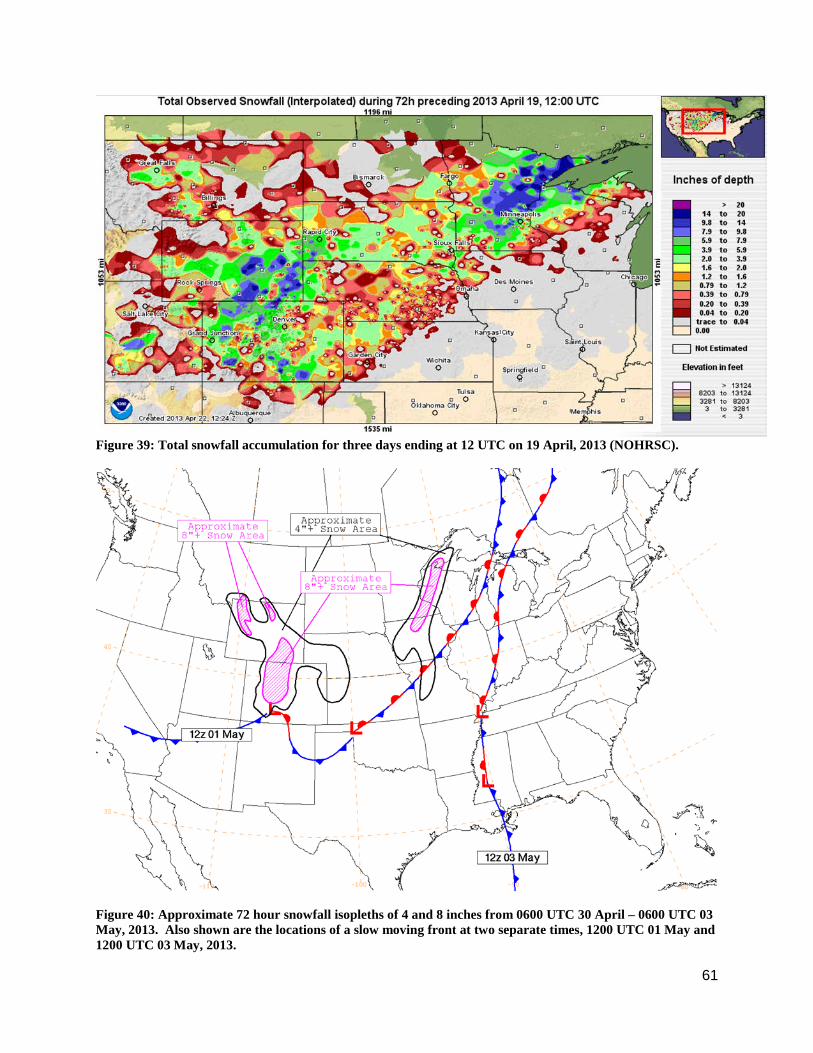
Figure 39: Total snowfall accumulation for three days ending at 12 UTC on 19 April, 2013 (NOHRSC).
Figure 40: Approximate 72 hour snowfall isopleths of 4 and 8 inches from 0600 UTC 30 April – 0600 UTC 03 May, 2013. Also shown are the locations of a slow moving front at two separate times, 1200 UTC 01 May and 1200 UTC 03 May, 2013.
61
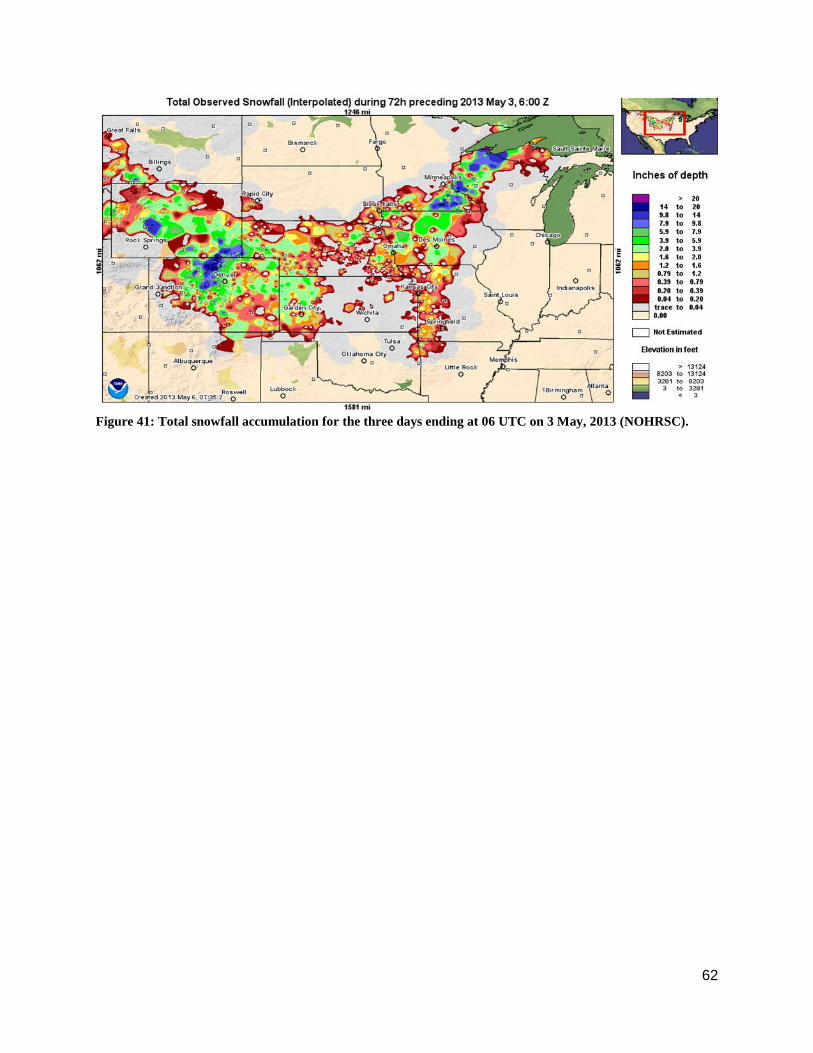
Figure 41: Total snowfall accumulation for the three days ending at 06 UTC on 3 May, 2013 (NOHRSC).
62

Table 1: Date Event Impacts Deaths/Injuries Damage ($)
28-31 October, 2012 Post-Tropical Storm Sandy
Winter Storm/Blizzard, Wind
1/0* 31.3 M*
6-7 November, 2012 Early Season Nor'easter
Winter Storm/Heavy Snow, Wind
0/0 940 K
29 November – 5 December, 2012
Western U.S. Heavy Precipitation
Winter Storm/Heavy Snow, Wind
0/0 402 K
9-10 December, 2012 Northern Plains/Upper
Midwest Snowstorm
Winter Storm/Heavy Snow, Wind
0/0 0.5 K
17 December Pacific Northwest Winter Storm
Winter Storm/Heavy Snow, Wind
0/0 1.11 M
25-28 December, 2012
Plains to Northeast Christmas Storm
Winter Storm/Blizzard/Heavy
Snow, Wind, Cold/Wind Chill, Coastal Flooding
4/0 119.8 M
16-18 January, 2013 Lower Mississippi River
Valley to Northeast Winter Storm
Winter Storm/Heavy Snow/Ice Storm,
Wind
0/0 2.04M
7-9 February, 2013 Great Lakes to Northeast Winter
Storm
Winter Storm/Blizzard,
Wind, Coastal Flood
7/0 54.0 M
10-11 February, 2013 Northern Plains and Upper Midwest Winter Storm
Winter Storm, Wind 1/0 53K
20-22 February, 2013 Central U.S. Winter Storm
Winter Storm/Ice Storm
0/0 1.70 M
25-28 February, 2013 Plains to Northeast Winter Storm
Winter Storm/Heavy Snow/Blizzard/Ice
Storm, Wind
2/0 15.5 M
5-8 March, 2013 Upper Midwest to Mid-Atlantic Winter
Storm
Winter Storm/Heavy Snow, Wind, Coastal
Flood, Cold/Wind Chill
1/0 3.58 M
18-20 March, 2013 New England Winter Storm
Winter Storm/Heavy Snow, Wind
0/0 364 K
23-26 March, 2013 Central and Eastern U.S. Winter Storm
Winter Storm, Wind 0/0 1.46 M
8-12 April, 2013 Northern and Central Plains Winter Storm
Winter Storm/Ice Storm, Wind
1/0 207.6 M
13-15 April, 2013 Northern Plains and Upper Midwest Winter Storm
Winter Storm, Wind 0/0 0.5 K
16-19 April, 2013 Western and Central U.S. Winter Storm
Winter Storm, Wind 0/0 35 K
1-3 May, 2013 Central Rockies to Upper Midwest Winter Storm
Winter Storm/Heavy Snow, Wind
0/0 4.00 M
Total 17/0 443.9 M *Damage and deaths/injuries from Post-Tropical Storm Sandy included here are only those caused by the winter storm aspect of the event. The totals do not include damage/casualties from storm surge or from the hurricane force winds near the center of the storm. Damage/casualties from high winds associated with the blizzard conditions over the Appalachians are included in the total.
63
Related Documents