MAJOR TRENDS IN GLOBAL OIL MARKET TO 2030

Welcome message from author
This document is posted to help you gain knowledge. Please leave a comment to let me know what you think about it! Share it to your friends and learn new things together.
Transcript

MAJOR TRENDS IN GLOBAL OIL MARKET TO 2030

Certain information in this report constitutes forward looking statements. This information may relate to future events, including the Company’s view on the prospects and trends of the global hydrocarbons market. All infor-mation other than information of historical fact is forward looking informa-tion. Such statements include, among other things: forecast demograph-ic trends and economic growth rates; forecast future dynamics of demand, supply and prices in the oil market; forecast details of developments in the tax law in certain countries; statements regarding predictions of cli-mate change policy; statements regarding other events which are subject to uncertainty; and statements regarding assumptions which form the basis for the forecasts included in this report.Words such as "expect", "look forward to", "anticipate", "plan", "intend" or "project" or words of similar meaning are intended to identify forward-looking statements, but are not the exclusive means for identifying such statements.By their nature, statements regarding the future involve inherent risks and uncertainties, both general and specific. There is a risk that any pre-diction, forecast or projection contained in any forward-looking statement will not be achieved as a result of any number of factors. Actual results may differ materially from the predictions, forecasts or projections contained in such statements.We assume no obligation to update or alter any forward-looking statement contained in this report, whether as a result of new information, subsequent events or otherwise.
1
CONTENTS
INTRODUCTIONKey findings 4
GLOBAL OIL DEMANDDemographic Trends 7Global Economic Growth Outlook 9Economic Development in China and India 10Global Vehicle Fleet 11Motorization in China and India 14Global Vehicle Fleet Structure 15Electric Vehicles 16Lithium Market 20Environmental Aspects of Electric Vehicles 20Potential for Fuel Economy Improvement by ICE Vehicles 21Climate Change Policy Impact on the Development of Global Energy 23Fuel Efficiency Improvement Programs 25Projections of Average Fuel Economy by a Passenger Car 26Change in Consumer Behavior Regarding Road Transportation 27Demand For Oil in Road Transportation 27Demand For Oil in Other Sectors 28Impact of Renewables on Oil Consumption 31
GLOBAL OIL SUPPLYProduction Decline Rate at Existing Fields and Oil Recovery Factor (ORF) 34Demand for New Production Projects 35Production Growth Prospects for OPEC Members 36Oil Production in Saudi Arabia 37Conventional Oil Production by Other OPEC Members 39Oil Production by Independent Producers 41Prospects of Production Growth in the U.S. 41Demand and Supply Curve for New Projects, Price Forecast 44
IN THE SEARCH OF EQUILIBRIUMInvestment Cycles 48Geopolitics and Supply Disruptions 50Prospects of Market Rebalancing 50Financial Factors 51Dollar Exchange Rate 53Role of Benchmark Prices 54Extent of Price Volatility 55
GLOBAL OIL SUPPLYGLOBAL OIL DEMANDINTRODUCTION
2
GLOBAL OIL REFININGGlobal Refining Overview 56Demand for Petroleum Products 57Global Refining Capacities 58Oil Refining in Europe 60
RUSSIAN OIL INDUSTRYOil Production Trend in Russia 62Exploration 64Enhanced Oil Recovery Techniques 65Shale Oil in Russia 65Upstream Taxation 67Forecasts of Oil Production in Russia 68Demand for Petroleum Products in Russia 69Oil Refining Taxation 71Refinery Modernization Program 73Supply and Demand Balances for Motor Fuels 74
ANNEXComparison with Previous Forecasts 75Sources 78
RUSSIAN OIL INDUSTRYIN THE SEARCH OF EQUILIBRIUM GLOBAL OIL REFINING
3
It’s been three years since PJSC LUKOIL has published the paper entitled "Global Trends in Oil & Gas Markets to 2025". During this period the global en-ergy market has witnessed major changes that makes us largely reconsider the oil industry’s future prospects. First of all, the growth of shale oil produc-tion in the U.S. exceeded the most ambitious projections, which forced OPEC to revise its strategy. Seeking to preserve its market share, Saudi Arabia re-fused to cut its production, which resulted in a steep drop in oil prices. Sec-ondly, in late 2015 international sanctions against Iran were lifted, enabling this major producer to increase its production and thus provide even greater competition in the oversupplied market. Thirdly, the cost of power generation from renewable sources saw a significant reduction, and favorable conditions for active development of the electric transportation market were creat-ed. Finally, the 21st UN Climate Change Conference approved an agreement on the scope of international cooperation in greenhouse emissions reductions following 2020. These developments outlined the new realities of the oil mar-ket, compared to what they were three years ago.
Following the 2008-2009 global financial crisis, the world entered a new economic era. The growth of developed economies is slowing down, driven by population aging. In their effort to stimulate the economy, Central Banks of those countries pursue extra-soft monetary policies, resulting in close to ze-ro or even negative interest rates. Developing economies, primarily China and India, remain major drivers of global economic growth. However, with in-creasingly large macroeconomic risks, many experts have become doubtful whether these countries are capable of maintaining long-term high econom-ic growth rates. In addition, the rapid development of financial markets is in-creasing the vulnerability of the global financial system and inflating economic bubbles, including those in the commodities markets.
Given the challenges the global economy is facing today, forecasting future oil prices is obviously a very difficult task. Therefore, PJSC LUKOIL’s standard practice is to use a scenario-based approach for forcasting.
This Outlook focuses our base case scenario of the oil industry development, called the "Concord". This scenario assumes that a coordinated effort by oil market players will help to smooth out the supply and demand imbalances, as well as to reduce the range of undesirable price fluctuations. The "Concord" scenario is based on the balancing approach, in which the oil price forecast is determined in a way to preserve a long-term supply and demand balance.
INTRODUCTION
GLOBAL OIL SUPPLYGLOBAL OIL DEMANDINTRODUCTION
4
An alternative to the "Concord" scenario is the "Volatility" scenario that as-sumes a constant supply and demand imbalance driven by both fundamen-tal and financial factors. According to this scenario, in the next fifteen years oil prices will fluctuate within a wide range but from time to time reach the bal-ance point as outlined in the "Concord" scenario. Given the existing mechan-ics of the oil market, the "Volatility" scenario, in our opinion, looks more real-istic than the "Concord" scenario. However, it is less applicable to long-term business planning.
The final section of the Outlook is devoted to the analysis of trends current-ly prevailing in the Russian oil industry. The section outlines major challenges for the Russian oil industry with reference to the changes expected in the global oil market and provides forecasts of the key industry development indicators.
KEY FINDINGS
‣ Growth of the middle class in developing Asian countries will contribute to the growth of the global car fleet;
‣ The increase in the global car fleet will be accompanied by a higher de-mand for oil from the transportation sector;
‣ Conventional motor vehicles with internal combustion engines will still dominate the global car fleet despite a higher share of electric-powered vehicles;
‣ Electric vehicles will help to improve the fuel efficiency of the global car fleet and will constrain the growth of fuel prices;
‣ The heavy-duty transport will make the largest contribution to oil con-sumption growth in road transportation sector;
‣ Oil and renewables are not antagonists. There is a limited room for com-petition between oil and renewables;
‣ The growing demand for oil and the decline in production at mature fields will create a need for greenfield projects of 39 mb/d by 2030;
‣ There will be a lack of low-cost oil to meet the growing fuel demand;
‣ The long-term oil price in "Concord" scenario is 80 USD/bbl in constant prices. In our view this price will enable the sustainable development of the oil market and efficient use of available energy resources;
‣ Without OPEC’s regulatory function, the oil market will experience a high price volatility driven by investment cycles, supply disruptions and finan-cial factors;
RUSSIAN OIL INDUSTRYIN THE SEARCH OF EQUILIBRIUM GLOBAL OIL REFINING
5
‣ In the "Volatility" scenario prices will vary within a wide range. The market will constantly experience supply and demand imbalance;
‣ In the mid-term excessive production capacity in global oil refining will continue putting downward pressure on the industry’s profitability;
‣ The competition on the European market of petroleum products will be-come tougher due to an increase in production of light petroleum prod-ucts in the Middle East, Asia-Pacific and Russia;
‣ Russian oil production enjoys promising growth prospects for the next few years to come. However, following 2019 the production is very like-ly to fall due to the depletion of reserves and failure to provide new tax incentives;
‣ There is a downward trend in the consumption of motor fuels in Russia. Once the Russian economy swings upward, the consumption of motor fu-els is expected to rise again;
‣ Lower oil prices and the tax maneuver had a material adverse impact on the economics of the Russian oil refining sector, resulting in the revi-sion by a number of companies of their plans to upgrade refineries;
‣ The current tax burden is critical to the Russian oil refining sector. Further worsening of the tax regime for refineries may result in a shortage of mo-tor fuels on the market and a surge in fuel prices across the country.
6
GLOBAL OIL SUPPLYGLOBAL OIL DEMANDINTRODUCTION
OIL CONSUMPTION GROWTH PROSPECTS WILL BE LARGELY DETERMINED BY THE HEALTH OF THE GLOBAL ECONOMY, WHOSE SUSTAINABLE GROWTH IS REQUIRED FOR A RISE IN GLOBAL OIL DEMAND. FUTURE RATES OF OIL DEMAND GROWTH WILL DEPEND ON WHETHER THE DEVELOPING COUNTRIES, ESPECIALLY INDIA AND CHINA, ARE CAPABLE TO MAINTAIN SUFFICIENT ECONOMIC GROWTH AMID INCREASINGLY HIGH MACROECONOMIC RISKS.
ALTHOUGH OIL HAS NUMEROUS APPLICATIONS IN A NUMBER OF INDUSTRIES, ITS KEY SOURCE OF DEMAND STILL COMES FROM THE TRANSPORTATION SECTOR. AS ELECTRIC VEHICLES ARE BECOMING INCREASINGLY POPULAR, EXPERTS ARE TRYING TO FIGURE OUT WHETHER OIL WILL MAINTAIN ITS POSITION AS THE MOST WIDELY USED SOURCE OF ENERGY FOR MOTOR VEHICLES IN THE FORESEEABLE FUTURE. FORECASTED CHANGES IN THE GLOBAL OIL DEMAND WILL LARGELY DEPEND ON THE ANSWER TO THIS QUESTION.
THIS SECTION OUTLINES THE MAJOR TRENDS THAT WILL EFFECTIVELY DRIVE THE GLOBAL DEMAND FOR OIL IN THE NEXT FIFTEEN YEARS. IN ADDITION, THE SECTION PROVIDES KEY ASSUMPTIONS ADOPTED FOR THE DEVELOPMENT OF THE GLOBAL OIL DEMAND FORECAST IN OUR BASE CASE SCENARIO "CONCORD".
GLOBAL OIL DEMAND
OECD countries China India Africa Other countries
+20% +16%
0
2
4
6
8
10
2030202520202015201020052000
Source: UN, Department of Economic and Social Affairs, Population Division. World Population Prospects: The 2015 Revision
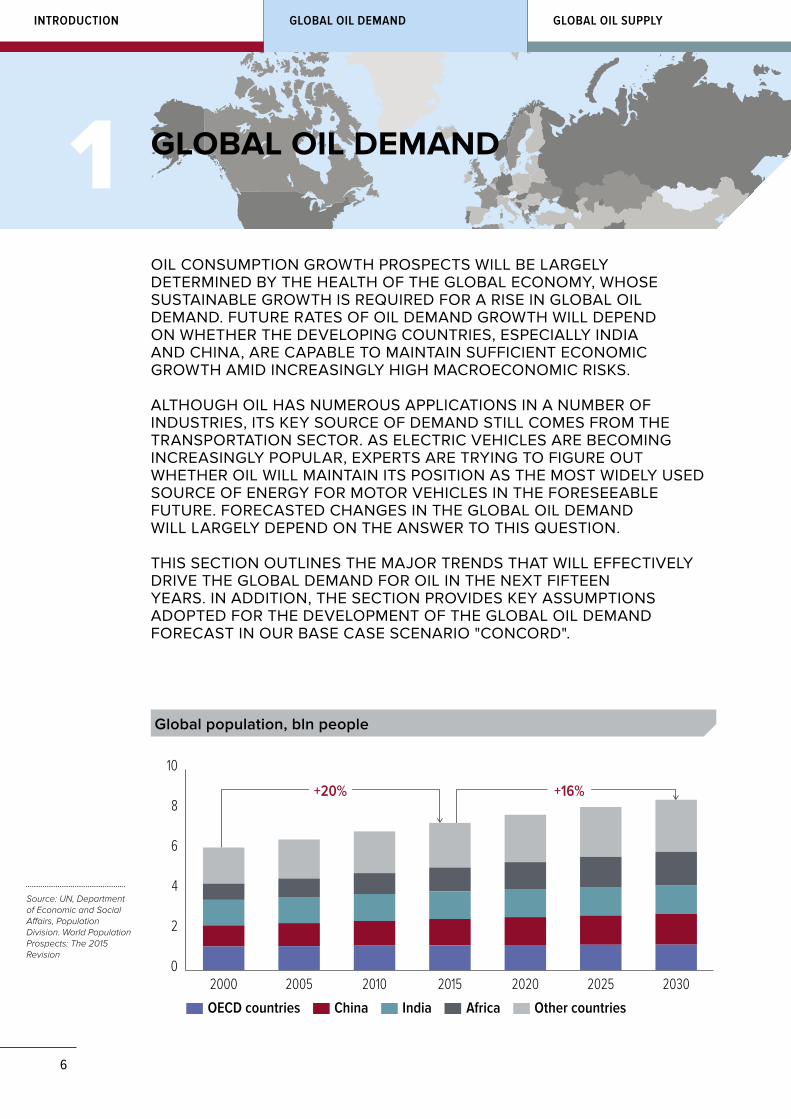
Global population, bln people
1
7
RUSSIAN OIL INDUSTRYIN THE SEARCH OF EQUILIBRIUM GLOBAL OIL REFINING
DEMOGRAPHIC TRENDS
Global population growth is one of the key economic growth drivers. The UN forecast is that the world’s total population will see an increase from 7.3 bln in 2015 to 8.5 bln in 2030. The highest population growth rate will occur in Africa and Asia, which will account for 75% of the planet’s popu-lation by 2030.
The global population growth rate between 2016 and 2030 will be low-er than it was in the previous fifteen-year period. The current slowdown has been caused by the so called ‘demographic transition’ being a consequence of revolution in science and technology, leading to a growth in prosperity and longer life spans worldwide, lower child mortality rates, emancipation, urbanization, and a decline in the birth rate, which eventually led to a boom in working age population. This encouraged high economic growth in devel-oped countries in the first half of the 20th century.
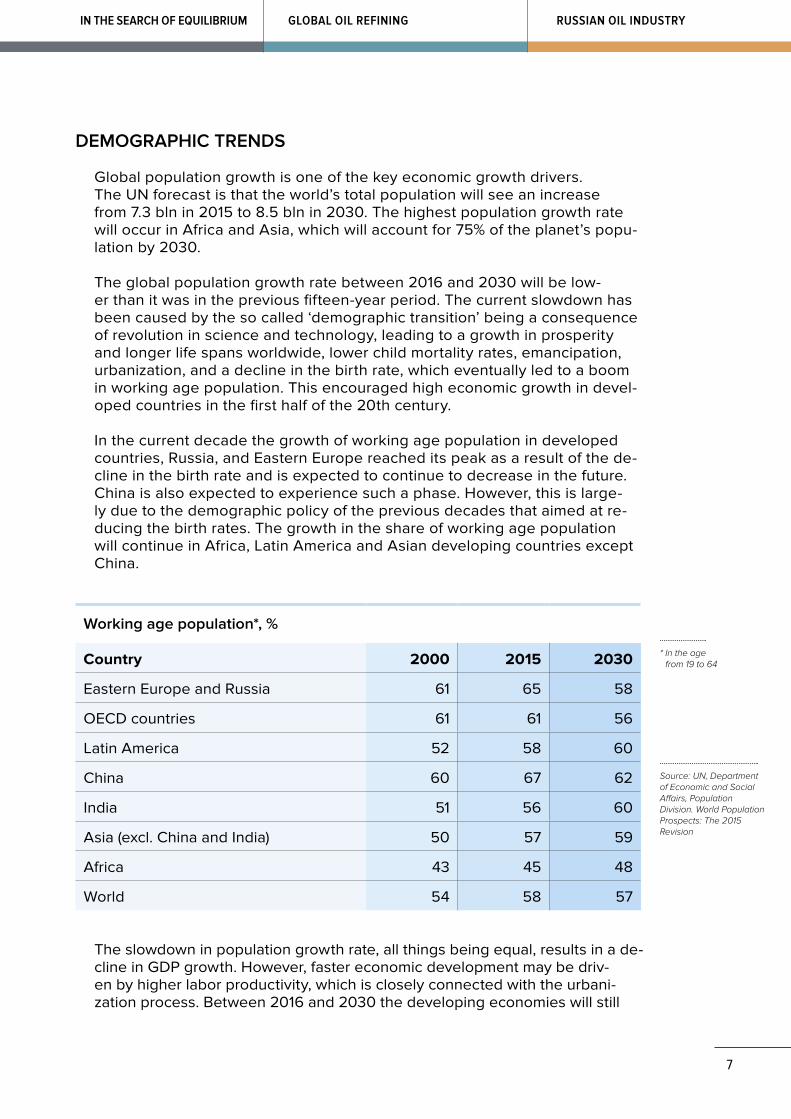
In the current decade the growth of working age population in developed countries, Russia, and Eastern Europe reached its peak as a result of the de-cline in the birth rate and is expected to continue to decrease in the future. China is also expected to experience such a phase. However, this is large-ly due to the demographic policy of the previous decades that aimed at re-ducing the birth rates. The growth in the share of working age population will continue in Africa, Latin America and Asian developing countries except China.
Working age population*, %
Country 2000 2015 2030
Eastern Europe and Russia 61 65 58
OECD countries 61 61 56
Latin America 52 58 60
China 60 67 62
India 51 56 60
Asia (excl. China and India) 50 57 59
Africa 43 45 48
World 54 58 57
Source: UN, Department of Economic and Social Affairs, Population Division. World Population Prospects: The 2015 Revision
* In the age from 19 to 64
The slowdown in population growth rate, all things being equal, results in a de-cline in GDP growth. However, faster economic development may be driv-en by higher labor productivity, which is closely connected with the urbani-zation process. Between 2016 and 2030 the developing economies will still
8
GLOBAL OIL SUPPLYGLOBAL OIL DEMANDINTRODUCTION
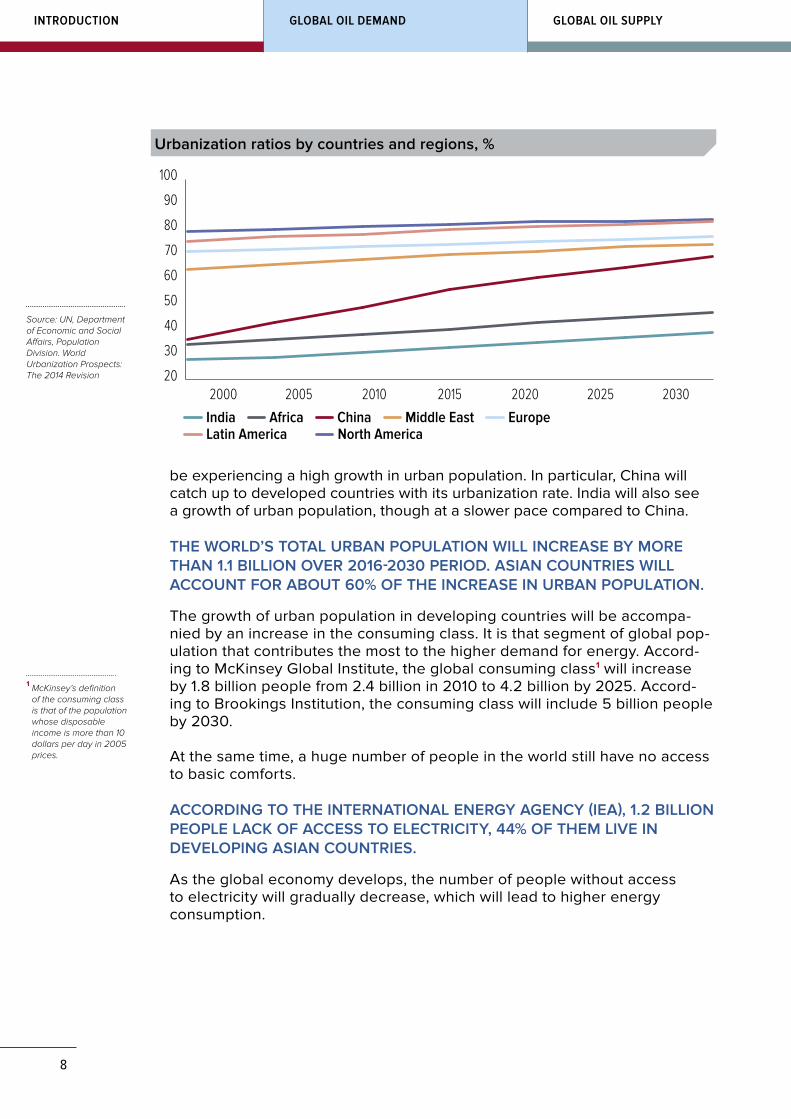
be experiencing a high growth in urban population. In particular, China will catch up to developed countries with its urbanization rate. India will also see a growth of urban population, though at a slower pace compared to China.
THE WORLD’S TOTAL URBAN POPULATION WILL INCREASE BY MORE THAN 1.1 BILLION OVER 2016-2030 PERIOD. ASIAN COUNTRIES WILL ACCOUNT FOR ABOUT 60% OF THE INCREASE IN URBAN POPULATION.
The growth of urban population in developing countries will be accompa-nied by an increase in the consuming class. It is that segment of global pop-ulation that contributes the most to the higher demand for energy. Accord-ing to McKinsey Global Institute, the global consuming class1 will increase by 1.8 billion people from 2.4 billion in 2010 to 4.2 billion by 2025. Accord-ing to Brookings Institution, the consuming class will include 5 billion people by 2030.
At the same time, a huge number of people in the world still have no access to basic comforts.
ACCORDING TO THE INTERNATIONAL ENERGY AGENCY (IEA), 1.2 BILLION PEOPLE LACK OF ACCESS TO ELECTRICITY, 44% OF THEM LIVE IN DEVELOPING ASIAN COUNTRIES.
As the global economy develops, the number of people without access to electricity will gradually decrease, which will lead to higher energy consumption.
1 McKinsey’s definition of the consuming class is that of the population whose disposable income is more than 10 dollars per day in 2005 prices.
20
30
40
50
60
70
80
90
100
2030202520202015201020052000
1 208 1 233 1 251 1 266 1 277 1 283
India Africa China Middle East EuropeLatin America North America
Urbanization ratios by countries and regions, %
Source: UN, Department of Economic and Social Affairs, Population Division. World Urbanization Prospects: The 2014 Revision
9
RUSSIAN OIL INDUSTRYIN THE SEARCH OF EQUILIBRIUM GLOBAL OIL REFINING
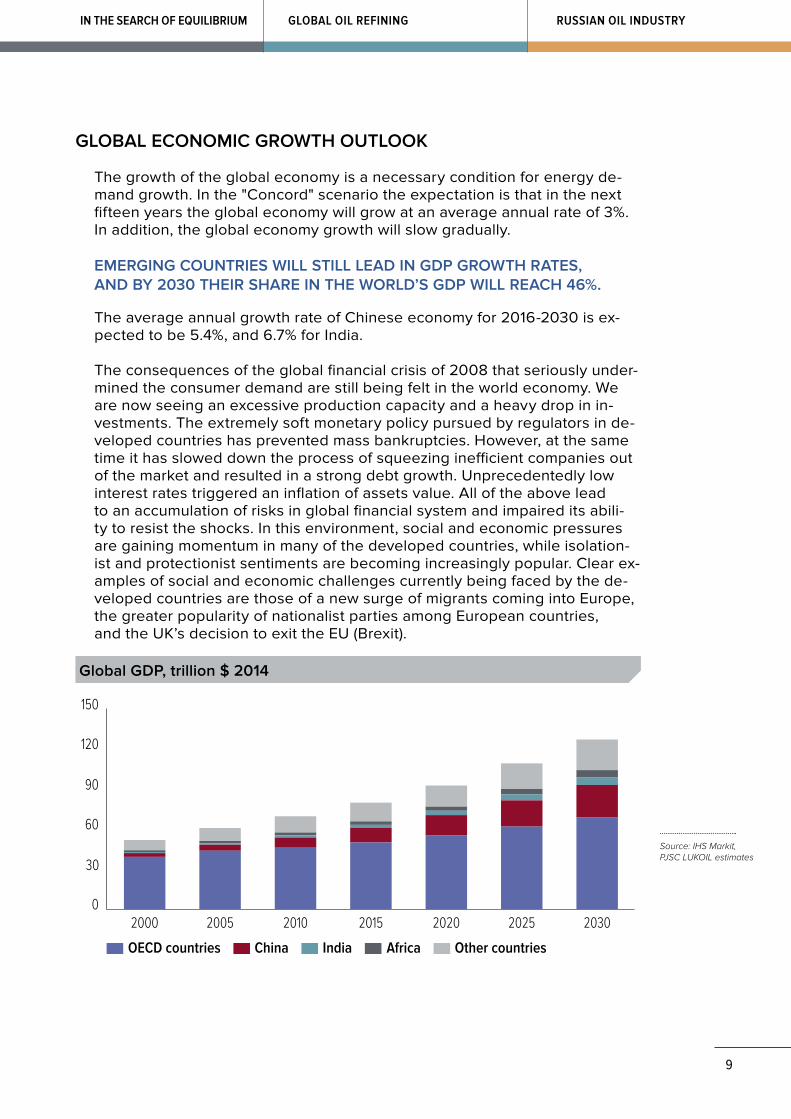
GLOBAL ECONOMIC GROWTH OUTLOOK
The growth of the global economy is a necessary condition for energy de-mand growth. In the "Concord" scenario the expectation is that in the next fifteen years the global economy will grow at an average annual rate of 3%. In addition, the global economy growth will slow gradually.
EMERGING COUNTRIES WILL STILL LEAD IN GDP GROWTH RATES, AND BY 2030 THEIR SHARE IN THE WORLD’S GDP WILL REACH 46%.
The average annual growth rate of Chinese economy for 2016-2030 is ex-pected to be 5.4%, and 6.7% for India.
The consequences of the global financial crisis of 2008 that seriously under-mined the consumer demand are still being felt in the world economy. We are now seeing an excessive production capacity and a heavy drop in in-vestments. The extremely soft monetary policy pursued by regulators in de-veloped countries has prevented mass bankruptcies. However, at the same time it has slowed down the process of squeezing inefficient companies out of the market and resulted in a strong debt growth. Unprecedentedly low interest rates triggered an inflation of assets value. All of the above lead to an accumulation of risks in global financial system and impaired its abili-ty to resist the shocks. In this environment, social and economic pressures are gaining momentum in many of the developed countries, while isolation-ist and protectionist sentiments are becoming increasingly popular. Clear ex-amples of social and economic challenges currently being faced by the de-veloped countries are those of a new surge of migrants coming into Europe, the greater popularity of nationalist parties among European countries, and the UK’s decision to exit the EU (Brexit).
OECD countries IndiaChina Africa Other countries
0
30
60
90
120
150
2030202520202015201020052000
Global GDP, trillion $ 2014
Source: IHS Markit, PJSC LUKOIL estimates
10
GLOBAL OIL SUPPLYGLOBAL OIL DEMANDINTRODUCTION
High macroeconomic risks are also inherent to emerging countries. Thus, the huge excess in production capacity and growth of corporate debt force the Chinese government to launch sophisticated structural reforms targeting a higher share of domestic consumption and service industries in the econ-omy. Combined with the unfavorable demographic situation, this will lead to a further decline in the country’s economic growth, dropping to 4% by 2030. The global community now largely relies on India in maintaining global economic growth, given the country’s high GDP growth rate shown over the last few years.
ECONOMIC DEVELOPMENT IN CHINA AND INDIA
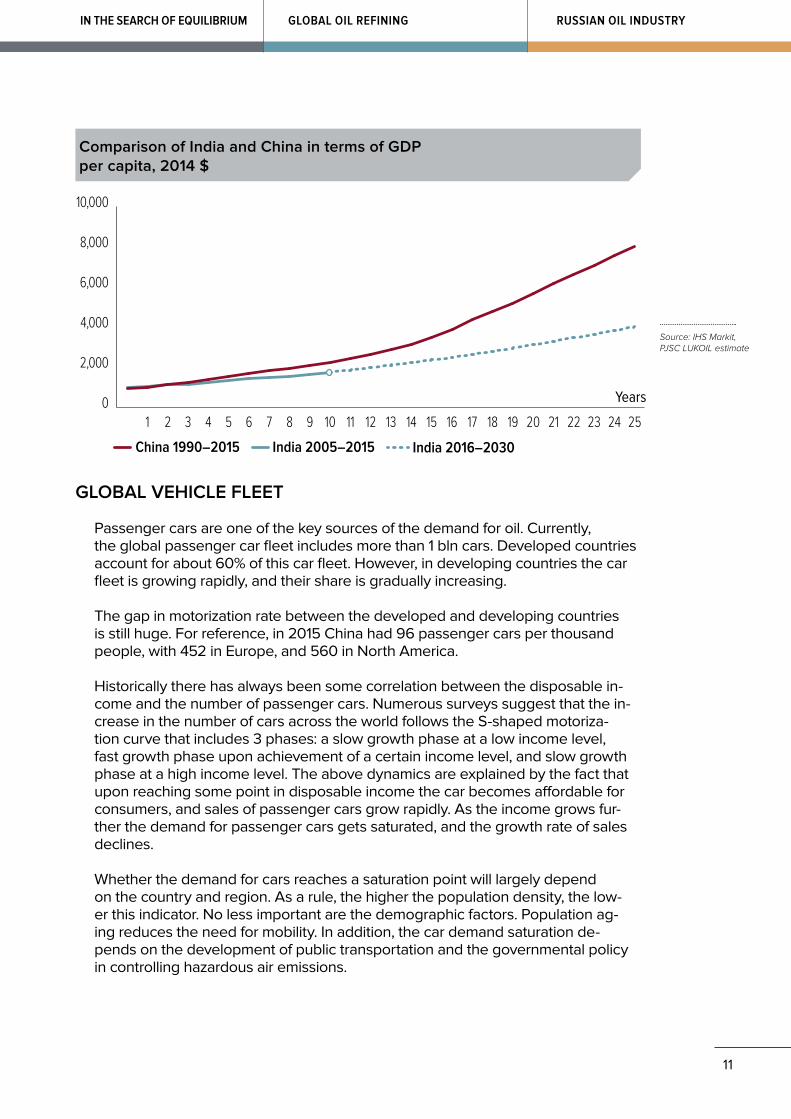
China and India, the world’s largest developing economies, will play a crucial role in determining the global economic growth rate in the next few decades. While China has been slowing down in the last years, India is demonstrating in-creasingly high economic growth rates. The question is whether India will be able to achieve the growth rate China demonstrated back in the 90s and 00s.
While China was able to take advantage of the global world market in the early 90s, India still remains a relatively closed economy. The rise to power of market focused political forces encouraged the country’s faster economic development and inspired some hope for a possible replication of the successful Chinese experience.
Fifteen nationalities in India have their own official languages. The country is populated by several thousand tribes and castes living separately in their compact settlements. India’s relatively slow urbanization rate reflects the contra-dictions prevailing in this country. Weakness of centralized power and an inabili-ty to pursue centralized top-down reforms depresses India’s economic growth.
India’s industry and agriculture demonstrate low labor productivity and have no access to affordable loans, which limit economic development opportunities. The high share of consumption in the GDP, negative trade balance and the high costs of maintaining governmental administration deplete the domestic sources for the accumulation of capital and make replication of the Chinese experience of accelerated investment growth a tough challenge.
The peak in the country’s industrial development based on local technolo-gies was registered back in 2008. Without improving the investment climate the country will struggle to get an inflow of foreign investments, the competi-tion for which became much tougher during the period of global excess of pro-duction capacity. According to our estimates, in the next decade India is unlikely to replicate the growth path China was experiencing in the last decades.
IN THE MID-TERM INDIA WILL CONTINUE TO DEMONSTRATE HIGH ECONOMIC GROWTH RATE, AHEAD OF CHINA.
11
RUSSIAN OIL INDUSTRYIN THE SEARCH OF EQUILIBRIUM GLOBAL OIL REFINING
India 2016–2030
0
2,000
4,000
6,000
8,000
10,000
25242322212019181716151413121110987654321
1 208 1 233 1 251 1 266 1 277 1 283Years
China 1990–2015 India 2005–2015
Comparison of India and China in terms of GDP per capita, 2014 $
GLOBAL VEHICLE FLEET
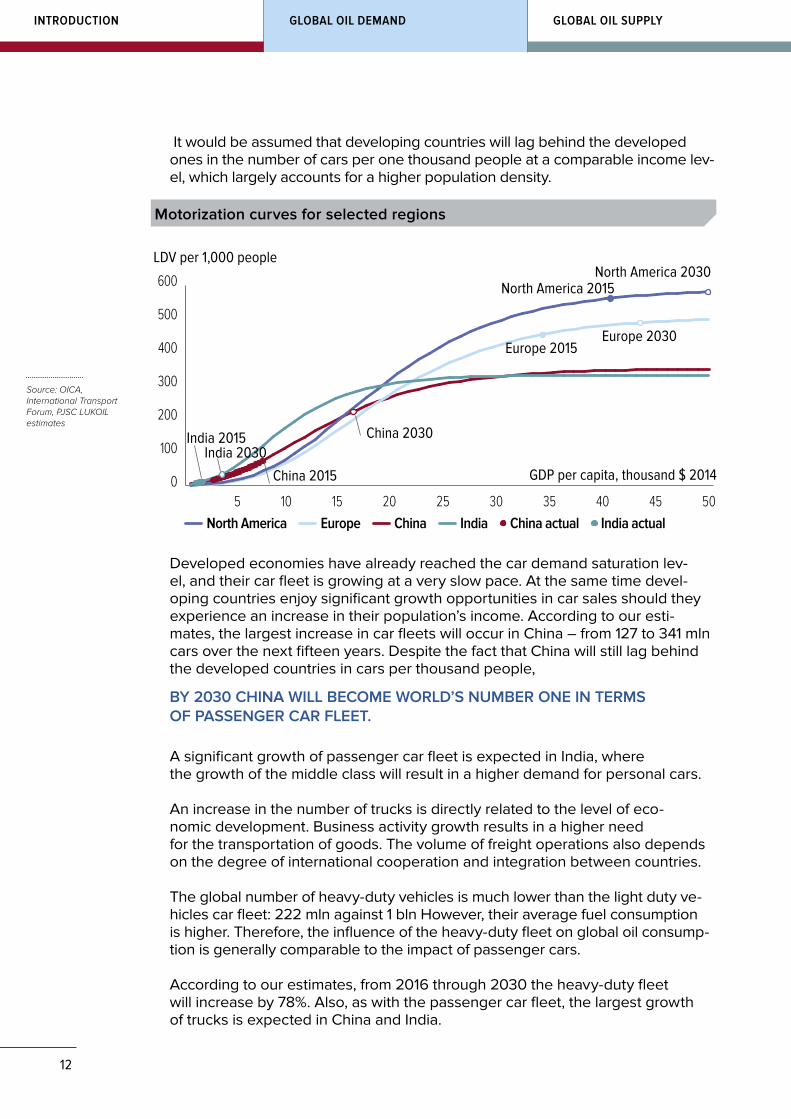
Passenger cars are one of the key sources of the demand for oil. Currently, the global passenger car fleet includes more than 1 bln cars. Developed countries account for about 60% of this car fleet. However, in developing countries the car fleet is growing rapidly, and their share is gradually increasing.
The gap in motorization rate between the developed and developing countries is still huge. For reference, in 2015 China had 96 passenger cars per thousand people, with 452 in Europe, and 560 in North America.
Historically there has always been some correlation between the disposable in-come and the number of passenger cars. Numerous surveys suggest that the in-crease in the number of cars across the world follows the S-shaped motoriza-tion curve that includes 3 phases: a slow growth phase at a low income level, fast growth phase upon achievement of a certain income level, and slow growth phase at a high income level. The above dynamics are explained by the fact that upon reaching some point in disposable income the car becomes affordable for consumers, and sales of passenger cars grow rapidly. As the income grows fur-ther the demand for passenger cars gets saturated, and the growth rate of sales declines.
Whether the demand for cars reaches a saturation point will largely depend on the country and region. As a rule, the higher the population density, the low-er this indicator. No less important are the demographic factors. Population ag-ing reduces the need for mobility. In addition, the car demand saturation de-pends on the development of public transportation and the governmental policy in controlling hazardous air emissions.
Source: IHS Markit, PJSC LUKOIL estimate
12
GLOBAL OIL SUPPLYGLOBAL OIL DEMANDINTRODUCTION
It would be assumed that developing countries will lag behind the developed ones in the number of cars per one thousand people at a comparable income lev-el, which largely accounts for a higher population density.
Europe China IndiaNorth America
0
100
200
300
400
500
600
1 208 1 233 1 251 1 266 1 277 1 283
India 2015
China 2015
China 2030
Europe 2015Europe 2030
North America 2030North America 2015
India 2030
LDV per 1,000 people
GDP per capita, thousand $ 2014
5 10 15 20 25 30 35 40 45 50China actual India actual
Motorization curves for selected regions
Source: OICA, International Transport Forum, PJSC LUKOIL estimates
Developed economies have already reached the car demand saturation lev-el, and their car fleet is growing at a very slow pace. At the same time devel-oping countries enjoy significant growth opportunities in car sales should they experience an increase in their population’s income. According to our esti-mates, the largest increase in car fleets will occur in China – from 127 to 341 mln cars over the next fifteen years. Despite the fact that China will still lag behind the developed countries in cars per thousand people,
BY 2030 CHINA WILL BECOME WORLD’S NUMBER ONE IN TERMS OF PASSENGER CAR FLEET.
A significant growth of passenger car fleet is expected in India, where the growth of the middle class will result in a higher demand for personal cars.
An increase in the number of trucks is directly related to the level of eco-nomic development. Business activity growth results in a higher need for the transportation of goods. The volume of freight operations also depends on the degree of international cooperation and integration between countries.
The global number of heavy-duty vehicles is much lower than the light duty ve-hicles car fleet: 222 mln against 1 bln However, their average fuel consumption is higher. Therefore, the influence of the heavy-duty fleet on global oil consump-tion is generally comparable to the impact of passenger cars.
According to our estimates, from 2016 through 2030 the heavy-duty fleet will increase by 78%. Also, as with the passenger car fleet, the largest growth of trucks is expected in China and India.
13
RUSSIAN OIL INDUSTRYIN THE SEARCH OF EQUILIBRIUM GLOBAL OIL REFINING
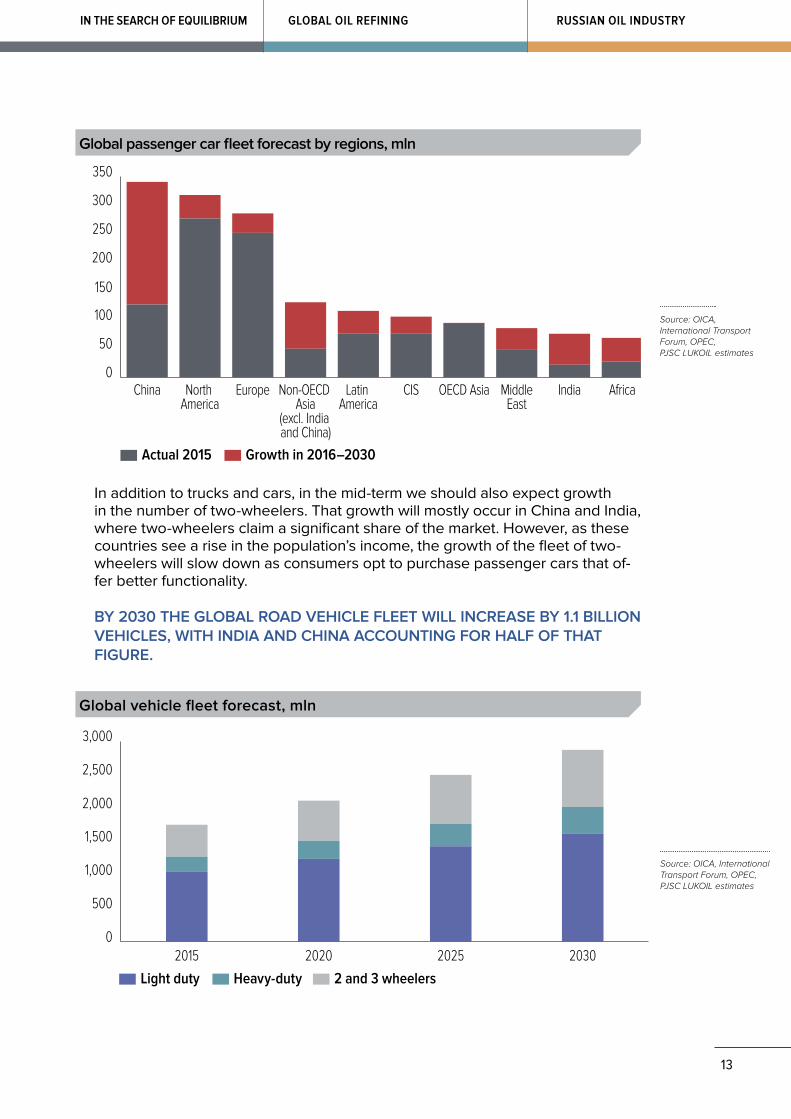
In addition to trucks and cars, in the mid-term we should also expect growth in the number of two-wheelers. That growth will mostly occur in China and India, where two-wheelers claim a significant share of the market. However, as these countries see a rise in the population’s income, the growth of the fleet of two-wheelers will slow down as consumers opt to purchase passenger cars that of-fer better functionality.
BY 2030 THE GLOBAL ROAD VEHICLE FLEET WILL INCREASE BY 1.1 BILLION VEHICLES, WITH INDIA AND CHINA ACCOUNTING FOR HALF OF THAT FIGURE.
Actual 2015 Growth in 2016–2030
0
50
100
150
200
250
300
350
AfricaIndiaMiddleEast
OECD AsiaCISLatin America
Non-OECD Asia
(excl. India and China)
EuropeNorth America
China
Global passenger car fleet forecast by regions, mln
Source: OICA, International Transport Forum, OPEC, PJSC LUKOIL estimates
Light duty Heavy-duty 2 and 3 wheelers
0
500
1,000
1,500
2,000
2,500
3,000
2030202520202015
Прогноз мирового парка дорожного транспорта, млн ед.Global vehicle fleet forecast, mln
Source: OICA, International Transport Forum, OPEC, PJSC LUKOIL estimates
14
GLOBAL OIL SUPPLYGLOBAL OIL DEMANDINTRODUCTION
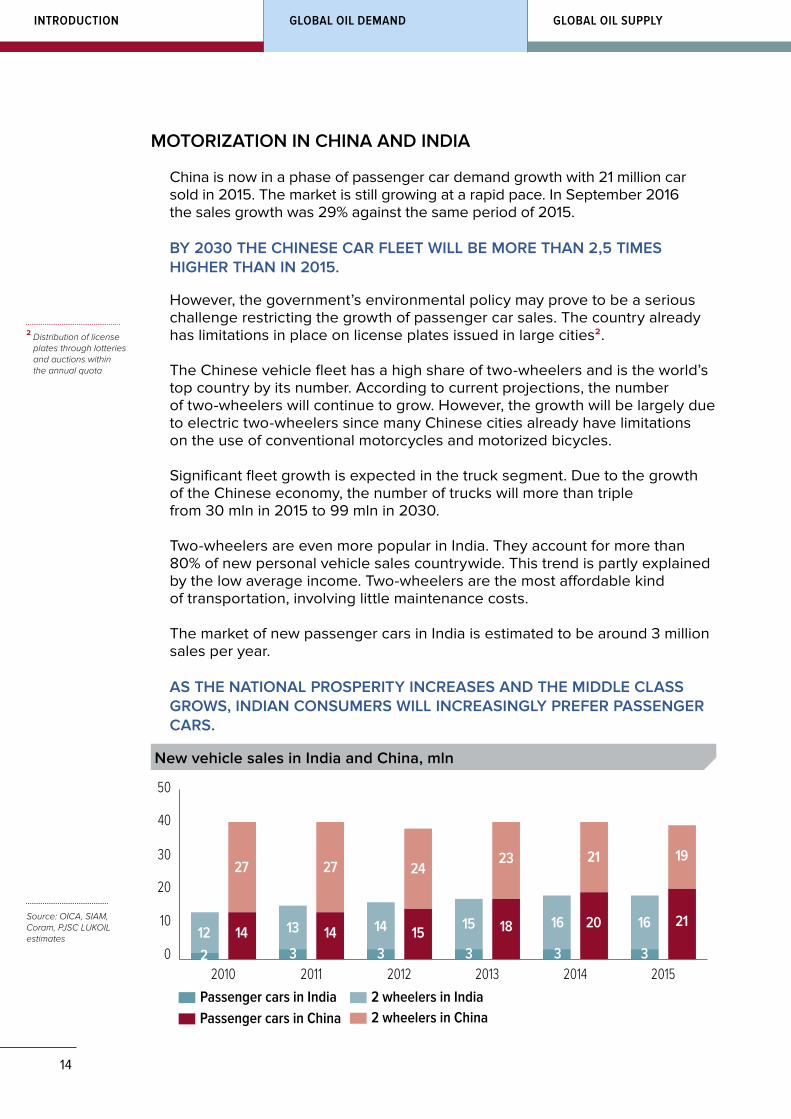
MOTORIZATION IN CHINA AND INDIA
China is now in a phase of passenger car demand growth with 21 million car sold in 2015. The market is still growing at a rapid pace. In September 2016 the sales growth was 29% against the same period of 2015.
BY 2030 THE CHINESE CAR FLEET WILL BE MORE THAN 2,5 TIMES HIGHER THAN IN 2015.
However, the government’s environmental policy may prove to be a serious challenge restricting the growth of passenger car sales. The country already has limitations in place on license plates issued in large cities2.
The Chinese vehicle fleet has a high share of two-wheelers and is the world’s top country by its number. According to current projections, the number of two-wheelers will continue to grow. However, the growth will be largely due to electric two-wheelers since many Chinese cities already have limitations on the use of conventional motorcycles and motorized bicycles.
Significant fleet growth is expected in the truck segment. Due to the growth of the Chinese economy, the number of trucks will more than triple from 30 mln in 2015 to 99 mln in 2030.
Two-wheelers are even more popular in India. They account for more than 80% of new personal vehicle sales countrywide. This trend is partly explained by the low average income. Two-wheelers are the most affordable kind of transportation, involving little maintenance costs.
The market of new passenger cars in India is estimated to be around 3 million sales per year.
AS THE NATIONAL PROSPERITY INCREASES AND THE MIDDLE CLASS GROWS, INDIAN CONSUMERS WILL INCREASINGLY PREFER PASSENGER CARS.
2 Distribution of license plates through lotteries and auctions within the annual quota
Passenger cars in India 2 wheelers in IndiaPassenger cars in China 2 wheelers in China
0
10
20
30
40
50
201520142013201220112010212
27
143
13
27
143
14
24
153
15
23
18
3
16
21
20
3
16
19
21
New vehicle sales in India and China, mln
Source: OICA, SIAM, Coram, PJSC LUKOIL estimates
15
RUSSIAN OIL INDUSTRYIN THE SEARCH OF EQUILIBRIUM GLOBAL OIL REFINING
At the same time, Indian authorities are concerned about environmental prob-lems in major cities. Since December 2015 diesel engines larger than 2 liters can no longer be registered in Delhi. Similar measures are also possible in other cities, which may adversely impact the growth of the passenger car fleet.
India enjoys significant opportunities for an increase in its heavy-duty vehicles fleet. By 2030 the Indian truck fleet may exceed 25 million vehicles, which is more than a two-fold increase compared to the current figure.
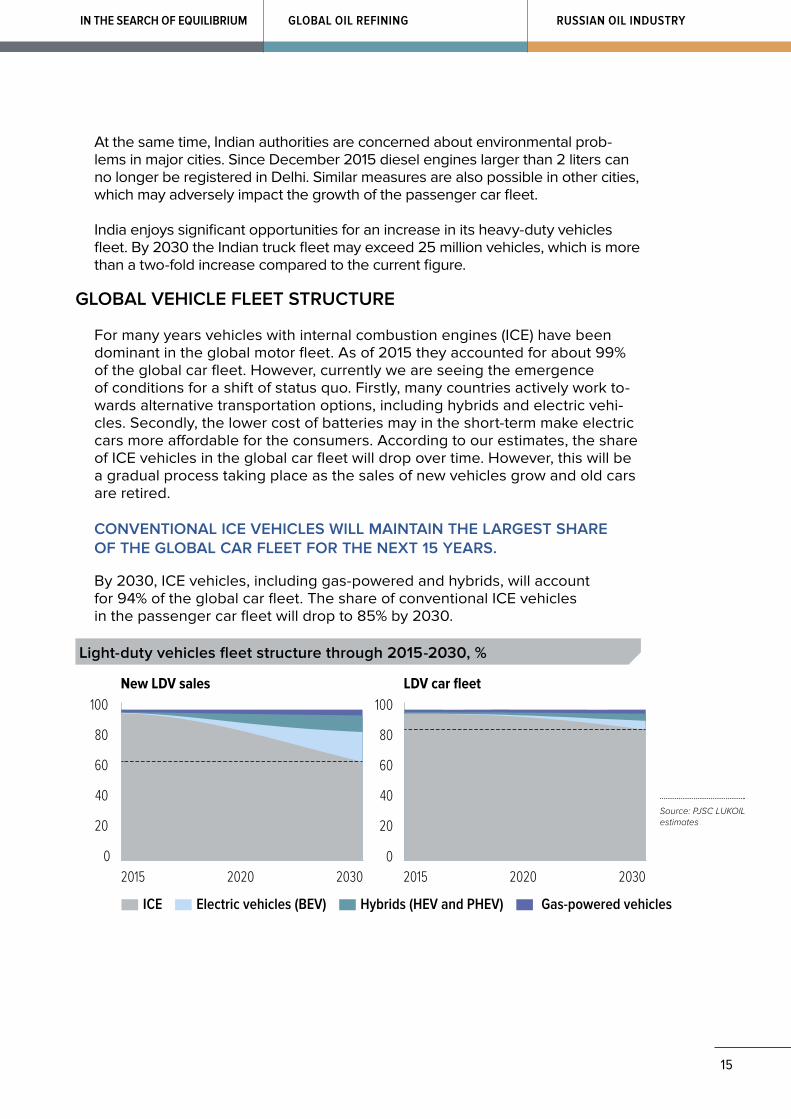
GLOBAL VEHICLE FLEET STRUCTURE
For many years vehicles with internal combustion engines (ICE) have been dominant in the global motor fleet. As of 2015 they accounted for about 99% of the global car fleet. However, currently we are seeing the emergence of conditions for a shift of status quo. Firstly, many countries actively work to-wards alternative transportation options, including hybrids and electric vehi-cles. Secondly, the lower cost of batteries may in the short-term make electric cars more affordable for the consumers. According to our estimates, the share of ICE vehicles in the global car fleet will drop over time. However, this will be a gradual process taking place as the sales of new vehicles grow and old cars are retired.
CONVENTIONAL ICE VEHICLES WILL MAINTAIN THE LARGEST SHARE OF THE GLOBAL CAR FLEET FOR THE NEXT 15 YEARS.
By 2030, ICE vehicles, including gas-powered and hybrids, will account for 94% of the global car fleet. The share of conventional ICE vehicles in the passenger car fleet will drop to 85% by 2030.
0
20
40
60
80
100
ICE Electric vehicles (BEV) Hybrids (HEV and PHEV) Gas-powered vehicles
0
20
40
60
80
100New LDV sales LDV car fleet
2015 2020 2030 2015 2020 2030
Light-duty vehicles fleet structure through 2015-2030, %
Source: PJSC LUKOIL estimates
16
GLOBAL OIL SUPPLYGLOBAL OIL DEMANDINTRODUCTION
ELECTRIC VEHICLES
Recently, press and the expert community have engaged in a heated debate regarding the opportunities for development of the electric vehicle market and the influence of that market on the global energy sector. Indeed, it is un-derstood that over the last few years some remarkable changes have occurred in the automotive industry. First, in 2012 an electric car with the appealing fea-tures, the Tesla Model S, was launched to the market. Tesla demonstrated that a long cruising range car with impressive dynamic characteristics was viable. Secondly, the world saw a significant decrease in the cost of batteries, the most expensive element of an electric car. Now the leading manufacturers of elec-tric vehicles mention a battery cost figure of 200 USD/kWh, and it is very like-ly that the cost will decrease even further. Thirdly, many automotive companies set ambitious targets to increase their production of electric vehicles. Thus, Te-sla is planning to boost their production to 500,000 electric cars by 2018 due to the launch of their new model, Tesla model III, designed for mass consumers. Volkswagen announced its plans to sell 2-3 mln electric vehicles by 2025. Such major manufacturers as General Motors, Toyota, and Renault-Nissan have ex-pressed an interest in developing electric vehicles.
The above developments partly follow from the policy of a number of countries pursuing carbon reduction in their transportation sector. Many countries have car efficiency improvement programs in place. Some governments state they are seeking ways to completely discontinue the use of ICE vehicles. In this con-text, Norway and the Netherlands are preparing their plans to completely switch to electric vehicles after 2025. Germany is planning to impose a ban on ICE ve-hicle sales in 2030. The Indian government, concerned with environmental is-sues, is now considering a ban on ICE vehicle sales starting in 2030.
Measures that would encourage the development of electric vehicles include various subsidies, tax exemptions, and incentives for electric vehicle owners. For instance, in the U.S. those who purchase an electric vehicle are entitled to a $7,500 federal tax exemption. China offers tax incentives of 6 to 10 thou-sand dollars. The highest incentives are available in Norway, where the electric vehicle consumer is entitled to an exemption from the sales tax for an amount equivalent to 12,000 dollars and from 25% VAT. Other kinds of incentives are al-so available. For instance, in China electric vehicles are exempt from property tax. A simplified registration procedure is also available, which is especially criti-cal for large cities with limitations on the issuance of license plates.
The electric vehicle market has been growing at an impressive pace: the mar-ket size has increased 10 times over the last 5 years to make up 1.26 mln electric vehicles in 2015. The number of vehicles powered solely by electric drive was about 700 thousand in 2015.

17
RUSSIAN OIL INDUSTRYIN THE SEARCH OF EQUILIBRIUM GLOBAL OIL REFINING
In 2015, a total of 550,000 electric vehicles were sold worldwide. Governmen-tal support enabled the share of electric vehicles in total sales to rise to 23% in Norway and 10% in the Netherlands. China is the current leader in electric ve-hicle sales, largely due to the popularity of electricity powered two-wheelers in this country.
According to our estimates, electric vehicles will become increasingly competi-tive and will gradually take their niche within the automotive market. In the base case scenario their share in global sales of new cars will reach about 20% by 2030. It means that by the end of the forecasted period there will be about 90 mln electric passenger cars on the roads (6% of the global car fleet). The rise in electric vehicle sales (including trucks) will allow oil demand to be re-duced by around 2 mb/d by 2030. The largest growth of electric car sales is ex-pected in the U.S., Western Europe and China, which offer favorable environ-ment for the expansion of electric vehicles.
WorldNorth America Africa Europe China India
0
5
10
15
20
25
30
35
2030202920282027202620252024202320222021202020192018201720162015
Доля электромобилей в продажах новых легковых а/м по регионам, %EV share in new passenger car sales by region, %
Source: PJSC LUKOIL estimates
THE NECESSARY CONDITION FOR THE BASE CASE SCENARIO OF ELECTRIC VEHICLE SALES GROWTH IS FURTHER REDUCTION IN THE COST OF BATTERIES.
However, the increased demand for batteries coming from automotive compa-nies may lead to a surge in the prices of related raw materials, such as lithium, cobalt, lead, nickel, and magnesium, which could be an issue preventing a re-duction in battery cost.
According to expert estimates currently available, the battery cost must be cut down to 100 USD/kWh for the electric vehicles to compete with conven-tional vehicles without subsidies. Otherwise, the subsidies will grow mul-ti-fold and become a heavy burden for national budgets of the countries of-fering support programs. If we consider the average subsidy to purchase
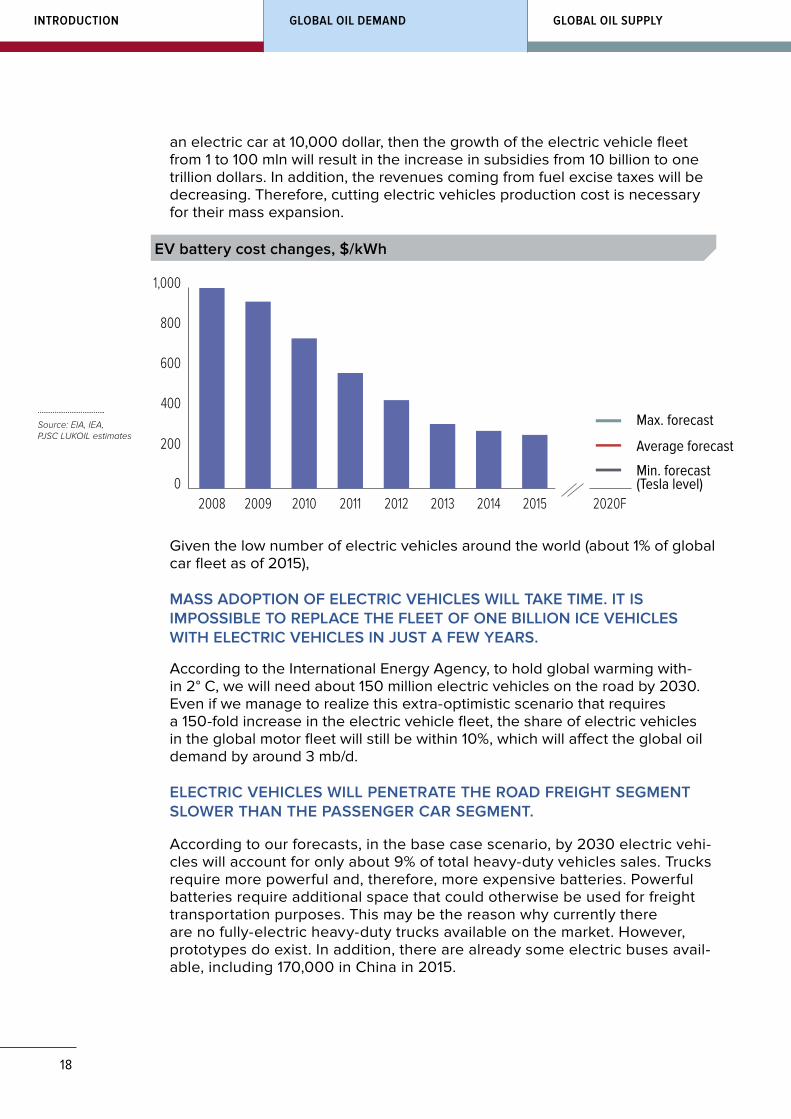
18
GLOBAL OIL SUPPLYGLOBAL OIL DEMANDINTRODUCTION
an electric car at 10,000 dollar, then the growth of the electric vehicle fleet from 1 to 100 mln will result in the increase in subsidies from 10 billion to one trillion dollars. In addition, the revenues coming from fuel excise taxes will be decreasing. Therefore, cutting electric vehicles production cost is necessary for their mass expansion.
0
200
400
600
800
1,000
2020F20152014201320122011201020092008
Max. forecast
Average forecast
Min. forecast(Tesla level)
EV battery cost changes, $/kWh
Source: EIA, IEA, PJSC LUKOIL estimates
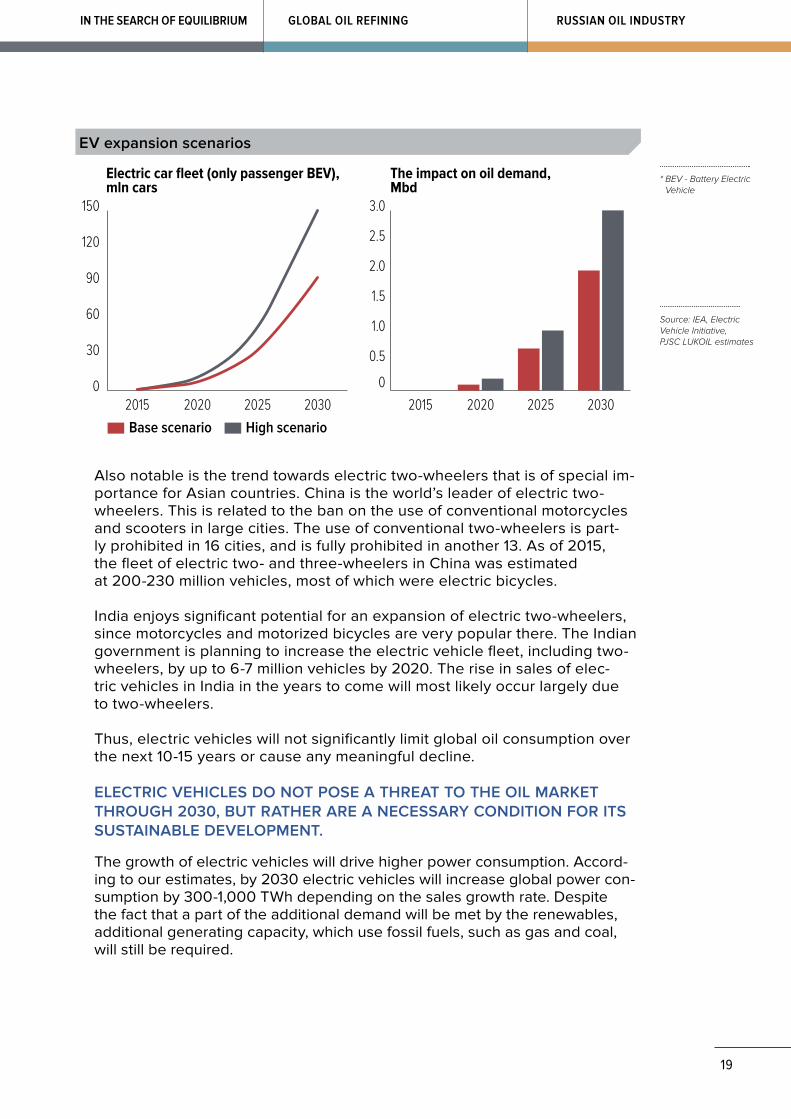
Given the low number of electric vehicles around the world (about 1% of global car fleet as of 2015),
MASS ADOPTION OF ELECTRIC VEHICLES WILL TAKE TIME. IT IS IMPOSSIBLE TO REPLACE THE FLEET OF ONE BILLION ICE VEHICLES WITH ELECTRIC VEHICLES IN JUST A FEW YEARS.
According to the International Energy Agency, to hold global warming with-in 2° С, we will need about 150 million electric vehicles on the road by 2030. Even if we manage to realize this extra-optimistic scenario that requires a 150-fold increase in the electric vehicle fleet, the share of electric vehicles in the global motor fleet will still be within 10%, which will affect the global oil demand by around 3 mb/d.
ELECTRIC VEHICLES WILL PENETRATE THE ROAD FREIGHT SEGMENT SLOWER THAN THE PASSENGER CAR SEGMENT.
According to our forecasts, in the base case scenario, by 2030 electric vehi-cles will account for only about 9% of total heavy-duty vehicles sales. Trucks require more powerful and, therefore, more expensive batteries. Powerful batteries require additional space that could otherwise be used for freight transportation purposes. This may be the reason why currently there are no fully-electric heavy-duty trucks available on the market. However, prototypes do exist. In addition, there are already some electric buses avail-able, including 170,000 in China in 2015.
19
RUSSIAN OIL INDUSTRYIN THE SEARCH OF EQUILIBRIUM GLOBAL OIL REFINING
Base scenario High scenario
0
30
60
90
120
150
2030202520202015
0
0.5
1.0
1.5
2.0
2.5
3.0
2030202520202015
Electric car fleet (only passenger BEV), mln cars
The impact on oil demand, Mbd
EV expansion scenarios
Source: IEA, Electric Vehicle Initiative, PJSC LUKOIL estimates
* BEV - Battery Electric Vehicle
Also notable is the trend towards electric two-wheelers that is of special im-portance for Asian countries. China is the world’s leader of electric two-wheelers. This is related to the ban on the use of conventional motorcycles and scooters in large cities. The use of conventional two-wheelers is part-ly prohibited in 16 cities, and is fully prohibited in another 13. As of 2015, the fleet of electric two- and three-wheelers in China was estimated at 200-230 million vehicles, most of which were electric bicycles.
India enjoys significant potential for an expansion of electric two-wheelers, since motorcycles and motorized bicycles are very popular there. The Indian government is planning to increase the electric vehicle fleet, including two-wheelers, by up to 6-7 million vehicles by 2020. The rise in sales of elec-tric vehicles in India in the years to come will most likely occur largely due to two-wheelers.
Thus, electric vehicles will not significantly limit global oil consumption over the next 10-15 years or cause any meaningful decline.
ELECTRIC VEHICLES DO NOT POSE A THREAT TO THE OIL MARKET THROUGH 2030, BUT RATHER ARE A NECESSARY CONDITION FOR ITS SUSTAINABLE DEVELOPMENT.
The growth of electric vehicles will drive higher power consumption. Accord-ing to our estimates, by 2030 electric vehicles will increase global power con-sumption by 300-1,000 TWh depending on the sales growth rate. Despite the fact that a part of the additional demand will be met by the renewables, additional generating capacity, which use fossil fuels, such as gas and coal, will still be required.
20
GLOBAL OIL SUPPLYGLOBAL OIL DEMANDINTRODUCTION
LITHIUM MARKET
The high cost to produce electric vehicles is one of the key issues prevent-ing their mass expansion. The most expensive component of an electric ve-hicle is its battery. Currently, the most popular batteries in the automotive industry are lithium-ion cells. Their popularity derives from a number of dis-tinctive features they offer, including high power capacity, low weight, short charging time, large number of charge cycles, and long discharge time. Shortcomings of lithium-ion batteries include sensitivity to high and low tem-peratures and recycling issues.
Lithium products, such as lithium carbonate and lithium hydroxide, are key components of lithium-ion batteries. Along with other metals, lithium is used in battery cathodes. The rise in production of electric vehicles has caused a surge in prices for lithium and its derivatives. Over the period beginning in 2014 lithium carbonate prices have quadrupled. In the mid-term the de-mand for lithium is expected to grow even further. According to Wood Mac-kenzie estimates, by 2030 global lithium consumption will triple. It is high-ly probable that the supply of lithium won’t be able to keep the pace with its demand.
Many of the lithium production projects are still in their early stages. Given the time required to obtain a license, raise sufficient funds, and perform con-struction activities, the experts estimate it will take more than 10 years to in-crease lithium supply twofold. We may therefore expect the market to ex-perience a steady shortage, and the upward trend in lithium prices will continue.
However, lithium accounts for just 2 – 3% of the battery cost in current pric-es. Therefore the rise in lithium prices will not greatly affect the battery cost. Moreover, some automotive manufacturers, such as Tesla, already have long-term lithium supply contracts at fixed prices. A more significant portion of the battery cost derives from the nickel and cobalt, which represent more than half of the cathode cost. The rise in prices for those metals may signifi-cantly affect the battery price.
ENVIRONMENTAL ASPECTS OF ELECTRIC VEHICLES
The surge in popularity of electric vehicles is largely related to the fact that they are quite often perceived by many people as an environmentally friend-ly mode of transportation that is capable of reducing the environmental im-pact. However, that is not quite the case. Firstly, the power supply sources for the electric vehicles may be not that "clean", as, for example, is the case with coal. In this case environmental implications from the expansion of elec-tric vehicles will be adverse. Secondly, lithium and other battery components are capable of having a negative environmental impact. Thirdly, the effects produced by the electromagnetic radiation emitted by the electric vehicle’s battery on human health are yet to be fully studied.
21
RUSSIAN OIL INDUSTRYIN THE SEARCH OF EQUILIBRIUM GLOBAL OIL REFINING
Lithium is classified as a highly hazardous substance. Its penetration into soil and water or emission into the air may cause material damage to the envi-ronment and harm to human health. According to Russian safety standards, lithium belongs to hazard class 2, meaning that the maximum allowable con-centration of this substance in air must be within 1 mg. per cubic meter, while the environmental recovery period is 30 years after the detrimental effect has been completely removed. The environmental impact produced by lith-ium may occur during both mining operations and the use of the batteries containing this substance.
IN THE ABSENCE OF APPROPRIATE SUPERVISION, THE GROWTH IN PRODUCTION OF LITHIUM-ION BATTERIES WILL SIGNIFICANTLY INCREASE THE NEGATIVE IMPACT ON THE ENVIRONMENT.
Modern recycling technologies enable the recovery of up to 50% of the mate-rials utilized in the production of batteries. Nevertheless, lithium-ion batteries are quite often incinerated or disposed into the landfill since the existing emis-sion fees are generally quite low.
Lithium-ion batteries are easily flammable under short circuit conditions or me-chanical action. Several electric vehicle fires have occurred over the last five years. The risk of fire increases when the vehicle is being charged and when the battery gets hot. Automotive manufacturers are putting great effort to im-prove the reliability and safety of their batteries. However, the attempts to cut the costs may result in unsafe electric vehicle models entering the market.
It has been scientifically proven that strong electromagnetic fields affect hu-man health. International surveys found that operators of electricity-powered trains suffer illnesses more often than any other average railroaders. The ef-fects produced on people by the electromagnetic radiation emitted during the operation of an electric vehicle are yet to be fully studied. It will take time and effort to undertake surveys that will help estimate how safe the electric vehicles are to human health.
POTENTIAL FOR FUEL ECONOMY IMPROVEMENT BY ICE VEHICLES
The loss of energy in a vehicle with an internal combustion engine is estimat-ed to be as high as 80%. However, the existing technologies can significantly improve this efficiency rate and, therefore, reduce fuel consumption.
THE FUEL CONSUMPTION OF AN ICE VEHICLE MAY BE REDUCED TO 50 - 70% THROUGH THE USE OF MODERN TECHNOLOGIES.
In fact, as opposed to electric vehicles, this potential may be captured through the use of technologies that are already available on the market.

22
GLOBAL OIL SUPPLYGLOBAL OIL DEMANDINTRODUCTION
Among major elements of a vehicle, internal combustion engine offers the high-est potential for fuel efficiency improvement. Up to 30% of fuel savings may be achieved by comprehensive ICE improvement. One of the possible techniques is to introduce a system of multi-stage fuel injection directly into the combustion chamber to provide a fuller combustion of the air-fuel mixture. Another promis-ing area of improvement in the ICE design is the use of a turbo-charging tech-nology that has recently become popular, which helps to maintain an optimal fuel to air ratio within the engine and improve its power-efficiency and envi-ronmental performance. The most sophisticated technologies include a varia-ble valve event and lift (VVEL) phase change system. The point of this system is that the valve opening time is adapted to different engine regimes.
Most expectations in terms of fuel efficiency improvement now lie with hybrid technologies, the use of which involves the installation of an electric motor with an additional battery into the ICE vehicle. Hybrid vehicles are common-ly classified as full hybrids (Hybrid Electric Vehicle – HEV) that are capable of charging the battery through regenerative braking only and plug-in hybrids (Plug-in Hybrid Electric Vehicle – PHEV), which can recharge with electrici-ty from charging stations. Introducing hybrid technologies will help achieve an additional reduction in fuel consumption by another 25% for HEV and by 30-50% for PHEV.
Additional fuel savings may be achieved by making a lighter car body, through the use of a robotized transmission and technologically advanced tires. Thus, the wider use of aluminum and composite materials in the car body’s structur-al design helps to reduce fuel consumption by about 10-15%. The use of robot-ized transmission reduces mechanical loss and results in a 7% lower fuel con-sumption. Improving the process for tire production and optimizing the tread pattern will save up to 5% of fuel.
0
1
2
3
4
5
6
7
8
70605040302010
Hybrid system
Weight reductionStart-stop
Automated transmissionThermal cycle optimization
Turbocharged engine
Cost, thousand $
Fuel e�ciency improvement (cumulative), %
Cost of fuel efficiency improvement technologies, $2015
Source: IEA, PJSC LUKOIL estimates

23
RUSSIAN OIL INDUSTRYIN THE SEARCH OF EQUILIBRIUM GLOBAL OIL REFINING
The more fuel-efficient the vehicle, the higher the cost if other performance parameters are equal. Therefore, the reason for purchasing a fuel-efficient ve-hicle largely depends on fuel prices. As long as the premium the owner has to pay for a more fuel-efficient car remains lower than the value of fuel savings over the vehicle ownership period, the purchase is advantageous for the con-sumer. Governments may provide additional incentives to improve consumer value of fuel-efficient vehicles, like, for example, raising the fuel excise tax.
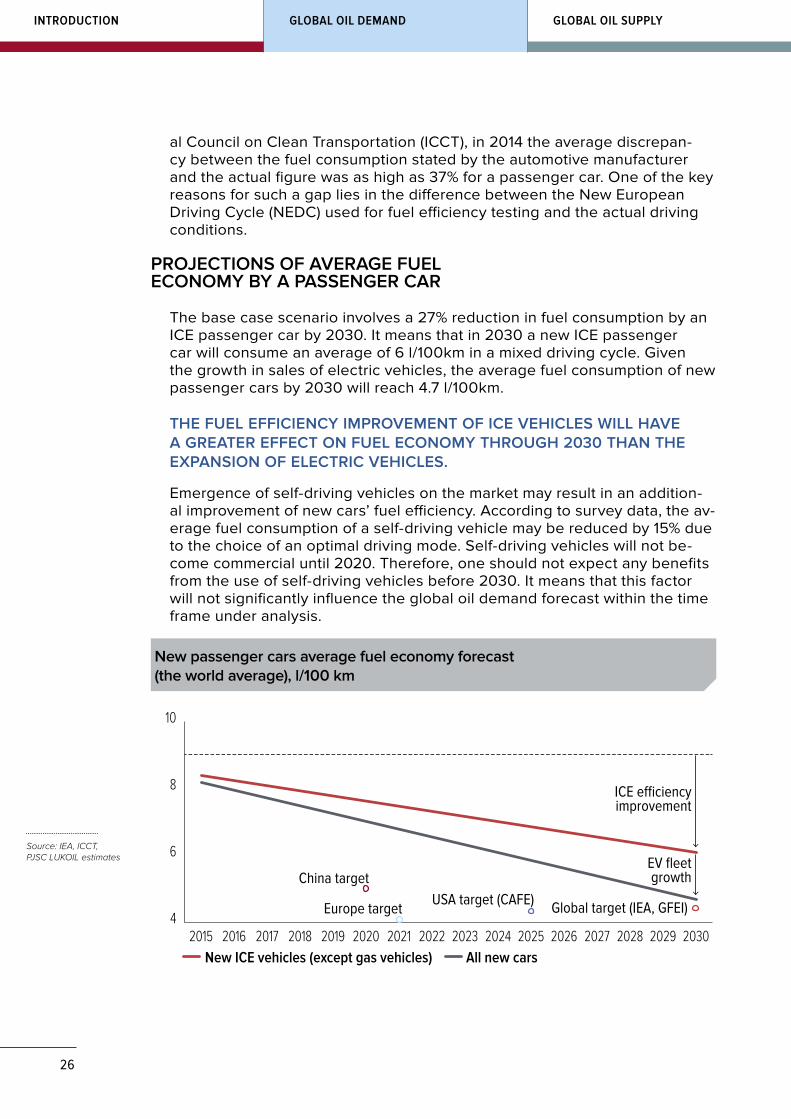
Keeping in mind the existing technologies that drive improvements in fuel ef-ficiency, as well as their cost, we presume that the average fuel consumption of a new ICE car will fall by 27% by 2030 compared to the 2015 figure.
CLIMATE CHANGE POLICY IMPACT ON THE DEVELOPMENT OF GLOBAL ENERGY
The connection between global warming and greenhouse gas emissions is still the subject of debate within the scientific community. Some scientists are of the opinion that climate change occurs on our planet in a cyclical man-ner and does not depend on human activities. At the same time, the interna-tional policy is dominated by the alternative standpoint, according to which global warming is caused by industrial development and the growth of in-dustrial production. This idea acts as the underlying assumption of the cli-mate policies pursued by most countries around the world.
In December 2015, the 21st session of the UN Conference on Climate Change (СОР 21) was held in Paris. As a result an agreement was signed be-tween 195 member states that provides for measures to reduce carbon di-oxide emissions starting in 2020. Most of the international community took part in signing the Paris Agreement. The Agreement’s key goal is to limit the growth of the average global temperature well below 2°С and make an effort to keep the warming within 1.5°С compared to the pre-industrial era.
The Paris Agreement is expected to replace the Kyoto Protocol starting in 2020. The countries that are parties to the Agreement individually de-cide on their contribution to the common goal. According to IEA, more than 160 countries declared their Intended Nationally Determined Contributions (INDC) concerning the reduction of greenhouse emissions. However, the ex-perts state that those initiatives are insufficient to achieve the goal of keep-ing global warming within 2°С. In addition, there is no mechanism in place to enforce the achievement of national goals. Every five years monitoring ac-tivities will be conducted to check the performance of the existing arrange-ments, and the latter will be adjusted, as necessary.
The Paris Agreement provides for a mechanism to assist developing coun-tries in achieving the climate change prevention goals. Thus, developed countries assumed the commitment to provide assistance to the developing countries, amounting to 100 bln dollars per year.
24
GLOBAL OIL SUPPLYGLOBAL OIL DEMANDINTRODUCTION
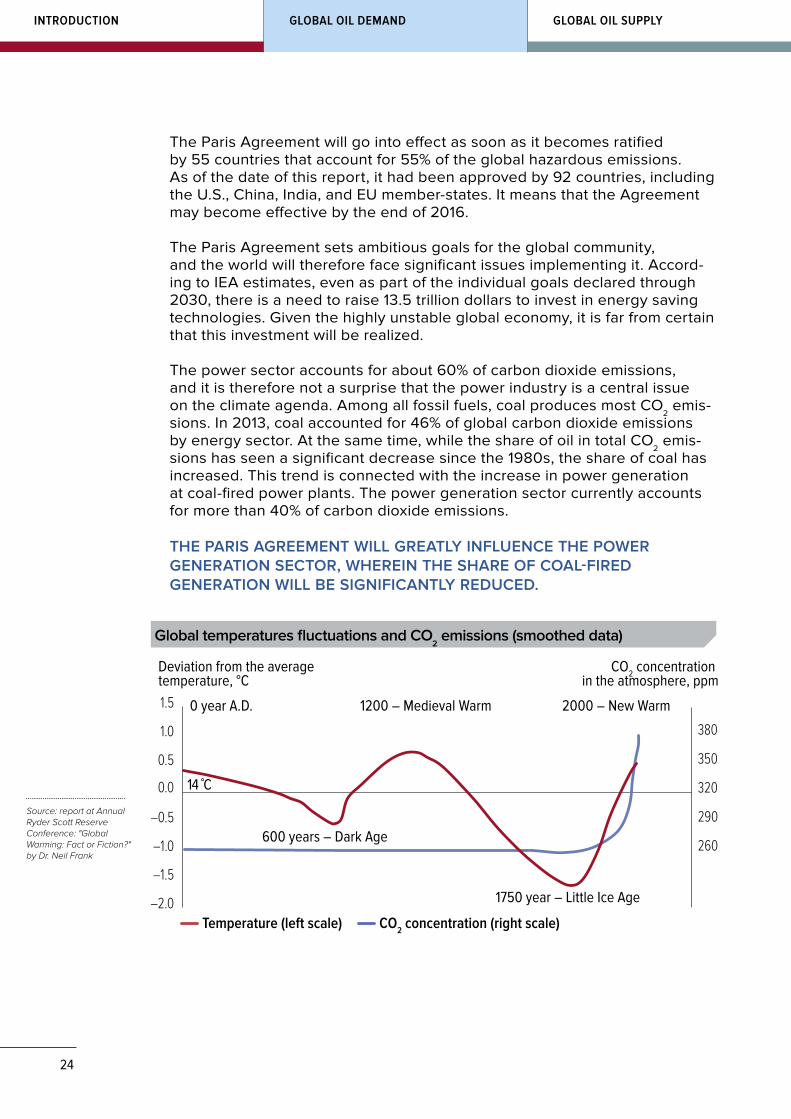
The Paris Agreement will go into effect as soon as it becomes ratified by 55 countries that account for 55% of the global hazardous emissions. As of the date of this report, it had been approved by 92 countries, including the U.S., China, India, and EU member-states. It means that the Agreement may become effective by the end of 2016.
The Paris Agreement sets ambitious goals for the global community, and the world will therefore face significant issues implementing it. Accord-ing to IEA estimates, even as part of the individual goals declared through 2030, there is a need to raise 13.5 trillion dollars to invest in energy saving technologies. Given the highly unstable global economy, it is far from certain that this investment will be realized.
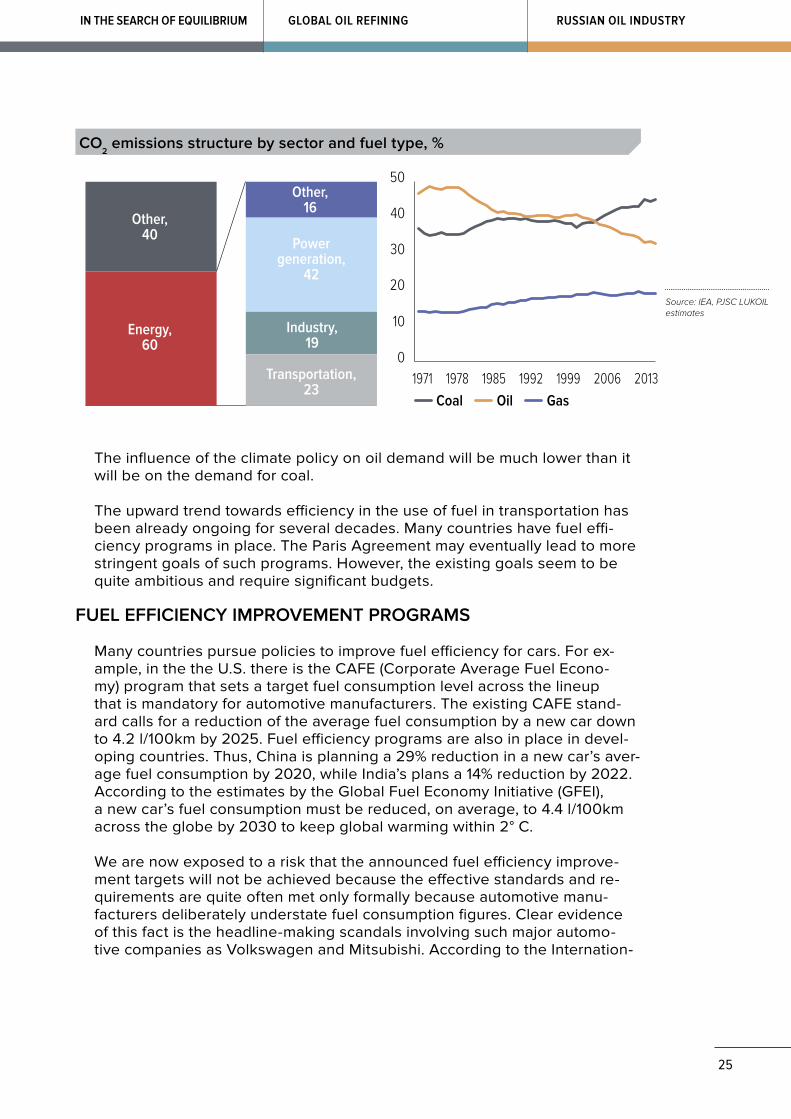
The power sector accounts for about 60% of carbon dioxide emissions, and it is therefore not a surprise that the power industry is a central issue on the climate agenda. Among all fossil fuels, coal produces most СО
2 emis-
sions. In 2013, coal accounted for 46% of global carbon dioxide emissions by energy sector. At the same time, while the share of oil in total СО
2 emis-
sions has seen a significant decrease since the 1980s, the share of coal has increased. This trend is connected with the increase in power generation at coal-fired power plants. The power generation sector currently accounts for more than 40% of carbon dioxide emissions.
THE PARIS AGREEMENT WILL GREATLY INFLUENCE THE POWER GENERATION SECTOR, WHEREIN THE SHARE OF COAL-FIRED GENERATION WILL BE SIGNIFICANTLY REDUCED.
2002 2003 2004 2005 2006 2006 2007 2008 2009 2010 2011 2012 2013 2014 2015 2016
Deviation from the averagetemperature, °С
CO2 concentration in the atmosphere, ppm
0 year A.D.
14 ˚C
1200 – Medieval Warm
600 years – Dark Age
1750 year – Little Ice Age
2000 – New Warm
260
290
320
350
380
Temperature (left scale) CO2 concentration (right scale)–2.0
–1.5
–1.0
–0.5
0.0
0.5
1.0
1.5
Global temperatures fluctuations and CO2 emissions (smoothed data)
Source: report at Annual Ryder Scott Reserve Conference: "Global Warming: Fact or Fiction?" by Dr. Neil Frank
25
RUSSIAN OIL INDUSTRYIN THE SEARCH OF EQUILIBRIUM GLOBAL OIL REFINING
The influence of the climate policy on oil demand will be much lower than it will be on the demand for coal.
The upward trend towards efficiency in the use of fuel in transportation has been already ongoing for several decades. Many countries have fuel effi-ciency programs in place. The Paris Agreement may eventually lead to more stringent goals of such programs. However, the existing goals seem to be quite ambitious and require significant budgets.
FUEL EFFICIENCY IMPROVEMENT PROGRAMS
Many countries pursue policies to improve fuel efficiency for cars. For ex-ample, in the the U.S. there is the CAFE (Corporate Average Fuel Econo-my) program that sets a target fuel consumption level across the lineup that is mandatory for automotive manufacturers. The existing CAFE stand-ard calls for a reduction of the average fuel consumption by a new car down to 4.2 l/100km by 2025. Fuel efficiency programs are also in place in devel-oping countries. Thus, China is planning a 29% reduction in a new car’s aver-age fuel consumption by 2020, while India’s plans a 14% reduction by 2022. According to the estimates by the Global Fuel Economy Initiative (GFEI), a new car’s fuel consumption must be reduced, on average, to 4.4 l/100km across the globe by 2030 to keep global warming within 2° С.
We are now exposed to a risk that the announced fuel efficiency improve-ment targets will not be achieved because the effective standards and re-quirements are quite often met only formally because automotive manu-facturers deliberately understate fuel consumption figures. Clear evidence of this fact is the headline-making scandals involving such major automo-tive companies as Volkswagen and Mitsubishi. According to the Internation-
Coal Oil Gas
0
20
10
30
40
50
Energy,60
Other,40
Other,16
Transportation,23
Industry,19
Power generation,
42
1971 1978 1985 1992 1999 2006 2013
CO2 emissions structure by sector and fuel type, %
Source: IEA, PJSC LUKOIL estimates
26
GLOBAL OIL SUPPLYGLOBAL OIL DEMANDINTRODUCTION
al Council on Clean Transportation (ICCT), in 2014 the average discrepan-cy between the fuel consumption stated by the automotive manufacturer and the actual figure was as high as 37% for a passenger car. One of the key reasons for such a gap lies in the difference between the New European Driving Cycle (NEDC) used for fuel efficiency testing and the actual driving conditions.
PROJECTIONS OF AVERAGE FUEL ECONOMY BY A PASSENGER CAR
The base case scenario involves a 27% reduction in fuel consumption by an ICE passenger car by 2030. It means that in 2030 a new ICE passenger car will consume an average of 6 l/100km in a mixed driving cycle. Given the growth in sales of electric vehicles, the average fuel consumption of new passenger cars by 2030 will reach 4.7 l/100km.
THE FUEL EFFICIENCY IMPROVEMENT OF ICE VEHICLES WILL HAVE A GREATER EFFECT ON FUEL ECONOMY THROUGH 2030 THAN THE EXPANSION OF ELECTRIC VEHICLES.
Emergence of self-driving vehicles on the market may result in an addition-al improvement of new cars’ fuel efficiency. According to survey data, the av-erage fuel consumption of a self-driving vehicle may be reduced by 15% due to the choice of an optimal driving mode. Self-driving vehicles will not be-come commercial until 2020. Therefore, one should not expect any benefits from the use of self-driving vehicles before 2030. It means that this factor will not significantly influence the global oil demand forecast within the time frame under analysis.
New ICE vehicles (except gas vehicles) All new cars
4
6
8
10
2030202920282027202620252024202320222021202020192018201720162015
China target
Europe targetUSA target (CAFE) Global target (IEA, GFEI)
ICE e�ciencyimprovement
EV fleetgrowth
New passenger cars average fuel economy forecast (the world average), l/100 km
Source: IEA, ICCT, PJSC LUKOIL estimates
27
RUSSIAN OIL INDUSTRYIN THE SEARCH OF EQUILIBRIUM GLOBAL OIL REFINING
CHANGE IN CONSUMER BEHAVIOR REGARDING ROAD TRANSPORTATION
The overall consumption of fuel by road transportation does not only de-pend on fuel economy rates but also on vehicle mileage. In the long run the changes in passenger car mileages will depend on a number of multi-directional trends. On the one hand, the growth of average income gener-ally results in higher mileages as drivers tend to take more trips. Improved car efficiency also leads to higher mileages. On the other hand, such trends as population aging and increased popularity of distant working jobs will cut the demand for mobility, resulting in lower mileages.
One recent trend has been the active development of car sharing servic-es. Expansion of transportation services like Uber and Gett as well as car sharing programs is growing rapidly. However, they will have very little im-pact on average mileages since they do not result in significant reduction in the number of car trips. In contrast, such services may attract some per-manent users of public transportation services.
Given the above trends, the base case scenario predicts the average pas-senger car mileages will remain almost unchanged through 2030.
DEMAND FOR OIL IN ROAD TRANSPORTATION
THE TRANSPORTATION SECTOR WILL STILL BE THE KEY DRIVER OF THE GLOBAL DEMAND FOR OIL THROUGH 2030.
According to our estimates, oil consumption in road transportation will grow by 7 mb/d by 2030. The greatest contribution to oil consumption in road transportation will be made by the heavy-duty sector. Improving ICE fu-el efficiency and the expansion of electric vehicles and hybrids will cause the passenger car demand for oil to stop rising by 2025 and begin to grad-ually decline. However, oil consumption by heavy-duty transport will keep on growing because, as we expect, the expansion of electric vehicles in this segment will be a much slower process as compared to that in the passen-ger car segment. We expect a rise in oil consumption by commercial vehi-cles of 4.5 mb/d by 2030.
The upward trend in fuel efficiency will still significantly influence the oil de-mand. Without fuel efficiency improvement, the consumption in road trans-portation sector could be 20 mb/d higher.

28
GLOBAL OIL SUPPLYGLOBAL OIL DEMANDINTRODUCTION
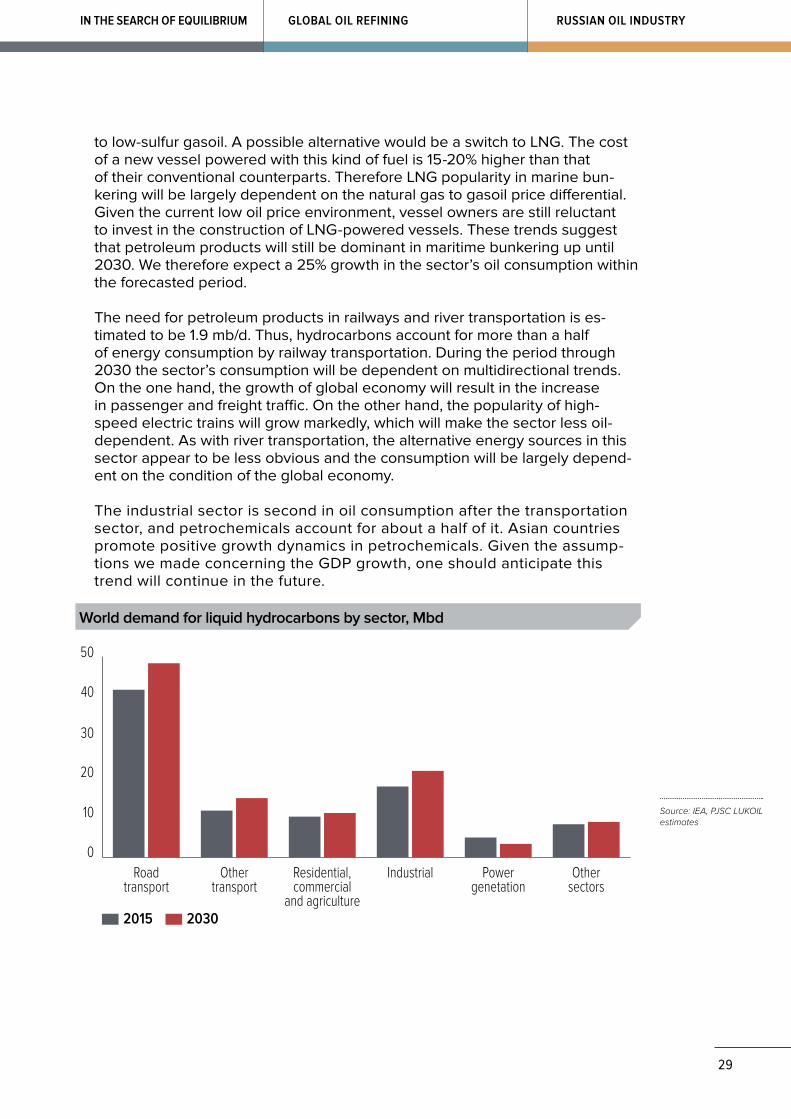
DEMAND FOR OIL IN OTHER SECTORS
The transportation sector accounts for more than half of the global oil demand. In addition to road transportation, other sectors including air transportation, railways, and river and marine transportation where petroleum products still re-main a popular fuel, contribute greatly to the consumption growth.
In 2015, the demand for oil by airlines was estimated at 5.5 mb/d, of which about a third was consumed by developing countries. Those countries account-ed for the largest increase in oil consumption over the last 20 years. There is a connection between the population income levels and the demand for air transportation services. The richer the country becomes, the more its people travel and go on business trips. Since the upward trend in population income and the middle class numbers over the next 15 years to come will continue in many developing countries, we may expect that the demand for air transpor-tation will keep rising. We also expect that despite the experiments in the use of solar energy and natural gas as a source of energy to power aircraft, kero-sene will still be the most widespread type of fuel used. In addition, fuel con-sumption will continue to decrease as the old engines are replaced with new-er more fuel efficient ones. Given the trends outlined above we estimate that by 2030 the demand for oil from the air transportation sector will increase by 30%.
Consumption of oil in marine transportation has been seeing a steady growth for the last few years to reach 4.3 mb/d in 2015. The demand in this sector is closely connected to the rate of global economic growth and internation-al trade. Currently, high-sulfur fuel oil and middle distillates remain the most widely used kinds of marine fuel. In 2015, the sulfur content limit of 0.1% was imposed for the fuel in the coastal areas of Northwestern Europe and North America. The International Maritime Organization (IMO) standards are expected to be further tightened in 2020, which will involve a worldwide ban on the use of fuel with more than 0.5% sulfur content. In order to comply with IMO stand-ards, shipowners will need to install scrubbers to catch the emissions or switch
Potential growth in demand without increase in fuel e�ciency of car fleet*:+ 3,3% per year
Passanger cars Heavy-duty 2 and 3 wheelers
0
10
20
30
40
50
60
70
2030202920282027202620252024202320222021202020192018201720162015
20 Mbd
Forecast of oil demand in road transportation, Mbd
Source: IEA, PJSC LUKOIL estimates
* Potential increase in demand is estimated in accordance with the forecast of the global car fleet growth
29
RUSSIAN OIL INDUSTRYIN THE SEARCH OF EQUILIBRIUM GLOBAL OIL REFINING
to low-sulfur gasoil. A possible alternative would be a switch to LNG. The cost of a new vessel powered with this kind of fuel is 15-20% higher than that of their conventional counterparts. Therefore LNG popularity in marine bun-kering will be largely dependent on the natural gas to gasoil price differential. Given the current low oil price environment, vessel owners are still reluctant to invest in the construction of LNG-powered vessels. These trends suggest that petroleum products will still be dominant in maritime bunkering up until 2030. We therefore expect a 25% growth in the sector’s oil consumption within the forecasted period.
The need for petroleum products in railways and river transportation is es-timated to be 1.9 mb/d. Thus, hydrocarbons account for more than a half of energy consumption by railway transportation. During the period through 2030 the sector’s consumption will be dependent on multidirectional trends. On the one hand, the growth of global economy will result in the increase in passenger and freight traffic. On the other hand, the popularity of high-speed electric trains will grow markedly, which will make the sector less oil-dependent. As with river transportation, the alternative energy sources in this sector appear to be less obvious and the consumption will be largely depend-ent on the condition of the global economy.
The industrial sector is second in oil consumption after the transportation sector, and petrochemicals account for about a half of it. Asian countries promote positive growth dynamics in petrochemicals. Given the assump-tions we made concerning the GDP growth, one should anticipate this trend will continue in the future.
2015 2030
0
10
20
30
40
50
Othersectors
Powergenetation
IndustrialResidential,commercial
and agriculture
Othertransport
Roadtransport
World demand for liquid hydrocarbons by sector, Mbd
Source: IEA, PJSC LUKOIL estimates
30
GLOBAL OIL SUPPLYGLOBAL OIL DEMANDINTRODUCTION
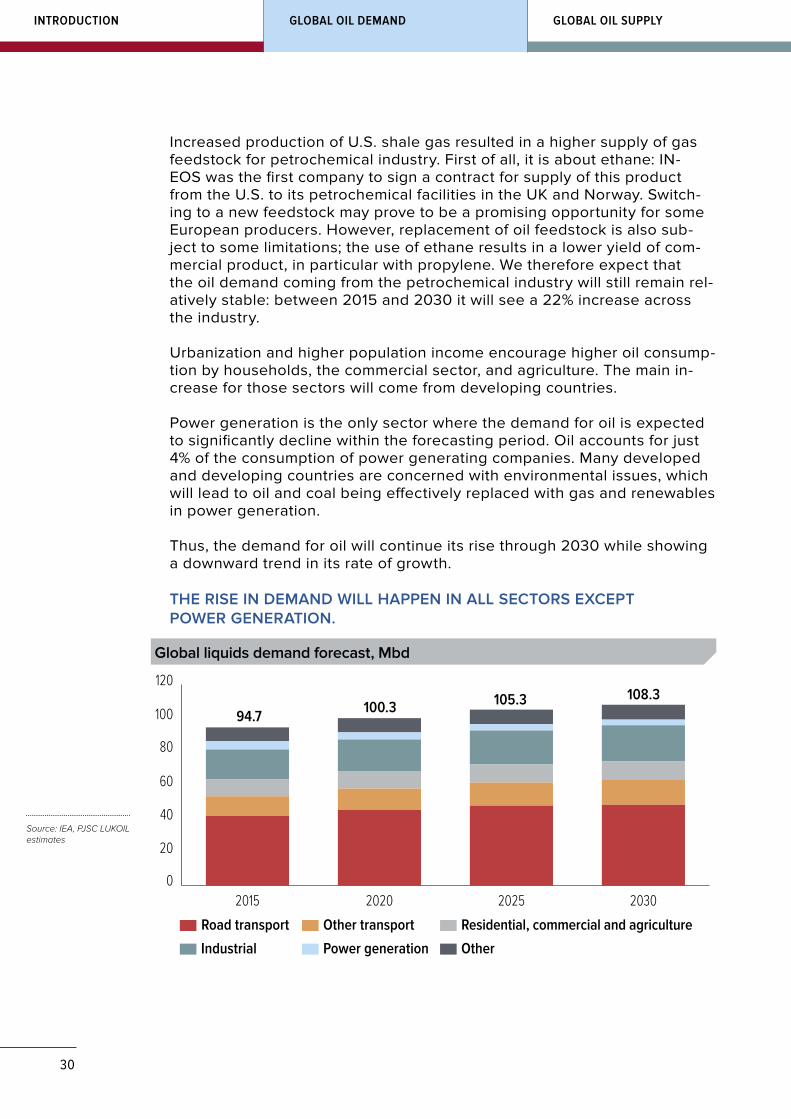
Increased production of U.S. shale gas resulted in a higher supply of gas feedstock for petrochemical industry. First of all, it is about ethane: IN-EOS was the first company to sign a contract for supply of this product from the U.S. to its petrochemical facilities in the UK and Norway. Switch-ing to a new feedstock may prove to be a promising opportunity for some European producers. However, replacement of oil feedstock is also sub-ject to some limitations; the use of ethane results in a lower yield of com-mercial product, in particular with propylene. We therefore expect that the oil demand coming from the petrochemical industry will still remain rel-atively stable: between 2015 and 2030 it will see a 22% increase across the industry.
Urbanization and higher population income encourage higher oil consump-tion by households, the commercial sector, and agriculture. The main in-crease for those sectors will come from developing countries.
Power generation is the only sector where the demand for oil is expected to significantly decline within the forecasting period. Oil accounts for just 4% of the consumption of power generating companies. Many developed and developing countries are concerned with environmental issues, which will lead to oil and coal being effectively replaced with gas and renewables in power generation.
Thus, the demand for oil will continue its rise through 2030 while showing a downward trend in its rate of growth.
THE RISE IN DEMAND WILL HAPPEN IN ALL SECTORS EXCEPT POWER GENERATION.
Road transport Other transport Residential, commercial and agriculture
Industrial Power generation Other
0
20
40
60
80
100
120
2030202520202015
94.7 100.3 105.3 108.3
Global liquids demand forecast, Mbd
Source: IEA, PJSC LUKOIL estimates

31
RUSSIAN OIL INDUSTRYIN THE SEARCH OF EQUILIBRIUM GLOBAL OIL REFINING
IMPACT OF RENEWABLES ON OIL CONSUMPTION
As the cost drops, renewables become increasingly competitive. The cost to produce solar panels has decreased 6 times from what it was 15 years ago, while their efficiency had tripled. We are now also seeing similar cost reduction trend in wind power. At the same time the projections are that we should ex-pect further reductions in the costs of renewable energy.
Many developed and developing countries are planning to significant-ly increase the share of renewables in their total energy consumption mix by 2030. EU countries are the most active ones in this area. Germany, for example, is planning to generate 45% of its electricity from renewables by 2030. Many developing countries have also announced their intentions to increase the share of renewables in their energy balance.
Wind SolarLCOE range for coal and gas power generation
50
100
150
200
250
300
350
400
2015E201420132012201120102009
–79%
–60%
Levelized cost of energy (LCOE) in the US, $/MWh
Source: Lazard, PJSC LUKOIL estimates
Currently, this sector enjoys great support in many countries in the form of subsidies. According to IEA estimates, in 2014 a total of 135 billion dol-lars of subsidies was granted, and this figure is expected to grow further.
As of 2015 the share of renewables in global primary energy consumption was about 3%. In fact, the investments in that sector are already compara-ble to oil and gas: in 2015 329 billion dollars in total was invested in renew-ables. Annual subsidies should also be added to this figure. With compara-ble costs, the volume of renewable energy produced is 12 times less than that of the energy generated from oil, which suggests the low economic performance of renewables. Meanwhile, given the targets many countries have set for themselves as part of the Paris Agreement on Climate, one may expect that the share of renewables in the global energy balance will continue to grow.
32
GLOBAL OIL SUPPLYGLOBAL OIL DEMANDINTRODUCTION
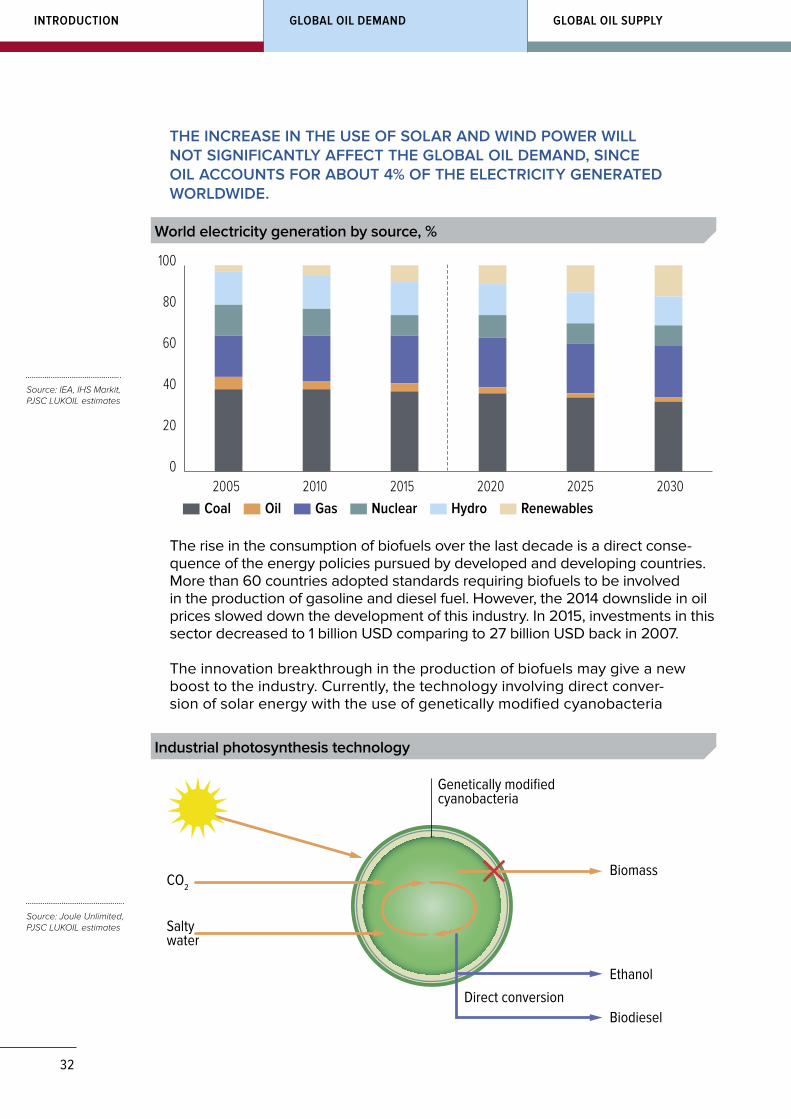
THE INCREASE IN THE USE OF SOLAR AND WIND POWER WILL NOT SIGNIFICANTLY AFFECT THE GLOBAL OIL DEMAND, SINCE OIL ACCOUNTS FOR ABOUT 4% OF THE ELECTRICITY GENERATED WORLDWIDE.
0
20
40
60
80
100
Coal Oil Gas Nuclear Hydro Renewables2005 2010 2015 2020 2025 2030
World electricity generation by source, %
Source: IEA, IHS Markit, PJSC LUKOIL estimates
The rise in the consumption of biofuels over the last decade is a direct conse-quence of the energy policies pursued by developed and developing countries. More than 60 countries adopted standards requiring biofuels to be involved in the production of gasoline and diesel fuel. However, the 2014 downslide in oil prices slowed down the development of this industry. In 2015, investments in this sector decreased to 1 billion USD comparing to 27 billion USD back in 2007.
The innovation breakthrough in the production of biofuels may give a new boost to the industry. Currently, the technology involving direct conver-sion of solar energy with the use of genetically modified cyanobacteria
Saltywater
Genetically modifiedcyanobacteria
Biomass
Ethanol
BiodieselDirect conversion
CO2
Industrial photosynthesis technology
Source: Joule Unlimited, PJSC LUKOIL estimates
33
RUSSIAN OIL INDUSTRYIN THE SEARCH OF EQUILIBRIUM GLOBAL OIL REFINING
Conventional New generation0 50 100 150 200 250
Ethanol(cyanobacteria)
Biodiesel(cyanobacteria)
Bioethanol(cellulose)
Bioethanol(sugarcane)
Traditionalbiodiesel 3
5
19
140
234
Biofuel productivity by technology type, kl/hectare
Source: Joule Unlimited, PJSC LUKOIL estimates
Solar Wind Biofuels
0
0.3
0.6
0.9
1.2
1.5
203020252020
Estimates of global oil demand substituted by renewables, Mbd
Source: IEA, PJSC LUKOIL estimates
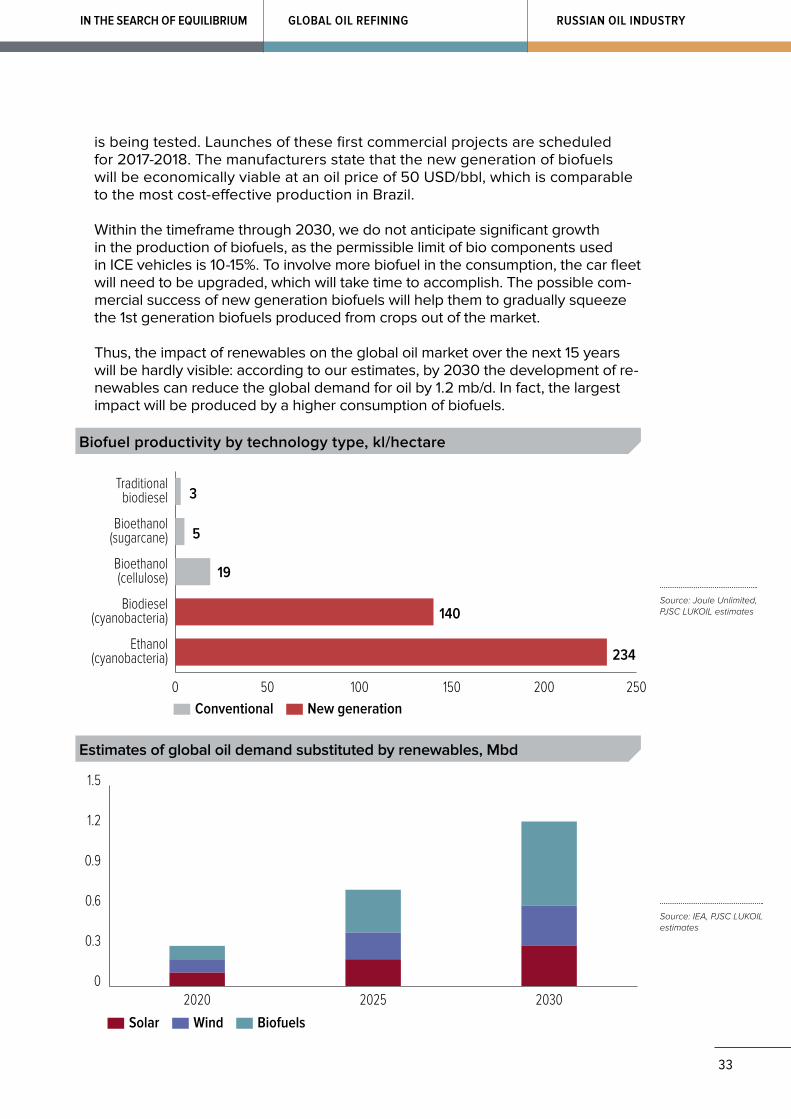
is being tested. Launches of these first commercial projects are scheduled for 2017-2018. The manufacturers state that the new generation of biofuels will be economically viable at an oil price of 50 USD/bbl, which is comparable to the most cost-effective production in Brazil.
Within the timeframe through 2030, we do not anticipate significant growth in the production of biofuels, as the permissible limit of bio components used in ICE vehicles is 10-15%. To involve more biofuel in the consumption, the car fleet will need to be upgraded, which will take time to accomplish. The possible com-mercial success of new generation biofuels will help them to gradually squeeze the 1st generation biofuels produced from crops out of the market.
Thus, the impact of renewables on the global oil market over the next 15 years will be hardly visible: according to our estimates, by 2030 the development of re-newables can reduce the global demand for oil by 1.2 mb/d. In fact, the largest impact will be produced by a higher consumption of biofuels.
34
GLOBAL OIL SUPPLYGLOBAL OIL DEMANDINTRODUCTION
PRODUCTION DECLINE RATE AT EXISTING FIELDS AND OIL RECOVERY FACTOR (ORF)
The oil industry is now facing a challenge not only to meet the increasing-ly high demand, but to also make up for the natural production decline at ma-ture fields by developing new reserves.
EVEN IF THE GLOBAL DEMAND STOPS GROWING, ADDITIONAL INVESTMENTS WILL BE REQUIRED TO OFFSET THE PRODUCTION DECLINE.
The production decline rates depend on the field maturity and type of re-serves. Mature fields experience higher decline rates. The exception to this rule is tight oil projects where the highest decline rates occur during the first year of operation. Thus, during the first year the decline rates of a U.S. shale well is 70-80% of the initial level. Conventional mature onshore and offshore fields demonstrate an annual production decline rate of 1-10%. Higher decline rates, on average 10-14%, are characteristic of deepwater offshore projects. Given the structure of producing fields around the world (where some dem-onstrate growth, while others are in decline), the annual decline rate of base production will be around 3%.
One of the key ways to maintain production at mature fields is to improve their oil recovery factor (ORF) through the use of enhanced oil recovery (EOR) techniques. The use of state-of-the-art EOR enables the attainment of 45-55% ORF.
THE "CONCORD" SCENARIO IMPLIES A LONG-TERM BALANCE BETWEEN DEMAND AND SUPPLY ON THE MARKET. OIL PRODUCTION AT THE EXISTING FIELDS WILL BE DECLINING OVER TIME. WHILE THE PRODUCTION AT MATURE FIELDS IS FALLING, NEW FIELDS SHOULD BE COMMISSIONED TO MEET THE DEMAND, WHICH REQUIRES INVESTMENTS. THE "CONCORD" SCENARIO DETERMINES THE OIL PRICE RELYING ON THE INVESTMENT COST TO PRODUCE IT AT NEW FIELDS.
THIS SECTION CONTAINS ANALYSIS OF OPPORTUNITIES FOR SUPPLY GROWTH FROM THE MAJOR MARKET PLAYERS. FOLLOWING THE ANALYSIS, PRICE PROJECTIONS ARE MADE THAT HELP TO BALANCE THE DEMAND AND SUPPLY IN LINE WITH THE ASSUMPTIONS ADOPTED IN THE "CONCORD" SCENARIO.
GLOBAL OIL SUPPLY2
35
RUSSIAN OIL INDUSTRYIN THE SEARCH OF EQUILIBRIUM GLOBAL OIL REFINING
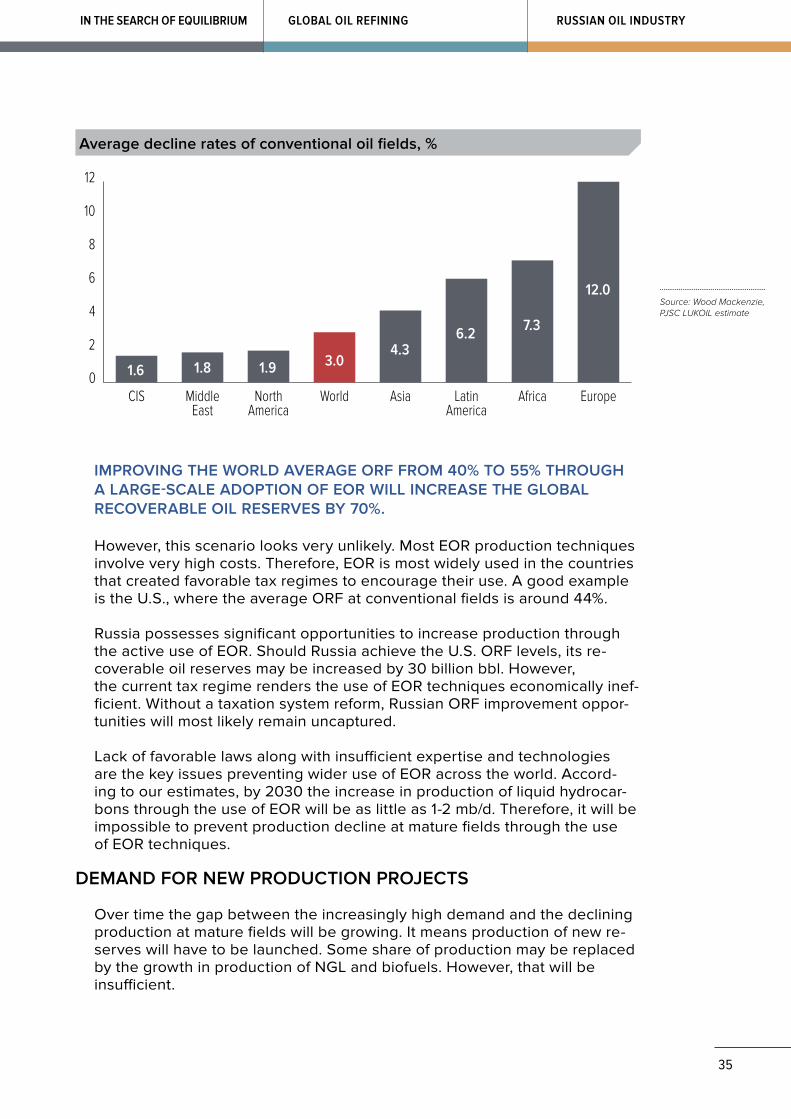
IMPROVING THE WORLD AVERAGE ORF FROM 40% TO 55% THROUGH A LARGE-SCALE ADOPTION OF EOR WILL INCREASE THE GLOBAL RECOVERABLE OIL RESERVES BY 70%.
However, this scenario looks very unlikely. Most EOR production techniques involve very high costs. Therefore, EOR is most widely used in the countries that created favorable tax regimes to encourage their use. A good example is the U.S., where the average ORF at conventional fields is around 44%.
Russia possesses significant opportunities to increase production through the active use of EOR. Should Russia achieve the U.S. ORF levels, its re-coverable oil reserves may be increased by 30 billion bbl. However, the current tax regime renders the use of EOR techniques economically inef-ficient. Without a taxation system reform, Russian ORF improvement oppor-tunities will most likely remain uncaptured.
Lack of favorable laws along with insufficient expertise and technologies are the key issues preventing wider use of EOR across the world. Accord-ing to our estimates, by 2030 the increase in production of liquid hydrocar-bons through the use of EOR will be as little as 1-2 mb/d. Therefore, it will be impossible to prevent production decline at mature fields through the use of EOR techniques.
DEMAND FOR NEW PRODUCTION PROJECTS
Over time the gap between the increasingly high demand and the declining production at mature fields will be growing. It means production of new re-serves will have to be launched. Some share of production may be replaced by the growth in production of NGL and biofuels. However, that will be insufficient.
0
2
4
6
8
10
12
EuropeAfricaLatinAmerica
AsiaWorldNorthAmerica
MiddleEast
CIS
1.6 1.8 1.9 3.04.3
6.2 7.3
12.0Source: Wood Mackenzie, PJSC LUKOIL estimate
Average decline rates of conventional oil fields, %
36
GLOBAL OIL SUPPLYGLOBAL OIL DEMANDINTRODUCTION
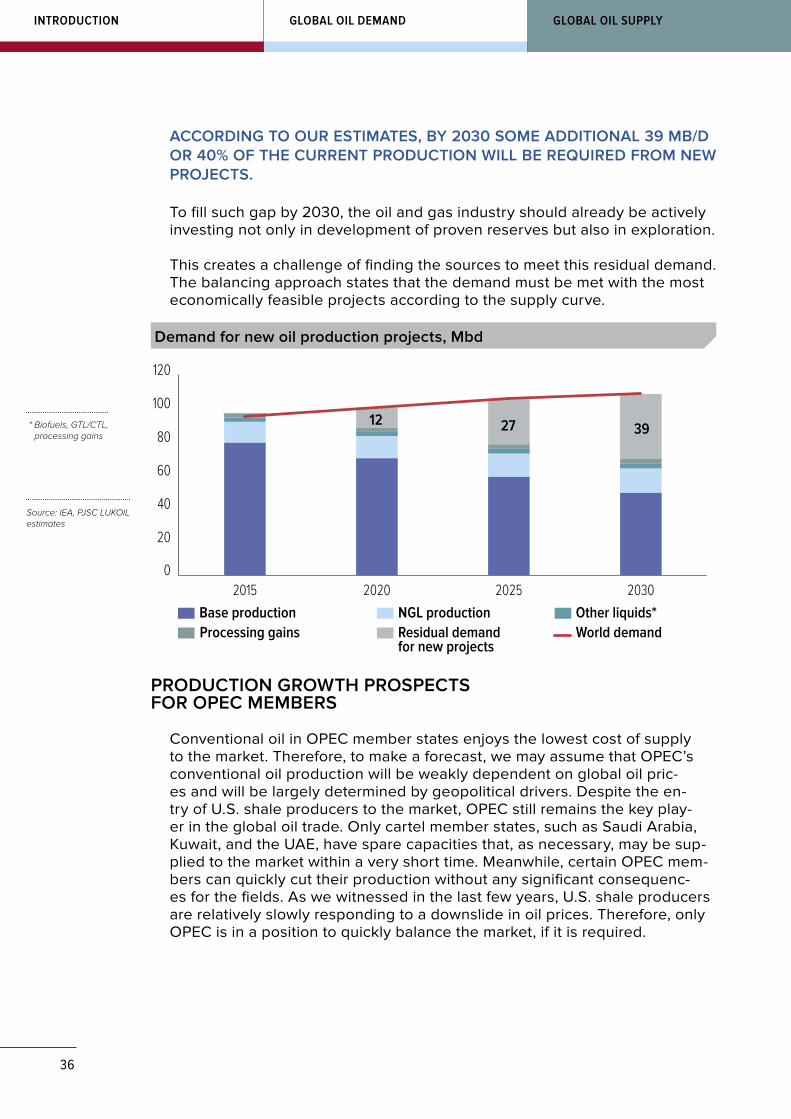
ACCORDING TO OUR ESTIMATES, BY 2030 SOME ADDITIONAL 39 MB/D OR 40% OF THE CURRENT PRODUCTION WILL BE REQUIRED FROM NEW PROJECTS.
To fill such gap by 2030, the oil and gas industry should already be actively investing not only in development of proven reserves but also in exploration.
This creates a challenge of finding the sources to meet this residual demand. The balancing approach states that the demand must be met with the most economically feasible projects according to the supply curve.
Base production NGL production Other liquids*Processing gains Residual demand
for new projects
0
20
40
60
80
100
120
2030202520202015
392712
World demand
Source: IEA, PJSC LUKOIL estimates
* Biofuels, GTL/CTL, processing gains
Demand for new oil production projects, Mbd
PRODUCTION GROWTH PROSPECTS FOR OPEC MEMBERS
Conventional oil in OPEC member states enjoys the lowest cost of supply to the market. Therefore, to make a forecast, we may assume that OPEC’s conventional oil production will be weakly dependent on global oil pric-es and will be largely determined by geopolitical drivers. Despite the en-try of U.S. shale producers to the market, OPEC still remains the key play-er in the global oil trade. Only cartel member states, such as Saudi Arabia, Kuwait, and the UAE, have spare capacities that, as necessary, may be sup-plied to the market within a very short time. Meanwhile, certain OPEC mem-bers can quickly cut their production without any significant consequenc-es for the fields. As we witnessed in the last few years, U.S. shale producers are relatively slowly responding to a downslide in oil prices. Therefore, only OPEC is in a position to quickly balance the market, if it is required.
37
RUSSIAN OIL INDUSTRYIN THE SEARCH OF EQUILIBRIUM GLOBAL OIL REFINING
The preliminary cartel agreement to freeze production that was made pub-lic at the conference in Algeria, in our opinion, pursues mostly short-term goals of protecting the prices and so far does not indicate any signifi-cant change in Saudi Arabian long-term strategy. The agreement provides for cutting OPEC production by 0.5-1 mb/d vs. the September 2016 levels, which is insufficient to quickly rebalance the market. In addition, the dis-cipline of the organization’s member states in meeting the quotas is tradi-tionally low. Therefore, it is not clear whether this decision will be executed. Nonetheless, if the decision to freeze production does get implemented, it will help to provide a smoother market rebalancing and prevent sharp price hikes.
We do not expect in the "Concord" scenario that in the long run OPEC will significantly deviate from its strategy to squeeze out its competitors by cut-ting production. The market will rebalance itself mostly due to independ-ent producers. Over time the cartel’s share in global production will grad-ually increase. As the worldwide resources become increasingly depleted and the cost of developing new fields continues to rise, the relatively cheap and steady OPEC production will stabilize the oil market, ensuring basic sup-ply to meet the growing demand.
OIL PRODUCTION IN SAUDI ARABIA
Saudi Arabia is the most influential OPEC member, and there are several objective reasons for that. First of all, the country is the largest oil produc-er and exporter. Secondly, favorable geology of its fields and effective lo-gistics make the costs incurred by the Kingdom in producing oil and de-livering it to the market the lowest globally. Thirdly, with spare production capacity at hand, Saudi Arabia is able to promptly respond to any changes in the global market by ramping up or cutting oil production.
Historically, Saudi Arabia has responded differently to changes in the mar-ket. In the first half of the 1980s the Kingdom cut its production by two-thirds, seeking to balance the market in light of the sinking global demand and growing oil production in the USSR and the North Sea. However, this policy has failed, for it did not bring about any substantial rise in prices. That was the reason why in 1986 Saudi Arabia decided to get back its lost share of the market by drastically boosting production. That resulted in a yet big-ger drop in oil prices. In contrast, during the 1998 and 2008 crises, Saudi Arabia reduced its production, contributing to a fast recovery of prices.
The 2014 slump in oil prices was largely due to the Kingdom’s reluctance to reduce production in response to a production increase by the non-OPEC producers, particularly the U.S. The decision to maintain the exist-ing levels of production was formally announced at the cartel meeting tak-ing place in November 2014. In December 2015 Saudi Arabia confirmed its
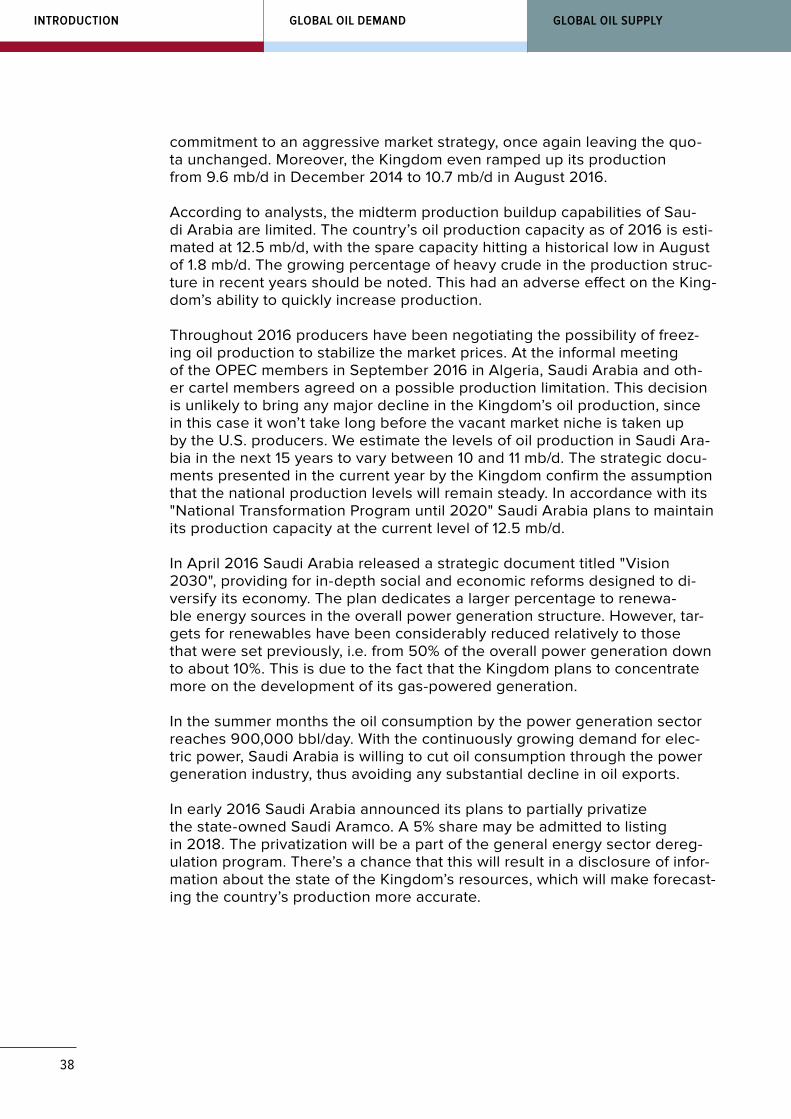
38
GLOBAL OIL SUPPLYGLOBAL OIL DEMANDINTRODUCTION
commitment to an aggressive market strategy, once again leaving the quo-ta unchanged. Moreover, the Kingdom even ramped up its production from 9.6 mb/d in December 2014 to 10.7 mb/d in August 2016.
According to analysts, the midterm production buildup capabilities of Sau-di Arabia are limited. The country’s oil production capacity as of 2016 is esti-mated at 12.5 mb/d, with the spare capacity hitting a historical low in August of 1.8 mb/d. The growing percentage of heavy crude in the production struc-ture in recent years should be noted. This had an adverse effect on the King-dom’s ability to quickly increase production.
Throughout 2016 producers have been negotiating the possibility of freez-ing oil production to stabilize the market prices. At the informal meeting of the OPEC members in September 2016 in Algeria, Saudi Arabia and oth-er cartel members agreed on a possible production limitation. This decision is unlikely to bring any major decline in the Kingdom’s oil production, since in this case it won’t take long before the vacant market niche is taken up by the U.S. producers. We estimate the levels of oil production in Saudi Ara-bia in the next 15 years to vary between 10 and 11 mb/d. The strategic docu-ments presented in the current year by the Kingdom confirm the assumption that the national production levels will remain steady. In accordance with its "National Transformation Program until 2020" Saudi Arabia plans to maintain its production capacity at the current level of 12.5 mb/d.
In April 2016 Saudi Arabia released a strategic document titled "Vision 2030", providing for in-depth social and economic reforms designed to di-versify its economy. The plan dedicates a larger percentage to renewa-ble energy sources in the overall power generation structure. However, tar-gets for renewables have been considerably reduced relatively to those that were set previously, i.e. from 50% of the overall power generation down to about 10%. This is due to the fact that the Kingdom plans to concentrate more on the development of its gas-powered generation.
In the summer months the oil consumption by the power generation sector reaches 900,000 bbl/day. With the continuously growing demand for elec-tric power, Saudi Arabia is willing to cut oil consumption through the power generation industry, thus avoiding any substantial decline in oil exports.
In early 2016 Saudi Arabia announced its plans to partially privatize the state-owned Saudi Aramco. A 5% share may be admitted to listing in 2018. The privatization will be a part of the general energy sector dereg-ulation program. There’s a chance that this will result in a disclosure of infor-mation about the state of the Kingdom’s resources, which will make forecast-ing the country’s production more accurate.
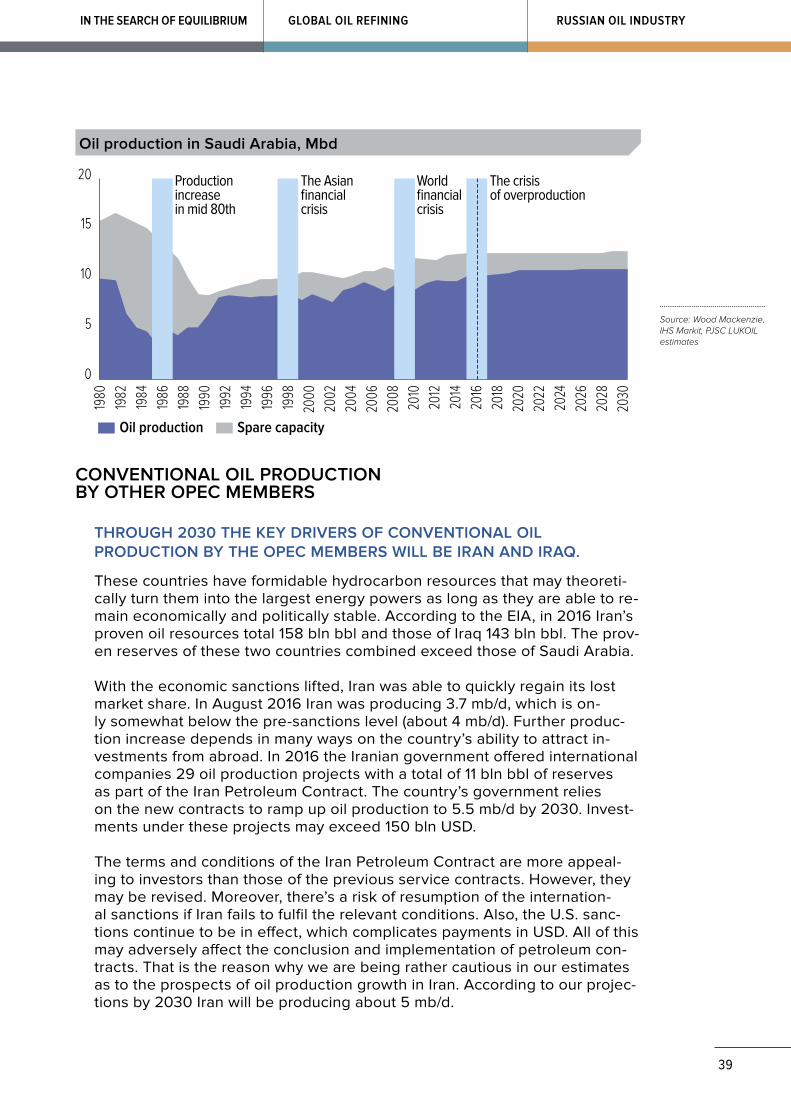
39
RUSSIAN OIL INDUSTRYIN THE SEARCH OF EQUILIBRIUM GLOBAL OIL REFINING
Oil production Spare capacity
0
5
10
15
20
2010
2008
2006
2004
2002
2000
1998
1996
1994
1992
1990
1988
1986
1984
1982
1980
2030
2028
2026
2024
2022
2020
2018
2016
2014
2012
Productionincreasein mid 80th
The Asianfinancial crisis
Worldfinancial crisis
The crisisof overproduction
Oil production in Saudi Arabia, Mbd
Source: Wood Mackenzie, IHS Markit, PJSC LUKOIL estimates
CONVENTIONAL OIL PRODUCTION BY OTHER OPEC MEMBERS
THROUGH 2030 THE KEY DRIVERS OF CONVENTIONAL OIL PRODUCTION BY THE OPEC MEMBERS WILL BE IRAN AND IRAQ.
These countries have formidable hydrocarbon resources that may theoreti-cally turn them into the largest energy powers as long as they are able to re-main economically and politically stable. According to the EIA, in 2016 Iran’s proven oil resources total 158 bln bbl and those of Iraq 143 bln bbl. The prov-en reserves of these two countries combined exceed those of Saudi Arabia.
With the economic sanctions lifted, Iran was able to quickly regain its lost market share. In August 2016 Iran was producing 3.7 mb/d, which is on-ly somewhat below the pre-sanctions level (about 4 mb/d). Further produc-tion increase depends in many ways on the country’s ability to attract in-vestments from abroad. In 2016 the Iranian government offered international companies 29 oil production projects with a total of 11 bln bbl of reserves as part of the Iran Petroleum Contract. The country’s government relies on the new contracts to ramp up oil production to 5.5 mb/d by 2030. Invest-ments under these projects may exceed 150 bln USD.
The terms and conditions of the Iran Petroleum Contract are more appeal-ing to investors than those of the previous service contracts. However, they may be revised. Moreover, there’s a risk of resumption of the internation-al sanctions if Iran fails to fulfil the relevant conditions. Also, the U.S. sanc-tions continue to be in effect, which complicates payments in USD. All of this may adversely affect the conclusion and implementation of petroleum con-tracts. That is the reason why we are being rather cautious in our estimates as to the prospects of oil production growth in Iran. According to our projec-tions by 2030 Iran will be producing about 5 mb/d.
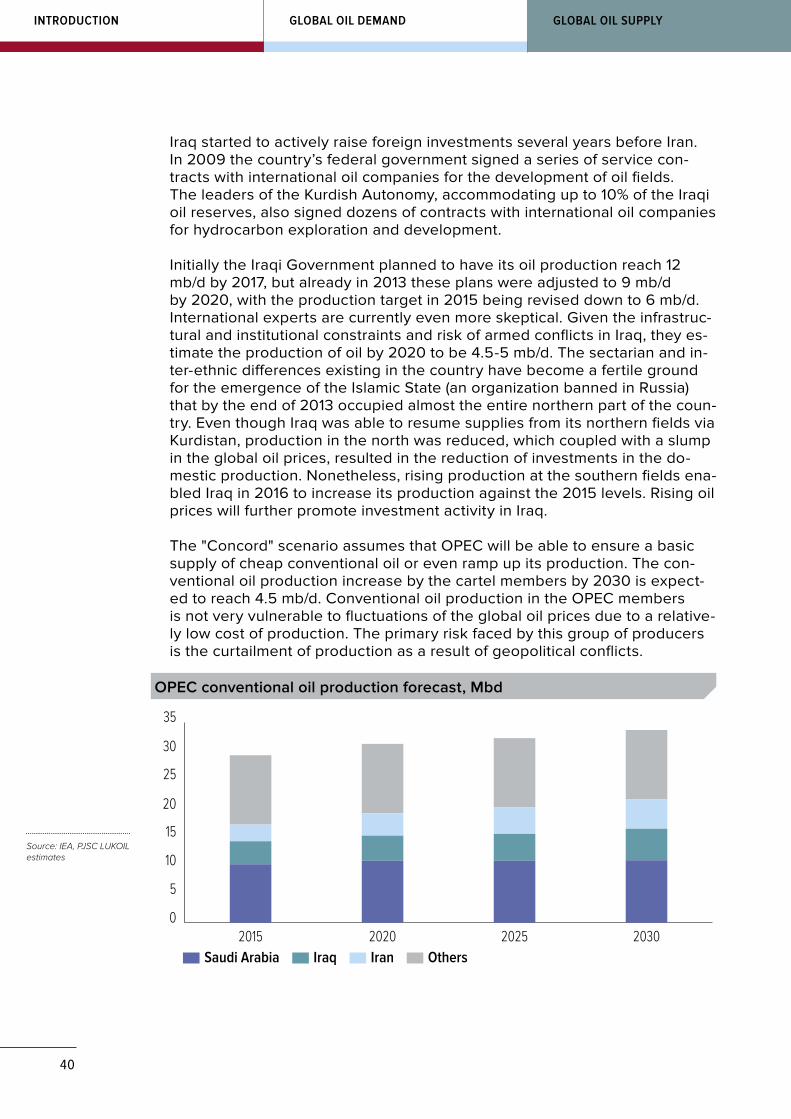
40
GLOBAL OIL SUPPLYGLOBAL OIL DEMANDINTRODUCTION
Iraq started to actively raise foreign investments several years before Iran. In 2009 the country’s federal government signed a series of service con-tracts with international oil companies for the development of oil fields. The leaders of the Kurdish Autonomy, accommodating up to 10% of the Iraqi oil reserves, also signed dozens of contracts with international oil companies for hydrocarbon exploration and development.
Initially the Iraqi Government planned to have its oil production reach 12 mb/d by 2017, but already in 2013 these plans were adjusted to 9 mb/d by 2020, with the production target in 2015 being revised down to 6 mb/d. International experts are currently even more skeptical. Given the infrastruc-tural and institutional constraints and risk of armed conflicts in Iraq, they es-timate the production of oil by 2020 to be 4.5-5 mb/d. The sectarian and in-ter-ethnic differences existing in the country have become a fertile ground for the emergence of the Islamic State (an organization banned in Russia) that by the end of 2013 occupied almost the entire northern part of the coun-try. Even though Iraq was able to resume supplies from its northern fields via Kurdistan, production in the north was reduced, which coupled with a slump in the global oil prices, resulted in the reduction of investments in the do-mestic production. Nonetheless, rising production at the southern fields ena-bled Iraq in 2016 to increase its production against the 2015 levels. Rising oil prices will further promote investment activity in Iraq.
The "Concord" scenario assumes that OPEC will be able to ensure a basic supply of cheap conventional oil or even ramp up its production. The con-ventional oil production increase by the cartel members by 2030 is expect-ed to reach 4.5 mb/d. Conventional oil production in the OPEC members is not very vulnerable to fluctuations of the global oil prices due to a relative-ly low cost of production. The primary risk faced by this group of producers is the curtailment of production as a result of geopolitical conflicts.
Saudi Arabia Iraq Iran Others
0
5
10
15
20
25
30
35
2030202520202015
OPEC conventional oil production forecast, Mbd
Source: IEA, PJSC LUKOIL estimates
41
RUSSIAN OIL INDUSTRYIN THE SEARCH OF EQUILIBRIUM GLOBAL OIL REFINING
OIL PRODUCTION BY INDEPENDENT PRODUCERS
Oil reserves with the highest development costs are still for the most part concentrated outside of OPEC with the so-called independent produc-ers that account for about 60% of the global liquid hydrocarbons supply. The growth of shale oil production in the U.S. in 2012-2014 enabled the inde-pendent producers to strengthen their position on the global oil market.
While modelling the global oil production under the "Concord" scenario, we assume that the production of the independent producers is more sen-sitive to the oil price level than that of the OPEC countries. However there are certain exceptions that we have to consider in our balancing model. For instance, the Russian oil production is not very sensitive to the global oil price dynamics due to the specifics of the taxation system and dependence of the Russian ruble exchange rate on the oil prices.
The U.S. and Russia are the largest independent oil producers. With vast hydrocarbons resources in hand, both countries are capable of influenc-ing the oil market. The projections of oil production in the U.S. and Russia are presented in specific sections of the Outlook.
OPEC Independent producers
0
2
4
6
8
10
12
IranCanadaIraqChinaUSASaudi ArabiaRussia
Oil production by the largest producers in 2015, Mbd
Source: EIA
PROSPECTS OF PRODUCTION GROWTH IN THE U.S.
The shale revolution enabled the U.S. to considerably increase its hydrocar-bons production. Between 2010 and 2015 the U.S. oil output grew by 70%, reaching 9.4 mb/d, which is only slightly below the all-time high of 1970. With natural gas liquids included, the U.S. now tops the list of global liquid hydrocarbon producers, moving ahead of Saudi Arabia and Russia.
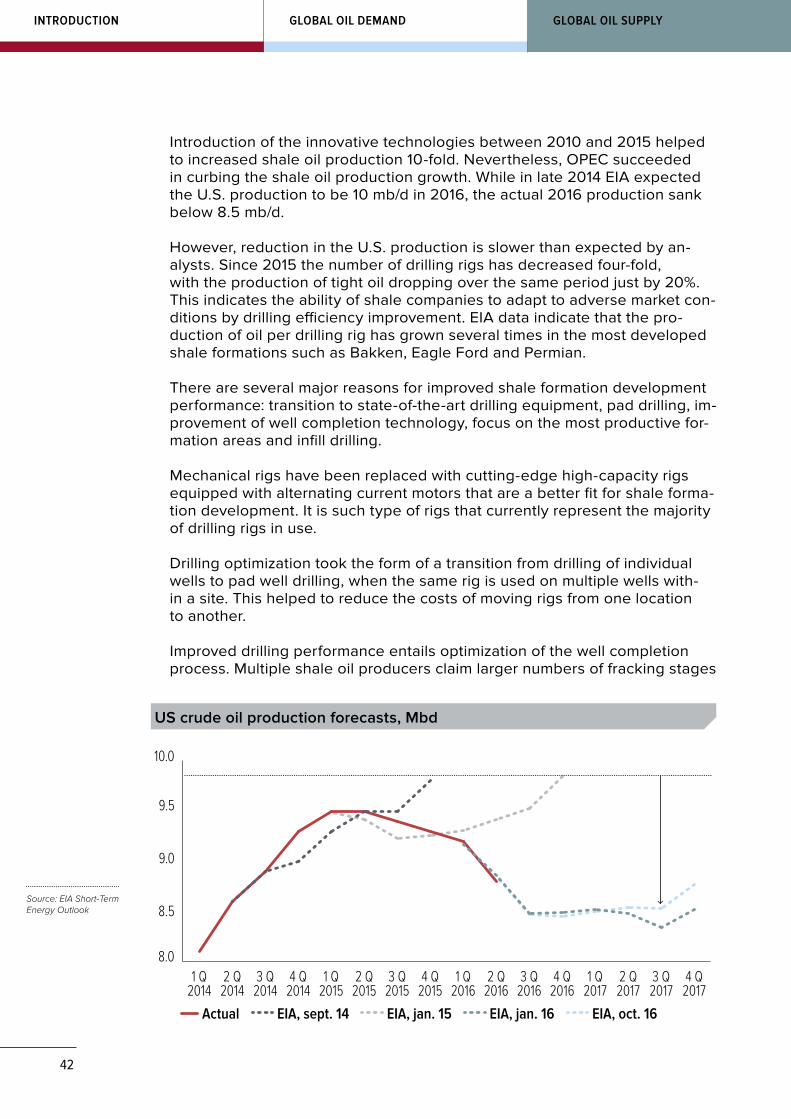
42
GLOBAL OIL SUPPLYGLOBAL OIL DEMANDINTRODUCTION
Introduction of the innovative technologies between 2010 and 2015 helped to increased shale oil production 10-fold. Nevertheless, OPEC succeeded in curbing the shale oil production growth. While in late 2014 EIA expected the U.S. production to be 10 mb/d in 2016, the actual 2016 production sank below 8.5 mb/d.
However, reduction in the U.S. production is slower than expected by an-alysts. Since 2015 the number of drilling rigs has decreased four-fold, with the production of tight oil dropping over the same period just by 20%. This indicates the ability of shale companies to adapt to adverse market con-ditions by drilling efficiency improvement. EIA data indicate that the pro-duction of oil per drilling rig has grown several times in the most developed shale formations such as Bakken, Eagle Ford and Permian.
There are several major reasons for improved shale formation development performance: transition to state-of-the-art drilling equipment, pad drilling, im-provement of well completion technology, focus on the most productive for-mation areas and infill drilling.
Mechanical rigs have been replaced with cutting-edge high-capacity rigs equipped with alternating current motors that are a better fit for shale forma-tion development. It is such type of rigs that currently represent the majority of drilling rigs in use.
Drilling optimization took the form of a transition from drilling of individual wells to pad well drilling, when the same rig is used on multiple wells with-in a site. This helped to reduce the costs of moving rigs from one location to another.
Improved drilling performance entails optimization of the well completion process. Multiple shale oil producers claim larger numbers of fracking stages
EIA, sept. 14 EIA, jan. 15 EIA, jan. 16 EIA, oct. 16Actual
8.0
10.0
4 Q2017
3 Q2017
2 Q2017
1 Q2017
4 Q2016
3 Q2016
2 Q2016
1 Q2016
4 Q2015
3 Q2015
2 Q2015
1 Q2015
4 Q2014
3 Q2014
2 Q2014
1 Q2014
9.5
8.5
9.0
US crude oil production forecasts, Mbd
Source: EIA Short-Term Energy Outlook
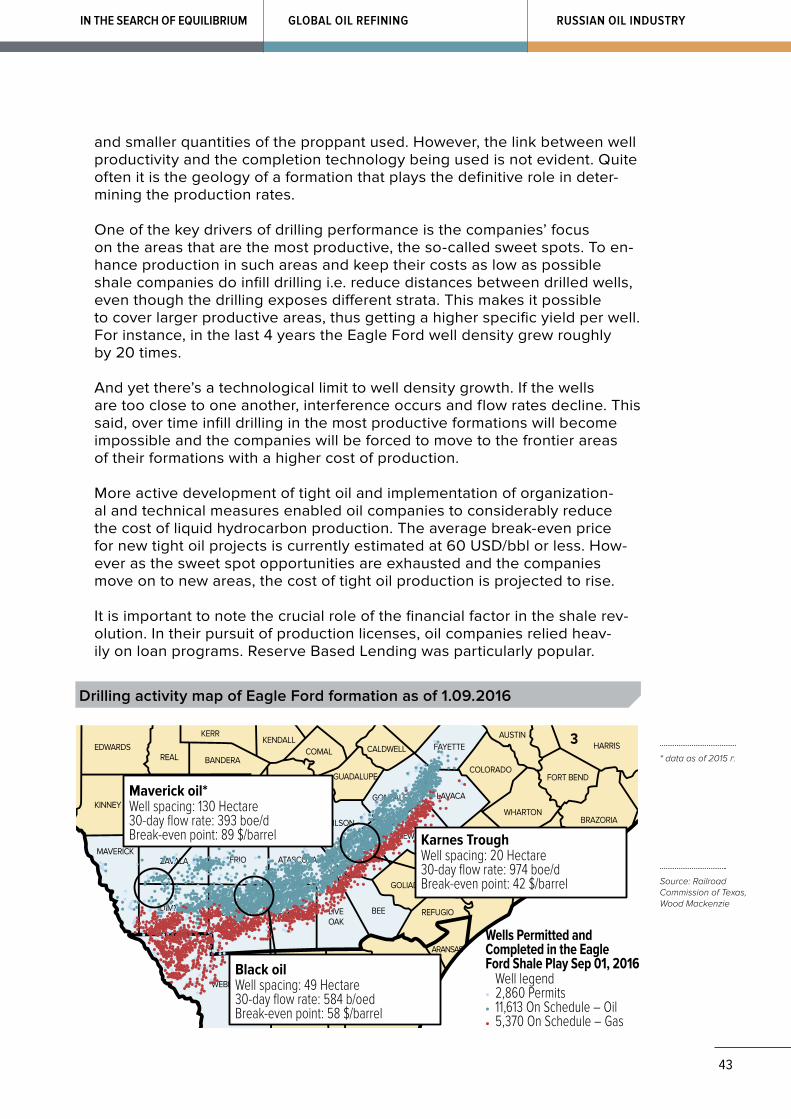
43
RUSSIAN OIL INDUSTRYIN THE SEARCH OF EQUILIBRIUM GLOBAL OIL REFINING
and smaller quantities of the proppant used. However, the link between well productivity and the completion technology being used is not evident. Quite often it is the geology of a formation that plays the definitive role in deter-mining the production rates.
One of the key drivers of drilling performance is the companies’ focus on the areas that are the most productive, the so-called sweet spots. To en-hance production in such areas and keep their costs as low as possible shale companies do infill drilling i.e. reduce distances between drilled wells, even though the drilling exposes different strata. This makes it possible to cover larger productive areas, thus getting a higher specific yield per well. For instance, in the last 4 years the Eagle Ford well density grew roughly by 20 times.
And yet there’s a technological limit to well density growth. If the wells are too close to one another, interference occurs and flow rates decline. This said, over time infill drilling in the most productive formations will become impossible and the companies will be forced to move to the frontier areas of their formations with a higher cost of production.
More active development of tight oil and implementation of organization-al and technical measures enabled oil companies to considerably reduce the cost of liquid hydrocarbon production. The average break-even price for new tight oil projects is currently estimated at 60 USD/bbl or less. How-ever as the sweet spot opportunities are exhausted and the companies move on to new areas, the cost of tight oil production is projected to rise.
It is important to note the crucial role of the financial factor in the shale rev-olution. In their pursuit of production licenses, oil companies relied heav-ily on loan programs. Reserve Based Lending was particularly popular.
HARRIS
FORT BEND
BRAZORIA
MATAGORDA
WHARTON
COLORADO
AUSTINFAYETTE
LAVACA
DEWITT
GONZALES
CALDWELL
GUADALUPE
BEXARMEDINA
FRIOZAVALA
DIMMIT LA SALLE
WEBB
ATASCOSA KARNES
BEELIVEOAK
McMULLEN
WILSON
MAVERICK
UVALDEKINNEY
REAL BANDERACOMAL
KENDALLKERR
EDWARDS
JACKSON
VICTORIA
CALHOUN
REFUGIO
SAN PATRICIO
NUECES
ARANSAS
KLEBERG
JIM WELLS
DUVAL
GOLIAD
Wells Permitted and Completed in the Eagle Ford Shale Play Sep 01, 2016
Well legend2,860 Permits11,613 On Schedule – Oil5,370 On Schedule – Gas
Maverick oil*Well spacing: 130 Hectare30-day flow rate: 393 boe/dBreak-even point: 89 $/barrel Karnes Trough
Well spacing: 20 Hectare30-day flow rate: 974 boe/dBreak-even point: 42 $/barrel
Black oilWell spacing: 49 Hectare30-day flow rate: 584 b/oedBreak-even point: 58 $/barrel
Drilling activity map of Eagle Ford formation as of 1.09.2016
Source: Railroad Commission of Texas, Wood Mackenzie
* data as of 2015 г.
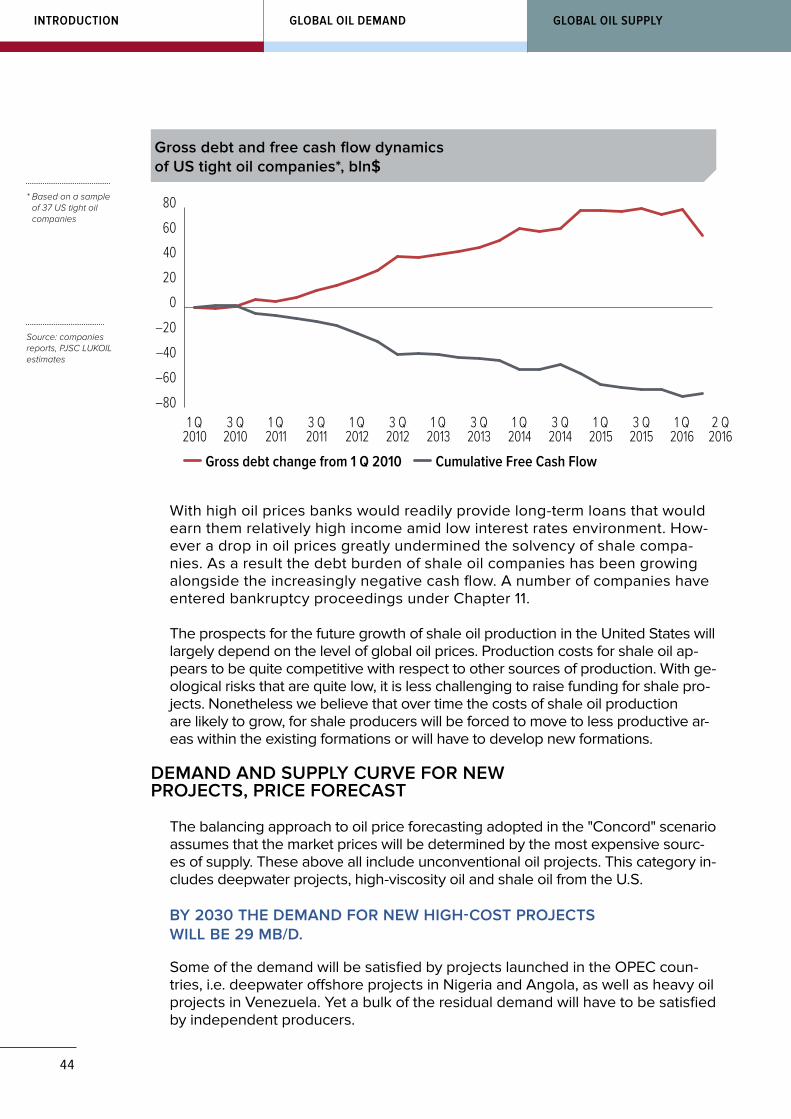
44
GLOBAL OIL SUPPLYGLOBAL OIL DEMANDINTRODUCTION
With high oil prices banks would readily provide long-term loans that would earn them relatively high income amid low interest rates environment. How-ever a drop in oil prices greatly undermined the solvency of shale compa-nies. As a result the debt burden of shale oil companies has been growing alongside the increasingly negative cash flow. A number of companies have entered bankruptcy proceedings under Chapter 11.
The prospects for the future growth of shale oil production in the United States will largely depend on the level of global oil prices. Production costs for shale oil ap-pears to be quite competitive with respect to other sources of production. With ge-ological risks that are quite low, it is less challenging to raise funding for shale pro-jects. Nonetheless we believe that over time the costs of shale oil production are likely to grow, for shale producers will be forced to move to less productive ar-eas within the existing formations or will have to develop new formations.
DEMAND AND SUPPLY CURVE FOR NEW PROJECTS, PRICE FORECAST
The balancing approach to oil price forecasting adopted in the "Concord" scenario assumes that the market prices will be determined by the most expensive sourc-es of supply. These above all include unconventional oil projects. This category in-cludes deepwater projects, high-viscosity oil and shale oil from the U.S.
BY 2030 THE DEMAND FOR NEW HIGH-COST PROJECTS WILL BE 29 MB/D.
Some of the demand will be satisfied by projects launched in the OPEC coun-tries, i.e. deepwater offshore projects in Nigeria and Angola, as well as heavy oil projects in Venezuela. Yet a bulk of the residual demand will have to be satisfied by independent producers.
Gross debt change from 1 Q 2010 Cumulative Free Cash Flow
–80
–60
–40
–20
0
20
40
60
80
2 Q2016
1 Q2016
3 Q2015
1 Q2015
3 Q2014
1 Q2014
3 Q2013
1 Q2013
3 Q2012
1 Q2012
3 Q2011
1 Q2011
3 Q2010
1 Q2010
Gross debt and free cash flow dynamics of US tight oil companies*, bln$
Source: companies reports, PJSC LUKOIL estimates
* Based on a sample of 37 US tight oil companies
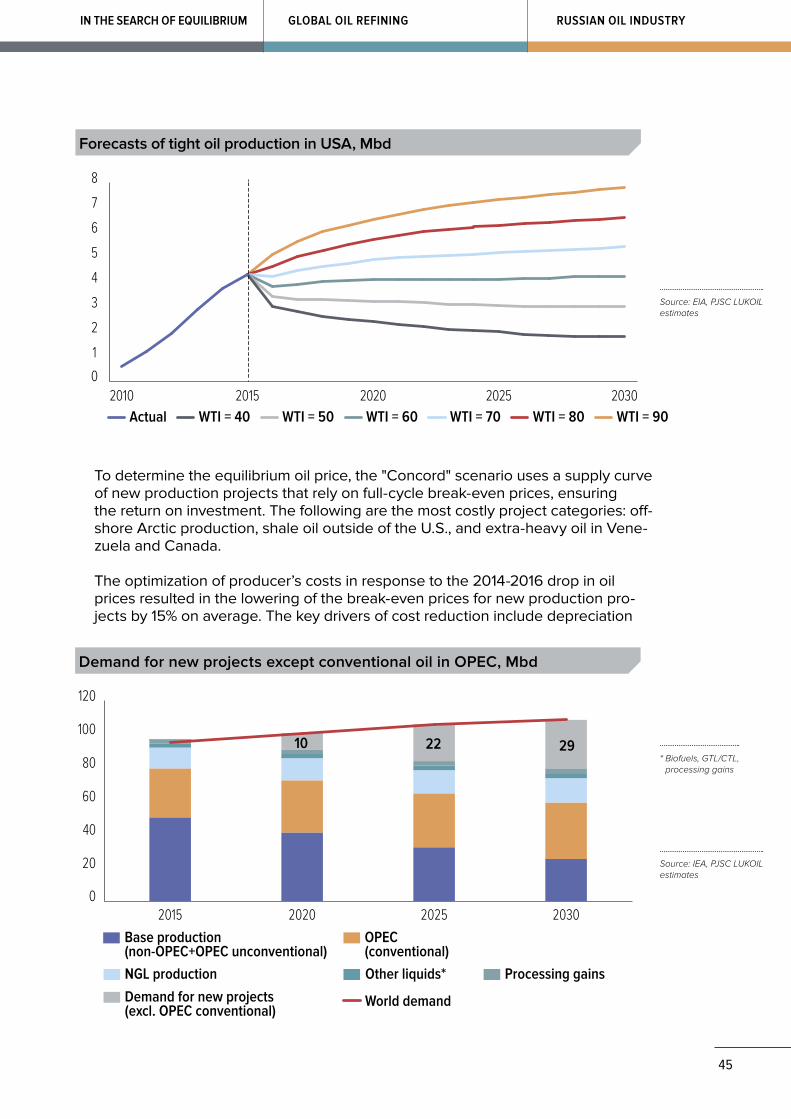
45
RUSSIAN OIL INDUSTRYIN THE SEARCH OF EQUILIBRIUM GLOBAL OIL REFINING
Actual WTI = 40 WTI = 50 WTI = 60 WTI = 70 WTI = 80 WTI = 90
0
1
2
3
4
5
6
7
8
20302025202020152010
Forecasts of tight oil production in USA, Mbd
Source: EIA, PJSC LUKOIL estimates
To determine the equilibrium oil price, the "Concord" scenario uses a supply curve of new production projects that rely on full-cycle break-even prices, ensuring the return on investment. The following are the most costly project categories: off-shore Arctic production, shale oil outside of the U.S., and extra-heavy oil in Vene-zuela and Canada.
The optimization of producer’s costs in response to the 2014-2016 drop in oil prices resulted in the lowering of the break-even prices for new production pro-jects by 15% on average. The key drivers of cost reduction include depreciation
Base production(non-OPEC+OPEC unconventional)
OPEC(conventional)
NGL production Other liquids* Processing gains
Demand for new projects(excl. OPEC conventional)
0
20
40
60
80
100
120
2030202520202015
292210
World demand
Demand for new projects except conventional oil in OPEC, Mbd
Source: IEA, PJSC LUKOIL estimates
* Biofuels, GTL/CTL, processing gains
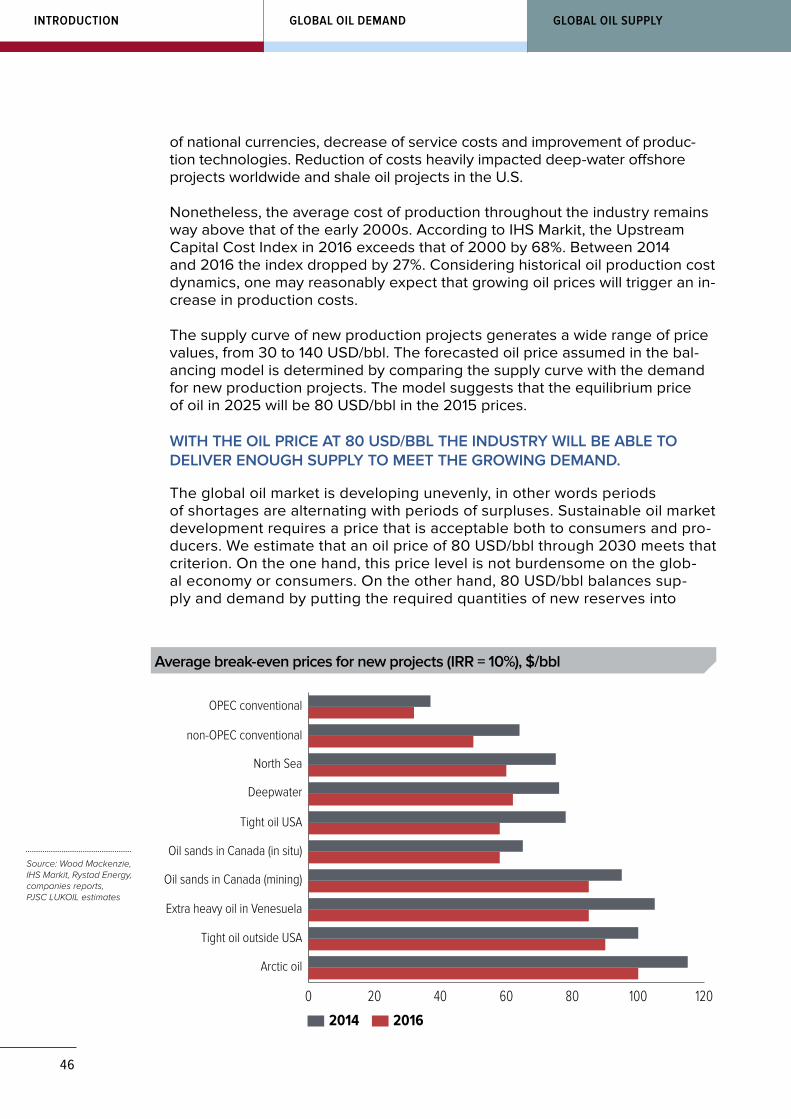
46
GLOBAL OIL SUPPLYGLOBAL OIL DEMANDINTRODUCTION
of national currencies, decrease of service costs and improvement of produc-tion technologies. Reduction of costs heavily impacted deep-water offshore projects worldwide and shale oil projects in the U.S.
Nonetheless, the average cost of production throughout the industry remains way above that of the early 2000s. According to IHS Markit, the Upstream Capital Cost Index in 2016 exceeds that of 2000 by 68%. Between 2014 and 2016 the index dropped by 27%. Considering historical oil production cost dynamics, one may reasonably expect that growing oil prices will trigger an in-crease in production costs.
The supply curve of new production projects generates a wide range of price values, from 30 to 140 USD/bbl. The forecasted oil price assumed in the bal-ancing model is determined by comparing the supply curve with the demand for new production projects. The model suggests that the equilibrium price of oil in 2025 will be 80 USD/bbl in the 2015 prices.
WITH THE OIL PRICE AT 80 USD/BBL THE INDUSTRY WILL BE ABLE TO DELIVER ENOUGH SUPPLY TO MEET THE GROWING DEMAND.
The global oil market is developing unevenly, in other words periods of shortages are alternating with periods of surpluses. Sustainable oil market development requires a price that is acceptable both to consumers and pro-ducers. We estimate that an oil price of 80 USD/bbl through 2030 meets that criterion. On the one hand, this price level is not burdensome on the glob-al economy or consumers. On the other hand, 80 USD/bbl balances sup-ply and demand by putting the required quantities of new reserves into
2014 2016
0 20 40 60 80 100 120
Arctic oil
Tight oil outside USA
Extra heavy oil in Venesuela
Oil sands in Canada (mining)
Oil sands in Canada (in situ)
Tight oil USA
Deepwater
North Sea
non-OPEC conventional
OPEC conventional
Average break-even prices for new projects (IRR = 10%), $/bbl
Source: Wood Mackenzie, IHS Markit, Rystad Energy, companies reports, PJSC LUKOIL estimates
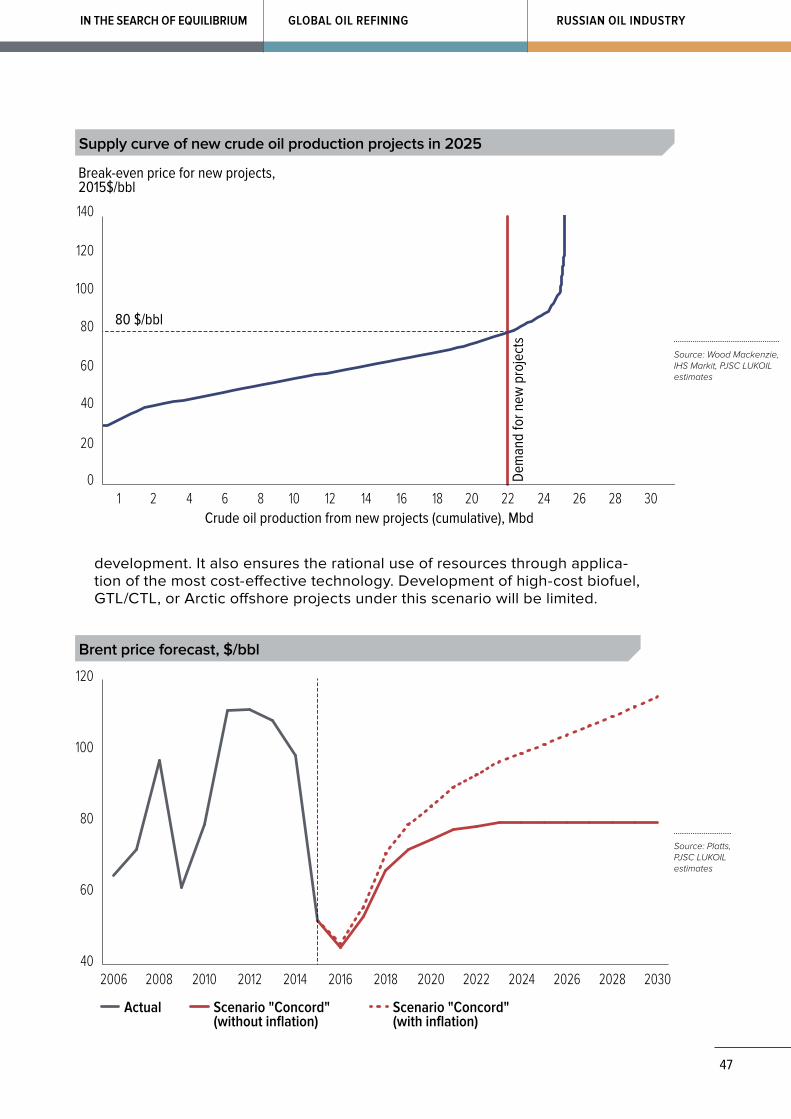
47
RUSSIAN OIL INDUSTRYIN THE SEARCH OF EQUILIBRIUM GLOBAL OIL REFINING
Actual Scenario "Concord"(without inflation)
Scenario "Concord"(with inflation)
40
60
80
100
120
2030202820262024202220202018201620142012201020082006
development. It also ensures the rational use of resources through applica-tion of the most cost-effective technology. Development of high-cost biofuel, GTL/ CTL, or Arctic offshore projects under this scenario will be limited.
Brent price forecast, $/bbl
Source: Platts, PJSC LUKOIL estimates
Crude oil production from new projects (cumulative), Mbd
0
20
40
60
80
100
120
140
302826242220181614121086421De
man
d fo
r new
pro
ject
s
80 $/bbl
Break-even price for new projects,2015$/bbl
Supply curve of new crude oil production projects in 2025
Source: Wood Mackenzie, IHS Markit, PJSC LUKOIL estimates
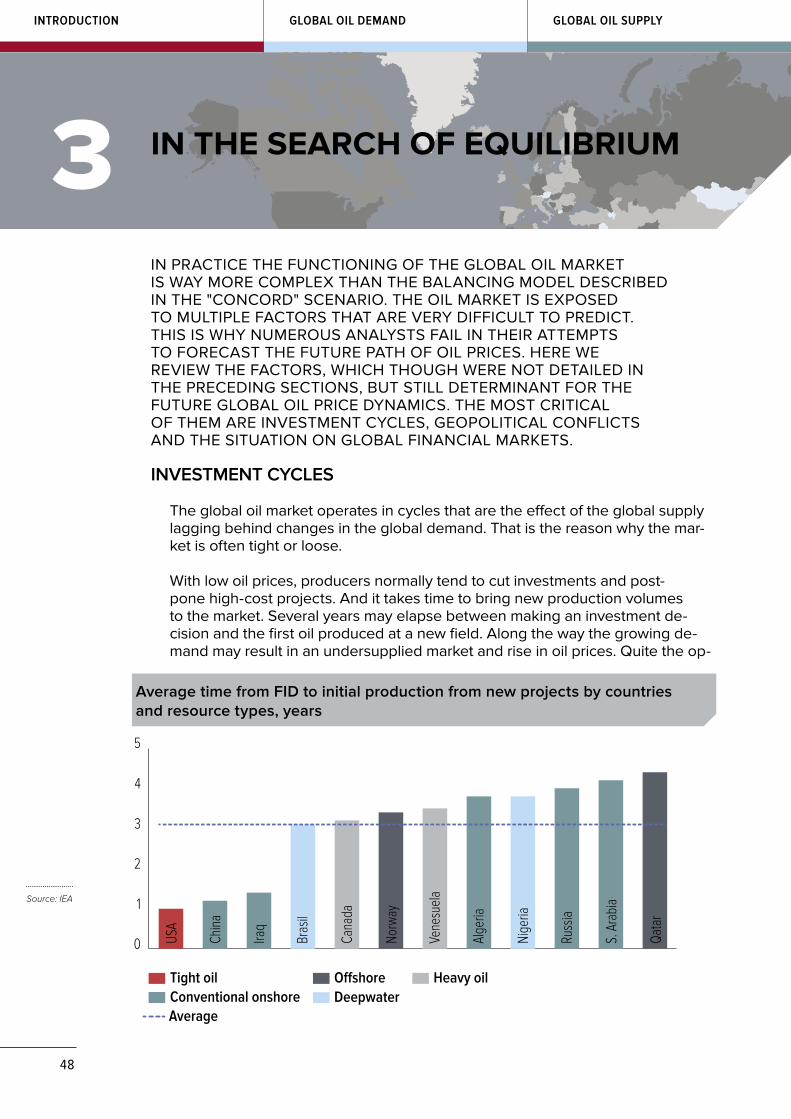
48
GLOBAL OIL SUPPLYGLOBAL OIL DEMANDINTRODUCTION
INVESTMENT CYCLES
The global oil market operates in cycles that are the effect of the global supply lagging behind changes in the global demand. That is the reason why the mar-ket is often tight or loose.
With low oil prices, producers normally tend to cut investments and post-pone high-cost projects. And it takes time to bring new production volumes to the market. Several years may elapse between making an investment de-cision and the first oil produced at a new field. Along the way the growing de-mand may result in an undersupplied market and rise in oil prices. Quite the op-
IN PRACTICE THE FUNCTIONING OF THE GLOBAL OIL MARKET IS WAY MORE COMPLEX THAN THE BALANCING MODEL DESCRIBED IN THE "CONCORD" SCENARIO. THE OIL MARKET IS EXPOSED TO MULTIPLE FACTORS THAT ARE VERY DIFFICULT TO PREDICT. THIS IS WHY NUMEROUS ANALYSTS FAIL IN THEIR ATTEMPTS TO FORECAST THE FUTURE PATH OF OIL PRICES. HERE WE REVIEW THE FACTORS, WHICH THOUGH WERE NOT DETAILED IN THE PRECEDING SECTIONS, BUT STILL DETERMINANT FOR THE FUTURE GLOBAL OIL PRICE DYNAMICS. THE MOST CRITICAL OF THEM ARE INVESTMENT CYCLES, GEOPOLITICAL CONFLICTS AND THE SITUATION ON GLOBAL FINANCIAL MARKETS.
IN THE SEARCH OF EQUILIBRIUM3
Average
Tight oil O�shore Heavy oilConventional onshore Deepwater
0
1
2
3
4
5
USA
Chin
a
Iraq
Bras
il
Cana
da
Norw
ay
Vene
suel
a
Alge
ria
Nige
ria
Russ
ia
S. A
rabi
a
Qata
r
Average time from FID to initial production from new projects by countries and resource types, years
Source: IEA
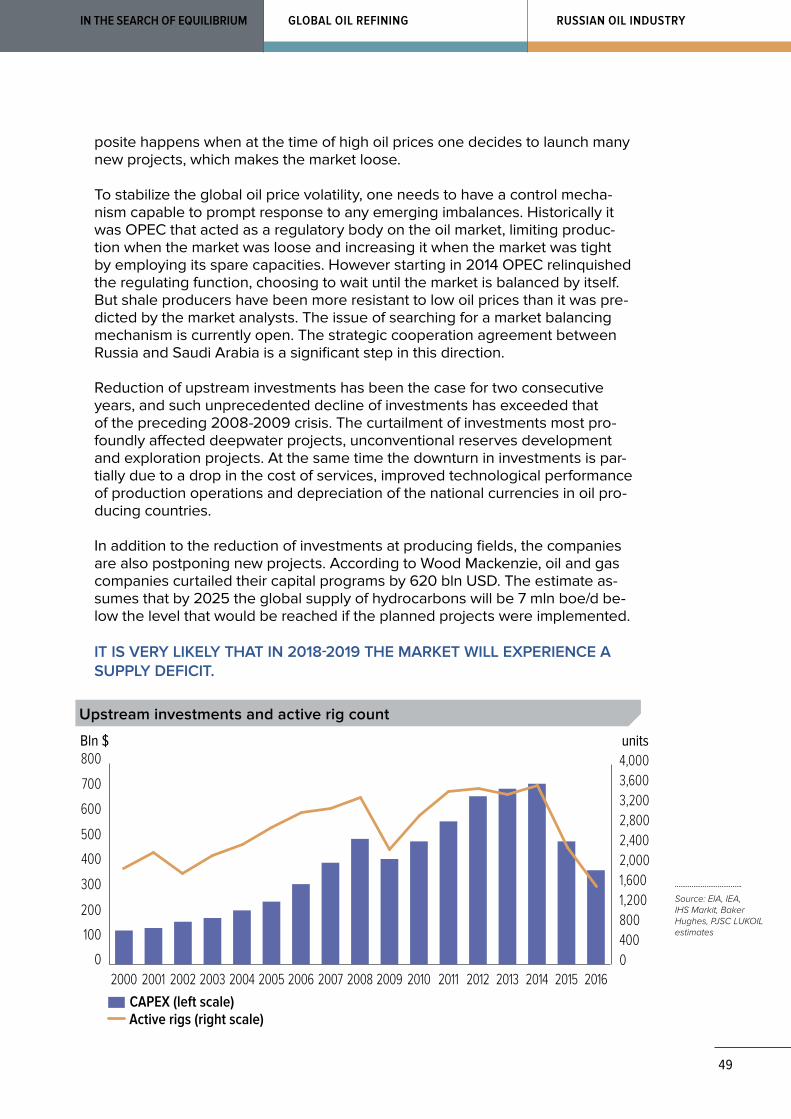
49
RUSSIAN OIL INDUSTRYIN THE SEARCH OF EQUILIBRIUM GLOBAL OIL REFINING
posite happens when at the time of high oil prices one decides to launch many new projects, which makes the market loose.
To stabilize the global oil price volatility, one needs to have a control mecha-nism capable to prompt response to any emerging imbalances. Historically it was OPEC that acted as a regulatory body on the oil market, limiting produc-tion when the market was loose and increasing it when the market was tight by employing its spare capacities. However starting in 2014 OPEC relinquished the regulating function, choosing to wait until the market is balanced by itself. But shale producers have been more resistant to low oil prices than it was pre-dicted by the market analysts. The issue of searching for a market balancing mechanism is currently open. The strategic cooperation agreement between Russia and Saudi Arabia is a significant step in this direction.
Reduction of upstream investments has been the case for two consecutive years, and such unprecedented decline of investments has exceeded that of the preceding 2008-2009 crisis. The curtailment of investments most pro-foundly affected deepwater projects, unconventional reserves development and exploration projects. At the same time the downturn in investments is par-tially due to a drop in the cost of services, improved technological performance of production operations and depreciation of the national currencies in oil pro-ducing countries.
In addition to the reduction of investments at producing fields, the companies are also postponing new projects. According to Wood Mackenzie, oil and gas companies curtailed their capital programs by 620 bln USD. The estimate as-sumes that by 2025 the global supply of hydrocarbons will be 7 mln boe/d be-low the level that would be reached if the planned projects were implemented.
IT IS VERY LIKELY THAT IN 2018-2019 THE MARKET WILL EXPERIENCE A SUPPLY DEFICIT.
CAPEX (left scale)
0
100
200
300
400
500
600
700
800
2016201520142013201220112010200920082007200620052004200320022001200004008001,2001,6002,0002,4002,8003,2003,6004,000
Bln $ units
Active rigs (right scale)
Upstream investments and active rig count
Source: EIA, IEA, IHS Markit, Baker Hughes, PJSC LUKOIL estimates
50
GLOBAL OIL SUPPLYGLOBAL OIL DEMANDINTRODUCTION
GEOPOLITICS AND SUPPLY DISRUPTIONS
Geopolitical conflicts are another major factor that may substantially affect the global market environment. High geopolitical tensions result in an annual undersupply of 2 to 3 mb/d of oil to the market.
Supply disruptions most often occur in the OPEC countries that are in the midst of geopolitical conflicts. Libya, Nigeria, Iraq, South Sudan and Yemen accounted for some 90% of total supply disruptions during the first half of 2016. The dura-tion of these disruptions normally depends on what caused them. If it is a strike, weather conditions or technical accidents, the supply may be resumed with-in several months. In case of political conflict, oil may be kept off the market for a longer time period.
It’s rather hard to predict the outcome of a geopolitical conflict. However, with many unresolved sectarian and inter-ethnic conflicts around, one may reasonably assume that oil supply disruptions will continue to greatly affect the oil market.
PROSPECTS OF MARKET REBALANCING
The scaling down of investments and postponement of commissioning new pro-jects are going to affect the global supply of oil. Though in 2015-2016 the ef-fects from the projects commissioned during the high oil price period were still present, the number of such new projects is expected to decrease in the years to come. At the same time, the spare capacity of OPEC is at its historical low, which indicates a potential limitation for further OPEC production growth. Amid the sustainably growing global demand for oil, the market may turn to defi-cit as early as in 2017. The OPEC agreement to freeze production, if enacted by the cartel members, may further aggravate the shortage of supply.
Nevertheless the market must remain tight for some time to reduce the re-serves and create an environment for sustainable price growth. Over the last
Динамика совокупного долга и свободного денежного потока сланцевых компаний*, млрд долл.OPEC Independent producers
0
0.5
1.0
1.5
2.0
2.5
3.0
3.5
4.0
jan. 1
1m
ar. 1
1m
ay 11
july
11se
p. 11
nov.
11jan
. 12
mar
. 12
may
12 ju
ly 12
sep.
12no
v. 12
jan. 1
3m
ar. 1
3m
ay 13
july
13se
p. 13
nov.
13jan
. 14
mar
. 14
may
14ju
ly 14
sep.
14no
v. 14
jan. 1
5m
ar. 1
5m
ay 15
july
15se
p. 15
nov.
15jan
. 16
mar
. 16
may
16ju
ly 16
Unplanned oil supply disruptions, Mbd
Source: EIA Short-Term Energy Outlook
51
RUSSIAN OIL INDUSTRYIN THE SEARCH OF EQUILIBRIUM GLOBAL OIL REFINING
two years the world oil and petroleum products stocks have reached the record high. The total stocks in developed countries are currently estimated at 3.1 bln barrels. Despite some decline in the U.S. stocks, this continues to adverse-ly affect the oil prices. It is going to take another 1 or 2 years of a tight market for the stocks to go back to the sustainable historic levels.
2005–2014 range
january february march april may june july august september october november december
Average (2005–2014)20152016
2.5
2.6
2.7
2.8
2.9
3.0
3.1
3.2
OECD commercial stocks, bln bbl
Source: EIA, PJSC LUKOIL estimates
FINANCIAL FACTORS
Financial markets are also important to pricing on the global oil market. The physical crude prices are usually linked to the commodity exchange quotes of key benchmark crudes. This link is used both in long-term contracts and spot deals. Futures and options contracts traded on the exchanges do not re-quire physical delivery of the underlying commodities, which enables financial speculations.
Since the mid 2000s the number of traded oil-related derivatives has soared. Between 2005 and 2015 the volume of "paper" crude trading grew fourfold. In 2016 oil futures trading was already 19 times the average daily quantity of the global supply of liquid hydrocarbons, which is due to the expansion of au-tomated trading.
The emergence on the oil market in 2004 of commodity index funds was a ma-jor contributor to the growth of trading volumes. This instrument became pop-ular with investors willing to include commodities in their investment portfolios. The income earned by commodity index funds is linked to the commodity indi-ces, with crude oil being one of their key components. According to some es-timates during the period of growing oil prices between 2005 and 2007 com-modity index funds accounted for up to 50% of the WTI market.
Many players on the market are pursuing different goals in oil trading. The Com-modity Futures Trading Commission (CFTC) divides traders into five categories: commercial traders, swap dealers, money managed, other reportables and oth-er non-reportables. Commercial traders normally include companies handling
52
GLOBAL OIL SUPPLYGLOBAL OIL DEMANDINTRODUCTION
physical crude (i.e. oil producing companies, oil refining companies, air carriers) seeking to hedge any risks of oil price change. Money managed normally in-clude institutional investors operating on behalf of their customers and earn-ing income from changes in the prices of financial assets. Another major cate-gory of market players are swap dealers, who use exchange-traded instruments to hedge their positions on the swap market, which is an OTC market.
World liquids productionWTI at CME Brent at ICE
0200400600800
1,0001,2001,4001,6001,8002,000
1988
1989
1990 1991
1992
1994
1993
1995
1996
1998
1997
1999
2000
2001
2002
2003
2004
2005
2006
2007
2008
2009
2010
2011
2012
2013
2014
2015
2016
Daily average CME and ICE trading volume, Mbd
Source: Thomson Reuters, CME, ICE
According to CFTC, commercial players hold between 20 and 30% of the "pa-per" market. However, at certain times the percentage of speculative trad-ers may reach 80%. The presence of these players on the oil market, capa-ble of quickly migrating from one financial market sector to another, contributes to the higher fluctuations of global oil prices. However major speculative traders may profit from both increasing and declining prices. This explains their interest in keeping the prices highly volatile.
2006 2007 2008 2009 2010 2011 2012 2013 2014 2015 2016
Producers/Commercials Money Managed Swap dealersOther reportables Non-reportables
0
20
40
60
80
100
WTI futures market structure by trader’s category, %
Source: CFTC

53
RUSSIAN OIL INDUSTRYIN THE SEARCH OF EQUILIBRIUM GLOBAL OIL REFINING
DOLLAR EXCHANGE RATE
It’s been over a decade that the US dollar exchange rate has been inversely re-lated to the global oil prices. Growth in oil prices is accompanied by the US dol-lar depreciation, whereas a slump in the prices is generally followed by the appreciation.
There are several hypotheses as to what causes such correlation between oil prices and the US dollar exchange rate. First of all, since oil is denominat-ed in the US dollars, as the US dollar appreciates oil becomes more expen-sive to consumers from countries that are outside of the USD zone. The high cost of oil in national currencies may result in contraction of demand for oil in such countries, which in turn causes the global oil prices to decrease. Sec-ondly, the currencies of some major oil exporters, e.g. Saudi Arabia, are linked to the US dollar. Weakening of the dollar brings a drop in the purchasing pow-er of the currencies of such countries, which may prompt them to limit their pro-duction in an effort to cause the global oil prices to increase. Thirdly, the vari-ations of the US dollar exchange rate are heavily dependent on the monetary policy pursued by the Federal Reserve. With federal funds rate increase, invest-ment funds sourced from high-risk assets (e.g. oil futures) are reallocated in-to low-risk ones (e.g. US Treasuries), which contributes to the strengthening of the dollar and reduction of oil prices.
In addition, rising oil prices worsen to the U.S. Trade balance, which puts neg-ative pressure on the US dollar exchange rate. Quite the opposite holds true for oil producing countries, whose export revenues are heavily dependent on oil prices. In case of a drop in prices, the national currencies of such countries de-preciate against the US dollar.
In the mid-term the correlation between oil prices and the US dollar exchange rate is expected to hold. That is the reason why the dollar exchange rate will continue to remain crucial for oil pricing.
july
09ja
n. 0
9ju
ly 08
jan.
08
july
07ja
n. 0
7ju
ly 06
jan.
06
july
05ja
n. 0
5ju
ly 04
jan.
04
july
03ja
n. 0
3ju
ly 02
jan.
02
july
14ja
n. 14
july
13ja
n. 13
july
16ja
n. 16
july
15ja
n. 15
july
12ja
n. 12
july
11ja
n. 11
july
10ja
n. 10
Brent (left scale) US dollar index (right scale)
0
20
40
60
80
100
120
140
60
70
80
90
100
110
120
130
Oil price and US dollar index
Source: Thomson Reuters, PJSC LUKOIL estimates

54
GLOBAL OIL SUPPLYGLOBAL OIL DEMANDINTRODUCTION
What is important is whether the US dollar will be able to preserve its dominant position in commodity payments, and whether the Federal Reserve will remain the lender of the last resort. Gradual loss by the U.S. of its leadership in global trade and its growing national debt that casts doubts on the dollar’s purchasing power may undermine the dollar’s primary reserve currency status.
The share of the developing countries in the global trade is growing. In 2014 China moved ahead of the U.S. in terms of its international trade volume. In November 2015 IMF included CNY in its reserve currency bas-ket, even though the Chinese currency fails to meet the applicable require-ments. This indicates recognition of the country’s crucial role in world trade. The number of countries dissatisfied with the U.S. dollar monopoly in global financial markets is growing. To withstand such monopoly, some countries began to make settlements in their national currencies.
There’s ongoing discussion of a single currency in the countries that are members of the Cooperation Council for the Arab States of the Gulf, in-cluding such major oil exporters as Saudi Arabia, Kuwait and the UAE.
USA China
0
1,000
2,000
3,000
4,000
5,000
2014200319931983
Comparison of USA and China by volume of trade, bln$
Source: WTO
ROLE OF BENCHMARK PRICES
Change in spot oil pricing is an important factor contributing to higher vola-tility. This may be illustrated by the situation with Brent, being a benchmark for multiple oil grades supplied to Europe. The Brentblend is currently be-ing evaluated on the basis of a limited number of oil grades whose produc-tion has been steadily declining. Though in 2016 the total production of such grades was 900 tb/d, by 2030 it is expected to drop to 200-250 tb/d. By comparison the supply of the Russian Urals grade to northwest Europe is about 1.4 mb/d.
Low production volumes of the benchmark grade give traders a possibility to manipulate the market. One major player may buy out a considerable por-tion of the monthly production. That makes price agencies expand the mix
55
RUSSIAN OIL INDUSTRYIN THE SEARCH OF EQUILIBRIUM GLOBAL OIL REFINING
of oil grades constituting the benchmark. However, the potential for involve-ment of new grades is limited.
There have been attempts to modify the established system of pricing of phys-ical oil shipments. These include attempts to introduce exchange based pricing of the major oil flows. The most successful example is the commencement of ex-change trading of Oman Crude in Dubai. There are plans to start oil exchange trad-ing in Russia. In late 2016 the Saint-Petersburg International Mercantile Exchange (SPIMEX) is expected to begin trading the Russian export benchmark – Urals.
EXTENT OF PRICE VOLATILITY
The considered factors make the oil market more volatile than the markets of many other financial assets. By comparison, the standard deviation of the an-nual return on WTI futures in 2010-2015 was 22%, whereas the same indicator for the S&P 500 was 10% and 5% for 10-year US treasury bonds.
The oil price fluctuation range under the Volatility scenario will remain rather wide in the coming decade. If average annual values are considered, the devia-tion from the "Concord" base case scenario may reach 40 USD/bbl. For daily oil quotes, the price volatility range may be even wider.
Completed analysis suggests improvement of oil market fundamentals in the mid-term. The market is expected to rebalance due to the curtailment of drilling and postponement of new projects. At the same time, the demand for new pro-duction projects will continue to grow. There is a high chance that the average price on the market between 2015 and 2030 will be close to 80 USD/bbl in con-stant prices, i.e. the price level assumed in the "Concord" scenario.
The Volatility scenario may be beneficial to conventional oil producers, and above all to the OPEC members, for it is going to hold back the development of renewa-bles and adversely affect independent producers.
Volatility range
2002 2004 2006 2008 2010 2012 2014 2016 2018 2020 2022 2024 2026 2028 2030Actual (monthly data) Actual (annual data) Forecast
0
30
60
90
120
150
Range of Brent oil price fluctuations in "Volatility" scenario, $/bbl
Source: Thomson Reuters, PJSC LUKOIL estimates
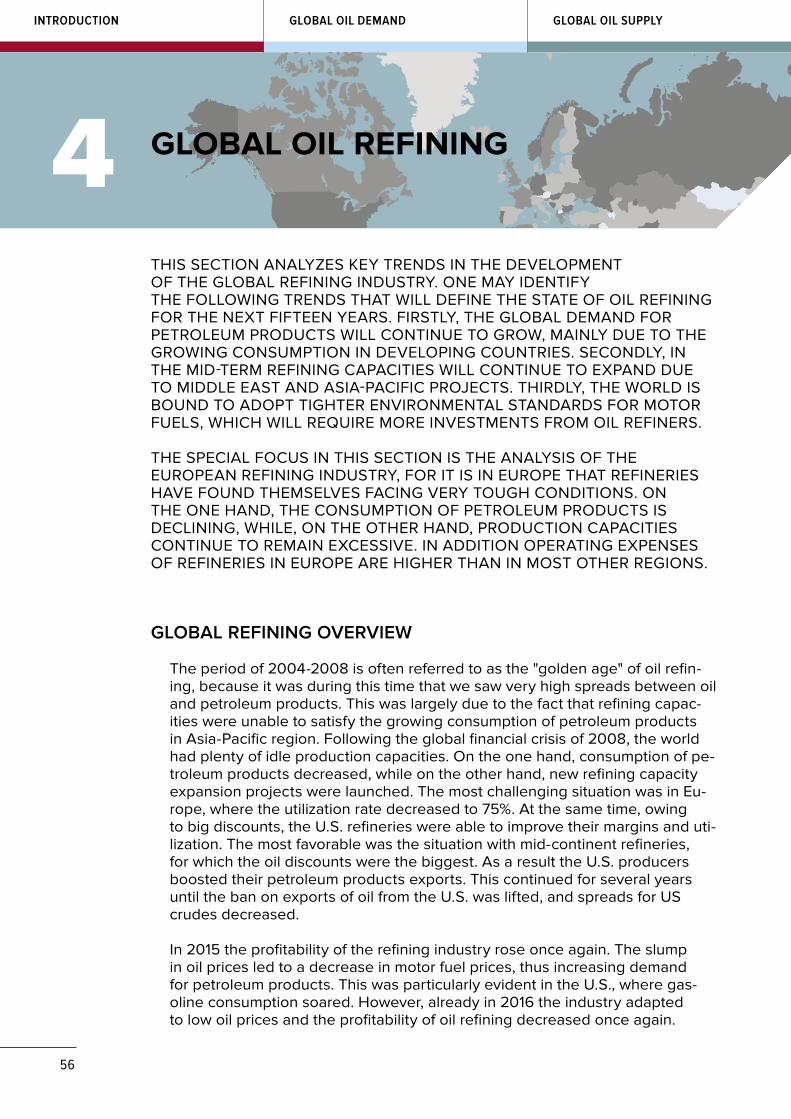
56
GLOBAL OIL SUPPLYGLOBAL OIL DEMANDINTRODUCTION
GLOBAL REFINING OVERVIEW
The period of 2004-2008 is often referred to as the "golden age" of oil refin-ing, because it was during this time that we saw very high spreads between oil and petroleum products. This was largely due to the fact that refining capac-ities were unable to satisfy the growing consumption of petroleum products in Asia-Pacific region. Following the global financial crisis of 2008, the world had plenty of idle production capacities. On the one hand, consumption of pe-troleum products decreased, while on the other hand, new refining capacity expansion projects were launched. The most challenging situation was in Eu-rope, where the utilization rate decreased to 75%. At the same time, owing to big discounts, the U.S. refineries were able to improve their margins and uti-lization. The most favorable was the situation with mid-continent refineries, for which the oil discounts were the biggest. As a result the U.S. producers boosted their petroleum products exports. This continued for several years until the ban on exports of oil from the U.S. was lifted, and spreads for US crudes decreased.
In 2015 the profitability of the refining industry rose once again. The slump in oil prices led to a decrease in motor fuel prices, thus increasing demand for petroleum products. This was particularly evident in the U.S., where gas-oline consumption soared. However, already in 2016 the industry adapted to low oil prices and the profitability of oil refining decreased once again.
THIS SECTION ANALYZES KEY TRENDS IN THE DEVELOPMENT OF THE GLOBAL REFINING INDUSTRY. ONE MAY IDENTIFY THE FOLLOWING TRENDS THAT WILL DEFINE THE STATE OF OIL REFINING FOR THE NEXT FIFTEEN YEARS. FIRSTLY, THE GLOBAL DEMAND FOR PETROLEUM PRODUCTS WILL CONTINUE TO GROW, MAINLY DUE TO THE GROWING CONSUMPTION IN DEVELOPING COUNTRIES. SECONDLY, IN THE MID-TERM REFINING CAPACITIES WILL CONTINUE TO EXPAND DUE TO MIDDLE EAST AND ASIA-PACIFIC PROJECTS. THIRDLY, THE WORLD IS BOUND TO ADOPT TIGHTER ENVIRONMENTAL STANDARDS FOR MOTOR FUELS, WHICH WILL REQUIRE MORE INVESTMENTS FROM OIL REFINERS.
THE SPECIAL FOCUS IN THIS SECTION IS THE ANALYSIS OF THE EUROPEAN REFINING INDUSTRY, FOR IT IS IN EUROPE THAT REFINERIES HAVE FOUND THEMSELVES FACING VERY TOUGH CONDITIONS. ON THE ONE HAND, THE CONSUMPTION OF PETROLEUM PRODUCTS IS DECLINING, WHILE, ON THE OTHER HAND, PRODUCTION CAPACITIES CONTINUE TO REMAIN EXCESSIVE. IN ADDITION OPERATING EXPENSES OF REFINERIES IN EUROPE ARE HIGHER THAN IN MOST OTHER REGIONS.
GLOBAL OIL REFINING4
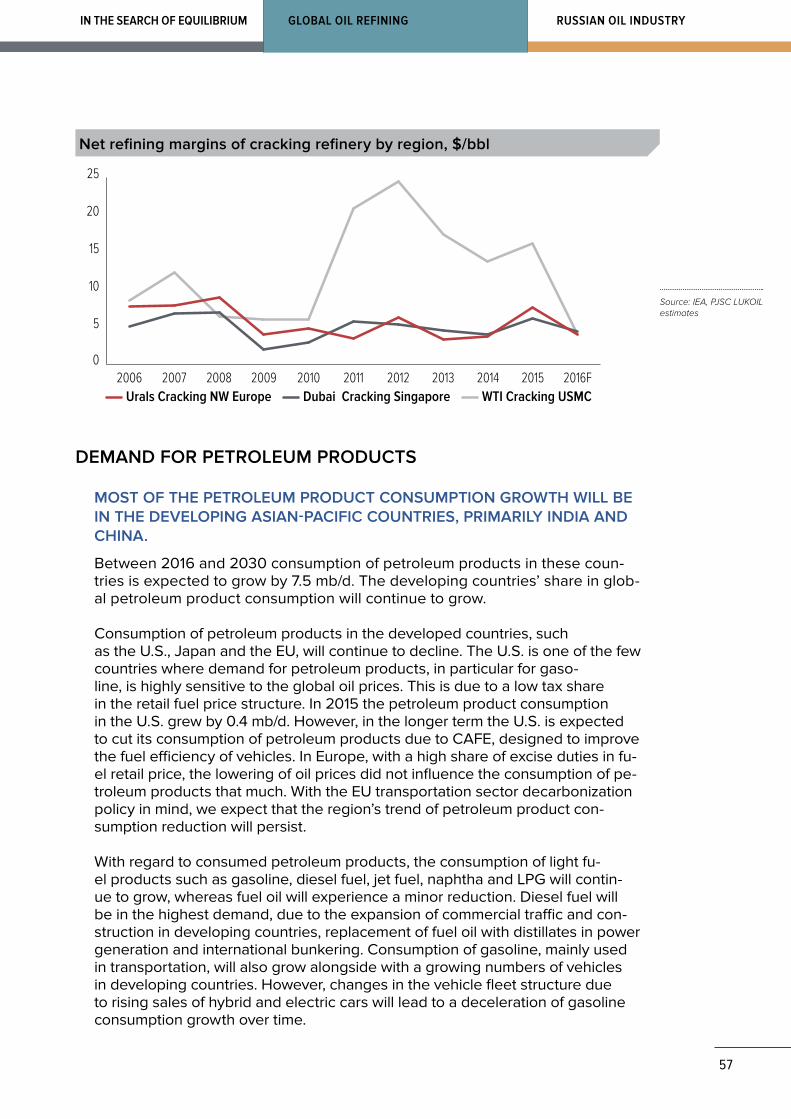
57
RUSSIAN OIL INDUSTRYIN THE SEARCH OF EQUILIBRIUM GLOBAL OIL REFINING
DEMAND FOR PETROLEUM PRODUCTS
MOST OF THE PETROLEUM PRODUCT CONSUMPTION GROWTH WILL BE IN THE DEVELOPING ASIAN-PACIFIC COUNTRIES, PRIMARILY INDIA AND CHINA.
Between 2016 and 2030 consumption of petroleum products in these coun-tries is expected to grow by 7.5 mb/d. The developing countries’ share in glob-al petroleum product consumption will continue to grow.
Consumption of petroleum products in the developed countries, such as the U.S., Japan and the EU, will continue to decline. The U.S. is one of the few countries where demand for petroleum products, in particular for gaso-line, is highly sensitive to the global oil prices. This is due to a low tax share in the retail fuel price structure. In 2015 the petroleum product consumption in the U.S. grew by 0.4 mb/d. However, in the longer term the U.S. is expected to cut its consumption of petroleum products due to CAFE, designed to improve the fuel efficiency of vehicles. In Europe, with a high share of excise duties in fu-el retail price, the lowering of oil prices did not influence the consumption of pe-troleum products that much. With the EU transportation sector decarbonization policy in mind, we expect that the region’s trend of petroleum product con-sumption reduction will persist.
With regard to consumed petroleum products, the consumption of light fu-el products such as gasoline, diesel fuel, jet fuel, naphtha and LPG will contin-ue to grow, whereas fuel oil will experience a minor reduction. Diesel fuel will be in the highest demand, due to the expansion of commercial traffic and con-struction in developing countries, replacement of fuel oil with distillates in power generation and international bunkering. Consumption of gasoline, mainly used in transportation, will also grow alongside with a growing numbers of vehicles in developing countries. However, changes in the vehicle fleet structure due to rising sales of hybrid and electric cars will lead to a deceleration of gasoline consumption growth over time.
Urals Cracking NW Europe Dubai Cracking Singapore WTI Cracking USMC
0
5
10
15
20
25
2016F2015201420132012201120102009200820072006
Net refining margins of cracking refinery by region, $/bbl
Source: IEA, PJSC LUKOIL estimates

58
GLOBAL OIL SUPPLYGLOBAL OIL DEMANDINTRODUCTION
The most rapid growth of gasoline consumption is expected in China, where the passenger car fleet is quickly expanding. While in the previous dec-ade the domestic demand for petroleum products was primarily driven by the growing consumption of middle distillates, in recent years consump-tion for the most part is driven by gasoline growth. This trend occurs as a re-sult of refocusing the Chinese economy from investment growth to that based on consumer demand. In India, on the contrary, the primary driver of petroleum products consumption will be diesel fuel, which is widely used in commercial transportation and construction.
The trend of declining fuel oil consumption will continue, primarily in such sec-tors as power generation and offshore bunkering. The share of fuel oil in pow-er generation is relatively low. Nonetheless, there’s still a potential for fuel oil may to be replaced with gas and renewables.
THE TIGHTENING OF FUEL QUALITY STANDARDS FOR MARITIME TRANSPORT IS LIKELY TO RESULT IN AN ADDITIONAL DROP IN DEMAND FOR FUEL OIL.
We estimate the quantity of fuel oil replaced with distillates as a result of adoption of new IMO standards to be between 1.5 and 2 mb/d.
By regions By products
Изменение потребления нефтепродуктов в 2016-2030 гг., млн барр./сут.
–2 0 2 4 6 8 10
North America
Europe
CIS
Latin America
Africa
Middle East
Asia-Pacific
–1
0
1
2
3
4
5
6
DieselGasolineFuel oil
Change in petroleum products consumption in 2016-2030, Mbd
Source: IEA, PJSC LUKOIL estimates
GLOBAL REFINING CAPACITIES
Between 2014 and 2015 several major projects designed to expand crude dis-tillation capacities were commissioned in various parts of the world. These include two refineries in Saudi Arabia – Yanbu and Jubail, with a capaci-ty of about 400,000 bbl/day each. In 2015 the expansion of the Ruwais re-fining complex was completed, expanding its capacity by 417,000 bbl/ day. Some major projects were completed in Asia-Pacific. In particular, in 2014 China launched a 240,000 bbl/day Sinochem refinery in Quan-zhou and a 200,000 bbl/day Petrоchina refinery in Pengzhou. In 2015 a 300,000 bbl/day Paradip refinery was completed in India. The U.S. also
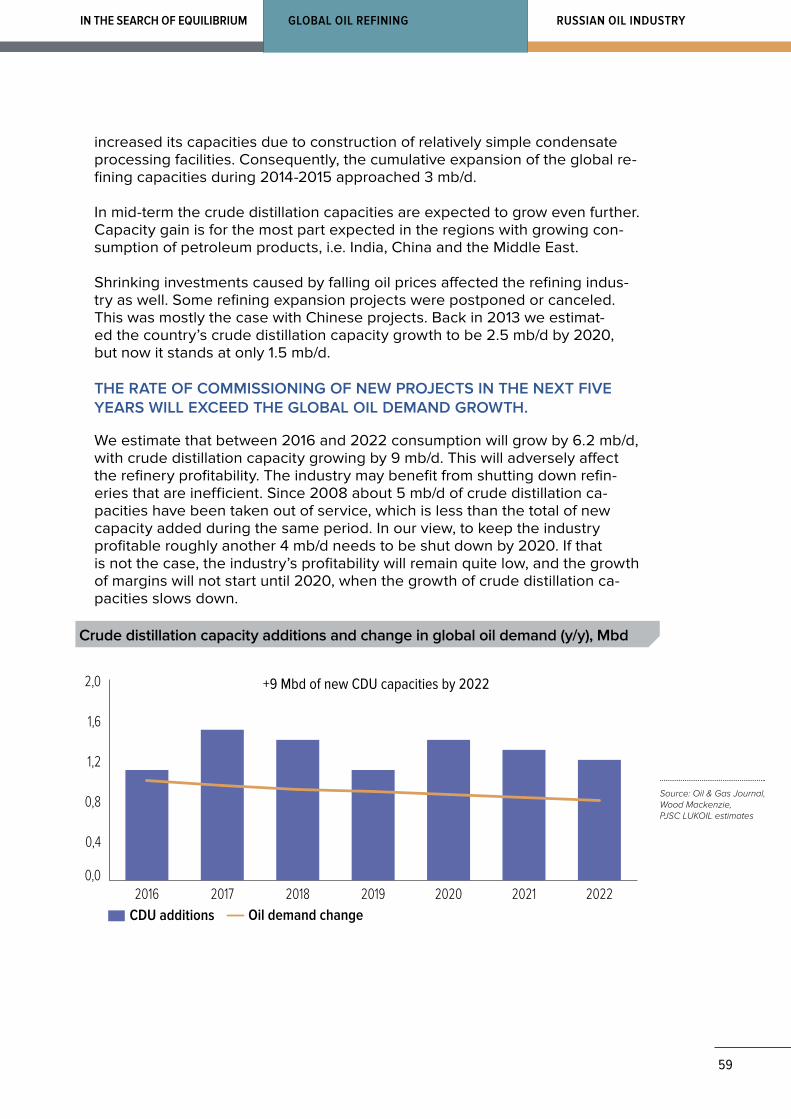
59
RUSSIAN OIL INDUSTRYIN THE SEARCH OF EQUILIBRIUM GLOBAL OIL REFINING
increased its capacities due to construction of relatively simple condensate processing facilities. Consequently, the cumulative expansion of the global re-fining capacities during 2014-2015 approached 3 mb/d.
In mid-term the crude distillation capacities are expected to grow even further. Capacity gain is for the most part expected in the regions with growing con-sumption of petroleum products, i.e. India, China and the Middle East.
Shrinking investments caused by falling oil prices affected the refining indus-try as well. Some refining expansion projects were postponed or canceled. This was mostly the case with Chinese projects. Back in 2013 we estimat-ed the country’s crude distillation capacity growth to be 2.5 mb/d by 2020, but now it stands at only 1.5 mb/d.
THE RATE OF COMMISSIONING OF NEW PROJECTS IN THE NEXT FIVE YEARS WILL EXCEED THE GLOBAL OIL DEMAND GROWTH.
We estimate that between 2016 and 2022 consumption will grow by 6.2 mb/d, with crude distillation capacity growing by 9 mb/d. This will adversely affect the refinery profitability. The industry may benefit from shutting down refin-eries that are inefficient. Since 2008 about 5 mb/d of crude distillation ca-pacities have been taken out of service, which is less than the total of new capacity added during the same period. In our view, to keep the industry profitable roughly another 4 mb/d needs to be shut down by 2020. If that is not the case, the industry’s profitability will remain quite low, and the growth of margins will not start until 2020, when the growth of crude distillation ca-pacities slows down.
+9 Mbd of new CDU capacities by 2022
CDU additions
0,0
0,4
0,8
1,2
1,6
2,0
2022202120202019201820172016Oil demand change
Crude distillation capacity additions and change in global oil demand (y/y), Mbd
Source: Oil & Gas Journal, Wood Mackenzie, PJSC LUKOIL estimates
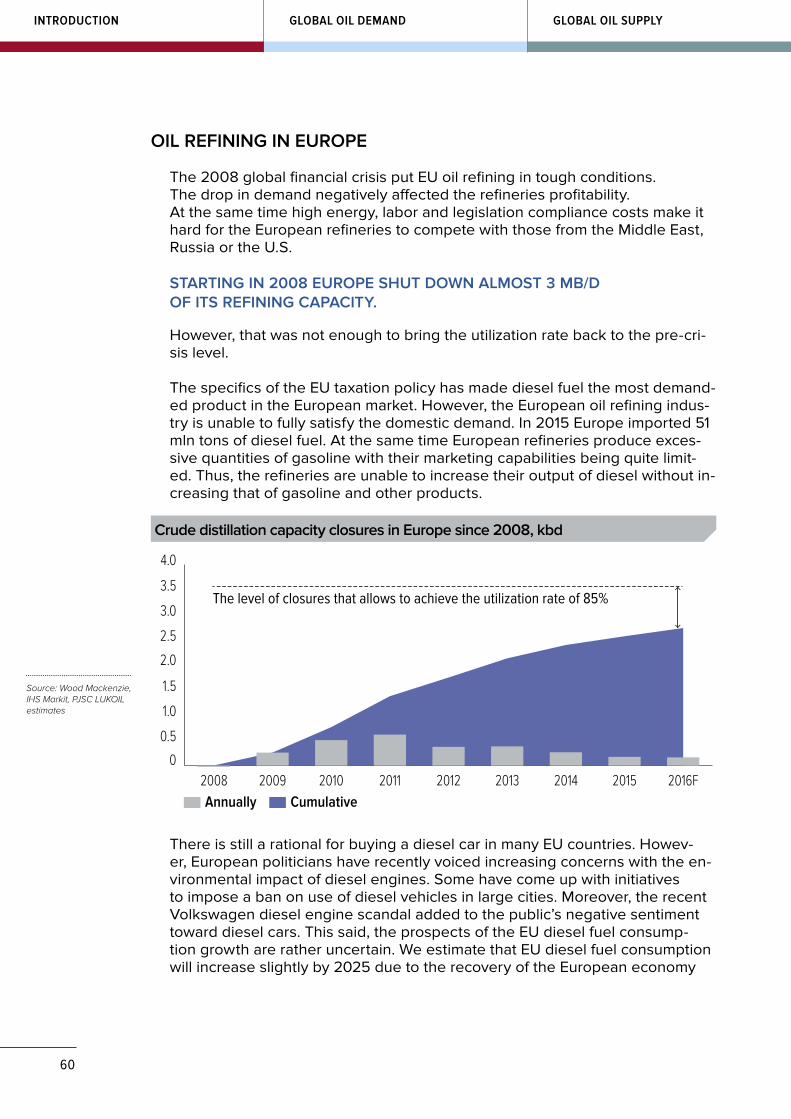
60
GLOBAL OIL SUPPLYGLOBAL OIL DEMANDINTRODUCTION
OIL REFINING IN EUROPE
The 2008 global financial crisis put EU oil refining in tough conditions. The drop in demand negatively affected the refineries profitability. At the same time high energy, labor and legislation compliance costs make it hard for the European refineries to compete with those from the Middle East, Russia or the U.S.
STARTING IN 2008 EUROPE SHUT DOWN ALMOST 3 MB/D OF ITS REFINING CAPACITY.
However, that was not enough to bring the utilization rate back to the pre-cri-sis level.
The specifics of the EU taxation policy has made diesel fuel the most demand-ed product in the European market. However, the European oil refining indus-try is unable to fully satisfy the domestic demand. In 2015 Europe imported 51 mln tons of diesel fuel. At the same time European refineries produce exces-sive quantities of gasoline with their marketing capabilities being quite limit-ed. Thus, the refineries are unable to increase their output of diesel without in-creasing that of gasoline and other products.
Annually Cumulative
The level of closures that allows to achieve the utilization rate of 85%
0
0.5
1.0
1.5
2.0
2.5
3.0
3.5
4.0
2016F20152014201320122011201020092008
Crude distillation capacity closures in Europe since 2008, kbd
Source: Wood Mackenzie, IHS Markit, PJSC LUKOIL estimates
There is still a rational for buying a diesel car in many EU countries. Howev-er, European politicians have recently voiced increasing concerns with the en-vironmental impact of diesel engines. Some have come up with initiatives to impose a ban on use of diesel vehicles in large cities. Moreover, the recent Volkswagen diesel engine scandal added to the public’s negative sentiment toward diesel cars. This said, the prospects of the EU diesel fuel consump-tion growth are rather uncertain. We estimate that EU diesel fuel consumption will increase slightly by 2025 due to the recovery of the European economy
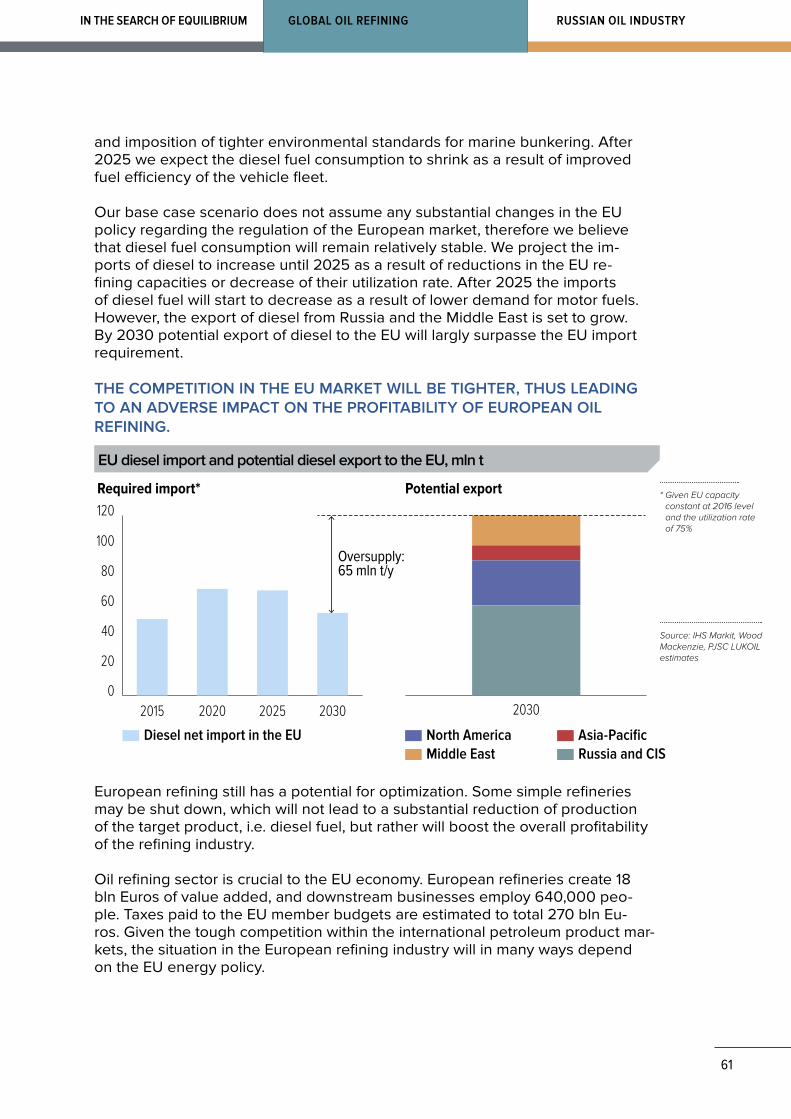
61
RUSSIAN OIL INDUSTRYIN THE SEARCH OF EQUILIBRIUM GLOBAL OIL REFINING
and imposition of tighter environmental standards for marine bunkering. After 2025 we expect the diesel fuel consumption to shrink as a result of improved fuel efficiency of the vehicle fleet.
Our base case scenario does not assume any substantial changes in the EU policy regarding the regulation of the European market, therefore we believe that diesel fuel consumption will remain relatively stable. We project the im-ports of diesel to increase until 2025 as a result of reductions in the EU re-fining capacities or decrease of their utilization rate. After 2025 the imports of diesel fuel will start to decrease as a result of lower demand for motor fuels. However, the export of diesel from Russia and the Middle East is set to grow. By 2030 potential export of diesel to the EU will largly surpasse the EU import requirement.
THE COMPETITION IN THE EU MARKET WILL BE TIGHTER, THUS LEADING TO AN ADVERSE IMPACT ON THE PROFITABILITY OF EUROPEAN OIL REFINING.
European refining still has a potential for optimization. Some simple refineries may be shut down, which will not lead to a substantial reduction of production of the target product, i.e. diesel fuel, but rather will boost the overall profitability of the refining industry.
Oil refining sector is crucial to the EU economy. European refineries create 18 bln Euros of value added, and downstream businesses employ 640,000 peo-ple. Taxes paid to the EU member budgets are estimated to total 270 bln Eu-ros. Given the tough competition within the international petroleum product mar-kets, the situation in the European refining industry will in many ways depend on the EU energy policy.
Required import* Potential export
Oversupply:65 mln t/y
Diesel net import in the EU North America Asia-PacificMiddle East Russia and CIS
0
20
40
60
80
100
120
2030202520202015 2030
EU diesel import and potential diesel export to the EU, mln t
Source: IHS Markit, Wood Mackenzie, PJSC LUKOIL estimates
* Given EU capacity constant at 2016 level and the utilization rate of 75%

62
GLOBAL OIL SUPPLYGLOBAL OIL DEMANDINTRODUCTION
OIL PRODUCTION TREND IN RUSSIA
The trend in Russian oil production has been upward, regardless of the slump in oil prices, imposition of international sanctions and deterioration of resources. In 2015 Russia produced 534 mln tons of oil and gas condensate, which was 1.4% more than in 2014. The country’s production growth was driven by such factors as the weakening of the ruble, tax exemptions and increased production of gas condensate.
THE RUSSIAN OIL INDUSTRY HAS MADE A GREAT DEAL OF PROGRESS IN RECENT YEARS: PRODUCTION OF OIL AND GAS CONDENSATE HAS BEEN STEADILY GROWING, THE OUTPUT OF LIGHT PETROLEUM PRODUCTS HAS RISEN, RUSSIAN REFINERIES HAVE BEGUN PRODUCING EURO-5 MOTOR FUELS, AND THE GASOLINE MARKET IS IN SURPLUS FOR THE FIRST TIME IN QUITE A WHILE. THESE ACHIEVEMENTS ARE IN MANY WAYS THE CONSEQUENCES OF GOVERNMENTAL POLICY AIMED TO STIMULATE THE INVESTMENT ACTIVITY IN THE INDUSTRY.
AT THE SAME TIME THERE IS A TREND OF A GROWING TAX BURDEN ON THE OIL INDUSTRY. THE TAXATION REGIME FOR BOTH OIL PRODUCTION AND OIL REFINING IS PRONE TO CONSTANT CHANGES. THUS, PROSPECTS FOR OIL INDUSTRY DEVELOPMENT APPEARS VERY UNCERTAIN. THIS SECTION INDICATES THE CHALLENGES FACED BY THE RUSSIAN OIL INDUSTRY AND PRESENTS DIFFERENT SCENARIOS OF ITS FUTURE DEVELOPMENT.
RUSSIAN OIL INDUSTRY5
0
100
200
300
400
500
600
20202019201820172016201520142013Base production* Drilling since 2013 Workover GreenfieldsCondensate
523 527 534 544 555 555 554 551
Crude and condensate production in Russia, Mt
Source: CDU TEK, Wood Mackenzie, Vygon Consulting, PJSC LUKOIL estimates
* Wells drilled before 2013
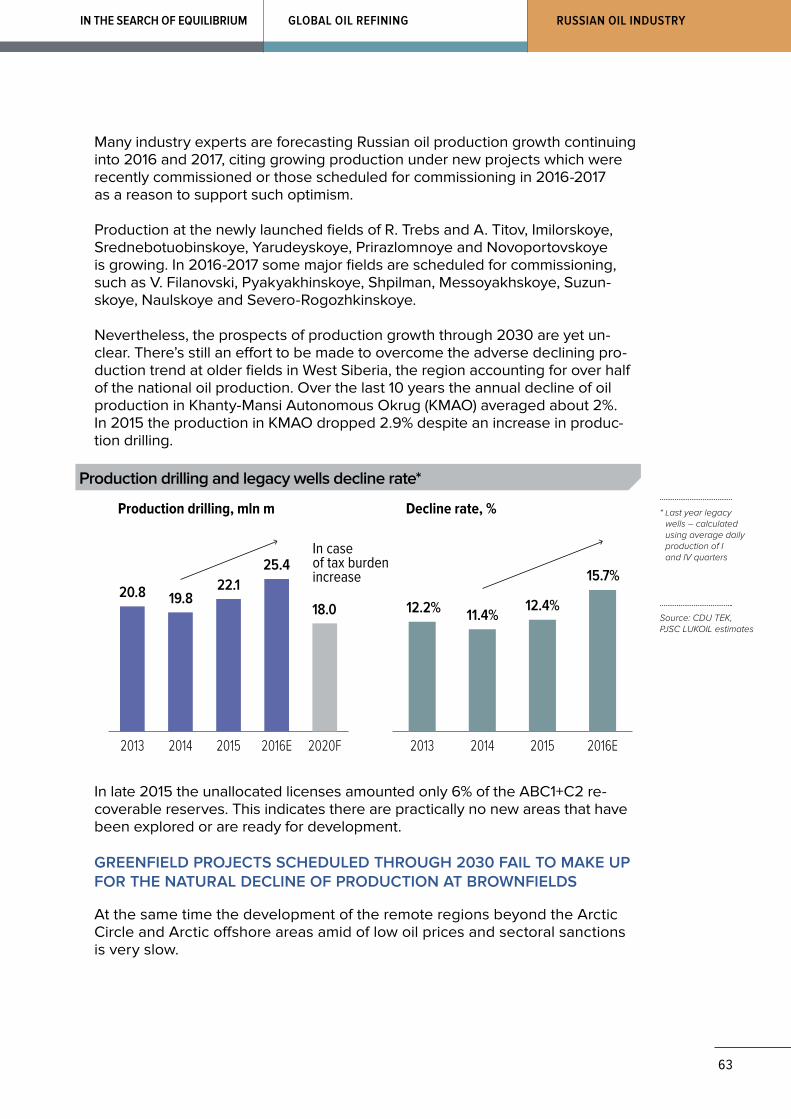
63
RUSSIAN OIL INDUSTRYIN THE SEARCH OF EQUILIBRIUM GLOBAL OIL REFINING
Many industry experts are forecasting Russian oil production growth continuing into 2016 and 2017, citing growing production under new projects which were recently commissioned or those scheduled for commissioning in 2016-2017 as a reason to support such optimism.
Production at the newly launched fields of R. Trebs and A. Titov, Imilorskoye, Srednebotuobinskoye, Yarudeyskoye, Prirazlomnoye and Novoportovskoye is growing. In 2016-2017 some major fields are scheduled for commissioning, such as V. Filanovski, Pyakyakhinskoye, Shpilman, Messoyakhskoye, Suzun-skoye, Naulskoye and Severo-Rogozhkinskoye.
Nevertheless, the prospects of production growth through 2030 are yet un-clear. There’s still an effort to be made to overcome the adverse declining pro-duction trend at older fields in West Siberia, the region accounting for over half of the national oil production. Over the last 10 years the annual decline of oil production in Khanty-Mansi Autonomous Okrug (KMAO) averaged about 2%. In 2015 the production in KMAO dropped 2.9% despite an increase in produc-tion drilling.
Production drilling, mln m Decline rate, %
In case of tax burdenincrease
2020F2016E201520142013 2016E201520142013
20.8 19.822.1
25.4
18.0 12.2% 11.4%12.4%
15.7%
Production drilling and legacy wells decline rate*
* Last year legacy wells – calculated using average daily production of I and IV quarters
Source: CDU TEK, PJSC LUKOIL estimates
In late 2015 the unallocated licenses amounted only 6% of the ABC1+C2 re-coverable reserves. This indicates there are practically no new areas that have been explored or are ready for development.
GREENFIELD PROJECTS SCHEDULED THROUGH 2030 FAIL TO MAKE UP FOR THE NATURAL DECLINE OF PRODUCTION AT BROWNFIELDS
At the same time the development of the remote regions beyond the Arctic Circle and Arctic offshore areas amid of low oil prices and sectoral sanctions is very slow.
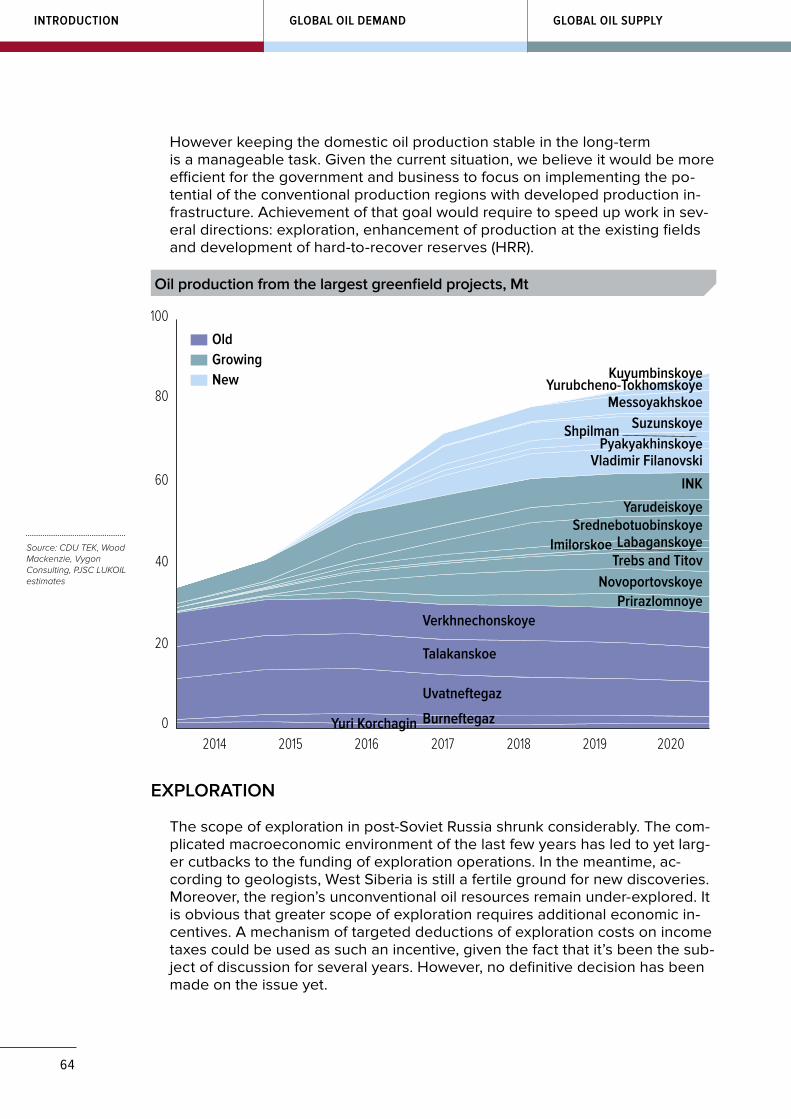
64
GLOBAL OIL SUPPLYGLOBAL OIL DEMANDINTRODUCTION
However keeping the domestic oil production stable in the long-term is a manageable task. Given the current situation, we believe it would be more efficient for the government and business to focus on implementing the po-tential of the conventional production regions with developed production in-frastructure. Achievement of that goal would require to speed up work in sev-eral directions: exploration, enhancement of production at the existing fields and development of hard-to-recover reserves (HRR).
0
20
40
60
80
100
2020201920182017201620152014
OldGrowingNew
Vladimir FilanovskiPyakyakhinskoye
Shpilman SuzunskoyeMessoyakhskoe
Yurubcheno-TokhomskoyeKuyumbinskoye
INK
YarudeiskoyeSrednebotuobinskoye
Trebs and TitovNovoportovskoye
Prirazlomnoye
LabaganskoyeImilorskoe
Yuri Korchagin Burneftegaz
Verkhnechonskoye
Talakanskoe
Uvatneftegaz
Oil production from the largest greenfield projects, Mt
Source: CDU TEK, Wood Mackenzie, Vygon Consulting, PJSC LUKOIL estimates
EXPLORATION
The scope of exploration in post-Soviet Russia shrunk considerably. The com-plicated macroeconomic environment of the last few years has led to yet larg-er cutbacks to the funding of exploration operations. In the meantime, ac-cording to geologists, West Siberia is still a fertile ground for new discoveries. Moreover, the region’s unconventional oil resources remain under-explored. It is obvious that greater scope of exploration requires additional economic in-centives. A mechanism of targeted deductions of exploration costs on income taxes could be used as such an incentive, given the fact that it’s been the sub-ject of discussion for several years. However, no definitive decision has been made on the issue yet.
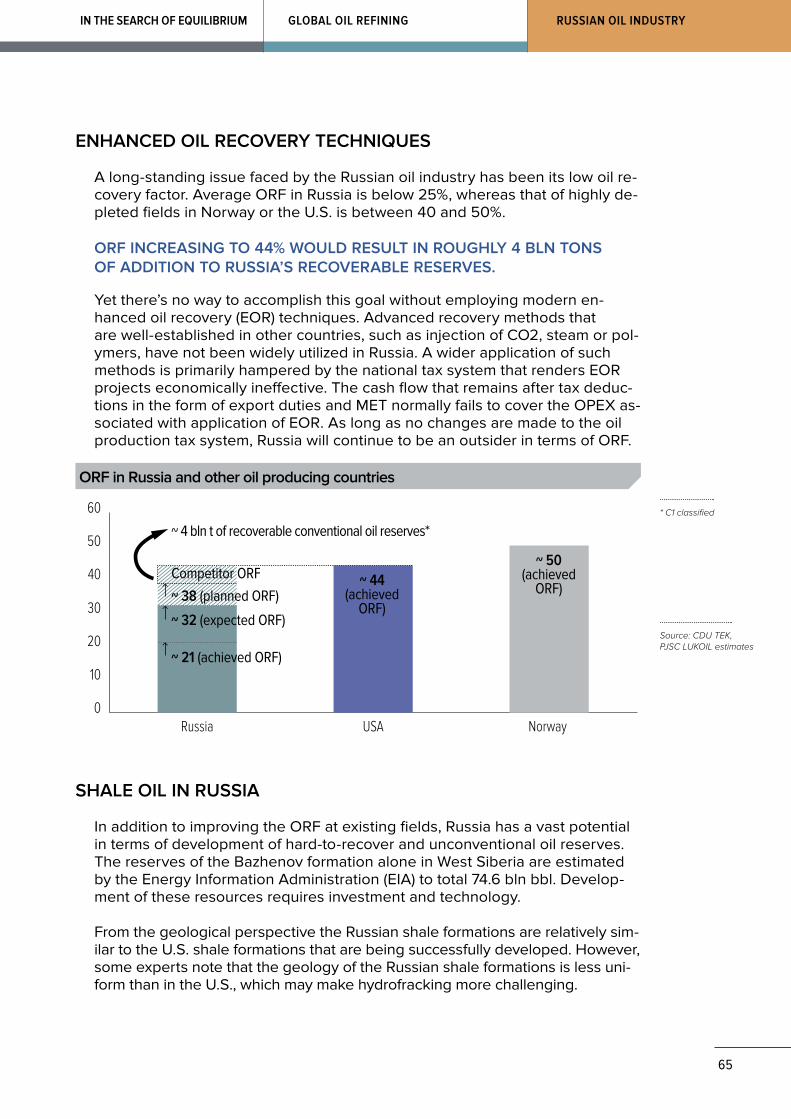
65
RUSSIAN OIL INDUSTRYIN THE SEARCH OF EQUILIBRIUM GLOBAL OIL REFINING
ENHANCED OIL RECOVERY TECHNIQUES
A long-standing issue faced by the Russian oil industry has been its low oil re-covery factor. Average ORF in Russia is below 25%, whereas that of highly de-pleted fields in Norway or the U.S. is between 40 and 50%.
ORF INCREASING TO 44% WOULD RESULT IN ROUGHLY 4 BLN TONS OF ADDITION TO RUSSIA’S RECOVERABLE RESERVES.
Yet there’s no way to accomplish this goal without employing modern en-hanced oil recovery (EOR) techniques. Advanced recovery methods that are well-established in other countries, such as injection of СО2, steam or pol-ymers, have not been widely utilized in Russia. A wider application of such methods is primarily hampered by the national tax system that renders EOR projects economically ineffective. The cash flow that remains after tax deduc-tions in the form of export duties and MET normally fails to cover the OPEX as-sociated with application of EOR. As long as no changes are made to the oil production tax system, Russia will continue to be an outsider in terms of ORF.
0
10
20
30
40
50
60
Norway USARussia
~ 4 bln t of recoverable conventional oil reserves*
~ 21 (achieved ORF)
~ 44(achieved
ORF)
~ 50(achieved
ORF)
~ 32 (expected ORF)~ 38 (planned ORF)
Competitor ORF
ORF in Russia and other oil producing countries
Source: CDU TEK, PJSC LUKOIL estimates
* С1 classified
SHALE OIL IN RUSSIA
In addition to improving the ORF at existing fields, Russia has a vast potential in terms of development of hard-to-recover and unconventional oil reserves. The reserves of the Bazhenov formation alone in West Siberia are estimated by the Energy Information Administration (EIA) to total 74.6 bln bbl. Develop-ment of these resources requires investment and technology.
From the geological perspective the Russian shale formations are relatively sim-ilar to the U.S. shale formations that are being successfully developed. However, some experts note that the geology of the Russian shale formations is less uni-form than in the U.S., which may make hydrofracking more challenging.
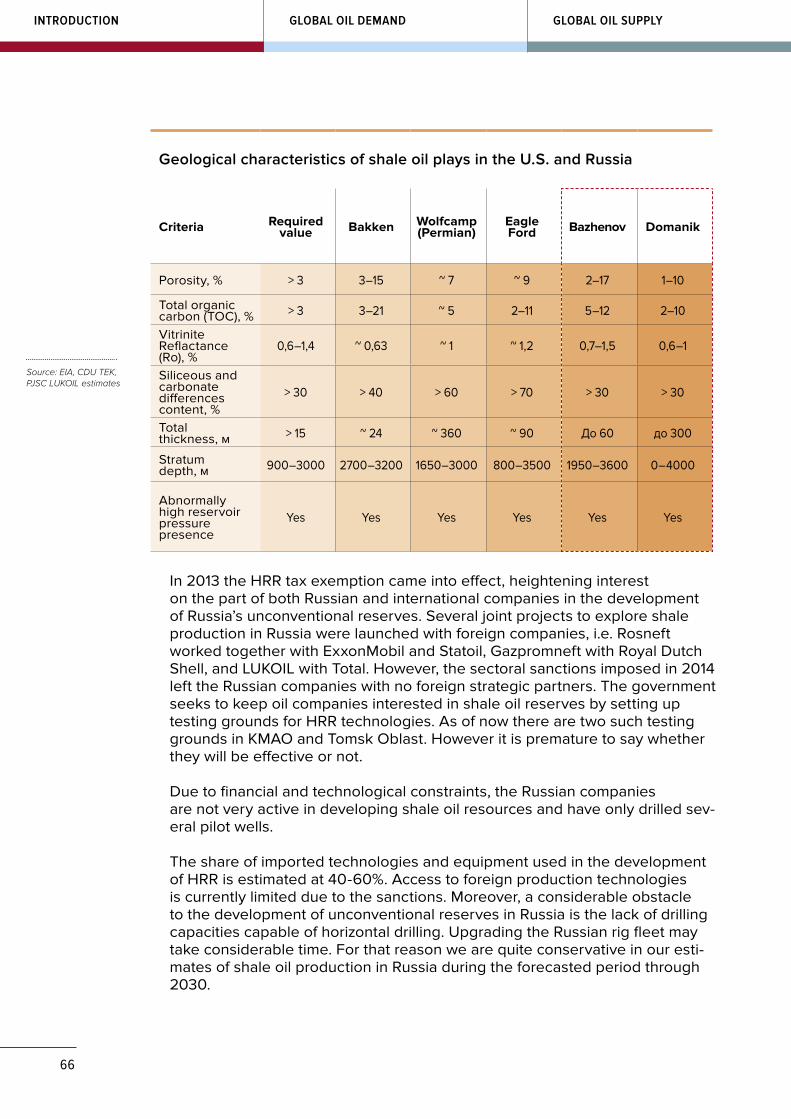
66
GLOBAL OIL SUPPLYGLOBAL OIL DEMANDINTRODUCTION
Geological characteristics of shale oil plays in the U.S. and Russia
Criteria Required value Bakken Wolfcamp
(Permian)Eagle Ford Bazhenov Domanik
Porosity, % > 3 3–15 ~ 7 ~ 9 2–17 1–10
Total organic carbon (TOC), % > 3 3–21 ~ 5 2–11 5–12 2–10
Vitrinite Reflactance (Ro), %
0,6–1,4 ~ 0,63 ~ 1 ~ 1,2 0,7–1,5 0,6–1
Siliceous and carbonate differences content, %
> 30 > 40 > 60 > 70 > 30 > 30
Total thickness, м > 15 ~ 24 ~ 360 ~ 90 До 60 до 300
Stratum depth, м 900–3000 2700–3200 1650–3000 800–3500 1950–3600 0–4000
Abnormally high reservoir pressure presence
Yes Yes Yes Yes Yes Yes
Source: EIA, CDU TEK, PJSC LUKOIL estimates
In 2013 the HRR tax exemption came into effect, heightening interest on the part of both Russian and international companies in the development of Russia’s unconventional reserves. Several joint projects to explore shale production in Russia were launched with foreign companies, i.e. Rosneft worked together with ExxonMobil and Statoil, Gazpromneft with Royal Dutch Shell, and LUKOIL with Total. However, the sectoral sanctions imposed in 2014 left the Russian companies with no foreign strategic partners. The government seeks to keep oil companies interested in shale oil reserves by setting up testing grounds for HRR technologies. As of now there are two such testing grounds in KMAO and Tomsk Oblast. However it is premature to say whether they will be effective or not.
Due to financial and technological constraints, the Russian companies are not very active in developing shale oil resources and have only drilled sev-eral pilot wells.
The share of imported technologies and equipment used in the development of HRR is estimated at 40-60%. Access to foreign production technologies is currently limited due to the sanctions. Moreover, a considerable obstacle to the development of unconventional reserves in Russia is the lack of drilling capacities capable of horizontal drilling. Upgrading the Russian rig fleet may take considerable time. For that reason we are quite conservative in our esti-mates of shale oil production in Russia during the forecasted period through 2030.
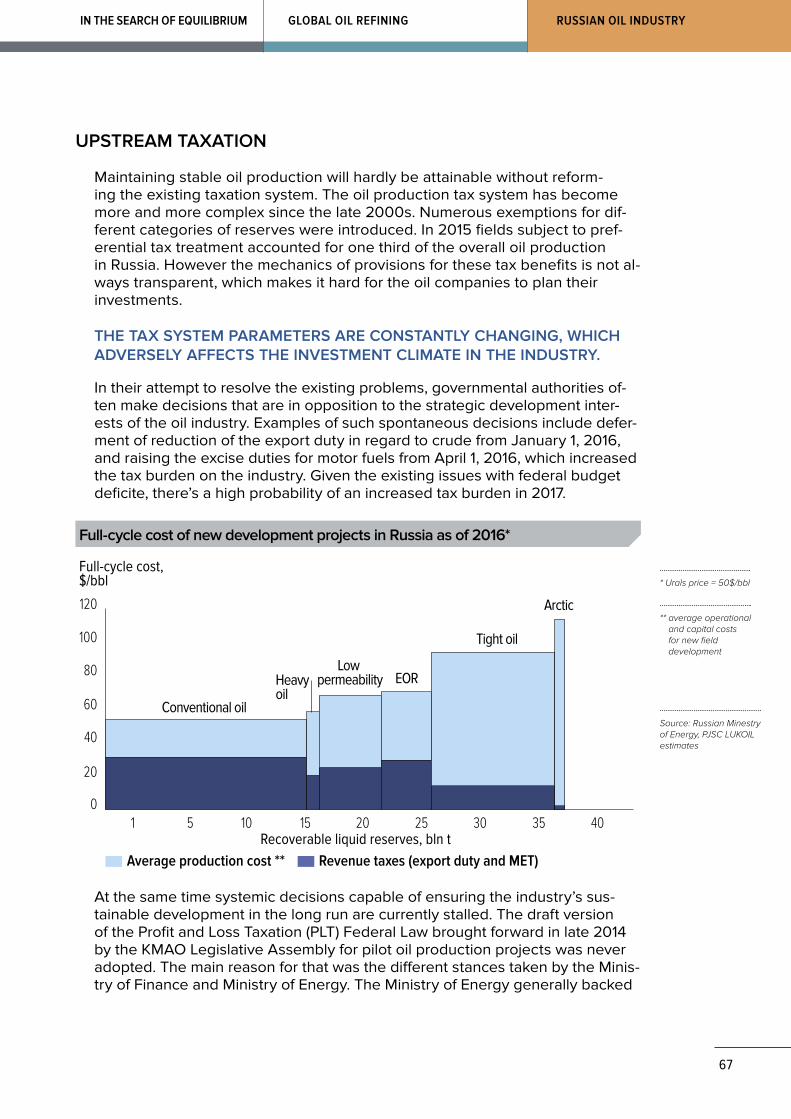
67
RUSSIAN OIL INDUSTRYIN THE SEARCH OF EQUILIBRIUM GLOBAL OIL REFINING
UPSTREAM TAXATION
Maintaining stable oil production will hardly be attainable without reform-ing the existing taxation system. The oil production tax system has become more and more complex since the late 2000s. Numerous exemptions for dif-ferent categories of reserves were introduced. In 2015 fields subject to pref-erential tax treatment accounted for one third of the overall oil production in Russia. However the mechanics of provisions for these tax benefits is not al-ways transparent, which makes it hard for the oil companies to plan their investments.
THE TAX SYSTEM PARAMETERS ARE CONSTANTLY CHANGING, WHICH ADVERSELY AFFECTS THE INVESTMENT CLIMATE IN THE INDUSTRY.
In their attempt to resolve the existing problems, governmental authorities of-ten make decisions that are in opposition to the strategic development inter-ests of the oil industry. Examples of such spontaneous decisions include defer-ment of reduction of the export duty in regard to crude from January 1, 2016, and raising the excise duties for motor fuels from April 1, 2016, which increased the tax burden on the industry. Given the existing issues with federal budget deficite, there’s a high probability of an increased tax burden in 2017.
Full-cycle cost of new development projects in Russia as of 2016*
Average production cost ** Revenue taxes (export duty and MET)
0
20
40
60
80
100
120
4035302520151051
Conventional oil
Heavyoil
Low permeability EOR
Tight oil
Arctic
Full-cycle cost,$/bbl
Recoverable liquid reserves, bln t
Source: Russian Minestry of Energy, PJSC LUKOIL estimates
* Urals price = 50$/bbl
** average operational and capital costs for new field development
At the same time systemic decisions capable of ensuring the industry’s sus-tainable development in the long run are currently stalled. The draft version of the Profit and Loss Taxation (PLT) Federal Law brought forward in late 2014 by the KMAO Legislative Assembly for pilot oil production projects was never adopted. The main reason for that was the different stances taken by the Minis-try of Finance and Ministry of Energy. The Ministry of Energy generally backed
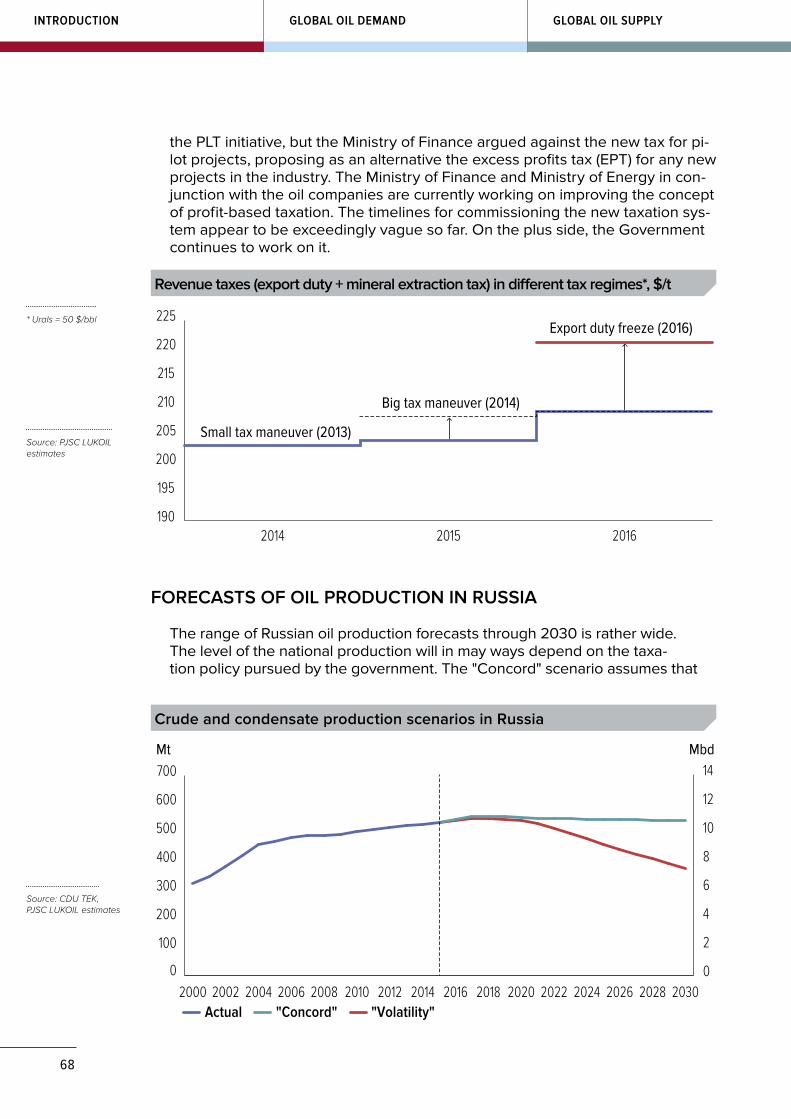
68
GLOBAL OIL SUPPLYGLOBAL OIL DEMANDINTRODUCTION
the PLT initiative, but the Ministry of Finance argued against the new tax for pi-lot projects, proposing as an alternative the excess profits tax (EPT) for any new projects in the industry. The Ministry of Finance and Ministry of Energy in con-junction with the oil companies are currently working on improving the concept of profit-based taxation. The timelines for commissioning the new taxation sys-tem appear to be exceedingly vague so far. On the plus side, the Government continues to work on it.
190
195
200
205
210
215
220
225
201620152014
Small tax maneuver (2013)
Big tax maneuver (2014)
Export duty freeze (2016)
Revenue taxes (export duty + mineral extraction tax) in different tax regimes*, $/t
Source: PJSC LUKOIL estimates
* Urals = 50 $/bbl
0
2
4
6
8
10
12
14
Actual "Concord" "Volatility"
0
100
200
300
400
500
600
700
2030202820262024202220202018201620142012201020082006200420022000
Mt Mbd
Crude and condensate production scenarios in Russia
Source: CDU TEK, PJSC LUKOIL estimates
FORECASTS OF OIL PRODUCTION IN RUSSIA
The range of Russian oil production forecasts through 2030 is rather wide. The level of the national production will in may ways depend on the taxa-tion policy pursued by the government. The "Concord" scenario assumes that

69
RUSSIAN OIL INDUSTRYIN THE SEARCH OF EQUILIBRIUM GLOBAL OIL REFINING
the forecasting time-frame through 2030 will accommodate the tax reform of transition to EPT (or another form of profit-based taxation), which will maintain the national oil production at sustainable levels above 10 mb/d.
IF RETAINED, THE EXISTING TAXATION SYSTEM WILL CAUSE THE DOMESTIC OIL PRODUCTION TO DECLINE STARTING IN 2019.
There are considerable uncertainties regarding the Government’s response to the decline in oil production. The dropping oil production is likely to provide incentives for acceleration of taxation reforms.
DEMAND FOR PETROLEUM PRODUCTS IN RUSSIA
The worsening of the Russian economy have negatively impacted the mo-tor fuel demand. In 2015 for the first time in a while domestic consumption of motor gasoline declined, sinking 1.5% below the 2014 level. Notably, even in the crisis year of 2009 the demand for gasoline didn't decrease. The die-sel fuel market also contracted. Consumption of diesel fuel started its decline as early as 2012. This was due both to the slowdown of the national economy and higher consumption of counterfeit products whose share went up consid-erably alongside with the adoption of tougher environmental regulations.
Gasoline consumption is closely linked to new car sales, which suffered a se-vere decline with household disposable incomes plummeting, car loan in-terest rates growing, and prices of new cars rising dramatically as a result of the ruble depreciation. While in 2014 2.5 mln new passenger cars were sold in Russia, in 2015 the sales dropped to 1.6 mln. The sales decline is like-ly to continue into 2016.
AS A RESULT OF DETERIORATION OF MACROECONOMIC CONDITIONS IN RUSSIA THE PROSPECTS OF THE RUSSIAN CAR MARKET HAVE TO BE REVIEWED.
In 2012 through 2013 the industry’s analysts were expecting that the Rus-sian new car market by 2025 may reach sales up to 4-4.5 mln vehicles. Now, however, experts are much more conservative in their estimates regard-ing the prospective growth of car sales. We estimate new car sales to reach the 2014 level only by 2030.
The downward trends in gasoline consumption were affected somewhat by the reduction in average mileage driven by vehicles in major cities as a result of the introduction of paid parking. Development of public trans-portation and car sharing may further aggravate the trend. At the same time the ruble depreciation caused people to take more car trips inside of Russia, which affects average mileage favorably.
Improved fuel efficiency of the motor vehicle fleet is directly linked to new car sales. Given the 2014 slump in sales, the fuel economy of the vehicle fleet is expected to improve at a slower pace than before. This trend will support the gasoline demand.
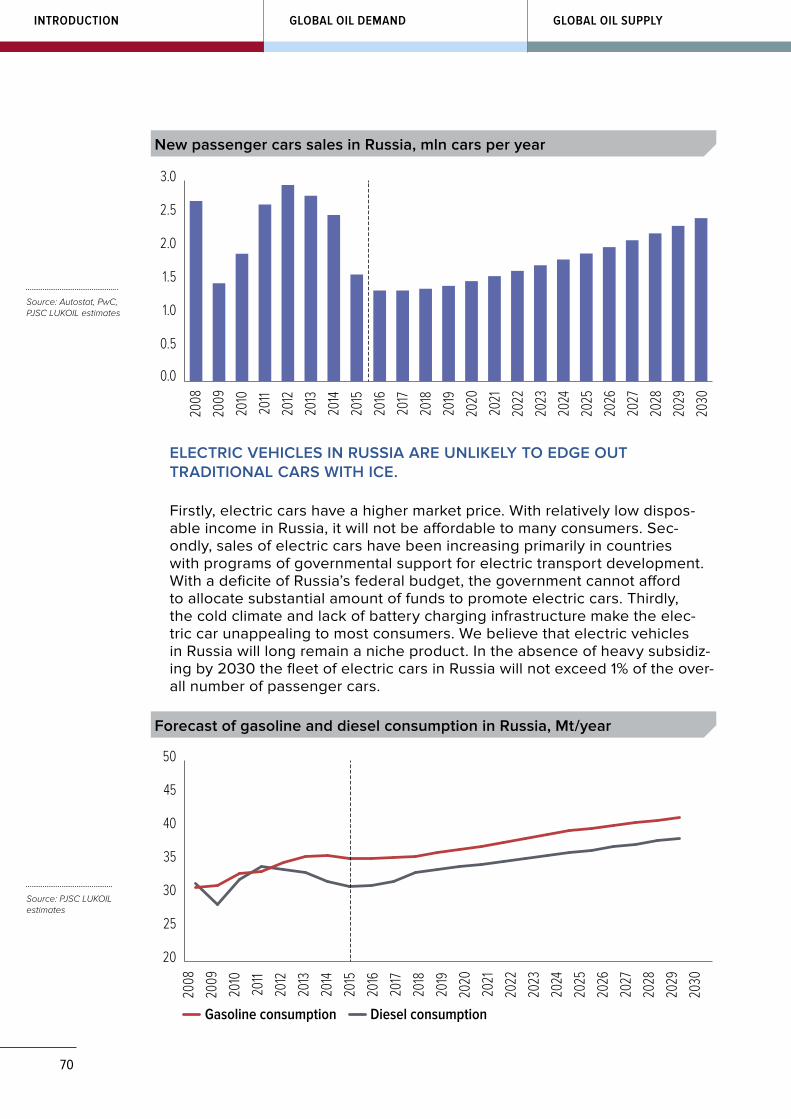
70
GLOBAL OIL SUPPLYGLOBAL OIL DEMANDINTRODUCTION
ELECTRIC VEHICLES IN RUSSIA ARE UNLIKELY TO EDGE OUT TRADITIONAL CARS WITH ICE.
Firstly, electric cars have a higher market price. With relatively low dispos-able income in Russia, it will not be affordable to many consumers. Sec-ondly, sales of electric cars have been increasing primarily in countries with programs of governmental support for electric transport development. With a deficite of Russia’s federal budget, the government cannot afford to allocate substantial amount of funds to promote electric cars. Thirdly, the cold climate and lack of battery charging infrastructure make the elec-tric car unappealing to most consumers. We believe that electric vehicles in Russia will long remain a niche product. In the absence of heavy subsidiz-ing by 2030 the fleet of electric cars in Russia will not exceed 1% of the over-all number of passenger cars.
New passenger cars sales in Russia, mln cars per year
2023
2022
2021
2020
2019
2018
2017
2016
2015
2014
2013
2012
2011
2010
2009
2008
2030
2029
2028
2027
2026
2025
2024
0.0
0.5
1.0
1.5
2.0
2.5
3.0
Source: Autostat, PwC, PJSC LUKOIL estimates
2023
2022
2021
2020
2019
2018
2017
2016
2015
2014
2013
2012
2011
2010
2009
2008
2030
2029
2028
2027
2026
2025
2024
Gasoline consumption Diesel consumption
20
25
30
35
40
45
50
Forecast of gasoline and diesel consumption in Russia, Mt/year
Source: PJSC LUKOIL estimates

71
RUSSIAN OIL INDUSTRYIN THE SEARCH OF EQUILIBRIUM GLOBAL OIL REFINING
The base-case scenario assumes that the Russian economy will gradually get on the path to recovery. This will help to improve the sales of new cars and commercial traffic.
AS THE RUSSIAN ECONOMY RECOVERS, MOTOR FUEL CONSUMPTION WILL RISE AGAIN.
We also presume that the government’s effort to combat counterfeit products by imposing excise duties on middle distillates will favorably impact consump-tion of high-quality diesel fuel. This makes it likely that in the years to come consumption of high-quality diesel fuel will grow faster than that of gasoline.
OIL REFINING TAXATION
A common characteristic of the Russian refineries is the high cost of exports of petroleum products, since they are located long distances from the main export market. Unlike oil, petroleum products are generally delivered to the port of shipment by rail, which is more costly than via pipeline. The sys-tem of taxation of the oil refining introduced in the early 2000s allows for a "customs subsidy", which represents the difference between export du-ties on crude and petroleum products (export duties on petroleum products are lower than those on crude). The "customs subsidy" for a long time helped make up for the adverse impact of logistics on the economics of the Rus-sian refineries and contributed to a relatively high profitability of the oil refin-ing. Up until recently the Russian refineries were able to compete quite easi-ly against European refineries and demonstrate high profitability, even despite the overproduction crisis that has been depressing the European refining in-dustry since 2008. Even simple refineries turned out to be quite competi-tive. The result was that Russian crude runs substantially expanded, reaching 289 mln tons in 2014.
High "customs subsidy" are intended to ensure an inflow of investments to up-grade the oil refining industry. Another impetus to investments was the deci-sion to level export duties on heavy oil products and crude, which is supposed to make things more complicated for simple refining. The levelling of duties was initially scheduled for 2015, but the industry turned out not to be ready, so the implementation was put off until 2017.
2015 saw considerable changes in oil refining taxation. As long as the formu-las of export duties on oil and petroleum products are linked to the oil prices, cheaper oil prices reduce the "customs subsidy". Our estimate is that the "cus-toms subsidy" for a reference FCC refinery located in European part of Russia decreased threefold in 2015 and barely covers the transportation costs.
The "customs subsidy" may shrink in the foreseeable future regardless of changes in oil price. There have been proposals to remove export duties on oil and petroleum products altogether. However this appears rather risky: traditionally it is the output of gasoline that is the bottleneck of the Russian oil refining.
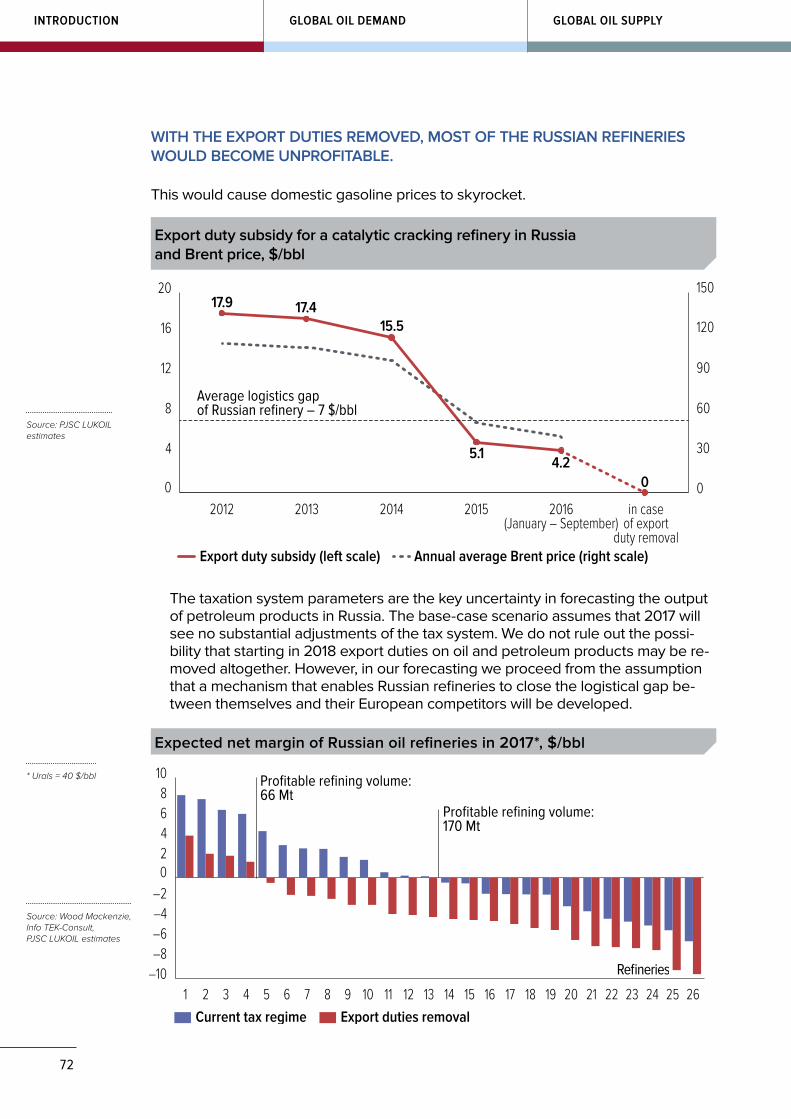
72
GLOBAL OIL SUPPLYGLOBAL OIL DEMANDINTRODUCTION
WITH THE EXPORT DUTIES REMOVED, MOST OF THE RUSSIAN REFINERIES WOULD BECOME UNPROFITABLE.
This would cause domestic gasoline prices to skyrocket.
Average logistics gapof Russian refinery – 7 $/bbl
0
30
60
90
120
150
Export duty subsidy (left scale) Annual average Brent price (right scale)
0
4
8
12
16
20
in caseof export
duty removal
2016(January – September)
2015201420132012
17.9 17.415.5
5.14.2
0
Source: PJSC LUKOIL estimates
Export duty subsidy for a catalytic cracking refinery in Russia and Brent price, $/bbl
Current tax regime Export duties removal
Profitable refining volume:170 Mt
Profitable refining volume: 66 Mt
–10–8–6–4–2
02468
10
2625242322212019181716151413121110987654321
Refineries
Expected net margin of Russian oil refineries in 2017*, $/bbl
Source: Wood Mackenzie, Info TEK-Consult, PJSC LUKOIL estimates
* Urals = 40 $/bbl
The taxation system parameters are the key uncertainty in forecasting the output of petroleum products in Russia. The base-case scenario assumes that 2017 will see no substantial adjustments of the tax system. We do not rule out the possi-bility that starting in 2018 export duties on oil and petroleum products may be re-moved altogether. However, in our forecasting we proceed from the assumption that a mechanism that enables Russian refineries to close the logistical gap be-tween themselves and their European competitors will be developed.
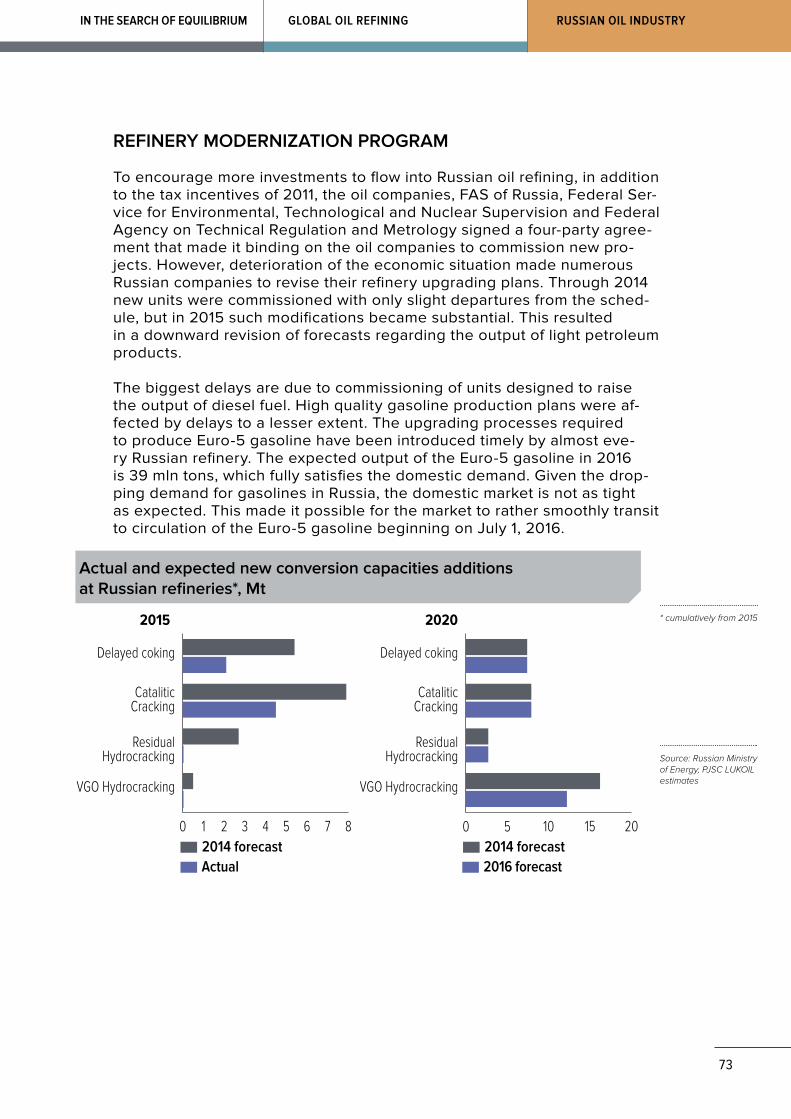
73
RUSSIAN OIL INDUSTRYIN THE SEARCH OF EQUILIBRIUM GLOBAL OIL REFINING
REFINERY MODERNIZATION PROGRAM
To encourage more investments to flow into Russian oil refining, in addition to the tax incentives of 2011, the oil companies, FAS of Russia, Federal Ser-vice for Environmental, Technological and Nuclear Supervision and Federal Agency on Technical Regulation and Metrology signed a four-party agree-ment that made it binding on the oil companies to commission new pro-jects. However, deterioration of the economic situation made numerous Russian companies to revise their refinery upgrading plans. Through 2014 new units were commissioned with only slight departures from the sched-ule, but in 2015 such modifications became substantial. This resulted in a downward revision of forecasts regarding the output of light petroleum products.
The biggest delays are due to commissioning of units designed to raise the output of diesel fuel. High quality gasoline production plans were af-fected by delays to a lesser extent. The upgrading processes required to produce Euro-5 gasoline have been introduced timely by almost eve-ry Russian refinery. The expected output of the Euro-5 gasoline in 2016 is 39 mln tons, which fully satisfies the domestic demand. Given the drop-ping demand for gasolines in Russia, the domestic market is not as tight as expected. This made it possible for the market to rather smoothly transit to circulation of the Euro-5 gasoline beginning on July 1, 2016.
2015 2020
2014 forecastActual
0 1 2 3 4 5 6 7 8
VGO Hydrocracking
ResidualHydrocracking
CataliticCracking
Delayed coking
2014 forecast2016 forecast
0 5 10 15 20
VGO Hydrocracking
ResidualHydrocracking
CataliticCracking
Delayed coking
Actual and expected new conversion capacities additions at Russian refineries*, Mt
Source: Russian Ministry of Energy, PJSC LUKOIL estimates
* cumulatively from 2015
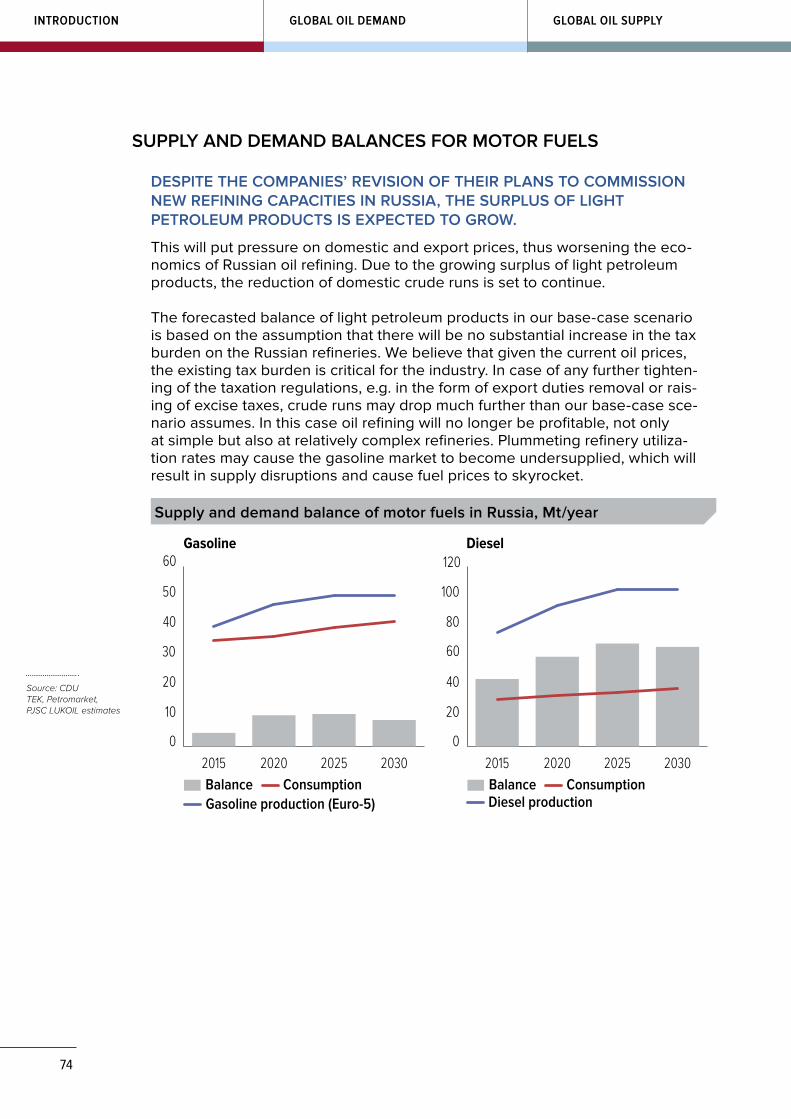
74
GLOBAL OIL SUPPLYGLOBAL OIL DEMANDINTRODUCTION
SUPPLY AND DEMAND BALANCES FOR MOTOR FUELS
DESPITE THE COMPANIES’ REVISION OF THEIR PLANS TO COMMISSION NEW REFINING CAPACITIES IN RUSSIA, THE SURPLUS OF LIGHT PETROLEUM PRODUCTS IS EXPECTED TO GROW.
This will put pressure on domestic and export prices, thus worsening the eco-nomics of Russian oil refining. Due to the growing surplus of light petroleum products, the reduction of domestic crude runs is set to continue.
The forecasted balance of light petroleum products in our base-case scenario is based on the assumption that there will be no substantial increase in the tax burden on the Russian refineries. We believe that given the current oil prices, the existing tax burden is critical for the industry. In case of any further tighten-ing of the taxation regulations, e.g. in the form of export duties removal or rais-ing of excise taxes, crude runs may drop much further than our base-case sce-nario assumes. In this case oil refining will no longer be profitable, not only at simple but also at relatively complex refineries. Plummeting refinery utiliza-tion rates may cause the gasoline market to become undersupplied, which will result in supply disruptions and cause fuel prices to skyrocket.
Gasoline Diesel
Consumption Gasoline production (Euro-5)Balance
0
10
20
30
40
50
60
2030202520202015Consumption
Diesel productionBalance
0
20
40
60
80
100
120
2030202520202015
Supply and demand balance of motor fuels in Russia, Mt/year
Source: CDU TEK, Petromarket, PJSC LUKOIL estimates
75
COMPARISON WITH PREVIOUS FORECASTS
Any forecast is based on certain premises and assumptions. Over the three years that have elapsed since the previous report came out, the oil market has changed drastically, which has made us to reconsider many of our for-mer judgments and assumptions.
There hasn't been any material revision of the forecasted oil demand. We still believe that such trends as urbanization and middle class expansion ex-perienced by the developing countries will continue to be the key drivers of oil demand growth. A slight difference in the estimates is due to the fact that the effect produced by the climate policy and more extensive use of electric cars will, in our opinion, become noticeable only after 2025.
In the meantime, we’ve revised our forecast of oil prices, since we've ad-justed a number of key assumptions used in the preparation of the old fore-cast. Firstly, we’ve raised our forecast of potential shale oil production growth in the U.S. Secondly, we adjusted the assumption regarding OPEC’s readiness to act as the market regulator and curtail production to maintain the prices. Thirdly, we made changes to our forecast of the USD exchange rate. While previously we proceeded from the assumption that the U.S. dol-lar will remain relatively weak in the forecasted period, now due to changes in the global economy we expect the U.S. currency to be stronger.
ANNEX
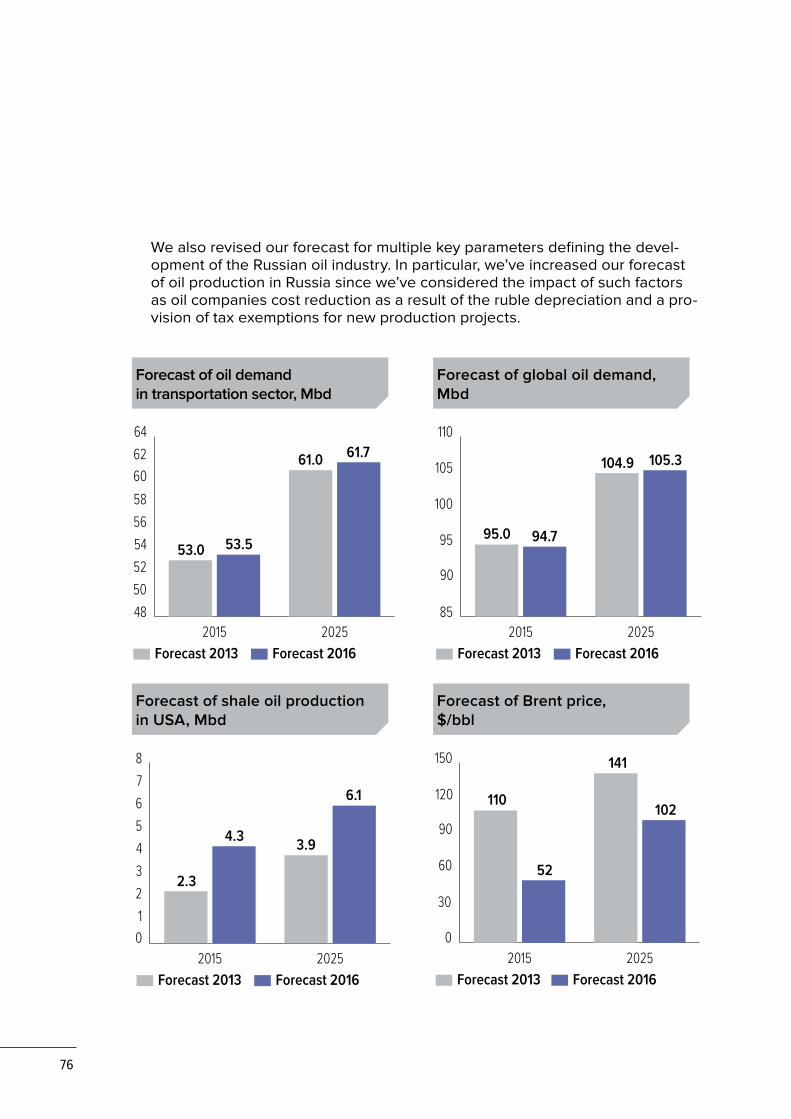
76
We also revised our forecast for multiple key parameters defining the devel-opment of the Russian oil industry. In particular, we’ve increased our forecast of oil production in Russia since we’ve considered the impact of such factors as oil companies cost reduction as a result of the ruble depreciation and a pro-vision of tax exemptions for new production projects.
Forecast 2013 Forecast 2016
48
50
52
54
56
58
6062
64
20252015
53.0 53.5
61.0 61.7
Forecast of oil demand in transportation sector, Mbd
Forecast 2013 Forecast 2016
85
90
95
100
105
110
20252015
95.0 94.7
104.9 105.3
Forecast of global oil demand, Mbd
Forecast 2013 Forecast 2016
01
2
3
4
5
6
7
8
20252015
2.3
4.3 3.9
6.1
Forecast of shale oil production in USA, Mbd
Forecast 2013 Forecast 2016
0
30
60
90
120
150
20252015
110
52
141
102
Forecast of Brent price, $/bbl
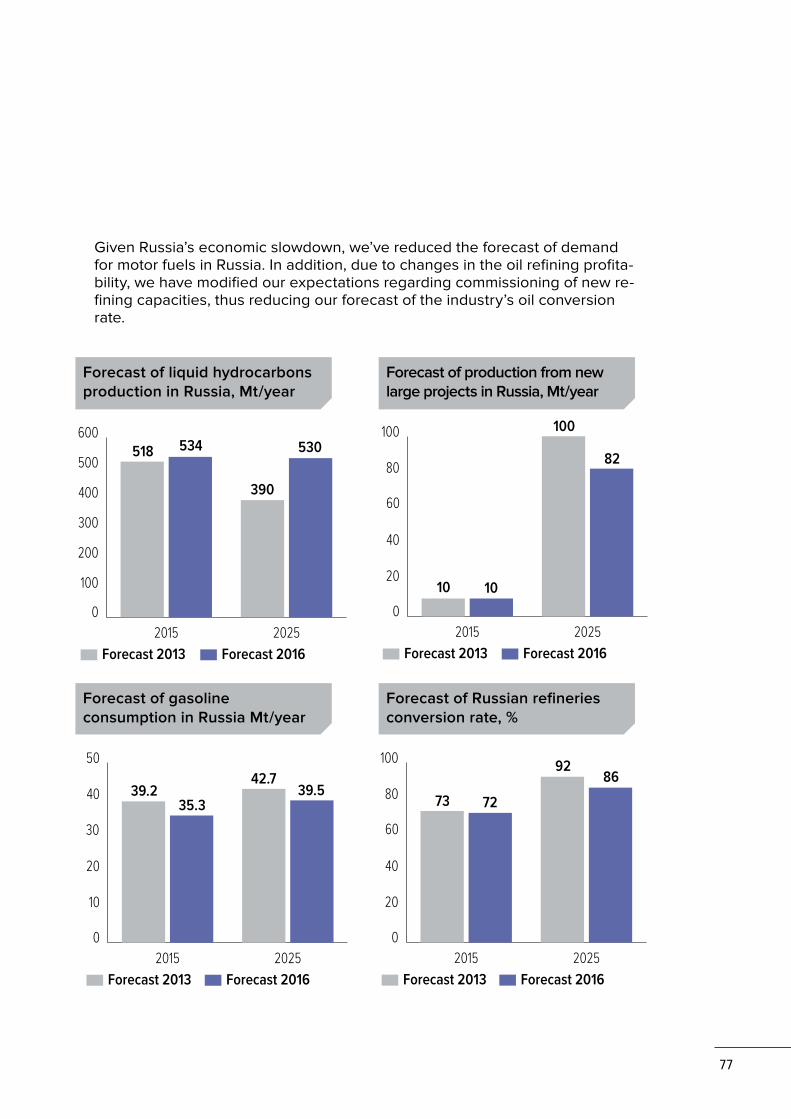
77
Forecast 2013 Forecast 2016
0
100
200
300
400
500
600
20252015
518 534
390
530
Forecast of liquid hydrocarbons production in Russia, Mt/year
Forecast 2013 Forecast 2016
0
20
40
60
80
100
20252015
10 10
100
82
Forecast of production from new large projects in Russia, Mt/year
Forecast 2013 Forecast 2016
0
10
20
30
40
50
20252015
39.235.3
42.739.5
Forecast of gasoline consumption in Russia Mt/year
Forecast 2013 Forecast 2016
0
20
40
60
80
100
20252015
73 72
9286
Forecast of Russian refineries conversion rate, %
Given Russia’s economic slowdown, we’ve reduced the forecast of demand for motor fuels in Russia. In addition, due to changes in the oil refining profita-bility, we have modified our expectations regarding commissioning of new re-fining capacities, thus reducing our forecast of the industry’s oil conversion rate.

78
SOURCES
1. Euromoney Institutional Investor Company (EMIS), Automotive Sector India, London, United Kingdom, March 2015
2. International Council on Clean Transportation (ICCT), Driving electrification: a global comparison of fiscal incentive policy for electric vehicles, Washington, USA, May 2014
3. International Council on Clean Transportation (ICCT), From laboratory to road, A 2015 update of official and "real-world" fuel consumption and СО2 values for passenger cars in Europe, Berlin, Germany, September 2015
4. International Council on Clean Transportation (ICCT), Oil Market Futures, A report for the European Climate Foundation, Cambridge, United Kingdom, April 2016
5. International Energy Agency, CO2 Emissions from Fuel Combustion, Paris, France, 2015
6. International Energy Agency, Global EV Outlook 2016: Beyond one million electric cars, Paris, France, 2016
7. International Energy Agency, Medium-Term Market Report 2016, Market Analysis and Forecasts to 2021, Paris, France, 2016
8. International Energy Agency, Technology and policy drivers of the fuel economy of new light-duty vehicles. Comparative analysis across elected automotive markets, Paris, France, 2016
9. International Energy Agency, Technology Roadmap: Fuel Economy of Road Vehicles, Paris, France, 2012
10. International Energy Agency, World Energy Outlook 2015, Paris, France, 2015
11. OECD International Transport Forum, Transport Outlook: Seamless Transport for Greener Growth, 2012
12. Organization of the Petroleum Exporting Countries, World Oil Outlook 2015, Vienna, Austria, October 2015
13. United Nations, Department of Economic and Social Affairs, Population Division. World Population Prospects: The 2015 Revision, New York, United States, 2015
14. United Nations, Department of Economic and Social Affairs, Population Division. World Population Prospects: The 2014 Revision, New York, United States, 2014
15. VYGON-Consulting, Russian Oil Industry: 2015 Results and Outlook for 2016-2017, Moscow, May, 2016
16. VYGON-Consulting, EV vs ICE vehicles: When to Expect Robust Competition? Moscow, March 2016
17. SKOLKOVO Business School Energy Centre, Electric Car: "Toy For the Rich" or Revolution in Oil Consumption? Moscow, May 2014
Related Documents