Initiating Coverage FC Research Analyst: Amanda Lokugamage SRI LANKA ROYAL CERAMICS LANKA PLC STRONG BUY RCL.N0000 Sep 2016 “Glazed Performance” Current Price: LKR 120.5 Fair Value: LKR 200.0 Royal Ceramic Lanka PLC, leader in high quality surface covering and bath- ware in Sri Lanka with subsidiaries providing a diversified product portfolio. RCL’s earnings is expected to grow at a CAGR of c.13% FY16-FY19E surpassing c.LKR 4.0Bn in FY18E and c.LKR 4.3Bn in FY19E. RCL is expected to grow its earnings mainly driven by the incline in its revenue streams coupled with the efficient management of operational costs. FC Research expect RCL to provide a return of 82% at LKR 200.0. STRONG BUY Construction sector boom driven revenue: RCL’s revenue is expected to grow at a c.CAGR of 14% over FY16-19E to reach c.LKR 36.9Bn in FY18E as opposed to LKR 24.9Bn registered in FY16 on the back of the growth in the construction sector primarily driven by the increased demand for housing and residential property led by rising urbanization and the boom in the tourism industry deriving from the increase in the number of tourist arrivals result in an increased demand for tourist accommodation. Increased volumes to Improve Margins and Earnings: Economies of scale deriving from increased volumes coupled with comparatively lower commodity prices to reduce the overall cost of sales thus record it at c.LKR 20.0Bn in FY18E with a CAGR of 14% over FY16-FY18E leading to an increase in RCL earnings to c.LKR 4.3Bn (CAGR of 17% over FY16-FY18E) while improving GP, EBIT and NP margins in FY18E to 39%, 21% and 12% respectively. RCL to provide 82% return over 18-months period: FC Research expect RCL to achieve a fair value of LKR 200.0 providing a total return of 82% (Dividend yield 16%) over 18-month period. [DCF based LKR 141.2 and PER based LKR 253.1] Risks associated: Given the nature of the business model of the company RCL is exposed to the risk resulting from the fluctuations in exchange rates and the changes in the government policies. Figure 1: RCL Price Volume Graph Disclosure on Shareholding: First Capital Group and its affiliates holds 246,842 shares in RCL. Neither First Capital Group nor its affiliates have traded in the shares in the three trading days prior to this document, and will not trade in the shares for three trading days following the issue of this document. P/E 31 March FY15 FY16 FY17E FY18E FY19E Revenue (LKR Mn) 22,379 24,905 27,130 32,623 36,902 Net Profit (LKR Mn) 2,135 2,934 3,093 4,006 4,285 EPS (LKR) 19.3 26.5 27.9 36.2 38.7 YoY % Growth 132% 37% 5% 30% 7% Valuations PER (X) 6.3 4.5 4.3 3.3 3.1 PBV (X) 1.1 0.9 0.8 0.7 0.6 Dividend Yield (%) 4.1% 6.6% 7.0% 9.0% 9.6% NAVPS 107.2 132.1 151.6 176.9 204.0 DPS (LKR) 5.0 8.0 8.4 10.8 11.6 Payout Ratio 26% 30% 30% 30% 30% KEY DATA Share Price (LKR) Average Daily Volume (Shares) 42,792 Average Daily Turnover 4,907,740 110.8 13,350 Price Performance (%) 1 mth 3 mths 12mths RCL -2.6% 4.2% -0.8% ASPI -2.5% 2.3% -9.3% 51.0% 13.8% 3.2% 2.5% 1.8% Market Capitalisation (LKR mn) 120.50 52w High/Low (LKR) 97.0/125.0 Issued Share Capital (Shares mn) Public Holdings 47.5% Major Shareholders as at 30th June 2016 Vallibel One PLC Employee Provident Fund HSBC Intl Nom Ltd - BBH- Grandeur Peak Emerging Mkts Sri Lanka Insurance Corporation Ltd - General Fund Employee Trust Fund Board

Welcome message from author
This document is posted to help you gain knowledge. Please leave a comment to let me know what you think about it! Share it to your friends and learn new things together.
Transcript
Initiating Coverage
FC Research Analyst: Amanda Lokugamage
SRI LANKA
ROYAL CERAMICS LANKA PLC STRONG BUY
RCL.N0000 Sep 2016
“Glazed Performance”
Current Price: LKR 120.5 Fair Value: LKR 200.0
Royal Ceramic Lanka PLC, leader in high quality surface covering and bath-
ware in Sri Lanka with subsidiaries providing a diversified product portfolio.
RCL’s earnings is expected to grow at a CAGR of c.13% FY16-FY19E surpassing
c.LKR 4.0Bn in FY18E and c.LKR 4.3Bn in FY19E. RCL is expected to grow its
earnings mainly driven by the incline in its revenue streams coupled with the
efficient management of operational costs. FC Research expect RCL to provide
a return of 82% at LKR 200.0. STRONG BUY
Construction sector boom driven revenue: RCL’s revenue is expected to grow
at a c.CAGR of 14% over FY16-19E to reach c.LKR 36.9Bn in FY18E as opposed to
LKR 24.9Bn registered in FY16 on the back of the growth in the construction
sector primarily driven by the increased demand for housing and residential
property led by rising urbanization and the boom in the tourism industry
deriving from the increase in the number of tourist arrivals result in an increased
demand for tourist accommodation.
Increased volumes to Improve Margins and Earnings: Economies of scale
deriving from increased volumes coupled with comparatively lower commodity
prices to reduce the overall cost of sales thus record it at c.LKR 20.0Bn in FY18E
with a CAGR of 14% over FY16-FY18E leading to an increase in RCL earnings to
c.LKR 4.3Bn (CAGR of 17% over FY16-FY18E) while improving GP, EBIT and NP
margins in FY18E to 39%, 21% and 12% respectively.
RCL to provide 82% return over 18-months period: FC Research expect RCL to
achieve a fair value of LKR 200.0 providing a total return of 82% (Dividend yield
16%) over 18-month period. [DCF based LKR 141.2 and PER based LKR 253.1]
Risks associated: Given the nature of the business model of the company RCL
is exposed to the risk resulting from the fluctuations in exchange rates and the
changes in the government policies.
Figure 1: RCL Price Volume Graph
Disclosure on Shareholding:
First Capital Group and its affiliates holds 246,842
shares in RCL. Neither First Capital Group nor its
affiliates have traded in the shares in the three
trading days prior to this document, and will not
trade in the shares for three trading days following
the issue of this document.
P/E 31 March FY15 FY16 FY17E FY18E FY19E
Revenue (LKR Mn) 22,379 24,905 27,130 32,623 36,902
Net Profit (LKR Mn) 2,135 2,934 3,093 4,006 4,285
EPS (LKR) 19.3 26.5 27.9 36.2 38.7
YoY % Growth 132% 37% 5% 30% 7%
Valuations
PER (X) 6.3 4.5 4.3 3.3 3.1
PBV (X) 1.1 0.9 0.8 0.7 0.6
Dividend Yield (%) 4.1% 6.6% 7.0% 9.0% 9.6%
NAVPS 107.2 132.1 151.6 176.9 204.0
DPS (LKR) 5.0 8.0 8.4 10.8 11.6
Payout Ratio 26% 30% 30% 30% 30%
KEY DATA
Share Price (LKR)
Average Daily Volume (Shares) 42,792
Average Daily Turnover 4,907,740
110.8
13,350
Price Performance (%) 1 mth 3 mths 12mths
RCL -2.6% 4.2% -0.8%
ASPI -2.5% 2.3% -9.3%
51.0%
13.8%
3.2%
2.5%
1.8%
Market Capitalisation (LKR mn)
120.50
52w High/Low (LKR) 97.0/125.0
Issued Share Capital (Shares mn)
Public Holdings 47.5%
Major Shareholders as at 30th June 2016
Vallibel One PLC
Employee Provident Fund
HSBC Intl Nom Ltd - BBH- Grandeur Peak Emerging Mkts
Sri Lanka Insurance Corporation Ltd - General Fund
Employee Trust Fund Board

FC Research
2
“Glazed Performance”
1.1 Introduction
Monopoly power of the tile sector: RCL, established in 1990, engages in manufacturing and sale of floor tiles, wall tiles and other ceramic products while having diversified into financial services and plantations. Through a series of acquisitions, the company presently holds the monopoly position in the tile sector, controlling c.60%-70% of the tile market. Operational and segmental review: RCL markets its tiles at a premium price under the brand name “Rocell” through a network of over 50 showrooms and 450 dealers island wide. The ISO 9001:2008 certified company operates two factories in Horana and Eheliyagoda, with capacities of 11,000 and 6,000 square meters of tiles per day respectively. In FY16 company generated 6% of its revenue from exports to Europe, North America, Australia and several parts of Asia. Royal ceramics employs c.10,000 employees and has a market capitalization of LKR 14Bn. SWOT analysis:
Strengths Monopoly power Brand equity
Opportunities Boost in the construction sector Better technology
Weaknesses Heavily concentrated on tile
and construction sector related products
Threats Possible delays in government
lead construction drive Competition from imports
RCL’s price has moved in line with ASPI. The downward trend in the share price during Sep 2015 – Mar 2016 reflects the overall slowdown in the market owing to the investors’ wait-and-see approach prior to the important government policies are accounted. Post Mar 2016, along with the recommencing of the major construction projects, the share has started to gain ground which we expect to continue.
4,500
5,000
5,500
6,000
6,500
7,000
7,500
80
90
100
110
120
130
140
150
160
RCL (LHS) ASPI (RHS)
67%
9%
6%
10%
7% 1%
Tiles and associated products Aluminium Products
Sanitaryware Packaging Material
Plantation Paints and other
Figure 2: Revenue sources of RCL
Source: Company Annual Reports
Figure 3: ASPI vs RCL

FC Research
3
“Glazed Performance”
1.3 Tile sector overview
Tile sector: Sri Lanka provides evidence for richly crafted ceramics dating back several centuries. The country is gifted with natural mineral deposits such as kaolin, ball clay, feldspar, silica quartz and dolomite which is a major factor strengthening the local manufacturing of tiles. Skilled workforce is abundant at a competitive labor cost. The locally manufactured tiles are reputed for its superior quality and is sold at a premium price, catering the upper end of the market. Tiles (floor tiles and wall tiles) are featured in several varieties such as glazed vs. unglazed and ceramic vs. porcelain. Import and export performance: The locally manufactured tiles account for c.60%-70% while imported tiles comprise c.30%-40% of the market. The imported tiles are primarily coming from India and China and is subject to CESS and other import taxes. Sri Lanka exports its locally manufactured tiles to United States, Australia, Canada, Japan, UK and several other European countries.
Monopoly lead by Royal Ceramics: The local tile manufacturing is dominated by the cluster of companies lead by Royal ceramics (Figure 2). They have the majority of market share in both wall tiles as well as floor tiles (Figure 4).
100
300
500
700
900
1,100
1,300
2011 2012 2013 2014 2015
LKR
-M
n
Source: Royal Ceramics Annual Report Note: Non-ceramic businesses are excluded
Figure 6: Monopoly lead by RCL
Figure 4: Manufactured Vs. imported
Locally manufactured Imported
60% - 70%
30% - 40%
Figure 5: Export performance
Source: Central Bank of Sri Lanka
Royal Ceramics PLC (RCL.N0000)
Lanka Ceramic PLC (CERA) (77%)
Lanka Walltiles PLC (LWL)
(62%)
Lanka Tiles PLC (TILE)
(68%)
Royal Porcelain (Pvt) Ltd) (100%)
Rocell Bathware Ltd (61%)
Rocell (Pty) Ltd (100%)
Swissteck Ceylon PLC (PARQ)
Source: Company Annual Report, FC Research Estimates

FC Research
4
“Glazed Performance”
Major tile manufacturers in the consortium other than RCL
Lanka Walltiles PLC (LWL): LWL is a subsidiary of RCL and produces wall tiles for more economic users. LWL has a production capacity of c.2.3Mn square meters per annum. The ISO 13006 certified company employs c.500 employees and has a market capitalization of LKR 6Bn.
Lanka Tiles PLC (TILE.N0000): TILE caters the floor tile segment and has a capacity of c.3Mn square meters of tile per annum. TILE employs c.500 employees and has a market capitalization of LKR 6Bn.
63%56%
37%44%
0%
10%
20%
30%
40%
50%
60%
70%
80%
90%
100%
RCL Group Other
Figure 7: Market shares in wall tiles and floor tiles
40%
23%
Source: Company Annual Report
-
1,000
2,000
3,000
4,000
5,000
6,000
Revenue Net profit
Figure 8: Company revenues and profits
Source: Company Annual Reports

FC Research
5
“Glazed Performance”
2.0 Construction sector boom driven revenue
A
Revenue to grow by 20%: RCL’s revenue is expected to grow at a CAGR of
c.14% over FY16-19E to reach c.LKR 36.9Bn in FY19E on the back of increased
demand resultant to the boom witness in the construction sector. Tiles and
associated products coupled with sanitary-ware is expected to generate
c.LKR 20.3Bn to contribute c.75% while Aluminium products segment is
expected to generate c.LKR 2.7Bn contributing c.10% of RCL’s total revenue
in FY17E primarily driven by the increased volumes created by the improved
demand.
2.1 Construction sector boom driven volume
All segments to boost demand: A boom in all segments of the construction
sector namely government led mega infrastructure development projects,
sky scrapers, mega hotel and tourism accommodation projects, residential
property and condominium apartment projects, integrated projects, etc.
coupled with the boom in the real estate segment have collectively
contributed to the increase in demand for building materials (e.g.: cement,
cables, floor tiles, wall tiles, sanitary-ware and aluminium products, etc…)
which in turn result in an increase in volumes for RCL which has a diversified
product portfolio through its subsidiary/ associate companies consisting of
floor tiles, wall tiles, sanitary-ware and aluminium products.
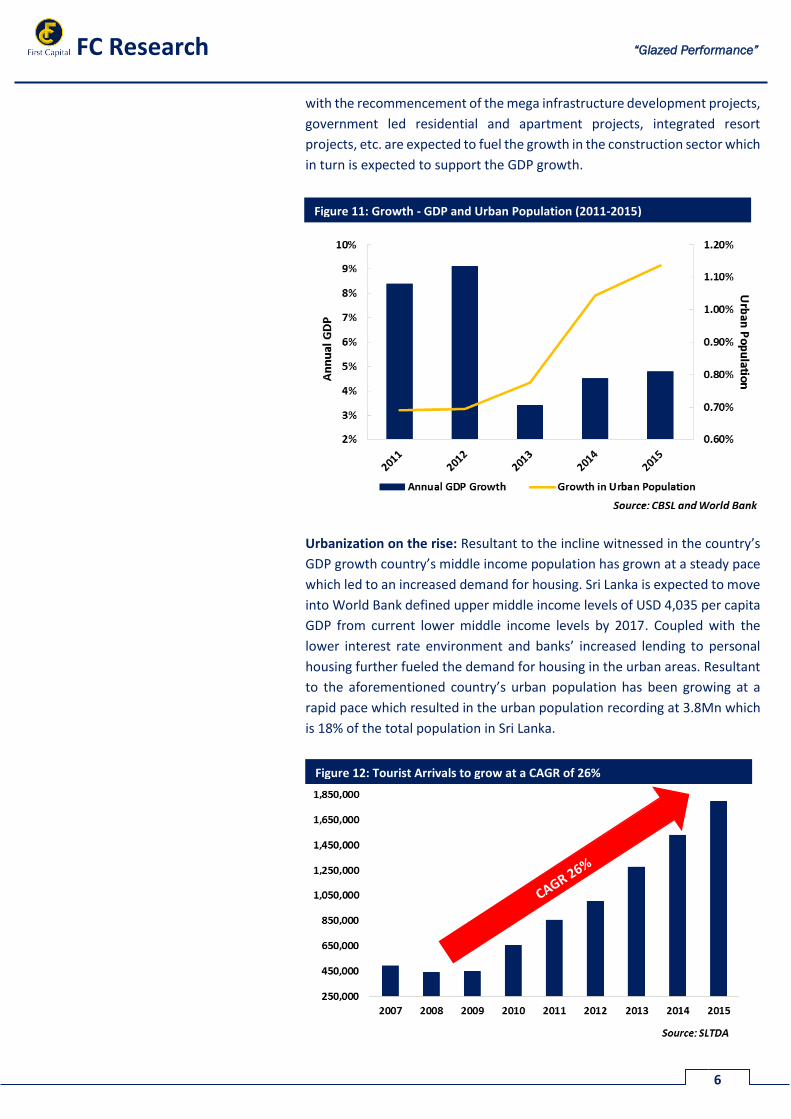
GDP growth supported by Construction: Country’s GDP registered a YoY
growth of 4.5% and 4.8% in 2014 and 2015 respectively while the same is
expected to record a growth of c. 5.5% and c. 6.3% in 2016E and 2017E
respectively where the contribution from construction sector was recorded
at 7.5% and 7.4% in 2014 and 2015 primarily driven by the government’s
heavy investment into mega infrastructure development projects. Currently
Figure 9: Revenue Growth
Figure 10: Construction as a % of GDP
0%
5%
10%
15%
20%
25%
-
5,000
10,000
15,000
20,000
25,000
30,000
35,000
40,000
Re
ven
ue
Gro
wth
(Yo
Y)R
eve
nu
e -
LKR
(M
n)
Revenue Growth (YoY)
Source: Company Annual Reports and FC Research Estimates
FC Research
6
“Glazed Performance”
with the recommencement of the mega infrastructure development projects,
government led residential and apartment projects, integrated resort
projects, etc. are expected to fuel the growth in the construction sector which
in turn is expected to support the GDP growth.
Urbanization on the rise: Resultant to the incline witnessed in the country’s
GDP growth country’s middle income population has grown at a steady pace
which led to an increased demand for housing. Sri Lanka is expected to move
into World Bank defined upper middle income levels of USD 4,035 per capita
GDP from current lower middle income levels by 2017. Coupled with the
lower interest rate environment and banks’ increased lending to personal
housing further fueled the demand for housing in the urban areas. Resultant
to the aforementioned country’s urban population has been growing at a
rapid pace which resulted in the urban population recording at 3.8Mn which
is 18% of the total population in Sri Lanka.
Figure 11: Growth - GDP and Urban Population (2011-2015)
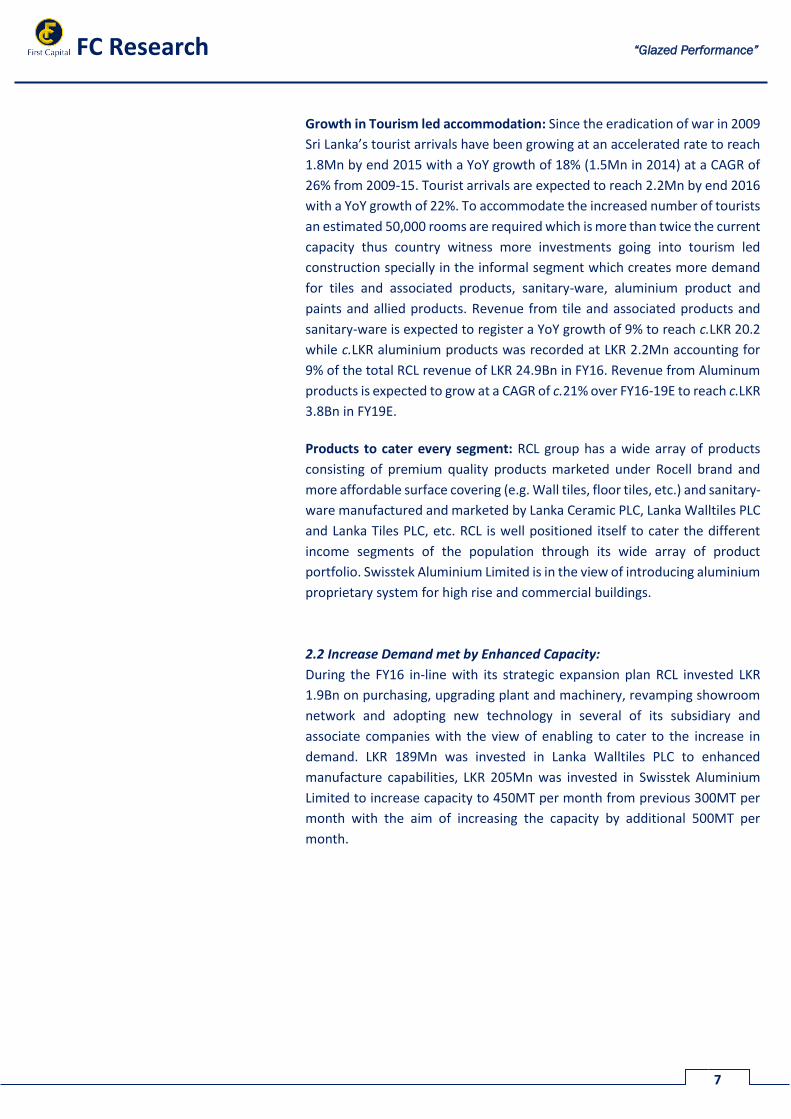
Figure 12: Tourist Arrivals to grow at a CAGR of 26%
FC Research
7
“Glazed Performance”
Growth in Tourism led accommodation: Since the eradication of war in 2009
Sri Lanka’s tourist arrivals have been growing at an accelerated rate to reach
1.8Mn by end 2015 with a YoY growth of 18% (1.5Mn in 2014) at a CAGR of
26% from 2009-15. Tourist arrivals are expected to reach 2.2Mn by end 2016
with a YoY growth of 22%. To accommodate the increased number of tourists
an estimated 50,000 rooms are required which is more than twice the current
capacity thus country witness more investments going into tourism led
construction specially in the informal segment which creates more demand
for tiles and associated products, sanitary-ware, aluminium product and
paints and allied products. Revenue from tile and associated products and
sanitary-ware is expected to register a YoY growth of 9% to reach c.LKR 20.2
while c.LKR aluminium products was recorded at LKR 2.2Mn accounting for
9% of the total RCL revenue of LKR 24.9Bn in FY16. Revenue from Aluminum
products is expected to grow at a CAGR of c.21% over FY16-19E to reach c.LKR
3.8Bn in FY19E.
Products to cater every segment: RCL group has a wide array of products
consisting of premium quality products marketed under Rocell brand and
more affordable surface covering (e.g. Wall tiles, floor tiles, etc.) and sanitary-
ware manufactured and marketed by Lanka Ceramic PLC, Lanka Walltiles PLC
and Lanka Tiles PLC, etc. RCL is well positioned itself to cater the different
income segments of the population through its wide array of product
portfolio. Swisstek Aluminium Limited is in the view of introducing aluminium
proprietary system for high rise and commercial buildings.
2.2 Increase Demand met by Enhanced Capacity:
During the FY16 in-line with its strategic expansion plan RCL invested LKR
1.9Bn on purchasing, upgrading plant and machinery, revamping showroom
network and adopting new technology in several of its subsidiary and
associate companies with the view of enabling to cater to the increase in
demand. LKR 189Mn was invested in Lanka Walltiles PLC to enhanced
manufacture capabilities, LKR 205Mn was invested in Swisstek Aluminium
Limited to increase capacity to 450MT per month from previous 300MT per
month with the aim of increasing the capacity by additional 500MT per
month.

FC Research
8
“Glazed Performance”
3.0 Increased volumes to Improve Margins and Earnings
RCL’s Earnings to improve: Economies of scale deriving from increased
volumes coupled with comparatively lower commodity prices to reduce the
overall cost of sales thus recording it at c.LKR 20.0Bn in FY18E with a CAGR of
14% over FY16-FY18E thus increasing RCL earnings to c.LKR 4.3Bn (CAGR of
17% over FY16-FY18E) while improving GP, EBIT and NP margins in FY18E to
39%, 21% and 12% respectively.
3.1 Economies of Scale through increased volumes: Adhering to the
strategic expansion plan RCL’s investment of LKR 1.9Bn during FY16 resulted
in increased capacity of RCL and its subsidiary and associate companies
which is expected to increase overall manufacture volumes enabling the
company to enjoy economies of scale leading to a reduction in cost of sales
to c.LKR 20.0Bn in FY18E with a CAGR of c. 10% over FY15-FY18E in
comparison to revenue of c.LKR 32.6Bn recorded in FY18E (CAGR of 13%
over FY15-FY18E) is expected to improve the bottom line while widening the
margins.
3.2 Access to raw material at lower cost: Basic raw materials used in RCL to
form the body of the tiles are Feldspar, Ball clay, Dolomite and Silica sand.
Most of these materials are used in their raw state, as mined. These
materials are generally homogenized to ensure consistency in composition.
RCL has invested in mining lands to ensure the access of raw material at
lower costs. RCL’s subsidiary Lanka Ceramics PLC is primarily focused onto
mining and processing of raw material for tiling and ceramic industry. During
FY16 company’s accumulated production was recorded at 68,000MT of raw
clay as the country’s largest supplier.
Further, company has secured steady supply of clay by investing in two
mining lands in Owala and Meetiyagoda for 7 years and 5 years respectively
while entering into an operating lease agreement with ball clay land owners
in Dediyawala.
Figure 13: Revenue, GP, EBIT and NP Margins (FY14-FY19E)
0%
5%
10%
15%
20%
25%
30%
35%
40%
45%
12,000
17,000
22,000
27,000
32,000
37,000
42,000
Revenue GP Margin EBIT Margin NP Margin
Source: Company Annual Reports and FC Research Estimates
Re
ven
ue
-LK
R (
Mn
)
Margin
s
FC Research
9
“Glazed Performance”
3.3 Better cost management strategies: RCL group in a bid to improve
accessibility to its products appointed new franchise dealers, upgrading
existing showrooms, revamping dealer network and strengthening its global
presence by opening 4 showrooms in Australia with the aim to expand into
Pakistan and Maldives. Company introduced lean management systems
along with investment into upgrading machinery resulted in cost savings of
LKR 12.0Mn during 4QFY16. Further, LKR 45Mn was invested in expansion
and LKR 12.0Mn was invested in a firewood boiler which is expected to bring
down the energy cost in Uni Dil Packaging Limited while company continued
to invest in the diversification of its plantation sector.

FC Research
10
“Glazed Performance”
4.0 RCL to provide 82% return
RCL Earnings CAGR of 13% FY16-18E: We expect a fair value of LKR 200.0
based on RCL’s earnings of c.LKR 4.3Bn in FY19E (CAGR of 13% over FY16-
19E). In FY18E RCL is expected to reach a net profit of LKR 4.0Bn, growing by
a CAGR of c.17% over FY16-18E. At the current price forward PER is expected
to be 7.0x by FY17E and FY18E.
4.1 RCL Total Return of 82%
Fair Value of LKR 200.0: Based on the company’s value as at March 2018 FC
Research expects a fair value of LKR 200.0 for RCL providing a total return of
82% at current price levels of LKR 120.5. The RCL target price of LKR 200.0 is
based on the average price of LKR 141.2 via DCF valuations and LKR 253.1 via
PER based. On an annualized basis RCL is expected to provide a return of 49%
with a fair value of LKR 200.0 at current price level of LKR 120.5.
Figure 14: Earnings to grow at a CAGR of 14% over FY16-FY19E
P/E 31 March FY15 FY16 FY17E FY18E FY19E
Revenue (LKR Mn) 22,379 24,905 27,130 32,623 36,902
Net Profit (LKR Mn) 2,135 2,934 3,093 4,006 4,285
EPS (LKR) 19.3 26.5 27.9 36.2 38.7
YoY % Growth 132% 37% 5% 30% 7%
Valuations
PER (X) 6.3 4.5 4.3 3.3 3.1
PBV (X) 1.1 0.9 0.8 0.7 0.6
Dividend Yield (%) 4.1% 6.6% 7.0% 9.0% 9.6%
NAVPS 107.2 132.1 151.6 176.9 204.0
DPS (LKR) 5.0 8.0 8.4 10.8 11.6
Payout Ratio 26% 30% 30% 30% 30%
15,000
20,000
25,000
30,000
35,000
40,000
FY16 FY17E FY18E FY19E
FY16 FY17E FY18E FY19E
Source: Company Annual Reports and FC Research Estimates

FC Research
11
“Glazed Performance”
FY17E: For FY17E we expect a fair value of LKR 170.0 for RCL based on average
price of LKR 154.3 via DCF valuations and LKR 195.4 via PER based valuations
providing a total return of 48% (capital gain 41% and dividend yield 7%) at
current market price of LKR 120.5.
Dividend Yield of 16%: FC Research expects a DPS of LKR 19.2 for FY18E
resulting in a dividend yield of 16% over a period of 18 months for RCL.
4.2 Discounted Cash flow Valuation
Expeceted RCL Price FY17E FY18E
DCF Valuations based Target Price 154.3 141.2
PER based Target Price 195.4 253.1
Average Target Price 174.8 197.2
Target Price (Rounded Up) 170.0 200.0
RCL
Return FY17E FY18E
Target Price 170.0 200.0
Current Price 120.5 120.5
Capital Gain (LKR) 49.5 79.5
Dividend(LKR) 8.4 19.2
Capital Gain % 41% 66%
Dividend Yield % 7% 16%
Total Return % 48% 82%
Annualised Return % 48% 49%
COE (Ke)
Rf 11%
Rm 18%
β 1.07
Ke=Rf m-Rf) 18%
Valuations FY17E FY18E
Enterprise Value 25,423 23,530
Debt (-) 10,522 10,464
Cash (+) 2,189 2,580
Total Value of Equity 17,090 15,647
No. of Shares 111 111
Value of Equity per Share 154 141
WACC
Ke 18%
Kd (1-t) 9%
D/E Assumption 40 /60
Terminal Growth (% ) 3%
WACC 14%
FY17E
154 12% 13% 14% 15% 16%
1% 127.4 127.4 127.4 127.4 127.4
2% 139.7 139.7 139.7 139.7 139.7
3% 154.3 154.3 154.3 154.3 154.3
4% 171.5 171.5 171.5 171.5 171.5
5% 192.5 192.5 192.5 192.5 192.5
WACC
Terminal
Growth
(%)
FY18E
141 12% 13% 14% 15% 16%
1% 114.4 114.4 114.4 114.4 114.4
2% 126.7 126.7 126.7 126.7 126.7
3% 141.2 141.2 141.2 141.2 141.2
4% 158.5 158.5 158.5 158.5 158.5
5% 179.4 179.4 179.4 179.4 179.4
WACC
Terminal
Growth
(%)

FC Research
12
“Glazed Performance”
4.3 Average PER of 7.0x
RCL price has been trading between 3.0x – 9.0x bands during the last 24
months. We expect RCL to trade at a PER of 7.0x on FY17E earnings. By FY17E
RCL’s EPS is expected to reach LKR 36.2. At 7.0x earnings, the price for RCL
stands at LKR 253.1.
5.0 Investment Risks
Change in Government Policy: At the 2016 Budget proposal government’s
decision the downwards revision of the import related duties on several
items including tiles and sanitary-ware will have an adverse impact on RCL’s
subsidiaries; Lanka Walltiles PLC and Lanka Tiles PLC. On the same budget
proposal Government’s decision to remove the tile and sanitary-ware sector
from BOI negative list will result in industry’s protected status being removed
exposing RCL to the threat of new players entering the market.
Exchange Rate Risk: RCL’s contribution from exports was recorded at 5% of
gross revenue with LKR 1.5Bn in FY16. Fluctuations in the USD exchange rate
would have an impact on the revenue as company exports to Australia while
securing dealerships in four continents with the view of entering Pakistan and
Maldives markets by opening stores. Fluctuation in Euro exchange rate is
likely to impact the cost of sales given RCL imports raw material from Europe.
Figure 15: PE Band Graph PER based Valuation FY17E FY18E
Earnings (LKR 'Mn) 3,093 4,006
No. of Shares ('Mn) 111 111
EPS 27.9 36.2
Expected Average PER 7.0 7.0
Price at 7.0x Earnings 195.4 253.1

FC Research
13
“Glazed Performance”
Appendix 1 – Recommendation Criteria
*1 Year T Bill rate as of 14-09-2016 - 10.39%
Appendix 2 – Income Statement
Categorization Company Category
Strong Buy Buy Hold Sell
Grade A S&P SL20 Companies
T.Bill + 10% & Above
T.Bill + 5% & Above
T.Bill + 1% & Above
Below T.Bill + 1%
Grade B Rest of the Companies
T.Bill + 13% & Above
T.Bill + 8% & Above
T.Bill + 3% & Above
Below T.Bill + 3%
Grade C Companies less than LKR 1Bn Market Cap
T.Bill + 16% & Above
T.Bill + 11% & Above
T.Bill + 6% & Above
Below T.Bill + 6%
Profit & Loss Statement
P/E 31 March FY15 FY16 FY17E FY18E FY19E
Revenue 22,379 24,905 27,130 32,623 36,902
Cost of sales (15,071) (15,348) (16,921) (19,985) (23,417)
Gross profit 7,308 9,557 10,209 12,638 13,485
Other income 236 191 125 151 170
Distribution cost (2,443) (3,243) (3,527) (4,078) (4,428)
Administrative expenses (1,319) (1,399) (1,523) (1,899) (2,225)
EBIT 3,782 5,106 5,285 6,813 7,003
Finance income 2 69 78 74 60
Finance cost (971) (823) (915) (860) (703)
Share of Associate company's Profits 831 1,356 1,518 1,701 1,905
Profit before tax 3,644 5,708 5,967 7,728 8,265
Income tax expense (577) (1,616) (1,671) (2,164) (2,314)
Profit for the period 3,067 4,092 4,296 5,564 5,951
Non controlling interest 932 1,157 1,203 1,558 1,666
Equityholders of Royal Ceramic Lanka PLC 2,135 2,934 3,093 4,006 4,285
EPS 19.3 26.5 27.9 36.2 38.7
Source: Company Annual Reports and FC Research Estimates
FC Research
14
“Glazed Performance”
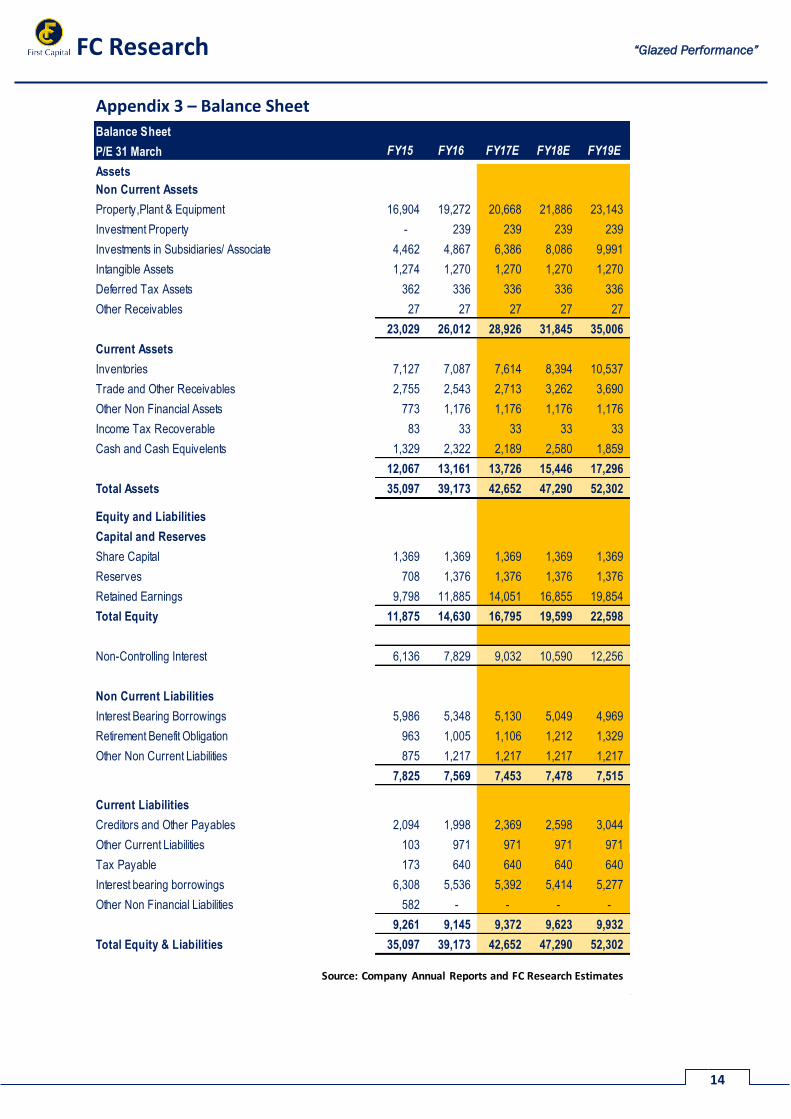
Appendix 3 – Balance Sheet
Balance Sheet
P/E 31 March FY15 FY16 FY17E FY18E FY19E
Assets
Non Current Assets
Property,Plant & Equipment 16,904 19,272 20,668 21,886 23,143
Investment Property - 239 239 239 239
Investments in Subsidiaries/ Associate 4,462 4,867 6,386 8,086 9,991
Intangible Assets 1,274 1,270 1,270 1,270 1,270
Deferred Tax Assets 362 336 336 336 336
Other Receivables 27 27 27 27 27
23,029 26,012 28,926 31,845 35,006
Current Assets
Inventories 7,127 7,087 7,614 8,394 10,537
Trade and Other Receivables 2,755 2,543 2,713 3,262 3,690
Other Non Financial Assets 773 1,176 1,176 1,176 1,176
Income Tax Recoverable 83 33 33 33 33
Cash and Cash Equivelents 1,329 2,322 2,189 2,580 1,859
12,067 13,161 13,726 15,446 17,296
Total Assets 35,097 39,173 42,652 47,290 52,302
Equity and Liabilities
Capital and Reserves
Share Capital 1,369 1,369 1,369 1,369 1,369
Reserves 708 1,376 1,376 1,376 1,376
Retained Earnings 9,798 11,885 14,051 16,855 19,854
Total Equity 11,875 14,630 16,795 19,599 22,598
Non-Controlling Interest 6,136 7,829 9,032 10,590 12,256
Non Current Liabilities
Interest Bearing Borrowings 5,986 5,348 5,130 5,049 4,969
Retirement Benefit Obligation 963 1,005 1,106 1,212 1,329
Other Non Current Liabilities 875 1,217 1,217 1,217 1,217
7,825 7,569 7,453 7,478 7,515
Current Liabilities
Creditors and Other Payables 2,094 1,998 2,369 2,598 3,044
Other Current Liabilities 103 971 971 971 971
Tax Payable 173 640 640 640 640
Interest bearing borrowings 6,308 5,536 5,392 5,414 5,277
Other Non Financial Liabilities 582 - - - -
9,261 9,145 9,372 9,623 9,932
Total Equity & Liabilities 35,097 39,173 42,652 47,290 52,302
Source: Company Annual Reports and FC Research Estimates

FC Research
15
“Glazed Performance”
Appendix 4 – Cash flow Statement
Cashflow Statement
P/E 31 March FY15 FY16 FY17E FY18E FY19E
PBT 3,644 5,708 5,967 7,728 8,265
Dividend Income (0) (3) - - -
Depreciation & Amortization 1,167 1,265 1,306 1,508 1,742
Interest Expense 969 754 837 786 643
(Profit) on sale of ST Investments - (11) - - -
(Profit)/Loss on sale of PPE (35) 23 - - -
Provision for defined benefit plans - 168 192 206 226
Profit Share of Investment in associate (831) (1,356) (1,518) (1,701) (1,905)
(Profit)/loss on Disposal of Subsidiary - 109 - - -
Other 287 - - - -
Operating Profit / (Loss) before Working Capital Changes 5,200 6,657 6,783 8,526 8,972
(Increase)/Decrease in Inventory (398) (49) (527) (779) (2,144)
(Increase)/Decrease in Receivables 502 206 (170) (549) (428)
Increase/(Decrease) in Payables 62 (114) 371 229 446
Other 260 (252) - - -
Net Change in Working Capital 425 (209) (326) (1,100) (2,125)
Cash Generated from Operation 5,625 6,448 6,456 7,427 6,846
Inerest paid (959) (806) (915) (860) (703)
Defined Benefit Obligations (79) (88) (90) (100) (109)
Tax Paid (202) (672) (1,671) (2,164) (2,314)
Cash from operations 4,384 4,882 3,781 4,304 3,721
Investing activities
Fixed and Intangible Assets (1,462) (1,877) (2,702) (2,726) (2,999)
Proceeds from Sale of Property, Plant & Equipment 41 74 - - -
Interest and Dividend received 108 234 78 74 60
Acquisition of Investments (67) - - - -
Proceeds from Sale of Short Term investments - 76 - - -
Cash from investments (1,381) (1,493) (2,624) (2,652) (2,939)
Fiancing Activities
Proceeds From Interest Bearing Loans & Borrowings (1,665) (941) (362) (59) (217)
Capital Repayments under Finance Lease Liabilities (33) (6) - - -
Dividend Paid (670) (931) (928) (1,202) (1,285)
Other 8 18 - - -
Cash from financing (2,361) (1,860) (1,290) (1,260) (1,503)
Net Foreign Exchange Differences (4) (2) - - -
Net cash during the year 639 1,528 (133) 391 (721)
Net cash at beginning (1,419) (780) 748 615 1,006
Net cash at end (780) 748 615 1,006 285
Balance sheet Cash Balance 1,329 2,322 2,189 2,580 1,859
Bank overdraft (2,109) (1,575) (1,575) (1,575) (1,575)
Source: Company Annual Reports and FC Research Estimates
347 1/1, Dr. Colvin R. De Silva Mawatha,
Colombo 2
Sales Desk: +94 11 2145 000
Fax: +94 11 5736 264
HEAD OFFICE BRANCHES
347 1/1, Negombo
Dr. Colvin R. De Silva Mawatha, No.72A, 2/1,
Colombo 2 Old Chilaw Road,
Negombo
Sales Desk: +94 11 2145 000
Fax: +94 11 5736 264 Tel: +94 31 2233 299
SALES BRANCHES
CEO http://www.firstcapital.lk/investment-bank-about-us/leadership/Jaliya Wijeratne +94 70 2910 042 Negombo
Priyanka Anuruddha +94 70 2910 035
Colombo Priyantha Wijesiri +94 70 2910 036
Damian Le Grand +94 70 2910 032
Nishantha Mudalige +94 70 2910 041
Isuru Jayawardana +94 70 2910 034
Anushka Buddhika +94 70 2910 030
Gamini Hettiarachchi +94 70 2910 039
Thushara Abeyratne +94 70 2910 037
RESEARCH
Dimantha Mathew +94 11 2145 016 Amanda Lokugamage +94 11 2145 015
Atchuthan Srirangan +94 11 2145 017 Michelle Weerasinghe +94 11 2145 018
Hansinee Beddage +94 11 2145 018
FIRST CAPITAL GROUP http://www.firstcapital.lk/investment-bank-about-us/leadership/
HEAD OFFICE BRANCHES
No. 2, Deal Place, Matara Kurunegala Kandy
Colombo 3 No. 24, 1/3, 2nd Floor, No. 6, 1st Floor, No.213-215,
Tel: +94 11 2639 898 Lakshman Cooray Building, Union Assurance Building, Peradeniya Road,
Anagarika Dharmapala Mawatha, Rajapihilla Mawatha, Kandy
Matara Kurunegala
Tel: +94 41 2222 988 Tel: +94 37 2222 930 Tel: +94 81 2236 011
Disclaimer:This Review is prepared and issued by First Capital Equities (Pvt) Ltd. and is based on information available in the public domain, internally developed and other sources
believed to be correct. Although all reasonable care has been taken to ensure that the contents of this document are accurate, First Capital Equities (Pvt) Ltd and its Directors
and employees, are not responsible for its accuracy, usefulness and reliability and disclaim liability for any loss suffered by the use of information contained herein.
First Capital Equities (Pvt) Ltd may act as a Broker in the investments which are the subject of this document or any related investments and may have acted on or have used
the information contained in this document, or the research or analysis on which it is based, before its publication.
First Capital Equities (Pvt) Ltd
Related Documents