_____________________________________________________________________ T. Van Pelt. “Maize, Soybean, and Alfalfa Biomass Densification”. Agricultural Engineering International: the CIGR Journal of Scientific Research and Development. Manuscript EE 03 002. May, 2003. 1 MAIZE, SOYBEAN, AND ALFALFA BIOMASS DENSIFICATION Timothy J. Van Pelt M.S. Graduate Student Agricultural Engineering Iowa State University 131 Davidson Hall Ames, IA 50011-3080 [email protected] Advisors: Dr. Carl J. Bern Dr. Graeme Quick ABSTRACT Several biomass samples of soybean straw, dry corn stalks, wet corn stalks, and dry alfalfa hay were compression tested. The objectives of this experiment were to (1) define a relationship between bulk density and applied pressure for several samples of corn stalks, soybean straw, and alfalfa hay, and curve fit the results using Equation 1 that models biomass densification, and (2) observe similarities or differences in the values for the constants k and n due to differences in moisture or type of biomass. ( ) n p k = γ (1) where: γ = bulk density, kg/m 3 k = constant p = pressure, kPa n = exponential constant Biomass samples were tested with an MTS Sintech ® 60/D Materials Testing Workstation (Figure 1) using a 2224 N (500 lb) load cell and a crosshead movement of 12.7 cm (5 in) per minute. The samples were compressed within a PVC tube having a 39-cm (15.4-in)

Welcome message from author
This document is posted to help you gain knowledge. Please leave a comment to let me know what you think about it! Share it to your friends and learn new things together.
Transcript
_____________________________________________________________________ T. Van Pelt. “Maize, Soybean, and Alfalfa Biomass Densification”. Agricultural Engineering International: the CIGR Journal of Scientific Research and Development. Manuscript EE 03 002. May, 2003.
1
MAIZE, SOYBEAN, AND ALFALFA BIOMASS
DENSIFICATION
Timothy J. Van Pelt M.S. Graduate Student
Agricultural Engineering Iowa State University
131 Davidson Hall Ames, IA 50011-3080 [email protected]
Advisors: Dr. Carl J. Bern
Dr. Graeme Quick
ABSTRACT
Several biomass samples of soybean straw, dry corn stalks, wet corn stalks, and dry alfalfa hay were compression tested. The objectives of this experiment were to (1) define a relationship between bulk density and applied pressure for several samples of corn stalks, soybean straw, and alfalfa hay, and curve fit the results using Equation 1 that models biomass densification, and (2) observe similarities or differences in the values for the constants k and n due to differences in moisture or type of biomass.
( )npk=γ (1)
where: γ = bulk density, kg/m3 k = constant p = pressure, kPa n = exponential constant
Biomass samples were tested with an MTS Sintech® 60/D Materials Testing Workstation (Figure 1) using a 2224 N (500 lb) load cell and a crosshead movement of 12.7 cm (5 in) per minute. The samples were compressed within a PVC tube having a 39-cm (15.4-in)

_____________________________________________________________________ T. Van Pelt. “Maize, Soybean, and Alfalfa Biomass Densification”. Agricultural Engineering International: the CIGR Journal of Scientific Research and Development. Manuscript EE 03 002. May, 2003.
2
inside diameter and a 56-cm (22.0-in) height. In increasing order, the average k-value for each material tested was 25 (dry corn stalks), 36 (soybean straw), 49 (wet corn stalks), and 56 (dry alfalfa hay). The most difficult biomass material to compact, from the four tested, was dry corn stalks. This experiment also indicates dry biomass is tougher to compact than wet biomass.
In decreasing order, the average n-value for each material tested was 0.29 (dry corn stalks), 0.24 (soybean straw), 0.24 (wet corn stalks), and 0.23 (dry alfalfa hay).
An ANOVA test determined that the k-values are statistically different for each material. However, an ANOVA test did not conclusively prove the n-values of the different biomass materials are different. Keywords: Biomass densification, bulk density
INTRODUCTION
Literature Review
In its natural form, most biomass is difficult to utilize as a fuel because it is bulky, wet, and dispersed (Balatinecz, 1983). Disadvantages of biomass as an energy source include inefficient transportation and large volumes required for storage. Solving these problems is where biomass densification gains extreme importance. Biomass densification is defined as compression or compaction of biomass to remove inter- and intra-particle voids (Balatinecz, 1983). Compression baling can reduce biomass volume to one-fifth of its loose bulk volume. The first United States patent for biomass densification was issued in 1880 to William Smith (U.S. Patent No. 233,887). He compressed the sawdust and other waste from a sawmill at a temperature of 66˚C (150˚F) using a steam hammer. Burmistrova (1963) described densification testing on various kinds of hay. Dry hay required stronger compression forces and produced bales of lower bulk density than wet hay. More moisture in the biomass decreases friction when the material is being compressed. Therefore, the same stress on wet biomass produces more deformation than on dry biomass (Mohsenin, 1970). Biomass densification can also reduce the moisture content of a material by "squeezing" some of the moisture out during compression. Burmistrova concluded moisture content is the variable with the greatest effect on compression. Sitkei (1986) reached the same conclusion. Burmistrova (1963) compressed hay at three different moistures (10.7%, 28.8%, and
_____________________________________________________________________ T. Van Pelt. “Maize, Soybean, and Alfalfa Biomass Densification”. Agricultural Engineering International: the CIGR Journal of Scientific Research and Development. Manuscript EE 03 002. May, 2003.
3
30.4%)* and obtained curves similar in shape to a power curve. However, he provided no equations of fit for the curves. He also found that initial bulk density influenced the final bulk density that could be obtained during compression. When subjected to the same amount of compression, hay with a higher initial bulk density can be compressed to a higher final bulk density. Burmistrova also described, in detail, what occurs as hay is being compressed. First, components of the plant mass are brought closer to each other. Then, air voids are reduced and stems are flattened. The plant mass experiences the greatest amount of deformation in the early stages of compression. However, the load is smallest at the beginning and keeps increasing to the end of compression. Therefore, an inverse relationship exists between the deformation of the plant material and the magnitude of the load.
Biomass densification is of the utmost importance for economical shipping and handling in the biomass industry. Trucks and other biomass hauling equipment are rarely able to maximize their hauled loads due to the bulkiness of handling biomass. Previous experimental research indicates the relationship between biomass bulk density and the applied pressure on it can be represented by a power curve (Equation 1), in which n is approximately 0.28 and k is approximately 30 when pressure is expressed in kilopascals and bulk density is expressed in kilograms per cubic meter (Kaminski, 1989).
( )npk=γ (1)
where: γ = bulk density, kg/m3 k = constant p = pressure, kPa n = exponential constant
No reports were found in the literature search that provided specific k and n values based on specific biomass materials and moisture contents. If biomass densification can be accurately modeled under various conditions using Equation 1, specific power requirements for biomass densification machines can be predicted easily.
OBJECTIVES
The objectives of this experiment were as follows: (1) Define a relationship between bulk density and applied pressure for several samples of corn stalks, soybean straw, and alfalfa hay, and curve fit the results using Equation 1 that models biomass densification.
* All moistures are stated on a percent wet basis.
_____________________________________________________________________ T. Van Pelt. “Maize, Soybean, and Alfalfa Biomass Densification”. Agricultural Engineering International: the CIGR Journal of Scientific Research and Development. Manuscript EE 03 002. May, 2003.
4
(2) Observe similarities or differences in the values for the constants k and n due to differences in moisture or type of biomass.
PROCEDURE
This experiment consisted of compacting 24 biomass samples using an MTS Sintech® 60/D Materials Testing Workstation (Figure 1). The load and stroke data output from the MTS Sintech® machine was converted to bulk density and applied pressure; the results were plotted and curve fitted using Equation 1. Test Apparatus
A tube and plunger apparatus was constructed for use with the MTS Sintech® machine at Iowa State University so biomass samples could be compacted (Figure 1). The tube is a section of PVC pipe, arbitrarily chosen with a 39-cm (15.4-in) inside diameter and 56-cm (22.0-in) height. A square piece of plywood is screwed to the bottom of the PVC tube to form the base. The plunger is 2.54-cm (1-in) thick plywood, cut to a diameter of 39 cm (15.4 in). It has a 0.95-cm (3/8-in) threaded rod connecting it to the load cell of the MTS Sintech® machine. Experimental Material Dry corn stalks, wet corn stalks, soybean straw, and alfalfa hay were collected from various fields near Grand Junction, Iowa. The dry corn stalks, wet corn stalks, and soybean straw were collected after a combine threshed them. The alfalfa hay bale was purchased. Moisture Determination
Moisture for each sample is stated using the standard wet basis formula.

_____________________________________________________________________ T. Van Pelt. “Maize, Soybean, and Alfalfa Biomass Densification”. Agricultural Engineering International: the CIGR Journal of Scientific Research and Development. Manuscript EE 03 002. May, 2003.
5
Figure 1. MTS Sintech® 60/D Materials Testing Workstation used for biomass densification.
_____________________________________________________________________ T. Van Pelt. “Maize, Soybean, and Alfalfa Biomass Densification”. Agricultural Engineering International: the CIGR Journal of Scientific Research and Development. Manuscript EE 03 002. May, 2003.
6
A random sub-sample of approximately 10 grams was extracted from each biomass test run to measure moisture. The following procedure was used to measure the percent moisture: (1) the wet mass was weighed, (2) it was placed in an oven at 103◦C for two hours, and (3) it was weighed again dry. The dry corn stalks, wet corn stalks, soybean straw, and alfalfa hay had average moisture contents of 18.1%, 33.2%, 9.7%, and 14.3%, respectively. Sample Test Procedure Each biomass sample was tested according to the following procedure. The PVC tube was filled with one of the biomass samples and then weighed. Using the Sintech® testing machine to compact the biomass sample, the test was conducted using a 2224 N (500 lb) load cell and a crosshead movement of 12.7 cm (5 in) per minute. The crosshead speed was chosen slow enough so no impact loading was present. The Sintech® machine generated an output data file in a notepad file format containing data points of the plunger stroke length and resistance force. The stroke length was zeroed at the point where the bottom of the surface on the plunger was flush with the top of the PVC tube. Therefore, the volume of the biomass during compaction is given by the following equation:
Volume = (1197.8)(55.88 - stroke) cm3 (2) After compressing each sample, it was discarded and a new sample was loaded. Compression stopped when the load cell reached its limit of 2224 N (500 lb).
The output data file was saved on a disk and opened using Microsoft® Excel®. The data were then converted from load and stroke distance to applied pressure and bulk density. To determine the applied pressure, the load was divided by the cross-sectional area (1197.8 cm2) of the tube. To derive the bulk density, the constant sample mass was divided by the instantaneous volume using Equation 2 above.
RESULTS AND DISCUSSION
Five sample runs were tested using soybean straw, four using wet corn stalks, five using dry corn stalks, and ten using dry alfalfa hay. Data are shown in Tables 1 through 4 and plots of bulk density versus applied pressure for the four materials tested are shown in Figures 2 through 5. Table 1 shows the results for the soybean straw. The average moisture for the soybean straw was 9.7%, the average k-value was 36, and the average n-value was 0.24 according to Equation 1. The standard deviations and 90% confidence intervals are also stated in the table. Figure 2 plots all five of the sample runs for the soybean straw on the same

_____________________________________________________________________ T. Van Pelt. “Maize, Soybean, and Alfalfa Biomass Densification”. Agricultural Engineering International: the CIGR Journal of Scientific Research and Development. Manuscript EE 03 002. May, 2003.
7
graph. By using the average k- and n-values from the five test samples, the average equation of best fit is displayed.
Table 1. Soybean straw equations.
Sample k-value n-valueSample Moisture
1 27.6 0.26 10.9%2 33.1 0.27 8.6%3 40.2 0.23 10.3%4 35.9 0.24 11.3%5 43.3 0.21 7.6%
AVG 36.0 0.24 9.7%Std. Dev. 6.1 0.02 1.6%
90% Confidence
Interval (plus/ minus)
4.5 0.02 1.2%
y = (36) x0.24
0.0
10.0
20.0
30.0
40.0
50.0
60.0
70.0
80.0
90.0
0.0 2.0 4.0 6.0 8.0 10.0 12.0 14.0 16.0 18.0 20.0
Pressure (kPa)
Bul
k D
ensi
ty (k
g/m
3 )
bean#1bean#2bean#3bean#4bean#5Best FitPower (Best Fit)
Figure 2. Bulk density plotted against pressure for the compaction of soybean straw.
_____________________________________________________________________ T. Van Pelt. “Maize, Soybean, and Alfalfa Biomass Densification”. Agricultural Engineering International: the CIGR Journal of Scientific Research and Development. Manuscript EE 03 002. May, 2003.
8
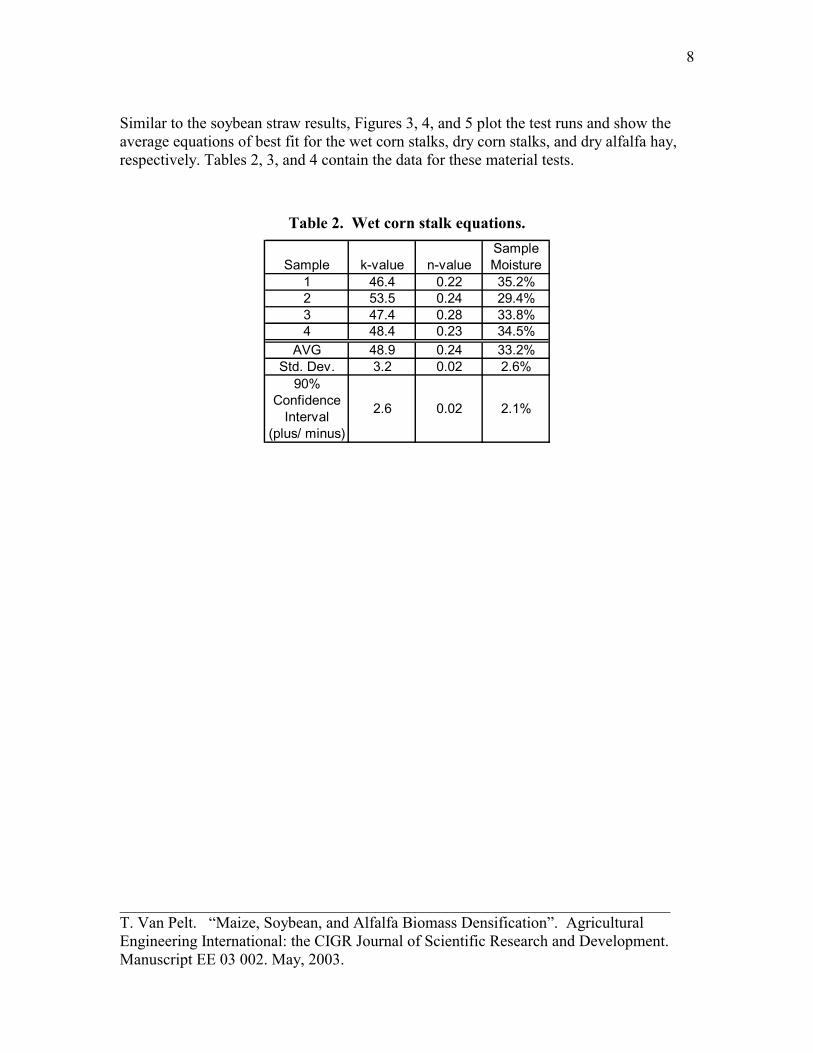
Similar to the soybean straw results, Figures 3, 4, and 5 plot the test runs and show the average equations of best fit for the wet corn stalks, dry corn stalks, and dry alfalfa hay, respectively. Tables 2, 3, and 4 contain the data for these material tests.
Table 2. Wet corn stalk equations.
Sample k-value n-valueSample Moisture
1 46.4 0.22 35.2%2 53.5 0.24 29.4%3 47.4 0.28 33.8%4 48.4 0.23 34.5%
AVG 48.9 0.24 33.2%Std. Dev. 3.2 0.02 2.6%
90% Confidence
Interval (plus/ minus)
2.6 0.02 2.1%
_____________________________________________________________________ T. Van Pelt. “Maize, Soybean, and Alfalfa Biomass Densification”. Agricultural Engineering International: the CIGR Journal of Scientific Research and Development. Manuscript EE 03 002. May, 2003.
9
y = (49) x0.24
0.0
10.0
20.0
30.0
40.0
50.0
60.0
70.0
80.0
90.0
100.0
110.0
120.0
0.0 2.0 4.0 6.0 8.0 10.0 12.0 14.0 16.0 18.0 20.0
Pressure (kPa)
Bul
k D
ensi
ty (k
g/m
3 )
Wet Corn#1Wet Corn#2Wet Corn#3Wet Corn#4Best FitPower (Best Fit)
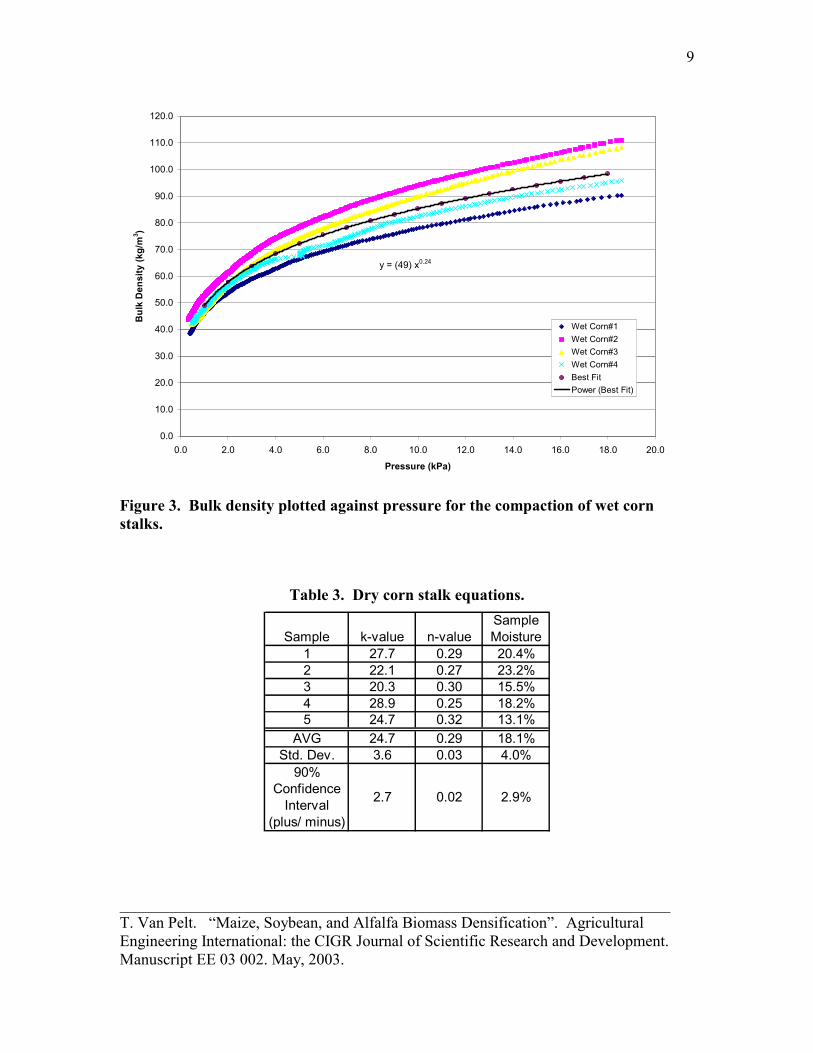
Figure 3. Bulk density plotted against pressure for the compaction of wet corn stalks.
Table 3. Dry corn stalk equations.
Sample k-value n-valueSample Moisture
1 27.7 0.29 20.4%2 22.1 0.27 23.2%3 20.3 0.30 15.5%4 28.9 0.25 18.2%5 24.7 0.32 13.1%
AVG 24.7 0.29 18.1%Std. Dev. 3.6 0.03 4.0%
90% Confidence
Interval (plus/ minus)
2.7 0.02 2.9%
_____________________________________________________________________ T. Van Pelt. “Maize, Soybean, and Alfalfa Biomass Densification”. Agricultural Engineering International: the CIGR Journal of Scientific Research and Development. Manuscript EE 03 002. May, 2003.
10
y = (25) x0.29
0.0
10.0
20.0
30.0
40.0
50.0
60.0
70.0
80.0
0.0 2.0 4.0 6.0 8.0 10.0 12.0 14.0 16.0 18.0 20.0
Pressure (kPa)
Bul
k D
ensi
ty (k
g/m
3 )
Dry Corn#1Dry Corn#2Dry Corn#3Dry Corn#4Dry Corn#5Best FitPower (Best Fit)
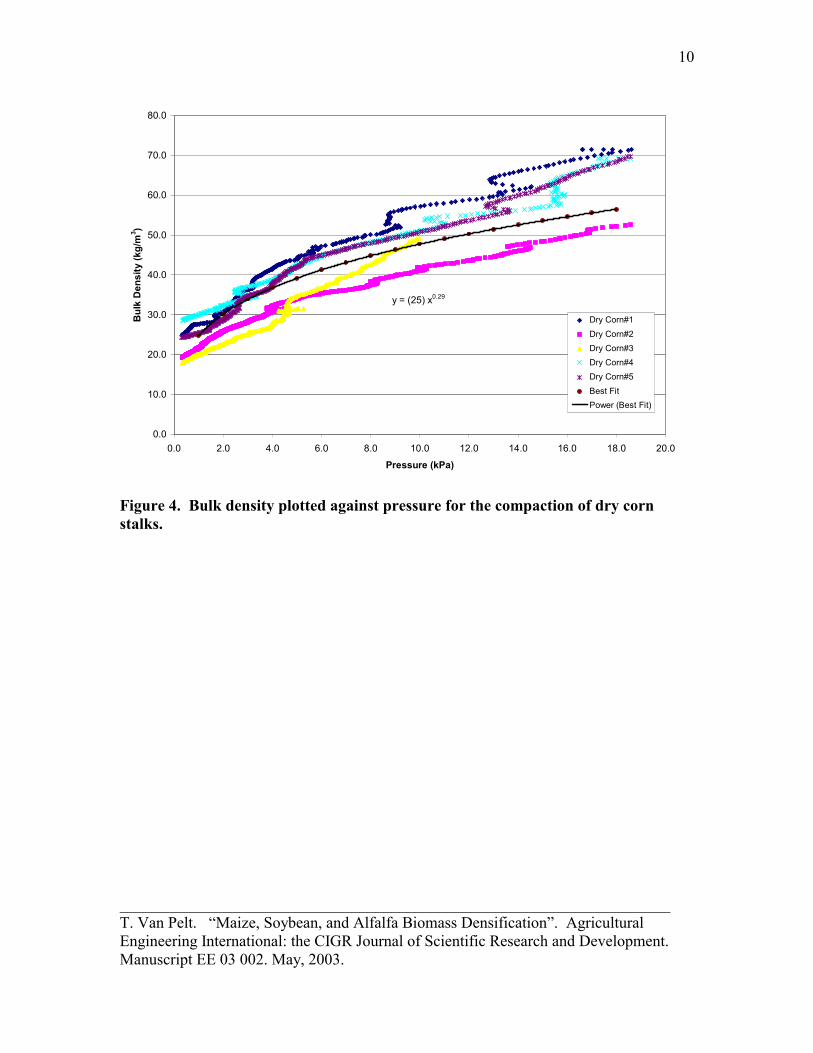
Figure 4. Bulk density plotted against pressure for the compaction of dry corn stalks.
_____________________________________________________________________ T. Van Pelt. “Maize, Soybean, and Alfalfa Biomass Densification”. Agricultural Engineering International: the CIGR Journal of Scientific Research and Development. Manuscript EE 03 002. May, 2003.
11
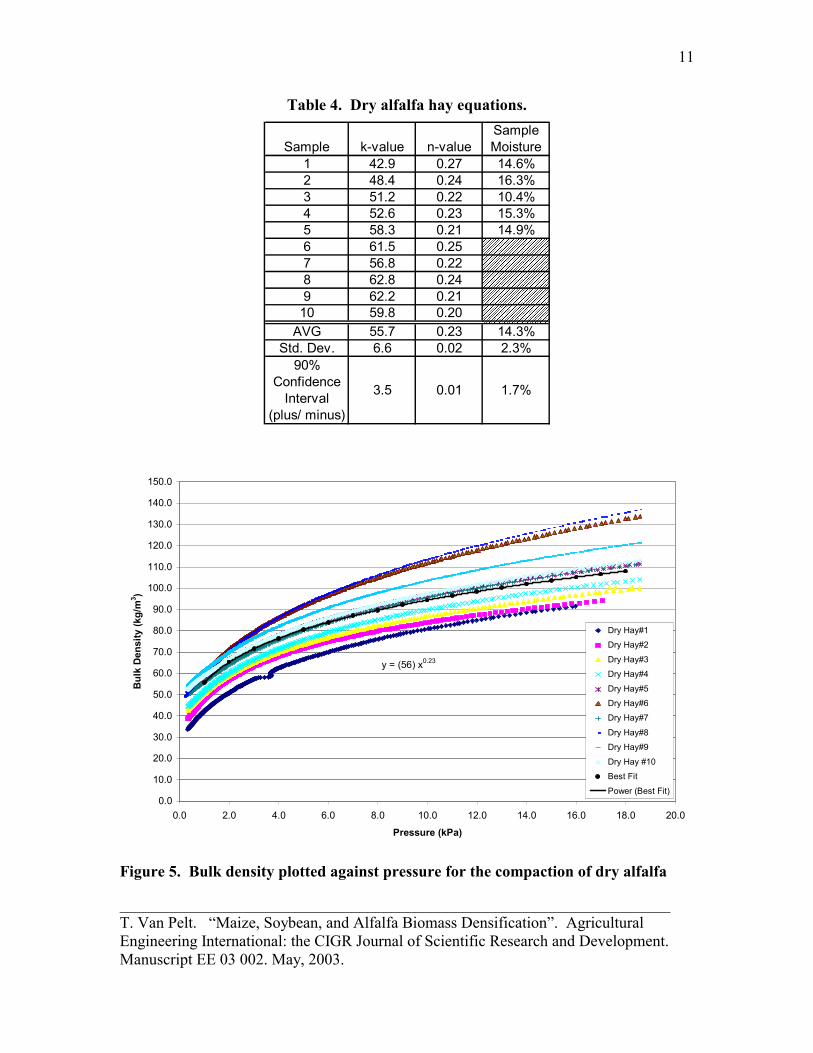
Table 4. Dry alfalfa hay equations.
����������������������������������������������������������������������������������������������������������������������������������������������������������������������������������������������������
Sample k-value n-valueSample Moisture
1 42.9 0.27 14.6%2 48.4 0.24 16.3%3 51.2 0.22 10.4%4 52.6 0.23 15.3%5 58.3 0.21 14.9%6 61.5 0.257 56.8 0.228 62.8 0.249 62.2 0.21
10 59.8 0.20AVG 55.7 0.23 14.3%
Std. Dev. 6.6 0.02 2.3%90%
Confidence Interval
(plus/ minus)
3.5 0.01 1.7%
y = (56) x0.23
0.0
10.0
20.0
30.0
40.0
50.0
60.0
70.0
80.0
90.0
100.0
110.0
120.0
130.0
140.0
150.0
0.0 2.0 4.0 6.0 8.0 10.0 12.0 14.0 16.0 18.0 20.0
Pressure (kPa)
Bulk
Den
sity
(kg/
m3 )
Dry Hay#1Dry Hay#2
Dry Hay#3Dry Hay#4
Dry Hay#5Dry Hay#6Dry Hay#7
Dry Hay#8Dry Hay#9
Dry Hay #10Best Fit
Power (Best Fit)
Figure 5. Bulk density plotted against pressure for the compaction of dry alfalfa
_____________________________________________________________________ T. Van Pelt. “Maize, Soybean, and Alfalfa Biomass Densification”. Agricultural Engineering International: the CIGR Journal of Scientific Research and Development. Manuscript EE 03 002. May, 2003.
12
hay. Analysis of Variance (ANOVA) tests
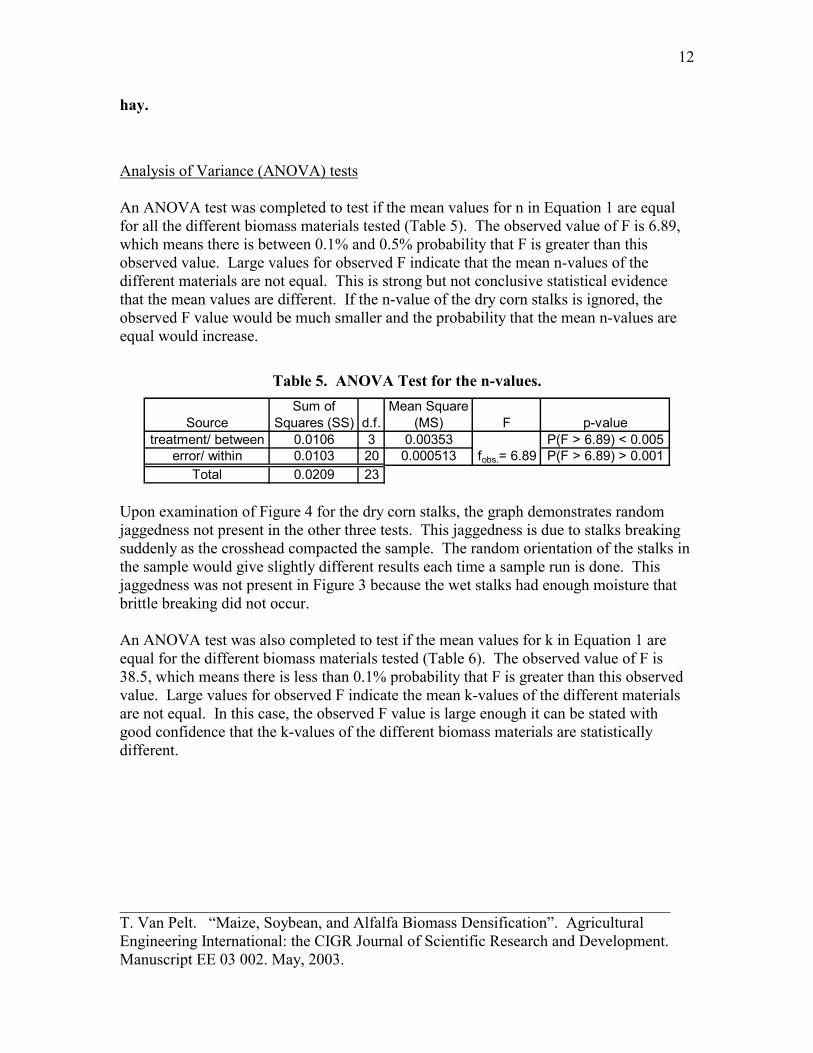
An ANOVA test was completed to test if the mean values for n in Equation 1 are equal for all the different biomass materials tested (Table 5). The observed value of F is 6.89, which means there is between 0.1% and 0.5% probability that F is greater than this observed value. Large values for observed F indicate that the mean n-values of the different materials are not equal. This is strong but not conclusive statistical evidence that the mean values are different. If the n-value of the dry corn stalks is ignored, the observed F value would be much smaller and the probability that the mean n-values are equal would increase.
Table 5. ANOVA Test for the n-values.
SourceSum of
Squares (SS) d.f.Mean Square
(MS) F p-valuetreatment/ between 0.0106 3 0.00353 P(F > 6.89) < 0.005
error/ within 0.0103 20 0.000513 P(F > 6.89) > 0.001Total 0.0209 23
fobs.= 6.89
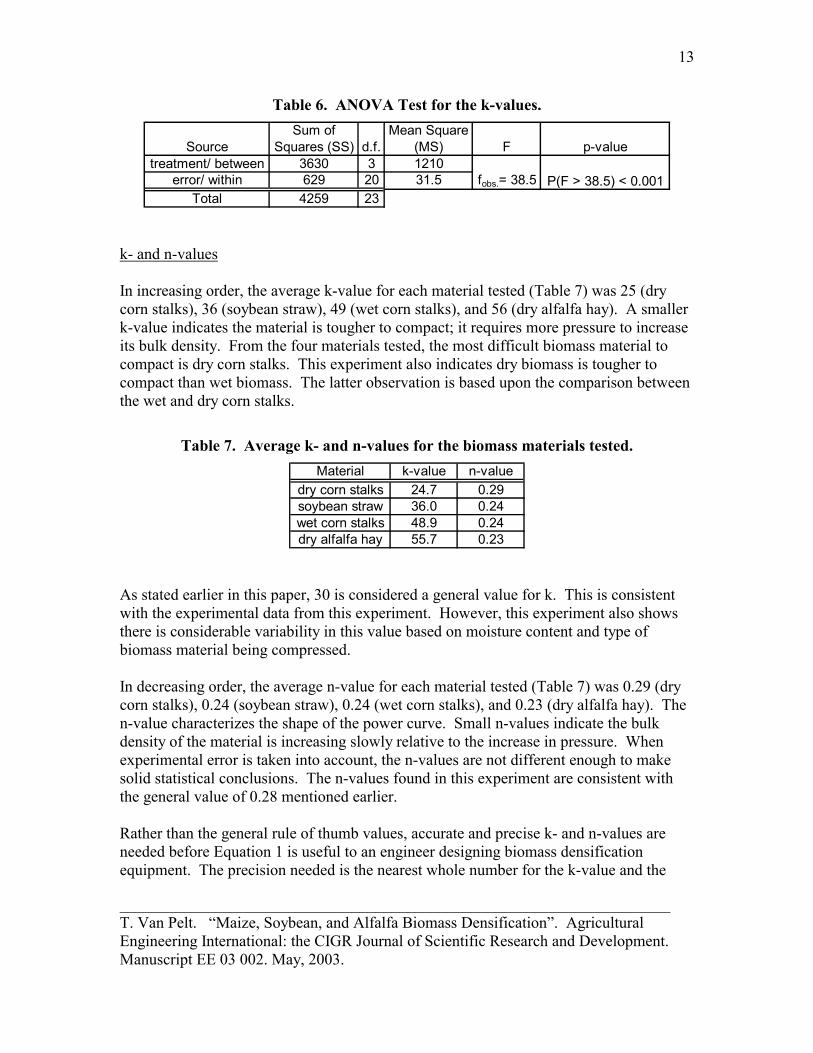
Upon examination of Figure 4 for the dry corn stalks, the graph demonstrates random jaggedness not present in the other three tests. This jaggedness is due to stalks breaking suddenly as the crosshead compacted the sample. The random orientation of the stalks in the sample would give slightly different results each time a sample run is done. This jaggedness was not present in Figure 3 because the wet stalks had enough moisture that brittle breaking did not occur. An ANOVA test was also completed to test if the mean values for k in Equation 1 are equal for the different biomass materials tested (Table 6). The observed value of F is 38.5, which means there is less than 0.1% probability that F is greater than this observed value. Large values for observed F indicate the mean k-values of the different materials are not equal. In this case, the observed F value is large enough it can be stated with good confidence that the k-values of the different biomass materials are statistically different.
_____________________________________________________________________ T. Van Pelt. “Maize, Soybean, and Alfalfa Biomass Densification”. Agricultural Engineering International: the CIGR Journal of Scientific Research and Development. Manuscript EE 03 002. May, 2003.
13
Table 6. ANOVA Test for the k-values.
SourceSum of
Squares (SS) d.f.Mean Square
(MS) F p-valuetreatment/ between 3630 3 1210
error/ within 629 20 31.5Total 4259 23
fobs.= 38.5 P(F > 38.5) < 0.001
k- and n-values
In increasing order, the average k-value for each material tested (Table 7) was 25 (dry corn stalks), 36 (soybean straw), 49 (wet corn stalks), and 56 (dry alfalfa hay). A smaller k-value indicates the material is tougher to compact; it requires more pressure to increase its bulk density. From the four materials tested, the most difficult biomass material to compact is dry corn stalks. This experiment also indicates dry biomass is tougher to compact than wet biomass. The latter observation is based upon the comparison between the wet and dry corn stalks.
Table 7. Average k- and n-values for the biomass materials tested. Material k-value n-value
dry corn stalks 24.7 0.29soybean straw 36.0 0.24wet corn stalks 48.9 0.24dry alfalfa hay 55.7 0.23
As stated earlier in this paper, 30 is considered a general value for k. This is consistent with the experimental data from this experiment. However, this experiment also shows there is considerable variability in this value based on moisture content and type of biomass material being compressed. In decreasing order, the average n-value for each material tested (Table 7) was 0.29 (dry corn stalks), 0.24 (soybean straw), 0.24 (wet corn stalks), and 0.23 (dry alfalfa hay). The n-value characterizes the shape of the power curve. Small n-values indicate the bulk density of the material is increasing slowly relative to the increase in pressure. When experimental error is taken into account, the n-values are not different enough to make solid statistical conclusions. The n-values found in this experiment are consistent with the general value of 0.28 mentioned earlier. Rather than the general rule of thumb values, accurate and precise k- and n-values are needed before Equation 1 is useful to an engineer designing biomass densification equipment. The precision needed is the nearest whole number for the k-value and the
_____________________________________________________________________ T. Van Pelt. “Maize, Soybean, and Alfalfa Biomass Densification”. Agricultural Engineering International: the CIGR Journal of Scientific Research and Development. Manuscript EE 03 002. May, 2003.
14
hundredths place for the n-value. The n-value affects the predicted bulk density exponentially. For example, when applied pressure equals 846 kPa and n equals 0.23, a 0.01 increase in the value of n increases the predicted bulk density by 7%. The k-value is directly proportional to the bulk density. The range of k-values in this experiment varies from 25 for the dry corn stalks to 56 for the dry alfalfa hay. Compared to the general value of 30, this is a difference of 17% to 87%, respectively. Relaxation
One interesting phenomenon noted in this experiment was the relaxation in the biomass material after each test was finished. The crosshead on the Sintech® machine would stop when the load cell limit of 2224 N (500 lb) was reached. Within ten seconds, the force on the load cell would drop to 1557 N (350 lb) or less and the crosshead was still in the same position. This phenomenon, called relaxation, was observed in all four materials. Due to the viscoelastic behavior of biomass, the curves for each material tested in this experiment would be different, and thus the k- and n-values would be different if the crosshead movement on the Sintech® machine is set to different speeds. As stated earlier, all of the samples in this experiment were run with an arbitrary crosshead speed of 12.7 cm (5 in) per minute, which was slow enough so impact loading did not occur. Calculating the power requirement for an alfalfa hay baler
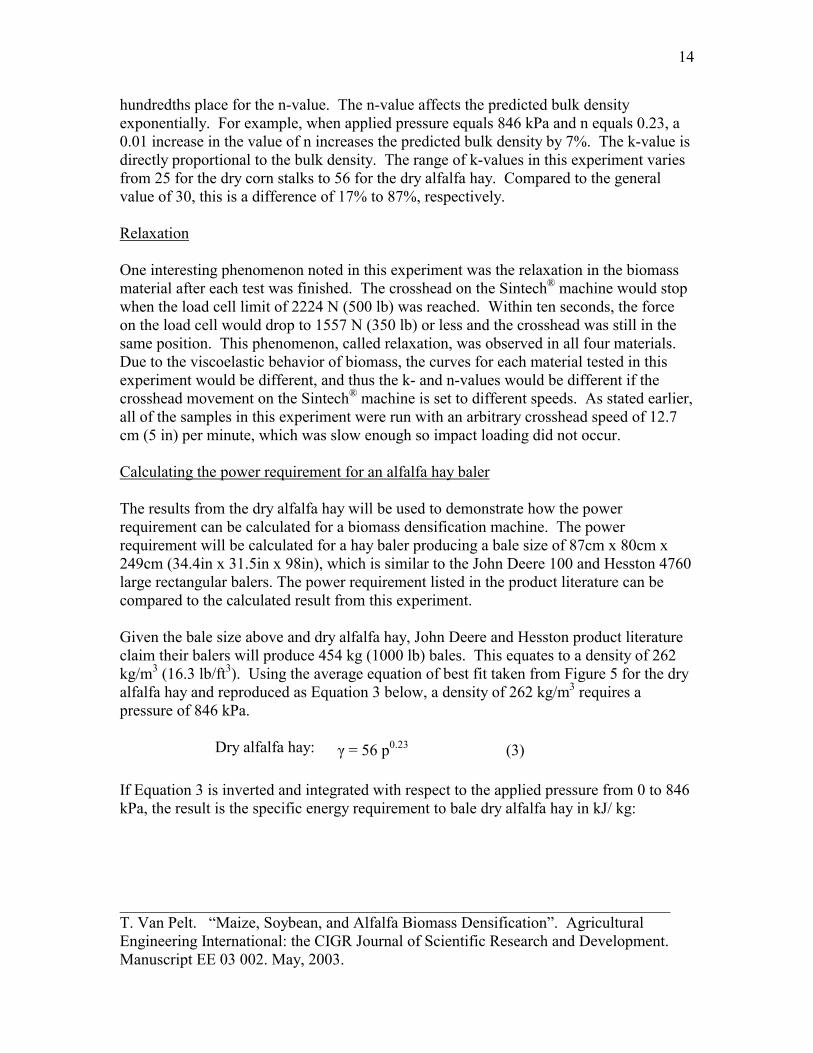
The results from the dry alfalfa hay will be used to demonstrate how the power requirement can be calculated for a biomass densification machine. The power requirement will be calculated for a hay baler producing a bale size of 87cm x 80cm x 249cm (34.4in x 31.5in x 98in), which is similar to the John Deere 100 and Hesston 4760 large rectangular balers. The power requirement listed in the product literature can be compared to the calculated result from this experiment. Given the bale size above and dry alfalfa hay, John Deere and Hesston product literature claim their balers will produce 454 kg (1000 lb) bales. This equates to a density of 262 kg/m3 (16.3 lb/ft3). Using the average equation of best fit taken from Figure 5 for the dry alfalfa hay and reproduced as Equation 3 below, a density of 262 kg/m3 requires a pressure of 846 kPa.
Dry alfalfa hay: γ = 56 p0.23 (3)
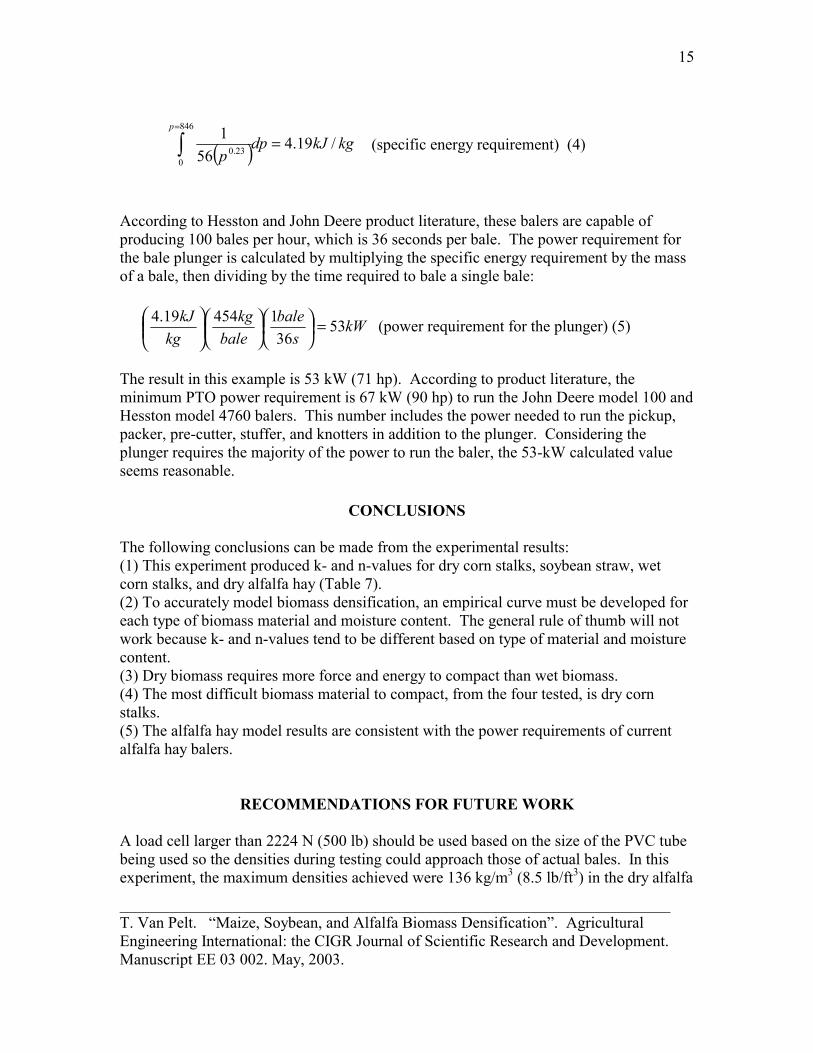
If Equation 3 is inverted and integrated with respect to the applied pressure from 0 to 846 kPa, the result is the specific energy requirement to bale dry alfalfa hay in kJ/ kg:
_____________________________________________________________________ T. Van Pelt. “Maize, Soybean, and Alfalfa Biomass Densification”. Agricultural Engineering International: the CIGR Journal of Scientific Research and Development. Manuscript EE 03 002. May, 2003.
15
( ) kgkJdpp
p
/19.456
1846
023.0 =∫
=
(specific energy requirement) (4)
According to Hesston and John Deere product literature, these balers are capable of producing 100 bales per hour, which is 36 seconds per bale. The power requirement for the bale plunger is calculated by multiplying the specific energy requirement by the mass of a bale, then dividing by the time required to bale a single bale:
kWs
balebale
kgkg
kJ 5336
145419.4 =
(power requirement for the plunger) (5)
The result in this example is 53 kW (71 hp). According to product literature, the minimum PTO power requirement is 67 kW (90 hp) to run the John Deere model 100 and Hesston model 4760 balers. This number includes the power needed to run the pickup, packer, pre-cutter, stuffer, and knotters in addition to the plunger. Considering the plunger requires the majority of the power to run the baler, the 53-kW calculated value seems reasonable.
CONCLUSIONS
The following conclusions can be made from the experimental results: (1) This experiment produced k- and n-values for dry corn stalks, soybean straw, wet corn stalks, and dry alfalfa hay (Table 7). (2) To accurately model biomass densification, an empirical curve must be developed for each type of biomass material and moisture content. The general rule of thumb will not work because k- and n-values tend to be different based on type of material and moisture content. (3) Dry biomass requires more force and energy to compact than wet biomass. (4) The most difficult biomass material to compact, from the four tested, is dry corn stalks. (5) The alfalfa hay model results are consistent with the power requirements of current alfalfa hay balers.
RECOMMENDATIONS FOR FUTURE WORK
A load cell larger than 2224 N (500 lb) should be used based on the size of the PVC tube being used so the densities during testing could approach those of actual bales. In this experiment, the maximum densities achieved were 136 kg/m3 (8.5 lb/ft3) in the dry alfalfa
_____________________________________________________________________ T. Van Pelt. “Maize, Soybean, and Alfalfa Biomass Densification”. Agricultural Engineering International: the CIGR Journal of Scientific Research and Development. Manuscript EE 03 002. May, 2003.
16
hay. Actual densities in biomass bales are typically 240 kg/m3 (15 lb/ft3) or larger. Using a larger load cell would give more validity to the graphed curves and would yield data in the same range as actual biomass bales. The curves in this experiment have to be extrapolated to give results relevant to actual biomass bales. To verify the conclusions of the ANOVA tests, a larger number of sample runs should be tested, especially for the soybean straw and corn stalks. A wider range of moistures for each biomass material should be tested so the effect of moisture can be quantified more accurately.
_____________________________________________________________________ T. Van Pelt. “Maize, Soybean, and Alfalfa Biomass Densification”. Agricultural Engineering International: the CIGR Journal of Scientific Research and Development. Manuscript EE 03 002. May, 2003.
17
REFERENCES
Balatinecz, J.J. 1983. The potential role of densification in biomass utilization. Biomass Utilization. 67: 181-190. Burmistrova, M.F. 1963. Physicomechanical properties of agricultural crops. Translation IPST/NSF. p. 249. Kaminski, Tony. 1989. Investigation of the feasibility of collection, densification, storage, transportation, and marketing of agricultural biomass. Saskatchewan Agriculture Development Fund. SRC publication 0829-9455. p.28. Mohsenin, N.N. 1970. Physical properties of plant and animal materials. Gordon & Beach, New York, New York. p. 175. Sitkei, Gyorgy. 1986. Mechanics of agricultural materials. In: Developments in Agricultural Engineering 8, Elsevier Science Publishing Co., New York, New York. p.403-420.
Related Documents