Department of Technology Management and Economics Division of Operations Management CHALMERS UNIVERSITY OF TECHNOLOGY Göteborg, Sweden 2014 Report No. E2014:087 Maintenance Optimization of Offshore Wind Power - Concept Development for Future Cost Reduction Master of Science Thesis in Management and Economics of Innovation ANTON GUSTAVSSON ERIK NYBERG 5% 20% 35% 50% 65% 80% Weather downtime CTV technician cost CTV cost CTV fuel cost 4 Additional CTV 2 CTV 3 CTV

Welcome message from author
This document is posted to help you gain knowledge. Please leave a comment to let me know what you think about it! Share it to your friends and learn new things together.
Transcript
Department of Technology Management and Economics Division of Operations Management CHALMERS UNIVERSITY OF TECHNOLOGY Göteborg, Sweden 2014 Report No. E2014:087
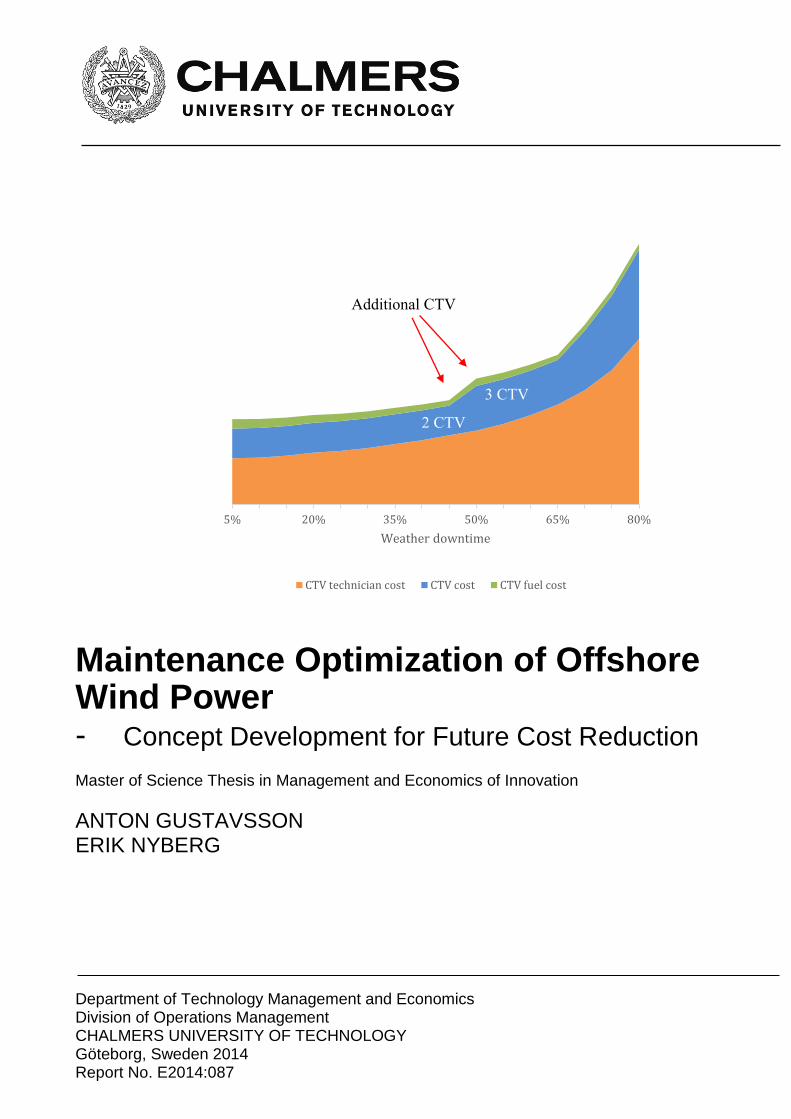
Maintenance Optimization of Offshore Wind Power - Concept Development for Future Cost Reduction Master of Science Thesis in Management and Economics of Innovation
ANTON GUSTAVSSON ERIK NYBERG
5% 20% 35% 50% 65% 80%
Weather downtime
CTV technician cost CTV cost CTV fuel cost
4 CTV
Additional CTV
2 CTV
3 CTV


REPORT NO. E 2014:087
Maintenance Optimization of Offshore Wind Power Concept Development for Future Cost Reduction
ANTON GUSTAVSSON
ERIK NYBERG
Department of Technology Management and Economics
CHALMERS UNIVERSITY OF TECHNOLOGY
Göteborg, Sweden 2014

Maintenance Optimization of Offshore Wind Power
- Concept Development for Future Cost Reduction
ANTON GUSTAVSSON
ERIK NYBERG
© ANTON GUSTAVSSON, ERIK NYBERG, 2014.
Technical report no E 2014:087
Department of Technology Management and Economics
Chalmers University of Technology
SE-412 96 Göteborg
Sweden
Telephone + 46 (0)31-772 1000
Cover:
Impact of WDT on a CTV setup, see p.28
Chalmers Reproservice
Göteborg, Sweden 2014

Acknowledgement
The authors would like to express their gratitude to the people who have provided great
support and valuable input during the process of writing this thesis. Without the support
of our project team at Siemens, this study would not have been successful. With great
enthusiasm and constructive feedback the project team guided our way forward through
the project. We would also like to express warm thanks to everyone at Siemens who has
contributed to this work, and especially the Maritime and Aviation Solution team. A
special thanks to professor Mats Winroth for his excellent advices during the process of
completing our thesis, his guidance and interest has made this a rewarding journey. In
addition we would like to thank our families and friends encouragement.
Anton Gustavsson Erik Nyberg
_________________________ _________________________
Chalmers University of Technology, Göteborg, 2014


Abstract
This study aims at increasing the knowledge within renewable energy, of which offshore
wind power is believed to be one important technology. This technology is in an early stage
of development and in order to be competitive against conventional energy sources, further
cost reduction is needed. One potential area of cost reduction is offshore maintenance
logistics. To explore this area, findings from expert interviews are combined with industry
data and literature to create a cost model. This model is used to explore the impact of major
cost drivers of offshore maintenance; distance to shore, weather downtime, number of
turbines, and number of service hours. The results are presented graphically and used to
explore two offshore-based concepts with site conditions of a future planned wind farm. The
compared concepts are an accommodation platform and a vessel capable of hosting
technicians offshore. An availability simulation is performed to compare the performance of
the two service strategies. It reveals an equal performance level together with a positive
availability impact of using helicopters for maintenance. The concepts are further elaborated
on in order to explore their individual potential of cost reduction and the compounded effect
is discussed. The results from the study show that the cost structure is impacted differently
by the cost drivers depending on the logistical setup. Another important aspect of the service
strategy is balancing asset capacity to service demand. The authors believes that knowledge
of this study is vital for decision making in order to bring down the cost of offshore
maintenance, thus the levelized cost of energy, making renewable energy competitive.
Keywords: offshore wind power, maintenance, service, cost drivers, O&M, cost
reduction, service concept, strategic development, capacity utilization

Nomenclature
Abbreviations CAPEX Capital Expenditure
CTV Crew Transfer Vessel
HHO Helicopter Hoisting Operation
LCC Life Cycle Cost
LCOE Levelized Cost of Energy
MLDT Mean Logistical Delay Time
MTBF Mean Time Between Failure
MTTF Mean Time To Failure
MTTR Mean Time To Repair
O&M Operation & Maintenance
SOV Service Operation Vessel
WDT Weather Downtime
WF Wind Farm
WFO Wind Farm Operator
WTG Wind Turbine Generator
Units € Euro
Hs Significant wave height
kt Knots (1.85 km/h)
MW Megawatt
MWh Megawatt hour
NM Nautical Mile (1852 m)
Pax Passengers
Table of Contents
1 Introduction ................................................................................................................... 1
1.1 Background ............................................................................................................. 1
1.2 Assignment description ........................................................................................... 1
1.3 Aim & purpose ........................................................................................................ 2
1.5 Research questions .................................................................................................. 2
1.6 Limitations .............................................................................................................. 2
2 Methodology .................................................................................................................. 3
2.1 Research characteristics .......................................................................................... 3
2.2 Research strategy .................................................................................................... 3
2.3 Research design ...................................................................................................... 3
2.4 Research process ..................................................................................................... 3
2.5 Methods for data collection and analysis ................................................................ 4
2.5.1 Data collection.................................................................................................. 4
2.5.2 Qualitative interviews ...................................................................................... 5
2.5.3 Cost driver analysis model ............................................................................... 5
2.6 Reflections on research quality ............................................................................... 6
3 Theoretical framework .................................................................................................. 7
3.1 Maintenance organisation ....................................................................................... 7
3.2 Offshore assets ........................................................................................................ 7
3.3 Maintenance strategies ............................................................................................ 8
3.4 Cost drivers ............................................................................................................. 8
3.5.1 Levelised Cost of Energy ............................................................................... 12
3.5.2 Life Cycle Cost............................................................................................... 12
3.6 Capacity balancing and waste ............................................................................... 12
3.7 Previous studies .................................................................................................... 13
4 Empirical findings ....................................................................................................... 15
4.1 Offshore maintenance ........................................................................................... 15
4.1.1 Technician work hours ................................................................................... 15
4.1.2 Team size........................................................................................................ 15
4.1.3 Staggered shift pattern .................................................................................... 16
4.2 Offshore assets ...................................................................................................... 17
4.2.1 CTV ................................................................................................................ 17
4.2.2 Helicopter ....................................................................................................... 18
4.2.3 SOV ................................................................................................................ 18

4.2.4 Platform .......................................................................................................... 19
4.3 Cost drivers of offshore logistics .......................................................................... 19
4.3.1 Distance to shore ............................................................................................ 19
4.3.2 Weather downtime ......................................................................................... 20
4.3.3 Number of turbines......................................................................................... 21
4.3.4 Number of service hours ................................................................................ 22
4.4 Hornsea - baseline ................................................................................................. 23
4.5 Availability ........................................................................................................... 24
5 Analysis ....................................................................................................................... 25
5.1 Cost driver analysis ............................................................................................... 25
5.1.1 Distance to shore ............................................................................................ 25
5.1.2 Weather downtime ......................................................................................... 26
5.1.3 Number of turbines......................................................................................... 28
5.1.4 Number of service hours ................................................................................ 29
5.2 Availability ........................................................................................................... 30
5.3 Service optimization ............................................................................................. 31
5.3.1 The platform concept ..................................................................................... 31
5.3.2 The SOV concept ........................................................................................... 31
6. Discussion ................................................................................................................... 33
7. Conclusion .................................................................................................................. 37
8. Further research .......................................................................................................... 39
References ...................................................................................................................... 40
Table of Figures
Figure 1 Schematic model of cost driver analysis tool ..................................................... 5
Figure 2 Case study of optimal vessel setup (Philips et al., 2013: 12) ............................. 9
Figure 3 O&M costs of offshore wind power (Besnard, 2013: 2) .................................. 10
Figure 4 Illustration of lowest theoretical total cost (Philips et al., 2013: 9) ................. 11
Figure 5 Example of technician time loss during a working day ................................... 15
Figure 6 Illustration of working time following team size and vessel capacity ............. 16
Figure 7 Staggered shift pattern ..................................................................................... 17
Figure 8 Cost impact of distance to shore ...................................................................... 20
Figure 9 Impact of WDT on a CTV setup ...................................................................... 21
Figure 10 Scaling effect of CTV and SOV .................................................................... 22
Figure 11 Impact of decreasing service hours for CTV and SOV.................................. 23
Figure 12 CTV travel distance and Hornsea site ............................................................ 24
Figure 13 Impact of distance to shore on SOV concept ................................................. 26
Figure 14 Impact of WDT on platform concept ............................................................. 27
Figure 15 Impact of number of turbines on SOV and Platform concept ........................ 28
Figure 16 Impact of service hours on SOV and Platform concept ................................. 29
Figure 17 Production-cost optimum of maintenance ..................................................... 30
Figure 18 Cost and availability simulation of service concepts ..................................... 30
Figure 19 Optimal utilization of assets ........................................................................... 31
Figure 20 Potential cost reduction of SOV concept ....................................................... 34
Figure 21 Potential cost reduction of platform concept ................................................. 35


1
1 Introduction This chapter is to give a background within the field of offshore wind power, it describes
the goals of Siemens, and challenges lying ahead for the industry. It further describes the
assignment with two research questions that are to be answered to fulfil the aim and
purpose of this study.
1.1 Background The European Commission has directed a climate goal aiming to increase the use of
renewable energy. The directive requires that 20 percent of the energy within the
European Union should be produced from renewables in 2020 (European Commission,
2009). To reach this target, energy producers have to invest in new cost efficient
technologies that produce energy from renewable sources. Offshore wind power is
believed to be one important technology contributing to the EU's climate goal. This
technology is however in an early stage of industrialisation and in order to make it
competitive against conventional power generation it needs further cost reduction (Kost
et al., 2012).
Siemens have promised their customers a 40 % cost reduction of offshore wind power by
2020 so as to bring the Levelized Cost Of Energy (LCOE) to less than €100 per MWh
(Siemens, 2013). The two main cost are the cost of installation and the cost of service. A
large part of the cost of service pertains to use of efficient logistical systems (Philips et
al., 2013). The logistical setup is an important consideration due to challenges of
remoteness, and often unpredictable weather conditions at offshore Wind Farms (WF).
These challenges are expected to increase in the future, as wind power moves further from
shore. These “farshore” WFs create a need for offshore based solutions such as a Service
Operation Vessel (SOV) or an accommodation platform (Besnard, 2013, Philips et al.,
2013).
In Great Britain alone, 3000 turbines are proposed to be built at farshore sites, with a
distance to shore greater than 40 Nautical Miles (NM). Philips et al. (2013) explored the
performance impact of distance to shore as a cost driver and concludes that it affects
which setup is suitable. Halvorsen-Weare et al. (2013) and Besnard et al. (2013) reveals
other important cost drivers such as weather conditions, number of turbines and turbine
reliability, although no cost driver was subject to analysis. As such it is uncertain how
service will be performed efficiently for future WFs.
With this study the authors want to increase the knowledge within maintenance in the
renewable energy sector by performing a cost driver sensitivity analysis for farshore
service solutions. This is novel within the field as neither the cost drivers of offshore wind
power nor concept comparison between a platform and an SOV solution have been fully
explored academically. It is also a critical field to examine, as wind power experiences a
high cost pressure, and the cost of service will raise as service moves further from shore.
1.2 Assignment description As the current market leader in the segment offshore wind power, Siemens predicts
potential in new ways of organising offshore maintenance for future wind farms. This
study aims at exploring this potential by studying the wind farm Hornsea, which is to host
a large number of turbines. The service organisation serves to maintain the production
2
capacity of the wind farm by conducting preventive and corrective maintenance. Large
factors of the service organisation include: means of transportation, staff, location,
sourcing strategies, service base and bundling possibilities. An optimised maintenance
structure has potential to reduce the service cost.
Initially the assignment intends to take a “snapshot” of the present solutions. By gaining
information from a broad spectrum, this study will provide basic understanding of cost
drivers and key constraints related to offshore maintenance. The maintenance structure is
to be mapped for offshore maintenance of wind farms. This knowledge will further be
used to perform a sensitivity analysis of farshore solutions to reveal the impact of cost
drivers. These results are used as a basis to develop concepts, which are then evaluated
by simulated availability in order to measure their performance. The study is to show a
cost efficient and high performing service solution for Hornsea. Conclusively the study
will examine how service solutions would be affected by a future scenario with decreased
number of service hours.
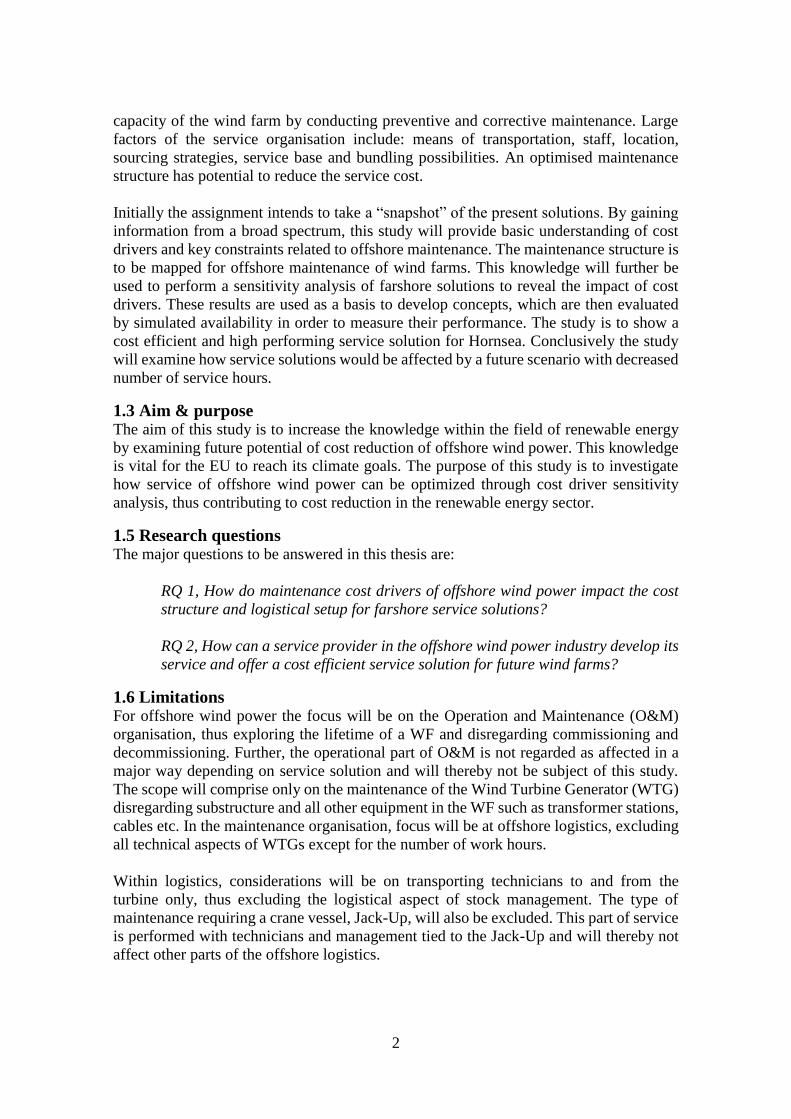
1.3 Aim & purpose The aim of this study is to increase the knowledge within the field of renewable energy
by examining future potential of cost reduction of offshore wind power. This knowledge
is vital for the EU to reach its climate goals. The purpose of this study is to investigate
how service of offshore wind power can be optimized through cost driver sensitivity
analysis, thus contributing to cost reduction in the renewable energy sector.
1.5 Research questions The major questions to be answered in this thesis are:
RQ 1, How do maintenance cost drivers of offshore wind power impact the cost
structure and logistical setup for farshore service solutions?
RQ 2, How can a service provider in the offshore wind power industry develop its
service and offer a cost efficient service solution for future wind farms?
1.6 Limitations For offshore wind power the focus will be on the Operation and Maintenance (O&M)
organisation, thus exploring the lifetime of a WF and disregarding commissioning and
decommissioning. Further, the operational part of O&M is not regarded as affected in a
major way depending on service solution and will thereby not be subject of this study.
The scope will comprise only on the maintenance of the Wind Turbine Generator (WTG)
disregarding substructure and all other equipment in the WF such as transformer stations,
cables etc. In the maintenance organisation, focus will be at offshore logistics, excluding
all technical aspects of WTGs except for the number of work hours.
Within logistics, considerations will be on transporting technicians to and from the
turbine only, thus excluding the logistical aspect of stock management. The type of
maintenance requiring a crane vessel, Jack-Up, will also be excluded. This part of service
is performed with technicians and management tied to the Jack-Up and will thereby not
affect other parts of the offshore logistics.
3
2 Methodology This chapter presents methods used in this study. It describes the characteristics and the
design of this particularly research followed by a description of the research process. It
also describes the methods for data collection, and discusses the validity and reliability
of the research.
2.1 Research characteristics This study focuses on the cost driver impact on service solutions for future WFs and how
concepts can be developed in order to provide customer value while reducing cost of
service. To explore this, in-depth knowledge of the current situation is needed. Data
collected will be compared with literature to test whether the current situation is aligned
with theory giving the study deductive characteristics, meaning theory is driving the
research process (Bryman and Bell, 2011).
Regarding the epistemological consideration: this study coheres with the concept of
positivism, meaning that science should be conducted objectively. For the ontological
consideration the research follows the concept of constructionism, which states that social
phenomena are produced through social interactions and are in a constant state of revision
(Bryman and Bell, 2011).
2.2 Research strategy The research strategy has two general approaches, which can be of guidance when
choosing methods of data collection and analysis; qualitative and quantitative. Qualitative
research is the dominant method for conducting business research and can be used when
data is hard to quantify, or when the sample size is small (Bryman and Bell, 2011).
Quantitative research is suitable when large sample sizes of quantifiable data are
desirable, the approach may also be suitable to test and validate theory. The scope of this
study entailed the use of both research approaches.
In a relatively young industry there is a limited number of experts in the field, this calls
for the use of qualitative methods to incorporate knowledge. Other measures regarding
offshore maintenance are on the contrary well suited for quantitative research. An
example of an area suitable for quantitative research is historical weather data, which can
be used to estimate the accessibility and energy production of wind turbines.
2.3 Research design The research design intends to guide the choice of research method used in a study. Since
this research is based on an in depth investigation of a unique case connected to a single
actor within the industry, a case study research design has been chosen. According to
Bryman and Bell (2011) a case study design has the possibility to grasp the complexity
and particularities of a unique case. This design is also widely used within business and
management research (Bryman and Bell, 2011). Hence the design is deemed appropriate
for the frame of questions in this study.
2.4 Research process During this study, information was continuously collected and documented. The process
is built up of five phases and results from earlier phases were used as a foundation for
later stages in a linear process. This enabled a funnel structure with a wide scope of
learning early in the process and a continuously narrowed focus towards significant areas

4
in later stages. Iterations were however applied when gaps of knowledge were identified
and a broader perspective needed. During the study continuous meetings were held with
the supervisor at Chalmers University of Technology and the project steering group at
Siemens to adjust the development and affirm the goals of the research.
In the first phase a pre-study was conducted to gain knowledge and to form a basic
understanding of maintenance of offshore wind power. Information from the pre-study
was collected from internal company reports, web-based search, and a few qualitative
interviews with people from the industry and academia. By using both written sources
and qualitative interviews, this pre-study provided both preliminary and secondary data.
In the second phase the maintenance structure at Siemens was mapped. This mapping was
done by studying service and logistical data together with collecting additional data from
interviews with logistical and operational experts at Siemens. These interviews had a
semi-structured approach and explored identified cost drivers.
The third phase of this study was to develop a tool for cost calculation. This was done by
developing a model which used 78 variable inputs to calculate cost. The inputs used for
the model consisted of logistical costs provided by Siemens, data for the specific site
Hornsea and turbine reliability. Historical weather data for the period 2001-2013 was
used to simulate accessibility for different means of transportation. The model was
validated against previous calculations of Hornsea service costs.
The fourth phase was to perform a cost driver sensitivity analysis of logistical setups using
the model. This was done by changing parameters for each cost driver individually within
intervals. This analysis provided results for how each cost driver impact the cost. This
phase was to answer RQ 1.
The fifth phase used the results from previous phases to explore possible improvements
of service concepts for Hornsea conditions. These concepts were measured on their
performance through availability simulation using software provided by Siemens. Areas
of potential improvement were explored using the cost calculation tool developed in
phase three in order to answer RQ 2.
2.5 Methods for data collection and analysis Several techniques were used for collecting data and performing analysis in this study.
By describing the execution of each method with its scientific approach in detail, the
authors hope to safeguard the quality and replicability of this study.
2.5.1 Data collection
During the investigation, data was collected from three repositories: it was firstly
collected from easily available sources in the field using web and library search engines.
This gave the authors of this paper a wide range of information during the pre-study
phase.
Secondly, literature was provided from several departments at Chalmers University of
Technology: Department of Technology Management and Economics, Department of
Energy and Environment, and Department of Shipping and Marine Technology. The
snowballing sampling was used which allows one to find new acquaintances of initial
5
respondents through their guidance (Bryman and Bell, 2011). This provided a technical
academic approach to the studied phenomena enabling a multitude of viewing angles.
Thirdly, literature and data was provided by Siemens. Literature provided included both
general industry information, but also included in depth descriptions of operational
challenges and trends. Specific information connected to service logistics and operational
cost was also provided for cost calculations.
For all phases of this study, literature was continuously collected and documented from
various sets of sources. This enabled additional relevant literature based on new
information gained from each phase.
2.5.2 Qualitative interviews
In order to broaden the understanding of current services offered by Siemens, an
exploratory approach was needed. According to Bryman and Bell (2011) a qualitative
approach can help develop the initial research idea. Due to the novelty in the field, and
unknown particularities of how offshore maintenance are offered by Siemens and semi-
structured interviews were applied. Initially, 17 interviews were carried out with experts
in the field within Siemens. The semi-structured interviews assured a coverage of relevant
topics while allowing for respondents to spin off into relevant side-tracks as described by
Bryman and Bell (2011).
2.5.3 Cost driver analysis model
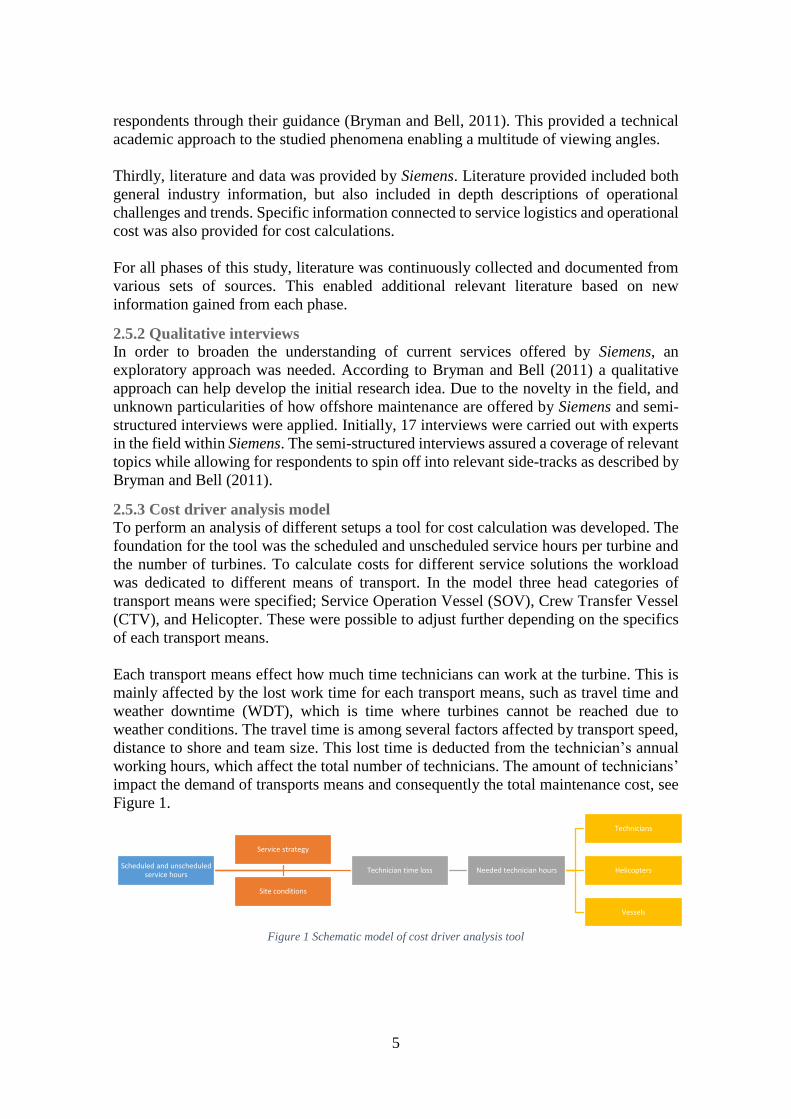
To perform an analysis of different setups a tool for cost calculation was developed. The
foundation for the tool was the scheduled and unscheduled service hours per turbine and
the number of turbines. To calculate costs for different service solutions the workload
was dedicated to different means of transport. In the model three head categories of
transport means were specified; Service Operation Vessel (SOV), Crew Transfer Vessel
(CTV), and Helicopter. These were possible to adjust further depending on the specifics
of each transport means.
Each transport means effect how much time technicians can work at the turbine. This is
mainly affected by the lost work time for each transport means, such as travel time and
weather downtime (WDT), which is time where turbines cannot be reached due to
weather conditions. The travel time is among several factors affected by transport speed,
distance to shore and team size. This lost time is deducted from the technician’s annual
working hours, which affect the total number of technicians. The amount of technicians’
impact the demand of transports means and consequently the total maintenance cost, see
Figure 1.
Figure 1 Schematic model of cost driver analysis tool
Scheduled and unscheduled service hours
Technician time loss Needed technician hours
Technicians
Helicopters
Vessels
Service strategy
Site conditions
6
The output of model, graphically illustrates the effect of cost per turbine by different cost
drivers and setups, e.g. distance to shore, number of turbines, and weather downtime. The
costs were divided into several categories and displayed graphically for each asset type.
For solutions that required offshore accommodation platform, the Capital Expenditures
(CAPEX) of the platform and the maintenance cost per year were illustrated as one cost
component.
2.6 Reflections on research quality A large amount of information was collected from qualitative interviews. The approach
of using semi-structured interviews entails the risk of anchoring, which is influence on
the results depending on which questions are asked (Bryman and Bell, 2011). As such the
respondents needed to have experience within the field as well as the study presented to
them in order to gain accurate responses and ensure high construct validity allowing the
study to measure what it was intended to (Bryman and Bell, 2011). For the reliability, the
semi-structured interviews were held in private to eliminate outside influences. To ensure
consistency of the results further, one researcher performed the interview, while the other
took notes and asked clarifying questions.
Results and data were discussed with an expert group on a weekly basis in order to
confirm the accuracy of conclusions and collected data. Any uncertainties were noted and
followed up with additional interviews to enhance the internal validity. The external
validity of this study can be perceived as low as the study focuses on one single case. This
study did however analyse several correlations between different parameters, which is
presented as a main result. These correlations can to a certain extent be generalized and
applicable for other situations.
Although information largely came from qualitative industry interviews, information was
also collected from scientific papers, together with quantitative industry data. Hence a
triangulation of both source and method was applied in order to improve the quality of
the research.

7
3 Theoretical framework This chapter presents the theory behind this study. It starts by giving an introduction to
service of offshore wind power and describes how maintenance may be structured
together with turbine reliability and availability. Further, it addresses calculation of
energy costs and asset utilization.
3.1 Maintenance organisation Offshore WTGs face harsher environment and are more exposed to breakdowns
compared to WTGs onshore. The offshore conditions have an impact on the cost of O&M,
which amounts to 15 - 30 % of the total cost of energy (Besnard, 2013). Although facing
harsh conditions and high service cost, there are some clear benefits of mounting wind
turbines offshore. The wind speed is high and has low variability, providing a Wind Farm
Operator (WFO) with a high and steady yield (Karyotakis, 2011).
The maintenance organisation is an important aspect of offshore wind power and impacts
both cost and performance. It comprises of the resources required to perform maintenance
such as staffing, sourcing strategies, and the challenge of offshore logistics. In order to
expand the installed capacity of offshore wind power, the logistical challenges will be
even greater as WFs need to be located further away from shore on deeper water with
longer travel distances (Besnard et al., 2013).
Besnard et al. (2013) have identified several critical aspects for the maintenance
organisation of offshore WFs that need to be considered. The location of a maintenance
base is central for the service performance as it affects the travel distance. This location
can be either at a harbour onshore or with technicians accommodated offshore at a
platform or at a larger vessel. Another important aspect is which type of transportation is
used. Vessels or helicopters differ in which type of maintenance they are suitable to
perform, due to differences between scheduled and unscheduled service. The transport
means also differs in limitations and specifications, such as operable wave height, wind
speed, transport capacity, and speed. Location of maintenance base and type of
transportation means will both affect the lead time to serve a wind farm through travel
distance and transport speed (Besnard et al., 2013, Besnard, 2013).
3.2 Offshore assets There are different types of assets serving as transport means and offshore
accommodation for technicians. For transport of technicians, both vessels and helicopters
can be used. The most common vessel is a CTV, which is used for crew and equipment
transport. The CTV usually has a passenger capacity (pax) of 12 or 24 and is used for
daily operations. To decrease transport time, and access the turbine at rough sea
conditions, it is also possible to use a helicopter which hoist technicians directly to the
nacelle at the top of the turbine. Although the fastest means of transport a helicopter is
limited in transportation weight, and has less pax for service operations. There are also
larger helicopter versions, which cannot be used for service but are suitable for crew
transport to an offshore station (Philips et al., 2013, Navigant Consulting, 2013).
If the transport distance is too large from an onshore base, it is necessary to have offshore
accommodation to decrease the time lost in transport (Philips et al., 2013). A platform
serves as an offshore base, which has the possibility to host technicians close to a wind
8
farm. From a platform, either CTVs or helicopters can be used to access the WTGs. The
SOV is another option for offshore accommodation. It is a larger vessel used to host
personnel and transfer technicians and equipment to the WTGs (Navigant Consulting,
2013).
3.3 Maintenance strategies Maintenance refers to technical activities and connected administrative activities, with
the aim of retaining or restoring the function of an item (Besnard, 2013). Tian et al. (2011)
describe three types of maintenance strategies for offshore wind power; corrective-,
preventive- and condition based maintenance. The condition based strategy refers to
studying degradation of components in order to transfer corrective- into preventive
maintenance (Besnard, 2013). Preventive maintenance is also referred to as scheduled
service, while corrective is described as unscheduled service (Philips et al., 2013).
Scheduled service is planned maintenance with a predefined interval or criteria with the
purpose on reducing the probability of failure. It can be either time or usage based. When
time based, a probability distribution is assumed to determine service interval from e.g.
the age of a component. For usage based maintenance the service interval is decided by
the usage of a component. Unscheduled service is on the contrary unplanned maintenance
carried out after failure in order to restore the function of a component or system. This is
usually done when there is no efficient measure to predict failure. From a cost perspective
it is preferable with scheduled service since the cost of the maintenance activities and
production losses can be reduced (Besnard, 2013, Tian et al., 2011).
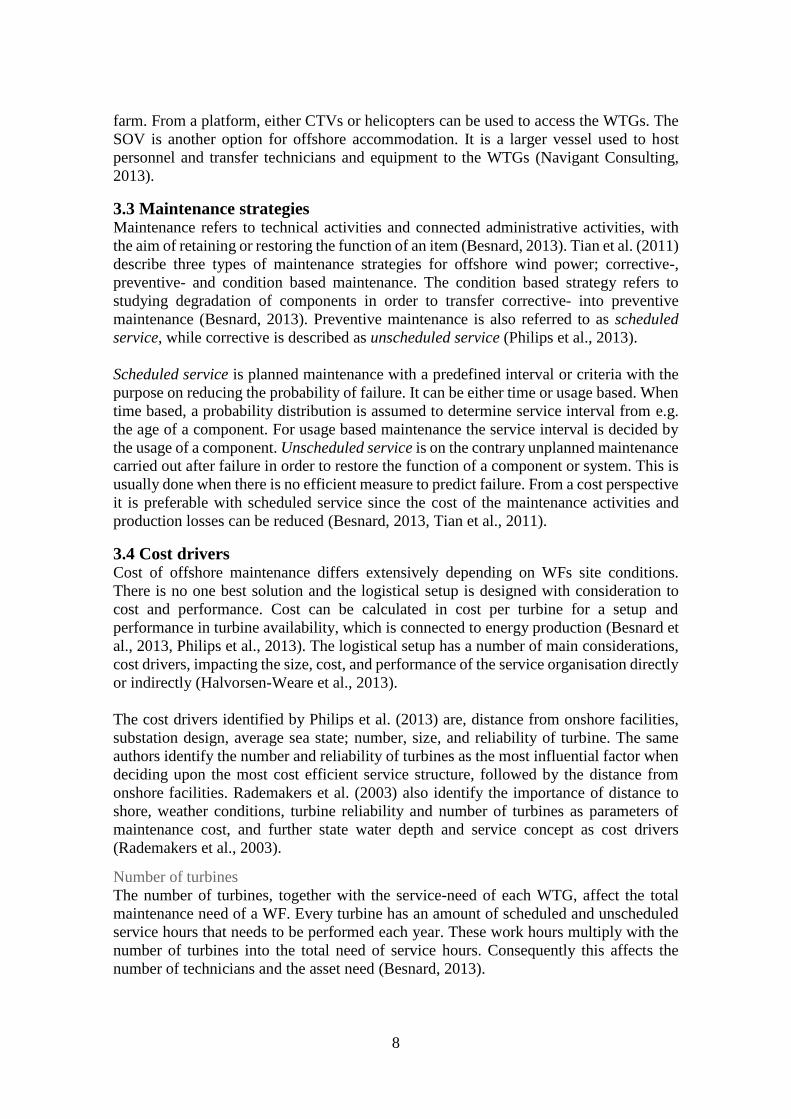
3.4 Cost drivers Cost of offshore maintenance differs extensively depending on WFs site conditions.
There is no one best solution and the logistical setup is designed with consideration to
cost and performance. Cost can be calculated in cost per turbine for a setup and
performance in turbine availability, which is connected to energy production (Besnard et
al., 2013, Philips et al., 2013). The logistical setup has a number of main considerations,
cost drivers, impacting the size, cost, and performance of the service organisation directly
or indirectly (Halvorsen-Weare et al., 2013).
The cost drivers identified by Philips et al. (2013) are, distance from onshore facilities,
substation design, average sea state; number, size, and reliability of turbine. The same
authors identify the number and reliability of turbines as the most influential factor when
deciding upon the most cost efficient service structure, followed by the distance from
onshore facilities. Rademakers et al. (2003) also identify the importance of distance to
shore, weather conditions, turbine reliability and number of turbines as parameters of
maintenance cost, and further state water depth and service concept as cost drivers
(Rademakers et al., 2003).
Number of turbines
The number of turbines, together with the service-need of each WTG, affect the total
maintenance need of a WF. Every turbine has an amount of scheduled and unscheduled
service hours that needs to be performed each year. These work hours multiply with the
number of turbines into the total need of service hours. Consequently this affects the
number of technicians and the asset need (Besnard, 2013).
9
Distance to shore
The distance, which technicians travel in order to access the wind farm, impacts the
service structure. The travel distance between the service base and a WF lead to a time
loss and reduce the time remaining for active work during a shift. When the working time
is decreased, an increased number of technicians and vessels are needed to perform
service. When the time lost in transit is too large, an offshore accommodation is needed
(Besnard et al., 2013, Philips et al., 2013).
Weather conditions
Philips et al. (2013) state the difficulties of getting technicians on and off turbines. A
major part of this pertains to the accessibility of a turbine. The accessibility refers to the
ability to access a turbine using certain means of transport. It is a function of the
limitations of the transport and the weather conditions. In order to execute maintenance a
weather window is needed which covers the travel time and the time of the service
operation (Halvorsen-Weare et al., 2013).
Accessibility of a transport is measured by limitations in significant wave height, wind
and visibility. Significant wave height, Hs, is defined as the top third of a wave (Philips
et al., 2013). It is claimed that an upper limits of vessels is about 2 m Hs and that it might
be periods of 1 - 2 months during wintertime when accessing a turbine is impossible
(Karyotakis, 2011).
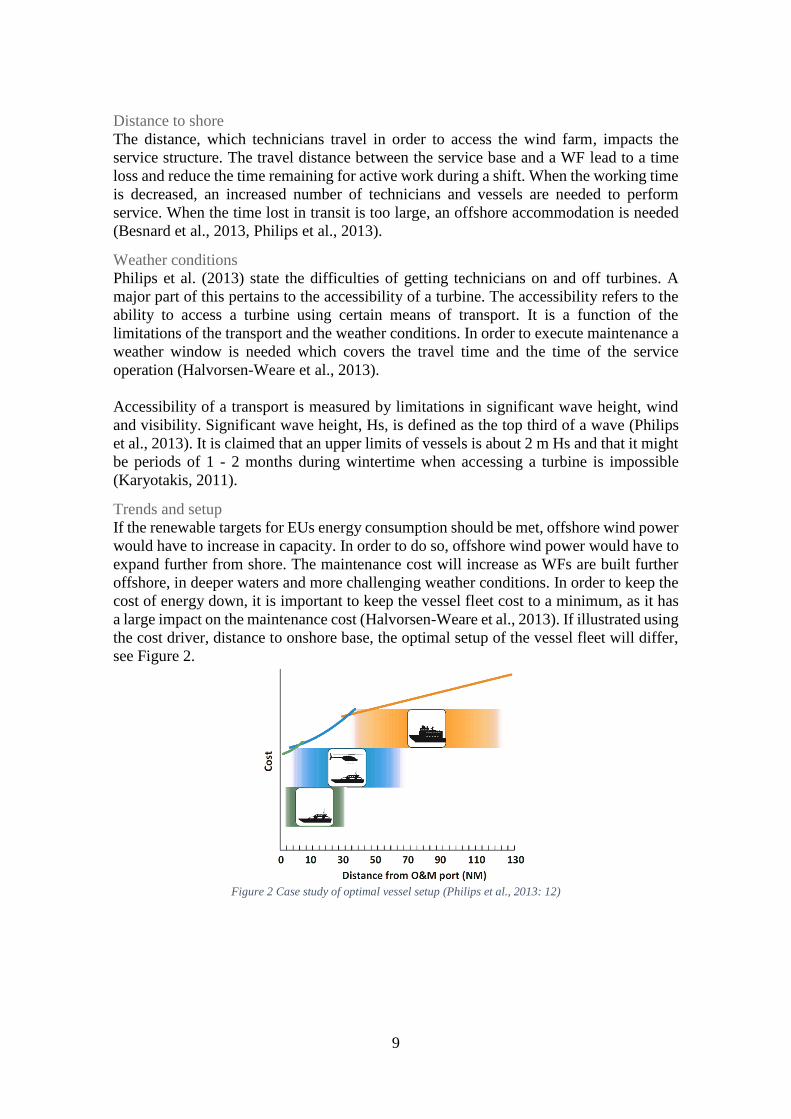
Trends and setup
If the renewable targets for EUs energy consumption should be met, offshore wind power
would have to increase in capacity. In order to do so, offshore wind power would have to
expand further from shore. The maintenance cost will increase as WFs are built further
offshore, in deeper waters and more challenging weather conditions. In order to keep the
cost of energy down, it is important to keep the vessel fleet cost to a minimum, as it has
a large impact on the maintenance cost (Halvorsen-Weare et al., 2013). If illustrated using
the cost driver, distance to onshore base, the optimal setup of the vessel fleet will differ,
see Figure 2.
Figure 2 Case study of optimal vessel setup (Philips et al., 2013: 12)
10
When maintenance is performed further from shore, the overall cost and complexity of
service will increase. In the case study of Figure 2, using a helicopter becomes cost
efficient at a distance of 12 nautical miles from an onshore base. At 40 NM, the time lost
in traveling is so great that an investment in an offshore base become cost beneficial. The
effect of distance to shore as a cost driver will decrease as turbines will be built further
from shore, and offshore concepts become more common in the business (Philips et al.,
2013).
Cost reduction
As offshore wind power is in an early stage of development, large potential cost savings
are expected as the industry develops. The potential cost savings come from many fields.
Financially, the cost of capital is expected to decrease as more WFs are being built
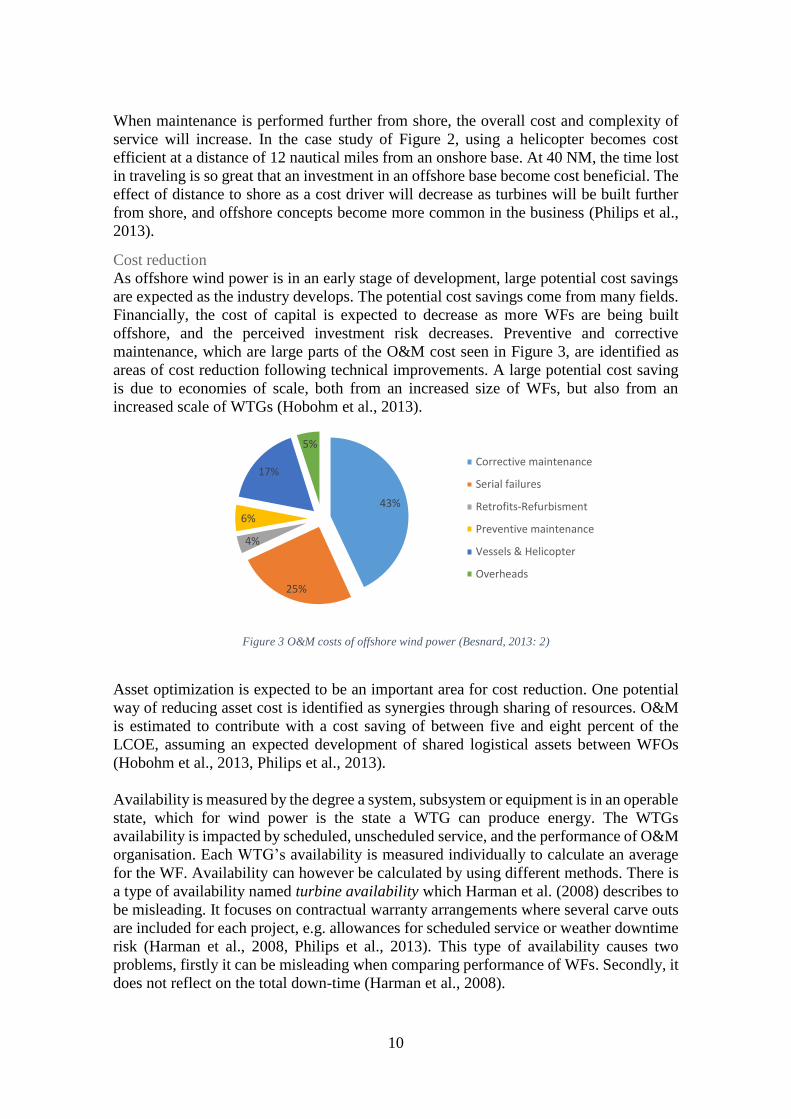
offshore, and the perceived investment risk decreases. Preventive and corrective
maintenance, which are large parts of the O&M cost seen in Figure 3, are identified as
areas of cost reduction following technical improvements. A large potential cost saving
is due to economies of scale, both from an increased size of WFs, but also from an
increased scale of WTGs (Hobohm et al., 2013).
Figure 3 O&M costs of offshore wind power (Besnard, 2013: 2)
Asset optimization is expected to be an important area for cost reduction. One potential
way of reducing asset cost is identified as synergies through sharing of resources. O&M
is estimated to contribute with a cost saving of between five and eight percent of the
LCOE, assuming an expected development of shared logistical assets between WFOs
(Hobohm et al., 2013, Philips et al., 2013).
Availability is measured by the degree a system, subsystem or equipment is in an operable
state, which for wind power is the state a WTG can produce energy. The WTGs
availability is impacted by scheduled, unscheduled service, and the performance of O&M
organisation. Each WTG’s availability is measured individually to calculate an average
for the WF. Availability can however be calculated by using different methods. There is
a type of availability named turbine availability which Harman et al. (2008) describes to
be misleading. It focuses on contractual warranty arrangements where several carve outs
are included for each project, e.g. allowances for scheduled service or weather downtime
risk (Harman et al., 2008, Philips et al., 2013). This type of availability causes two
problems, firstly it can be misleading when comparing performance of WFs. Secondly, it
does not reflect on the total down-time (Harman et al., 2008).
43%
25%
4%
6%
17%
5%
Corrective maintenance
Serial failures
Retrofits-Refurbisment
Preventive maintenance
Vessels & Helicopter
Overheads

11
The availability described above is also misleading according to Conroy et al. (2011)
since energy production from wind power is dependent on wind speed, which fluctuates.
Conroy et al. (2011) argues that energy based (yield based) availability is a more
appropriate method to provide accurate data. Energy based availability considers the non-
linear relation between time and energy production due to different wind speeds, hence
there are no losses for a temporary shutdown during a windless day (Conroy et al., 2011).
Another measurement for comparing setups in financial modelling is system availability,
see Equation 1. This measures time where the turbine is in a functional state, against total
time, disregarding wind data and reasons for downtime. This is the most simplistic
measurement according to Harman et al. (2008).
𝑆𝑦𝑠𝑡𝑒𝑚 𝐴𝑣𝑎𝑖𝑙𝑎𝑏𝑖𝑙𝑖𝑡𝑦 = 𝑇𝑖𝑚𝑒 𝑡𝑢𝑟𝑏𝑖𝑛𝑒𝑠 𝑎𝑟𝑒 𝑟𝑒𝑎𝑑𝑦 𝑡𝑜 𝑜𝑝𝑒𝑟𝑎𝑡𝑒
𝑇𝑜𝑡𝑎𝑙 𝑡𝑖𝑚𝑒 (1)
The system availability is usually 95 - 99 % for onshore WFs due to easy accessibility,
while it has been significantly lower (e.g. Barrow WF in UK with 67 %) in early stages
of offshore WFs due to remoteness, harsh weather conditions and serial failures (Feng et
al., 2010).
Availability has impact on financial performance of the WF. The purpose of the
maintenance organisation is to maintain the WTGs capability to produce energy and
hence generate revenue. A general assumption is that a high performing organisation
which deliver high availability also has higher direct cost of O&M compared to a low
performing organisation (Harman et al., 2008). The cost impact of increasing the
performance of the O&M organisation can be illustrated with an exponential curve, while
lost revenues due to production losses can be illustrated as a linear cost curve correlating
to availability. These two correlations can be mapped into a graph to illustrate the trade-
off, where the sum of lost revenue and the direct O&M cost has a theoretical minimum,
see orange curve in Figure 4 (Philips et al., 2013).
Figure 4 Illustration of lowest theoretical total cost (Philips et al., 2013: 9)
The main driver reducing availability for WTGs is the downtime that appears due to the
Mean Time To Repair (MTTR), and the Mean Logistic Delay Time (MLDT). The sum of
these two components and the Mean time To Failure (MTTF) gives the Mean Time
Between Failure (MTBF), see Equation 2. These measurements can be used to calculate
system availability, see Equation 3 (Mahadevan, 2010, Jin et al., 2012).

12
𝑀𝑇𝐵𝐹 = 𝑀𝑇𝑇𝐹 + 𝑀I𝑇𝑇𝑅 + 𝑀𝐿𝐷𝑇 (2)
𝐴 = 𝑀𝑇𝐵𝐹−𝑀𝑇𝑇𝑅
𝑀𝑇𝐵𝐹 (3)
3.5.1 Levelised Cost of Energy
The LCOE formula, see Equation 4, measures the average cost of energy over the lifetime
of a power plant. By using this formula different types of energy sources can be compared
from a cost perspective. LCOE is calculated as the present value of investment and
operation cost during the lifetime of the plant divided by the value of generated energy
during the corresponding period (Hobohm et al., 2013).
𝐿𝐶𝑂𝐸 =𝑙𝑜 + ∑𝑡=1
𝑛 𝐴𝑡(1+𝑖)𝑡
∑𝑡=1 𝑛 𝑀𝑒𝑙
(1+𝑖)𝑡
(4)
LCOE Levelised cost of energy in Euro/MWh lo Capital expenditure in Euro At Annual operating costs in Euro in year t Mel Produced electricity in the corresponding year in MWh i Weighted average cost of capital in % n Operational lifetime t individual year of lifetime
3.5.2 Life Cycle Cost
Nilsson and Bertling (2007) used Life Cycle Cost (LCC) to calculate the total
maintenance cost during the lifetime of a WF, LCC is calculated by Equation 5. The LCC
contains cost for maintenance and the cost of production losses. Maintenance cost is the
direct cost of maintenance, while production losses is the cost of lost revenue. The aim is
to minimise the LCC, consequently reducing maintenance cost and/or increasing
availability.
𝐿𝐶𝐶 = 𝐶𝐼𝑛𝑣 + 𝐶𝐶𝑀 + 𝐶𝑃𝑀 + 𝐶𝑃𝐿 + 𝐶𝑅𝑒𝑚 (5) 𝐶𝑖𝑛𝑣 Cost of the investment
𝐶𝐶𝑀 Cost for corrective maintenance
𝐶𝑃𝑀 Cost for preventive maintenance
𝐶𝑃𝐿 Cost for production loss
𝐶𝑅𝑒𝑚 Remainder value
3.6 Capacity balancing and waste When capacity is increased, unit cost often reduces in what is referred to as economies of
scale. Fixed cost do not usually increase to the proportion of changes in capacity need.
When increasing capacity, fixed costs often increase stepwise following additional
investments. The points of capacity increase is referred to as fixed cost breaks by Slack
et al. (2013). In order to maintain an optimal cost level, it is important to match capacity
with demand. If there is an overcapacity, the unit or production cost would be higher as
fixed investments could have been shared over additional units. Should the demand be
greater than the capacity there is a risk of additional cost such as overtime or increased
maintenance cost of assets (Slack et al., 2013: 168).

13
When investing in additional capacity, it may be disadvantageous if the capacity steps are
large. With a large increase in production capacity, there is a risk of low asset utilization
following the fixed cost break. Thus, investing in several assets with lower capacity will
enable a better match between capacity and demand curve. Slack et al. (2013) also
identify other factors with potential of influencing unit cost including several types of
waste of both asset and technician capacity. Waiting time and transportation are typical
types of waste connected to work efficiency (Slack et al., 2013: 472).
3.7 Previous studies A few previous studies have been found which examine the cost of offshore maintenance.
Hofmann and Sperstad (2013) made a comparison between an SOV and a platform
concept, which showed a higher availability for the SOV concept. In the study the SOV
were however equipped with a crane, which decreased the lead time of waiting for a crane
ship. Philips et al. (2013) studied the impact of the cost driver distance to shore and
concluded that an offshore accommodation would be beneficial for a travel distance to
WF exceeding 40 NM.
Besnard (2013) developed a tool for analysing the cost structure of a wind farm with 100
5MW turbines using the weather conditions of the WF Horns Rev, and a travel distance
of 32 NM. The study took into account the availability of the WF as a factor, thus
calculating the service cost from a WFO perspective. The study compared the cost of
performing service from an onshore base or a platform, and concluded that a platform
solution would be the most cost beneficial. For the logistical setup, the lowest total cost
is achieved when servicing the WF using CTVs with a wave limitation of 2 m Hs. It also
showed a connection between increasing failure rate, and the cost benefit of having a
helicopter or platform (Besnard, 2013).

14

15
4 Empirical findings In this chapter data collected through the assignment will be presented. Important
maintenance factors such as work hours, logistical assets and cost drivers will be
described.
4.1 Offshore maintenance Although there is an IEC standard for what is regarded as corrective and preventive
maintenance, Siemens has chosen its own definition, dividing maintenance into scheduled
and unscheduled service. Scheduled service is planned and performed on an annual basis,
while all other service is regarded as unscheduled service. For scheduled service Siemens
deploy three technicians to the turbine, while unscheduled service generally is performed
by service teams of two technicians. The division of annual working hours between
scheduled and unscheduled service is comparable when considering the lifetime of a
WTG.
4.1.1 Technician work hours
The annual working time and the technicians cost differs between regions, for this
investigation Siemens UK conditions apply. The shift pattern is 12 hours per day for 7 or
14 days in a row. If service is performed from an onshore base, technicians will have a
deduction in working time and get paid for fewer hours during WDT days.
Apart from WDT, there are other time losses for technicians. From Siemens experience,
about two hours of the working day are lost in briefings and other activities. Time for
transportation within and outside WF is added to that, limiting the time work can be
conducted at turbines during a working day. These figures added together can be used to
calculate the utilization of the work force, see Figure 5. A low utilization results in an
increased number of technicians needed to perform required work hours, leading to an
increased demand of logistical assets for transport.
Figure 5 Example of technician time loss during a working day
4.1.2 Team size
The time loss differs with the type of transport used. For a CTV or helicopter the team
size will also have an impact, since all teams in the vessel start and end at the same time.
This implies that there is waiting time for several teams in the beginning and end of each
shift.
The time spent in transportation is affected by the amount of service teams, together with
the number of technicians, which is consequently affected by team and vessel size. Figure
6 shows technician waiting time for different vessel and team sizes, assuming full vessel
utilization. In the two bottom bars, the difference in time loss is displayed for 4 teams and
Travel time
Average waiting time in wind farm (drop off and pick up)
Other lost time (briefings, lunch, toilet)
Actual effective working hours
12 h

16
12 or 24 technicians being dropped off. In the two top bars, the difference in time loss is
due to a change in team size only, having 4 or 8 teams being dropped off. From the figure
it can be derived that the amount of teams have a larger impact for technician time loss
than the amount of technicians. It can also be seen that it is possible to increase technician
utilization by increasing team size. It is however uncertain whether or not this is beneficial
for unscheduled service where the required team size is two. For scheduled service it is
regarded as possible to increase team size from today’s three to six technicians working
at large WTGs.
Figure 6 Illustration of working time following team size and vessel capacity
4.1.3 Staggered shift pattern
Staggered shift pattern is a model which implies that the working hours of technicians are
spread out during the day and each shift start its working day with an offset of time period
t to previous shift. By using this model, technician waiting time, which appears due to
transportation, can be reduced. With this shift pattern it is possible to increase technician
utilisation, especially if used with a vessel which is able to stay in the wind farm during
the night (e.g. SOV). It could also be used for other transport means, which are able to
return to a base or harbour to pick up new teams.
The purpose of the staggered shift pattern is to increase the technicians’ time at the
turbines by decreasing time wasted in transportation. This implies that the working day
for the vessel is set by the working hours per shift plus, the compounded offset of
additional shifts (e.g. 12 hours working day, 5 teams, 1 hour offset gives a 16 hours
staggered shift). By increasing the number of technicians for each shift the same amount
of work could be performed by less number of shifts, given that the technicians efficiency
at the turbine is unaffected by team size.
The number of shifts and their working day can be illustrated as the left side of Figure 7,
which illustrates eleven teams in a staggered shift pattern with one hour offset per shift.
The theoretical optimum usage of an SOV under these conditions is illustrated in the left
side of the figure. Each shift is dropped off during one hour and spends ten hours at the
turbine before the shift is picked up during the last hour. The right side of the figure shows
an example where the third shift is being picked up after two hours of work to continue
work on another turbine (in this example it could be regarded as unscheduled work). This
causes one hour delay for team 6, two hours delay for team 7 – 9 and two lost working
days for team 10 and 11. This serial delay results in significantly larger time losses
compared to not utilising shift 3 for the rest of the day.
0 1 2 3 4
12 PAX, team size 3
24 PAX, team size 6
24 PAX, team size 3
Hours

17
Figure 7 Staggered shift pattern
4.2 Offshore assets The following chapter will describe the different assets suitable for offshore maintenance.
It will further present technical specifications, limitations, and suitable usage.
4.2.1 CTV
The most common size for CTVs at Siemens is 12 pax, this due to larger time losses of
using 24 pax vessels. Using a smaller CTVs also increases the possibility to match
capacity with demand, the vessel cost per pax is however lower for a 24 pax compared to
a 12 pax CTV.
The technicians spend a relatively large part of the day in the CTV, travelling to and
within the wind farm. This causes seasickness for some of the technicians during rough
weather conditions, which leads to time loss to recover for up to 30 minutes. An onshore
CTV usually has large time losses during the transport between harbour and WF. The
transit speed is 20 kt, but speed limitations may occur within the harbour. The transit time
between harbour and wind farm is limited to 1.5 hours by Siemens. This means that a
CTV with a transit speed of 20 kt is at maximum, able to serve a site 30 NM from
harbour/base.
There are different types of CTVs that can be divided into three generations, where the
first generation is a standard vessel used in the offshore oil and gas industry. The second
generation is a catamaran vessel designed specifically for WF maintenance and is the type
mainly used today. The second generation has better weather and loading capabilities than
the first generations single hull design. There is currently a third generation under
development, using jet engines for transportation at approx. 30 kt. This generation of
vessel is a hovercraft type and can operate in harsher weather conditions due its design.
A hovercraft vessel will however not be able to carry the same amount of tonnage and
has a higher daily cost than its predecessor.
The CTVs are limited to how much cargo they can carry as well as by weather conditions.
The main limitation for CTVs is the wave height, ranging from 1.5 to 1.75 m Hs for CTVs
used today, but wind speed can also be critical. The direction of the step over at the WTG
can be a limiting factor since vessel stability is influenced not only from the wave height
and wind speed, but also by the direction of wave, wind and current.
0 4 8 12 16 20 24
1
3
5
7
9
11
0 4 8 12 16 20 24
1
3
5
7
9
11
18
4.2.2 Helicopter
There are two types of helicopters which Siemens consider to utilize for offshore
maintenance; a small type suitable for Helicopter Hoisting Operation (HHO), and a larger
type not allowed for HHO operations but suitable for transfer to offshore base.
A helicopter has the possibility to transfer technicians to turbines with a high transfer
speed and hoisting a service team in about one minute. Although helicopters can transfer
4 technicians to a range exceeding 70 NM if offshore refuelling is possible, a shorter
distance is preferable for operations. A helicopter used for hoisting operations has 5-7
pax, but is heavily restricted by weight limitations. The weight restriction is
approximately 600 kilogram in total but differs with the transport distance. If the distance
is short, less fuel is needed and more weight can be transported. Due to weight limitation,
the helicopter is regarded more suitable for unscheduled service, as the scheduled service
includes a heavy service package and would require multiple trips.
The helicopter has a relatively high accessibility with a weather downtime of approx. 15
%, with restrictions set by visibility and wind speeds exceeding 20 m/s. For nearshore
operations a helicopter can fly teams out to WF directly. When using a helicopter for
operations further offshore, there is a cost advantage of having a helipad for ranges
exceeding 20 NM. This cost advantage is due to a regulatory limitation of hoisting to one
WTG at a time. If there is a helipad in WF two teams can be carried out to different
WTGs, with one service team being dropped off at helipad waiting to be hoisted.
4.2.3 SOV
The SOV is a vessel with accommodation capability suitable for service far from shore.
The first SOV is currently under construction for Siemens and is to be launched in 2015.
The main reason of introducing the SOV is to increase utilization of technicians, this is
due to less WDT compared with other vessels and its capability to stay in WF for longer
periods of time. The vessel has capacity for 40 pax, of which approximately 5 will be
reserved for site management. It has the capacity to carry eight 20 ft containers of cargo,
which enable it to host necessary equipment for service. In addition the SOV is equipped
with a daughter craft, which can be used to transport service teams for unscheduled
service during calm weather conditions.
The SOV is to operate in WFs for two weeks, returning to harbour only for refuelling and
loading of supplies. The vessel is therefore suitable to service WF at farshore locations,
where an onshore base is not an alternative. To utilize the technicians at the SOV
efficiently, a staggered shift pattern will be used. The SOV is planned to perform mainly
scheduled service for several WTGs within the same area of the WF simultaneously.
For service operations there are safety rules limiting the operational distance. There is a
30 minute rule for reaching technicians with first aid and a 60 minute rule for a more
advanced level of medical assistance. All technicians have first aid training and if the
team size is 3 or above, the 30 minute rule is regarded as fulfilled. The transfer time
between two turbines is estimated at 60 minutes. The regulations make it hard to perform
unscheduled service with the vessel since all teams must be deployed in the same area of
the WF. The time limit is estimated to be covered within 5 turbines distance.

19
The currently developed SOV is limited to 2.3 m Hs, but can access the turbine from all
directions due to its gangway access system. This means that wave and current direction
is not as critical for the SOV as for smaller vessels. For the daughter craft the limitation
in wave height is 1 m Hs, and accessing of the turbine is restricted to landing on the
turbine. The transit speed of the SOV is 15 kt outside of WF. When moving in WF a
dynamic positioning system needs to be used, limiting the transit speed to 5 kt. To exit
the dynamic positioning system takes approx. 15 min, to turn it back on is however a
procedure of about one hour. The positioning system is therefore not possible to exit if
service teams are deployed in WF using the SOV only, due to the safety regulations of 30
and 60 minutes.
4.2.4 Platform
An offshore platform is an offshore base, which serves as accommodation for technicians.
The platform is fixed to a location and by using an offshore base it is possible to reduce
the transport time to a WF and thereby technician time loss. The platform has a helipad
and possibility of docking vessels, e.g. CTV for technician transport. There are sites
having offshore accommodation platform today, however it is rare due to a large initial
investment estimated to around €70 million. Some platforms are used only during
summer time for performing scheduled service.
4.3 Cost drivers of offshore logistics When considering service of a WTG, it is possible to assess the amount of service which
needs to be done in a WF on a yearly basis. These values are the starting point of
calculating the logistical setup. When the effective working time is known, the number
of technicians and fleet composition can be calculated for offshore maintenance.
Depending on the chosen offshore assets, the amount of technicians will vary due to
differences in time loss for accessing the turbine. The cost and efficiency of service is
highly affected by the site conditions and the most suitable offshore setup of a WF will
vary. The main conditions identified affecting the cost of service, hence referred to as
cost drivers are:
1. Distance to shore
2. Weather downtime
3. Number of turbines
4. Service hours
In order to understand their impact on the service structure, they will be explored
individually in depth and later used as a means of analysis.
4.3.1 Distance to shore
A key measurement for the location of a WF is distance to shore. This measurement is
the shortest possible distance between a wind farm and a harbour. However, the distance
to harbour is longer if the harbour is not situated on the exact nearest onshore spot to the
WF. This means that the travel distance is usually longer than the distance between WF
and shore. The travel distance could also be affected due to areas where it is not possible
to travel e.g. islands or restricted zones.
There are also differences between transportation means, vessels travel by sea while
helicopters travel airborne. This means that there is a need for two types of ports, one port
20
for vessels and one for helicopters. These can be in the same location, where the helipad
is situated in the harbour, or located separately e.g. by using an already existing airport.
For this study the assumed distance to shore equals the travel distance to harbour and the
same travel distance is assumed for vessels and helicopters.
The distance to shore and the average travel speed have direct correlation with the travel
time to the WF. Due to travel time, each technician loses time waiting to be transported
to the WF, which is deducted from the effective work hours the technician can perform.
In order to cover the same amount of work hours, an increased number of technicians are
needed. Consequently, the number of technicians impact the amount of transport means,
which further impact flight hours and/or fuel cost.
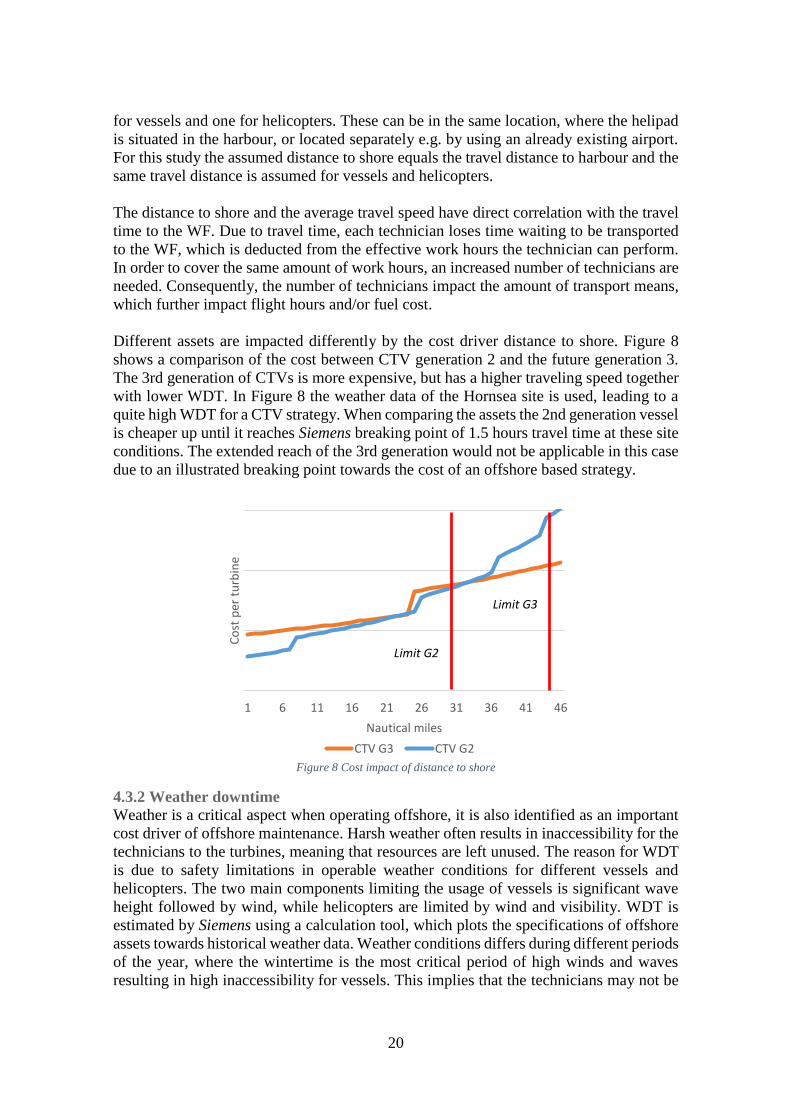
Different assets are impacted differently by the cost driver distance to shore. Figure 8
shows a comparison of the cost between CTV generation 2 and the future generation 3.
The 3rd generation of CTVs is more expensive, but has a higher traveling speed together
with lower WDT. In Figure 8 the weather data of the Hornsea site is used, leading to a
quite high WDT for a CTV strategy. When comparing the assets the 2nd generation vessel
is cheaper up until it reaches Siemens breaking point of 1.5 hours travel time at these site
conditions. The extended reach of the 3rd generation would not be applicable in this case
due to an illustrated breaking point towards the cost of an offshore based strategy.
Figure 8 Cost impact of distance to shore
4.3.2 Weather downtime
Weather is a critical aspect when operating offshore, it is also identified as an important
cost driver of offshore maintenance. Harsh weather often results in inaccessibility for the
technicians to the turbines, meaning that resources are left unused. The reason for WDT
is due to safety limitations in operable weather conditions for different vessels and
helicopters. The two main components limiting the usage of vessels is significant wave
height followed by wind, while helicopters are limited by wind and visibility. WDT is
estimated by Siemens using a calculation tool, which plots the specifications of offshore
assets towards historical weather data. Weather conditions differs during different periods
of the year, where the wintertime is the most critical period of high winds and waves
resulting in high inaccessibility for vessels. This implies that the technicians may not be
1 6 11 16 21 26 31 36 41 46
Co
st p
er t
urb
ine
Nautical miles
CTV G3 CTV G2
Limit G2
Limit G3
21
able to perform work during several days or weeks, which affects the availability of the
turbine and the energy production.
Weather downtime is affected by the transportation type used. A helicopter is unaffected
by wave height and has the highest accessibility. A larger vessel will be able to withstand
higher waves and has less time where turbines are unreachable, but at a higher cost. It is
also possible to use a motion compensation system, which can be mounted on a vessel,
to decrease WDT. The access systems used today needs to be mounted on a larger vessels,
such as an SOV. There are tests regarding mounting access systems on CTVs, these
systems are however not used by Siemens due to uncertainties regarding safety.
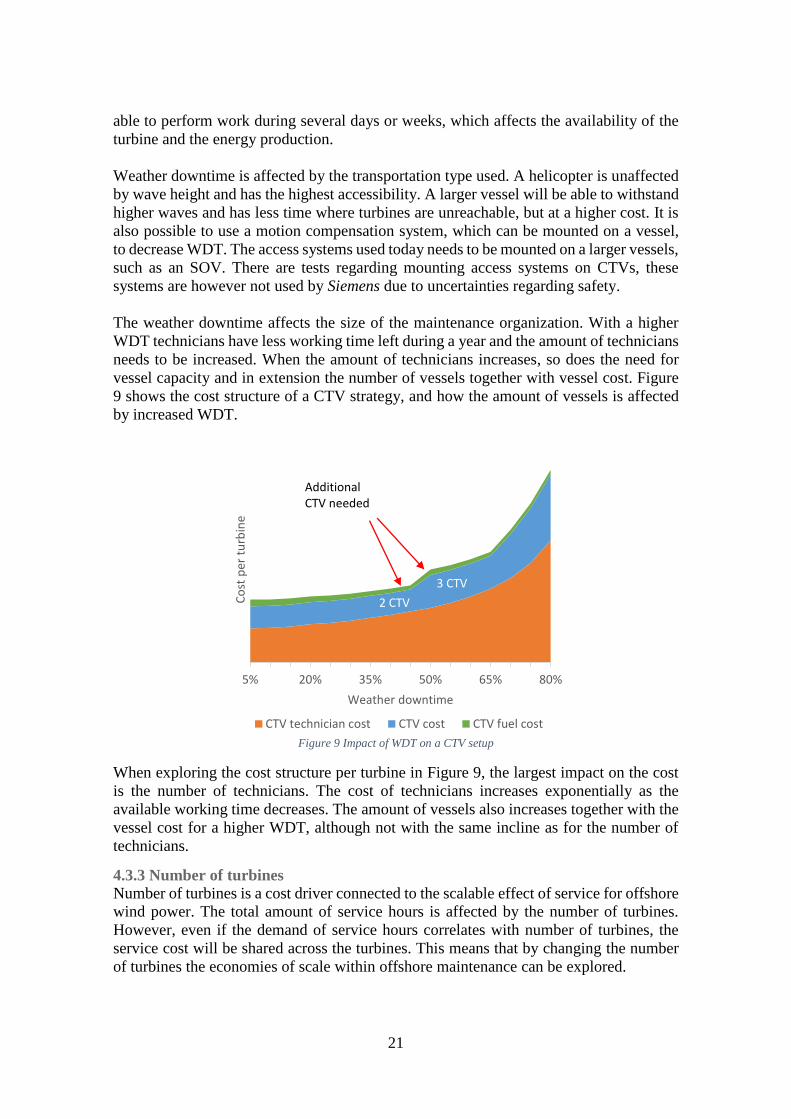
The weather downtime affects the size of the maintenance organization. With a higher
WDT technicians have less working time left during a year and the amount of technicians
needs to be increased. When the amount of technicians increases, so does the need for
vessel capacity and in extension the number of vessels together with vessel cost. Figure
9 shows the cost structure of a CTV strategy, and how the amount of vessels is affected
by increased WDT.
Figure 9 Impact of WDT on a CTV setup
When exploring the cost structure per turbine in Figure 9, the largest impact on the cost
is the number of technicians. The cost of technicians increases exponentially as the
available working time decreases. The amount of vessels also increases together with the
vessel cost for a higher WDT, although not with the same incline as for the number of
technicians.
4.3.3 Number of turbines
Number of turbines is a cost driver connected to the scalable effect of service for offshore
wind power. The total amount of service hours is affected by the number of turbines.
However, even if the demand of service hours correlates with number of turbines, the
service cost will be shared across the turbines. This means that by changing the number
of turbines the economies of scale within offshore maintenance can be explored.
5% 20% 35% 50% 65% 80%
Co
st p
er t
urb
ine
Weather downtime
CTV technician cost CTV cost CTV fuel cost
Additional CTV needed
2 CTV
3 CTV
4 CTV
22
Increased number of turbines leads to increased number of scheduled and unscheduled
work hours for the wind farm. This means that there is a need for more technicians and
further an increased number of logistical assets driving the total cost up. However, when
measuring the cost per unit (in this case: cost per turbine), the cost can either increase or
decrease within certain spans.
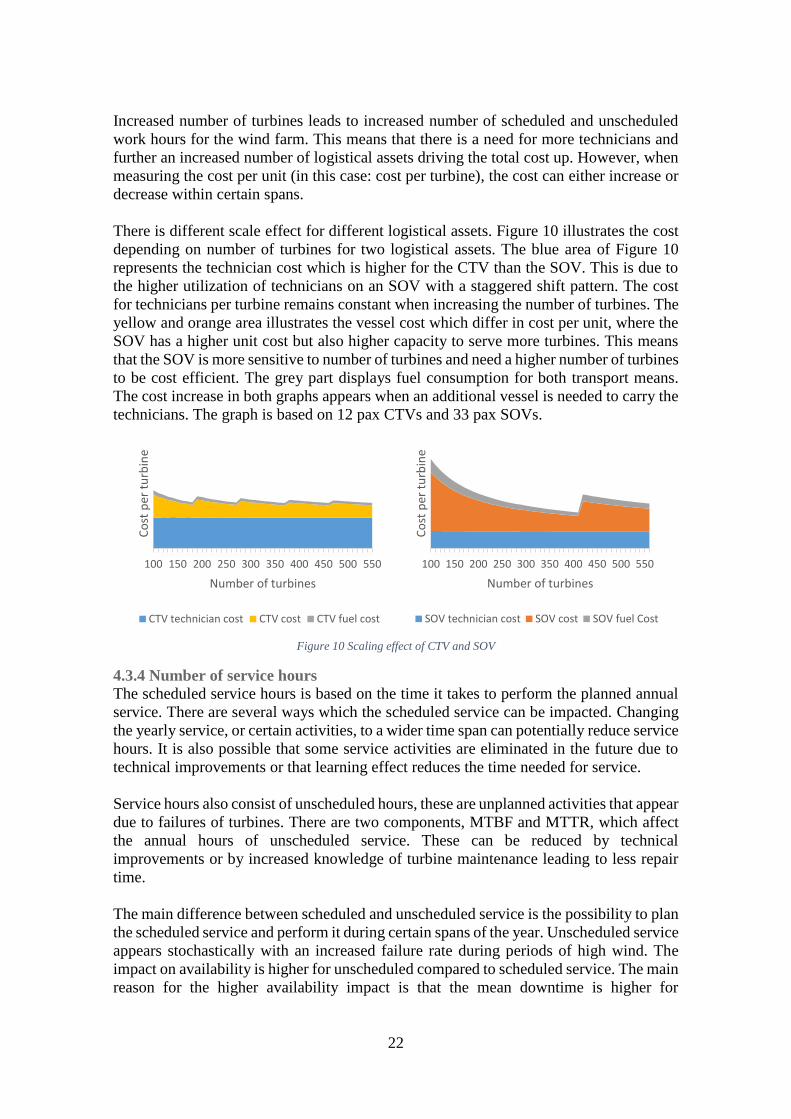
There is different scale effect for different logistical assets. Figure 10 illustrates the cost
depending on number of turbines for two logistical assets. The blue area of Figure 10
represents the technician cost which is higher for the CTV than the SOV. This is due to
the higher utilization of technicians on an SOV with a staggered shift pattern. The cost
for technicians per turbine remains constant when increasing the number of turbines. The
yellow and orange area illustrates the vessel cost which differ in cost per unit, where the
SOV has a higher unit cost but also higher capacity to serve more turbines. This means
that the SOV is more sensitive to number of turbines and need a higher number of turbines
to be cost efficient. The grey part displays fuel consumption for both transport means.
The cost increase in both graphs appears when an additional vessel is needed to carry the
technicians. The graph is based on 12 pax CTVs and 33 pax SOVs.
Figure 10 Scaling effect of CTV and SOV
4.3.4 Number of service hours
The scheduled service hours is based on the time it takes to perform the planned annual
service. There are several ways which the scheduled service can be impacted. Changing
the yearly service, or certain activities, to a wider time span can potentially reduce service
hours. It is also possible that some service activities are eliminated in the future due to
technical improvements or that learning effect reduces the time needed for service.
Service hours also consist of unscheduled hours, these are unplanned activities that appear
due to failures of turbines. There are two components, MTBF and MTTR, which affect
the annual hours of unscheduled service. These can be reduced by technical
improvements or by increased knowledge of turbine maintenance leading to less repair
time.
The main difference between scheduled and unscheduled service is the possibility to plan
the scheduled service and perform it during certain spans of the year. Unscheduled service
appears stochastically with an increased failure rate during periods of high wind. The
impact on availability is higher for unscheduled compared to scheduled service. The main
reason for the higher availability impact is that the mean downtime is higher for
100 150 200 250 300 350 400 450 500 550
Co
st p
er t
urb
ine
Number of turbines
CTV technician cost CTV cost CTV fuel cost
100 150 200 250 300 350 400 450 500 550
Co
st p
er t
urb
ine
Number of turbines
SOV technician cost SOV cost SOV fuel Cost
23
unscheduled service, where production losses appear from turbine failure until it is
repaired. For scheduled service production losses only appear during the repair time and
there is a possibility to restart the turbine between service days.
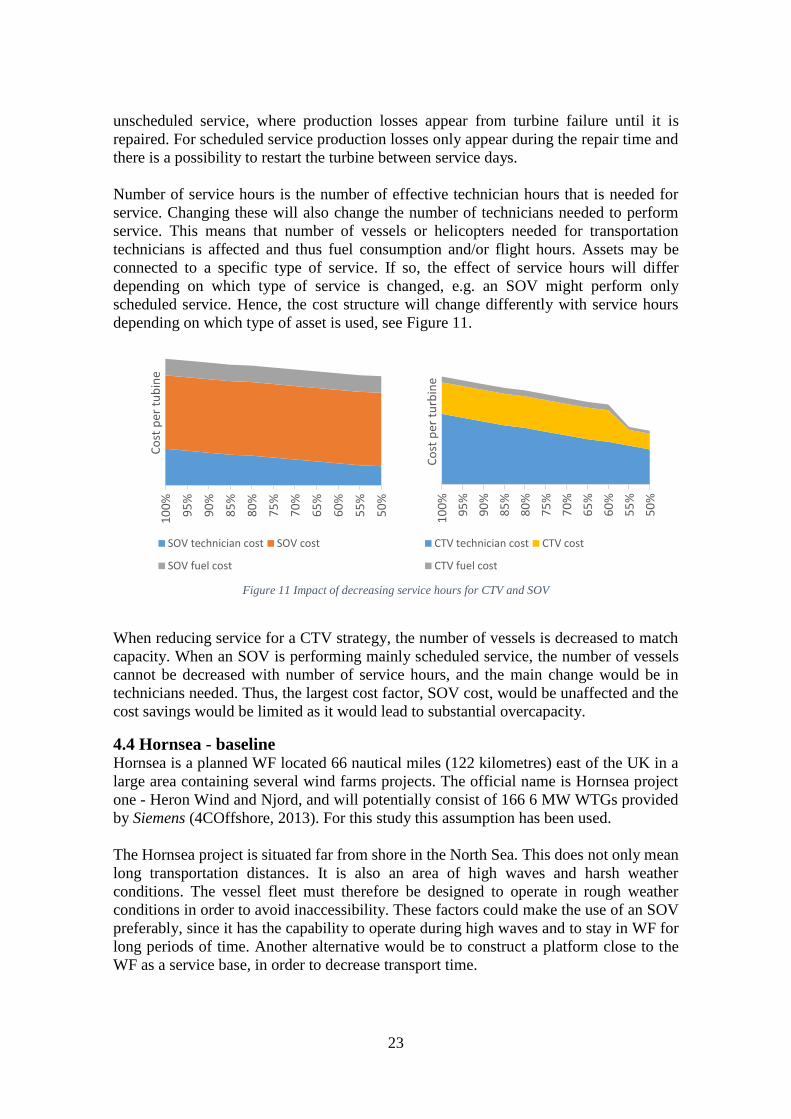
Number of service hours is the number of effective technician hours that is needed for
service. Changing these will also change the number of technicians needed to perform
service. This means that number of vessels or helicopters needed for transportation
technicians is affected and thus fuel consumption and/or flight hours. Assets may be
connected to a specific type of service. If so, the effect of service hours will differ
depending on which type of service is changed, e.g. an SOV might perform only
scheduled service. Hence, the cost structure will change differently with service hours
depending on which type of asset is used, see Figure 11.
Figure 11 Impact of decreasing service hours for CTV and SOV
When reducing service for a CTV strategy, the number of vessels is decreased to match
capacity. When an SOV is performing mainly scheduled service, the number of vessels
cannot be decreased with number of service hours, and the main change would be in
technicians needed. Thus, the largest cost factor, SOV cost, would be unaffected and the
cost savings would be limited as it would lead to substantial overcapacity.
4.4 Hornsea - baseline Hornsea is a planned WF located 66 nautical miles (122 kilometres) east of the UK in a
large area containing several wind farms projects. The official name is Hornsea project
one - Heron Wind and Njord, and will potentially consist of 166 6 MW WTGs provided
by Siemens (4COffshore, 2013). For this study this assumption has been used.
The Hornsea project is situated far from shore in the North Sea. This does not only mean
long transportation distances. It is also an area of high waves and harsh weather
conditions. The vessel fleet must therefore be designed to operate in rough weather
conditions in order to avoid inaccessibility. These factors could make the use of an SOV
preferably, since it has the capability to operate during high waves and to stay in WF for
long periods of time. Another alternative would be to construct a platform close to the
WF as a service base, in order to decrease transport time.
10
0%
95
%
90
%
85
%
80
%
75
%
70
%
65
%
60
%
55
%
50
%
Co
st p
er t
urb
ine
CTV technician cost CTV cost
CTV fuel cost
10
0%
95
%
90
%
85
%
80
%
75
%
70
%
65
%
60
%
55
%
50
%
Co
st p
er t
ub
ine
SOV technician cost SOV cost
SOV fuel cost

24
To explore the future of offshore maintenance, Siemens has chosen to use the site
conditions at Hornsea to develop a baseline. This baseline is calculated with 166 6 MW
turbines and an SOV and helicopter concept performing all service which do not require
a jack-up.
Figure 12 shows the Hornsea site and the closest land based port together with markings
at the maximum travel distance from shore using a CTV strategy with 1.5 hour travel time
each way.
Figure 12 CTV travel distance and Hornsea site
4.5 Availability The most common service contracts between Siemens and a WFO is to use turbine
availability. Exceptions for weather downtime are usually included in these contracts,
meaning that the WFO has the risk of production losses due to inaccessibility. This
implies that the contractual agreement is not directly related to the financial performance
of the WF. Siemens can however potentially raise customer satisfaction by increasing
availability.
There is a trend in the industry where the risk of production losses due to weather
downtime is moved from the WFO to the service company. Two example of this
contracting are system based and energy based availability. This increases the incentives
for the service companies to offer solutions which are less sensitive to WDT. For energy
based availability there is also higher incentives to plan the scheduled service during times
of the year where there is low production.

25
5 Analysis The analysis will describe the impact of identified cost drivers for the farshore solutions
SOV and platform when servicing a WF with Hornsea conditions.
5.1 Cost driver analysis Besnard (2013) and Philips et al. (2013) described a trend in the industry where WFs are
being built further away from shore, with greater logistical challenges. In Siemens case,
this challenge will appear on several future sites and require a different service setup
compared to what is used today, Hornsea is one of these sites.
The distance to shore for Hornsea is 66 NM, hence above the 40 NM Philips et al. (2013)
described as the limit for onshore solutions. Due to the remote conditions of Hornsea, a
farshore solution is necessary to perform service. As described by Besnard (2013) and
Philips et al. (2013) there are two offshore based strategies, an SOV strategy or a platform
strategy. The SOV can perform scheduled service during harsh weather conditions.
However, since the SOV is unable to perform all required unscheduled service at Hornsea,
it would have to be complemented. Helicopter are the only complement which can be
used without having to invest in an additional offshore base, however investment in a
helipad with refuelling capacity is needed. The other option is using a platform concept
together with CTV and possibly helicopter.
The empirical study of Hornsea showed that a 33 pax SOV has a capacity to serve 400
turbines when used for scheduled service only. This means that the SOV has an
overcapacity for scheduled service at Hornseas 166 WTGs. By analysing the sensitivity
of staggered shift pattern together with input from expert interviews, the authors’
estimates that it will be possible to perform 20% of the unscheduled service from the
SOV. The remaining 80% of the unscheduled service is assumed to be performed by
helicopter. Due to safety regulations, the helicopter technicians for SOV concept are
assumed to be accommodated onshore due to uncertainties with restrictions of helicopter
hoisting from SOV in WF.
For the platform concept the same division and utilization of helicopters is made although
CTVs could perform all service at Hornsea. The introduction of helicopters is founded in
the high weather downtime for CTVs at Hornsea, which would have a negative impact
on energy production due to high inaccessibility. The platform is situated outside the wind
farm which means that it is not affected by hoisting regulations for helicopters, hence it
is possible to station helicopter technicians offshore.
5.1.1 Distance to shore
Distance to shore is seen as a major cost driver, something pointed out by Philips et al.
(2013). Due to the remoteness of the Hornsea site, both concepts have to be offshore
based. These solutions are not as cost sensitive regarding the distance to shore as onshore
based solutions due to decreased transport time for the technicians.
SOV
The concept with SOV, where the helicopter technicians are hosted onshore, showed a
cost increase mainly due to increased number of flight hours. This results in a need for an
additional helicopter after 45 NM, see Figure 13. All cost components except the SOV
cost increases with distance to shore. However the increase of fuel is only slightly affected
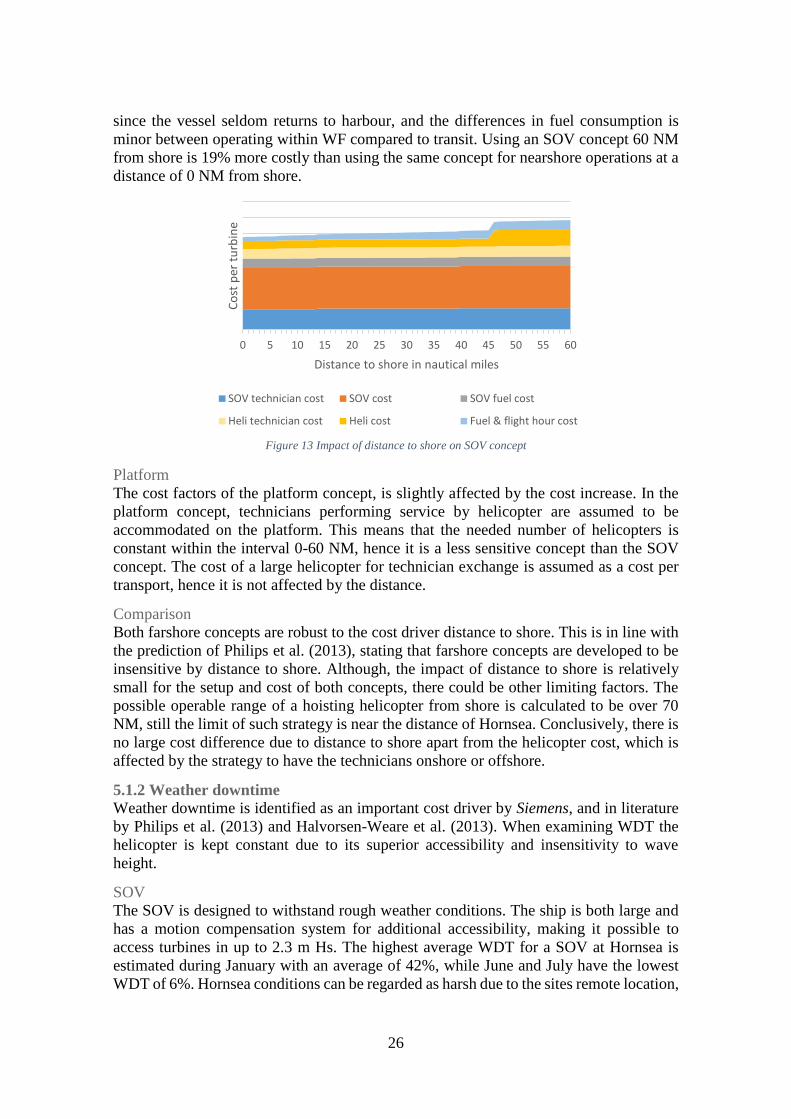
26
since the vessel seldom returns to harbour, and the differences in fuel consumption is
minor between operating within WF compared to transit. Using an SOV concept 60 NM
from shore is 19% more costly than using the same concept for nearshore operations at a
distance of 0 NM from shore.
Figure 13 Impact of distance to shore on SOV concept
Platform
The cost factors of the platform concept, is slightly affected by the cost increase. In the
platform concept, technicians performing service by helicopter are assumed to be
accommodated on the platform. This means that the needed number of helicopters is
constant within the interval 0-60 NM, hence it is a less sensitive concept than the SOV
concept. The cost of a large helicopter for technician exchange is assumed as a cost per
transport, hence it is not affected by the distance.
Comparison
Both farshore concepts are robust to the cost driver distance to shore. This is in line with
the prediction of Philips et al. (2013), stating that farshore concepts are developed to be
insensitive by distance to shore. Although, the impact of distance to shore is relatively
small for the setup and cost of both concepts, there could be other limiting factors. The
possible operable range of a hoisting helicopter from shore is calculated to be over 70
NM, still the limit of such strategy is near the distance of Hornsea. Conclusively, there is
no large cost difference due to distance to shore apart from the helicopter cost, which is
affected by the strategy to have the technicians onshore or offshore.
5.1.2 Weather downtime
Weather downtime is identified as an important cost driver by Siemens, and in literature
by Philips et al. (2013) and Halvorsen-Weare et al. (2013). When examining WDT the
helicopter is kept constant due to its superior accessibility and insensitivity to wave
height.
SOV
The SOV is designed to withstand rough weather conditions. The ship is both large and
has a motion compensation system for additional accessibility, making it possible to
access turbines in up to 2.3 m Hs. The highest average WDT for a SOV at Hornsea is
estimated during January with an average of 42%, while June and July have the lowest
WDT of 6%. Hornsea conditions can be regarded as harsh due to the sites remote location,
0 5 10 15 20 25 30 35 40 45 50 55 60
Co
st p
er t
urb
ine
Distance to shore in nautical miles
SOV technician cost SOV cost SOV fuel cost
Heli technician cost Heli cost Fuel & flight hour cost
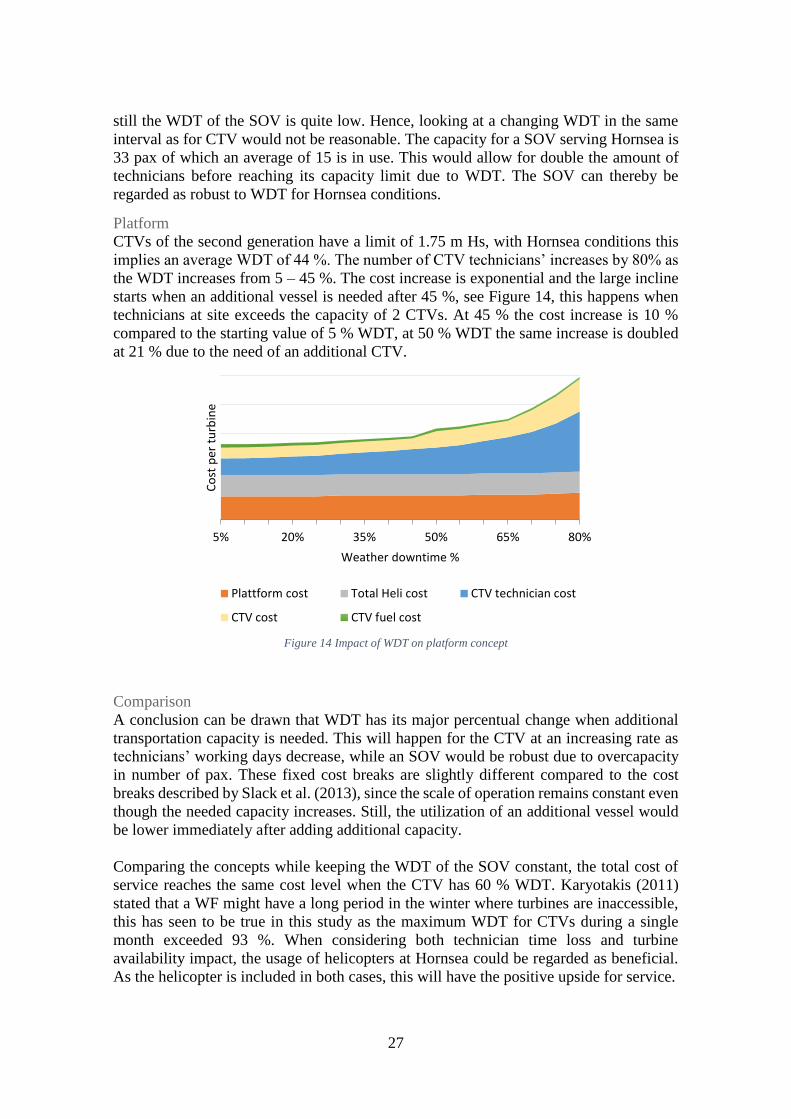
27
still the WDT of the SOV is quite low. Hence, looking at a changing WDT in the same
interval as for CTV would not be reasonable. The capacity for a SOV serving Hornsea is
33 pax of which an average of 15 is in use. This would allow for double the amount of
technicians before reaching its capacity limit due to WDT. The SOV can thereby be
regarded as robust to WDT for Hornsea conditions.
Platform
CTVs of the second generation have a limit of 1.75 m Hs, with Hornsea conditions this
implies an average WDT of 44 %. The number of CTV technicians’ increases by 80% as
the WDT increases from 5 – 45 %. The cost increase is exponential and the large incline
starts when an additional vessel is needed after 45 %, see Figure 14, this happens when
technicians at site exceeds the capacity of 2 CTVs. At 45 % the cost increase is 10 %
compared to the starting value of 5 % WDT, at 50 % WDT the same increase is doubled
at 21 % due to the need of an additional CTV.
Figure 14 Impact of WDT on platform concept
Comparison
A conclusion can be drawn that WDT has its major percentual change when additional
transportation capacity is needed. This will happen for the CTV at an increasing rate as
technicians’ working days decrease, while an SOV would be robust due to overcapacity
in number of pax. These fixed cost breaks are slightly different compared to the cost
breaks described by Slack et al. (2013), since the scale of operation remains constant even
though the needed capacity increases. Still, the utilization of an additional vessel would
be lower immediately after adding additional capacity.
Comparing the concepts while keeping the WDT of the SOV constant, the total cost of
service reaches the same cost level when the CTV has 60 % WDT. Karyotakis (2011)
stated that a WF might have a long period in the winter where turbines are inaccessible,
this has seen to be true in this study as the maximum WDT for CTVs during a single
month exceeded 93 %. When considering both technician time loss and turbine
availability impact, the usage of helicopters at Hornsea could be regarded as beneficial.
As the helicopter is included in both cases, this will have the positive upside for service.
5% 20% 35% 50% 65% 80%
Co
st p
er t
urb
ine
Weather downtime %
Plattform cost Total Heli cost CTV technician cost
CTV cost CTV fuel cost
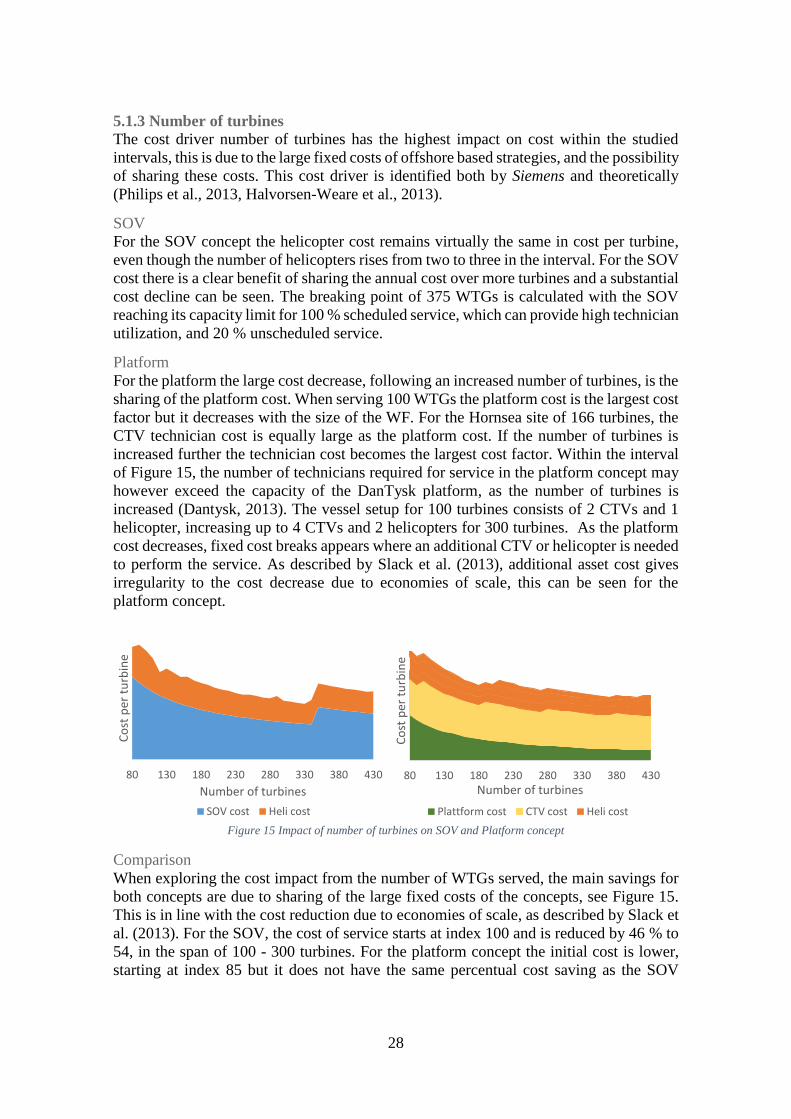
28
5.1.3 Number of turbines
The cost driver number of turbines has the highest impact on cost within the studied
intervals, this is due to the large fixed costs of offshore based strategies, and the possibility
of sharing these costs. This cost driver is identified both by Siemens and theoretically
(Philips et al., 2013, Halvorsen-Weare et al., 2013).
SOV
For the SOV concept the helicopter cost remains virtually the same in cost per turbine,
even though the number of helicopters rises from two to three in the interval. For the SOV
cost there is a clear benefit of sharing the annual cost over more turbines and a substantial
cost decline can be seen. The breaking point of 375 WTGs is calculated with the SOV
reaching its capacity limit for 100 % scheduled service, which can provide high technician
utilization, and 20 % unscheduled service.
Platform
For the platform the large cost decrease, following an increased number of turbines, is the
sharing of the platform cost. When serving 100 WTGs the platform cost is the largest cost
factor but it decreases with the size of the WF. For the Hornsea site of 166 turbines, the
CTV technician cost is equally large as the platform cost. If the number of turbines is
increased further the technician cost becomes the largest cost factor. Within the interval
of Figure 15, the number of technicians required for service in the platform concept may
however exceed the capacity of the DanTysk platform, as the number of turbines is
increased (Dantysk, 2013). The vessel setup for 100 turbines consists of 2 CTVs and 1
helicopter, increasing up to 4 CTVs and 2 helicopters for 300 turbines. As the platform
cost decreases, fixed cost breaks appears where an additional CTV or helicopter is needed
to perform the service. As described by Slack et al. (2013), additional asset cost gives
irregularity to the cost decrease due to economies of scale, this can be seen for the
platform concept.
Figure 15 Impact of number of turbines on SOV and Platform concept
Comparison
When exploring the cost impact from the number of WTGs served, the main savings for
both concepts are due to sharing of the large fixed costs of the concepts, see Figure 15.
This is in line with the cost reduction due to economies of scale, as described by Slack et
al. (2013). For the SOV, the cost of service starts at index 100 and is reduced by 46 % to
54, in the span of 100 - 300 turbines. For the platform concept the initial cost is lower,
starting at index 85 but it does not have the same percentual cost saving as the SOV
80 130 180 230 280 330 380 430
Co
st p
er t
urb
ine
Number of turbines
SOV cost Heli cost
80 130 180 230 280 330 380 430
Co
st p
er t
urb
ine
Number of turbines
Plattform cost CTV cost Heli cost

29
concept and is reduced by 35 % to index 56. The SOV strategy is thereby a cheaper
solution for a WF of approximately 300 turbines.
5.1.4 Number of service hours
The amount of work hours is described by Philips et al. (2013) as an important cost driver.
Siemens identifies improvement potential and a possible reduction in the amount of
service hours as the technology of WTGs develop.
SOV
Looking at a decreased number of service hours performed at Hornsea, the large vessel
cost remains constant. Since the SOV has a high capacity, and the fixed cost cannot be
adapted to a decreasing demand, the only SOV cost saving in the interval of Figure 16 is
due to a decreased number of technicians. In this calculation the SOV is staying offshore
the whole year with a fixed fuel cost for time spent in WF. For the unscheduled service
the total helicopter cost is adaptable, since the number of helicopters can be decreased if
reducing the amount of work hours, see Figure 16. The total cost decrease of 23 % in the
interval would be lower in a case where the number of logistical assets is constant. This
is the case if only the amount of scheduled service performed by the SOV, decreases.
Platform
With a platform concept using CTV and helicopter for transport, the amount of
technicians’ decreases by 50%, for the reduction of service hours seen in Figure 16. The
large cost decrease is where the capacity need is reduced and the number of CTVs is
reduced from 2 to 1. With a setup of one CTV and one helicopter there is no further fixed
cost breaks from reduction of transport means. The total cost reduction in the interval is
30%.
Figure 16 Impact of service hours on SOV and Platform concept
Comparison
When looking at a decreasing number of work hours, the SOV has a 23 % reduction from
index 100 down to 77. The cost savings for the same change of work hours with a CTV
is 30 %, starting at 83 and decreasing down to 58. The platform is initially 17 % cheaper,
this figure increases to 25 % with a service hour reduction of 50 %. When reducing the
amount of work hours, the CTV technician cost reduces in a higher extent than the
technicians using the SOV due to shorter effective working hours for CTV technicians.
10
0%
95
%
90
%
85
%
80
%
75
%
70
%
65
%
60
%
55
%
50
%
Co
st p
er t
ub
ine
SOV technician cost SOV cost
SOV fuel cost Heli technician cost
Heli cost Fuel & flight hour cost
10
0%
95
%
90
%
85
%
80
%
75
%
70
%
65
%
60
%
55
%
50
%
Co
st p
er t
urb
ine
Platform cost CTV technician cost
CTV cost CTV fuel cost
Heli techniician cost Heli cost
Fuel & flight hour cost
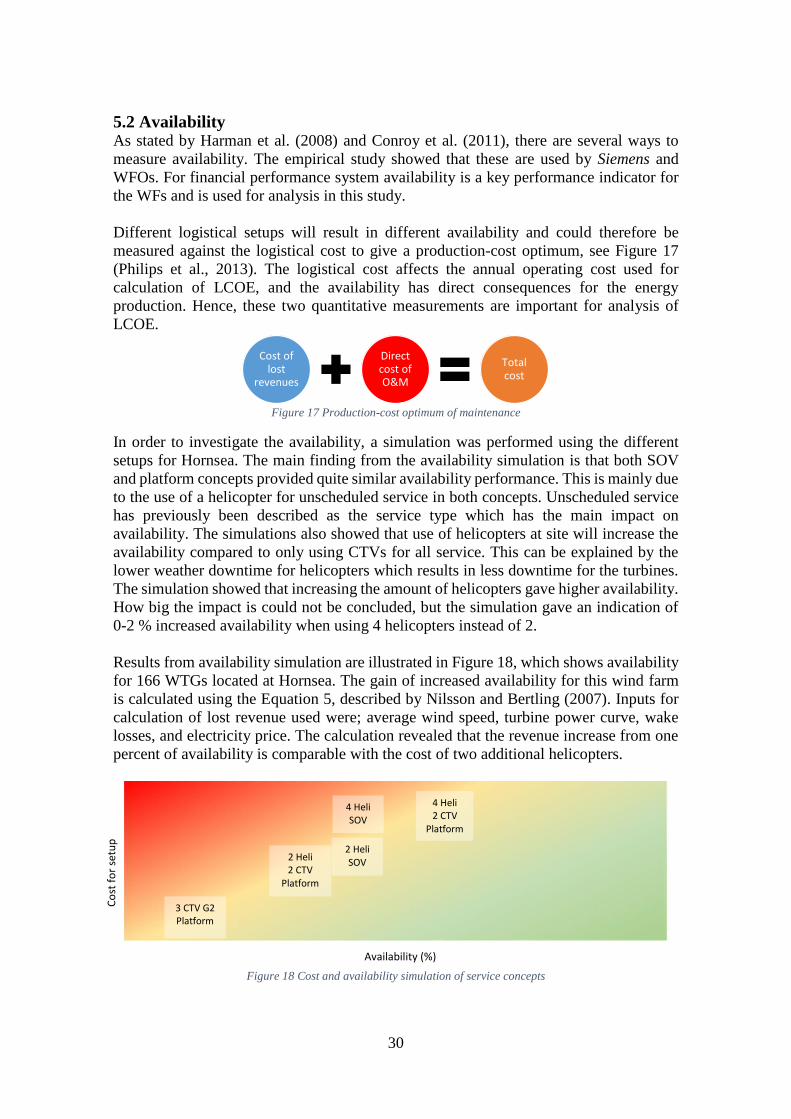
30
5.2 Availability As stated by Harman et al. (2008) and Conroy et al. (2011), there are several ways to
measure availability. The empirical study showed that these are used by Siemens and
WFOs. For financial performance system availability is a key performance indicator for
the WFs and is used for analysis in this study.
Different logistical setups will result in different availability and could therefore be
measured against the logistical cost to give a production-cost optimum, see Figure 17
(Philips et al., 2013). The logistical cost affects the annual operating cost used for
calculation of LCOE, and the availability has direct consequences for the energy
production. Hence, these two quantitative measurements are important for analysis of
LCOE.
Figure 17 Production-cost optimum of maintenance
In order to investigate the availability, a simulation was performed using the different
setups for Hornsea. The main finding from the availability simulation is that both SOV
and platform concepts provided quite similar availability performance. This is mainly due
to the use of a helicopter for unscheduled service in both concepts. Unscheduled service
has previously been described as the service type which has the main impact on
availability. The simulations also showed that use of helicopters at site will increase the
availability compared to only using CTVs for all service. This can be explained by the
lower weather downtime for helicopters which results in less downtime for the turbines.
The simulation showed that increasing the amount of helicopters gave higher availability.
How big the impact is could not be concluded, but the simulation gave an indication of
0-2 % increased availability when using 4 helicopters instead of 2.
Results from availability simulation are illustrated in Figure 18, which shows availability
for 166 WTGs located at Hornsea. The gain of increased availability for this wind farm
is calculated using the Equation 5, described by Nilsson and Bertling (2007). Inputs for
calculation of lost revenue used were; average wind speed, turbine power curve, wake
losses, and electricity price. The calculation revealed that the revenue increase from one
percent of availability is comparable with the cost of two additional helicopters.
Figure 18 Cost and availability simulation of service concepts
Cost of lost
revenues
Direct cost of O&M
Total cost
3 CTV G2
Platform
4 Heli 2 CTV
Platform
Availability (%)
2 Heli SOV
2 Heli 2 CTV
Platform
Co
st f
or
setu
p
4 Heli SOV

31
5.3 Service optimization In order to further explore the farshore concepts, areas of importance for the cost structure
of service is followed up in this chapter. The analysis is performed for the concepts
individually and presented below.
5.3.1 The platform concept
For the platform combined with CTV and helicopter, the importance of capacity
utilization will be lifted, this is pointed out by Slack et al. (2013) as significant for the
cost. In order to balance utilization of resources used for service, work division should be
subject to consideration. In Figure 19, the helicopter usage is investigated on the amount
of unscheduled service performed in the WF. The helicopter usage can balance the
resource utilization of the CTV. When reaching an optimum balance, the amount of assets
could potentially be reduced. The total cost span between the worst and optimal usage is
10.5 %. From the initial assumption in the cost driver analysis, with the helicopter
performing 80 % of the unscheduled service, the number of assets is already at a
minimum. Increasing the service performed by helicopter up to 95 % would lead to a
potential cost saving of 1.4 %.
Figure 19 Optimal utilization of assets
Another observation connected to utilization of technicians is the impact of team size for
CTV usage. Due to the waiting time between drop offs from a CTV, there is a time waste
between the first team being dropped off, and the last. When exploring the possibility of
increasing the team size of scheduled service, from today’s three to six technicians, a cost
reduction can be seen. If reducing the waiting time by an increased team size, the needed
number of technicians is reduced. The total cost savings of doubling the team size for
scheduled service would amount to 1.8 %.
5.3.2 The SOV concept
For the SOV, one area of improvement is the helicopter utilization. In the initial SOV
concept calculations technicians are stationed onshore. When regarding the utilization of
the SOV, it has the capacity of deploying 11 service teams using a staggered shift pattern.
When stationed full time at Hornsea it is utilized for 5 teams. The average travel time to
0% 20% 40% 60% 80% 100%
Co
st p
er t
urb
ine
(tru
nca
ted
grap
h)
1 Heli 2 CTV
1 Heli 3 CTV
2 Heli 2 CTV

32
a substation equipped with a helicopter pad would be the same time as deploying 3 teams.
Thus, there would be time remaining during a working day for dropping off helicopter
technicians at a substation for hoisting operations. This could reduce the number of
rounds a helicopter would have to fly out to the wind farm each day of operation. Having
technicians hosted on the SOV would also reduce technician waiting time each day.
Together these factors would provide a cost saving of 12%.
The largest potential gain is however the scaling effect. A larger scale of operation, and
operating close to the capacity limit is, as described by Slack et al. (2013), a possible way
of cost reduction. Scale and sharing of resources is also identified by Hobohm et al. (2013)
and Philips et al. (2013) as important for cost reduction within offshore maintenance.
When exploring the scale of operations for displayed farshore concepts, the utilization of
assets shows potential for reducing the service cost per unit. This is especially true for the
SOV concept, as it display the highest cost reduction potential of the compared concepts.
If exploring in depth, the overcapacity of the SOV is eminent for a site the size of Hornsea.
Should the SOV be used at full capacity and perform only scheduled service, it would
only require 150 days to complete the annual service need.
There are two possibilities for sharing the SOV capacity in order to achieve cost savings
through scaling effects. It could either serve a larger WF or be shared with other WFs.
These factors would however require influence by WFOs and not directly affected by the
service provider. A different approach would be to develop a smaller service vessel, an
SOV-light concept. On the backdrop of this an additional investigation was made, using
the pricing, size and weather restrictions of a smaller 25 pax vessel restricted to 2 m Hs.
The study showed that the small vessel has the capacity to perform the full scheduled
service at Hornsea in 350 days, thus providing a good capacity match between the vessel
and the WF size.
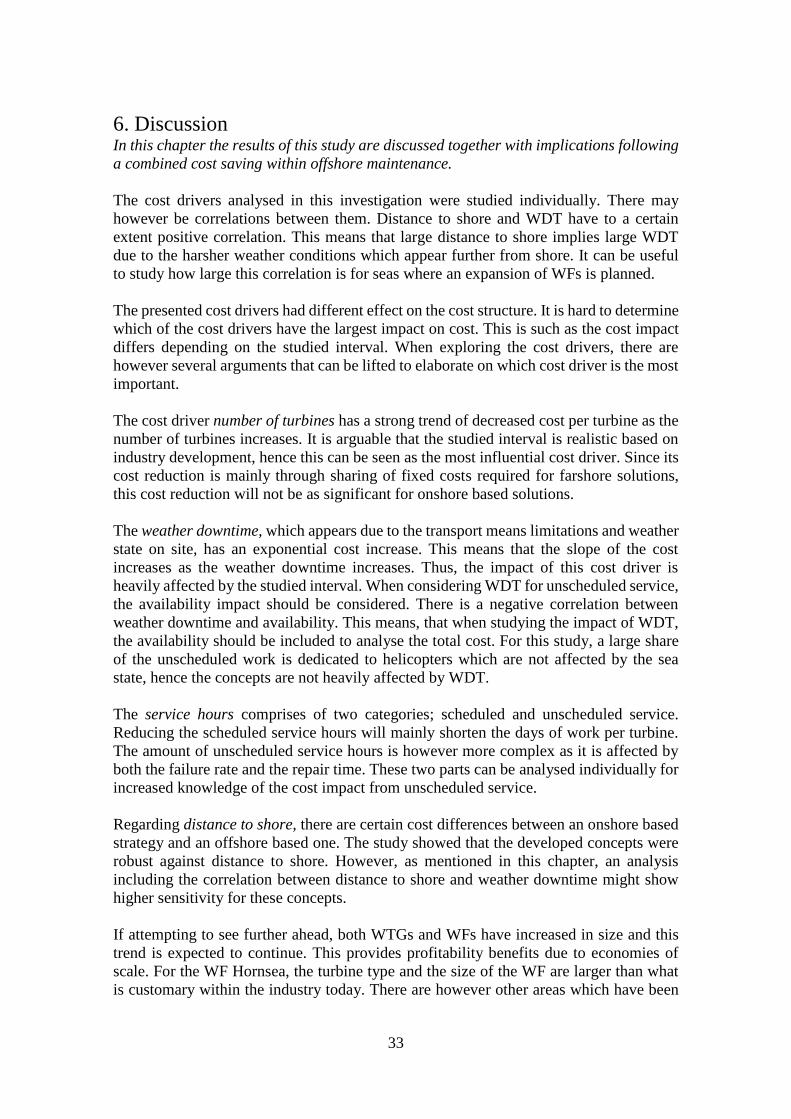
33
6. Discussion In this chapter the results of this study are discussed together with implications following
a combined cost saving within offshore maintenance.
The cost drivers analysed in this investigation were studied individually. There may
however be correlations between them. Distance to shore and WDT have to a certain
extent positive correlation. This means that large distance to shore implies large WDT
due to the harsher weather conditions which appear further from shore. It can be useful
to study how large this correlation is for seas where an expansion of WFs is planned.
The presented cost drivers had different effect on the cost structure. It is hard to determine
which of the cost drivers have the largest impact on cost. This is such as the cost impact
differs depending on the studied interval. When exploring the cost drivers, there are
however several arguments that can be lifted to elaborate on which cost driver is the most
important.
The cost driver number of turbines has a strong trend of decreased cost per turbine as the
number of turbines increases. It is arguable that the studied interval is realistic based on
industry development, hence this can be seen as the most influential cost driver. Since its
cost reduction is mainly through sharing of fixed costs required for farshore solutions,
this cost reduction will not be as significant for onshore based solutions.
The weather downtime, which appears due to the transport means limitations and weather
state on site, has an exponential cost increase. This means that the slope of the cost
increases as the weather downtime increases. Thus, the impact of this cost driver is
heavily affected by the studied interval. When considering WDT for unscheduled service,
the availability impact should be considered. There is a negative correlation between
weather downtime and availability. This means, that when studying the impact of WDT,
the availability should be included to analyse the total cost. For this study, a large share
of the unscheduled work is dedicated to helicopters which are not affected by the sea
state, hence the concepts are not heavily affected by WDT.
The service hours comprises of two categories; scheduled and unscheduled service.
Reducing the scheduled service hours will mainly shorten the days of work per turbine.
The amount of unscheduled service hours is however more complex as it is affected by
both the failure rate and the repair time. These two parts can be analysed individually for
increased knowledge of the cost impact from unscheduled service.
Regarding distance to shore, there are certain cost differences between an onshore based
strategy and an offshore based one. The study showed that the developed concepts were
robust against distance to shore. However, as mentioned in this chapter, an analysis
including the correlation between distance to shore and weather downtime might show
higher sensitivity for these concepts.
If attempting to see further ahead, both WTGs and WFs have increased in size and this
trend is expected to continue. This provides profitability benefits due to economies of
scale. For the WF Hornsea, the turbine type and the size of the WF are larger than what
is customary within the industry today. There are however other areas which have been
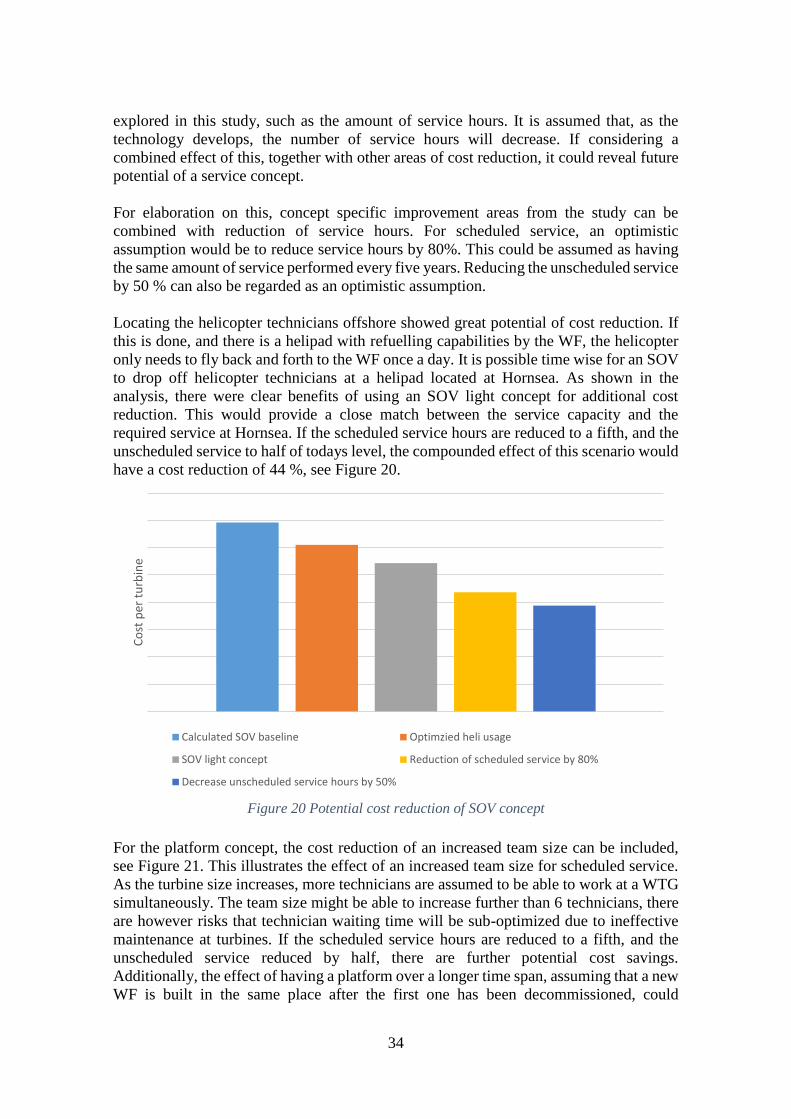
34
explored in this study, such as the amount of service hours. It is assumed that, as the
technology develops, the number of service hours will decrease. If considering a
combined effect of this, together with other areas of cost reduction, it could reveal future
potential of a service concept.
For elaboration on this, concept specific improvement areas from the study can be
combined with reduction of service hours. For scheduled service, an optimistic
assumption would be to reduce service hours by 80%. This could be assumed as having
the same amount of service performed every five years. Reducing the unscheduled service
by 50 % can also be regarded as an optimistic assumption.
Locating the helicopter technicians offshore showed great potential of cost reduction. If
this is done, and there is a helipad with refuelling capabilities by the WF, the helicopter
only needs to fly back and forth to the WF once a day. It is possible time wise for an SOV
to drop off helicopter technicians at a helipad located at Hornsea. As shown in the
analysis, there were clear benefits of using an SOV light concept for additional cost
reduction. This would provide a close match between the service capacity and the
required service at Hornsea. If the scheduled service hours are reduced to a fifth, and the
unscheduled service to half of todays level, the compounded effect of this scenario would
have a cost reduction of 44 %, see Figure 20.
Figure 20 Potential cost reduction of SOV concept
For the platform concept, the cost reduction of an increased team size can be included,
see Figure 21. This illustrates the effect of an increased team size for scheduled service.
As the turbine size increases, more technicians are assumed to be able to work at a WTG
simultaneously. The team size might be able to increase further than 6 technicians, there
are however risks that technician waiting time will be sub-optimized due to ineffective
maintenance at turbines. If the scheduled service hours are reduced to a fifth, and the
unscheduled service reduced by half, there are further potential cost savings.
Additionally, the effect of having a platform over a longer time span, assuming that a new
WF is built in the same place after the first one has been decommissioned, could
Co
st p
er t
urb
ine
Calculated SOV baseline Optimzied heli usage
SOV light concept Reduction of scheduled service by 80%
Decrease unscheduled service hours by 50%
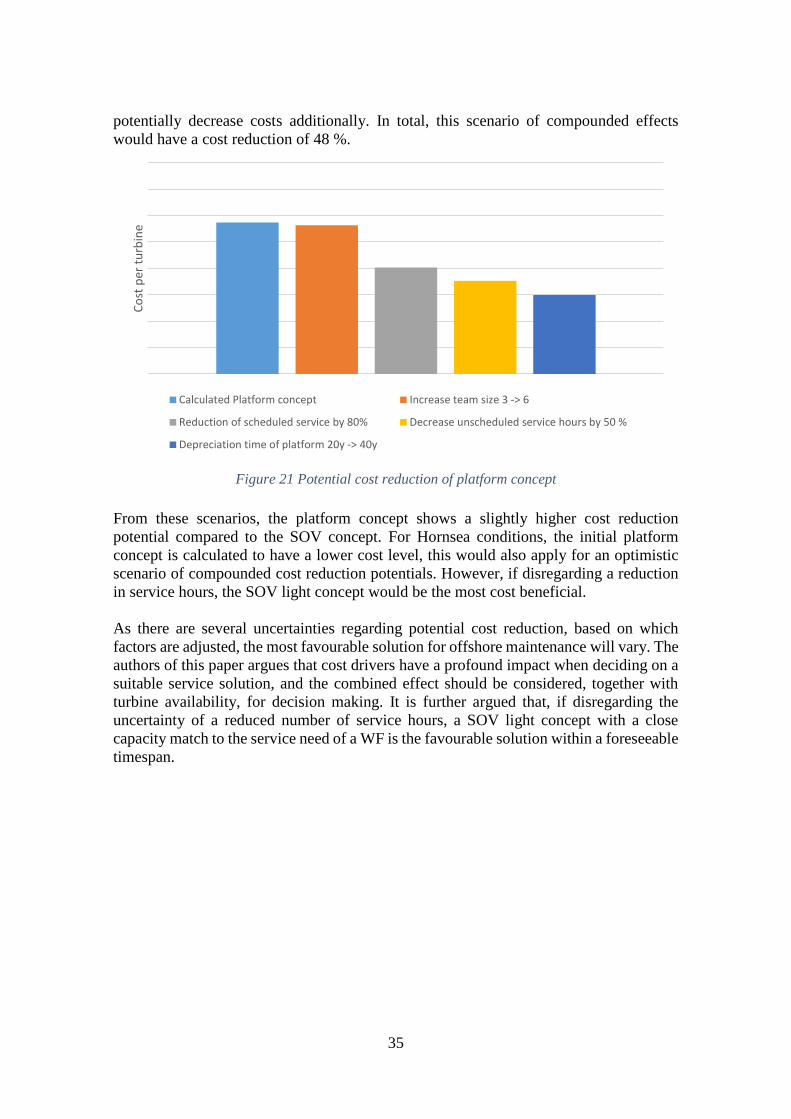
35
potentially decrease costs additionally. In total, this scenario of compounded effects
would have a cost reduction of 48 %.
Figure 21 Potential cost reduction of platform concept
From these scenarios, the platform concept shows a slightly higher cost reduction
potential compared to the SOV concept. For Hornsea conditions, the initial platform
concept is calculated to have a lower cost level, this would also apply for an optimistic
scenario of compounded cost reduction potentials. However, if disregarding a reduction
in service hours, the SOV light concept would be the most cost beneficial.
As there are several uncertainties regarding potential cost reduction, based on which
factors are adjusted, the most favourable solution for offshore maintenance will vary. The
authors of this paper argues that cost drivers have a profound impact when deciding on a
suitable service solution, and the combined effect should be considered, together with
turbine availability, for decision making. It is further argued that, if disregarding the
uncertainty of a reduced number of service hours, a SOV light concept with a close
capacity match to the service need of a WF is the favourable solution within a foreseeable
timespan.
Co
st p
er t
urb
ine
Calculated Platform concept Increase team size 3 -> 6
Reduction of scheduled service by 80% Decrease unscheduled service hours by 50 %
Depreciation time of platform 20y -> 40y

36

37
7. Conclusion This chapter is to conclude the results from the study by summarizing the analysis and
answering the two research questions. The research questions are answered with the
concept of positivism where the results are objective.
This study aimed at increasing the knowledge within renewable energy sector. This was
done by examining the cost structure of service for offshore wind power. Literature and
empirical findings were combined to create a tool for analysing different parameters, in
this study referred to as cost drivers. The conclusion from the study is based on analysis
using the developed tool and presented by answering the two research questions.
RQ 1, How do maintenance cost drivers of offshore wind power impact the cost
structure and logistical setup for farshore service solutions?
This study shows the strategic impact on service solutions from four major cost drivers;
distance to shore, weather downtime, number of turbines, and service hours. Depending
on the cost drivers, the preferred setup of logistical assets will vary. This is so since assets
are affected by cost drivers differently. One major strategic consideration is the use of an
onshore or offshore base for maintenance activities. The use of an offshore base is
beneficial for WFs located farshore, such as the site Hornsea. Analysis has been made
using two service concepts; an SOV supported by helicopter and a platform concept
including CTV and helicopter.
Due to the use of an offshore base, farshore solutions were shown to have low sensitivity
towards distance to shore. The impact of the cost driver was similar for both farshore
concepts, and mainly affected the helicopter usage.
For the cost driver weather downtime, a large cost impact was identified for the platform.
WDT led to additional need of technicians and vessels resulting in an exponential cost
increase. The SOV was less cost sensitive and the concept showed robustness against
WDT.
The cost driver number of turbines showed cost reduction through economies of scale for
both farshore concepts as fixed costs were shared across WTGs. It revealed cost reduction
potential of asset-sharing, together with the advantage of the higher accessibility limit of
the SOV. While the SOV is the service concept with the highest annual cost, it also allows
for a better asset utilization with its lower WDT. This allows the SOV to reap larger
advantages from economies of scale than the platform, consequently making it the
cheapest concept for large scale operations.
The cost impact of a decreased amount of service hours was countered by the large fixed
investments of an offshore base. The platform displayed a larger cost reduction than the
SOV. This is so as the CTV has less capacity than the SOV and consequently lower fixed
cost breaks, thus better possibility of matching demand.
RQ 2, How can a service provider in the offshore wind power industry develop its
service and offer a cost efficient service solution for future wind farms?
38
This study showed that a service provider within offshore wind power can develop its
solutions to become more cost efficient through strategic decisions and optimization. A
large share of cost savings was to use logistical setups customized to the service need. A
cost efficient offering should have a low maintenance cost and deliver high availability.
The availability simulation showed that there are benefits of using helicopters for
unscheduled service since it increases the availability. Maintaining high availability can
be a competitive advantage for the service provider. To decrease the cost of helicopter
usage there are benefits of locating helicopter technicians offshore in order to reduce
flight hours and transport time.
There were two concepts presented in this study as farshore solutions. These had several
fixed costs, where the vessel cost for the SOV and the platform cost were large shares of
the total maintenance cost. Both concepts showed cost reduction per turbine as the
number of turbines increased. Hence, it is beneficial for the service provider to contract
large WFs, or if possible, bundle services between WFs.
The cost for the platform concept can be reduced by optimizing the needed number of
logistical assets. This can be done by utilising each transport means at a maximum
regarding the division of scheduled and unscheduled service. The cost of service can
further be reduced by increased utilization of technicians. This can be done by increasing
the team size, which will reduce the transport time within the wind farm.
A conclusion that can be drawn from this study is that a 33 pax SOV has overcapacity for
Hornsea. Hence, it could be advantageous to use a smaller SOV to perform the service as
it is less expensive and matches the demand of service. This can reduce the cost of service
while providing same value to the customer. This solution was calculated to be most cost
efficient for service of 166 WTGs at Hornsea.
39
8. Further research This chapter presents the authors suggestions on further research within the studied field.
This research may be important to further bring down the cost within renewable energy
and wind power. The presented suggestions of research are also subject of analysis to
further validate the results of this investigation.
As the usage of an SOV has not been fully explored in practice, the authors suggest that
this study is validated through a case study of the operational performance of an SOV.
This to conclude its actual capacity regarding number of turbines and the impact of
performing unscheduled service. It is concluded that the SOV has an over capacity for
Hornsea and that a smaller SOV has a potential to provide a better match between capacity
and service demand. Hence is a suggestion to further research cost and performance of a
smaller SOV.
For the platform concepts, calculations have been made for one WF. Since the cost of a
platform is a large part of the service cost, it could be advantageous to share a platform
between WFs in order to decrease the overall service cost. If a platform is shared between
WFs, it may however impact the utilisation of technicians and assets. By investigating
this subject further, advantages and disadvantages of bundling service could be explored.
This investigation assumed that helicopters were able to perform 100 % of the
unscheduled service, there are however uncertainties. This assumption was based on
expert interviews, but it need a further in-depth investigation of operations to reveal the
actual impact of using helicopters instead of vessels. In addition to this investigation the
authors recommend a study of using helicopters to perform scheduled service in order to
conclude the impact on maintenance.
In conclusion, the authors identifies several topics that could be further explored within
renewable energy and more specified the field of maintenance for offshore wind power.
By exploring these topics, new knowledge could be created within cost reduction of
offshore wind power, thus potentially supporting the EU to reach its climate goals.

40
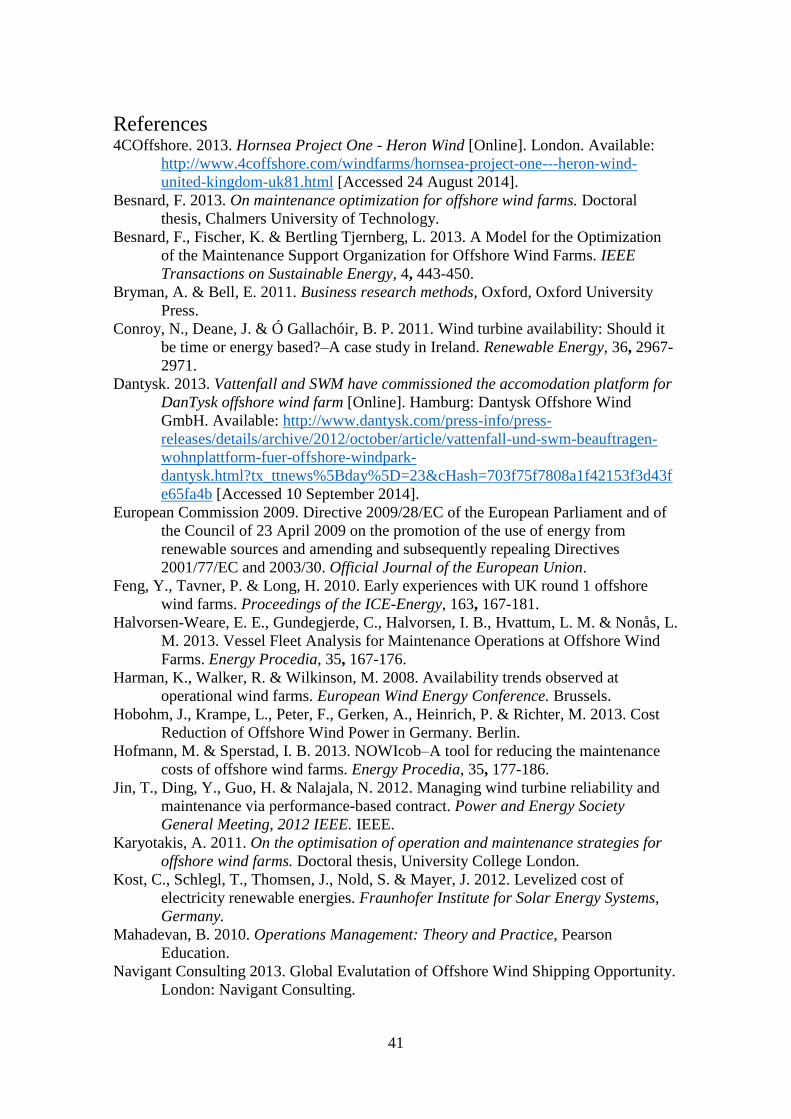
41
References 4COffshore. 2013. Hornsea Project One - Heron Wind [Online]. London. Available:
http://www.4coffshore.com/windfarms/hornsea-project-one---heron-wind-
united-kingdom-uk81.html [Accessed 24 August 2014].
Besnard, F. 2013. On maintenance optimization for offshore wind farms. Doctoral
thesis, Chalmers University of Technology.
Besnard, F., Fischer, K. & Bertling Tjernberg, L. 2013. A Model for the Optimization
of the Maintenance Support Organization for Offshore Wind Farms. IEEE
Transactions on Sustainable Energy, 4, 443-450.
Bryman, A. & Bell, E. 2011. Business research methods, Oxford, Oxford University
Press.
Conroy, N., Deane, J. & Ó Gallachóir, B. P. 2011. Wind turbine availability: Should it
be time or energy based?–A case study in Ireland. Renewable Energy, 36, 2967-
2971.
Dantysk. 2013. Vattenfall and SWM have commissioned the accomodation platform for
DanTysk offshore wind farm [Online]. Hamburg: Dantysk Offshore Wind
GmbH. Available: http://www.dantysk.com/press-info/press-
releases/details/archive/2012/october/article/vattenfall-und-swm-beauftragen-
wohnplattform-fuer-offshore-windpark-
dantysk.html?tx_ttnews%5Bday%5D=23&cHash=703f75f7808a1f42153f3d43f
e65fa4b [Accessed 10 September 2014].
European Commission 2009. Directive 2009/28/EC of the European Parliament and of
the Council of 23 April 2009 on the promotion of the use of energy from
renewable sources and amending and subsequently repealing Directives
2001/77/EC and 2003/30. Official Journal of the European Union.
Feng, Y., Tavner, P. & Long, H. 2010. Early experiences with UK round 1 offshore
wind farms. Proceedings of the ICE-Energy, 163, 167-181.
Halvorsen-Weare, E. E., Gundegjerde, C., Halvorsen, I. B., Hvattum, L. M. & Nonås, L.
M. 2013. Vessel Fleet Analysis for Maintenance Operations at Offshore Wind
Farms. Energy Procedia, 35, 167-176.
Harman, K., Walker, R. & Wilkinson, M. 2008. Availability trends observed at
operational wind farms. European Wind Energy Conference. Brussels.
Hobohm, J., Krampe, L., Peter, F., Gerken, A., Heinrich, P. & Richter, M. 2013. Cost
Reduction of Offshore Wind Power in Germany. Berlin.
Hofmann, M. & Sperstad, I. B. 2013. NOWIcob–A tool for reducing the maintenance
costs of offshore wind farms. Energy Procedia, 35, 177-186.
Jin, T., Ding, Y., Guo, H. & Nalajala, N. 2012. Managing wind turbine reliability and
maintenance via performance-based contract. Power and Energy Society
General Meeting, 2012 IEEE. IEEE.
Karyotakis, A. 2011. On the optimisation of operation and maintenance strategies for
offshore wind farms. Doctoral thesis, University College London.
Kost, C., Schlegl, T., Thomsen, J., Nold, S. & Mayer, J. 2012. Levelized cost of
electricity renewable energies. Fraunhofer Institute for Solar Energy Systems,
Germany.
Mahadevan, B. 2010. Operations Management: Theory and Practice, Pearson
Education.
Navigant Consulting 2013. Global Evalutation of Offshore Wind Shipping Opportunity.
London: Navigant Consulting.

42
Nilsson, J. & Bertling, L. 2007. Maintenance management of wind power systems using
condition monitoring systems—life cycle cost analysis for two case studies.
Energy Conversion, IEEE Transactions on, 22, 223-229.
Philips, J., Fitch-Roy, O., Reynolds, P. & Gardner, P. 2013. A Guide to UK Offshore
Wind Operations and Maintenance. GL Garrad Hassan.
Rademakers, L. W. M. M., Braam, H. & Verbruggen, T. W. 2003. R&D needs for
O&M of wind turbines. European Wind Energy Conferance. Madrid.
Siemens. 2013. Wind power on its way to cost reduction [Online]. Hamburg. Available:
http://www.siemens.com/press/en/pressrelease/?press=/en/pressrelease/2013/ene
rgy/wind-power/ewp201311010.htm&content[]=EW [Accessed 10 September
2014.
Slack, N., Brandon-Jones, A. & Johnston, R. 2013. Operations management, Pearson.
Tian, Z., Jin, T., Wu, B. & Ding, F. 2011. Condition based maintenance optimization
for wind power generation systems under continuous monitoring. Renewable
Energy, 36, 1502-1509.
Related Documents