WP/05/65 Maintaining Competitiveness Under Equilibrium Real Appreciation: The Case of Slovakia Nienke Oomes

Welcome message from author
This document is posted to help you gain knowledge. Please leave a comment to let me know what you think about it! Share it to your friends and learn new things together.
Transcript

WP/05/65
Maintaining Competitiveness Under Equilibrium Real Appreciation:
The Case of Slovakia
Nienke Oomes
© 2005 International Monetary Fund WP/05/65
IMF Working Paper
European Department
Maintaining Competitiveness Under Equilibrium Real Appreciation: The Case of Slovakia
Prepared by Nienke Oomes1
Authorized for distribution by Juan-Jose Fernández-Ansola
March 2005
Abstract
This Working Paper should not be reported as representing the views of the IMF. The views expressed in this Working Paper are those of the author(s) and do not necessarily represent those of the IMF or IMF policy. Working Papers describe research in progress by the author(s) and are published to elicit comments and to further debate.
This paper evaluates competitiveness in Slovakia and estimates the equilibrium real exchange rate for the koruna. Slovak wages and prices are found to have been relatively low even when adjusted for differences in relative income and productivity, suggesting an undervalued real exchange rate. However, recent rapid nominal appreciation has reduced most or all of this undervaluation and has brought the real exchange rate near or above equilibrium. The productivity-driven equilibrium real appreciation rate during 2005−09 is estimated at close to 3 percent per year but can be lower with the help of fiscal consolidation. JEL Classification Numbers: F31, E31 Keywords: Real exchange rate, competitiveness, Balassa-Samuelson, Slovakia Author(s) E-Mail Address: [email protected]
1 For useful comments and suggestions, the author would like to thank—without implication— Nada Choueri, Balázs Égert, Juan-Jose Fernández-Ansola, Katerina Kalcheva, David Moore, Zuzana Murgasova, Jan Tóth, Slovak experts from the National Bank of Slovakia and the Slovak Ministry of Finance, and IMF seminar participants. In addition, the author is indebted to Christina Cheptea for excellent research assistance, and to Tom Walter for helpful editorial comments. A shorter version of this paper is forthcoming in the journal Economic Systems.
- 2 -
Contents Page
I. Introduction ............................................................................................................................4
II. Wages ....................................................................................................................................6
III. Prices....................................................................................................................................8
IV. Equilibrium Real Appreciation — Cross-Section Estimates.............................................10
V. Equilibrium Real Appreciation — Time-Series Estimates .................................................12 A. CPI-based and Net-CPI based Real Appreciation...................................................13 B. PPI-based and ULC-based Real Appreciation ........................................................14 C. Econometric Estimation ..........................................................................................17 D. Projections...............................................................................................................19
VI. Conclusion .........................................................................................................................20
References................................................................................................................................22 Figures 1. Monetary Policy Developments ..........................................................................................4 2. New EU Member States: Relative Wages, 2003 ................................................................6 3. New EU Member States: Wages and Productivity, 2003 ....................................................64. Wages, Productivity, and Unit Labor Costs.........................................................................7 5. Unit Labor Costs in Manufacturing .....................................................................................7 6. Slovak Price Level Relative to Euro Area Price Level........................................................8 7. Relative Prices and Relative Income Levels, 2003..............................................................9 8. Slovakia: Equilibrium and Actual Relative Price Levels ..................................................11 9. Slovakia: Estimated Real Exchange Rate Undervaluation ................................................12 10. Contributions to Headline CPI Inflation ............................................................................13 11. Real Exchange Rate Indices and Productivity Differential ...............................................14 12. Real Exchange Rate Indices and Productivity Differential ..............................................14 13. Tradables and Nontradables Prices....................................................................................16 Tables 1. Slovakia: Weights of CPI Components .............................................................................16 2. Projected Equilibrium Real Appreciation, 2005-2009.......................................................20 Appendices 1. Unit Root Tests, Cointegration Tests, and Cointegration Estimates ................................252. Recursive Coefficient Estimates of Real Exchange Rate Determinants............................28

- 3 -
Appendix Tables A1. ADF Unit Root Tests ........................................................................................................25 A2. Johansen Cointegration Tests ...........................................................................................26 A3. Estimated Cointegration Equations ..................................................................................27
- 4 -
I. INTRODUCTION
Recent reforms have made the Slovak economy one of the most competitive in Central and Eastern Europe. After having lagged behind its neighbors for most of the 1990s, Slovakia was recently placed first among Central and Eastern European countries in a competitiveness ranking conducted by the Swiss Institute for Management Development (IMD, 2004). Moreover, the World Bank recently classified Slovakia as the world’s top reformer of its investment climate over the past 12 months, and as one of the 20 most attractive countries in the world for doing business (World Bank, 2004). These achievements have been partly the result of recent far-reaching reforms that have cut the time required to start a business, recover debt, and gain access to credit, and which have improved legal rights.
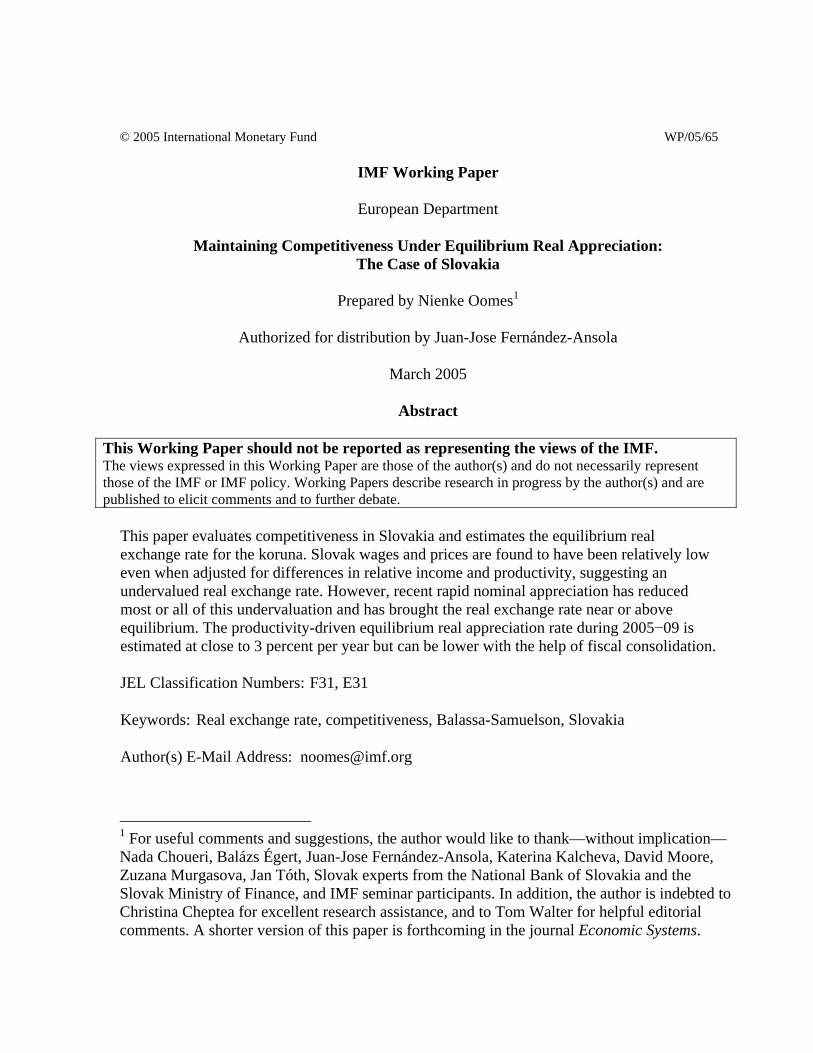
Nevertheless, there are concerns, particularly among the Slovak authorities, that Slovakia’s strong competitiveness may be eroded by excessively rapid exchange rate appreciation. In the past few years, the Slovak koruna has appreciated substantially against the euro,2 both in real terms and—more recently—in nominal terms.3 This appreciation appears to have been driven by rapid productivity growth, which in turn has been driven by large inflows of foreign direct investment (FDI), especially into automobile manufacturing. However, to the extent that real appreciation may be exceeding productivity growth in certain traditional manufacturing sectors, those sectors may be suffering a loss of competitiveness. Because of these concerns, the National Bank of Slovakia (NBS) repeatedly cut interest rates
2 In this paper, we focus on the bilateral koruna-euro exchange rate, because the euro area is by far Slovakia’s most important trade partner, and because the bilateral rate is most relevant for assessing Slovakia’s euro adoption strategy. Other studies on the Slovak real exchange rate have also typically focused on the koruna-euro rate (e.g., Égert and Lommatzsch, 2004; and Tóth and Chudik, 2004.)
3 The CPI-based real exchange rate appreciated by an average annual rate of 7½ percent during 2000–04, and by almost 10 percent per year during 2002–04. As explained further below, a substantial part of this real appreciation was the result of significant adjustments in administrative prices and indirect taxes, but even when these factors are excluded, the average real appreciation rate was still about 4 percent per year during 2000–04. In nominal terms, the koruna appreciated by almost 7 percent against the euro in 2004, and by almost 2½ percent in the first two months of 2005.
Figure 1. Monetary Policy Developments
-250
0
250
500
750
1000
Jan-02 Jun-02 Nov-02 Apr-03 Sep-03 Feb-04 Jul-04 Dec-0436
38
40
42
44
46Intervention (million euros, LHS)NBS policy interest rate (basis points, LHS)Exchange rate (koruny per euro, RHS)
Sources: National Bank of Slovakia and IMF staff estimates.

- 5 -
and intervened substantially in the foreign exchange market in 2004, in order to stem appreciation pressures (Figure 1).
Given that nonmonetary factors determine the long-run equilibrium rate of real appreciation, there exists a trade-off between limiting nominal appreciation and reducing inflation. This trade-off is particularly important because Slovakia plans to adopt the euro on January 1, 2009, at which time the country loses its exchange rate instrument. While excessive nominal appreciation would hurt competitiveness, resisting nominal appreciation in the presence of equilibrium real appreciation pressures would mean creating additional inflation—implying that Slovakia could risk missing the Maastricht inflation criterion of 3 percent in 2007.
This paper is one of the first to evaluate competitiveness in Slovakia and to estimate the equilibrium real exchange rate path for the koruna. While Slovakia has often been included in cross-country studies on equilibrium real exchange rates in Central and Eastern Europe,4 there are only a few published papers that contain time-series estimations done specifically for Slovakia.5 Although the NBS has conducted work in this area, it has not published any econometric estimates of the equilibrium real exchange rate in Slovakia.6
We have four main findings. First, we find evidence that Slovak wages are still relatively low in comparison with those in other new EU member states, even when adjusted for differences in productivity. Second, we find that, until recently, Slovak prices remained relatively low compared to what may have been expected given Slovakia’s relative income and productivity level, implying real exchange rate undervaluation. Third, administered price adjustments, indirect tax increases, and rapid nominal appreciation have eliminated most or all of this undervaluation, and there is even a risk of overvaluation in 2005. Finally, we estimate that, although the equilibrium exchange rate itself will continue to appreciate in line with productivity growth relative to the euro area (not necessarily only due to the Balassa-Samuelson effect), fiscal consolidation could mitigate this real appreciation. In the absence of fiscal consolidation, the estimated equilibrium rate of real appreciation during 2005−09 is close to 3 percent per year. However, if the share of government consumption in GDP declines in line with the authorities’ medium-term fiscal objectives, the estimated equilibrium
4 E.g., Égert and others (2003); and Maeso-Fernandez, Osbat, and Schnatz (2004).
5 We are aware of only three papers: Égert (2002), Égert and Lommatzsch (2004) and Tóth and Chudik (2004). Dufrenot and Égert (2005) estimate a VAR for Slovakia, but find that the estimated coefficients for Slovakia are highly unstable, and therefore do not report the results.
6 Kovács (2002) contains a chapter on the Balassa-Samuelson effect in Slovakia, prepared by Frantisek Hajnovic, who is currently at the NBS, but this chapter does not contain any econometric estimates.
- 6 -
real appreciation rate is significantly lower. We thus conclude that fiscal policy can support monetary policy in limiting real appreciation, making it easier to contain both nominal appreciation and inflation.
The remainder of this paper is organized as follows. First, we look at various indicators of competitiveness, including wages, unit labor costs, and prices. Next, we estimate the equilibrium rate of real appreciation using both cross-section and time-series techniques. We conclude by summarizing the main findings.
II. WAGES
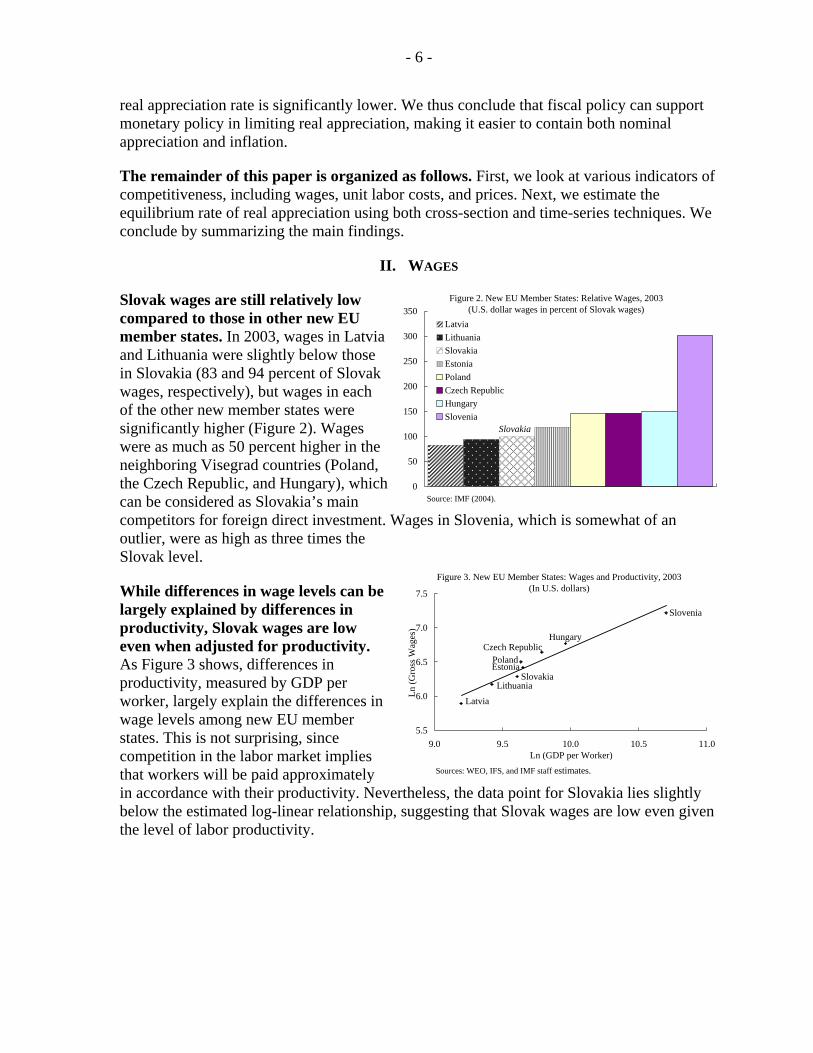
Slovak wages are still relatively low compared to those in other new EU member states. In 2003, wages in Latvia and Lithuania were slightly below those in Slovakia (83 and 94 percent of Slovak wages, respectively), but wages in each of the other new member states were significantly higher (Figure 2). Wages were as much as 50 percent higher in the neighboring Visegrad countries (Poland, the Czech Republic, and Hungary), which can be considered as Slovakia’s main competitors for foreign direct investment. Wages in Slovenia, which is somewhat of an outlier, were as high as three times the Slovak level.
While differences in wage levels can be largely explained by differences in productivity, Slovak wages are low even when adjusted for productivity. As Figure 3 shows, differences in productivity, measured by GDP per worker, largely explain the differences in wage levels among new EU member states. This is not surprising, since competition in the labor market implies that workers will be paid approximately in accordance with their productivity. Nevertheless, the data point for Slovakia lies slightly below the estimated log-linear relationship, suggesting that Slovak wages are low even given the level of labor productivity.
Figure 3. New EU Member States: Wages and Productivity, 2003(In U.S. dollars)
Latvia
SlovakiaLithuania
Estonia
HungaryCzech Republic
Poland
Slovenia
5.5
6.0
6.5
7.0
7.5
9.0 9.5 10.0 10.5 11.0Ln (GDP per Worker)
Ln (G
ross
Wag
es)
Sources: WEO, IFS, and IMF staff estimates.
0
50
100
150
200
250
300
350LatviaLithuaniaSlovakiaEstoniaPolandCzech RepublicHungarySlovenia
Figure 2. New EU Member States: Relative Wages, 2003(U.S. dollar wages in percent of Slovak wages)
Slovakia
Source: IMF (2004).
- 7 -
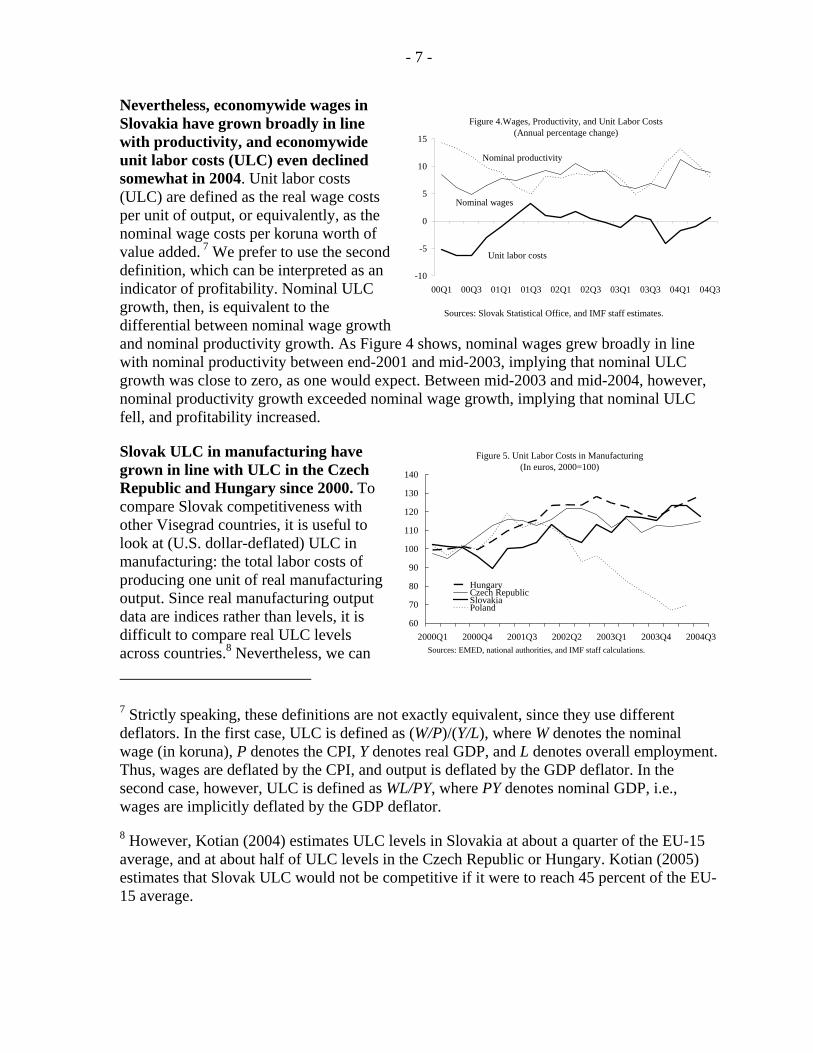
Nevertheless, economywide wages in Slovakia have grown broadly in line with productivity, and economywide unit labor costs (ULC) even declined somewhat in 2004. Unit labor costs (ULC) are defined as the real wage costs per unit of output, or equivalently, as the nominal wage costs per koruna worth of value added. 7 We prefer to use the second definition, which can be interpreted as an indicator of profitability. Nominal ULC growth, then, is equivalent to the differential between nominal wage growth and nominal productivity growth. As Figure 4 shows, nominal wages grew broadly in line with nominal productivity between end-2001 and mid-2003, implying that nominal ULC growth was close to zero, as one would expect. Between mid-2003 and mid-2004, however, nominal productivity growth exceeded nominal wage growth, implying that nominal ULC fell, and profitability increased.
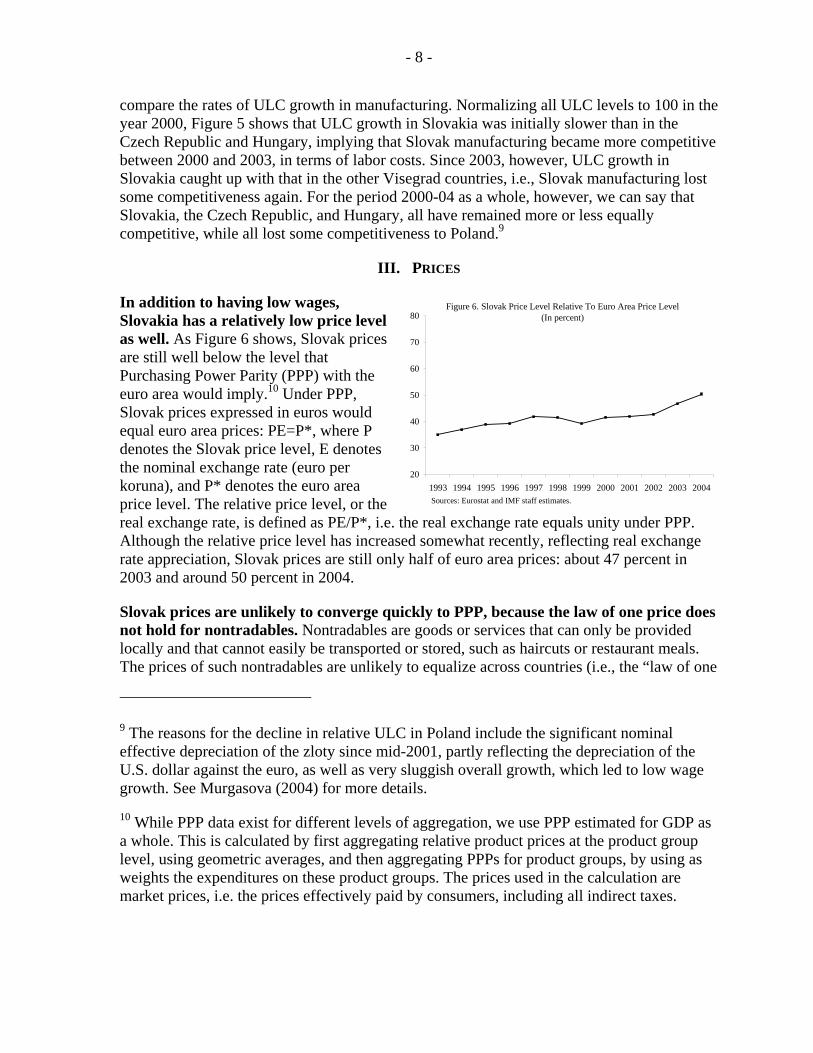
Slovak ULC in manufacturing have grown in line with ULC in the Czech Republic and Hungary since 2000. To compare Slovak competitiveness with other Visegrad countries, it is useful to look at (U.S. dollar-deflated) ULC in manufacturing: the total labor costs of producing one unit of real manufacturing output. Since real manufacturing output data are indices rather than levels, it is difficult to compare real ULC levels across countries.8 Nevertheless, we can 7 Strictly speaking, these definitions are not exactly equivalent, since they use different deflators. In the first case, ULC is defined as (W/P)/(Y/L), where W denotes the nominal wage (in koruna), P denotes the CPI, Y denotes real GDP, and L denotes overall employment. Thus, wages are deflated by the CPI, and output is deflated by the GDP deflator. In the second case, however, ULC is defined as WL/PY, where PY denotes nominal GDP, i.e., wages are implicitly deflated by the GDP deflator.
8 However, Kotian (2004) estimates ULC levels in Slovakia at about a quarter of the EU-15 average, and at about half of ULC levels in the Czech Republic or Hungary. Kotian (2005) estimates that Slovak ULC would not be competitive if it were to reach 45 percent of the EU-15 average.
Figure 5. Unit Labor Costs in Manufacturing(In euros, 2000=100)
60
70
80
90
100
110
120
130
140
2000Q1 2000Q4 2001Q3 2002Q2 2003Q1 2003Q4 2004Q3
HungaryCzech RepublicSlovakiaPoland
Sources: EMED, national authorities, and IMF staff calculations.
Figure 4.Wages, Productivity, and Unit Labor Costs(Annual percentage change)
-10
-5
0
5
10
15
00Q1 00Q3 01Q1 01Q3 02Q1 02Q3 03Q1 03Q3 04Q1 04Q3
Unit labor costs
Nominal productivity
Nominal wages
Sources: Slovak Statistical Office, and IMF staff estimates.
- 8 -
compare the rates of ULC growth in manufacturing. Normalizing all ULC levels to 100 in the year 2000, Figure 5 shows that ULC growth in Slovakia was initially slower than in the Czech Republic and Hungary, implying that Slovak manufacturing became more competitive between 2000 and 2003, in terms of labor costs. Since 2003, however, ULC growth in Slovakia caught up with that in the other Visegrad countries, i.e., Slovak manufacturing lost some competitiveness again. For the period 2000-04 as a whole, however, we can say that Slovakia, the Czech Republic, and Hungary, all have remained more or less equally competitive, while all lost some competitiveness to Poland.9
III. PRICES
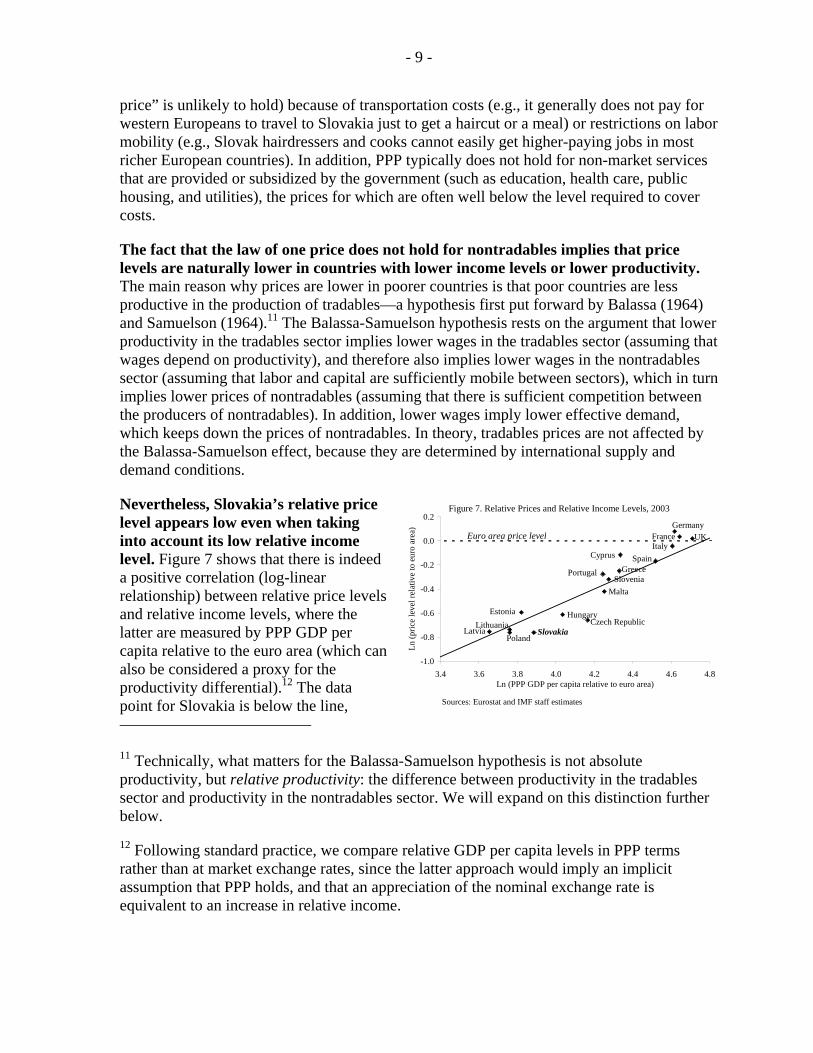
In addition to having low wages, Slovakia has a relatively low price level as well. As Figure 6 shows, Slovak prices are still well below the level that Purchasing Power Parity (PPP) with the euro area would imply.10 Under PPP, Slovak prices expressed in euros would equal euro area prices: PE=P*, where P denotes the Slovak price level, E denotes the nominal exchange rate (euro per koruna), and P* denotes the euro area price level. The relative price level, or the real exchange rate, is defined as PE/P*, i.e. the real exchange rate equals unity under PPP. Although the relative price level has increased somewhat recently, reflecting real exchange rate appreciation, Slovak prices are still only half of euro area prices: about 47 percent in 2003 and around 50 percent in 2004.
Slovak prices are unlikely to converge quickly to PPP, because the law of one price does not hold for nontradables. Nontradables are goods or services that can only be provided locally and that cannot easily be transported or stored, such as haircuts or restaurant meals. The prices of such nontradables are unlikely to equalize across countries (i.e., the “law of one
9 The reasons for the decline in relative ULC in Poland include the significant nominal effective depreciation of the zloty since mid-2001, partly reflecting the depreciation of the U.S. dollar against the euro, as well as very sluggish overall growth, which led to low wage growth. See Murgasova (2004) for more details.
10 While PPP data exist for different levels of aggregation, we use PPP estimated for GDP as a whole. This is calculated by first aggregating relative product prices at the product group level, using geometric averages, and then aggregating PPPs for product groups, by using as weights the expenditures on these product groups. The prices used in the calculation are market prices, i.e. the prices effectively paid by consumers, including all indirect taxes.
Figure 6. Slovak Price Level Relative To Euro Area Price Level(In percent)
20
30
40
50
60
70
80
1993 1994 1995 1996 1997 1998 1999 2000 2001 2002 2003 2004Sources: Eurostat and IMF staff estimates.
- 9 -
price” is unlikely to hold) because of transportation costs (e.g., it generally does not pay for western Europeans to travel to Slovakia just to get a haircut or a meal) or restrictions on labor mobility (e.g., Slovak hairdressers and cooks cannot easily get higher-paying jobs in most richer European countries). In addition, PPP typically does not hold for non-market services that are provided or subsidized by the government (such as education, health care, public housing, and utilities), the prices for which are often well below the level required to cover costs.
The fact that the law of one price does not hold for nontradables implies that price levels are naturally lower in countries with lower income levels or lower productivity. The main reason why prices are lower in poorer countries is that poor countries are less productive in the production of tradables—a hypothesis first put forward by Balassa (1964) and Samuelson (1964).11 The Balassa-Samuelson hypothesis rests on the argument that lower productivity in the tradables sector implies lower wages in the tradables sector (assuming that wages depend on productivity), and therefore also implies lower wages in the nontradables sector (assuming that labor and capital are sufficiently mobile between sectors), which in turn implies lower prices of nontradables (assuming that there is sufficient competition between the producers of nontradables). In addition, lower wages imply lower effective demand, which keeps down the prices of nontradables. In theory, tradables prices are not affected by the Balassa-Samuelson effect, because they are determined by international supply and demand conditions.
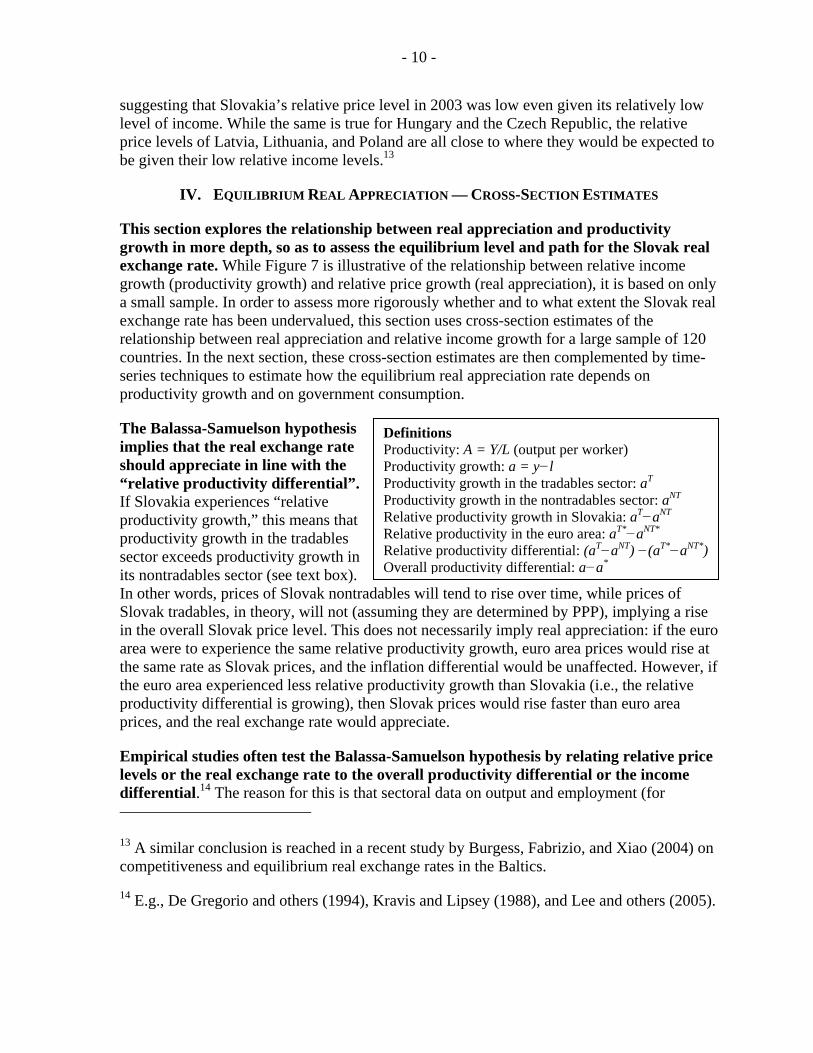
Nevertheless, Slovakia’s relative price level appears low even when taking into account its low relative income level. Figure 7 shows that there is indeed a positive correlation (log-linear relationship) between relative price levels and relative income levels, where the latter are measured by PPP GDP per capita relative to the euro area (which can also be considered a proxy for the productivity differential).12 The data point for Slovakia is below the line, 11 Technically, what matters for the Balassa-Samuelson hypothesis is not absolute productivity, but relative productivity: the difference between productivity in the tradables sector and productivity in the nontradables sector. We will expand on this distinction further below.
12 Following standard practice, we compare relative GDP per capita levels in PPP terms rather than at market exchange rates, since the latter approach would imply an implicit assumption that PPP holds, and that an appreciation of the nominal exchange rate is equivalent to an increase in relative income.
Figure 7. Relative Prices and Relative Income Levels, 2003
UKFranceGermany
Italy
LithuaniaPoland
SpainCyprus
GreeceSlovenia
Portugal
Malta
Czech RepublicHungary
Latvia Slovakia
Estonia
-1.0
-0.8
-0.6
-0.4
-0.2
0.0
0.2
3.4 3.6 3.8 4.0 4.2 4.4 4.6 4.8Ln (PPP GDP per capita relative to euro area)
Ln (p
rice
leve
l rel
ativ
e to
eur
o ar
ea)
Euro area price level
Sources: Eurostat and IMF staff estimates
- 10 -
suggesting that Slovakia’s relative price level in 2003 was low even given its relatively low level of income. While the same is true for Hungary and the Czech Republic, the relative price levels of Latvia, Lithuania, and Poland are all close to where they would be expected to be given their low relative income levels.13
IV. EQUILIBRIUM REAL APPRECIATION — CROSS-SECTION ESTIMATES
This section explores the relationship between real appreciation and productivity growth in more depth, so as to assess the equilibrium level and path for the Slovak real exchange rate. While Figure 7 is illustrative of the relationship between relative income growth (productivity growth) and relative price growth (real appreciation), it is based on only a small sample. In order to assess more rigorously whether and to what extent the Slovak real exchange rate has been undervalued, this section uses cross-section estimates of the relationship between real appreciation and relative income growth for a large sample of 120 countries. In the next section, these cross-section estimates are then complemented by time-series techniques to estimate how the equilibrium real appreciation rate depends on productivity growth and on government consumption.
The Balassa-Samuelson hypothesis implies that the real exchange rate should appreciate in line with the “relative productivity differential”. If Slovakia experiences “relative productivity growth,” this means that productivity growth in the tradables sector exceeds productivity growth in its nontradables sector (see text box). In other words, prices of Slovak nontradables will tend to rise over time, while prices of Slovak tradables, in theory, will not (assuming they are determined by PPP), implying a rise in the overall Slovak price level. This does not necessarily imply real appreciation: if the euro area were to experience the same relative productivity growth, euro area prices would rise at the same rate as Slovak prices, and the inflation differential would be unaffected. However, if the euro area experienced less relative productivity growth than Slovakia (i.e., the relative productivity differential is growing), then Slovak prices would rise faster than euro area prices, and the real exchange rate would appreciate.
Empirical studies often test the Balassa-Samuelson hypothesis by relating relative price levels or the real exchange rate to the overall productivity differential or the income differential.14 The reason for this is that sectoral data on output and employment (for 13 A similar conclusion is reached in a recent study by Burgess, Fabrizio, and Xiao (2004) on competitiveness and equilibrium real exchange rates in the Baltics.
14 E.g., De Gregorio and others (1994), Kravis and Lipsey (1988), and Lee and others (2005).
Definitions Productivity: A = Y/L (output per worker) Productivity growth: a = y−l Productivity growth in the tradables sector: aT
Productivity growth in the nontradables sector: aNT Relative productivity growth in Slovakia: aT−aNT Relative productivity in the euro area: aT*−aNT*
Relative productivity differential: (aT−aNT) −(aT*−aNT*) Overall productivity differential: a−a*
- 11 -
“tradables” and “nontradables” sectors) tend to be of mixed quality, and are difficult to compare and aggregate across countries. Most studies therefore use the overall productivity differential as a proxy for the relative productivity differential, which amounts to assuming that productivity growth in both the tradables and the nontradables sector are approximately a constant fraction of overall productivity growth.15 An alternative proxy that is commonly used is the income differential, i.e., the difference between GDP per capita in two countries.
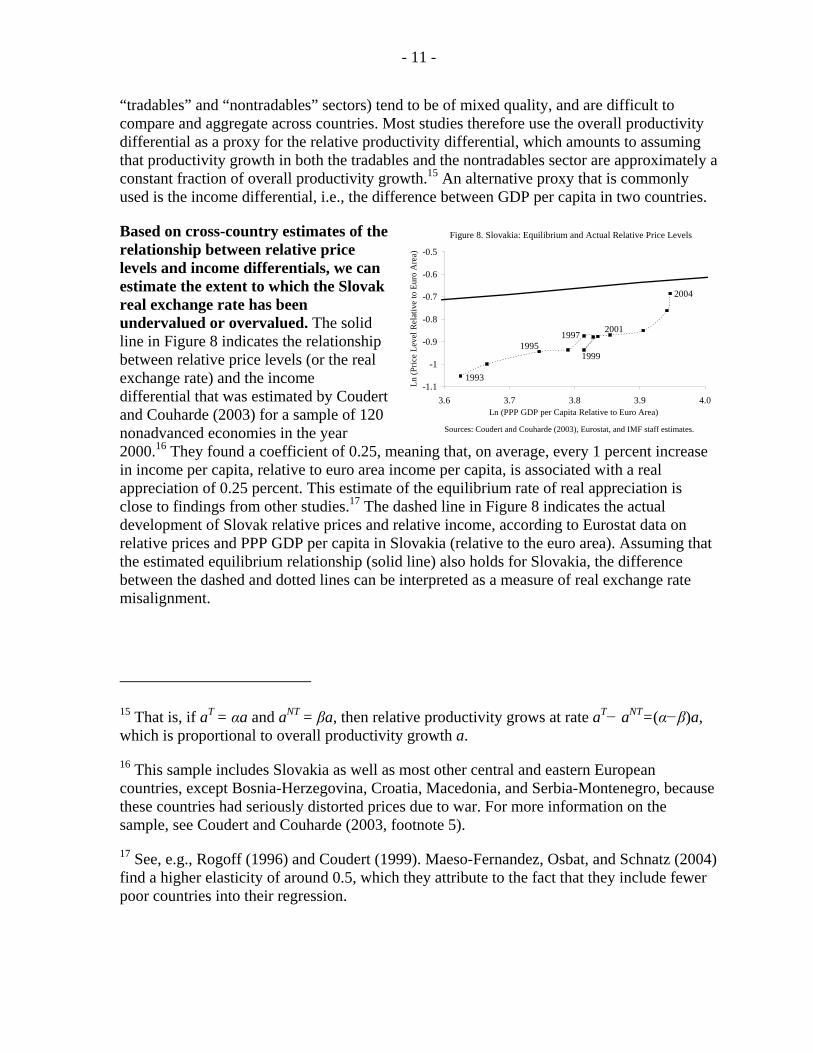
Based on cross-country estimates of the relationship between relative price levels and income differentials, we can estimate the extent to which the Slovak real exchange rate has been undervalued or overvalued. The solid line in Figure 8 indicates the relationship between relative price levels (or the real exchange rate) and the income differential that was estimated by Coudert and Couharde (2003) for a sample of 120 nonadvanced economies in the year 2000.16 They found a coefficient of 0.25, meaning that, on average, every 1 percent increase in income per capita, relative to euro area income per capita, is associated with a real appreciation of 0.25 percent. This estimate of the equilibrium rate of real appreciation is close to findings from other studies.17 The dashed line in Figure 8 indicates the actual development of Slovak relative prices and relative income, according to Eurostat data on relative prices and PPP GDP per capita in Slovakia (relative to the euro area). Assuming that the estimated equilibrium relationship (solid line) also holds for Slovakia, the difference between the dashed and dotted lines can be interpreted as a measure of real exchange rate misalignment.
15 That is, if aT = αa and aNT = βa, then relative productivity grows at rate aT− aNT=(α−β)a, which is proportional to overall productivity growth a.
16 This sample includes Slovakia as well as most other central and eastern European countries, except Bosnia-Herzegovina, Croatia, Macedonia, and Serbia-Montenegro, because these countries had seriously distorted prices due to war. For more information on the sample, see Coudert and Couharde (2003, footnote 5).
17 See, e.g., Rogoff (1996) and Coudert (1999). Maeso-Fernandez, Osbat, and Schnatz (2004) find a higher elasticity of around 0.5, which they attribute to the fact that they include fewer poor countries into their regression.
Figure 8. Slovakia: Equilibrium and Actual Relative Price Levels
-1.1
-1
-0.9
-0.8
-0.7
-0.6
-0.5
3.6 3.7 3.8 3.9 4.0Ln (PPP GDP per Capita Relative to Euro Area)
Ln (P
rice
Leve
l Rel
ativ
e to
Eur
o A
rea)
1993
1999
Sources: Coudert and Couharde (2003), Eurostat, and IMF staff estimates.
2004
2001
19951997
- 12 -
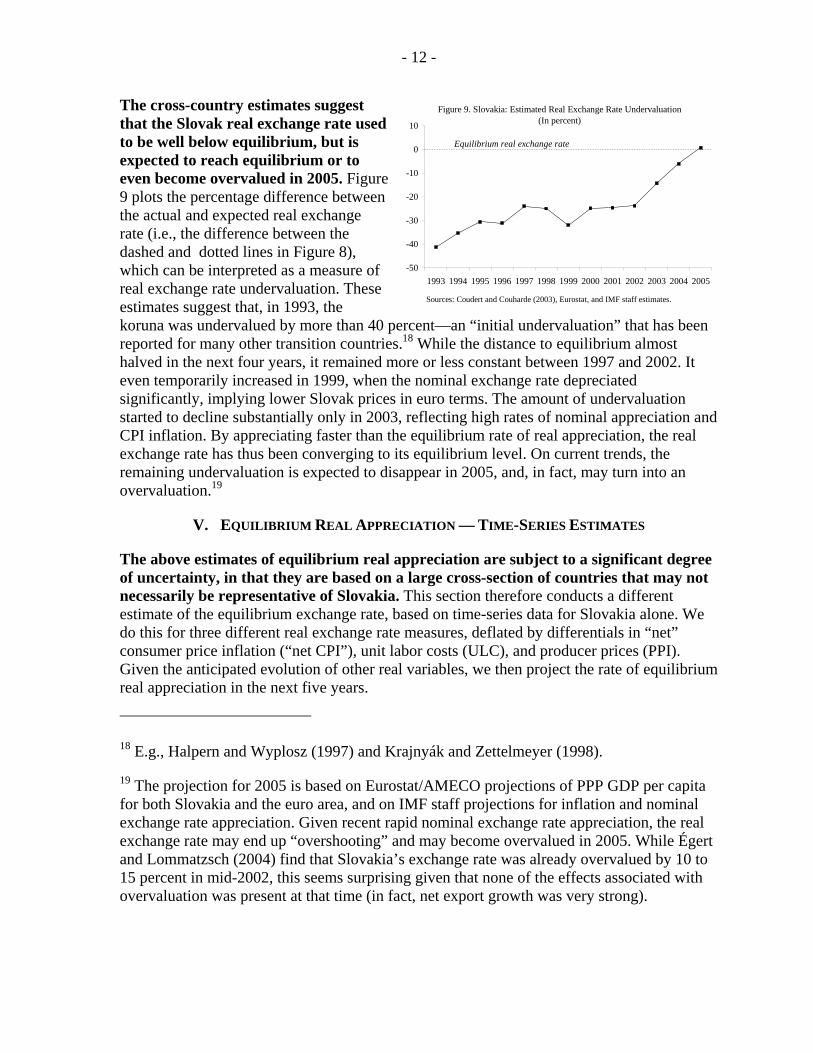
The cross-country estimates suggest that the Slovak real exchange rate used to be well below equilibrium, but is expected to reach equilibrium or to even become overvalued in 2005. Figure 9 plots the percentage difference between the actual and expected real exchange rate (i.e., the difference between the dashed and dotted lines in Figure 8), which can be interpreted as a measure of real exchange rate undervaluation. These estimates suggest that, in 1993, the koruna was undervalued by more than 40 percent—an “initial undervaluation” that has been reported for many other transition countries.18 While the distance to equilibrium almost halved in the next four years, it remained more or less constant between 1997 and 2002. It even temporarily increased in 1999, when the nominal exchange rate depreciated significantly, implying lower Slovak prices in euro terms. The amount of undervaluation started to decline substantially only in 2003, reflecting high rates of nominal appreciation and CPI inflation. By appreciating faster than the equilibrium rate of real appreciation, the real exchange rate has thus been converging to its equilibrium level. On current trends, the remaining undervaluation is expected to disappear in 2005, and, in fact, may turn into an overvaluation.19
V. EQUILIBRIUM REAL APPRECIATION — TIME-SERIES ESTIMATES
The above estimates of equilibrium real appreciation are subject to a significant degree of uncertainty, in that they are based on a large cross-section of countries that may not necessarily be representative of Slovakia. This section therefore conducts a different estimate of the equilibrium exchange rate, based on time-series data for Slovakia alone. We do this for three different real exchange rate measures, deflated by differentials in “net” consumer price inflation (“net CPI”), unit labor costs (ULC), and producer prices (PPI). Given the anticipated evolution of other real variables, we then project the rate of equilibrium real appreciation in the next five years.
18 E.g., Halpern and Wyplosz (1997) and Krajnyák and Zettelmeyer (1998).
19 The projection for 2005 is based on Eurostat/AMECO projections of PPP GDP per capita for both Slovakia and the euro area, and on IMF staff projections for inflation and nominal exchange rate appreciation. Given recent rapid nominal exchange rate appreciation, the real exchange rate may end up “overshooting” and may become overvalued in 2005. While Égert and Lommatzsch (2004) find that Slovakia’s exchange rate was already overvalued by 10 to 15 percent in mid-2002, this seems surprising given that none of the effects associated with overvaluation was present at that time (in fact, net export growth was very strong).
Figure 9. Slovakia: Estimated Real Exchange Rate Undervaluation (In percent)
-50
-40
-30
-20
-10
0
10
1993 1994 1995 1996 1997 1998 1999 2000 2001 2002 2003 2004 2005
Sources: Coudert and Couharde (2003), Eurostat, and IMF staff estimates.
Equilibrium real exchange rate
- 13 -
A. CPI-based and Net-CPI based Real Appreciation
For the purpose of predicting the future equilibrium real appreciation path, it is important to correct for initial undervaluation. As we argued above, a significant part of CPI-based real appreciation has been due to a “catching-up effect” from initial undervaluation, as a result of which the rate of CPI-based real appreciation has exceeded the equilibrium rate. This implies that we would be overestimating the equilibrium real appreciation rate if we were to simply extrapolate the historical relationship between CPI-based real appreciation and the productivity differential.
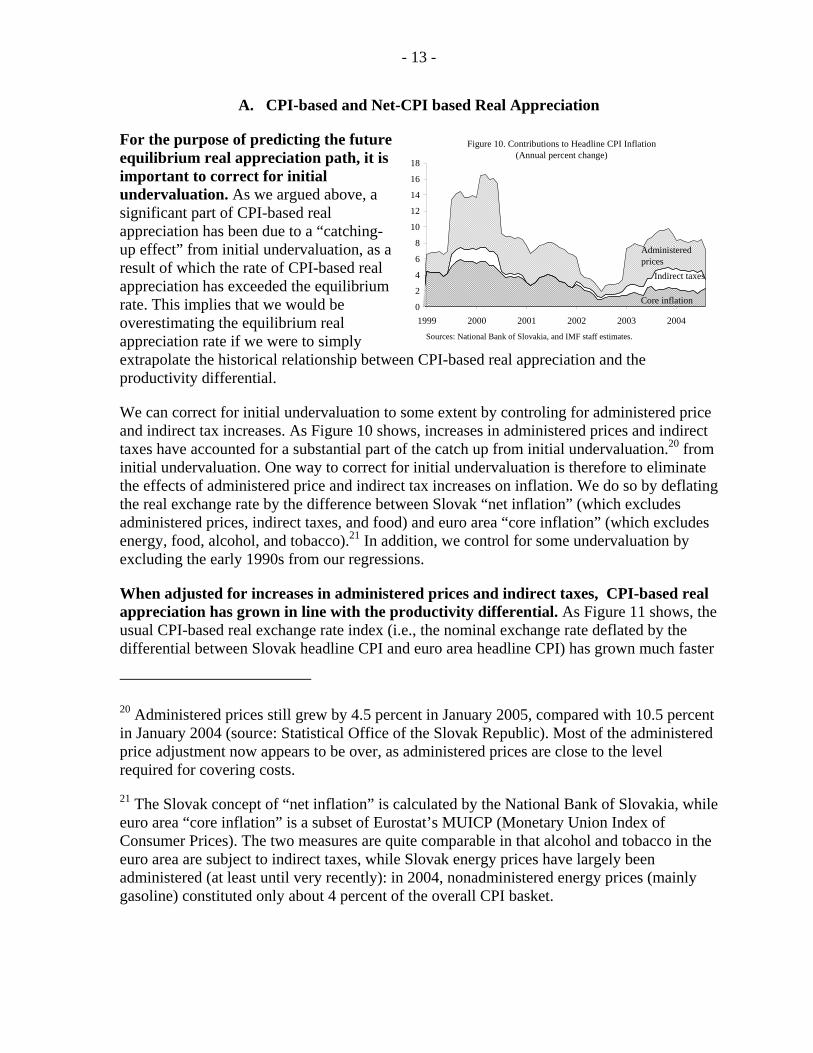
We can correct for initial undervaluation to some extent by controling for administered price and indirect tax increases. As Figure 10 shows, increases in administered prices and indirect taxes have accounted for a substantial part of the catch up from initial undervaluation.20 from initial undervaluation. One way to correct for initial undervaluation is therefore to eliminate the effects of administered price and indirect tax increases on inflation. We do so by deflating the real exchange rate by the difference between Slovak “net inflation” (which excludes administered prices, indirect taxes, and food) and euro area “core inflation” (which excludes energy, food, alcohol, and tobacco).21 In addition, we control for some undervaluation by excluding the early 1990s from our regressions.
When adjusted for increases in administered prices and indirect taxes, CPI-based real appreciation has grown in line with the productivity differential. As Figure 11 shows, the usual CPI-based real exchange rate index (i.e., the nominal exchange rate deflated by the differential between Slovak headline CPI and euro area headline CPI) has grown much faster
20 Administered prices still grew by 4.5 percent in January 2005, compared with 10.5 percent in January 2004 (source: Statistical Office of the Slovak Republic). Most of the administered price adjustment now appears to be over, as administered prices are close to the level required for covering costs.
21 The Slovak concept of “net inflation” is calculated by the National Bank of Slovakia, while euro area “core inflation” is a subset of Eurostat’s MUICP (Monetary Union Index of Consumer Prices). The two measures are quite comparable in that alcohol and tobacco in the euro area are subject to indirect taxes, while Slovak energy prices have largely been administered (at least until very recently): in 2004, nonadministered energy prices (mainly gasoline) constituted only about 4 percent of the overall CPI basket.
Figure 10. Contributions to Headline CPI Inflation(Annual percent change)
0
2
4
6
8
10
12
14
16
18
1999 2000 2001 2002 2003 2004
Core inflation
Indirect taxes
Administered prices
Sources: National Bank of Slovakia, and IMF staff estimates.
- 14 -
than the productivity differential, especially in recent years. However, when we deflate the nominal exchange rate by the “net inflation differential,” real appreciation appears to have been largely in line with productivity differential growth. The only exception is the period mid-1998 through mid-1999, when the nominal exchange rate depreciated substantially, following the transition from a fixed to a managed floating exchange rate regime in October 1998.
B. PPI-based and ULC-based Real Appreciation
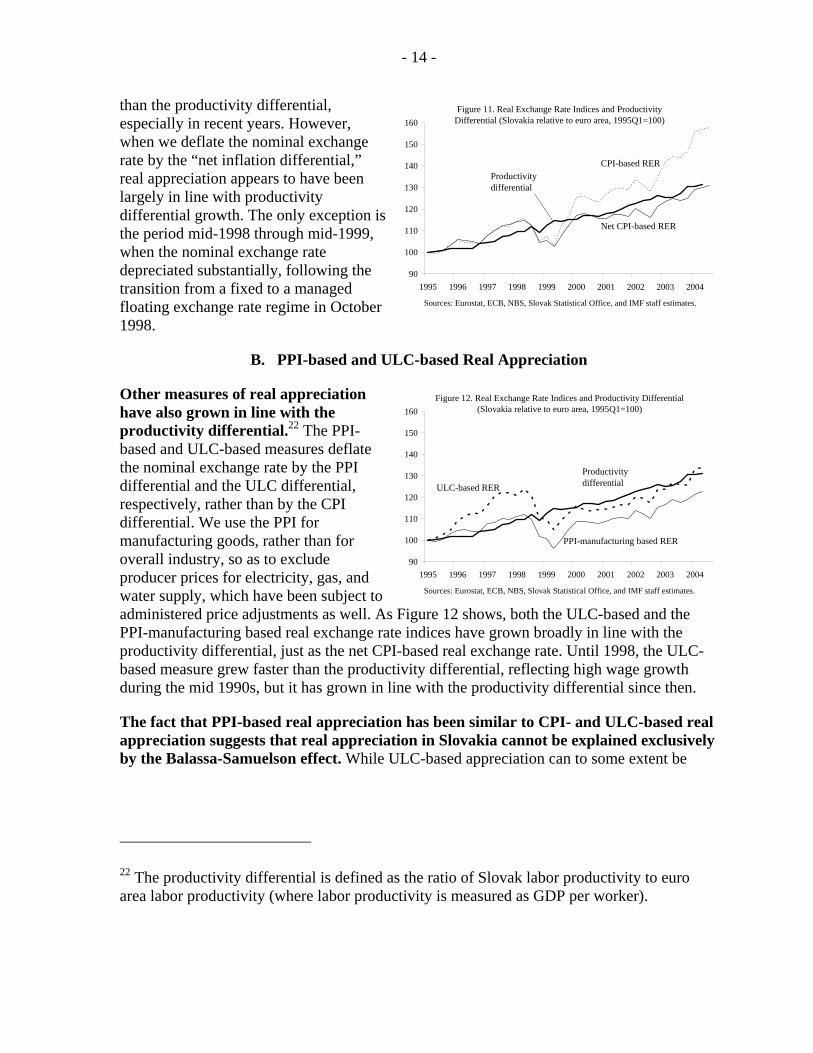
Other measures of real appreciation have also grown in line with the productivity differential.22 The PPI-based and ULC-based measures deflate the nominal exchange rate by the PPI differential and the ULC differential, respectively, rather than by the CPI differential. We use the PPI for manufacturing goods, rather than for overall industry, so as to exclude producer prices for electricity, gas, and water supply, which have been subject to administered price adjustments as well. As Figure 12 shows, both the ULC-based and the PPI-manufacturing based real exchange rate indices have grown broadly in line with the productivity differential, just as the net CPI-based real exchange rate. Until 1998, the ULC-based measure grew faster than the productivity differential, reflecting high wage growth during the mid 1990s, but it has grown in line with the productivity differential since then.
The fact that PPI-based real appreciation has been similar to CPI- and ULC-based real appreciation suggests that real appreciation in Slovakia cannot be explained exclusively by the Balassa-Samuelson effect. While ULC-based appreciation can to some extent be
22 The productivity differential is defined as the ratio of Slovak labor productivity to euro area labor productivity (where labor productivity is measured as GDP per worker).
Figure 12. Real Exchange Rate Indices and Productivity Differential (Slovakia relative to euro area, 1995Q1=100)
90
100
110
120
130
140
150
160
1995 1996 1997 1998 1999 2000 2001 2002 2003 2004
PPI-manufacturing based RER
Productivity differential ULC-based RER
Sources: Eurostat, ECB, NBS, Slovak Statistical Office, and IMF staff estimates.
Figure 11. Real Exchange Rate Indices and Productivity Differential (Slovakia relative to euro area, 1995Q1=100)
90
100
110
120
130
140
150
160
1995 1996 1997 1998 1999 2000 2001 2002 2003 2004
CPI-based RERProductivity differential
Sources: Eurostat, ECB, NBS, Slovak Statistical Office, and IMF staff estimates.
Net CPI-based RER
- 15 -
explained by the Balassa-Samuelson effect,23 PPI-based appreciation cannot, since relative productivity growth in the tradables sector should, in theory, not affect tradables prices. However, there are three main factors that could explain PPI-based real appreciation. First, the PPI is only an imperfect measure of tradable goods, and may have significant nontradable components, including goods that are subject to imperfect international competition. Second, there has been an improvement in the quality of domestically produced tradable goods, which—to the extent that this is not accounted for by revisions in the PPI basket—has increased the average price of tradables.24 Third, there has been an improvement in the marketing and reputation of tradable goods (including domestically produced foreign goods that used to be imported), which has also increased their value added and their price.25 Since the latter two factors have been driven by foreign direct investment, which, in turn, has been associated with productivity growth, it is not surprising that we find a strong relationship between productivity growth and PPI-based real appreciation.26
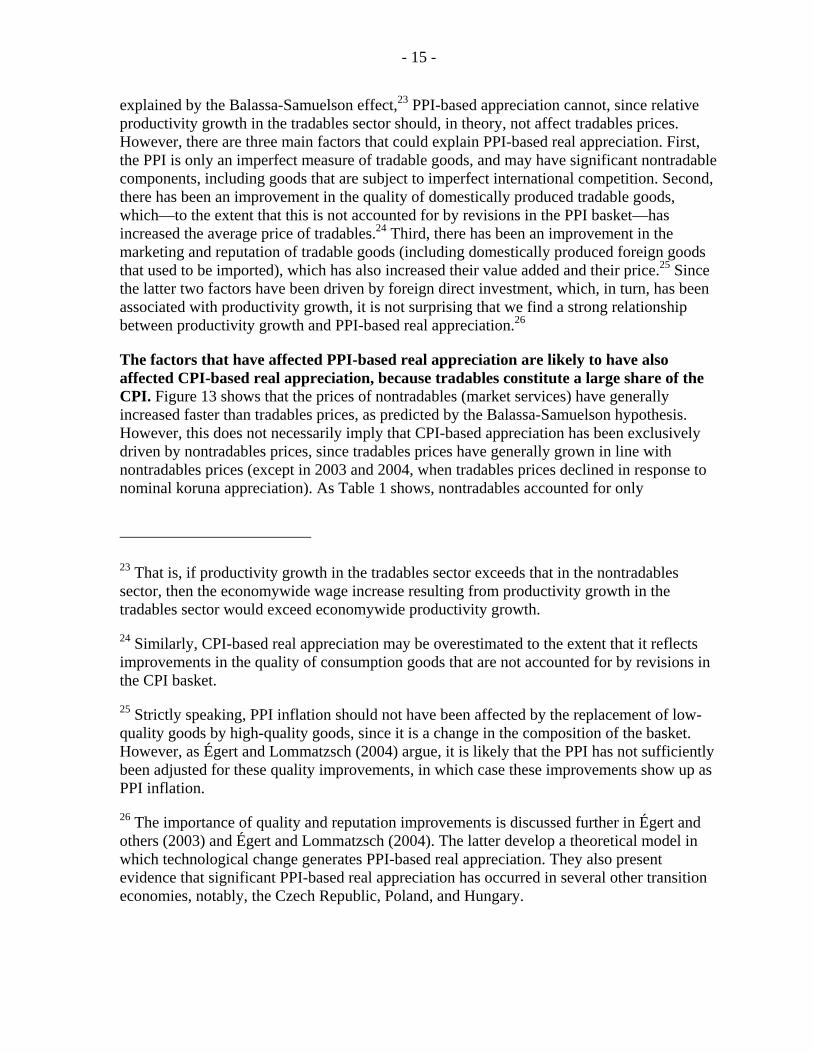
The factors that have affected PPI-based real appreciation are likely to have also affected CPI-based real appreciation, because tradables constitute a large share of the CPI. Figure 13 shows that the prices of nontradables (market services) have generally increased faster than tradables prices, as predicted by the Balassa-Samuelson hypothesis. However, this does not necessarily imply that CPI-based appreciation has been exclusively driven by nontradables prices, since tradables prices have generally grown in line with nontradables prices (except in 2003 and 2004, when tradables prices declined in response to nominal koruna appreciation). As Table 1 shows, nontradables accounted for only
23 That is, if productivity growth in the tradables sector exceeds that in the nontradables sector, then the economywide wage increase resulting from productivity growth in the tradables sector would exceed economywide productivity growth.
24 Similarly, CPI-based real appreciation may be overestimated to the extent that it reflects improvements in the quality of consumption goods that are not accounted for by revisions in the CPI basket.
25 Strictly speaking, PPI inflation should not have been affected by the replacement of low-quality goods by high-quality goods, since it is a change in the composition of the basket. However, as Égert and Lommatzsch (2004) argue, it is likely that the PPI has not sufficiently been adjusted for these quality improvements, in which case these improvements show up as PPI inflation.
26 The importance of quality and reputation improvements is discussed further in Égert and others (2003) and Égert and Lommatzsch (2004). The latter develop a theoretical model in which technological change generates PPI-based real appreciation. They also present evidence that significant PPI-based real appreciation has occurred in several other transition economies, notably, the Czech Republic, Poland, and Hungary.
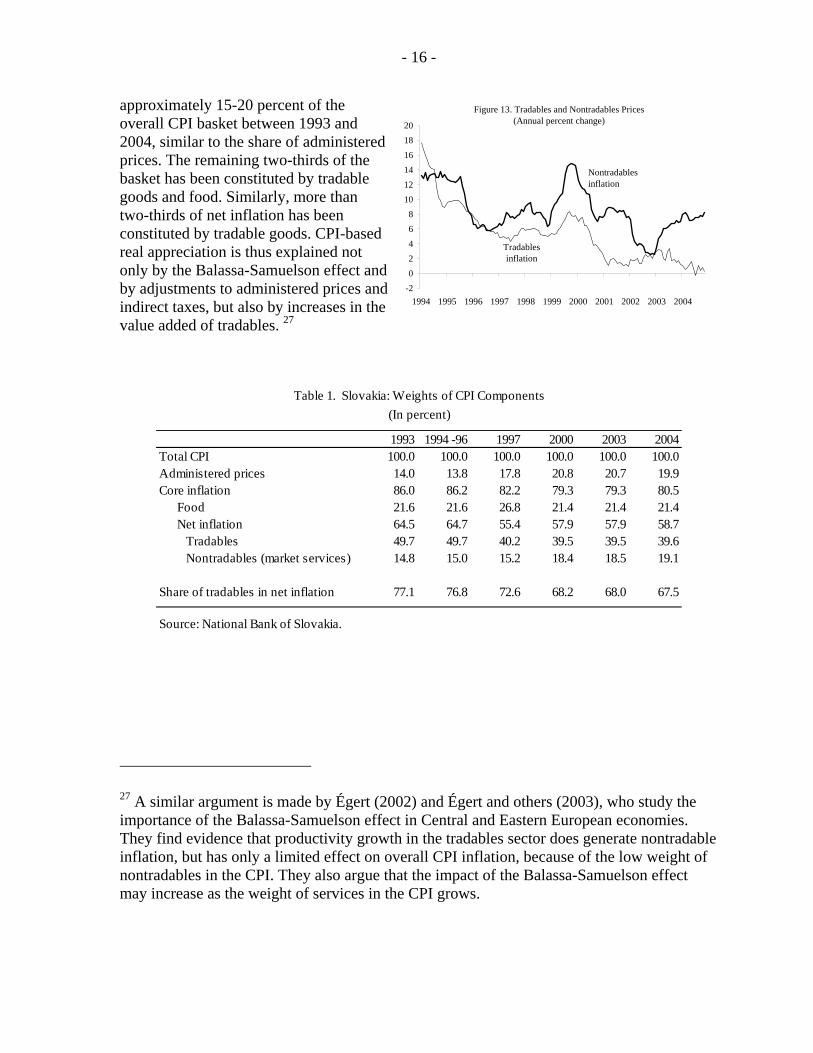
- 16 -
approximately 15-20 percent of the overall CPI basket between 1993 and 2004, similar to the share of administered prices. The remaining two-thirds of the basket has been constituted by tradable goods and food. Similarly, more than two-thirds of net inflation has been constituted by tradable goods. CPI-based real appreciation is thus explained not only by the Balassa-Samuelson effect and by adjustments to administered prices and indirect taxes, but also by increases in the value added of tradables. 27
1993 1994 -96 1997 2000 2003 2004Total CPI 100.0 100.0 100.0 100.0 100.0 100.0Administered prices 14.0 13.8 17.8 20.8 20.7 19.9Core inflation 86.0 86.2 82.2 79.3 79.3 80.5
Food 21.6 21.6 26.8 21.4 21.4 21.4Net inflation 64.5 64.7 55.4 57.9 57.9 58.7 Tradables 49.7 49.7 40.2 39.5 39.5 39.6 Nontradables (market services) 14.8 15.0 15.2 18.4 18.5 19.1
Share of tradables in net inflation 77.1 76.8 72.6 68.2 68.0 67.5
Source: National Bank of Slovakia.
Table 1. Slovakia: Weights of CPI Components(In percent)
27 A similar argument is made by Égert (2002) and Égert and others (2003), who study the importance of the Balassa-Samuelson effect in Central and Eastern European economies. They find evidence that productivity growth in the tradables sector does generate nontradable inflation, but has only a limited effect on overall CPI inflation, because of the low weight of nontradables in the CPI. They also argue that the impact of the Balassa-Samuelson effect may increase as the weight of services in the CPI grows.
Figure 13. Tradables and Nontradables Prices(Annual percent change)
-202468
101214161820
1994 1995 1996 1997 1998 1999 2000 2001 2002 2003 2004
Nontradables inflation
Tradables inflation
- 17 -
C. Econometric Estimation
Our econometric methodology is based on a Behavioral Equilibrium Exchange Rate (BEER) model.28 This methodology involves estimating the statistical long-run relationship between the real exchange rate and its fundamentals. In addition to the productivity differential, we follow the literature by also including government consumption as a fundamental determinant of the real exchange rate. The intuition behind this is that, to the extent that government spending is biased towards nontradables, an increase in government consumption is likely to lead to a rise in the relative price of nontradables, and therefore to real appreciation. Of course, one could argue that government spending will eventually have to be financed through higher taxes, which would offset the effect on real appreciation through a decline in disposable income and therefore to a fall in the relative price of nontradables, assuming that the demand for nontradables increases with disposable income. However, as Edwards (1989) has argued, the first effect is likely to dominate the second effect, and this is generally confirmed by empirical studies.29
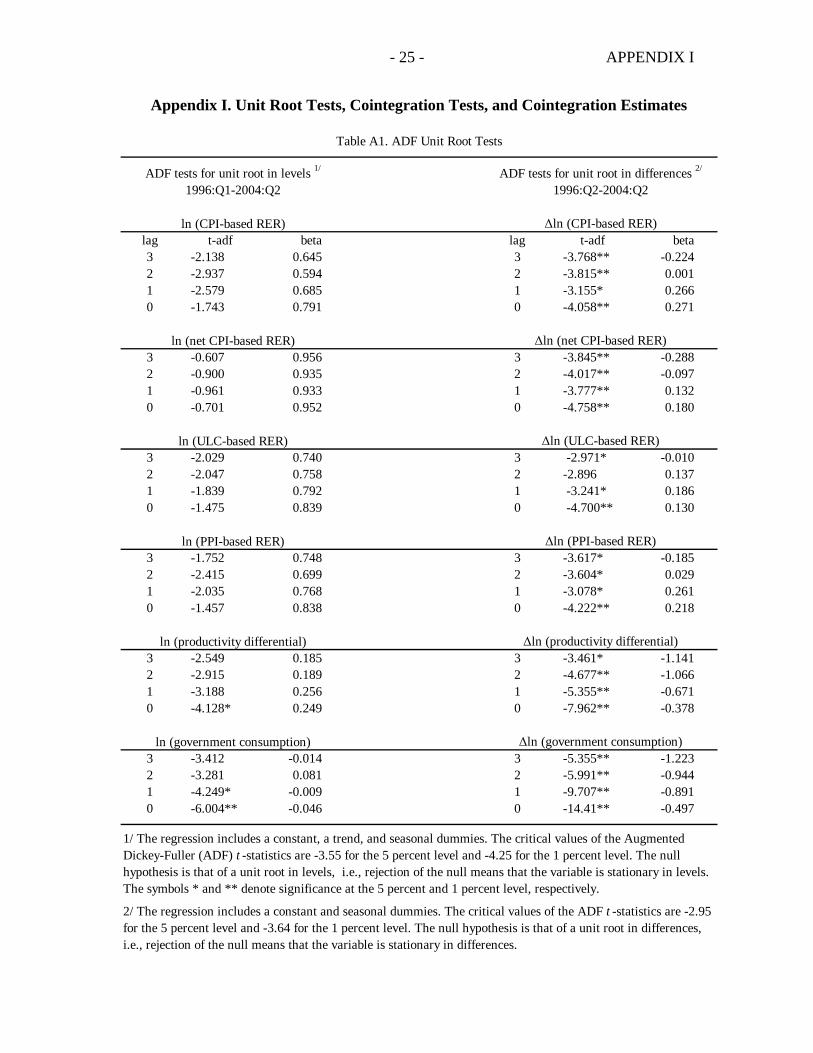
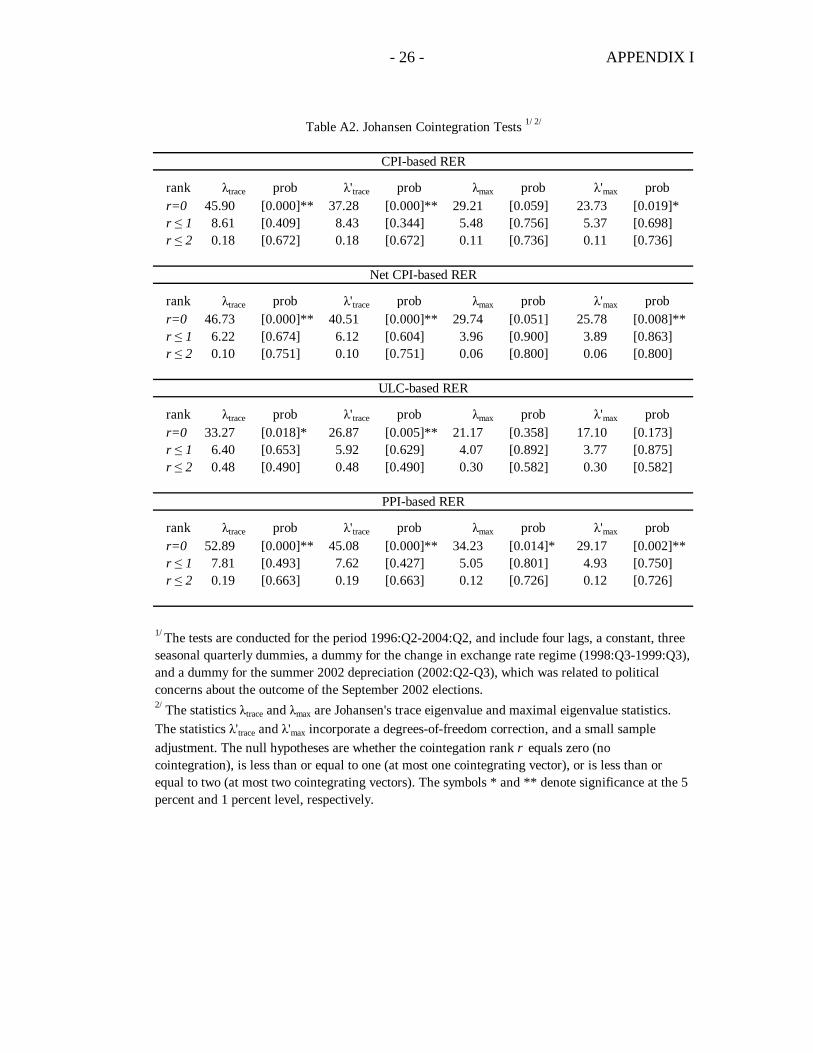
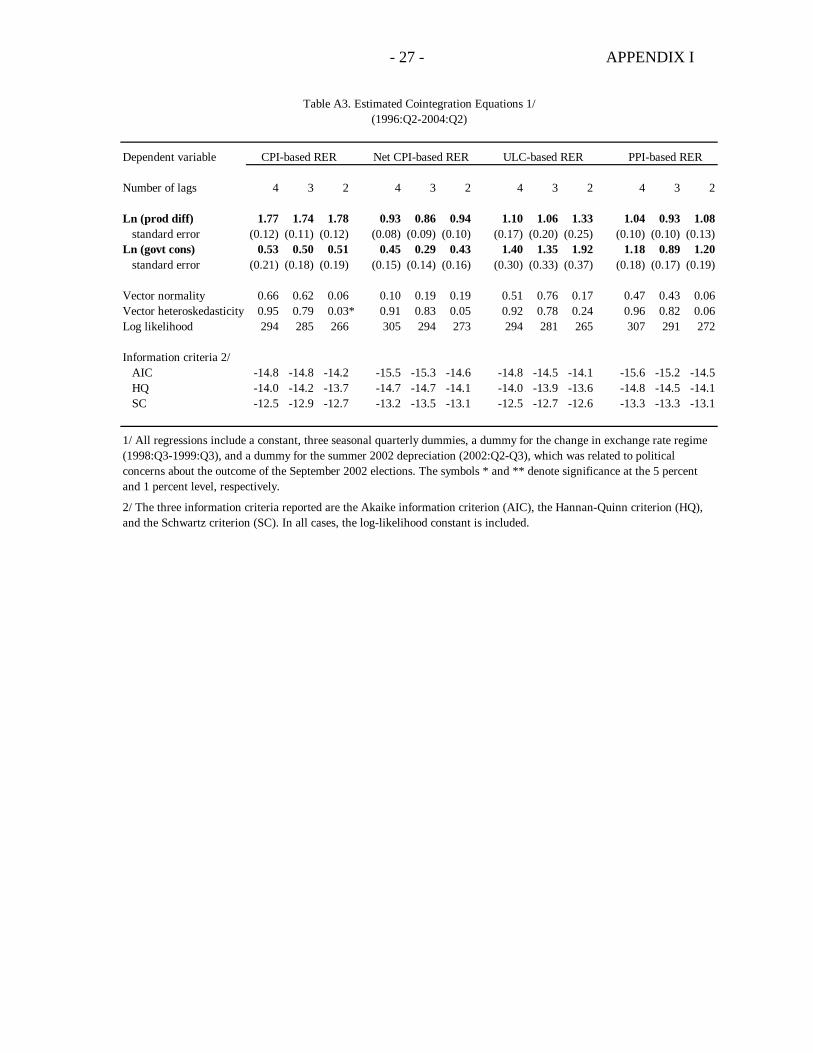
Our estimates suggest that all measures of real appreciation in Slovakia have been cointegrated with both productivity growth and the growth in government consumption.30 Appendix I reports evidence of stable cointegration relationships between the real exchange rate (deflated by headline CPI, net CPI, ULC, and PPI differentials), the productivity differential, and government consumption (in percent of GDP). Table A1 shows that all variables are nonstationary,31 implying that it is legitimate to search for a 28 Other equilbrium real exchange rate models include the Fundamental Equilibrium Exchange Rate (FEER) approach, the Desired Equilibrium Exchange Rate approach (DEER), and the Natural Rate of Exchange (NATREX) approach. For a survey, see Égert (2003).
29 In an important cross-country study, Froot and Rogoff (1991) found that the real exchange rate appreciates more in countries with a high growth rate of government consumption. Égert, Halpern, and MacDonald (2004), Table 5, list ten more papers that find a positive effect of government consumption on the real exchange rate, and only two papers that find a negative effect.
30 Besides government consumption to GDP, we also tried including several other variables, including trade openness, FDI inflows, and administered prices (to estimate potential second-round effects). However, this did not yield any meaningful results, since the variables turned out to be very highly correlated (by more than 90 percent) with each other as well as with the productivity differential, leading to multicollinearity problems. The only two variables that yielded a stable and robust cointegration relationship with the real exchange rate were the productivity differential and government consumption to GDP.
31 That is, the null hypothesis of a unit root in levels generally cannot be rejected (when sufficient lags are included), while the null hypothesis of a unit root in differences can be rejected (see Table A1).
- 18 -
cointegration relationship. Table A2 shows the results of Johansen cointegration tests, which provide evidence that a unique cointegrating vector exists between the three variables, for all different measures of the real exchange rate. Finally, Table A3 provides detailed estimates of the cointegrating vectors, with the coefficient for the real exchange rate normalized to one.
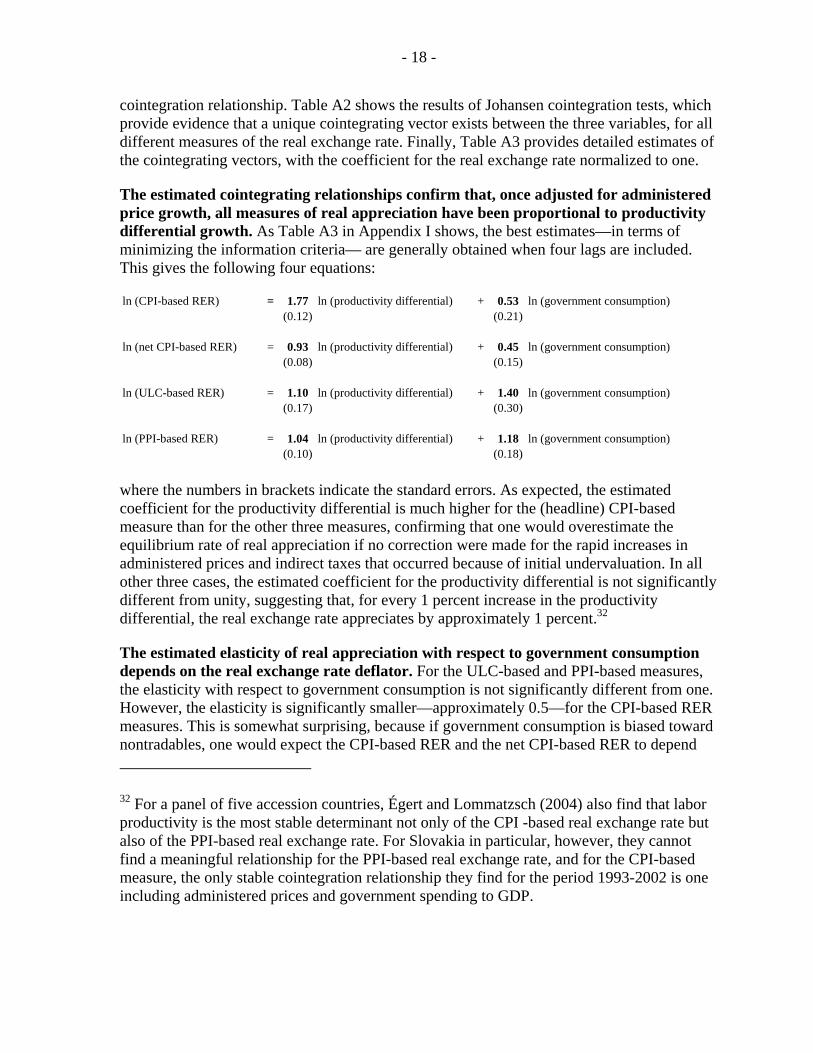
The estimated cointegrating relationships confirm that, once adjusted for administered price growth, all measures of real appreciation have been proportional to productivity differential growth. As Table A3 in Appendix I shows, the best estimates—in terms of minimizing the information criteria— are generally obtained when four lags are included. This gives the following four equations:
ln (CPI-based RER) = 1.77 ln (productivity differential) + 0.53 ln (government consumption)(0.12) (0.21)
ln (net CPI-based RER) = 0.93 ln (productivity differential) + 0.45 ln (government consumption)(0.08) (0.15)
ln (ULC-based RER) = 1.10 ln (productivity differential) + 1.40 ln (government consumption)(0.17) (0.30)
ln (PPI-based RER) = 1.04 ln (productivity differential) + 1.18 ln (government consumption)(0.10) (0.18)
where the numbers in brackets indicate the standard errors. As expected, the estimated coefficient for the productivity differential is much higher for the (headline) CPI-based measure than for the other three measures, confirming that one would overestimate the equilibrium rate of real appreciation if no correction were made for the rapid increases in administered prices and indirect taxes that occurred because of initial undervaluation. In all other three cases, the estimated coefficient for the productivity differential is not significantly different from unity, suggesting that, for every 1 percent increase in the productivity differential, the real exchange rate appreciates by approximately 1 percent.32
The estimated elasticity of real appreciation with respect to government consumption depends on the real exchange rate deflator. For the ULC-based and PPI-based measures, the elasticity with respect to government consumption is not significantly different from one. However, the elasticity is significantly smaller—approximately 0.5—for the CPI-based RER measures. This is somewhat surprising, because if government consumption is biased toward nontradables, one would expect the CPI-based RER and the net CPI-based RER to depend 32 For a panel of five accession countries, Égert and Lommatzsch (2004) also find that labor productivity is the most stable determinant not only of the CPI -based real exchange rate but also of the PPI-based real exchange rate. For Slovakia in particular, however, they cannot find a meaningful relationship for the PPI-based real exchange rate, and for the CPI-based measure, the only stable cointegration relationship they find for the period 1993-2002 is one including administered prices and government spending to GDP.
- 19 -
more strongly on government consumption than the other measures. A possible explanation for the strong effect on the ULC-based RER is that an important part of government consumption includes salaries of civil servants, which affect economywide unit labor costs. However, we do not have a good explanation for the strong effect on the PPI-based RER.
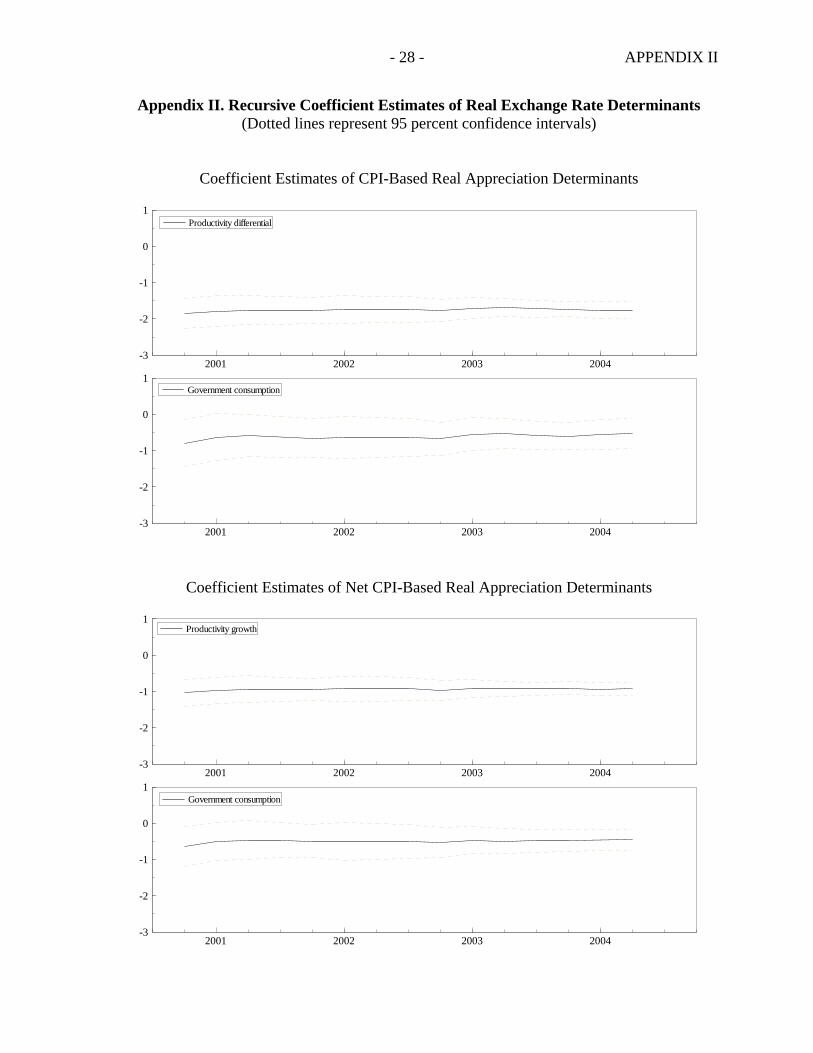
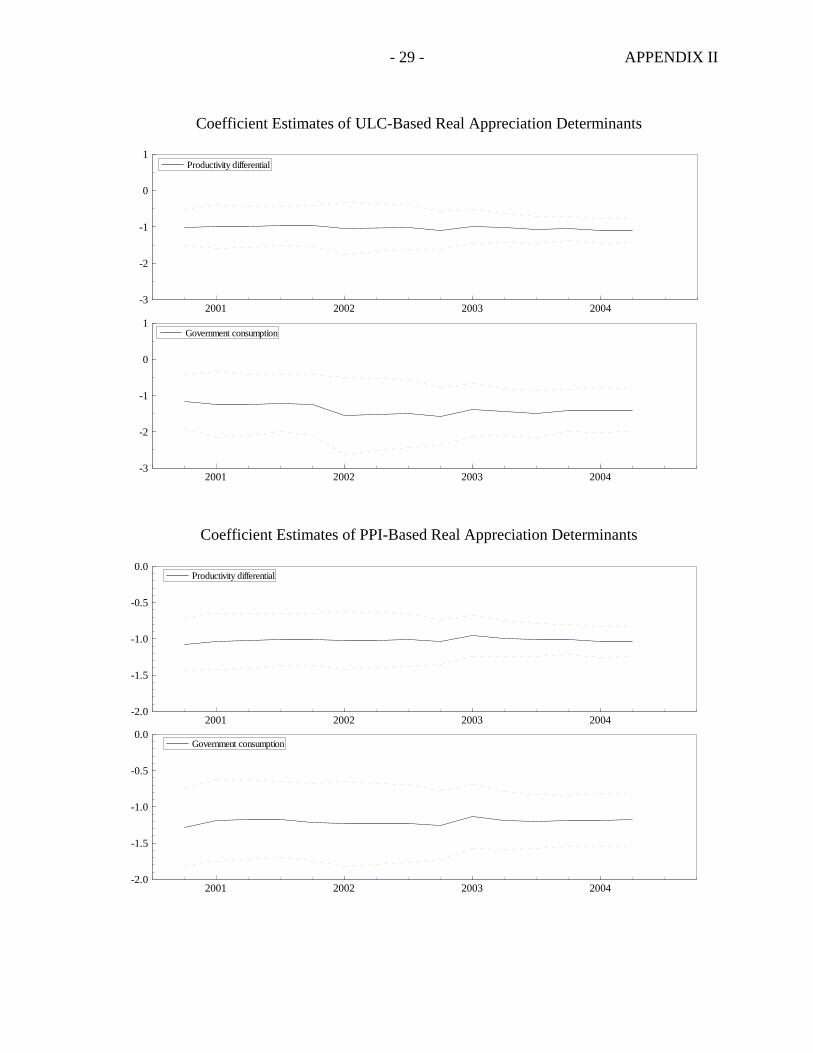
In spite of the small number of observations, the estimates are robust to variations in the number of lags and in the sample period. The residuals for the regressions with three or four lags are all well-behaved, and the coefficient estimates are never significantly different from one in any of the regressions. For the case of two lags, the null hypothesis of no heteroskedasticity is either rejected or barely accepted, hence these estimates are somewhat less reliable.33 To further test the robustness of the estimates, we performed a recursive estimation of the coefficients by shrinking the sample by one observation at the time. The results, shown in Appendix II, confirm that the estimated coefficients are very stable over time, with the confidence interval narrowing slightly as the sample size increases.
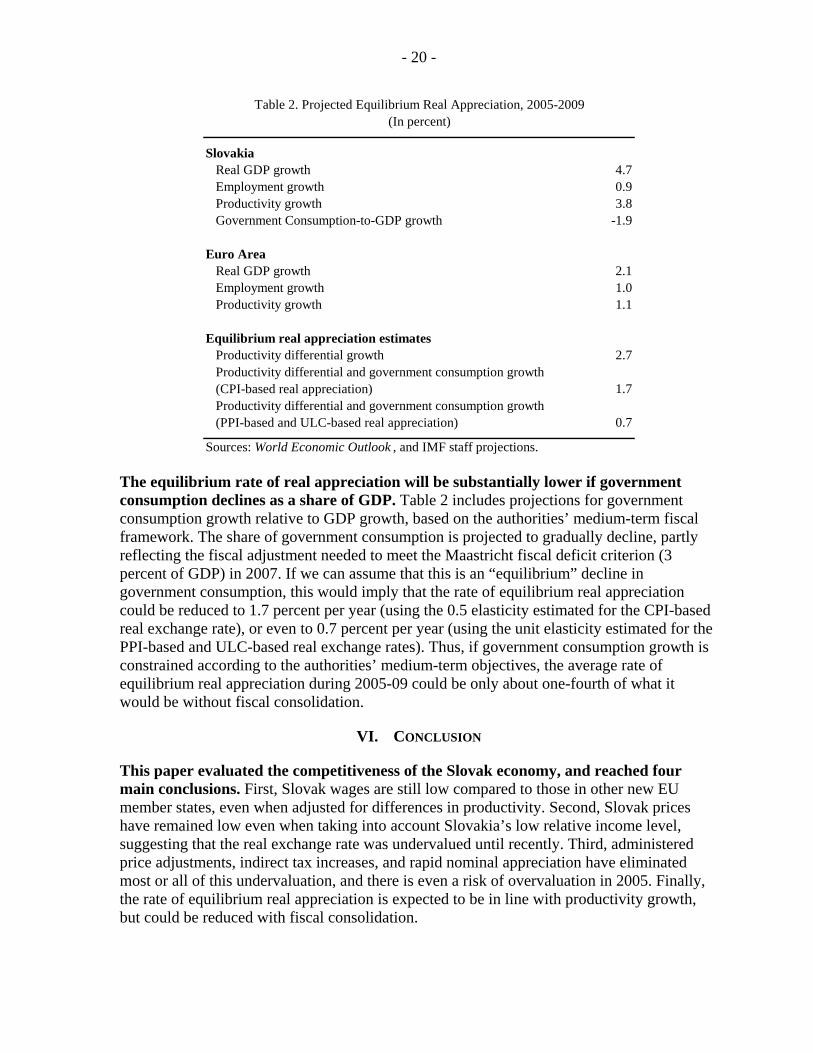
D. Projections
In terms of projections, our estimates suggest that productivity-driven equilibrium real appreciation may approach 3 percent per year on average during the next five years. Table 2 presents projections on average output and employment growth for Slovakia and the euro area. These projections imply a growth in the productivity differential by 2.7 percent per year on average during 2005-09. Since administered prices and indirect taxes are not expected to play an important role anymore, we can assume that real appreciation will be proportional to the growth in the productivity differential, as implied by our estimates. If government consumption were to remain constant in percent of GDP, productivity-driven equilibrium real appreciation would thus be close to 3 percent per year— an estimate that is very similar to that obtained by other studies.34
33 This test amounts to a multivariate regression of all error variances and covariances on the original regressors and their squares (excluded unrestricted regressors, i.e., constant and dummies).
34 Tóth and Chudik (2004) estimate the medium-term equilibrium real appreciation rate in Slovakia at 3.1 percent per year. Kovács (2002) “guesstimates” the Balassa-Samuelson effect for Slovakia at 1−2 percent, but notes that 3 percent “is possible in the future, in case of accelerated FDI inflow into the manufacturing sector.” Kovács and Simon (1998) and Rother (2000) also find a productivity-driven real appreciation of approximately 3 percent per year for Hungary and Slovenia, respectively. In contrast, Égert (2002) finds that equilibrium real appreciation is close to zero for Slovakia, the Czech Republic, and Slovenia, but this may be due to the fact that he assumes that productivity growth in the nontradables sector is zero, while Mihaljek and Klau (2004) estimate this at 3 percent for Slovakia. By thus overestimating the relative productivity growth differential, he is likely underestimating the effect of the “true” relative productivity growth differential on real appreciation.
- 20 -
SlovakiaReal GDP growth 4.7Employment growth 0.9Productivity growth 3.8Government Consumption-to-GDP growth -1.9
Euro AreaReal GDP growth 2.1Employment growth 1.0Productivity growth 1.1
Equilibrium real appreciation estimatesProductivity differential growth 2.7Productivity differential and government consumption growth (CPI-based real appreciation) 1.7Productivity differential and government consumption growth (PPI-based and ULC-based real appreciation) 0.7
Sources: World Economic Outlook , and IMF staff projections.
Table 2. Projected Equilibrium Real Appreciation, 2005-2009(In percent)
The equilibrium rate of real appreciation will be substantially lower if government consumption declines as a share of GDP. Table 2 includes projections for government consumption growth relative to GDP growth, based on the authorities’ medium-term fiscal framework. The share of government consumption is projected to gradually decline, partly reflecting the fiscal adjustment needed to meet the Maastricht fiscal deficit criterion (3 percent of GDP) in 2007. If we can assume that this is an “equilibrium” decline in government consumption, this would imply that the rate of equilibrium real appreciation could be reduced to 1.7 percent per year (using the 0.5 elasticity estimated for the CPI-based real exchange rate), or even to 0.7 percent per year (using the unit elasticity estimated for the PPI-based and ULC-based real exchange rates). Thus, if government consumption growth is constrained according to the authorities’ medium-term objectives, the average rate of equilibrium real appreciation during 2005-09 could be only about one-fourth of what it would be without fiscal consolidation.
VI. CONCLUSION
This paper evaluated the competitiveness of the Slovak economy, and reached four main conclusions. First, Slovak wages are still low compared to those in other new EU member states, even when adjusted for differences in productivity. Second, Slovak prices have remained low even when taking into account Slovakia’s low relative income level, suggesting that the real exchange rate was undervalued until recently. Third, administered price adjustments, indirect tax increases, and rapid nominal appreciation have eliminated most or all of this undervaluation, and there is even a risk of overvaluation in 2005. Finally, the rate of equilibrium real appreciation is expected to be in line with productivity growth, but could be reduced with fiscal consolidation.
- 21 -
We assessed the equilibrium level rate of real appreciation using both cross-section and time-series techniques. Based on our cross-section estimates, we found that the Slovak real exchange rate is likely to have been undervalued in the past, but may reach equilibrium in 2005. Based on our time-series estimates, we found that the equilibrium real exchange rate appreciates by 1 percent for every 1 percent increase in the productivity differential with the euro area. These estimates were robust to variations in the number of lags and in the sample period and had relatively small standard errors. The estimates were also adjusted for increases in administered prices and indirect taxes, which otherwise would have led to an upward bias of the equilibrium real exchange rate due to initial undervaluation.
Our estimate of productivity-driven real equilibrium real appreciation is robust to using different real exchange rate deflators, which suggests that it cannot be exclusively explained by the Balassa-Samuelson effect. Our finding that equilibrium real appreciation is proportional to productivity differential growth holds not only for the CPI-based real exchange rate (adjusted for increases in administered prices and indirect taxes), but also for ULC-based and PPI-based measures of the real exchange rate. While ULC-based appreciation can partly be explained by the Balassa-Samuelson effect, PPI-based appreciation cannot, since relative productivity growth in the tradables sector should, in theory, not affect tradables prices. Instead, the association between PPI-based appreciation and productivity growth can be explained in part by the fact that productivity growth, driven by foreign direct investment, has gone hand in hand with an improvement in the quality and marketing of tradable goods, which has increased their value added.
Our time-series estimates imply that the equilibrium real appreciation rate will be close to 3 percent per year on average in the next five years, assuming that government consumption does not grow as a share of GDP. However, the equilibrium real appreciation rate could be significantly reduced if government consumption declines in percent of GDP, as planned, with the amount of the reduction depending on the real exchange rate deflator (CPI, PPI, or ULC). By helping to reduce real appreciation, fiscal policy can thus support monetary policy in achieving disinflation without losing competitiveness.
- 22 -
REFERENCES
Balassa, Bela, 1964, “The Purchasing Power Parity Doctrine: A Reappraisal,” Journal of Political Economy, Vol. 72, No. 6, pp. 584–96.
Burgess, Robert, Stefania Fabrizio, and Yuan Xiao, 2004, The Baltics: Competitiveness on
the Eve of EU Accession (Washington: International Monetary Fund). Coudert, Virginie, 1999, “Comment définer un taux de change d’équilibre pour les pays
émergents,” Économie Internationale, No. 77, pp. 1–23. ______________, and Cécile Couharde, 2003, “Exchange Rate Regimes and Sustainable
Parities for CEECs in the Run-Up to EMU Membership,” Revue Économique, Vol. 54, No. 5, pp. 983–1012.
De Gregorio, Jose, Alberto Giovannini, and Holger Wolf, 1994, “International Evidence on
Tradables and Nontradables Inflation,” European Economic Review, Vol. 38, No. 6, pp. 1225–44.
Dufrenot, Gilles, and Balázs Égert, 2005, “Real Exchange Rates in Central and Eastern
Europe: What Scope for the Underlying Fundamentals?” Emerging Markets Finance and Trade Vol. 41, No. 2, pp. 41–59.
Edwards, Sebastian, 1989, Real Exchange Rates, Devaluation, and Adjustment (Cambridge,
Massachusetts: MIT Press). Égert, Balázs, 2002, “Investigating the Balassa-Samuelson Hypothesis in the Transition: Do
We Understand What We See? A Panel Study,” Economics of Transition, Vol. 10, No. 2, pp. 273–309.
___________, 2003, “Assessing Equilibrium Exchange Rates in CEE Acceding Countries:
Can We Have DEER with BEER without FEER? A Critical Survey of the Literature,” Focus on Transition Vol. 2, pp. 38–106. Available via the Internet: http://www.oenb.at/en/img/egert_ftr_203_tcm16-10369.pdf
Égert, Balázs, Imed Drine, Kirsten Lommatzsch, and Christophe Rault, 2003, “The Balassa-
Samuelson Effect in Central and Eastern Europe: Myth or Reality?” Journal of Comparative Economics, Vol. 31, pp. 552–72.
Égert, Balázs, László Halpern, and Ronald MacDonald, 2004, “Equilibrium Exchange Rates
in Transition Economies: Taking Stock of the Issues,” Centre for Economic Policy Research Discussion Paper No. 4809 (London: Centre for Economic Policy Research Discussion Paper). Available via the Internet: www.cepr.org/pubs/dps/DP4809.asp
- 23 -
Égert, Balázs, and Kirsten Lommatzsch, 2004, “Equilibrium Exchange Rates in the Transition: The Tradable Price-Based Real Appreciation and Estimation Uncertainty,” William Davidson Institute Working Paper No. 676 (Ann Arbor: William Davidson Institute at the University of Michigan Business School). Available via the Internet: http://ideas.repec.org/p/wdi/papers/2004-676.html
Froot, K.A., and Kenneth Rogoff, 1991, “The EMS, the EMU, and the Transition to a
Common Currency”, in Macroeconomics Annual 1991, ed. by Olivier Blanchard and Stanley Fischer (Cambridge, Mass: MIT Press), pp. 269–371.
Halpern, László, and Charles Wyplosz, 1997, “Equilibrium Exchange Rates in Transition
Economies,” IMF Staff Papers Vol. 44, No. 4, pp. 430–461. IMD, 2004, “IMD World Competitiveness Yearbook 2004” (Lausanne: Institute for
Management Development). Summary available via the Internet: http://www02.imd.ch/wcc/pressreleases/
IMF, 2004, “Czech Republic: 2004 Article IV Consultation—Staff Report” (Washington:
International Monetary Fund). Available via the Internet: http://www.imf.org/external/pubs/cat/longres.cfm?sk=17652.0
Kotian, Juraj, 2004, “Is the Slovak Koruna Overvalued?” in Country Report: Slovak Republic
(Bratislava: Slovenska Sporitelna), April. Kotian, Juraj, 2005, “Competitiveness of Slovak Economy In Light Of Structural Changes”
in Country Report: Slovak Republic (Bratislava: Slovenska Sporitelna), January. Kovács, Mihály András, ed., 2002, “On the Estimated Size of the Balassa-Samuelson Effect
in Five Central and Eastern European Countries,” NBH Working Paper No. 2002/5 (Budapest: National Bank of Hungary). Available via the Internet: http://english.mnb.hu/Engine.aspx?page=mnben_mnbfuzetek&ContentID=3093
Kovács, Mihály András, and András Simon, 1998, “The Components of the Real Exchange
Rate in Hungary,” NBH Working Paper No. 1998/3 (Budapest: National Bank of Hungary). Available via the Internet: http://english.mnb.hu/Engine.aspx?page=mnben_mnbfuzetek&ContentID=3099
Krajnyák, Kornélia, and Jeromin Zettelmeyer, 1998, “Competitiveness in Transition
Economies—What Scope for Real Appreciation?” IMF Staff Papers, Vol. 45, No. 2, pp. 309–362.
Kravis, Irving, and Richard Lipsey, 1988, “National Price Levels and the Prices of Tradables
and Nontradables,” American Economic Review, Papers and Proceedings, Vol 78, No. 2 (May) pp. 474–78.
- 24 -
Lee, Jaewoo, Gian Maria Milesi-Ferretti, Luca Ricci, and Sarma Jayanthi, 2005, “Equilibrium Real Exchange Rates: Estimates for Industrial Countries and Emerging Markets” (unpublished; Washington: International Monetary Fund).
Maeso-Fernandez, Francisco, Chiara Osbat, and Bernd Schnatz, 2004, “Towards the
Estimation of Equilibrium Exchange Rates for CEE Acceding Countries: Methodological Issues and a Panel Cointegration Perspective,” ECB Working Paper No. 353 (Frankfurt: European Central Bank).
Mihaljek, Dubravko, and Marc Klau, 2004, “The Balassa-Samuelson Effect in Central
Europe: A Disaggregated Analysis,” Comparative Economic Studies, Vol. 46, pp. 63–94.
Murgasova, Zuzana, 2004, “Assessment of Competitiveness,” in Republic of Poland:
Selected Issues, IMF Country Report, No. 04/218 (Washington: International Monetary Fund).
National Bank of Slovakia, 2004, “Slovak Republic –Convergence Assessment,” July
(Bratislava: National bank of Slovakia, Institute of Monetary and Financial Studies). Rogoff, Kenneth, 1996, “The Purchasing Power Puzzle,” Journal of Economic Literature,
Vol. 34, No. 2, June, pp. 647–68. Rother, C. P., 2000, “The Impact of Productivity Differentials on Inflation and the Real
Exchange Rate: an Estimation of the Balassa-Samuelson Effect in Slovenia,” in Republic of Slovenia: Selected Issues, IMF Country Report, No. 00/56 (Washington: International Monetary Fund).
Samuelson, Paul A., 1964, “Theoretical Notes on Trade Problems,” Review of Economics
and Statistics, Vol. 46, No. 2, pp. 145–54. Tóth, Jan, and Alexander Chudik, 2004, “In Search of a Koruna Equilibrium. Part I: BEER
Approach,” ING Economics Paper No. 4 (Bratislava: ING Bank). World Bank, 2004, Doing Business in 2005: Removing Obstacles to Growth (Washington:
World Bank and Oxford University Press). Available via the Internet: http://rru.worldbank.org/doingbusiness/
- 25 - APPENDIX I
Appendix I. Unit Root Tests, Cointegration Tests, and Cointegration Estimates
lag t-adf beta lag t-adf beta3 -2.138 0.645 3 -3.768** -0.2242 -2.937 0.594 2 -3.815** 0.0011 -2.579 0.685 1 -3.155* 0.2660 -1.743 0.791 0 -4.058** 0.271
3 -0.607 0.956 3 -3.845** -0.2882 -0.900 0.935 2 -4.017** -0.0971 -0.961 0.933 1 -3.777** 0.1320 -0.701 0.952 0 -4.758** 0.180
3 -2.029 0.740 3 -2.971* -0.0102 -2.047 0.758 2 -2.896 0.1371 -1.839 0.792 1 -3.241* 0.1860 -1.475 0.839 0 -4.700** 0.130
3 -1.752 0.748 3 -3.617* -0.1852 -2.415 0.699 2 -3.604* 0.0291 -2.035 0.768 1 -3.078* 0.2610 -1.457 0.838 0 -4.222** 0.218
3 -2.549 0.185 3 -3.461* -1.1412 -2.915 0.189 2 -4.677** -1.0661 -3.188 0.256 1 -5.355** -0.6710 -4.128* 0.249 0 -7.962** -0.378
3 -3.412 -0.014 3 -5.355** -1.2232 -3.281 0.081 2 -5.991** -0.9441 -4.249* -0.009 1 -9.707** -0.8910 -6.004** -0.046 0 -14.41** -0.497
1996:Q1-2004:Q2 1996:Q2-2004:Q2
ln (CPI-based RER) ∆ln (CPI-based RER)
ln (PPI-based RER) ∆ln (PPI-based RER)
ln (government consumption) ∆ln (government consumption)
ln (productivity differential)
1/ The regression includes a constant, a trend, and seasonal dummies. The critical values of the Augmented Dickey-Fuller (ADF) t -statistics are -3.55 for the 5 percent level and -4.25 for the 1 percent level. The null hypothesis is that of a unit root in levels, i.e., rejection of the null means that the variable is stationary in levels. The symbols * and ** denote significance at the 5 percent and 1 percent level, respectively.
2/ The regression includes a constant and seasonal dummies. The critical values of the ADF t -statistics are -2.95 for the 5 percent level and -3.64 for the 1 percent level. The null hypothesis is that of a unit root in differences, i.e., rejection of the null means that the variable is stationary in differences.
Table A1. ADF Unit Root Tests
∆ln (productivity differential)
ADF tests for unit root in levels 1/ ADF tests for unit root in differences 2/
ln (net CPI-based RER) ∆ln (net CPI-based RER)
ln (ULC-based RER) ∆ln (ULC-based RER)
- 26 - APPENDIX I
rank λtrace prob λ'trace prob λmax prob λ'max probr=0 45.90 [0.000]** 37.28 [0.000]** 29.21 [0.059] 23.73 [0.019]*r ≤ 1 8.61 [0.409] 8.43 [0.344] 5.48 [0.756] 5.37 [0.698]r ≤ 2 0.18 [0.672] 0.18 [0.672] 0.11 [0.736] 0.11 [0.736]
rank λtrace prob λ'trace prob λmax prob λ'max probr=0 46.73 [0.000]** 40.51 [0.000]** 29.74 [0.051] 25.78 [0.008]**r ≤ 1 6.22 [0.674] 6.12 [0.604] 3.96 [0.900] 3.89 [0.863]r ≤ 2 0.10 [0.751] 0.10 [0.751] 0.06 [0.800] 0.06 [0.800]
rank λtrace prob λ'trace prob λmax prob λ'max probr=0 33.27 [0.018]* 26.87 [0.005]** 21.17 [0.358] 17.10 [0.173]r ≤ 1 6.40 [0.653] 5.92 [0.629] 4.07 [0.892] 3.77 [0.875]r ≤ 2 0.48 [0.490] 0.48 [0.490] 0.30 [0.582] 0.30 [0.582]
rank λtrace prob λ'trace prob λmax prob λ'max probr=0 52.89 [0.000]** 45.08 [0.000]** 34.23 [0.014]* 29.17 [0.002]**r ≤ 1 7.81 [0.493] 7.62 [0.427] 5.05 [0.801] 4.93 [0.750]r ≤ 2 0.19 [0.663] 0.19 [0.663] 0.12 [0.726] 0.12 [0.726]
1/ The tests are conducted for the period 1996:Q2-2004:Q2, and include four lags, a constant, three seasonal quarterly dummies, a dummy for the change in exchange rate regime (1998:Q3-1999:Q3), and a dummy for the summer 2002 depreciation (2002:Q2-Q3), which was related to political concerns about the outcome of the September 2002 elections.
Table A2. Johansen Cointegration Tests 1/ 2/
2/ The statistics λtrace and λmax are Johansen's trace eigenvalue and maximal eigenvalue statistics. The statistics λ'trace and λ'max incorporate a degrees-of-freedom correction, and a small sample adjustment. The null hypotheses are whether the cointegation rank r equals zero (no cointegration), is less than or equal to one (at most one cointegrating vector), or is less than or equal to two (at most two cointegrating vectors). The symbols * and ** denote significance at the 5 percent and 1 percent level, respectively.
CPI-based RER
Net CPI-based RER
ULC-based RER
PPI-based RER
- 27 - APPENDIX I
Dependent variable
Number of lags 4 3 2 4 3 2 4 3 2 4 3 2
Ln (prod diff) 1.77 1.74 1.78 0.93 0.86 0.94 1.10 1.06 1.33 1.04 0.93 1.08standard error (0.12) (0.11) (0.12) (0.08) (0.09) (0.10) (0.17) (0.20) (0.25) (0.10) (0.10) (0.13)
Ln (govt cons) 0.53 0.50 0.51 0.45 0.29 0.43 1.40 1.35 1.92 1.18 0.89 1.20standard error (0.21) (0.18) (0.19) (0.15) (0.14) (0.16) (0.30) (0.33) (0.37) (0.18) (0.17) (0.19)
Vector normality 0.66 0.62 0.06 0.10 0.19 0.19 0.51 0.76 0.17 0.47 0.43 0.06Vector heteroskedasticity 0.95 0.79 0.03* 0.91 0.83 0.05 0.92 0.78 0.24 0.96 0.82 0.06Log likelihood 294 285 266 305 294 273 294 281 265 307 291 272
Information criteria 2/AIC -14.8 -14.8 -14.2 -15.5 -15.3 -14.6 -14.8 -14.5 -14.1 -15.6 -15.2 -14.5HQ -14.0 -14.2 -13.7 -14.7 -14.7 -14.1 -14.0 -13.9 -13.6 -14.8 -14.5 -14.1SC -12.5 -12.9 -12.7 -13.2 -13.5 -13.1 -12.5 -12.7 -12.6 -13.3 -13.3 -13.1
Table A3. Estimated Cointegration Equations 1/
PPI-based RER
(1996:Q2-2004:Q2)
ULC-based RERCPI-based RER
1/ All regressions include a constant, three seasonal quarterly dummies, a dummy for the change in exchange rate regime (1998:Q3-1999:Q3), and a dummy for the summer 2002 depreciation (2002:Q2-Q3), which was related to political concerns about the outcome of the September 2002 elections. The symbols * and ** denote significance at the 5 percent and 1 percent level, respectively.
2/ The three information criteria reported are the Akaike information criterion (AIC), the Hannan-Quinn criterion (HQ), and the Schwartz criterion (SC). In all cases, the log-likelihood constant is included.
Net CPI-based RER
- 28 - APPENDIX II
Appendix II. Recursive Coefficient Estimates of Real Exchange Rate Determinants (Dotted lines represent 95 percent confidence intervals)
Coefficient Estimates of CPI-Based Real Appreciation Determinants
2001 2002 2003 2004-3
-2
-1
0
1Productivity differential
2001 2002 2003 2004-3
-2
-1
0
1Government consumption
Coefficient Estimates of Net CPI-Based Real Appreciation Determinants
2001 2002 2003 2004-3
-2
-1
0
1Productivity growth
2001 2002 2003 2004-3
-2
-1
0
1Government consumption
- 29 - APPENDIX II
Coefficient Estimates of ULC-Based Real Appreciation Determinants
2001 2002 2003 2004-3
-2
-1
0
1Productivity differential
2001 2002 2003 2004-3
-2
-1
0
1Government consumption
Coefficient Estimates of PPI-Based Real Appreciation Determinants
2001 2002 2003 2004-2.0
-1.5
-1.0
-0.5
0.0Productivity differential
2001 2002 2003 2004-2.0
-1.5
-1.0
-0.5
0.0Government consumption
Related Documents