IITB Summer Internship 2014 Project Report Recommendation System for Adaptive e-learning Principal Investigator Prof. D.B. Phatak Project In-Charge Mr. Nagesh Karmali Project Mentors Project Group Members Miss Firuza Aibara Mr. Devanshu Jain Mr. Ashish Kedia Mr. Rakshit Singla Mr. Sameer Sonawane

Welcome message from author
This document is posted to help you gain knowledge. Please leave a comment to let me know what you think about it! Share it to your friends and learn new things together.
Transcript

IITB Summer Internship 2014
Project Report
Recommendation System forAdaptive e-learning
Principal InvestigatorProf. D.B. Phatak
Project In-ChargeMr. Nagesh Karmali
Project Mentors Project Group MembersMiss Firuza Aibara Mr. Devanshu Jain
Mr. Ashish KediaMr. Rakshit Singla
Mr. Sameer Sonawane

text

Summer Internship 2014Project Approval Certificate
Department of Computer Science and Engineering
Indian Institute of Technology Bombay
The project entitled ”Recommendation System for Adaptive e-learning” submitted byMr. Devanshu Jain, Mr. Rakshit Singla, Mr. Ashish Kedia and Mr. Sameer Sonawaneis approved for Summer Internship 2014 programme from 10th May 2014 to 6th July2014, at Department of Computer Science and Engineering, IIT Bombay.
Prof. Deepak B. Phatak Mr. Nagesh KarmaliDept. of CSE, IITB Dept. of CSE, IITBPrincipal Investigator Project In-Charge
Place: IIT Bombay, MumbaiDate: July 2, 2014

text

DeclarationI declare that this written submission represents my ideas in my own words and whereothers’ ideas or words have been included, I have adequately cited and referenced theoriginal sources. I also declare that I have adhered to all principles of academic honestyand integrity and have not misrepresented or fabricated or falsified any idea/data/-fact/source in my submission. I understand that any violation of the above will because for disciplinary action by the Institute and can also evoke penal action from thesources which have thus not been properly cited or from whom proper permission hasnot been taken when needed.
Mr. Devanshu JainDhirubhai Ambani Institute of Information and Communication Technology
Mr. Ashish KediaNational Institute of Technology Karnataka, Surathkal
Mr. Rakshit SinglaIndian Institute of Technology, Hyderabad
Mr. Sameer SonawaneVisvesvaraya National Institute of Technology, Nagpur
Date:

text

Acknowledgements
We have put our best efforts in this project. However, it would not have been possiblewithout the kind support and help of many individuals and organizations. We wouldlike to extend our sincere thanks to all of them.
We are highly indebted to Prof D.B. Phatak, Mr. Nagesh Karmali and Miss FiruzaAibara for their guidance and constant supervision as well as for providing necessaryinformation regarding the project and also for their support in completing the project.
We would like to express our gratitude towards the members of IIT Bombay, fortheir kind co-operation and encouragement which helped us in the completion of thisproject. Our thanks and appreciations also go to our colleagues in other groups indeveloping the project and people who have willingly helped us out with their abilities.

text

Abstract
Role of computer in modern world education has introduced a new way of learningthat is independent of traditional classroom style and goes beyond its ideology of ’onesize fits all’. The classroom style follows the method of one instructor guiding manyusers through a course, which, although sounds like a very tedious and inefficient job,still happens. While today’s Learning Management Systems (LMSs) do facilitate theinstructor to make the content available online, yet they don’t have any functionalityto personalise the learning of the user. The adaptive e-learning technology extendsthe traditional classroom environment to make the guidance, a one to one mechanism,i.e. single machine guiding a single user. The adaptive technology can individualisethe learning process.
This project aims at exploring the various ways of collecting, storing and finallyutilizing useful information about the user, instructor and learning material to aid theprocess of personalization.


List of Figures
1.1 Popular MOOC Platforms . . . . . . . . . . . . . . . . . . . . . . . . . 11.2 Components of adaptive e-learning . . . . . . . . . . . . . . . . . . . . 3
2.1 Fuzzy Cognitive Map[1] . . . . . . . . . . . . . . . . . . . . . . . . . . 52.2 Grade - matrix . . . . . . . . . . . . . . . . . . . . . . . . . . . . . . . 82.3 QC - matrix . . . . . . . . . . . . . . . . . . . . . . . . . . . . . . . . . 82.4 Grade matrix, before the quiz . . . . . . . . . . . . . . . . . . . . . . . 122.5 Grade matrix, after the quiz . . . . . . . . . . . . . . . . . . . . . . . . 13
3.1 User modelling . . . . . . . . . . . . . . . . . . . . . . . . . . . . . . . 163.2 Overlay Model[2] . . . . . . . . . . . . . . . . . . . . . . . . . . . . . . 17
4.1 Adaptive Engine . . . . . . . . . . . . . . . . . . . . . . . . . . . . . . 214.2 Sample Computation of Item-Item Similarity and Prediction Matrix . . 24
5.1 Feedback questions after the quiz . . . . . . . . . . . . . . . . . . . . . 305.2 Average feedback responses of all students . . . . . . . . . . . . . . . . 325.3 Average ratings of all categories . . . . . . . . . . . . . . . . . . . . . . 325.4 Average ratings of all categories in graphical form . . . . . . . . . . . . 325.5 Average success of all concepts and relationship . . . . . . . . . . . . . 335.6 Average success of all concepts graphically . . . . . . . . . . . . . . . . 335.7 Values of precision, recall and F1 metric charts . . . . . . . . . . . . . . 34
6.1 Python Logo . . . . . . . . . . . . . . . . . . . . . . . . . . . . . . . . 366.2 Git Logo . . . . . . . . . . . . . . . . . . . . . . . . . . . . . . . . . . . 376.3 Django Logo . . . . . . . . . . . . . . . . . . . . . . . . . . . . . . . . . 376.4 XAMPP Logo . . . . . . . . . . . . . . . . . . . . . . . . . . . . . . . . 386.5 Celery Artitechture[3] . . . . . . . . . . . . . . . . . . . . . . . . . . . . 396.6 RabbitMQ Logo . . . . . . . . . . . . . . . . . . . . . . . . . . . . . . . 406.7 Pycharm Logo . . . . . . . . . . . . . . . . . . . . . . . . . . . . . . . . 416.8 Netbeans Logo . . . . . . . . . . . . . . . . . . . . . . . . . . . . . . . 426.9 Firebug Logo . . . . . . . . . . . . . . . . . . . . . . . . . . . . . . . . 436.10 Sublime Text Logo . . . . . . . . . . . . . . . . . . . . . . . . . . . . . 436.11 Sample Chart Rendered in Application . . . . . . . . . . . . . . . . . . 446.12 Jquery Logo . . . . . . . . . . . . . . . . . . . . . . . . . . . . . . . . . 446.13 Bootstrap Logo . . . . . . . . . . . . . . . . . . . . . . . . . . . . . . . 456.14 Code organisation . . . . . . . . . . . . . . . . . . . . . . . . . . . . . . 466.15 Screenshot of Add Concept Page . . . . . . . . . . . . . . . . . . . . . 486.16 Screenshot of Delete Concept Page . . . . . . . . . . . . . . . . . . . . 486.17 Screenshot of Add Question Page . . . . . . . . . . . . . . . . . . . . . 49

LIST OF FIGURES
6.18 Screenshot of Delete Question Page . . . . . . . . . . . . . . . . . . . . 496.19 Screenshot of Evaluation Page on Instructor’s side . . . . . . . . . . . . 506.20 Screenshot of the Feedback Evaluation Page . . . . . . . . . . . . . . . 516.21 Screenshot of the Material Evaluation Page . . . . . . . . . . . . . . . . 516.22 Teacher Flowchart . . . . . . . . . . . . . . . . . . . . . . . . . . . . . 526.23 Screenshot of Student Dashboard . . . . . . . . . . . . . . . . . . . . . 526.24 Screenshot of Student Dashboard . . . . . . . . . . . . . . . . . . . . . 536.25 Screenshot of Concept Menu Page . . . . . . . . . . . . . . . . . . . . . 536.26 Screenshot of Learning Material . . . . . . . . . . . . . . . . . . . . . . 546.27 Screenshot of Quiz . . . . . . . . . . . . . . . . . . . . . . . . . . . . . 546.28 Screenshot of Feedback Page . . . . . . . . . . . . . . . . . . . . . . . . 556.29 Activity Model . . . . . . . . . . . . . . . . . . . . . . . . . . . . . . . 56
7.1 ER Diagram (1) . . . . . . . . . . . . . . . . . . . . . . . . . . . . . . . 577.2 ER Diagram (2) . . . . . . . . . . . . . . . . . . . . . . . . . . . . . . . 58
List of Tables
1.1 List of Abbreviations . . . . . . . . . . . . . . . . . . . . . . . . . . . . 3
2.1 Correctly Learned to Correctly Learned . . . . . . . . . . . . . . . . . . 102.2 Incorrectly Learned to Incorrectly Learned . . . . . . . . . . . . . . . . 102.3 Q1Q2RightWrong table, before the quiz . . . . . . . . . . . . . . . . . 132.4 Q1Q2RightWrong table, after the quiz . . . . . . . . . . . . . . . . . . 132.5 Question Confidence . . . . . . . . . . . . . . . . . . . . . . . . . . . . 14
3.1 Advantages and Disadvantages of Overlay Model . . . . . . . . . . . . 18
4.1 Advantages and Disadvantages of Collaborative Filtering . . . . . . . . 25
5.1 Relationship between Success of Quiz and Quality of Learning Material 33

LIST OF TABLES
Contents
1 Introduction 11.1 Purpose . . . . . . . . . . . . . . . . . . . . . . . . . . . . . . . . . . . 21.2 Objectives . . . . . . . . . . . . . . . . . . . . . . . . . . . . . . . . . . 21.3 Abbreviations and Definitions . . . . . . . . . . . . . . . . . . . . . . . 21.4 Components of e-learning system . . . . . . . . . . . . . . . . . . . . . 2
2 Content Modelling 52.1 Introduction . . . . . . . . . . . . . . . . . . . . . . . . . . . . . . . . . 52.2 Disadvantages of Traditional Concept Mapping . . . . . . . . . . . . . 62.3 Semi-Automatic Concept Mapping . . . . . . . . . . . . . . . . . . . . 62.4 Example of Concept Mapping . . . . . . . . . . . . . . . . . . . . . . . 82.5 Concept Mapping Algorithm . . . . . . . . . . . . . . . . . . . . . . . . 12
2.5.1 Finding the confidence between questions . . . . . . . . . . . . . 122.5.2 Finding the concept dependency . . . . . . . . . . . . . . . . . . 132.5.3 Drawbacks . . . . . . . . . . . . . . . . . . . . . . . . . . . . . . 14
3 User Modelling 153.1 Introduction to User Modeling . . . . . . . . . . . . . . . . . . . . . . . 153.2 Representation of Domain Related Information . . . . . . . . . . . . . . 15
3.2.1 Advantages and Disadvanges of Overlay Model . . . . . . . . . . 153.3 Representation of Domain Unrelated Information . . . . . . . . . . . . 17
4 Adaptive Engine 214.1 Introduction to the Adaptive Engine . . . . . . . . . . . . . . . . . . . 214.2 Maximum Success Path . . . . . . . . . . . . . . . . . . . . . . . . . . 214.3 Collaborative Filtering . . . . . . . . . . . . . . . . . . . . . . . . . . . 22
4.3.1 User - Item Collaborative Filtering . . . . . . . . . . . . . . . . 224.3.1.1 Algorithm Used . . . . . . . . . . . . . . . . . . . . . . 224.3.1.2 Complexity Analysis of the Algorithm . . . . . . . . . 234.3.1.3 Advantages and Disadvantages . . . . . . . . . . . . . 23
4.3.2 User - User Collaborative Filtering . . . . . . . . . . . . . . . . 244.4 Recommending Concepts for Remediation . . . . . . . . . . . . . . . . 26
4.4.1 Proposed Algorithm . . . . . . . . . . . . . . . . . . . . . . . . 274.4.2 Example . . . . . . . . . . . . . . . . . . . . . . . . . . . . . . . 27
5 Evaluation Model 295.1 Introduction to evaluation model: . . . . . . . . . . . . . . . . . . . . . 295.2 Evaluation based on feedback of students . . . . . . . . . . . . . . . . . 295.3 Evaluation based on student scores . . . . . . . . . . . . . . . . . . . 31
CONTENTS
5.4 Evaluation based on Parameters . . . . . . . . . . . . . . . . . . . . . . 33
6 System Guide 356.1 Prerequisites . . . . . . . . . . . . . . . . . . . . . . . . . . . . . . . . . 35
6.1.1 Hardware Prerequisites . . . . . . . . . . . . . . . . . . . . . . . 356.1.2 Software Prerequisites . . . . . . . . . . . . . . . . . . . . . . . 35
6.2 Installation Steps . . . . . . . . . . . . . . . . . . . . . . . . . . . . . . 356.2.1 Python . . . . . . . . . . . . . . . . . . . . . . . . . . . . . . . . 366.2.2 Git . . . . . . . . . . . . . . . . . . . . . . . . . . . . . . . . . . 366.2.3 Django . . . . . . . . . . . . . . . . . . . . . . . . . . . . . . . . 376.2.4 XAMPP . . . . . . . . . . . . . . . . . . . . . . . . . . . . . . . 376.2.5 Cloning and Initializing System . . . . . . . . . . . . . . . . . . 386.2.6 Celery . . . . . . . . . . . . . . . . . . . . . . . . . . . . . . . . 39
6.3 Optional Tools for Developers . . . . . . . . . . . . . . . . . . . . . . . 416.3.1 PyCharm . . . . . . . . . . . . . . . . . . . . . . . . . . . . . . 416.3.2 Neatbeans . . . . . . . . . . . . . . . . . . . . . . . . . . . . . . 426.3.3 Firebug . . . . . . . . . . . . . . . . . . . . . . . . . . . . . . . 426.3.4 Sublime Text . . . . . . . . . . . . . . . . . . . . . . . . . . . . 43
6.4 APIs . . . . . . . . . . . . . . . . . . . . . . . . . . . . . . . . . . . . . 436.4.1 Highcharts . . . . . . . . . . . . . . . . . . . . . . . . . . . . . . 446.4.2 JQuery . . . . . . . . . . . . . . . . . . . . . . . . . . . . . . . . 446.4.3 BootStrap . . . . . . . . . . . . . . . . . . . . . . . . . . . . . . 446.4.4 Celery and RabbitMQ . . . . . . . . . . . . . . . . . . . . . . . 45
6.5 Code Organisation . . . . . . . . . . . . . . . . . . . . . . . . . . . . . 456.6 Deploying System . . . . . . . . . . . . . . . . . . . . . . . . . . . . . . 476.7 System Design . . . . . . . . . . . . . . . . . . . . . . . . . . . . . . . . 47
6.7.1 Content Management System . . . . . . . . . . . . . . . . . . . 476.7.2 Learning Management System . . . . . . . . . . . . . . . . . . . 52
7 Database 577.1 Database Schema . . . . . . . . . . . . . . . . . . . . . . . . . . . . . . 577.2 Description of Tables . . . . . . . . . . . . . . . . . . . . . . . . . . . . 58
7.2.1 Student table . . . . . . . . . . . . . . . . . . . . . . . . . . . . 587.2.2 Concept Table . . . . . . . . . . . . . . . . . . . . . . . . . . . . 587.2.3 Student State Table . . . . . . . . . . . . . . . . . . . . . . . . 597.2.4 Student History Table . . . . . . . . . . . . . . . . . . . . . . . 597.2.5 Student Similarity Table . . . . . . . . . . . . . . . . . . . . . . 597.2.6 Feedback Question Table . . . . . . . . . . . . . . . . . . . . . . 597.2.7 Feedback Table . . . . . . . . . . . . . . . . . . . . . . . . . . . 597.2.8 Concept Dependency Table . . . . . . . . . . . . . . . . . . . . 607.2.9 Question Table . . . . . . . . . . . . . . . . . . . . . . . . . . . 607.2.10 Question Concept Table . . . . . . . . . . . . . . . . . . . . . . 607.2.11 Question Concept New Table . . . . . . . . . . . . . . . . . . . 607.2.12 Grade Table . . . . . . . . . . . . . . . . . . . . . . . . . . . . . 607.2.13 Confidence R to R Table . . . . . . . . . . . . . . . . . . . . . . 617.2.14 Confidence W to W Table . . . . . . . . . . . . . . . . . . . . . 617.2.15 Ratings Table . . . . . . . . . . . . . . . . . . . . . . . . . . . . 617.2.16 Q1Q2RightWrong Table . . . . . . . . . . . . . . . . . . . . . . 61

CONTENTS
8 Future Work and Conclusion 638.1 Capturing Cognitive Skills . . . . . . . . . . . . . . . . . . . . . . . . . 638.2 Automated Concept Mapping . . . . . . . . . . . . . . . . . . . . . . . 638.3 Multi Criteria Collaborative Filtering . . . . . . . . . . . . . . . . . . . 638.4 Sequential Pattern Mining . . . . . . . . . . . . . . . . . . . . . . . . . 64
Bibliography 65

Chapter 1
Introduction
The corporate world is growing at a fast pace and the competition is getting fiercer.No company wants to lose the edge. More and more companies are focussing onhuman capital to increase their productivity. Alone, U.S. companies’ spending ontraining grew by 15% in 2013. It is $70 billion in U.S. and $130 billion worldwide. [4]Traditional classroom training method is no longer viable as it requires large budgets,extensive planning and logistics. That’s why many are shifting their attention to e-learning as a technological solution to this problem. 98% of companies, nowadays, usetechnological infrastructure (online learning) to control the delivery and managementof training to its employees[5]. E-learning makes the individualised tutoring, a reality.It has been studied, as a part of ATI research that invidualisation of learning reapsmuch better results as compared to the traditional classroom system, which followsthe theory of ’one size fits all’. E-learning is nowadays, also finding applications indistance education as well as blended learning. Using technology in the learning assistsin changing the process from one based on rote to one based on comprehension. [6]
Figure 1.1: Popular MOOC Platforms
1
2 CHAPTER 1. INTRODUCTION
1.1 Purpose
The true power of this educational technology is not just to deliver content whichcan even be done without it, but it is the numerous possibilities that it opens up likeadaptation. Adaptive e-learning intends to improve the user’s/learner’s experience bycapturing details about the user like his/her learning style, cognitive abilities, knowl-edge level, interests, personal traits, etc. and provides the user a personalized learningpath based on the information captured. As opposed to traditional classroom ideologyof one size fits all, adaptation actually individualises learning. The system shouldidentify user characteristics and provides instructions accordingly. In other words, thegoal of the system is to provide the right content to the right person at the right time.
1.2 Objectives
The major part of this research is to come up with techniques that can enhance theexisting e-learning environments. The major objectives of this project are as follows :
• Developing algorithms to determine the most suitable content for a particularuser.
• Developing methods of capturing, storing and using information about users inan efficient manner.
• Developing methods to evaluate the performance of the system
The purpose of this document is to give an overview about the work done and chal-lenges faced by us in order to achieve the above objectives.
The document is divided into five 6 major chapter. The next 3 chapters describesthe component of e-learning. The following chapters describes the Evaluation Modeland System Design. The last chapter concludes the document and puts forward somefuture work and improvements that can be done in the system.
1.3 Abbreviations and Definitions
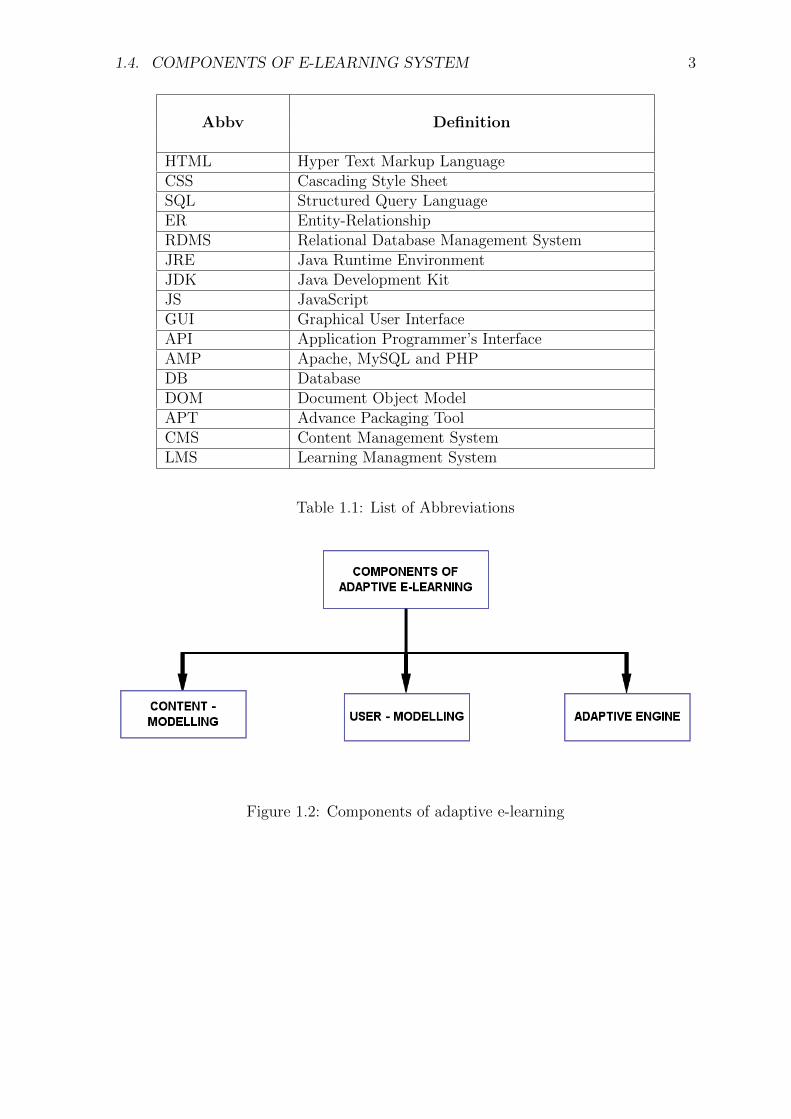
Table ?? lists all the common abbreviations used throughout the length of this doc-ument and their corresponding definition.
1.4 Components of e-learning system
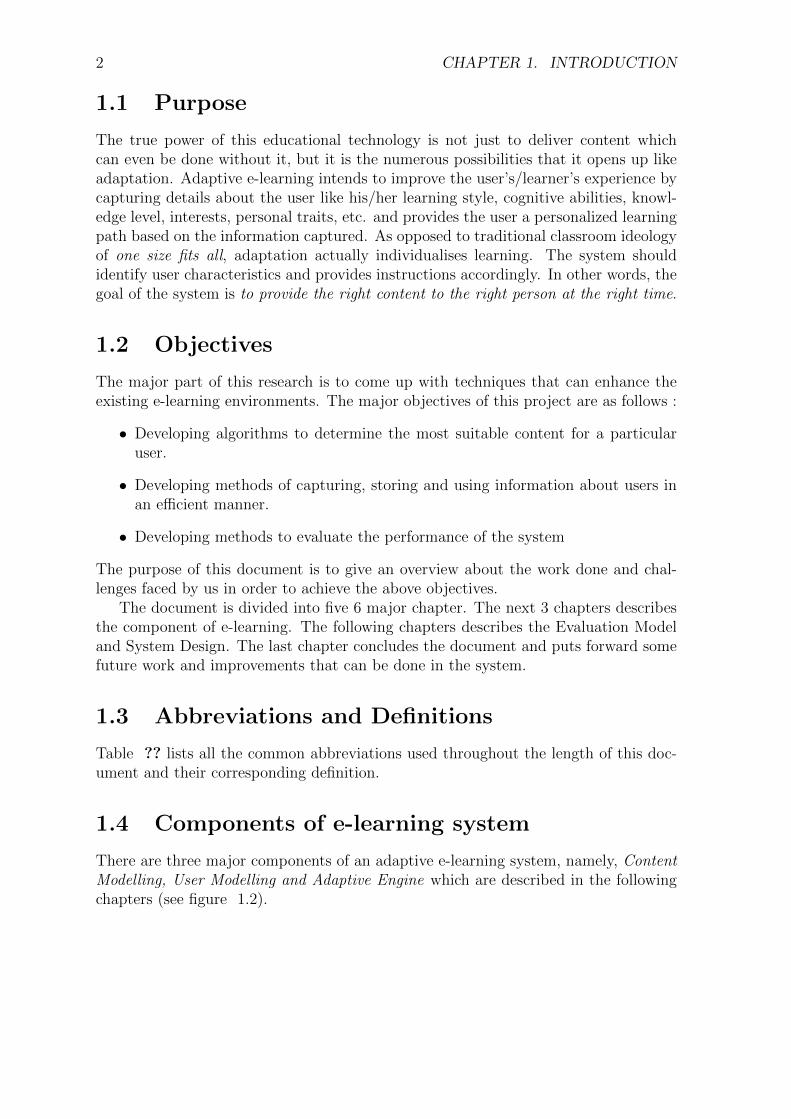
There are three major components of an adaptive e-learning system, namely, ContentModelling, User Modelling and Adaptive Engine which are described in the followingchapters (see figure 1.2).
1.4. COMPONENTS OF E-LEARNING SYSTEM 3
Abbv Definition
HTML Hyper Text Markup LanguageCSS Cascading Style SheetSQL Structured Query LanguageER Entity-RelationshipRDMS Relational Database Management SystemJRE Java Runtime EnvironmentJDK Java Development KitJS JavaScriptGUI Graphical User InterfaceAPI Application Programmer’s InterfaceAMP Apache, MySQL and PHPDB DatabaseDOM Document Object ModelAPT Advance Packaging ToolCMS Content Management SystemLMS Learning Managment System
Table 1.1: List of Abbreviations
Figure 1.2: Components of adaptive e-learning

4 CHAPTER 1. INTRODUCTION

Chapter 2
Content Modelling
2.1 Introduction
Content Model is used for domain level representation of the knowledge structure.Chrysafiadi and Virvou [1] suggests an approach for representing the domain knowledgeby using Fuzzy Cognitive Maps. The domain knowledge is divided into concepts andthere are interdependencies between these concepts. The structure takes the formof a directed graph, where each node represents a concept and arcs between nodesrepresent the level of interdependencies between concepts. An example of a FuzzyCognitive Map is shown in Figure 2.1. Content model also describes the forms inwhich the content is available for its users, for example: e-book, slideshow, videos,animations, etc. This helps in providing the right type of content to the user i.e. thecontent which is suitable to his cognitive needs and personal preferences.
Figure 2.1: Fuzzy Cognitive Map[1]
Concept map (FCM) plays an important role as it helps in student assessment,diagnosis, recommendation and remediation. A major challenge in constructing a con-cept map is to find the relationship (edge weights in a concept map) between concepts,automatically.
5
6 CHAPTER 2. CONTENT MODELLING
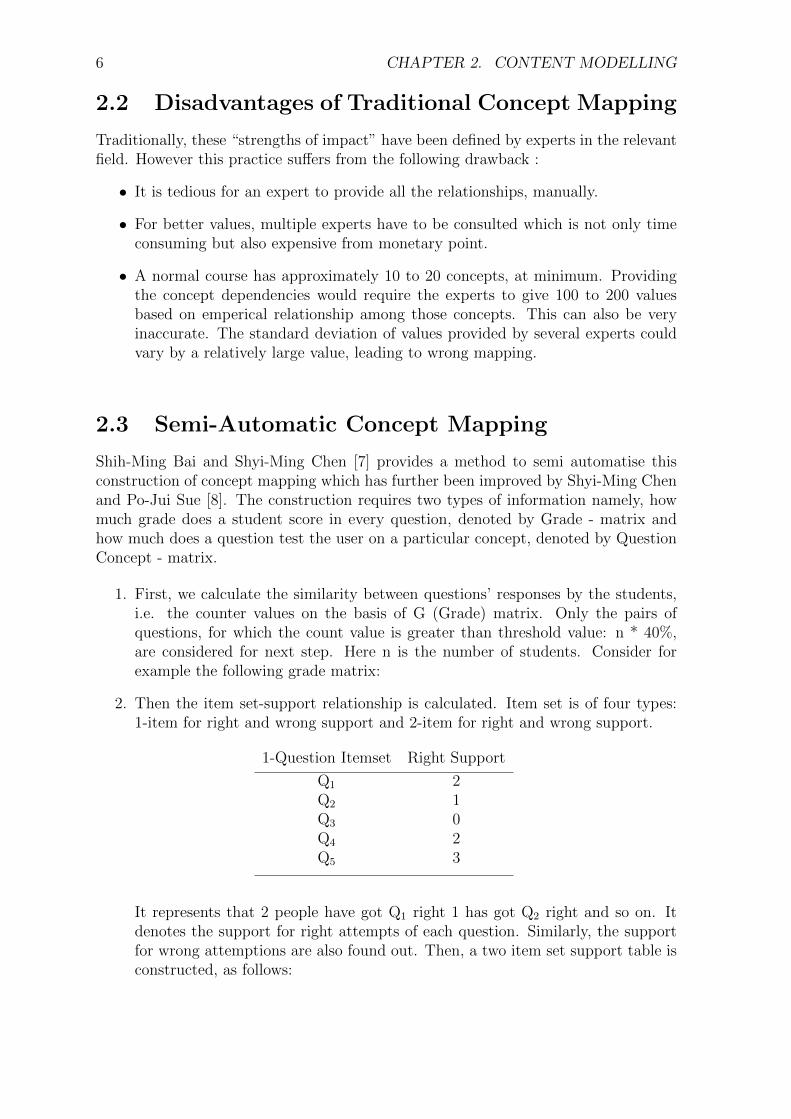
2.2 Disadvantages of Traditional Concept Mapping
Traditionally, these “strengths of impact” have been defined by experts in the relevantfield. However this practice suffers from the following drawback :
• It is tedious for an expert to provide all the relationships, manually.
• For better values, multiple experts have to be consulted which is not only timeconsuming but also expensive from monetary point.
• A normal course has approximately 10 to 20 concepts, at minimum. Providingthe concept dependencies would require the experts to give 100 to 200 valuesbased on emperical relationship among those concepts. This can also be veryinaccurate. The standard deviation of values provided by several experts couldvary by a relatively large value, leading to wrong mapping.
2.3 Semi-Automatic Concept Mapping
Shih-Ming Bai and Shyi-Ming Chen [7] provides a method to semi automatise thisconstruction of concept mapping which has further been improved by Shyi-Ming Chenand Po-Jui Sue [8]. The construction requires two types of information namely, howmuch grade does a student score in every question, denoted by Grade - matrix andhow much does a question test the user on a particular concept, denoted by QuestionConcept - matrix.
1. First, we calculate the similarity between questions’ responses by the students,i.e. the counter values on the basis of G (Grade) matrix. Only the pairs ofquestions, for which the count value is greater than threshold value: n * 40%,are considered for next step. Here n is the number of students. Consider forexample the following grade matrix:
2. Then the item set-support relationship is calculated. Item set is of four types:1-item for right and wrong support and 2-item for right and wrong support.
1-Question Itemset Right Support
Q1 2Q2 1Q3 0Q4 2Q5 3
It represents that 2 people have got Q1 right 1 has got Q2 right and so on. Itdenotes the support for right attempts of each question. Similarly, the supportfor wrong attemptions are also found out. Then, a two item set support table isconstructed, as follows:

2.3. SEMI-AUTOMATIC CONCEPT MAPPING 7
1-Question Itemset Right Support
Q1, Q2 1Q2, Q3 0Q3, Q4 0Q4, Q5 2Q5, Q1 0
It represents that for Q1 and Q2, only 1 has got both of the questions right. Itdenotes the 2-itemset support for right attempts. Similarly, the 2-itemset supportfor wrong attempts are also found out. Now, we use the following formula tocalculate the confidence between questions.
Confidence(Qx → Qy) =Support(Qx → Qy)
Support(Qx)(2.1)
Through this, the confidence level between the questions is established. Confi-dence levels for two kinds of association rules are found out: one for the correctlyattempted and second for the wrongly attempted, as mentioned above. In lay-man words, the confidence(Q1 → Q2)right represents that if the student attemptsQ1, correctly then what is the probability by which he attempts Q2, correctly.Association rules with confidence lecel greater than 75% are considered in futuresteps.For example,confidence(Q1 → Q2)right = Support(Q1,Q2)
Support(Q1)= 1
2= 0.5
3. Now a new Question-Concept matrix is created (QC’), based on below two rules:
(a) If there are two or more nonzero values in column Ct of the questions-concepts matrix QC, then the degree of relevance of question Qx with re-spect to concept Ct in the constructed questions-concepts matrix QC’ iscalculated as follows:
qc′ut =qcxt
m∑u=1
qcut
, (2.2)
Where m is the number of questions
(b) If there is only one nonzero value in column Ct of the questions-conceptsmatrix QC, then the degree of relevance of question Qx with respect toconcept Ct in the constructed questions-concepts matrix QC’ is calculatedas follows:
qc′xt = qcxt (2.3)
4. Based on the associative rule Qx → Qy, the relevance between concept Ci → Cj,is calculated:
rev(Ci → Cj)Qx→Qy = qcxi ∗ qc′yj ∗ Confidence(Qx → Qy) (2.4)
Here,
Ci denotes a concept in question Qx and Cj denotes a concept in question Qy
qcxi denotes the degree of relevance of question Qx with respect to concept Ci
8 CHAPTER 2. CONTENT MODELLING
in the questions-concepts matrix QCqcyj denotes the degree of relevance of question Qy with respect to concept Cj
in the questions-concepts matrix QCConfidence represents the confidence of the association rule Qx → Qy
5. Calculate a threshold value of the relevance degree µ, as follows:
µ = MIN(qcxt), where 1 ≤ x ≤m and 1 ≤ t ≤ pm : the number of questionsp : the number of concepts
6. If rev(Ci → Cj)Qx→Qy < µ, then calculate εij as follows:
εij = Ni + Nj
where Ni is the number of questions having concept i
If εij > m * 50%, then the relevance relation is retained.
7. Now, in some cases, there are two relevance degree between same pair of concepts:one for the associative rule: correctly learned to correctly learned and second for: incorrectly learned to incorrectly learned. The one with maximum value ischosen.
2.4 Example of Concept Mapping
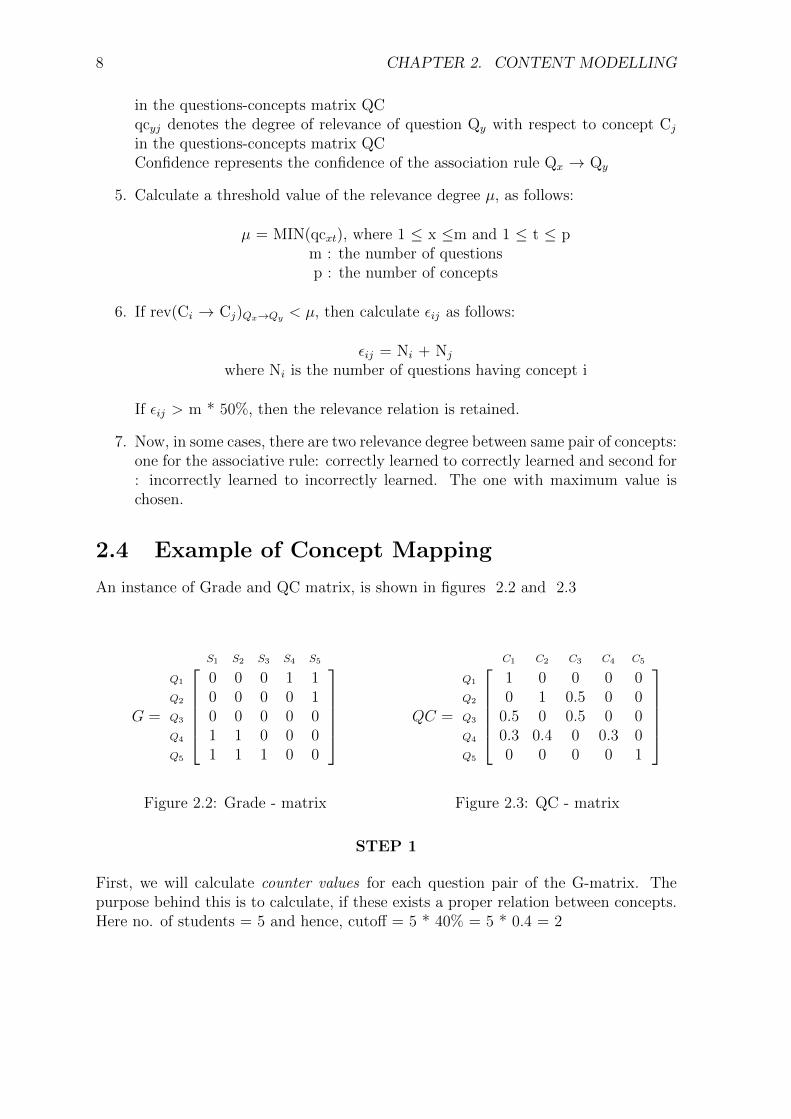
An instance of Grade and QC matrix, is shown in figures 2.2 and 2.3
G =
S1 S2 S3 S4 S5
Q1 0 0 0 1 1Q2 0 0 0 0 1Q3 0 0 0 0 0Q4 1 1 0 0 0Q5 1 1 1 0 0
Figure 2.2: Grade - matrix
QC =
C1 C2 C3 C4 C5
Q1 1 0 0 0 0Q2 0 1 0.5 0 0Q3 0.5 0 0.5 0 0Q4 0.3 0.4 0 0.3 0Q5 0 0 0 0 1
Figure 2.3: QC - matrix
STEP 1
First, we will calculate counter values for each question pair of the G-matrix. Thepurpose behind this is to calculate, if these exists a proper relation between concepts.Here no. of students = 5 and hence, cutoff = 5 * 40% = 5 * 0.4 = 2
2.4. EXAMPLE OF CONCEPT MAPPING 9
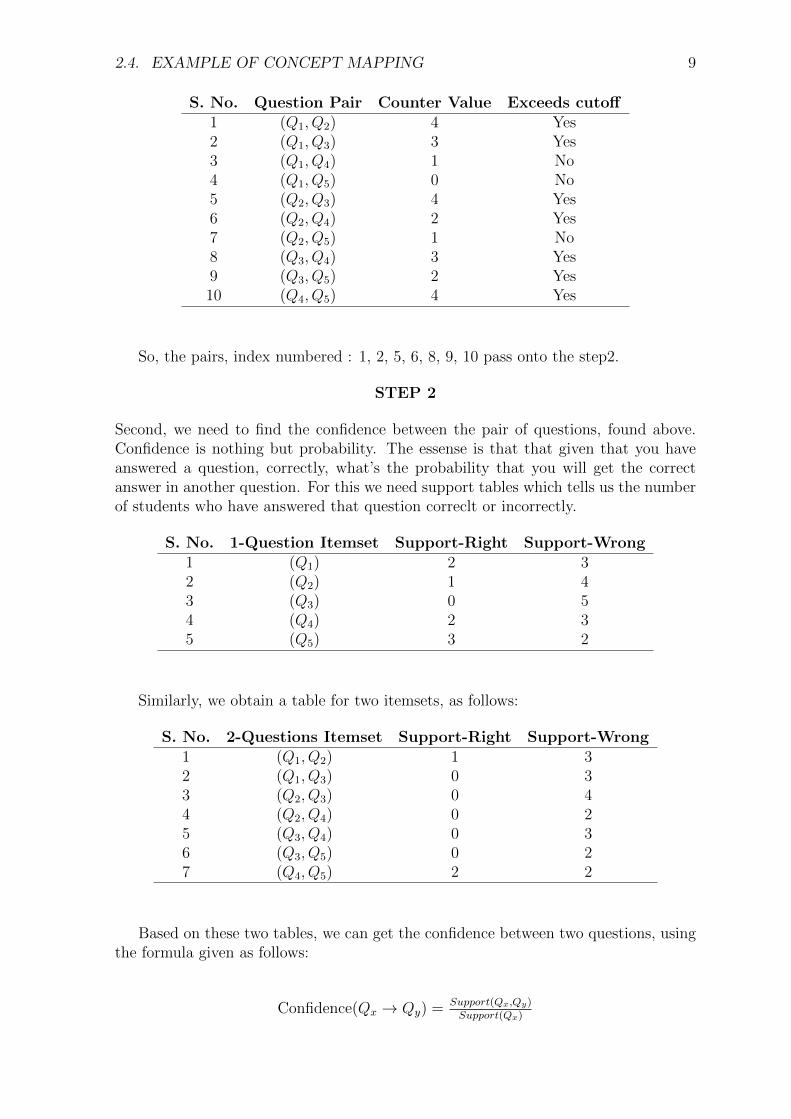
S. No. Question Pair Counter Value Exceeds cutoff1 (Q1, Q2) 4 Yes2 (Q1, Q3) 3 Yes3 (Q1, Q4) 1 No4 (Q1, Q5) 0 No5 (Q2, Q3) 4 Yes6 (Q2, Q4) 2 Yes7 (Q2, Q5) 1 No8 (Q3, Q4) 3 Yes9 (Q3, Q5) 2 Yes10 (Q4, Q5) 4 Yes
So, the pairs, index numbered : 1, 2, 5, 6, 8, 9, 10 pass onto the step2.
STEP 2
Second, we need to find the confidence between the pair of questions, found above.Confidence is nothing but probability. The essense is that that given that you haveanswered a question, correctly, what’s the probability that you will get the correctanswer in another question. For this we need support tables which tells us the numberof students who have answered that question correclt or incorrectly.
S. No. 1-Question Itemset Support-Right Support-Wrong1 (Q1) 2 32 (Q2) 1 43 (Q3) 0 54 (Q4) 2 35 (Q5) 3 2
Similarly, we obtain a table for two itemsets, as follows:
S. No. 2-Questions Itemset Support-Right Support-Wrong1 (Q1, Q2) 1 32 (Q1, Q3) 0 33 (Q2, Q3) 0 44 (Q2, Q4) 0 25 (Q3, Q4) 0 36 (Q3, Q5) 0 27 (Q4, Q5) 2 2
Based on these two tables, we can get the confidence between two questions, usingthe formula given as follows:
Confidence(Qx → Qy) = Support(Qx,Qy)
Support(Qx)

10 CHAPTER 2. CONTENT MODELLING
That table is also shown as follows:Here, we have used the cutoff as 0.75 i.e. all those association rules whose confidencevalue is below 0.75 will be deleted and only those above or equal to 0.75 will be pre-served.
S. No. Question Pair Confidence Preserve1 (Q1 → Q2) 0.5 No2 (Q2 → Q1) 1 Yes3 (Q1 → Q3) 0 No4 (Q3 → Q1) 0 No5 (Q2 → Q3) 0 No6 (Q3 → Q2) 0 No7 (Q2 → Q4) 0 No8 (Q4 → Q2) 0 No9 (Q3 → Q4) 0 No10 (Q4 → Q3) 0 No11 (Q3 → Q5) 0 No12 (Q5 → Q3) 0 No13 (Q4 → Q5) 1 Yes14 (Q5 → Q4) 0.67 No
Table 2.1: Correctly Learned to Correctly Learned
S. No. Question Pair Confidence Preserve1 (Q1 → Q2) 1 Yes2 (Q2 → Q1) 0.75 Yes3 (Q1 → Q3) 1 Yes4 (Q3 → Q1) 0.6 No5 (Q2 → Q3) 1 Yes6 (Q3 → Q2) 0.8 Yes7 (Q2 → Q4) 0.5 No8 (Q4 → Q2) 0.67 No9 (Q3 → Q4) 0.6 No10 (Q4 → Q3) 1 Yes11 (Q3 → Q5) 0.4 No12 (Q5 → Q3) 1 Yes13 (Q4 → Q5) 0.67 No14 (Q5 → Q4) 1 Yes
Table 2.2: Incorrectly Learned to Incorrectly Learned
STEP 3
In this step, we calculate a new Question-Concept (QC’) matrix, based on the originalquestion-Concept (QC) matrix, based on rules mentioned.Our original QC matrix changes as shown in the following figure:

2.4. EXAMPLE OF CONCEPT MAPPING 11
QC =
C1 C2 C3 C4 C5
Q1 1 0 0 0 0Q2 0 1 0.5 0 0Q3 0.5 0 0.5 0 0Q4 0.3 0.4 0 0.3 0Q5 0 0 0 0 1
→QC ′ =
C1 C2 C3 C4 C5
Q1 0.555 0 0 0 0Q2 0 0.714 0.5 0 0Q3 0.278 0 0.5 0 0Q4 0.167 0.286 0 0.3 0Q5 0 0 0 0 1
STEP 4
Now we calculate relevence between two concepts by the formula, :
rev(Ci, Cj)Qx→Qy = qcxi ∗ qc′yj ∗ Confidence(Qx → Qy)
We shall calculate some relevences to remove any confusion:Let’s take C1 and C2, i.e. we need to calculate concept dependency from C1 to C2 andC2 to C1, based on various association rules.
1. Consider the association rule: Q1 to Q2 for correctly learned to correctly learned,but we cannot take that because its confidence value does not pass the cutoffspecified i.e. 0.75. Hence we move to another association rule.
2. Consider the association rule Q2 → Q1 for correctly learned to correctly learned.Since it passes the cutoff, we calculate the relevence between concept C1 → C2,as: rev(C1 → C2)Q2→Q1 = qc21 ∗ qc′12 ∗ confidencer(Q2 → Q1) = 0 ∗ 0 ∗ 1 = 0
3. Consider the association rule Q1 to Q2 for the incorrectly learned to incorrectlylearned. rev(C1 → C2)Q1→Q2 = qc11 ∗ qc′22 ∗ confidencew(Q1 → Q2) = 1 ∗ 0.714 ∗1 = 0.714
4. Consider the association rule Q2 to Q1 for the incorrectly learned to incorrectlylearned. rev(C1 → C2)Q2→Q1 = qc21∗qc′12∗confidencew(Q2 → Q1) = 0∗0∗0.75 =0
5. Consider the association rule Q2 → Q1 for correctly learned to correctly learned.Since it passes the cutoff, we calculate the relevence between concept C2→ C1, as:rev(C2 → C1)Q2→Q1 = qc22 ∗ qc′11 ∗ confidencer(Q2 → Q1) = 1∗0.555∗1 = 0.555
6. Consider the association rule Q1 to Q2 for the incorrectly learned to incorrectlylearned. rev(C2 → C1)Q1→Q2 = qc12∗qc′21∗confidencew(Q1 → Q2) = 0∗0∗1 = 0
and so on ...
STEP 5
Now a threshold value is calculated as follows:µ = Min(1, 0.5, 0.3, 1, 0.4, 0.5, 0.3, 1) = 0.3andεij = Ni +Nj
For the case of Concepts C1 and C2, we get N1 = 3 and N2 = 2Hence, ε12 = 3 + 2 = 5

12 CHAPTER 2. CONTENT MODELLING
STEP 6 and 7
Construct the concepts-relationship between any two concepts Ci and Cj based onthe relevence degrees, obtained in step 5, whenever, the relevence degree is not smallerthan µ or ε ¡ number of questions * 50%. Consider the rules mentioned in the stepsfor the direction of dependence.If the number of such dependencies exceeds 1, then consider only the maximum one.
2.5 Concept Mapping Algorithm
2.5.1 Finding the confidence between questions
For this, we maintain a table, named ’Q1Q2RightWrong’ storing the number of stu-dents corresponding to every possible pair of questions, for both categories:
1. those who have got it right in both the questions.
2. those who have got it wrong in both the questions.
Also, in the Grade table that stores the evaluation of the response of the studentsagainst the questions, we maintain the student’s current score as well as the previousscore as well which helps us remember the transition of score of that student in thatquestion.
As such whenever, the student gives a quiz, the grade matrix is changed appropri-ately.Then we go through each object in Q1Q2RightWrong table which contain the ques-tions attempted as either question x or question y.After that the confidence values are calculated. For this, we again go through theobjects in Q1Q2RightWrong table which contain the attempted questions and findthe confidence values (both of them, straight and reverse as well i.e. if the object isthe pair: (Qx, Qy), then we calculate the confidence (Qx → Qy) and (Qy → Qx)). Thefollowing example may make the understanding better.Consider initially, the G matrix and Q1Q2RightWrong matrix were:
G =
S1 S2 S3
Q1 0/0 0/0 0/0Q2 0/0 0/0 0/0Q3 0/0 0/0 0/0
Figure 2.4: Grade matrix, before the quiz
Here the formatat x/y suggests that now the value is x and previously the valuewas y.
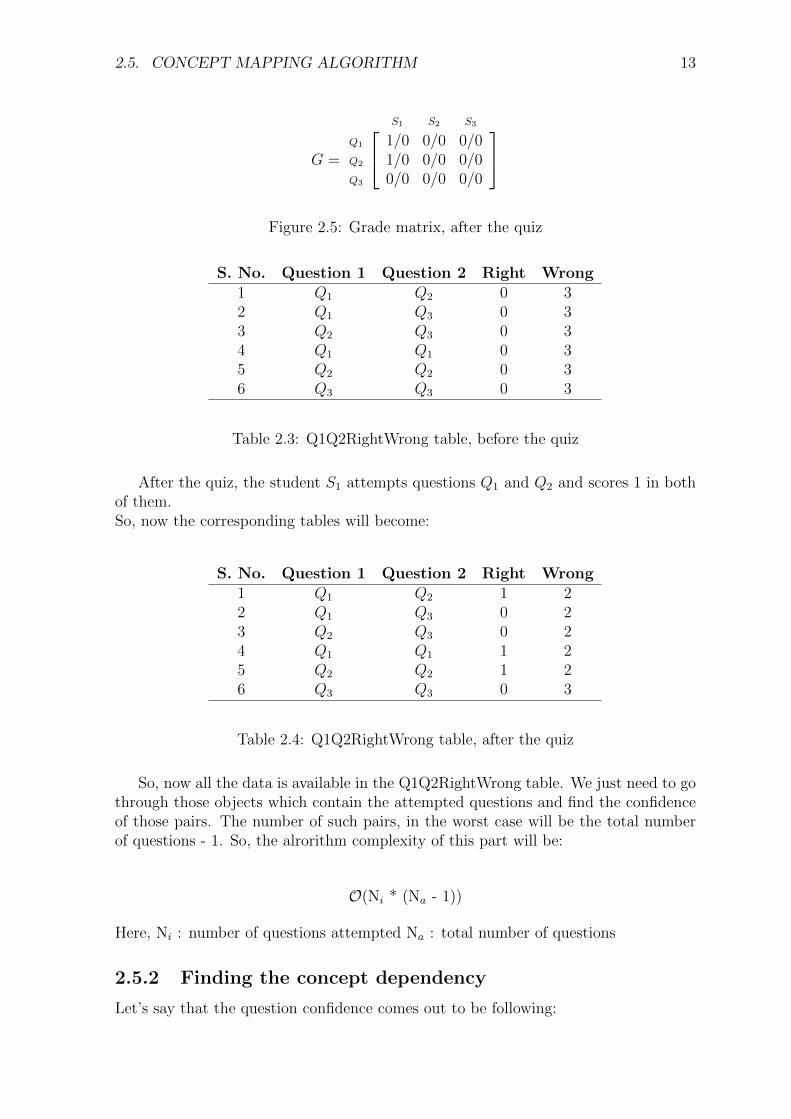
2.5. CONCEPT MAPPING ALGORITHM 13
G =
S1 S2 S3
Q1 1/0 0/0 0/0Q2 1/0 0/0 0/0Q3 0/0 0/0 0/0
Figure 2.5: Grade matrix, after the quiz
S. No. Question 1 Question 2 Right Wrong1 Q1 Q2 0 32 Q1 Q3 0 33 Q2 Q3 0 34 Q1 Q1 0 35 Q2 Q2 0 36 Q3 Q3 0 3
Table 2.3: Q1Q2RightWrong table, before the quiz
After the quiz, the student S1 attempts questions Q1 and Q2 and scores 1 in bothof them.So, now the corresponding tables will become:
S. No. Question 1 Question 2 Right Wrong1 Q1 Q2 1 22 Q1 Q3 0 23 Q2 Q3 0 24 Q1 Q1 1 25 Q2 Q2 1 26 Q3 Q3 0 3
Table 2.4: Q1Q2RightWrong table, after the quiz
So, now all the data is available in the Q1Q2RightWrong table. We just need to gothrough those objects which contain the attempted questions and find the confidenceof those pairs. The number of such pairs, in the worst case will be the total numberof questions - 1. So, the alrorithm complexity of this part will be:
O(Ni * (Na - 1))
Here, Ni : number of questions attempted Na : total number of questions
2.5.2 Finding the concept dependency
Let’s say that the question confidence comes out to be following:

14 CHAPTER 2. CONTENT MODELLING
S. No. Question Pair Confidence - Right Confidence - Wrong1 Q1 → Q2 0.8 12 Q1 → Q3 0.75 0.763 Q2 → Q3 0.78 0.824 Q3 → Q1 0.95 0.9
Table 2.5: Question Confidence
Let’s say that the question concept matrix was:
QC =
C1 C2
Q1 0.5 0.5Q2 0 1Q3 0 1
From this, we get the new Question Concept matrix as:
QC ′ =
C1 C2
Q1 0.5 0.2Q2 0 0.4Q3 0 0.4
Here,
µ = Min(0.5, 0.2, 0.4) = 0.2ε12 = N1 + N2 = 1 + 3 = 4No. of questions, m = 3hence ε12 is not less than m * 50%For C1 and C2, we look at all the association rules in the confidence table and find
the relevence according to it. Hence we are looking at all the possible pair of conceptsand then looking at all the association rules, based on those association rules, we arefinding the relevence between concepts. The association rules table i.e. the confidencetable, in the worst case contains (total number of questions * (total number of questions- 1)) entries.
Hence the worst case complexity of this part of the algorithm is total number ofconcepts2 * total number of questions2
2.5.3 Drawbacks
The whole algorithm has a very high time complexity and is not scalable, as per thecurrent implementation. It requires a lot of computational power even after memo-ization of data. This alogorithm has to be substituted by an appoximate version onlarger system with thousands of students and hundreds or courses.

Chapter 3
User Modelling
3.1 Introduction to User Modeling
Student Model refers to the method of representing a user in the virtual world. StudentModel is used to collect and store user’s information like knowledge, misconception,goals, emotional state, etc. This information is then used by the system to determineuser’s need and adapt itself accordingly. There are two types of information, collected:[6](see figure 3.1)
1. Domain related: It refers to the information about the user related to the contextof the course like knowledge about different concepts, misconceptions, etc.
2. Domain unrelated: It refers to the information about personal traits of the user,i.e. cognitive abilities, learning style, age, sex, etc.
3.2 Representation of Domain Related Information
We suggest representation of domain related information to be done using an overlaymodel [9], i.e. the user’s knowledge is expressed as a subset of the knowledge domain,which represents the expert knowledge in that domain. The differences between thestudent’s and the expert’s set of knowledge are be- lieved to be the student’s lack ofskills and knowledge, and the instructional objective is to eliminate these differences asmuch as possible. Consequently, the domain is decomposed into a set of elements andthe overlay model is simply a set of masteries over those elements. This is illustratedin Figure 3.2.
3.2.1 Advantages and Disadvanges of Overlay Model
The pros and cons of using an overlay model is listed in table 3.1
User’s knowledge, instead of being represented in concrete terms, is represented inan abstract (fuzzy) way, which is more close to human understanding and results inbetter interpretation. The knowledge is categorised in four fuzzy sets: Unknown (Un),
15

16 CHAPTER 3. USER MODELLING
Figure 3.1: User modelling
Unsatisfactorily Known (UK), Known (K) and Learned(L). Membership function ofeach set is described by the following equations. [2]
µUn =
x, x ≤ 55
1− (x− 55)/5, 55 < x < 60
0, x ≥ 60.
(3.1)
µUK =
0, x ≤ 55 or x ≥ 75
(x− 55)/5, 55 < x < 60
1, 60 ≤ x ≤ 70
1− (x− 70)/5, 70 < x < 75.
(3.2)
µK =
0, x ≤ 70 or x ≥ 90
(x− 70)/5, 70 < x < 75
1, 75 ≤ x ≤ 85
1− (x− 85)/5, 85 < x < 90.
(3.3)

3.3. REPRESENTATION OF DOMAIN UNRELATED INFORMATION 17
Figure 3.2: Overlay Model[2]
µL =
0, x ≤ 55
(x− 85)/5, 85 < x < 90
1, 90 ≤ x ≤ 100.
(3.4)
Here, x is the degree of success the student holds in that conceptand µ is the membership function of the fuzzy sets.
Concepts in a domain are not independent. They are interrelated. Some conceptsact as pre-requisite for other concepts. So learning of one concept also affects thelearning of other concepts. To take this into account, following equations are used tochange the knowledge levels of the user [1].
KLj(t+ 1) = KLj(t) + (KLj(t) ∗Wij ∗ pi) (3.5)
where Wij is the dependency of Cj on Ci and
pi = KLi(t+ 1)− KLi(t)
KLi(t)(3.6)
3.3 Representation of Domain Unrelated Informa-
tion
Domain unrelated information can be modelled using Felder-Silverman Learning StyleModel (FSLSM)[10]. Felder and Silverman distinguishes the user’s preferences on fourdimensions.

18 CHAPTER 3. USER MODELLING
Advantages Disadvantages
• It allows the representationof the user knowledge foreach concept independent ofother concepts.
• Its complexity depends onthe granularity of the do-main model structure.
• Easy to implement and use.It has been thus used widely.
• It does not allows represent-ing the incorrect knowledgethat the student might haveacquired during the learningphase.
• It does not account forlearner’s cognitive needs,preferences, behavior andpersonality
• Fails when learner follows adifferent problem solving ap-proach.
Table 3.1: Advantages and Disadvantages of Overlay Model
1. The first dimension distinguishes between an active and reflective way of learning.Active learners are the ones who like to apply the learned material and work ingroups, communicating their ideas. Reflective workers try to work alone, thinkabout what they have learned.
2. Second dimension distinguishes the user on the basis of intuitive and sensorypreferences. Sensing learning style like concrete learning material and like tosolve problems using standard approaches. Intuitive learners like totally rely onabstract theories and their underlying meanings.
3. Third dimension tests distinguishes users on the grounds of visual and verbalpreferences. Visual learners are the ones, who prefer learning from what theyhave seen. They have less memory retaining capacity. Verbal learners are theones who prefer textual representation (written/spoken).
4. Fourth dimension classifies the users on the basis of their process of understand-ing. Sequential learners learn in small steps and their learning graph is linear.They are more interested in details. Global learners, on the other hand, are moreinterested in overviews and a broad knowledge.
On the basis of these four dimensions, the user is characterised and an appropriatekind of learning object, which suits his learning style is presented to him.
Much of information stored as a part of student model is static in nature i.e.,it remains constant throughout the learning phase such as age, sex, mother tongueetc. Such information is usually collected via questionnaires. All other informationis dynamic in nature i.e., it changes during the learning phase like knowledge level,performance etc. Such information is available directly via the student’s interaction

3.3. REPRESENTATION OF DOMAIN UNRELATED INFORMATION 19
with he system and is constantly updated. Chrysafiadi and Virvou have presented anice literature of the popular student modelling techniques used in the past decade[11].

20 CHAPTER 3. USER MODELLING
Chapter 4
Adaptive Engine
4.1 Introduction to the Adaptive Engine
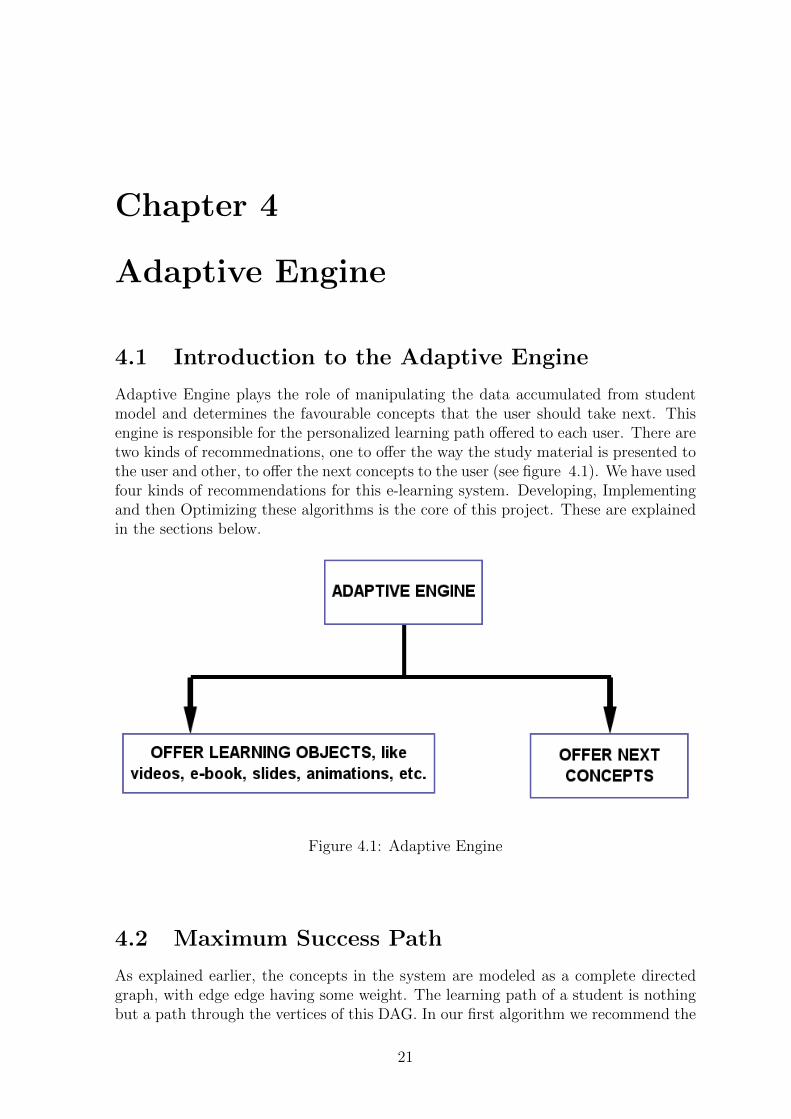
Adaptive Engine plays the role of manipulating the data accumulated from studentmodel and determines the favourable concepts that the user should take next. Thisengine is responsible for the personalized learning path offered to each user. There aretwo kinds of recommednations, one to offer the way the study material is presented tothe user and other, to offer the next concepts to the user (see figure 4.1). We have usedfour kinds of recommendations for this e-learning system. Developing, Implementingand then Optimizing these algorithms is the core of this project. These are explainedin the sections below.
Figure 4.1: Adaptive Engine
4.2 Maximum Success Path
As explained earlier, the concepts in the system are modeled as a complete directedgraph, with edge edge having some weight. The learning path of a student is nothingbut a path through the vertices of this DAG. In our first algorithm we recommend the
21
22 CHAPTER 4. ADAPTIVE ENGINE
concepts to the user based on the path from current concept (the last concept passed)that received maximum success in the past. Because one concept is related to another,hence change in knowledge level of one concept affects user’s knowledge level of otherconcept too. This algorithm recommends the concept which will provide the highestoverall average increase in knowledge level across all concepts.
Whenever, a student traverses the edge Ci → Cj, i.e. he/she takes the quiz of Cj
when the last concept done by him/her is Ci, his knowledge level for various conceptsis changed based on the quiz result. The average change in knowledge level across allthe concepts for the student is recorded.
ACfor current user =
∑Cm∈Concepts
KLm(t+ 1)−KLm(t)
|Concepts|(4.1)
Here, KLm(t + 1) is the knowledge level in concept m after the quiz and KLm(t) is
the knowledge level in concept m before the quiz.Now the new average change for Ci to Cj is calculated as:
ACCi→Cj=ACCi→Cj
∗ |StudentsCi→Cj|+ ACfor current user
|StudentsCi→Cj|+ 1
(4.2)
Here AC stands for average change.
Thus, if a user has completed concept Ci, all concepts Cj which have not beencompleted are recommended in the order of decreasing value of average increase ofCi → Cj across all users.
4.3 Collaborative Filtering
Collaborative filtering is one of the widely used techniques for recommendation. Twoalgorithms based on collaborative filtering has been used namely User-Item and User-User.
4.3.1 User - Item Collaborative Filtering
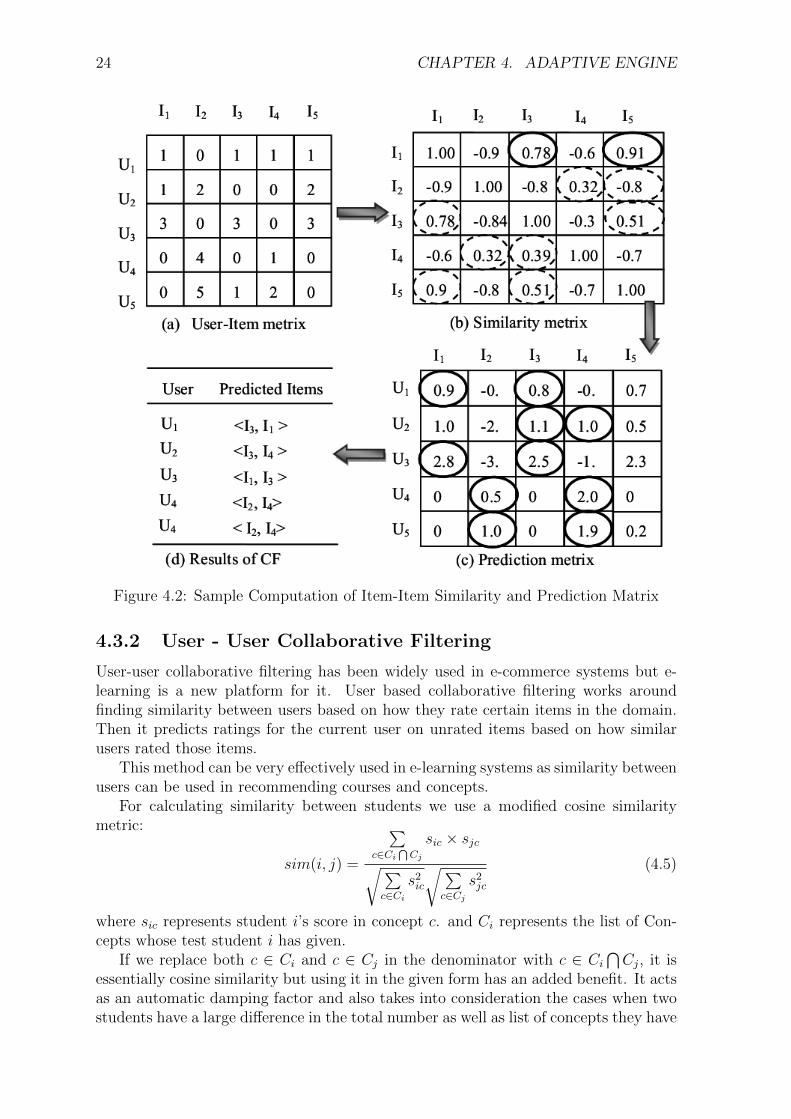
This is an approach to determine the similarity between 2 items based on ratingsprovided by other users. It uses the known preferences of a group of users to makerecommendations or predictions of the unknown preferences for other users [12]. Thisis one of the most successful technology for building recommendation systems till dateand is widely used. In the proposed recommendation model items are learning objectsor material like tutorials or lectures from which a student learns about a concept. Thismethod attempts to predict the utility/suitability of a learning objects to a particularuser based on the ratings provided by other users. Once we have predicted the utilityof various learning objects, we propose to recommend the top k learning objects tothe user [13].
4.3.1.1 Algorithm Used
The two key steps involved in this algorithm are as follows:

4.3. COLLABORATIVE FILTERING 23
1. Computing similarity between Learning Objects :. The most populartechniques used for this step is the Pearson’s correlation coefficient [14] andcosine based approach. The simple well-known formula used is:
sim(i, j) =
∑(Ru,i −Ru
) (Ru,j −Ru
)√∑(Ru,i −Ru
)2√∑(Ru,j −Ru
)2 (4.3)
Where Ru,i is the rating given to Ii by user u, R is the mean rating of all theratings provided by u. As evident from the formula, the similarity value betweentwo learning object can take values in the range [−1, 1]. A Item-Item similaritymatrix is created and top k item similar to the last learning object used by theuser are chosen.
2. Computing Prediction Matrix: The prediction for each user u in the user-setU correlated with each item i in the item-set I is calculated as follows:
Pu,i =
∑t∈N
(sim (i, t)∗Ru,t)∑t∈N
(‖sim(i, t)‖)(4.4)
Where N represents the item i′s similar item set, and Ru,t is the rating given toitem t by learner u. The prediction matrix is not stored in memory, rather it iscalculated dynamically whenever required
A sample computation for both the item-item similarity Matrix and Prediction Matrixis shown in figure 4.2
4.3.1.2 Complexity Analysis of the Algorithm
The complexity of collaborative filtering algorithm implemented in the system is asfollows :
• When user rates a object - Θ (UN). Since a row in the item-item similaritymatrix is changed and all the combination of user vs learning object is traveresed
• When user opens dashboard to view concepts available for learning - Θ (NK) ∼O (N2). Since for every course, the prediction of the current user is calculatedby traversing through the corresponding row of item-item similarity matrix
• Space Complexity - The system stores item-item similarity matrix and user-itemrating matrix only. So the space complexity of the algorithm is Θ (N2 + UN)
where, U , is the total number of students in the system, N is the total number of learn-ing objects in the system and K is the number of objects to be selected for prediction.
4.3.1.3 Advantages and Disadvantages
The advantages and disadvantages [15] of the technique discussed above is listed intable 4.1
24 CHAPTER 4. ADAPTIVE ENGINE
Figure 4.2: Sample Computation of Item-Item Similarity and Prediction Matrix
4.3.2 User - User Collaborative Filtering
User-user collaborative filtering has been widely used in e-commerce systems but e-learning is a new platform for it. User based collaborative filtering works aroundfinding similarity between users based on how they rate certain items in the domain.Then it predicts ratings for the current user on unrated items based on how similarusers rated those items.
This method can be very effectively used in e-learning systems as similarity betweenusers can be used in recommending courses and concepts.
For calculating similarity between students we use a modified cosine similaritymetric:
sim(i, j) =
∑c∈Ci
⋂Cj
sic × sjc√∑c∈Ci
s2ic
√∑c∈Cj
s2jc
(4.5)
where sic represents student i’s score in concept c. and Ci represents the list of Con-cepts whose test student i has given.
If we replace both c ∈ Ci and c ∈ Cj in the denominator with c ∈ Ci
⋂Cj, it is
essentially cosine similarity but using it in the given form has an added benefit. It actsas an automatic damping factor and also takes into consideration the cases when twostudents have a large difference in the total number as well as list of concepts they have

4.3. COLLABORATIVE FILTERING 25
Advantages Disadvantages
• Silmilar concepts can easy bedetermined without consid-ering the content.
• Relatively low time andspace complexity comparedto other algorithms. The al-gorithm also scales well withco-rated items
• New users can be added in-crementally and handled ef-ficiently.
• Suffers from cold start prob-lem. Good recommenda-tion requires a large trainingset. The performance sufferswhen the data gets sparse.
• It depends on human rat-ing. It may be biased oruser might rate concepts ran-domly.
• Adding new item is difficultas it relies on specific vectorspace
Table 4.1: Advantages and Disadvantages of Collaborative Filtering
each taken. Any concept which is not common will contribute to the denominator butnot to the numerator thus reducing the similarity value, which is intuitively correct.
After calculating the similarity, the prediction value for each concept (which is notattempted by the current user) is calculated for the current user.
Pic =
∑j∈S
sim(i, j)× sjc∑j∈S
sim(i, j)(4.6)
Where Pic represents Prediction value for Student i in Concept c and the set S repre-sents the set of students who have attempted Concept c.
After calculating the prediction values, the concepts whose prediction value isgreater than a threshold(can be the passing marks) are recommended in decreasingorder of prediction values.
An example: Let’s consider there are 4 students and 4 concepts in the domainat some moment.
Score =
C1 C2 C3 C4
S1 1.0 0.7 NA NAS2 0.6 1.0 0.9 NAS3 NA 0.8 0.9 0.9S4 0.9 0.6 NA 0.7
where NA signifies that the student has not attempted that quiz.

26 CHAPTER 4. ADAPTIVE ENGINE
Now calculating similarity between the students based on their scores:
sim(S1, S2) =1 ∗ 0.6 + 0.7 ∗ 1√
1.0 + 0.49√
0.36 + 1.0 + 0.81=
1.3√1.49√
2.17= 0.72 (4.7)
sim(S2, S3) =1 ∗ 0.8 + 0.9 ∗ 0.9√
0.36 + 1.0 + 0.81√
0.64 + 0.81 + 0.81=
1.65√2.17√
2.26= 0.75 (4.8)
sim(S1, S3) =0.7 ∗ 0.8√
1.0 + 0.49√
0.64 + 0.81 + 0.81=
0.56√1.49√
2.26= 0.30 (4.9)
sim(S1, S4) =1 ∗ 0.9 + 0.7 ∗ 0.6√
1.0 + 0.49√
0.81 + 0.36 + 0.49=
1.32√1.49√
1.66= 0.84 (4.10)
sim(S2, S4) =0.6 ∗ 0.9 + 1 ∗ 0.6√
0.36 + 1.0 + 0.81√
0.81 + 0.36 + 0.49=
1.14√2.17√
1.66= 0.60 (4.11)
sim(S3, S4) =0.8 ∗ 0.6√
0.64 + 0.81 + 0.81√
0.81 + 0.36 + 0.49=
0.48√2.26√
1.66= 0.25 (4.12)
Now suppose S1 is our current student and we want to calculate prediction valuefor other concepts he/she hasn’t taken.
PS1,C3 =0.72 ∗ 0.9 + 0.30 ∗ 0.9
0.72 + 0.30= 0.90 (4.13)
PS1,C4 =0.30 ∗ 0.9 + 0.84 ∗ 0.7
0.30 + 0.84=
0.86
1.14= 0.75 (4.14)
So for S1, the recommendation order is:
1. C3
2. C4
So, in this way students history can be used to calculate similarity between studentswhich can be further used to recommend concepts to them.
4.4 Recommending Concepts for Remediation
Recommendations are not only designed to suggest best new concept, but also to sug-gest concepts in which the user is making mistakes frequently. For this, we suggest thefollowing recommendation technique suggesting the concepts to the user, which he hasforgot. The basis of this technique is that any question does not test the user just onone concept. There is a certain degree to which a question judges the student on oneconcept, denoted in the Question-Concept (QC) matrix as described concept-mappingsection.
4.4. RECOMMENDING CONCEPTS FOR REMEDIATION 27
4.4.1 Proposed Algorithm
For every concept for a particular student, we retrieve two parameters:
1. Ni - Number of consecutive wrong attemps made across all question that isdependent on concept Ci.
2. Di - The total sum of dependencies, across all those questions attempted wrongly.
A concept is considered as forgotten if and only if the following condition holds true :
Ni ≥M × 30% (4.15)
Where M is the total number of questions contributing to that concept,
Ni is the total number of consecutive wrong attemps in concept Ci’s question,Di is the total dependencies of wrongly attempted questions.
We have assigned a revision importance (Ri) to every concept that signifies thepriority with which the student should revise the concepts in which he has misconcep-tion. This parameter is calculated by giving equal weightage to both the parametersnamely Ni and Di, as follows:
Ri = (0.5×Ni) + (0.5×Di) (4.16)
Now the user is recommended concepts in order of decreasing importance (Ri) of the
concepts.
4.4.2 Example
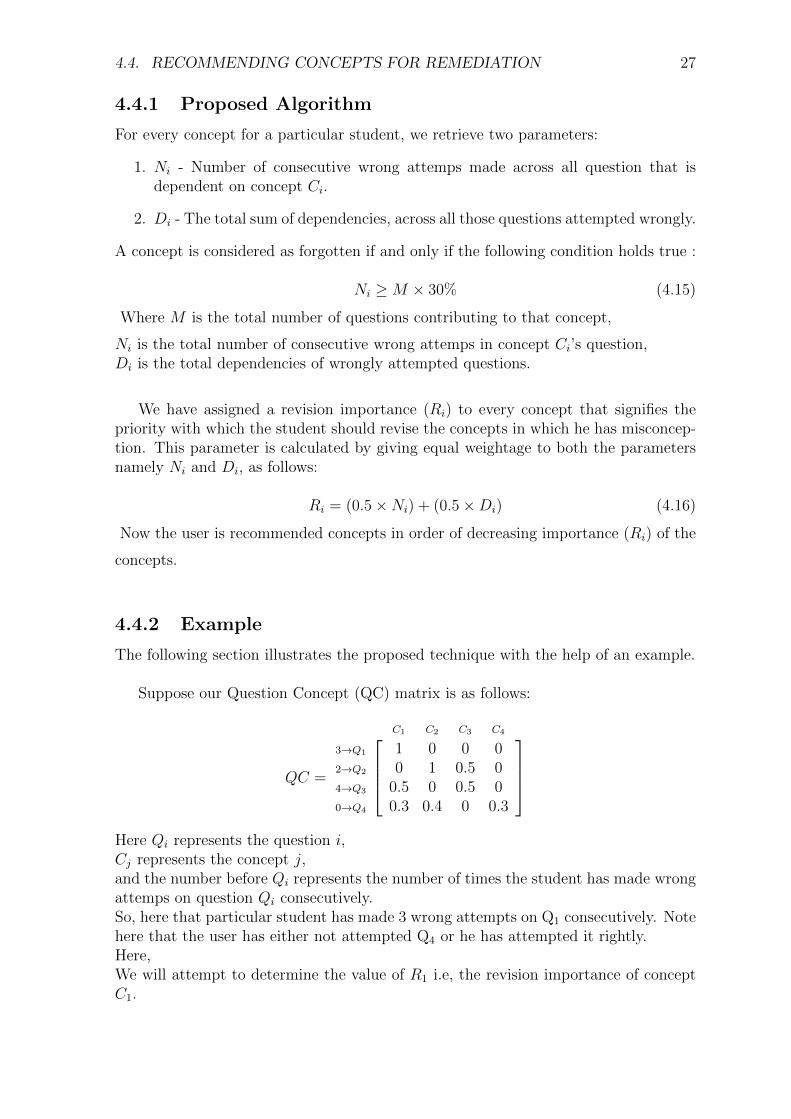
The following section illustrates the proposed technique with the help of an example.
Suppose our Question Concept (QC) matrix is as follows:
QC =
C1 C2 C3 C4
3→Q1 1 0 0 02→Q2 0 1 0.5 04→Q3 0.5 0 0.5 00→Q4 0.3 0.4 0 0.3
Here Qi represents the question i,Cj represents the concept j,and the number before Qi represents the number of times the student has made wrongattemps on question Qi consecutively.So, here that particular student has made 3 wrong attempts on Q1 consecutively. Notehere that the user has either not attempted Q4 or he has attempted it rightly.Here,We will attempt to determine the value of R1 i.e, the revision importance of conceptC1.

28 CHAPTER 4. ADAPTIVE ENGINE
Parameter Ni can be calculated by simply summing up the number of wrong attemptson all questions dependent of concept C1 which is Q1 and Q3.
N1 = 3 + 4 = 7 (4.17)
Parameter M is simply 3 - (Q1, Q3 and Q4)Here N1 comes out to be 7 which is greater than M×0.3 = 0.9. So we continue findingit’s revision importance. Parameter Di can be calculated by simply summing up thedependency of Q1 on C1 and dependency of Q3 on C1.
D1 = 1 + 0.5 = 1.5 (4.18)
Lastly, the revision importance can be calculated as follows :
R1 = (0.5× 7) + (0.5× 1.5) = 3.5 + 0.75 = 4.25 (4.19)
Similarly, R2, R3 and R4 can also be calculated. Once these values are available, we
sort them in decreasing order and recommend to user.
Chapter 5
Evaluation Model
5.1 Introduction to evaluation model:
Evaluation of recommender systems has only lately started to become more impor-tant and systematic. Currently, there are very few E-learning platforms which havedeveloped a recommendation system along with a evaluation model. Evalauation of arecommender system is very important from the point of view of refinement requiredin the learning model and to identify the steps needed to do so. In order to increasethe efficiency of the adaptive learning model, it is of utmost importance to evaluatethe model thoroughly and precisely. In our system, we have implemented a layeredevaluation model which decomposes the recommendation model into several layersbased on several criteria and then evaluates each layer individually. Layered evalua-tion [?] helps to inspect each and every aspect of the model thoroughly and concludeabout that aspect in detail. The evaluation model can be categorised into followingcategories :
5.2 Evaluation based on feedback of students
The students are the ones who are going to use the learning model. Hence, it hasto satisfy the needs of the students. Also, it has been observed that students areones who judge the system very well and the suggestions received from them are veryvaluable.This same observation was used to build the PeRSIVA [16] evalauation modelfor adaptive learning. The suggestions and experiences of the students are generallycollected by using a feedback questionairre and then judging the system based onthe responses. In our model, we have shortlisted a questionairre of 15 questions thatcorrespond to each and every layer of the model. A small subset out of these 15questions appear after the students gives the quiz and his score is displayed. Thestudent then gives his feedback to these questions.
The 15 feedback questions are categorized into the following 5 categories :
• Effectivness of the system: The questions based on this category correspondto the user interface of the system along with the impact of the system in incul-cating the knowledge in the student’s mind (in our case understanding the logicof programming ). The questions also correspond to the basic core question -“is the model really an useful one ?”. The questions under this category are asfollows :
29

30 CHAPTER 5. EVALUATION MODEL
Figure 5.1: Feedback questions after the quiz
1. Does the educational software meet your expectations?
2. Does the educational software help you understanding the logic of program-ming?
3. Do you think that this educational software is useful as an educational tool?
• Adaptivity of the system: The questions in these category mainly corre-spond to the adaption of the system to the student’s knowledge needs. It checkswhether the concepts recommended correspond to the students knowledge leveland whether the student is ready to learn that concept. Also,the question cor-responds to the authencity of the recommendations displayed. The questionsunder this category are as follows :
1. Does the program correspond to your knowledge level each time?
2. Does the program correspond to your educational needs level each time?
3. Does the test adapt to your educational needs?
• State on computer programming: Since our model is oriented to learningof C language, we have inculcated this category to get a better information aboutthe model. The questions ask the student whether the model helps the studentto develop interest in computer programming and whether the model is usefulin developing the logic of the student. The questions under this category are asfollows :
1. Does the educational software affect positively your perception about com-puter programming?
5.3. EVALUATION BASED ON STUDENT SCORES 31
2. Does the educational software draw your interest on computer program-ming?
3. Does the educational software motivate you to be involved in computerprogramming?
• Student’s progress in future: The responses to the feedback questions arecollected from the student over a long period of time. So it is necessary to findout whether the model is useful to the students in future also. So the questionsin these category ask the student whether the concepts learnt in these model arehelpful in future or not. The questions also check whether the course learnt (Cprogramming in our model) is helpful in their studies in future. The questionsunder this category are as follows :
1. Does the educational software help you understanding better the logic ofprogramming?
2. Does the educational software help you to learn other programming lan-guages?
3. Does the educational software help you in your studies?
• Necessity of Revision: For evaluating a E-learning model, it is importantto know how much is the frequency of the student going back to the previousconcepts just because he forgot them or he realized that his concepts were notclear enough. For an efficient model, the frequency is expected to be as lowas possible. The feedback questions in this category actually ask the studentwhether there is a need for revision before starting a new concept and whetherthe revision helped them to revise the concepts thoroughly. The questions underthis category are as follows :
1. Do you think that your returns to a previous chapter in order to revise itare a waste of time?
2. Do the returns to a previous chapter correspond to your need for revision?
3. Does your return to a previous level, that happened each time the sys-tem discovered that you made errors of previous chapters,help you learningprogramming?
All the responses to the feedback questions are given by the students in the formof ratings on a scale of 1(not at all) - 5(very much). These responses are stored inthe database and an average ratings to all questions by all students is displayed in theform of tables.
Based on these average ratings of all questions, the average ratings of each categoryis calculated which helps us to generate the overall conclusion of the model.
5.3 Evaluation based on student scores
The first category of evaluation i.e. evaluation based on feedback was based on explicitinteractions of the user with the model i.e. based on explicit responses of the student tothe feedback questions. But a good evaluation model should also evaluate the modelimplicitly. So in order to evaluate the model implicitly, we are using the scores of

32 CHAPTER 5. EVALUATION MODEL
Figure 5.2: Average feedback responses of all students
Figure 5.3: Average ratings of all categories
Figure 5.4: Average ratings of all categories in graphical form
the students in each concept to generate the relationship between the quiz and the
5.4. EVALUATION BASED ON PARAMETERS 33
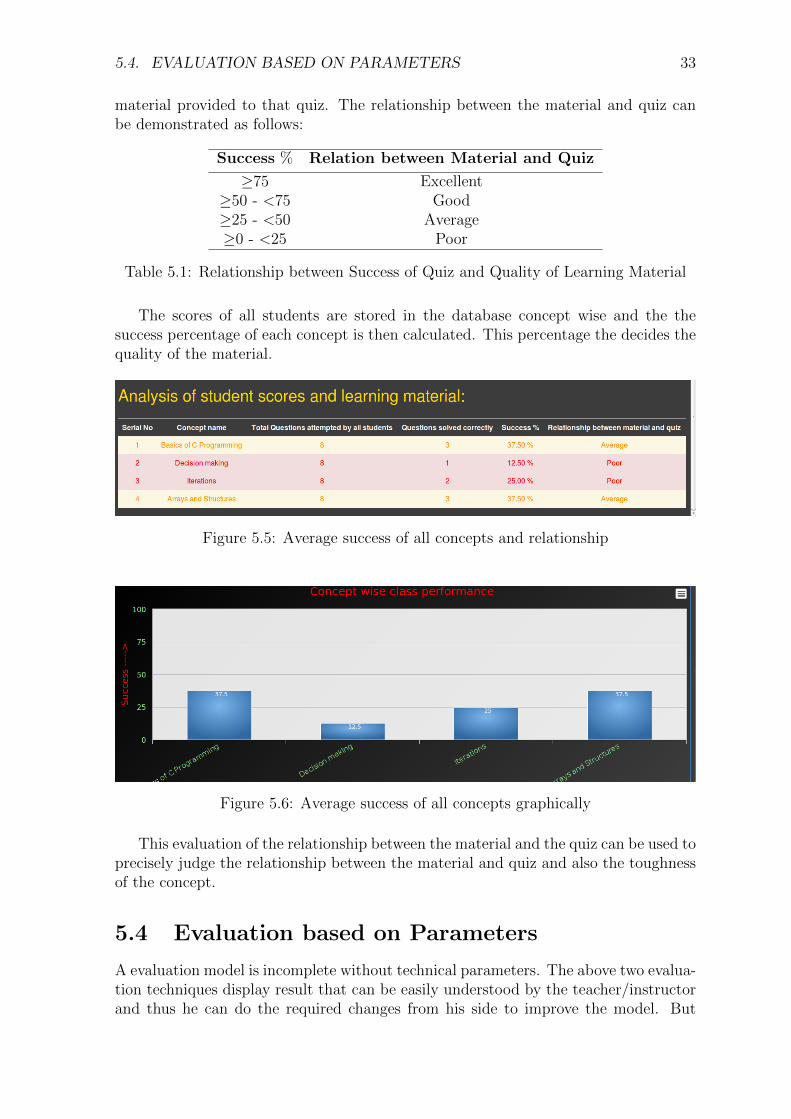
material provided to that quiz. The relationship between the material and quiz canbe demonstrated as follows:
Success % Relation between Material and Quiz
≥75 Excellent≥50 - <75 Good≥25 - <50 Average≥0 - <25 Poor
Table 5.1: Relationship between Success of Quiz and Quality of Learning Material
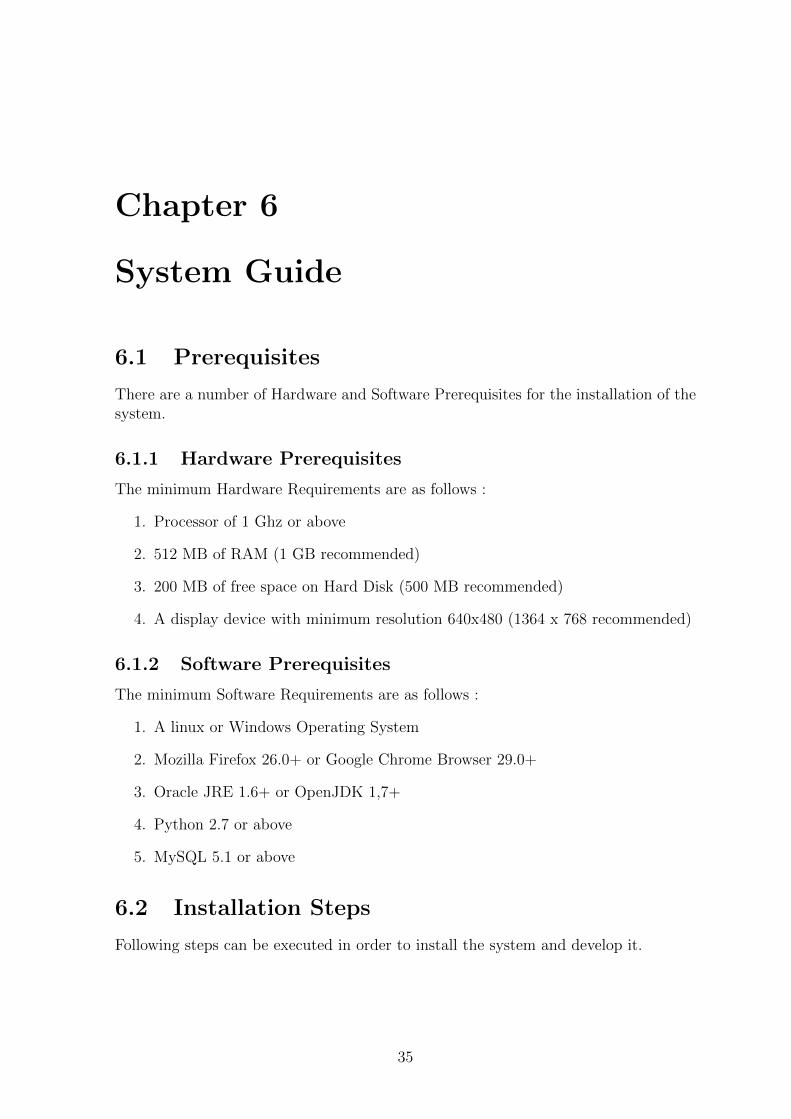
The scores of all students are stored in the database concept wise and the thesuccess percentage of each concept is then calculated. This percentage the decides thequality of the material.
Figure 5.5: Average success of all concepts and relationship
Figure 5.6: Average success of all concepts graphically
This evaluation of the relationship between the material and the quiz can be used toprecisely judge the relationship between the material and quiz and also the toughnessof the concept.
5.4 Evaluation based on Parameters
A evaluation model is incomplete without technical parameters. The above two evalua-tion techniques display result that can be easily understood by the teacher/instructorand thus he can do the required changes from his side to improve the model. But

34 CHAPTER 5. EVALUATION MODEL
some changes are required from technical point of view like changing the number ofrecommendations displayed, chnaging the type(text,video,etc.) of recommendationsdisplayed. These changes are to be done by the developer and to help him do so, wehave put two well known evaluation parameters - precision and recall [17] which areused extensively in the evaluation domain.They can be defined as:
Precision =Number of good Concepts recommended
Total Number of concepts recommended(5.1)
Recall =Number of good Concepts recommended
Total Number of good concepts(5.2)
By the term- ”Good Concept” we mean concepts which have average ratings above4 in scale of 1-5. Also,”Number of concepts recommended” is the number of recom-mendations displayed to the learner. The values of precision and recall vary between0 and 1 and it is often observed that increase in any one of the leads to decrease inthe other. Hence, a new parameter which combines both of them is generated andpopularly known as the F1 metric. It can be stated as follows:
F1 metric =2 * Precision * Recall
Precision + Recall(5.3)
The F1 metric in our model gives equal weightage to precision and recall. Its valueranges from 0 to 1 and higher its value, better is the recommendation model.
Figure 5.7: Values of precision, recall and F1 metric charts
Chapter 6
System Guide
6.1 Prerequisites
There are a number of Hardware and Software Prerequisites for the installation of thesystem.
6.1.1 Hardware Prerequisites
The minimum Hardware Requirements are as follows :
1. Processor of 1 Ghz or above
2. 512 MB of RAM (1 GB recommended)
3. 200 MB of free space on Hard Disk (500 MB recommended)
4. A display device with minimum resolution 640x480 (1364 x 768 recommended)
6.1.2 Software Prerequisites
The minimum Software Requirements are as follows :
1. A linux or Windows Operating System
2. Mozilla Firefox 26.0+ or Google Chrome Browser 29.0+
3. Oracle JRE 1.6+ or OpenJDK 1,7+
4. Python 2.7 or above
5. MySQL 5.1 or above
6.2 Installation Steps
Following steps can be executed in order to install the system and develop it.
35

36 CHAPTER 6. SYSTEM GUIDE
Figure 6.1: Python Logo
6.2.1 Python
Python is a widely used general-purpose, high-level programming language designedwith a philosophy that emphasizes code readability. Python 2.7 is by-default installedin most of the Linux distributions. It can be upgraded or re-installed using the follow-ing command [18]:
1 sudo apt−get i n s t a l l python
For Windows users an installation package is available at Python’s official website -https://www.python.org.
After installing Python, pip has to be installed. Pip is a utility to install pythonpakages. It is an open-source software developed and maintained by Python PakagingAuthority. It can be installed on Ubuntu by using following command [19]:
1 sudo apt−get i n s t a l l python−pip
On Fedora it can be installed using following command :
1 sudo yum i n s t a l l python−pip
Alternatively, one can download a pip installation script and install pip manually. Thismethod works on all Operating Systems including windows :
1 wget ” https : // boots t rap . pypa . i o / get−pip . py”2 python get−pip . py
6.2.2 Git
Git is a distributed revision control and source code management (SCM) system withan emphasis on speed, data integrity and support for distributed, non-linear workflows.It is the most widely adopted version control system. Since the development code ofthe system is hosted on github, installing git is necessary to get the latest version ofthe code.
On Linux Systems, git can be installed using following command [20]:
1 sudo apt−get i n s t a l l g i t
For Windows, a native application for Git is available. The latest stable release as of25th June, 2014 is 2.0, which supports Windows Vista and above. The app can beinstalled from here - https://windows.github.com/
6.2. INSTALLATION STEPS 37
Figure 6.2: Git Logo
6.2.3 Django
Django is a high-level Python Web framework that encourages rapid development andclean, pragmatic design. Django focuses on automating as much as possible [21]. Asof 28th June, 2014, the latest official stable release of django is 1.6.5.
Figure 6.3: Django Logo
Django can be install using pip :
1 pip i n s t a l l Django==1.6.5
Alternatively, the Django can be compiled and installed from the lastest developmentcode which is hosted on github [21] :
1 g i t c l one https : // github . com/django/django . g i t
To test the version of Django installed following command can be executed in a pythonshell [22]:
1 >>> import django2 >>> pr in t ( django . g e t v e r s i o n ( ) )3 1 .6
6.2.4 XAMPP
XAMPP[23] is a free and open source cross-platform web server solution stack package,consisting mainly of the Apache HTTP Server, MySQL database, and interpreters forscripts written in the PHP and Perl programming languages. Xampp is mostly usedas a development tool, to allow website designers and programmers to test their workon their own computers without any access to the Internet. Xampp also provides agraphical user interface for MySQL Database, which makes it easier to execute and
38 CHAPTER 6. SYSTEM GUIDE
Figure 6.4: XAMPP Logo
obtain results of queries.
XAMPP can be downloaded and install for all platforms from it’s official website -https://www.apachefriends.org/index.html. Once mysql is installed, a databaseand a user has to be created for django framework and all privilages should be grantedto it so that the framework can manage the database.
1 mysql −u root −p2 mysql> c r e a t e database e l e a r n i n g r e c o db ;3 mysql> grant a l l p r i v i l a g e s on e l e a a rn i ng r e c o db .∗ to
<des i red username>@loca lhos t i d e n t i f i e d by ’<des i red password > ’ ;
6.2.5 Cloning and Initializing System
Once all the above steps are performed, the system will be ready to run the application.First a git directory has to be initialized and then the git repository of the applicationhas to be cloned using following command:
1 g i t i n i t2 g i t c l one https : // github . com/ f r e s ea r chg roup /Recommendation−
System−f o r−Adaptive−E−Learning . g i t
Once the git repository is cloned, configuration files has to edited to run the appli-cation. The project directory consists of a folder named ’elearning site’. This folderconsist of a file named ’settings.py’, which consist of all the settings specific to thesystem. The database engine to be used should be specified along with username andpassword. In particular the DATABASES settings should be configured as follows :
1 DATABASES = {2 ’ d e fau l t ’ : {3 ’ENGINE’ : ”django . db . backends . mysql” ,4 ’NAME’ : ” e l e a r n i n g r e c o db ” ,5 ’USER’ : ”<des i red username>” ,6 ’PASSWORD’ : ”<des i red password>” ,7 ’HOST’ : ” l o c a l h o s t ” , # Or IP o f DB Server8 ’PORT’ : ”” ,9 }
10 }
Once the database settings have been configured, the database has to synced with themodels used in the application. This can be done by executing the following commandin the elearning site folder :
1 python manage . py syncdb
6.2. INSTALLATION STEPS 39
Running the above command for the first time will prompt for creation of a superuser.This superuser has all the privilages to make changes in the application via the adminpage. The superuser should be created and the password must be kept safe.
6.2.6 Celery
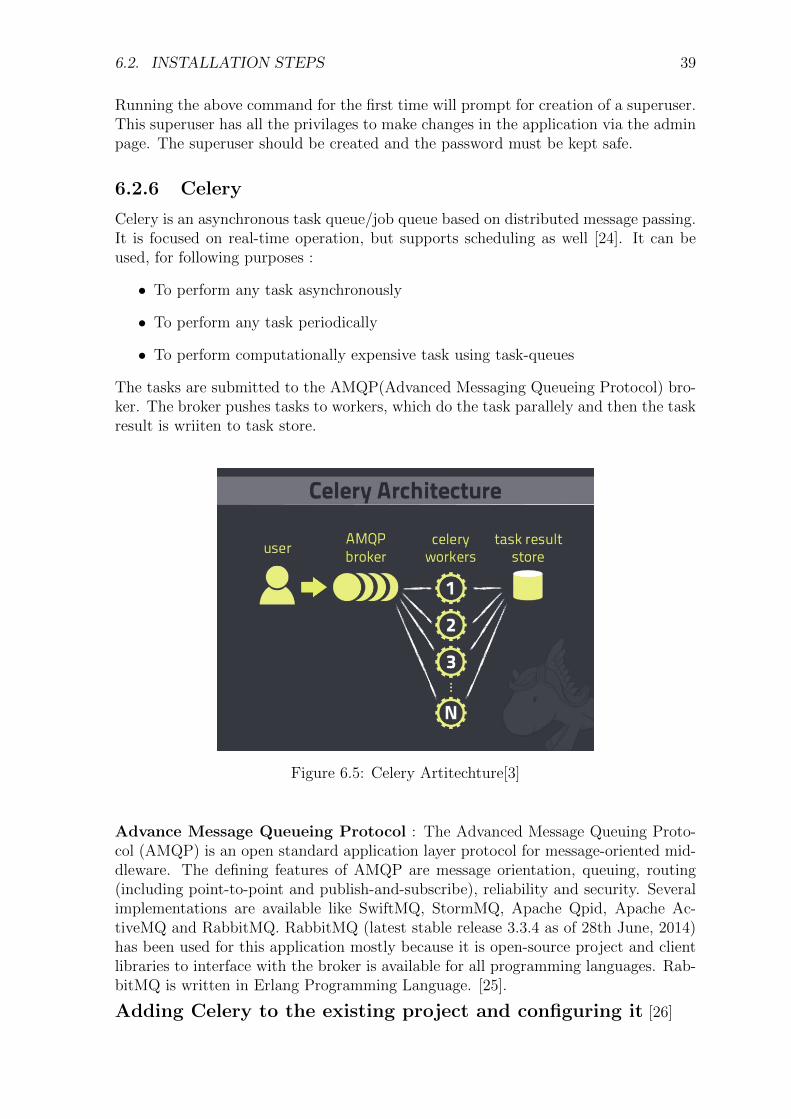
Celery is an asynchronous task queue/job queue based on distributed message passing.It is focused on real-time operation, but supports scheduling as well [24]. It can beused, for following purposes :
• To perform any task asynchronously
• To perform any task periodically
• To perform computationally expensive task using task-queues
The tasks are submitted to the AMQP(Advanced Messaging Queueing Protocol) bro-ker. The broker pushes tasks to workers, which do the task parallely and then the taskresult is wriiten to task store.
Figure 6.5: Celery Artitechture[3]
Advance Message Queueing Protocol : The Advanced Message Queuing Proto-col (AMQP) is an open standard application layer protocol for message-oriented mid-dleware. The defining features of AMQP are message orientation, queuing, routing(including point-to-point and publish-and-subscribe), reliability and security. Severalimplementations are available like SwiftMQ, StormMQ, Apache Qpid, Apache Ac-tiveMQ and RabbitMQ. RabbitMQ (latest stable release 3.3.4 as of 28th June, 2014)has been used for this application mostly because it is open-source project and clientlibraries to interface with the broker is available for all programming languages. Rab-bitMQ is written in Erlang Programming Language. [25].
Adding Celery to the existing project and configuring it [26]

40 CHAPTER 6. SYSTEM GUIDE
Figure 6.6: RabbitMQ Logo
1. First celery has to be installed using the following command
1 pip i n s t a l l django−c e l e r y
2. Next RabbitMQshould be installed using the following command
1 sudo apt−get i n s t a l l rabbitmq−s e r v e r
3. A file has to be created which stores all the tasks to be performed by celery. Theapplication repository already has a file named task.py. So no need of creatinga new file.
4. Another file called celery.py has to be crested which stores all the settings relatedto the celery server. The default settings are listed below and it can be changedaccording to need.
1 from f u t u r e import abso lu te impor t2
3 from c e l e r y import Celery4
5 app = Celery ( ” pro j ” ,6 broker=”amqp : //” ,7 backend=”amqp : //” ,8 i n c lude=[” pro j . t a sk s ” ] )9
10 # Optional con f i gu ra t i on , s ee the app l i c a t i o n user guide .11 app . conf . update (12 CELERY TASK RESULT EXPIRES=3600 ,13 )14
15 i f name == ” main ” :16
17 app . s t a r t ( )
5. The celery has to be imported to the django framework. This is done in init .pywhich is executed when the django framework starts. Again, by default allsettings are configured but it can be changed.
1 from f u t u r e import abso lu te impor t2
3 # This w i l l make sure the app i s always imported when4 # Django s t a r t s so that shared ta sk w i l l use t h i s app5
6 from . c e l e r y import app as c e l e ry app
6.3. OPTIONAL TOOLS FOR DEVELOPERS 41
6. The Django project configuration also has to be changed which can be achievedby changing settings.py. The default settings are as follows [27]:
1 import d j c e l e r y2
3 d j c e l e r y . s e tup l oade r ( )4
5 ## Broker s e t t i n g s6 BROKERURL = ”amqp : // guest : gue s t@ loca lhos t : 5672//”7
8 # Li s t o f modules to import when c e l e r y s t a r t s .9 CELERY IMPORTS = (” reco app . ta sk s ” )
10 CELERYANNOTATIONS = {” ta sk s . add” : {” r a t e l im i t ” : ”10/ s ”}}11 BROKERBACKEND = ”django”12 CELERY RESULT BACKEND =13 ” d j c e l e r y . backends . database : DatabaseBackend”
6.3 Optional Tools for Developers
6.3.1 PyCharm
PyCharm is an Integrated Development Environment (IDE) used for programming inPython. It provides code analysis, graphical debugger, integrated unit tester, VCS/D-VCS integration and supports web development with Django. PyCharm is developedby Czech company JetBrains [28] It is cross-platform working on Windows, Mac OSX and Linux. Following steps needs to be followed to install PyCharm :
Figure 6.7: Pycharm Logo
1. Download the installation archive of PyCharm (latest stable version 3.4.1 as of30th June, 2014) from the official website using the following command :
1 wget ”http : //download . j e t b r a i n s . com/python/2 pycharm−community−3 . 4 . 1 . ta r . gz”
2. Once the download is complete, the downloaded archive should be extractedusing the following command :
1 ta r x f z pycharm−∗. t a r . gz
3. The downloaded archive can be removed to save disk space (optional) using thefollowing command :
1 rm pycharm−∗. t a r . gz

42 CHAPTER 6. SYSTEM GUIDE
4. Lastly, the Installation Script should be executed using the following command:
1 sudo . / pycharm . sh
6.3.2 Neatbeans
Netbeans is a cross-platform Integrated Development Environment that supports de-velopment of HTML documents. It also supports JavaScript and Cascading StyleSheets. Netbeans (latest stable release 8.0 as of 30th June, 2014) can be installedusing the installation scripts provided on the official website [29].
Figure 6.8: Netbeans Logo
The installation steps are as follows [30]:
1. Download the Installation script using the following command :
1 wget ”http : //download . netbeans . org / netbeans2 /8 .0/ f i n a l / bundles /netbeans−8.0− l i nux . sh”
2. Once installed, the file-permissions has to be modified using tha following com-mand.
1 chmod +x ”netbeans−8.0− l i nux . sh”
3. Lastly, the script has to be executed which will automatically install all therequired packages, using the following command :
1 sudo . / netbeans−8.0− l i nux . sh
6.3.3 Firebug
Firebug is a web development tool that facilitates the debugging, editing, and monitor-ing of any website’s CSS, HTML, DOM, XHR, and JavaScript; it also provides otherweb development tools.[2] Firebug’s JavaScript panel can log errors, profile functioncalls, and enable the developer to run arbitrary JavaScript [31]. Firebug is also freeand open-source.
Firebug can be installed by opening this link “https://addons.mozilla.org/en-US/firefox/addon/firebug/” from Firefox browser.

6.4. APIS 43
Figure 6.9: Firebug Logo
6.3.4 Sublime Text
Sublime Text is a cross-platform text and source code editor, with a Python applicationprogramming interface (API). Sublime Text is proprietary software. Several features ofthis editor like Command Palette, Multiple Selection, JSON Settings, Project-Specificpreferences, etc. makes code editing and debugging simpler. Sublime Text (latest
Figure 6.10: Sublime Text Logo
stable release 2.0.2 as of 1st July, 2014) can be installed using the following command[32]:
1 sudo add−apt−r e po s i t o r y ”ppa : webupd8team/ sublime−text−2”2 sudo apt−get update3 sudo apt−get i n s t a l l sublime−t ex t
6.4 APIs
This section contains information about the various libraries abd APIs used in systemdevelopment. This will primarily help future developers.

44 CHAPTER 6. SYSTEM GUIDE
6.4.1 Highcharts
Highcharts is a JavaScript based charting API that can create interactive charts forany web project [33].
Figure 6.11: Sample Chart Rendered in Application
It has the following features :
• Free for non-commercial purposes
• Compatible with old browsers including Internet Explorer 6.
• It supports adding, deleting editing series, points and axes
• Numerous charting options like line, spline, area, areaspline, column, bar, pie,scatter, angular gauges, arearange, areasplinerange, columnrange, etc.
6.4.2 JQuery
jQuery is a cross-platform JavaScript library designed to simplify the client-side script-ing of HTML. It makes things like HTML document traversal and manipulation, eventhandling, animation, and Ajax much simpler with an easy-to-use API that works acrossa multitude of browsers [34].
Figure 6.12: Jquery Logo
6.4.3 BootStrap
Bootstrap is a free collection of tools for creating websites and web applications. Itcontains HTML and CSS-based design templates for typography, forms, buttons, nav-igation and other interface components, as well as optional JavaScript extensions [35].It efficiently scales across different devices and is full of HTML, CSS as well JavaScriptfeatures.

6.5. CODE ORGANISATION 45
Figure 6.13: Bootstrap Logo
6.4.4 Celery and RabbitMQ
Please refer to section 6.2.6 for information about Celery and RabbitMQ.
6.5 Code Organisation
Our code is organised as shown in figure 6.14There are two main directories and an important file in the code structure, namely,
elearning site, reco app and manage.py. The third directory, media is just used toupload sample content to the database, which can be uploaded, otherwise, throughthe site, too. Each of these 3 things are explained in the following section :
• manage.py : It is a python script which imports the django framework settingsto the interactive python shell. Any command passed as command line optionwhile executing this file is passed to the interactive shell after importing thedjango settings.It helps to interact with the project in many ways, like validatingthe model, creating database and running the server.
• elearning site : It is the actual python package for the project. To use celerywith the project, an instance of Celery library (called an ’app’) is defined incelery.py. Then this app is imported in init .py. init .py, is used to markthe directory on disk as a Python package directory. As such the files inside theelearning site folder can be imported as:
1 from e l e a r n i n g s i t e import u r l s . py
or
1 import e l e a r n i n g s i t e . u r l s
settings.py contain the settings/configurations for the project like the templatesdirectory, database configurations, static files, etc. urls.py is the ’table of con-tents’ of the django powered site.
• reco app : It is the main plugin of the application that contains all the core-codes. Nite that it is also a python package, marked by init .py. Here, weadd models (models.py) and views (views.py). Models are python classes whichare automatically converted to SQL tables. Django ORM provides an objectoriented interface to the programmers to interact directly with the database.views.py is a simple python function that takes a web request and returns a webresponse. This directory also houses templates (HTML pages) and static files(css, javascript, jquery).

46 CHAPTER 6. SYSTEM GUIDE
Figure 6.14: Code organisation
In layman terms, if to add a new web page to this or any django powered site, thenan HTML page has to be created in the templates directory. AFter that the requiredstyles and javascript files should be placed in static folder under appropiate section.The business logic of the page has to be written in views.py in form of a function thatsaccepts a request and respond by rendering an HTML template with a given context.Lastly, a regular expression for the webpage url is added in urls.py (eg. /login/ forlogin page) and registered with the corresponding view written for it. The presentcode can be used as a reference.

6.6. DEPLOYING SYSTEM 47
6.6 Deploying System
Once the system and all the required tools and dependencies are installed, the serverhas to be started. Django framework provides its own wsgi server for testing theapplication in local machine before it is hosted. Following steps must be followed tostart an application :
1. Change the directory to the project directory
2. Run the celery server first (so that work can be performed using worker nodes)using the following command :
1 c e l e r y −A e l e a r n i n g s i t e worker − l i n f o
The terminal will show message on successful deployment of celery worker node.All the messages related to the backend tasks running on celery can be viewedon this terminal
3. A new terminal is opened. Now the server has to started using the followingcommand :
1 python manage . py runse rve r
This will run the server on the same local machine. Appropriate message isdisplayed on successful deployment of local server along with the port numberon which the server is running. All the request made to the server and all theresponses sent can be easily monitored via this terminal
4. Open a browser and visit localhost or 127.0.0.1. This will take the user to thelogin page.
6.7 System Design
This system consists of two main sub-systems, namely the Content Management Sytem(CMS) and the Learning Mangament System (LMS). The functionalities provided byeach of these sub-systems is described below.
6.7.1 Content Management System
This sub-system provides the tools and utilities useful for the instructor/trainer/teacherto maintain the contents of the course taken by the student. This subsystem is alsoused for evaluating student’s performance. The actions that can be performed via thissystem are as follows :
1. Adding New Concept : Here the instructor can select the learning materialand specify the name of the new concept that has to be created. The new conceptis saved and is displayed to the students, when they visit the correspondingCourse Page (see fig. 6.15).

48 CHAPTER 6. SYSTEM GUIDE
Figure 6.15: Screenshot of Add Concept Page
2. Delete Concept : Here the instructor can see the list of all concepts belongingto the course and select one or more concepts that has to be deleted. Oncedeleted all information about the concept including student’s performance in itand it’s learning material is lost (see fig. 6.16).
Figure 6.16: Screenshot of Delete Concept Page
3. Adding Question : Here the instructor can add a new question to any concept.While uploading a question, the instructor has to mention the concept to whichthe course belongs and also the dependency of this question with all concepts
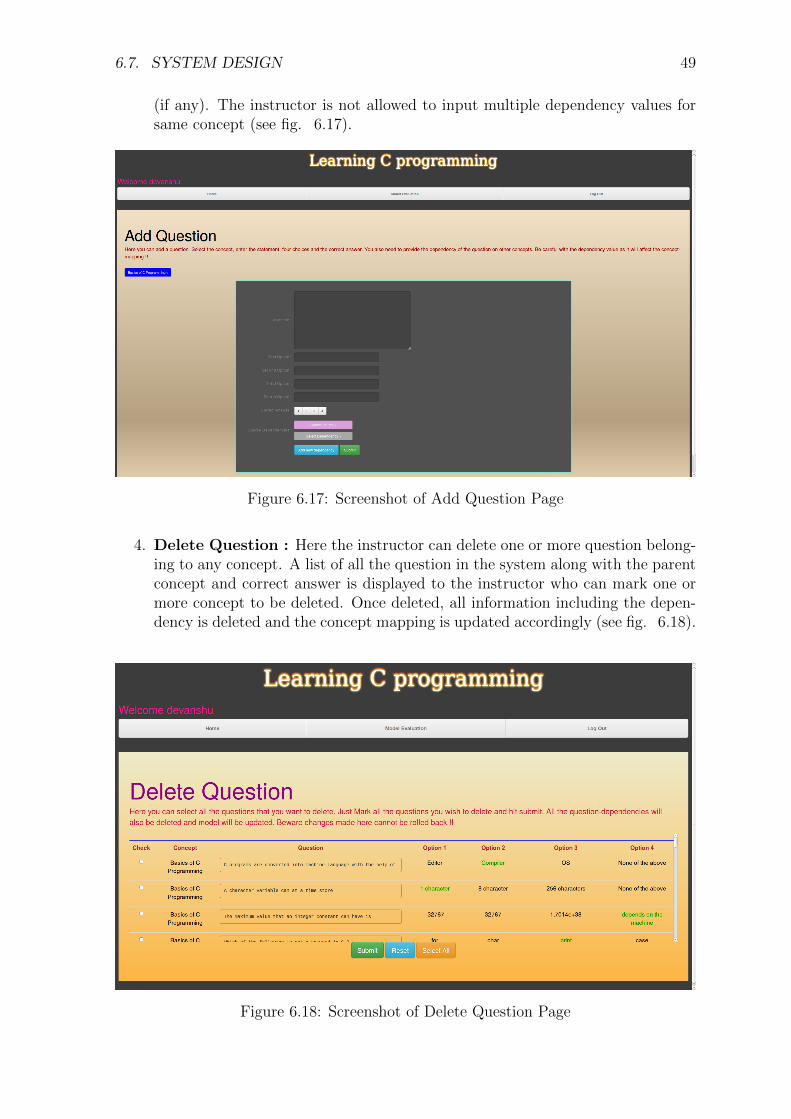
6.7. SYSTEM DESIGN 49
(if any). The instructor is not allowed to input multiple dependency values forsame concept (see fig. 6.17).
Figure 6.17: Screenshot of Add Question Page
4. Delete Question : Here the instructor can delete one or more question belong-ing to any concept. A list of all the question in the system along with the parentconcept and correct answer is displayed to the instructor who can mark one ormore concept to be deleted. Once deleted, all information including the depen-dency is deleted and the concept mapping is updated accordingly (see fig. 6.18).
Figure 6.18: Screenshot of Delete Question Page

50 CHAPTER 6. SYSTEM GUIDE
5. Evalution Model : Here the instructor can see the evaluation of the system.Student’s performance,overall class performance and feedback of the student canbe viewed by the instructor. Colorful charts are plotted for the intructor to aidbetter visualization (see fig. ??).
Figure 6.19: Screenshot of Evaluation Page on Instructor’s side
The Evaluation Model is further divided into two parts :
• Feedback Evaluation : Here the feedback of the students are displayed. Thestatistics are displayed in a tabular format. The system also makes someautomatic conclusions which are displayed to the user (see fig 6.20).

6.7. SYSTEM DESIGN 51
Figure 6.20: Screenshot of the Feedback Evaluation Page
• Material Evaluation : Here the learning material added by the instructor isanalyzed based on student’s performance and displayed in a tabular format.(see fig 6.21).
Figure 6.21: Screenshot of the Material Evaluation Page
The Activity Model of the Content Management System is descriped in figure 6.22

52 CHAPTER 6. SYSTEM GUIDE
Figure 6.22: Teacher Flowchart
6.7.2 Learning Management System
Learning Management system provides the useful functionalities for users/students.The use-cases for this sub-system are as follows :
1. Registration : Here a new student can register for the website. A new user hasto specify his/her name, email id and password. Once a user creates an account,he is automatically subscribed to the C Programming Course (see fig. ??)
Figure 6.23: Screenshot of Student Dashboard
2. Dashboard : Here the user can see all the courses that he/she is subscribed to.Note: The system was tested with only one course i.e, C programming (see fig.6.24).

6.7. SYSTEM DESIGN 53
Figure 6.24: Screenshot of Student Dashboard
3. Concepts : Here the user can view concepts belonging to a particular course: Acourse has atleast 10 to 15 concepts. User can choose the recommended conceptsvia 4 plans as discussed in the Adaptive Engine (see fig. 6.25).
Figure 6.25: Screenshot of Concept Menu Page
4. Read Learning Material : Here the user can read the material of a concept.The user can go directly to the material either from the menu or can visit it viaconcept page (see fig. 6.26).

54 CHAPTER 6. SYSTEM GUIDE
Figure 6.26: Screenshot of Learning Material
5. Take Quiz : The user can take quiz of any concept. Just like reading learningmaterial, the user can go to the quiz directly or from the menu page or can visitit via the concept page (see fig. 6.27).
Figure 6.27: Screenshot of Quiz
6. Give Feedback : Here the user can give feedback about the course. The userwill be asked 15 question and user can grade each parameter from 1-5. Thefeedback answer of a user is overwritten in case of duplicate responses. Thisfeedback is useful in system evaluation (see fig. 6.28).

6.7. SYSTEM DESIGN 55
Figure 6.28: Screenshot of Feedback Page
After taking the quiz, the user rates the overall concept as well give a short feedbackon the system, which is randomly generated from a set of feedback questions. Thescores, rating and feedback is stored in the database and this information is later usedto compute recommendation parameters.The Activity Model of the Learning Management System is described in Figure 6.29
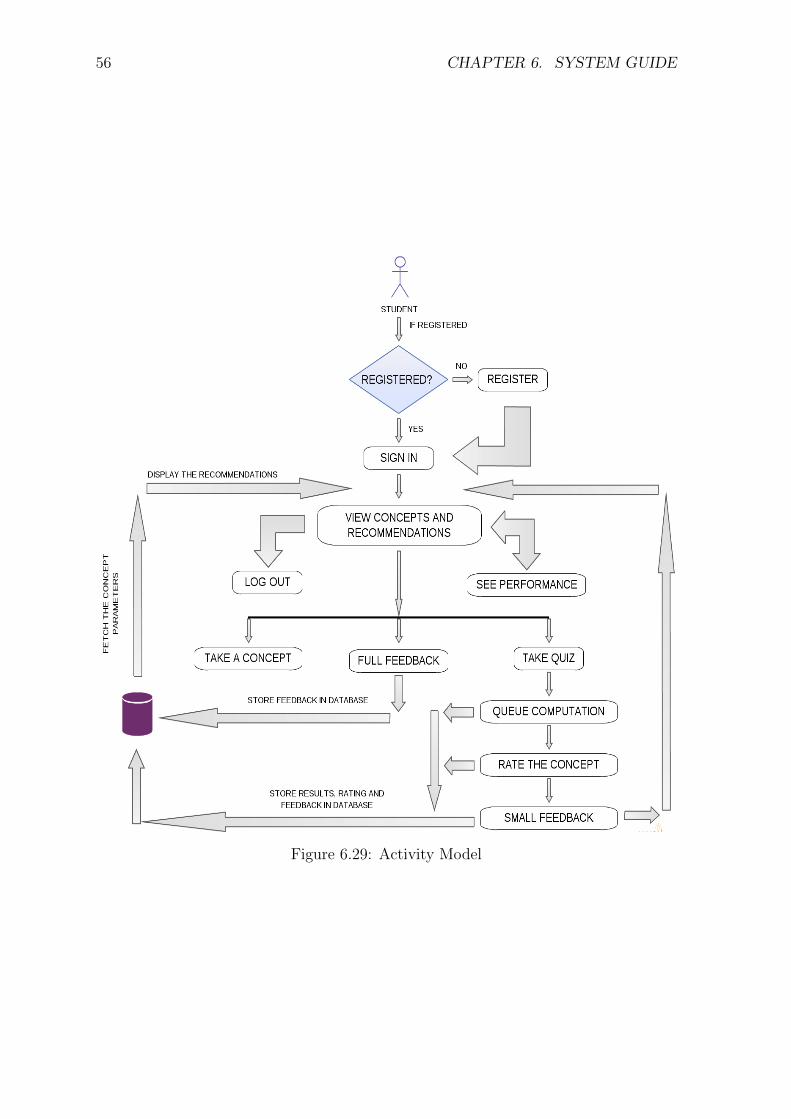
56 CHAPTER 6. SYSTEM GUIDE
Figure 6.29: Activity Model
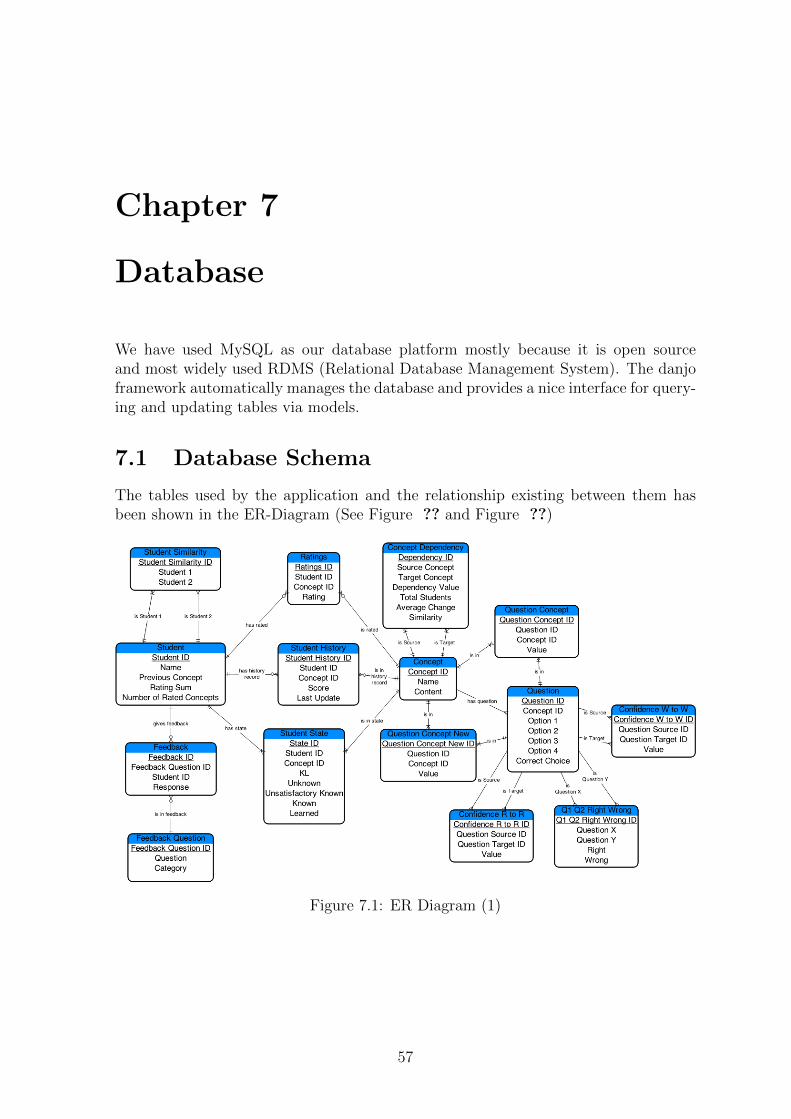
Chapter 7
Database
We have used MySQL as our database platform mostly because it is open sourceand most widely used RDMS (Relational Database Management System). The danjoframework automatically manages the database and provides a nice interface for query-ing and updating tables via models.
7.1 Database Schema
The tables used by the application and the relationship existing between them hasbeen shown in the ER-Diagram (See Figure ?? and Figure ??)
Figure 7.1: ER Diagram (1)
57

58 CHAPTER 7. DATABASE
Figure 7.2: ER Diagram (2)
7.2 Description of Tables
There are a total of 16 tables used by the ’reco app’. Note that there are several otherdefault tables used by Django framework and celery for their working. One Model inDjango framework corresponding to one table in Database. The major tables in thedatabase used by our application has been decribed in the following section :
7.2.1 Student table
The Student table stores the basic information about the student namely his/her name,content preference, ratings sum and total number of concepts rated. The usernameand password for the student are stored in the django’s auth user table.
Content preference: currently the system only offers textual study material fora concept. But the study material can be of many types - textual,videos,interactiveanimations and many other. So in future many kinds of study material may be avail-able for a concept and different types of people like different types of material, somelike texts while others may like videos.So this field can store the students preferred material type based on his/her choiceor behaviour. This can be used in making recommendations and providing the bestcontent for every user.
Rating sum and number of concepts rated: these fields help in the ratingsbased recommendations in the Item based collaborative filtering algorithm.
7.2.2 Concept Table
The Concept Table contains the concept name and the study material path.Currentlywe only have a single course but When you have multiple courses, it should also containa foreign key to the course table, specifying the course in which the given concept is.

7.2. DESCRIPTION OF TABLES 59
7.2.3 Student State Table
The student state table contains the students Knowledge Level(KL) for each courseas well as the membership values for the four states(unknown, unsatisfactorily known,known and learned) for each student-concept pair.
7.2.4 Student History Table
The Student History table keeps record of the time and score whenever a student takesthe quiz of a concept. It has namely four fields:
• Student ID: A foreign key from the Student Table specifying the student takingthe quiz.
• Concept ID: A foreign key from the concept table specifying the concept inwhich the quiz is.
• Score: A decimal value which stores the score obtained in the quiz.
• Last updated: A datetime field which is used to timestamp the quiz event.When the student takes the quiz again, the score and the time is updated.
7.2.5 Student Similarity Table
The Student Similarity Table simply contains the similarity values between pairs ofstudents who have atleast one concept in common(i.e. the similarity value stored isalways greater than zero.)
7.2.6 Feedback Question Table
The Feedback Question Table Contains the details of the questions in the feedback.Thecategory field specifies which category the feedback falls in. There are five categoriesspecified in the Evaluation Model for feedback.
7.2.7 Feedback Table
The Feedback Table contains the details of the feedback given by the students. It hasthe following fields:
• Student ID: A foreign key from the Student Table specifying the student whogave the feedback.
• Question ID: A foreign Key from the Feedback Question Table specifying thequestion for which the feedback was given.
• response: An integer field which records the student’s response on a scale of 1to 5.
60 CHAPTER 7. DATABASE
7.2.8 Concept Dependency Table
The concept dependency table contains the following fields:
• Source and Target Concepts: Foreign Keys from the Concept Table specify-ing the two concepts in which the dependency is calculated.
• Dependency Value: The Value of Dependency calculated between the twoconcepts.
• Total Students: This field keeps track of the total number of students whohave gone through this edge in the concept map (i.e. who have taken TargetConcept directly after the Source Concept)
• Average Change: this field stores the average change in the KL across allconcepts among all student while going through this edge in the concept map.This along with Total Students field help in the Average Change based Recom-mendations.
• Similarity: this field stores the similarity between the source and the targetconcepts based on the ratings given by the students. This helps in the Ratingsbased Collaborative Filtering Recommendations.
7.2.9 Question Table
The Questions Table contains details of the questions which appear in the quizzesof concepts. It has fields such as Concept ID, Question, Option 1,...,Option 4 andAnswer.
7.2.10 Question Concept Table
The Question Concept Table records the dependencies between Questions in thequizzes and the Concepts in the domain. It contains Question ID, Concept ID andDependency Value.
7.2.11 Question Concept New Table
The QC New Table contains the QC’ matrix as described in the Dynamic ConceptMapping Algorithm.
7.2.12 Grade Table
The grade table contains the G-matrix as described in the Dynamic Concept MappingAlgorithm. It contains the following fields:
• Student ID: A Foreign Key from the Student Table.
• Question ID: A foreign Key from the Question Table.
• Concept ID: A foregin Key from the Concept Table specifying the Concept theQuestion is in.

7.2. DESCRIPTION OF TABLES 61
• Value: The Value of the grade, either 0 or 1.
• Previous: The previous value of the grade, either 0 or 1.
• Attempted: a field which tells whether the student has been answering thisparticular question wrong or not.If attempted = 0, the student has either not attempted the question or he hasanswered it correctly.If attempted is not = 0, the student has been answering the question wronglytwo or more times consecutively.
7.2.13 Confidence R to R Table
This table contains the right to right confidence value between a pair of questions asdescribed in the Dynamic Concept Mapping Algorithm.
7.2.14 Confidence W to W Table
This table contains the wrong to wrong confidence value between a pair of questionsas described in the Dynamic Concept Mapping Algorithm.
7.2.15 Ratings Table
The Ratings Table contains the ratings given by students to the concepts in the domain.It contains the fields Student ID, Concept ID and Rating Value.
7.2.16 Q1Q2RightWrong Table
This table contains the total number of students who have answered both Q1 and Q2right + the total number of students who have answered both Q1 and Q2 wrong. Thishelps in the Dynamic Concept Mapping Algorithm.

62 CHAPTER 7. DATABASE

Chapter 8
Future Work and Conclusion
The current system has a lot of scope for improvement. Many of such developmentshave been discussed in the following section :
8.1 Capturing Cognitive Skills
The user modeling techniques that we have implemented can be further enhanced byengaging parameters based on context independent information like personal traitsand cognitive abilities of the user. Niskos Manouselis et al proposed such parameters[36] in context of a European E-Learning Project which can be adapted to suit otherE-Learning environment as well. The classic Honey Mumford Model [37] can be easilyhybridized with the existing model to create a selection model that considers congnitivebehavior of users.
8.2 Automated Concept Mapping
The concept mapping can also be fully automated by mining the data from academicarticles as proposed by Chen, et al [38]. It is based on assumptions that if the distancebetween keywords in a text is less and the frequency of such instances is more, then,the relationship between the keywords is higher. The engine shall mine concepts askeywords from various articles and according to their proximity, assign relations be-tween them. Here, the teacher has no role to play in forming the concept dependencies.However this would require much more computational power.
8.3 Multi Criteria Collaborative Filtering
Currently, the collaborative filtering algorithms implemented in the system works onlyon the overall rating provided by the user in regard to a particular concept. A betterway would be extendeding the algorithm to account for multiple criteria (multipleaspects of a concept like learning material, quiz, relevance to course, etc.) as proposedby Nilashi et al [39]. They also propose Adaptive Neuro-Fuzzy Inference Systems(ANFIS) and Self-Organizing Map (SOM) clustering to improve predictive accuracyof Collaborative filtering. The time and space complexity of the algorithm will varywith the number of criterias used.
63

64 CHAPTER 8. FUTURE WORK AND CONCLUSION
8.4 Sequential Pattern Mining
The collaborative filtering algorithm can also be improved by using it along with se-quential pattern mining [40] to obtain a better result. Sequential Pattern Mininginvolves determining frequent sequences and pruning away cadidate sequence whosesupport is less than the minimal support cut-off. This hybrid approach can also beused in peer to peer to peer learning environment. This technique might work verywell in an e-learning environment where same learning path occurs frequently.
Adaptive E-learning is a powerful tool to challenge illiteracy. It removes the re-quirement for all third party activities like logistics, operational expenses, etc. whichact as bootlenecks for efficient imparting of education. But it is unfortunate that thetechnology’s state in the present time is just above that of an online lecture, where lec-ture videos and assignments are published on the internet and the student can browsethrough it, without any recommendations.

References
[1] K. Chrysafiadi and M. Virvou, “A knowledge representation approach using fuzzycognitive maps for better navigation support in an adaptive learning system,”SpringerPlus, vol. 2, no. 1, 2013.
[2] K. Chrysafiadi and M. Virvou, “Evaluating the integration of fuzzy logic intothe student model of a web-based learning environment,” Expert Systems withApplications, vol. 39, no. 18, pp. 13127 – 13134, 2012.
[3] I. Gazit, “How celery works!.” https://www.slideshare.net/idangazit/
an-introduction-to-celery. Accessed: 10th June, 2014.
[4] J. Bersin, “Spending on Corporate Training Soars: Employee CapabilitiesNow A Priority.” http://www.forbes.com/sites/joshbersin/2014/02/04/
the-recovery-arrives-corporate-training-spend-skyrockets/, 2014. [On-line; accessed 26-June-2014].
[5] L. Freifeld, “Training magazine ranks 2013 top 125 organizations,” Training Mag-azine, 2013.
[6] V. Shute and B. Towle, “Adaptive e-learning,” Educational Psychologist, vol. 38,no. 2, pp. 105–114, 2003.
[7] S.-M. Bai and S.-M. Chen, “Automatically constructing grade membership func-tions of fuzzy rules for students’ evaluation,” Expert Systems with Applications,vol. 35, no. 3, pp. 1408 – 1414, 2008.
[8] S.-M. Chen and P.-J. Sue, “Constructing concept maps for adaptive learningsystems based on data mining techniques,” Expert Systems with Applications,vol. 40, no. 7, pp. 2746 – 2755, 2013.
[9] A. C. Martins, L. Faria, C. V. de Carvalho, and E. Carrapatoso, “User modeling inadaptive hypermedia educational systems,” Educational Technology and Society,vol. 11, no. 1, pp. 194–207, 2008.
[10] S. Graf, S. R. Viola, and T. Leo, “In-depth analysis of the felder-silverman learningstyle dimensions,” Journal of Research on Technology in Education, pp. 79–93,2007.
[11] K. Chrysafiadi and M. Virvou, “Student modeling approaches: A literature reviewfor the last decade,” Expert Systems with Applications, vol. 40, no. 11, pp. 4715– 4729, 2013.
65

66 REFERENCES
[12] T. M. K. Xiaoyuan Su, “A survey of collaborative filtering techniques,” Advancesin Artificial Intelligence, vol. 2009, 2009.
[13] M. Deshpande and G. Karypis, “Item-based top-n recommendation algorithms,”ACM Trans. Inf. Syst., vol. 22, pp. 143–177, Jan. 2004.
[14] Y. Li, Z. Niu, W. Chen, and W. Zhang, “Combining collaborative filtering andsequential pattern mining for recommendation in e-learning environment,” in Ad-vances in Web-Based Learning - ICWL 2011 (H. Leung, E. Popescu, Y. Cao,R. Lau, and W. Nejdl, eds.), vol. 7048 of Lecture Notes in Computer Science,pp. 305–313, Springer Berlin Heidelberg, 2011.
[15] “Collaborative filtering - wikipedia.” http://en.wikipedia.org/wiki/
Collaborative_filtering. Accessed: 1st July, 2014.
[16] M. V. Konstantina Chrysafiadi*, “Persiva: An empirical evaluation method ofa student model of an intelligent e-learning environment for computer program-ming,” Computers & Education, vol. 68, pp. 322–333, 2013.
[17] G. S. Asela Gunawardana, “A survey of accuracy evaluation metrics of recom-mendation tasks,” Journal of Machine Learning Research, vol. 10, pp. 2935–2962,2009.
[18] “Python official website.” https://www.python.org/. Accessed: 25th June,2014.
[19] “Pip official website.” https://pip.pypa.io/en/latest/installing.html. Ac-cessed: 25th June, 2014.
[20] “Set up git.” https://help.github.com/articles/set-up-git. Accessed:28th June, 2014.
[21] “Django official website.” https://www.djangoproject.com/download/. Ac-cessed: 25th June, 2014.
[22] “Django installation guide.” https://docs.djangoproject.com/en/1.6/
intro/install/. Accessed: 28th June, 2014.
[23] “Xampp official website.” https://www.apachefriends.org/index.html. Ac-cessed: 28th June, 2014.
[24] “Celery website.” https://www.celeryproject.org. Accessed: 25th June, 2014.
[25] “Rabbitmq official website.” https://www.rabbitmq.com/. Accessed: 28th June,2014.
[26] “Official celery documentation.” http://docs.celeryproject.org/en/latest/
getting-started/index.html. Accessed: 10th June, 2014.
[27] S. de la Rouviere, “A simple example.” https://github.com/simondlr/
Django-Celery-Rabbitmq-full-example/blob/master/settings.py. Ac-cessed: 10th June, 2014.

REFERENCES 67
[28] “Pycharm official website.” http://www.jetbrains.com/pycharm/. Accessed:30th June, 2014.
[29] “Netbeans official website.” https://netbeans.org/. Accessed: 30th June, 2014.
[30] “Netbeans official installation guide.” https://netbeans.org/community/
releases/73/install.html. Accessed: 30th June, 2014.
[31] “Firebug official website.” https://getfirebug.com/. Accessed: 30th June,2014.
[32] “Sublime text official website.” http://www.sublimetext.com/. Accessed: 1stJuly, 2014.
[33] “Highchart official website.” http://www.highcharts.com/. Accessed: 30thJune, 2014.
[34] “Jquery official website.” http://jquery.com/. Accessed: 30th June, 2014.
[35] “Bootstrap official website.” http://getbootstrap.com/. Accessed: 30th June,2014.
[36] N. Manouselis and D. Sampson, “Dynamic knowledge route selection forpersonalised learning environments using multiple criteria,” in APPLIEDINFORMATICS-PROCEEDINGS-, no. 1, pp. 448–453, UNKNOWN, 2002.
[37] P. Honey and A. Mumford, “The manual of learning styles, 1992,” ISBN 0,vol. 9508444, no. 7, p. 0.
[38] N.-S. Chen, Kinshuk, C.-W. Wei, and H.-J. Chen, “Mining e-learning domainconcept map from academic articles,” Computers and Education, vol. 50, no. 3,pp. 1009 – 1021, 2008.
[39] M. Nilashi, O. bin Ibrahim, and N. Ithnin, “Hybrid recommendation ap-proaches for multi-criteria collaborative filtering,” Expert Systems with Applica-tions, vol. 41, no. 8, pp. 3879 – 3900, 2014.
[40] Y. Hirate and H. Yamana, “Generalized sequential pattern mining with itemintervals,” Journal of computers, vol. 1, no. 3, pp. 51–60, 2006.
Related Documents