UNIVERSITY OF VAASA FACULTY OF TECHNOLOGY DEPARTMENT OF PRODUCTION Serdar ÖZTÜRK MAIN FACTORS OF UNSECCESSFULL AVIATION PROJECTS Master’s Thesis in Industrial Management VAASA 2012

Welcome message from author
This document is posted to help you gain knowledge. Please leave a comment to let me know what you think about it! Share it to your friends and learn new things together.
Transcript
UNIVERSITY OF VAASA
FACULTY OF TECHNOLOGY
DEPARTMENT OF PRODUCTION
Serdar ÖZTÜRK
MAIN FACTORS OF UNSECCESSFULL AVIATION
PROJECTS
Master’s Thesis in
Industrial Management
VAASA 2012
1
Contents LIST OF FIGURES ....................................................................................................................... 3
LIST OF TABLES ......................................................................................................................... 4
ABBREVIATIONS ....................................................................................................................... 4
ABSTRACT: ................................................................................................................................. 5
1. INTRODUCTION ..................................................................................................................... 6
1.1 Purpose of the study ............................................................................................................. 6
1.2 Scope of the study ................................................................................................................ 7
1.3 Research questions ............................................................................................................... 7
1.4 Structure of study ................................................................................................................. 8
2. PROJECT MANAGEMENT ................................................................................................... 11
2.1 Literature Review ............................................................................................................... 11
2.1 History of Project Management .......................................................................................... 11
2.2 Project Management in Today’s World ............................................................................... 13
2.3 Project Definitions ............................................................................................................. 13
2.3.1 Project Managers (PMs) ............................................................................................. 14
2.3.2 The Project Team (PT) ................................................................................................ 15
2.3.3 Project Stakeholders .................................................................................................... 16
2.4 Project Management Steps or Phases .................................................................................. 16
2.4.1 Defining Phase ............................................................................................................ 17
2.4.2 Planning Phase ............................................................................................................ 17
2.4.3 Execution Phase ......................................................................................................... 18
2.4.4 Controlling Phase ........................................................................................................ 18
2.4.5 Closing Phase .............................................................................................................. 19
2.5. Project Structure and Properties ......................................................................................... 19
2.6 Introduction to Aviation Project Management ..................................................................... 21
2.6.1 Quality ........................................................................................................................ 23
2.6.2 Cost ............................................................................................................................. 24
2.6.3 Time ............................................................................................................................ 24
2.4.4 Relationship between Primary Objectives .................................................................... 24
2
3. PERFORMANCE INDICATOR MEASUREMET ............................................................... 26
3.1 Performance Measurement ................................................................................................. 26
3.2 Critical Success Factors for APs ......................................................................................... 29
4. THE CRITICAL FACTOR INDEX (CFI) And THE BALANCE CRITICAL FACTOR
INDEX METHOD (BCFI) ........................................................................................................... 30
4.1 Description of the CFI and BCFI Method ........................................................................... 30
4.2 Calculating CFI and BCFI .................................................................................................. 32
4.3 Interpreting the results ........................................................................................................ 36
5. CASE: AVIATION PROJECT IN TURKISH AERONAUTICAL ASSOCIATION (TAA) .. 37
5.1 About Case Company ......................................................................................................... 37
5.2 Gathering Data ................................................................................................................... 39
5.2.1 Questionnaire .............................................................................................................. 39
5.2.2 Interview ..................................................................................................................... 40
5.3 Executing the Survey.......................................................................................................... 40
6. ANALYSIS OF STUDY RESULTS .................................................................................... 41
6.1 Data Analyzing .................................................................................................................. 41
6.1.1 BCFI Analyzing for Top Managers .............................................................................. 49
6.1.2 BCFI Analyzing for PMs ............................................................................................. 50
6.1.3 BCFI Analyzing for PTMs ........................................................................................... 52
6.2 Case Project and Comparing Another Study ....................................................................... 54
6.2.1 Case Project ................................................................................................................. 55
6.2.2 Brenda Whittaker Study ............................................................................................... 59
7. CONCLUSION .................................................................................................................... 61
RESOURCES .............................................................................................................................. 64
APPENDICES ............................................................................................................................. 66
APPENDIX 1 - SURVEY QUESTIONNARIA ........................................................................ 66
APPENDIX 2 - CASE AVIATION PROJECT (PAINTING PROJECT) PROCESSES ............ 70
APPENDIX 3 – NEW ORGANIZATION CHART .................................................................. 74
3
LIST OF FIGURES Page
Figure 1: Structure of the thesis 10
Figure 2: The active part of a project life cycle 20
Figure 3: Development of three objectives during the last decade’s 22
Figure 4: The triangle of objective (Flouris & Lock 2008) 25
Figure 5: Four Types of Performance Measures 27
Figure 6: Performance measurement framework 28
Figure 7: FCI Method Formulas 33
Figure 8: BFCI Method Formulas 34
Figure 9: Gap index and the Direction of development index 34
Figure 10: BFCI for Overall 46
Figure 11: BCFI values comparison. 48
Figure 12: Expectation and Experience for Top Managers 49
Figure 13: BCFI for Top Managers 50
Figure 14: Expectation and Experience for PMs 51
Figure 15: BCFI for PMs 52
Figure 16: Expectation and Experience for PTMs 53
Figure 17: BCFI for PTMs 54
Figure 18: Painting Project Organization Chart 56
4
LIST OF TABLES Page
Table 1: Model of questionnaire 31
Table 2: Values and meaning of factors 35
Table 3: Attributes and some statistics for all respondents 43
Table 4: Main attributes and their data 44
Table 5: BFCI divided by group (Top manager, APM and PTMs) 47
Table 6: Project activities with man-hour 57
ABBREVIATIONS
AP Aviation Project
APM Aviation Project Manager
APMBOK Association of Project Management Body of knowledge
BFCI Balanced Critical Factor Index
CAA Civil Aviation Authority
CPM Critical Path Method
PERT Program Evaluation and Review Technique
PM Project Manager
PMBOK Project Management Body of Knowledge
PMI Project Management Institute
PTM Project Team Member
TAA Turkish Aeronautical Association
5
UNIVERSITY OF VAASA
Faculty of Technology
Author: Serdar ÖZTÜRK
Topic of the Thesis: Main Factors of Unsuccessful Aviation Projects
Name of the Supervisor: Josu TAKALA
Degree: Master of Science in Economics and Business
Administration
Department: Department of Production
Major Subject: Industrial Management
Year of Entering the University: 2009
Year of Completing the Thesis: 2012 Pages: 74
ABSTRACT: The aim of this dissertation is to understand what aviation projects are and which factors affect their success. In getting more global and competitive world, aviation sector and project managing dramatically change and getting more complex. Because of end-user expectations and competiveness necessitate, aviation projects have to be completed within desired objectives. Thus, this study has been prepared in order to understand how to fulfill project’s necessities and to answer research questions (What are aviation projects and their properties? Which factors affect aviation projects goals? And who thinks what about these factors? And what are the key factors to be successful for aviation projects?).
When this study was prepared; last developments, methods and current aviation projects were considered. In this study, firstly literature and development of project management have been overviewed. Secondly aviation project identifications, components, phases and properties have been determined with previous studies. Thirdly performance indicator concepts and success criteria have been assessed from different aspects. Fourthly, using BCFI methods, case company and compering other studies; aviation projects have deeply analyzed. And the last part of this dissertation has been concluded under previous studies and analysis.
End of this study, it have been reached that depend on project types, properties, attributes and/or factors can affect to aviation project results. Moreover, not only aviation project but also all kind of projects are unique and each of them should be assessed in its own conditions.
KEYWORDS: Aviation projects, projects components, success criteria, reasons for unsuccessful projects, critical factors for projects.
6
1. INTRODUCTION
Aviation industry is one of the most indispensable parts of today’s world that is getting
more global and competitive. In this context, quality and quantities of aviation activities
dramatically increase and turn into the different forms. In parallel with this, aviation
industry and also Aviation Projects (APs) become more complex or more sophisticated.
Increasing human necessities, new inventions, technology and techniques foment
complication of AP management. The main problem is how APs can be managed?
For managing APs, there is no formula or technique to overcome all problems like other
kinds of projects. Nevertheless, if some points or key factors are well known in AP,
managing may be under control, but it does not guarantee that project will successfully get
completed. What factors and which are more effective for project steps and/or project
results, is an essential knowledge to achieve AP problems.
1.1 Purpose of the study
AP management is similar to the other project managements and it may have its own
character because of its priorities like reliability, quality, time, cost and other competitive
conditions. Particularly competitive priority in projects, affects projects’ characteristic
structure. So, competitive priority is one of the most important parts of project structure. In
this context, to achieve project management, all aspects of success criteria must be
analyzed, and then project can be shaped. When companies comprehend and correctly
manage competitive priorities, key factors and their relationships, they can survive in
globalization and competition world.
In this study; competitive priority and key factors concepts and their relationships will be
deeply analyzed. However this study focuses on AP and an aviation company is looked into
as a case study; these concepts can be seen in other project.
7
1.2 Scope of the study
There are many literature studies about project management and aviation industry
respectively and also researchers have used lots kind of methods, techniques and
assessment tools in order to reach their aims. Nevertheless, there are few studies that are
explained project management in general in term; none of them – which can be described
as search gaps – is related to competitive priorities, key factors and their relationships with
each other.
This thesis writes in order to fill this gap and look into AP with different aspects. In other
words, the purpose of this thesis is to comprehend the concepts, which are competitive
priorities, key factors and their relationship, and how their affections are on project results.
Not only how projects are affected will be investigated, but also pitfalls, their results and
how to avoid them will be assessed.
1.3 Research questions
As mentioned above, aim of this study is to discover deficient and development areas in
APs. For that reason, scope has been restricted with project components and APs which do
not reach their aims. So below questions related aviation will be used to analyze
understanding unsuccessful AP’ cause and relationship with factor that affect projects
results.
8
This thesis hereby, will try to find possible answers to the following questions;
• What are the APs and what are their properties?
• Which factors affect APs goals? And who thinks what about these factors?
• What are the key factors to be successful for APs?
1.4 Structure of study
The following chapters represent the structure of this case study and give a short summary
about the content of each section.
1. Introduction:
The introduction section will lead the reader to the topic of project and APs. From there
onto the research problems and objectives as well as the definitions and limitations which
are involved.
2. Literature review:
The literature review concentrates on the three questions as explained in previous section.
As the project management and AP in general are deeply looked into and try to understand
what and which factors affect the project results according to previous studies.
3. Performance indicator measurement
In this section, success and failure will be reviewed and they will be defined with their
properties. And also projects will be analyzed in terms of their success or failure, according
to whom and what.
9
4. The Balance Critical Factor Index Method (BCFI):
In this section all applied methods for investigating the resource allocation process will be
presented. Especially the BCFI methodology will be explained in depth as the method has
been developed further for this research.
5. Case: Turkish Aeronautical Association (TAA)
TAA will be represented in this section, and also which kind of APs have been done and
will be implemented in near future.
6. Discussion and Analysis of Study Results
How data will be collected and which method will be implemented, are explained in this
chapter. Then they will be executed for case company. And finally, results will be analyzed
and discussed.
7. Conclusion
The last part of the thesis, all study will be overviewed and most important parts will be
mentioned. Finally, findings and estimations will be compared from the different
researches. Last of all the study will be finalized with further research proposals
8. Resources and Appendices
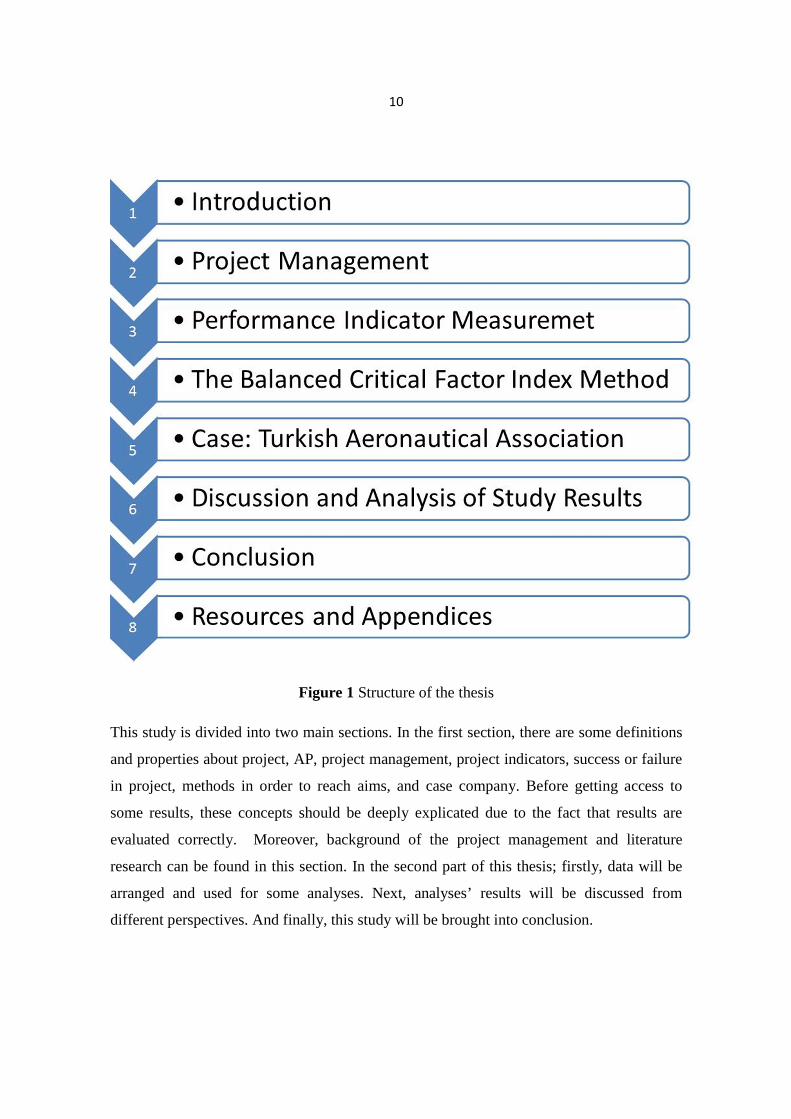
Figure 1 Shows how this study will follow
10
Figure 1 Structure of the thesis
This study is divided into two main sections. In the first section, there are some definitions
and properties about project, AP, project management, project indicators, success or failure
in project, methods in order to reach aims, and case company. Before getting access to
some results, these concepts should be deeply explicated due to the fact that results are
evaluated correctly. Moreover, background of the project management and literature
research can be found in this section. In the second part of this thesis; firstly, data will be
arranged and used for some analyses. Next, analyses’ results will be discussed from
different perspectives. And finally, this study will be brought into conclusion.
11
2. PROJECT MANAGEMENT
2.1 Literature Review
Project management contains a very huge area; therefore, there are lots of literature studies
in project management area. In this study, the scope of project management is restricted in
order to make readers to focus on main reasons of unsuccessful APs. Before going into
details about unsuccessful APs, it is better to overview development of project management
and APs.
2.1 History of Project Management
Like all management disciplines, project management has been firstly used during the
Second World War then it has changed and developed until now. This development has
some mile stones; Critical Path Planning and Network Planning techniques (1950’s and
60’s), planning and tracking integrated time, cost and quality, using integrated
computer systems (1970’s), Matrix Management and training in the role of the PM
(1980’s), The Project Management competencies (1980’s and 90’s), Project Management
Bodies of Knowledge, PMBOK (1980’s), The other PM roles of Sponsor and User
(1990’s), The measurement of project success for each role (1990’s), Management by
Project and its use in the management of change (1990’s), Programme Management and
Project Benefits Management (1990’s and 2000’s), Maturity Modeling (2000 and beyond)
Many scientist, engineer, businessman have contributed to these developments; but none of
them has enriched as Frederick Taylor (1856- 1915) who was an American industrialist and
issued management techniques. He introduced work methods that are designed to increase
worker productivity then he proposed the new methods, the way to obtain productivity was
12
to demand more workers or to have people work harder for longer hours. What he did was
applying a scientific approach in order to figure out the steps in completing a product and
“using money to create added incentive for workers who exceed the “average” level of
production” (Murch, 2001).And his studies were collected in his book, Principles of
Scientific Management (in 1911), and his studies are currently used in industrial areas
Another important figure in project management discipline is Henry Gannt (1861- 1919). It
is believed that Henry Gannt is the father of planning and control techniques in the United
States. “Bar Chart” or “Gannt Chart” which are also used as a project management tool
today made him a famous person. Drawing these charts simplified the process and this fact,
proposed by Gannt formed the basis for many modern management tools. Likewise, it is
accepted that Dr. W. Edwards Deming (1900- 1993) is the father of quality. His studies
related quality has still been used in today world.
The 1950s marked the beginning of the modern project management era in which core
engineering fields came together to work as one. Project management became recognized
as a distinct discipline arising from the management discipline with engineering model
(http://en.wikipedia.org/wiki/Project_management). After this date, Project Managers
(PMs) started to use Gantt Charts and informal techniques, tools in general. Also two
mathematical project scheduling models were developed in these years. One of them is
Program Evaluation and Review Technique (PERT) that was developed as part of the
United States Navy’s Polaris missile submarine program. And second one is Critical Path
Method, CPM that was developed in a joint venture by both DuPont Corporation and
Remington Rand Corporation for managing plant maintenance projects. Commonly, both
technics have been used in many sectors and projects in following times.
Then, in the 1969 the Project Management Institute (PMI), which was established, tried to
improve the development of standards, research, education, publication, networking-
opportunities in local chapters in project management scope and PMI Board of Directors
13
authorized the development of what has become the The Guide to the Project Management
Body of Knowledge containing the standards and guidelines of practice that are widely
used throughout the profession.
In 1981, the PMI Board of Directors authorized the development of what has
become the The Guide to the Project Management Body of Knowledge, ( PMBOK)
containing the standards and guidelines of practice that are widely used throughout the
profession. Then, PMBOK studies have accepted standards of the project management.
2.2 Project Management in Today’s World
In today’s world, project management is much more systematic and system components are
sophisticated. Because, cost, time, and quality are more important to achieve goals. So
today, project management can be a profession, a job and an activity in order to satisfy
shareholder and customer. To understand project management, its components and phases
should be looked into.
2.3 Project Definitions
There are lots kinds of literature studies or researches concerned with project management.
Therefore, from the simplest to complex, many descriptions can be seen in many resources.
For example; a project is a sequence of unique, complex and connected activities that have
one purpose that must be completed with a specific time, within budget and according to
specifications (Wysocki 2000) ; or APMBOK (Association of Project Management body
of knowledge 2006) defines project management as “The process by which projects are
defined, planned, monitored, controlled and delivered such that the agreed benefits are
realized.” as widespread description "a sequence of unique, complex, and connected
14
activities having one goal or purpose and that must be completed within a specific time,
within budget, and according to specification. Likewise, project management can be simply
defined to coordinate organization and manage all factors that may be affect project
purposes. In other words, organization discipline in order to reach specific goals or
proposes. However quite a few descriptions have been derived up till now and some
different type of projects have been encountered.
2.3.1 Project Managers (PMs)
In any organization, there can be many directors or managers who can realize various needs
of a project like; planning, controlling, staff management or budget etc. But, PMs dedicate
to achieving all purpose of project within specific time, quality and cost. In addition, PMs
provide leadership to the Project Team (PT), like that leadership in planning, organizing,
and controlling the work effort to accomplish the project objective. (Gido & Climent 2009),
in addition PMs make that customer, shareholders and PT are satisfied.
PMs have some responsibility for providing leadership in planning, organizing, and
controlling the work effort to accomplish the project objective. Planning is first and maybe
one of the most important responsibilities for PMs. They have to clearly define the project
objective and reach the agreement with the customer on these targets, and then PMs
communicate these targets to PT. And they should update plans after taking the feedback
from PT, shareholders. Second important responsibility is organizing. PMs must decide
which tasks should be done in house and which tasks should be done by subcontractors or
consultants. For tasks that will be carried out in house, the PM gains a commitment from
the specific people who will work on the project. The PM also assigns responsibility and
delegate’s authority to specific individuals or subcontractors for the various tasks, with the
understanding that they will be accountable for the accomplishment of their tasks within the
assigned budget and schedule. For large projects involving many individuals, the PM may
designate leaders for specific groups of tasks (Gido & Climent 2009). And last important
15
responsibility is controlling due to fact that PMs can resolve problems before their situation
worse. PM and PT have to monitor the progress of their assigned tasks and regularly
provide data on progress, schedule, and costs. When one of them goes to wrong direction,
PMs can interfere unexpected event.
To fulfill these responsibilities, PMs have some management skills. However, Murch
indicates that successful PMs were not born like that disregarding; they turn out to be
successful by a combination of experience, time, talent and also training (Murch, 2001).
But, having leadership for PM is the most important tool for all kinds of projects. In this
context, especially APM, project leader gets more important day by day. Integration of
employees with different professional backgrounds very specific qualifications and
approaches are required. This represents another strong indication for the existence of
different professional cultures and the tasks that are organized in projects are frequently of
a key importance for organizations. (Lumpé Marc-Philippe 2008)
2.3.2 The Project Team (PT)
PMs have to cooperate a group of people (PT), who are individuals working
interdependently to achieve the project objective. In the other words, PT is the cooperative
effort by members of a team to achieve project’s targets. PT is vital part of the project
because of the fact that each member of PT makes a different contribution to the project’s
success. Like PMs, all members of PT qualifications (background, experience, motivation
etc.) are essential parts of the project. So PT and PT’s effectiveness are the other keys to
project success. According to Gido & Climent, to achieve project objective, the
development and growth of teams, characteristics of effective PTs and barriers to
effectiveness, team building, valuing team diversity, ethical behavior, sources of conflict
during the project and approaches to handling conflict, problem solving and effective time
management must be improved for PT.
16
2.3.3 Project Stakeholders
Stakeholder can be simply defined as people (customer or client, contractor, investor etc.)
and organization who affect the project results.
The range and nature of stakeholders will vary greatly from one project to another. And
the number of different stakeholder categories for this project would probably extend
to hundreds. Stakeholders can be categorized also according to the degree of interest that
they have in the project (for example, through investment) or how their personal lives
might be affected. Some stakeholders, such as suppliers of equipment and materials,
aggressive local residents’ associations, voluntary, environmental agencies, and the law
enforcement bodies such as police, customs, and immigration, although not directly
working on the project, can have a considerable degree of influence through their statutory
powers. Stakeholders can, therefore, be ranked according to their degree of interest or
influence. The principal investors, statutory bodies, designers, and main contractors would
all be in the first rank, and would be primary stakeholders who are passengers and aircrews
and have less influence on the success or failure of AP. (Flouris & Lock 2008)
2.4 Project Management Steps or Phases
As mentioned in the previous section, every project has its own characteristic due to
changeable components. Thus, there is no formula or technique to overcome all projects.
But, most of the projects have similar phases and properties. To understand project phases
and their properties, might prevent some problems. Hereby, project phases and project
properties are essential to be understood since they constitute main reasons of unsuccessful
projects.
General project management contains five phases. (Defining, planning, execution,
controlling, closing)
17
2.4.1 Defining Phase
In first phase; projects steps, concepts, boundaries (works, workers, equipment’s,
techniques, aims, times, units...etc.) are defined with detail. Especially, PT’s
responsibilities, tasks and their authorizations have to be defined clearly before the next
phase. In addition, definitions have to be coherent with project value dimensions; like such
as time pressure, cost limitation and quality standards.
If the first step is wrong or inadequate, the rest of phases will be wrong. So, PM should not
parry this phase. On contrary, all definitions should be considered from different aspects.
Because, after project start, these definitions tell PM and PTM what should be done and
what should not be done.
2.4.2 Planning Phase
Planning can simply be defined as a project road map. Before any project acts are started,
project plan has to be completed in order to know how the work will be performed. It
exactly tells when a task will start and get completed, who will perform the tasks, what kind
of and how much resources will be used etc. However, PM and/or project planners cannot
know the exact future, they may forecast possible outcomes. The best plan does not mean
to know real outcomes. The aim of the plan is better understanding of project way and
project proposes. Hence project plan must be clear and understandable. In this phase, the
most crucial point is forecast. Because, prediction is always difficult issues. If project
planner make huge mistakes (inadequate tools, wrong data), it triggers that PM follows
wrong path. Moreover, project planner has to update it in every project step, as project
planning should be a dynamic process.
In this phase, another important point is that resources (4M - Man, Materials, Money, and
Machine) have to be assigned to the right place at the right time. If this cannot be
succeeded, resources will be wasted or they will not be enough to complete the tasks. Thus
PM shouldn't underestimate these assignments.
18
2.4.3 Execution Phase
Execution phase is the act time of the project. This phase refers to personnel and PT that
perform as in project plan. PTMs must have enough experience to accomplish their tasks.
Moreover, they must know when their tasks will start and be completed according to the
project plan.
If PM wants all project tasks be accomplished on time with enough quality, s/he should
follow four actions rule. First rule is that PM has to identify 4M (Man, Materials, Money,
and Machine). This is necessary to accomplish all the tasks defined in a project plan.
Second action rule is assignments. Workers have to be assigned to right tasks and at the
right time. When they are assigned, PM has to consider their ability, motivation, experience
and expectations so that good results can be achieved. Likewise, when PM assigns other
resources (money, time, materials...), quantity should be considered. The third action rule is
to stick the plan; especially the starting and closing dates of tasks. PM can change activities
times unless PTM exceeds of time tolerance limits. And last action is to launch. According
to the project plan, tasks are implemented.
2.4.4 Controlling Phase
In this phase, PM tries to understand where the project is and how far the activities are
reached, according to the plan. Controlling tools are the best instruments for a project to
reach its propose. These instruments are like PM’s eyes, ears and other sense organs to
follow or sense the roadmap. PM should focus on controlling phases so as not to stumble in
any project phase. Especially, manager can interfere some critical activities, when they
realize that activities are proceeding in wrong directions. Besides, monitoring system not
only indicates the completed work measure as project plan, but also it helps PM to look
ahead for possible future problems' signs.
19
2.4.5 Closing Phase
PT may think that this phase is not necessary for project, because the fact that phase has
very similar data for future projects. But, it may include essential values and experiences
for the next projects. Especially, in the end of the project report, PM and some PTM write
their ideas and advices in order to help to next projects. When previous or/and similar
projects are analyzed, PM can understand which parts of project are so essential and how
similar problems or situations are prevented and how they are accomplished
2.5. Project Structure and Properties
Project life cycle and project structure should be studied in order to clearly understand
project’s concepts. Any aviation project period or life begins with the authorization of work
on the project. It can be started with signing of customer contract and it can be completed
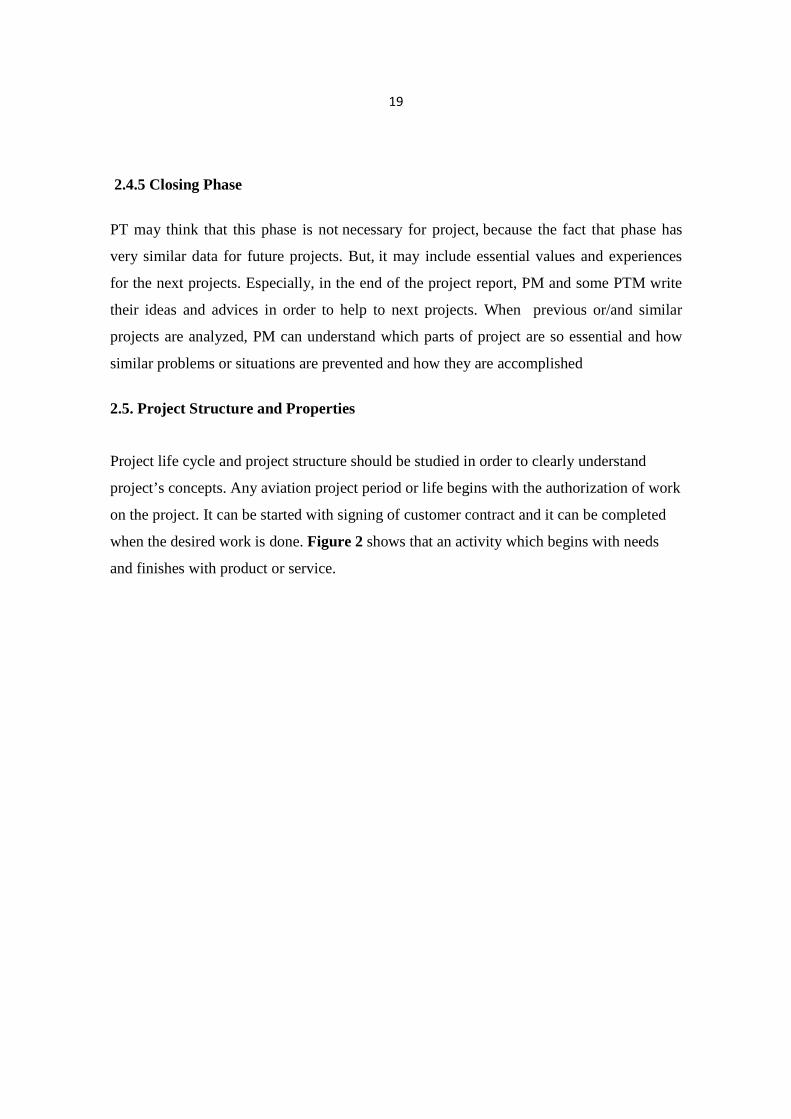
when the desired work is done. Figure 2 shows that an activity which begins with needs
and finishes with product or service.
20
Figure 2 The active part of a project life cycle (Flouris & Lock 2008)
Most of the projects do not exactly fit this figure. Because, some part of them may be
ignored or it may be thought that some of them are needless. For instance, some project
purchasing and fulfillment work can start without any design phase starts or completed.
In order to reach specific points or aims in any type of projects, like civil engineering and
construction project, manufacturing project, IT project and so on forth, there might be many
ways that might not be totally different from each other. Whichever are selected ways or
ways, they have common values and properties.
21
The most important and essential property is that every project is the uniqueness and it does
not repeat. It means that every project has got its own characteristic and can be executed
only one time. Although some projects have the similar processes or targets, and even
some of them resemble the others, each project is unique and can never be repeated. For
instance; car manufacturing for different brands might be seemed as the same work or the
same project, due to similar design, process and the same materials. But every type of car
manufacturing is different and unique. Because, production components, like team, style,
design, location, process time, quality, budget, problems, decisions etc., are different from
others. So it is not possible to re-execute the same process within the same components.
But, only mass production or production process that is one of project processes is not
project due to repetition.
Another important project property is that every project has a specific goal as is mentioned
in definition. According to this goal; organization, plans, usage of source, PTM,
tactics…etc., shape and determine how processes will be implemented. Not only project
goal keeps together the project components and point at where project goes, but also it
helps to determine the project scope, which indicates project restriction area. In addition,
project goal helps appoint exact beginning and ending points for both whole project and
project steps
2.6 Introduction to Aviation Project Management
AP management can be thought that it is a branch of project management with core project
management techniques. Because, principally, all kinds of projects have the same purpose
that is to complete successfully in spite of all risks and difficulties with well prediction,
planning, organization and controlling. Like other projects, APs primary aim is to satisfy
the project sponsor or purchaser within the promised timescale, budged and other resources.
When, deeply APs are looked into, five types of projects can be seen; Civil Engineering
22
and Construction, Manufacturing, IT Projects and Projects Associated with Management
Change, Projects for Pure Scientific Research. Actually, from the smallest private plane to
large wide-bodied passenger airlines, every aviation work (like design, manufacturing,
transporting, navigation service, building, improving, supporting etc.) can be accepted as
APs. If military aviation may be added these project examples, aviation project can gained
different dimension. (Flouris & Lock 2008)
Some factors such as changing customer expectations, time competing, customer service,
globalization of industry, integration of organizations and the use information technology
have affected APM, due to primary objectives. However, in the 60s and the 70s projects’
primary objectives used to be only costs and quantity, today PMs have to take into account
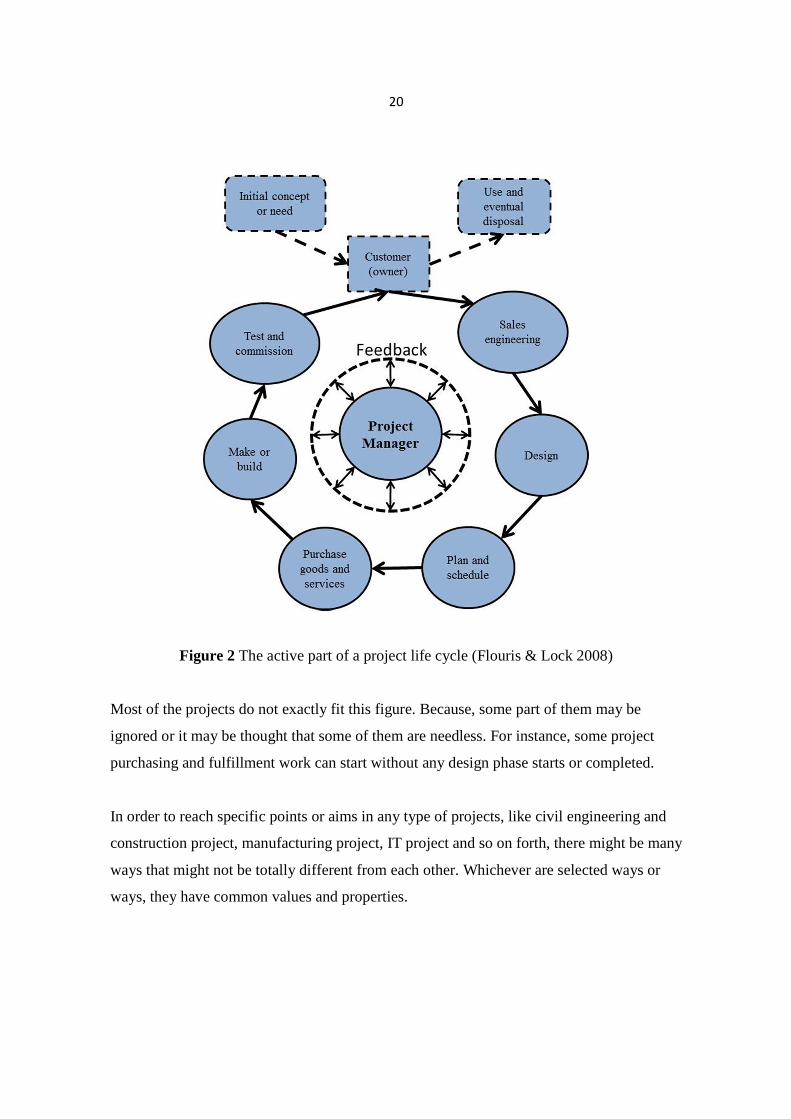
three objectives; cost, time and quality. Figure 3 shows these three objectives’ development
in the last decades. Blue area between center of triangle and two arrows indicates how
much primary objectives used in a project.
Figure 3 Development of three objectives during the last decades (Milling, Peter& Jörn-
Henrik Thun 2000)
23
High capital cost, quality and organizational complexities are slightly different from the
other projects. Especially quality in which there is very small tolerance limit, is the most
important part of APs. And the other important of aviation project difference is that PM
needs to understand special nature of aviation and its properties
Each project has its own special objectives that affect project structure and project life. So,
successfully completing for any aviation project, depends on understanding that the most
primary objects which are quality, performance and cost. Knowing the priority between the
project objectives is not enough. The relationship between these objectives must also be
comprehended.
Before finding failure in any aviation project, it is better to understand project objectives
and their relationships.
2.6.1 Quality
The competitive advantage of a firm depends upon the quality of the goods and services
provided (Grönroos, 1990). So quality will be probably one of the most important
objectives for all projects. At the end of the project all outputs must be in accordance with
the specification and project intends. This may appear different forms in different project.
For example; losing, damaging, sending right place at the right time are some of the quality
indicators for a logistic project. Likewise, quality dimension is vital part of the project for
APs. Actually, quality in APs is almost everything. Inadequate quality in any part of
projects, like equipment, tool, process, person, knowledge…, can cause very huge disaster.
For that reason, except in small tolerance limits, PM does not compromise in any project
step or component.
24
2.6.2 Cost
Cost dimension is another important goal or objective for successful a project, especially,
when project has limited resources. So, the expenditures for activities should be in
accordance with resource plans. According to AP plan or budget plan, cost is controlled in
order to maximize the project profit and to return on the capital investment. Not only,
restraining cost can help to decrease financial risks, but also it can be used for controlling to
projects. Therefore cost dimension is one of the most essential parts of a project.
2.6.3 Time
According to project plan, time objective is to complete the project’s required tasks. All
important steps or phases of project must be executed no later than their specified time. Past
due activities may affect other activities and next projects, which negatively cause sponsors
and stakeholders’ aspects. However, timing is differently perceived in diverse projects, it is
accepted as one of the most important parts of competition in any sector. Especially, in
aviation sector, changing schedule for airline or late deliveries for air cargo means that
project is a failure and rivalry gets lost.
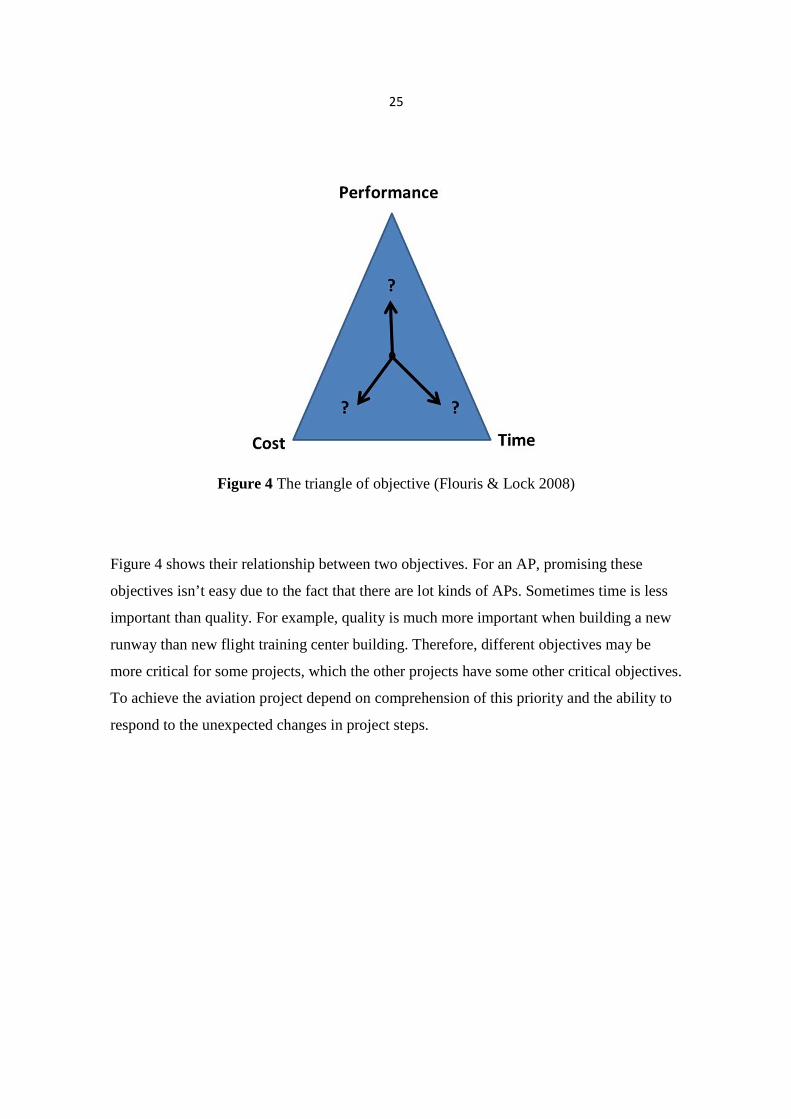
2.4.4 Relationship between Primary Objectives
Today, quality, cost and time are the most important competitive priorities in the any
aviation company. These three objectives are not separated from each other; however each
of them is more important in different APs.
25
Figure 4 The triangle of objective (Flouris & Lock 2008)
Figure 4 shows their relationship between two objectives. For an AP, promising these
objectives isn’t easy due to the fact that there are lot kinds of APs. Sometimes time is less
important than quality. For example, quality is much more important when building a new
runway than new flight training center building. Therefore, different objectives may be
more critical for some projects, which the other projects have some other critical objectives.
To achieve the aviation project depend on comprehension of this priority and the ability to
respond to the unexpected changes in project steps.
26
3. PERFORMANCE INDICATOR MEASUREMET
Success is defined as achieving what you want or intend. Likewise failure (lack of success)
is defined as a lack of success in achieving or doing something (Longman Dictionary). Both
of them are subjective concepts; it means that they can change as person, place, time etc.
These subjective concepts can be seen in APs. Because, in the project there is a complex
interplay between often multiple and conflicting agendas and understanding of technology
success and risks, among diverse decision maker and project stakeholders. These all result
in ambiguity and the equivocality of set project goal, key performance indicators and
project success/failure criteria, which then continue throughout the project life cycle.
Multiple perspectives are always present in all project issue, where gain and loss often
depend on perspective taken by the shareholders in questions. (Smith & Derry, 2012)
3.1 Performance Measurement
Performance measurement is a fundamental building block of project management. Project
management always measures projects steps in order to understand whether they are right
in the direction or not.
According to Parmenter (2010) there are four types of performance measures;
1-Key Result Indicator (KRIs); tells you how you have done in a perspective or critical
success factor
2-Result Indicator (RIs); tells you what you have done
3-Performance Indicator (PIs) tells you what to do. Next
4-KPIs tell you what to do to increase performance dramatically.
27
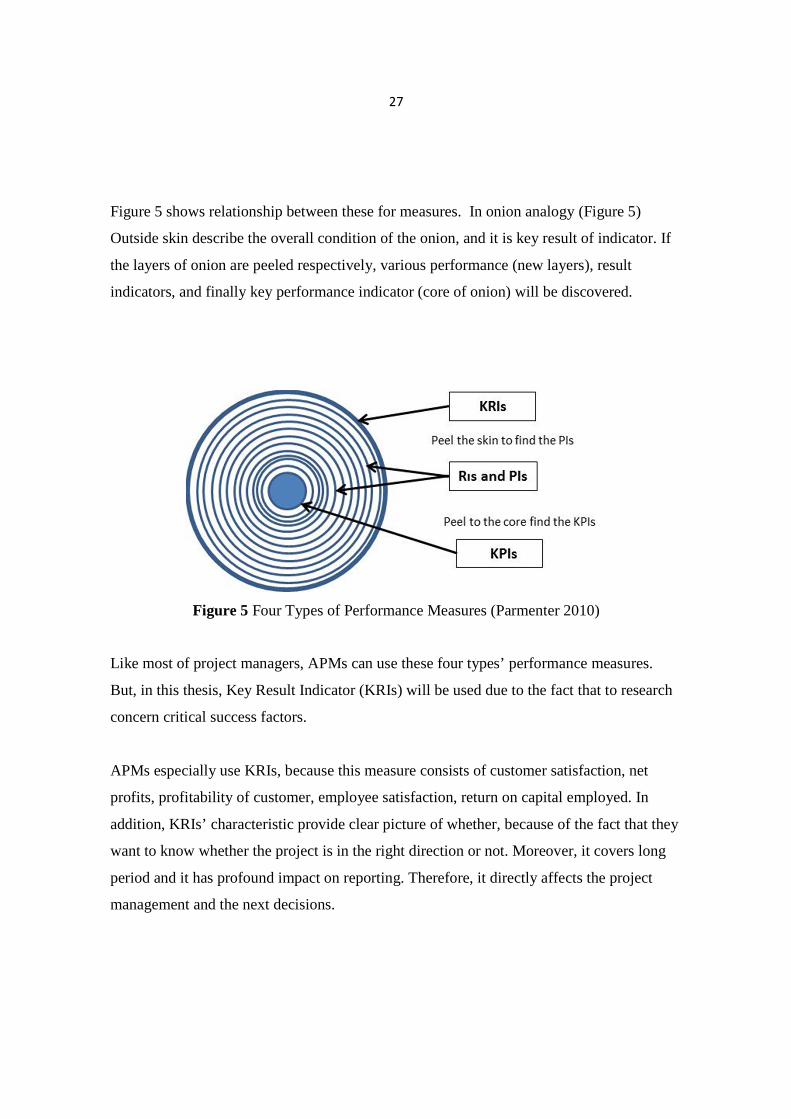
Figure 5 shows relationship between these for measures. In onion analogy (Figure 5)
Outside skin describe the overall condition of the onion, and it is key result of indicator. If
the layers of onion are peeled respectively, various performance (new layers), result
indicators, and finally key performance indicator (core of onion) will be discovered.
Figure 5 Four Types of Performance Measures (Parmenter 2010)
Like most of project managers, APMs can use these four types’ performance measures.
But, in this thesis, Key Result Indicator (KRIs) will be used due to the fact that to research
concern critical success factors.
APMs especially use KRIs, because this measure consists of customer satisfaction, net
profits, profitability of customer, employee satisfaction, return on capital employed. In
addition, KRIs’ characteristic provide clear picture of whether, because of the fact that they
want to know whether the project is in the right direction or not. Moreover, it covers long
period and it has profound impact on reporting. Therefore, it directly affects the project
management and the next decisions.
28
Also, APMs can use others measures. So, a good performance measurement should be
arranged by framework will be focused on the customer and measure the right things.
When PMs draw the performance framework, they will consider project phase goals and
shareholder expectations.
Performance measures must be:
• Meaningful, unambiguous and widely understood
• Owned and managed by the teams within the organization
• Based on a high level of data integrity
• Such that data collection is embedded within the normal procedures
• Able to drive improvement
• Linked to critical goals and key drivers of the organization (Parmenter 2010)
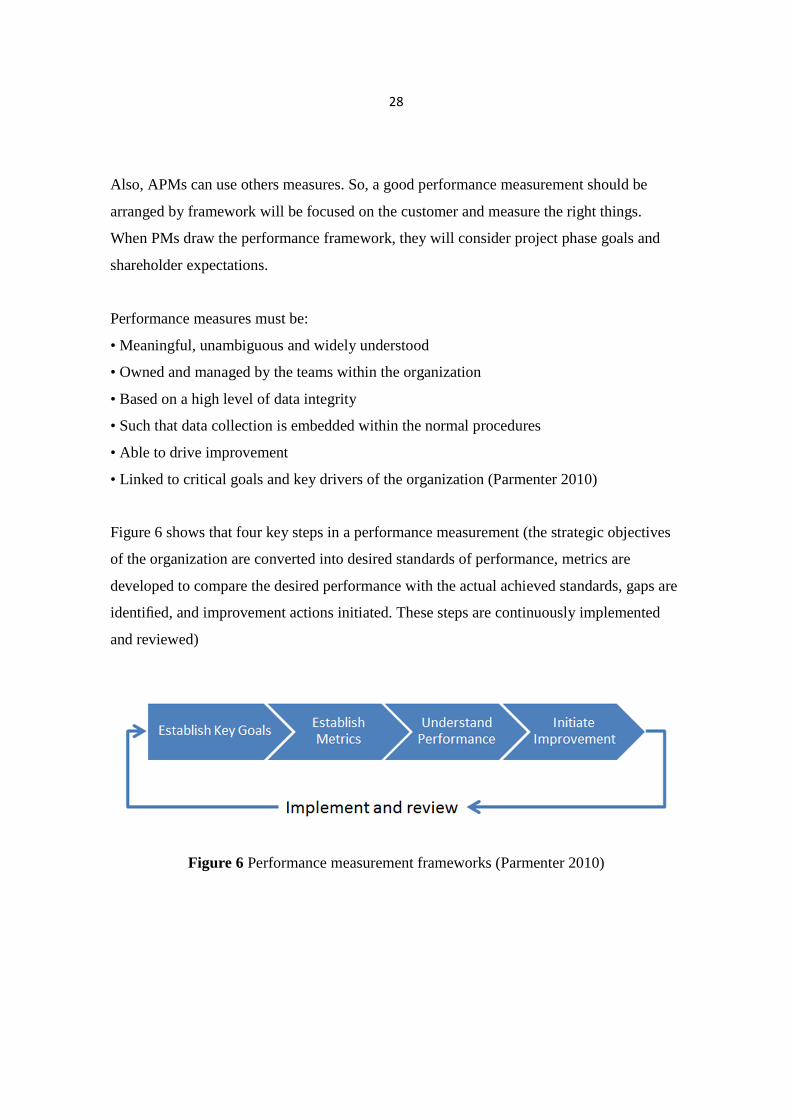
Figure 6 shows that four key steps in a performance measurement (the strategic objectives
of the organization are converted into desired standards of performance, metrics are
developed to compare the desired performance with the actual achieved standards, gaps are
identified, and improvement actions initiated. These steps are continuously implemented
and reviewed)
Figure 6 Performance measurement frameworks (Parmenter 2010)
29
3.2 Critical Success Factors for APs
Generally, success project form the basis of how well three primary objectives that are cost,
quality and time. This acceptation can be said for APs. Because APs can consist of other
projects like; civil engineering, construction, manufacturing, IT, logistics, service,
scientific. So, APMs are judged according to how much customer the satisfaction, good
quality or performance for all phases and completion within the cost budget and on time
which in accordance with the project specification. And for good project management,
three objectives include the following: (Flouris & Lock 2008 pg 5-6)
- Good project definition and a sound business case;
- Appropriate choice of project strategy;
- Strong support for the project and its manager from higher management;
- Availability of sufficient funds and other resources;
- Firm control of changes to the authorized project;
- Technical competence;
- A sound quality culture throughout the organization;
- A suitable organization structure;
- Appropriate regard for the health and safety of everyone connected with the project;
- Good project communications;
- Well motivated staff;
- Quick and fair resolution of conflict.
30
4. THE CRITICAL FACTOR INDEX (CFI) and THE BALANCE CRI TICAL
FACTOR INDEX METHOD (BCFI)
In this part of thesis, it will be illustrated what is BCFI and how data is collected and
analyzed for case study. BCFI, which is modified of CFI (Critical Factor Index) method,
has been approved in terms of logic and functionality by the inventor of the CFI method,
Professor Josu Takala and Professor of statistics at Vaasa University, Dr. Bernd Pape.
Before it is looked over BCFI, it is better to be overviewed CFI.
4.1 Description of the CFI and BCFI Method
CFI is basically a measurement tool used to indicate which attributes which a business
process is critical and which is not, based upon the experience and expectations of the
company’s employees (Ranta & Takala 2007). This method was developed on the basis of
the “Gab analysis and the implementation index” that was invented by Takala. Fast and
reliable method for management purposes to see and respond to customer satisfaction were
focused, when it was developed (Rautiainen & Takala 2003). Aim of this method is to
expose critical within the business process to view in order to gives the management
support to make decisions concerning which attributes. Thus attributes, especially critical
attributes, can be seen and improved.
In this method, data is collected from selected group of managers and experts who have
experience or currently working related study area. The data can be gathered by using a
questionnaire or interviews with this group. Questionnaire includes attributes that take into
account customer’s expectation and experiences, how they see themselves’ positions
against competitors in the market regarding an attribute and how they see an attribute
developing in the future in a given time frame. (Ranta & Takala 2007). In generally
31
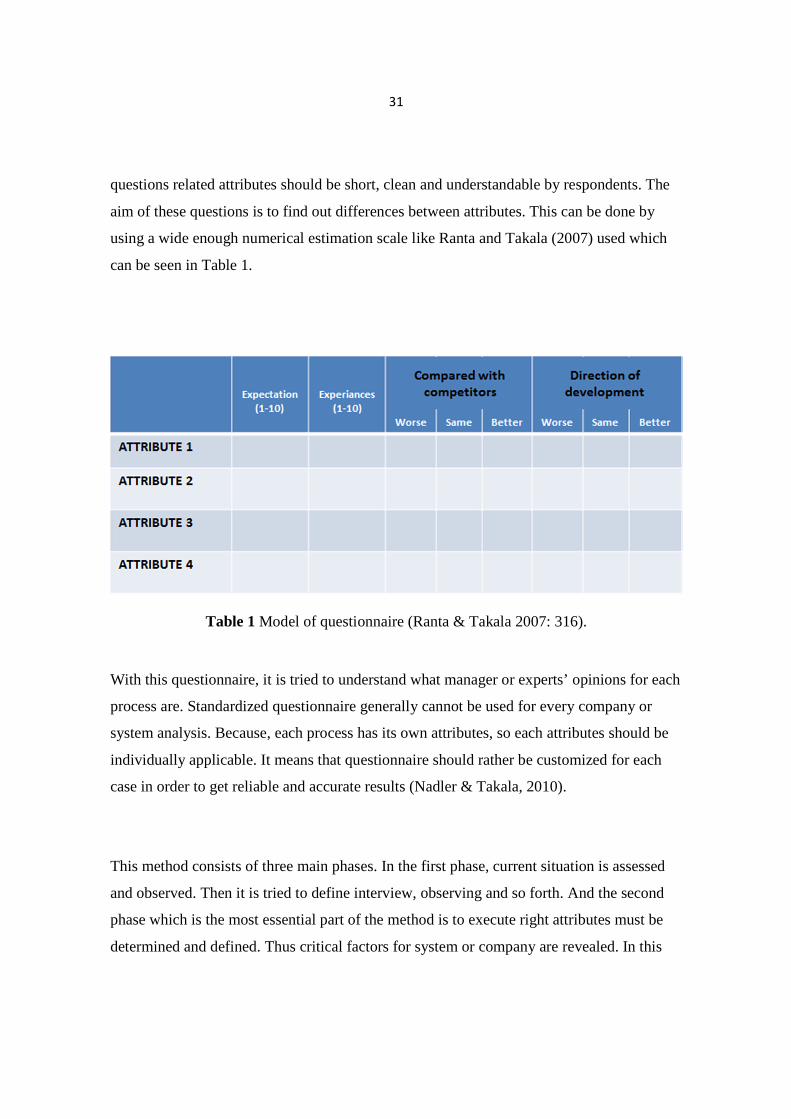
questions related attributes should be short, clean and understandable by respondents. The
aim of these questions is to find out differences between attributes. This can be done by
using a wide enough numerical estimation scale like Ranta and Takala (2007) used which
can be seen in Table 1.
Table 1 Model of questionnaire (Ranta & Takala 2007: 316).
With this questionnaire, it is tried to understand what manager or experts’ opinions for each
process are. Standardized questionnaire generally cannot be used for every company or
system analysis. Because, each process has its own attributes, so each attributes should be
individually applicable. It means that questionnaire should rather be customized for each
case in order to get reliable and accurate results (Nadler & Takala, 2010).
This method consists of three main phases. In the first phase, current situation is assessed
and observed. Then it is tried to define interview, observing and so forth. And the second
phase which is the most essential part of the method is to execute right attributes must be
determined and defined. Thus critical factors for system or company are revealed. In this
32
phase, selected group is interviewed and/or questionnaire is sent to respondents, which is
the most important point for examining the processes. With questionnaire, it is tried to
know respondents’ experiences and expectations about each attribute. When they assess
this questionnaire, they take account of company strategy, vision, mission and values their
responses commonly measure with numerical scale and higher score mean better or positive
thinking. In addition, respondent’s opinion for the past and future development for each
attribute is asked the respondents. They can assess them by choosing three options (worse,
same, better). And the last phase is all information, gathered from interview or
questionnaire, is analyzed by BCFI method.
4.2 Calculating CFI and BCFI
PMs and PTMs are asked to assess each attributes by using expectation and real life
experiences. In addition, they are asked that which attributes will develop within the next
three years and how it has changed last three years. For each attribute evaluation, scale that
was graded from 1 to 10; was used in questionnaire. The relatively wide range makes it
easier to point out inconsistencies between expectations and experiences (Ranta & Takala
2003: 316). The Figure 7 show that all necessary formulas for calculating the CFI.
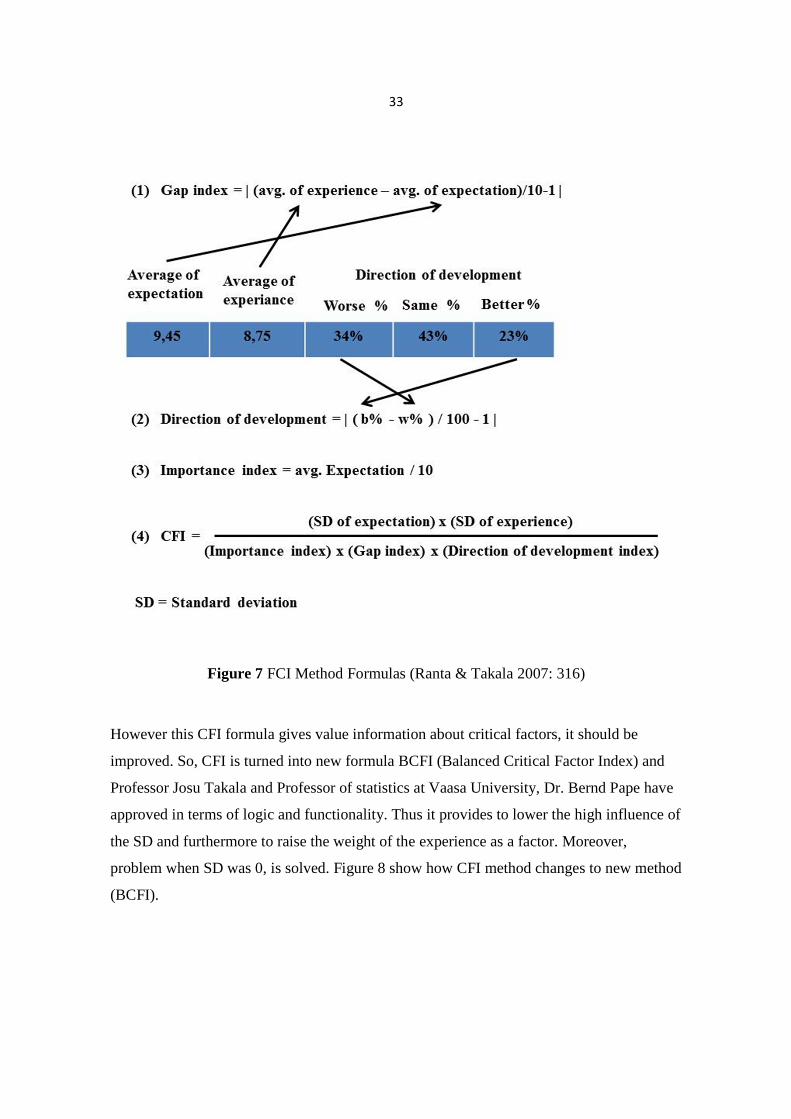
33
Figure 7 FCI Method Formulas (Ranta & Takala 2007: 316)
However this CFI formula gives value information about critical factors, it should be
improved. So, CFI is turned into new formula BCFI (Balanced Critical Factor Index) and
Professor Josu Takala and Professor of statistics at Vaasa University, Dr. Bernd Pape have
approved in terms of logic and functionality. Thus it provides to lower the high influence of
the SD and furthermore to raise the weight of the experience as a factor. Moreover,
problem when SD was 0, is solved. Figure 8 show how CFI method changes to new method
(BCFI).
34
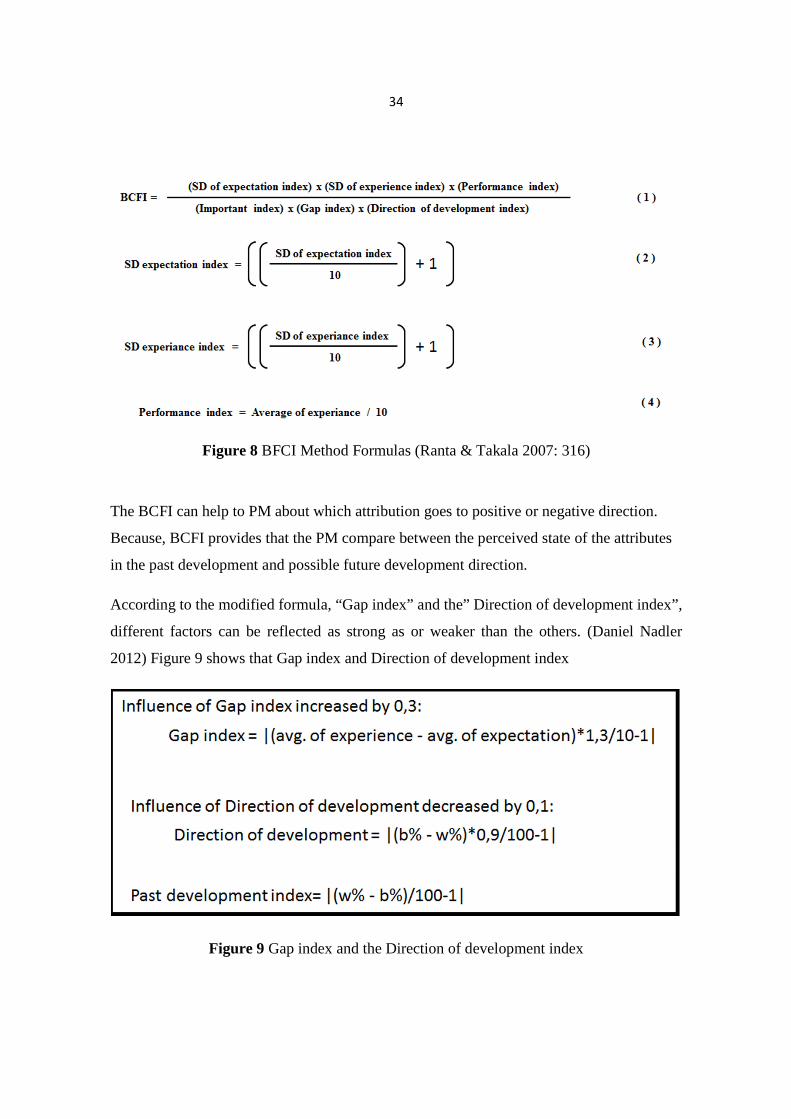
Figure 8 BFCI Method Formulas (Ranta & Takala 2007: 316)
The BCFI can help to PM about which attribution goes to positive or negative direction.
Because, BCFI provides that the PM compare between the perceived state of the attributes
in the past development and possible future development direction.
According to the modified formula, “Gap index” and the” Direction of development index”,
different factors can be reflected as strong as or weaker than the others. (Daniel Nadler
2012) Figure 9 shows that Gap index and Direction of development index
Figure 9 Gap index and the Direction of development index
35
In the BCFI method, the other instrument is “standard deviation” that indicates the
agreements among the respondents. The low value of standard deviation means that most of
respondents agree about the attributes questions. Their answer is very close to each other,
which makes higher attributes reliable. On the other hand, high value standard deviation
means that respondents have different ideas about attribute.
And the last important parts of BCFI method are the “performance and importance index
“and the other one is direction of development. The performance and importance index are
self-explanatory and represent simply the level of performance or expectation of the
attribute. Depending on the expectations and experiences of an attribute of the index, when
respondent’ expectations and experiences have different values, Gap index direction goes to
positive or negative direction. Like Gap index, in the Direction of development,
respondents have the same opinion, “there is no direction”. Whereas they have differences
in their answers, There would be direction; positive or negative. Below Table 2 indicates
that this relationship between standard deviation and indexes that were explained above.
Table 2 Values and meaning of factors. (NADLER, Daniel, 2012)
36
4.3 Interpreting the results
According to the BCFI method, attribute value gets to small value, it might be more critical.
However attribute value indicates that is critical level; it does not mean that value quantity
shows how it is big or small. Also differences between two attribute values do not mean
how much one of them is more critical than the other. This value provides which attribute is
more critical regarding respondents’ opinions.
PM should select a number of the most critical attributes, which depend on project’s critical
level and commonly it is less than 5, and PM focuses on these attributes. If an attribute has
a value significantly greater than other attributes, it can indicate ambiguity about the
attribute. Such attributes should be specified and looked into more carefully for the future
development. (Nadler & Takala, 2010).
37
5. CASE: AVIATION PROJECT IN TURKISH AERONAUTICAL
ASSOCIATION (TAA)
To understand and estimate APs, as above mentioned managing and key factors, case
company was included this study. However it was very difficult to reach aviation
knowledge via company due to competition; it was taken into account of its size (personnel
budget, how many aircraft and branch it has etc.) and which kind of aviation projects
executed when case company was selected.
In addition, in this study, to find answers to the research questions concern critical
attributes for aviation projects, a survey was made within a PMs and PTMs. Because, both
of these groups have much more experience than other personnel. If only one group was
selected, one part of this study would be deficient to understand aviation projects. In
gathering information, not only both groups were selected and questioned, it was asked that
current situation and projects were evaluated in order to reach valid and reliable survey.
The questionnaire is presented in Appendix 1
5.1 About Case Company
Case company, TAA, which was founded in early twentieth century, laid the foundation of
Turkish civil aviation. Before Second World War, aircraft design, manufacture, installation
and maintenance activities were performed and even aircraft sales abroad were realized
until the early 1950s. However, aerial activities and aircraft production were slowed down
by the early 1950s and completely ended in mid-1950s. Case company which stands as the
first civilian, sportive and training aircraft company operates in design, production,
assembly, certification and sales marketing of various air platforms such as sport aircraft,
unmanned aerial vehicles, training, electric and engine aircraft.
38
Now case company is continuing civil activities like aviation maintenance structure which
carries out the maintenance, fault-relieving, modernization, technical publications and
quality activities and also provides logistics and supply support to the air vehicles that are
not only in its own inventory, but also in the inventories of independent aviation
organizations and performs the training and licensing of both its own staff and the staff of
other organizations with its high-level technical infrastructure combined with the aircraft
avionics – mechanical system maintenance capabilities.
In addition Flight School, Aerial Fire Fighting (case company has the biggest private
firefighting fleet in Europe with more than twenty aircrafts and has extinguished over 2000
fires in Israel, Italy, Middle East and the European countries, besides Turkey) Agricultural
Spraying, Air Vaccination, Air Taxi / Cargo / Ambulance (company provide Safe and
comfortable transportation to the desired location at any time with three aircrafts and
twelve experienced pilots and it is the authorized enterprise in Turkey owning international
standards in the field of operating Ambulance Aircraft with its qualified medical teams),
Private Flight Organization, Airport Handling and Ground Services, Aerial Photographing
and Filming, Courses: Skydiving/Parachute, Jumping, Microlight, Balloon, Sportive and
Amateur Aircraft Sale, Cappadocia Balloon Tours, Aero Model Sale and aircraft painting
TAA manages all aviation projects with more than one hundred aircrafts, about one
thousand experienced people and owns 4 training centers, one of which is approximately
1.600 acres of land. Moreover case company with its own university; aim to develop its
vision that is to adapt aviation to Turkish youth as a way of life and to serve Turkish People
effectively in the field of aviation.
39
5.2 Gathering Data
Project management is a very broad concept in order to collect all data, and also other data
that is come different discipline should be added, for looking into different angles.
However, AP management seems a part of project management, aviation and AP
management consist both project management and aviation technics. So, in this section, we
will analyze aviation project within case company that is the biggest company or
association in Turkey using BCFI. For that reason, PM and PTMs were sent survey and top
managers were interviewed.
5.2.1 Questionnaire
In the survey, the first important part was to create the questionnaire which should be easy
and understandable from responses. When this questionnaire was prepared, it was thought
whether questions reflect process attributes. Moreover it was considered that questions
contain aviation terms and all respondent use the same language.
This questionnaire is separated nine main sections; project sponsor, project cost, plan,
personnel, budget & controlling, knowledge& technology management, process work &
flows, organizational systems and information. Thus, respondent opinions will be analyzed
within different categories which are 42 project components in total. And when
respondents assessed these attributes, they used their experience and expectations. And the
last part of questionnaire is about respondent experience, which helps to know which
positions and how many years they had worked in an AP.
40
5.2.2 Interview
Three top managers accepted to interview when they filled the given questionnaire.
However, mainly they answered questions in the questionnaire, they commented AP and
case company role in aviation sector and in Turkey. When it was taken account of their
experience (at least 40 years work experience and 25 years manage AP experience), it can
be seen they have a great command of aviation industry. And of the conclusion section,
their opinion with experience year will be compared to the other respondents.
5.3 Executing the Survey
The reviewed survey was sent to groups of respondents who have experience in AP, or
questions were asked one by one in interviews. Before respondents answered the questions,
it had explicated why this survey was prepared and where it would be used. Moreover, for
its reliability, respondents were asked not to write name or section on survey. Then
questionnaire was described how it should be filled. There was an option of not answering
the questions when respondents were not sure about the situation. Total 87 employees or
respondents, who are work in different departments or different branches of case the
company, received survey with a one month reply time. At this time, 18 respondents, 5
whom are PMs, answered questions in a short time and three top managers were
interviewed by using survey.
41
6. ANALYSIS OF STUDY RESULTS
Under this chapter, results from this study are presented from all aspects. However, major
results and the development needs will be pointed out in the conclusion section, in this
section lies the groundwork for answering research questions. Initially, according to the
surveyed employees ‘opinions about their future expectations and experiences, AP will be
tried to understood by using table that is summary of averages and standard deviations for
the questioned future expectations and experience. In addition, the direction of
development for the next three years and the past three years will be analyzed from that
table. Then the results that can be seen as whole respondents and/or separately broken
down based on the employee level like PM, PTM and top managers, will be shown as they
processed with the BCFI method. At the end of this section, a summary of the results will
be presented.
6.1 Data Analyzing
As it was mentioned before, the purpose of this analysis is to find competitive priorities and
key factors to be successful for APs. The philosophy is that person, who is working on task,
knows the best about the job, which base on questionnaire. Therefore, top managers, PMs
and PTM were selected for questionnaire. However, three different groups may have
different backgrounds, beliefs, experiences and characters, they have to work together and
they have the same aim on APM. Thus, more different opinions and point of views were
shown regarding the project’s performance. At the same time, it provides an opportunity to
compare the responses of different groups and clarify what is more critical and important
exactly for them. Before each group analysis, it is better to have a general opinion for the
person who is directly in the project processes.
42
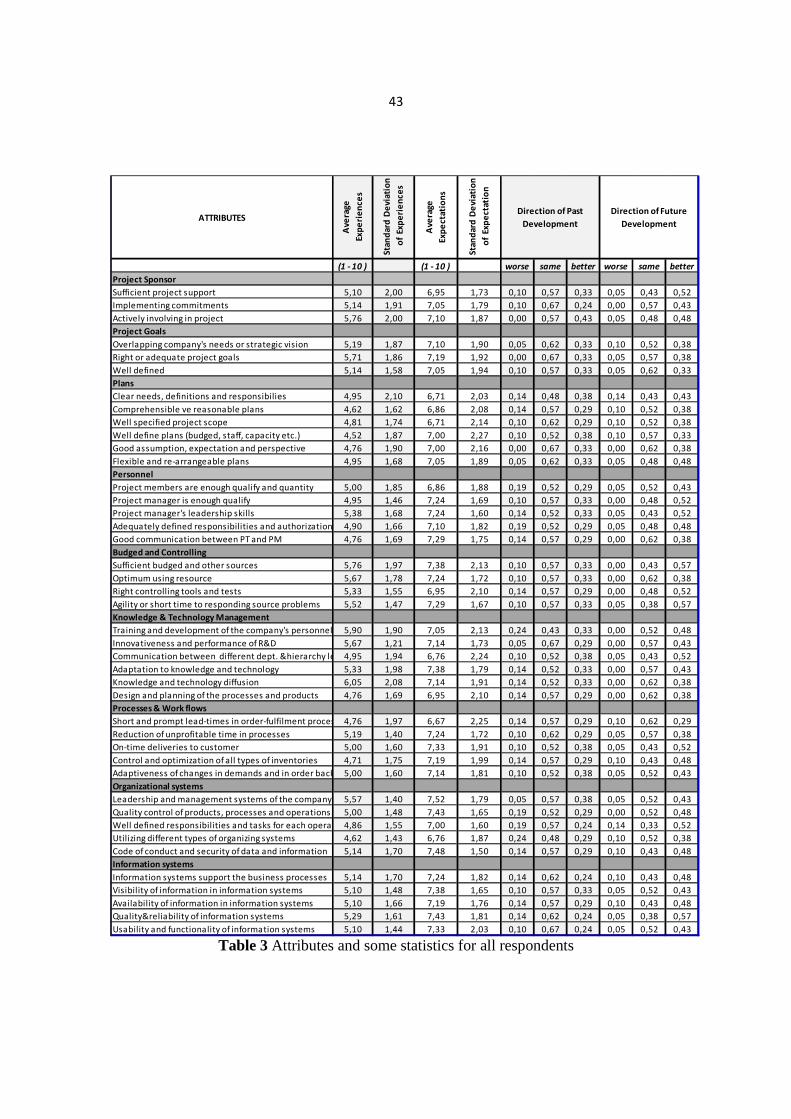
Table 3 shows AP attributes or components and some statistical data about these group
opinions. According to table, experience level is less than expectation for each attribute,
which indicates that almost all people have higher expectation for AP. Especially
“Organizational System” and “Information System” have quite differences between
expectation and experience, which can be easily seen in table 3. (Max. dissidence on “Good
communication between PT and PM” and Min. dissidence on “Knowledge and technology
diffusion” .In addition fluctuations in expectation are more distinctive. In the other words,
people working in the project have different level expectation.
And also, according to the general idea about past development, everyone agrees on
“Actively involving in the project” and “Good assumption, expectation and perspective”,
they believe that both attributes are absolutely better than the past. And most of them (%43)
believe that “Actively involving in a project” has improved for three years. Likewise, they
have hopes about AP future. So that they believe that twelve attributes in forty attribute will
never be bad, moreover more than half people think ten attributes will be better in future.
Table 3 also gives us an idea about which attribute is more critical for the respondents.
43
Table 3 Attributes and some statistics for all respondents
ATTRIBUTES
Ave
rag
e
Ex
pe
rie
nce
s
Sta
nd
ard
De
via
tio
n
of
Exp
eri
en
ce
s
Ave
rag
e
Exp
ecta
tio
ns
Sta
nd
ard
De
via
tio
n
of
Exp
ecta
tio
n
(1 - 10 ) (1 - 10 ) worse same better worse same better
Project Sponsor
Sufficient project support 5,10 2,00 6,95 1,73 0,10 0,57 0,33 0,05 0,43 0,52
Implementing commitments 5,14 1,91 7,05 1,79 0,10 0,67 0,24 0,00 0,57 0,43
Actively involving in project 5,76 2,00 7,10 1,87 0,00 0,57 0,43 0,05 0,48 0,48
Project Goals
Overlapping company's needs or strategic vision 5,19 1,87 7,10 1,90 0,05 0,62 0,33 0,10 0,52 0,38
Right or adequate project goals 5,71 1,86 7,19 1,92 0,00 0,67 0,33 0,05 0,57 0,38
Well defined 5,14 1,58 7,05 1,94 0,10 0,57 0,33 0,05 0,62 0,33
Plans
Clear needs, definitions and responsibilies 4,95 2,10 6,71 2,03 0,14 0,48 0,38 0,14 0,43 0,43
Comprehensible ve reasonable plans 4,62 1,62 6,86 2,08 0,14 0,57 0,29 0,10 0,52 0,38
Well specified project scope 4,81 1,74 6,71 2,14 0,10 0,62 0,29 0,10 0,52 0,38
Well define plans (budged, staff, capacity etc.) 4,52 1,87 7,00 2,27 0,10 0,52 0,38 0,10 0,57 0,33
Good assumption, expectation and perspective 4,76 1,90 7,00 2,16 0,00 0,67 0,33 0,00 0,62 0,38
Flexible and re-arrangeable plans 4,95 1,68 7,05 1,89 0,05 0,62 0,33 0,05 0,48 0,48
Personnel
Project members are enough qualify and quantity 5,00 1,85 6,86 1,88 0,19 0,52 0,29 0,05 0,52 0,43
Project manager is enough qualify 4,95 1,46 7,24 1,69 0,10 0,57 0,33 0,00 0,48 0,52
Project manager's leadership skills 5,38 1,68 7,24 1,60 0,14 0,52 0,33 0,05 0,43 0,52
Adequately defined responsibilities and authorization 4,90 1,66 7,10 1,82 0,19 0,52 0,29 0,05 0,48 0,48
Good communication between PT and PM 4,76 1,69 7,29 1,75 0,14 0,57 0,29 0,00 0,62 0,38
Budged and Controlling
Sufficient budged and other sources 5,76 1,97 7,38 2,13 0,10 0,57 0,33 0,00 0,43 0,57
Optimum using resource 5,67 1,78 7,24 1,72 0,10 0,57 0,33 0,00 0,62 0,38
Right controlling tools and tests 5,33 1,55 6,95 2,10 0,14 0,57 0,29 0,00 0,48 0,52
Agility or short time to responding source problems 5,52 1,47 7,29 1,67 0,10 0,57 0,33 0,05 0,38 0,57
Knowledge & Technology Management
Training and development of the company's personnel 5,90 1,90 7,05 2,13 0,24 0,43 0,33 0,00 0,52 0,48
Innovativeness and performance of R&D 5,67 1,21 7,14 1,73 0,05 0,67 0,29 0,00 0,57 0,43
Communication between different dept. &hierarchy levels4,95 1,94 6,76 2,24 0,10 0,52 0,38 0,05 0,43 0,52
Adaptation to knowledge and technology 5,33 1,98 7,38 1,79 0,14 0,52 0,33 0,00 0,57 0,43
Knowledge and technology diffusion 6,05 2,08 7,14 1,91 0,14 0,52 0,33 0,00 0,62 0,38
Design and planning of the processes and products 4,76 1,69 6,95 2,10 0,14 0,57 0,29 0,00 0,62 0,38
Processes & Work flows
Short and prompt lead-times in order-fulfilment process 4,76 1,97 6,67 2,25 0,14 0,57 0,29 0,10 0,62 0,29
Reduction of unprofitable time in processes 5,19 1,40 7,24 1,72 0,10 0,62 0,29 0,05 0,57 0,38
On-time deliveries to customer 5,00 1,60 7,33 1,91 0,10 0,52 0,38 0,05 0,43 0,52
Control and optimization of all types of inventories 4,71 1,75 7,19 1,99 0,14 0,57 0,29 0,10 0,43 0,48
Adaptiveness of changes in demands and in order backlog5,00 1,60 7,14 1,81 0,10 0,52 0,38 0,05 0,52 0,43
Organizational systems
Leadership and management systems of the company 5,57 1,40 7,52 1,79 0,05 0,57 0,38 0,05 0,52 0,43
Quality control of products, processes and operations 5,00 1,48 7,43 1,65 0,19 0,52 0,29 0,00 0,52 0,48
Well defined responsibilities and tasks for each operation4,86 1,55 7,00 1,60 0,19 0,57 0,24 0,14 0,33 0,52
Utilizing different types of organizing systems 4,62 1,43 6,76 1,87 0,24 0,48 0,29 0,10 0,52 0,38
Code of conduct and security of data and information 5,14 1,70 7,48 1,50 0,14 0,57 0,29 0,10 0,43 0,48
Information systems
Information systems support the business processes 5,14 1,70 7,24 1,82 0,14 0,62 0,24 0,10 0,43 0,48
Visibility of information in information systems 5,10 1,48 7,38 1,65 0,10 0,57 0,33 0,05 0,52 0,43
Availability of information in information systems 5,10 1,66 7,19 1,76 0,14 0,57 0,29 0,10 0,43 0,48
Quality&reliability of information systems 5,29 1,61 7,43 1,81 0,14 0,62 0,24 0,05 0,38 0,57
Usability and functionality of information systems 5,10 1,44 7,33 2,03 0,10 0,67 0,24 0,05 0,52 0,43
Direction of Past
Development
Direction of Future
Development
44
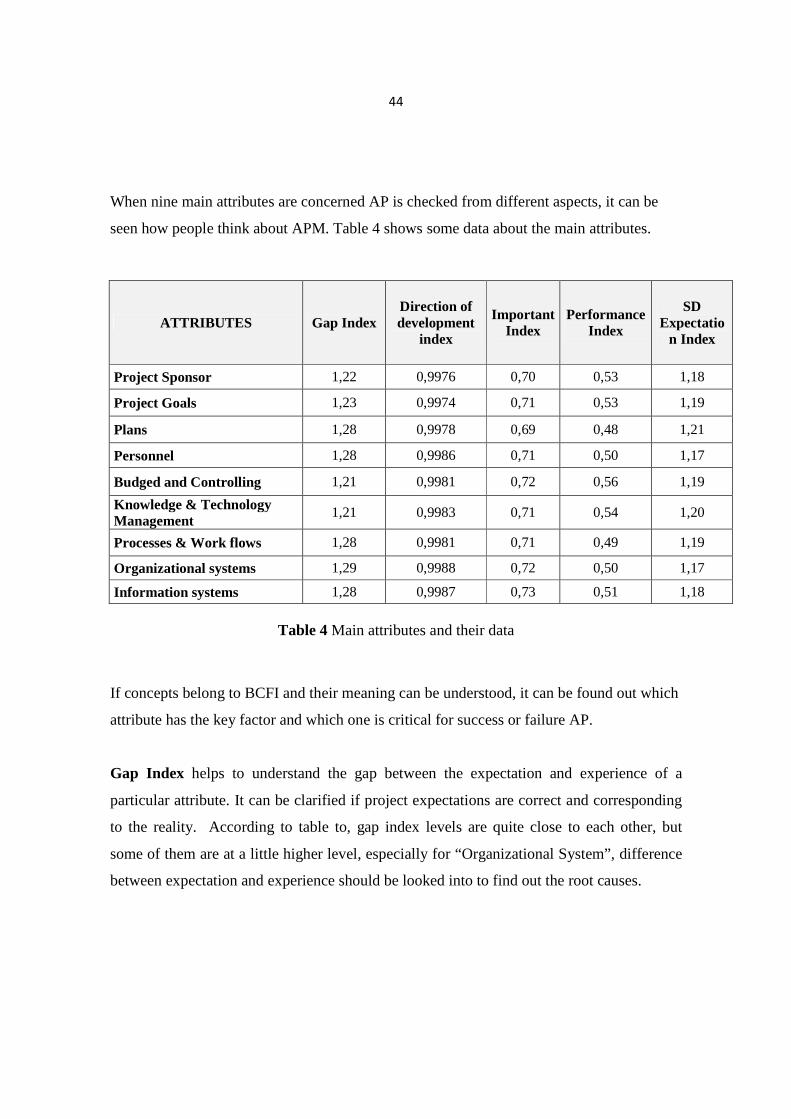
When nine main attributes are concerned AP is checked from different aspects, it can be
seen how people think about APM. Table 4 shows some data about the main attributes.
ATTRIBUTES Gap Index Direction of development
index
Important Index
Performance Index
SD Expectatio
n Index
Project Sponsor 1,22 0,9976 0,70 0,53 1,18
Project Goals 1,23 0,9974 0,71 0,53 1,19
Plans 1,28 0,9978 0,69 0,48 1,21
Personnel 1,28 0,9986 0,71 0,50 1,17
Budged and Controlling 1,21 0,9981 0,72 0,56 1,19
Knowledge & Technology Management
1,21 0,9983 0,71 0,54 1,20
Processes & Work flows 1,28 0,9981 0,71 0,49 1,19
Organizational systems 1,29 0,9988 0,72 0,50 1,17
Information systems 1,28 0,9987 0,73 0,51 1,18
Table 4 Main attributes and their data
If concepts belong to BCFI and their meaning can be understood, it can be found out which
attribute has the key factor and which one is critical for success or failure AP.
Gap Index helps to understand the gap between the expectation and experience of a
particular attribute. It can be clarified if project expectations are correct and corresponding
to the reality. According to table to, gap index levels are quite close to each other, but
some of them are at a little higher level, especially for “Organizational System”, difference
between expectation and experience should be looked into to find out the root causes.
45
Direction of Development Index demonstrates the actual positive or negative changes of
an attribute’s performance. The index provides us with the information about the actual
direction of the project’s development. For this questionnaire, almost all attributes have the
same level and it means that all project components go to a better position. So, respondents
believe that their works will be better than the previous. The more direction of the
development level closes the two, the more it will be critical. For this time, all attributes are
not different critical level from direction of development aspect.
Importance Index demonstrates the level of importance of an attribute among the others.
The index reflects the actual expectations of the company regarding an attribute. Anyhow,
the expectation may not correspond to the experience. “Information systems” are slightly
bigger than the others. It means that the project workers’ expectations for the information
system are higher, so APM should try to understand why it is high level.
Performance Index reflects the value of an attribute’s performance based on the actual
experience of the respondents. As a result we can see either an attribute has performed well
or not and make the conclusion about the attribute importance. Like importance index, if
performance index level increase, attribute’s value will be higher. Because this indicator
shows how project components perform. As data in Table 4, attributes about Budged and
Controlling have better performance.
SD Expectation Index indicates the fact if the respondents have similar or controversial
meaning regarding all the attributes’ expectations, when Table 4 is checked, it can be seen
that all values are very close. So it may be ignored in this index.
46
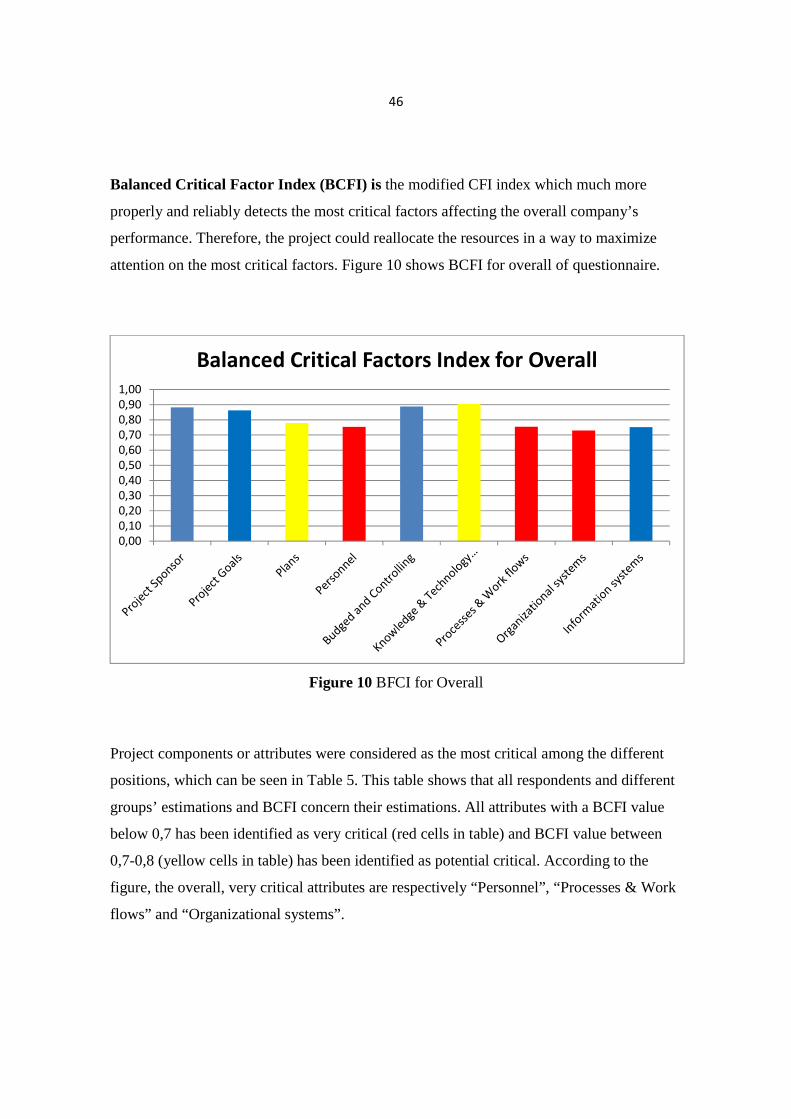
Balanced Critical Factor Index (BCFI) is the modified CFI index which much more
properly and reliably detects the most critical factors affecting the overall company’s
performance. Therefore, the project could reallocate the resources in a way to maximize
attention on the most critical factors. Figure 10 shows BCFI for overall of questionnaire.
Figure 10 BFCI for Overall
Project components or attributes were considered as the most critical among the different
positions, which can be seen in Table 5. This table shows that all respondents and different
groups’ estimations and BCFI concern their estimations. All attributes with a BCFI value
below 0,7 has been identified as very critical (red cells in table) and BCFI value between
0,7-0,8 (yellow cells in table) has been identified as potential critical. According to the
figure, the overall, very critical attributes are respectively “Personnel”, “Processes & Work
flows” and “Organizational systems”.
0,00
0,10
0,20
0,30
0,40
0,50
0,60
0,70
0,80
0,90
1,00
Balanced Critical Factors Index for Overall
47
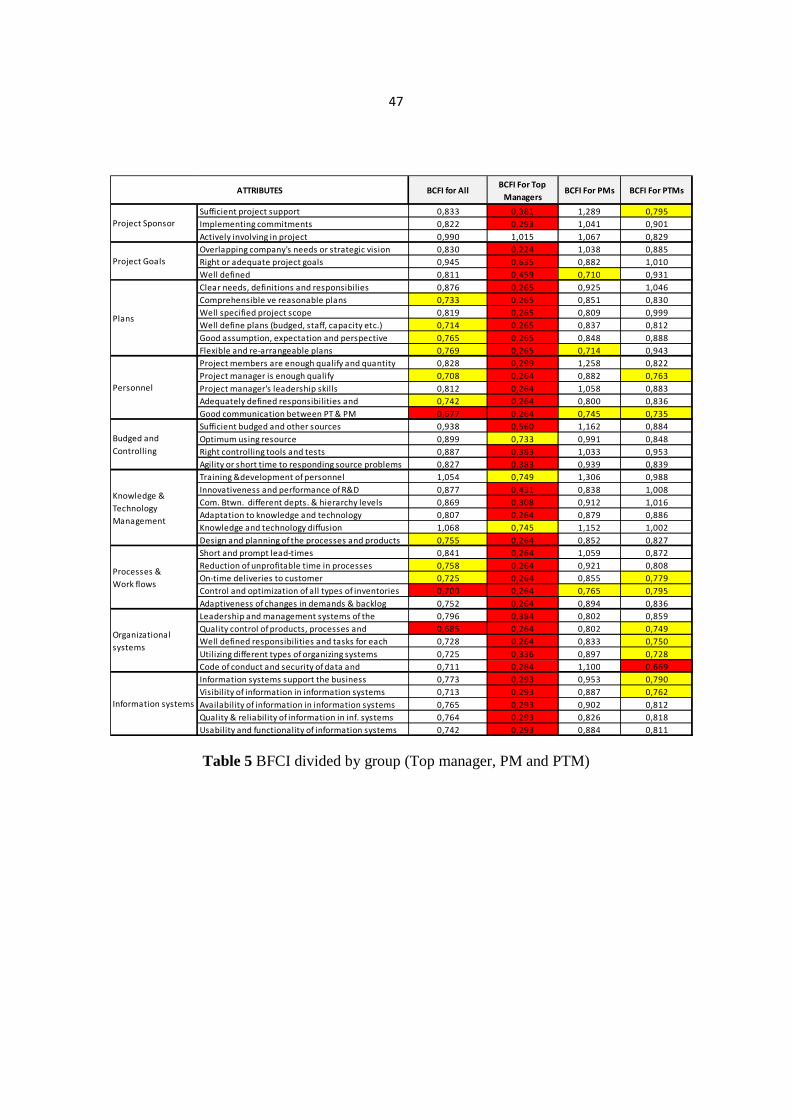
Table 5 BFCI divided by group (Top manager, PM and PTM)
BCFI for AllBCFI For Top
ManagersBCFI For PMs BCFI For PTMs
Sufficient project support 0,833 0,381 1,289 0,795
Implementing commitments 0,822 0,293 1,041 0,901
Actively involving in project 0,990 1,015 1,067 0,829
Overlapping company's needs or strategic vision 0,830 0,224 1,038 0,885
Right or adequate project goals 0,945 0,635 0,882 1,010
Well defined 0,811 0,459 0,710 0,931
Clear needs, definitions and responsibilies 0,876 0,265 0,925 1,046
Comprehensible ve reasonable plans 0,733 0,265 0,851 0,830
Well specified project scope 0,819 0,265 0,809 0,999
Well define plans (budged, staff, capacity etc.) 0,714 0,265 0,837 0,812
Good assumption, expectation and perspective 0,765 0,265 0,848 0,888
Flexible and re-arrangeable plans 0,769 0,265 0,714 0,943
Project members are enough qualify and quantity 0,828 0,299 1,258 0,822
Project manager is enough qualify 0,708 0,264 0,882 0,763
Project manager's leadership skills 0,812 0,264 1,058 0,883
Adequately defined responsibilities and 0,742 0,264 0,800 0,836
Good communication between PT & PM 0,677 0,264 0,745 0,735
Sufficient budged and other sources 0,938 0,560 1,162 0,884
Optimum using resource 0,899 0,733 0,991 0,848
Right controlling tools and tests 0,887 0,383 1,033 0,953
Agility or short time to responding source problems 0,827 0,383 0,939 0,839
Training &development of personnel 1,054 0,749 1,306 0,988
Innovativeness and performance of R&D 0,877 0,431 0,838 1,008
Com. Btwn. different depts. & hierarchy levels 0,869 0,308 0,912 1,016
Adaptation to knowledge and technology 0,807 0,264 0,879 0,886
Knowledge and technology diffusion 1,068 0,745 1,152 1,002
Design and planning of the processes and products 0,755 0,264 0,852 0,827
Short and prompt lead-times 0,841 0,264 1,059 0,872
Reduction of unprofitable time in processes 0,758 0,264 0,921 0,808
On-time deliveries to customer 0,725 0,264 0,855 0,779
Control and optimization of all types of inventories 0,700 0,264 0,765 0,795
Adaptiveness of changes in demands & backlog 0,752 0,264 0,894 0,836
Leadership and management systems of the 0,796 0,384 0,802 0,859
Quality control of products, processes and 0,685 0,264 0,802 0,749
Well defined responsibilities and tasks for each 0,728 0,264 0,833 0,750
Utilizing different types of organizing systems 0,725 0,336 0,897 0,728
Code of conduct and security of data and 0,711 0,264 1,100 0,669
Information systems support the business 0,773 0,293 0,953 0,790
Visibility of information in information systems 0,713 0,293 0,887 0,762
Availability of information in information systems 0,765 0,293 0,902 0,812
Quality & reliability of information in inf. systems 0,764 0,293 0,826 0,818
Usability and functionality of information systems 0,742 0,293 0,884 0,811
ATTRIBUTES
Project Sponsor
Project Goals
Plans
Personnel
Budged and
Controlling
Knowledge &
Technology
Management
Processes &
Work flows
Organizational
systems
Information systems
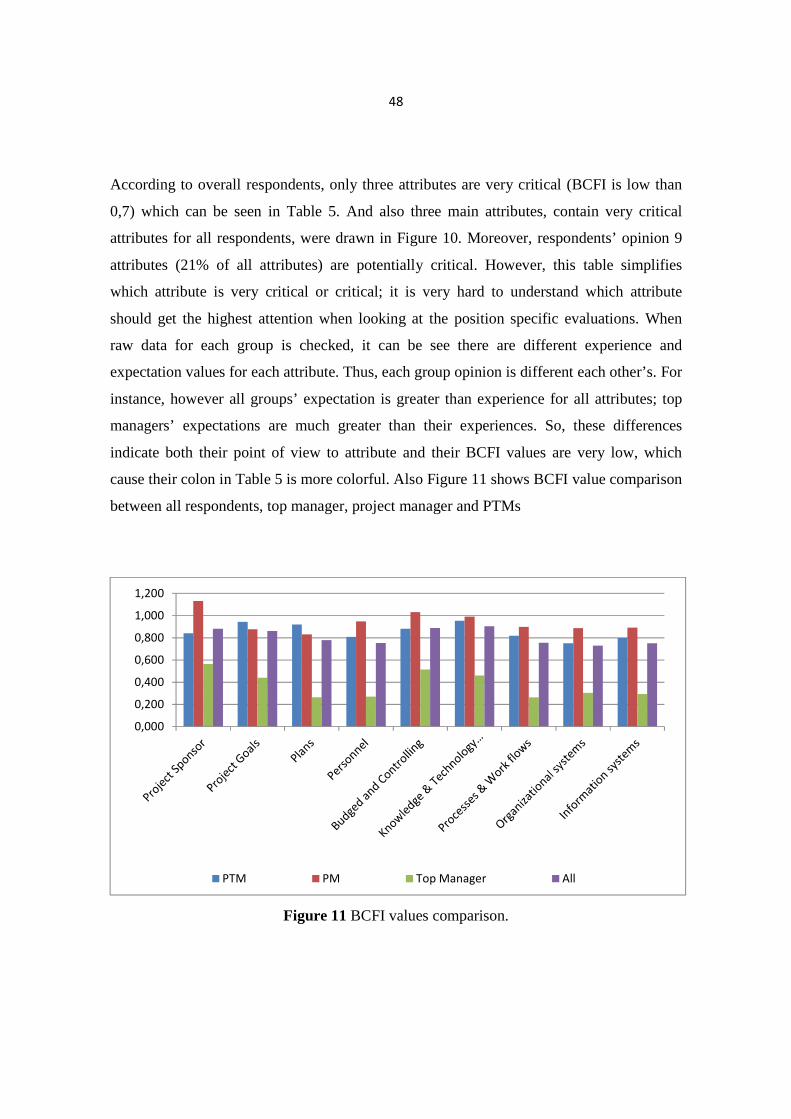
48
According to overall respondents, only three attributes are very critical (BCFI is low than
0,7) which can be seen in Table 5. And also three main attributes, contain very critical
attributes for all respondents, were drawn in Figure 10. Moreover, respondents’ opinion 9
attributes (21% of all attributes) are potentially critical. However, this table simplifies
which attribute is very critical or critical; it is very hard to understand which attribute
should get the highest attention when looking at the position specific evaluations. When
raw data for each group is checked, it can be see there are different experience and
expectation values for each attribute. Thus, each group opinion is different each other’s. For
instance, however all groups’ expectation is greater than experience for all attributes; top
managers’ expectations are much greater than their experiences. So, these differences
indicate both their point of view to attribute and their BCFI values are very low, which
cause their colon in Table 5 is more colorful. Also Figure 11 shows BCFI value comparison
between all respondents, top manager, project manager and PTMs
Figure 11 BCFI values comparison.
0,000
0,200
0,400
0,600
0,800
1,000
1,200
PTM PM Top Manager All
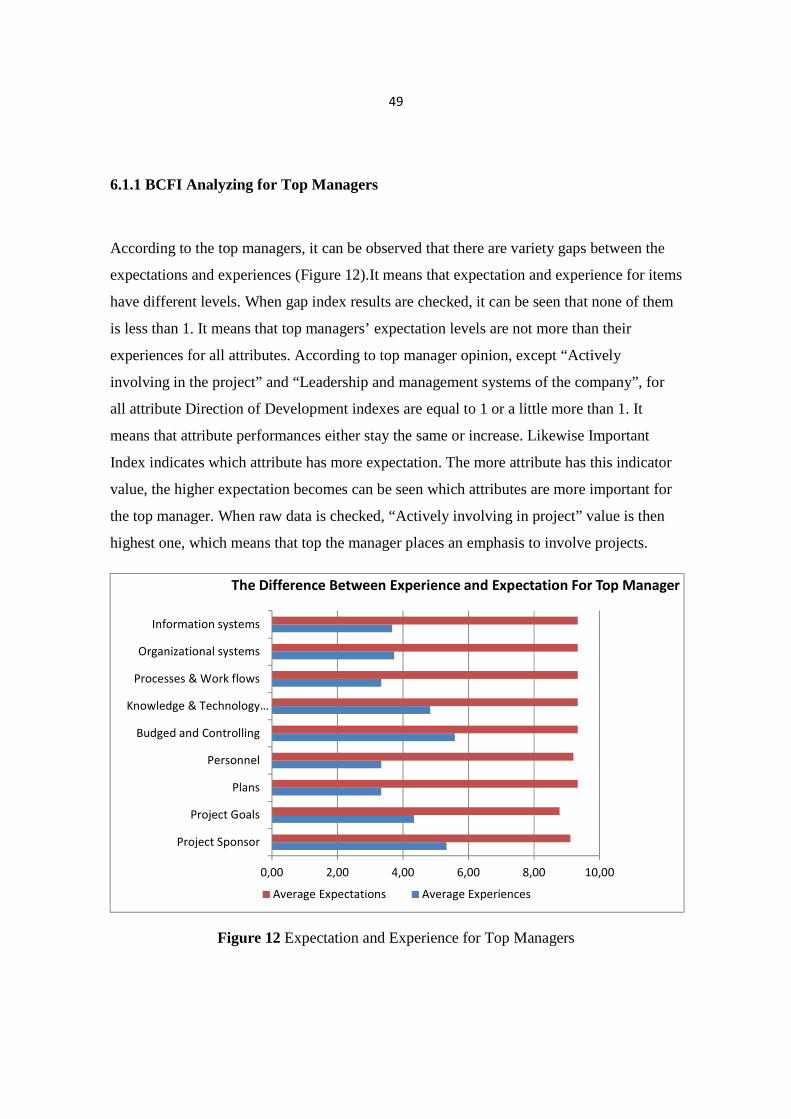
49
6.1.1 BCFI Analyzing for Top Managers
According to the top managers, it can be observed that there are variety gaps between the
expectations and experiences (Figure 12).It means that expectation and experience for items
have different levels. When gap index results are checked, it can be seen that none of them
is less than 1. It means that top managers’ expectation levels are not more than their
experiences for all attributes. According to top manager opinion, except “Actively
involving in the project” and “Leadership and management systems of the company”, for
all attribute Direction of Development indexes are equal to 1 or a little more than 1. It
means that attribute performances either stay the same or increase. Likewise Important
Index indicates which attribute has more expectation. The more attribute has this indicator
value, the higher expectation becomes can be seen which attributes are more important for
the top manager. When raw data is checked, “Actively involving in project” value is then
highest one, which means that top the manager places an emphasis to involve projects.
Figure 12 Expectation and Experience for Top Managers
0,00 2,00 4,00 6,00 8,00 10,00
Project Sponsor
Project Goals
Plans
Personnel
Budged and Controlling
Knowledge & Technology…
Processes & Work flows
Organizational systems
Information systems
The Difference Between Experience and Expectation For Top Manager
Average Expectations Average Experiences
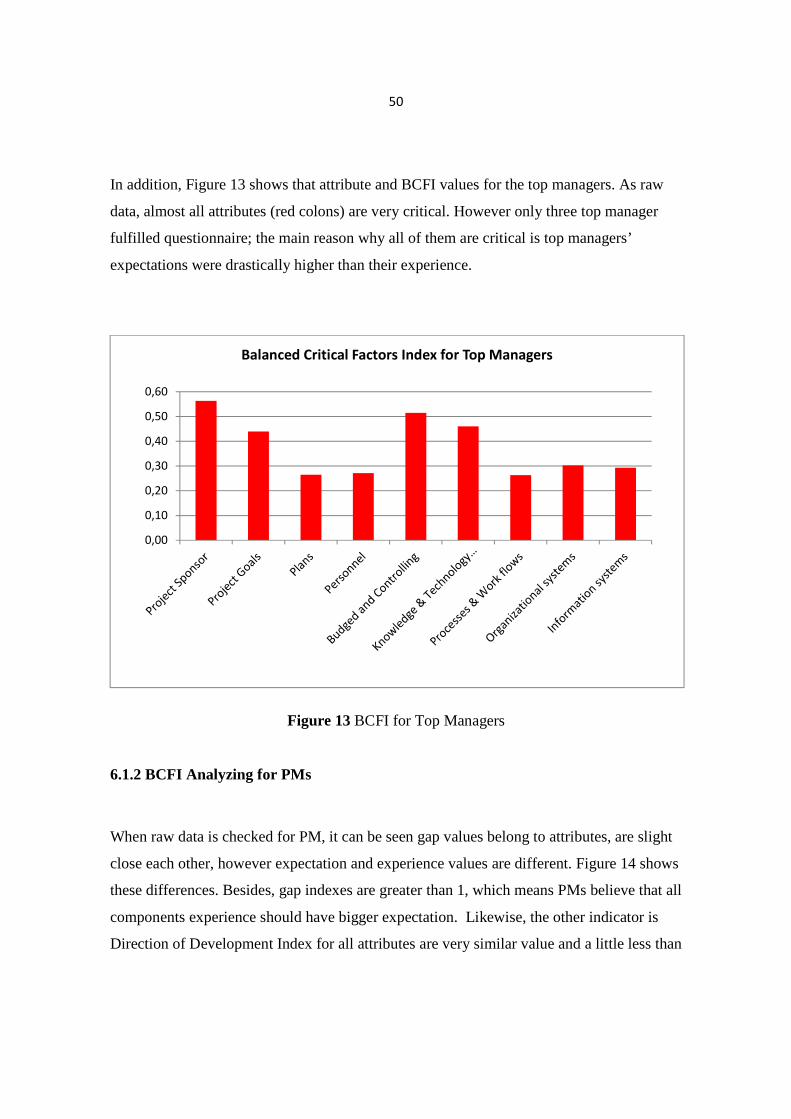
50
In addition, Figure 13 shows that attribute and BCFI values for the top managers. As raw
data, almost all attributes (red colons) are very critical. However only three top manager
fulfilled questionnaire; the main reason why all of them are critical is top managers’
expectations were drastically higher than their experience.
Figure 13 BCFI for Top Managers
6.1.2 BCFI Analyzing for PMs
When raw data is checked for PM, it can be seen gap values belong to attributes, are slight
close each other, however expectation and experience values are different. Figure 14 shows
these differences. Besides, gap indexes are greater than 1, which means PMs believe that all
components experience should have bigger expectation. Likewise, the other indicator is
Direction of Development Index for all attributes are very similar value and a little less than
0,00
0,10
0,20
0,30
0,40
0,50
0,60
Balanced Critical Factors Index for Top Managers
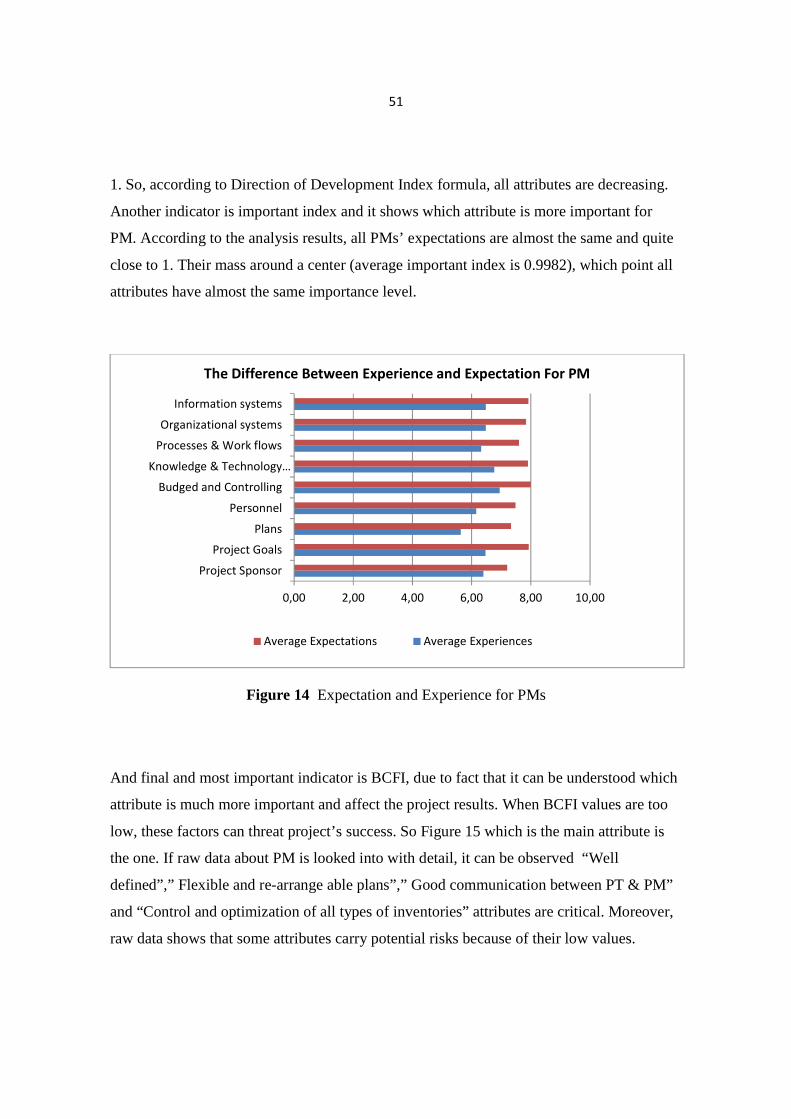
51
1. So, according to Direction of Development Index formula, all attributes are decreasing.
Another indicator is important index and it shows which attribute is more important for
PM. According to the analysis results, all PMs’ expectations are almost the same and quite
close to 1. Their mass around a center (average important index is 0.9982), which point all
attributes have almost the same importance level.
Figure 14 Expectation and Experience for PMs
And final and most important indicator is BCFI, due to fact that it can be understood which
attribute is much more important and affect the project results. When BCFI values are too
low, these factors can threat project’s success. So Figure 15 which is the main attribute is
the one. If raw data about PM is looked into with detail, it can be observed “Well
defined”,” Flexible and re-arrange able plans”,” Good communication between PT & PM”
and “Control and optimization of all types of inventories” attributes are critical. Moreover,
raw data shows that some attributes carry potential risks because of their low values.
0,00 2,00 4,00 6,00 8,00 10,00
Project Sponsor
Project Goals
Plans
Personnel
Budged and Controlling
Knowledge & Technology…
Processes & Work flows
Organizational systems
Information systems
The Difference Between Experience and Expectation For PM
Average Expectations Average Experiences
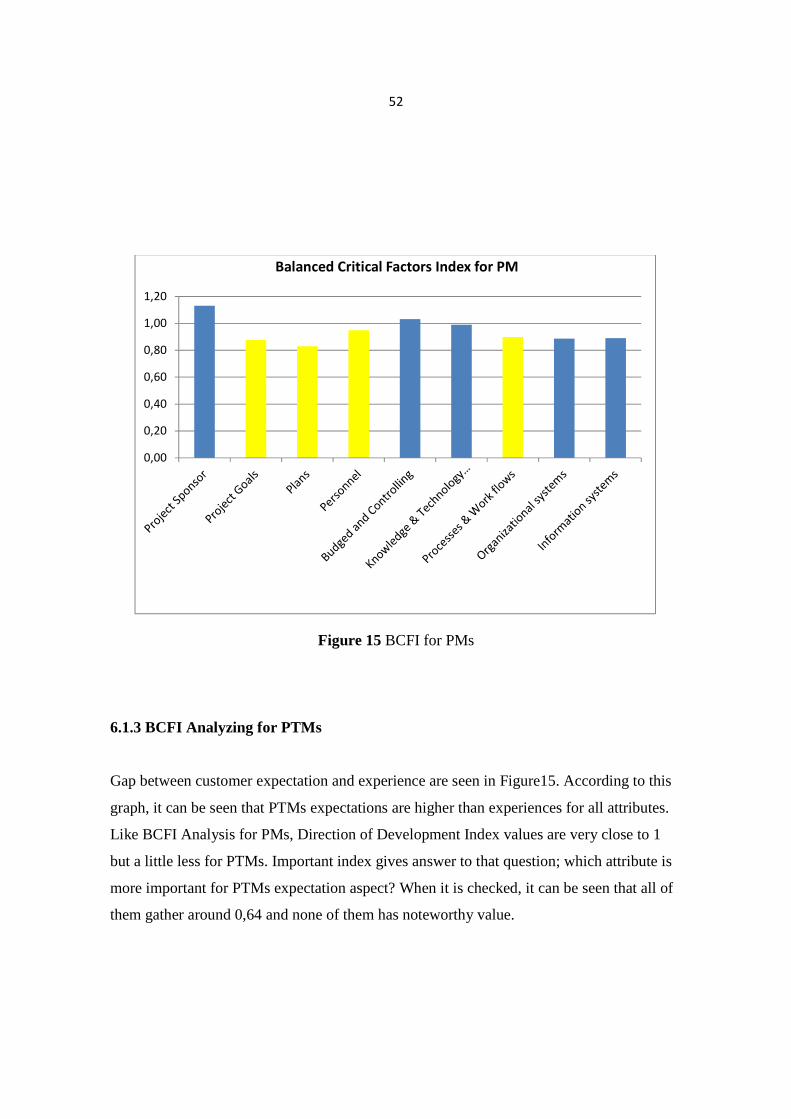
52
Figure 15 BCFI for PMs
6.1.3 BCFI Analyzing for PTMs
Gap between customer expectation and experience are seen in Figure15. According to this
graph, it can be seen that PTMs expectations are higher than experiences for all attributes.
Like BCFI Analysis for PMs, Direction of Development Index values are very close to 1
but a little less for PTMs. Important index gives answer to that question; which attribute is
more important for PTMs expectation aspect? When it is checked, it can be seen that all of
them gather around 0,64 and none of them has noteworthy value.
0,00
0,20
0,40
0,60
0,80
1,00
1,20
Balanced Critical Factors Index for PM
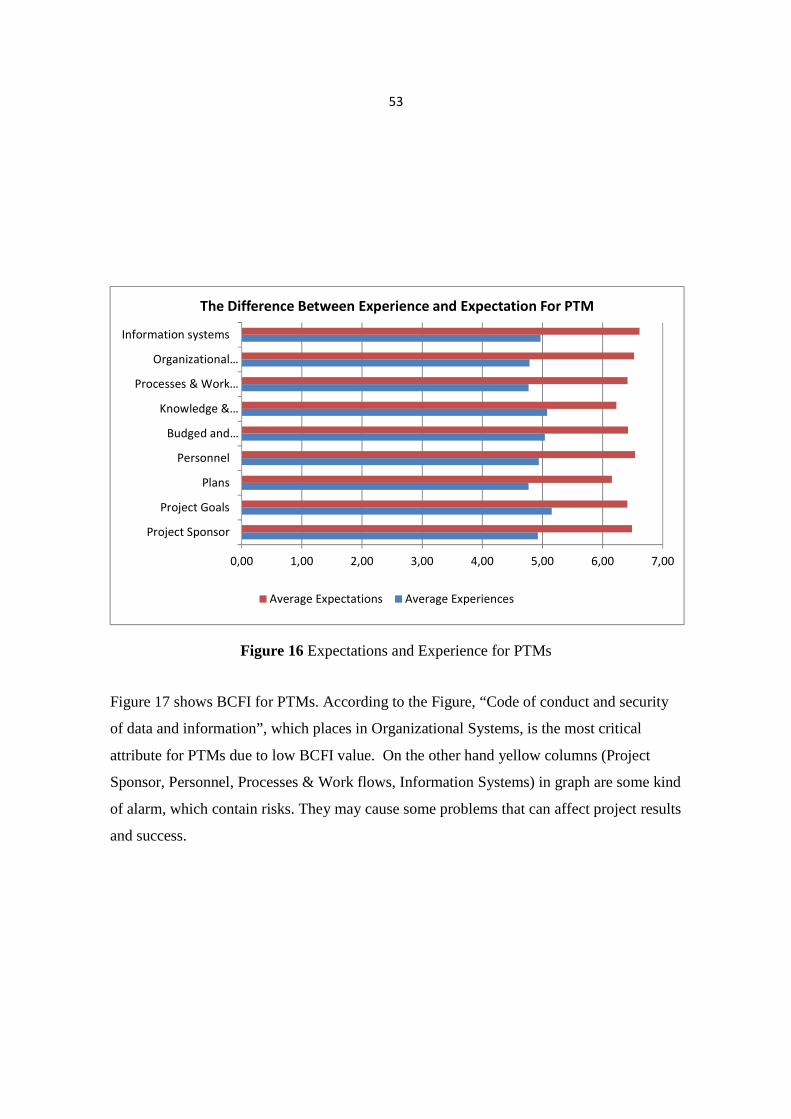
53
Figure 16 Expectations and Experience for PTMs
Figure 17 shows BCFI for PTMs. According to the Figure, “Code of conduct and security
of data and information”, which places in Organizational Systems, is the most critical
attribute for PTMs due to low BCFI value. On the other hand yellow columns (Project
Sponsor, Personnel, Processes & Work flows, Information Systems) in graph are some kind
of alarm, which contain risks. They may cause some problems that can affect project results
and success.
0,00 1,00 2,00 3,00 4,00 5,00 6,00 7,00
Project Sponsor
Project Goals
Plans
Personnel
Budged and…
Knowledge &…
Processes & Work…
Organizational…
Information systems
The Difference Between Experience and Expectation For PTM
Average Expectations Average Experiences
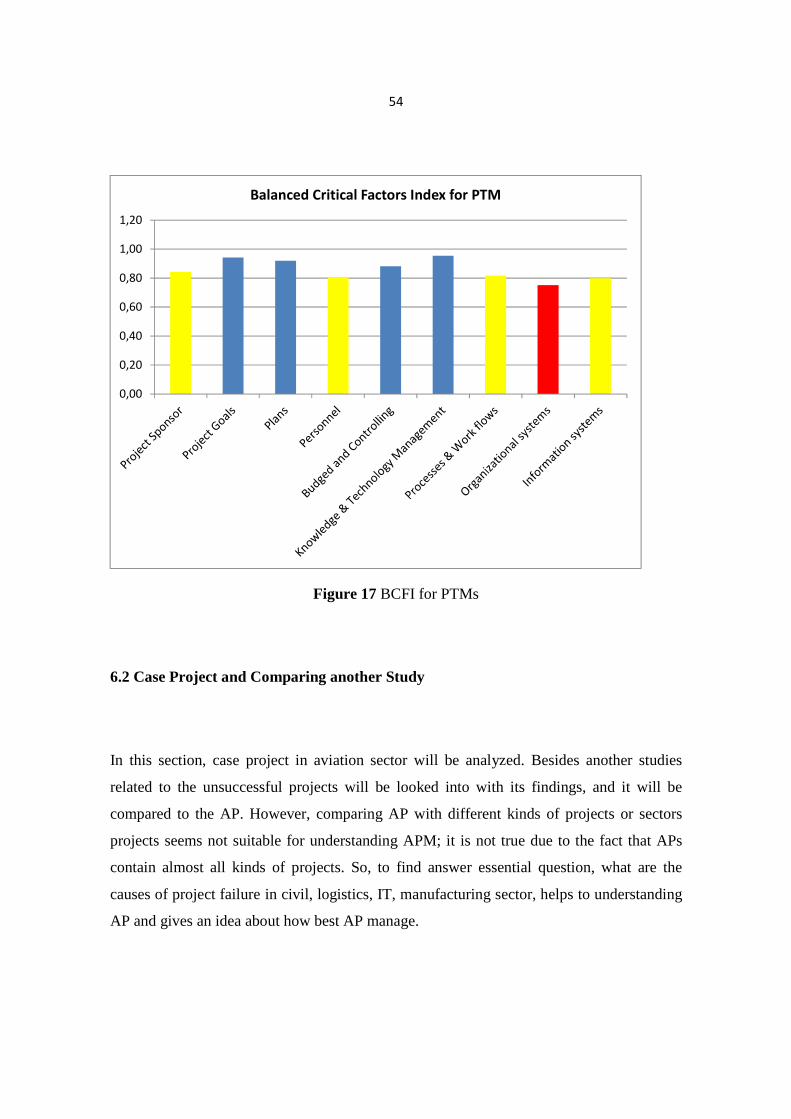
54
Figure 17 BCFI for PTMs
6.2 Case Project and Comparing another Study
In this section, case project in aviation sector will be analyzed. Besides another studies
related to the unsuccessful projects will be looked into with its findings, and it will be
compared to the AP. However, comparing AP with different kinds of projects or sectors
projects seems not suitable for understanding APM; it is not true due to the fact that APs
contain almost all kinds of projects. So, to find answer essential question, what are the
causes of project failure in civil, logistics, IT, manufacturing sector, helps to understanding
AP and gives an idea about how best AP manage.
0,00
0,20
0,40
0,60
0,80
1,00
1,20
Balanced Critical Factors Index for PTM
55
6.2.1 Case Project
For the case project, painting aircraft project was selected because of the fact that it is
typical aviation project, besides project phases and factors that affect project targets can be
easily observed when activities are executed. In addition, data concern case project was
easily acquired and it was gathered by two ways; first one was being in all project phases
and attending meetings as a project engineer. Also, all activities were observed and some
notes were taken when they happened. The second way was to interview with PM who was
responsible for whole painting projects.
The painting issue is very important for all aircraft. Because, painting aircraft provides
excellent protection for the skin of the airplane. Besides it creates a smoother surface on the
skin. That can help reduce drag, if ever so slightly. Its weight, qualities, process and other
factors are very important for flight safety and performance. In addition, painting time and
duration are very important for the project budget. Therefore printing project is a vital
process for three dimensions; cost, quality and time.
Paint Project objectives and outlook
The project aimed to paint the aircraft in accordance with the Civil Aviation Authority
regulations. And also objectives were that project completed in 8 days with 60.000 €.
Project organization
The project was sponsored by Case Company’s projects manager and he added
responsibility for monitoring all aspects of the project. He prepared project organization
chart, which can be seen in Figure 18.
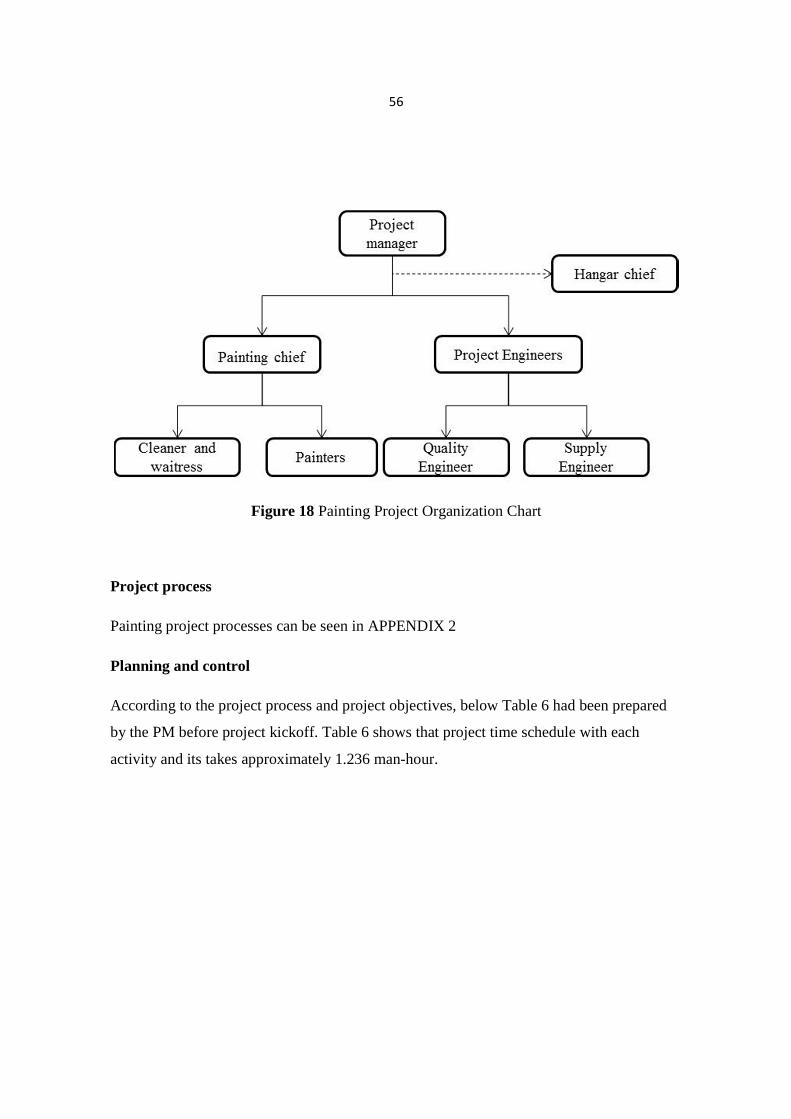
56
Figure 18 Painting Project Organization Chart
Project process
Painting project processes can be seen in APPENDIX 2
Planning and control
According to the project process and project objectives, below Table 6 had been prepared
by the PM before project kickoff. Table 6 shows that project time schedule with each
activity and its takes approximately 1.236 man-hour.
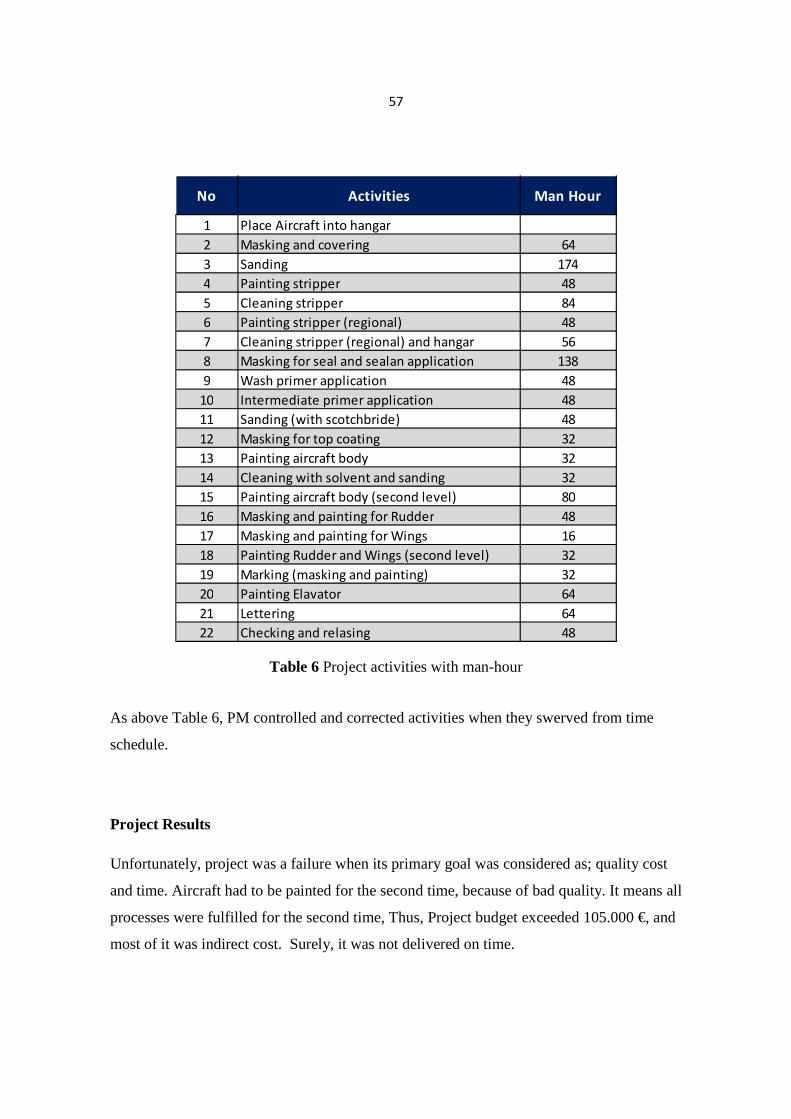
57
Table 6 Project activities with man-hour
As above Table 6, PM controlled and corrected activities when they swerved from time
schedule.
Project Results
Unfortunately, project was a failure when its primary goal was considered as; quality cost
and time. Aircraft had to be painted for the second time, because of bad quality. It means all
processes were fulfilled for the second time, Thus, Project budget exceeded 105.000 €, and
most of it was indirect cost. Surely, it was not delivered on time.
1 Place Aircraft into hangar
2 Masking and covering 64
3 Sanding 174
4 Painting stripper 48
5 Cleaning stripper 84
6 Painting stripper (regional) 48
7 Cleaning stripper (regional) and hangar 56
8 Masking for seal and sealan application 138
9 Wash primer application 48
10 Intermediate primer application 48
11 Sanding (with scotchbride) 48
12 Masking for top coating 32
13 Painting aircraft body 32
14 Cleaning with solvent and sanding 32
15 Painting aircraft body (second level) 80
16 Masking and painting for Rudder 48
17 Masking and painting for Wings 16
18 Painting Rudder and Wings (second level) 32
19 Marking (masking and painting) 32
20 Painting Elavator 64
21 Lettering 64
22 Checking and relasing 48
Man HourActivitiesNo
58
Analyzing the Painting Project
Although the case company has many experiences in civil aviation and APMs manage
countless projects; painting project was a disappointment. But, after painting a few
aircrafts, APMs noticed four major shortcomings in aircraft painting project;
1- Inadequate organization
2- Wrong planning (cost and materials)
3- Insufficiently qualified person
4- Bad progress management
In the beginning of the project, APM made some mistakes when he drew the organization
chart. As explained in Chapter 2, defining phase in project phases may be the most
important one in order to fulfill the project activities. Especially, not defined PTM’
responsibilities, tasks and their authorizations and APMs prepared organization chart by
themselves caused the project to be built on slack base.
Second fatal failure was wrong planning, which pointed out wrong path to APM and PTMs.
In addition, wrong calculating and wrong concatenation processes carried the project to
failure. However forecasting and planning were very tough; APMs could have re-planned
and prevented some problems. Particularly, wrong material planning occasioned missing
and poor quality materials, hence project one and half day delay.
Insufficiently qualified persons determined the project quality finishing time. In the case
project, inexperienced person spent too much time and materials in order to execute high
quality processes which CAA demands. In other words, incompetent persons increase
project’s cost and duration.
59
And last major shortcoming is bad progress management, which affected to all project
phases and primary project objectives. Especially, when APM encountered unexpected
situations, changing plan or taking a decision; receiving approval from sponsors caused the
project lost time and money. Moreover, PTM’ motivation decreased due to the fact that
sponsor and APM were not involved in the project except for a few meetings. Therefore,
inadequate and poor communication between three groups (top managers, APM and PTMs)
did not work collectively.
According to the interview with PMs, after case company completed closed phase and
ascertained first painting project, PMs and other department managers arranged some
meetings exchanging of views and brainstorming. Then they drew a new road map for the
painting project taking account of project primary objectives. New organization chart,
project schedule (it could be seen in APPENDIX 3), flexible plans prepared and qualified
persons hired.
6.2.2 Brenda Whittaker Study
According to Brenda Whittaker‘s study (1999), questionnaire was sent to 1.450 (176 of
them replied) public and private sector in Canada. The aim of this questionnaire was to
collect information on reasons behind the unsuccessful projects for Information Sector (IT).
And failure was defined as three dimensions; project budget, schedule was overrun by 30%,
or project was cancelled. After analysis this questionnaire, some useful information was
reached.
60
Finding Brenda Whittaker
A total 87% of unsuccessful projects exceeded their initial schedule, Likewise 56% of the
project exceeded budget. And 45% projects were cancelled. When this information was
analyzed, it could be seen three main reasons for the project failure. First one was poor
project planning because of fact that risks were not addressed as a part of the project
planning process. And project planning was weak. As mentioned it in Chapter two, the
most crucial point in the project plan is future forecast. Bad forecast may cause weak
planning. According to Brenda Whittaker’s study, some factors shared this week plan
reasons (incorrectly estimated activity durations 63%, incorrect assumptions regarding
resource availability 52%, inadequate assignment of activity accountabilities, 51%, missing
or incomplete review and approval activities 47%). The second main reason for
unsuccessful project is weak business case. According to the respondents, “Business and
operational changes needed to deliver the benefits” (48%), “clearly understood
deliverables” (46%), “quantified costs and benefits” (44%) and “overall scope of project
Business and technology risks” (37%) cause weak business case. And final main reason for
unsuccessful projects is lack of management involvement. Respondent believed business
sponsor, executive managers, president and CEO were not involved enough to manage the
projects.
61
7. CONCLUSION
The purpose of this thesis is to emphasize the importance of APM and to find out which
factors affect the projects results for different aspects. With analysis in this study, these
factors and success criteria, which are shareholders and customer say “project is a success”,
have been tried to reveal.
As mentioned previous chapters, every project is the uniqueness and it does not repeat. In
the other words every project has got its own characteristic and can be executed only one
time. Moreover every project has specific goals and/or projects have different primary
objectives levels. In addition, changing in aviation sector such as customer requirements,
competition with activities and technology makes every project is new and different.
Therefore, it does not say that formula or technique provides to successfully complete
projects. But, knowing some important points in project may prevent making mistake.
Using BCFI method, case project and compering another study, these points have been
lighted.
With BCFI Analysis;
According to this method each group (PTMs, PM and Top managers) perceived attributes
with different levels. Because, each groups is interested different part of project. For
instance, PTMs just focuses on their tasks, so they believe their tasks are much more
important than rest of the project. Likewise APM takes care of only project results. It
means APMs care primary objectives, which determines project’s successful or failure.
And top managers estimate attribute as long term success. In addition, each group or
respondent may have different backgrounds and experience. Generally, when they respond
survey questions, they take account of previous failure experience. Moreover, various
causes (age, sex, expectation etc.) can determinate perception levels, which are based on
this analyse. When BCFI results are checked, it can be seen each group point out different
attribute, because of their perception. However, all groups agree on three attributes
62
(Personnel, Processes & Work flows and Organizational systems) are very critical for APs;
each group should be estimated into their perspective. In the other words, it should be paid
attention attribute’ critical level as each group estimates. For example, when attribute
concern defining responsibilities and authorizing more important for PTMs, but they don’t
interest attribute about sponsors issues. So it does not mean sponsors and/or relationships
with sponsors are less important. These two attribute indicate that PTMs have to more pay
attention about responsibility and authorizing than another.
Also, this method shows some attribute are not very critical but it may cause some problem
in near futures. So PM or top manager may find some solution and prevent problems
related that attributes. Besides, If BCFI analysis is deeply executed with the more
respondents, all causes and their results easily could be noticed by APM. Thus attributes
and critical factors could be more meaningful before improved processes.
Case study and interview;
According to case study and interview, project results and project success are very
important for all people who are in project. But especially end user in aviation sectors, such
as passengers and aircrews have higher expectations success criteria. It is not thought that
low quality, delay schedule and expensive goods or service in aviation sector due to
customer expectations and competition. Especially, as project quality perspective there is
no place for mistake; even if it affects project results with small value.
Case study shows how much important preparing project before kick-off. It is very tough
to fix problem after it is noticed that any project step or phase is wrong way. Even if it can
be compensated, it will probably cause high project cost. Thus before starting to project, all
people in project should prepare their tasks and responsibilities. When they do it, all of
them contact each other. As work flow run with enough quality and complete on time,
pitfalls, possible problems should be forecast and then their affects are decreased or
removed by relevant persons.
63
Besides, Case study indicated that inadequate organization, wrong planning with
insufficiently qualified person will take undesirable project result. Because, missing or
wrong responsibilities, tasks and authorizations will cause chaos in any community.
Ambiguous line for every area lets arise untidy places. In this indiscipline organization and
atmosphere, project is never managed. Even if well organization provide, with wrong
planning or path, organization does not reach project goals. If and only ıf good plans such
as personnel, material, budget planning, throws light on arduous project ways. Case project
and interviews also pointed out that project is completed with desirable quality, time and
cost without qualified persons. After all issues are fulfilled, APMs may control projects.
Depend on APMs background, experience, leadership and skills, project progress shape.
Comparing other studies;
Other studies concern unsuccessful projects were looked into in order to cross check this
study. Thus, comparing gave an opportunity to see different perspective for APs.
This comparing indicates that relationship between AP and other projects (IT, construction,
logistic etc.) is similar to relationships among the APs due to the fact that all projects have
similar components and phases. However project name, goal, size, capacity etc., can change
because of fact that each project is unique; all of them have the same logic that is connected
activities, components (person, machine, material, and money), primary objectives and
basic goal. Behind of this logic, there are many kinds of knowledge, experiences, technics
and efforts.
64
RESOURCES
Association of Project Management, (2006). Body of Knowledge 5th edition. UK:
Association of Project Management
FLOURİS, Triant, LOCK Dennis, (2008), Aviation Project Management, Ashgate
Publishing Limited, ISBN-13: 978-0-7546-7395-8
GIDO Jack & CLEMENTS James P.(2009), Successful Project Management. (Fourth
Edition), pg 300-330
GRONROOS, C, (1990), Service Management and Marketing, Managing the moments of
Truth in Service Competition. Toronto, Massachusetts: Lexington Books.
LOCK, Dennis (2007), The essentials of project management. Burlington, Gower
publishing company, 2007
LUMPE, Marc Philippe (2008),Leadership and organization in the aviation industry, ISBN
978-0-7546-7144-2, Pg 186
MILLING, Peter M., Uwe Schwellbach & JORN-Henrik Thun (2000). The role of speed in
manufacturing. POM Facing the millennium. First World Conference on Production
and Operations Management. Sevilla 27.8. – 1.9. ISBN 84-8009-102-9
MURCH, Richard (2001), Project Management. Best Practices for it Professionals.USA:
Prentice Hall.
NADLER, Daniel, (2012), Human Resource Allocation in a Multiple Project Environment,
University of Vaasa, Department of Industrial Management.
65
NICOLAS, John M. (2001), Project Management Business and Technology. Principles and
Practice. (Second edition). New Jersey: Prentice Hall. Pg.19- 157
PARMENTER, David, (2010), Key Performance Indicator (KPI): Developing,
Implementing and Using Winning KPIs; Page 1-2-3
Project Management Institute (2000), A Guıde to the Project Management Body of
Knowledge (PMBOK Guıde). Pennsylvania USA pg. 1- 90 Available at
(http://en.wikipedia.org/wiki/Project_management)
SMITH , Patric Harper & DERRY, Simon; ProMarch (2012); Project Management :Fast
Tract to Success
WHITTAKER, Brenda (1999), Information Management & Computer Security, MCB University Press (ISSN 0968-5227), page 23-29
WYSOCKI, Robert K, BECK Jr., Robert, and CRANE, David (2000) Effective project
management. New York : John Wiley ,
66
APPENDICES
APPENDIX 1 - SURVEY QUESTIONNARIA Dear respondent, You have been selected for this survey because of your value expertise and know-how in TAA. We intend to understand what is your opinion and expectation about project, which does not reach its aims, and which parts are most affect to project results. Background TAA, which was founded in 1925, has laid the foundation of Turkish civil aviation by carrying out the following activities; Flight School, Aerial Fire Fighting, Agricultural Spraying, Air Vaccination, Air Taxi / Cargo / Ambulance, Private Flight Organization, Maintenance Services, Airport Handling and Ground Services, Aerial Photographing and Filming, Courses: Skydiving/Parachute, Jumping, Microlight, Balloon, Sportive and Amateur Aircraft Sale, Cappadocia Balloon Tours, Aero model Sale.. TAA owes this success to believe and execute the philosophy of continuous improvement. In this context, aim of this study is to discover deficient and development areas in aviation projects. For that reason, scope has been restricted with project components and aviation projects that do not reach their aims. The information related aviation project collected by this survey would be used to further develop ideas handling and follow-up experiences to ensure to prevent problems and finding solution them for our company departments. Questionnaire Following page include table concern project components and some criteria. The first column (column-A) shows project components, 42 attributes. And column-B and column-C respectively show experiences (how the attribute has carried out or affect TAA project result in the past and at the moment) and expectations (how will the attribute carry out or affect TAA project result in the future). When you estimate these attributes, please give a grade on the scale of 1 (poor) to 10 (excellent). Columns-D indicates attribute direction. When you estimate the Column-D (How has it developed over the past 3 years?), consider with your opinion, how the attribute has developed over the last three years until now. For example; if you believe that any attribute has positively developed in last three years, please answer by writing an (X) in “better” section. Likewise, please point by writing an (X) for the appropriate option. And Column-E (How will it become in the next 3 years?) indicates that how the attribute will develop over the next three years. Like,
67
previously column, you can write (X) the best option for attributes. When you evaluate each attribute, please compare TAA aviation with its rival. For instance, if you believe that TAA is better position for any attributes as its rivals, you should write an (X) in “better” section. Likewise, please point by writing an (X) for the suitable section in Column-F area. And the last part of questionnaire (Line-G) shows us how much you have experience in projects. Please fill in suitable areas as your situation. And please do not answer components (grey topic row)
If you have not enough experiences or information, you may pass without any estimated. Your respond will be used to understand of the current status of unsuccessful aviation projects. In addition they will be analyzed to understand which and how much attributes affect project results.
How to respond:
Please send your respond by email attachment or by hand until March 16th, 2012 to: [email protected]
Thank you for your time!
Serdar ÖZTÜRK Project Manager / TAA Gökçen Aviation Büyük Sanayi 1. Cad. Elif Sokak No: 2 Altındağ / ANKARA/ TURKEY Phone : +90 (312) 222 48 40-221
68
Project
Experiences
from the past
Project
Expectations for
the future
How has it developed
over the past 3 years?
How will it become in
next 3 years?
ATTRIBUTES (1 - 10 ) (1 - 10 ) worse same better worse same better
Project Sponsor
Sufficient project support
Implementing commitments
Actively involving in project
Project Goals
Overlapping company's needs or strategic vision
Right or adequate project goals
Well defined
Plans
Clear needs, definitions and responsibly
Comprehensible and reasonable plans
Well specified project scope
Well define plans (budged, staff, capacity etc.)
Good assumption, expectation and perspective
Flexible and re-arrange able plans
Personnel
Project members are enough quality and quantity
Project manager is enough qualify
Project manager's leadership skills
Adequately defined responsibilities and authorization
Good communication between PT and PM
Budged and Controlling
Sufficient budged and other sources
Optimum using resource
Right controlling tools and tests
Agility or short time to responding source problems
Knowledge & Technology Management
Training and development of the company's personnel
Innovativeness and performance of R&D
Communication between different dept. &hierarchy
levels
Adaptation to knowledge and technology
Knowledge and technology diffusion
Design and planning of the processes and products
69
Project
Experiences
from the past
Project
Expectations
for the future
How has it developed over
the past 3 years?
How will it become in next
3 years?
ATTRIBUTES (1 - 10 ) (1 - 10 ) worse same better worse same better
Processes & Work flows
Short and prompt lead-times in order-fulfillment process
Reduction of unprofitable time in processes
On-time deliveries to customer
Control and optimization of all types of inventories
Adaptiveness of changes in demands and in order
backlog
Organizational systems
Leadership and management systems of the company
Quality control of products, processes and operations
Well defined responsibilities and tasks for each operation
Utilizing different types of organizing systems
Code of conduct and security of data and information
Information systems
Information systems support the business processes
Visibility of information in information systems
Availability of information in information systems
Quality & reliability of information systems
Usability and functionality of information systems
Not yet
As a Project
Team Member As a Project Manager As a Project Sponsor
Have you been in project?
How many years work in project? ….… year/s ….…
year/s
….…
year/s
SENSE AND RESPOND QUESTIONNAIRE
Explanations:
Expectations = What is the level of expectations for an attribute in a scale of 1-10 Experiences = What is the level of experiences for an attribute in a scale of 1-10 Direction of development (future) = Direction of development compared to the situation expected 1 year after this questionnaire
Direction of development (past) = Direction of development compared to the situation 2 years before this questionnaire Compared with competitors = Level of experiences compared to the competitors
70
APPENDIX 2 - CASE AVIATION PROJECT (PAINTING PROJEC T) PROCESSES
Description Aircraft Repainting
Reason Upon Customer Requisition
Relevant Shops Company Paint Facility
Labor-A/C Application (Man-Hour)
1600
Prepared By Structures Engıneer
Check By Structures Lead Engıneer
Approved By Struc. and Cabın int. Engg. Mgr.
Using Materials or System Livery Drawing, high-solid topcoat paint system (PPG paint or Akzo-Nobel paint)
PREPARATION
1 Place Aircraft into an environmental controlled hangar
2 Check the painting hangar environmental condition
(temperature and humidity)
3 Mask and cover the parts and areas that will not be stripped
4 Before performing of the stripper, clean the surface, remove
the loose dirt, grease
5 Apply a suitable chemical paint stripper, which were approved
by A/C manufacturer
6 Use clean cold water to remove all traces of paint remover
and Dry the surface
7 Rub down carefully the parts. Abrade (sand) the topcoat
equally down to the Primer surface
8 Clean the surfaces by certified solvent and clean water
71
INSPECTION
1 Check the all stripped areas for signs of corrosion or scratches
2 Areas that applied chemical paint stripper, remove the -joint
old sealant at butt-joints and lap
3 Check the integrity of all lap-joint and butt-joint seal
4 Reseal the all butt-joints
WASH PRIMER APPLICATION
1 Check again and protect carefully all affected areas
2 Prepare the surfaces with using clean cold water and scotch bride
pads or equivalent materials
3 Clean the surfaces by certified solvent and clean water
4 Apply wash primer. Use suitable wash primer as per below
preferred Paint System.
5 Check that the dry film thickness is between 6 to 10 µm.
PRIMER APPLICATION
1 Apply the following primer between 1 hour and max. application
8 hour after wash primer
2 Check that the dry film thickness is within a range of
approx. 15 to 20 µm .
72
TOPCOAT APPLICATION
1 Check again the painting hangar environmental condition.
2 Mask aircraft to paint the fuselage and clean surface with
using lint free cloth
3 Apply topcoat according to exterior livery drawing
4 Mask aircraft to paint the vertical stabilizer& rudder and clean surface
5 Apply topcoat according to exterior livery drawing
6 Mask aircraft to paint XYZ Logos on tail. Use attached livery
for the color codes.
7 Apply topcoat according to exterior livery drawing
8 Mask aircraft to paint the A/C Registration and Ship Name,
‘ABC AIRLINES’
9 Apply topcoat according to exterior livery drawing
10 Mask aircraft to paint the ABC Logo and Flag
11 Apply topcoat according to exterior livery drawing
12 Mask aircraft to paint XYZ Logos on cockpit windows
13 Apply topcoat according to exterior livery drawing
73
APPLICATION OF MANDATORY MARKINGS, TECHNICAL LETTERING
1 Apply marking and technical lettering with using stencil kits
DE-MASKING AIRCRAFT
1 Remove the masking and prepare aircraft for acceptance check
2 Remove the residual tape adhesives, masking papers, mask, etc.
BALANCE OF THE CONTROL SURFACES
1 Perform the balance procedure of the flight control surfaces
2 Record the adjusted balance weight and balance values
CLOSE-UP
1 Measure and record the paint thickness and gloss
2 Check the aircraft which was painted according to attached drawing
3 Check areas like static ports, outflow valve, pitot probes, etc.
4 Check all mandatory markings
5 Check the Compliance Report, issued by the Paint Facility
6 Put the airline back to serviceable condition
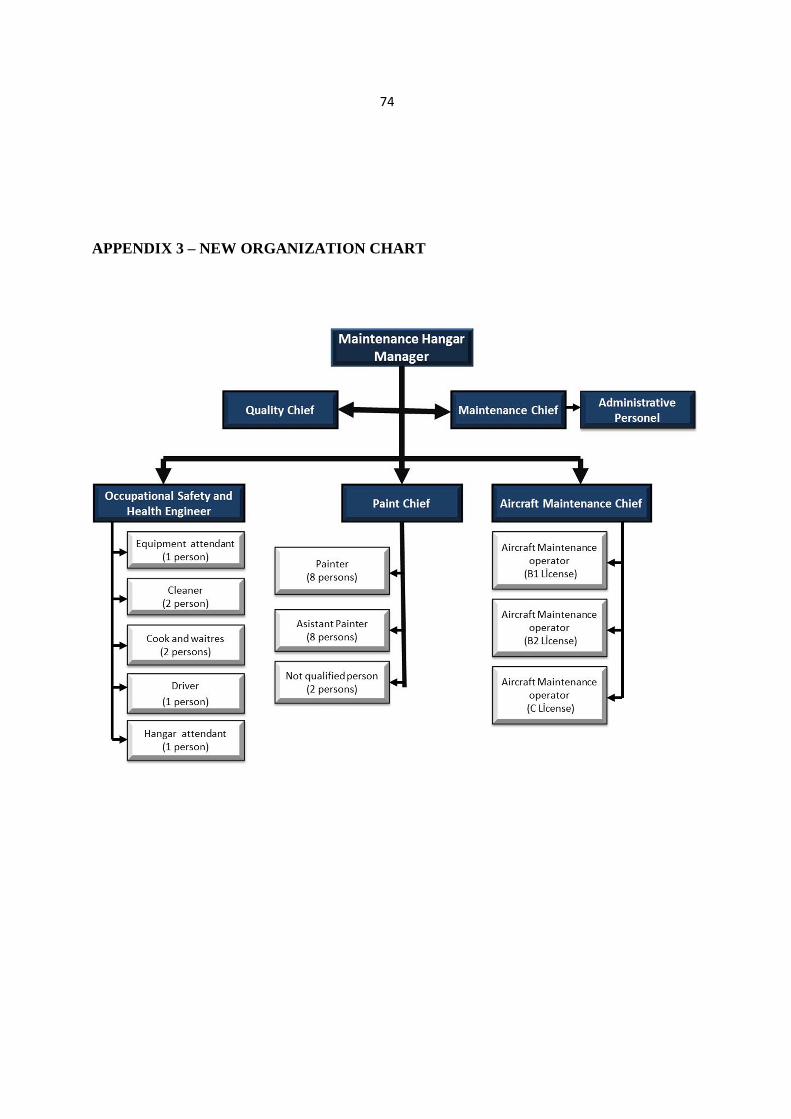
74
APPENDIX 3 – NEW ORGANIZATION CHART
Related Documents