Magnitude and Time Course of Microvascular Obstruction and Tissue Injury After Acute Myocardial Infarction Carlos E. Rochitte, MD; Joa ˜o A.C. Lima, MD; David A. Bluemke, MD, PhD; Scott B. Reeder, PhD; Elliot R. McVeigh, PhD; Toshiya Furuta, MD; Lewis C. Becker, MD; Jacques A. Melin, MD Background—Microvascular obstruction within an area of myocardial infarction indicates worse functional recovery and a higher risk of postinfarction complications. After prolonged coronary occlusion, contrast-enhanced MRI identifies myocardial infarction as a hyperenhanced region containing a hypoenhanced core. Because the time course of microvascular obstruction after infarction/reperfusion is unknown, we examined whether microvascular obstruction reaches its full extent shortly after reperfusion or shows significant progression over the following 2 days. Methods and Results—Seven dogs underwent 90-minute balloon occlusion of the left anterior descending coronary artery (LAD) followed by reflow. Gadolinium-DTPA– enhanced MRI performed at 2, 6, and 48 hours after reperfusion was compared with radioactive microsphere blood flow (MBF) measurements and myocardial staining to define microvascular obstruction (thioflavin S) and infarct size (triphenyltetrazolium chloride, TTC). The MRI hypoenhanced region increased 3-fold during 48 hours after reperfusion (3.261.8%, 6.764.4%, and 9.963.2% of left ventricular mass at 2, 6, and 48 hours, respectively, P,0.03) and correlated well with microvascular obstruction (MBF ,50% of remote region, r50.99 and thioflavin S, r50.93). MRI hyperenhancement also increased (21.764.0%, 24.364.6%, and 28.865.1% at 2, 6, and 48 hours, P,0.006) and correlated well with infarct size by TTC (r50.92). The microvascular obstruction/infarct size ratio increased from 13.064.8% to 22.668.9% and to 30.464.2% over 48 hours (P50.024). Conclusions—The extent of microvascular obstruction and the infarct size increase significantly over the first 48 hours after myocardial infarction. These results are consistent with progressive microvascular and myocardial injury well beyond coronary occlusion and reflow. (Circulation. 1998;98:1006-1014.) Key Words: magnetic resonance imaging n myocardial infarction n microcirculation n reperfusion n perfusion E arly reperfusion by thrombolytic therapy or angio- plasty is now widely used to limit infarct size, pre- serve left ventricular (LV) function, and improve survival in patients with acute myocardial infarction. 1 Although restoration of blood flow to previously ischemic tissue does occur after reperfusion, the process is not homoge- neous, and limited myocardial perfusion is observed in some parts of the injured territory. This so-called “no- reflow” or “low-reflow” phenomenon has been docu- mented at the inner portion of the LV wall, which often remains nonreperfused after release of prolonged coronary occlusion. 2 Electron microscopic studies of tissue within the no-reflow region reveal severe microvascular damage and obstruction by red and white blood cells and other necrotic debris. Microvascular obstruction at the infarct core has been demonstrated in humans 3–5 and represents a predictor of poor myocardial functional recovery 5 and postinfarction cardiovascular complications. 6 Initially, microvascular obstruction was believed to be completed at the onset of arterial reflow, 2 but more recent data suggest that this process is dynamic and develops up to 3.5 hours after reperfusion. 7 However, the time course and magnitude of microvascular damage beyond reperfusion re- main controversial, in large part because noninvasive meth- ods to study this phenomenon serially were unavailable. It was recently demonstrated that microvascular obstruction can be evaluated noninvasively by contrast-enhanced MRI. 4,8 In addition, this method has been shown to index infarct size by probing water kinetics through shortened proton relaxation times induced by gadolinium atoms. 4,8 Numerous previous studies have established the validity of this approach to assess myocardial damage after experimental 8,9 and human 4 coro- nary artery occlusion. Therefore, our principal objective was to analyze the time course and magnitude of the no-reflow region using contrast-enhanced MRI up to 48 hours after coronary reflow. In addition, we aimed to validate the serial assessment of microvascular obstruction by MRI against radioactive microsphere blood flow (MBF) measurements, the established basic methodology of studying microvascular damage after myocardial ischemia. Received December 18, 1997; revision received March 23, 1998; accepted April 1, 1998. From the Cardiology Division, Department of Medicine (C.E.R., J.A.C.L., T.F., L.C.B.); Department of Radiology (J.A.C.L., D.A.B., E.R.M.); and Department of Biomedical Engineering (E.R.M., S.B.R.), Johns Hopkins University, Baltimore, Md, and the Division of Cardiology, Department of Medicine, University of Louvain, Brussels, Belgium (J.A.M.). Correspondence to Joa ˜o A.C. Lima, MD, Johns Hopkins Hospital, Cardiology Division, Blalock 569, 600 N Wolfe St, Baltimore, MD 21287-6568. E-mail [email protected] © 1998 American Heart Association, Inc. 1006 Basic Science Reports by guest on January 2, 2015 http://circ.ahajournals.org/ Downloaded from

Welcome message from author
This document is posted to help you gain knowledge. Please leave a comment to let me know what you think about it! Share it to your friends and learn new things together.
Transcript
Magnitude and Time Course of Microvascular Obstructionand Tissue Injury After Acute Myocardial Infarction
Carlos E. Rochitte, MD; Joao A.C. Lima, MD; David A. Bluemke, MD, PhD; Scott B. Reeder, PhD;Elliot R. McVeigh, PhD; Toshiya Furuta, MD; Lewis C. Becker, MD; Jacques A. Melin, MD
Background—Microvascular obstruction within an area of myocardial infarction indicates worse functional recovery anda higher risk of postinfarction complications. After prolonged coronary occlusion, contrast-enhanced MRI identifiesmyocardial infarction as a hyperenhanced region containing a hypoenhanced core. Because the time course ofmicrovascular obstruction after infarction/reperfusion is unknown, we examined whether microvascular obstructionreaches its full extent shortly after reperfusion or shows significant progression over the following 2 days.
Methods and Results—Seven dogs underwent 90-minute balloon occlusion of the left anterior descending coronary artery(LAD) followed by reflow. Gadolinium-DTPA–enhanced MRI performed at 2, 6, and 48 hours after reperfusion wascompared with radioactive microsphere blood flow (MBF) measurements and myocardial staining to definemicrovascular obstruction (thioflavin S) and infarct size (triphenyltetrazolium chloride, TTC). The MRI hypoenhancedregion increased 3-fold during 48 hours after reperfusion (3.261.8%, 6.764.4%, and 9.963.2% of left ventricular massat 2, 6, and 48 hours, respectively,P,0.03) and correlated well with microvascular obstruction (MBF,50% of remoteregion, r50.99 and thioflavin S,r50.93). MRI hyperenhancement also increased (21.764.0%, 24.364.6%, and28.865.1% at 2, 6, and 48 hours,P,0.006) and correlated well with infarct size by TTC (r50.92). The microvascularobstruction/infarct size ratio increased from 13.064.8% to 22.668.9% and to 30.464.2% over 48 hours (P50.024).
Conclusions—The extent of microvascular obstruction and the infarct size increase significantly over the first 48 hoursafter myocardial infarction. These results are consistent with progressive microvascular and myocardial injury wellbeyond coronary occlusion and reflow.(Circulation. 1998;98:1006-1014.)
Key Words: magnetic resonance imagingn myocardial infarctionn microcirculationn reperfusionn perfusion
Early reperfusion by thrombolytic therapy or angio-plasty is now widely used to limit infarct size, pre-
serve left ventricular (LV) function, and improve survivalin patients with acute myocardial infarction.1 Althoughrestoration of blood flow to previously ischemic tissuedoes occur after reperfusion, the process is not homoge-neous, and limited myocardial perfusion is observed insome parts of the injured territory. This so-called “no-reflow” or “low-reflow” phenomenon has been docu-mented at the inner portion of the LV wall, which oftenremains nonreperfused after release of prolonged coronaryocclusion.2 Electron microscopic studies of tissue withinthe no-reflow region reveal severe microvascular damageand obstruction by red and white blood cells and othernecrotic debris. Microvascular obstruction at the infarctcore has been demonstrated in humans3–5 and represents apredictor of poor myocardial functional recovery5 andpostinfarction cardiovascular complications.6
Initially, microvascular obstruction was believed to becompleted at the onset of arterial reflow,2 but more recent
data suggest that this process is dynamic and develops up to3.5 hours after reperfusion.7 However, the time course andmagnitude of microvascular damage beyond reperfusion re-main controversial, in large part because noninvasive meth-ods to study this phenomenon serially were unavailable. Itwas recently demonstrated that microvascular obstruction canbe evaluated noninvasively by contrast-enhanced MRI.4,8 Inaddition, this method has been shown to index infarct size byprobing water kinetics through shortened proton relaxationtimes induced by gadolinium atoms.4,8 Numerous previousstudies have established the validity of this approach to assessmyocardial damage after experimental8,9 and human4 coro-nary artery occlusion. Therefore, our principal objective wasto analyze the time course and magnitude of the no-reflowregion using contrast-enhanced MRI up to 48 hours aftercoronary reflow. In addition, we aimed to validate the serialassessment of microvascular obstruction by MRI againstradioactive microsphere blood flow (MBF) measurements,the established basic methodology of studying microvasculardamage after myocardial ischemia.
Received December 18, 1997; revision received March 23, 1998; accepted April 1, 1998.From the Cardiology Division, Department of Medicine (C.E.R., J.A.C.L., T.F., L.C.B.); Department of Radiology (J.A.C.L., D.A.B., E.R.M.); and
Department of Biomedical Engineering (E.R.M., S.B.R.), Johns Hopkins University, Baltimore, Md, and the Division of Cardiology, Department ofMedicine, University of Louvain, Brussels, Belgium (J.A.M.).
Correspondence to Joao A.C. Lima, MD, Johns Hopkins Hospital, Cardiology Division, Blalock 569, 600 N Wolfe St, Baltimore, MD 21287-6568.E-mail [email protected]
© 1998 American Heart Association, Inc.
1006
Basic Science Reports
by guest on January 2, 2015http://circ.ahajournals.org/Downloaded from
MethodsExperimental ProtocolSeven mongrel dogs (mean weight, 2262.3 kg) were initiallyanesthetized with thiopental (26 mg/kg IV), intubated, and mechan-ically ventilated. They received halothane anesthesia during cathe-terization procedures and small intravenous (IV) boluses of sodiumpentobarbital during MRI (2.4 to 4.9 mg/kg; the mean total dose was20.3 mg/kg for the first day of the protocol).
Through a right femoral artery catheter sheath, a 7F pigtail catheterwas placed into the LV cavity and used for microsphere administrationand blood pressure monitoring. Microsphere reference blood sampleswere obtained from the femoral artery catheter sheath. An IV bolus ofheparin (3000 IU) was given before the left coronary artery wasaccessed with a JR 4 catheter introduced through a right carotid arterialsheath. Baseline coronary angiography was performed to prove leftanterior descending coronary artery (LAD) patency. Then an angio-plasty balloon of 3-mm diameter was inflated (at 4 atm) to occlude theLAD. Angiography was repeated to document coronary occlusion.Reperfusion was established after 90 minutes of total LAD occlusion.After balloon deflation, LAD patency was documented by left coronaryangiography. The animals were allowed to recover from anesthesia andwere kept alive during the next day. On the third day, the animals wereanesthetized with repeated IV boluses of sodium pentobarbital (2.4 to4.9 mg/kg; mean total dose, 41.3 mg/kg) and also received an IV bolusof heparin (3000 IU) before undergoing repeat coronary angiography todocument LAD patency 48 hours after experimental infarction.
At the end of the experimental protocol, the anesthetized animalsreceived 20 mL of thioflavin S 4% solution through an LV catheterto define the region of microvascular obstruction (no-reflow region2)immediately before cardiac arrest induced by intraventricular KCl.The heart was immediately removed from the thorax, and the atria,epicardial tissue, valvular apparatus, and right ventricular free wallwere excised. The LV was sectioned into short-axis slices 10 mmthick from the apex toward the base of the heart.
Regional MBF was measured 5 times during the experimentalprotocol: on day 1, during occlusion (30 minutes before reperfusion)and immediately before MRI scanning at 2 and 6 hours afterreperfusion, and on day 3, at 48 hours after reperfusion before andduring an IV dobutamine infusion of 7.5mg z kg21 z min21. For eachflow measurement,'2 million radioactive microspheres (15 to16 mm in diameter; DuPont) labeled with153Gd,113Sn,103Ru,95Nb, or46Sc were injected into the LV through a pigtail catheter.
MRI ProtocolContrast-enhanced MRI studies were performed at 2, 6, and 48 hoursafter reperfusion. T1-weighted images were obtained in a 1.5-Tsystem. The animals were placed in the left lateral decubitus positionwith a flexible radiofrequency coil wrapped around the chest. Weused a fast gradient-echo imaging pulse sequence, spoiled gradientrecalled (SPGR) acquisition in the steady state, described in detailelsewhere.10 This pulse sequence included nonselective preparatoryradiofrequency pulses used to drive magnetization to a steady state
before image acquisition, which resulted in homogeneous and darkprecontrast baseline images. With these parameters, pixel intensityapproximates a linear relation to 1/T1, which is linearly related tochanges in contrast concentration over a wide range of pixelintensities.10 The imaging parameters were matrix, 2563108; flipangle,a545°; field of view, 32 cm; TR56.5 ms; TE52.3 ms; slicethickness, 10 mm; and voxel dimensions, 1.233.3310 mm. Imageswere obtained at ECG-gated middiastolic phase (delay after R waveon ECG, 180 to 250 ms) and during mechanical ventilation pause atthe same time point in the respiratory cycle.
The contrast-enhanced imaging protocol began 10 seconds after a0.225-mmol/kg bolus injection of Magnevist (gadopentetate dime-glumine, Berlex) in the femoral vein and continued for 15 minutesthereafter. During the first 5 minutes of postcontrast injection,yresolution was 108 lines, and one third of k-segmented space wasacquired during each cardiac cycle (36 phase encodes per heartbeat),with 4 to 5 short-axis myocardial slices imaged 4 times during eachbreath-hold. Late images (10 to 15 minutes after contrast injection)were acquired with greater spatial resolution in they axis (252 lines)but with short-axis slices imaged only twice during each breath-hold.Breath-hold duration was kept constant (20 to 30 seconds) through-out the entire imaging protocol. Between breath-holds, animals wereventilated for at least 30 seconds.
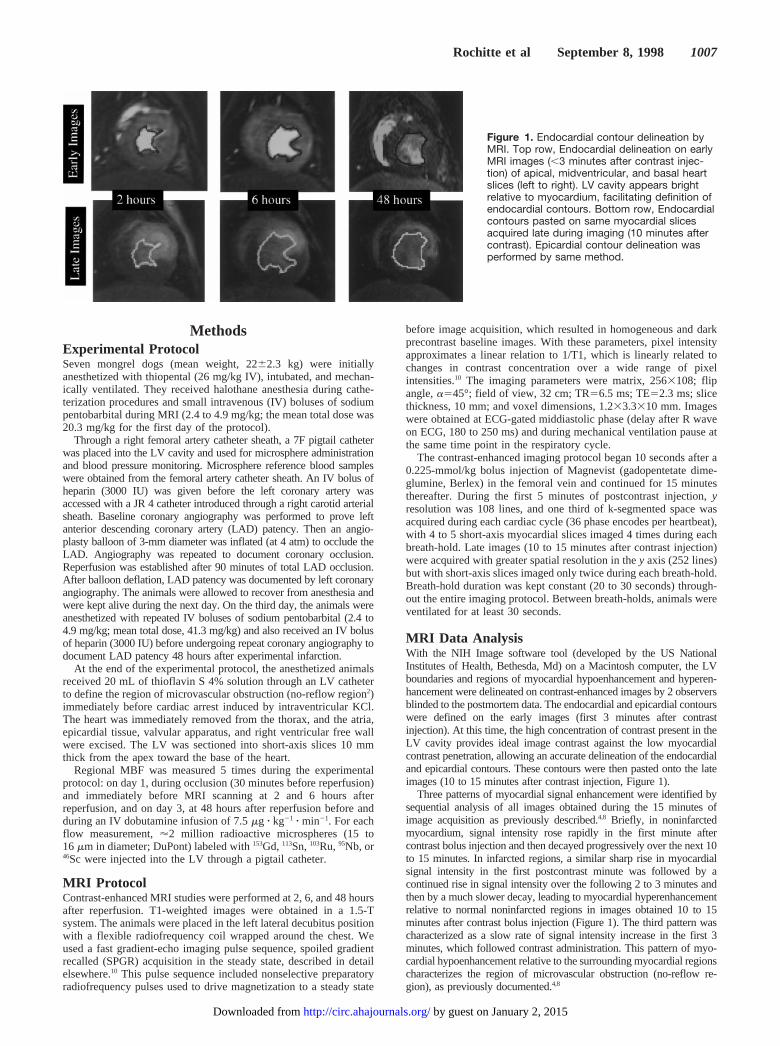
MRI Data AnalysisWith the NIH Image software tool (developed by the US NationalInstitutes of Health, Bethesda, Md) on a Macintosh computer, the LVboundaries and regions of myocardial hypoenhancement and hyperen-hancement were delineated on contrast-enhanced images by 2 observersblinded to the postmortem data. The endocardial and epicardial contourswere defined on the early images (first 3 minutes after contrastinjection). At this time, the high concentration of contrast present in theLV cavity provides ideal image contrast against the low myocardialcontrast penetration, allowing an accurate delineation of the endocardialand epicardial contours. These contours were then pasted onto the lateimages (10 to 15 minutes after contrast injection, Figure 1).
Three patterns of myocardial signal enhancement were identified bysequential analysis of all images obtained during the 15 minutes ofimage acquisition as previously described.4,8 Briefly, in noninfarctedmyocardium, signal intensity rose rapidly in the first minute aftercontrast bolus injection and then decayed progressively over the next 10to 15 minutes. In infarcted regions, a similar sharp rise in myocardialsignal intensity in the first postcontrast minute was followed by acontinued rise in signal intensity over the following 2 to 3 minutes andthen by a much slower decay, leading to myocardial hyperenhancementrelative to normal noninfarcted regions in images obtained 10 to 15minutes after contrast bolus injection (Figure 1). The third pattern wascharacterized as a slow rate of signal intensity increase in the first 3minutes, which followed contrast administration. This pattern of myo-cardial hypoenhancement relative to the surrounding myocardial regionscharacterizes the region of microvascular obstruction (no-reflow re-gion), as previously documented.4,8
Figure 1. Endocardial contour delineation byMRI. Top row, Endocardial delineation on earlyMRI images (,3 minutes after contrast injec-tion) of apical, midventricular, and basal heartslices (left to right). LV cavity appears brightrelative to myocardium, facilitating definition ofendocardial contours. Bottom row, Endocardialcontours pasted on same myocardial slicesacquired late during imaging (10 minutes aftercontrast). Epicardial contour delineation wasperformed by same method.
Rochitte et al September 8, 1998 1007
by guest on January 2, 2015http://circ.ahajournals.org/Downloaded from
The hypoenhanced regions were defined as those regions thatshowed distinct and persistent hypoenhancement for at least 1 minuteduring the first 3 minutes after contrast injection (early images).From a series of early images (acquired at 8-second intervals), foreach short-axis slice, hypoenhanced regions were selected from theimage containing the greatest area of myocardial hypoenhancement.The hyperenhanced regions were defined as distinct myocardialbrightness on late images (10 to 15 minutes after contrast injection),and its extent was measured by planimetry on the image showing thelargest bright region.
The extents of infarcted and microvascular-obstruction regionsdefined by MRI as a percentage of the total LV mass was calculatedas the sum of the regions of interest for all slices divided by the sumof the LV cross-sectional areas from all slices, as previouslydescribed8: % hypoenhanced region5S hypoenhancement area of allslices/SLV cross-sectional area of all slices.
Postmortem Delineation of Microvascular-Obstruction, Infarcted, and Risk RegionsAs described above, the LV was sectioned into cross-sectional myocar-dial slices immediately after intraventricular injection of thioflavin S andcardiac arrest. Thioflavin S is a fluorescent dye first used to demonstratethe distribution and patency of the microvasculature by means ofendothelial staining.11 It stains the endothelium of blood vessels thathave received arterial flow between the time of injection and theexcision of the heart, thereby defining the distribution of myocardialperfusion. Myocardial regions in which the microvasculature is stainedby thioflavin will fluoresce brightly when viewed under ultraviolet light,thus delineating no-reflow regions as thioflavin S–negative regions.2
The apical and basal views of each myocardial slice were first drawnonto an acetate sheet and photographed under ultraviolet light (delin-eating regions that failed to stain by thioflavin as thioflavin-negative orno-reflow regions). Immediately thereafter, the slices were submergedinto a 1% solution of triphenyltetrazolium chloride (TTC) for 20minutes at 37°C and again outlined on an acetate sheet and photo-graphed under room light (delineating regions that failed to stain withTTC as TTC-negative or infarcted regions). By this protocol, viablemyocardium reduces tetrazolium to formazan pigments by diaphoresis,which uses NADH or NADPH as an electron donor. Infarcted regionsare identified as tetrazolium-staining defects due to loss of cofactors innecrotic myocardium.12
After TTC staining, myocardial slices were sectioned into radialsegments for MBF measurements. Each myocardial segment wasdivided into 5 equal transmural pieces: 2 subendocardial, 2 subepicar-dial, and 1 midwall piece. Pieces and reference blood samples wereweighted and counted in ag-emission spectrometer (Packard). Theradioactive counting and flow calculations were performed by standardmethods.13,14 Segments 6 to 11 mm wide were obtained inside theTTC-negative and remote regions. In addition, 5 strips 1 mm wide wereexcised outside each lateral border of the TTC-negative region toincrease the spatial resolution of MBF measurements.
Risk regions were defined by MBF measurements as previouslydescribed.8,15–17 This technique has been validated in our laboratoryagainst staining methods such as monastral blue dye injection.18 Inbrief, myocardial pieces with MBF,50% of the MBF in theequivalent remote-region piece during coronary occlusion consti-tuted the risk region. The precise location and size of each myocar-dial piece was recorded on acetate sheets, constituting the “blood-flow map.” This blood-flow map was also compared withphotographs and transparencies, registering the extent and locationof the infarcted and no-reflow regions defined by myocardialstaining, to delineate the at-risk but noninfarcted region (the TTC-positive region with MBF,50% at the time of coronary occlusion).Similarly, regions of microvascular obstruction defined by MBFmeasurements were those containing pieces with MBF,50%relative to its corresponding remote piece at 2, 6, and 48 hours aftercoronary reflow, as previously described.8 By use of the blood-flowmap, the risk and no-reflow regions were measured by planimetry(Sigma-Scan, Jandel Scientific). Very importantly, drawings weredouble-checked by comparison with the photographs to ensure theaccuracy of all topographic measurements.
Four regions were defined on the basis of the postmortem data forblood-flow measurement purposes: the remote region, defined as theLV wall opposite the infarct; the TTC-positive/risk region, definedas the TTC-positive regions with MBF,50% relative to remoteregion during coronary occlusion; the thioflavin-positive/infarctedregion, defined as the TTC-negative but thioflavin-positive regions;and the region of microvascular obstruction (no-reflow region),defined as the thioflavin-negative regions.
To compare MRI-defined regions of myocardial infarction andmicrovascular obstruction with corresponding regions defined atpostmortem examination, 3 topographic regions were defined: theregion of microvascular obstruction (no-reflow region), defined bystaining as the thioflavin-negative regions and by MBF measure-ments as regions with MBF,50% relative to the remote region afterreperfusion; the infarcted region, defined as the entire TTC-negativeregions; and the risk region, defined as the regions with MBF,50%relative to the remote region during coronary occlusion.
To calculate infarct size in terms of percent total LV mass, we tookthe union of the infarcted regions drawn from the apical and basal viewsof each myocardial slice. The total LV mass was calculated by use of theepicardial contour from the basal view and the endocardial contour fromthe apical view of each myocardial slice. Thus, infarct size wascalculated as % infarcted regions5S TTC-negative area of all slices/SLV cross-sectional area of all slices. The extent of risk andmicrovascular-obstruction regions in terms of percent total LV masswere calculated by a similar methodology.
Cross-registration of MRI with histopathological data was used inthis study for qualitative comparisons only, with the sole objective ofexamining the equivalence of spatial localization of infarcted andno-reflow regions obtained by MRI against histopathological stain-ing methods performed during postmortem examination. To matchthe locations of anatomic myocardial slices relative to MRI short-axis images, we selected the most apical short-axis image that stillshowed residual LV cavity. Starting at this slice location, weobtained several (typically 5) parallel, 10-mm-thick short-axis slicesup to the LV base defined by the mitral valve ring. Later, onpostmortem examination, we cut our first apical short-axis slice sothat it contained the residual apical portion of the LV cavity, similarto that obtained by MRI. We then proceeded to section the leftventricle from apex to base in slices 1 cm thick, comparable to theimage planes obtained by MRI. We then used natural LV landmarks,such as the papillary muscles and the connections between right andleft ventricles, to superimpose the transparencies generated duringpostmortem examination onto MRI images.
Statistical AnalysisThe extent of the regions based on MBF measurements, MRI, andmyocardial staining are expressed as mean6SEM. We used repeated-measures ANOVA and the Bonferroni test for multiple comparisons ofMBF measurements across time and between different regions. Simplelinear regression was used to assess the correlation between MRI andpostmortem or microsphere measurements. The treatment for extremevalues in the analysis across time was 2-fold: a sensitivity analysis19 withremoval of these values and a nonparametric method (the Friedmantest20) not influenced by extreme values.
ResultsHemodynamicsHeart rate, systolic and mean blood pressures, and the heartrate3systolic blood pressure (double product) are shown atdifferent times during the experimental protocol (Table).There was a slight decrease in blood pressure during occlu-sion, with recovery 2 hours after reperfusion. Dobutaminestimulation, used primarily to assess coronary flow reserve inmyocardium injured by different degrees of ischemia, causedan increase in heart rate (10.165%), mean blood pressure(18.065%), systolic blood pressure (18.066%), and thedouble product (30.866%, Table).
1008 Time Course of Microvascular Obstruction
by guest on January 2, 2015http://circ.ahajournals.org/Downloaded from
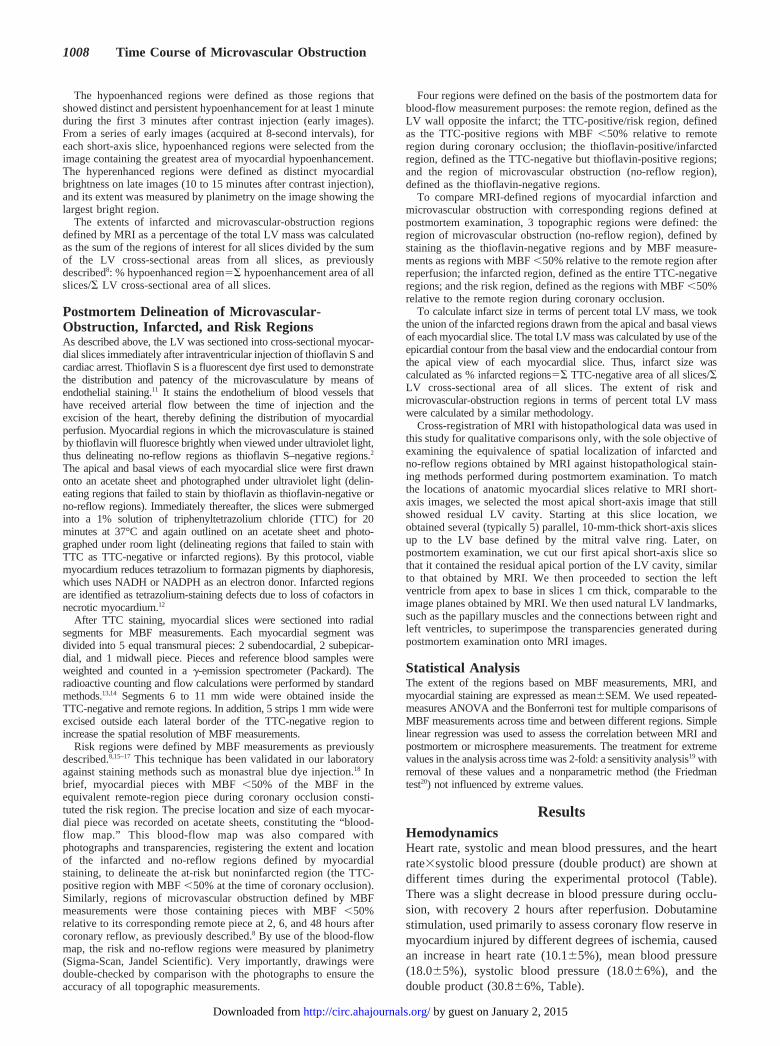
Myocardial Blood FlowAbsolute radioactive MBF measurements at different timepoints during the experimental protocol are shown in Figure 2.During total coronary occlusion, we found significantly lowerMBFs in the thioflavin-negative region (0.0560.01 mLz min21 zg21), the TTC-negative/thioflavin-positive region (0.0960.01mL z min21 z g21), and the TTC-positive/risk region (0.3460.03mL z min21 z g21) compared with noninfarcted remote regions(0.9660.06 mLz min21 z g21). Two hours after reperfusion, MBFwas restored in all previously underperfused regions, includingthe thioflavin-negative region (1.3160.39 mL z min21 z g21,107.6629.0% relative to remote region). However, MBF de-creased significantly in the thioflavin-negative regions 6 hoursafter reperfusion (0.7060.16 mL z min21 z g21, 45.4612.8% ofremote flow) and remained at low levels up to 48 hours afterinfarction/reperfusion (0.5560.18 mLz min21 z g21, 39.568.3%of remote flow;P50.005). Forty-eight hours after infarction,there were no statistically significant differences in MBF amongregions outside the thioflavin-negative region. Moreover, remotenoninfarcted regions showed little variation in absolute MBFduring the entire experimental protocol except during catechol-amine stimulation. This pattern of MBF alterations demonstratesthe development of microvascular obstruction at the infarct core.
During dobutamine stimulation, there was an increase inabsolute flow in all regions. However, such augmentationwas progressively lower from the remote to the thioflavin-negative regions, for which changes in MBF were notstatistically significant. Mean MBF increase was 85.2% in theremote, 84.4% in the TTC-positive/risk, 57.6% in the TTC-negative/thioflavin-positive (P,0.05 by repeated-measuresANOVA with Bonferroni correction), and 25.6% in thethioflavin-negative region (ANOVA,P5NS).
Time Course of Microvascular Obstruction AfterMyocardial Infarction and ReperfusionThe extent of microvascular obstruction by MRI expressed aspercent hypoenhanced LV mass after contrast injection was
measured at 2, 6, and 48 hours after coronary reflow. The extentof microvascular obstruction by MRI at 48 hours correlated wellwith microvascular obstruction measured as the extent of thethioflavin-negative LV mass at postmortem examination (Fig-ures 3 and 4, A and B). Moreover, there was also a goodcorrelation between microvascular obstruction by MRI and byMBF measured 48 hours after reperfusion (Figure 4A and 4C).
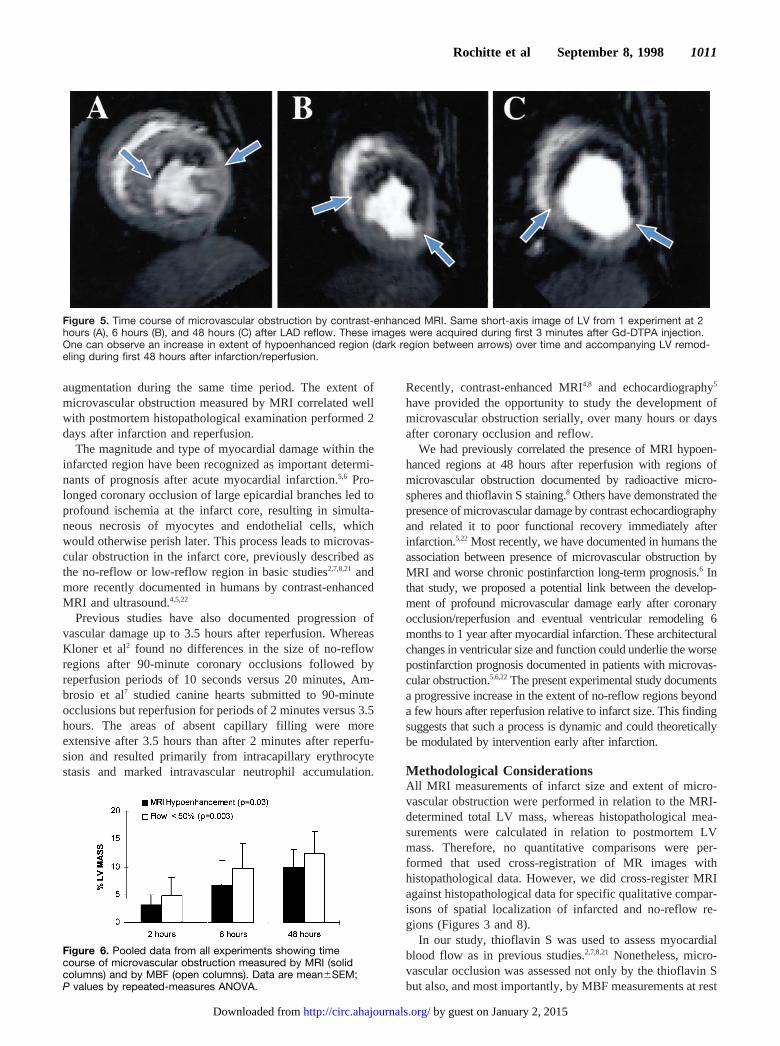
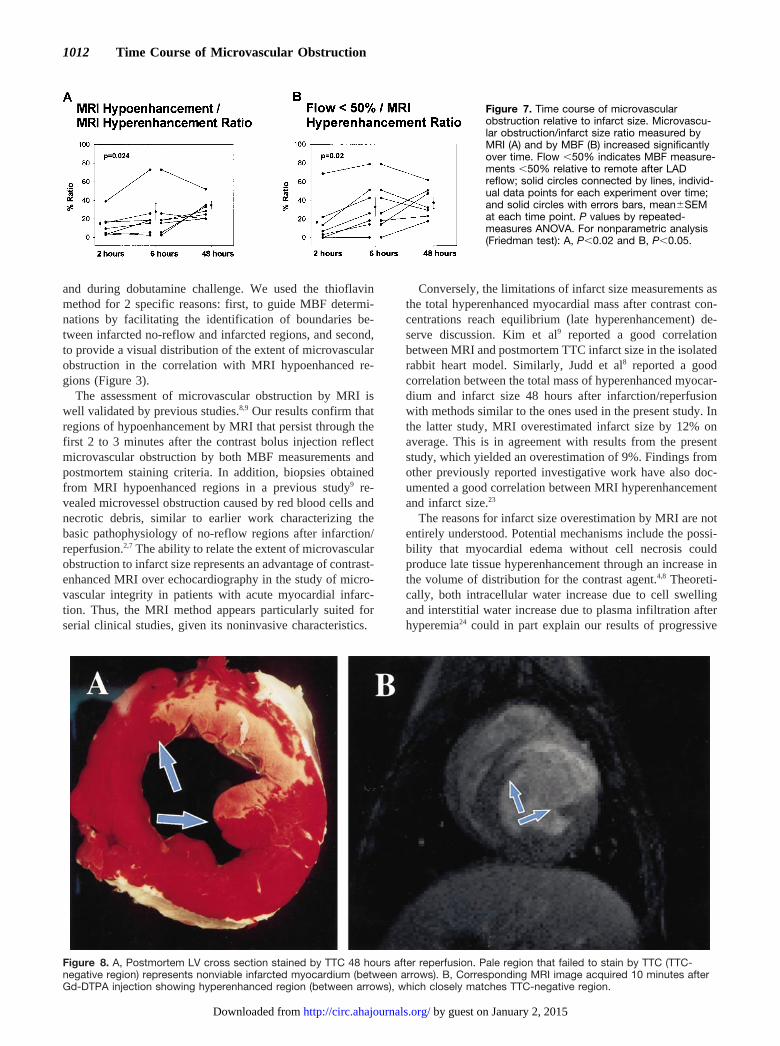
Microvascular obstruction assessed as hypoenhanced regionson contrast-enhanced MRI increased in size in the first 48 hoursafter reperfusion (Figures 5 and 6). At 2 hours after reperfusion,the extent of microvascular obstruction by MRI was 3.261.8%of the LV mass; at 6 hours, it increased to 6.764.4%; and at 48hours, it reached 9.963.2% (P50.03 by repeated-measuresANOVA). Microvascular obstruction defined by MBF also hada progressive and statistically significant increase up to 48 hoursafter reperfusion, from 4.863.3% at 2 hours to 9.764.5% at 6hours and to 12.564.0% at 48 hours, withP50.003 (Figure 6).The extent of MRI-defined microvascular obstruction, relative tototal myocardial infarct size defined as the total hyperenhancedmyocardial mass, increased progressively up to 48 hours aftercoronary occlusion and reflow, from 13.064.8% at 2 hours to22.668.9% at 6 hours and to 30.464.2% at 48 hours (P50.024,Figure 7). The ratio of microvascular obstruction by radioactivemicrosphere to the MRI-defined infarcted region increasedsimilarly over the same time period (P50.02, Figure 7B).
Because 1 of our experiments showed much greater micro-vascular obstruction magnitudes than the other cases at all 3 timepoints, measured either by MRI or by MBF measurements(Figure 4A), we used 2 additional methods to further assess thestatistical significance of the alterations in microvascular dam-age over time. A sensitivity analysis19 excluding the observedextreme values provided even stronger evidence that microvas-cular obstruction by both MRI and MBF increases over time upto 48 hours after coronary reflow (P,0.01 for both). In addition,a nonparametric method not influenced by extreme values, theFriedman test,20 was performed and also confirmed the statistical
Figure 2. Radioactive MBF measurements. Microsphereabsolute blood flow (mL z min21 z g21) from each region ofinterest during occlusion, 2, 6, and 48 hours after reperfu-sion, and during dobutamine stimulation. Columns anderror bars represent mean6SEM. P values ,0.05 byrepeated-measures ANOVA with Bonferroni multicompari-son tests performed between specific regions of interestagainst remote region at each time point are also shown.*P,0.05 vs remote.
Hemodynamics
Baseline Occlusion 10 min 2 h 6 h 48 h Dobutamine
Heart rate, bpm 11366 11869 11866 104610 11967 13565 14767
Systolic blood pressure, mm Hg 11965 10963 9863 12265 11968 13166 15468
Mean blood pressure, mm Hg 9663 8764 7764 9865 9768 10065 11864
Pressure-rate product, 13469 12969 11565 125610 141613 176611 225615
bpm3mm Hg3100
Data are expressed as mean6SEM.
Rochitte et al September 8, 1998 1009
by guest on January 2, 2015http://circ.ahajournals.org/Downloaded from
significance of the microvascular obstruction progression overtime measured by both MRI and MBF (P,0.05 andP,0.01,respectively).
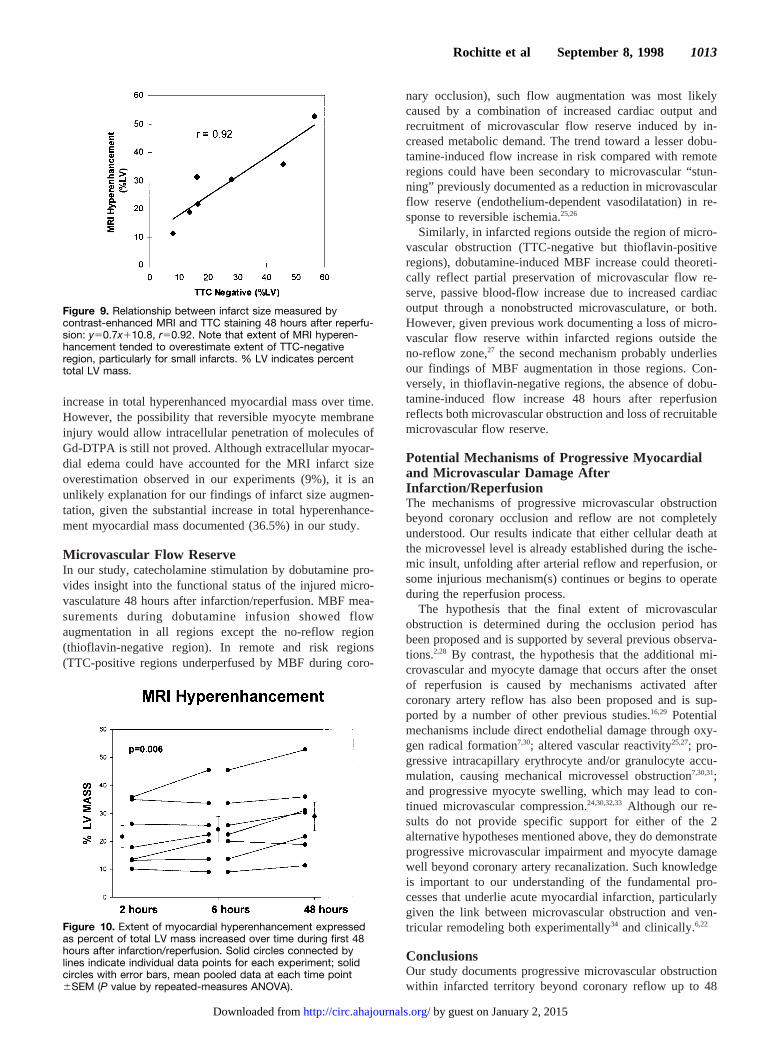
Time Course of Myocardial Infarction AfterCoronary Occlusion and ReflowThe extent of myocardial infarction defined by MRI corre-lated well with infarct size measured by TTC on postmortemexamination (Figures 8 and 9). The extent of myocardialdamage by MRI (28.865.1%) overestimated by 9.4% theTTC-negative area, which was 26.466.9%. Moreover, theextent of myocardial infarction was augmented 36.5610.5%in the 2 days after coronary occlusion and reflow. Infarctextent by MRI was 21.764.0% at 2 hours, 24.364.6% at 6hours, and 28.865.1% at 48 hours (P,0.006 by repeated-measures ANOVA, Figure 10).
The volume of LV myocardial tissue underperfused at thetime of coronary occlusion (territory at risk) represented37.266.0% of the total LV mass. However, because the totalmass of hyperenhanced myocardium increased over time,infarct size relative to the risk region increased from58.264.3% at 2 hours to 63.662.7% at 6 hours and
77.765.1% at 48 hours (P50.004). In addition, 65.767.3%of the risk region was TTC-negative at postmortem exami-nation, which was similar to the MRI infarct size/risk ratio at48 hours (77.765.1%, P5NS). Finally, the size of the riskregion was proportional to the extent of myocardial infarctionby MRI at 2 (y50.62x21.5,r50.93), 6 (y50.76x23.96,r50.98), and 48 (y50.78x20.32,r50.93) hours after reper-fusion. A similar relationship was found between the size ofthe risk region at the time of coronary occlusion and TTC-negative infarct size measured at postmortem examination 48hours later (y51.08x213.71,r50.95).
Discussion
Microvascular ObstructionThis is the first study designed to investigate the time courseof microvascular obstruction in the 2 days that followcoronary occlusion and reperfusion. Our results demonstratea consistent increase in the region of microvascular obstruc-tion defined by both radioactive microspheres and contrast-enhanced MRI up to 48 hours after acute myocardial infarc-tion. This increase occurs over and above infarct size
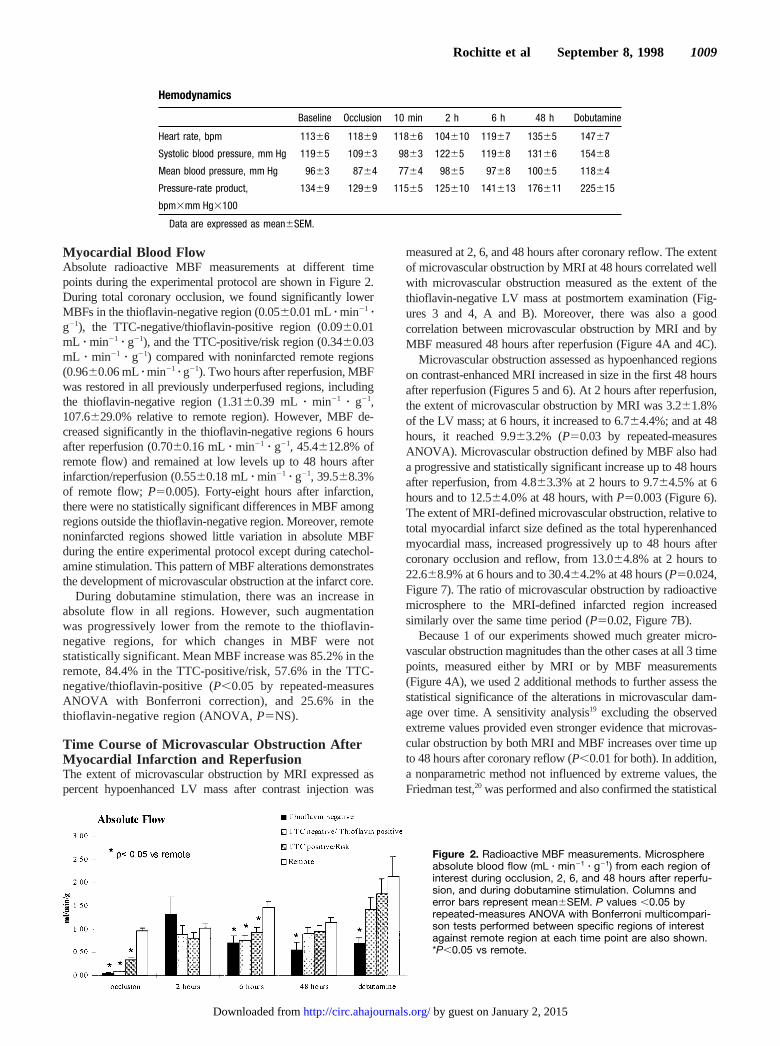
Figure 3. A, Postmortem myocardial slice stained by thioflavin S 48 hours after infarction/reperfusion. Note brown region betweenarrows, which failed to stain by thioflavin S due to microvascular obstruction (thioflavin-negative region). B, Equivalent short-axis sliceacquired by MRI 2 minutes after contrast injection at 48 hours after reperfusion. Note hypoenhanced (dark) MRI region between arrowssimilar in size and location to thioflavin-negative region shown in A.
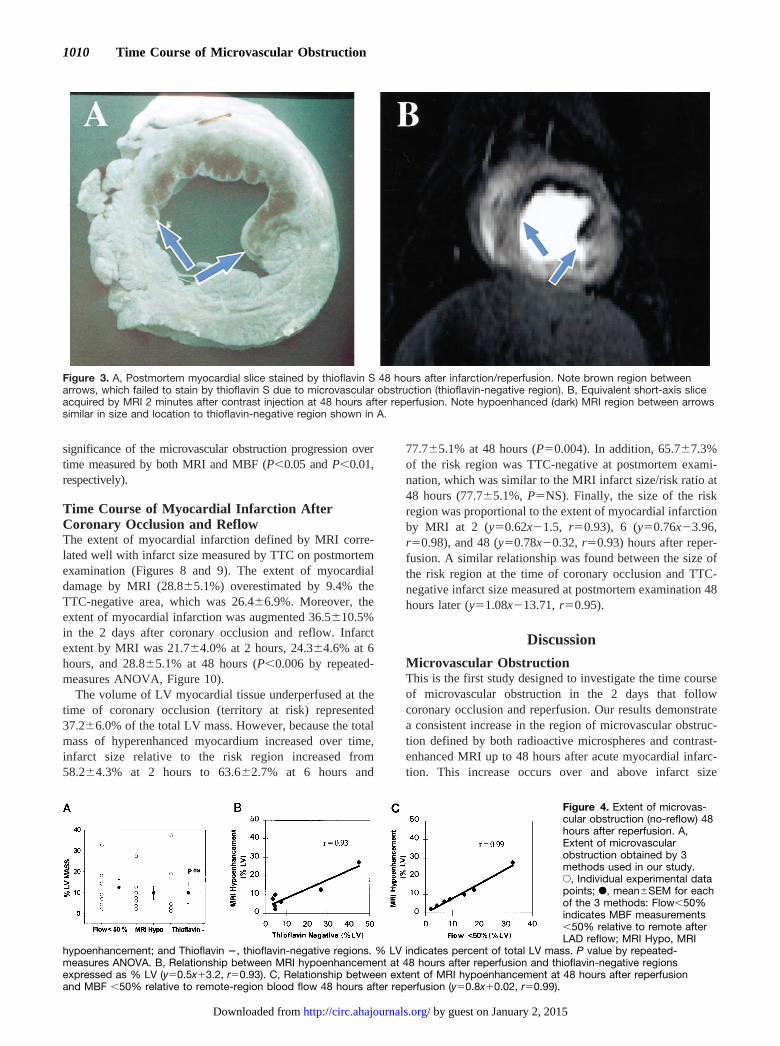
Figure 4. Extent of microvas-cular obstruction (no-reflow) 48hours after reperfusion. A,Extent of microvascularobstruction obtained by 3methods used in our study.E, Individual experimental datapoints; F, mean6SEM for eachof the 3 methods: Flow,50%indicates MBF measurements,50% relative to remote afterLAD reflow; MRI Hypo, MRI
hypoenhancement; and Thioflavin 2, thioflavin-negative regions. % LV indicates percent of total LV mass. P value by repeated-measures ANOVA. B, Relationship between MRI hypoenhancement at 48 hours after reperfusion and thioflavin-negative regionsexpressed as % LV (y50.5x13.2, r50.93). C, Relationship between extent of MRI hypoenhancement at 48 hours after reperfusionand MBF ,50% relative to remote-region blood flow 48 hours after reperfusion (y50.8x10.02, r50.99).
1010 Time Course of Microvascular Obstruction
by guest on January 2, 2015http://circ.ahajournals.org/Downloaded from
augmentation during the same time period. The extent ofmicrovascular obstruction measured by MRI correlated wellwith postmortem histopathological examination performed 2days after infarction and reperfusion.
The magnitude and type of myocardial damage within theinfarcted region have been recognized as important determi-nants of prognosis after acute myocardial infarction.5,6 Pro-longed coronary occlusion of large epicardial branches led toprofound ischemia at the infarct core, resulting in simulta-neous necrosis of myocytes and endothelial cells, whichwould otherwise perish later. This process leads to microvas-cular obstruction in the infarct core, previously described asthe no-reflow or low-reflow region in basic studies2,7,8,21 andmore recently documented in humans by contrast-enhancedMRI and ultrasound.4,5,22
Previous studies have also documented progression ofvascular damage up to 3.5 hours after reperfusion. WhereasKloner et al2 found no differences in the size of no-reflowregions after 90-minute coronary occlusions followed byreperfusion periods of 10 seconds versus 20 minutes, Am-brosio et al7 studied canine hearts submitted to 90-minuteocclusions but reperfusion for periods of 2 minutes versus 3.5hours. The areas of absent capillary filling were moreextensive after 3.5 hours than after 2 minutes after reperfu-sion and resulted primarily from intracapillary erythrocytestasis and marked intravascular neutrophil accumulation.
Recently, contrast-enhanced MRI4,8 and echocardiography5
have provided the opportunity to study the development ofmicrovascular obstruction serially, over many hours or daysafter coronary occlusion and reflow.
We had previously correlated the presence of MRI hypoen-hanced regions at 48 hours after reperfusion with regions ofmicrovascular obstruction documented by radioactive micro-spheres and thioflavin S staining.8 Others have demonstrated thepresence of microvascular damage by contrast echocardiographyand related it to poor functional recovery immediately afterinfarction.5,22 Most recently, we have documented in humans theassociation between presence of microvascular obstruction byMRI and worse chronic postinfarction long-term prognosis.6 Inthat study, we proposed a potential link between the develop-ment of profound microvascular damage early after coronaryocclusion/reperfusion and eventual ventricular remodeling 6months to 1 year after myocardial infarction. These architecturalchanges in ventricular size and function could underlie the worsepostinfarction prognosis documented in patients with microvas-cular obstruction.5,6,22The present experimental study documentsa progressive increase in the extent of no-reflow regions beyonda few hours after reperfusion relative to infarct size. This findingsuggests that such a process is dynamic and could theoreticallybe modulated by intervention early after infarction.
Methodological ConsiderationsAll MRI measurements of infarct size and extent of micro-vascular obstruction were performed in relation to the MRI-determined total LV mass, whereas histopathological mea-surements were calculated in relation to postmortem LVmass. Therefore, no quantitative comparisons were per-formed that used cross-registration of MR images withhistopathological data. However, we did cross-register MRIagainst histopathological data for specific qualitative compar-isons of spatial localization of infarcted and no-reflow re-gions (Figures 3 and 8).
In our study, thioflavin S was used to assess myocardialblood flow as in previous studies.2,7,8,21 Nonetheless, micro-vascular occlusion was assessed not only by the thioflavin Sbut also, and most importantly, by MBF measurements at rest
Figure 5. Time course of microvascular obstruction by contrast-enhanced MRI. Same short-axis image of LV from 1 experiment at 2hours (A), 6 hours (B), and 48 hours (C) after LAD reflow. These images were acquired during first 3 minutes after Gd-DTPA injection.One can observe an increase in extent of hypoenhanced region (dark region between arrows) over time and accompanying LV remod-eling during first 48 hours after infarction/reperfusion.
Figure 6. Pooled data from all experiments showing timecourse of microvascular obstruction measured by MRI (solidcolumns) and by MBF (open columns). Data are mean6SEM;P values by repeated-measures ANOVA.
Rochitte et al September 8, 1998 1011
by guest on January 2, 2015http://circ.ahajournals.org/Downloaded from
and during dobutamine challenge. We used the thioflavinmethod for 2 specific reasons: first, to guide MBF determi-nations by facilitating the identification of boundaries be-tween infarcted no-reflow and infarcted regions, and second,to provide a visual distribution of the extent of microvascularobstruction in the correlation with MRI hypoenhanced re-gions (Figure 3).
The assessment of microvascular obstruction by MRI iswell validated by previous studies.8,9 Our results confirm thatregions of hypoenhancement by MRI that persist through thefirst 2 to 3 minutes after the contrast bolus injection reflectmicrovascular obstruction by both MBF measurements andpostmortem staining criteria. In addition, biopsies obtainedfrom MRI hypoenhanced regions in a previous study9 re-vealed microvessel obstruction caused by red blood cells andnecrotic debris, similar to earlier work characterizing thebasic pathophysiology of no-reflow regions after infarction/reperfusion.2,7 The ability to relate the extent of microvascularobstruction to infarct size represents an advantage of contrast-enhanced MRI over echocardiography in the study of micro-vascular integrity in patients with acute myocardial infarc-tion. Thus, the MRI method appears particularly suited forserial clinical studies, given its noninvasive characteristics.
Conversely, the limitations of infarct size measurements asthe total hyperenhanced myocardial mass after contrast con-centrations reach equilibrium (late hyperenhancement) de-serve discussion. Kim et al9 reported a good correlationbetween MRI and postmortem TTC infarct size in the isolatedrabbit heart model. Similarly, Judd et al8 reported a goodcorrelation between the total mass of hyperenhanced myocar-dium and infarct size 48 hours after infarction/reperfusionwith methods similar to the ones used in the present study. Inthe latter study, MRI overestimated infarct size by 12% onaverage. This is in agreement with results from the presentstudy, which yielded an overestimation of 9%. Findings fromother previously reported investigative work have also doc-umented a good correlation between MRI hyperenhancementand infarct size.23
The reasons for infarct size overestimation by MRI are notentirely understood. Potential mechanisms include the possi-bility that myocardial edema without cell necrosis couldproduce late tissue hyperenhancement through an increase inthe volume of distribution for the contrast agent.4,8 Theoreti-cally, both intracellular water increase due to cell swellingand interstitial water increase due to plasma infiltration afterhyperemia24 could in part explain our results of progressive
Figure 8. A, Postmortem LV cross section stained by TTC 48 hours after reperfusion. Pale region that failed to stain by TTC (TTC-negative region) represents nonviable infarcted myocardium (between arrows). B, Corresponding MRI image acquired 10 minutes afterGd-DTPA injection showing hyperenhanced region (between arrows), which closely matches TTC-negative region.
Figure 7. Time course of microvascularobstruction relative to infarct size. Microvascu-lar obstruction/infarct size ratio measured byMRI (A) and by MBF (B) increased significantlyover time. Flow ,50% indicates MBF measure-ments ,50% relative to remote after LADreflow; solid circles connected by lines, individ-ual data points for each experiment over time;and solid circles with errors bars, mean6SEMat each time point. P values by repeated-measures ANOVA. For nonparametric analysis(Friedman test): A, P,0.02 and B, P,0.05.
1012 Time Course of Microvascular Obstruction
by guest on January 2, 2015http://circ.ahajournals.org/Downloaded from
increase in total hyperenhanced myocardial mass over time.However, the possibility that reversible myocyte membraneinjury would allow intracellular penetration of molecules ofGd-DTPA is still not proved. Although extracellular myocar-dial edema could have accounted for the MRI infarct sizeoverestimation observed in our experiments (9%), it is anunlikely explanation for our findings of infarct size augmen-tation, given the substantial increase in total hyperenhance-ment myocardial mass documented (36.5%) in our study.
Microvascular Flow ReserveIn our study, catecholamine stimulation by dobutamine pro-vides insight into the functional status of the injured micro-vasculature 48 hours after infarction/reperfusion. MBF mea-surements during dobutamine infusion showed flowaugmentation in all regions except the no-reflow region(thioflavin-negative region). In remote and risk regions(TTC-positive regions underperfused by MBF during coro-
nary occlusion), such flow augmentation was most likelycaused by a combination of increased cardiac output andrecruitment of microvascular flow reserve induced by in-creased metabolic demand. The trend toward a lesser dobu-tamine-induced flow increase in risk compared with remoteregions could have been secondary to microvascular “stun-ning” previously documented as a reduction in microvascularflow reserve (endothelium-dependent vasodilatation) in re-sponse to reversible ischemia.25,26
Similarly, in infarcted regions outside the region of micro-vascular obstruction (TTC-negative but thioflavin-positiveregions), dobutamine-induced MBF increase could theoreti-cally reflect partial preservation of microvascular flow re-serve, passive blood-flow increase due to increased cardiacoutput through a nonobstructed microvasculature, or both.However, given previous work documenting a loss of micro-vascular flow reserve within infarcted regions outside theno-reflow zone,27 the second mechanism probably underliesour findings of MBF augmentation in those regions. Con-versely, in thioflavin-negative regions, the absence of dobu-tamine-induced flow increase 48 hours after reperfusionreflects both microvascular obstruction and loss of recruitablemicrovascular flow reserve.
Potential Mechanisms of Progressive Myocardialand Microvascular Damage AfterInfarction/ReperfusionThe mechanisms of progressive microvascular obstructionbeyond coronary occlusion and reflow are not completelyunderstood. Our results indicate that either cellular death atthe microvessel level is already established during the ische-mic insult, unfolding after arterial reflow and reperfusion, orsome injurious mechanism(s) continues or begins to operateduring the reperfusion process.
The hypothesis that the final extent of microvascularobstruction is determined during the occlusion period hasbeen proposed and is supported by several previous observa-tions.2,28 By contrast, the hypothesis that the additional mi-crovascular and myocyte damage that occurs after the onsetof reperfusion is caused by mechanisms activated aftercoronary artery reflow has also been proposed and is sup-ported by a number of other previous studies.16,29 Potentialmechanisms include direct endothelial damage through oxy-gen radical formation7,30; altered vascular reactivity25,27; pro-gressive intracapillary erythrocyte and/or granulocyte accu-mulation, causing mechanical microvessel obstruction7,30,31;and progressive myocyte swelling, which may lead to con-tinued microvascular compression.24,30,32,33 Although our re-sults do not provide specific support for either of the 2alternative hypotheses mentioned above, they do demonstrateprogressive microvascular impairment and myocyte damagewell beyond coronary artery recanalization. Such knowledgeis important to our understanding of the fundamental pro-cesses that underlie acute myocardial infarction, particularlygiven the link between microvascular obstruction and ven-tricular remodeling both experimentally34 and clinically.6,22
ConclusionsOur study documents progressive microvascular obstructionwithin infarcted territory beyond coronary reflow up to 48
Figure 9. Relationship between infarct size measured bycontrast-enhanced MRI and TTC staining 48 hours after reperfu-sion: y50.7x110.8, r50.92. Note that extent of MRI hyperen-hancement tended to overestimate extent of TTC-negativeregion, particularly for small infarcts. % LV indicates percenttotal LV mass.
Figure 10. Extent of myocardial hyperenhancement expressedas percent of total LV mass increased over time during first 48hours after infarction/reperfusion. Solid circles connected bylines indicate individual data points for each experiment; solidcircles with error bars, mean pooled data at each time point6SEM (P value by repeated-measures ANOVA).
Rochitte et al September 8, 1998 1013
by guest on January 2, 2015http://circ.ahajournals.org/Downloaded from
hours after myocardial infarction. This increase in the no-reflow region relative to infarct size was documented by bothMRI and MBF methods. In addition, we also report progres-sive augmentation in the total myocardial mass injured byischemia/reperfusion up to 48 hours after myocardial infarc-tion. These results support the concept that myocardial injurycontinues beyond reperfusion, in terms of both additionalmicrovascular damage and total infarcted myocardial mass.
AcknowledgmentsThis work was supported by Grant-in-Aid 92–10-26–01 of theAmerican Heart Association, Dallas, Tex, and by NHLBI grantsHL-45090 and P50-HL-52315 (SCOR in Ischemic Heart Disease),NIH, Bethesda, Md. Dr Rochitte was supported in part by fellowshipgrant 200247/95–6 from the Brazilian National Research Council(CNPq). Dr McVeigh is an established investigator of the AHA andis also partially funded through a Whitaker Biomedical EngineeringResearch Grant. Dr Melin was supported by a visiting scientist grantfrom the Saint-Luc Foundation, Brussels, Belgium.
References1. Grines CL, Browne KF, Marco J, Rothbaum D, Stone GW, O’Keefe J,
Overlie P, Donohue B, Chelliah N, Timmis GC, Vlietstra RE, StrzeleckiM, Puchrowicz-Ochocki S, O’Neill WW, for the Primary Angioplasty inMyocardial Infarction Study Group. A comparison of immediate angio-plasty with thrombolytic therapy for acute myocardial infarction.N EnglJ Med. 1993;328:673–679.
2. Kloner RA, Ganote CE, Jennings RB. The “no-reflow” phenomenon aftertemporary coronary occlusion in the dog.J Clin Invest. 1974;54:1496–1508.
3. Schofer J, Montz R, Mathey DG. Scintigraphy evidence of the “no-reflow” phenomenon in human beings after coronary thrombolysis.J AmColl Cardiol. 1985;5:593–598.
4. Lima JAC, Judd RM, Bazille A, Schulman SP, Atalar E, Zerhouni EA.Regional heterogeneity of human myocardial infarcts demonstrated bycontrast-enhanced MRI: potential mechanisms.Circulation. 1995;92:1117–1125.
5. Ito H, Tomooka T, Sakai N, Yu H, Higashino Y, Fujii K, Masuyama T,Kitabatake A, Minamino T. Lack of myocardial perfusion immediatelyafter successful thrombolysis: a predictor of poor recovery of left ven-tricular function in anterior myocardial infarction.Circulation. 1992;85:1699–1705.
6. Wu KC, Zerhouni EA, Judd RM, Lugo-Olivieri CH, Barouch LA,Schulman SP, Blumenthal RS, Lima JAC. The prognostic significance ofmicrovascular obstruction by magnetic resonance imaging in patientswith acute myocardial infarction.Circulation. 1998;97:765–772.
7. Ambrosio G, Weisman HF, Mannisi JA, Becker LC. Progressiveimpairment of regional myocardial perfusion after initial restoration ofpostischemic blood flow.Circulation. 1989;80:1846–1861.
8. Judd RM, Lugo-Olivieri CH, Arai M, Kondo T, Croisille P, Lima JAC,Mohan V, Becker LC, Zerhouni EA. Physiological basis of myocardialcontrast enhancement in fast magnetic resonance images of 2-day-oldreperfused canine infarcts.Circulation. 1995;92:1902–1910.
9. Kim RJ, Chen E, Lima JAC, Judd RM. Myocardial Gd-DTPA kineticsdetermine MRI contrast enhancement and reflect the extent and severityof myocardial injury after acute reperfused infarction.Circulation. 1996;94:3318–3326.
10. Judd RM, Reeder SB, Atalar E, McVeigh ER, Zerhouni EA. Amagnetization-driven gradient echo pulse sequence for the study of myo-cardial perfusion.Magn Reson Med. 1995;34:276–282.
11. Schlegel JU. Demonstration of blood vessels and lymphatics with afluorescent dye in ultraviolet light.Anat Rec. 1949;105:433–453.
12. Klein HH, Puschmann J, Schaper J, Schaper W. The mechanism of thetetrazolium reaction in identifying experimental myocardial infarction.Virchows Arch (Pathol Anat). 1981;393:287–297.
13. Domenech RJ, Hoffman JIE, Noble MIM, Saunders KB, Henson JR,Subijanto S. Total and regional coronary blood flow measured by radio-active microspheres in conscious and anesthetized dogs.Circ Res. 1969;25:581–596.
14. Jugdutt BI, Hutchins GM, Bulkley BH, Becker LC. Myocardial infarctionin the conscious dog: three-dimensional mapping of infarct, collateralflow and region at risk.Circulation. 1979;60:1141–1150.
15. Becker LC, Schuster E, Jugdutt BI, Hutchins GM, Bulkley BH. Rela-tionship between myocardial infarct size and occluded bed size in thedog: difference between left anterior descending and circumflex coronaryartery occlusions.Circulation. 1983;67:549–557.
16. Arai M, Lefer DJ, So T, DiPaula A, Aversano T, Becker LC. Ananti-CD18 antibody limits infarct size and preserves left ventricularfunction in dogs with ischemia and 48-hour reperfusion.J Am CollCardiol. 1996;27:1278–1285.
17. Lima JAC, Becker LC, Melin JA, Lima S, Kallman CA, Weisfeldt ML,Weiss JL. Impaired thickening of nonischemic myocardium during acuteregional ischemia in the dog.Circulation. 1985;71:1048–1059.
18. Melin JA, Becker LC. Salvage of ischemic myocardium by prostacyclinduring experimental myocardial infarction.J Am Coll Cardiol. 1983;2:279–286.
19. Altman DG. Preparing to analyse data. In: Altman DG, ed.PracticalStatistics for Medical Research. London, UK: Chapman & Hall; 1991:122–151.
20. Altman DG. Relation between several variables. In: Altman DG, ed.Practical Statistics for Medical Research. London, UK: Chapman & Hall;1991:325–364.
21. Jeremy RW, Links JM, Becker LC. Progressive failure of coronary flowduring reperfusion of myocardial infarction: documentation of the noreflow phenomenon with positron emission tomography.J Am CollCardiol. 1990;16:695–704.
22. Ito H, Maruyama A, Iwakura K, Takiuchi S, Masuyama T, Hori M,Higashino Y, Fujii K, Minamino T. Clinical implications of the “no-reflow” phenomenon: a predictor of complications and left ventricularremodeling in reperfused anterior wall myocardial infarction.Circulation.1996;93:223–228.
23. Nishimura T, Yamada Y, Hayashi M, Kozuka T, Nakatani T, Noda H,Takano H. Determination of infarct size of acute myocardial infarction indogs by magnetic resonance imaging and gadolinium-DTPA: comparisonwith indium-111 antimyosin imaging.Am J Physiol Imaging. 1989;4:82–88.
24. Jennings RB, Schaper J, Hill ML, Steenbergen CJ, Reimer KA. Effect ofreperfusion late in the phase of reversible ischemic injury: changes in cellvolume, electrolytes, metabolites, and ultrastructure.Circ Res. 1985;56:262–278.
25. Bolli R, Triana JF, Jeroudi MO. Prolonged impairment of coronaryvasodilation after reversible ischemia: evidence for microvascular “stun-ning.” Circ Res. 1990;67:332–343.
26. Nicklas JM, Gips SJ. Decreased coronary flow reserve after transientmyocardial ischemia in dogs.J Am Coll Cardiol. 1989;13:195–199.
27. Sklenar J, Camarano G, Goodman C, Ismail S, Jayaweera AR, Kaul S.Contractile versus microvascular reserve for the determination of theextent of myocardial salvage after reperfusion: the effect of residualstenosis.Circulation. 1996;94:1430–1440.
28. Fishbein MC, Y-Rit J, Lando U, Kanmatsuse K, Mercier JC, Ganz W.The relationship of vascular injury and myocardial hemorrhage tonecrosis after reperfusion.Circulation. 1980;62:1274–1279.
29. Farb A, Kolodgie FD, Jenkins M, Virmani R. Myocardial infarctextension during reperfusion after coronary artery occlusion: pathologicevidence.J Am Coll Cardiol. 1993;21:1245–1253.
30. Becker LC, Ambrosio G. Myocardial consequences of reperfusion.ProgCardiovasc Dis. 1987;30:23–44.
31. Engler R, Dahlgren M, Morris D, Peterson M, Schmid-Schoenbein G.Role of leukocytes in the response to acute myocardial ischemia andreflow in dogs.Am J Physiol. 1986;251:H314–H323.
32. Tranum-Jensen J, Janse M, Fiolet J, Krieger W, D’Alnoncourt C, Durrer D.Tissue osmolality, cell swelling, and reperfusion in acute regional myocardialischemia in the isolated porcine heart.Circ Res. 1981;49:364–381.
33. Willerson J, Watson J, Hutton I, Templeton G, Fixler D. Reducedmyocardial reflow and increased coronary vascular resistance fol-lowing prolonged myocardial ischemia in the dog.Circ Res. 1975;36:771–781.
34. Rochitte CE, Melin JA, Bluemke DA, Guttman MA, McVeigh ER,Reeder SB, Becker LC, Lima JAC. The extent of microvascularobstruction best predicts left ventricular remodeling after acute myo-cardial infarction.Circulation. 1997;96(suppl I):I-305. Abstract.
1014 Time Course of Microvascular Obstruction
by guest on January 2, 2015http://circ.ahajournals.org/Downloaded from
Toshiya Furuta, Lewis C. Becker and Jacques A. MelinCarlos E. Rochitte, João A. C. Lima, David A. Bluemke, Scott B. Reeder, Elliot R. McVeigh,
Myocardial InfarctionMagnitude and Time Course of Microvascular Obstruction and Tissue Injury After Acute
Print ISSN: 0009-7322. Online ISSN: 1524-4539 Copyright © 1998 American Heart Association, Inc. All rights reserved.
is published by the American Heart Association, 7272 Greenville Avenue, Dallas, TX 75231Circulation doi: 10.1161/01.CIR.98.10.1006
1998;98:1006-1014Circulation.
http://circ.ahajournals.org/content/98/10/1006World Wide Web at:
The online version of this article, along with updated information and services, is located on the
http://circ.ahajournals.org//subscriptions/
is online at: Circulation Information about subscribing to Subscriptions:
http://www.lww.com/reprints Information about reprints can be found online at: Reprints:
document. Permissions and Rights Question and Answer this process is available in the
click Request Permissions in the middle column of the Web page under Services. Further information aboutOffice. Once the online version of the published article for which permission is being requested is located,
can be obtained via RightsLink, a service of the Copyright Clearance Center, not the EditorialCirculationin Requests for permissions to reproduce figures, tables, or portions of articles originally publishedPermissions:
by guest on January 2, 2015http://circ.ahajournals.org/Downloaded from
Related Documents