IN VESTO R P R E S E N TATIO N 1H 2016 FINANCIALRESULTS published on August24, 2016

Welcome message from author
This document is posted to help you gain knowledge. Please leave a comment to let me know what you think about it! Share it to your friends and learn new things together.
Transcript
INVESTOR PRESENTATION
1H 2016 FINANCIAL RESULTS published on August 24, 2016
2
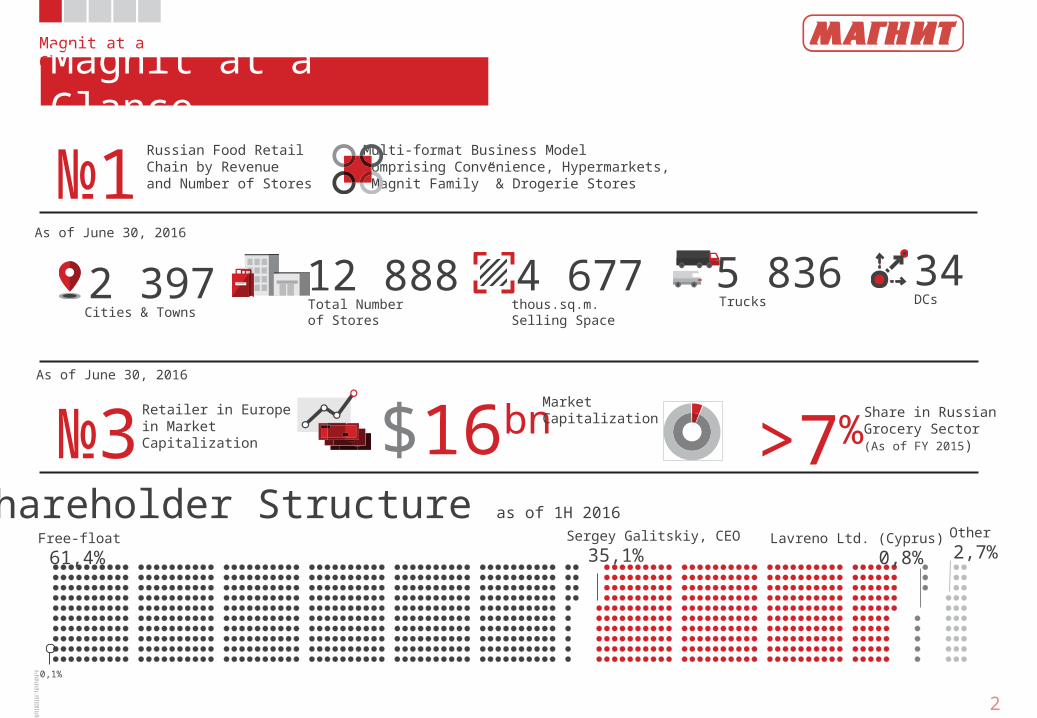
Magnit at a GlanceMagnit at a Glance
Source: Company, Thomson Reuters, Company’s calculations based on IFRS accounts for 1H2016
2 397Cities & Towns
№1Russian Food RetailChain by Revenueand Number of Stores
12 888Total Numberof Stores
4 677thous.sq.m.Selling Space
34DCs
5 836Trucks
Multi-format Business ModelComprising Convenience, Hypermarkets,“Magnit Family” & Drogerie Stores
№3Retailer in Europein MarketCapitalization $16bnMarket
Capitalization >7%Share in RussianGrocery Sector (As of FY 2015)
Shareholder Structure as of 1H 2016
61,4%Free-float
35,1%Sergey Galitskiy, CEO
0,8%Lavreno Ltd. (Cyprus)
0,1%
As of June 30, 2016
As of June 30, 2016
2,7%Other
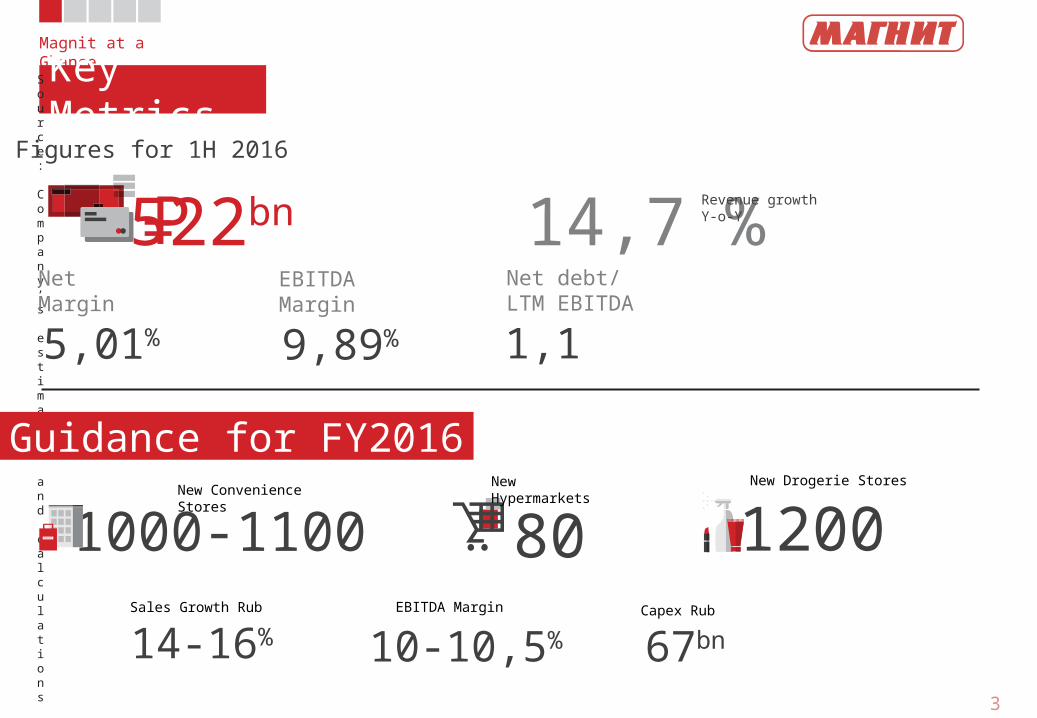
Magnit at a GlanceKey Metrics
3
Source: Company’s estimates and calculations
522bn 14,7 %5,01%
NetMargin
9,89%
EBITDAMargin
1,1Net debt/LTM EBITDA
1000-1100 80 1200
P= Revenue growth Y-o-Y
Guidance for FY2016
Figures for 1H 2016
14-16%Sales Growth Rub
10-10,5%EBITDA Margin
67bnCapex Rub
New Convenience Stores
New Hypermarkets
New Drogerie Stores
4
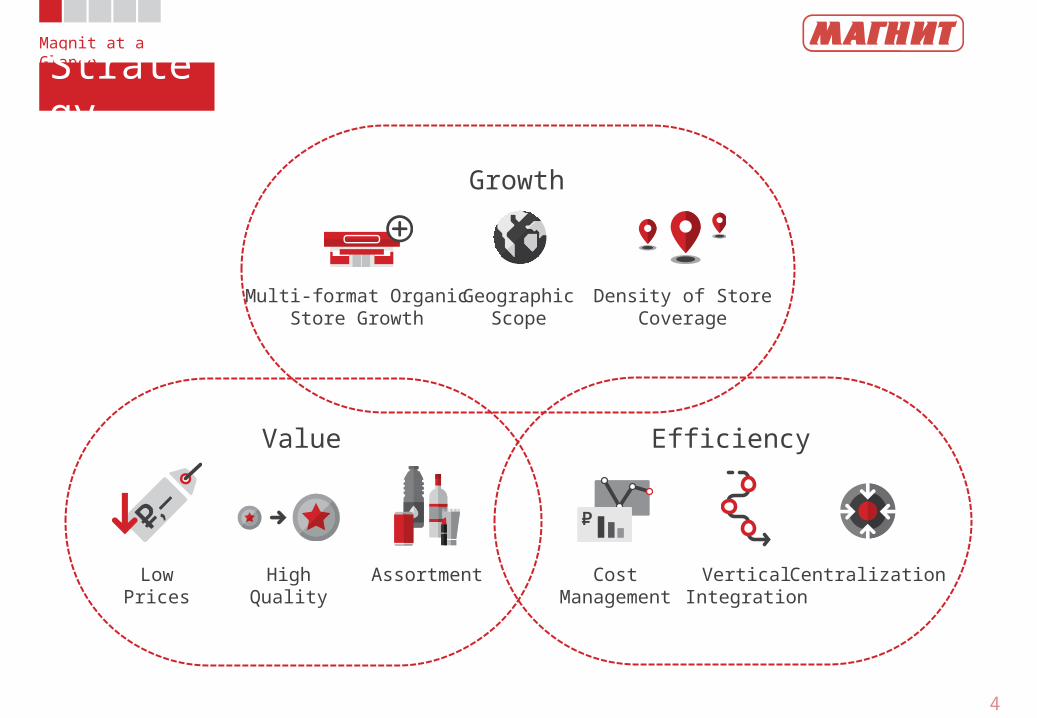
Magnit at a GlanceStrategy
Growth
Value Efficiency
Multi-format OrganicStore Growth
GeographicScope
Density of StoreCoverage
LowPrices
HighQuality
Assortment CostManagement
VerticalIntegration
Centralization
5
65
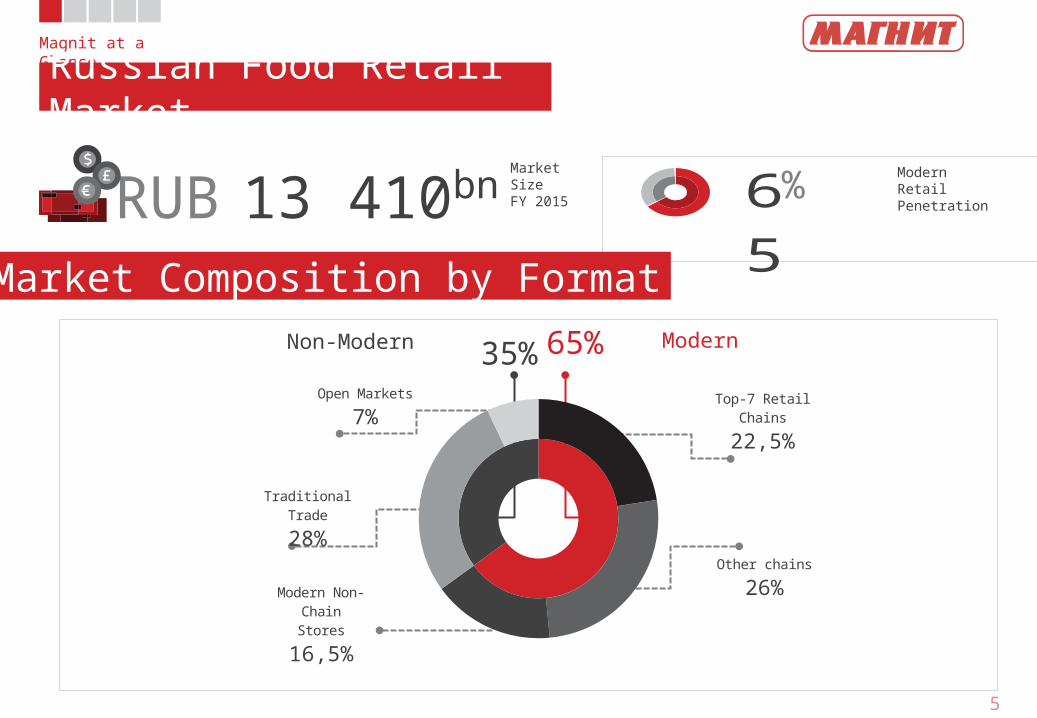
Magnit at a GlanceRussian Food Retail Market
Market Composition by FormatRUB 13 410bn Market
SizeFY 2015 % Modern
RetailPenetration
Non-Modern Modern
Source: INFOLine, as of December 31, 2015
65%
35%
Top-7 Retail Chains
22,5%
Modern Non-ChainStores
16,5%
Other chains26%
Traditional Trade28%
Open Markets7%
6
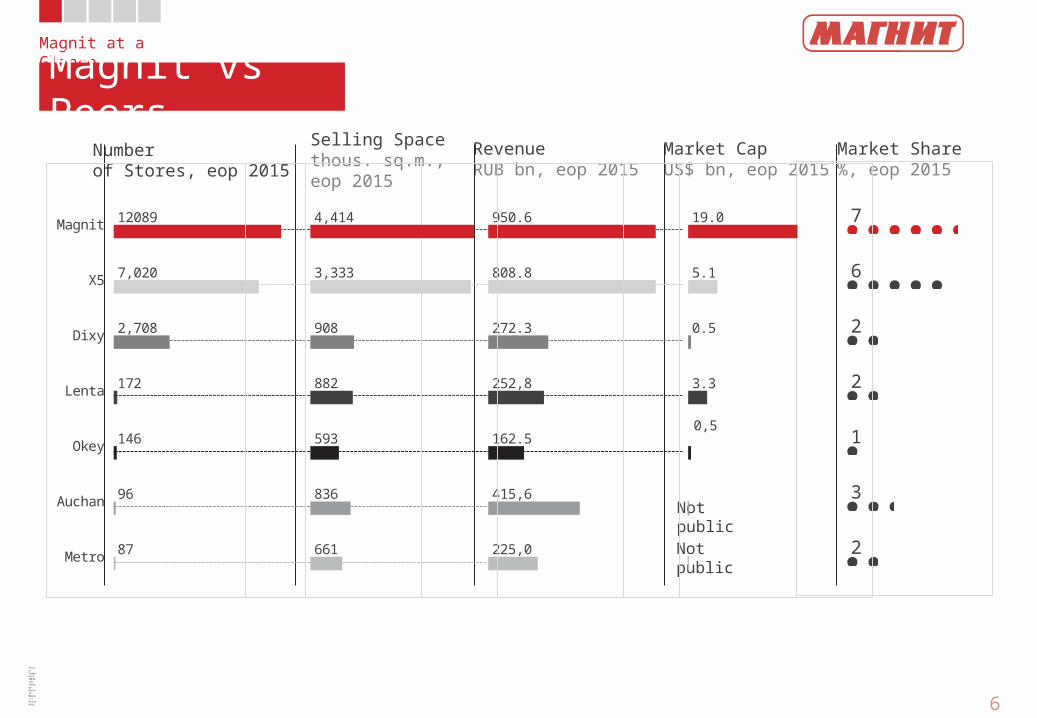
Magnit at a GlanceMagnit vs Peers
Source: Companies, INFOLine, Thomson Reuters, Magnit’s Estimates
Numberof Stores, eop 2015
Selling Spacethous. sq.m., eop 2015
RevenueRUB bn, eop 2015
Market CapUS$ bn, eop 2015
Market Share%, eop 2015
7
6
2
2
1
3
2
Not public
Not public
950.6
808.8
272.3
252,8
162.5
415,6
225,0
Magnit
X5
Dixy
Lenta
Okey
Auchan
Metro
12089
7,020
2,708
172
146
96
87
4,414
3,333
908
882
593
836
661
19.0
5.1
0.5
3.3
0,5

7
2 588Drogerie Stores 92 511 658 745 237 238107
9 902Convenience Stores
228Hypermarkets
170Magnit Family
34Distribution Centers
6 44 33 52 12 11
8 63 38 64 15 3010
3581684 2667 2961 972 895
365
Operational OverviewGeographical Coverage
Source: Company, as of June 30, 2016
2 397Cities& Towns
7 FederalRegions
North Caucasu
sSouthern Volga North
WestUrals SiberiaCentral
8 10 8 3

8
Operational OverviewLogistics System
Source: Company, as of June 30, 2016
12 888Total Numberof Stores
1 351thous.sq.m.Warehousing Space
34DCs
5 836Trucks
Central
Volga
Southern
Urals
North Caucasus
North West
Siberia
10
8
8
3
1
2
2
3684
3957
2293
1179
462
826
487
283,871
310,387
142,533
Centralization Ratio%
90
10
92
8
Convenience Stores
1H2016
73
27
80
20
HypermarketsDelivered from DC
Delivered from supplier
Delivered from DC
Delivered from supplier
9
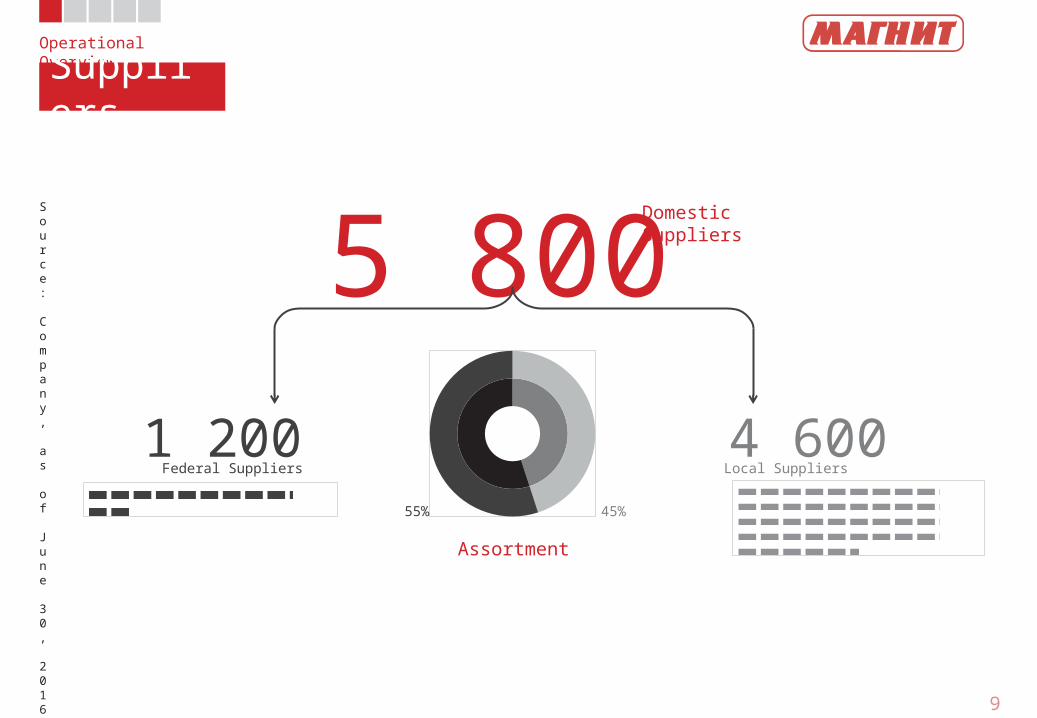
Operational OverviewSuppliers
Source: Company, as of June 30, 2016
5 800DomesticSuppliers
4 600Local Suppliers
1 200Federal Suppliers
Assortment55% 45%

10
Operational OverviewDirect Import
Source: Company, Direct Import – as of December 31, 2015; Private Label – as of June 30, 2016
11
% Shareof Revenue611PL
SKUsM 84% FoodItems
Private Label
9 % InternationalDirect Import 757Open
Contracts
11
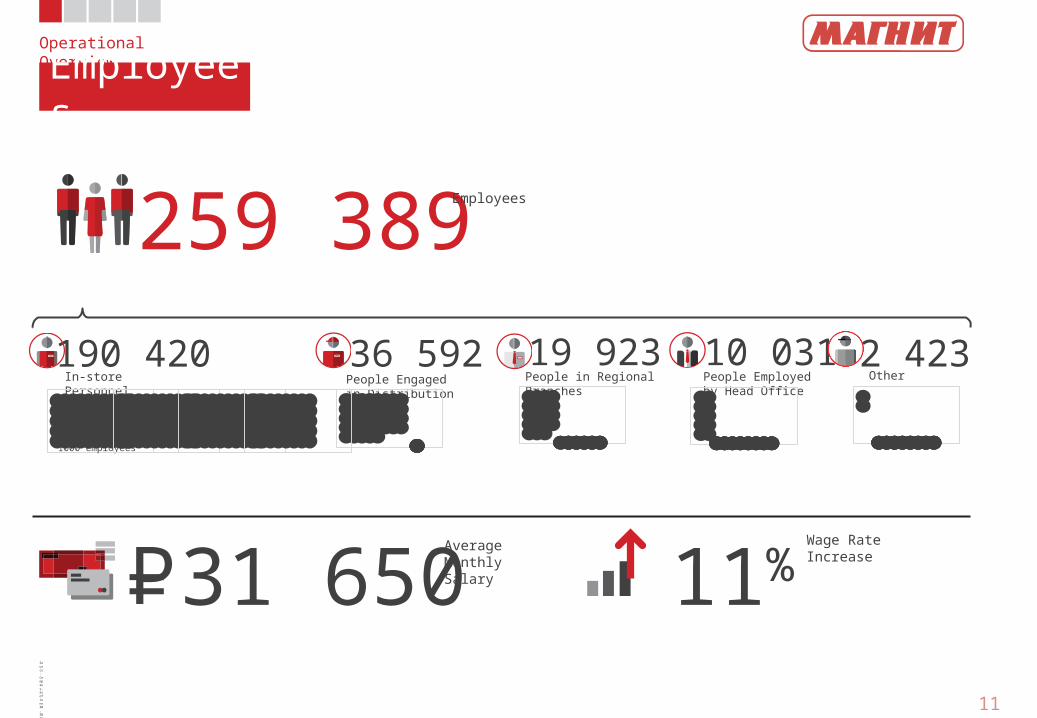
Operational OverviewEmployees
Source: Company, as of June 30, 2016
259 389Employees
31 650AverageMonthlySalary 11% Wage Rate
Increase P=
190 420In-storePersonnel
36 592People Engagedin Distribution
19 923People in RegionalBranches
10 031People Employedby Head Office
1000 employees
2 423Other

12
Operational OverviewCompetitive Attributes
43-45 % of FamilyBudgetSpent on Food
Location Quality(of Products)
Assortment Reliability AtmospherePrices
5 000 People —MinimumPopulation
(1 500–1 600 Families)
4 000-9 500 MonthlyFamily FoodBudgetP=
Overlap “Good”Cannibalization
Magnit #1
Magnit #2500m
Competitor #1 Competitor #2
Competitor #3
500m
Sales Catchment Area
Source: Company’s Estimates

Convenience Store

14
Operational OverviewConvenience Store
Source: Company, as of June 30, 2016
457
sq.m.Total
327
sq.m.Selling Space
89% Food
11% Non-food
25% Owned
75% Leased
Format Description Key Operational Statistics OpeningSize of the Store Average Ticket Payback
Store Ownership Structure
Sales MixTraffictickets/sq.m./day
Sales Densitysales/sq.m./year
LFL 1H2016 –1H2015,%
243,80P=$3,47
245 306P=$4 024
-0,36 AverageTicket, RUB
2,21 Traffic
1,85 Sales
2,7
3 years
If Leased
If Owned
Cost of New Storeper sq.m. of Total Space, thousand RUB
Time to Maturity
6 months
4-6 years
Owned 35-105Leased 10-19

Hypermarket
16
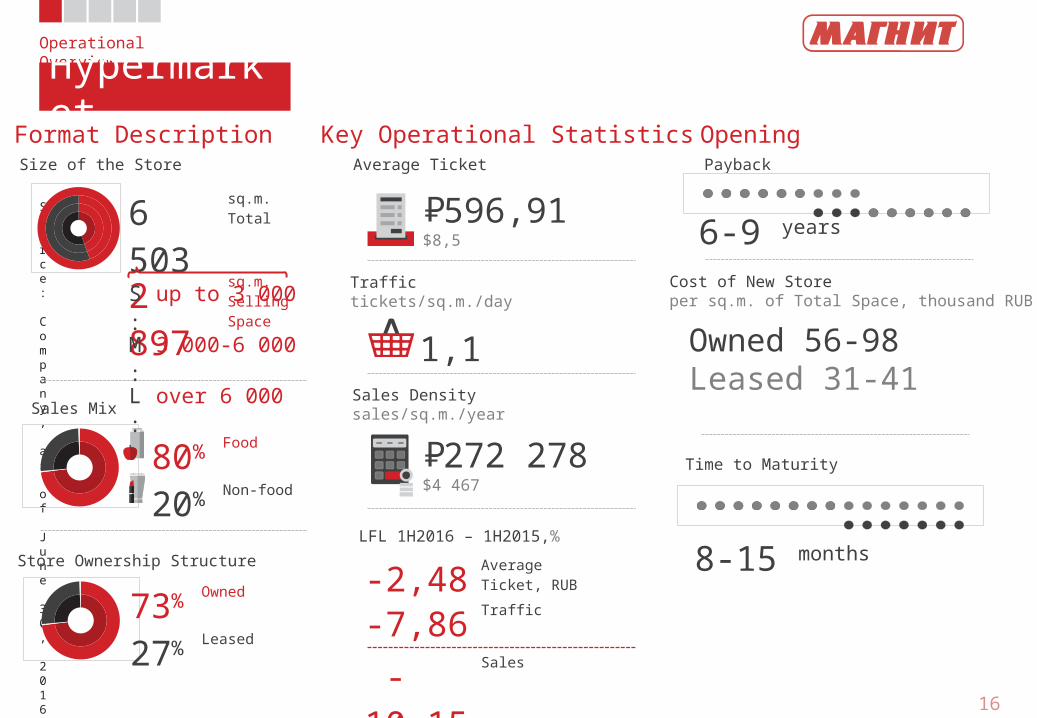
Operational OverviewHypermarket
Source: Company, as of June 30, 2016
80% Food
20% Non-food
73% Owned
27% Leased
Format Description Key Operational StatisticsSize of the Store Average Ticket
Store Ownership Structure
Sales Mix
Traffictickets/sq.m./day
Sales Densitysales/sq.m./year
LFL 1H2016 – 1H2015,%
596,91P=$8,5
272 278P=$4 467
1,1
6 503
sq.m.Total
2 897
sq.m.Selling Space
-2,48 AverageTicket, RUB
-7,86 Traffic
-10,15
Sales
OpeningPayback
6-9 years
Cost of New Storeper sq.m. of Total Space, thousand RUB
Owned 56-98Leased 31-41
8-15 months
Time to Maturity
S: up to 3 000M:
3 000-6 000
L: over 6 000
Magnit Family
18
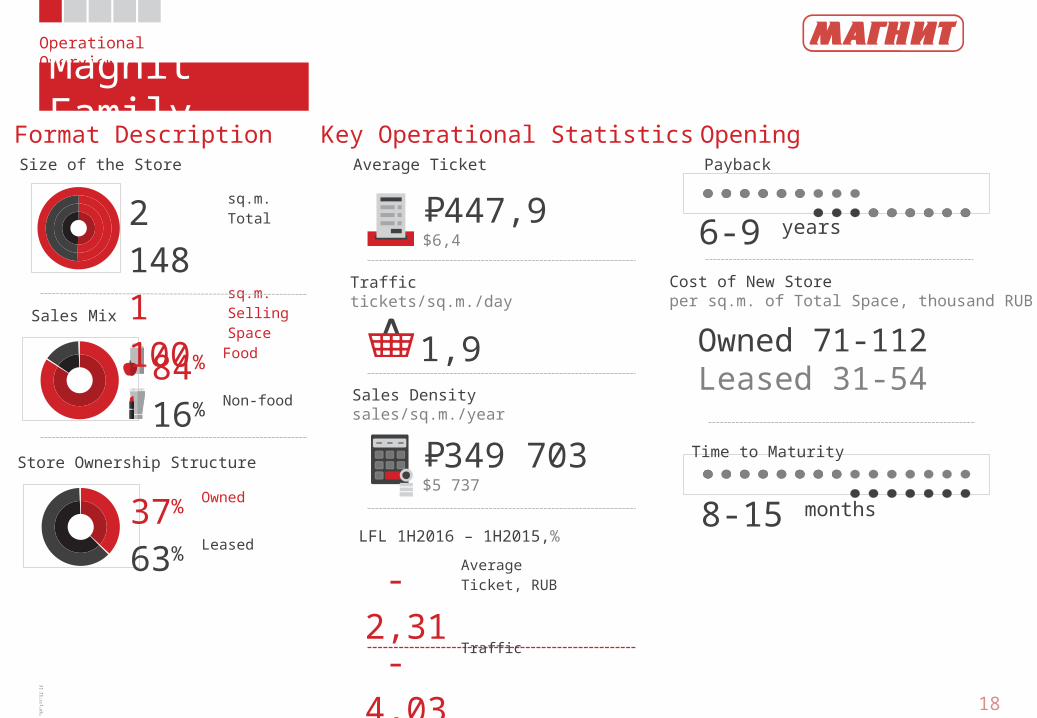
Operational OverviewMagnit Family
Source: Company, as of June 30, 2016
2 148
sq.m.Total
1 100
sq.m.Selling Space
84% Food
16% Non-food
37% Owned
63% Leased
Format Description Key Operational Statistics OpeningSize of the Store Average Ticket Payback
Store Ownership Structure
Sales MixTraffictickets/sq.m./day
Sales Densitysales/sq.m./year
LFL 1H2016 – 1H2015,%
447,9P=$6,4
349 703P=$5 737
1,9
6-9 years
Cost of New Storeper sq.m. of Total Space, thousand RUB
Owned 71-112Leased 31-54
8-15 months
-2,31
AverageTicket, RUB
-4,03
Traffic
-6,25
Sales
Time to Maturity

Drogerie Store

20
Operational OverviewDrogerie Store
Source: Company, as of June 30, 2016
290
sq.m.Total
229
sq.m.Selling Space
100% Non-food
13% Owned
87% Leased
Format Description Key Operational Statistics OpeningSize of the Store Average Ticket Payback
Store Ownership Structure
Sales MixTraffictickets/sq.m./day
Sales Densitysales/sq.m./year
LFL 1H2016 – 1H2015,%
305,3P=$4,4
114 924P=$1 885
10,86
AverageTicket, RUB
-4,00 Traffic
6,42 Sales
0,9
3 years
If Leased
If Owned
Cost of New Storeper sq.m. of Total Space, thousand RUB
Time to Maturity
6 months
Owned 20-70Leased 9-16
4-6 years

21
80%20%
Sizeof the Store
sq.m.
AverageTicket
TrafficTickets/
sq.m./day
DensitySales/
sq.m./year
SalesMix
LFL 1H2016-1H2015
%
Store Owner-
ship Structure
PaybackYears
Cost of New Store
per sq.m.of Total Space
Timeto Maturity
Months
• Total• Selling Space
• Food• Non-food
• Av.ticket• Traffic/ Sales
• Owned• Leased
13%
87%
37%
63%
73%27%
25%75%
Operational OverviewFormat Summary
Source: Company, as of June 30, 2016; * Excludes selling space designated for leases
Hypermarket
DrogerieStore
MagnitFamily
327
2897*6 503
290
Owned RUB 35-
105kLeased
RUB 10-19k2,7
0,9
1,9
P.243,8$3,5
P.596,9$8,5
P.305,3$4,4
P.447,9$6,4
P.245 306$4 024
P.272 278$4 467
P. 114 924$1 885
P.349 703$5 737
89%11%
Conveniencestore
6
8-15
6
8-15
3 (if leased)
6-9
3 (if leased)
6-9
4-6 (if owned)
4-6 (if owned)
OwnedRUB 56-98k
LeasedRUB 31-41k
OwnedRUB 20-70k
LeasedRUB 9-16k
OwnedRUB 71-112k
LeasedRUB 31-54k8
4%16%
1
-0.36
-2.48
10.86
-2.31
2.21
-7.86
-4.00
-4.03
1.85
-10.15
6.42
-6.25

22
Financial OverviewSummary P&L
SG&A is presented net of Depreciation & Amortization (except for Depreciation of production fixed assets which was included in the Cost of sales)Source: Company’ s calculations based on IFRS accounts for 1H2015 – 1H2016Please note: there may be small variations in calculation of totals , subtotals, and/ or percentage change due to rounding of decimals
RUB MN 1H2015 1H2016 1H2015 / 1H2016Y-o-Y Growth
Net sales 454,808.63 521,527.57 14.7%
Cost of sales (327,748.22) (379,464.58) 15.8%
Gross profit 127,060.41 142,062.99 11.8%
Gross margin, % 27.94% 27.24%
SG&A (79,406.25) (92,661.97) 16.7%
Other income, net 937.45 2,138.69 128.1%
EBITDA 48,627.66 51,599.85 6.1%
EBITDA margin,% 10.69% 9.89%
Depreciation & Amortization (10,033.63) (12,101.38) 20.6%
EBIT 38,594.03 39,498.47 2.3%
Net finance costs (5,865.82) (6,853.38) 16.8%
Profit before tax 32,728.21 32,645.09 -0.3%
Taxes (7,462.55) (6,537.85) -12.4%
Effective tax rate 22.80% 20.03%
Net income 25,265.66 26,107.24 3.3%
Net margin, % 5.56% 5.01%

23
1H2014 1H2015 1H2016
2025 26
1H2014 1H2015 1H2016
349455 522
Financial OverviewRevenue & Costs
Source: Company’s calculations based on IFRS accounts for 1H2014-1H20161H2014 1H2015 1H2016
0
5
10
15
20
25
3027.8 27.9 27.2
10.5 10.7 9.9
5.6 5.6 5
Revenue DynamicsRUB bn
Net Income DynamicsRUB bn
Margin DynamicsSG&A Expense StructureRevenue — 522 RUB bn
GrossMargin
EBITDAMargin
NetMargin
%
+30,3%
11,5% -0,5%
+14,7%+29,0%
+3,3%
LFLLFL
Sales Growth, RUB
Sales Growth, RUB
2,07 (0,42) ― Packaging & Raw Materials1,84 (0,37) ― Repair & Maintenance
50,08 (10,05) ― Payroll & Related Taxes1,56 (0,31) ― Taxes, Other than Income Tax
11,50 (2,31) ― Deprecation & Amortization
25,81 (5,18) ― Rent & Utilities
3,00 (0,60) ― Other
in SG&A,% in Revenue, %
2,51 (0,50) ― Advertising
1,63 (0,33) ― Bank Services20%
104 703 RUB mn

24
GM1H2014
Trading Margin Transport Losses GM1H2015
Trading Margin Transport Losses GM1H2016
15171921232527293133
27.83 27.94 27.24-0.42 -0.11 -0.60 -0.160.64 0.06
Financial OverviewGross Margin Bridge
Source: Company’s calculations
EBITDA Margin Bridge
% of Sales
% of Sales
+11 b.p. -70 b.p.
+22 b.p. -80 b.p.
02468
1012 10.47 10.69 9.890.11 0.59 0.09
0.43 0.09 0.210.29 0.22 0.06 0.7 0.75 0.04 0.04

25
49,065
36,336
11,551
-5,777
-2,239-5,735 -4,755
-24 434
-351 -19 299
1 972
Financial OverviewFree Cash Flow
Source: Company’s calculations based on IFRS accounts for 1H2015-1H2016
Working Capital AnalysisThe Average Days Payable to Suppliers is 38 Days.
Inventory Management Days is 57 Days
Working Capital: RUB 34 258 mn as of 30.06.2016
RUB mn1H 2015
1H 2016
Adjusted for loss from disposal of PPE, provision for doubtful receivables, foreign exchange loss, gain on disposal of subsidiary Calculated as
additions + transfers of PP&E during the respective period
Does not include cash flow from financing activities
Adjusted
EBITDA
Change in
Working ca
pital
Net Interest
Expense Ta
xes
Paid OCF
Capex
Other Cash
Flow
from In
vesti
ng
Activit
iesFC
F
Paym
ent of D
ividents
Other Cash
Flow
from Fi
nancing
Activit
ies
CF
51,182
23,519
2,374
-3,505
-16,964
-6,796 -3,903 -21 018
-127 -20 982
15 102
26
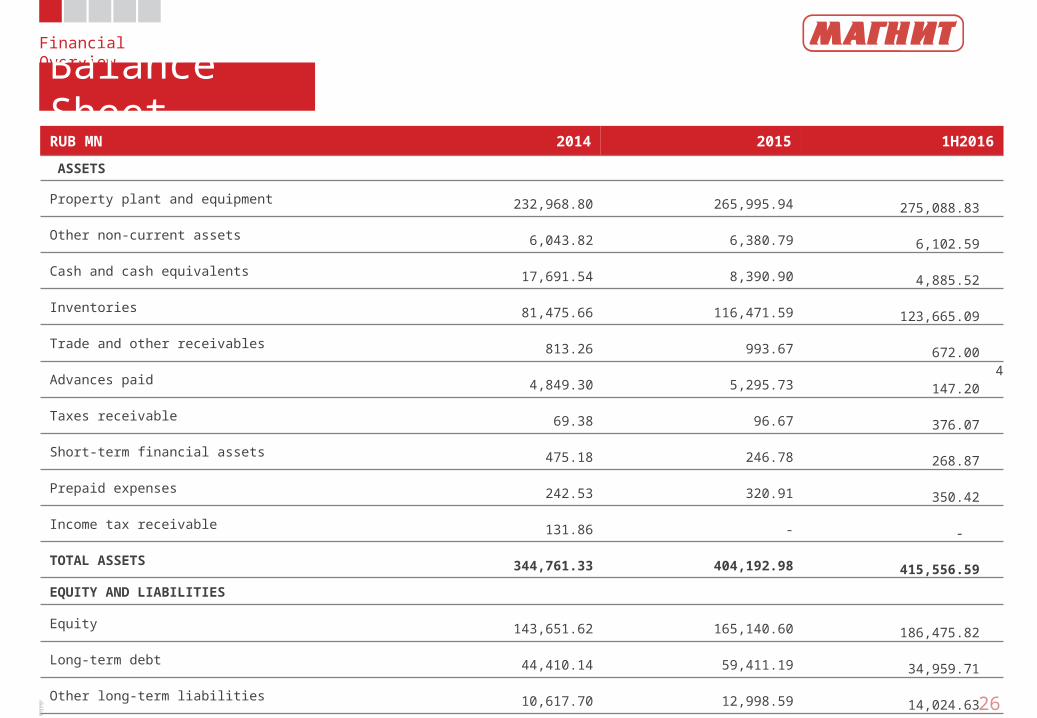
Financial OverviewBalance Sheet
Source: Company’ s calculations based on IFRS accounts for FY2014 - 1H2016Please note: there may be small variations in calculation of totals , subtotals, and/or percentage change due to rounding of decimals
RUB MN 2014 2015 1H2016 ASSETS Property plant and equipment 232,968.80 265,995.94 275,088.83 Other non-current assets 6,043.82 6,380.79 6,102.59 Cash and cash equivalents 17,691.54 8,390.90 4,885.52 Inventories 81,475.66 116,471.59 123,665.09 Trade and other receivables 813.26 993.67 672.00 Advances paid 4,849.30 5,295.73 4 147.20 Taxes receivable 69.38 96.67 376.07 Short-term financial assets 475.18 246.78 268.87 Prepaid expenses 242.53 320.91 350.42 Income tax receivable 131.86 - - TOTAL ASSETS 344,761.33 404,192.98 415,556.59 EQUITY AND LIABILITIES Equity 143,651.62 165,140.60 186,475.82 Long-term debt 44,410.14 59,411.19 34,959.71 Other long-term liabilities 10,617.70 12,998.59 14,024.63 Trade and other payables 66,794.61 88,372.22 73,498.37 Short-term debt 51,256.67 44,817.12 85,207.60 Dividends payable 14,372.03 16,993.86 7.10 Other current liabilities 13,658.56 16,459.40 21,383.36 TOTAL EQUITY AND LIABILITIES 344,761.33 404,192.98 415,556.59
27
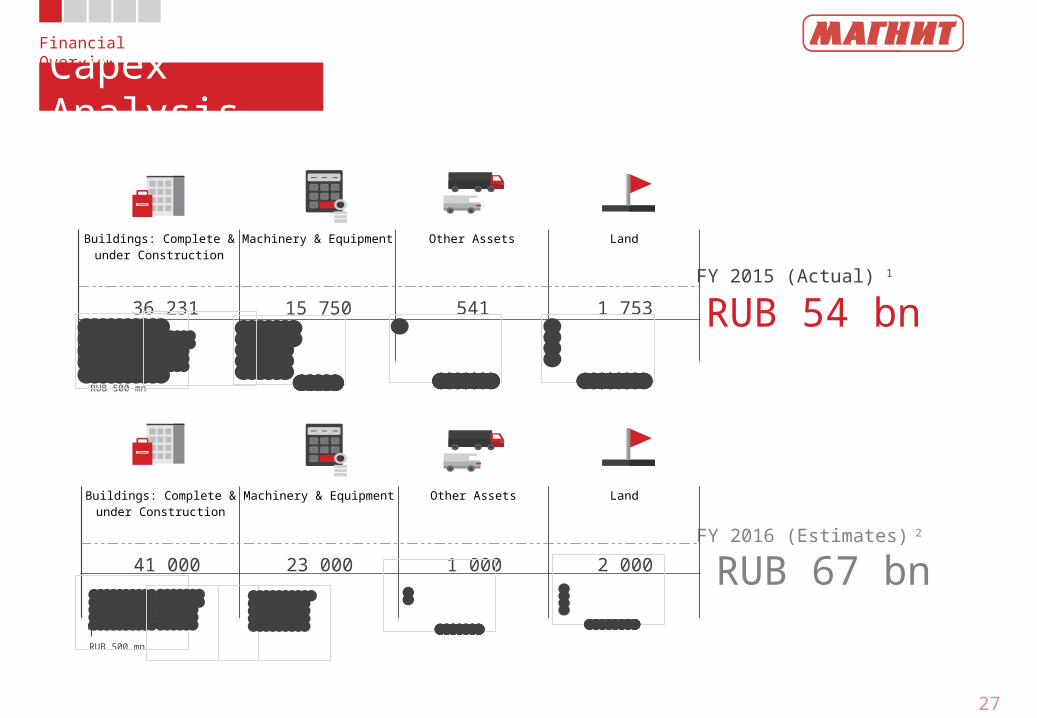
Financial OverviewCapex Analysis
1 CAPEX for 1H2016 amounts to RUB 21,018 mn2 Source: Company’s calculations based on IFRS accounts for FY2015, Company’s Estimates for FY2016
Buildings: Complete & under Construction
Machinery & Equipment Other Assets Land
36 231 15 750 541 1 753FY 2015 (Actual) 1
RUB 54 bn
FY 2016 (Estimates) 2
RUB 67 bn
RUB 500 mn
Buildings: Complete & under Construction
Machinery & Equipment Other Assets Land
41 000 23 000 1 000 2 000
RUB 500 mn

Source: Company’s calculations based on IFRS accounts for FY2014-1H2016 28
2014 2015 1H2016
95,667104,228
120,167
77,975
95,837
115,28244,410 59,411 34,960
Net DebtLong-term Debt%
Financial OverviewDebt Burden
2014 2015 1H20160.0
2.0
4.0
6.0
8.0
10.0
12.0
14.0 12.9
8.77.5
2014 2015 1H20160
0.5
1
1.5
2
0.9 0.91.1
Debt Level Dynamics RUB mn
Credit Metrics Credit ProfileEBITDA / Finance Expenses
Net Debt / LTM EBITDA
The Company Hasan Impeccable Credit HistoryCollaboration withthe Largest BanksLow Debt Burden:Net Debt / LTM EBITDA Ratio of 1,1
No Currency Risk: 100%of Debt is Rub DenominatedMatching Revenue StructureInsignificant Interest Rate Risk:Interest Payments are Madeat Fixed Rates Primarily
53,6%43,0%
70,9%
29% of Debt is Long-termApproximately 59%of LT Debt is Rub Bonds
29
Contact InformationContact InformationTimothy PostHead of Investor Relations
+7 (961) [email protected]://ir.magnit.com
15/2 Solnechnaya StreetKrasnodar, 350072Russian Federation
Related Documents