arXiv:cond-mat/0104391v1 20 Apr 2001 Millikelvin magnetic relaxation measurements of α-Fe 2 O 3 antiferromagnetic particles E. del Barco, J.M. Hern´andez, M. Duran and J. Tejada Departament de F´ ısica Fonamental, Universitat de Barcelona Diagonal 647, Barcelona, 08028, Spain R. D. Zysler and M. Vasquez Mansilla Centro At´omico Bariloche, CNEA, 8400 S. C. de Bariloche, RN, Argentina D. Fiorani ICMAT-CNR, Area della Ricerca di Roma CP10, Monterotondo Stazione. (Rome) Italy Abstract In this paper we report magnetic relaxation data for anti- ferromagnetic α-Fe2O3 particles of 5 nm mean diameter in the temperature range 0.1 K to 25 K. The average spin value of these particles S ≃ 124 and the uniaxial anisotropy constant D ≃ 1.6 × 10 −2 K have been estimated from the experimental values of the blocking temperature and anisotropy field. The observed plateau in the magnetic viscosity from 3 K down to 100 mK agrees with the occurrence of spin tunneling from the ground state SZ = S. However, the scaling M vs T ln(ν0t) is broken below 5 K, suggesting the occurrence of tunneling from excited states below this temperature. The search for candidates to study the quantum oscilla- tions of spin between opposite orientations is of major inter- est today for both basic and applied purposes. There are two areas in which this is extremely important: the study of the spin quantum coherence in mesoscopic systems [1–3], and the assessment of magnetic units as hardware for quantum computation [4–6]. The rate of magnetic relaxation of a single domain particle associated to thermal fluctuations is Γ = ν exp(−U/T ) where U is the energy barrier and ν is the attempt frequency. In the case of ensembles of small particles with a distribution of volumes, the magnetization depends on time, in the case of thermal relaxation, only through the combination T ln(νt). The occurrence of magnetic relaxation in a fine particle sys- tem at temperatures where thermal fluctuations vanish has been explained in terms of quantum tunneling [7,8]. Most of the experiments carried out in magnetic systems have been performed at temperatures above 1 K and using ferro and ferrimagnetic particulate systems with interaction between particles [7]. There are also interesting measurements of fer- rimagnetic and ferromagnetic single particles [9,10]. In this paper we show data of relaxation experiments down to mK for a system of independent antiferromagnetic particles with a narrow size distribution. α-Fe2O3 is an antiferromagnet (TN = 960K) which under- goes a spin-flip transition at the Morin temperature, TM = 263K. Below TM it is an uniaxial antiferromagnet with the spins aligned along the trigonal (111) axis, whereas above TM is a canted antiferromagnet with the spins perpendicular to (111), except for a slight canting (0.13 ◦ ) from the basal plane, which results in a small net magnetic moment. There is, how- ever, another contribution to the net spin of these particles. This is associated with the number of non-compensated spins expected from the randomness of the surface core. The Morin temperature reduces as the particle size decreases tending to vanish for particles smaller than about 8nm [11]. The antifer- romagnetic α-Fe2O3 particles were prepared from precursor FeOOH particles following the route proposed by Zysler et al. [12]. X-ray powder diffraction pattern shows the hematite structure corundum type of the particles. Morphological char- acterization of the particles was made by using both a com- mercial light dispersion equipment before drying the solution and a 200 keV transmission electron microscopy. The parti- cles show a platelet shape [12–14]. The size distribution is centered at 5 nm and comprised between 3 and 7 nm. ESR measurements were made at the X-band (9.4 GHz) at tem- peratures down to 2 K. No single ion resonance line appears in the spectrum; that is, our sample is free of paramagnetic impurities. Magnetization measurements down to 1.8 K were per- formed by using a Quantum Design SQUID magnetometer. The very low temperature magnetic measurements were car- ried out by using a top loading 3 He- 4 He dilution refrigerator (Oxford Kelvinox) which has incorporated a 5 T supercon- ductor magnet. The sample is inside the liquid mixture and its temperature may be varied between 50 mK and 1.2 K. The magnetic moment of the sample is registered using a super- conductor gradiometer by the extraction method. This gra- diometer is coupled through a superconducting transformer to a Quantum Design dc SQUID which is placed near the 1 K pot. The temperature of the dc SQUID is kept constant as it is thermally linked to the 1 K pot. The dc SQUID has also been shielded from the magnetic field created by the super- conductor magnet and the magnetometer has been calibrated by using pure paramagnetic samples. In Figure 1 we show the low field (H = 300 Oe) magne- tization measurements down to 1.8K. The zero field cooled magnetisation, ZFC, is mainly due to the fraction of particles that behave superparamagnetically at a given T , while the field cooled magnetisation, FC, corresponds to the equilib- rium value. The inset of Figure 1 shows the FC data obtained with the dilution refrigerator down to the lowest tempera- ture (T = 100 mK). The data for both ZFC and FC above 4 K are in agreement with those reported by Bødker et al. [15] from magnetic and M¨ossbauer measurements performed in the Kelvin regime on particles of 16 nm average size. The blocking temperature for our particles is, however, larger than that estimated for the particles of Bødker et al. [15] which may be due to the increase of the surface anisotropy when reducing 1

Welcome message from author
This document is posted to help you gain knowledge. Please leave a comment to let me know what you think about it! Share it to your friends and learn new things together.
Transcript
arX
iv:c
ond-
mat
/010
4391
v1 2
0 A
pr 2
001
Millikelvin magnetic relaxation measurements of α-Fe2O3 antiferromagnetic particles
E. del Barco, J.M. Hernandez, M. Duran and J. TejadaDepartament de Fısica Fonamental, Universitat de Barcelona
Diagonal 647, Barcelona, 08028, Spain
R. D. Zysler and M. Vasquez MansillaCentro Atomico Bariloche, CNEA, 8400 S. C. de Bariloche, RN, Argentina
D. FioraniICMAT-CNR, Area della Ricerca di Roma CP10, Monterotondo Stazione. (Rome) Italy
Abstract
In this paper we report magnetic relaxation data for anti-ferromagnetic α-Fe2O3 particles of 5 nm mean diameter in thetemperature range 0.1 K to 25 K. The average spin value ofthese particles S ≃ 124 and the uniaxial anisotropy constantD ≃ 1.6×10⁻² K have been estimated from the experimentalvalues of the blocking temperature and anisotropy field. Theobserved plateau in the magnetic viscosity from 3 K down to100 mK agrees with the occurrence of spin tunneling from theground state SZ = S. However, the scaling M vs T ln(ν0t)is broken below 5 K, suggesting the occurrence of tunnelingfrom excited states below this temperature.
The search for candidates to study the quantum oscilla-tions of spin between opposite orientations is of major inter-est today for both basic and applied purposes. There aretwo areas in which this is extremely important: the study ofthe spin quantum coherence in mesoscopic systems [1–3], andthe assessment of magnetic units as hardware for quantumcomputation [4–6].
The rate of magnetic relaxation of a single domain particleassociated to thermal fluctuations is Γ = ν exp(−U/T ) whereU is the energy barrier and ν is the attempt frequency. Inthe case of ensembles of small particles with a distributionof volumes, the magnetization depends on time, in the caseof thermal relaxation, only through the combination T ln(νt).The occurrence of magnetic relaxation in a fine particle sys-tem at temperatures where thermal fluctuations vanish hasbeen explained in terms of quantum tunneling [7,8]. Most ofthe experiments carried out in magnetic systems have beenperformed at temperatures above 1 K and using ferro andferrimagnetic particulate systems with interaction betweenparticles [7]. There are also interesting measurements of fer-rimagnetic and ferromagnetic single particles [9,10]. In thispaper we show data of relaxation experiments down to mKfor a system of independent antiferromagnetic particles witha narrow size distribution.
α-Fe2O3 is an antiferromagnet (TN = 960K) which under-goes a spin-flip transition at the Morin temperature, TM =263K. Below TM it is an uniaxial antiferromagnet with thespins aligned along the trigonal (111) axis, whereas above TM
is a canted antiferromagnet with the spins perpendicular to(111), except for a slight canting (0.13◦) from the basal plane,which results in a small net magnetic moment. There is, how-ever, another contribution to the net spin of these particles.
This is associated with the number of non-compensated spinsexpected from the randomness of the surface core. The Morintemperature reduces as the particle size decreases tending tovanish for particles smaller than about 8nm [11]. The antifer-romagnetic α-Fe2O3 particles were prepared from precursorFeOOH particles following the route proposed by Zysler etal. [12]. X-ray powder diffraction pattern shows the hematitestructure corundum type of the particles. Morphological char-acterization of the particles was made by using both a com-mercial light dispersion equipment before drying the solutionand a 200 keV transmission electron microscopy. The parti-cles show a platelet shape [12–14]. The size distribution iscentered at 5 nm and comprised between 3 and 7 nm. ESRmeasurements were made at the X-band (9.4 GHz) at tem-peratures down to 2 K. No single ion resonance line appearsin the spectrum; that is, our sample is free of paramagneticimpurities.
Magnetization measurements down to 1.8 K were per-formed by using a Quantum Design SQUID magnetometer.The very low temperature magnetic measurements were car-ried out by using a top loading 3He-4He dilution refrigerator(Oxford Kelvinox) which has incorporated a 5 T supercon-ductor magnet. The sample is inside the liquid mixture andits temperature may be varied between 50 mK and 1.2 K. Themagnetic moment of the sample is registered using a super-conductor gradiometer by the extraction method. This gra-diometer is coupled through a superconducting transformerto a Quantum Design dc SQUID which is placed near the 1K pot. The temperature of the dc SQUID is kept constant asit is thermally linked to the 1 K pot. The dc SQUID has alsobeen shielded from the magnetic field created by the super-conductor magnet and the magnetometer has been calibratedby using pure paramagnetic samples.
In Figure 1 we show the low field (H = 300 Oe) magne-tization measurements down to 1.8K. The zero field cooledmagnetisation, ZFC, is mainly due to the fraction of particlesthat behave superparamagnetically at a given T , while thefield cooled magnetisation, FC, corresponds to the equilib-rium value. The inset of Figure 1 shows the FC data obtainedwith the dilution refrigerator down to the lowest tempera-ture (T = 100 mK). The data for both ZFC and FC above4 K are in agreement with those reported by Bødker et al.[15] from magnetic and Mossbauer measurements performedin the Kelvin regime on particles of 16 nm average size. Theblocking temperature for our particles is, however, larger thanthat estimated for the particles of Bødker et al. [15] which maybe due to the increase of the surface anisotropy when reducing
1
the size of the particles.The zero field cooled magnetisation at a given temperature,
field and time is given by [7]
M(T, H, t) =m2
0H
2T
∫ VB(T,t)
0
dV f(V )V 2 (1)
where m0 is the magnetic moment per unit volume of the ma-terial of the particle, f(V ) is the volume distribution of theparticles, VB(T, t) = kBT
Kln(ν0t) is the blocking volume at a
given temperature T and time t, ν0 is the attempt frequencyand K is the magnetic anisotropy energy density. At T > TB,the average blocking temperature, the integral of equation (1)becomes constant because the moments of most of the parti-cles are unblocked. That is, above the blocking temperaturethe ZFC magnetisation should follow the 1/T superparamag-netic Curie law, as it is experimentally observed.
At T ≪ TB, the ZFC magnetisation depends on the volumedistribution function because the fraction of superparamag-netic particles contributing to the magnetic signal decreaseswhen the temperature decreases. Below 1 K, however, theZFC magnetisation increases when temperature decreases,with a 1/T dependence down to the lowest temperature of100 mK. This behaviour can not be due to paramagnetic im-purities, since their presence should be detected by EPR mea-surements, which is not the case. This result can be explainedby equation (1) if the relaxation volume VB does not dependon temperature below 1 K. That is, in presence of quantumrelaxation, the temperature in the definition of VB is replacedby the temperature, Tc, of the crossover from the classical tothe quantum regime. At T < Tc, quantum transitions, inde-pendently of the volume distribution, result in the ZFC curveproportional to 1/T . It may be concluded, therefore, thatthere is a fraction of particles whose magnetic moments neverget blocked due to quantum tunneling effects.
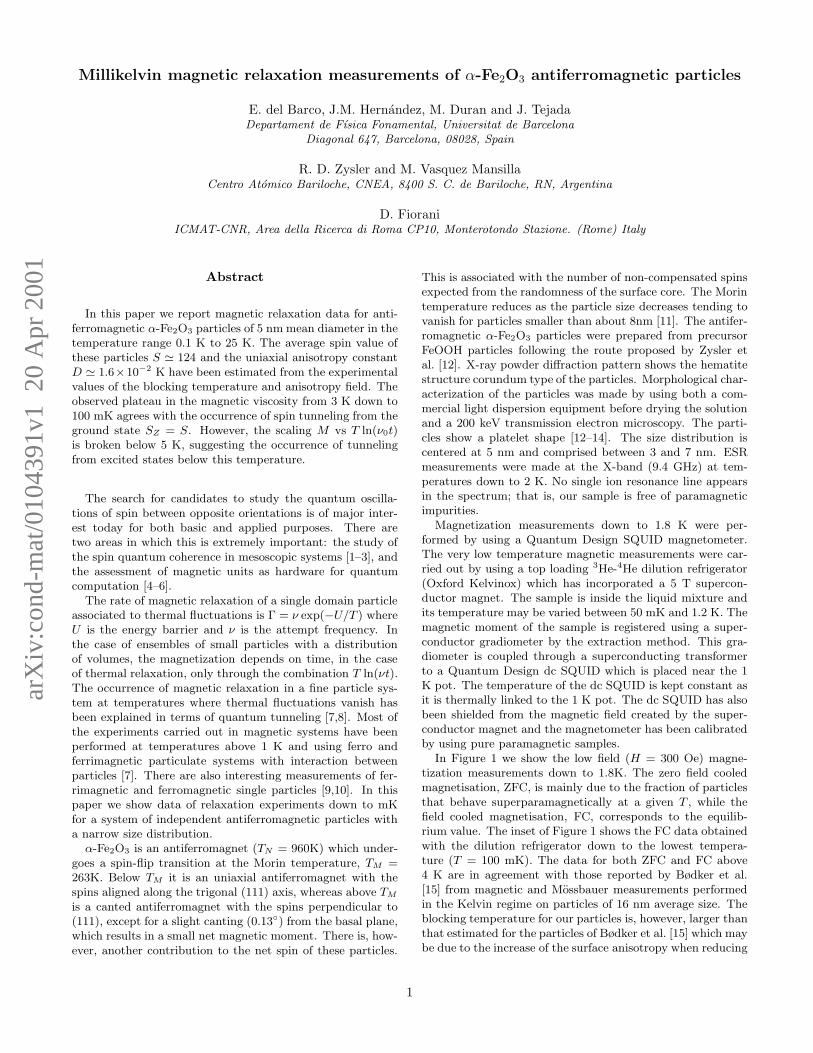
The FC data split from the ZFC data at T = Tmax as theycorrespond to the equilibrium magnetisation at each temper-ature. For temperatures lower than 5 K the FC data growwith temperature following a Curie law until the lowest tem-perature of 100 mK. The Curie-Weiss temperature, θC , de-duced from the extrapolation to zero temperature of the FCdata measured below 1K (see inset in figure 1) is θC ≃ 2mK, suggesting a very weak interaction between the magneticparticles [8]. Using the temperature variation of the calledisothermal remanent magnetization, MTRM = 2MZF C−MF C
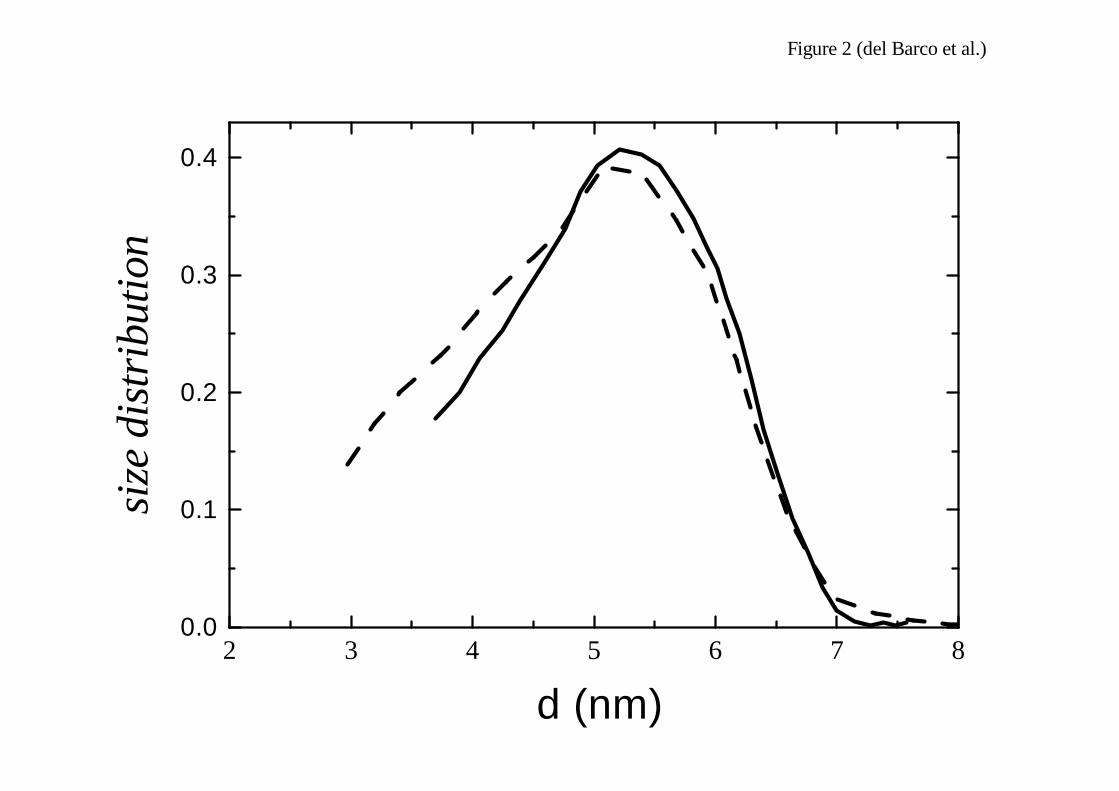
[16–18] we have deduced the volume distribution of particles,see dashed lines in figure 2.
All isothermal magnetisation curves, for T > TB, are wellfitted by Boltzmann’s statistics and follow a H/T scalingwhen considering the random distribution of easy axis andthe temperature variation of the magnetic moment of the par-ticles. Below TB, the M(H) curves show hysteresis. Below1 K the cycles close at H ≃ 3 T, which roughly representsthe highest particle anisotropy field Han. The continuous in-crease of both coercitivity and anisotropy field when reducingthe temperature below the blocking, suggest that the Morintransition does not take place in these small particles [11].
Magnetic relaxation measurements were performed down to100mK. In order to make easier the comparison of the data ob-tained above (Quantum Design SQUID magnetometer) andbelow (dilution refrigerator) to 1.6K, we have followed the
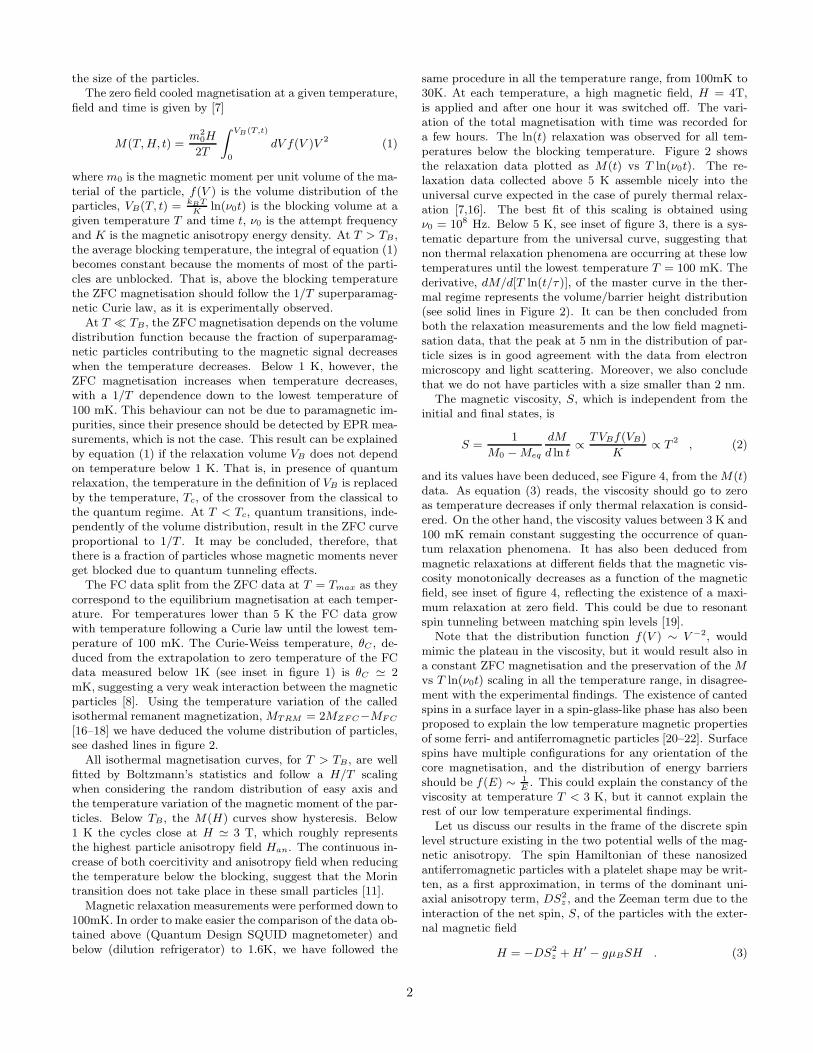
same procedure in all the temperature range, from 100mK to30K. At each temperature, a high magnetic field, H = 4T,is applied and after one hour it was switched off. The vari-ation of the total magnetisation with time was recorded fora few hours. The ln(t) relaxation was observed for all tem-peratures below the blocking temperature. Figure 2 showsthe relaxation data plotted as M(t) vs T ln(ν0t). The re-laxation data collected above 5 K assemble nicely into theuniversal curve expected in the case of purely thermal relax-ation [7,16]. The best fit of this scaling is obtained usingν0 = 108 Hz. Below 5 K, see inset of figure 3, there is a sys-tematic departure from the universal curve, suggesting thatnon thermal relaxation phenomena are occurring at these lowtemperatures until the lowest temperature T = 100 mK. Thederivative, dM/d[T ln(t/τ )], of the master curve in the ther-mal regime represents the volume/barrier height distribution(see solid lines in Figure 2). It can be then concluded fromboth the relaxation measurements and the low field magneti-sation data, that the peak at 5 nm in the distribution of par-ticle sizes is in good agreement with the data from electronmicroscopy and light scattering. Moreover, we also concludethat we do not have particles with a size smaller than 2 nm.
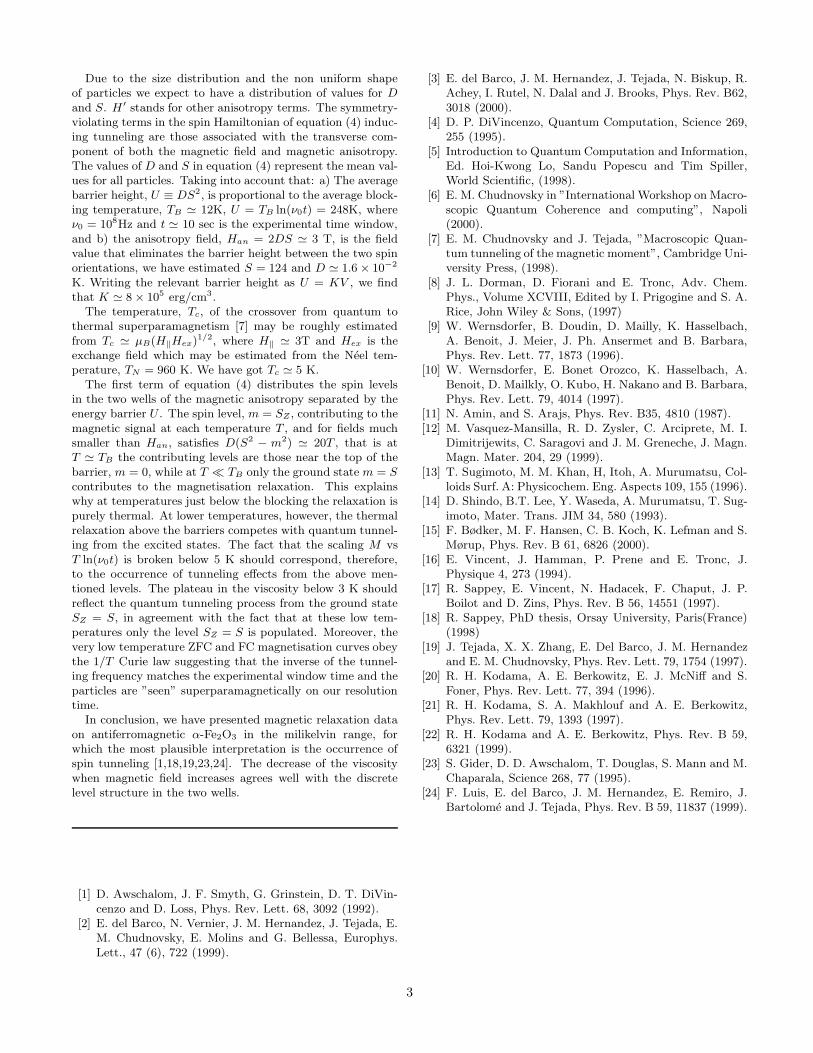
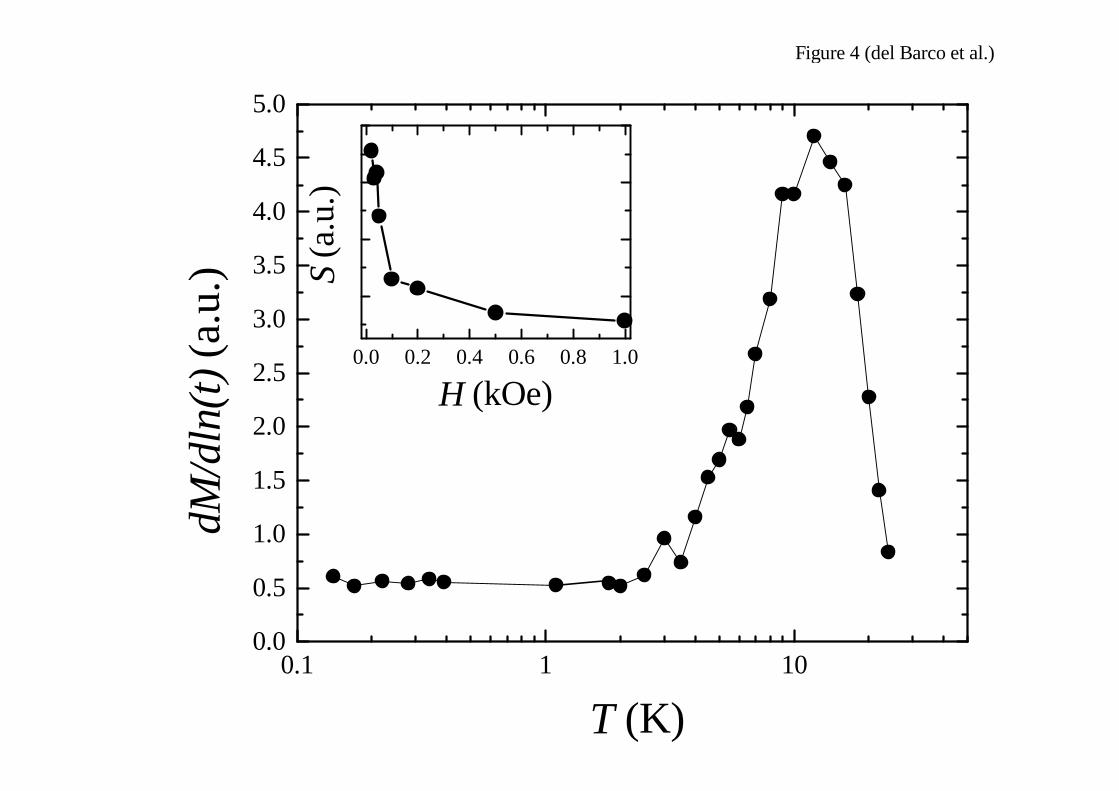
The magnetic viscosity, S, which is independent from theinitial and final states, is
S =1
M0 − Meq
dM
d ln t∝
TVBf(VB)
K∝ T 2 , (2)
and its values have been deduced, see Figure 4, from the M(t)data. As equation (3) reads, the viscosity should go to zeroas temperature decreases if only thermal relaxation is consid-ered. On the other hand, the viscosity values between 3 K and100 mK remain constant suggesting the occurrence of quan-tum relaxation phenomena. It has also been deduced frommagnetic relaxations at different fields that the magnetic vis-cosity monotonically decreases as a function of the magneticfield, see inset of figure 4, reflecting the existence of a maxi-mum relaxation at zero field. This could be due to resonantspin tunneling between matching spin levels [19].
Note that the distribution function f(V ) ∼ V −2, wouldmimic the plateau in the viscosity, but it would result also ina constant ZFC magnetisation and the preservation of the Mvs T ln(ν0t) scaling in all the temperature range, in disagree-ment with the experimental findings. The existence of cantedspins in a surface layer in a spin-glass-like phase has also beenproposed to explain the low temperature magnetic propertiesof some ferri- and antiferromagnetic particles [20–22]. Surfacespins have multiple configurations for any orientation of thecore magnetisation, and the distribution of energy barriersshould be f(E) ∼ 1
E. This could explain the constancy of the
viscosity at temperature T < 3 K, but it cannot explain therest of our low temperature experimental findings.
Let us discuss our results in the frame of the discrete spinlevel structure existing in the two potential wells of the mag-netic anisotropy. The spin Hamiltonian of these nanosizedantiferromagnetic particles with a platelet shape may be writ-ten, as a first approximation, in terms of the dominant uni-axial anisotropy term, DS2
z , and the Zeeman term due to theinteraction of the net spin, S, of the particles with the exter-nal magnetic field
H = −DS2z + H ′
− gµBSH . (3)
2
Due to the size distribution and the non uniform shapeof particles we expect to have a distribution of values for Dand S. H ′ stands for other anisotropy terms. The symmetry-violating terms in the spin Hamiltonian of equation (4) induc-ing tunneling are those associated with the transverse com-ponent of both the magnetic field and magnetic anisotropy.The values of D and S in equation (4) represent the mean val-ues for all particles. Taking into account that: a) The averagebarrier height, U ≡ DS2, is proportional to the average block-ing temperature, TB ≃ 12K, U = TB ln(ν0t) = 248K, whereν0 = 108Hz and t ≃ 10 sec is the experimental time window,and b) the anisotropy field, Han = 2DS ≃ 3 T, is the fieldvalue that eliminates the barrier height between the two spinorientations, we have estimated S = 124 and D ≃ 1.6 × 10⁻²
K. Writing the relevant barrier height as U = KV , we findthat K ≃ 8 × 10⁵ erg/cm3.
The temperature, Tc, of the crossover from quantum tothermal superparamagnetism [7] may be roughly estimatedfrom Tc ≃ µB(H‖Hex)1/2, where H‖ ≃ 3T and Hex is theexchange field which may be estimated from the Neel tem-perature, TN = 960 K. We have got Tc ≃ 5 K.
The first term of equation (4) distributes the spin levelsin the two wells of the magnetic anisotropy separated by theenergy barrier U . The spin level, m = SZ , contributing to themagnetic signal at each temperature T , and for fields muchsmaller than Han, satisfies D(S2
− m2) ≃ 20T , that is atT ≃ TB the contributing levels are those near the top of thebarrier, m = 0, while at T ≪ TB only the ground state m = Scontributes to the magnetisation relaxation. This explainswhy at temperatures just below the blocking the relaxation ispurely thermal. At lower temperatures, however, the thermalrelaxation above the barriers competes with quantum tunnel-ing from the excited states. The fact that the scaling M vsT ln(ν0t) is broken below 5 K should correspond, therefore,to the occurrence of tunneling effects from the above men-tioned levels. The plateau in the viscosity below 3 K shouldreflect the quantum tunneling process from the ground stateSZ = S, in agreement with the fact that at these low tem-peratures only the level SZ = S is populated. Moreover, thevery low temperature ZFC and FC magnetisation curves obeythe 1/T Curie law suggesting that the inverse of the tunnel-ing frequency matches the experimental window time and theparticles are ”seen” superparamagnetically on our resolutiontime.
In conclusion, we have presented magnetic relaxation dataon antiferromagnetic α-Fe2O3 in the milikelvin range, forwhich the most plausible interpretation is the occurrence ofspin tunneling [1,18,19,23,24]. The decrease of the viscositywhen magnetic field increases agrees well with the discretelevel structure in the two wells.
[1] D. Awschalom, J. F. Smyth, G. Grinstein, D. T. DiVin-cenzo and D. Loss, Phys. Rev. Lett. 68, 3092 (1992).
[2] E. del Barco, N. Vernier, J. M. Hernandez, J. Tejada, E.M. Chudnovsky, E. Molins and G. Bellessa, Europhys.Lett., 47 (6), 722 (1999).
[3] E. del Barco, J. M. Hernandez, J. Tejada, N. Biskup, R.Achey, I. Rutel, N. Dalal and J. Brooks, Phys. Rev. B62,3018 (2000).
[4] D. P. DiVincenzo, Quantum Computation, Science 269,255 (1995).
[5] Introduction to Quantum Computation and Information,Ed. Hoi-Kwong Lo, Sandu Popescu and Tim Spiller,World Scientific, (1998).
[6] E. M. Chudnovsky in ”International Workshop on Macro-scopic Quantum Coherence and computing”, Napoli(2000).
[7] E. M. Chudnovsky and J. Tejada, ”Macroscopic Quan-tum tunneling of the magnetic moment”, Cambridge Uni-versity Press, (1998).
[8] J. L. Dorman, D. Fiorani and E. Tronc, Adv. Chem.Phys., Volume XCVIII, Edited by I. Prigogine and S. A.Rice, John Wiley & Sons, (1997)
[9] W. Wernsdorfer, B. Doudin, D. Mailly, K. Hasselbach,A. Benoit, J. Meier, J. Ph. Ansermet and B. Barbara,Phys. Rev. Lett. 77, 1873 (1996).
[10] W. Wernsdorfer, E. Bonet Orozco, K. Hasselbach, A.Benoit, D. Mailkly, O. Kubo, H. Nakano and B. Barbara,Phys. Rev. Lett. 79, 4014 (1997).
[11] N. Amin, and S. Arajs, Phys. Rev. B35, 4810 (1987).[12] M. Vasquez-Mansilla, R. D. Zysler, C. Arciprete, M. I.
Dimitrijewits, C. Saragovi and J. M. Greneche, J. Magn.Magn. Mater. 204, 29 (1999).
[13] T. Sugimoto, M. M. Khan, H, Itoh, A. Murumatsu, Col-loids Surf. A: Physicochem. Eng. Aspects 109, 155 (1996).
[14] D. Shindo, B.T. Lee, Y. Waseda, A. Murumatsu, T. Sug-imoto, Mater. Trans. JIM 34, 580 (1993).
[15] F. Bødker, M. F. Hansen, C. B. Koch, K. Lefman and S.Mørup, Phys. Rev. B 61, 6826 (2000).
[16] E. Vincent, J. Hamman, P. Prene and E. Tronc, J.Physique 4, 273 (1994).
[17] R. Sappey, E. Vincent, N. Hadacek, F. Chaput, J. P.Boilot and D. Zins, Phys. Rev. B 56, 14551 (1997).
[18] R. Sappey, PhD thesis, Orsay University, Paris(France)(1998)
[19] J. Tejada, X. X. Zhang, E. Del Barco, J. M. Hernandezand E. M. Chudnovsky, Phys. Rev. Lett. 79, 1754 (1997).
[20] R. H. Kodama, A. E. Berkowitz, E. J. McNiff and S.Foner, Phys. Rev. Lett. 77, 394 (1996).
[21] R. H. Kodama, S. A. Makhlouf and A. E. Berkowitz,Phys. Rev. Lett. 79, 1393 (1997).
[22] R. H. Kodama and A. E. Berkowitz, Phys. Rev. B 59,6321 (1999).
[23] S. Gider, D. D. Awschalom, T. Douglas, S. Mann and M.Chaparala, Science 268, 77 (1995).
[24] F. Luis, E. del Barco, J. M. Hernandez, E. Remiro, J.Bartolome and J. Tejada, Phys. Rev. B 59, 11837 (1999).
3
FIGURE CAPTIONS
Figure 1. ZFC and FC magnetization curves. The insetshows the linear dependendence of 1/MF C on temperaturein the millikelvin regime. The extrapolation of these data tozero temperature gives θc ≃ 0 mK.
Figure 2. Size distribution of α-Fe2O3 particles deducedfrom the ZFC and FC curves using equation (2) (dashed line)and from the M vs. T ln(ν0t) plot (continuous line).
Figure 3. Magnetization of α-Fe2O3 particles versusT ln(ν0t). The best fit has been achieved using ν0 = 108sec−1.
Figure 4. The temperature dependence of the magneticviscosity S for the α-Fe2O3 particles. The inset shows thevariation of S with field at T = 3 K.
4

0 20 40 60 80 100
5.0x10⁻⁵
1.0x10⁻⁴
1.5x10⁻⁴
2.0x10⁻⁴
2.5x10⁻⁴
3.0x10⁻⁴
M (
emu)
Figure 1 (del Barco et al.)
T (mK)
0 50 100 150 200 250 3003
4
5
6
7
8
9
T (mK)
1/M
(a.
u.)
2 3 4 5 6 7 80.0
0.1
0.2
0.3
0.4
d (nm)
Figure 2 (del Barco et al.)
size
dis
trib
utio
n

0 100 200 300 400 500
0.0
2.0x10⁻⁴
4.0x10⁻⁴
6.0x10⁻⁴
8.0x10⁻⁴
Figure 3 (del Barco et al.)
M
(em
u)
T ln(ν0t) (K)
0 30 60
7.0x10⁻⁴
7.5x10⁻⁴
8.0x10⁻⁴
8.5x10⁻⁴
9.0x10⁻⁴
M (
emu)
T ln(ν0t) (K)
0.1 1 100.0
0.5
1.0
1.5
2.0
2.5
3.0
3.5
4.0
4.5
5.0
Figure 4 (del Barco et al.)
dM/d
ln(t
) (a.
u.)
T (K)
0.0 0.2 0.4 0.6 0.8 1.0
S (a
.u.)
H (kOe)
Related Documents