ICEA Department MSc Environmental Engineering MASTER THESIS Marini Sara Magnetic nanocomposites for heavy metals removal from stormwater Supervisor: Prof. Sgarbossa Paolo ACADEMIC YEAR 2014/2015

Welcome message from author
This document is posted to help you gain knowledge. Please leave a comment to let me know what you think about it! Share it to your friends and learn new things together.
Transcript

ICEA Department
MSc Environmental Engineering
MASTER THESIS
Marini Sara
Magnetic nanocomposites for heavy metals removal from
stormwater
Supervisor: Prof. Sgarbossa Paolo
ACADEMIC YEAR 2014/2015


Abstract
By 2020 half the world population will probably live in urban areas, causing the increase in
the volume of stormwater needing treatment. Heavy metals are the most common pollutants
in urban dust and runoff. Many techniques have been developed to remove heavy metals from
wastewater both in the past (conventional techniques) and in recent years (alternative
techniques). All these methods present different drawbacks and problems, therefore new
methods of treatment must be developed in the near future. Iron oxide nanocomposites may
be an efficient tool to solve this problem. The present thesis studies new iron oxide/graphene
oxide nanocomposites, evaluating their morphologic and magnetic properties and assessing
their performance in removing lead, chromium and nickel. These nanocomposites can
efficiently be removed, after their application, simply by applying a magnet as demonstrated
by the results obtained through magnetic measurements and magnetic separation after
adsorption experiments. The removal efficiencies obtained depends on the heavy metal
treated. Among the heavy metals analyzed, the removal was more efficient for lead than for
chromium and nickel.
Metà della popolazione mondiale abiterà probabilmente nelle aree urbane entro il 2020,
causando l’aumento dei volumi di acqua di prima pioggia da trattare. I metalli pesanti sono gli
inquinanti più comuni nelle acque meteoriche di dilavamento. In passato e negli ultimi anni
sono state sviluppate diverse tecniche per la rimozione dei metalli pesanti dalle acque reflue.
Questi metodi di trattamento presentano diversi svantaggi e problemi, perciò nuovi metodi di
trattamento dovranno essere sviluppati nel prossimo futuro. I nanocompositi di ossidi di ferro
possono essere un efficiente strumento per risolvere questo problema. La presente tesi studia
nuovi nanocompositi, esaminando le loro caratteristiche morfologiche e magnetiche e
valutando la loro performance nella rimozione del piombo, del cromo e del nickel. Dopo
l’applicazione, questi nanocompositi possono essere rimossi semplicemente tramite
separazione magnetica, come dimostrato dai risultati ottenuti tramite misurazioni magnetiche
e dalle prove sperimentali di separazione magnetica successive agli esperimenti di
adsorbimento. Le efficienze di rimozione ottenute variano in base al metallo considerato. La
rimozione è più elevata nel caso del piombo rispetto al cromo e al nichel.

Index
1. Stormwater pollutants and legislation ------------------------------------------------------------- 7
2. Heavy metals removal from water ---------------------------------------------------------------- 13
2.1 Conventional methods ------------------------------------------------------------------------ 13
2.1.1 Chemical precipitation ------------------------------------------------------------------ 13
2.1.2 Ion exchange ------------------------------------------------------------------------------ 14
2.1.3 Electrochemical removal ---------------------------------------------------------------- 14
2.2 Alternative techniques ------------------------------------------------------------------------ 14
2.2.1 Adsorption -------------------------------------------------------------------------------- 15
2.2.2 Membrane filtration --------------------------------------------------------------------- 16
2.2.3 Electrodialysis ---------------------------------------------------------------------------- 17
2.2.4 Photocatalysis ---------------------------------------------------------------------------- 18
3. Safe and sustainable water treatment with magnetic nanoparticles -------------------------- 21
3.1 Magnetic behaviour --------------------------------------------------------------------------- 23
4. Magnetic iron oxide nanoparticles synthesis and functionalizations ------------------------ 27
4.1 Stabilization of magnetic particles ---------------------------------------------------------- 31
4.2 Nanocomposites for wastewater treatment ------------------------------------------------ 32
5. Graphene oxide -------------------------------------------------------------------------------------- 35
5.1 Adsorption and desorption of iron oxide nanoparticles from graphene oxide -------- 37
6. Aim of the thesis ------------------------------------------------------------------------------------ 41
7. Nanocomposites synthesis and functionalizations --------------------------------------------- 45
7.1 Iron NPs synthesis ----------------------------------------------------------------------------- 46
7.2 NPs-DHCA synthesis ------------------------------------------------------------------------- 47
7.3 NPs-CA synthesis ----------------------------------------------------------------------------- 47
7.4 NPs-APTES synthesis ------------------------------------------------------------------------ 48
7.5 Graphene oxide synthesis -------------------------------------------------------------------- 49
7.6 NPs-GO synthesis ----------------------------------------------------------------------------- 49
7.7 GO nanocomposites --------------------------------------------------------------------------- 50
8. Vibrating Sample Magnetometer ----------------------------------------------------------------- 53
9. Adsorption experiments ---------------------------------------------------------------------------- 57
10. Nanocomposites morphology ------------------------------------------------------------------ 59

11. Magnetic measurements ------------------------------------------------------------------------- 67
12. Metals removal experiments -------------------------------------------------------------------- 75
13. Spreading and ecotoxicology of nanotechnologies ------------------------------------------ 83
13.1 Ecotoxicology of iron oxide nanoparticles ------------------------------------------------ 85
14. Conclusions --------------------------------------------------------------------------------------- 87
15. Bibliography -------------------------------------------------------------------------------------- 89

Stormwater pollutants and legislation
6

Stormwater pollutants and legislation
1. Stormwater pollutants and legislation
Pollution generated by urban run-off is an important environmental problem especially
for the extremely varied nature of the type of pollutants, which depends mainly on the
nature of the anthropogenic activities occurring in the interested area. The pollutants
include organic compounds (such as polycyclic aromatic hydrocarbons (PAHs),
polychlorinated biphenyls (PCBs), atrazine), nutrients and heavy metals (such as lead,
mercury, chromium) which are widely spread and difficult to remove. Table 1.1 shows
common stormwater pollutants and their sources.
Table 1.1: Pollutants and their sources in stormwater runoff [1] .
By 2020 half the world population will probably live in urban areas causing the increase
in the volume of stormwater needing treatment [1].
Heavy metals are the most common pollutants in urban dust and runoff. They are
particularly dangerous because of their high solubility in water, which means they can
easily enter and spread in the environment, and consequently enter the food chain [2].
There are many different definitions for heavy metals, based on density, on atomic
weight or on their chemical properties and their toxicity. In urban environments, heavy
metals usually refer to toxic metals that originate from human activities [1].
Excess levels of these heavy metals can damage human health and ecosystems.
However some of these same elements are required in trace amounts by human and
living organisms. The heavy metals of most concern in the environment are chromium
(Cr), nickel (Ni), zinc (Zn), copper (Cu), lead (Pb), vanadium (V), cobalt (Co),
cadmium (Cd) and mercury (Hg).
Soil erosions Vehicles
Human/animal waste Fertilizers
Household chemicals
Industrial processes
Paint and preservatives
Solids
Metals
Oil, greese and organics
Nutrients
7

Stormwater pollutants and legislation
Heavy metals cause important harmful health effects, such as reduced growth and
development, cancer, organ damage, nervous system damage, and death. Moreover,
some metals, such as mercury and lead, may cause development of autoimmunity (a
person’s immune system attacks the harmless cells of its own body) [2].
The type and amount of heavy metals present in stormwater depends on many factors
such as:
land use characteristics;
specific materials and components employed in the drainage area;
meteorological effects.
In non-industrial areas the main sources of heavy metals are automobiles and structures
with metallic components [3].
Davis et al. [3] reported the major source for each heavy metal, such as the brakes for
copper, the tire wear for zinc and the vehicles’ surfaces for chromium, since they are
coated with hexavalent chromium to prevent corrosion.
Table 1.2 presents several heavy metals concentration range in the sediments on street
surfaces as a function of sediment grain size. Sediments were collected in an area close
to London. The concentration is higher in the case of coarse sediments.
Table 1.2: Heavy metals range as a function of sediment grain size [1].
Due to their toxicity and harmfulness, heavy metals discharge to the environment has
been regulated by laws throughout the world. The limit concentration established by law
for water discharge varies with the type of heavy metal and from country to country.
In Italy this limit concentrations are established by Legislative Decree 152/2006 (Table
1.3).
Sediment size < 250 μm Sediment size > 250 μm
Pb (μg/g) 40-1690 111-2296Cd (μg/g) 0,72-4,2 1,3-6,8Mn (μg/g) 766-855 694-1244 Zn (μg/g) 119-2133 91,6-1760Cu (μg/g) 42,6-640 27,2-212Fe (μg/g) 6780-22700 4195-22850
8

Stormwater pollutants and legislation
Table 1.3: Limit concentrat ion for water discharge according to legislative decree 152/2006 [ 4].
Parameters Unit of measure
Discharge in surface waters
Discharge in sewer system
pH 5,5-9,5 5,5-9,5 BOD5 (as O2) mg/l ≤ 40 ≤ 250 COD (as O2) mg/l ≤ 160 ≤ 500 Alluminum mg/l ≤ 1 ≤ 2,0
Arsenic mg/l ≤ 0.5 ≤ 0.5 Barium mg/l ≤ 20 - Boron mg/l ≤ 2 ≤ 4
Cadmium mg/l ≤ 0,02 ≤ 0,02 Total chromium mg/l ≤ 2 ≤ 4 Chromium (VI) mg/l ≤ 0,2 ≤ 0,20
Iron mg/l ≤ 2 ≤ 4 Manganese mg/l ≤ 2 ≤ 4
Mercury mg/l ≤ 0.005 ≤ 0.005 Nickel mg/l ≤ 2 ≤ 4 Lead mg/l ≤ 0,2 ≤ 0,3
Copper mg/l ≤ 0,1 ≤ 4 Selenium mg/l ≤ 0,03 ≤ 0,03
Tin mg/l ≤ 10 - Zinc mg/l ≤ 0,5 ≤ 1,0
Total cyanide mg/l ≤ 0,5 ≤ 1,0 Free available chlorine mg/l ≤ 0,2 ≤ 0,3
Sulfide (as H2S) mg/l ≤ 1 ≤ 2 Sulfite (as SO3) mg/l ≤ 1 ≤ 2 Sulfate (as SO4) mg/l ≤ 1000 ≤ 1000
Chloride mg/l ≤ 1200 ≤ 1200 Fluoride mg/l ≤ 6 ≤ 12
Total phosphorus (as P) mg/l ≤ 10 ≤ 10 Ammoniacal nitrogen
(as NH4) mg/l ≤ 15 ≤ 30
Nitrous nitrogen (as N) mg/l ≤ 0,6 ≤ 0,6 Nitric nitrogen (as N) mg/l ≤ 20 ≤ 30
Fats and oils mg/l ≤ 20 ≤ 40 Total hydrocarbons mg/l ≤ 5 ≤ 10
Phenols mg/l ≤ 0,5 ≤ 1 Aldehydes mg/l ≤ 1 ≤ 2
Aromatic organic solvents mg/l ≤ 0,2 ≤ 0,4 Nitrogen organic solvents mg/l ≤ 0,1 ≤ 0,2
Total surfactants mg/l ≤ 2 ≤ 4 Total pesticides mg/l ≤ 0,05 ≤ 0,05
Chlorinated solvents mg/l ≤ 1 ≤ 2
9

Stormwater pollutants and legislation
With regard to stormwater, the Legislative Decree 152/2006 establishes that regions are
responsible for deciding when and which amount of stormwater needs to be treated in a
wastewater treatment plant. For example Lombardia’s legislation defines stormwater as
the first 5 mm/m2 of rainwater, due to their relatively high concentration of pollutants
[5]. Whenever these waters come from industrial soil, parking, oil stations etc., they
must be conveyed and treated in sewage treatment plants.
Heavy metals limits for discharge in sewer system are compulsory in absence of
specific limits defined by the competent (regional) authority, or whenever the final
treatment plant cannot assure that final limit concentrations for discharge in surface
waters can be reached. Also whenever stormwater coming from parking, oil stations
etc., is discharged directly on soil, heavy metals removal may be necessary. In this last
case, heavy metals concentration limits before discharge are those presented in Table
1.4.
10

Stormwater pollutants and legislation
Table 1.4: Limits for discharge on soil.
Parameters Unit of
measure Discharge on
soil pH 6-8
BOD5 (as O2) mg/l ≤ 20 COD (as O2) mg/l ≤ 100
Total nitrogen (as N) mgN/l ≤ 15 Total phosphorus (as P) mgP/l ≤ 2
Total surfactants mg/l ≤ 0,5 Alluminum mg/l ≤ 1
Arsenic mg/l ≤ 0,05 Barium mg/l ≤ 10 Boron mg/l ≤ 0,5
Total chromium mg/l ≤ 1 Iron mg/l ≤ 2
Manganese mg/l ≤ 0,2 Nickel mg/l ≤ 0,2 Lead mg/l ≤ 0,1
Copper mg/l ≤ 0,1 Selenium mg/l ≤ 0,002
Tin mg/l ≤ 3 Zinc mg/l ≤ 0,5
Free available chlorine mg/l ≤ 0,2 Sulfide (as H2S) mg/l ≤ 0,5 Sulfite (as SO3) mg/l ≤ 0,5 Sulfate (as SO4) mg/l ≤ 500
Chloride mgCl/l ≤ 200 Fluoride mgF/l ≤ 1 Phenols mg/l ≤ 0,1
Aldehydes mg/l ≤ 0,5 Aromatic organic solvents mg/l ≤ 0,01 Nitrogen organic solvents mg/l ≤ 0,01
11

Stormwater pollutants and legislation
12

Heavy metals removal from water
2. Heavy metals removal from water
Many techniques are available to treat heavy metals, however some criteria are
important to choose the best one:
• Applicability to local condition.
• Ability to reach the legal limit concentration as defined by law.
Innovative processes for treating wastewater containing heavy metals are the most
widely studied and applied. However, lime precipitation, a conventional method of
treatment, is one of the most efficient techniques to treat inorganic effluents with a
metal concentration higher than 1000 mg/l. The present paragraph reviews the different
methods, both conventional and innovative ones.
2.1 Conventional methods
Conventional methods to treat metal contaminated water are [2]:
- Chemical precipitation.
- Ion exchange.
- Electrochemical removal.
2.1.1 Chemical precipitation
The method of chemical precipitation can be summarized by the following precipitation
equation (M2+ are the dissolved metal ions, OH- represents the precipitant and M(OH)2
is the insoluble metal hydroxide).
𝑀𝑀2+ + 2𝑂𝑂𝑂𝑂− ↔ 𝑀𝑀(𝑂𝑂𝑂𝑂)2 ↓
The major parameter affecting this method is the pH, which needs to be adjusted to
basic conditions. The most common precipitant agents used are lime and limestone
(composed of calcium carbonate, CaCO3). Lime precipitation is efficient to treat
inorganic effluents with concentrations higher than 1000 mg/l. Although the technique
13

Heavy metals removal from water
is cheap, safe and simple, it requires the use of a large amount of chemicals in order to
reduce metal content to an acceptable level before discharge. Furthermore, it creates a
lot of sludge needing treatment. Other minor drawbacks are slow metal precipitation,
poor settling, aggregation of metal precipitates, long-term environmental impacts of
sludge disposal.
2.1.2 Ion exchange
Ion exchange. Ion exchangers are capable of exchanging ions with the surrounding
material. The most common are synthetic, organic resins, which generally can be
regenerated on site by treatment with acid or caustic soda. This method has many
drawbacks, the most important being that it cannot treat water with high metal
concentration, because of fouling of the matrix by organics and other solids present in
the wastewater. Furthermore, ion exchange is nonselective and highly sensitive to pH.
2.1.3 Electrochemical removal
This technique is based on the passage of a current by a cathode plate and an insoluble
anode through the water stream. Metal cations present in water are attracted by the
negatively charged cathode and stick to it. A metal deposit forms on the cathode and
can be removed. The main drawback is that electrodes may be easily corroded, so they
may have to be replaced frequently.
2.2 Alternative techniques
As shown there are many disadvantages in applying conventional techniques, such as
large chemical requirements, production of high amounts of sludge and fouling.
Although these methods can still be useful in some cases, new techniques can treat
water in a more efficient way, by minimizing drawbacks. The most important
alternative techniques are:
- Adsorption.
- Membrane filtration.
14
Heavy metals removal from water
- Electrodialysis.
- Photocatalysis.
2.2.1 Adsorption
The most important alternative technique is adsorption, a mass transfer process.
Adsorption consists in the transfer of a substance from the liquid phase to the surface of
a solid. The substance may be bound by physical and/or chemical interactions. The
process is composed of three main steps [2]:
1. Transport of the pollutant from the bulk solution to the sorbent surface.
2. Adsorption on the solid surface.
3. Transport within the sorbent particle.
Currently, the most popular method for the removal of heavy metals from water is
immobilization through adsorption on activated carbon, a cheap and easy to apply
technique. Many other adsorbents have been studied; these may have mineral, organic
or biologic origin [2]:
Zeolites (aluminosilicate minerals composed of aluminum, silicon and oxygen).
Clinoptilolite, the most important natural zeolite, showed high selectivity for
some particular heavy metal ions, e.g. Pb(II), Cd(II), Zn(II), and Cu(II).
However its efficiency is highly dependent on the pretreatment. Instead,
synthetic zeolite selective adsorption is highly pH dependent.
Clay-polymer composites are natural clay minerals (hydrous aluminum
phyllosilicates) modified with a polymeric material in order to improve the
polymer efficiency in removing metals.
Phosphates, such as calcined phosphate, activated phosphate (with nitric acid),
and zirconium phosphate.
15

Heavy metals removal from water
Industrial byproducts, for example fly ash, iron slags, hydrous titanium oxide.
All these material can be chemically modified in order to remove heavy metals
from water.
Modified agricultural and biological wastes. In this case the process is called
bio-sorption and utilizes inactive (non-living) microbial biomass to bind heavy
metals by purely physico-chemical mechanisms (mainly chelation and
adsorption). Some examples are hazelnut shell, rice husk, pecan shells, jackfruit,
maize cob or husk. These need to undergo chemical modification or conversion
by heating into activated carbon before use.
Biopolimers. These have a lot of positive features, such as capability of lowering
transition metals ion concentration to an order of magnitude lower than parts per
billion; availability; environmental safety. Moreover their different functional
groups (hydroxyls, amines, etc.) increase the efficiency of metal ion uptake and
the maximum chemical loading possible.
Hydrogels, crosslinked hydrophilic polymers. Removal is driven by water
diffusion into the hydrogel. Hydrogels expand their volume thanks to their high
swelling in water.
2.2.2 Membrane filtration Membrane filtration is another method whose use is constantly increasing in the last
years. It allows to remove a wide range of contaminants: suspended solids, organic and
inorganic compounds (e.g. heavy metals). There are three types of membrane filtration:
ultrafiltration (UF), nanofiltration (NF) and reverse osmosis (RO). This classification is
based on the size of the particles that can be retained by the membrane: UF > NF > RO.
Therefore generally NF membranes separation efficiency is between the UF and RO
ones. The three types of filtration combined can be used to obtain multiple barriers in
order to increase the efficiency.
16

Heavy metals removal from water
Figure 2.1: Comparison between the different types of filtration [6].
In ultrafiltration (UF) a permeable membrane separates macromolecules, suspended
solids and heavy metals from water. The pore size ranges from 5 to 20 nm and the
molecular weight of the separating compounds from 1000 to 100000 Da. With a metal
concentration ranging from 10 to 112 mg/l, UF can reach a removal efficiency higher
than 90%. However, fouling has many adverse effects on the membrane (e.g. flux
decline, increase in transmembrane pressure), which result in high operational costs [2].
Reverse osmosis is sometimes used to remove low levels of heavy metals from drinking
water. However this method is costly and easily subject to clogging (the same metal
oxides tend to clog the membrane).
2.2.3 Electrodialysis
Electrodialysis (ED) is a particular membrane separation process. Water pass through
ion exchange membranes composed of thin sheets of plastic materials with either
anionic or cationic characteristics and an electric potential is applied. The anions present
in solution migrate toward the anode and the cations toward the cathode, crossing the
ion exchange membranes ([7], Figure 2.2).
ED produces a highly concentrated stream and allows to recover valuable metals such
as Cr and Cu. Like the other membrane techniques, ED requires periodic maintenance.
17

Heavy metals removal from water
Figure 2.2: Electrodialysis scheme. CM, cation-exchange membrane, D, diluate chamber, e1 and e2 – electrode
chambers, AM, anion exchange membrane, and K, concentrate chamber [7].
2.2.4 Photocatalysis
Photocatalysis in an alternative process that utilizes solar energy. The classical
photocatalysis is composed of five steps [8]:
1. Transfer of the reactants in the fluid phase to the surface of the catalyst.
2. Adsorption the reactants.
3. Reaction in the adsorbed phase.
4. Desorption of the products.
5. Removal of the products from the interface region
The photocatalytic reaction occurs during step n° 3, in the adsorbed phase. When the
semiconductor–electrolyte interface is hit by light with energy equal or greater than the
semiconductor band-gap, electron–hole pairs (e-/h+) form and dissociate into free
photo-electrons in the conduction band and photoholes in the valence band.
At the same time, if a fluid phase (gas or liquid) is present, a spontaneous adsorption
occurs and electrons are transferred towards acceptor molecules, whereas positive
photoholes are transferred to donor molecules (according to the redox potential of each
adsorbate) [8]. That is to say, the charge carriers migrate toward the semiconductor
surface and are capable of reducing or oxidizing species in solution (Figure 2.3, [2]).
18

Heavy metals removal from water
Figure 2.3: Scheme of photocatalysis over TiO2.
All these alternative techniques have many benefits but also a lot of important
drawbacks, which can be summarized in (Table 2.1, [2]):
• High operational costs due to the chemicals used.
• High-energy consumption.
• Handling costs for sludge disposal.
Table 2.1: Advantages and drawbacks of the main techniques for heavy metal treatment in wastewater.
Treatment method Advantages Disadvantages References
Chemical precipitation
Low capital cost, simple operation
Sludge generation, extra operational cost for sludge
disposal
Kurniawan et al. (2006)
Adsorption with new
adsorbents
Low-cost, easy operating conditions, having wide pH range, high metal binding
capacities
Low selectivity, production of waste products
Babel and Kurniawan
(2003); Aklil et al. (2004)
Membrane filtration
Small space requirement, low pressure, high separation
selectivity
High operational cost due to membrane fouling
Kurniawan et al. (2006)
Electrodialysis High separation selectivity High operational cost due to
membrane fouling and energy consumption
Mohammadi et al. (2005)
Photocatalysis Removal of metals and organic pollutant simultaneously, less
harmful by-products
Long duration time, limited applications
Barakat et al. (2004);
Kajitvichyanukula et al. (2005)
Considering the relevant drawbacks of both conventional and alternative techniques, it
is still necessary to develop more efficient techniques for stormwater pollutants 19

Heavy metals removal from water
treatment. In recent years, the environmental remediation research studies have been
focused on the design and development of nanosized materials for adsorption of organic
and heavy metal pollutants [9].
To tackle the problem of stormwater treatment, the present thesis analyzes the use of
magnetically separable nanocomposites. These composites may allow to reduce the
sludge produced and to improve the quality of the treated effluent.
20

Safe and sustainable water treatment with magnetic nanoparticles
3. Safe and sustainable water treatment with magnetic nanoparticles
Nanomaterials and nanostructures have at least one dimension in the order of magnitude
of nanometers (between 1 and 100 nm) [10]. Typically a nanoparticle consists of 10 -
105 atoms and is smaller than a bacterial cell, whose diameter is about 1 µm (1000 nm)
[11, 12].
Many of these nanomaterials, such as metal and metal oxide nanoparticles have a higher
reactivity if compared to the corresponding bulk material thanks to their higher surface
area/volume ratio. The peculiar reactivity may be caused by the increasing number of
surface atoms with decreasing particle size. In other words, particle surface area
increases with decreasing particle size, as shown in Figure 3.1. For this reason they
present also different optical, electrical and magnetic properties with respect to
microscopic particles [10].
Figure 3.1: Particle surface area varying with diameter. (Surface area was calculated assuming spherical
geometry and the average density of Fe0 and Fe3O4, 6,7 g/cm3) [13].
Nowadays magnetic nanoparticles, particularly nano zero-valent iron (nZVI), magnetite
(Fe3O4) and maghemite (γ-Fe2O3) nanoparticles, and their applications in water
21

Safe and sustainable water treatment with magnetic nanoparticles
treatment are an important field of research. They show have a capacity for metals
uptake from water thanks to some peculiar properties:
High surface to volume ratio, as explained above, which implies fast kinetics for
contaminant removal [14].
Magnetism, a very useful property and, compared to sophisticated membrane
filtration, a more cost effective method to separate nanoparticles from water,
even though no successful real application has been reported yet [15]. This
property will be explained more in detail in the following paragraph.
Ability for surface modification, by covering the particles with inorganic shells
or by attaching organic molecules to them. These properties may be used to
stabilize the particles in order to prevent their oxidation but also to provide them
with specific functionalities, for example, to make them selective in ion uptake
[1].
Low toxicity. Iron is a micronutrient, a substance essential for grow and survival
in low amounts. However it can have adverse effects on living organisms at high
concentrations.
Low price. Considering these nanoparticles can be synthetized using mainly iron
salts, their price is limited, especially if compared with that of other types of
nanomaterials, for example gold nanoparticles.
Iron oxide is naturally abundant in nature in the forms of magnetite, Fe3O4 and
maghemite, γ-Fe2O3. Hematite shows weak, size-dependent magnetism while
maghemite shows strong ferromagnetism [16].
The magnetic nanoparticles performance in removing contaminants depends on the
removal mechanisms applied. The mechanism of heavy metals removal by magnetic
nanoparticles can proceed through different processes such as (Figure 3.2):
- Adsorption
- Reduction
- Co-precipitation
22

Safe and sustainable water treatment with magnetic nanoparticles
Figure 3.2: Different removal mechanisms used by magnetic nanopart icles.
Magnetite nanoparticles remove heavy metals by both physical and chemical
adsorption, while maghemite particles usually gives only physical adsorption. This is
demonstrated also by the low desorption of metals at high pH that occurs when applying
magnetite, Fe3O4, nanoparticles, typical of chemical adsorption. Instead adsorption by γ-
Fe2O3 nanoparticles does not involve chemical reaction as demonstrated by the
unchanged crystallite structure after metals removal. As a matter of fact elettrostatic
interactions are the cause of pollutant removal by maghemite nanoparticles.
Removal performance of magnetite and maghemite nanoparticles is highly pH
dependent. At pH values below the zero point of charge (pHzpc), also called isoelectric
point (IEP), the surface of iron oxide nanoparticles is positively charged and therefore
attracts negatively charged pollutants such as Cr (IV) and As (V) [15].
3.1 Magnetic behaviour
The movements of particles that have both mass and electric charges (e.g. electrons,
holes, protons, and positive and negative ions) are the cause of magnetic effects. A
magnetic dipole, so-called magneton, is composed of a spinning electric-charged
particle. A magnetic domain or Weiss domain in a ferromagnetic material is a volume in
which all magnetons are aligned in the same direction [17]. This domain structure is the
reason why the magnetic behavior of ferromagnetic material is size dependent. As a
matter of fact, iron oxide nanoparticles, unlike zero valent iron particles, show super-
paramagnetic properties [14]. Superparmagnetic properties are caused by nanoparticles’
23

Safe and sustainable water treatment with magnetic nanoparticles
size and can be explained analyzing the coercivity, the main parameter describing the
ferromagnetic material reaction to a magnetic field.
There are two different notions of coercivity, one defined in the M(H) graph and the
other in the B(H) graph. In both cases the coercivity is represented by the point of
intersection of the function with the negative H axis (Figure 3.3, [18]). M is the
magnetization inside the sample induced by the applied magnetic field, H. B is defined
as B=µ0(H+M). The coercivity analyzed in this thesis is the intrinsic coercivity. In the
following paragraphs it will be called simply coercivity.
Figure 3.3: M vs H, hysteresis curve for a ferromagnetic material. Ms is the saturation magnetization. Mr, M at H
equal to zero, is the residual magnetization. Hci is the intrinsic coercivity, i.e. the field that reduces M to zero.
B=µ0(H+M) vs H, another hysteresis curve for ferromagnetic materials. Br is the residual induction when H=0. Hc is
the coercivity, the field that reduces B to zero [18].
24

Safe and sustainable water treatment with magnetic nanoparticles
When the nanoparticle diameter decreases, the coercivity increases to a maximum and
then decreases toward zero. If the diameter of a single domain particle further decreases,
the coercivity becomes zero and the particle is superparamagnetic (Figure 3.4).
Figure 3.4: Coercivity variation with particle diameter.
Superparamagnetic nanoparticles exhibit a magnetic behavior in the presence of an
external magnetic field but get back to a nonmagnetic state when the external magnet is
removed while ferromagnetic nanoparticles maintain a net magnetization also after the
magnet removal (Figure 3.5). Between the naturally occurring minerals on earth (e.g.
Fe, Co, Ni crystalline materials show ferromagnetic properties), magnetite, Fe3O4, is the
most magnetic [17].
25

Safe and sustainable water treatment with magnetic nanoparticles
Figure 3.5: The domains of a ferromagnetic NP and the magnetic moment of single domain superparamagnetic NPs
align with the applied magnetic field. However if the external magnet is removed, while ferromagnetic nanoparticles
maintain their magnetization, superparamagnetic nanoparticles will show no net magnetization.
There are two main advantages of superparamagnetic nanoparticles:
- Higher reactivity thanks to the higher surface to volume ratio, as explained
previously.
- Greater tendency to mix in solution, thanks to the absence of a net
magnetization when no magnet is applied.
26

Magnetic iron oxide nanoparticles synthesis and functionalizations
4. Magnetic iron oxide nanoparticles synthesis and functionalizations
There are two main challenges that must be overcome when synthetizing
superparamagnetic nanoparticles:
1. Define experimental conditions that allow to obtain nanoparticles with suitable
size. Moreover, the size dispersion must be low, to assure that all particles are at
the nanoscale and present the same properties.
2. Select a process that is easily reproducible by industries.
Many methods were developed to synthesize magnetic iron oxide nanoparticles [19]:
Coprecipitation.
Reactions in constrained environment.
Hydrothermal and high-temperature reactions.
Sol-gel reactions.
Polyol methods.
Flow injection synthesis.
Electrochemical methods.
Aerosol/Vapor methods.
Sonolysis.
Coprecipitation, the most common, efficient and easiest method. Two stages are
involved in this process: a short burst of nucleation, when the reactants concentrations
reaches critical supersaturation and a slow growth of the nuclei, by diffusion of the
solids to the surface of the crystals. Iron oxides (Fe3O4 or γFe2O3) are prepared by
mixing ferrous and ferric salts in aqueous medium. Since particles number is defined
during the first step, also size control must be generally performed in this stage of the
process. The reaction representing Fe3O4 formation is:
𝐹𝐹𝐹𝐹2+ + 2𝐹𝐹𝐹𝐹3+ + 8𝑂𝑂𝑂𝑂− → 𝐹𝐹𝐹𝐹3𝑂𝑂4 + 4𝑂𝑂2𝑂𝑂
27

Magnetic iron oxide nanoparticles synthesis and functionalizations
Complete precipitation of Fe3O4 is expected at a pH ranging from 8 to 14, with a
stoichiometric ratio Fe3+/Fe2+ of 2:1 in a non-oxidizing oxygen environment (since the
oxygen used to oxidize iron is the one present in OH- ions, therefore the oxygen is
already reduced). Moreover the higher the pH and the closer the stoichiometric ratio
Fe3+/Fe2+ to 2:1, the smaller the particles size and the size distribution with will be. Also
increasing the mixing rate allows to reduce particles size.
Since magnetite, Fe3O4, is not stable, it is transformed into maghemite γFe2O3 in the
presence of oxygen:
𝐹𝐹𝐹𝐹3𝑂𝑂4 + 2𝑂𝑂+ → γFe2𝑂𝑂3 + 𝐹𝐹𝐹𝐹2+ + 𝑂𝑂2𝑂𝑂
Reactions in constrained environment, as many other methods, was developed to
produce nanoparticles with more uniform dimensions with respect to those obtained
with the coprecipitation method. This technique utilizes synthetic and biological
nanoreactors. Surfactant molecules may spontaneously form nanodroplets of different
sizes:
• micelles (1-10 nm)
• water-in-oil emulsions (10-100 nm)
In these nanodroplets aqueous iron salt solutions are encapsulated by a surfactant
coating that separates them from a surrounding organic solution. Consequently, this
system forms a nanoreactor since it applies kinetic and thermodynamic constraints on
particle formation. These constraints limit particle nucleation and growth.
Figure 4.1: Reverse micelle structure.
28

Magnetic iron oxide nanoparticles synthesis and functionalizations
Hydrothermal and high-temperature reactions. These processes are carried out in
acqueous media in reactors or autoclaves characterized by very high temperatures and
pressures (pressure can be higher than 2000 psi, temperature higher than 200°C). There
are two similar and alternative routes to obtain iron oxide nanoparticles with this
method: hydrolysis and oxidation or neutralization of mixed metal hydroxides. The
main difference between these two routes is that the first one utilizes iron salts. In both
cases, as it often occurs in nanoparticles synthesis, reaction conditions significantly
affected the product characteristics. For example, a prolonged reaction time and higher
water content increased the size of the nanoparticles obtained.
Sol-gel reactions, based on the hydroxylation and condensation of molecular precursors
in solution, forming a “sol” of nanometric particles. The wet gel, a three dimensional
metal oxide network, was obtained by further condensation and inorganic
polymerization. Since these reactions occur at room temperature, a final heat treatment
is needed to reach the final crystalline state.
Polyol methods, similar to sol-gel reactions. Polyols used ad solvents have some
interesting characteristics. They can dissolve inorganic inorganic compounds thanks to
their high dielectric constants. They can be used to prepare inorganic compounds in a
wide operating-temperature range because of their high boiling points. Furthermore,
polyols avoid interparticle aggregation.
Flow injection synthesis, used to obtain particles with narrow size distribution and to
define the particle morphology. The reaction zone is confined in different “matrixes”
such as emulsions. An alternative to the “matrix” confinement can be a specific design
of the reactor. The obtained particles have a narrow sized distribution ranging from 2 to
7 nm.
Electrochemical methods. Preparation of iron oxide nanoparticles from an iron electrode
in an aqueous solution of dimethylformamide and cationic surfactants.
Aerosol/Vapor methods. Spray and laser pyrolysis have the main advantage to be
continuous chemical processes allowing high rate production. In spray pyrolysis after a
solution of ferric salts and a reducing agent in organic solvents is sprayed into a series
29

Magnetic iron oxide nanoparticles synthesis and functionalizations
of reactors, the aerosol solute condenses and the solvent evaporates. Particles size in the
resulting dried residue depends on the initial size of the original droplets. Laser
pyrolysis allows to reduce the reaction volume. Small, narrow sized nanoparticles are
produced by laser heating a gaseous mixture of iron precursor.
Figure 4.2: Scheme of laser pyrolysis [20].
Sonolysis, breaking of chemical bonds or radicals formation by using ultrasound, Figure
4.3. The rapid collapse of sonically generated cavities originates very high temperature
hot spots allowing for the conversion of ferrous salts into magnetic nanoparticles.
Figure 4.3: Sonolysis process. Applying ultrasound, alternate compression and rarefaction of the liquid causes
pressure drops leading to the formation of small gas bubbles. The bubbles collapse after reaching an unstable size.
30

Magnetic iron oxide nanoparticles synthesis and functionalizations
4.1 Stabilization of magnetic particles
Iron oxide nanoparticles must be stabilized against aggregation by reaching the
equilibrium between attractive and repulsive forces in the magnetic colloidal
suspension.
There are four types of forces that theoretically contribute to the interparticle potential
in the system:
1. Van der Waals forces that induce strong short range isotropic attractions.
2. Electrostatic repulsive forces that can be partially screened adding salt to the
suspension.
3. Magnetic dipolar forces between two particles, in case of magnetic suspensions.
4. Steric repulsion forces, in case of non-naked particles.
The first three types of forces are globally attractive as can be demonstrated integrating
the anisotropic interparticle potential over all directions. Stabilization of the particles
can be achieved acting on one or both of the two repulsive forces (electrostatic and
steric repulsion, Figure 4.4).
Figure 4.4: Particles are stabilized by an electrostatic layer or by steric repulsion.
The surface iron atoms of iron oxide act as Lewis acids, therefore coordinate with
molecules that donate lone-pair electrons. In aqueous solutions, iron atoms coordinate
with water, which rapidly dissociates leaving the iron oxide surface hydroxyl 31

Magnetic iron oxide nanoparticles synthesis and functionalizations
functionalized. Being the hydroxyl groups amphoteric, they may react with acids or
bases. The surface of the magnetite will be positive or negative, depending on pH
present in solution. The isoelectric point (also called point of zero charge, PZC) is
observed at pH 6,8. Around the PZC the particles are no longer stable in water and
flocculate, because their surface charge density is too low. To obtain stable iron oxide
nanoparticles, it is then necessary to act on both electrostatic and steric stabilization.
Many different stabilizers were studied:
• Monomeric stabilizers, such as carboxylates, phosphates.
• Inorganic materials: silica, gold.
• Polymer stabilizers, such as dextran, polyethylene glycol (PEG), polyvinyl
alcohol (PVA).
4.2 Nanocomposites for wastewater treatment
Only a few studies have been carried out on nanocomposites applied to wastewater
treatment. Mahdavian et al. [21] investigated the ability of magnetite nanoparticles
functionalized with APTES ((3-aminopropyl)triethoxysilane) and acryloyl chloride
(AC) to adsorb heavy metal cations such as Cd2+, Pb2+; Ni2+ and Cu2+. By FT-IR
(Fourier Transform Infrared Spectroscopy) spectra, they found that aminosilane
molecules are linked on the surface of the magnetite nanoparticles, through Fe-O-Si
chemical bonds. The APTES-NPs particles can be further modified, for example with
acryloyl chloride. Furthermore, metal cations concentration in solution decreased in
time until being completely removed. The adsorption capacity was maximum for lead
ions and minimum for cadmium ions.
Ozmen et al. [22] studied the capacity of magnetite nanoparticles functionalized with
APTES and glutaraldehyde (GA) to remove Cu (II) from water. They obtained good
results, reaching adsorption equilibrium in 15 minutes (Figure 4.5) and found that in this
case Cu removal is pH dependent. As a matter of fact the maximum removal of Cu (II)
occurred at a pH equal to 4 and 5,3. According to Ozmen et al. iron oxide nanoparticles
functionalized with both APTES and GA (GA-APTES-NPs) show a better adsorption
capability than particles functionalized with APTES only.
32

Magnetic iron oxide nanoparticles synthesis and functionalizations
Figure 4.5: Effect of contact time (left) and initial Cu (II) concentration on the adsorbate removal by GA-APTES-
NPs, synthetized by Ozmen et al. [22].
Diagboya et al. analyzed the Hg2+ adsorption by iron oxide nanoparticles functionalized
with GO through reaction with APTES. They demonstrated that the nanocomposite
adsorption capacity is five times higher than that of the pristine GO sheets. They also
proved that a higher temperature has a negative effect on the process, by comparing the
adsorption of Hg2+ at 20°C, 30°C and 40°C [23].
33

Magnetic iron oxide nanoparticles synthesis and functionalizations
34
Graphene oxide
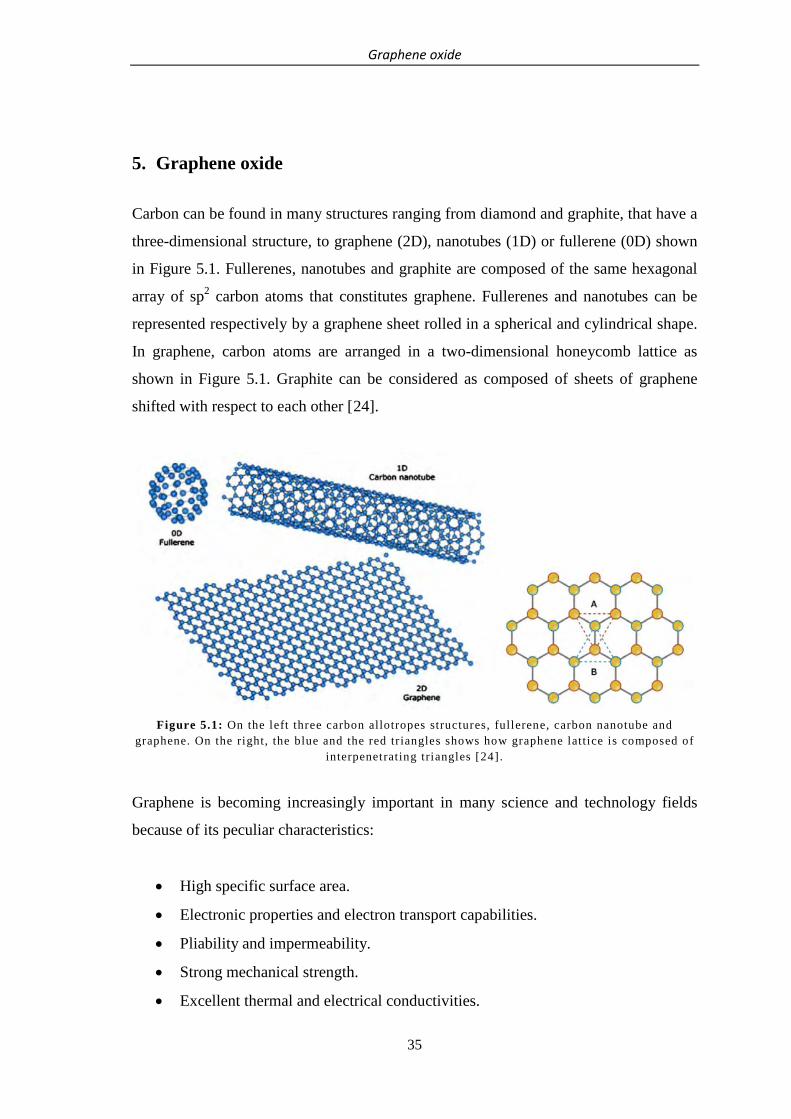
5. Graphene oxide
Carbon can be found in many structures ranging from diamond and graphite, that have a
three-dimensional structure, to graphene (2D), nanotubes (1D) or fullerene (0D) shown
in Figure 5.1. Fullerenes, nanotubes and graphite are composed of the same hexagonal
array of sp2 carbon atoms that constitutes graphene. Fullerenes and nanotubes can be
represented respectively by a graphene sheet rolled in a spherical and cylindrical shape.
In graphene, carbon atoms are arranged in a two-dimensional honeycomb lattice as
shown in Figure 5.1. Graphite can be considered as composed of sheets of graphene
shifted with respect to each other [24].
Figure 5.1: On the left three carbon allotropes structures, fullerene, carbon nanotube and
graphene. On the right, the blue and the red tr iangles shows how graphene lattice is composed of interpenetrating triangles [24].
Graphene is becoming increasingly important in many science and technology fields
because of its peculiar characteristics:
• High specific surface area.
• Electronic properties and electron transport capabilities.
• Pliability and impermeability.
• Strong mechanical strength.
• Excellent thermal and electrical conductivities.
35

Graphene oxide
Graphene oxide (GO, Figure 5.2) consists of a single-layer of graphite oxide and is
produced by the oxidation of graphite followed by its dispersion and exfoliation in
water or other suitable organic solvent. It is a precursor for graphene synthesis by
chemical or thermal reduction. Its structure is not yet well known even if many oxygen-
containing functional groups have been identified on both the planar surface of the sheet
(mainly hydroxyl and epoxy groups) and its edges (small amounts of carboxy, carbonyl,
phenol, lactone and quinone).
Figure 5.2 : Graphene oxide, structural formula.
Figure 5.3: This scheme shows how GO presents oxygen-containing functional groups on both
the planar surface and the edges [ 25].
These oxygenated groups influence GO’s electronic, mechanical and electrochemical
properties. For the same reason GO is characterized by some peculiar advantages and
drawbacks if compared with pristine graphene [25].
The advantages gained in GO are:
36

Graphene oxide
• Hydrophilic structure thanks to the polar oxygen functional groups. Therefore
GO is dispersible in many solvents and forms a stable colloidal dispersion in
water. This effect is caused by the low acidity constant of carboxyl groups (that
quickly dissociate into carboxylate anions) that characterize GO with negative
surface charge up until very low pH values (<1).
• Functional groups can be used as sites to chemically modify GO. They allow to
synthesize many GO composites useful to remove toxic metals from water.
• Facile synthesis.
• Unique optical properties (such as fluorescence labels).
• Lower costs of GO-based devices compared with conventional electrodes and
adsorbents. GO is easily produced from graphite, that is abundant in nature and
its adsorption capacities are becoming progressively similar to those of zeolites
[25, 16].
Thanks to these properties many graphene and graphene oxide-based materials with
great potential for environmental applications can be prepared. However a strategy for
GO recovery after sorption must be developed in order to apply it to pollutants’
decontamination [16]. This problem can be solved using magnetic nanoparticles.
The covalent oxygenated functional groups originate flaws on the graphene structure
that cause some drawbacks in the use of GO:
• Loss in electrical conductivity [25].
• Multistep, complex procedures to synthetize composite materials that
irreversibly modify GO structure.
• GO composites have narrow ranges of application.
• Difficulty in removing GO from solution.
• Oxygenated groups present on GO characterize it with in vivo toxicity [16].
5.1 Adsorption and desorption of iron oxide nanoparticles from graphene oxide
As previously stated iron oxide NPs surface chemistry depends on pH in solution and its
isoelectric point (IEP) is equal to 7,48. When pH is below the IEP value, iron oxide is
expected to show strong attraction to GO due to the opposed surface charges (Figure
37

Graphene oxide
5.4). When the pH increases above the IEP the GO can be redispersed in solution since
the adsorption doesn’t modify GO, making the process fully reversible.
Figure 5.4: Change in attraction or repulsion forces between GO and iron oxide nanoparticles
with varying pH [16].
Therefore the adsorption of magnetic substances on GO can be controlled by changing
the surface charge with a pH adjustment. Once magnetic nanoparticles are attached to
GO, the latter can be easily removed by water applying a magnetic field as shown in
Figure 5.5. The reversibility of the process allow to reuse both GO and the magnetic
material.
Figure 5.5 : Different effect caused by the application of a magnetic field depending on pH in
solution [16].
Figure 5.6 shows the isoelectric points of GO and of iron oxide, respectively equal to
approximately zero and 7 (for both maghemite and magnetite). Hence the two materials
have opposite surface charges for a wide pH range, in which they are expected to
undergo Coulombic attraction.
38

Graphene oxide
Figure 5.6: GO and iron oxide zeta potentials [16].
McCoy et al. analyzed this behavior applying iron oxide microparticles, nanoparticles
and also magnetic surfactants system.
The results obtained confirmed the expected behavior. Figure 5.7 shows the narrow
range of pH in which the transition between complete adsorption and dispersion of GO
occurs in the case of iron oxide microparticles. At pH 12 there is a decrease in dispersed
GO, likely due to the fact that GO starts to become chemically reduced [16].
Figure 5.7: GO concentration in solution as a function of pH with a fixed initial GO
concentration of 1,5 mg/ml and 20 mg of Fe2O3 microparticles [16].
39

Graphene oxide
40

Aim of the thesis
6. Aim of the thesis
The aim of the present thesis is to syntheisze new magnetic iron oxide based
nanocomposites and to study their application to heavy metals removal from
stormwater. The nanocomposites are synthetized by functionalizing bare iron oxide
nanoparticles and binding them to graphene oxide nanosheets. In particular, two main
types of nanoadsorbents will be taken into account for the removal tests:
• Iron oxide magnetic nanoparticles (MNPs) as synthesized and with coordinating
or chelating groups on the surface, specifically designed to bond heavy metal
ions.
• Graphene oxide nanosheets decorated with magnetic nanoparticles. Graphene
oxide has been already applied with success to the purification of water by
absorption of a wide range of organic pollutants. The composites obtained by
decorating it with the magnetic material will allow for his response to magnetic
fields and its easy separation from the treated water. Graphene oxide will be
decorated with both bare and already functionalized magnetic nanoparticles.
Figure 6.1: Scheme for the synthesis of the MNPs/graphene oxide composites.
The nanocomposites will be analyzed through magnetic measurements to determine the
efficiency of the separation by magnet, in order to understand the viability of this
removal system.
41

Aim of the thesis
The nanocomposites will then be applied to heavy metals removal through adsorption
experiments.
The metals studied are lead, chromium and nickel, all very dangerous for human health.
Their toxic effects on humans are:
Lead: damage to the fetal brain, diseases of the kidneys, circulatory system, and
nervous system.
Chromium: headache, diarrhea, nausea, vomiting. Furthermore it is
carcinogenic.
Nickel: dermatitis, nausea, chronic asthma, coughing. This metal is another
human carcinogen [2].
The nanocomposites would be more efficient if applied directly to stormwater,
especially considering that these are often stored in stormwater tanks to limit
overloading of the sewage system. This would avoid the problems caused by high
suspended matter content on the removal of heavy metals. Instead, if heavy metals must
be removed in the final treatment plant, the device should be placed after a primary
settler but before the activated sludge system. A device implementing the
nanocomposites studied in the present thesis might be placed in the oil and fats
separator or after this unit, as shown in Figure 6.2, in which A and B are the different
possible positions.
Figure 6.2: Possible positions for the device implementing nanocomposites.
The magnetic device for the nanocomposites separation includes two magnetic
elements:
1. A magnetic element to stir the nanoparticles injected in the dirty water.
42
Aim of the thesis
2. A magnet to attract the magnetic nanoparticles with the linked pollutants after
treatment. The stirring of nanoparticles will be obtained using a time varying
magnetic field generated by means of some permanent magnets in rotation or a
coil supplied by a time varying electrical current and positioned close to the
nanoparticles injection elements.
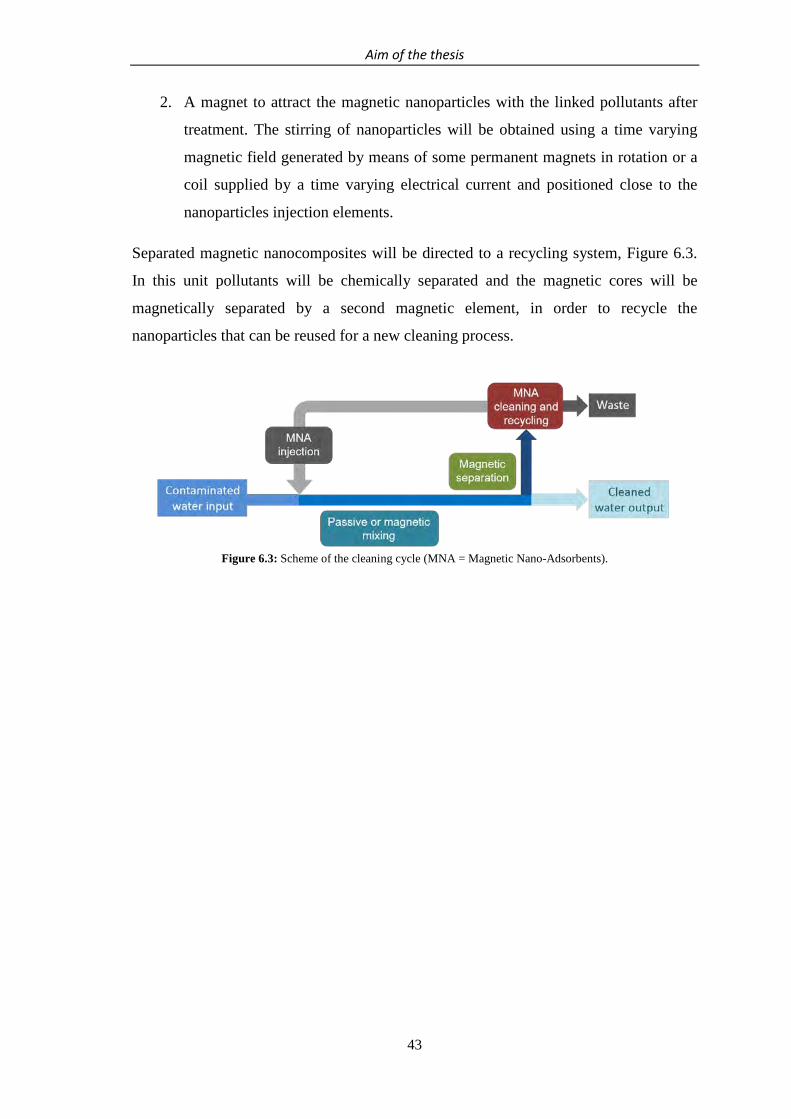
Separated magnetic nanocomposites will be directed to a recycling system, Figure 6.3.
In this unit pollutants will be chemically separated and the magnetic cores will be
magnetically separated by a second magnetic element, in order to recycle the
nanoparticles that can be reused for a new cleaning process.
Figure 6.3: Scheme of the cleaning cycle (MNA = Magnetic Nano-Adsorbents).
43

Aim of the thesis
44

Nanocomposites synthesis and functionalizations
7. Nanocomposites synthesis and functionalizations
Different nanocomposites are synthetized and applied to water treatment in this study.
There are two main types of nanocomposites studied Table 7.1. To the first class belong
nanocomposites without GO. These are bare nanoparticles (NPs) and NPs
functionalized with:
- 3,4-dihydroxyhydrocinnamic acid, DHCA
- Caffeic acid, CA
- (3-Aminopropyl)triethoxysilane, APTES
To the second class belong nanocomposites implementing GO. These are NPs
functionalized with:
- Graphene Oxide, GO
- GO and DHCA
- GO and CA
- GO and APTES
Therefore nanocomposites synthetized are summarized in the following table (Table
7.1).
Table 7.1: Nanocomposites synthetized and applied to water treatment in the present study.
Nanocomposites without GO Nanocomposites with GO
NPs NPs-GO
NPs-DHCA NPs-GO-DHCA
NPs-CA NPs-GO-CA
NPs-APTES NPs-GO-APTES
45

Nanocomposites synthesis and functionalizations
Chemicals used in the synthesis processes are listed in Table 7.2. All reagents were used
as purchased.
Table 7.2: Chemicals used in the synthesis and functionalization of the nanocomposites.
7.1 Iron NPs synthesis
The nanoparticles used in this study are synthetized with the coprecipitation method, a
very common and efficient method, although generating particles with a broader size
range with respect to other techniques.
In a three neck flask were placed:
• 5 g of Iron (II) chloride tetrahydrate FeCl2∙4H2O, 25 mmol.
• 13,5 g of Iron (II) chloride esahydrate FeCl3∙6H2O, 50 mmol.
• 150 ml of deionized water.
While the flask is undergoing mechanical stirring, 12,5 ml of ammonium hydroxide
solution (NH4OH) are added. The reaction occurring is:
Chemicals used Company furnishing the chemicals
3,4-dihydroxyhydrocinnamic acid (DHCA, 98%)
Sigma-Aldrich
Caffeic acid (98%) Sigma-Aldrich
(3-Aminopropyl)triethoxysilane (APTES, 98%)
Fluka
NaOH (98%) Sigma-Aldrich
THF (99,9%) Sigma-Aldrich
Expanded graphite, ECOPHIT 50 ECOPHIT
KMnO4 Sigma-Aldrich
H2SO4 (98%) Sigma-Aldrich
HCl (37%) Sigma-Aldrich
46
Nanocomposites synthesis and functionalizations
2𝐹𝐹𝐹𝐹𝐹𝐹𝐹𝐹3 ∙ 6𝑂𝑂2𝑂𝑂(𝑠𝑠) + 𝐹𝐹𝐹𝐹𝐹𝐹𝐹𝐹2 ∙ 4𝑂𝑂2𝑂𝑂(𝑠𝑠) + 8𝑁𝑁𝑂𝑂4𝑂𝑂𝑂𝑂(𝑎𝑎𝑎𝑎)
→ 𝐹𝐹𝐹𝐹3𝑂𝑂4(𝑠𝑠) + 8𝑁𝑁𝑂𝑂4𝐹𝐹𝐹𝐹(𝑎𝑎𝑎𝑎) + 20𝑂𝑂2𝑂𝑂(𝑙𝑙)
The solution turns rapidly to a dark brown color. Ammonium hydroxide is added
dropwise until obtaining a pH of 11. Then the system is heated at 60°C and 7,5 ml of
oleic acid (5% v/v) are added. The synthesis’ last step is mechanical stirring at 60°C for
30 minutes.
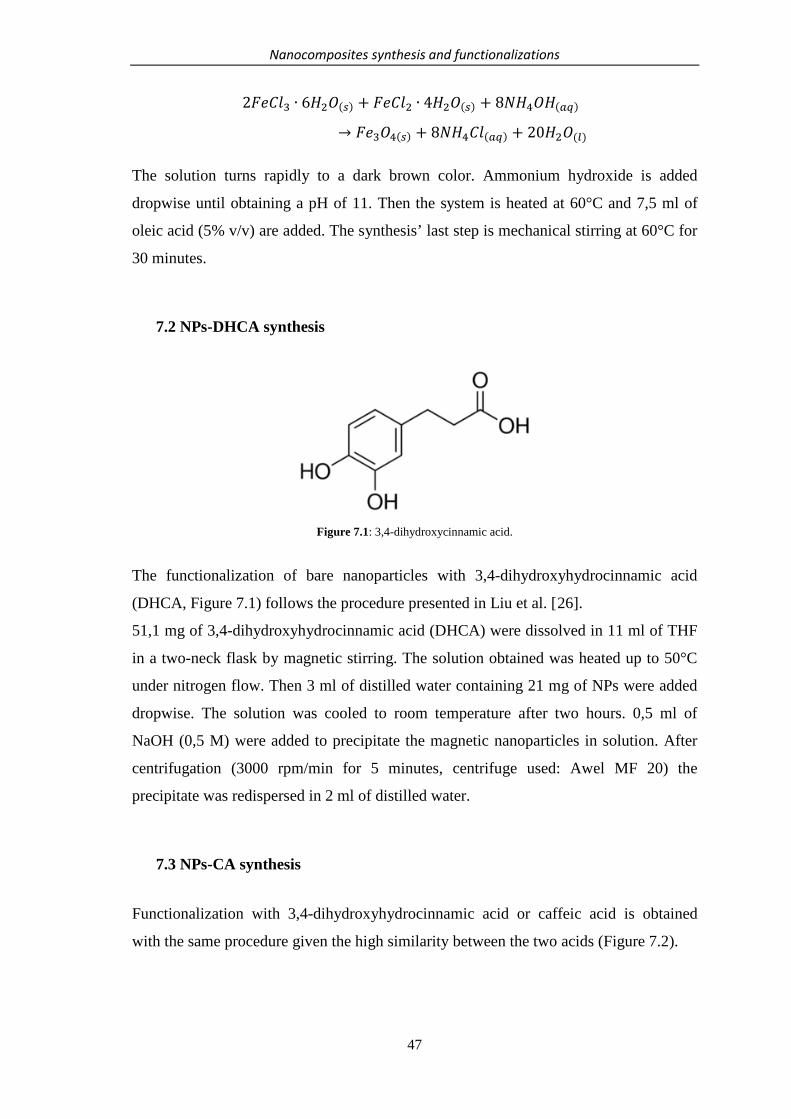
7.2 NPs-DHCA synthesis
Figure 7.1: 3,4-dihydroxycinnamic acid.
The functionalization of bare nanoparticles with 3,4-dihydroxyhydrocinnamic acid
(DHCA, Figure 7.1) follows the procedure presented in Liu et al. [26].
51,1 mg of 3,4-dihydroxyhydrocinnamic acid (DHCA) were dissolved in 11 ml of THF
in a two-neck flask by magnetic stirring. The solution obtained was heated up to 50°C
under nitrogen flow. Then 3 ml of distilled water containing 21 mg of NPs were added
dropwise. The solution was cooled to room temperature after two hours. 0,5 ml of
NaOH (0,5 M) were added to precipitate the magnetic nanoparticles in solution. After
centrifugation (3000 rpm/min for 5 minutes, centrifuge used: Awel MF 20) the
precipitate was redispersed in 2 ml of distilled water.
7.3 NPs-CA synthesis
Functionalization with 3,4-dihydroxyhydrocinnamic acid or caffeic acid is obtained
with the same procedure given the high similarity between the two acids (Figure 7.2).
47

Nanocomposites synthesis and functionalizations
Figure 7.2 : Caffeic acid structural formula.
51,1 mg of caffeic acid were dissolved in 11 ml of THF in a two-neck flask by magnetic
stirring. The solution obtained was heated up to 50°C under nitrogen flow. Then 3 ml of
distilled water containing 21 mg of NPs were added dropwise. The solution was cooled
to room temperature after two hours. 0,5 ml of NaOH (0,5 M) were added to precipitate
the magnetic nanoparticles in solution. After centrifugation (3000 rpm/min for 5
minutes) the precipitate was redispersed in 2 ml of distilled water.
7.4 NPs-APTES synthesis
The nanocomposite used in the present study were functionalized with APTES ((3-
aminopropyl)triethoxysilane), following the same procedure presented by Mahdavian et
al.
Figure 7.3 : (3-Aminopropyl)triethoxysilane structural formula.
20 ml of nanoparticles in distilled water were centrifuged (10000 rpm for 10 minutes)
and washed with ethanol twice. Then 140 mg of nanoparticles in ethanol underwent 30
minutes of sonication before the addition of 4,3 g of APTES. After stirring for 7 hours
at room temperature the material was separated by centrifugation (10000 rpm for 10
minutes) and washed with ethanol three times. Finally the product was vacuum dried
under N2 gas.
48

Nanocomposites synthesis and functionalizations
7.5 Graphene oxide synthesis
Graphene oxide used in this study was obtained with a modified Sun method [27] by
Doctor Flavio Pendolino and Professor Roberta Bertani.
5 g of expanded graphite and 15 g of potassium permanganate were placed in a 1l
beaker and stirred to obtain homogeneity. While stirring continued, the beaker was
placed in an ice−water bath, and 100 ml of concentrated sulfuric acid (98%) was added
slowly (since the reaction is exothermic) until obtaining a petrol-green liquid paste.
Then, the system was kept at room temperature with continuous stirring until a foam-
like material was formed (about 20 min were needed). At this stage, a safety measure
must be carried out: the foam material, which has density gradients, is stirred to
homogeneity in order to avoid possible explosions after water addition (exothermic
reaction). Then the beaker was placed again in the ice−water bath, and 400ml of
distilled water was added to it very slowly (also in this case to avoid an uncontrolled
temperature increase). The green-brownish liquid was then placed in a 90°C water bath
for 1 h and a dark suspension was obtained. The suspension was paper filtered and then
underwent washings with the following subtances:
1. 500 ml of distilled water.
2. 200 ml of HCl 5% to remove manganese
3. 500 ml of distilled water.
7.6 NPs-GO synthesis
The iron oxide/GO nanocomposites are synthetized following the procedure in Kyzas et
al. [28] using:
4 ml of distilled water containing 28 mg of iron oxide nanoparticles.
28 mg of GO.
24 ml of distilled water.
The dispersion obtained undergoes 30 minutes of sonication, then the nanocomposites
are collected by magnetic separation. After most water is collected with a pipette,
distilled water is added and the dispersion is sonicated again for 5 minutes. These last
49

Nanocomposites synthesis and functionalizations
three steps are repeated another time. Finally, after magnetic separation, the
nanocomposites are vacuum dried under nitrogen gas.
7.7 GO nanocomposites
The procedure presented in paragraph 7.6 was applied to iron oxide nanoparticles
functionalized with DHCA, Caffeic acid, and APTES. The following figure (Figure 7.4)
shows the main steps of the procedure to obtain iron oxide NPs functionalized with
APTES and GO. The first part of the synthesis follows the same steps of the NPs-
APTES synthesis. In the second part GO is linked by sonication. APTES and GO are
linked by a covalent bond as demonstrated by Diagboya et al. [23].
50

Nanocomposites synthesis and functionalizations
Figure 7.4: Main steps of the functionalization of iron oxide nanoparticles with APTES and graphene oxide.
H3C O Si
OH3C
NH2
O CH3
NH2
O OHOH O OH
O
OH
OHOOH
HO
OH
OHO
O OH OH O OH
O
OHO
HO
OH
OHO OSi
ONH
O
NHO Si
O
O
O SiO
O
Magnetic nanoparticles, MNPs
stirring, 7 hours, room temperature(3-aminopropyl)triethoxysilane,
APTESfunctionalized
MNPs
Graphene oxide,
sonication, 30 minutes
NPs - GO -APTES
GO
APTES
51

Nanocomposites synthesis and functionalizations
52

Vibrating Sample Magnetometer
8. Vibrating Sample Magnetometer
Magnetic properties of materials can be detected by measuring a change in magnetic
flux, force, or by indirect techniques. Magnetic measurements shown in this study were
carried out by Doctor Sara Laureti in the laboratory of “Materiali Magnetici
Nanostrutturati” at the “Istituto di Struttura della Materia (CNR)” in Rome (Italy).
The magnetometer used is a Vibrating Sample Magnetometer (VSM) detecting
magnetic flux variation due to the sample displacement in a pick-up coil system. This
device, invented 40 years ago, allows to take fast magnetic measurements.
Figure 8.1 shows a simplified scheme of a magnetometer. The procedure is the
following [29]:
1. The loudspeaker assembly causes the sample to vibrate perpendicularly to the
applied field.
2. The oscillating magnetic field of the vibrating sample induces a voltage in the
stationary detection coils.
3. The magnetic properties of the sample are deduced from measurements of this
voltage.
4. A second voltage is induced in a similar stationary set of reference coils by a
reference sample (a small permanent magnet or an electromagnet).
5. Since the sample and the reference are driven synchronously by a common
member, the phase and amplitude of the resulting voltages are directly related.
The magnetic moment is proportional to the known portion of the voltage from the
reference coils, phased to balance the voltage from sample coils.
Thanks to this procedure the measurements can be made insensitive to:
- Changes of vibration amplitude.
- Vibration frequency.
- Small magnetic field instability.
53

Vibrating Sample Magnetometer
- Amplifier gain.
Figure 8.1: Simple scheme of the vibrating sample magnetometer: (1) loud-speakers transducer, (2) conical paper
cup support, (3) drinking straw, (4) reference sample, (5) sample, (6) reference coils, (7) sample coils, (8) magnet
poles, (9) metal container.
The device used for the measurements presented in this thesis is a Model 10 ADE-
Technologies VSM magnetometer (Figure 8.2). It is composed of a rotating
electromagnet that can generate a maximum field of 20 kOe, while the minimum
detectable signal is about 20 µemu.
54

Vibrating Sample Magnetometer
Figure 8.2: Scheme of the model 10 ADE-Technologies VSM magnetometer.
The magnetic signal is detected by 8 coils, forming 4 pairs of two coils each (Figure
8.3). Two coils assembled one over the other form a pair of coils. Two pairs of coils
connected together and parallel to each other measure the signal in one direction. The
other two pairs, assembled with orthogonal direction to the first ones, measure the
magnetic signal in the perpendicular direction with respect to the first direction.
Figure 8.3: VSM setup.
55

Vibrating Sample Magnetometer
These setup allow rotation and vector option and consequently allow:
- Angle dependent measurements.
- Magnetic anisotropy measurements.
- Determination of the intrinsic magnetic behavior.
56

Adsorption experiments
9. Adsorption experiments
Heavy metals have different adverse health effect, therefore, as previously explained, it
is important to limit their spreading in the environment. In this study the removal of
three metals is analyzed, chosen because of their serious effects on human health, such
as chronic asthma or illnesses of the nervous system.
• Lead
• Chromium
• Nickel
These metals are between the most hazardous to the environment.
In the adsorption experiments, the following procedure was followed for each type of
nanocomposite synthetized. 20 ml of solution of each metal containing 20 mg of
nanoparticles were magnetically stirred for two hours.
Then the nanoparticles were magnetically separated and the solution was centrifuged.
15 ml were collected, diluted to obtain a volume equal to 100 ml and analyzed by ICP
(Inductively Coupled Plasma). The measure was carried out with a Perkin Elmer
Optima 4200 DV ICP-OES, by Doctor Sandon Annalisa the DII Department
(Dipartimento di Ingegneria Industriale, Laboratori di Voltabarozzo, University of
Padova). Some samples showed a light yellow color therefore needed filtration and
acidification to remove the iron salts in solution before being analyzed by ICP. The
most commonly known ICP is ICP-MS (Inductively Coupled Plasma Mass
Spectrometry, Figure 9.1).
57

Adsorption experiments
Figure 9.1: ICP-MS scheme [30].
Samples were analyzed in this study by ICP-OES (Inductively Coupled Plasma Optical
Emission Spectrometry). In this process, argon gas becomes inductively coupled. This
means that the moving electrons and nuclei are ripped apart in opposite directions by
the magnetic field forming a plasma (a “gas” of electrons and positively charged argon
ions). This plasma has a very high temperature, on the order of 5000-10000 Kelvin and
emits an intense light rich in ultra-violet radiation, capable of ionizing almost all
elements with high efficiency.
The samples must be injected into the plasma as:
- Gas.
- Mist.
- Fine particles ( < 10 μm).
The ions jump back to their ground state, emitting photons of characteristic
wavelengths. Metals present in the sample are therefore evaluated by observing these
photons through a spectrophotometer [30]. This last step is the basis of ICP-OES.
58

Nanocomposites morphology
10. Nanocomposites morphology
TEMs of all nanocomposites were taken in the laboratory of electron microscopy
(department of Biology, university of Padova) by Doctor Federico Caicci.
As shown in the following pictures all nanocomposites have irregular, spherical-like
shapes.
Figure 10.1: TEMs of bare iron oxide nanoparticles.
The size of the different nanoparticles ranges from 10 to 30 nm. Figure 10.2 shows
some TEMs (Transmission Electron Microscopy) of DHCA functionalized
nanoparticles.
59

Nanocomposites morphology
Figure 10.2 : TEMs of iron oxide nanoparticles functionalized with 3,4-dihydroxycinnamic acid.
Figure 10.3 shows some TEMs of nanoparticles functionalized with caffeic acid.
60

Nanocomposites morphology
Figure 10.3 : TEMs of iron oxide nanoparticles functionalized with caffeic acid.
The following pictures (Figure 10.4) are TEMs of the APTES-NPs.
61

Nanocomposites morphology
Figure 10.4 : TEMs of iron oxide nanoparticles functionalized with APTES.
A TEM of GO-NPs nanocomposites are shown in the following picture (Figure 10.4).
Figure 10.5 : TEMs of iron oxide nanoparticles functionalized with GO.
The following pictures (Figure 10.6) show GO-DHCA-NPs. GO sheets are clearly
visible in the first of the following TEMs, captured at the microscale level. As can be
seen in the first TEM, graphene oxide supports the nanoparticles, therefore improving
their magnetic separation efficiency after water treatment.
62

Nanocomposites morphology
Figure 10.6: TEMs of iron oxide nanoparticles functionalized with 3,4-dihydroxyhydrocinnamic acid and graphene
oxide.
The following pictures (Figure 10.7) show TEMs of iron oxide nanoparticles
functionalized with caffeic acid and further modified by addition of GO (GO-Caffeic
acid-NPs). 63

Nanocomposites morphology
Figure 10.7: TEMs of iron oxide nanoparticles functionalized with caffeic acid and graphene oxide.
Figure 10.8 shows TEMs of GO-APTES-NPs.
64

Nanocomposites morphology
Figure 10.8: TEM of nanoparticles attached on graphene oxide sheets using APTES and GO.
65

Nanocomposites morphology
66

Magnetic measurements
11. Magnetic measurements There are two main differences between bulk and nanoscale material. The first, as
previously explained, is due to the transition of iron oxide from the ferromagnetic to the
superparamagnetic state when reaching the nanoscale. The second difference is that
nanoparticles may be less magnetic with respect to bulk material because on their
crystal surface there is a substantially greater fraction of metal ions, which may not
contribute to the particle's net magnetization [31].
As can be seen in the following graphs (Figure 11.1) the coercivity of all the
nanoparticles synthetized is equal to zero meaning that they are superparamagnetic, as
expected. Therefore nanoparticles are stable, they did not aggregate and they maintain
their properties in time.
67

Magnetic measurements
68

Magnetic measurements
69

Magnetic measurements
Figure 11.1 : Magnetization curves of the different types of nanoparticles.
As shown in Table 11.1 and Figure 11.2, the saturation magnetization (Ms) of bulk
magnetite and maghemite is higher than those of the nanoparticles, which means that
the nanoparticles are less magnetic than the bulk material, as explained above.
Table 11.1: Saturation magnetization of bulk magnetite and maghemite and of the different types of nanoparticles.
Material Ms (emu/g)
Bulk magnetite 100
Bulk maghemite 80
NPs 71
NPs-DHCA 68
NPs-CA 52
NPs-APTES 72
NPs-GO 35
NPs-GO-DHCA 23
NPs-GO-CA 60
NPs-GO-APTES 34
70

Magnetic measurements
Figure 11.2: Comparison between the saturation magnetization of different types of bulk materials and nanoparticles.
Assuming an average saturation magnetization of 90 emu/g for a mixture of bulk
maghemite and magnetite, it is possible to compare the saturation value of bulk and
nanoscale material. In Table 11.2, it is shown that NPS, NPs-DHCA and NPs-APTES
have a saturation equal to about 80% of bulk material saturation. Therefore DHCA and
APTES do not significantly affect particles’ magnetization.
NPs-Caffeic acid and NPs-GO-Caffeic acid saturation is about 60% of the bulk
equivalent. All the values previously discussed are equal to or higher than values
obtained by Kucheryavy at al. [31].
Instead, NPs-GO-DHCA and NPs-GO-APTES have only 30% of the saturation
magnetization of the bulk equivalent.
71

Magnetic measurements
Table 11.2: Saturation magnetization ratios of nanoscale and bulk material.
In the following table (Table 11.3) and graph (Figure 11.3) the saturation
magnetizations of the nanocomposites with and without graphene oxide are compared.
Generally GO addition leads to a relevant decrease of Ms, with the exception of
nanoparticles functionalized with caffeic acid.
Table 11.3: Saturation magnetization ratios.
Nanoparticles
NPs 0,79
NPs-DHCA 0,76
NPs-CA 0,58
NPs-APTES 0,80
NPs-GO 0,39
NPs-GO-DHCA 0,26
NPs-GO-CA 0,67
NPs-GO-APTES 0,38
𝑴𝒔, 𝒏𝒂𝒏𝒐𝒑𝒂𝒓𝒕𝒊𝒄𝒍𝒆𝒔
𝑴𝒔, 𝒃𝒖𝒍𝒌 𝒎𝒂𝒕𝒆𝒓𝒊𝒂𝒍
Ms ratio
0,49
0,34
1,15
0,47
𝑀𝑀𝑠𝑠, 𝑁𝑃𝑠𝑠−𝐺𝑂𝑀𝑀𝑠𝑠, 𝑁𝑃𝑠𝑠
𝑀𝑀𝑠𝑠, 𝑁𝑃𝑠𝑠−𝐺𝑂−𝐷𝐻𝐶𝐴𝑀𝑀𝑠𝑠, 𝑁𝑃𝑠𝑠−𝐷𝐻𝐶𝐴
𝑀𝑀𝑠𝑠, 𝑁𝑃𝑠𝑠−𝐺𝑂−𝐶𝐴𝑀𝑀𝑠𝑠, 𝑁𝑃𝑠𝑠−𝐶𝐴
𝑀𝑀𝑠𝑠, 𝑁𝑃𝑠𝑠−𝐺𝑂−𝐴𝑃𝑇𝐸𝑆𝑀𝑀𝑠𝑠, 𝑁𝑃𝑠𝑠−𝐴𝑃𝑇𝐸𝑆
72

Magnetic measurements
Figure 11.3: Comparison between the saturation magnetizations of the nanocomposites with and without graphene
oxide.
73

Magnetic measurements
74

Metals removal experiments
12. Metals removal experiments
The amount of nanoparticles recovered by magnetic separation was weighted (Table
12.1, Table 12.2, Table 12.3). In almost all cases the amount of nanoparticles removed
by magnetic separation was higher than 90% and often equal to 100%. This means that
magnets are a good tool to remove NPs form water and they allow to avoid fouling
problems that would occur if nanocomposites had to be collected by membrane
filtration.
Table 12.1: Percentage of nanoparticles recovered by magnetic separation after lead removal.
Table 12.2: Percentage of nanoparticles recovered by magnetic separation after chromium removal.
Nanoparticles used% NPs recovered by
magnet
NPs 100NPs-DHCA 90
NPs-CA 91,5NPs-APTES 96,5
NPs-GO 100NPs-GO-DHCA 100
NPs-GO-CA 99NPs-GO-APTES 100
Nanoparticles used% NPs recovered by
magnet
NPs 65,5NPs-DHCA 95,5
NPs-CA 100NPs-APTES 60,5
NPs-GO 100NPs-GO-DHCA 100
NPs-GO-CA 100NPs-GO-APTES 100
75

Metals removal experiments
Table 12.3: Percentage of nanoparticles recovered by magnetic separation after nickel removal.
The remaining concentration of heavy metals after the adsorption experiments was
measured with ICP-OES. Results obtained by the ICP are presented in Table 12.4, while
Table 12.5 shows the same results corrected considering the dilution factor used before
analyzing the sample, therefore presents the actual concentrations used during the
experiments.
Table 12.4: Final concentrations of heavy metals after adsorption.
The initial concentration of heavy metals (concentrations in the control sample) are well
above the Italian limit for discharge in surface water (0,2 mg/l for lead, 2 mg/l for nickel
and total chromium). All nanocomposites managed to reduce lead below the legal
Nanoparticles used% NPs recovered by
magnet
NPs 100NPs-DHCA 94,5
NPs-CA 94NPs-APTES 86
NPs-GO 100NPs-GO-DHCA 100
NPs-GO-CA 100NPs-GO-APTES 100
Pb (µg/l) Cr (µg/l) Ni (µg/l)
Control sample 955 1100 1325
NPs 35,9 774 1245
NPs-DHCA 84 134 521
NPs-CA 55,2 169 384
NPs-APTES 74,1 371 789
NPs-GO 145 516 715
NPs-GO-DHCA 10 307 446
NPs-GO-CA 17,4 426 1040
NPs-GO-APTES 77 455 955
76
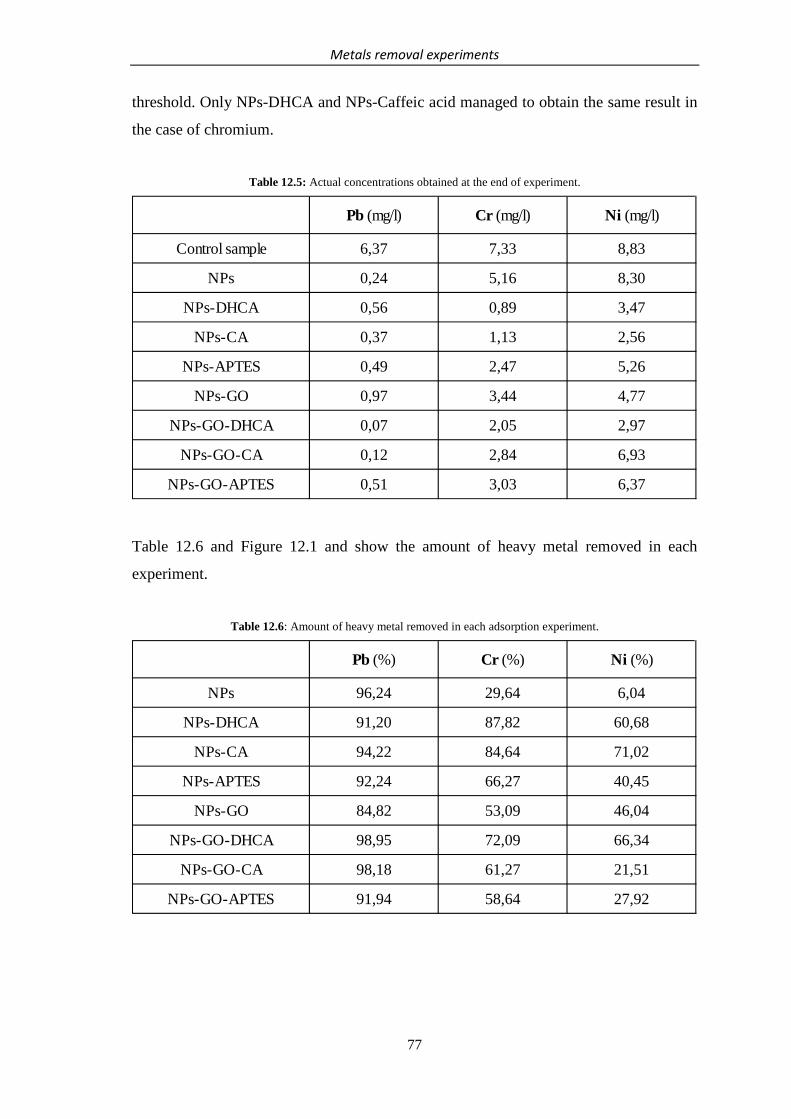
Metals removal experiments
threshold. Only NPs-DHCA and NPs-Caffeic acid managed to obtain the same result in
the case of chromium.
Table 12.5: Actual concentrations obtained at the end of experiment.
Table 12.6 and Figure 12.1 and show the amount of heavy metal removed in each
experiment.
Table 12.6: Amount of heavy metal removed in each adsorption experiment.
Pb (mg/l) Cr (mg/l) Ni (mg/l)
Control sample 6,37 7,33 8,83
NPs 0,24 5,16 8,30
NPs-DHCA 0,56 0,89 3,47
NPs-CA 0,37 1,13 2,56
NPs-APTES 0,49 2,47 5,26
NPs-GO 0,97 3,44 4,77
NPs-GO-DHCA 0,07 2,05 2,97
NPs-GO-CA 0,12 2,84 6,93
NPs-GO-APTES 0,51 3,03 6,37
Pb (%) Cr (%) Ni (%)
NPs 96,24 29,64 6,04
NPs-DHCA 91,20 87,82 60,68
NPs-CA 94,22 84,64 71,02
NPs-APTES 92,24 66,27 40,45
NPs-GO 84,82 53,09 46,04
NPs-GO-DHCA 98,95 72,09 66,34
NPs-GO-CA 98,18 61,27 21,51
NPs-GO-APTES 91,94 58,64 27,92
77

Metals removal experiments
Figure 12.1: Amount of heavy metals removed by each type of nanocomposite.
78

Metals removal experiments
Considering the similar initial concentration of the different metals, the removal
percentages are comparable. The highest metal removal occurred for lead, while the
lowest for nickel. Bare nanoparticles showed a very different behavior when treating
different metals. Specifically, their performance dropped drastically from removing
96% of lead to removing just 6% of nickel. The performance does not change so
drastically in the case of the other nanocomposites. This suggests that lead is probably
removed by reduction and adsorption on the bare iron oxide nanoparticle surface, while
the other metals are preferentially removed by coordination on the functionalized
surface of the nanocomposite.
All nanoparticles worked well for lead removal. With the exception of NPs-GO
nanoparticles (84% lead removal), they removed more than 90% of lead. NPs-GO-
DHCA and NPs-GO-Caffeic acid almost completely removed the amount of lead
present, removing more than 98% of the heavy metal. As shown in the following graph
(Figure 12.2) GO addition improves significantly lead removal efficiency in
nanoparticles functionalized with DHCA and caffeic acid.
Figure 12.2: Comparison between the lead removal efficiency of nanocomposites with and without GO.
In the case of chromium, the nanoparticles with the highest efficiency are NPs-DHCA
and NPs-Caffeic acid, removing more than 80% of the metal. Good removal
percentages were obtained also with NPs-APTES, NPs-GO-DHCA and NPs-GO-
Caffeic acid, which removed at least 60% of chromium. GO addition to the
nanocomposites did not improve chromium removal as shown in Figure 12.3.
79

Metals removal experiments
Figure 12.3: Comparison between the chromium removal efficiency of nanocomposites with and without GO.
Nanocomposites that removed more than 60% of nickel are NPs-DHCA, NPs-Caffeic
acid and NPs-GO-DHCA, which showed good adsorption properties for all the three
metals analyzed. Only in the case of nanoparticles functionalized with DHCA, GO
addition to nanocomposites increases (5%) the nickel removal efficiency
Figure 12.4: Comparison between the chromium removal efficiency of nanocomposites with and without GO.
80

Metals removal experiments
Similar results can be find in literature even if adsorption experiment conditions and
nanocomposites used often vary in different studies. For example, Liu et al. [32] using
bare iron oxide nanoparticles, managed to remove 90% of lead.
As previously explained Mahdavian et al. [21] synthetized iron oxide nanoparticles
functionalized with APTES and acryloyl chloride (AC) and converted to the
corresponding sodium salt with an aqueous solution of NaOH. In order to compare the
results obtained in the present study with those of Mahdavian et al., the adsorption of
heavy metals was calculated, as shown in Table 12.7.
Table 12.7: Adsorption of heavy metals cations.
The results can be compared reminding that adsorption experiment conditions were
different in the two cases. Nanocomposites synthetized by Mahdavian et al. showed
higher adsorption capacity for lead and lower for nickel, as observed in the present
study. However, adsorption capacity in the study of Mahdavian et al. was significantly
higher (about 25 mgNi2+/gNPs, and 30 mgPb2+/gNPs at pH 7).
Ozmen et al. [22] analyzed copper removal with magnetite nanoparticles functionalized
with APTES and glutaraldehyde (GA). With conditions similar to the present study
applied during the adsorption experiments, they obtained the removal of 80% of the
heavy metal.
Ads (mgPb2+/gNPs) Ads (mgCr2+/gNPs) Ads (mgNi2+/gNPs)
NPs 6,13 2,17 0,53
NPs-DHCA 5,81 6,44 5,36
NPs-CA 6,00 6,21 6,27
NPs-APTES 5,87 4,86 3,57
NPs-GO 5,40 3,89 4,07
NPs-GO-DHCA 6,30 5,29 5,86
NPs-GO-CA 6,25 4,49 1,90
NPs-GO-APTES 5,85 4,30 2,47
81

Metals removal experiments
82

Spreading and ecotoxicology of nanotechnologies
13. Spreading and ecotoxicology of nanotechnologies
As shown in chapter 12, after wastewater treatment nanoparticles can be almost
completely recovered by magnetic separation, therefore their release in the environment
would be very limited. In any case, since nanotechnologies will be probably widely
applied in the future, it is important to study their possible effects on the environment.
New projects implementing nanoparticles are constantly developed, as shown for the
United States in Figure 13.1. The map shows the locations of universities, companies
and government laboratories that are using nanotechnologies in the US. The next figure
(Figure 13.2) shows only those localized in the city of Los Angeles. According to the
Project on Emerging Nanotechnologies these institutions are already 1200 only in the
US. There are many nanotechnologies applied in the health and environmental fields
(Figure 13.2, Figure 13.3), that are promising and allow to achieve targets impossible to
obtain without them. However, with the increasing use of nanoparticles, also concerns
about their environmental impact and their possible harmful effects on health are
constantly growing.
Figure 13.1: Map showing the localizations of companies and laboratories implementing nanotechnology in the US
[33].
83

Spreading and ecotoxicology of nanotechnologies
Figure 13.2: Map showing the localizations of companies and laboratories using nanotechnologies in the city of Los
Angeles [33]. The different colors represent the different sectors in which the laboratory or company is working:
orange, electronics; light blue, energy and environmental applications; yellow, imaging and microscopy; green,
medicine and health; dark blue, materials; red, tools and instruments; purple, academic and government research;
white, organization.
Figure 13.3: Map of contaminated sites where nanotechnologies are used worldwide [34].
Many of the properties that make nanotechnologies and nanoparticles useful, for
example their high reactivity, may increase their potential risks towards human health
and the environment. These risks are nowadays often still unknown and there is a need
for further studies about the ecotoxicity of nanoparticles and nanocomposites.
All studies agree that different nanoparticles are characterized by different risks so case
by case studies are needed. According to Handy et al. [35], manufactured nanoparticles
84

Spreading and ecotoxicology of nanotechnologies
may behave differently with respect to naturally existing nanoparticles because
designed to have specific properties. Furthermore nanoparticles that are not toxic may
become harmful when carrying dangerous substances [36]. For example, Fe
nanomaterials may bind with copper, which toxicity threshold for phytoplankton, algae
fungi and flowering plants is exceeded only by mercury and sometimes silver [37].
13.1 Ecotoxicology of iron oxide nanoparticles
As stated in the previous paragraph, risk related to nanoparticles varies a lot with the
type of particles considered. Concerns with respect to iron oxide nanoparticles are very
low. As a matter of fact iron is a micronutrient, a substance essential for grow and
survival in low amounts [38]. However, it is harmful at high concentrations. In
particular, a study showed that iron oxide nanoparticles may cause considerable harmful
effects on living organisms. Zhu et al. [39] used early life stages of the zebrafish (Danio
rerio) in their study, since organisms in the early stages of embryonic development are
usually more sensitive to toxicological effects. The concentration of iron oxide particles
tested were 100, 50, 10, 5, 1, 0,5, 0,1 mg/l. According to this study, a concentration
equal or higher to 10 mg/l of iron oxide nanoparticles caused developmental toxicity of
Zebrafish embryos. The consequences of the exposure were mortality, hatching delay
and malformations, as shown in the following graphs (Figure 13.4).
Figure 13.4: Different survival (on the left) and hatching rate (on the right) of zebrafish embryos caused by different
concentration of iron oxide NPs over 168 hpf (hours postfertilization). Error bars represent the standard deviation
from the mean of three replicates.
85

Spreading and ecotoxicology of nanotechnologies
No effect on survival and no malformations were observed for nanoparticles
concentrations ≤ 10 mg/l, however the hatching rate was influenced at a concentration
of 10 mg/l.
Vittori Antisari et al, [40] found no effect on microbial biomass in soil with 10 and
100mg/kg of iron oxide NPs, which are the only metal oxide nanoparticles that show no
or limited harmful effect on microbial communities even at high concentrations [41].
86

Conclusions
14. Conclusions
Stormwater volumes needing treatment will constantly increase in the foreseeable
future. Heavy metals are one of the main categories of pollutants present in stormwater
and have several adverse effect on human health. This thesis studies and compares new
and previously synthetized nanocomposites for heavy metals removal from water. The
synthesis and functionalization processes are easy to implement and the materials
needed have limited costs.
Nanocomposites’ magnetic properties allow to separate them magnetically from the
water streams. Magnetic measurements and magnetic separation after adsorption
experiments showed that these nanocomposites can efficiently be removed after their
application simply by applying a magnet. These nanocomposites may therefore be
implemented in a simple device where they would be injected in the wastewater stream,
mixed and removed by magnetic means.
Heavy metals removal efficiency varies depending on the type of heavy metal (Pb > Cr
> Ni). Removal was particularly efficient in the case of lead (Figure 14.1).
Figure 14.1: Removal efficiency of nanocomposites with and without GO.
Moreover the highest metal removal efficiency was reached by different
nanocomposites depending on the metal considered:
87

Conclusions
• NPs-GO-DHCA and NPs-GO-Caffeic acid removed more than 98% of lead.
• NPs-DHCA and NPs-Caffeic acid removed more than 80% of chromium.
• NPs-DHCA, NPs-Caffeic acid and NPs-GO-DHCA removed more than 60% of
nickel.
After application nanocomposites can be recycled by using chemicals to remove the
heavy metals captured. Obviously, this would increase the amount of chemicals used in
the process. Considering the low costs of the nanocomposites implemented, an
alternative would be to discard the metals remaining after removal of graphene oxide by
thermal treatment.
Further research must assess the behavior of nanocomposites when different heavy
metals are present in water, in order to study the selectivity of the removal process.
Moreover adsorption experiments should be carried out on metals different from the
ones analyzed in this thesis and on substences different from heavy metals. Finally other
functionalization may be studied to improve the removal efficiency.
88

15. Bibliography
[1] Rupak Aryal, Sarvanamuthu Vigneswaran,, Jaya Kandasamy, and Ravi Naidu, “Urban stormwater
quality and treatment”, Korean J. Chem. Eng. 2010, 27, 1343.
[2] M.A. Barakat, “New trends in removing heavy metals from industrial wastewater”, Arabian Journal of
Chemistry 2011, 4, 361.
[3] Allen P. Davis, Mohammad Shokouhian and Shubei Ni, “Loading estimates of lead, copper, cadmium
and zinc in urban runoff from specific sources”, Chemosphere 2001, 44, 997.
[4] http://archivio.ambiente.it/impresa/legislazione/leggi/1999/dlgs152-99/allegato5.htm.
[5] Regolamento Regionale 24 marzo 2006 , N. 4. Disciplina dello smaltimento delle acque di prima
pioggia e di lavaggio delle aree esterne, in attuazione dell'articolo 52, comma 1, lettera a) della legge
regionale 12 dicembre 2003, n. 26.
[6] http://www.eurowater.com/products/standard_products/nanofiltration_plants.aspx.
[7] Chen, G.H.,. “Electrochemicals technologies in wastewater treatment”, Separation and Purification
Technologies 2004, 38 (1), 11.
[8] Herrmann, J.M.,. “Heterogeneous photocatalysis: fundamentals and applications to the removal of
various types of aqueous pollutants.”, Catalysis Today 1999, 53, 115.
[9] N. Savage, Mamadou Diallo, Jeremiah Duncan, Anita Street and Richard Sustich, “Nanotechnology
Applications for Clean Water”, William Andrew Ed., 2009.
[10] Iram Mohmood, Clàudia Batista Lopes, Isabel Lopes, Iqbal Ahmad, Armando C. Duarte, Eduarda
Pereira, “Nanoscale materials and their use in water contaminants removal (a review)”, Environmental
Science Pollution Research 2013, 20, 1239.
[11] Bharat Bhushan, “Springer Handbook of Nanotechnology - Introduction to Nanotechnology”, Ed.
Springer, 2007.
[12] Wei-xian Zhang, “Nanoscale iron particles for environmental remediation: An overview” Journal of
Nanoparticle Research 2003, 5 ,323.
[13] Paul G. Tratnyek, Richard L. Johnson, “Nanotechnologies for environmental cleanup” Nano Today
2006, 1, 44.
[14] Kimberly M. Cross, Yunfeng Lu, Tonghua Zheng, Jingjing Zhan, Gary McPherson, Vijay John,
“Water Decontamination Using Iron and Iron Oxide Nanoparticles” Nanotechnology Applications for
Clean Water 2009, 347.
[15] Samuel C.N. Tang, Irene M.C. Lo, “Magnetic nanoparticles: Essential factors for sustainable
environmental applications”, Water Research 2013, 47, 2613.
[16] Thomas M. McCoy, Paul Brown, Julian Eastoe, Rico F. Tabor, “Noncovalent Magnetic Control and
Reversible Recovery of Graphene Oxide Using Iron Oxide and Magnetic Surfactants”, Applied Materials
& Interfaces 2014, 7, 2124.
89

[17] Abolfazl Akbarzadeh, Mohamad Samiei and Soodabeh Davaran, “Magnetic nanoparticles:
preparation, physical properties, and applications in biomedicine”, Nanoscale Research Letters 2012,
7:144.
[18] Hilda W. F. Sung and Czeslaw Rudowicz, “A closer look at the hysteresis loop for ferromagnets”,
Department of Physics and Materials Science, City University of Hong Kong.
[19] Sophie Laurent, Delphine Forge, Marc Port, Alain Roch, Caroline Robic, Luce Vander Elst, Robert
N. Muller, “Magnetic Iron Oxide Nanoparticles: Synthesis, Stabilization, Vectorization, Physicochemical
Chacterization and Biological Applications”, Chemical Reviews 2008, 108, 2064.
[20] Borsella Elisabetta, D’Amato Rosaria, Fabbri Fabio, Falconieri Mauro, Terranova Gaetano,
“Synthesis of nanoparticles by laser pyrolysis: from research to applications”, Energia, Ambiente e
Innovazione 2011, 4-5, 54.
[21] Ali Reza Mahdavian, Monir Al-Sadat Mirrahimi, “Efficient separation of heavy metal cations by
anchoring polyacrylic acid on superparamagnetic magnetite nanoparticles through surface
modification”, Chemical Engineering Journal 2010, 159, 264.
[22] Mustafa Ozmen, Keziban Can, Gulsin Arslan, Ali Tor, Yunus Cengeloglu, Mustafa Ersoz,
“Adsorption of Cu(II) from aqueous solution by using modified Fe3O4 magnetic nanoparticles”,
Desalination 2010, 254, 162.
[23] Paul N. Diagboya, Bamidele I., Olu-Owolabi and Kayode O. Adebowale, “Synthesis of covalently
bonded graphene oxide–iron magnetic nanoparticles and the kinetics of mercury removal”, Royal Society
of Chemistry 2015, 5, 2536.
[24] Caterina Soldano, Ather Mahmood, Erik Dujardin, “Production, properties and potential of
graphene”, Carbon 2010 , 48, 2127.
[25] Da Chen, Hongbin Feng, Jinghong Li, “Graphene Oxide: Preparation, Functionalization and
Electrochemical Applications”, Chemical Reviews 2012, 112(11), 6027.
[26] Liu Y., Chen T., Wu C., Qiu L., Hu R., Li J., Cansiz S., Zhang L., Cui C., Zu G., You M., Zhang T.,
Tan W., “Facile surface functionalization of hydrophobic magnetic nanoparticles”, Journal of the
American Society 2014, 136, 12552.
[27] Flavio Pendolino, Emilio Parisini, and Sergio Lo Russo, “Time-Dependent Structure and
Solubilization Kinetics of Graphene Oxide in Methanol and Water Dispersions”, The journal of Physical
Chemistry 2014, 28, 162.
[28] George Z. Kyzas, Eleni A. Deliyanni, Kostas A. Matis, “Graphene oxide and its application as an
adsorbent in wastewater treatment”, Journal of Chemical Technology and Biotechnology 2014, 89, 196.
[29] Laureti Sara, tesi di dottorato di ricerca in Scienza dei Materiali (Roma, Università La Sapienza
23/12/2007).
[30] MIT OpenCourseWare, “Geochemical Analysis of Environmental Materials”, Analytical Techniques
for Studying Environmental and Geologic Samples, Spring 2011.
[31] Pavel Kucheryavy, Jibao He, Vijay T. John, Pawan Maharjan, Leonard Spinu, Galina Z.Goloverda,
and Vladimir L. Kolesnichenko, “Superparamagnetic Iron Oxide Nanoparticles with Variable Size and an
Iron Oxidation State as Prospective Imaging Agents”, American Chemical Society 2012, 29(2), 710.
90

[32] Jing-Fu Liu, Zong-Shan Zhao and Gui-Bin Jiang, “Coating of Fe3O4 Magnetic Nanoparticles with Humic Acid
for High Efficient Removal for Heavy Metals in Water”, Environ. Sci. Technol. 2008, 42, 6949.
[33] http://www.nanotechproject.org/inventories/map/.
[34] http://www.nanotechproject.org/inventories/remediation_map/.
[35] Handy RD, von der Kammer F., Lead JR, Hassellöv M., Owen R., Crane M., “The ecotoxicology
and chemistry of manufactured nanoparticles”, Ecotoxicology 2008, 17, 287.
[36] Barbara Karn, Todd Kuiken, Martha Otto, “Nanotechnology and in Situ Remediation: A Review of
the Benefits and Potential Risks”, Environmental Health Perspectives 2009, 117, 1823.
[37] Sposito G., “The Chemistry of Soils”, Ed. University Press, 1989.
[38] Verónica Nogueira, Isabel Lopes, Teresa Rocha-Santos, Fernando Goncalves, Ruth Pereira,
“Toxicity of solid residues resulting from wastewater treatment with nanomaterials, Aquatic Toxicology
2015, 165, 172–178.
[39] Xiaoshan Zhu, Shengyan Tian, Zhonghua Cai “Toxicity Assessment of Iron Oxide Nanoparticles in
Zebrafish (Danio rerio) Early Life Stages”, PLoS ONE 2012, 7(9), 1.
[40] Vittori Antisari L, Carbone S, Gatti A, Vianello G, Nannipieri P., “Toxicity of metal oxide (CeO2,
Fe3O4, SnO2) engineered nanoparticles on soil microbial biomass and their distribution in soil.”, Soil
Biology and Biochemistry 2015, 60, 87–94.
[41] Marie Simonin, Agnès Richaume, “Impact of engineered nanoparticles on the activity, abundance,
and diversity of soil microbial communities: a review”, Environmental Science and Pollution Research
2015.
91
Related Documents