414 IEEE TRANSACTIONS ON ELECTROMAGNETIC COMPATIBILITY, VOL. 48, NO. 2, MAY2006 Magnetic Fields and Loop Voltages Inside Reduced- and Full-Scale Structures Produced by Direct Lightning Strikes Ibrahim A. Metwally, Senior Member, IEEE, Fridolin H. Heidler, and Wolfgang J. Zischank Abstract—This paper presents a numerical electromagnetic analysis of magnetic fields and loop voltages inside reduced- and full-scale lightning protection systems (LPSs) “structures” result- ing from direct lightning strikes. The method of moments is em- ployed to model the whole structure in three dimensions except the lightning channel. The lightning channel is simulated by the well- known transmission-line model (TL model), where the influence of the lightning-channel generated electric and magnetic fields are taken into account. Three distinct LPSs were modeled, namely, reduced-scale model with return conductors (RSRC), reduced- scale model with lightning channel (RSLC), and full-scale model with lightning channel (FS). The computed results of magnetic fields and magnetic-field derivatives were verified versus some ex- perimental results for the RSRC model. In addition, the scale fac- tor for all the measured quantities were also checked as functions of the geometrical scale factor for the positive and the negative first stroke currents. The lightning shielding performance with and without bonding was investigated for three distinct lightning stroke types, namely, the negative first, the negative subsequent, and the positive strokes. The voltages and currents generated in loops located inside the struck FS LPS were computed with and without bonding and grounding resistance and for different light- ning current waveforms, locations and inclination of the lightning channel, and return stroke velocity. Index Terms—Buildings, lightning, magnetic shielding, numeri- cal analysis, transient analysis. NOMENCLATURE c Speed of light, m/s. f Frequency, Hz. (H x ,H y ,H z ) Components of magnetic field in x-, y- and z-directions, A/m. H tot Resultant magnetic field, A/m. ˙ H tot Resultant magnetic-field time derivative, A/m µs. i(t, z) Time-varying current propagating along the return stroke channel in z-direction, kA. ˆ I l Peak of the simulated lightning current waveform, kA. Manuscript received June 14, 2005; revised January 12, 2006. I. A. Metwally is with the Department of Electrical and Computer Engi- neering, College of Engineering, Sultan Qaboos University, Muscat, Sultanate of Oman, and also with Faculty of Electrical Engineering, University of the Federal Armed Forces–Munich, EIT 7, Werner-Heisenberg-Weg 39, D-85577 Neubiberg, Germany (e-mail: [email protected]). F. H. Heidler and W. J. Zischank are with the Faculty of Electrical En- gineering, University of the Federal Armed Forces–Munich, EIT 7, Werner- Heisenberg-Weg 39, D-85577 Neubiberg, Germany (e-mail: fridolin.heidler@ unibw-muenchen.de; [email protected]). Digital Object Identifier 10.1109/TEMC.2006.873852 I µ Current in the µth segment of the lightning channel, kA. k g Geometrical scale factor, pu. k t Time scale factor, pu. k I Current scale factor, pu. k dI/dt Current derivative scale factor, pu. k H Magnetic field scale factor, pu. k dH/dt Magnetic-field derivative scale factor, pu. k U Voltage scale factor, pu. R g Grounding resistance, Ω. s µ Length of segment µ on the lightning chan- nel, m. t Time. t f ,t t Front and tail times, µs. U Peak of the roof-to-floor voltage, kV. v Return stroke velocity, m/µs. x, y Coordinates in a horizontal plane, m. z Coordinate directed outward from the ground, m. z ∗ Height of the striking point, m. ∆f Frequency step, Hz. φ Channel inclination angle to the vertical and projected to the east end, ◦ . η Constant. λ Wave length, m. τ 1 ,τ 2 Time constants, µs or ns. ω Angular frequency, rps. EM Electromagnetic. EMC Electromagnetic compatibility. EMFs Electric and magnetic fields. FS Full-scale model with lightning channel. LEMP Lightning electromagnetic pulses. LPS Lightning protection system. LPZ Lightning protection zone. MoM Method of moments. pu Per unit. RSLC Reduced-scale model with lightning channel. RSRC Reduced-scale model with return conductors. TL Transmission line. I. INTRODUCTION N EARBY and direct lightning strikes to a LPS produce so- called LEMP that induce overvoltages on wires and cables inside it. Nearby lightning strikes radiate EMFs whose effects 0018-9375/$20.00 © 2006 IEEE

Welcome message from author
This document is posted to help you gain knowledge. Please leave a comment to let me know what you think about it! Share it to your friends and learn new things together.
Transcript
414 IEEE TRANSACTIONS ON ELECTROMAGNETIC COMPATIBILITY, VOL. 48, NO. 2, MAY 2006
Magnetic Fields and Loop Voltages Inside Reduced-and Full-Scale Structures Produced by Direct
Lightning StrikesIbrahim A. Metwally, Senior Member, IEEE, Fridolin H. Heidler, and Wolfgang J. Zischank
Abstract—This paper presents a numerical electromagneticanalysis of magnetic fields and loop voltages inside reduced- andfull-scale lightning protection systems (LPSs) “structures” result-ing from direct lightning strikes. The method of moments is em-ployed to model the whole structure in three dimensions except thelightning channel. The lightning channel is simulated by the well-known transmission-line model (TL model), where the influenceof the lightning-channel generated electric and magnetic fields aretaken into account. Three distinct LPSs were modeled, namely,reduced-scale model with return conductors (RSRC), reduced-scale model with lightning channel (RSLC), and full-scale modelwith lightning channel (FS). The computed results of magneticfields and magnetic-field derivatives were verified versus some ex-perimental results for the RSRC model. In addition, the scale fac-tor for all the measured quantities were also checked as functionsof the geometrical scale factor for the positive and the negativefirst stroke currents. The lightning shielding performance withand without bonding was investigated for three distinct lightningstroke types, namely, the negative first, the negative subsequent,and the positive strokes. The voltages and currents generated inloops located inside the struck FS LPS were computed with andwithout bonding and grounding resistance and for different light-ning current waveforms, locations and inclination of the lightningchannel, and return stroke velocity.
Index Terms—Buildings, lightning, magnetic shielding, numeri-cal analysis, transient analysis.
NOMENCLATURE
c Speed of light, m/s.f Frequency, Hz.(Hx,Hy ,Hz ) Components of magnetic field in x-, y- and
z-directions, A/m.Htot Resultant magnetic field, A/m.Htot Resultant magnetic-field time derivative,
A/m µs.i(t, z) Time-varying current propagating along the
return stroke channel in z-direction, kA.Il Peak of the simulated lightning current
waveform, kA.
Manuscript received June 14, 2005; revised January 12, 2006.I. A. Metwally is with the Department of Electrical and Computer Engi-
neering, College of Engineering, Sultan Qaboos University, Muscat, Sultanateof Oman, and also with Faculty of Electrical Engineering, University of theFederal Armed Forces–Munich, EIT 7, Werner-Heisenberg-Weg 39, D-85577Neubiberg, Germany (e-mail: [email protected]).
F. H. Heidler and W. J. Zischank are with the Faculty of Electrical En-gineering, University of the Federal Armed Forces–Munich, EIT 7, Werner-Heisenberg-Weg 39, D-85577 Neubiberg, Germany (e-mail: [email protected]; [email protected]).
Digital Object Identifier 10.1109/TEMC.2006.873852
Iµ Current in the µth segment of the lightningchannel, kA.
kg Geometrical scale factor, pu.kt Time scale factor, pu.kI Current scale factor, pu.kdI/dt Current derivative scale factor, pu.kH Magnetic field scale factor, pu.kdH/dt Magnetic-field derivative scale factor, pu.kU Voltage scale factor, pu.Rg Grounding resistance, Ω.sµ Length of segment µ on the lightning chan-
nel, m.t Time.tf , tt Front and tail times, µs.U Peak of the roof-to-floor voltage, kV.v Return stroke velocity, m/µs.x, y Coordinates in a horizontal plane, m.z Coordinate directed outward from the
ground, m.z∗ Height of the striking point, m.∆f Frequency step, Hz.φ Channel inclination angle to the vertical and
projected to the east end, .η Constant.λ Wave length, m.τ1, τ2 Time constants, µs or ns.ω Angular frequency, rps.EM Electromagnetic.EMC Electromagnetic compatibility.EMFs Electric and magnetic fields.FS Full-scale model with lightning channel.LEMP Lightning electromagnetic pulses.LPS Lightning protection system.LPZ Lightning protection zone.MoM Method of moments.pu Per unit.RSLC Reduced-scale model with lightning
channel.RSRC Reduced-scale model with return
conductors.TL Transmission line.
I. INTRODUCTION
N EARBY and direct lightning strikes to a LPS produce so-called LEMP that induce overvoltages on wires and cables
inside it. Nearby lightning strikes radiate EMFs whose effects
0018-9375/$20.00 © 2006 IEEE
METWALLY et al.: MAGNETIC FIELDS AND LOOP VOLTAGES INSIDE REDUCED- AND FULL-SCALE STRUCTURES 415
are similar to those of the direct strikes, but with lower ampli-tudes [1], [2]. Lightning represents a severe threat to the sen-sitive electrical or electronic equipment located inside a struckstructure. Nowadays, as a result of the ever-increasing use ofhighly sophisticated microelectronic circuits having very lowsignal levels, the equipment becomes more susceptible to elec-tromagnetic interferences. The control of electromagnetic inter-ferences has become the dominant task of lightning protection.The lightning phenomenon involves frequencies up to severalmegahertz [3], [4]. The evaluation of the EMFs inside a struckstructure is essential for the EMC of the electrical and electronicsystems [5], [6]. In spite of the shielding efficiency of the LPS,the interference voltages may be of magnitudes that are dan-gerous for control units and instruments [7]. In addition, if themagnetic field exceeds certain levels, electronically stored datacan be erased [8].
Direct lightning strikes may involve a variety of current wave-forms from slow-rising impulse currents of positive strokeswith amplitudes up to 200 kA to fast rising currents of neg-ative subsequent strokes with front times in the range of afew 100 ns and current peak values up to 50 kA [9]. Suchcurrents flowing through LPS conductors to the ground maycause [3]–[6], [10], [11] 1) damage in the LPS due to ther-mal and electromagnetic forces, 2) secondary sparks, whichmight lead to fire or explosion hazard, 3) unequal high-voltagedistribution, which may cause dangerous events for personsinside the struck structure, and 4) interference and malfunc-tioning of the electronic communications, control, and mea-suring systems inside the struck structure by high-magnitudedisturbances. Moreover, the main reason of inadvertent out-ages of overhead power lines is not only due to direct lightningstrikes to the lines but also due to the direct strikes to con-trol buildings of indoor substations [12], [13], where overvolt-ages are produced at the input/output (I/O) ports of electronicequipment.
Analyses of the EM environment inside a building duringa lightning event were addressed by many authors in differentways. The fundamental works of Uman et al. [14]–[16] ad-dresses the evaluation of the EM field due to lightning channelknowing the current distribution along the channel. Their modelhas also been used to compute the EM field radiated by thedown conductors [6], [17]. The EM field depends on the cur-rents flowing in the down conductors of the LPS. Predictionmodels for the current sharing in the down conductors includenumerical [18] and analytical models [19], e.g., based on trans-mission line models [20] and lumped circuit models [10]. Fornearby lightning strikes, electric field integral equations basedmethods are more suitable for the evaluation of the induced cur-rents and EM field inside the building [4], taking into accountboth the LPS configuration [12] and the shielding performancesof pillars and reinforced concrete walls [21].
The knowledge of magnetic fields and induced voltages insidea building in case of a direct lightning strike is crucial for thedesign of lightning protection measures from the EMC point ofview. In the present analysis, all Maxwell’s equations are solvedusing the MoM to compute the transient lightning magneticfields and their derivatives, and voltages and currents in loops
inside the struck LPS. The excitation of the structure understudy is simulated by the TL model. Theoretical investigationsinto the factors affecting the lightning shielding performanceare introduced and interpreted in the light of a computationalEMF analysis by MoM combined with TL model.
Because of the limited size, in high voltage laboratories itis not possible to build up full size structures like the LPS ofbuildings. Therefore, scaled models are used with reduced di-mensions. Such scale modeled structures have been set up inthe High Current Laboratory of the University of the FederalArmed Forces in Munich (UAFM), using a scale factor of 1:6.The measurements at scaled models necessitate that not onlythe geometry but also all relevant physical quantities have tobe scaled. The current tests further require an injection rod tosimulate the lightning channel and a current return path arrange-ment in order that the current flows back to the impulse currentgenerator. Of course, this return path does not exist in reality,e.g., when a building is struck by lightning. Therefore, in thelaboratory tests a quasi-coaxial arrangement of return path rodsis used to minimize the influence on the test object.
The objectives of the present paper are as follows.1) A 1:6 scaled-down LPS tested in the laboratory is simu-
lated with a computer model to validate the experimentalresults.
2) In a second modified computer model, the return patharrangement is removed and the current injection rod issubstituted by a simulated lightning channel. This modelis also based on a scaling factor of 1:6 to compare the LPSwith and without return path arrangement.
3) With a third full-scale 1:1 model, a real sized structureis simulated to check the scaling factors. This full-scalemodel also simulates loop structures placed inside the LPSin order to investigate the induction effects in installationloops. Finally, the influence of additional quantities is ex-amined, like the bonding and grounding of the LPS, thereturn stroke velocity, and the inclination of the lightningchannel.
II. TRANSMISSION-LINE MODEL
The analysis and modeling of EMC problems is often dif-ficult in dealing with complex environments where interactingobjects of arbitrary shape are present. The TL method requiressignificantly more computer memory per node, but it generallydoes a better job of modeling complex boundary geometries.This is because both the EMFs are calculated at every bound-ary node, and complex nonlinear materials are readily modeled.Impulse responses and the time-domain behavior of systems aredetermined explicitly. The MoM, which is in widespread use,calculates charge and current distributions on such boundaries.MoM approach permits the incorporation of the treatment oflarge free space regions with very high efficiency. The goal ofthe hybrid method is to combine the advantages of the space dis-cretizing TL method and the advantages of the MoM, therebyovercoming the limitations of both the methods and a signifi-cant reduction of computation time, which enables analysis ofcomplex structures.
416 IEEE TRANSACTIONS ON ELECTROMAGNETIC COMPATIBILITY, VOL. 48, NO. 2, MAY 2006
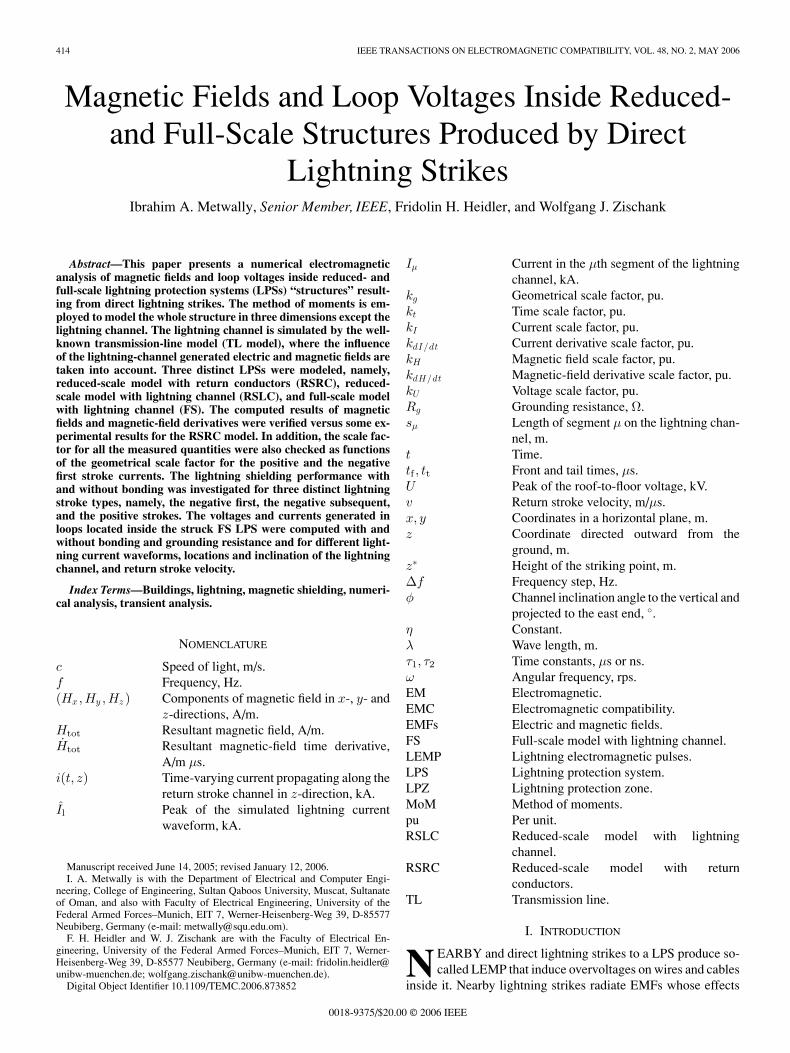
Fig. 1. Traveling of a current wave along the return stroke channel.
The injected double-exponential lightning current to the at-tachment/striking point il(t) is simulated by
i1(t) =
I1η [Exp(−t/τ1) − Exp(−t/τ2)], t ≥ 00, t < 0
(1)
where I1 is the peak of the simulated lightning current wave-form, η is a constant, and τ1 and τ2 are time constants.
The TL model introduced by Uman [22] is a well-establishedmodel in the area of the simulation of lightning return strokechannel. This model is validated by various tests as comparisonwith both measured data and other models. Finally, it is proposedby CIGRE—Working Group 33.01—to simulate the couplingprocesses to TLs [23]. This model provides only the interferencesource, i.e., there is no coupling back from the structure understudy to the lightning channel. The TL model is based on thefollowing assumptions. The lightning return stroke channel isstraight and increases with a constant return stroke velocity νalong the z-coordinate resulting in the time-dependent channellength νt; see Fig. 1.
The current along the lightning channel as a function of timet and coordinate z is given by
i(t, z) = i1(t − (z − z∗)/ν, z∗) (2)
where z∗ is the height of the striking point. Equation (2)describes a current waveform that starts from the attach-ment/striking point and travels upwards without any attenuationalong the return stroke channel; see Fig. 1. The return strokevelocity v is a fraction of the speed of light c; its typical valuesrange from c/5 to c/2. The TL model only describes the inter-ferences due to the return stroke process. This involves that thecoupling of the lightning channel to the structure under study istaken into account, while the coupling from the structure back tothe lightning channel is ignored. From (1) and (2) and at t ≥ 0,the lightning-current distribution along the lightning channel
results in
i(t, z) =I1
η[Exp(−(t − (z − z∗)/ν)/τ1)
−Exp(−(t − (z − z∗)/ν)/τ2)]. (3)
The TL model is transferred to the frequency domain, usingthe time shifting theorem of the Fourier analysis. Dividing thelightning channel into segments of the length sµ , the current Iµ
in the µth segment can then be determined, where sµ designatesthe length of the lightning channel between the starting point ofthe current wave and the middle of segment µ. Both the basicassumption of the TL model and the link to the MoM computercode (CONCEPT) are summarized in [24].
III. COMPUTATIONAL APPROACH
The electromagnetic computations are carried out by the com-puter code “CONCEPT,” which has been developed duringthe last two decades by the Technical University Hamburg-Harburg [25]. This computer code is based on the so-calledMoM [26] and is written in FORTRAN 77. It is a well-knowncomputer code in the area of EM computations, and has beenvalidated using basic arrangements as antenna systems andTLs above ideal ground [25]. A comparison between mea-sured and calculated fields in electromagnetic pulse (EMP)simulators is given in [27]. This computer code solves allMaxwell’s equations in the frequency domain. Therefore, thetime-domain solutions (transient quantities: currents, voltages,and EMF) are obtained from the inverse Fourier transformation.The fundamental assumptions of the computer code are givenin [25] and the handling of the program package is describedin [28].
For modeling of electrical structures, several features areavailable to simulate metallic surfaces and rods, and insulatingmaterials. In the present simulation, however, only the so-calledcylindrical thin-wire approach is used. In this approach, trian-gles are employed as expansion functions for the currents and theDirac delta functions as testing functions (point matching). Thewhole electrical structures (e.g., the LPS conductors and loopsinside the LPS) are simulated by cylindrical straight wires sub-dividing them into segments, where the length of each segmentis much longer than its radius. Further, the length of a segmentis generally limited to λ/8, where λ is the wavelength of thehighest frequency considered. The segment itself may be idealconducting or loaded, e.g., by a finite conductivity, an inductiveor a capacitive load in order to simulate resistors, inductances,or capacitors, respectively. The structure can be excited by anincident wave or by current or voltage sources. The ideal con-ducting ground is taken into account by the method of electricalimages.
The lightning channel, having a length of 8 km, is simulatedby the well-known TL model [22], [23], where the influence ofthe lightning channel generated EMFs is taken into account. Infact, only the fields produced in the near zones of the lower partof the lightning channel contribute significantly to the EMFs.Therefore, the length of the lightning channel is generally re-stricted to 2.2 km. In this model, a predefined current source at
METWALLY et al.: MAGNETIC FIELDS AND LOOP VOLTAGES INSIDE REDUCED- AND FULL-SCALE STRUCTURES 417
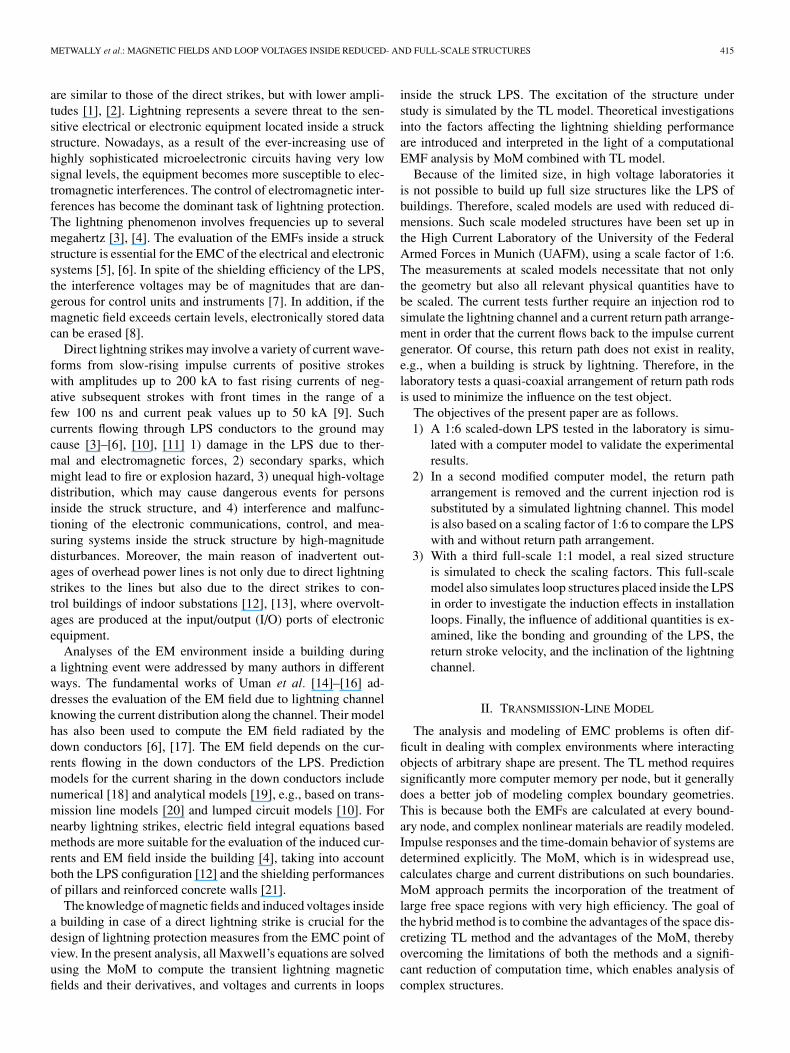
TABLE IPARAMETERS OF THE SIMULATED LIGHTNING CURRENTS OF THE FULL-SCALE
MODEL
the lightning attachment point is used, where the time-varyingcurrent waveform propagates in z-direction; see Fig. 1. In thefrequency domain, this model uses a current source, where thephase velocity is given by the return stroke velocity ν. The in-verse Fourier transformation gives a time-varying current wavestarting from the point of strike and traveling along a straightwire with a constant ν.
IV. ASSUMPTIONS
The ν is kept constant at 100 m/µs. Assuming the highestprotection level [9], [29], Table I gives the parameters of thesimulated double-exponential lightning currents, where Il isthe peak value, tf/tt are the front/tail times, τ1 and τ2 are thetime constants, and η is a dimensionless constant. Details ofthe current waveforms injected to attachment/striking point andalong the lightning channel are given in Fig. 1.
The whole metallic structures including the cylindrical wires(air termination, down conductors, and loops inside the LPS)are considered to be ideal conducting. To calculate the roof-to-floor voltages and the voltage across the open loops, the relevantwires are loaded by resistors of 1 MΩ.
The upper limit of the computation frequency is chosen as20 MHz corresponding to a wavelength of 15 m. On the onehand, the frequency has to be increased at least to some tensmegahertz in order to cover the whole frequency regime whensimulating the fast-rising current of the subsequent negativestroke or when calculating the magnetic-field derivatives andthe roof-to-floor voltages. The increase in the frequency leadsto an increase in the number of segments to fulfill the aforemen-tioned condition, where the segment length <λ/8. Therefore,the considered highest frequency of 20 MHz is a compromisebetween the requirements of the computer code and the neces-sity to limit the computation time and the memory to a suitablesize. The chosen upper computation frequency limit of 20 MHzis also based on the fact that the rise of the fastest lightning cur-rent “negative subsequent” can be characterized by a dampedoscillation of ∼1 MHz [30]. Consequently, the maximum seg-ment length is limited to about 2 m.
Three different frequency regimes are chosen in order tominimize the number of frequencies. Starting with a lowestfrequency of 1 kHz, the frequency is increased in steps of∆f = 2 kHz up to 99 kHz. Then in the second frequency regime,the frequency step is increased to ∆f = 3 kHz up to 2 MHz.In the highest frequency regime between 2 and 20 MHz, thefrequency step is further increased to ∆f = 4 kHz.
In the present work, the effects of both the grounding systemand the soil ionization are not taken into consideration. In addi-
tion, the contribution of the low-frequency field component isignored.
V. EXPERIMENTAL SETUP
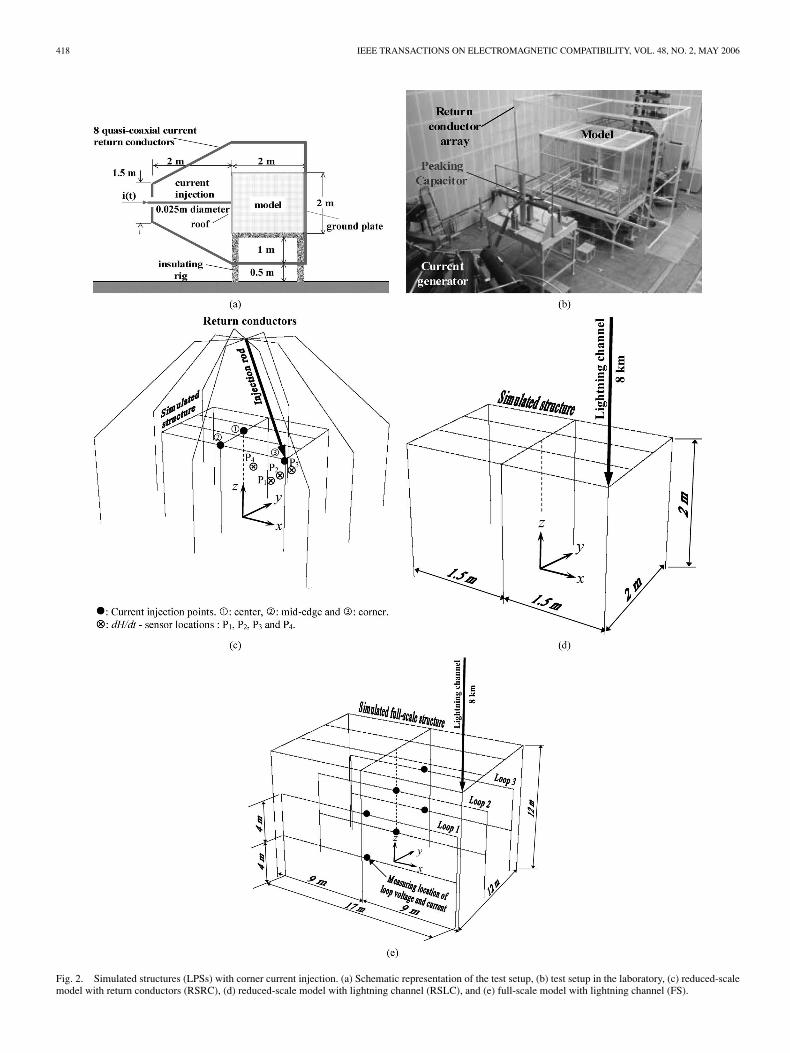
The model was placed on a wooden support rig 1.5 m abovelaboratory floor as illustrated in Fig. 2(a). In order to achievea symmetric arrangement of the models with respect to theimpulse current generator, the model had to be rotated by 90
(i.e., the roof is pointing to the left and the floor to the right).Fig. 2(a)–(c) illustrates the arrangement of the test structure onthe test rig. The current return path from the ground plate wasformed by an array of eight copper return conductors (10 mm2
each) that were quasi-coaxially arranged around the models in adistance of 1 m from the model sidewalls and at ∼0.75 m fromthe current injection terminal. The quasi-coaxial arrangementof the return conductors makes their generated magnetic fieldsto be canceled at the cage center. As the steel plate acts as anequipotential surface, the currents through the return conductorsare almost symmetric and independent of the current injectionpoint. The effect of different current injection locations on thereturn-conductor currents is within ±2%.
For different lightning attachment points on the roof [center:(0, 0, 2), corner: (1.5,−1, 2), and midedge: (0,−1, 2) in me-ters], the components of the magnetic-field derivative dH/dtwere measured at four locations/points inside the RSRC model,namely, P1 (0.75, 0, 1), P2 (0.75, 0.5, 1), P3 (0.75, 0.945, 1), andP4 (0, 0.5, 1) with the coordinates in meters, as can be seen inFig. 2(c). The x, y, and z components [definition of coordinatessee Fig. 2(c)] of the magnetic field derivatives (dH/dt) weremeasured using shielded loop sensors of 6-, 15-, and 20- cm di-ameter. The corresponding bandwidths of the sensors were 70,22, and 16 MHz, respectively. The signals were transferred tothe digital scopes (HP 54510A, 200 MHz single shot bandwidth)via 300 MHz fiber optic link systems NanoFast OP 300-2A.
The magnetic fields were derived from the (dH/dt)-waveforms by numeric integration. Background noise originat-ing from the current generator spark gaps (start gaps, peak-ing circuit gaps) was eliminated during the integration process.Noise originating from the main sphere gap and the peakinggap occurred before the onset of the current flow along the teststructure and thus could be disregarded for the determinationof the maximum dH/dt and during the numerical integrationprocess. In addition, the repeatability of the measurements forall shots reveals that the variations in the injected current peakand dH/dt are within ±1.5%.
The positive stroke currents were generated by an overcriti-cally damped 100-kJ capacitor bank with an additional peakingcapacitor. The negative first stroke currents were obtained from a250-kV three-stage Marx generator with an erected capacitanceof 400 nF equipped with a low-impedance peaking capacitor anda peaking spark gap. Details of all the impulse current generatorsused can be found in our previous paper [34].
The induced open-circuit loop voltage between the roof andthe floor centers of the test structure U(t) is measured by an0.8-mm diameter copper wire terminating into a 500-Ω probe.This signal is transferred via fiber optic system. For the fastest
418 IEEE TRANSACTIONS ON ELECTROMAGNETIC COMPATIBILITY, VOL. 48, NO. 2, MAY 2006
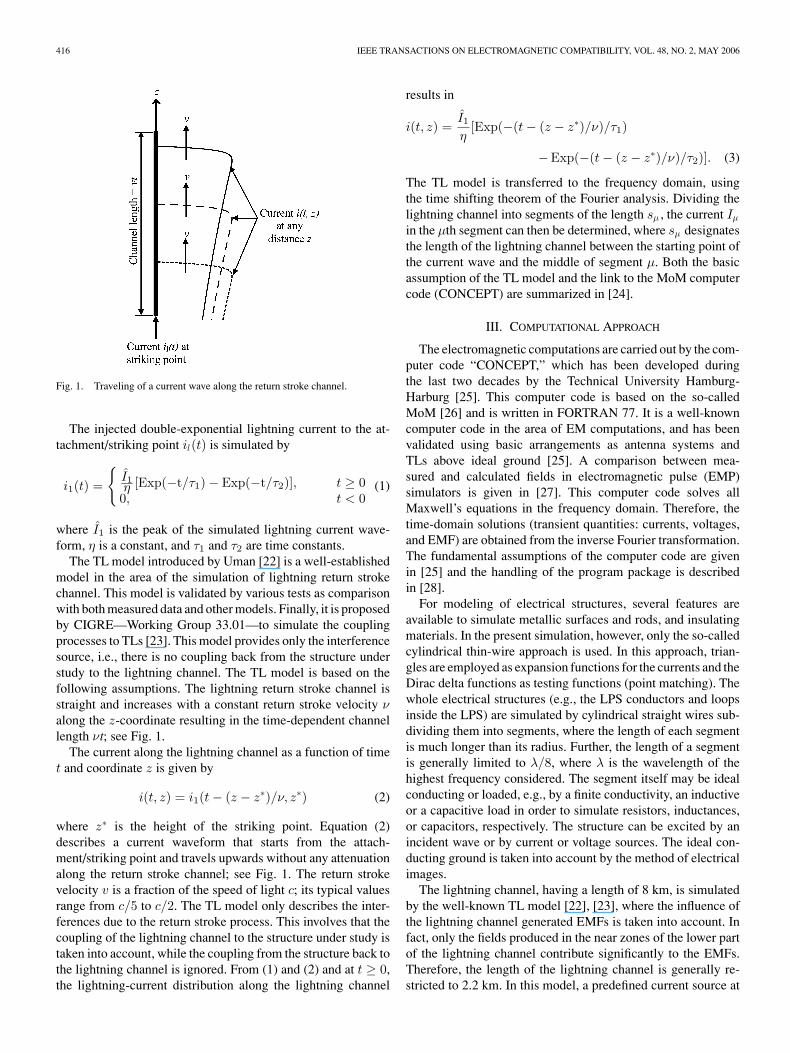
Fig. 2. Simulated structures (LPSs) with corner current injection. (a) Schematic representation of the test setup, (b) test setup in the laboratory, (c) reduced-scalemodel with return conductors (RSRC), (d) reduced-scale model with lightning channel (RSLC), and (e) full-scale model with lightning channel (FS).
METWALLY et al.: MAGNETIC FIELDS AND LOOP VOLTAGES INSIDE REDUCED- AND FULL-SCALE STRUCTURES 419
TABLE IISCALE FACTORS OF THE REDUCED-SCALE MODEL
current waveform (negative subsequent stroke), the wavelengthassociated to the maximum significant frequency involved inthe current spectrum is much longer compared to the length ofthe copper wire (∼100 times). The above-mentioned criterionsatisfactorily defines the voltage along the wire itself.
VI. RESULTS AND DISCUSSION
In Section VI-A, all the computed quantities were ver-ified versus the experimental results for the RSRC model[Fig. 2(a)–(c)] [32], while, in Sections VI-B and C, all quantitieswere computed for all structures/models shown in Fig. 2.
A. Verification of the Computed Results
Fig. 2(a)–(c), (d) and (e) illustrate the modeled threeLPSs, namely, (a)–(c) reduced-scale model with return conduc-tors (RSRC), (d) reduced-scale model with lightning channel(RSLC), and (e) full-scale model with lightning channel (FS),respectively. The similarity relations theory [31] allows estab-lishing scale laws and scale factors from the differential equa-tions describing a physical process without the need to solvethese differential equations. The geometrical scale factor of theRSRC and with RSLC [see Fig. 2(a)–(c) and (d)], was selectedas kg = 1:6 [32]. Fig. 2(e) shows the FS with lightning chan-nel, where three parallel vertical loops were connected to theconducting ground plate at [(−8.5,−5.5, 0)], [(8.5,−5.5, 0)],[(−8.5, 0, 0)], [(8.5, 0, 0)], and [(−8.5, 5.5, 0)], [(8.5, 5.5, 0)],in Meter, for loops 1, 2, and 3, respectively. In other words,all loops are located at 0.5 m from all side walls of the struc-ture. Each loop consists of two meshes (length = 17 m andheight = 4 m) with a total height of 8 m having a wire diameterof 2 mm. To measure the voltages induced into the meshes, thehorizontal wires are loaded at the midsection by a finite con-ductivity in order to simulate the aforementioned resistors of 1MΩ.
With the geometrical scale factor 1:6, the scale factors forthe relevant physical quantities (t: time, I: current, dI/dt: cur-rent derivative, H: magnetic field, dH/dt = H: magnetic-fieldderivative, and U : voltage) are given in Table II. The time scalefactor 1:6 is associated with an inverse scale factor of 6:1 forthe frequency. Of course, in the Fourier analysis, the frequencyregimes have to be scaled up by these scale factors in case ofthe scaled-down models of RSLC and RSRC.
Table III gives the main parameters of the selected positiveand negative first impulse currents defined in the standards (scale1:1), the scaled-down parameters for the 1:6 size environment,
TABLE IIITEST/SIMULATED CURRENT PARAMETERS OF THE REDUCED-SCALE MODELS
and the parameters obtained in the model experiments [32]. Itwas the main aim of the experimental setup in the high-voltagelaboratory to achieve the time requirements of the standards asclose as possible. Then, a further extrapolation of the modelresults is possible with satisfying accuracy.
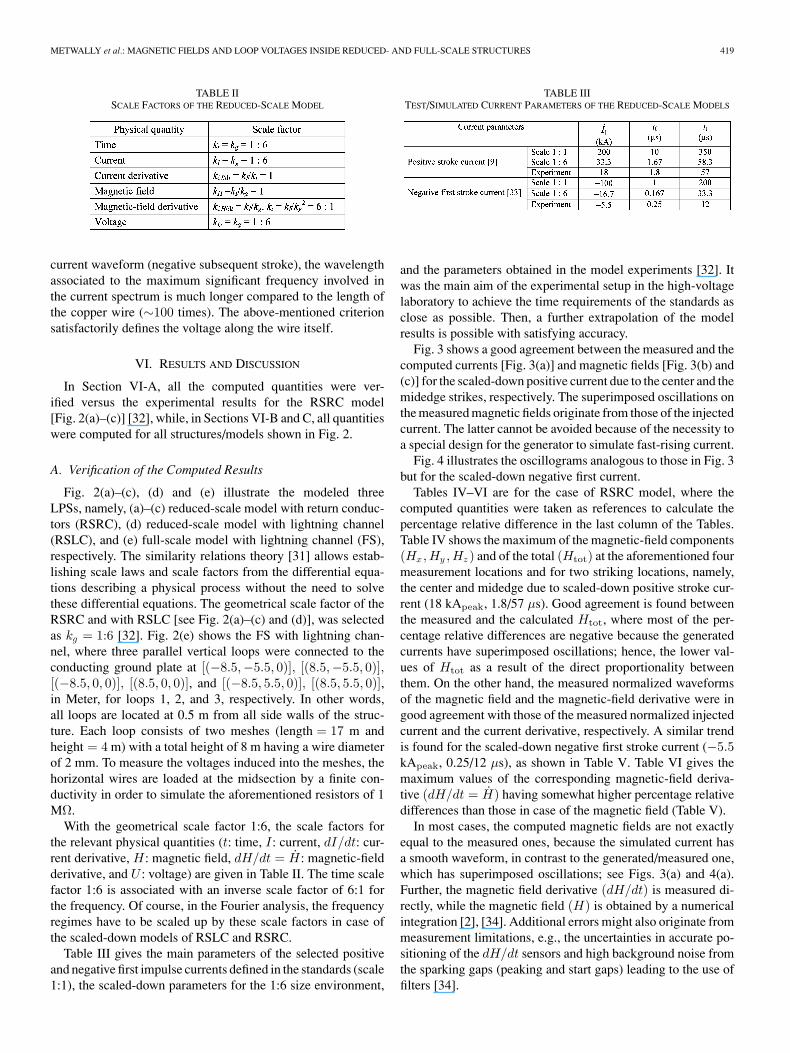
Fig. 3 shows a good agreement between the measured and thecomputed currents [Fig. 3(a)] and magnetic fields [Fig. 3(b) and(c)] for the scaled-down positive current due to the center and themidedge strikes, respectively. The superimposed oscillations onthe measured magnetic fields originate from those of the injectedcurrent. The latter cannot be avoided because of the necessity toa special design for the generator to simulate fast-rising current.
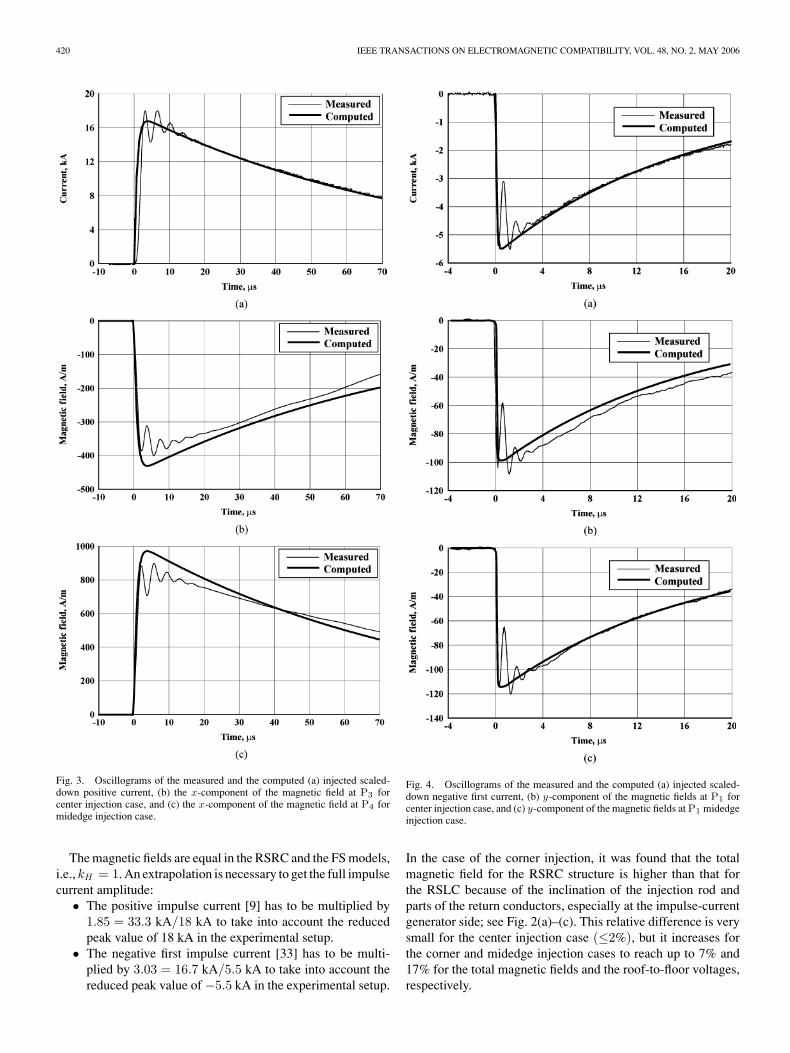
Fig. 4 illustrates the oscillograms analogous to those in Fig. 3but for the scaled-down negative first current.
Tables IV–VI are for the case of RSRC model, where thecomputed quantities were taken as references to calculate thepercentage relative difference in the last column of the Tables.Table IV shows the maximum of the magnetic-field components(Hx,Hy ,Hz ) and of the total (Htot) at the aforementioned fourmeasurement locations and for two striking locations, namely,the center and midedge due to scaled-down positive stroke cur-rent (18 kApeak, 1.8/57 µs). Good agreement is found betweenthe measured and the calculated Htot, where most of the per-centage relative differences are negative because the generatedcurrents have superimposed oscillations; hence, the lower val-ues of Htot as a result of the direct proportionality betweenthem. On the other hand, the measured normalized waveformsof the magnetic field and the magnetic-field derivative were ingood agreement with those of the measured normalized injectedcurrent and the current derivative, respectively. A similar trendis found for the scaled-down negative first stroke current (−5.5kApeak, 0.25/12 µs), as shown in Table V. Table VI gives themaximum values of the corresponding magnetic-field deriva-tive (dH/dt = H) having somewhat higher percentage relativedifferences than those in case of the magnetic field (Table V).
In most cases, the computed magnetic fields are not exactlyequal to the measured ones, because the simulated current hasa smooth waveform, in contrast to the generated/measured one,which has superimposed oscillations; see Figs. 3(a) and 4(a).Further, the magnetic field derivative (dH/dt) is measured di-rectly, while the magnetic field (H) is obtained by a numericalintegration [2], [34]. Additional errors might also originate frommeasurement limitations, e.g., the uncertainties in accurate po-sitioning of the dH/dt sensors and high background noise fromthe sparking gaps (peaking and start gaps) leading to the use offilters [34].
420 IEEE TRANSACTIONS ON ELECTROMAGNETIC COMPATIBILITY, VOL. 48, NO. 2, MAY 2006
Fig. 3. Oscillograms of the measured and the computed (a) injected scaled-down positive current, (b) the x-component of the magnetic field at P3 forcenter injection case, and (c) the x-component of the magnetic field at P4 formidedge injection case.
The magnetic fields are equal in the RSRC and the FS models,i.e., kH = 1. An extrapolation is necessary to get the full impulsecurrent amplitude:
• The positive impulse current [9] has to be multiplied by1.85 = 33.3 kA/18 kA to take into account the reducedpeak value of 18 kA in the experimental setup.
• The negative first impulse current [33] has to be multi-plied by 3.03 = 16.7 kA/5.5 kA to take into account thereduced peak value of −5.5 kA in the experimental setup.
Fig. 4. Oscillograms of the measured and the computed (a) injected scaled-down negative first current, (b) y-component of the magnetic fields at P1 forcenter injection case, and (c) y-component of the magnetic fields at P1 midedgeinjection case.
In the case of the corner injection, it was found that the totalmagnetic field for the RSRC structure is higher than that forthe RSLC because of the inclination of the injection rod andparts of the return conductors, especially at the impulse-currentgenerator side; see Fig. 2(a)–(c). This relative difference is verysmall for the center injection case (≤2%), but it increases forthe corner and midedge injection cases to reach up to 7% and17% for the total magnetic fields and the roof-to-floor voltages,respectively.

METWALLY et al.: MAGNETIC FIELDS AND LOOP VOLTAGES INSIDE REDUCED- AND FULL-SCALE STRUCTURES 421
TABLE IVCOMPARISON BETWEEN THE MEASURED AND THE
COMPUTED MAXIMUM MAGNETIC FIELDS FOR SCALED-DOWN
POSITIVE STROKE CURRENT (1.8/57 µS)
TABLE VCOMPARISON BETWEEN THE MEASURED AND THE
COMPUTED MAXIMUM MAGNETIC FIELDS FOR SCALED-DOWN
NEGATIVE FIRST STROKE CURRENT (0.25/12 µS)
TABLE VICOMPARISON BETWEEN THE MEASURED AND THE COMPUTED MAXIMUM
MAGNETIC-FIELD DERIVATIVES FOR SCALED-DOWN NEGATIVE FIRST STROKE
CURRENT (0.25/12 µS)
B. Scale Factors
Fig. 5(a) illustrates the roof-to-floor voltage U(t), which isthe potential difference between the roof center and the floorcenter. This induced voltage can be considered as an indicatorfor voltages appearing in large loops connected between roofand ground, e.g., electrical lines to equipment on the roof asair conditioning systems or satellite antennas [34]. For the full-scale (FS) structure [see Fig. 2(e)], a significant delay exists inU(t) which is equal the delay in the case of RSRC or RSLCtimes the time-scale factor kt = 6; see Table II. Therefore, allwaveforms have the same delay when the time is divided by6 as can be seen in Figs. 5 and 6. In addition, it can be seenthat the peak value of U(t), i.e., Umax, for both the FS and theRSLC models are roughly equal, while that for the RSRC ishigher by about 38% because of the inclination effect of partsof the return conductors and the injection rod; see Fig. 2(a)–(c). For the sake of comparison, in Fig. 5(b) the magnetic-field
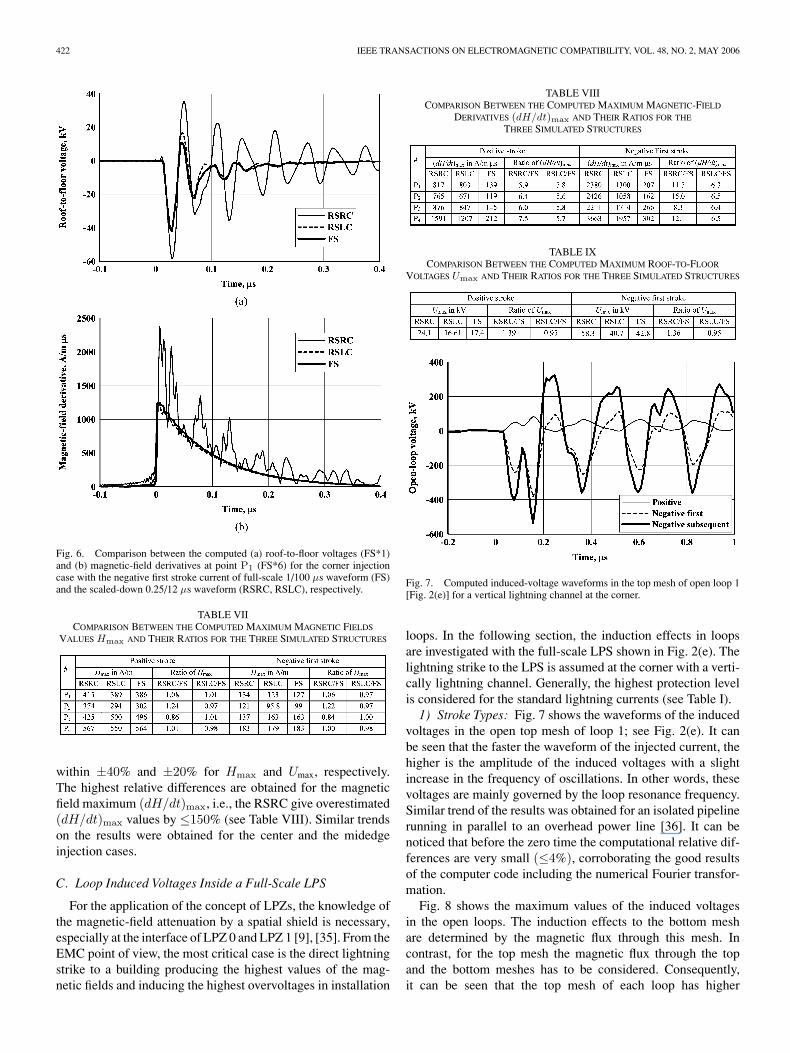
Fig. 5. Comparison between the computed (a) roof-to-floor voltages (FS*1)and (b) magnetic-field derivatives at point P1 (FS*6) for the corner injectioncase with the positive stroke currents of full-scale 10/350 µs waveform (FS) andof scaled-down 1.8/57 µs waveform (RSRC, RSLC), respectively.
derivative (dH/dt = H) is multiplied by 6 in case of the FSmodel. The peak values of magnetic-field derivative are equalfor the three models but that for the FS model is much slower as aresult of the time-scale factor. In Fig. 5(a) and (b), the successivereflections at the conducting wire ends and the coupling betweenthe conductors causes oscillations in U(t) and H , respectively.
For the scaled-down negative first stroke current, similarcomparisons between the computed U(t) and H are shownfor the three models in Fig. 6(a) and (b), respectively. Inboth figures, the computed U(t) and H for the FS and theRSLC models are roughly equal, while those for the RSRC aredoubled. The latter effect is caused by significant successivereflections on return conductors due to the submicrosecondrisetime of the injected current “doubling effect.”
For the corner injection case, Tables VII–IX summarizethe computed maximum values of H, H , and U and thecorresponding ratios for RSRC/FS and RSLC/FS, respec-tively. Generally, good agreements exist between the ratios ofHmax, (dH/dt)max, and Umax and the scale factors given inTable II, i.e., kH , kdt/dt , and kU , respectively. On the con-trary, for RSRC, the return conductors cause remarkable re-flections, especially in case of the fast-rising current waveformof the negative first stroke. For the RSRC/FS, ratios of themaximum quantities, therefore, have higher relative difference
422 IEEE TRANSACTIONS ON ELECTROMAGNETIC COMPATIBILITY, VOL. 48, NO. 2, MAY 2006
Fig. 6. Comparison between the computed (a) roof-to-floor voltages (FS*1)and (b) magnetic-field derivatives at point P1 (FS*6) for the corner injectioncase with the negative first stroke current of full-scale 1/100 µs waveform (FS)and the scaled-down 0.25/12 µs waveform (RSRC, RSLC), respectively.
TABLE VIICOMPARISON BETWEEN THE COMPUTED MAXIMUM MAGNETIC FIELDS
VALUES Hmax AND THEIR RATIOS FOR THE THREE SIMULATED STRUCTURES
within ±40% and ±20% for Hmax and Umax, respectively.The highest relative differences are obtained for the magneticfield maximum (dH/dt)max, i.e., the RSRC give overestimated(dH/dt)max values by ≤150% (see Table VIII). Similar trendson the results were obtained for the center and the midedgeinjection cases.
C. Loop Induced Voltages Inside a Full-Scale LPS
For the application of the concept of LPZs, the knowledge ofthe magnetic-field attenuation by a spatial shield is necessary,especially at the interface of LPZ 0 and LPZ 1 [9], [35]. From theEMC point of view, the most critical case is the direct lightningstrike to a building producing the highest values of the mag-netic fields and inducing the highest overvoltages in installation
TABLE VIIICOMPARISON BETWEEN THE COMPUTED MAXIMUM MAGNETIC-FIELD
DERIVATIVES (dH/dt)max AND THEIR RATIOS FOR THE
THREE SIMULATED STRUCTURES
TABLE IXCOMPARISON BETWEEN THE COMPUTED MAXIMUM ROOF-TO-FLOOR
VOLTAGES Umax AND THEIR RATIOS FOR THE THREE SIMULATED STRUCTURES
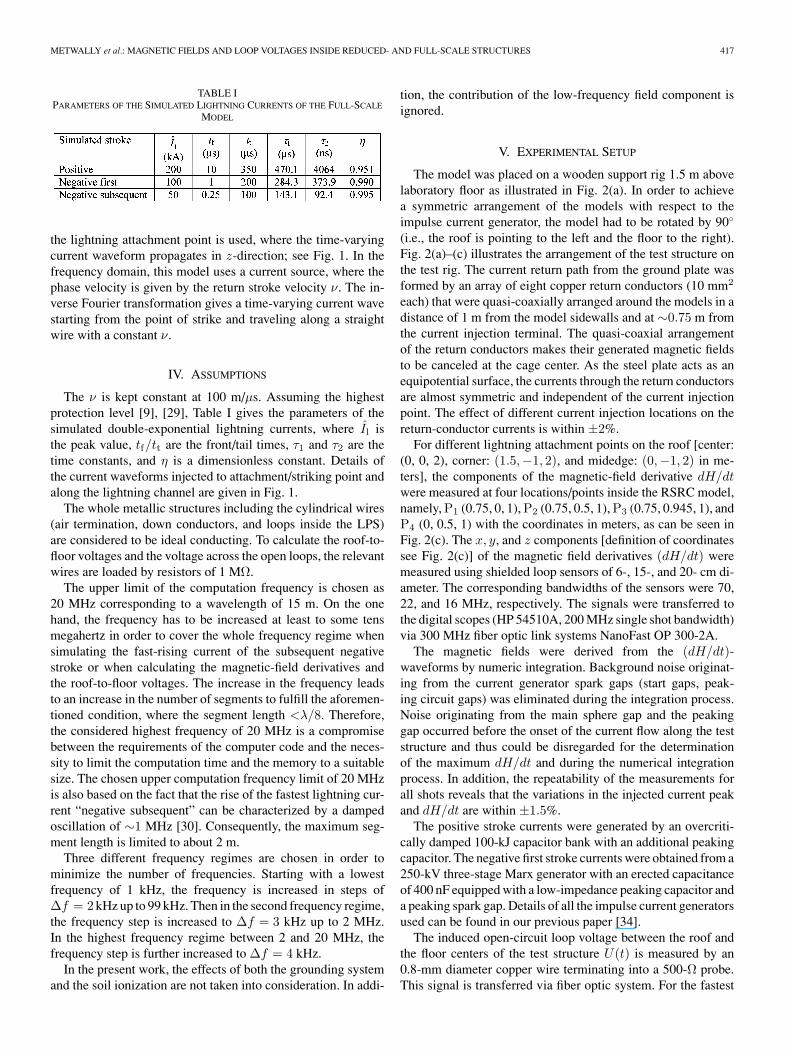
Fig. 7. Computed induced-voltage waveforms in the top mesh of open loop 1[Fig. 2(e)] for a vertical lightning channel at the corner.
loops. In the following section, the induction effects in loopsare investigated with the full-scale LPS shown in Fig. 2(e). Thelightning strike to the LPS is assumed at the corner with a verti-cally lightning channel. Generally, the highest protection levelis considered for the standard lightning currents (see Table I).
1) Stroke Types: Fig. 7 shows the waveforms of the inducedvoltages in the open top mesh of loop 1; see Fig. 2(e). It canbe seen that the faster the waveform of the injected current, thehigher is the amplitude of the induced voltages with a slightincrease in the frequency of oscillations. In other words, thesevoltages are mainly governed by the loop resonance frequency.Similar trend of the results was obtained for an isolated pipelinerunning in parallel to an overhead power line [36]. It can benoticed that before the zero time the computational relative dif-ferences are very small (≤4%), corroborating the good resultsof the computer code including the numerical Fourier transfor-mation.
Fig. 8 shows the maximum values of the induced voltagesin the open loops. The induction effects to the bottom meshare determined by the magnetic flux through this mesh. Incontrast, for the top mesh the magnetic flux through the topand the bottom meshes has to be considered. Consequently,it can be seen that the top mesh of each loop has higher
METWALLY et al.: MAGNETIC FIELDS AND LOOP VOLTAGES INSIDE REDUCED- AND FULL-SCALE STRUCTURES 423
Fig. 8. Computed maximum value of the induced voltages in the open loops[Fig. 2(e)] for a vertical lightning channel at the corner.
Fig. 9. Computed induced-current waveforms in the closed loops [Fig. 2(e)]for a positive stroke and a vertical channel at the corner.
open-loop voltages than those of the bottom one because ofthe higher loop area. The negative subsequent stroke producesthe highest magnetic field derivatives, contrary to the positivestroke [2], [34], [36]. Consequently, it is obvious that the nega-tive subsequent stroke induces the highest voltages in open-loopstructures. The closer the loop to the injection point, the higherare the magnetic-field derivatives and therefore the open-loopinduced voltages [2], [34], [36].
It is worth mentioning that the induced currents in the case ofthe negative first and the negative subsequent strokes are muchlower than for the positive stroke, because the magnetic fields areproportional to the lightning currents [34]. For the most criticalcase of a positive return stroke, Fig. 9 depicts the waveformsof the induced currents in the meshes of the closed loop 1 [Fig.2(e)]. It can be noticed that there are no successive reflections onthe closed-loop current waveforms, contrary to the open-loopvoltage. This is attributed to the fact that when the closed-looplength is much smaller than the equivalent wavelength of thelightning current waveform, the induced current in this closedloop roughly has the same waveform as that of the lightningcurrent. The loop in the center of the structure has the lowestinduced current because it is relatively far from the current-carrying down conductors.
2) Lightning Channel Inclination: The influence of a non-perpendicular lightning channel is investigated by inclining thelightning channel across the diagonal of the LPS [Fig. 2(e)].Fig. 10 shows the maximum voltages induced in the open loop
Fig. 10. Influence of diagonal inclination of lightning channel on the computedmaximum induced voltages in the open loop 1 [Fig. 2(e)].
1 as a function of the inclination angle. Loop 1 is selected sincethis loop is the closest to the struck corner, and therefore themagnetic field and the induced voltages have the highest values.Compared to the case of a vertical lightning channel (φ = 0),there is a linear increase in the induced voltages, where thetop mesh has higher values than the bottom one. The faster thelightning current waveform rises, the higher are the inducedvoltages in open loops. The trend of the results is also in accor-dance to the reasoning of Fig. 8, where the fast-rising currentsof the negative subsequent stroke produce the highest open-loopvoltages.
For all cases, the inclined channel gives higher induced volt-ages in the open loops because the near-distance componentof the magnetic field becomes pronounced, which increaseswith the lightning-current amplitude. This can also be ex-plained as the following. Inclined return stroke produces a vectorpotential that has a higher magnitude horizontal component inthe direction of the loop. Such a component has large effects onthe voltage induction on the loops.
3) Structure Bonding and Grounding: Bonding is investi-gated for horizontal wires installed between each down con-ductors at the middle height around the LPZ walls. Further,the influence of the nonideal conducting soil is studied termi-nating each of the eight down conductors with a resistor ofRg = 20 Ω. For the different arrangements and for the positivestroke, Fig. 11 illustrates the voltages induced in the top meshof the open loop 1. The bonding reduces the magnetic flux,and therefore, the induced voltage in the loop as can be seenin Fig. 12. The relative open-loop voltages are calculated as theratio between the voltages in the case with bonding or with Rg
to those without. Compared to the case without bonding, theintroduction of the bonding gives significant reduction in theopen-loop voltage for all strokes. In addition, the increase in Rg
reduces the diverting of the major part of current to the groundthrough the down conductor at the struck point on the expense ofincreasing the current flow through the other down conductors.In addition, increasing Rg leads to a significant damping of thereflection occurring across the loop. The slower the lightningcurrent waveform and/or the closer the meshes to the LPS roof(top), the lower the relative open-loop voltages in the case of
424 IEEE TRANSACTIONS ON ELECTROMAGNETIC COMPATIBILITY, VOL. 48, NO. 2, MAY 2006
Fig. 11. Computed induced-voltage waveforms in the top mesh of the openloop 1 [Fig. 2(e)] for a vertical channel and a positive stroke.
Fig. 12. Computed relative values of the maximum induced voltages in themeshes of open loop 1 [Fig. 2(e)] for a vertical lightning channel.
bonding and/or using grounding resistance. It is worth mention-ing that these results are specific for the LPS under investigation.Work is in progress to generalize the effect of grounding andbonding of any LPS.
4) Return Stroke Velocity: The induced voltages in loopsincrease with the increase in the return stroke velocity (v), de-pending on the stroke type and loop location. For instance, theincrease in ν from 50 to 200 m/µs for the positive stroke and neg-ative subsequent leads to an increase in the voltages of loop 3 topby ∼10% and 79%, respectively. This effect is attributed to thepronounced effect of the irradiative far-distance magnetic fieldwhich increases with the time rate of change of the current and,hence, with the progress velocity of the return stroke [2], [36].Similar trend was observed for large structures as in overheadTLs, where the influence of the lightning channel is significantlyhigher [2], [36].
VII. CONCLUSION
Numerical EM analysis is presented for direct lightningstrikes to LPSs. The analysis comprises the generated magneticfields and their time derivatives, and the loop voltages and cur-rents inside reduced-scale LPS (scaling factor 1:6) and full-scaleLPS (scaling factor 1:1). The LPS and the lightning channel weresimulated by the MoM and the TL model, respectively. Threedistinct LPSs were modeled, namely, reduced-scale model withreturn conductors (RSRC), reduced-scale model with lightning
channel (RSLC), and full-scale model with lightning channel(FS).
For the RSRC model, good agreement was found betweenthe measured and the computed magnetic fields, while some-what higher relative differences were found for the magnetic-field derivatives. The use of return conductors causes currentreflections and an increase in the magnetic-field derivatives incase of fast-rising currents. Therefore, the RSRC model overes-timates the maximum magnetic-field derivatives and also some-what the roof-to-floor voltages, especially for the negative firststroke current. This explains that in the case of RSRC/FS (seeTable VIII), the scaling factor for the maximum field derivativeof first negative strokes is roughly doubled compared to the an-ticipated one given in Table II. Apart from this, very good agree-ment was also found between the anticipated (Table II) and cal-culated scaling factors of the different quantities. In conclusion,all the investigated models produce good results and agree wellto the laboratory experiments. The comparison, however, is re-stricted to the scaled-down positive and the negative first strokecurrents excluding the fast-rising negative subsequent stroke, be-cause this stroke current could not be simulated experimentally.
With the full-scale model (FS) the open-loop voltage and theclosed-loop current are investigated for different arrangements.The open-loop voltage waveforms exhibit oscillations due tothe resonance frequency of the loop, where negative subsequentstrokes produce the highest magnetic-field time derivatives, andtherefore induce the highest induced voltages in open loops. Incontrast, the closed-loop currents have no oscillations becauseof the higher resonance frequency. The positive strokes producethe highest magnetic fields and therefore induce the highestcurrents in closed loops.
The influence of the lightning-channel parameters were alsoinvestigated by changing the return stroke velocity and the chan-nel inclination across the diagonal of the structure. It was foundthat the latter gives only minor effect, while the effect of theformer is based on the stroke type. For instance, the increasein v from 50 to 200 m/µs for the positive stroke and negativesubsequent leads to an increase in the voltages of loop 3 top by∼10% and 79%, respectively, and even a strong inclination ofthe lightning channel with an angle of 40 enhances the open-loop voltages only by about 30%. Also, the grounding resistancehas a minor effect. For the given LPS when considering ground-ing resistance of 20 Ω for each down conductor, the maximumopen-loop voltage only decreases by about 10% compared to aperfect conducting ground. Despite that, bonding of this LPSgives a stronger reduction in the open-loop voltage. For thepositive stroke, the maximum open-loop voltage is reduced toabout the half for the considered simple case that only one addi-tional bonding wire is installed at the middle height of the downconductors around the LPZ walls.
ACKNOWLEDGMENT
The first author wishes to acknowledge his indebtedness toInstitute 7, Faculty of Electrical Engineering, University of theFederal Armed Forces–Munich, Germany, for its generous hos-pitality.
METWALLY et al.: MAGNETIC FIELDS AND LOOP VOLTAGES INSIDE REDUCED- AND FULL-SCALE STRUCTURES 425
REFERENCES
[1] A. Orlandi, C. Mazzetti, Z. Flisowski, and M. Yarmarkin, “Systematicapproach for the analysis of the electromagnetic environment inside abuilding during lightning strike,” IEEE Trans. Electromagn. Compat.,vol. 40, no. 4, pp. 521–535, Nov. 1998.
[2] I. A. Metwally and F. H. Heidler, “Improvement of the lightning shieldingperformance of overhead transmission lines by passive shield wires,” IEEETrans. Electromagn. Compat., vol. 45, no. 2, pp. 378–392, May 2003.
[3] A. Orlandi and F. Schietroma, “Attenuation by a lightning protectionsystem of induced voltages due to direct strikes to a building,” IEEETrans. Electromagn. Compat., vol. 38, no. 1, pp. 43–50, Feb. 1996.
[4] C. Buccella, S. Cristina, and A. Orlandi, “Frequency analysis of the in-duced effects due to the lightning stroke radiated electromagnetic field,”IEEE Trans. Electromagn. Compat., vol. 34, no. 3, pp. 338–344, Aug.1992.
[5] A. Sowa, “Induced voltages in electronic systems within the buildingswhich are struck by lightning,” in Proc. 18th Int. Conf. Lightning Protec-tion, Munich, Germany, 1985, pp. 239–243.
[6] M. Feliziani and A. Orlandi, “Lightning stroke to a structure protectionsystem—Part II: Electromagnetic fields analysis,” in Proc. 6th Int. Symp.High-Voltage Eng., New Orleans, LA, Aug.28–Sep. 1 1989, pp. 109–112.
[7] J. P. Bruhin, “Shielding efficiency of reinforced steel in concrete againstlightning,” in Proc. 6th Int. Symp. Electromagn. Compat., Wroclaw,Poland, 1982, pp. 475–484.
[8] W. Hadrian, “Research into the electromagnetic disturbances caused bylightning in buildings,” in Proc. 4th Int. Symp. Electromagn. Compat.,Wroclaw, Poland, 1978, pp. 511–519.
[9] Protection Against Lightning—Part 1: General Principles, IEC 62305-1,Ed. 1, May, 2003.
[10] S. Cristina and A. Orlandi, “Calculation on the induced effects due to alightning stroke,” Proc. Inst. Elect. Eng.-B, vol. 139, no. 4, pp. 374–380,Jul. 1992.
[11] A. Sowa, “Surge current distribution in building during a direct lightningstroke,” in Proc. IEEE Int. Symp. Electromagn. Compat., 1991, pp. 248–252.
[12] S. Cristina and A. Orlandi, “EMC effects of the lightning protected sys-tem: Shielding properties of the roof-grid,” in Proc. IEEE Int. Symp.Electromagn. Compat,, 1991, pp. 78–83.
[13] IEEE Working Group, “A simplified method for estimating lightning per-formance of transmission lines,” IEEE Trans. Power App. Syst., vol. PAS-104, no. 4, pp. 919–932, Apr. 1985.
[14] M. A. Uman, D. K. McLain, and E. P. Kreider, “The electromagneticradiation from a finite antenna,” Amer. J. Phys., vol. 43, pp. 33–38, 1975.
[15] M. A. Uman and M. Rubinstein, “Methods for calculating the electromag-netic fields from a known source distribution: Application to lightning,”IEEE Trans. Electromagn. Compat., vol. 31, no. 2, pp. 183–189, May1988.
[16] M. Rubinstein and M. A. Uman, “Transient electric and magnetic fieldsassociated with establishing of finite electrostatic dipole, revisited,” IEEETrans. Electromagn. Compat., vol. 33, no. 4, pp. 312–320, Nov. 1991.
[17] S. Cristina, M. D’Amore, and A. Orlandi, “Lightning stroke to a structureprotection system—Part I: Current distribution analysis,” in Proc. 6thInt. Symp. High-Voltage Eng., New Orleans, LA, Aug. 28–Sep. 1 1989,pp. 104–108.
[18] O. Beirl and H. Steinbigler, “Simplified and fast estimation of inducedvoltages caused by lightning currents,” in Proc. 6th Int. Symp. High-Voltage Eng., New Orleans, LA, Aug. 28–Sep. 1 1989, pp. 635–638.
[19] A. Orlandi, G. B. Lo Piparo, and C. Mazzetti, “Analytical expressionsfor current share by means of a lightning protection system model,” Eur.Trans. Elect. Power Eng. (ETEP), vol. 5, no. 2, pp. 1–8, Mar./Apr. 1995.
[20] C. A. F. Sartori and J. R. Cardoso, “EMC aspects in a steel structure struckby lightning,” in Proc. IEEE Int. Symp. Electromagn. Compat., Atlanta,GA, Aug. 1995, pp. 248–252.
[21] S. Cristina and A. Orlandi, “Electromagnetic penetration through rein-forced concrete structures: An equivalent transmission line model,” IE-ICE Trans. Commun. Special Issue on Electromagn. Compat., vol. E78-B,no. 2, pp. 218–229, Feb. 1995.
[22] M. A. Uman, R. D. Brantley, Y. T. Lin, J. A. Tiller, E. P. Krider, and D.K. McLain, “Correlated electric and magnetic fields from lightning returnstrokes,” J. Geophys. Res., vol. 80, pp. 373–376, 1975.
[23] Working Group 33.01 (Lighting), “Lightning-induced voltages on over-head power lines. Part I: Return-stroke current models with specifiedchannel-base current for the evaluation of the return-stroke electromag-netic fields,” ELECTRA, no. 161, pp. 75–102, Aug. 1995.
[24] H.-D. Bruns, H. Singer, and F. Demmel, “Calculation of transient pro-cesses at direct lightning stroke into thin wire structures,” presented atthe 7th Symp. Electromagn. Compat., Zurich, Switzerland, 1987, Paper17D5, pp. 85–90.
[25] H.-D. Bruns “Pulse generated electromagnetic response in three-dimensional wire structures,” Ph.D. dissertation, Univ. Federal ArmedForces Hamburg, Germany, 1985 (in German).
[26] R. F. Harrington, Field Calculations by Moment Methods. New York:MacMillan, 1968.
[27] H.-D. Bruns and D. Koenigstein, “Calculation and measurements of tran-sient electromagnetic fields in EMP simulators,” presented at the 6thSymp. Electromagn. Compat., Zurich, Switzerland, 1985, Paper 66L2,pp. 365–370.
[28] H. Singer, H. –D. Bruens, T. Mader, and A. Freiberg, CONCEPT II—Programmer Handbook, University Hamburg-Harburg, Germany, 1994(in German), 1994.
[29] J. Wiesinger, “LEMP hazard for electronic systems and their protection,”in Proc. 25th Int. Conf. Lightning Protection, Rhodes, Greece, 2000,pp. 32–38.
[30] Protection Against Lightning Electromagnetic Impulse (LEMP). Part 2:Shielding of Structures, Bonding Inside Structures and Earthing, IEC61312-2, 1999.
[31] R. Frentzel, “Use of similarity relations in the analysis of lightning-induced transient phenomena,” Eur. Trans. Elect. Power Eng. (ETEP),vol. 7, no. 3, pp. 173–177, May/Jun. 1997.
[32] W. Zischank, F. Heidler, A. Kern, M. Seevers, K. Stimper, and J. Wiesinger,“Magnetic fields and induced voltages inside LPZ 1 measured at a 1:6 scalemodel building,” presented at the 27th Int. Conf. Lightning Protection,Avignon, France, 2004.
[33] KTA 2206:2000-06, “Auslegung von Kernkraftwerken gegen Blitzein-wirkungen,” Sicherheitstechnische Regel des KTA.
[34] I. A. Metwally, W. J. Zischank, and F. H. Heidler, “Measurement of mag-netic fields inside single- and double-layer reinforced concrete buildingsduring simulated lightning currents,” IEEE Trans. Electromagn. Compat.,vol. 46, no. 2, pp. 208–221, May 2004.
[35] Protection Against Lightning—Part 4: Electrical and Electronic SystemsWithin Structures, IEC 62305-4, Ed. 1, Dec, 2003.
[36] I. A. Metwally and F. H. Heidler, “Mitigation of the produced voltages inAC overhead power-lines/pipelines parallelism during power frequencyand lightning conditions,” Eur. Trans. Elect. Power Eng. (ETEP), vol. 15,no. 3, pp. 351–369, 2005.
Ibrahim A. Metwally (M’93–SM’04) was bornin 1963. He received the B.Eng. degree in elec-trical engineering (Hons.), the M.Eng. degree inhigh-voltage engineering, and the Ph.D. degree inhigh-voltage engineering from Mansoura University(MU), Mansoura, Egypt, in 1986, 1990, and 1994,respectively. The Ph.D. degree was received in col-laboration with Cardiff University, Cardiff, U.K.
He is currently a Full Professor with the Depart-ment of Electrical Engineering, MU. He has beenseconded to the Department of Electrical and Com-
puter Engineering, College of Engineering, Sultan Qaboos University, Muscat,Oman, as an Associate Professor since August 2002. From 2000 to 2002 andin the summers of 2003 and 2004, he joined the University of the FederalArmed Forces, Munich, Germany, as a Visiting Professor. His areas of researchinclude oil- and gas-flow electrification in both electric power apparatus andpipelines, measurements of fast impulse voltages and currents, line insulatorsand zinc-oxide surge arresters, coronas on overhead transmission lines, impulsevoltage characterization and modeling of electrical machines, particle-initiatedbreakdown in gas-insulated switchgear (GIS) and gas-insulated transmissionlines (GITL), power quality and stray-current corrosion in the oil industry, andhazards of lightning strikes to buildings, overhead power lines, and aircraft.
Prof. Metwally is a Fellow of the Alexander von Humboldt Foundation,Bonn, Germany, and a Member of the International Electrotechnical Commis-sion. He was awarded both the First Rank of the State Prize in EngineeringSciences in 1998 and 2004, and the Late Prof. Dr.-Ing. M. Khalifa’s Prize inElectrical Engineering in 1999 from the Egyptian Academy of Scientific Re-search and Technology. His biographical profile was published in Who’s Whoin Science and Engineering in 2001.
426 IEEE TRANSACTIONS ON ELECTROMAGNETIC COMPATIBILITY, VOL. 48, NO. 2, MAY 2006
Fridolin H. Heidler was born in 1955. He receivedthe B.Eng. and the M.Eng. degrees from the TechnicalUniversity Munich, Germany, in 1978 and 1982, re-spectively, both in electrical engineering with specialemphasis on high-voltage engineering, and the Ph.D.(Dr.-Ing.) and Dr.-Ing. habilitation degrees in high-voltage engineering from the Institute of High Volt-age Engineering, University of the Federal ArmedForces, Munich, in 1987 and 1999, respectively.
From 1987 to 1991, he was with IABG, where hewas active in the field of electrodynamic calculations
in the frequency and time domains. In 1991, he rejoined the Institute of HighVoltage Engineering, Federal Armed Forces University, where he is currentlya Senior Scientific Assistant. He is currently working in the fields of lightningresearch, lightning protection, and electromagnetic compatibility (EMC) withmain emphasis on numerical calculations of the lightning discharge processand the measurement of the electric or magnetic fields originated by lightning.He is the author and coauthor of more than 100 scientific papers on lightningprotection, lightning research, and electromagnetic compatibility.
Dr. Heidler is a member of several national (VG) and international commit-tees (CIGRE, URSI) dealing with standardization, lightning research, and elec-tromagnetic compatibility problems. He was the recipient of the Second PrizeAward at the Electromagnetic Compatibility Conference of Zurich, Switzerland,and the VDE/ETG award in 1985 and 1997, respectively.
Wolfgang J. Zischank was born in 1952. He receivedthe B.Eng. and the M.Eng. degrees from the Techni-cal University, Munich (TUM), Germany, in 1974 and1978, respectively, both in electrical engineering withspecial emphasis on high-voltage engineering, andthe Ph.D. degree in high-voltage engineering fromthe Institute of High Voltage Engineering, Universityof the Federal Armed Forces, Munich (UAFM), in1983.
He is currently a Senior Scientific Assistant andheads the High-Voltage/High-Current Laboratory at
UAFM. He is working in the field of lightning research and lightning protec-tion with main emphasis on laboratory simulation of lightning and high voltagetest techniques. He is the author and coauthor of numerous papers and severalpatents on lightning protection and simulation.
Dr. Zischank is a Member of several national (VDE) and international stan-dardization committees [International Electrotechnical Commission (IEC), Eu-ropean Committee for Electrotechnical Standardization (CENELEC), Society ofAutomotive Engineers (SAE)/European Organization for Civil Aviation Equip-ment (EUROCAE)] dealing with lightning protection. He was the recipient ofthe VDE/ABB Junior Scientist Award in 1991.
Related Documents