Magnetic brain activity evoked and induced by visually presented words and nonverbal stimuli CARSTEN EULITZ, a,c HIND EULITZ, a BURKHARD MAESS, b RUDOLF COHEN, a CHRISTO PANTEV, c and THOMAS ELBERT a a Department of Psychology, University of Konstanz, Germany b Max-Planck-Institute for Cognitive Neuroscience, Leipzig, Germany c Institute for Experimental Audiology, University of Münster, Germany Abstract Evoked and induced magnetic brain activity measured over the left hemisphere were tested for their specificity to language-related processing. Induced activity refers to oscillatory alterations time locked but not phase locked to the stimulus. Words, false font stimuli, and two types of nonverbal patterns were presented visually while subjects performed a nonlinguistic visual feature detection task. The comparison of evoked and induced brain activity around 200 ms after stimulus onset revealed differential sensitivity to the stimuli. The M180 component of the evoked magnetic field was larger at the processing of words and false font stimuli compared with nonverbal stimuli. The induced magnetic brain activity in the 60-Hz band at a compatible latency range was correlated with the familiarity of the visual Gestalt. Sensitivity to language-specific information processing can be concluded if a parameter differentiates the word condition from the nonlexical conditions. Such a difference was observed at sensors located over the frontal-temporal scalp regions for induced but not evoked magnetic brain activity. Thus, evoked and induced magnetic brain activity revealed a differential sensitivity to elements of cognitive processing during the given task. Descriptors: MEG, Visual evoked magnetic field, Language, Lexical processing, Gammaband activity, Oscillatory brain activity The sensitivity of event-related potentials ~ ERP!, event-related fields ~ ERF!, and electrocorticograms to various aspects of language processing has been reported in many studies ~for review see Ku- tas, 1997; Kutas & Van Petten, 1988!. Early components before 300 ms have been shown to differentiate word processing from processing of visual information contained in objects, faces, or symbols ~Allison, McCarthy, Nobre, Puce, & Belger, 1994; Kuriki, Takeuchi, & Hirata, 1998; Nobre, Allison, & McCarthy, 1994; Schendan, Ganis, & Kutas, 1998!. Differences in the processing of words and nonwords were reported mainly after 200 ms. The intracranially recorded N200 differentiated letter strings from faces and other objects but not words and nonwords ~ Nobre et al., 1994!. During these intracranial recordings, a word–nonword difference was reported around 400 ms. Similarly, the magnetoencephalo- graphic ~ MEG! study by Salmelin, Service, Kiesilä, Uutela, and Salonen ~1996! reported a word–nonword difference only in later portions of the ERF waveforms around 400 ms. Furthermore, the results of Pulvermüller, Lutzenberger, and Birbaumer ~1995! and Schendan et al. ~1998! are compatible with the idea that words and nonwords are not differentiated until after 200 ms. Given these results, the electrophysiological brain activity until after 200 ms probably reflects prelexical processing of words or letter strings. This conclusion needs, however, additional research because lex- ical processing has also been demonstrated for that latency inter- val. For example, Pulvermüller et al. ~1995! reported an ERP component around 160 ms that differed between the processing of function and content words. Event-related responses are extracted by averaging the electro- encephalogram ~ EEG! or MEG across repeated trials. In addition to the analyses of this evoked brain activity, frequency-domain analysis of EEG and MEG data has been introduced as a further tool for quantifying functional changes in neural activity ~ Makeig, 1993!. This approach estimates the induced brain activity based on time- but not phase-locked event-related activity and thus reveals aspects of brain activity that are not visible when using time- domain analysis. A number of studies ~for review see Pulvermüller, Birbaumer, Lutzenberger, & Mohr, 1997; Tallon-Baudry & Ber- trand, 1999! have demonstrated the suitability of induced brain activity parameters from the high-frequency range ~above 20 Hz! for the description of specific cognitive processes, in particular for elements of language processing. Pulvermüller and co-workers ~ Pulvermüller, 1996; Pulvermüller et al., 1997! proposed that the Research for this study was supported by the Deutsche Forschungs- gemeinschaft and a grant from the Human-Frontier and Science program. We thank the editor, S. Heim, and the unknown reviewers for helpful comments. We also thank L. Green for editing. Address reprint requests to: Dr. Carsten Eulitz, Department of Psychol- ogy, PF 5560-D25, University of Konstanz, Universitätsstraße 10, D-78434 Konstanz, Germany. E-mail: [email protected]. Psychophysiology, 37 ~2000!, 447–455. Cambridge University Press. Printed in the USA. Copyright © 2000 Society for Psychophysiological Research 447

Welcome message from author
This document is posted to help you gain knowledge. Please leave a comment to let me know what you think about it! Share it to your friends and learn new things together.
Transcript

Magnetic brain activity evoked and induced by visuallypresented words and nonverbal stimuli
CARSTEN EULITZ,a,c HIND EULITZ,a BURKHARD MAESS,b RUDOLF COHEN,a
CHRISTO PANTEV,c and THOMAS ELBERTa
aDepartment of Psychology, University of Konstanz, GermanybMax-Planck-Institute for Cognitive Neuroscience, Leipzig, GermanycInstitute for Experimental Audiology, University of Münster, Germany
Abstract
Evoked and induced magnetic brain activity measured over the left hemisphere were tested for their specificity tolanguage-related processing. Induced activity refers to oscillatory alterations time locked but not phase locked to thestimulus. Words, false font stimuli, and two types of nonverbal patterns were presented visually while subjectsperformed a nonlinguistic visual feature detection task. The comparison of evoked and induced brain activity around200 ms after stimulus onset revealed differential sensitivity to the stimuli. The M180 component of the evoked magneticfield was larger at the processing of words and false font stimuli compared with nonverbal stimuli. The inducedmagnetic brain activity in the 60-Hz band at a compatible latency range was correlated with the familiarity of the visualGestalt. Sensitivity to language-specific information processing can be concluded if a parameter differentiates the wordcondition from the nonlexical conditions. Such a difference was observed at sensors located over the frontal-temporalscalp regions for induced but not evoked magnetic brain activity. Thus, evoked and induced magnetic brain activityrevealed a differential sensitivity to elements of cognitive processing during the given task.
Descriptors: MEG, Visual evoked magnetic field, Language, Lexical processing, Gammaband activity, Oscillatorybrain activity
The sensitivity of event-related potentials~ERP!, event-related fields~ERF!, and electrocorticograms to various aspects of languageprocessing has been reported in many studies~for review see Ku-tas, 1997; Kutas & Van Petten, 1988!. Early components before300 ms have been shown to differentiate word processing fromprocessing of visual information contained in objects, faces, orsymbols~Allison, McCarthy, Nobre, Puce, & Belger, 1994; Kuriki,Takeuchi, & Hirata, 1998; Nobre, Allison, & McCarthy, 1994;Schendan, Ganis, & Kutas, 1998!. Differences in the processing ofwords and nonwords were reported mainly after 200 ms. Theintracranially recorded N200 differentiated letter strings from facesand other objects but not words and nonwords~Nobre et al., 1994!.During these intracranial recordings, a word–nonword differencewas reported around 400 ms. Similarly, the magnetoencephalo-graphic ~MEG! study by Salmelin, Service, Kiesilä, Uutela, andSalonen~1996! reported a word–nonword difference only in laterportions of the ERF waveforms around 400 ms. Furthermore, the
results of Pulvermüller, Lutzenberger, and Birbaumer~1995! andSchendan et al.~1998! are compatible with the idea that words andnonwords are not differentiated until after 200 ms. Given theseresults, the electrophysiological brain activity until after 200 msprobably reflects prelexical processing of words or letter strings.This conclusion needs, however, additional research because lex-ical processing has also been demonstrated for that latency inter-val. For example, Pulvermüller et al.~1995! reported an ERPcomponent around 160 ms that differed between the processing offunction and content words.
Event-related responses are extracted by averaging the electro-encephalogram~EEG! or MEG across repeated trials. In additionto the analyses of thisevokedbrain activity, frequency-domainanalysis of EEG and MEG data has been introduced as a furthertool for quantifying functional changes in neural activity~Makeig,1993!. This approach estimates theinducedbrain activity based ontime- but not phase-locked event-related activity and thus revealsaspects of brain activity that are not visible when using time-domain analysis. A number of studies~for review see Pulvermüller,Birbaumer, Lutzenberger, & Mohr, 1997; Tallon-Baudry & Ber-trand, 1999! have demonstrated the suitability of induced brainactivity parameters from the high-frequency range~above 20 Hz!for the description of specific cognitive processes, in particular forelements of language processing. Pulvermüller and co-workers~Pulvermüller, 1996; Pulvermüller et al., 1997! proposed that the
Research for this study was supported by the Deutsche Forschungs-gemeinschaft and a grant from the Human-Frontier and Science program.
We thank the editor, S. Heim, and the unknown reviewers for helpfulcomments. We also thank L. Green for editing.
Address reprint requests to: Dr. Carsten Eulitz, Department of Psychol-ogy, PF 5560-D25, University of Konstanz, Universitätsstraße 10, D-78434Konstanz, Germany. E-mail: [email protected].
Psychophysiology, 37~2000!, 447–455. Cambridge University Press. Printed in the USA.Copyright © 2000 Society for Psychophysiological Research
447

induced brain activity in the high-frequency range may reflect theactivation of neuronal assemblies specific for certain elements ofcognitive processing with defined cortical topographies and tem-poral activity patterns. The variety of the reported frequency rangesand latencies in only a small number of studies, together with therange of experimental designs used, require additional research tofurther illuminate the role of high-frequency responses during lan-guage processing. For this purpose, two major issues will be stud-ied. First, is there a high-frequency response specific to aspects ofword processing? If so, what are the frequency bands and timeranges of relevance? The second issue is whether parameters of theevoked and the induced brain activity reflect the same or differentaspects of information processing.
Using analyses of the induced neuromagnetic activity, we havepreviously reported enhanced normalized spectral power around200 ms in the 60–65-Hz band over the left hemisphere whensubjects processed language-related material and over the righthemisphere for a nonlanguage condition~Eulitz et al., 1996!. Theresult was independent of modality~auditory or visual! of stimuluspresentation. It was concluded that this enhancement of the nor-malized spectral power reflected oscillatory patterns specific to theprocessing of words. To further explore the functional role of thisoscillatory brain activity, in addition to the stimuli used in theprevious investigation, namely, word and false font stimuli~fourrotated, mirrored, or distorted letters!, two further nonverbal stim-ulus classes were used in this study: shapes~complex pattern witha row of four or five clusters of connected pixels! and dots stimuli~randomly arranged pixels on an area identical to the other classesof stimuli!.
As in the previous study, we used the MEG for these measure-ments specifically because it is a reference-free signal and, incertain conditions, may have a signal-to-noise ratio superior to thatfrom the EEG~Eulitz, Eulitz, & Elbert, 1997!. As previously,subjects had to detect targets that appeared occasionally in a seriesof standard~nontarget! stimuli. The task was to detect a commonnonlinguistic feature in all four classes of stimuli. According to the“word superiority effect” meaningful words are processed differ-ently from nonwords and nonsense letter strings, even when pro-cessing is not required by the task~Reicher, 1969; Wheeler, 1970!.Posner, Sandson, Dhawan, and Shulman~1989! showed that wordsautomatically activate systems for visual word form recognition.Furthermore, positron emission tomography~PET! studies haveshown the passive processing of visually presented words to besufficient to activate additional brain structures as compared withthe processing of nonverbal stimuli~Petersen, Fox, Snyder, &Raichle, 1990; Price, Wise, & Frackowiak, 1996!. Among otherregions, differential activation was demonstrated in the left pre-frontal region for words versus nonwords.
In sum, it was expected that especially for passive processingconditions, the processing of lexical stimuli should be focused indistinct and specialized subsystems of the brain. If this language-related information processing is correlated with the activation ofneuronal assemblies specific for that processing, we should be ableto describe it by means of a specific topographic and temporalactivity pattern of the induced brain activity in the high-frequencyrange for the nontarget stimuli. The main hypothesis regarding theprocessing of visual information in the four different classes ofcomplex stimuli is thelexical hypothesis, which assumes that lex-ical information is processed differently from nonlexical informa-tion. Another possibility is that differences in brain activation willreflect the cumulative experience in processing of visual informa-tion ~see also Schendan et al., 1998!. The more connected the
pixels and the more related they are to shapes and forms of familiarGestalts, the larger will be the change of brain activational param-eters related to Gestalt perception. Such aGestalt hypothesisas-sumes that the brain activation should be smallest for the dotscondition, larger for the shapes condition, then the false font con-dition, and largest for the word condition.
Materials and Methods
SubjectsFifteen right-handed~Oldfield, 1971! subjects~4 female, 11 male!aged between 20 and 32 years~median: 26.5 years! participated inthe study. None of the first-degree family members~parents, sib-lings! were reported to be left handed. Two subjects were excludedfrom further analysis due to a very low signal power of MEGresponses.
Stimuli and ProcedureFour different classes of complex visual stimuli, equated in lumi-nance, mean number of pixels, and area covered by the patterns,were used. The classes of visual stimuli differed in degrees ofcomplexity and concepts. The following stimulus classes wereused:~a! word stimuli—content words with two syllables~fourcharacters!; ~b! false font stimuli—pattern of four rotated, mir-rored, or distorted letters, which did not allow for reconstructioninto real German words;~c! shapes stimuli—complex pattern witha row of four or five clusters of connected pixels; and~d! dotsstimuli—randomly arranged pixels on an area identical to the otherclasses of stimuli. For each stimulus class 42 variants of stimuliwere created. Examples are demonstrated in Figure 1.
From these stimuli, a subset of 21 different target stimuli foreach stimulus class~i.e., 84 variants for the whole set of nontargetstimuli! was derived by removing a small section from the stim-ulus ~see right column of Figure 1!. The deletion could appear onvariable positions within the stimulus and the average size of theremoved part was different for the stimulus classes. As also seen inFigure 1, the deletion was smaller for the words than for the otherstimulus classes. This procedure was chosen to equate error rates
Figure 1. Examples of visual word, false font, shapes, and dots stimuli outof a set of 42 different variants per stimulus class are illustrated in the leftcolumn. Target stimuli are shown in the right column. The latter werederived from the nontarget stimuli by cutting out a small area of one of thecharacters. In the bottom part of the figure, the respective visual angles areindicated.
448 C. Eulitz et al.

for the different classes.1 The subject’s task was to detect thetargets and to respond by pressing a button as accurately andquickly as possible. The probability of a target appearing was 15%for all stimulus conditions.
The experiment consisted of six blocks of trials. For each block,two of the four stimulus classes were presented in random order.Each stimulus class was combined with each of the others acrossblocks. The order of recording blocks was balanced across subjectsand each pair of stimulus conditions occurred equally often at eachposition. Each stimulus class had the same probability of occur-rence in two subsequent recording blocks. For each subject, a totalof 252 stimuli per experimental condition were presented. Thiscorresponds to six repetitions of each nontarget stimulus acrossthree of the six experimental blocks during the measurements.
Visual stimuli were presented for 400 ms on a screen usingnonmagnetic fiber optic transmission. The interstimulus intervalvaried randomly from 2.0 to 2.4 s. The screen was positioned60–70 cm in front of the subject’s eyes. During the measurement,a frame~visual angles: 3.18 vertical, 6.88 horizontal! was displayedcontinuously on the screen, and subjects were asked to focus on thecenter of the frame. Stimuli were presented in the center, with amaximum of 1.48 vertical, and 4.18 horizontal extremum.
Before the experiment, it was assured that all participants wereable to identify all words and target stimuli with an accuracy of100%. During the preparation for the measurement and during theinstructional session, the stimuli were presented repeatedly to thesubjects to familiarize them with the task and to minimize a pos-sible impact of repetition effects later during the experimentalsession. Using this procedure, the influence of memory effectscannot be ruled out, as differential ERP repetition effects for wordsand nonlanguage patterns are possible~Van Petten & Senkfor,1996!. However, in addition to the familiarization with the stimuli,the experimental session contained six repetitions, the task for thesubjects was target detection, the subjects were not instructed tomemorize any stimuli, and there was no relevance of the stimulus-class-related visual information in the nontarget stimuli for anyaspects of the experimental session.
MEG MeasurementsNeuromagnetic data were recorded using a 37-channel neuromag-netometer~Magnes, Biomagnetic Technologies, Inc.; consisting offirst-order axial gradiometers with 5-cm baseline; pick-up coils arearranged in an array of concentric circles with a diameter of 14.4 cm!.Measurements were carried out in a magnetically shielded room.The sensor array was centered over the left supratemporal cortexabout 1.5 cm superior to the T3 electrode position of the 10-20system. The head position relative to sensor pickup coils was mea-sured by a sensor position indicator. Horizontal and vertical elec-trooculogram~EOG! and the button press was also recorded.2
Subjects were lying on their side with the head fixated by a vac-uum cushion. They were instructed to avoid eye blinks and headmovements, and to carry out the monitoring task carefully. Con-
tinuous data were recorded in 7–8-min blocks at a sampling rate of297.6 Hz within a bandpass width of 0.03–100 Hz.
Data AnalysisAveraged waveforms for nontargets were calculated for each stim-ulus class across epochs of 1,500 ms, including a 300-ms prestim-ulus baseline. Artifact-contaminated epochs with a signal deviationof more than 2.5 pT in the MEG, or 120mV in the EOG, andepochs with an erroneous button press were excluded. The aver-aged waveforms were digitally filtered using a lowpass filter of20 Hz ~12 dB0oct!.
Peak latencies and peak amplitudes were defined for severalERF components. They were the maximum signal deviation frombaseline in the following time intervals poststimulus onset:~1!M100: 90–135 ms;~2! M180: 160–220 ms. For better compara-bility between time- and frequency-domain-based results, the meanM180 amplitude for the latency range from 160 to 220 ms wascalculated and used for statistical analysis instead of just the peakamplitude. Although literal comparability cannot be achieved, thisprocedure results in an amplitude measure representing integratedtime information similar to the parameter extracted for the spectralintensities. For comparisons, the signal power was determined asthe root-mean-squared~rms! value across all MEG channels overthe left hemisphere.
For frequency-domain analyses, a method similar to event-related perturbation analyses~Makeig, 1993! was applied usingthe avg_q software~Feige, 1999!. In artifact-free epochs of MEGraw data~same rejection criteria as reported above!, power spectralestimates were derived from Fourier transforms on pairs~overlap-ping by one half! of 214-ms Welch-windowed segments~one halfof the segment contained data, whereas for the other half zeropadding was used to enhance the frequency resolution; the lowestfrequency bands were therefore insufficient for analysis!. Underthese constraints, a frequency resolution of 4.6 Hz was obtained.Power estimates were selectively averaged for each segment aroundstimulus onset and stimulus class. Nine time segments were situ-ated equidistantly within a 600-ms interval before stimulus onset~baseline!, and 24 segments after stimulus onset within the totalinterval of 1,343 ms. Only spectral power changes in frequencybands above 7 Hz were considered. The mean power spectra weretransformed with respect to baseline-related changes. Normalizedmean power spectra were calculated by dividing each single meanspectral power within one time-frequency bin by the mean spectralpower across all corresponding baseline segments.
To further reduce the data and to obtain estimates that were notaffected by small alterations in the location or orientation of thegenerating brain regions, and that showed little dependency onindividual variations of brain anatomy, the normalized spectralpower was collapsed across the 37 recording channels. This methodled to a smoothing and reduction of effects when significant changesin spectral power were only local. However, the mean differencesbetween experimental conditions were small and using robust pa-rameters and conservative statistical testing was preferred. For amore detailed topographical analysis of effects found with theconservatively reduced data, three subaverages each consisting of12 magnetic channels were calculated. The channels were chosenover the frontal-temporal, the central-parietal and the temporal-occipital scalp regions~see also Figure 6!. Across subjects, thesensor groups were aligned with the middle channel of the sensorarray~positioned 1.5 cm superior to T3!, and with the most supe-rior channel of the sensor array~which was close to Cz!. For thecomparison of parameters from time- and frequency-domain analy-
1Tests with equal sized removed sections in target words and “falsefont” target stimuli prior to the experiment revealed a systematically lowererror rate in the “word”~mean error rate: 3%! as compared with the “falsefont” condition~16%!. Consequently, the average size of the removed partsof the target stimuli was enlarged in all nonlanguage target stimuli toequalize the error rate across stimulus classes.
2In addition, EEG was recorded from F3, F4, T3, T4, P3, P4, M1, andM2 referred to Cz. Results focusing on EEG and MEG comparisons arereported in Eulitz, Eulitz, and Elbert~1997!.
Perception of words and nonverbal stimuli 449

ses, the same subaverages were calculated using the absolute val-ues of the mean M180 amplitude.
Statistical analyses were carried out using univariate analysesof variance~ANOVA !. Where appropriate, Greenhouse–Geisseradjustments were carried out. The peak latencies and rms ampli-tudes of the ERF components, and the normalized spectral powerwere used as dependent variables. Repeated measures one-wayANOVA were used to compare the four stimulus classes~false fontvs. shapes vs. dots vs. word!. Regional normalized spectral powerswere statistically tested with a 4 Stimulus Classes~false font vs.shapes vs. dots vs. word! 3 3 Sensor Groups~frontal-temporal vs.central-parietal vs. temporal-occipital! design~repeated measures!.For a comparison of parameters from the time- and the frequency-domain analyses, each parameter wasz-transformed across allstimulus classes, sensor groups, and subjects. Thez-transformedparameters were then used for a repeated-measures three-way AN-OVA for a 2 Methods~time- vs. frequency-domain analysis! 3 4Stimulus Classes3 3 Sensor Groups design.
Planned comparisons using contrasts were calculated for posthoc analyses. Three different hypotheses about factors influencingthe expression of dependent variables were tested:~a! the lexicalhypothesis, that is, word differs from all three other stimulus classes~contrasts: word@3#, false font@21#, shapes@21#, dots@21#!; ~b!the verbal hypothesis, that is, subjects may be able to verbalizefalse font stimuli or parts of them after some simple mental trans-formation, leading to a verbalization in both the word and the falsefont condition but not in the shapes and dots condition~contrasts:word @1#, false font @1#, shapes@21#, dots @21#!; and ~c! theGestalt hypothesis, that is, the more connected the pixels to shapesand forms and the more related the shapes and forms to knownconcepts or Gestalts, the larger the change of a parameter indicat-ing activational processes involving binding of perceptual featuresto Gestalts will be. In terms of contrasts, the Gestalt hypothesis canbe tested using a linear model~contrasts: word@3#, false font@1#,shapes@21#, dots@23#!. As the contrasts for the three hypothesesare not orthogonal, for planned comparisons the significance level~a 5 0.05! was adjusted toa9 5 0.0125 by means of the Bonferroniprocedure.
Results
Evoked ActivityFigure 2 presents the averaged MEG waveforms of one subject forthe different experimental conditions. The grand averages~acrossall subjects! of MEG signal power~rms waveforms! are illustratedin Figure 3. After the initial M100 and M180, which may corre-spond to the electric P100 and N180, a slow component lasting upto 600 ms after stimulus onset appears under all experimentalconditions. This component probably results from the sustainedactivity during stimulation and from more stimulus-specific infor-mation processing. The mean latencies of the components did notdifferentiate experimental conditions. However, mean rms ampli-tude began to differ between experimental conditions about 150 msafter stimulus onset. The M180 component was larger for the falsefont and the word conditions than for the shapes and the dotsconditions.
The ANOVA comparing the four stimulus classes~false font vs.shapes vs. dots vs. word! revealed significant amplitude-differenceswith no latency-differences for the M180. The mean M180 rmspeak amplitude was larger for the false font~125.9 f T! and word~125.3 f T! conditions than for the shapes~98.3 f T! and dots~104.7 f T! conditions,F~3,36! 5 7.88,E 5 0.636,p , .003. The
verbal hypothesis,F~1,12! 5 14.23,p , .003, explained the dif-ferences between conditions.
Induced ActivityAn overview of stimulus induced changes of normalized spectralpower in the whole time-frequency area averaged across all sub-jects is shown in Figure 4. In three time-frequency regions, thespectral power was enhanced relative to baseline and one time0frequency region showed a reduction of spectral power under allexperimental conditions. Enhanced spectral power around 10 Hzwas obvious from 50 to 200 ms, around 60 Hz from 100 to 400 ms,and around 10–40 Hz from 700 to 1,100 ms. The enhancementaround 60 Hz from 100 to 400 ms seems to be most pronounced inthe word condition and is absent in the dots condition~see alsoFigure 5 for an extended view of the normalized spectral powerchanges for the 60-Hz band as a function of time!. The late en-hancement of spectral power from 700 to 1,100 ms was mostpronounced in the shapes and dots condition. Only in the dotscondition did this late enhancement tend to be enlarged in lowerfrequency bands. A reduction of normalized spectral power is seenaround 200–600 ms in the 10–40-Hz range. This reduction ofspectral power was on average somewhat stronger in the shapescondition as compared with the other experimental conditions.
The essential change of spectral power for the present report3
was the enhancement around 60 Hz from 100 to 400 ms. In theword condition, the 60-Hz enhancement was largest at the time-frequency window centered at 183 ms, where it markedly ex-ceeded the variability during the baseline interval~Figure 5!. Nochanges of spectral power were evident for the dots condition. Thefalse font and the shapes conditions also showed enhancements ofspectral power in that time-frequency bin but those enhancementswere smaller. ANOVA revealed a significant main effect of stim-ulus classes for the spectral power,F~3,36! 5 3.13,E5 0.838,p ,.05. Post hoc planned comparisons suggested that the Gestalt hy-pothesis explains the spectral power differences in the 60-Hz band,F~1,12! 5 10.77,p , .007.
For a more detailed topographical analysis of the effects withinthe 60-Hz band, three subaverages for 12 magnetic channels each,grouped over the frontal-temporal, the central-parietal, and thetemporal-occipital regions were calculated. As can be derived fromFigure 6, changes of spectral power over central-parietal andtemporal-occipital sensor groups were similar to the overall changesdisplayed in Figure 5. Over the frontal-temporal sensor group,enhanced spectral power was obtained only in the word condition.
Regional normalized spectral power showed statistically sig-nificant main effects for sensor groups,F~2,24! 5 3.91,E5 0.958,p , .04, as well as stimulus classes,F~3,36! 5 3.43,E 5 0.823,p , .05. The sensor groups effect was primarily explained by thereduced spectral power over frontal-temporal areas in the false fontand shapes condition. Planned comparisons for explanation of thestimulus classes effect showed the same result as the analysesacross all channels. The Gestalt hypothesis explains the spectral
3Spectral power changes for other time frequency windows also showedstatistically significant differences between stimulus classes. The reductionof normalized spectral power was largest in the 19 Hz frequency band atthe time window centered at 291 ms,F~3,36! 5 3.50,E5 0.773,p , .05.The late enhancement of spectral power from 700 to 1,100 ms in the10–40-Hz frequency band was seen in all experimental conditions andtended to indicate differences between stimulus classes mainly in the fre-quency range below 25 Hz,F~3,36! 5 3.58,E 5 0.665,p , .05, around13.9 Hz and 830 ms. However, these changes were not essential for thequestions under investigation and will not be discussed in detail.
450 C. Eulitz et al.
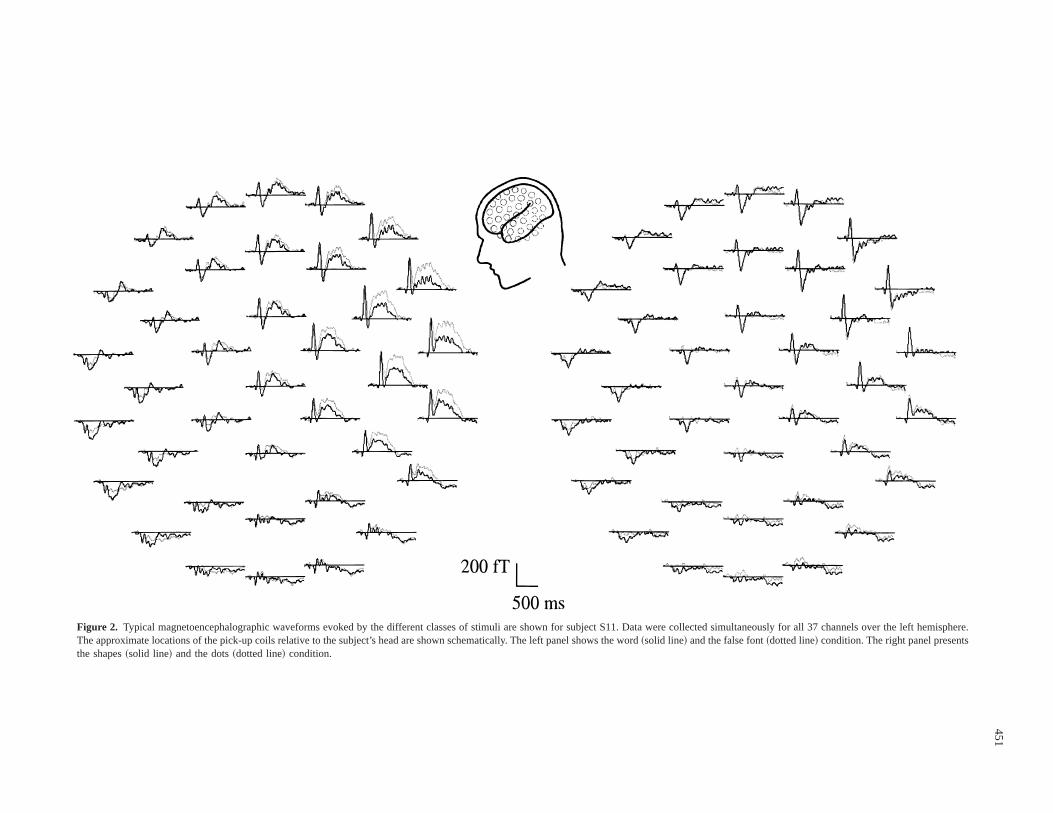
Figure 2. Typical magnetoencephalographic waveforms evoked by the different classes of stimuli are shown for subject S11. Data were collected simultaneously for all 37 channels over the left hemisphere.The approximate locations of the pick-up coils relative to the subject’s head are shown schematically. The left panel shows the word~solid line! and the false font~dotted line! condition. The right panel presentsthe shapes~solid line! and the dots~dotted line! condition.
Pe
rcep
tion
of
wo
rds
an
dn
on
verb
alstim
uli
451

power differences in the 60-Hz band. Testing the hypotheses sep-arately for a sensor group of interest~for arguments see Discus-sion! indicated that over the frontal-temporal sensor group, thelexical hypothesis,F~1,12! 5 18.14, p , .002, and the Gestalthypothesis,F~1,12! 5 11.39, p , .002, explain spectral powerdifferences in the 60-Hz band. The corresponding mean spectralpower differences between stimulus classes~see Figure 6! supportthe lexical hypothesis.
Comparison Between Evoked and Induced ActivityThe effect in the 60-Hz band that may reflect aspects of languageprocessing occurs in a similar time interval as the M180 compo-nent of the evoked activity. To answer the question as to whetheror not both parameters reflect the same neurophysiological pro-cesses, the expression of both parameters for the different stimulusclasses and sensor groups was compared. Figure 6 shows thez-transformed amplitude values of both parameters for all stimulus
Figure 3. Grand-average root meansquared~rms! waveforms recorded fromthe left hemisphere are shown separatelyfor the different experimental conditions.The thick solid line codes the word con-dition, the thin solid line the false fontcondition, the dashed line the shapes con-dition, and the dotted line the dots condi-tion. Only 100 ms of the 300-ms baselineare plotted in this figure.
Figure 4. Normalized spectral power for all time0frequency bins averaged across all channels and then across all subjects is presentedfor all experimental conditions. The upper part of the figure displays the results from the verbal conditions, and the lower part thosefrom the nonverbal conditions. In each picture, thex-axis represents the frequency, they-axis the latency, and the level of normalizedspectral power is indicated by isocontour lines. Solid lines are used for time0frequency areas of enhanced normalized spectral powerby more than 1.5%; dotted lines indicate a reduction of normalized spectral power by more than 1.5%. The contour step is61.5% upto 69% and then63%.
452 C. Eulitz et al.

classes separately for three sensor groups. The mean M180 am-plitude was larger for all stimulus classes over temporal-occipitalscalp regions as compared with the other regions, especially for thefalse font condition. In contrast, this topography is not seen for thespectral power changes in the 60-Hz band. Regional differences inthe spectral power were evident for all stimulus classes except for
the word condition. For the later condition, the enhancement ofspectral power seemed to be widespread across the whole lefthemisphere. The most characteristic feature for the comparisonbetween experimental conditions emerged over the frontal-temporalregion, where the spectral power was enhanced as compared withthe baseline level only for the word condition.
Figure 5. Changes of the normalized spectral power aver-aged across all channels and then across all subjects as afunction of time for the frequency band around 60 Hz for allexperimental conditions. The solid line codes the word con-dition, the long-dashed line the false font condition, theshort-dashed line the shapes condition, and the dotted linethe dots condition. A normalized spectral power of 1 corre-sponds to the mean spectral power across nine prestimulustime windows ~separately calculated for each frequencyband!. A normalized spectral power of 1.05 indicates theirenhancement by 5% above baseline level.
Figure 6. Meanz-transformed values of the normalized spectral power for the 60-Hz effect~induced activity indicated by stars! andthe mean M180 amplitude~evoked activity indicated by crosses! are shown. The three sensor groups of interest are presented separatelyin the columns. Within each column, the values for the stimulus classes are demonstrated in the following order: word~w!, false font~f !, shapes~s!, and dots~d! condition. Corresponding parameters from the evoked and the induced brain activity are connected by adotted line. Error bars indicate between-subject variability~standard errors!. The schematic head in the bottom part of the figure showsthe projection of the 37 channels of the used magnetoencephalograph~MEG! on the left side of a head. Different symbols indicate thechannels used for subaverages of the parameters for more detailed topographical analyses. Circles represent the frontal-temporal,rectangles the central-parietal, and triangles the temporal-occipital sensor groups. Note the different rankings of the induced and theevoked activity for the sensor groups, and the different rankings for induced activity over the frontal-temporal sensor groups across thestimulus classes.
Perception of words and nonverbal stimuli 453
Statistical analysis using stimulus class, sensor groups, andmethod as repeated-measures factors revealed in addition to sig-nificant main effects of the stimulus class,F~3,36! 5 3.97, E 50.834,p , .02, and sensor group,F~2,24! 5 15.03,E5 0.833,p ,.001, also significant interactions of sensor groups and method,F~2,24! 5 9.46,E5 0.983,p , .001, as well as stimulus class andmethod,F~3,36! 5 3.21, E 5 0.854, p , .05. The interactionsconfirmed that the parameters of the induced and the evoked brainactivity differ in topographic distribution and were differently ex-pressed for the investigated stimulus classes.
Discussion
To further illuminate the role of high-frequency oscillatory brainresponses during language processing, we studied induced neuro-magnetic activity in the high-frequency range during the process-ing of visually presented words and nonverbal stimuli and comparedthe differences between conditions with the differences observedin the parameters of the evoked neuromagnetic brain activity. Theanalyses were focused on the brain activity around 200 ms. Theinteractions of both parameters with the sensor groups and withthe stimulus class demonstrate that induced and evoked brain ac-tivity have a different topography and a different dependency ofthe signal power on the investigated stimulus classes. We concludethat the two parameters reflect different neurophysiological pro-cesses. This point is also illustrated by the observation that for bothparameters different post hoc hypotheses explained the differencesacross conditions. The verbal hypothesis explained the differencesacross conditions in the evoked brain activity, whereas the Gestalthypothesis explained the differences of the induced brain activity.
The point that both parameters reflect different neurophysio-logical processes is important for the following reason. High-frequency induced brain activity has been proposed as an index ofspecific cognitive processes, and should be mediated by the acti-vation of distributed neuronal assemblies specific for certain ele-ments of cognitive processing~Pulvermüller, 1996; Pulvermülleret al., 1997!. The Sensor Group3 Method and the Stimulus Class3Method interactions in the present results indeed support the ideathat the area-specific spectral power changes in the 60-Hz bandreflect different aspects of information processing as the evokedneuromagnetic activity. One reason for the differences might bethat cognitive processes are time locked but not phase locked to thestimulus onset and will be systematically detected only with thefrequency-domain analyses. Support for the assumption that as-pects of language may generate a considerable jitter in the timingof information processing from word to word was demonstratedfor the influence of word frequency during reading~King & Kutas,1998!. In studies of cognitive processes in which a considerablejitter in the timing of information processing can be expected,analyses of the induced brain activity may be a valuable tool toreveal aspects of brain activity that are less visible in the evokedbrain activity.
The evoked neuromagnetic activity reflected systematic differ-ences in the processing of the stimulus classes around 200 ms afterstimulus onset and thus confirmed previous results, which demon-strated differential processing of words and visual information in ob-jects, faces, or symbols~Allison et al., 1994; Kuriki et al., 1998;Nobre et al., 1994!. As the M180 amplitude did not differentiate theword condition from a variety of nonlexical conditions, the differ-ences did not support the view that the information processing re-flected in the M180 is language specific. It should be considered thatM180 amplitude differences may also be influenced by differential
repetition effects for words and nonverbal stimuli, as noted previ-ously for later components in electrical recordings~Van Petten &Senkfor, 1996!. This could have affected the present results, eventhough there was a large number of repetitions during the instruc-tion of participants and the experimental session.
The induced brain activity in the 60-Hz band reflected system-atic differences in the processing of the stimulus classes. The dif-ferences between the word and the false font conditions confirmedthe earlier results of Eulitz et al.~1996!, who reported a largerspectral power during automatic word processing. However, theoverall differences across all stimulus classes under investigationwhen using measures from a sensor array that nearly covers thewhole left hemisphere showed a dependency of event-related os-cillations in the 60-Hz band with the familiarity of the visualGestalt and did not support the lexical hypothesis. This findingdemonstrates that the presently introduced additional sets of con-trol stimuli allow for a more concise interpretation of the 60-Hzeffect and the functional significance of parameters. Based on theoverall changes of the induced activity, we may suggest that theparameter reflects information processing on the prelexical level.The activity seems to be “sensitive to the statistical regularitieswithin well-learned, visual image categories”~Schendan et al.,1998, p. 249!. Although this notion originates from examining thefunctional role of an ERP component, that is, from electric and notmagnetic and from evoked and not induced brain activity, thepresent results support the generalization of this idea.
Brain imaging studies support the specific role of the left fron-tal operculum for word reading~Fiez & Petersen, 1998!. PETstudies with tasks closely related to the experimental manipula-tions in the present study were reported by Petersen et al.~1990!and Price et al.~1996!. In these studies, differential PET activa-tional pattern for visual words and wordlike stimuli in a passiveviewing situation and during the implicit processing4 of the visualinformation were observed. Compared with the nonlanguage con-ditions, an increased metabolic activation was reported in left in-ferior prefrontal cortex during the word condition. An activity inthis brain area would mainly be measured by the frontal-temporalsensor group. Based on this evidence, a regional post hoc com-parison seems straightforward and indeed showed that both thelexical hypothesis and the Gestalt hypothesis explained the differ-ences across conditions. Mean spectral power differences betweenstimulus classes~see Figure 6! support the lexical hypothesis. Itshould be noted, however, that the Sensor Group3 Stimulus Classinteraction did not reach significance, indicating a high variabilityof regional pattern across subjects. Nevertheless, we may tenta-tively conclude that over the left frontal-temporal scalp region thehigh-frequency-induced magnetic brain activity in the 60-Hz bandin the 200-ms time segment reflects the activation of neuronalsubsystems specialized for automatic word processing, which maybe in part spatially distinct from those involved in the processingof the other stimulus classes. However, these statements are drivenby assumptions derived from imaging studies. It is well known thatelectrophysiological and imaging methods reflect different aspectsof brain activity and using blood flow to constrain the regions ofneuromagnetic activity has to be considered with caution~Elbert,1998; Eulitz et al., 1994; Stippich et al., 1998!. Furthermore, amore precise location of the generators of the induced neuromag-
4Subjects performed a nonlinguistic feature detection task and were notinstructed to process words and pseudowords. Price, Wise, and Frackowiak~1996! called the word and pseudoword processing implicit.
454 C. Eulitz et al.

netic activity is certainly highly desirable but was not attempted inthe present study for the following reasons. The partial coverageavailable with the 37-channel system is small. At the same time,the scalp distribution of the magnetic field suggests that multipleregions are simultaneously active in response to the presentation oflanguage-related material. Therefore, additional assumptions wouldbe required to solve the inverse problem, for instance to constrainsource modeling with a limited number of fixed dipoles. This doesnot seem useful for the present data set as relatively large inter-individual variability in the neuroanatomical location of languageareas~Ojemann, 1983! would require additional measurements todefine reasonable constraints. Furthermore, there is currently noprocedure available that allows for localization of sites of neuraloscillations without assumptions about a phase reference or align-ment~Feige, 1999!. Such assumptions would limit the validity ofthe approach. To examine the tentative conclusions in detail, future
research using a whole head system and other combinations oftasks within one experiment is necessary.
In conclusion, the comparison of evoked and induced brainmagnetic activity around 200 ms after stimulus onset showed thatthe two measures may reflect different elements of cognitive pro-cessing during a given task. The functional role of the language-related 60-Hz effect that appears around 200 ms after stimulusonset and that has been observed in an earlier study by Eulitz et al.~1996! was specified. The general conclusion of the earlier studythat this enhancement of the normalized spectral power seems toreflect oscillatory pattern specific to the processing of words canbe maintained tentatively for sensors over the frontal-temporalscalp regions. When using measures from a sensor array that cov-ers the major portion of the surface over the left hemisphere, thepower of event-related oscillations in the 60-Hz band was corre-lated with the familiarity of the visual Gestalt.
REFERENCES
Allison, T., McCarthy, G., Nobre, A., Puce, A., & Belger, A.~1994!. Hu-man extrastriate visual cortex and the perception of faces, words, num-bers, and colors.Cerebral Cortex, 5, 544–554.
Elbert, T. ~1998!. Neuromagnetism. In W. Andrä & H. Nowak~Eds.!,Magnetism in medicine~pp. 190–262!. New York: Wiley.
Eulitz, C., Elbert, T., Bartenstein, P., Weiller, C., Müller, S., & Pantev, C.~1994!. Comparison of magnetic and metabolic brain activity during averb generation task.NeuroReport, 6, 97–100.
Eulitz, C., Eulitz, H., & Elbert, T.~1997!. Differential outcomes frommagneto- and electroencephalography for the analysis of human cog-nition. Neuroscience Letters, 227, 185–188.
Eulitz, C., Maess, B., Pantev, C., Friederici, A., Feige, B., & Elbert, T.~1996!. Oscillatory neuromagnetic activity induced by language andnon-language stimuli.Cognitive Brain Research, 4, 121–132.
Feige, B.~1999!. Oscillatory brain activity and its analysis on the basis ofMEG and EEG. Münster, Germany: Waxmann.
Fiez, J. A., & Petersen, S. E.~1998!. Neuroimaging studies of word reading.Proceedings of the National Academy of Sciences of the United Statesof America, 95, 914–921.
King, J. W., & Kutas, M. ~1998!. Neural plasticity in the dynamics ofhuman visual word recognition.Neuroscience Letters, 244, 61–64.
Kuriki, S., Takeuchi, F., & Hirata, Y.~1998!. Neural processing of words inthe extrastriate visual cortex.Cognitive Brain Research, 6, 193–203.
Kutas, M. ~1997!. Views on how the electrical activity that the braingenerates reflects the functions of different language structures.Psy-chophysiology, 34, 383–398.
Kutas, M., & Van Petten, C.~1988!. Event-related brain potential studies oflanguage. In P. K. Acles, J. R. Jennings, & M. G. H. Coles~Eds.!,Advances in psychophysiology~Vol. 3, pp. 139–187!. Greenwich, CT:JAI Press.
Makeig, S.~1993!. Auditory event-related dynamics of the EEG spectrumand effects of exposure to tones.Electroencephalography and ClinicalNeurophysiology, 86, 283–293.
Nobre, A. C., Allison, T., & McCarthy, G.~1994!. Word recognition in thehuman inferior temporal lobe.Nature, 372, 260–263.
Ojemann, G. A.~1983!. Brain organisation for language from the perspec-tive of electrical stimulation mapping.Behavioral and Brain Sciences,26, 189–230.
Oldfield, R. C. ~1971!. The assessment and analysis of handedness: TheEdinburgh inventory.Neuropsychologia, 9, 97–113.
Petersen, S. E., Fox, P. T., Snyder, A. Z., & Raichle, M. E.~1990!. Acti-vation of extrastriate and frontal cortical areas by visual words andword-like stimuli.Science, 249, 1041–1044.
Posner, M. I., Sandson, J., Dhawan, M., & Shulman, G. L.~1989!. Is wordrecognition automatic? A cognitive-anatomical approach.Journal ofCognitive Neuroscience, 1, 50–60.
Price, C. J., Wise, R. J. S., & Frackowiak, R. S. J.~1996!. Demonstrating theimplicit processing of visually presented words and pseudowords.Ce-rebral Cortex, 6, 62–70.
Pulvermüller, F.~1996!. Hebb’s concept of cell assemblies and the psy-chophysiology of word processing.Psychophysiology, 33, 317–333.
Pulvermüller, F., Birbaumer, N., Lutzenberger, W., & Mohr, B.~1997!.High-frequency brain activity: Its possible role in attention, perceptionand language processing.Progress in Neurobiology, 52, 427–444.
Pulvermüller, F., Lutzenberger, W., & Birbaumer, N.~1995!. Electrocorti-cal distinction of vocabulary types.Electroencephalography and Clin-ical Neurophysiology, 94, 357–370.
Reicher, G. M.~1969!. Perceptual recognition as a function of meaning-fulness of stimulus material.Journal of Experimental Psychology, 81,275–280.
Salmelin, R., Service, E., Kiesilä, P., Uutela, K., & Salonen, O.~1996!.Impaired visual word processing in dyslexia revealed with magneto-encephalography.Annals of Neurology, 40, 157–162.
Schendan, H. E., Ganis, G., & Kutas, M.~1998!. Neurophysiological ev-idence for visual perceptual categorization of words and faces within150 ms.Psychophysiology, 35, 240–251.
Stippich, C., Freitag, P., Kassubek, J., Sörös, P., Kamada, K., Kober, H.,Scheffler, K., Hopfengärtner, R., Bilecen, D., Radü, E.W., & Vieth, J. B.~1998!. Motor, somatosensory and auditory cortex localization by fMRIand MEG.NeuroReport, 9, 1953–1957.
Tallon-Baudry, C., & Bertrand, O.~1999!. Oscillatory gamma activity inhumans and its role in object representation.Trends in Cognitive Sci-ences, 3, 151–162.
Van Petten, C., & Senkfor, A. J.~1996!. Memory for words and novel visualpatterns: Repetition, recognition, and encoding effects in the event-related brain potential.Psychophysiology, 33, 491–506.
Wheeler, D. D.~1970!. Processes in word recognition.Cognitive Psychol-ogy, 1, 59–80.
(Received July 6, 1998;Accepted July 12, 1999!
Perception of words and nonverbal stimuli 455
Related Documents