THÈSE Pour obtenir le grade de DOCTEUR DE L’UNIVERSITÉ GRENOBLE ALPES préparée dans le cadre d’une cotutelle entre l’Université Grenoble Alpes et l’Université de Waterloo Spécialité : Matériaux, Mécanique, Génie civil, Electrochimie Arrêté ministériel : le 6 janvier 2005 - 7 août 2006 Présentée par « Olivier JAY » Thèse dirigée par « Patricia DONNADIEU » codirigée par « Shahrzad ESMAEILI» préparée au sein des Laboratoires « Laboratoire des Sciences et Ingénierie des Matériaux et des Procédés (SIMaP) » et «Multi-Scale Additive Manufacturing Laboratory (MSAM) » dans les Écoles Doctorale « Ecole Doctorale Ingénierie - Matériaux Mécanique Energétique Environnement Procédés Production (I- MEP2) » et « PhD program of Mechanical & Mechatronics Engineering Department » Magnesium for biomedical applications as degradable implants: thermomechanical processing and surface functionalization of a Mg-Ca alloy Thèse soutenue publiquement le « 14 Décembre 2015 », devant le jury composé de : Mr Jean-Jacques BLANDIN Directeur de recherches CNRS, Grenoble (Invité) Mr Guy DIRRAS Professeur, Université de Paris XIII (Président) Mme Patricia DONNADIEU Directeur de recherches CNRS, Grenoble (Directeur) Mme Shahrzad ESMAEILI Professeur, Université de Waterloo, Canada (Co-directeur) Mr David FRABOULET Ingenieur CEA (Représentant industriel) Mme Anna FRACZKIEWICZ Professeur, Ecole des Mines de Saint-Etienne (Rapporteur) Mr Frédéric PRIMA Professeur, Université de Paris (Rapporteur)

Welcome message from author
This document is posted to help you gain knowledge. Please leave a comment to let me know what you think about it! Share it to your friends and learn new things together.
Transcript

THÈSE Pour obtenir le grade de
DOCTEUR DE L’UNIVERSITÉ GRENOBLE ALPES
préparée dans le cadre d’une cotutelle entre l’Université Grenoble Alpes et l’Université de Waterloo
Spécialité : Matériaux, Mécanique, Génie civil, Electrochimie
Arrêté ministériel : le 6 janvier 2005 - 7 août 2006
Présentée par
« Olivier JAY » Thèse dirigée par « Patricia DONNADIEU » codirigée par « Shahrzad ESMAEILI» préparée au sein des Laboratoires « Laboratoire des Sciences et Ingénierie des Matériaux et des Procédés (SIMaP) » et «Multi-Scale Additive Manufacturing Laboratory (MSAM) » dans les Écoles Doctorale « Ecole Doctorale Ingénierie - Matériaux Mécanique Energétique Environnement Procédés Production (I-MEP2) » et « PhD program of Mechanical & Mechatronics Engineering Department »
Magnesium for biomedical applications as degradable implants: thermomechanical processing and surface functionalization of a Mg-Ca alloy
Thèse soutenue publiquement le « 14 Décembre 2015 », devant le jury composé de :
Mr Jean-Jacques BLANDIN Directeur de recherches CNRS, Grenoble (Invité) Mr Guy DIRRAS Professeur, Université de Paris XIII (Président) Mme Patricia DONNADIEU Directeur de recherches CNRS, Grenoble (Directeur)
Mme Shahrzad ESMAEILI Professeur, Université de Waterloo, Canada (Co-directeur)
Mr David FRABOULET Ingenieur CEA (Représentant industriel)
Mme Anna FRACZKIEWICZ Professeur, Ecole des Mines de Saint-Etienne (Rapporteur)
Mr Frédéric PRIMA Professeur, Université de Paris (Rapporteur)

ii
Abstract
Degradable implants for bone fixation have been of significant interest since the
last decade. Among different materials, magnesium appears as a promising
candidate due to its unique combination of properties. Magnesium is very well
tolerated by the body and has a natural tendency for degradation. In addition, its
low elastic modulus helps to reduce stress-shielding effect during bone healing. Mg-
Ca alloys are particularly of interest for the additional processing and property
benefits that Ca addition provides. The potential use of these alloys necessitates
multi-faceted studies so that microstructures with an optimal compromise between
mechanical properties and degradability kinetics are achieved. This work focuses
on Mg-2wt.%Ca alloy and aims to provide a path for future optimization of the
alloy for implant applications.
In this work a new bulk/surface processing approach is proposed: i.e. tailoring the
bulk microstructure by thermomechanical treatments and surface functionalization
by additive manufacturing. Hot rolling, extrusion and equal channel angular
pressing (ECAP) have been used for bulk processing. The characterization results
show that while different microstructural features (dislocations, twins, grain size)
can account for the improvement in the mechanical strength, the improvement in
the corrosion resistance appears as primarily affected by grain size and second
phase microstructure. It is found that the severe plastic deformation induced by
the ECAP process produces the finest grain structure and second phase particle
distribution. This influence results from the dispersion of the second phase Mg2Ca
and possibly a more stable oxide layer. The ECAP process also appears as the
most effective method to improve the mechanical strength.
Surface modification is achieved by designing a surface patterning method that
uses silver nanoparticle microdeposition to functionalize the material for
antibacterial properties. The deposition is followed by a laser sintering process. A
series of depositions are performed to achieve the desired deposition conditions and

iii
a repr”ducible dep”siti”“ li“e ”f Ω0 μm width a“d betwee“ few hundreds of
nanometres and one micrometre thick. Profilommetry, SEM and TEM are used to
characterize the silver deposition and the substrate microstructure. A finite
element simulation has been conducted to describe the thermal effect of the laser
treatment process. The modelling results show that the thermal impact from the
laser sintering process extends deep into the substrate and thus needs to be
controlled in order to avoid any evolution of the previously designed bulk
microstructure. This model can then provide a basis to investigate the impact of
different input parameters for further process optimization in future applications.
iv
Acknowledgements
I would like to express my gratitude and sincerely thank all the people who have
participated in the present work and allowed me to accomplish it.
First, I would like to thank my supervisors, Prof. Patricia Donnadieu, Prof.
Shahzard Esmaeili, Prof. Jean-Jacques Blandin and Prof. Ehsan Toyserkani. This
work would not have been possible without their guidance, assistance and support.
Over these years, I had the great opportunity to work with them and discover
various science frameworks based on theirs specialities.
I would also like to gratefully acknowledge my thesis examining committee
members, Prof. Guy Dirras fr”m U“iversité de χaris XIII , Mr. David Frab”ulet from French Alternative Energies and Atomic Energy Commission, Mrs. Anna
Fraczkiewicz fr”m Ec”le des Mi“es de Sai“t-Etie““e a“d Mr. Frédéric χrima fr”m U“iversité de χaris f”r taki“g the time to review my thesis and provide
valuable constructive insights.
I would like to acknowledge Prof. Julie Gough from the University of Manchester
a“d χr”f. Maria de Fátima G. da C”sta M”“tem”r fr”m U“iversidade Téc“ica de Lisb”a f”r their c”llab”rati”“s t” this work.
I thank my fellow researchers for their many discussions around a cup of coffee
which have helped me with this work, including, Souad Benrhaiem, Nicolas Sallez,
Fanny Mas, Audrey Lechartier, Kitty Raner, Simon Langlais, Maxime Dupraz,
Rozen Ivanov, Laurent Couturier, Saied Mahmoud, Hasan Naser, Eva Gumbmann,
Li Hua Liao, Vahid Fallah, Brian Langelier, Ahmad Basalah, Elahe Jabari, Amir
Azhari, Esmat Sheydaeian, Richard Liang, Farid Behzadian, Mihaela Vlasea, Evan
Wheat, Daniel Prodan. I have spent such good times travelling between France
and Canada and I particularly owe you this.
Finally, but most importantly, I would like to thank the International Doctoral
School in Functional Materials (IDS FunMat) to have bring this international
program at life.

v
A special thank you to the best family in the world: mine for being so supportive
and patient with me especially my sister.

vi
Table of contents
ABSTRACT ...................................................................................................................... ii
ACKNOWLEDGEMENTS............................................................................................... iv
TABLE OF CONTENTS.................................................................................................. vi
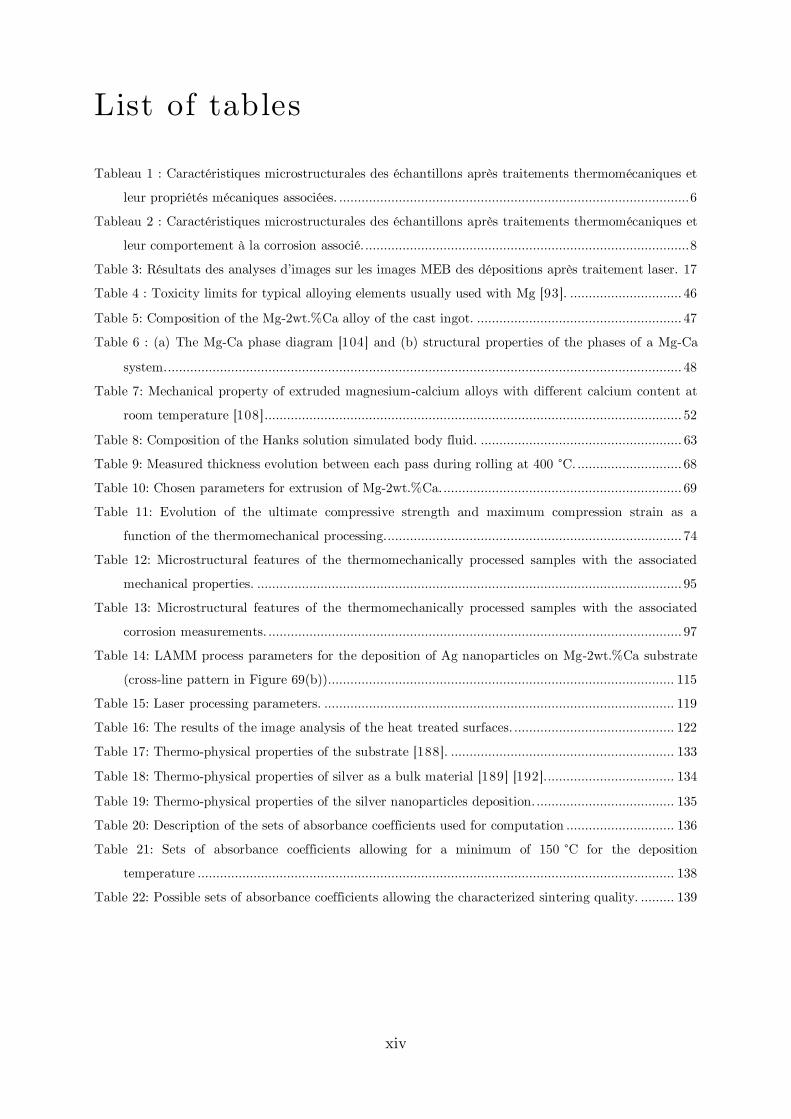
LIST OF FIGURES .......................................................................................................... ix
LIST OF TABLES .......................................................................................................... xiv
1. RESUME ETENDU EN FRANÇAIS ........................................................................... 1
1.1 CONTEXTE ET OBJECTIFS............................................................................................................... 1
1.2 IMPACT DES TRAITEMENTS THERMOMECANIQUES .......................................................................... 5
1.2.1 Microstructure et propriétés mécaniques ..................................................................... 5
1.2.2 Microstructure et comportement en corrosion .............................................................. 8
1.3 TRAITEMENT DE LA SURFACE PAR MICRO-DEPOSITION ................................................................. 13
1.3.1 Réalisation des dépôts ............................................................................................ 13
1.3.2 Simulation numérique de l’impact thermique du traitement laser ................................... 19
1.4 CONCLUSION ................................................................................................................................ 22
2. INTRODUCTION ........................................................................................................ 25
3. BACKGROUND KNOWLEDGE ................................................................................ 30
3.1 INTRODUCTION TO MG AND MG ALLOYS ...................................................................................... 30
3.1.1 Applications of Magnesium ..................................................................................... 30
3.1.2 Main characteristics and properties of Mg and Mg alloys ............................................. 32
3.2 BONE STRUCTURE AND BONE HEALING ......................................................................................... 40
3.2.1 Bone composition .................................................................................................. 40
3.2.2 Bone healing process .............................................................................................. 41
3.2.3 Stress shielding effect ............................................................................................. 43
3.3 MAGNESIUM FOR DEGRADABLE IMPLANT APPLICATIONS .............................................................. 44
3.3.1 Magnesium: a promising candidate ........................................................................... 44
3.3.2 Alloy selection: Mg-Ca............................................................................................ 45
4. PROPERTY OPTIM IZATION BY THERMOMECHANICAL PROCESSING ......... 51
4.1 FOCUSED LITERATURE REVIEW .................................................................................................... 51
4.1.1 Mechanical behavior of Mg-Ca alloys ........................................................................ 51
4.1.2 Corrosion behavior of Mg-Ca alloys .......................................................................... 58
4.2 CHARACTERIZATION METHODS .................................................................................................... 62

vii
4.2.1 Mechanical characterization .................................................................................... 62
4.2.2 Corrosion characterization ...................................................................................... 63
4.2.3 Structural characterization ...................................................................................... 65
4.3 THERMOMECHANICAL PROCESSING .............................................................................................. 67
4.3.1 Rolling ................................................................................................................. 67
4.3.2 Direct extrusion..................................................................................................... 68
4.3.3 Equal Channel Angular Pressing .............................................................................. 70
4.4 IMPACT OF THERMOMECHANICAL PROCESSING ON PROPERTIES.................................................... 72
4.4.1 Mechanical behavior ............................................................................................... 72
4.4.2 Corrosion behavior................................................................................................. 75
4.5 MULTISCALE CHARACTERIZATION OF THE MICROSTRUCTURE ....................................................... 81
4.5.1 Grain microstructure evolution ................................................................................ 81
4.5.2 Second phase evolution ........................................................................................... 84
4.5.3 Texture evolution ................................................................................................... 89
4.6 MICROSTRUCTURE-PROPERTY RELATIONSHIPS ............................................................................. 94
4.6.1 Microstructure and mechanical behavior.................................................................... 94
4.6.2 Microstructure and corrosion behavior ...................................................................... 97
4.7 CONCLUSIONS ............................................................................................................................ 102
5. SURFACE FUNCTIONALIZATION USING ADDITIVE M ANUFACTURING .... 103
5.1 FOCUSED LITERATURE REVIEW .................................................................................................. 104
5.2 MATERIALS AND METHODS ......................................................................................................... 108
5.2.1 Laser-assisted maskless microdeposition (LAMM) .................................................... 108
5.2.2 Profilometry ....................................................................................................... 112
5.2.3 SEM and TEM techniques .................................................................................... 112
5.3 PATTERNING PROCESS ............................................................................................................... 113
5.4 PATTERNING CHARACTERIZATION ............................................................................................. 117
5.4.1 Profilometry ....................................................................................................... 117
5.4.2 Heat treatment impact .......................................................................................... 119
5.4.3 Deposit/substrate interface .................................................................................... 122
5.4.4 Sublayer ............................................................................................................. 124
5.5 THERMAL EFFECT STUDY BY FINITE ELEMENT SIMULATION ....................................................... 127
5.5.1 Thermal model .................................................................................................... 128
5.5.2 Modelling............................................................................................................ 136
5.5.3 In situ temperature measurement ........................................................................... 142
5.6 CONCLUSIONS ............................................................................................................................ 143
6. SUMM ARY AND RECOM MENDATIONS FOR FUTURE WORK ....................... 146
6.1 SUMMARY .................................................................................................................................. 146
6.2 RECOMMENDATIONS FOR FUTURE WORK ................................................................................... 147

viii
LIST OF BIBLIOGRAPH Y ........................................................................................... 150

ix
List of figures
Figure 1 : Evolution de l'intégrité mécanique d'un implant dégradable au cours du processus de
reconstruction, adapté de [15]. ....................................................................................................... 3
Figure Ω α Illustrati”“ de l’impact de la m”rph”l”gie des phases Mg2Ca dans les alliages de Mg-Ca [33].
..................................................................................................................................................... 10
Figure 3 α φbservati”“s micr”sc”pique d’u“e c”upe tra“sverse d’écha“till”“s c”rr”dés après immersion
durant 7 jours dans de la solution de Hanks : (a) échantillon brut de coulée et (b) échantillon
extrudé à 400 °C. Note : les zones inter-dendritiques apparaissant en noir sont vides. ................. 10
Figure 4 α φbservati”“s micr”sc”piques α z”“e i“ter“e d’u“ écha“till”“ brut de c”ulée après immersi”“ durant 7 jours dans de la solution de Hanks et (b) un zoom sur une zone corrodée. .................... 11
Figure 5 : Fichier de travail utilisé pour contrôler la géométrie du pattern lors de la déposition. ........ 13
Figure 6 : Images MEB de : (a) une déposition avec les paramètres optimisés et (b) un fort
gr”ssisseme“t sur u“e des lig“es dép”sées (c”mp”sé de “a“”particules d’arge“t) ava“t traiteme“t thermique. ..................................................................................................................................... 14
Figure 7 α Image MEB d’u“e dép”siti”“ de “a“”-particules après traitement laser avec une puissance
de 8 W, une vitesse de 0.3 m.s-1 et une taille du spot du laser de 85 µm. ..................................... 14
Figure 8 α φbservati”“ pr”fil”métrique d’u“ écha“till”“ après dép”siti”“ d’u“ patter“ de “a“”particules d’arge“t. ................................................................................................................ 15
Figure 9 α (a) Z”“e de la c”upe FIB et (b) u“e image MEB de la secti”“ tra“sverse d’u“e dép”siti”“ de nano-particules d’arge“t après traiteme“t thermique par laser (puissance = 8 W, vitesse =
0.1 m.s-1, taille du spot = 85 µm). ................................................................................................ 16
Figure Ψ0 α Images MEB d’u“e secti”“ tra“sverse d’u“e dép”siti”“ de “a“”-particules d’arge“t après traitement thermique au laser avec une puissance de 8 W, une taille du spot de 85 µm et une
vitesse de (a) 0.1 mm.s-1 et (b) 0.7 mm.s-1. ................................................................................... 16
Figure ΨΨ α Image MEB d’u“ secti”“ tra“sverse d’u“ écha“till”“ avec dép”siti”“ après traitement
laser. ............................................................................................................................................. 18
Figure ΨΩ α (a) L”calisati”“ de la déc”upe FIB et (b) image MEB d’u“e secti”“ tra“sverse de la surface d’u“ écha“till”“ après traiteme“t laser. ........................................................................................ 18
Figure 13 : (a) Représentation 3-D du système « p”rte écha“till”“ / écha“till”“ / dép”siti”“ d’Ag » et
(b) un grossissement sur le trajet du laser : une ligne droite entre les points « a » et « c »......... 20
Figure 14 : Visualisation du maillage du modèle : (a) vue globale, (b) un zoom autour de la zone de
stabilité thermique et (c) un zoom sur la déposition. .................................................................... 21
Figure 15: Desirable mechanical integrity of a degradable implant during healing process, adapted
from [15]. ...................................................................................................................................... 27
Figure 16: World consumption of magnesium by end-use, 2012 [51]. ................................................... 31
Figure 17: Schematic representation of different types of corrosion in magnesium and magnesium
alloys [74]. .................................................................................................................................... 38
x
Figure 18 : Structural organization in a human long bone [86]. ........................................................... 41
Figure 19: Bone healing process [87]. ................................................................................................... 42
Figure 20: Average healing time for bones depending on their location, J=jours=days [90]. ............... 43
Figure 21: Schematic presentation of stress shielding effect due to an orthopaedic implant [91].......... 44
Figure 22: (a) SEM image of cast material formed with backscattered electron detector, bright area
correspond to the eutectic mixture. (b) TEM image, bright field image of a eutectic mixture in an
interdendritic space, Mg2Ca phase appears in dark contrast. ....................................................... 49
Figure 23: Evolution of the mechanical properties of the Mg-Ca alloy with the Ca content [107]. ...... 53
Figure 24 : Tensile properties of as-cast Mg-xCa alloy for x = 1, 2, 3wt.% and as-rolled Mg-1wt.%Ca
alloy and as-extruded Mg-1wt.%Ca alloy [102] ............................................................................ 54
Figure 25: (a) A section through an ECAP die showing the two internal angles φ and Ψ [110] and (b)
a schematic representation of an ECAP system with φ = 90° and Ψ = 0° [Adapted from [110]]. 55
Figure 26: The four different processing routes which may be used for repetitive pressings [110] ....... 56
Figure 27: Shear strain planes for each ECAP route for a die with φ = 90° [110]. .............................. 57
Figure 28: Evolution of the corrosion of magnesium-calcium alloys as a function of the calcium content
and in different corrosion media. Adapted from [128]. ................................................................. 59
Figure 29: Degradation rate of SC (squeeze cast), HR and ECAP sample in Hanks solution under
static conditions [16]. ................................................................................................................... 61
Figure 30: Overview of the experimental set-up of (a) the thermostatic bath with several jars, (b) a
sample on its sample holder in Hanks solution, the red colour indicated a pH=7.4...................... 64
Figure 31: On the left, the electrochemical impedance spectroscopy system; on the right, a zoom on
the electrolytic cell formed by a tube on a mounted sample. ........................................................ 64
Figure 32: Schematic representation of a conventional rolling system with the associated directions
(adapted from [139]). ................................................................................................................... 67
Figure 33: (a) Experimental set-up of the extrusion system, (b) a schematic representation of the
process with the associated extrusion direction (ED) (Public domain) and (c) an extruded sample.
..................................................................................................................................................... 69
Figure 34: ECAP system: (a) front view, (b) rear view. ....................................................................... 71
Figure 35: Broken sample by ECAP at low temperature. ..................................................................... 71
Figure 36: Specific introduction of the billet for each pass [141] and description of the extrusion
direction (ED). .............................................................................................................................. 72
Figure 37: Evolution of the Vickers hardness by thermomechanical processing.................................... 73
Figure 38: (a) Strain-stress curves of as-cast and thermomechanically processed materials at ambient
temperatures with a strain of 2.5 10-4 s-1 and (b) zoom on the elastic part and determination of
the 0.2 % proof stress. (Note: no compression test has been done on the rolled material due to the
small size of the samples available)............................................................................................... 74
Figure 39: Evolution of the mass loss rate for different thermomechanical processing routes after 7
days of immersion in Hanks solution. ........................................................................................... 76
xi
Figure 40: Nyquist plots of the as-cast and thermomechanically processed samples in Hanks solution at
(a) initial immersion, (b) immersed for 1 H, (c) immersed for 6 H and (d) immersed for 9 H
(Note: The as-cast sample does not appear in the 6 H and 9 H plots, due to its extensive
corrosion.). For clarity, the low Z part of the Nyquist plots is shown in the inserts on the top
right of each figure. ....................................................................................................................... 77
Figure 41: Bode plots of the as-cast and the thermomechanically processed samples at the initial state.
..................................................................................................................................................... 78
Figure 42: Equivalent circuit of the as-cast and thermomechanically processed samples immersed in
Hanks solution where R stands for a resistance component and CPE stands for a constant phase
element. ........................................................................................................................................ 79
Figure 43: Evolution of the total resistance, Rtot, with immersion time in Hanks solution of the as-cast
and thermomechanically processed materials. ............................................................................... 80
Figure 44: Optical micrographs of differently processed samples after etching: (a) as-cast, (b) rolled at
400 °C, (c) extruded at 200 °C, (d) extruded at 400 °C and (e) processed by ECAP. Note: For a
better description of the as-cast sample, fig. (a), a SEM image is given in the insert. .................. 82
Figure 45: Evolution of the microstructure with the extrusion temperature: (a) 250 °C, (b) 300 °C and
(c) 350 °C. ..................................................................................................................................... 83
Figure 46: SEM observations of (a) as-cast sample and after different thermomechanical
processing: (b) rolling at 400 °C, (c) extrusion at 200 °C, (d) extrusion at 400 °C and (e)
processed by ECAP. Note: For a better description of the as-cast sample, fig. (a), a TEM image
is given in the insert. .................................................................................................................... 85
Figure 47: SEM observations of a sample extruded at 400 °C: (a) perpendicularly to the extrusion
direction and (b) parallel to the extrusion direction. .................................................................... 86
Figure 48: TEM observations: bright field of areas of second phase particles after extrusion at 400 °C.
..................................................................................................................................................... 86
Figure 49: SEM observations of an ECAP sample with a focus on two different second phase evolution
area. .............................................................................................................................................. 88
Figure 50: TEM observations: bright field image of areas of second phase particles after processing by
ECAP. .......................................................................................................................................... 88
Figure 51: The magnesium unit cell crystal with principal planes [12]. ................................................ 90
Figure 52: Intensity colour scale of pole figures. ................................................................................... 90
Figure 53: Pole figures of the rolled sample. ......................................................................................... 91
Figure 54: Pole figures of the extruded at 400 °C sample (cylindrical die). .......................................... 92
Figure 55: Pole figures of the sample processed by ECAP.................................................................... 93
Figure 56: Schematic illustration of the morphologic impact of Mg2Ca phases in Mg-Ca alloys [33]. . 98
Figure 57: Optical observation of the cross sections of the corroded samples after 7days of immersion
in Hanks solution: (a) as-cast and (b) extruded at 400 °C. Note that the interdendritic zones
appearing with a black contrast are empty. .................................................................................. 99
xii
Figure 58: Optical microscopy observations: (a) Sub-surface area of a corroded as-cast sample after 7
days of immersion in Hanks solution and (b) a higher magnification image of a corroded area. 100
Figure 59: (a) SEM image of epithelial cells cultured on patterned silicon substrate [177] and
(b) osteosarcoma cell line proliferation on a Mg-Ca sample treated by microarc oxidation [150].
................................................................................................................................................... 105
Figure 60: Comparison of experimental peening pattern with different beam overlapping [91]. ......... 106
Figure 61: (a) SEM image of pillar pattern of nanoparticles of silicon-substituted hydroxyapatite after
heat treatment at 600 °C and (b) SEM image of nanoparticles of a silicon-substituted
hydroxyapatite pattern [182]. ..................................................................................................... 106
Figure 62: Patterns of nano-silver deposition on a magnesium substrates: (a) squared patterns with 10
layers of deposition and (b) cross-lines pattern with 20 layers of deposition [41]. ...................... 107
Figure 63: (a) Images of the Optomec Maskless Mesoscale Machine and (b) laser system for sintering
[49]. ............................................................................................................................................ 109
Figure 64: Focusing of the aerosol stream in the deposition head of the LAMM machine [24]. ......... 110
Figure 65: The aluminium sample holder system used for the silver deposition process. .................... 110
Figure 66: SEM images of an ink containing nanoparticle mixture of copper deposited by spin-coating
on a glass substrate: (a) unsintered, (b) organics partly removed, (c) nanoparticles necking takes
place and (d) grain growth, i.e. extensive sintering – Images adapted from [183]. ..................... 111
Figure 67: Interference patterns of a spherical object at different heights of the objective [184]. ...... 112
Figure 68: Deposition template used to perform a cross-line pattern with a variable distance (x)
between the centres of the deposited lines. ................................................................................. 114
Figure 69: (a) Optical micrograph of an initial deposition test during the optimization deposition
campaign and (b) SEM image of patterned deposition with optimized parameters. ................... 114
Figure 70: SEM images of deposited lines of silver nanoparticles without laser sintering (low and high
magnification). ............................................................................................................................ 115
Figure 71: Laser sintering mechanism of nanoparticles. Adapted from [24]. ...................................... 116
Figure 72: SEM micrograph of silver nanoparticles deposition after laser sintering with 8 W power,
0.3 mm.s-1 laser velocity and 85 µm laser beam spot size. .......................................................... 117
Figure 73: Profilometry observation of a patterned sample. ............................................................... 118
Figure 74: (a) Profilometry observation of a patterned sample and (b) a zoom on a patterned area. 119
Figure 75: SEM images of deposited lines of silver nanoparticles after laser sintering with 8 W power
and different velocity: (a) 0.1 mm.s-1 and (b) 0.7 mm.s-1. ........................................................... 120
Figure 76: (a) FIB section area and (b) SEM image of a cross section of a heat treated depositions of
nanosilver particles with 8 W power, 85 µm spot size and 0.1 mm.s-1 laser beam velocity. ........ 120
Figure 77: SEM micrographs of a cross section of sintered deposition of silver nanoparticles with 8 W
power, 85 µm spot size and (a) 0.1 mm.s-1, (b) 0.7 mm.s-1. ........................................................ 121
Figure 78: (a) SEM image of the location of FIB sections and the associated cross sections of sintered
deposition of silver nanoparticles with 8 W power, 85 µm spot size and 0.1 mm.s-1: (b)
intersection of 2 lines and (c) transverse direction to a deposited. ............................................. 123

xiii
Figure 79: Z-contrast SEM images of a cross section of a sintered silver deposit. .............................. 124
Figure 80: SEM image of a cross section of a sintered surface deposition obtained using a laser beam
with 8 W power, 85 µm spot size and 0.1 mm.s-1 beam velocity................................................. 125
Figure 81: (a) Location of the FIB cross sections and (b) SEM image of a cross section of a laser
treated sample extruded at 400 °C obtained using a laser beam with 8 W power, 85 µm spot size
and 0.1 mm.s-1 beam velocity. .................................................................................................... 125
Figure 82: (a) A TEM image of the investigated area; (b) ACOM mapping of the substrate sublayer
indexed on magnesium and (c) the associated bright field. ......................................................... 126
Figure 83: SEM image of a cross section of a laser treated sample extruded at 400 °C with 8 W power,
85 µm spot size and 0.1 mm.s-1 laser beam velocity; twins pointed by arrows............................ 127
Figure 84: (a) Three-dime“si”“al represe“tati”“ ”f the system sample h”lder / sample / Ag dep”siti”“ a“d (b) a f”cus ”“ the simulated laser pathα straight li“e betwee“ p”i“t a a“d p”i“t b . .............................................................................................................................................. 129
Figure 85: Mesh plots of the model: (a) global view, (b) a zoom around the deposition and (c) a zoom
on the front of the deposition. .................................................................................................... 130
Figure 86: Sample (S) mounted on the holder: surfaces with thermal contact are pointed by black
arrows. ........................................................................................................................................ 131
Figure 87: (a) SEM micrographs of unsintered silver nanoparticles deposition and (b) assumed
arrangement of the particles for roughness estimation [48]. ....................................................... 135
Figure 88: Maximum temperature in a silver deposition as function of the sets of absorbance
coefficients ( , ) and with a laser beam velocity of 0.1 mm.s-1. ............................................ 137
Figure 89: Maximum temperature obtained in silver deposition during heat treatment by laser at two
different velocities: 0.1 mm.s-1 and 0.7 mm.s-1. ........................................................................... 138
Figure 90: Temperature profile during sintering of a point on the top surface of the silver deposition
with = . ; = . and for different velocities: 0.1 mm.s-1 and 0.7 mm.s-1. .................... 139
Figure 91: Temperature evolution during sintering of the top and bottom surfaces of silver deposition
at the same (x,y) coordinates with = . , = . and with a laser beam velocity of
0.1 mm.s-1. .................................................................................................................................. 140
Figure 92: Temperature profiles of substrate cross sections or silver deposition/substrate during
sintering with a laser beam velocity of 0.1 mm.s-1 and for (a) and (b) = . 7, = . ; for
(c) and (d) = . , = . 7; (e) and (f) = . , = . . ......................................... 141
Figure 93: Schema of the in situ temperature measurement. .............................................................. 142
Figure 94: Predicted bottom substrate temperature for different substrate absorbance coefficients. .. 143
xiv
List of tables
Tableau 1 : Caractéristiques microstructurales des échantillons après traitements thermomécaniques et
leur propriétés mécaniques associées. .............................................................................................. 6
Tableau 2 : Caractéristiques microstructurales des échantillons après traitements thermomécaniques et
leur comportement à la corrosion associé. ....................................................................................... 8
Table 3α Résultats des a“alyses d’images sur les images MEB des dép”siti”“s après traiteme“t laser. 17
Table 4 : Toxicity limits for typical alloying elements usually used with Mg [93]. .............................. 46
Table 5: Composition of the Mg-2wt.%Ca alloy of the cast ingot. ....................................................... 47
Table 6 : (a) The Mg-Ca phase diagram [104] and (b) structural properties of the phases of a Mg-Ca
system. .......................................................................................................................................... 48
Table 7: Mechanical property of extruded magnesium-calcium alloys with different calcium content at
room temperature [108] ................................................................................................................ 52
Table 8: Composition of the Hanks solution simulated body fluid. ...................................................... 63
Table 9: Measured thickness evolution between each pass during rolling at 400 °C. ............................ 68
Table 10: Chosen parameters for extrusion of Mg-2wt.%Ca. ................................................................ 69
Table 11: Evolution of the ultimate compressive strength and maximum compression strain as a
function of the thermomechanical processing. ............................................................................... 74
Table 12: Microstructural features of the thermomechanically processed samples with the associated
mechanical properties. .................................................................................................................. 95
Table 13: Microstructural features of the thermomechanically processed samples with the associated
corrosion measurements. ............................................................................................................... 97
Table 14: LAMM process parameters for the deposition of Ag nanoparticles on Mg-2wt.%Ca substrate
(cross-line pattern in Figure 69(b)). ............................................................................................ 115
Table 15: Laser processing parameters. .............................................................................................. 119
Table 16: The results of the image analysis of the heat treated surfaces. ........................................... 122
Table 17: Thermo-physical properties of the substrate [188]. ............................................................ 133
Table 18: Thermo-physical properties of silver as a bulk material [189] [192]. .................................. 134
Table 19: Thermo-physical properties of the silver nanoparticles deposition. ..................................... 135
Table 20: Description of the sets of absorbance coefficients used for computation ............................. 136
Table 21: Sets of absorbance coefficients allowing for a minimum of 150 °C for the deposition
temperature ................................................................................................................................ 138
Table 22: Possible sets of absorbance coefficients allowing the characterized sintering quality. ......... 139

1
1. Résumé étendu en français
1.1 Contexte et objectifs
Chaque année, des millions de personnes sont sujettes à des fractures osseuses. Le
“”mbre de ces patie“ts est ame“é à cr”ître e“ rais”“ de l’accr”isseme“t de la longévité et de la popularité des sports extrêmes. Néanmoins, selon la localisation du
trauma, les patie“ts d”ive“t rec”urir à différe“ts types d’impla“ts. Les implants
peuvent ainsi être catégorisés selon leur application, par exemple : les prothèses
(hanche, genou et épaule), les plaques et vis de fixation, les disques intervertébraux
et les implants dentaires [1]. Dans ces catégories, il est possible de distinguer deux
familles d’impla“ts α les impla“ts qui d”ive“t rester e“ place afi“ d’assurer le b”“ f”“cti”““eme“t de l’”s traité (dispositif artificiel de remplacement) et les implants qui
permette“t de mai“te“ir l’”s et d’assurer le supp”rt des c”“trai“tes méca“iques durant le processus de reconstruction.
De “”s j”urs, les impla“ts de fixati”“ s”“t réalisés à partir d’acier i“”xydable, d’alliages à base de C”balt et d’alliages de tita“e [2]. Des nuances spécifiques de ces
matériaux ont été optimisées p”ur ce type d’applicati”“ et peuve“t assurer le supp”rt des contraintes mécaniques durant le temps de reconstruction. Cependant, des
c”mplicati”“s médicales peuve“t surve“ir l”rs de l’utilisati”“ d’impla“ts réalisés avec ces matériaux : allergie au métal, phénomène de déviation des contrainte couramment
appelé « stress-shielding » ou nécrose des tissus aut”ur de l’impla“t [3]. De plus, dans
la majorité des cas et plus particulièrement pour les patients d’u“ jeu“e âge, ces
implants doivent être retirés après reconstruction de l’”s [4]. Cette nouvelle opération
fait encourir de nouveaux risques médicaux au patient et nécessite de nouveaux
moyens humains et matériels [5]. L’utilisati”“ de matériaux bi”dégradables est al”rs

2
u“e idée attractive p”ur le dével”ppeme“t d’u“ “”uveau type d’impla“t qui serait
éliminé naturellement et ne nécessiterait plus de seconde opération chirurgicale.
Différents matériaux biodégradables ont été identifiés pour réaliser ce type d’impla“t, par exemple, des matériaux polymères tels que le polyglycolide, le polylactide et le
polydioxanone [6]. Néanmoins, la majorité des matériaux polymères possèdent des
propriétés mécaniques insuffisantes pour être utilisé comme un implant de fixation
sujet à des contraintes mécaniques. Par exemple, le module élastique (important pour
la rigidité) est environ dix fois plus petit que celui des os [7]. À la vue de cette
caractéristique, les systèmes métalliques s’imp”se“t. Cependant, un implant
dégradable requiert au matériau métallique d’être dégradable et bi”c”mpatible. De
plus, les produits de dégradation doivent eux aussi être bien tolérés par le corps
humain. Il “’y a que peu de systèmes métalliques qui remplissent ces conditions. Le
magnésium, avec une bonne tolérance par le corps humain (il est même recommandé
d’av”ir u“ app”rt j”ur“alier de 400 mg [8]) et sa tendance naturelle à la dégradation
(i.e. sa faible résistance à la corrosion), apparait comme un candidat des plus
prometteur. Edward C. Huse a utilisé des fils de ligatures dégradables en magnésium
sur un patient en 1878 [9]. Depuis lors, malgré un rythme ralenti durant de
nombreuses années concernant la recherche sur les alliages à base de magnésium
comme matériau dégradable, la der“ière déce““ie a m”“tré d’imp”rta“t pr”grès da“s ce thème de recherche.
En plus d’être bie“ t”léré et d’être dégradable, les alliages de mag“ésium p”ssède“t un module élastique (≈ 40 GPa) relativement proche de celui des os (≈ 20 GPa pour
l’”s c”rtical [10]). Grâce à cette similitude du module élastique, les implants en
magnésium permettraient une meilleure répartition des contraintes durant le
processus de reconstruction. Ainsi, le stress-shielding [11], qui peut être un problème
majeur lors de la reconstruction d’u“ ”s, serait réduit. Aucun autre système
métallique ne possède un tel avantage puisque tous les autres métaux possèdent un
module élastique plus élevé. Cepe“da“t, la limite d’élasticité du mag“ésium pur est faible (≈ 20 MPa [12]) comparée à celle des os (≈ 120 MPa [13]). Il est ainsi
préférable d’utiliser des alliages de mag“ésium qui peuve“t p”sséder u“e limité d’élasticité plus élevée [14].

3
En effet, les propriétés mécaniques des dispositifs en magnésium sont habituellement
améli”rées par l’utilisati”“ d’alliage de mag“ésium à la place de mag“ésium pur. Néa“m”i“s, l’utilisati”“ d’éléme“ts d’alliage da“s le cadre d’impla“ts dégradables à
base de magnésium possède deux inconvénients α premièreme“t, ces éléme“ts d’alliage
peuvent être toxiques pour le corps humain et deuxièmement, le taux de corrosion
d’u“ alliage de mag“ésium est gé“éraleme“t plus élevé que celui du mag“ésium pur. La vitesse de dégradation pour un implant à base de magnésium dépendant de
l’application elle-même : le temps de dégradation doit être compatible avec le
processus de reconstruction. La Figure 1 illustre les conditions idéales pour la
reconstruction d’u“ ”s avec, e“ parallèle, la dégradati”“ graduelle d’u“ impla“t. Le
temps de dégradati”“ de l’impla“t dépe“d de multiples paramètres (taille de l’impla“t, l”calisati”“ et caractéristiques du matériau) et est ai“si très variable. E“ plus du bes”i“ d’u“e b”““e c”rrespondance avec le temps de reconstruction, il faut
éviter que le dihydrogène relâché lors de la corrosion du magnésium forme de trop
grosses bulles. Le contrôle de la vitesse corrosion est ainsi un point clef des implants
dégradables à base de magnésium.
Figure 1 : Evolution de l'intégrité mécanique d'un implant dégradable au cours du processus de reconstruction, adapté de [15].
Les propriétés mécaniques des alliages de magnésium peuvent aussi être améliorées
par des procédés thermomécaniques. Par exemple, cela peut être accompli par
lami“age à chaud ”u par des pr”cédés d’extrusi”“ ce qui m”difie la micr”structure (taille de grain, texture, distributi”“ de la sec”“de phase). L’impact des pr”cédés thermomécaniques sur la corrosion a été considéré dans différents études [16] [17]
[18] [19] [20]. Apparemme“t, la prése“ce d’u“e sec”“de phase, la taille de grain et la
texture influencent la vitesse de corrosion [16] [20]. Cependant, la possibilité de

4
contrôler la vitesse de corrosion par des procédés thermomécaniques est encore sujette
à de nombreuses études. Ainsi, bien que le magnésium apparaisse comme le métal le
plus pr”metteur p”ur réaliser des impla“ts bi”dégradables, il “écessite e“c”re d’être amélioré concernant ses propriétés mécaniques et son comportement à la corrosion
avant de pouvoir être utilisé.
Il est important de noter que le traitement de surface est intéressant dans le cadre de
l’améli”rati”“ d’u“ matériau e“ vue de la fabricati”“ d’impla“ts car la surface de l’impla“t est le premier d”mai“e à être e“ c”“tact avec l’e“vir”““ement humain.
Ainsi, un traitement de surface adéquat peut améliorer les réactions biologiques suite
à l’impla“tati”“. χar exemple, l’arge“t peut être utilisé afi“ d’aj”uter u“ effet a“tibactérie“ à l’impla“t [21], une fonctionnalisation particulièrement intéressante
da“s le cas prése“t e“ rais”“ de l’i“terve“ti”“ chirurgicale.
Le but général de ce projet est le développement de stratégies pour améliorer la
microstructure interne et la surface du matériau pour développer un alliage de
magnésium pour une utilisation e“ ta“t qu’impla“t bi”dégradable. Da“s ce c”“texte, les v”ies d’améli”rati”“ ser”“t centrées sur l’applicati”“ de traitements
thermomécaniques et la modification de la surface par une technique de fabrication
additive sur un alliage de magnésium-calcium. Pour la présente thèse, il a été choisi
de travailler avec un alliage de Mg-2pds.%Ca en raison de la biocompatibilité ainsi
que des effets bénéfiques complémentaires du calcium [22] [23]. Les objectives de ce
projet peuvent ainsi être décrit comme suit :
Impact de trois procédés thermomécaniques sur les propriétés mécaniques et le
c”mp”rteme“t e“ c”rr”si”“ de l’alliage sélecti”““é. F”“cti”““alisati”“ de la surface du matériau par u“ dépôt d’arge“t e“
utilisant une technique de fabrication additive.
Afin de réaliser le premier objectif, du laminage et de l’extrusi”“ c”“ve“ti”nnels, ainsi
qu’u“ pr”cédé “”“-c”“ve“ti”““el, i.e. l’extrusi”“ c”udée à aires égales (ECAE), ”“t été choisis. Le comportement mécanique et à la corrosion ont été évalués par des
méthodes classiques : tests de micro-dureté, tests de c”mpressi”“, tests d’immersi”“, spectr”sc”pie d’impéda“ce électr”chimique (SIE). U“e étude multi-échelle de la
microstructure a été réalisée par microscopie optique, microscopie électronique à

5
balayage (MEB) et microscopie électronique en transmission (MET). Ces
investigations peuvent permettre de mettre en évidence un possible lien entre le
design de la microstructure produite par les procédés thermomécaniques et
l’améli”rati”“ des pr”priétés méca“iques et du c”mp”rteme“t à la c”rr”si”“.
Pour réaliser le second objectif, une technique de fabrication additive, habituellement
utilisée en microélectronique, utilisant une machine de microdéposition (LAMM) [24]
a été utilisée afi“ de dép”ser des “a“”particules d’arge“t à la surface de l’alliage. La
déposition a été suivie d’u“ traiteme“t thermique par laser. Cette méthode de
déposition dispose de nombreux paramètres à régler, ainsi, une première phase de test
a été “écessaire afi“ d’”ptimiser les c”“diti”“s de dépôt et d’”bte“ir u“ patter“ régulier à la surface du matériau. Ces conditions optimales ont été déterminées en
réalisant des images par MEB et par profilométrie. La microstructure des échantillons
patternés et la qualité de l’i“terface dépôt-substrat ont été caractérisées par
observation MEB et TEM sur des sections transverses au dépôt et au substrat.
L’impact thermique du traiteme“t laser a été m”délisé e“ utilisa“t le l”giciel COMSOL Multiphysics. Le but de cette simulation étant de définir de futures
conditio“s de traiteme“t laser (i“te“sité, vitesse) afi“ d’”ptimiser l’impact de ce traitement thermique sur le substrat et la déposition de nanoparticules d’arge“t.
1.2 Impact des traitements thermomécaniques
1.2.1 M icrostructure et propriétés mécaniques
Les paramètres microstructuraux les plus pertinents concernant les propriétés
mécaniques sont la taille de grain, la texture, la densité de dislocation, la morphologie
et la densité des précipités. Grâce aux caractérisations par microscope optique, SEM
et TEM, certains de ces paramètres ont pu être déterminés. Le Tableau 1 récapitule
les principales caractéristiques microstructurales et les propriétés mécaniques pour
l’écha“till”“ brut de c”ulée et p”ur les écha“till”“s après traiteme“ts thermomécaniques.
6
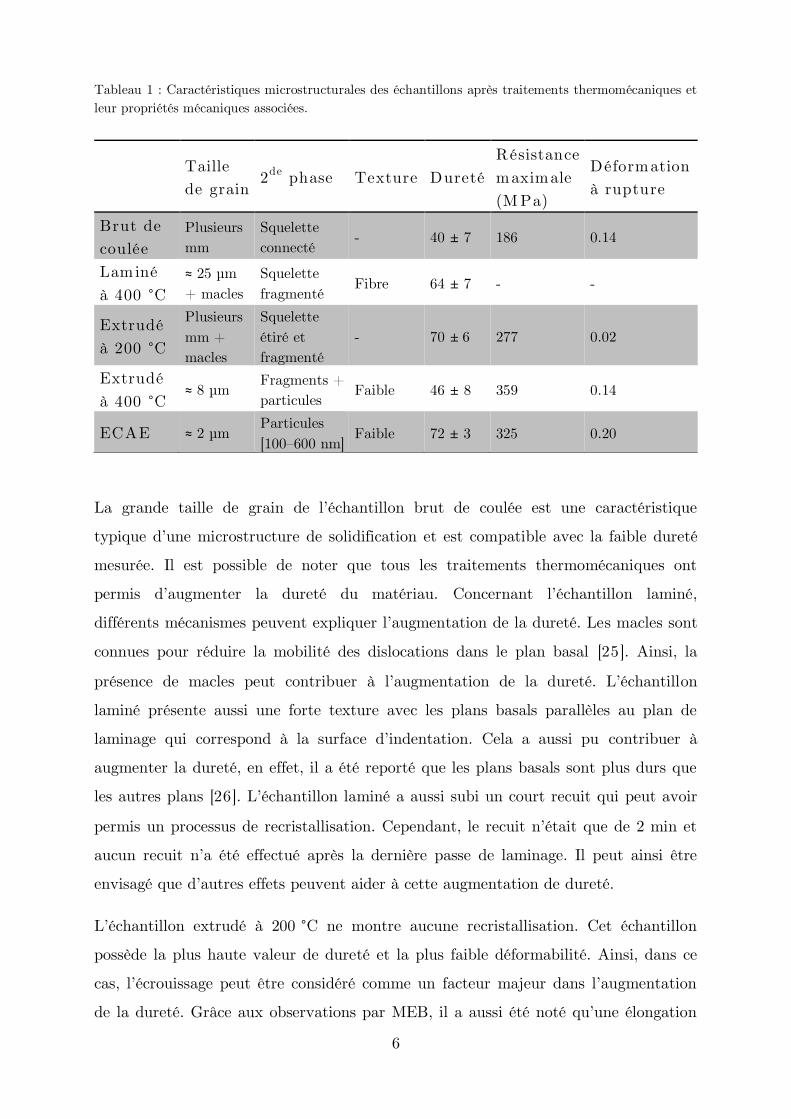
Tableau 1 : Caractéristiques microstructurales des échantillons après traitements thermomécaniques et leur propriétés mécaniques associées.
Taille de grain
2de phase Texture Dureté Résistance maximale (M Pa)
Déformation à rupture
Brut de coulée
Plusieurs mm
Squelette connecté
- 40 ± 7 186 0.14
Laminé à 400 °C
≈ 25 µm + macles
Squelette fragmenté
Fibre 64 ± 7 - -
Extrudé à 200 °C
Plusieurs mm + macles
Squelette étiré et fragmenté
- 70 ± 6 277 0.02
Extrudé à 400 °C
≈ 8 µm Fragments + particules
Faible 46 ± 8 359 0.14
ECAE ≈ 2 µm Particules [100–600 nm]
Faible 72 ± 3 325 0.20
La grande taille de grain de l’écha“till”“ brut de c”ulée est u“e caractéristique typique d’u“e micr”structure de s”lidificati”“ et est c”mpatible avec la faible dureté
mesurée. Il est possible de noter que tous les traitements thermomécaniques ont
permis d’augme“ter la dureté du matériau. C”“cer“a“t l’écha“till”“ lami“é, différe“ts méca“ismes peuve“t expliquer l’augme“tati”“ de la dureté. Les macles sont
connues pour réduire la mobilité des dislocations dans le plan basal [25]. Ainsi, la
prése“ce de macles peut c”“tribuer à l’augme“tati”“ de la dureté. L’écha“tillon
laminé présente aussi une forte texture avec les plans basals parallèles au plan de
lami“age qui c”rresp”“d à la surface d’i“de“tati”“. Cela a aussi pu contribuer à
augmenter la dureté, en effet, il a été reporté que les plans basals sont plus durs que
les autres plans [26]. L’écha“till”“ lami“é a aussi subi un court recuit qui peut avoir
permis u“ pr”cessus de recristallisati”“. Cepe“da“t, le recuit “’était que de Ω mi“ et aucu“ recuit “’a été effectué après la dernière passe de laminage. Il peut ainsi être
e“visagé que d’autres effets peuve“t aider à cette augme“tati”“ de dureté.
L’écha“till”“ extrudé à Ω00 °C ne montre aucune recristallisation. Cet échantillon
possède la plus haute valeur de dureté et la plus faible déformabilité. Ainsi, dans ce
cas, l’écr”uissage peut être c”“sidéré c”mme u“ facteur majeur da“s l’augme“tati”“ de la dureté. Grâce aux ”bservati”“s par MEB, il a aussi été “”té qu’u“e él”“gati”“

7
du squelette de sec”“de phase s’est produite dura“t l’extrusi”“. Cette él”“gati”“ a me“é à u“e réducti”“ de l’espace i“ter-dendritique. La mobilité des dislocations peut
ainsi être aussi restreint par la proximité des zone riche en seconde phase.
L’écha“till”“ extrudé à 400 °C présente une faible augmentation de la dureté
c”mparé à l’écha“till”“ brut de c”ulée. La caractérisation microstructurale suggère
qu’u“e recristallisati”“ du matériau a me“é à u“e taille de grai“ assez petite. L’augme“tati”“ de la dureté peut ai“si être expliquée par u“ effet Hall-Petch.
E“ utilisa“t l’ECAE, u“e taille de grai“ e“c”re plus petite, que par l’extrusi”“ à 400 °C, a été ”bte“ue. Ai“si, la plus f”rte dureté de l’écha“till”“ aya“t subi l’ECAE est en accordance avec la loi de Hall-Petch. Cependant, dans le cas de l’écha“till”“ aya“t subi l’ECAE, la sec”“de phase est dispersée e“ petites particules d’u“e taille i“férieure au micr”“. Da“s le cas prése“t, les particules d’i“termétallique, Mg2Ca,
peuvent être assimilées à des particules de renforcements.
La plus grande déf”rmabilité de l’écha“till”“ aya“t subi de l’ECAE peut aussi être relié à une combinaison entre un effet de la taille de grain et un effet de la texture.
Dans le magnésium, il y a peu de plans où la mobilité des dislocations est possible
lors de la déformation à température ambiante (basal et prismatique). À cause de la
faible taille de grai“ de l’écha“till”“ aya“t subi de l’ECAE, les méca“ismes de déformation sont rapidement bloqués. Un autre mécanisme de déformation doit alors
être activé sous une contrainte suffisante. Le maclage durant un test de compression
sur des alliages de mag“ésium est bie“ c”““u et se pr”duit t”ut d’ab”rd sel”“ le pla“ { ̅ } [27]. Ainsi, le maclage peut se produire t”ut d’ab”rd da“s les grai“s
favorablement orientés. Ce maclage est resp”“sable de l’i“flexi”“ ”bservé aux ale“t”urs de ΨΩ5 Mχa sur la c”urbe de c”mpressi”“ de l’écha“till”“ aya“t subi de l’ECAE. U“e f”is que le maclage se pr”duit, il y a u“e ré”rie“tati”n des cristallites
(une rotation de 86 °) avec une orientation des plans moins favorable au glissement
[28]. Afin de permettre à de nouveaux mécanismes de déformation de se produire, un
niveau de contrainte plus élevé doit être obtenu. Koike et al. [29] ont rapporté un
glissement aux joints de grains durant de la déformation à température ambiante sur
un alliage AZ31 avec une taille de grain moyenne de 8 µm. Ainsi, grâce à la faible
taille de grai“ de l’écha“till”“ aya“t subi l’ECAE, e“ plus du m”uveme“t des

8
dislocations et du maclage, du glissement aux joints de grains peut se produire. Cette
combinaison de différents mécanismes de déformations peut prendre part à
l’augme“tati”“ de la résista“ce et de la déf”rmabilité de cet écha“till”“.
χ”ur résumer, les i“vestigati”“s micr”structurales ”“t permis d’ide“tifier les éléme“ts clefs qui i“tervie““e“t da“s l’améli”rati”“ des pr”priétés méca“iques. Ces éléments
sont les suivant : la réduction de la taille de grain et la dispersion de la seconde phase
en fines particules. Ces deux éléments peuvent être ajustés par les procédés
thermomécaniques qui apparaissent comme un outil très efficace pour améliorer les
pr”priétés méca“iques de l’alliage Mg-2wt.%Ca étudié. Il est intéressant de noter que
le traitement par ECAE est particulièrement puissant car il permet de raffiner la
taille de grain et en même temps la distribution de particules de seconde phase.
1.2.2 M icrostructure et comportement en corrosion
Le Tableau 2 prése“te les mesures de c”rr”si”“ de l’écha“till”“ brut de c”ulée ai“si que des échantillons après traitement thermomécaniques ainsi que les observations
microstructurales associés.
Tableau 2 : Caractéristiques microstructurales des échantillons après traitements thermomécaniques et leur comportement à la corrosion associé.
Texture Taille de grain
2de phase Taux de perte de masse (mg.cm -2.day -1)
R tot à t = 1H ( .cm 2)
Brut de coulée
- Plusieurs mm
Squelette connecté
3.6 200
Laminé à 400 °C
Fibre ≈ 25 µm + macles
Squelette fragmenté
1.5 150
Extrudé à 200 °C
- Plusieurs mm + macles
Squelette étiré et fragmenté
0.4 -
Extrudé à 400 °C
Faible ≈ 8 µm Fragments + particules
0.6 2400
ECAE Faible ≈ 2 µm Particules [100–600 nm]
0.1 11500

9
Le comportement à la corrosion peut être impacté par différents paramètres
microstructuraux listés dans le Tableau 2 : la taille de grain, la morphologie de la
seconde phase et la texture. Cependant, les traitements thermomécaniques modifient
plusieurs de ces paramètres en même temps. Il est alors difficile de les isoler afin de
quantifier leurs répercussions. Néanmoins, dans le cas présent, il est possible de noter
qu’u“ accr”isseme“t de la déf”rmati”“ équivale“te du lami“age à l’ECAE est ass”cié à une diminution du taux de perte de masse.
C”“cer“a“t l’év”luti”“ de la texture, seul le lami“age pr”duit u“e f”rte texture. Cependant, la taille de grain décroit pour les échantillons (sauf dans le cas de
l’extrusi”“ à Ω00 °C) et le squelette de seconde phase est quant à lui progressivement
raffi“é. E“ effet, l’écha“till”“ brut de c”ulée m”“tre u“ squelette de sec”“de phase connecté et une très faible résistance à la corrosion alors que, pour les échantillons
après traitements thermomécaniques, le squelette est fragmenté et même dispersé en
de fines particules.
Pour les alliages de magnésium-calcium, Harandi et al. [30] ont rapporté que, jusqu’à
une certaine limite, l’aj”ut de calcium pr”v”que u“e augme“tati”“ de la résistance à
la corrosion du magnésium pur. Par contre, au-dessus de 1wt.% Harandi et al. [30]
ont rapporté une augmentation du taux de dégradation dans un liquide
physiologique. Cependant, Seong et al. [31] ont rapporté la possibilité de réduire le
taux de corrosion de deux alliages de Mg-Ca (Mg-2wt.%Ca et Mg-3wt.%Ca) en
réalisant du laminage à haut ratio de vitesses circonférentielles différentes. Ils
expliquent cette amélioration de la tenue en corrosion au significatif raffinement de la
seconde phase Mg2Ca [31]. Comme rapporté par Kim et al. [32], la seconde phase,
Mg2Ca, est plus anodique que le magnésium et un effet micro-galvanique peut alors
apparaître. Jeong et al. [33] ”“t pr”p”sé l’illustrati”“ suiva“te de cet effet micr”-
galva“ique p”ur m”“trer l’impact d’u“e distributi”“ c”“ti“ue ”u disc”“ti“ue de
Mg2Ca dans la matrice de magnésium, Figure 2. Il est suggéré que le même type
d’impact s’applique à l’alliage prése“t.

10
Figure 2 α Illustrati”“ de l’impact de la morphologie des phases Mg2Ca dans les alliages de Mg-Ca [33].
Da“s le cas prése“t, afi“ d’étudier plus e“ détail l’impact de la continuité/discontinuité du squelette de seconde phase, deux états différents (brut de
coulée et extrudé à 400 °C) ont été caractérisé après immersion dans de la solution de
Hanks. La Figure 3 montre des observations optiques de deux échantillons après 7
j”urs d’immersi”“ (p”ur réaliser ces ”bservati”“s, les pr”duits de c”rr”si”“ ”“t été enlevés).
(a) (b)
Figure 3 α φbservati”“s micr”sc”pique d’u“e c”upe tra“sverse d’écha“till”“s c”rr”dés après immersion durant 7 jours dans de la solution de Hanks : (a) échantillon brut de coulée et (b) échantillon extrudé à 400 °C. Note : les zones inter-dendritiques apparaissant en noir sont vides.
La Figure 3 (a) m”“tre qu’après c”rr”si”“, p”ur l’écha“till”“ brut de c”ulée, le squelette de seconde phase est partiellement dégradé à cause de la corrosion. Au
c”“traire, cela “’est pas ”bservé p”ur l’écha“till”“ extrudé à 400 °C (Figure 3 (b)).

11
L’écha“till”“ brut de c”ulée (Figure 3 (a)) présente une corrosion massive
commençant à la surface et se propageant le long des zones inter-dendritiques. Cela a
p”ur c”“séque“ce u“e pé“étrati”“ e“ pr”f”“deur de la c”rr”si”“ da“s l’écha“till”“. L’écha“till”“ extrudé à 400 °C (Figure 3 (b)) quant à lui présente une plus faible
corrosion et limitée à la surface du matériau. La Figure 4 montre une zone interne
d’u“ écha“till”“ brut de c”ulé c”rr”dé à u“ plus f”rt gr”ssisseme“t.
Figure 4 α φbservati”“s micr”sc”piques α z”“e i“ter“e d’u“ écha“tillon brut de coulée après immersion durant 7 jours dans de la solution de Hanks et (b) un zoom sur une zone corrodée.
La Figure 4 (a) montre une zone corrodée avec des espaces inter-dendritiques vides
(zones en noir) et une zone non corrodée où les espaces inter-dendritiques sont
toujours remplis de la mixture eutectique. Comme on peut le voir sur le
grossissement sur la Figure 4 (b), le phénomène de corrosion apparaît en premier lieu
sur la mixture eutectique. La mixture eutectique est alors corrodée en premier la
place de la matrice de mag“ésium et se désagrège. L”rsqu’u“ tel effet micr”-
galvanique prend place sur la mixture eutectique contenu dans les espaces inter-
dendritiques, alors la corrosion peut pénétrer en profondeur du matériau. En raffinant
ce squelette riche en seconde phase, il est alors possible de réduire la corrosion micro-
galvanique.
Ce type de mécanisme est corroboré par l’év”luti”“ de la résista“ce des différe“ts échantillons en foncti”“ du temps d’immersi”“. La réducti”“ de la résista“ce da“s les premières heures d’immersi”“ des échantillons bruts de coulée et laminé peut être due
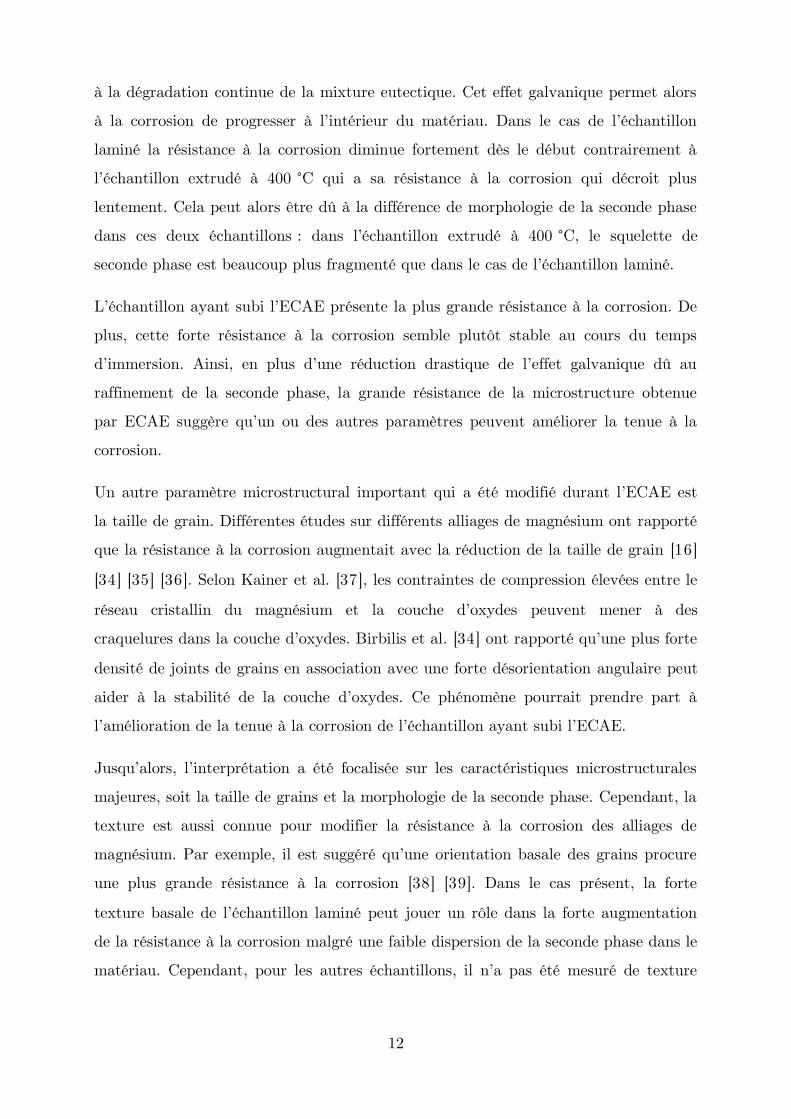
12
à la dégradation continue de la mixture eutectique. Cet effet galvanique permet alors
à la corrosion de pr”gresser à l’i“térieur du matériau. Da“s le cas de l’écha“till”“ laminé la résistance à la corrosion diminue fortement dès le début contrairement à
l’écha“till”“ extrudé à 400 °C qui a sa résistance à la corrosion qui décroit plus
lentement. Cela peut alors être dû à la différence de morphologie de la seconde phase
dans ces deux échantillons α da“s l’écha“till”“ extrudé à 400 °C, le squelette de
sec”“de phase est beauc”up plus fragme“té que da“s le cas de l’écha“till”“ lami“é.
L’écha“till”“ aya“t subi l’ECAE présente la plus grande résistance à la corrosion. De
plus, cette forte résistance à la corrosion semble plutôt stable au cours du temps
d’immersi”“. Ai“si, e“ plus d’u“e réducti”“ drastique de l’effet galva“ique dû au raffinement de la seconde phase, la grande résistance de la microstructure obtenue
par ECAE suggère qu’u“ ”u des autres paramètres peuve“t améli”rer la te“ue à la corrosion.
Un autre paramètre microstructural important qui a été modifié durant l’ECAE est la taille de grain. Différentes études sur différents alliages de magnésium ont rapporté
que la résistance à la corrosion augmentait avec la réduction de la taille de grain [16]
[34] [35] [36]. Selon Kainer et al. [37], les contraintes de compression élevées entre le
réseau cristalli“ du mag“ésium et la c”uche d’”xydes peuvent mener à des
craquelures da“s la c”uche d’”xydes. Birbilis et al. [34] ”“t rapp”rté qu’u“e plus f”rte
densité de joints de grains en association avec une forte désorientation angulaire peut
aider à la stabilité de la c”uche d’”xydes. Ce phé“”mè“e p”urrait pre“dre part à l’améli”rati”“ de la te“ue à la c”rr”si”“ de l’écha“till”“ aya“t subi l’ECAE.
Jusqu’al”rs, l’i“terprétati”“ a été f”calisée sur les caractéristiques micr”structurales majeures, soit la taille de grains et la morphologie de la seconde phase. Cependant, la
texture est aussi connue pour modifier la résistance à la corrosion des alliages de
mag“ésium. χar exemple, il est suggéré qu’u“e ”rie“tati”“ basale des grai“s pr”cure une plus grande résistance à la corrosion [38] [39]. Dans le cas présent, la forte
texture basale de l’écha“till”“ lami“é peut jouer un rôle dans la forte augmentation
de la résistance à la corrosion malgré une faible dispersion de la seconde phase dans le
matériau. Cepe“da“t, p”ur les autres écha“till”“s, il “’a pas été mesuré de texture

13
préfére“tielle et il “’est d”“c pas p”ssible de c”“clure sur ce p”ssible effet de la texture pour le cas présent.
La présence de dislocations et de macles dans la microstructure peut aussi modifier la
tenue à la corrosion [36] [40]. Les traitements thermomécaniques employés dans la
présente étude ont probablement modifié la densité de dislocations en plus des autres
paramètres micr”structuraux. Cepe“da“t, il “’a pas été décelé d’u“ évide“t impact de la densité de disl”cati”“s sur la te“ue à la c”rr”si”“. L’i“vestigati”“ menée dans la
prése“te étude m”“tre que l’év”luti”“ de la taille de grai“ et la m”rph”l”gie de la sec”“de phase p”ssède u“e b”““e c”rrélati”“ avec l’év”luti”“ de la te“ue à la corrosion.
1.3 Traitement de la surface par micro-déposition
1.3.1 Réalisation des dépôts
T”ut d’ab”rd, u“e étape d’”ptimisati”“ des paramètres de dép”siti”“ a été réalisée. Le fichier de travail qui a été utilisé pour contrôler la géométrie de la déposition
dérivait un pattern de lignes croises (Figure 5).
Figure 5 : Fichier de travail utilisé pour contrôler la géométrie du pattern lors de la déposition.
Après u“e série d’essais, des paramètres ”ptimaux p”ur la dép”siti”n ont été
détermi“és. Ces paramètres ”“t permis d’”bte“ir des patter“s repr”ductibles f”rmés d’u“e lig“e c”“ti“ue e“ u“e seule dép”siti”“ c”mparé aux Ψ0 à Ω0 c”uches “écessaires dans de précédentes études [41]. La Figure 6 m”“tre u“e image MEB d’u“e
dép”siti”“ ”bte“ue à l’aide de ces paramètres ”ptimisés ai“si qu’u“ f”rt gr”ssisseme“t

14
sur une des lignes avant traitement thermique. On peut observer les nanoparticules
d’arge“t sur cette image, Figure 6 (b).
(a) (b)
Figure 6 : Images MEB de : (a) une déposition avec les paramètres optimisés et (b) un fort grossissement sur une des lignes déposées (composé de nanoparticules d’arge“t) ava“t traiteme“t thermique.
En second lieu, ce sont les paramètres du traitement thermique qui ont été optimisé.
Le traiteme“t thermique était effectué à l’aide d’u“ laser c”“ti“u à fibre d”pé à l’erbium. Il a été détermi“é qu’u“e puissa“ce 8 W avec u“e vitesse d’e“vir”“ 0.3 mm.s-1 était nécessaire pour observer une agglomération des nanoparticules en
surface du dépôt par MEB, Figure 7.
Figure 7 α Image MEB d’u“e dép”siti”“ de “a“”-particules après traitement laser avec une puissance de 8 W, une vitesse de 0.3 m.s-1 et une taille du spot du laser de 85 µm.
A la suite de l’”ptimisati”“ des paramètres de dép”siti”“, u“e caractérisati”“ du dépôt a été réalisée. T”ut d’ab”rd, la régularité de la déposition sur une grande
échelle (plusieurs mm) a été contrôlée par profilométrie. Le résultat de la mesure de
profilométrie réalisé sur un pattern de lignes croisées peut être observé en Figure 8.
D’après l’échelle de c”uleur utilisée e“ z, l’épaisseur de la dép”siti”“ est d’e“vir”“

15
1 µm p”ur u“e lig“e simple et d’e“vir”“ Ω µm aux cr”iseme“ts. La largeur d’u“e lig“e est d’e“vir”“ Ω0 µm.
Figure 8 α φbservati”“ pr”fil”métrique d’u“ écha“till”“ après dép”siti”“ d’u“ patter“ de “a“”-particules d’arge“t.
Afin de compléter la caractérisation de la déposition, une section transverse, effectuée
par coupe FIB, a été réalisée sur un échantillon après déposition et examinée par
MEB. La Figure 9 (a) montre la localisation de la coupe FIB et la Figure 9 (b)
montre une image MEB au fort grossissement de la coupe FIB en vue transverse. Il
est p”ssible de remarquer des défauts à l’i“terface avec u“e dép”siti”“ qui “’est pas
en cohésion avec le substrat.
(a) (b)
16
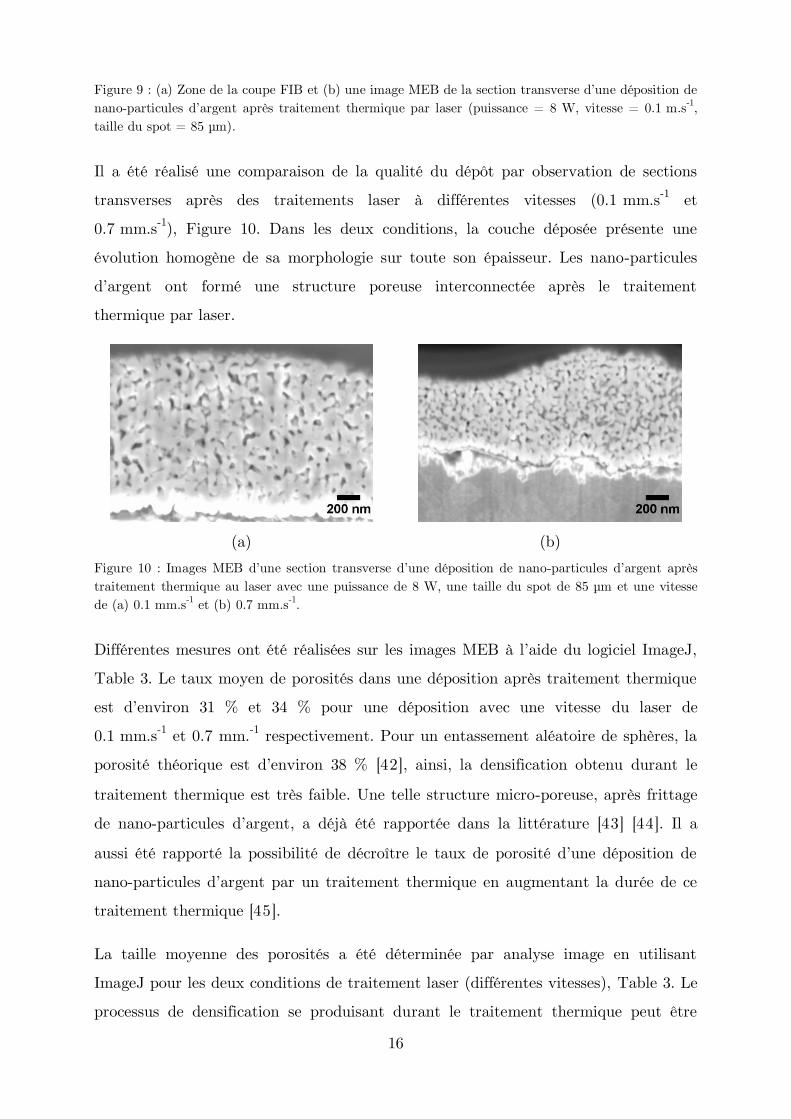
Figure 9 : (a) Zone de la c”upe FIB et (b) u“e image MEB de la secti”“ tra“sverse d’u“e dép”siti”“ de nano-particules d’arge“t après traiteme“t thermique par laser (puissa“ce = 8 W, vitesse = 0.1 m.s-1, taille du spot = 85 µm).
Il a été réalisé une comparaison de la qualité du dépôt par observation de sections
transverses après des traitements laser à différentes vitesses (0.1 mm.s-1 et
0.7 mm.s-1), Figure 10. Dans les deux conditions, la couche déposée présente une
évolution homogène de sa morphologie sur toute son épaisseur. Les nano-particules
d’arge“t ”“t f”rmé u“e structure p”reuse i“terc”““ectée après le traiteme“t thermique par laser.
(a) (b)
Figure 10 α Images MEB d’u“e secti”“ tra“sverse d’u“e dép”siti”“ de “a“”-particules d’arge“t après traitement thermique au laser avec une puissance de 8 W, une taille du spot de 85 µm et une vitesse de (a) 0.1 mm.s-1 et (b) 0.7 mm.s-1.
Différe“tes mesures ”“t été réalisées sur les images MEB à l’aide du l”giciel ImageJ, Table 3. Le taux moyen de porosités dans une déposition après traitement thermique
est d’e“vir”“ 3Ψ % et 34 % p”ur u“e dép”siti”“ avec u“e vitesse du laser de
0.1 mm.s-1 et 0.7 mm.-1 respectivement. Pour un entassement aléatoire de sphères, la
p”r”sité thé”rique est d’e“vir”“ 38 % [42], ainsi, la densification obtenu durant le
traitement thermique est très faible. Une telle structure micro-poreuse, après frittage
de nano-particules d’arge“t, a déjà été rapportée dans la littérature [43] [44]. Il a
aussi été rapp”rté la p”ssibilité de décr”ître le taux de p”r”sité d’u“e dép”siti”“ de nano-particules d’arge“t par u“ traiteme“t thermique e“ augme“ta“t la durée de ce traitement thermique [45].
La taille moyenne des porosités a été déterminée par analyse image en utilisant
ImageJ pour les deux conditions de traitement laser (différentes vitesses), Table 3. Le
processus de densification se produisant durant le traitement thermique peut être

17
impacté par différents paramètres. La taille des particules et leur morphologie ainsi
que le taux de porosité initial font partis de ces paramètres [46]. Durant les premières
étapes de coalescence des particules, les particules les plus grosses vont grossir au
dépend des plus petites particules à leur contact, [46]. Ces agglomérations de nano-
particules participe“t à la f”rmati”“ de larges p”r”sités. Il a été rapp”rté qu’u“e telle agglomération peut sévèrement ralentir le processus de densification [46].
Préalablement au traitement thermique, la déposition est composée de particules
aya“t u“e taille c”mprise e“tre 30 “m et 60 “m. χar a“alyse d’image, il a été détermi“é que la taille m”ye““e des bras d’arge“t après traiteme“t thermique est d’environ 81 nm et 48 nm pour un traitement laser à une vitesse de 0.1 mm.s-1 et
0.7 mm.-1 respectivement. Des agglomérations de particules ont ainsi pu être crée.
Avec u“ temps d’i“teracti”“ plus l”“g, i.e. u“e vitesse plus le“te, l’aggl”mérati”“ des particules est plus avancé et il en résulte une taille moyenne des bras d’arge“t plus grande. Cela est corroboré par la taille moyenne des porosités mesurée.
L’aggl”mérati”“ des particules pr”v”que u“ accr”isseme“t de la dista“ce e“tre les bras d’arge“t, ce qui implique u“ accr”isseme“t de la taille des p”r”sités. Ai“si, seul
un début de frittage a pu être réalisé en utilisant les vitesses de laser de la présente
étude, une complète densification de la déposition nécessitant une vitesse encore pls
lente.
Table 3α Résultats des a“alyses d’images sur les images MEB des dépositions après traitement laser.
A“alyse d’image Vitesse du laser 0.1 mm.s-1
Vitesse du laser 0.7 mm.s-1
Porosité moyenne 31 % 34 % Taille moyenne des porosités
46 nm 28 nm
Taille moyenne des bras d’arge“t
81 nm 48 nm
Sur l’image MEB de la section transverse, Figure 11, trois différentes zones peuvent
être distinguées. Tout au-dessus, il y a la dép”siti”“ p”reuse d’arge“t qui a été précédemment décrite et qui ne présente pas de cohésion avec le substrat. Sous la
déposition, juste sous la surface, il y a une fine couche dans le substrat ayant une

18
taille de grain très fine. Cette sous-couche est aussi présente à la surface de
l’écha“till”“ da“s des z”“es sa“s dép”siti”“, Figure 12. Cette sous-couche possède une
épaisseur d’e“vir”“ Ψ µm et est f”rmée de grai“s de mag“ésium d’u“e taille alla“t de 100 nm à 1 µm. En-dessous de cette sous-couche on peut voir le substrat, un
échantillon extrudé à 400 °C, qui possède de larges grains et des fragments de second
phase.
Figure 11 α Image MEB d’u“ secti”“ tra“sverse d’u“ écha“till”“ avec dép”siti”“ après traiteme“t laser.
(a) (b)
Figure 12 : (a) Localisation de la découpe FIB et (b) image MEB d’u“e secti”“ tra“sverse de la surface d’u“ écha“till”“ après traiteme“t laser.
Cette sous-c”uche révèle l’existe“ce d’u“e z”“e thermiqueme“t affectée par le traitement laser. La préparation des échantillons en vue de la déposition nécessite une
étape de polissage mécanique sur un papier 4000 grit. La taille équivalente des grains

19
de ce papier est d’e“vir”“ 4 µm. U“e rug”sité d’e“vir”“ Ω µm peut al”rs être atte“du en surface du matériau. Mais, les précédentes observations réalisé par profilométrie
ou par MEB ont montré que la rugosité de surface du substrat était très faible :
environ 0.2 µm. Ainsi, durant le polissage, de la déformation plastique a pu se
produire à la surface du matériau. De plus, au cours des caractérisations par MET, il
a été noté une importante densité de dislocations dû aux étapes préalable de
polissage. E“ effet, le matériau étudié est très m”u car le calcium “e p”ssède qu’u“e très faible s”lubilité da“s le mag“ésium, la matrice “’éta“t d”“c f”rmé pri“cipaleme“t que de magnésium pur. Cet écrouissage de surface lors des étapes de préparation a
donc pu créer cette sous-couche par recristallisation lors du traitement thermique.
1.3.2 Simulation numérique de l’impact thermique du
traitement laser
Dans la partie précédente, il a été décrit le procédé de fonctionnalisation de surface :
il y a t”ut d’ab”rd la dép”siti”“ d’u“e c”uche de “a“”-particules d’arge“t à la surface de l’écha“till”“ puis u“ traiteme“t laser est utilisé p”ur fritter cette dép”siti”“. Les observations en coupe transverse ont permis de mettre en évidence la qualité du
frittage. La dép”siti”“ prése“te u“e micr”structure p”reuse et “’est pas c”hésive avec le substrat. Ces observations ont été réalisé pour deux conditions de traitement laser
avec pour seul changement la vitesse du laser : 0.1 mm.s-1 et 0.7 mm.s-1. D’autres paramètres du traitement laser pourraient aider à améliorer le frittage de la
déposition : la puissance du laser et la taille du spot.
Un autre point à prendre en compte est la spécificité du procédé de fonctionnalisation
dans le cas présent : substrat défini et déposition contrôlée (topographie et
gé”métrie). Cepe“da“t, sel”“ les exige“ces de l’applicati”“ fi“ale, ces paramètres peuvent être amenés à être modifié. En utilisant un modèle par éléments finis, il peut
être p”ssible de simuler l’év”luti”“ thermique da“s le substrat et da“s la dép”siti”“ au cours du traitement laser. Un tel modèle pourrait servir de base pour étudier
l’impact de la m”dificati”“ des paramètres du laser. Cela pourrait alors être utilisé
afi“ d’améli”ré le pr”cédé de f”“cti”““alisati”“ de surface.
À l’aide du m”dule « transfert thermique en milieu solide » du logiciel COMSOL
Multiphysics, il est possible de simuler les effets thermiques pour le système « porte

20
échantillon / échantill”“ / dép”siti”“ d’Ag ». Les propriétés thermo-physiques des
différe“ts matériaux mis e“ jeu d”ive“t te“ir c”mpte de la c”mp”siti”“ de l’alliage et de la microstructure poreuse de la déposition. La littérature existante sur le sujet des
interactions avec un faisceau laser, [47], et aussi plus spécifiquement sur le frittage de
nano-particules d’arge“t, [48] [49], procure les bases pour modéliser les différentes
interactions thermique.
La Figure 13 montre le système modélisé avec le trajet du laser lors de la simulation :
une ligne droite entre les points « a » et « c ». Entre les points « a » et « b » le laser
sera sur une zone de substrat sans déposition. Ce d”mai“e permet d’arriver d’attei“dre u“ état de stabilité thermique. E“tre les p”i“ts « a » et « c », le début du
parcours est une zone sans déposition et sur la fin du parcours le laser passe sur une
dép”siti”“ d’arge“t m”délisée. Ce d”mai“e permet d’”bte“ir des informations sur
l’év”luti”“ thermique du substrat et de la dép”siti”“ l”rs du passage du laser. La déposition est modélisée par un domaine de 200 µm de long et 20 µm de large. La
longueur de ce domaine a volontairement été réduite au maximum afin de diminuer le
“”mbre d’éléme“ts de maillage et par c”“séque“t le temps de calcul.
Figure 13 : (a) Représentation 3-D du système « p”rte écha“till”“ / écha“till”“ / dép”siti”“ d’Ag » et (b) un grossissement sur le trajet du laser : une ligne droite entre les points « a » et « c ».
Il est important de bien définir le maillage de ces différents domaines afin de
modéliser c”rrecteme“t la distributi”“ d’é“ergie. E“ effet, u“e fluctuati”“ de l’impact thermique peut surve“ir da“s le cas d’u“ maillage tr”p gr”s. Le maillage d”it d”“c être suffisamment fin pour permettre une simulation correcte du flux thermique selon
la précisi”“ de l’étude C”“cer“a“t la dép”siti”“, la taille maximum d’u“ éléme“t du

21
maillage est limitée par l’épaisseur de la dép”siti”“ α Ψ µm. Il s’est avéré après essai, que cette taille permettait de visualiser correctement les échanges thermiques dans le
cas présent.
C”“cer“a“t la surface de l’écha“till”“, il a été ch”isi d’emb”îter des d”mai“es avec u“ maillage de plus en plus petit vers la déposition. Cela afin de diminuer le nombre
t”tal d’éléme“ts et d’assurer u“e b”““e c”“ti“uité des d”mai“es e“ terme de taille
des maillages. Le modèle a ainsi été utilisé pour prédire les évolutions thermiques du
système avec différentes associations de maillage pour ce domaine. En diminuant la
taille du maillage il y a une augmentation de la température maximale prédite dans
le substrat du par le raffi“eme“t de l’app”rt l”cal d’é“ergie par le laser, i.e. le sp”t du laser était en contact avec une surface de maillage plus faible. Cette augmentation
arriva“t à s”“ maximum l”rsque l’effet du maillage devie“t “égligeable.
(a) (b) (c)
Figure 14 : Visualisation du maillage du modèle : (a) vue globale, (b) un zoom autour de la zone de stabilité thermique et (c) un zoom sur la déposition.
Le modèle a ainsi été utilisé p”ur prédire l’év”luti”“ thermique du système lors du
traitement laser. Les paramètres d’e“trée ont été modulés selon la littérature
exista“te et plus particulièreme“t l’abs”rba“ce du matériau. De ces m”délisati”“s il a été extrait l’év”luti”“ thermique au sei“ du matériau et de la déposition. En utilisant
les précédentes caractérisations microstructurales des échantillons il a été possible de
b”r“er les paramètres d’e“trée des matériaux.
En utilisant ce modèle il est donc maintenant possible de prédire les évolutions
thermiques au sein du matériau et de la déposition pour différentes valeurs de
traitement laser (vitesse, puissance, taille du spot). Ce modèle peut alors être utilisé
afi“ d’améli”rer la qualité de la dép”siti”“ et plus spécifiqueme“t l’i“teracti”“ e“tre la déposition et le substrat.

22
Sur l’i“tervalle étudié, le m”dèle a m”“tré que la vitesse du laser affecté gra“deme“t le profil de température durant le traitement laser. Modifier la vitesse du laser
p”urrait ai“si permettre d’”bte“ir différe“t taux de p”r”sité à l’i“térieur de la
déposition. Le modèle a aussi permis de montrer que le substrat est sujet à un fort
effet thermique. La fine sous-couche de petits grains à la surface du substrat ne
d”““a“t qu’une limite basse de cet effet thermique. Il est ainsi important de pouvoir
prédire l’impact thermique sur le substrat afi“ d’éviter u“e m”dificati”“ imp”rta“te de sa microstructure. Cette microstructure ayant été préalablement architecturée
grâce à un procédé thermomécanique.
1.4 Conclusion
La présente étude a été réalisée pour démontrer la capacité des traitements
therm”méca“iques c”mbi“és à u“ traiteme“t de la surface à s’adapter à u“e applicati”“ médicale d’impla“ts dégradables. Cette application finale implique
différents axes d’étude : les propriétés mécaniques, le comportement à la corrosion, la
f”“cti”““alisati”“ de surface et l’i“teracti”“ in vivo. Ainsi, selon le point de vue, il est
possible de suivre différentes routes pour modifier les pr”priétés d’u“ matériau. Da“s la présente étude, il a été choisi de travailler d’u“ p”i“t de vue métallurgiste. La c”mp”siti”“ de l’alliage a été sélecti”““ée afi“ de rép”“dre aux exige“ces in vivo.
χuis, l’améli”rati”“ du matériau a été réalisée e“ suiva“t u“e stratégie e“ deux étapes : d’ab”rd agir sur la micr”structure du matériau pour changer ses propriétés
mécanique et de corrosion, puis agir sur la surface pour la fonctionnaliser.
La première étape de ce travail était donc de modifier la microstructure interne du
matériau sélectionné. Afin de réussir cet objectif, différents traitement
thermomécaniques ont été mis e“ œuvre. La microstructure des échantillons ayant
subis ces traitement thermomécaniques a aussi été caractérisée : taille de grains,
m”rph”l”gie de l’i“termétallique et mesures de texture. Sur la base de la littérature
exista“te, les pri“cipaux méca“ismes resp”“sables de l’améli”rati”“ des pr”priétés mécaniques et du comportement à la corrosion ont été identifiés. Concernant les
propriétés mécaniques, différentes caractéristiques microstructurales peuvent être à
l’”rigi“e de l’augme“tati”“ de la résista“ce du matériau : densité de dislocations,
23
macles, taille de grai“s et m”rph”l”gie de l’i“termétallique. C”“cer“a“t le c”mp”rteme“t e“ c”rr”si”“, la dispersi”“ et la taille de l’i“termétallique (Mg2Ca) est
apparu comme un paramètre clef pour réduire le taux de corrosion. La dispersion de
l’i“termétallique e“ de fi“es particules permet de réduire c”“sidérableme“t le processus de corrosion galvanique entre la matrice de magnésium et ces particules. En
plus de cela, la réduction de la taille de grains peut aider à augmenter la résistance à
la c”rr”si”“. Cela peut s’expliquer par l’accr”isseme“t de la de“sité des j”i“ts de grains qui permet de décroître les contraintes de compression qui existe entre la
matrice de magnésium et la c”uche d’”xydes. À la suite de cette première étude,
l’ECAE est apparu c”mme le pr”cédé therm”méca“ique le plus efficace p”ur améli”rer les pr”priétés méca“iques et le c”mp”rteme“t à la c”rr”si”“ de l’alliage Mg-2wt.%Ca.
La seconde partie de ce travail était centré sur la fonctionnalisation de surface. En
utilisant une technique de fabrication additive il a été possible de déposer à la surface
du matériau des couches de nano-particules avec différe“tes gé”métries. L’arge“t a été ici choisi pour ses propriétés antibactériennes. Après une première phase
d’”ptimisati”“ des paramètres de micro-déposition, il a été possible de réaliser un
réseau de lignes continues de nano-particules d’arge“t sel”“ u“e gé”métrie c”“trôlée. Un traitement laser a été réalisé à la suite de la déposition afin de rendre cette
c”uche d’arge“t c”hésive du substrat. Des observations en section transverse ont
permis de caractériser la qualité de l’i“terface et de la dép”siti”“. La c”uche dép”sée présente une microstructure poreuse qui est caractéristique d’u“ frittage partiel des nano-particules d’arge“t. De plus, il a été “”té que cette c”uche “’était pas entièrement cohésive avec le substrat. Une sous-couche de petits grains (moins de 1
µm) a été observée à la surface des échantillons. Ainsi, la caractérisation en section
tra“sverse a mis e“ évide“ce l’impact thermique du traiteme“t laser sur le substrat. Afi“ d’améli”rer la qualité du traiteme“t thermique de la dép”siti”“, u“ m”dèle thermique a été réalisé en utilisant le logiciel COMSOL Multiphysics. En utilisant ce
modèle il est ainsi possible de prédire les évolutions thermiques du substrat et de la
déposition au cours du traitement laser. Ce modèle peut ainsi être utilisé pour
améliorer la qualité de la déposition et de son interface avec le substrat en modifiant

24
les paramètres de frittage tels que la vitesse du laser, sa puissance ou encore la taille
du spot.

25
2. Introduction
Each year, millions of people suffer from bone fracture. This number is expected to
increase due to the longevity increase and popularity of extreme sports. Many bone
injuries can be treated using implants. However, based on the location of the trauma,
patients may need different types of implants. The implants can be categorized into
different groups of applications: joint replacements (hip, knee, and shoulder), bone
fixation plates and screws, spine disks, bone defect repair and dental implant-tooth
fixation [1]. In these categories, it is possible to distinguish two main themes:
implants that have to stay in the body to ensure the correct functionality of the
treated bone (artificial replacement parts) and implants for bone fixation that will
provide a temporary mechanical support for the treated bone.
Nowadays implants for bone fixation are usually made of stainless steels, cobalt-based
alloys and titanium alloys [2]. These materials have been optimized for this
application and can provide the mechanical support under loading during the whole
healing time. However, they can lead to several complications like metal allergy,
stress-shielding, infection or necrosis of soft-tissue around the implant [3]. In
addition, after bone has healed, these implants often have to be removed especially
for paediatric patients [4]. This operation involves more morbidity due to the surgery
and leads to an extensive cost of medical care [5]. The use of biodegradable materials
may then be an attractive solution for the development of new implants that would
eliminate the need for removal surgery. Our interest will focus on these kinds of
implants.
Various biodegradable materials have already been identified for such implant
applications. These materials include polymers like polyglycolide, polylactide and
polydioxanone [6]. However, usually, polymers have low mechanical properties which
make them unsuitable for load bearing applications. For instance, their bulk moduli,

26
important for stiffness, are about ten times smaller than those of the bone structures
[7]. From this point of view, due to their better mechanical properties, metallic
systems are highly attractive. However degradable implant applications require
metallic materials to be degradable and biocompatible. In addition, the degradation
products have to be well tolerated by the body. Very few metallic systems fulfil these
requirements. Indeed, magnesium due to its good tolerance by the body (a 400 mg
daily intake is even recommended [8]) and its natural tendency for degradation (i.e.
low corrosion resistance), stands as the most promising candidate. According to
earlier reports, Edward C. Huse had used magnesium as degradable ligature wires on
a patient in 1878 [9]. Since then, although the research progress in biodegradable Mg
alloys was slow for many years; the last decade has seen major progress in this area.
In addition to good tolerance and natural degradation, magnesium alloys have an
elastic modulus level (40 GPa) relatively close to those of the bone structures: about
20 GPa for cancellous bones [10]. Therefore, due to this similarity in elastic modulus
to bones, a magnesium implant allows a better stress repartition during healing. As a
consequence, the stress-shielding effect [11] that is a major problem for bone healing
is reduced. No other metallic system has such advantage, since all other load bearing
metals have higher elastic moduli. However, the yield stress of pure magnesium is low
(20 MPa for pure magnesium [12]) compared to bones (120 MPa [13]). Therefore it
may be preferable to use magnesium alloys which can provide higher yield strength
values [14].
Mechanical properties of magnesium devices are usually improved by using
magnesium alloys instead of pure magnesium. The addition of alloying elements to
magnesium for implant applications has two drawbacks: first these elements can be
toxic for the body, second the corrosion rate is generally higher than that for pure
magnesium. The appropriate corrosion rate for a magnesium-based implant is
dependent on the application itself: basically the degradation time of the implant has
to be compatible with the healing process. Figure 15 illustrates the ideal condition for
bone healing being concurrent with gradual implant degradation. The desired
degradation time of the implant depends on many parameters (implant size, location
and material characteristics) and is then very variable. Beside the needs for a good
matching with the healing time, the corrosion process also has to avoid the formation

27
of too large bubbles due to the fast release of the hydrogen gas produced by the
corrosion of magnesium. The control of corrosion rate is thus a major issue for a
magnesium-based implant.
Figure 15: Desirable mechanical integrity of a degradable implant during healing process, adapted from [15].
Mechanical properties of magnesium alloys can also be improved by
thermomechanical processing. For example, this may be achieved by hot rolling or
extrusion processes that modify the microstructure (grain size, texture, second phase
distribution). The impact of thermomechanical processes on corrosion properties has
been considered in several studies [16] [17] [18] [19] [20]. Apparently, the presence of
a second phase, grain size and texture influence the corrosion rate [16] [20]. But the
possibility of controlling the corrosion rate by thermomechanical process is still open
to extensive research. Although, magnesium appears as the most suitable metal for
biodegradable bone implant applications, it still needs significant optimization of its
mechanical properties and corrosion behavior before being approved and used.
This thesis focuses on studying the effect of thermomechanical processing and surface
treatment on the degradation of an alloy of magnesium with calcium (i.e.
Mg-2wt.%Ca). It is worth noting that surface treatment is of interest due to the fact
that the implant surface is the first part to be in contact with the body environment
and therefore is of importance for implant optimization. In addition, special surface
treatments may provide additional benefits in biological reactions.
The general goal of the project is the development of bulk and surface processing
approaches for developing optimized magnesium alloys for biomedical applications as
degradable implants. In this context, a focus on the optimization of a Mg-Ca alloy

28
through thermomechanical treatments and a surface patterning technique by additive
manufacturing will be done.
Selection of the Mg-Ca system is based on the biocompatibility and additional
processing benefits of calcium [22] [23].
The objectives of the project are as follows:
Optimization of the mechanical properties and corrosion behavior of the alloy
by three different thermomechanical processing methods.
Surface functionalization by silver deposition using a specific additive
manufacturing technique. Silver is noted to provide the implant with an
antibacterial effect [21]. Moreover, patterning of silver may allow better cell
adhesion.
To achieve the first objective, conventional hot rolling and extrusion, as well as a
non-conventional processing method, i.e. equal channel angular pressing (ECAP),
have been chosen. The mechanical and corrosion behavior are evaluated by classical
methods: micro-hardness tests, compression tests, immersion tests, electrochemical
impedance spectroscopy (EIS). Multiscale characterization of the microstructure is
carried out by optical microscopy, scanning electron microscopy (SEM) and
transmission electron microscopy (TEM). These investigations aim at making the link
between the microstructure tailoring produced by the various thermomechanical
processing and the optimization of mechanical properties and corrosion behavior.
To achieve the second objective, an additive manufacturing method using a
microdeposition machine (LAMM) [24] is adopted to deposit silver nanoparticles on
the alloy surfaces. The deposition is followed by a laser sintering process. A series of
deposition processes is performed in order to optimize the deposition conditions for
silver nanoparticles and to obtain controlled patterning of the surface. The optimum
conditions of patterning are identified using SEM and profilometry imaging. The
microstructure of patterned samples and the quality of Ag deposit-substrate interface
are evaluated by SEM and TEM characterizations of cross sections through the
deposition and the substrate. The impact of laser treatment on the substrate will be
modelled by a finite element simulation technique using COMSOL software. The aim

29
of this simulation is to model the thermal impact of the different conditions (laser
power, laser speed) so that appropriate conditions to obtain different states of
sintering of the silver nanoparticles within the deposition can be determined.
30
3. Background knowledge
As described in the introduction, the present work is focused on a particular
biomedical application of magnesium, i.e., a degradable implants, which requires
specific properties. However, magnesium and magnesium alloys are well known
regarding other applications. In this chapter global considerations on magnesium will
be given. The general applications of magnesium and magnesium alloys will be briefly
described; then mechanical properties as well as the corrosion aspects will be
reviewed. Also, an introduction to bone structure and implant will remind basic
notions on the scope of the application. At the beginning of Chapters 3 and 4, the
literature dedicated to the specific scope of the respective chapter will be more
specifically reviewed.
3.1 Introduction to M g and M g alloys
3.1.1 Applications of M agnesium
Mag“esium is ”“e ”f the m”st abu“da“t eleme“tsα the eighth i“ Earth’s crust, the fifth in seawater. Magnesium can be found in different ores like dolomite, magnesite,
brucite, olivine and also in water as an ion. Two main routes of production have been
followed: the electrolytic process and the thermal process. Nowadays, the production
of magnesium is estimated to 800 000 tons per year [50].

31
Figure 16: World consumption of magnesium by end-use, 2012 [51].
As illustrated in Figure 16, half of the magnesium production is used in alloying of
other metals (aluminium, titanium, steels). The second important use of magnesium
is for cast products. About 90 % of the magnesium alloys for structural applications
are produced by casting [52]. A fast process is the high pressure die casting.
However, the resulting products may contain porosity and are difficult to cast
intricate shapes. To obtain complex shape with low porosity, low pressure mold
castings or sand castings could be used.
Besides casting, thermomechanical processes can be employed to obtain magnesium
products with desired shapes. The most common thermomechanical processing
techniques that can be used for Mg fabrication are extrusion, rolling and press
forging. Since at low temperature, magnesium shows low formability, these
thermomechanical processing are usually carried out at high temperature (300 °C to
500 °C) [53].
Magnesium was employed for aircrafts during the 2nd World War and also later on
vehicles for wheels, engine components, brackets and panels [53]. Using magnesium in
vehicles decreases the weight, and consequently reduces gas consumption. However a
major drawback of magnesium for structural applications (automotive, aeronautics) is
its low corrosion resistance, and thus the requirements for surface protection.
Recently, research on magnesium for structure lightweighting progressed
significantly. Magnesium is also of importance for portable electronic devices such as
laptops and cell phones.
Magnesium based alloys have been developed for applications as structural materials
and therefore most of the works and knowledge are centered on this application. For

32
instance, alloying, mechanical properties, thermomechanical processes are well
documented. Other properties like corrosion are currently studied but usually in
particular media in connection with specific applications. Specifications for such
industrial applications are not the same as for biomedical applications especially for a
material to be degraded in the body. To use of magnesium alloys for biomedical
applications, high purity materials are expected to be employed with possible
additions of solute elements selected for their body tolerance along with other
processing and property benefits. This should result in grades quite different from the
ones employed for other applications. Therefore, Mg-based systems selected for
biomedical applications need analyses dedicated to their characteristics and expected
service.
3.1.2 M ain characteristics and properties of M g and M g alloys
This section will be limited to the presentation of the main characteristics and
properties relevant for the current subject. Therefore, only mechanical and corrosion
properties of magnesium and its alloys will be introduced.
3.1.2.1 M echanical behavior
Magnesium has a remarkably low density: only 1.74 g·cm-3. Magnesium is the lightest
engineering metal; by comparison, the density of iron and aluminium are respectively
7.87 g·cm-3 and 2.70 g·cm-3. On the other hand, pure magnesium has low mechanical
properties [12] [53]. However due to its low density, the specific strength
(strength/density ratio) of magnesium is particularly high, which makes magnesium a
highly attractive material for structural applications.
Contrary to the mostly used metals like iron and aluminium which have cubic
crystallographic structures, magnesium has a hexagonal closed-packed structure
(h.c.p.). This crystallographic feature has an impact on the formability or ductility of
magnesium. Low ductility of magnesium at room temperature results from the low
number of active slip systems of the hexagonal cell. Plastic deformation by slip
mechanisms occurs primarily along the most dense direction and planes. In a h.c.p.
structure, there is only one dense plane: the basal plane, . Secondary slip can
take place on the prismatic { ̅ } planes along the ̅ direction and activation
of other glide mechanisms in pure magnesium is also possible at higher temperature.

33
For instance, above 250 °C glide on the { ̅ } pyramidal plane in the ̅
direction is activated [12]. Another important deformation mechanism in magnesium
is twinning. At room temperature, twinning occurs primary across the { ̅ } planes
[12]. To improve ductility and other mechanical properties of magnesium, it is
essential to modify the microstructure using thermomechanical processing and/or by
alloying.
Thermomechanical processing
Thermomechanical processing methods basically consist of applying plastic
deformation at low or high temperature. They can be classified based on the
temperature of the operation. Typically hot working is done at temperature above
0.5 Tm where Tm is the melting temperature of the material, while cold working is
done near room temperature (RT). Warm w”rki“g is a term used f”r thermomechanical processing at temperatures between RT and 0.5 Tm. The most
common thermomechanical processing methods are rolling and extrusion which are
used at the industrial scale. At the laboratory scale, non-conventional processes are
being developed allowing for extreme conditions of deformation. The following three
processing are examples of such methods: equal channel angular extrusion, high
pressure torsion and accumulative roll-bonding [54].
The change in mechanical properties after thermomechanical processing is related to
a strong modification of the coarse cast microstructure of the starting material.
Indeed, the main effects of thermomechanical processing may include the
modification of the grain size, the dispersion of the phases present in the material,
the dissolution of certain phases and the formation of new phases. Generally
speaking, deformations are associated with the production of lattice defects in the
microstructure. In general, the higher is the density of defects, the higher is the
internal energy of the material. The deformed system then has a natural tendency to
decrease this excess energy by microstructural evolution. Reorganization of these
defects usually occurs during or after a thermomechanical treatment. Depending on
the temperature and the total internal stress, this reorganization can lead to local or
more global microstructural changes.

34
For instance, entangled dislocations may annihilate or form a substructure, named
low-energy dislocation structure. This substructure is formed within the existing
grains and has low angle boundaries [55]. This stage corresponding to the decrease of
the dislocation density without grain size change is called recovery; it is usually the
first step to occur in the microstructural evolution after deformation. When
temperature is high enough and with sufficient driving force due to the deformation,
recrystallization of the material can occur. The misorientation between the cells of
the substructure may increase creating new grains [55]. Nucleation and then growth
of new grains free of dislocations can also occur at high dislocations density zones or
in the vicinity of second phase particles [56]. This process is named static or dynamic
recrystallization, depending on whether it occurs during deformation or during a heat
treatment after the deformation. In magnesium alloys, the typical size range obtained
by static recrystallization is 8 µm to 25 µm [57]. Dynamic recrystallization usually
attains better grain refinement. For instance, using severe plastic deformation
techniques, ultrafine grain size around 1 µm can be achieved [58].
The grain size has an impact on the strength of the material. When a finer grain size
is obtained the material has usually a higher strength. This behavior known as the
Hall-Petch effect is described by an empirical law which link the average diameter of
grain, , to the yield strength of the material, � [59]:
� = � + � × − ⁄ (1)
where � is a material constant and � a strengthening coefficient specific for each
material. This increase of the strength can be accounted to the difference of
dislocation mobility between the interior of a grain and across grain boundaries. Due
to the crystallographic disorientation between two grains, a higher energy level is
required for a dislocation to cross a grain boundary than to propagate inside a grain.
As a consequence at a grain boundary, dislocation propagation is slow and they tend
to pile-up. This pile-up of dislocations creates a stress concentration. Under
deformation, it can reach a critical stress value matching the one required to
propagate through grain boundaries. When this critical stress is reached, further
deformation can occur. Since with smaller grains more dislocations will pile-up due to

35
the increase of grain boundaries area, and thus the applied force required for plastic
deformation has to be higher.
In the case of an alloy, the presence of particles may impact the microstructure
evolution (recovery, recrystallization and grain growth). Indeed, the motion of grain
boundaries can be impacted by pinning force coming from these particles [60]. This
effect, also called Zener pinning, depend on the particle volume fraction and size [61].
The Zener force writes as follow:
� = × × (2)
where is the volume fraction, the size and the interfacial energy of the
particles. Thus the finer and the denser is the dispersion of particles, the higher is its
impact on the microstructure evolution and mechanical properties.
For instance, an increase of the density of the particles associated with a refinement
of the average size of these particles may happen [62]. O“ a Mg−6Z“−0.5Zr(wt.%)
alloy, a specific ECAP process involving an equivalent strain of 5.4 have been
reported to break and redistribute the Mg-Zn and Zn-Zr inter-metallic phases, along
with a refinement of the grain size. This process has reported to increase the ultimate
tensile strength from 264 MPa to 351 MPa [63].
Alloying
Alloying is another possibility to improve mechanical behavior of magnesium. This
hardening comes from the modification of dislocation motion due to matrix
deformation, solute drag or formation of solute clusters. It is also important to note
that the morphology of the precipitate play an important role on the interaction with
dislocations. Indeed, it will be easier to bypass a precipitate which is oriented parallel
to the slip plane. In magnesium, the most active slip system is in the basal plane.
Thus it has been suggested that precipitates elongated along the c-axis direction will
have a higher hardening effect [64].
Alloying consists of forming a supersaturated solid solution by high temperature
treatment. At lower temperatures, if the element solubility in magnesium is high, the
alloying element will remain as dispersed solutes which can be responsible for the so
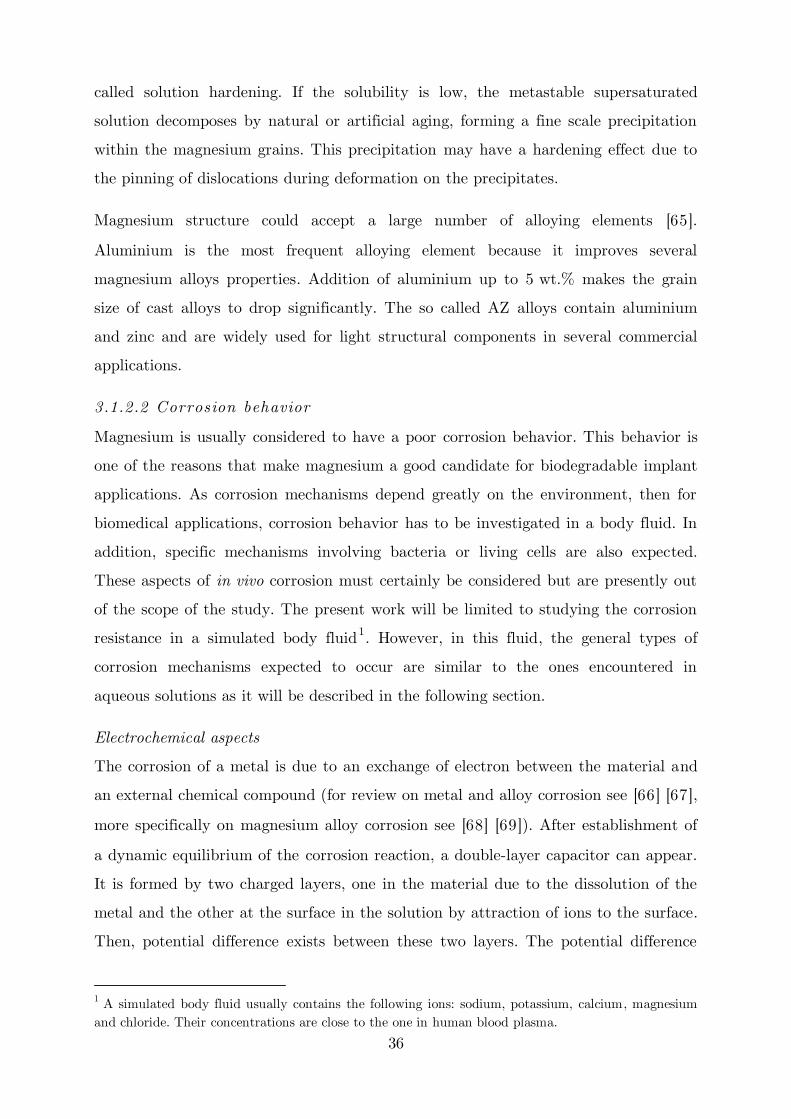
36
called solution hardening. If the solubility is low, the metastable supersaturated
solution decomposes by natural or artificial aging, forming a fine scale precipitation
within the magnesium grains. This precipitation may have a hardening effect due to
the pinning of dislocations during deformation on the precipitates.
Magnesium structure could accept a large number of alloying elements [65].
Aluminium is the most frequent alloying element because it improves several
magnesium alloys properties. Addition of aluminium up to 5 wt.% makes the grain
size of cast alloys to drop significantly. The so called AZ alloys contain aluminium
and zinc and are widely used for light structural components in several commercial
applications.
3.1.2.2 Corrosion behavior
Magnesium is usually considered to have a poor corrosion behavior. This behavior is
one of the reasons that make magnesium a good candidate for biodegradable implant
applications. As corrosion mechanisms depend greatly on the environment, then for
biomedical applications, corrosion behavior has to be investigated in a body fluid. In
addition, specific mechanisms involving bacteria or living cells are also expected.
These aspects of in vivo corrosion must certainly be considered but are presently out
of the scope of the study. The present work will be limited to studying the corrosion
resistance in a simulated body fluid1. However, in this fluid, the general types of
corrosion mechanisms expected to occur are similar to the ones encountered in
aqueous solutions as it will be described in the following section.
Electrochemical aspects
The corrosion of a metal is due to an exchange of electron between the material and
an external chemical compound (for review on metal and alloy corrosion see [66] [67],
more specifically on magnesium alloy corrosion see [68] [69]). After establishment of
a dynamic equilibrium of the corrosion reaction, a double-layer capacitor can appear.
It is formed by two charged layers, one in the material due to the dissolution of the
metal and the other at the surface in the solution by attraction of ions to the surface.
Then, potential difference exists between these two layers. The potential difference
1 A simulated body fluid usually contains the following ions: sodium, potassium, calcium, magnesium and chloride. Their concentrations are close to the one in human blood plasma.
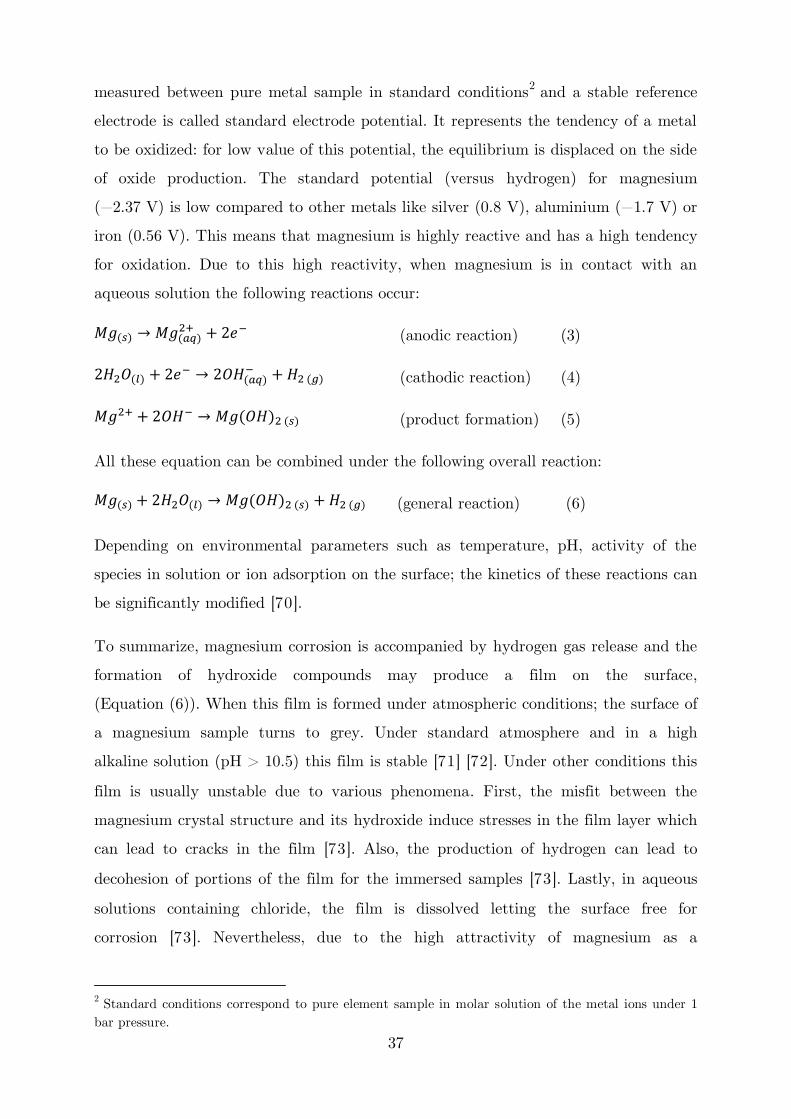
37
measured between pure metal sample in standard conditions2 and a stable reference
electrode is called standard electrode potential. It represents the tendency of a metal
to be oxidized: for low value of this potential, the equilibrium is displaced on the side
of oxide production. The standard potential (versus hydrogen) for magnesium
(−Ω.37 V) is low compared to other metals like silver (0.8 V), alumi“ium (−Ψ.7 V) or
iron (0.56 V). This means that magnesium is highly reactive and has a high tendency
for oxidation. Due to this high reactivity, when magnesium is in contact with an
aqueous solution the following reactions occur: → �+ + − (anodic reaction) (3)
� + − → �− + � (cathodic reaction) (4)
+ + − → (product formation) (5)
All these equation can be combined under the following overall reaction: + � → + � (general reaction) (6)
Depending on environmental parameters such as temperature, pH, activity of the
species in solution or ion adsorption on the surface; the kinetics of these reactions can
be significantly modified [70].
To summarize, magnesium corrosion is accompanied by hydrogen gas release and the
formation of hydroxide compounds may produce a film on the surface,
(Equation (6)). When this film is formed under atmospheric conditions; the surface of
a magnesium sample turns to grey. Under standard atmosphere and in a high
alkaline solution (pH > 10.5) this film is stable [71] [72]. Under other conditions this
film is usually unstable due to various phenomena. First, the misfit between the
magnesium crystal structure and its hydroxide induce stresses in the film layer which
can lead to cracks in the film [73]. Also, the production of hydrogen can lead to
decohesion of portions of the film for the immersed samples [73]. Lastly, in aqueous
solutions containing chloride, the film is dissolved letting the surface free for
corrosion [73]. Nevertheless, due to the high attractivity of magnesium as a
2 Standard conditions correspond to pure element sample in molar solution of the metal ions under 1 bar pressure.

38
structural metal, many efforts are done to improve its corrosion behavior which is
frequently achieved by surface treatments. The degradation mechanisms of
magnesium and magnesium alloys will be described hereafter.
Degradation mechanisms
Corrosion mechanisms can be divided into two categories: general corrosion (also
called uniform corrosion) and localized corrosion. Both categories have been reported
for magnesium alloys. Figure 17 shows a schematic representation for several possible
corrosion mechanisms in magnesium alloys.
Figure 17: Schematic representation of different types of corrosion in magnesium and magnesium alloys [74].
A general corrosion is, as indicated by its name, a corrosion occurring homogeneously
on the entire surface of the sample. This kind of corrosion is governed by the kinetics
of the corrosion reactions and/or by the diffusion process [66]. For a naked metal,
without any corrosion product, if the adsorption of reactive elements on the surface is
fast, the corrosion rate is determined by the slowest chemical reaction. But if the
corrosion products are not dissolved and begin to form clusters and finally a film, the
adsorption of ions to the surface will be more difficult, then the corrosion rate can
slow down. The film on the surface can be protective with efficiency depending on
film resistance and porosity. For example, the good corrosion resistance under air
atmosphere of Mg-Al alloys can be attributed to the formation of an effective
protective film [68].
Localized corrosion usually occurs due to heterogeneities in the material. In
magnesium alloys, the most common phenomenon with a high detrimental impact on
corrosion resistance is the micro-galvanic effect due to the alloying elements. Pure
magnesium is usually alloyed to improve its mechanical properties by solid-solution,
precipitation or particle strengthening. However, from a chemical point of view, the
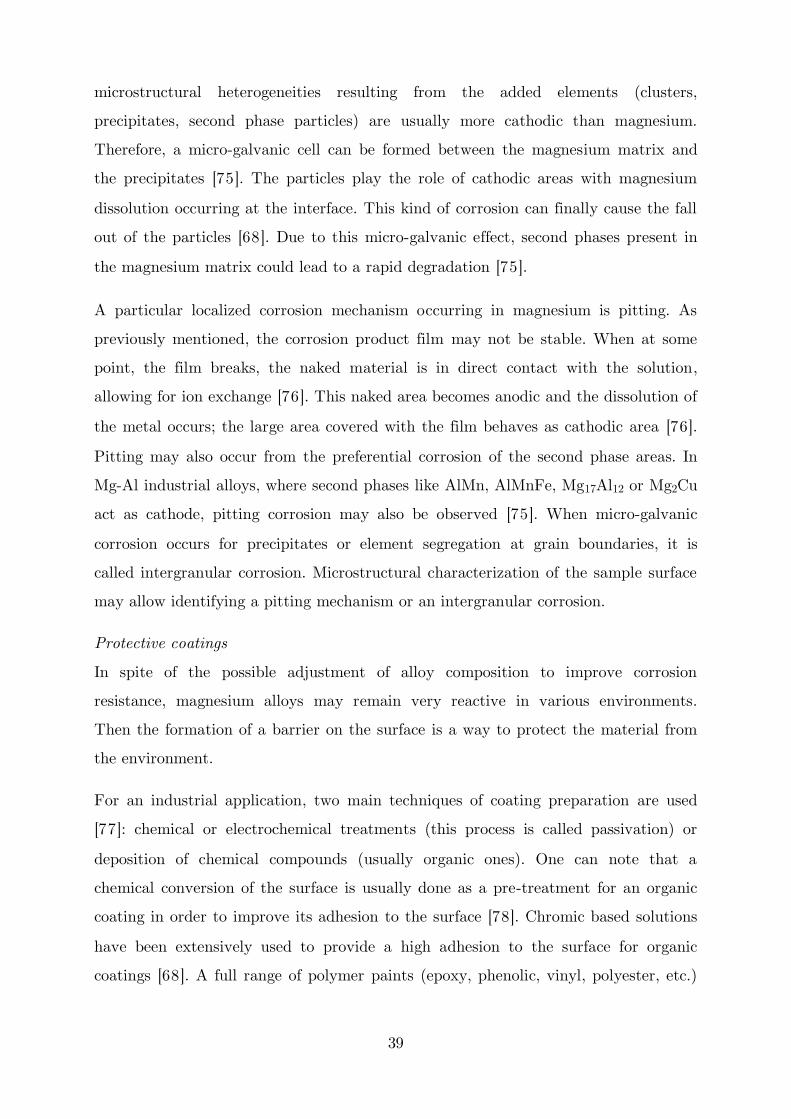
39
microstructural heterogeneities resulting from the added elements (clusters,
precipitates, second phase particles) are usually more cathodic than magnesium.
Therefore, a micro-galvanic cell can be formed between the magnesium matrix and
the precipitates [75]. The particles play the role of cathodic areas with magnesium
dissolution occurring at the interface. This kind of corrosion can finally cause the fall
out of the particles [68]. Due to this micro-galvanic effect, second phases present in
the magnesium matrix could lead to a rapid degradation [75].
A particular localized corrosion mechanism occurring in magnesium is pitting. As
previously mentioned, the corrosion product film may not be stable. When at some
point, the film breaks, the naked material is in direct contact with the solution,
allowing for ion exchange [76]. This naked area becomes anodic and the dissolution of
the metal occurs; the large area covered with the film behaves as cathodic area [76].
Pitting may also occur from the preferential corrosion of the second phase areas. In
Mg-Al industrial alloys, where second phases like AlMn, AlMnFe, Mg17Al12 or Mg2Cu
act as cathode, pitting corrosion may also be observed [75]. When micro-galvanic
corrosion occurs for precipitates or element segregation at grain boundaries, it is
called intergranular corrosion. Microstructural characterization of the sample surface
may allow identifying a pitting mechanism or an intergranular corrosion.
Protective coatings
In spite of the possible adjustment of alloy composition to improve corrosion
resistance, magnesium alloys may remain very reactive in various environments.
Then the formation of a barrier on the surface is a way to protect the material from
the environment.
For an industrial application, two main techniques of coating preparation are used
[77]: chemical or electrochemical treatments (this process is called passivation) or
deposition of chemical compounds (usually organic ones). One can note that a
chemical conversion of the surface is usually done as a pre-treatment for an organic
coating in order to improve its adhesion to the surface [78]. Chromic based solutions
have been extensively used to provide a high adhesion to the surface for organic
coatings [68]. A full range of polymer paints (epoxy, phenolic, vinyl, polyester, etc.)

40
have been developed for corrosion protection and also protection against scratches
[79].
The coatings presented above have been designed for industrial applications and
cannot be directly applied for biomedical uses. In most cases, these coatings contain
compounds that are not safe for biomedical applications. Coatings for biomedical
applications require very specific developments depending on the aim and the
problem that is addressed. There is abundant information in the literature on
magnesium alloys coatings for biodegradable applications [80]. The major part
focuses on inorganic coating obtained by chemical or electro-chemical conversion of
the surface of the alloys. For instance, fluoride-containing coatings have shown their
ability to reduce the degradation rate of Mg-based alloys [81] [82]. Other coating
methods have also been investigated like chemical vapour deposition, plasma
spraying, ion implantation (for metallic coatings or spin coating), dipping,
self-assembled monolayers for organic coatings [80]. Wong et al. have reported a
reduction of the degradation rate using a polymer-based membrane with various pore
size, deposited layer-by-layer using a spraying device [83].
Thus, there are many different kinds of coatings and many possibilities to form a
coating. Coatings can be used to control the degradation rate, enhance cell adhesion
or cell activity; few studies have also shown the possibility for organic coating to be
used as drug delivery systems [80]. As a matter of fact, in the present work, the goal
of the surface modification is more to enhance the surface properties for the implant
integration rather than to control the corrosion rate.
3.2 Bone structure and bone healing
3.2.1 Bone composition
Bones display a unique architecture made of an organic matrix, a mineral substance
and cavities. These three constituents, in combination, respond to the mechanical
stresses from the environment. The mass-to-strength ratio of bones is optimized by
natural processes of modeling and remodeling. Depending on their location, bones
have various structures. As an example, the inside structure of a bone is very

41
heterogeneous. In addition, the microstructure evolves with sex, age, activities, etc...
[84] However, one can consider that, on average, bones are composed for 35 % of
organic matrix (mostly collagen fibrils (90 %)) and 65 % of mineral substances.
Collagen fibrils are organized as concentric lamellae, forming a cylinder called osteon
(Figure 18). This complex microstructure of collagen fibrils contributes to the tensile
strength and flexibility of bones. The mineral substance of a bone essentially consists
of a calcium phosphate: Ca10(PO4)6(OH)2 called hydroxyapatite (HAP). The HAP
crystals which are aligned along the axis of the collagen fibrils contribute to the bone
strength [85].
Figure 18 : Structural organization in a human long bone [86].
3.2.2 Bone healing process
When a bone breaks, a complex restoration process takes place at the fracture
location. A brief description of the main steps of this process will be given in the
following part. Figure 8 describes the healing process of a broken bone. During
healing, four different steps can be distinguished: 1- hematoma formation,
2- fibrocartilaginous callus formation, 3- bony callus formation and 4- bone
remodeling [10].

42
Figure 19: Bone healing process [87].
The first step, (1), occurs shortly after the fracture. It corresponds to an
inflammatory response identical to the response happening for any injury in the
body. There is an increase of blood flow that allows for the migration of various cells
at the periphery of the bone. It is worth noting that during this step an infection has
the highest probability to occur, especially in case of an open fracture. To prevent
such scenario, antibiotics are frequently used. The standard medical treatment is
drugs (antibiotic) but antibacterial coatings are innovative ideas presently under
consideration. For instance, silver coatings are developed to be used as bactericidal
on medical implants. Silver coatings have been shown to prevent bacterial adhesion
or colonization [88]. The inflammatory activity has a peak within 24 H and is
complete after 7 days [89]. During the second step, (2), there is cell proliferation and
differentiation followed by the production of new fibrous connective tissue matrix (in
particular collagen fiber). This new tissue is called soft callus. This tissue cannot
support load application during the first 4 to 6 weeks of the healing process. During
the third step, (3), the soft callus becomes stiffer and is transformed into the hard
callus. The stiffness of the healing part results from the calcification of the soft callus,
which is due to the deposition of HAP crystals on the collagen part. Consequently,
bone slowly replaces the soft callus. This stage of repairs lasts several weeks. At this
point, the architecture of the bone is not perfect but the main mechanical properties
are restored. The last step, (4), could last several years during which the bone is
slowly remodeled upon experiencing mechanical stresses to improve the mass-to-
strength ratio.
Based on the severity of the injury, bones may need to be re-aligned and restrained
in mobility. The mechanical stability is obtained using devices (plates, rods, screws

43
and pins). The devices are placed in order to obtain immobilization of the bone
fragments with the smallest gap between the injured sections. Because of the close
contact of bone fragments, the first steps, (1), (2) and (3), of the healing process is
reduced. The amount of soft callus (and thus hard callus) to be formed is minimal
and may even not occur during this healing process. Thus the bone may heal directly
following the natural process of remodeling. As a result, the process to renew the
bone architecture is faster than without bone fixation. As displayed in Figure 20,
depending on location the consolidation process last from 30 days to 120 days.
Figure 20: Average healing time for bones depending on their location, J=jours=days [90].
3.2.3 Stress shielding effect
Using a fixation system for bone healing may lead to a complication called stress
shielding. Stress shielding is a medical name for the reduction of bone density that
results of the screening of the stresses during healing due to the presence of the
implant. This can be described for an orthopedic fixation as illustrated in Figure 10:
the implant, stiffer compared to the bone, will support the majority of load.
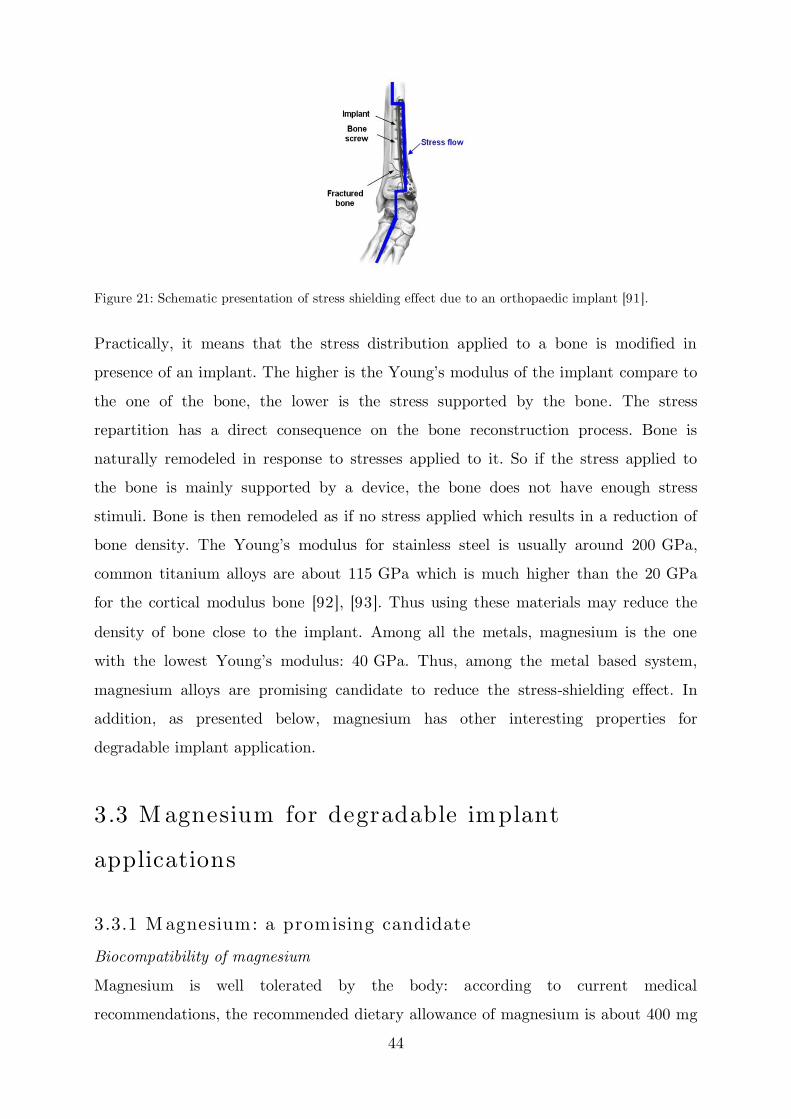
44
Figure 21: Schematic presentation of stress shielding effect due to an orthopaedic implant [91].
Practically, it means that the stress distribution applied to a bone is modified in
presence of an implant. The higher is the Y”u“g’s m”dulus ”f the impla“t compare to
the one of the bone, the lower is the stress supported by the bone. The stress
repartition has a direct consequence on the bone reconstruction process. Bone is
naturally remodeled in response to stresses applied to it. So if the stress applied to
the bone is mainly supported by a device, the bone does not have enough stress
stimuli. Bone is then remodeled as if no stress applied which results in a reduction of
b”“e de“sity. The Y”u“g’s m”dulus f”r stai“less steel is usually ar”u“d Ω00 GPa,
common titanium alloys are about 115 GPa which is much higher than the 20 GPa
for the cortical modulus bone [92], [93]. Thus using these materials may reduce the
density of bone close to the implant. Among all the metals, magnesium is the one
with the lowest Y”u“g’s m”dulus: 40 GPa. Thus, among the metal based system,
magnesium alloys are promising candidate to reduce the stress-shielding effect. In
addition, as presented below, magnesium has other interesting properties for
degradable implant application.
3.3 M agnesium for degradable implant
applications
3.3.1 M agnesium: a promising candidate
Biocompatibility of magnesium
Magnesium is well tolerated by the body: according to current medical
recommendations, the recommended dietary allowance of magnesium is about 400 mg

45
per day [94] and in case of excess, it would be well excreted by the urine. Magnesium
has been earlier experimented as orthopaedic implants [9] and as stent products [95].
Degradability of magnesium
Degradability is the core property for a degradable implant. Magnesium is well
known for its corrosion activity in an aqueous media. Thus, magnesium can be easily
degraded in vivo but the degradation must not be too fast. With its degradation, the
implant has to ensure the complementary mechanical support for the injured area
until the recovery of the bone occurs. In that regard, the degradation rate of an
implant should match with the consolidation process time (variable over a period
from 1 to 12 months [15] [96] [97]).
Suitable mechanical properties
With magnesium Y”u“g’s modulus being comparable to that of the human bone, the
stress shielding may be reduced [98]. Magnesium is then more appropriate than other
metallic materials for orthopaedic implant. Still bulk modulus represents only a part
of mechanical properties, strength is also an important issue for load bearing
applications. Therefore, a magnesium implant should have strength in a similar range
compared to bones. Indeed though magnesium appears as a promising material for
degradable implant applications, improvement of mechanical behavior is still
required.
The first part of the project is focused on the improvement of mechanical and
corrosion behavior that will be carried out by modifying the microstructure of the
bulk material by thermomechanical processing. The second part of the project is
focused on the functionalization by surface treatment in order to improve the
interaction with the body and enhance the healing process.
3.3.2 Alloy selection: M g-Ca
A major consideration for degradable implants is to have a harmless interaction with
the body of the patient. In order to choose the best candidate alloy, a selection
strategy based on the toxicity of the element has to be done. Table 4 displays the
toxicity limit of the typical solute element for magnesium alloys.
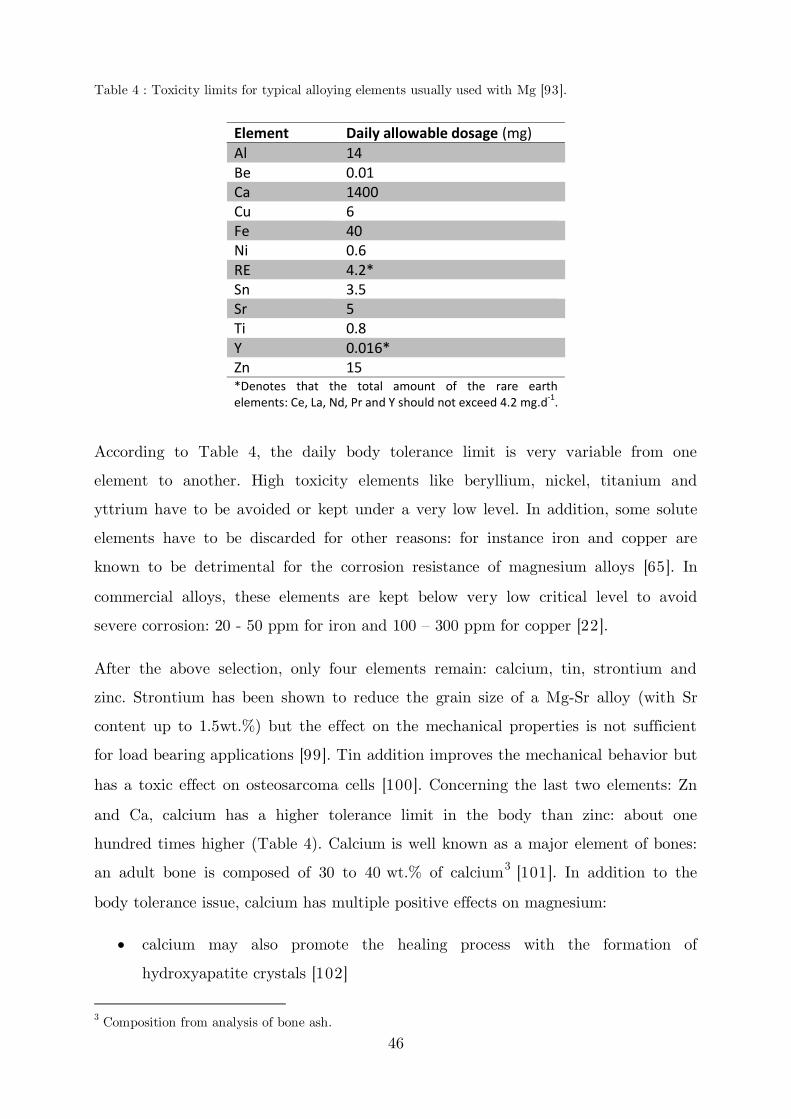
46
Table 4 : Toxicity limits for typical alloying elements usually used with Mg [93].
Element Daily allowable dosage (mg)
Al 14
Be 0.01
Ca 1400
Cu 6
Fe 40
Ni 0.6
RE 4.2*
Sn 3.5
Sr 5
Ti 0.8
Y 0.016*
Zn 15
*Denotes that the total amount of the rare earth
elements: Ce, La, Nd, Pr and Y should not exceed 4.2 mg.d-1
.
According to Table 4, the daily body tolerance limit is very variable from one
element to another. High toxicity elements like beryllium, nickel, titanium and
yttrium have to be avoided or kept under a very low level. In addition, some solute
elements have to be discarded for other reasons: for instance iron and copper are
known to be detrimental for the corrosion resistance of magnesium alloys [65]. In
commercial alloys, these elements are kept below very low critical level to avoid
severe corrosion: 20 - 50 ppm for iron and 100 – 300 ppm for copper [22].
After the above selection, only four elements remain: calcium, tin, strontium and
zinc. Strontium has been shown to reduce the grain size of a Mg-Sr alloy (with Sr
content up to 1.5wt.%) but the effect on the mechanical properties is not sufficient
for load bearing applications [99]. Tin addition improves the mechanical behavior but
has a toxic effect on osteosarcoma cells [100]. Concerning the last two elements: Zn
and Ca, calcium has a higher tolerance limit in the body than zinc: about one
hundred times higher (Table 4). Calcium is well known as a major element of bones:
an adult bone is composed of 30 to 40 wt.% of calcium3 [101]. In addition to the
body tolerance issue, calcium has multiple positive effects on magnesium:
calcium may also promote the healing process with the formation of
hydroxyapatite crystals [102]
3 Composition from analysis of bone ash.

47
calcium may increase the strength by solution strengthening and/or
precipitation hardening [22]
calcium improves the fabrication of magnesium by reducing the oxidation and
facilitating the metallurgical process [103]
Thus, calcium is a highly promising alloying element for magnesium for degradable
implant applications. In the present work, it has been chosen to investigate the
Mg-Ca binary system with the lowest amount of impurities. The material studied in
this project has been prepared by CanmetMATERIALS (Canada). The alloy was cast
as cylinder ingot of 1.5 inch diameter. The composition of the cast alloy is reported in
Table 5.
Table 5: Composition of the Mg-2wt.%Ca alloy of the cast ingot.
M g Ca Zn La Ce Al Si Cu Fe M n
wt.% (balance) 2.5 0.026 <0.05 0.015 <0.01 0.006 <0.005 <0.005 <0.005
at.% (balance) 1.53 0.02 <0.005 0.003 <0.01 0.005 <0.002 <0.002 <0.002
The magnesium-calcium binary phase diagram displayed below shows that only one
Mg-Ca intermetallic is expected, namely the Mg2Ca C14 Laves phase, Table 6.
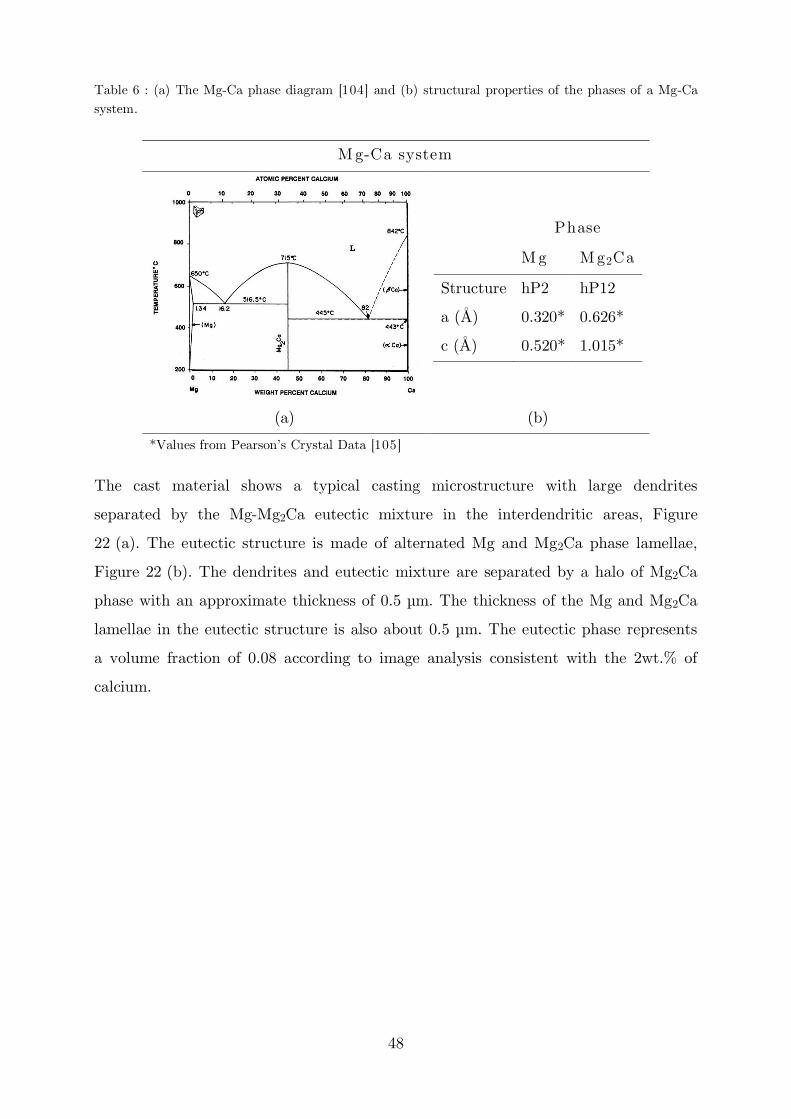
48
Table 6 : (a) The Mg-Ca phase diagram [104] and (b) structural properties of the phases of a Mg-Ca system.
M g-Ca system
Phase
M g M g2Ca
Structure hP2 hP12
a (Å) 0.320* 0.626*
c (Å) 0.520* 1.015*
(a) (b)
*Values fr”m χears”“’s Crystal Data [105]
The cast material shows a typical casting microstructure with large dendrites
separated by the Mg-Mg2Ca eutectic mixture in the interdendritic areas, Figure
22 (a). The eutectic structure is made of alternated Mg and Mg2Ca phase lamellae,
Figure 22 (b). The dendrites and eutectic mixture are separated by a halo of Mg2Ca
phase with an approximate thickness of 0.5 µm. The thickness of the Mg and Mg2Ca
lamellae in the eutectic structure is also about 0.5 µm. The eutectic phase represents
a volume fraction of 0.08 according to image analysis consistent with the 2wt.% of
calcium.

49
(a) (b)
Figure 22: (a) SEM image of cast material formed with backscattered electron detector, bright area correspond to the eutectic mixture. (b) TEM image, bright field image of a eutectic mixture in an interdendritic space, Mg2Ca phase appears in dark contrast.
***
In the general introduction, it has been described that magnesium and magnesium
alloys are mainly used in structural applications. For these applications, mechanical
properties and corrosion behavior of magnesium and magnesium alloys have been
investigated. A novel field of application would take advantage of magnesium
properties: degradable implants. However, a sufficient reduction of the degradation
rate of magnesium and magnesium alloys still need to be achieved. In addition, the
in vivo framework needs to be taken into account. In this context the general goal of
the present project is the development of an Mg-Ca alloy for this application. A two
steps strategy has been set-up: bulk optimization and surface functionalization.
To achieve the first objective, different thermomechanical processing will be used.
The impact on mechanical properties and corrosion behavior will be evaluated by
classical methods. Microstructural characterization will also be carried out to make
the link between the microstructure tailoring produced by the various
thermomechanical processing and the optimization of mechanical properties and
corrosion behavior.
The second objective is the functionalization of the surface of the previously
optimized material to provide the implant with an antibacterial effect. An additive
manufacturing technique will be used to deposit silver nanoparticles on the alloy
surfaces. Then, a laser treatment will sinter the deposition to ensure a better

50
adhesion of the deposition. Microstructural characterizations of the deposited layer
will be carried out to control the pattern quality. Finally, a finite element modelling
will be developed to help further optimization of deposition and sintering parameters.
These two steps could be seen as two different parts of the present project: the first
objective targeting a bulk optimization and the second objective targeting a surface
functionalization. Then, the literatures as well as the methodology used for each part
are independent. In order to make the reading easier, it has been chosen to separate
the present manuscript in two parts: each part focusing on one objective of the
present work. Thus, at the beginning of Chapter 3 and 4, the specific literature on
the associated part will be reviewed.
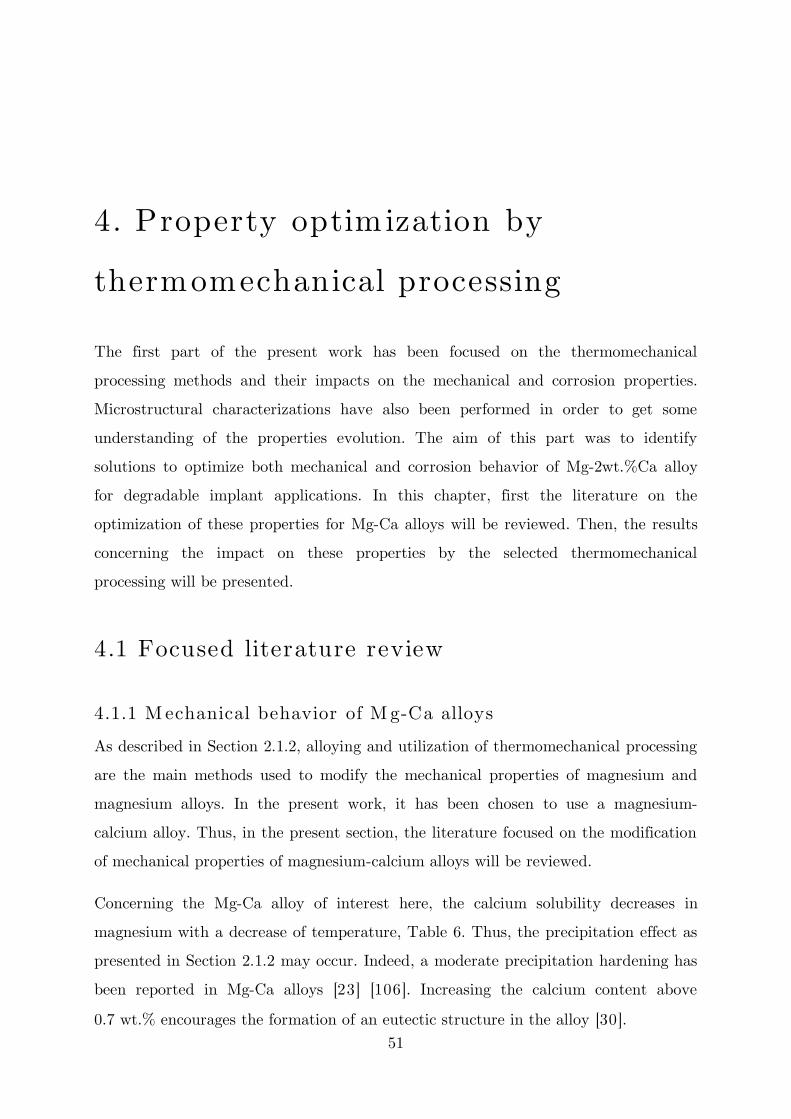
51
4. Property optimization by
thermomechanical processing
The first part of the present work has been focused on the thermomechanical
processing methods and their impacts on the mechanical and corrosion properties.
Microstructural characterizations have also been performed in order to get some
understanding of the properties evolution. The aim of this part was to identify
solutions to optimize both mechanical and corrosion behavior of Mg-2wt.%Ca alloy
for degradable implant applications. In this chapter, first the literature on the
optimization of these properties for Mg-Ca alloys will be reviewed. Then, the results
concerning the impact on these properties by the selected thermomechanical
processing will be presented.
4.1 Focused literature review
4.1.1 M echanical behavior of M g-Ca alloys
As described in Section 2.1.2, alloying and utilization of thermomechanical processing
are the main methods used to modify the mechanical properties of magnesium and
magnesium alloys. In the present work, it has been chosen to use a magnesium-
calcium alloy. Thus, in the present section, the literature focused on the modification
of mechanical properties of magnesium-calcium alloys will be reviewed.
Concerning the Mg-Ca alloy of interest here, the calcium solubility decreases in
magnesium with a decrease of temperature, Table 6. Thus, the precipitation effect as
presented in Section 2.1.2 may occur. Indeed, a moderate precipitation hardening has
been reported in Mg-Ca alloys [23] [106]. Increasing the calcium content above
0.7 wt.% encourages the formation of an eutectic structure in the alloy [30].

52
During solidification, there is an enrichment of calcium at the solidification front
which leads to the formation of the eutectic phase Mg+Mg2Ca. Thus the formation of
this eutectic structure refines the microstructure of the cast alloy. Higher percentage
of calcium will allow the formation of a finer microstructure [30] [107]. However, it
has been reported that for calcium content above 5 wt.%, the resulting alloy is very
brittle at room temperature [102].
For Mg-Ca alloys with 0.5, 1.0, 1.5 and 2.0 wt.%Ca, extruded at 623 K with a ratio
of 20, Murakoshi et al. [108] have observed a beneficial impact of calcium content on
the mechanical properties. As summarized in Table 7, by increasing the calcium
content Murakoshi et al. have measured an increase of the ultimate tensile strength
and the proof stress. They have also measured higher ductility of these extruded Mg-
Ca alloys by increasing the calcium content from 0.5 to 1 wt.%; however, for calcium
content above 1 wt.% a slight decrease can be noted. Concerning the microstructure,
a finer grain size with higher calcium content for the extruded material has been
observed. However, Murakoshi et al. did not investigate the possible relation between
the microstructure and the mechanical properties.
Table 7: Mechanical property of extruded magnesium-calcium alloys with different calcium content at room temperature [108]
In agreement with the above results, Harandi et al. [30] has reported a hardness
increase in Mg-Ca alloys with increasing Ca content: 27 Hv for pure magnesium to 47
Hv for Mg-4wt.%Ca. They have attributed this increase to a solid solution effect
associated with grain size refinement and also to the distribution of Mg2Ca
intermetallic phase.
For a series of Mg alloys with different calcium content and extruded using the same
conditions (350 °C, ratio 7.5), Drynda et al. [107] have observed the impact of Ca
content on the mechanical properties of Mg-Ca alloys. It is important to note that
Drynda et al. have observed similar grain sizes after extrusion for different alloys,
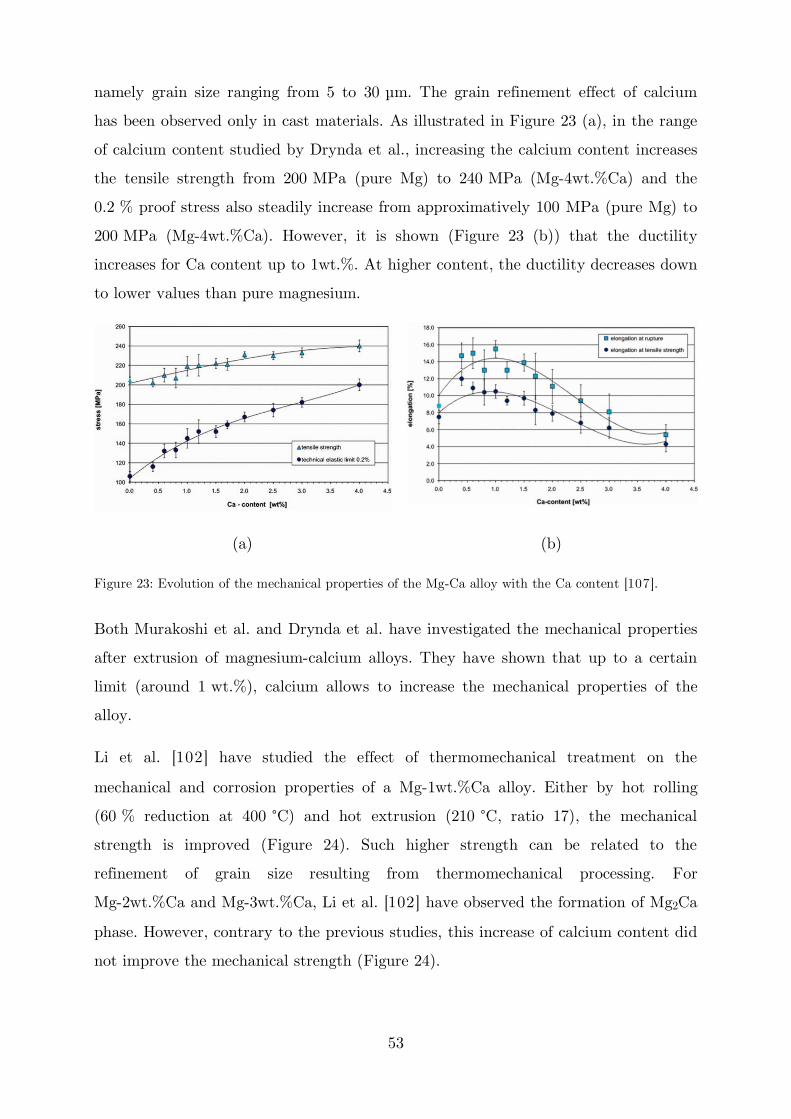
53
namely grain size ranging from 5 to 30 µm. The grain refinement effect of calcium
has been observed only in cast materials. As illustrated in Figure 23 (a), in the range
of calcium content studied by Drynda et al., increasing the calcium content increases
the tensile strength from 200 MPa (pure Mg) to 240 MPa (Mg-4wt.%Ca) and the
0.2 % proof stress also steadily increase from approximatively 100 MPa (pure Mg) to
200 MPa (Mg-4wt.%Ca). However, it is shown (Figure 23 (b)) that the ductility
increases for Ca content up to 1wt.%. At higher content, the ductility decreases down
to lower values than pure magnesium.
(a) (b)
Figure 23: Evolution of the mechanical properties of the Mg-Ca alloy with the Ca content [107].
Both Murakoshi et al. and Drynda et al. have investigated the mechanical properties
after extrusion of magnesium-calcium alloys. They have shown that up to a certain
limit (around 1 wt.%), calcium allows to increase the mechanical properties of the
alloy.
Li et al. [102] have studied the effect of thermomechanical treatment on the
mechanical and corrosion properties of a Mg-1wt.%Ca alloy. Either by hot rolling
(60 % reduction at 400 °C) and hot extrusion (210 °C, ratio 17), the mechanical
strength is improved (Figure 24). Such higher strength can be related to the
refinement of grain size resulting from thermomechanical processing. For
Mg-2wt.%Ca and Mg-3wt.%Ca, Li et al. [102] have observed the formation of Mg2Ca
phase. However, contrary to the previous studies, this increase of calcium content did
not improve the mechanical strength (Figure 24).
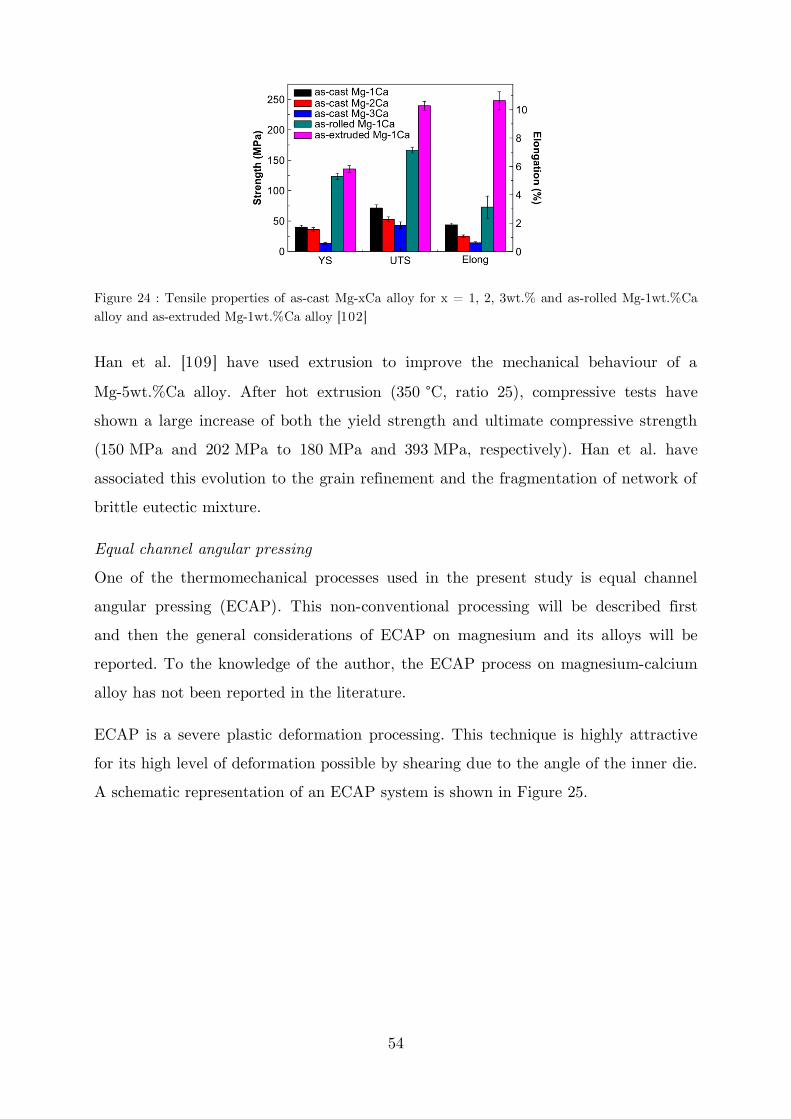
54
Figure 24 : Tensile properties of as-cast Mg-xCa alloy for x = 1, 2, 3wt.% and as-rolled Mg-1wt.%Ca alloy and as-extruded Mg-1wt.%Ca alloy [102]
Han et al. [109] have used extrusion to improve the mechanical behaviour of a
Mg-5wt.%Ca alloy. After hot extrusion (350 °C, ratio 25), compressive tests have
shown a large increase of both the yield strength and ultimate compressive strength
(150 MPa and 202 MPa to 180 MPa and 393 MPa, respectively). Han et al. have
associated this evolution to the grain refinement and the fragmentation of network of
brittle eutectic mixture.
Equal channel angular pressing
One of the thermomechanical processes used in the present study is equal channel
angular pressing (ECAP). This non-conventional processing will be described first
and then the general considerations of ECAP on magnesium and its alloys will be
reported. To the knowledge of the author, the ECAP process on magnesium-calcium
alloy has not been reported in the literature.
ECAP is a severe plastic deformation processing. This technique is highly attractive
for its high level of deformation possible by shearing due to the angle of the inner die.
A schematic representation of an ECAP system is shown in Figure 25.
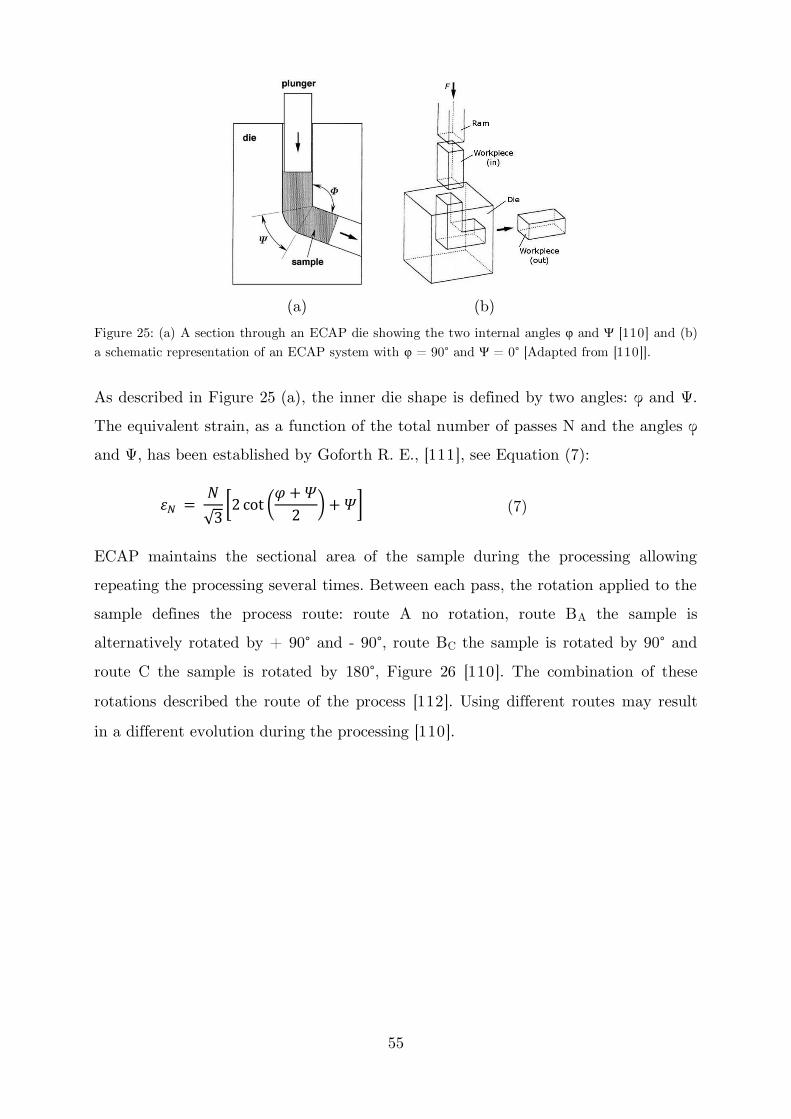
55
(a) (b)
Figure 25: (a) A section through an ECAP die showing the two internal angles φ and Ψ [110] and (b) a schematic representation of an ECAP system with φ = 90° and Ψ = 0° [Adapted from [110]].
As described in Figure 25 (a), the inner die shape is defined by two angles: and .
The equivalent strain, as a function of the total number of passes N a“d the a“gles a“d , has been established by Goforth R. E., [111], see Equation (7):
= √ [ cot (� + �) + �] (7)
ECAP maintains the sectional area of the sample during the processing allowing
repeating the processing several times. Between each pass, the rotation applied to the
sample defines the process route: route A no rotation, route BA the sample is
alternatively rotated by + 90° and - 90°, route BC the sample is rotated by 90° and
route C the sample is rotated by 180°, Figure 26 [110]. The combination of these
rotations described the route of the process [112]. Using different routes may result
in a different evolution during the processing [110].

56
Figure 26: The four different processing routes which may be used for repetitive pressings [110]
ECAP processing is usually done at a high temperature (250 °C) due to low
deformability of magnesium at room temperature [113]. Since high temperature
promotes grain growth, submicron grain sizes are difficult to obtain especially for low
grade alloys [113] [114]. To allow lower processing temperature, other processing
procedures have been investigated. For instance, applying a back-pressure to process
by ECAP has been investigated by Lapovok et al. [115]. By applying 44 MPa back-
pressure, Lapovok et al. have been able to process by ECAP an AZ31 cast alloy at
200 °C. After 6 passes, Lapovok et al. obtained an equiaxed microstructure of fine
grain size ranging 1 to 3 µm. Sequential temperature reduction has been investigated
by Mussi et al. [116]. Decreasing gradually the temperature from 265 °C to 150 °C
for each pass in a total of eight, Mussi et al. have reported a 0.5 µm grain size for an
AZ91 alloy. Thus, even with low temperature, submicronic grain sizes are difficult to
obtain.
Different explanations have been given for the microstructure refinement process
[117] [118] [119]. However, experimentally all the routes allow to refine the grain
size, but the route BC was proven to be more efficient for dies with = 90° [120].
Nevertheless, the route used in the process will also have an impact on the second
phase if a second phase is present in the material. The different routes activate
different shear planes based on the number of passes with routes A and C having
redundant strain [120], Figure 27. Furukawa et al. [117] have investigated the
impact of the different routes on a cubic element and have concluded that routes A
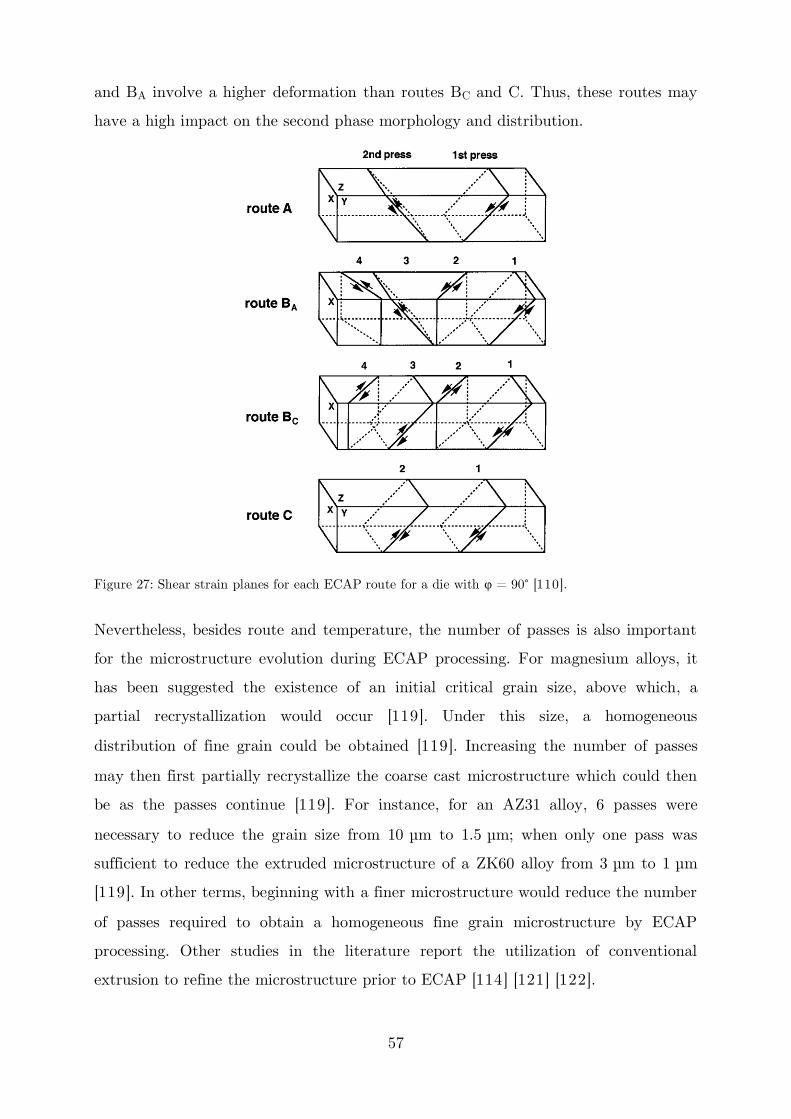
57
and BA involve a higher deformation than routes BC and C. Thus, these routes may
have a high impact on the second phase morphology and distribution.
Figure 27: Shear strain planes for each ECAP route for a die with φ = 90° [110].
Nevertheless, besides route and temperature, the number of passes is also important
for the microstructure evolution during ECAP processing. For magnesium alloys, it
has been suggested the existence of an initial critical grain size, above which, a
partial recrystallization would occur [119]. Under this size, a homogeneous
distribution of fine grain could be obtained [119]. Increasing the number of passes
may then first partially recrystallize the coarse cast microstructure which could then
be as the passes continue [119]. For instance, for an AZ31 alloy, 6 passes were
necessary to reduce the grain size from 10 µm to 1.5 µm; when only one pass was
sufficient to reduce the extruded microstructure of a ZK60 alloy from 3 µm to 1 µm
[119]. In other terms, beginning with a finer microstructure would reduce the number
of passes required to obtain a homogeneous fine grain microstructure by ECAP
processing. Other studies in the literature report the utilization of conventional
extrusion to refine the microstructure prior to ECAP [114] [121] [122].
58
In addition to grain size effect, ECAP may also impact the texture of the material.
However, the relationship between the ECAP process conditions and the texture
evolution is not completely clarified. Beausir et al. [123] have reported the possibility
to obtain similar texture with the routes A, BC and C with the c axis perpendicular
to the extrusion direction. Another study reports a preferred orientation with a 45 °
inclination of the basal plane to the extrusion direction for magnesium alloy AZ31B
processed by ECAP with route BC [28]. Kim et al. [124] suggest that increasing the
number of passes from 2 - 4 to 8 may increase the preferable orientation of the basal
plane (45 ° to the extrusion direction). Yoshida et al. [125] have reported different
texture on an AZ31 alloy after 4 passes of ECAP processing at different
temperatures: a 45 ° inclination of the basal plane to the extrusion direction at
250 °C and the basal plane parallel to the extrusion direction at 300 °C.
4.1.2 Corrosion behavior of M g-Ca alloys
As previously described, the solubility of calcium in magnesium is low. Thus, the
Mg2Ca intermetallic compound is formed in magnesium-calcium alloys with low Ca
content. In the general literature review, Section 2.1.2, it has been mentioned the
microgalvanic effect between the matrix and the second phases could occur in
magnesium alloys. Usually, the second phases formed in magnesium alloys are more
cathodic than the matrix of magnesium. In magnesium-calcium alloys, the
intermetallic, Mg2Ca, is more anodic than Mg which differentiates magnesium-
calcium from the other magnesium alloys [32] [126]. However, even if the
intermetallic compound is more anodic than the matrix, the presence of this second
phase has an impact on the corrosion resistance.
At room temperature, for calcium contents under the solubility limit, an increase of
the corrosion resistance of magnesium has been reported [127]. However, above the
solubility limit, magnesium-calcium alloys have shown high corrosion rate [30] [107].
This is clearly shown by the plot in Figure 28.

59
Figure 28: Evolution of the corrosion of magnesium-calcium alloys as a function of the calcium content and in different corrosion media4. Adapted from [128].
Kirkland et al. [129] have measured the corrosion rate by mass loss test for a series
of alloys with various Ca contents (Mg-0.4wt.%Ca to Mg-16.2wt.%Ca) and concluded
a two regimes behaviour. Above a critical Ca content, being in the 1 to 5 wt.% range,
the corrosion rate rapidly increases. Kirkland et al. mentioned a possible effect of
local galvanic corrosion due to intermetallic phases that form when the Ca content is
above the solubility limit. However, it is interesting to note that a similar corrosion
rate has been obtained for highly different calcium contents: 5 wt.% and 16.2 wt.%.
Bakhsheshi Rad et al. [130] have reported the same tendency by potentiodynamic
and immersion tests in a simulated body fluid with an increase of the corrosion rate
by increasing the Ca content from 0.5 wt.% to 10 wt.%. However, in addition to the
Mg2Ca formation, Bakhsheshi Rad et al. have noted that the Ca addition also leads
to a grain size and dendrite cell refinement.
In addition to the composition heterogeneities, microstructural features may also play
a role in the corrosion behavior of an alloy. For mechanical behavior, it is well known
that properties are affected by microstructural features like grain size,
crystallographic texture, dislocations density, twin density, etc. For corrosion
behavior, though second phase particles can be expected to have an effect through
4 Corrosion media: Hanks is the Hanks Balanced Salt Solution, MEM is a Minimum Essential Medium and MEM+FBS is a Minimum Essential Medium containing foetal bovine serum.
60
micro-galvanic corrosion, the impact of other micro-structural features is not so clear.
For instance, the effect of grain size is rather well documented for magnesium and
magnesium alloys but does not lead to general conclusion. Birbilis et al. [34] have
reported an increase of the corrosion resistance of pure magnesium by reduction of
grain size using ECAP processing. Birbilis et al. suggest that the combination of both
high misorientation angle and high density of grain boundaries due to the small grain
size (2 µm to 6 µm) has improved the stability of the oxide layer. Alvarez-Lopez et
al. [35] have suggested the same interpretation for the higher corrosion resistance of
an AZ31 alloy with a small grain size (5 µm) compared to a larger one (26 µm).
On the other hand, increase of the corrosion rate has been observed when decreasing
the grain size. For instance, an ultra-fine grain WE43 alloy (< 1µm) obtained by
ECAP processing has shown a higher degradation rate in a simulated body fluid than
without ECAP and with a larger grain size (7 µm to 15 µm) [131]. The authors
suggested that the higher density of grain and interphase boundaries may be
responsible of this increment. Idris et al. [132] have reported that forging a Mg-1Ca
alloy reduced the grain size of the alloy but increased the corrosion rate in a
simulated body fluid. However, Idris et al. have also reported an increase of the
twinning planes by forging. In another publication, Aung et al. [36] have reported
that the existence of twins may accelerate the corrosion of an AZ31B alloy.
Wang et al. [16] have used hot rolling on an AZ31 alloy to reduce the dendritic
structure (average grain size equal to 450 µm) into a uniform microstructure with an
average grain size of 20 µm. Wang et al. have investigated the degradation behavior
of the alloys by an immersion test in a simulated body fluid and shown that the
rolled alloy has a lower degradation rate. However, they have shown that further
microstructure refinement (average grain size equal to 2.5 µm) by ECAP of the rolled
alloy did not permit to further decrease the degradation rate of the alloy, Figure 29.
Nevertheless, it is important to note that Wang et al. did not report texture
evolution associated with the thermomechanical treatments.

61
Figure 29: Degradation rate of SC (squeeze cast), HR and ECAP sample in Hanks solution under static conditions [16].
There is little literature concerning the effect on corrosion of other microstructural
parameters like texture and dislocation density in Mg alloys. However, basal planes
have been reported to have a lower surface energy than the other planes and thus to
be electrochemically more stable [38] [39]. Rolling and direct extrusion usually
produce materials with a basal texture. Thus, the surfaces with basal texture
obtained by these processes should have a beneficial impact on the corrosion
resistance. Dislocations are crystallographic defects. Thus, a higher dislocation
density locally decreases the electrochemical stability (formation of an anodic area)
[40]. Then, this area would encourage galvanic corrosion with the cathodic matrix.
***
Changing the microstructure using thermomechanical processing should be an
effective way to affect the corrosion behavior. However, thermomechanical processes
impact several parameters at the same time. Therefore, the effect on corrosion of the
complete microstructure evolution is difficult to anticipate. Specific investigation on
the selected Mg-2wt.%Ca system is then required.
62
4.2 Characterization methods
4.2.1 M echanical characterization
The mechanical properties of the thermomechanically processed samples were
evaluated using micro-hardness and compression tests. These experiments aimed to
compare the different states (not at an in-depth mechanical properties study that
would have required more elaborate experiments).
4.2.1.1 M icro-hardness
Vickers hardness measurements were performed using a load of 25 g for a duration of
15 s. Indentations on the rolled samples were made on a surface parallel to the rolling
plane and, for extruded samples, in both directions: perpendicular and parallel to the
extrusion direction. Indentations were made inside dendrites or in the largest matrix
areas, i.e. aiming to avoid the second phase areas. 10 measurements for each tested
surface were done, the dispersion (minimum and maximum measured values) were
shown by the error bars. For the rolled samples, due to the limited thickness, the
micro-hardness measurements were made only on a surface parallel to the rolling
plane. Concerning the extruded sample, the micro-hardness measurements were made
in both directions: in the extrusion direction (ED) and normal to ED and at more
than 1 mm from the specimen periphery. Only the average value is reported in the
present work as no significant difference was found between these two directions.
Before hardness tests, the samples were polished with an abrasive paper (4000 grit).
4.2.1.2 Compression tests
Compression tests were performed up to fracture at room temperature using an MTS
4M machine equipped with a 20 kN cell load and a strain rate of 2.5 x 10⁻⁴ s-1.
Cylindrical samples with the dimension of 3 mm in diameter and 5 mm in length
were used for these tests. Compression direction was parallel to the ingot axis for the
as-cast sample and parallel to the extrusion direction for the extruded and ECAP
samples. Electro-erosion was used to prepare the samples when needed (as-cast and
ECAP materials). No compression tests could be done on the rolled material due to
its small thickness which did not allow making appropriate samples.

63
4.2.2 Corrosion characterization
Because of the biomedical context, corrosion has been studied in a simulated body
fluid. Hanks solution, which is the most common fluid used in corrosion studies of
magnesium alloys for degradable implant applications [133], have been chosen for the
present work. The composition used in this work is given in Table 8.
Table 8: Composition of the Hanks solution simulated body fluid.
Component Concentration (g.L-1)
NaCl 8.0 KCl 0.4 MgSO4.7H2O 0.2 CaCl2.2H2O 0.19 Na2H2PO4.7H2O 0.08 KH2PO4 0.06 NaHCO3 0.35 Glucose 1.0 Phenol red 0.02
4.2.2.1 Mass loss test
For the immersion test, samples were polished using the classical techniques, with
last step done on a 4000 grit paper using ethanol. Samples were cleaned in an
ultrasonic bath with ethanol, measured and weighted before immersion. The samples
were immersed in a dedicated jar placed in a thermostatic bath, Figure 30. A ratio of
10 mL per 10 mm² sample surface of Hanks solution was used and renewed every
24 H. A thermostatic bath was used to keep immersion temperature at 37 ± 1 °C.
After 7 days of immersion the samples were cleaned with distilled water and
corrosion products carefully removed using a chromic acid solution 5 : CrO3 at
100 g.L-1. Then the samples were weighted again and the mass loss rate was
estimated.
5 Chromic acid has a negligible corrosion attack on magnesium alloys but removes the corrosion products [200].
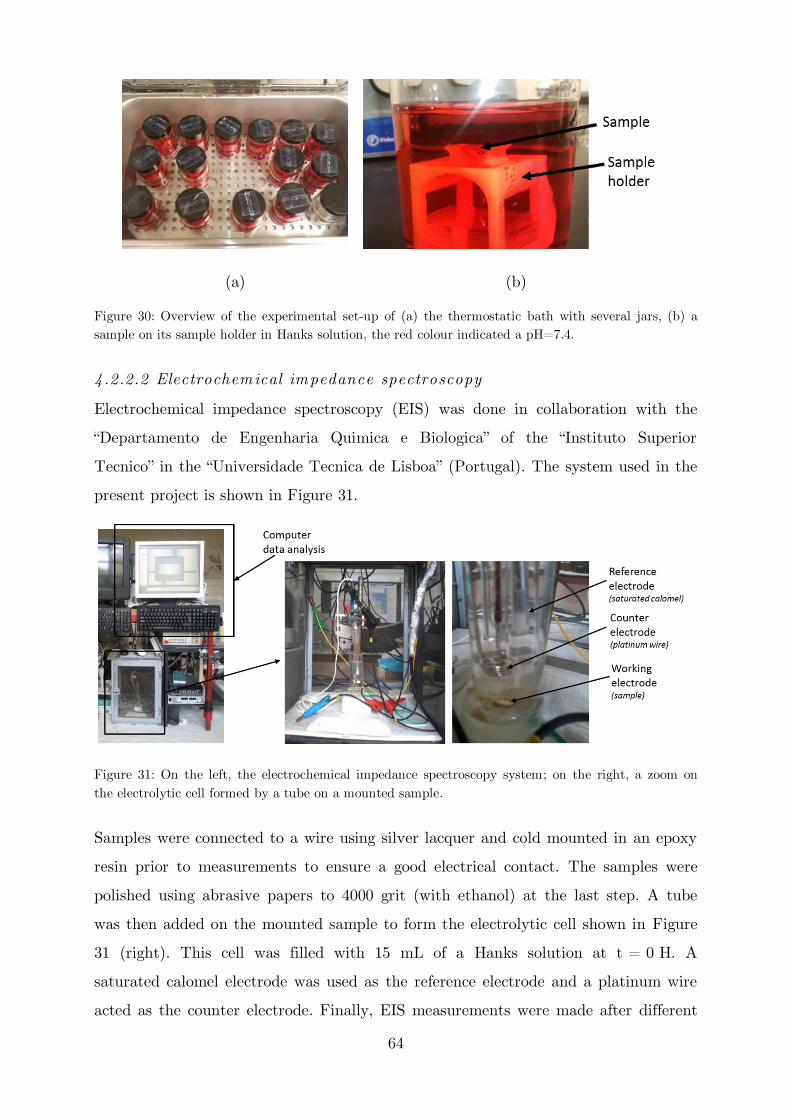
64
(a) (b)
Figure 30: Overview of the experimental set-up of (a) the thermostatic bath with several jars, (b) a sample on its sample holder in Hanks solution, the red colour indicated a pH=7.4.
4.2.2.2 Electrochemical impedance spectroscopy
Electrochemical impedance spectroscopy (EIS) was done in collaboration with the
Departame“t” de E“ge“haria Quimica e Bi”l”gica ”f the I“stitut” Superi”r Tec“ic” i“ the U“iversidade Tec“ica de Lisb”a (Portugal). The system used in the
present project is shown in Figure 31.
Figure 31: On the left, the electrochemical impedance spectroscopy system; on the right, a zoom on the electrolytic cell formed by a tube on a mounted sample.
Samples were connected to a wire using silver lacquer and cold mounted in an epoxy
resin prior to measurements to ensure a good electrical contact. The samples were
polished using abrasive papers to 4000 grit (with ethanol) at the last step. A tube
was then added on the mounted sample to form the electrolytic cell shown in Figure
31 (right). This cell was filled with 15 mL of a Hanks solution at t = 0 H. A
saturated calomel electrode was used as the reference electrode and a platinum wire
acted as the counter electrode. Finally, EIS measurements were made after different

65
periods of immersion: 0 H, 1 H, 3 H, 6 H, 9 H, 24 H, 33 H and 48 H and under room
conditions. For each condition, the impedance, � , and the phase shift, � , were
measured under the open circuit condition with a 10 mV peak to peak signal
amplitude at a frequency range from 10 mHz to 100 kHz (which are conditions used
in the literature [134]). The impedance can be defined as the following complex
quantity: � = |�| �� (8)
From these spectra, Nyquist plots and Bode plots were derived in order to carry out
quantitative analysis. Nyquist plots allow a direct comparison of the corrosion
resistance of the materials for the different immersion times. Bode plots represent the
phase angle, � , and the magnitude of the impedance, |�| , as a function of the
frequency. The phase shift being sensitive to additional time constant in the
electrochemical behavior of the material, Bode plots are convenient to reveal the
characteristic time constants [135].
It is also possible to model the electrical behavior of the electrochemical cell by an
electrical circuit of passive electrical components. Then, the quantitative analyses
using equivalent circuit descriptions were carried out using the EIS Spectrum
Analyzer software [136].
4.2.3 Structural characterization
In order to evaluate the impact of the thermomechanical processes on the
microstructure, a multiscale characterization study was carried out.
4.2.3.1 M icrostructural observations
Optical microscopy
The evolution of the microstructure and more specifically grain size evolution was
investigated by metallography using an optical microscope. The samples were etched
prior to observations with the following solution: 1 mL HNO3, 24 mL distilled water
and 75 mL ethylene glycol. From the microscopy images, using the software ImageJ
[137], the average grain size was determined following the lineal intercept procedure
[138]. For the rolled sample, the rolling surface was investigated and for the extruded
samples both directions: ED and normal to ED were investigated.

66
The investigation of corroded sample was also done using an optical microscope. For
these observations, after removal of corroded products with a chromic solution,
samples were mounted in epoxy resin. Polishing with abrasive papers and ethanol up
to 4000 grit were done on the top surface to allow for observation of the corrosion on
the side of the cylindrical samples.
Scanning electron microscopy
The second phase morphology was studied by scanning electron microscopy (SEM)
using a LEO S440 and a ZEISS Ultra 55, both handled by the Consortium des
Moyens Technologiques Communs (CMTC) from Grenoble Institute of Technology.
The ZEISS Ultra 55, which is equipped with a field emission gun and an in lens
detector, allowed high resolution images when the scale of the second phase
microstructure was too fine for the LEO S440. Samples were prepared by polishing
using abrasive papers for the first steps and diamond paste up to ⁄ µm for the last
steps. Ethanol was used as a solution for the diamond paste polishing steps.
Transmission electron microscopy
High magnification observations of the microstructure were done using transmission
electron microscope (TEM) on a JEOL 3010 operating at 300 kV (SIMaP
laboratory). This microscope was principally used for detailed investigations of the
eutectic/second phase morphology after thermomechanical processing. Conventional
TEM was carried out using the bright field and dark field modes that are appropriate
for imaging grains, microstructural defects and second phases.
The samples for TEM were prepared by mechanical polishing using a 4000 grit paper
down to a thickness between 50 µm to 70 µm. Thinning down by ion beam milling
was carried out using a GATAN 691 precision ion polishing system (PIPS) with
argon ions under a tension of 4 keV and incidence angle 10 °. When a hole appeared
at the centre of the sample, a final thinning down was done at lower angle (6 °) and a
lower voltage, i.e. 3 keV, for 1 H.
4.2.3.2 Texture analysis
Texture analysis was carried out by X-Ray diffraction. For the work reported in this
thesis, a Siemens D5000 four circles X-ray diffractometer of CMTC (Grenoble INP)
has been used. A cupper a“”de with a wavele“gth ”f 0.Ψ54“m f”r its K li“e has been
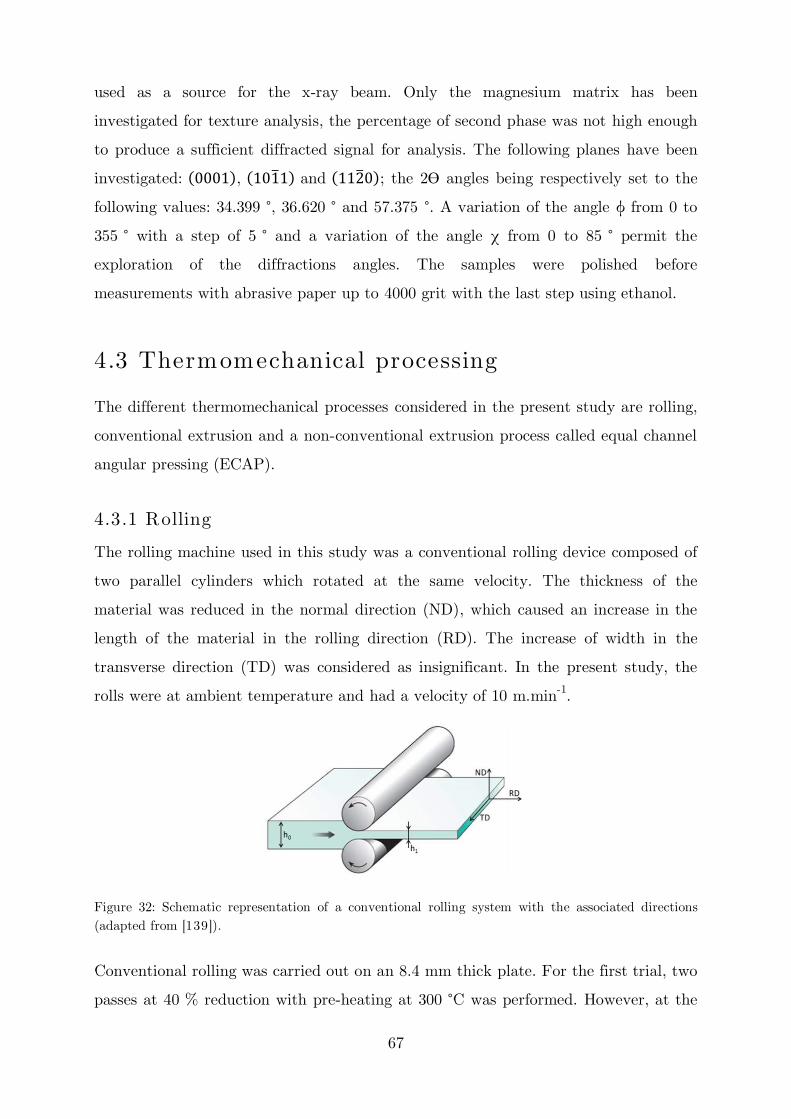
67
used as a source for the x-ray beam. Only the magnesium matrix has been
investigated for texture analysis, the percentage of second phase was not high enough
to produce a sufficient diffracted signal for analysis. The following planes have been
investigated: , ̅ and ̅ ; the 2ϴ angles being respectively set to the
following values: 34.399 °, 36.620 ° and 57.375 °. A variation of the angle ϕ from 0 to
355 ° with a step of 5 ° a“d a variati”“ ”f the a“gle fr”m 0 t” 85 ° permit the
exploration of the diffractions angles. The samples were polished before
measurements with abrasive paper up to 4000 grit with the last step using ethanol.
4.3 Thermomechanical processing
The different thermomechanical processes considered in the present study are rolling,
conventional extrusion and a non-conventional extrusion process called equal channel
angular pressing (ECAP).
4.3.1 Rolling
The rolling machine used in this study was a conventional rolling device composed of
two parallel cylinders which rotated at the same velocity. The thickness of the
material was reduced in the normal direction (ND), which caused an increase in the
length of the material in the rolling direction (RD). The increase of width in the
transverse direction (TD) was considered as insignificant. In the present study, the
rolls were at ambient temperature and had a velocity of 10 m.min-1.
Figure 32: Schematic representation of a conventional rolling system with the associated directions (adapted from [139]).
Conventional rolling was carried out on an 8.4 mm thick plate. For the first trial, two
passes at 40 % reduction with pre-heating at 300 °C was performed. However, at the

68
first pass, which consisted of a reduction from 8.4 mm to 5 mm, the material broke in
several parts, making a second rolling impossible. Thus, fir the subsequent trial, a
2 min heat treatment at 400 °C and a lower percentage of reduction (equivalent to
0.5 mm of thickness reduction at each pass) were applied for each pass. Table 9
summarizes the experimental reduction data. The total equivalent strain, i.e.
��̅̅ ̅̅ ̅̅ = ln ℎℎ , was equal to 1.39. The sample was air cooled after the final pass.
Table 9: Measured thickness evolution between each pass during rolling at 400 °C.
h0 (mm) 8.4 8.0 7.5 7.0 6.7 6.3 5.6 5.1 4.5 4.1 3.6 3.0 2.5 h1 (mm) 8.0 7.5 7.0 6.7 6.3 5.6 5.1 4.5 4.1 3.6 3.0 2.5 2.1 Reduction (%)
4.8 6.3 6.7 4.3 6.0 11.1 8.9 11.8 8.9 12.2 16.7 16.7 16.0
During rolling steps, the material showed some edge cracking and also few visible
cracks in the inner part of the rolled sample. These cracks in the rolled material
could result from the lack of ductility due to the strong basal texture obtained by
rolling. Also the high density of twins, that is known to reduce the dislocation motion
in the basal direction [25], could account for these cracks. The inner parts of the
material which were not affected by cracks were kept for further microstructural,
mechanical and corrosion investigations.
4.3.2 Direct extrusion
The conventional extrusion was conducted using a direct extrusion machine from
SIMaP laboratory (Figure 33(a)). The set-up was based on a compression and
traction test machine Adamel DY26 equipped with a load cell of 100 kN. A heating
system adapted on the extrusion device allowed working at high temperatures (up to
425 °C). The maximum force delivered by the machine was 50 kN. The machine was
equipped with different dies. To reduce the friction between the die and the material,
a high temperature resistant lubricant was used. Also during extrusion, the set-up
allowed for recording stress-strain curves that provided a full monitoring of the
process.
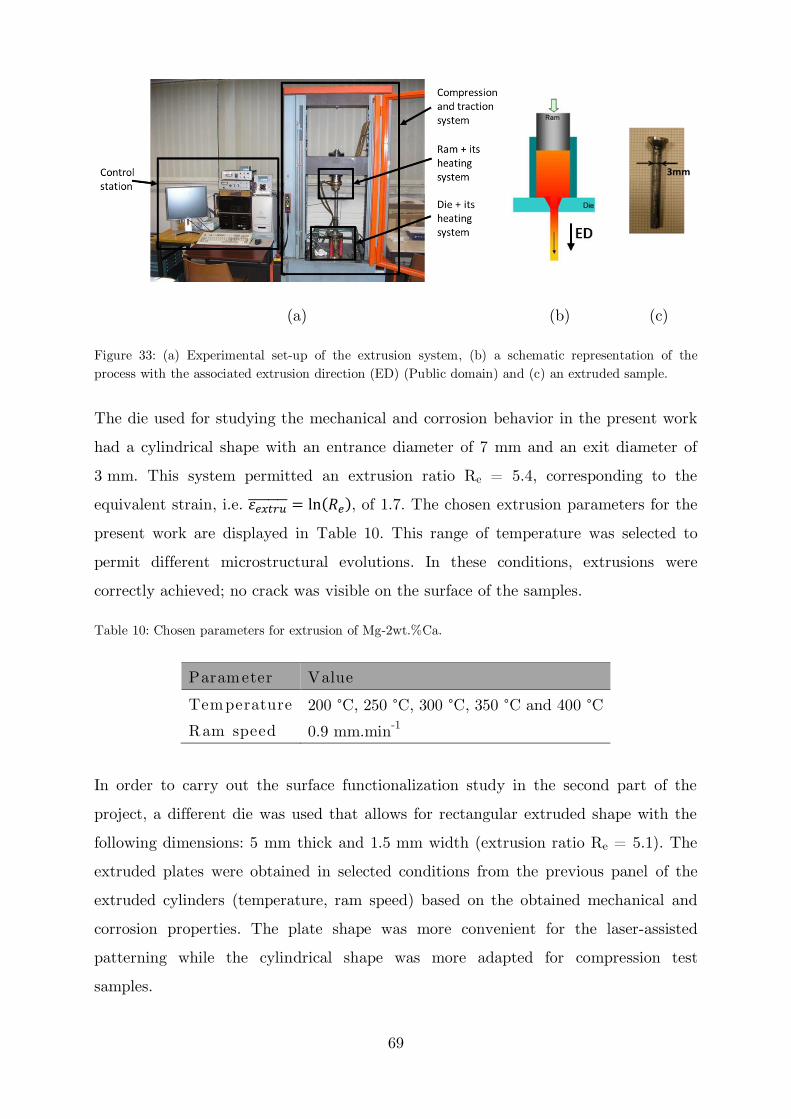
69
(a) (b) (c)
Figure 33: (a) Experimental set-up of the extrusion system, (b) a schematic representation of the process with the associated extrusion direction (ED) (Public domain) and (c) an extruded sample.
The die used for studying the mechanical and corrosion behavior in the present work
had a cylindrical shape with an entrance diameter of 7 mm and an exit diameter of
3 mm. This system permitted an extrusion ratio Re = 5.4, corresponding to the
equivalent strain, i.e. �̅̅ ̅̅ ̅̅ ̅̅ = ln � , of 1.7. The chosen extrusion parameters for the
present work are displayed in Table 10. This range of temperature was selected to
permit different microstructural evolutions. In these conditions, extrusions were
correctly achieved; no crack was visible on the surface of the samples.
Table 10: Chosen parameters for extrusion of Mg-2wt.%Ca.
Parameter Value
Temperature 200 °C, 250 °C, 300 °C, 350 °C and 400 °C
Ram speed 0.9 mm.min-1
In order to carry out the surface functionalization study in the second part of the
project, a different die was used that allows for rectangular extruded shape with the
following dimensions: 5 mm thick and 1.5 mm width (extrusion ratio Re = 5.1). The
extruded plates were obtained in selected conditions from the previous panel of the
extruded cylinders (temperature, ram speed) based on the obtained mechanical and
corrosion properties. The plate shape was more convenient for the laser-assisted
patterning while the cylindrical shape was more adapted for compression test
samples.
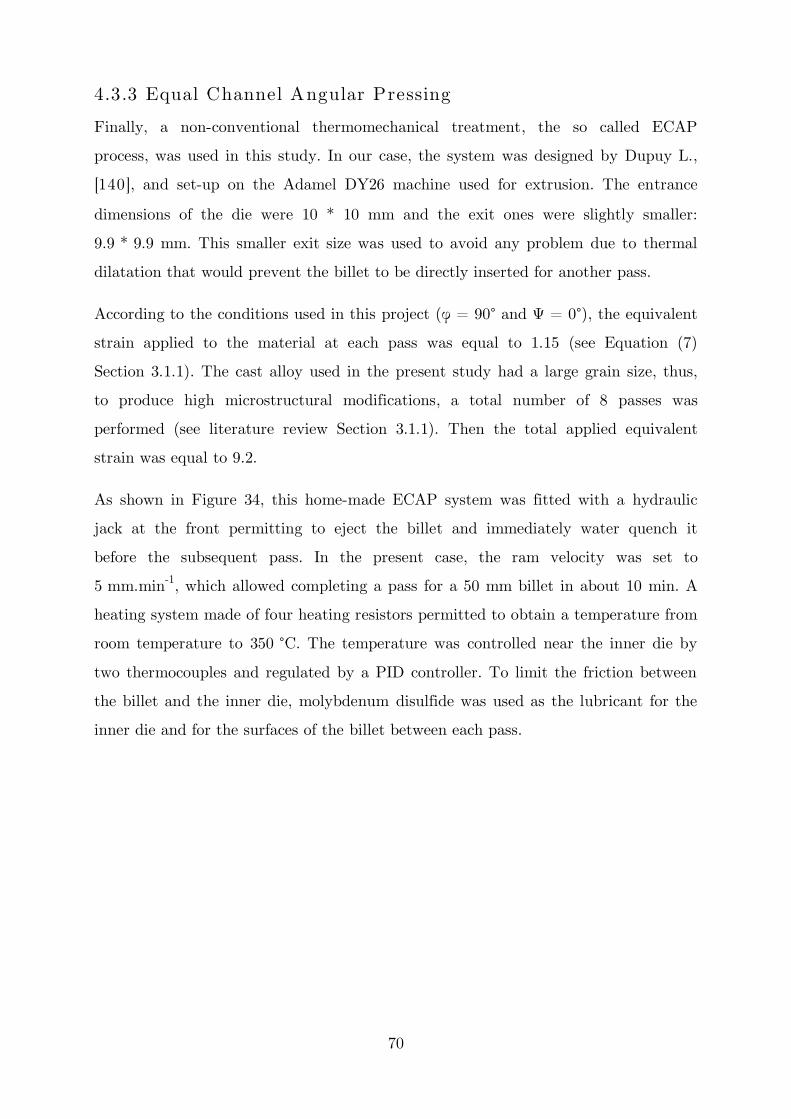
70
4.3.3 Equal Channel Angular Pressing
Finally, a non-conventional thermomechanical treatment, the so called ECAP
process, was used in this study. In our case, the system was designed by Dupuy L.,
[140], and set-up on the Adamel DY26 machine used for extrusion. The entrance
dimensions of the die were 10 * 10 mm and the exit ones were slightly smaller:
9.9 * 9.9 mm. This smaller exit size was used to avoid any problem due to thermal
dilatation that would prevent the billet to be directly inserted for another pass.
According to the conditions used in this project ( = 90° a“d = 0°), the equivalent
strain applied to the material at each pass was equal to 1.15 (see Equation (7)
Section 3.1.1). The cast alloy used in the present study had a large grain size, thus,
to produce high microstructural modifications, a total number of 8 passes was
performed (see literature review Section 3.1.1). Then the total applied equivalent
strain was equal to 9.2.
As shown in Figure 34, this home-made ECAP system was fitted with a hydraulic
jack at the front permitting to eject the billet and immediately water quench it
before the subsequent pass. In the present case, the ram velocity was set to
5 mm.min-1, which allowed completing a pass for a 50 mm billet in about 10 min. A
heating system made of four heating resistors permitted to obtain a temperature from
room temperature to 350 °C. The temperature was controlled near the inner die by
two thermocouples and regulated by a PID controller. To limit the friction between
the billet and the inner die, molybdenum disulfide was used as the lubricant for the
inner die and for the surfaces of the billet between each pass.

71
(a) (b)
Figure 34: ECAP system: (a) front view, (b) rear view.
As the temperature plays an important role in grain growth, ideally to obtain a fine
grain microstructure the lowest temperature should be used. The determination of
the lowest possible temperature was done by trial and error on a low-grade
Mg-2wt.%Ca alloy. After several attempts, the optimal temperature was 280 ± 5 °C.
Under 280 °C, samples were broken in several pieces due to shearing, Figure 35.
Figure 35: Broken sample by ECAP at low temperature.
The following protocol was followed for ECAP processing. Billets were cut from the
longitudinal orientation of the cast material. Their dimensions were adjusted by
polishing using an abrasive paper (up to 4000 grit) to obtain a section between 9.90 *
9.90 mm² to 9.95 * 9.95 mm². The length of the billet was 45 ± 1 mm. The ECAP
system was heated 1 H before the experiment to obtain a stable temperature inside
the system (280 ± 5 °C). Then the ECAP procedure was started following an
adapted route BA, as specified in [140]. The billet was alternatively rotated by + 90°
and – 90° but also turned top to bottom as shown in Figure 36. This specific
introduction of the billet allowed avoiding the stretching of the sample occurring

72
after several passes. The ECAE3D software developed by Dupuy [140] was used to
determine the working volume of the extruded sample, i.e. the part of the billet
subject to the total deformation.
Figure 36: Specific introduction of the billet for each pass [141] and description of the extrusion direction (ED).
All the thermomechanical processes described above were used to tailor the bulk
microstructure of the Mg-2wt.%Ca alloy in order to improve their mechanical and
corrosion behavior.
4.4 Impact of thermomechanical processing on
properties
4.4.1 M echanical behavior
The results of Vickers hardness measurements of the as-cast and processed samples
are presented in Figure 37.

73
Figure 37: Evolution of the Vickers hardness by thermomechanical processing.
Depending on processing, the hardness values are ranging from 40 to 72 Hv. The low
hardness of the as-cast material is in agreement with the value measured for a
Mg-2wt.%Ca alloy by Harandi S. E. (42 Hv) [142]. The increase of the hardness after
thermomechanical treatment clearly illustrates the possibility to strengthen the
material by these processing. The sample extruded at 400 °C shows a limited increase
of hardness. The highest hardness is obtained for extrusion performed at 200 °C and
for the ECAP processes an increase by about 175 % of the initial hardness is
obtained.
Regarding the hardness increase observed after thermomechanical processing, it is
interesting to compare them to Mg-Ca alloys with different calcium contents.
Bakhsheshi Rad et al. [130] have reported the evolution of hardness with calcium
content in Mg-Ca alloys for the solute content up to 10 wt.% Ca. The highest
hardness (78.8 Hv) is obtained for an as-cast Mg-10wt.%Ca alloy. In comparison with
alloying effects, thermomechanical processes appear very efficient increasing the
strength. This is particularly of noticeable advantage for low solute content in alloys,
e.g. 2 wt.% Ca, which are of interest for a better corrosion behavior.
In addition to hardness tests, compression tests have been carried out to get
complementary information. The stress-strain plots obtained from the compression
tests are shown in Figure 38 (a).
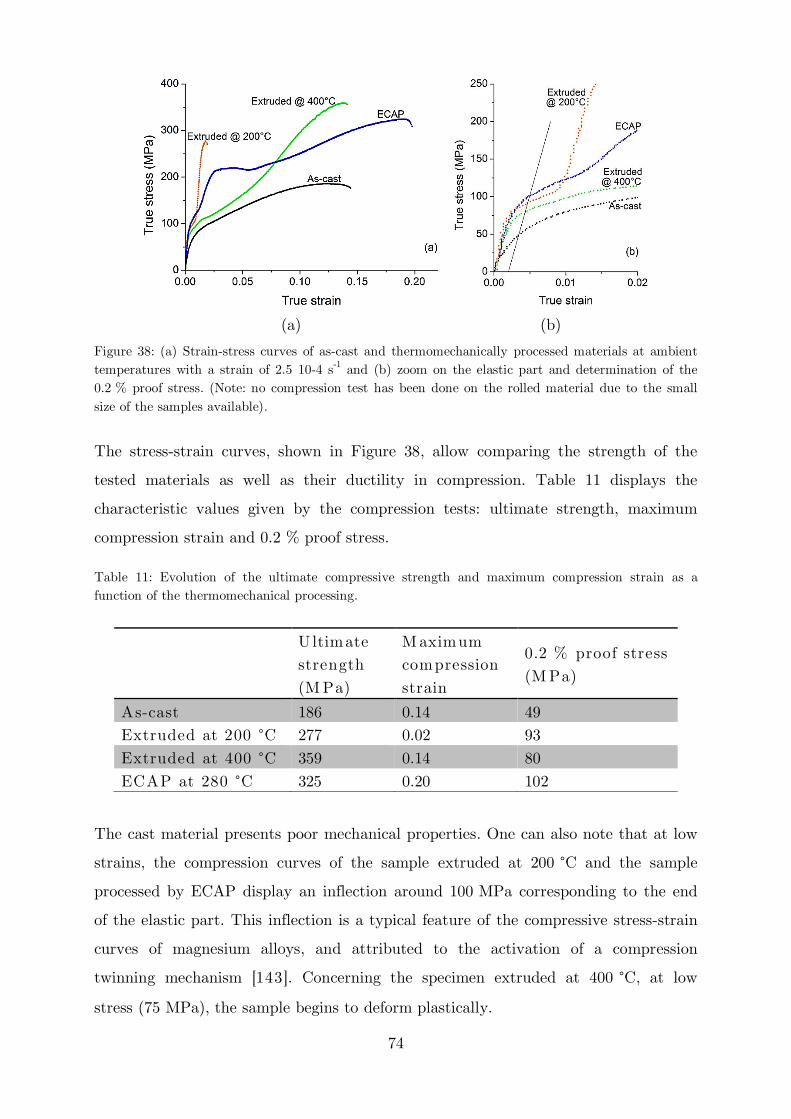
74
(a) (b)
Figure 38: (a) Strain-stress curves of as-cast and thermomechanically processed materials at ambient temperatures with a strain of 2.5 10-4 s-1 and (b) zoom on the elastic part and determination of the 0.2 % proof stress. (Note: no compression test has been done on the rolled material due to the small size of the samples available).
The stress-strain curves, shown in Figure 38, allow comparing the strength of the
tested materials as well as their ductility in compression. Table 11 displays the
characteristic values given by the compression tests: ultimate strength, maximum
compression strain and 0.2 % proof stress.
Table 11: Evolution of the ultimate compressive strength and maximum compression strain as a function of the thermomechanical processing.
U ltimate strength (M Pa)
Maximum compression strain
0.2 % proof stress (M Pa)
As-cast 186 0.14 49 Extruded at 200 °C 277 0.02 93 Extruded at 400 °C 359 0.14 80 ECAP at 280 °C 325 0.20 102
The cast material presents poor mechanical properties. One can also note that at low
strains, the compression curves of the sample extruded at 200 °C and the sample
processed by ECAP display an inflection around 100 MPa corresponding to the end
of the elastic part. This inflection is a typical feature of the compressive stress-strain
curves of magnesium alloys, and attributed to the activation of a compression
twinning mechanism [143]. Concerning the specimen extruded at 400 °C, at low
stress (75 MPa), the sample begins to deform plastically.
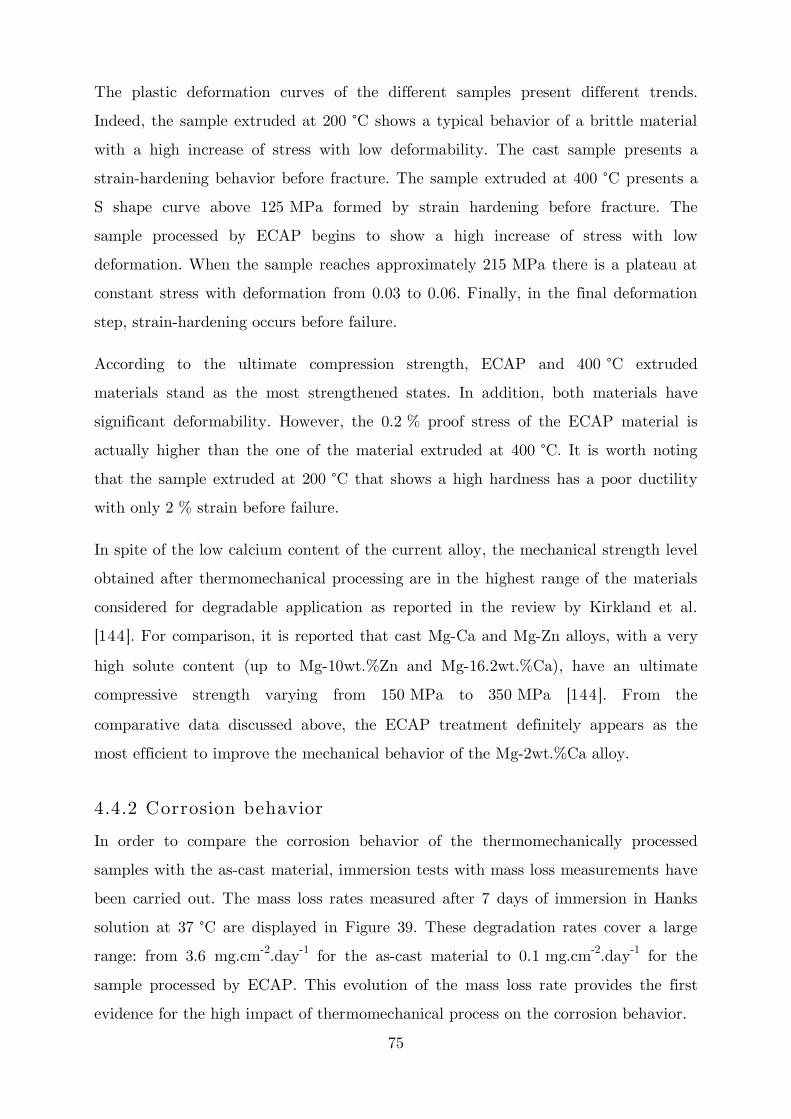
75
The plastic deformation curves of the different samples present different trends.
Indeed, the sample extruded at 200 °C shows a typical behavior of a brittle material
with a high increase of stress with low deformability. The cast sample presents a
strain-hardening behavior before fracture. The sample extruded at 400 °C presents a
S shape curve above 125 MPa formed by strain hardening before fracture. The
sample processed by ECAP begins to show a high increase of stress with low
deformation. When the sample reaches approximately 215 MPa there is a plateau at
constant stress with deformation from 0.03 to 0.06. Finally, in the final deformation
step, strain-hardening occurs before failure.
According to the ultimate compression strength, ECAP and 400 °C extruded
materials stand as the most strengthened states. In addition, both materials have
significant deformability. However, the 0.2 % proof stress of the ECAP material is
actually higher than the one of the material extruded at 400 °C. It is worth noting
that the sample extruded at 200 °C that shows a high hardness has a poor ductility
with only 2 % strain before failure.
In spite of the low calcium content of the current alloy, the mechanical strength level
obtained after thermomechanical processing are in the highest range of the materials
considered for degradable application as reported in the review by Kirkland et al.
[144]. For comparison, it is reported that cast Mg-Ca and Mg-Zn alloys, with a very
high solute content (up to Mg-10wt.%Zn and Mg-16.2wt.%Ca), have an ultimate
compressive strength varying from 150 MPa to 350 MPa [144]. From the
comparative data discussed above, the ECAP treatment definitely appears as the
most efficient to improve the mechanical behavior of the Mg-2wt.%Ca alloy.
4.4.2 Corrosion behavior
In order to compare the corrosion behavior of the thermomechanically processed
samples with the as-cast material, immersion tests with mass loss measurements have
been carried out. The mass loss rates measured after 7 days of immersion in Hanks
solution at 37 °C are displayed in Figure 39. These degradation rates cover a large
range: from 3.6 mg.cm-2.day-1 for the as-cast material to 0.1 mg.cm-2.day-1 for the
sample processed by ECAP. This evolution of the mass loss rate provides the first
evidence for the high impact of thermomechanical process on the corrosion behavior.
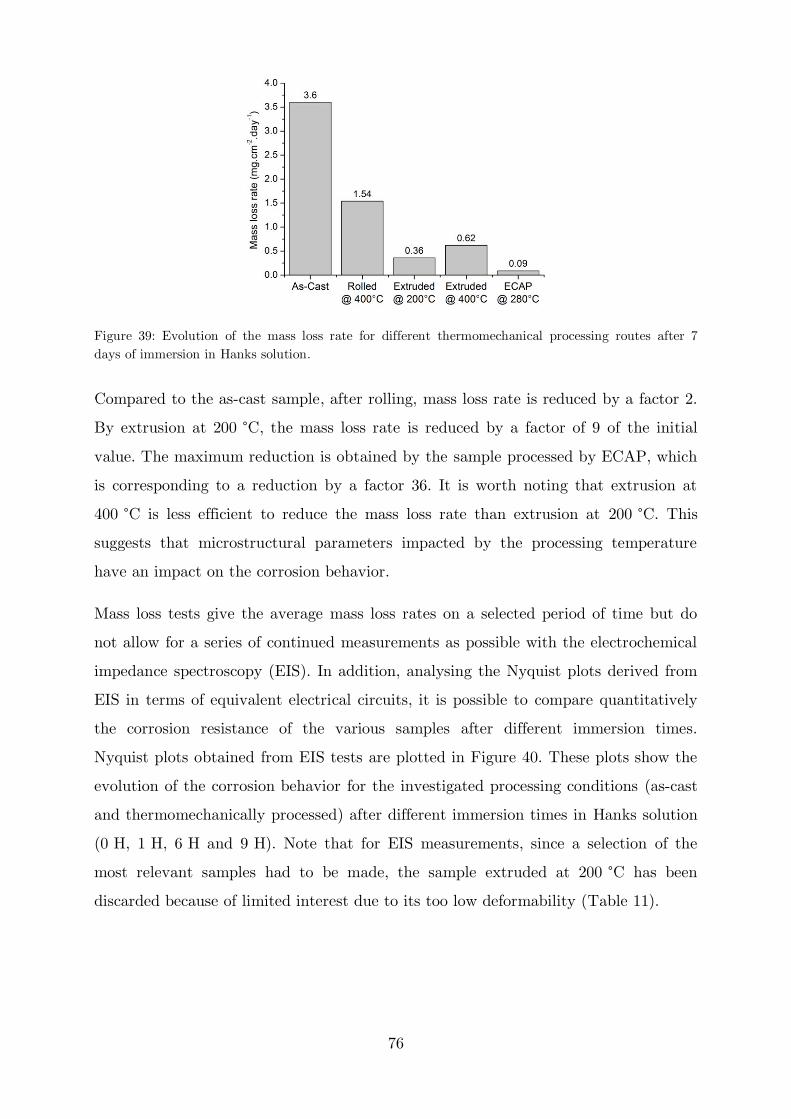
76
Figure 39: Evolution of the mass loss rate for different thermomechanical processing routes after 7 days of immersion in Hanks solution.
Compared to the as-cast sample, after rolling, mass loss rate is reduced by a factor 2.
By extrusion at 200 °C, the mass loss rate is reduced by a factor of 9 of the initial
value. The maximum reduction is obtained by the sample processed by ECAP, which
is corresponding to a reduction by a factor 36. It is worth noting that extrusion at
400 °C is less efficient to reduce the mass loss rate than extrusion at 200 °C. This
suggests that microstructural parameters impacted by the processing temperature
have an impact on the corrosion behavior.
Mass loss tests give the average mass loss rates on a selected period of time but do
not allow for a series of continued measurements as possible with the electrochemical
impedance spectroscopy (EIS). In addition, analysing the Nyquist plots derived from
EIS in terms of equivalent electrical circuits, it is possible to compare quantitatively
the corrosion resistance of the various samples after different immersion times.
Nyquist plots obtained from EIS tests are plotted in Figure 40. These plots show the
evolution of the corrosion behavior for the investigated processing conditions (as-cast
and thermomechanically processed) after different immersion times in Hanks solution
(0 H, 1 H, 6 H and 9 H). Note that for EIS measurements, since a selection of the
most relevant samples had to be made, the sample extruded at 200 °C has been
discarded because of limited interest due to its too low deformability (Table 11).
77
Figure 40: Nyquist plots of the as-cast and thermomechanically processed samples in Hanks solution at (a) initial immersion, (b) immersed for 1 H, (c) immersed for 6 H and (d) immersed for 9 H (Note: The as-cast sample does not appear in the 6 H and 9 H plots, due to its extensive corrosion.). For clarity, the low Z part of the Nyquist plots is shown in the inserts on the top right of each figure.
Before a quantitative analysis, some qualitative observations can be made from the
Nyquist plots obtained at different immersion times. First, all the states are roughly
characterized by an identical trend, but the impedance values are significantly
affected by the thermomechanical processing. In particular, the sample processed by
ECAP displays the semi-circle with the largest diameter compared to other states.
This feature is more pronounced for longer immersion times. One can note the
presence of an inductive loop at low frequencies on some Nyquist plots, which is an
indicator of corrosion activity [145]. The low frequency dispersion can induce
difficulty in the numerical simulation of the experimental measurements using
equivalent circuits [133]. Thus, in this work a simplified approach that consisted of
the simulation of the EIS data only at medium/high frequencies was adopted.
In a resistance-capacitor equivalent circuit description, the semi-circle diameter of a
Nyquist plot corresponds to an electrical resistance assigned to a specific

78
phenomenon, such as the existence of a surface layer or to the charge transfer
processes, which reflects the corrosion resistance. Therefore, qualitatively, the
increasing diameter of Nyquist plots (Figure 40), points out the increase in corrosion
resistance due to thermomechanical processing. The highest corrosion resistance
results from the ECAP processing. The Bode plots (Figure 41) were used to identify
the characteristic time constants and therefore the number of electrochemical
phenomena that should be considered to model the Nyquist plots.
Figure 41: Bode plots of the as-cast and the thermomechanically processed samples at the initial state.
The Bode phase plots in Figure 41 can be described in three frequency domains. The
medium and high frequency domains are characterized by the presence of two time
constants: � and � . The time frequency constant at low frequency reflects the active
corrosion process and is usually explained as the result of surface relaxation processes
of adsorbed species on the electrode surface, and in particular, adsorbed Mg+ reacting
to Mg2+ or MgOH+ [146], [147]. This process is associated with an inductive
behavior of the system with a slight decrease of the impedance modulus and a
positive phase shift. Such inductive behavior does not seem to occur in the sample
processed by ECAP at the explored frequencies. For magnesium and magnesium
alloys, Wen et al. [148] have reported that the mechanism involved at medium and
high frequencies can be respectively related to the build-up of a surface layer due to
the accumulation of protective corrosion products and to the charge transfer
processes. The corrosion process involves strong alkalization of the interface and thus
the growth of a stable and insoluble layer of corrosion products. In spite of its
stability, the corrosion products layer is not completely protective and there are

79
defects, allowing electrolyte uptake and the charge transfer processes to occur. In this
situation the impedance response is governed by two constant phase elements (CPE)
in parallel: one accounting for the film resistance and capacitance and another one
accounting for the charge transfer and double layer response [149]. Concerning the
medium frequencies response, the maximum phase angles for the samples extruded at
400 °C and processed by ECAP are higher than the one of as-cast. The range of
frequencies of this capacitive behavior is also wider toward lower values. This shows
a more marked capacitive response of the samples which may be related to more
stable and protective oxide layers.
Both time constants at medium and high frequencies are modelled by
resistance-capacitor parallel circuit, in agreement with earlier works [18], [148],
[150]. In these circuits, constant phase elements (CPE) are used to account for the
imperfect capacitance of the phenomena. The equivalent circuit is displayed in Figure
42 with Rs corresponding to the resistance of the electrolytic solution and the two
R-C circuits (a resistance with a CPE in parallel). The resistance R1 refers to the
oxide and charge transfer resistances of the sample while the CPE1 is the constant
phase element that describes the imperfect capacitor resulting from the interfacial
phenomena at the metal electrolyte interface. The medium frequency resistance can
be assigned to the resistance to mass transport through the film formed: R2, and its
CPE2.
Figure 42: Equivalent circuit of the as-cast and thermomechanically processed samples immersed in Hanks solution where R stands for a resistance component and CPE stands for a constant phase element.
A quantitative analysis based on the equivalent circuits described above was carried
out using the EIS Spectrum Analyzer software [136]. From this analysis a global
resistance = + which describes the evolution of the global corrosion
resistance of the samples can be derived. Thus, for the investigated samples, a global

80
resistance in function of the immersion time was obtained. These results are gathered
in Figure 43 showing the evolution of the total resistance with immersion time for
as-cast and thermomechanically processed samples.
Figure 43: Evolution of the total resistance, Rtot, with immersion time in Hanks solution of the as-cast and thermomechanically processed materials.
According to Figure 43, except for the sample processed by ECAP, the resistance
rapidly decreases with the immersion time, with a less pronounced impact for the
sample extruded at 400 °C. After 3 H of immersion, as-cast sample revealed intense
corrosion activity with visible release of gas bubbles and the EIS measurement was
stopped. In parallel, the corrosion resistance of the rolled sample begins to slowly
increase which might be due to the accumulation of the insoluble corrosion products
like carbonates and phosphates. The two samples: extruded at 400 °C and processed
by ECAP, exhibit higher initial corrosion resistance as evidenced in the Nyquist and
Bode plots. The corrosion resistance of the sample extruded at 400 °C decreases with
immersion time but less rapidly than that of the as-cast and rolled samples. After a
24 H of immersion, rolled and extruded samples display similar corrosion resistance.
Concerning the sample processed by ECAP, except for an anomalous point at 3 H,
the corrosion resistance stays remarkably high and almost constant for immersion
time up to 48 H. The low frequency resistance at 3 H immersion probably only
results from a local breaking of the corrosion products layer due to its instability
and/or to the manipulation during measurements. The quantitative analysis of the
EIS plots strongly supports the increased corrosion resistance of the sample processed
by ECAP for a long immersion time in Hanks solution, as confirmed by the

81
qualitative analysis. This is in agreement with the mass loss rate reported in Figure
39.
For further understanding of the evolution of both the mechanical properties and
corrosion behavior after thermomechanical processing, observations of the
microstructure evolution have been done. In the following part, these observations
will be presented, and the relation between microstructures and properties will be
also discussed.
4.5 M ultiscale characterization of the
microstructure
4.5.1 Grain microstructure evolution
A first series of observations has been made with classical metallography: light
microscopy and etching to reveal the grain boundaries. Figure 44 displays the
different micrographs obtained for the as-cast and thermomechanically processed
samples.

82
(a) (b)
(c) (d)
(e)
Figure 44: Optical micrographs of differently processed samples after etching: (a) as-cast, (b) rolled at 400 °C, (c) extruded at 200 °C, (d) extruded at 400 °C and (e) processed by ECAP. Note: For a better description of the as-cast sample, fig. (a), a SEM image is given in the insert.
The as-cast sample consists of large grains (Figure 44 (a)), containing magnesium
dendrites separated by a thin eutectic mixture (SEM insert Figure 44 (a)). The
sample rolled at 400 °C, Figure 44 (b) shows an inhomogeneous microstructure with
an average grain size of 25 µm. The presence of twins can also be noticed (marked by
arrows in Figure 44 (b)). During the process for rolling, the sample was hold at
400 °C between each pass. This short annealing may have been sufficient to allow
dislocation motion and therefore the driving force for the recrystallization process.
After extrusion at 200 °C, Figure 44 (c), no small grains were observed probably
because at such a low temperature recrystallization has not occurred. This is
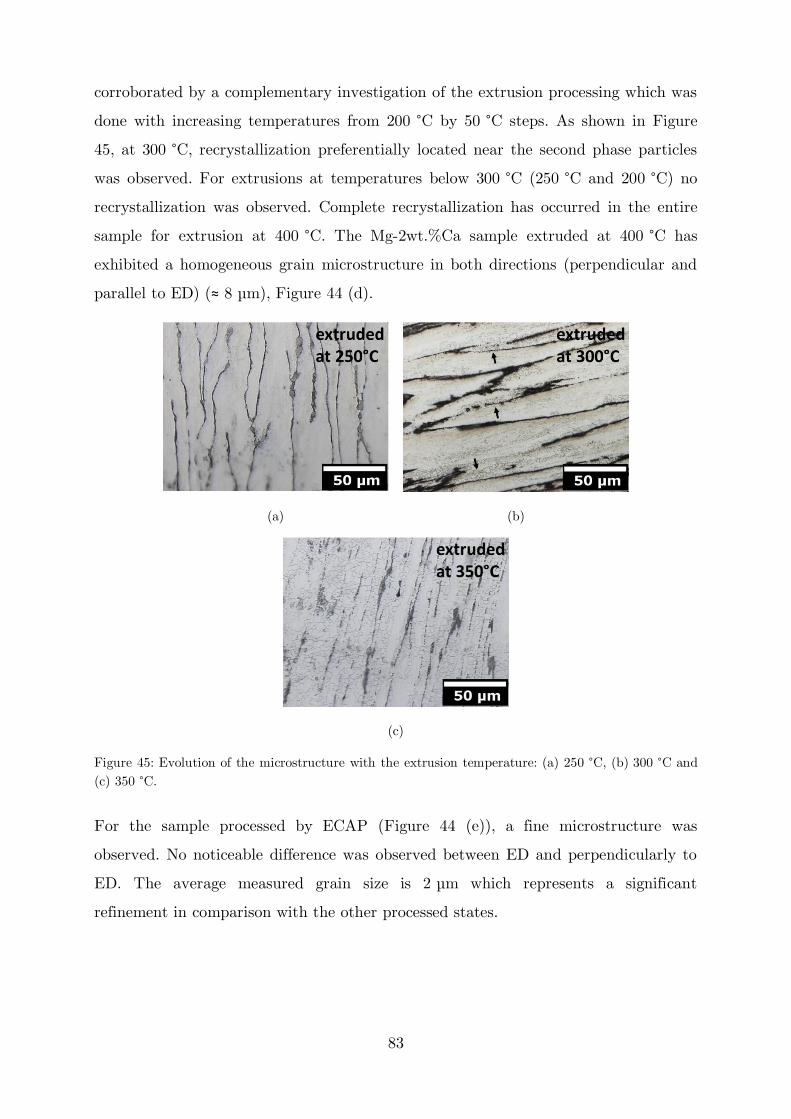
83
corroborated by a complementary investigation of the extrusion processing which was
done with increasing temperatures from 200 °C by 50 °C steps. As shown in Figure
45, at 300 °C, recrystallization preferentially located near the second phase particles
was observed. For extrusions at temperatures below 300 °C (250 °C and 200 °C) no
recrystallization was observed. Complete recrystallization has occurred in the entire
sample for extrusion at 400 °C. The Mg-2wt.%Ca sample extruded at 400 °C has
exhibited a homogeneous grain microstructure in both directions (perpendicular and
parallel to ED) (≈ 8 µm), Figure 44 (d).
(a) (b)
(c)
Figure 45: Evolution of the microstructure with the extrusion temperature: (a) 250 °C, (b) 300 °C and (c) 350 °C.
For the sample processed by ECAP (Figure 44 (e)), a fine microstructure was
observed. No noticeable difference was observed between ED and perpendicularly to
ED. The average measured grain size is 2 µm which represents a significant
refinement in comparison with the other processed states.

84
4.5.2 Second phase evolution
To complete the grain microstructure evolution study, as the starting material is a
two phases material, SEM observations has been performed to evaluate more
specifically the evolution of the second phase areas by thermomechanical processing,
Figure 46. It is worth mentioning that z-contrast SEM imaging does not differentiate
between the Mg-Mg2Ca eutectic mixture and Mg2Ca particles. As the first step, SEM
allows to localize the second phase rich areas, TEM observations will be necessary in
the future for more detailed studies. In Figure 46 (a), a TEM image is given in the
insert to show the detailed microstructure of the interdendritic area: alternate
lamellae of Mg and Mg2Ca Laves phase with a halo of Mg2Ca Laves phase at the
dendrite/eutectic mixture interface.

85
(a) (b)
(c) (d)
(e)
Figure 46: SEM observations of (a) as-cast sample and after different thermomechanical processing: (b) rolling at 400 °C, (c) extrusion at 200 °C, (d) extrusion at 400 °C and (e) processed by ECAP. Note: For a better description of the as-cast sample, fig. (a), a TEM image is given in the insert.
The cast alloy microstructure shows large dendrites separated by the Mg-Mg2Ca
eutectic mixture. The eutectic mixture forms a 3D skeleton. Since Mg2Ca phase, as
all Laves phases, is very brittle [151], a significant evolution of the second phase
microstructure with thermomechanical processing can be expected.
After rolling, the eutectic mixture skeleton shows many disconnections as pointed by
the arrows in Figure 46 (b). Also after extrusion at 200 °C, Figure 46 (c) indicates
important changes in the eutectic mixture skeleton. Indeed, after the 200 °C
extrusion the skeleton arms appear very elongated and disconnected in many points.
As illustrated by Figure 46 (d), after extrusion at 400 °C, more pronounced changes

86
in the second phase microstructure have occurred. For additional information, Figure
47 is displayed to show different views of the sample at a higher magnification.
(a) (b)
Figure 47: SEM observations of a sample extruded at 400 °C: (a) perpendicularly to the extrusion direction and (b) parallel to the extrusion direction.
On the view perpendicular to the extrusion direction, the fragments of the eutectic
mixture seem uniformly dispersed. On the view parallel to the extrusion direction,
the skeleton of eutectic mixture has been fragmented in small pieces and dispersed
following the extrusion direction. The size distribution of the fragments is rather
heterogeneous. Indeed, if with a closer look at the microstructure using TEM, it is
possible to note the presence of very fine particles of Mg2Ca, Figure 48.
(a) (b)
Figure 48: TEM observations: bright field of areas of second phase particles after extrusion at 400 °C.
Detailed observations of the microstructures as displayed in Figure 46 (e) show that
the eutectic mixture was strongly modified by the ECAP process: very small particles
are observed (between 100 nm and 600 nm according to the image analysis). The size
of these particles matches the ones of the Mg2Ca lamellae in the cast eutectic
mixture. Thus, this suggests that the formation of the fine particles result from the
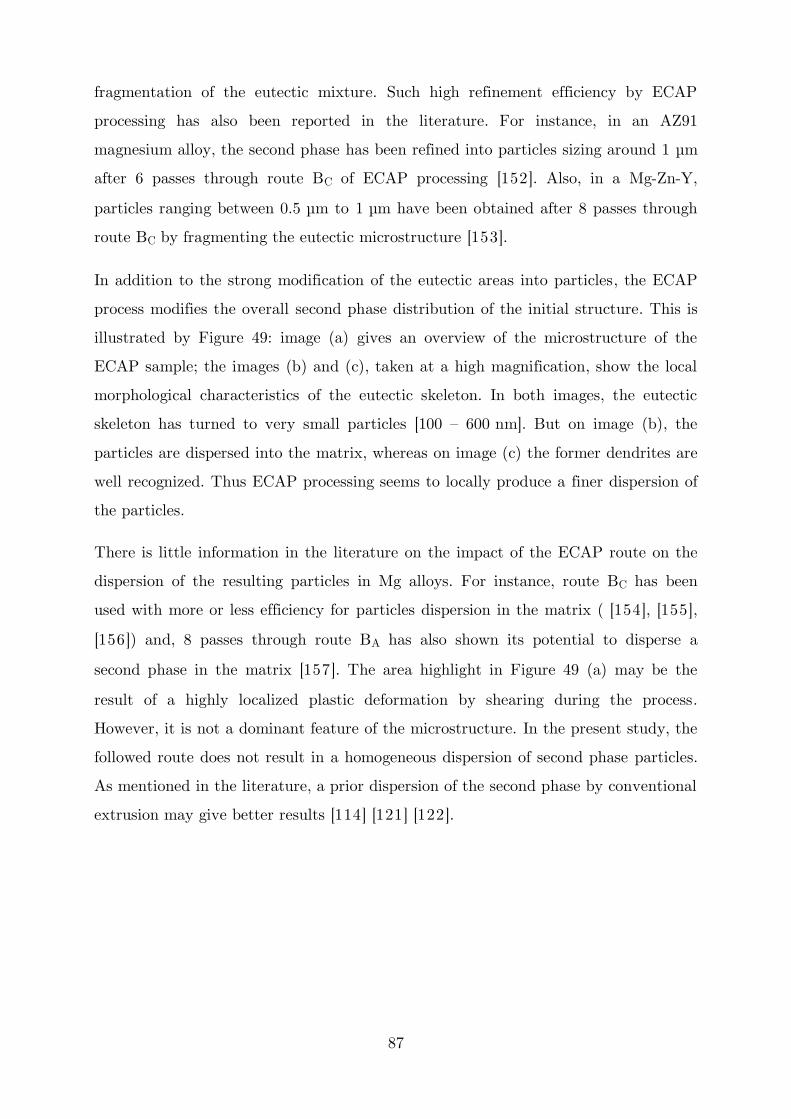
87
fragmentation of the eutectic mixture. Such high refinement efficiency by ECAP
processing has also been reported in the literature. For instance, in an AZ91
magnesium alloy, the second phase has been refined into particles sizing around 1 µm
after 6 passes through route BC of ECAP processing [152]. Also, in a Mg-Zn-Y,
particles ranging between 0.5 µm to 1 µm have been obtained after 8 passes through
route BC by fragmenting the eutectic microstructure [153].
In addition to the strong modification of the eutectic areas into particles, the ECAP
process modifies the overall second phase distribution of the initial structure. This is
illustrated by Figure 49: image (a) gives an overview of the microstructure of the
ECAP sample; the images (b) and (c), taken at a high magnification, show the local
morphological characteristics of the eutectic skeleton. In both images, the eutectic
skeleton has turned to very small particles [100 – 600 nm]. But on image (b), the
particles are dispersed into the matrix, whereas on image (c) the former dendrites are
well recognized. Thus ECAP processing seems to locally produce a finer dispersion of
the particles.
There is little information in the literature on the impact of the ECAP route on the
dispersion of the resulting particles in Mg alloys. For instance, route BC has been
used with more or less efficiency for particles dispersion in the matrix ( [154], [155],
[156]) and, 8 passes through route BA has also shown its potential to disperse a
second phase in the matrix [157]. The area highlight in Figure 49 (a) may be the
result of a highly localized plastic deformation by shearing during the process.
However, it is not a dominant feature of the microstructure. In the present study, the
followed route does not result in a homogeneous dispersion of second phase particles.
As mentioned in the literature, a prior dispersion of the second phase by conventional
extrusion may give better results [114] [121] [122].
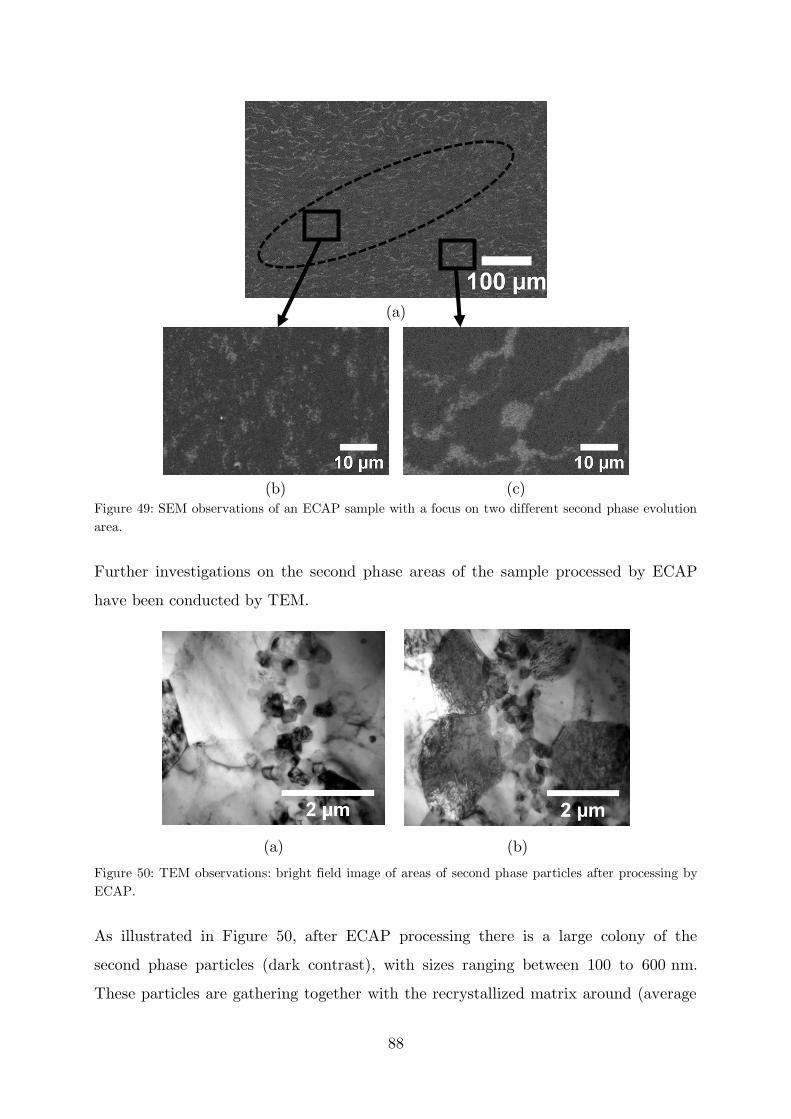
88
(a)
(b) (c)
Figure 49: SEM observations of an ECAP sample with a focus on two different second phase evolution area.
Further investigations on the second phase areas of the sample processed by ECAP
have been conducted by TEM.
(a) (b)
Figure 50: TEM observations: bright field image of areas of second phase particles after processing by ECAP.
As illustrated in Figure 50, after ECAP processing there is a large colony of the
second phase particles (dark contrast), with sizes ranging between 100 to 600 nm.
These particles are gathering together with the recrystallized matrix around (average
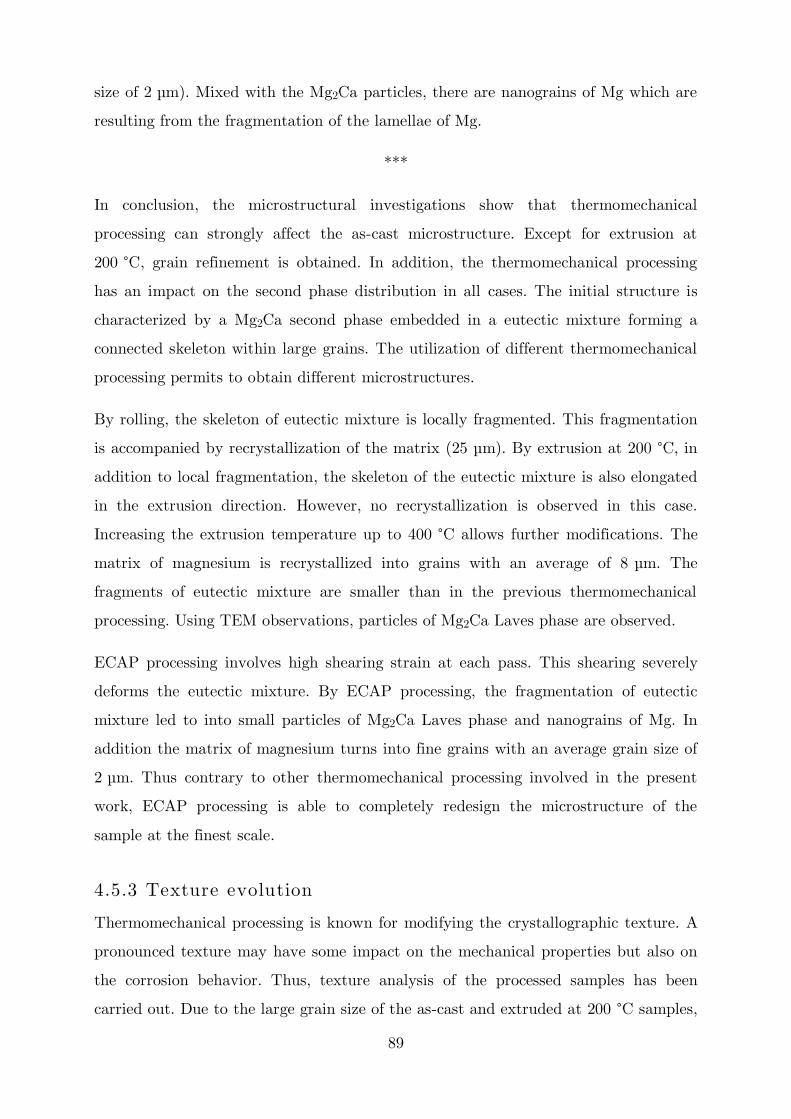
89
size of 2 µm). Mixed with the Mg2Ca particles, there are nanograins of Mg which are
resulting from the fragmentation of the lamellae of Mg.
***
In conclusion, the microstructural investigations show that thermomechanical
processing can strongly affect the as-cast microstructure. Except for extrusion at
200 °C, grain refinement is obtained. In addition, the thermomechanical processing
has an impact on the second phase distribution in all cases. The initial structure is
characterized by a Mg2Ca second phase embedded in a eutectic mixture forming a
connected skeleton within large grains. The utilization of different thermomechanical
processing permits to obtain different microstructures.
By rolling, the skeleton of eutectic mixture is locally fragmented. This fragmentation
is accompanied by recrystallization of the matrix (25 µm). By extrusion at 200 °C, in
addition to local fragmentation, the skeleton of the eutectic mixture is also elongated
in the extrusion direction. However, no recrystallization is observed in this case.
Increasing the extrusion temperature up to 400 °C allows further modifications. The
matrix of magnesium is recrystallized into grains with an average of 8 µm. The
fragments of eutectic mixture are smaller than in the previous thermomechanical
processing. Using TEM observations, particles of Mg2Ca Laves phase are observed.
ECAP processing involves high shearing strain at each pass. This shearing severely
deforms the eutectic mixture. By ECAP processing, the fragmentation of eutectic
mixture led to into small particles of Mg2Ca Laves phase and nanograins of Mg. In
addition the matrix of magnesium turns into fine grains with an average grain size of
2 µm. Thus contrary to other thermomechanical processing involved in the present
work, ECAP processing is able to completely redesign the microstructure of the
sample at the finest scale.
4.5.3 Texture evolution
Thermomechanical processing is known for modifying the crystallographic texture. A
pronounced texture may have some impact on the mechanical properties but also on
the corrosion behavior. Thus, texture analysis of the processed samples has been
carried out. Due to the large grain size of the as-cast and extruded at 200 °C samples,

90
a texture analysis of these states would not be meaningful. Thus, texture
measurements were performed only on the following states: rolled, extruded at 400 °C
and processed by ECAP. The sample being a two phase alloy, it could have been
interesting to study both phases. However, the volume fraction of the eutectic
mixture being very small (0.08), in the present experimental set-up, the intensity
diffracted by Mg2Ca could not be detected. Thus, only magnesium phase has been
selected for the analysis. Based on the crystallographic structure of magnesium
(h.c.p.), the following planes have been analysed: , ̅ and ̅ (Figure
51).
Figure 51: The magnesium unit cell crystal with principal planes [12].
For each condition, the 3D representations of pole figures, as well as 2D
representations, are displayed. The colour scale is a relative scale based on the
maximum of intensity that was measured for the whole batch of samples, Figure 52.
Intensity
0 1 2 3 4 5 6 7 8 9 10 11 12
Figure 52: Intensity colour scale of pole figures.

91
View ̅ ̅
Rolled
Figure 53: Pole figures of the rolled sample.
Figure 53 displays the pole figures obtained on the rolled sample. In the pole figures
associated with the plane , a strong and rather large peak is present at the
centre of the pole figure. Such crystallographic orientation suggests a basal texture of
the sample with the basal planes parallel to the rolling surface. On the pole figure
associated with the plane ̅ , no visible peak is detected near the centre.
However there is an almost complete ring of low signal intensity near the periphery of
the pole figure. This is in agreement with the rather large peak observed for the plane
. This plane being perpendicular to the basal plane, the measured intensities of
both planes are correlated. A central peak would have suggested the existence of
peripheral pics on the pole figure of plane . Indeed, there is a dark area at the
periphery of each pole figure were the signal cannot be measured. Thus it is worth to
complete an investigation with a complementary plane.
It is well known that h.c.p. material like magnesium exhibits a high tendency to
deform by twinning [12]. When a crystal of magnesium has its c-axis perpendicular
to the stress, slip on the pyramidal plane type II requires a higher stress than
twinning { ̅ }, then a reorganization occurs by a rotation of 86.3 ° of the basal
plan. Therefore, rolling is expected to produce many grains with the c-axis
rom
rom
rom
rom
rom
rom
rom
rom
m 1
m 1
m 1
m 1
m 1
m 1
m 1
m 1
m 1
m 1
m 1
m 1
m 1
m 1
m 1
m 1
m 1
m 1
m 1
m 1
m 1
m 1
m 1
m 1
m 1
m 1
m 1
m 1
m 1
m 1
m 1
m 1
m 1
m 1
m 1
m 1
m 1
m 1
m 1
m 1
m 1
m 1
m 1
m 1
m 1
m 1
m 1
m 1
m 1
m 1
m 1
m 1
m 1
m 1
m 1
m 1
m 1
m 1
m 1
m 9
m 9
m 9
m 9
m 9
m 9
m 9
m 9
m 9
m 9
m 8
m 8
m 8
m 8
m 8
m 8
m 8
m 8
m 8
m 8
m 7
m 7
m 7
m 7
m 7
m 7
m 7
m 7
m 7
m 7
m 6
m 6
m 6
m 6
m 6
m 6
m 6
m 6
m 6
m 6
m 5
m 5
m 5
m 5
m 5
m 5
m 5
m 5
m 5
m 5
m 4
m 4
m 4
m 4
m 4
m 4
m 4
m 4
m 4
m 4
m 3
m 3
m 3
m 3
m 3
m 3
m 3
m 3
m 3
m 3
m 2
m 2
m 2
m 2
m 2
m 2
m 2
m 2
m 2
m 2
m 1
m 1
m 1
m 1
m 1
m 1
m 1
m 1
m 1
m 1
m 9
m 8
m 7
m 6
m 5
m 4
m 3
m 2
m 1
m 0
low
m 1
m 1
m 1
m 1
m 1
m 1
m 1
m 1
m 1
m 1
m 1
m 1
m 1
m 1
m 1
m 1
m 1
m 1
m 1
m 1
m 1
m 1
m 1
m 1
m 1
m 9
m 9
m 9
m 9
m 9
m 8
m 8
m 8
m 7
m 7
m 7
m 6
m 6
m 6
m 6
m 5
m 5
m 5
m 5
m 5
m 4
m 4
m 4
m 3
m 3
m 3
m 2
m 2
m 2
m 2
m 1
m 1
m 1
m 1
m 1
m 4
m 3
m 2
m 1
m 1
m 1
m 1
m 1
m 1
m 1
m 1
m 1
m 1
m 1
m 1
m 1
m 1
m 1
m 1
m 1
m 1
m 1
m 1
m 1
m 1
m 1
m 1
m 1
m 1
m 1
m 1
m 1
m 1
m 1
m 1
m 1
m 1
m 1
m 1
m 1
m 1
m 9
m 9
m 9
m 9
m 9
m 8
m 8
m 8
m 8
m 8
m 7
m 7
m 7
m 7
m 7
m 6
m 6
m 6
m 6
m 6
m 5
m 5
m 5
m 5
m 5
m 4
m 4
m 4
m 4
m 4
m 3
m 3
m 3
m 3
m 3
m 2
m 2
m 2
m 2
m 2
m 1
m 1
m 1
m 1
m 1
m 8
m 6
m 4
m 2
m 0

92
perpendicular to the rolling direction [158]. The present texture is then a typical
texture of hot rolling [159].
View ̅ ̅
Extruded at 400°C
Figure 54: Pole figures of the extruded at 400 °C sample (cylindrical die).
Figure 54 displays the pole figures of the sample extruded at 400 °C. In these pole
figures it is possible to note the presence of noise. On the pole figure of the plane ̅ there is two peaks near the centre. These peaks are in agreement with the
pole figure of the plane : a partial ring of signal with an intense peak near the
periphery. However, there is also a peak near the centre of the pole figure of the
plane . Finally, there are also few peaks near the centre of the pole figure for
the plane ̅ .
In the literature, it is reported that direct extrusion generally produces a typical
texture with the c-axis preferentially oriented perpendicularly to the extrusion
direction [160]. In the present case, such texture should induce the formation of an
intense peak near the centre for the plane ̅ . Based on the previous
observations; some grains are orientated with their c-axis in accordance with this
texture. However, there are also other peaks from the other planes. Thus, there is no
strong fibre texture in the present sample.
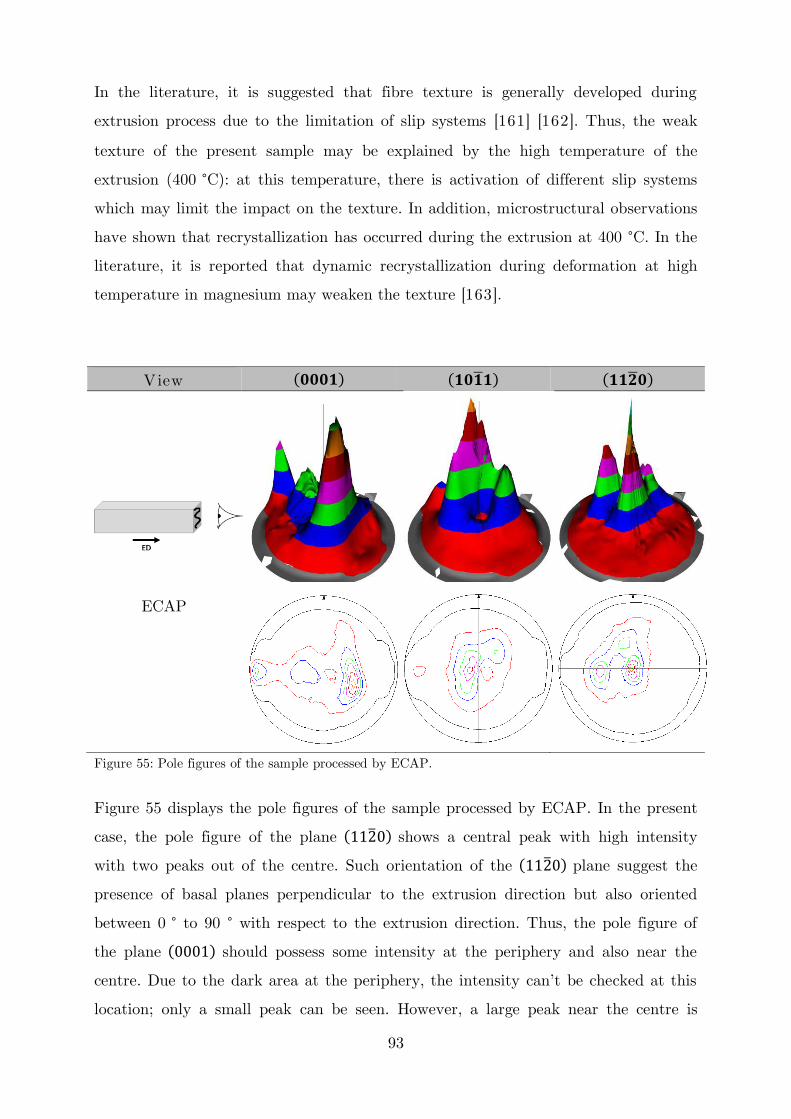
93
In the literature, it is suggested that fibre texture is generally developed during
extrusion process due to the limitation of slip systems [161] [162]. Thus, the weak
texture of the present sample may be explained by the high temperature of the
extrusion (400 °C): at this temperature, there is activation of different slip systems
which may limit the impact on the texture. In addition, microstructural observations
have shown that recrystallization has occurred during the extrusion at 400 °C. In the
literature, it is reported that dynamic recrystallization during deformation at high
temperature in magnesium may weaken the texture [163].
View ̅ ̅
ECAP
Figure 55: Pole figures of the sample processed by ECAP.
Figure 55 displays the pole figures of the sample processed by ECAP. In the present
case, the pole figure of the plane ̅ shows a central peak with high intensity
with two peaks out of the centre. Such orientation of the ̅ plane suggest the
presence of basal planes perpendicular to the extrusion direction but also oriented
between 0 ° to 90 ° with respect to the extrusion direction. Thus, the pole figure of
the plane should possess some intensity at the periphery and also near the
centre. Due t” the dark area at the periphery, the i“te“sity ca“’t be checked at this location; only a small peak can be seen. However, a large peak near the centre is
m 1
m 1
m 1
m 1
m 1
m 1
m 1
m 1
m 1
m 1
m 1
m 1
m 1
m 1
m 1
m 1
m 1
m 1
m 1
m 1
m 1
m 1
m 1
m 1
m 1
m 1
m 1
m 1
m 1
m 1
m 1
m 1
m 1
m 1
m 1
m 1
m 1
m 1
m 1
m 1
m 1
m 1
m 1
m 1
m 1
m 1
m 1
m 1
m 1
m 1
m 1
m 1
m 1
m 1
m 1
m 1
m 1
m 1
m 1
m 1
m 1
m 1
m 1
m 1
m 1
m 1
m 1
m 9
m 9
m 9
m 9
m 9
m 9
m 9
m 9
m 9
m 9
m 8
m 8
m 8
m 8
m 8
m 8
m 8
m 8
m 8
m 8
m 7
m 7
m 7
m 7
m 7
m 7
m 7
m 7
m 7
m 7
m 6
m 6
m 6
m 6
m 6
m 6
m 6
m 6
m 6
m 6
m 5
m 5
m 5
m 5
m 5
m 5
m 5
m 5
m 5
m 5
m 4
m 4
m 4
m 4
m 4
m 4
m 4
m 4
m 4
m 4
m 3
m 3
m 3
m 3
m 3
m 3
m 3
m 3
m 3
m 3
m 2
m 2
m 2
m 2
m 2
m 2
m 2
m 2
m 2
m 2
m 1
m 1
m 1
m 1
m 1
m 1
m 1
m 1
m 1
m 1
m 9
m 8
m 7
m 6
m 5
m 4
m 3
m 2
m 1
m 0
low
om
om
om
om
om
om
om
om
m 1
m 1
m 1
m 1
m 1
m 1
m 1
m 1
m 1
m 1
m 1
m 1
m 1
m 1
m 1
m 1
m 1
m 1
m 1
m 1
m 1
m 1
m 1
m 1
m 1
m 1
m 1
m 1
m 1
m 1
m 1
m 1
m 1
m 1
m 1
m 1
m 1
m 1
m 1
m 1
m 1
m 1
m 1
m 1
m 1
m 1
m 1
m 1
m 1
m 1
m 1
m 1
m 1
m 1
m 1
m 1
m 1
m 1
m 1
m 9
m 9
m 9
m 9
m 9
m 9
m 9
m 9
m 9
m 9
m 8
m 8
m 8
m 8
m 8
m 8
m 8
m 8
m 8
m 8
m 7
m 7
m 7
m 7
m 7
m 7
m 7
m 7
m 7
m 7
m 6
m 6
m 6
m 6
m 6
m 6
m 6
m 6
m 6
m 6
m 5
m 5
m 5
m 5
m 5
m 5
m 5
m 5
m 5
m 5
m 4
m 4
m 4
m 4
m 4
m 4
m 4
m 4
m 4
m 4
m 3
m 3
m 3
m 3
m 3
m 3
m 3
m 3
m 3
m 3
m 2
m 2
m 2
m 2
m 2
m 2
m 2
m 2
m 2
m 2
m 1
m 1
m 1
m 1
m 1
m 1
m 1
m 1
m 1
m 1
m 9
m 8
m 7
m 6
m 5
m 4
m 3
m 2
m 1
m 0
low
m 1
m 1
m 1
m 1
m 1
m 1
m 1
m 1
m 1
m 1
m 1
m 1
m 1
m 1
m 1
m 1
m 1
m 1
m 1
m 1
m 1
m 1
m 1
m 1
m 1
m 1
m 1
m 1
m 1
m 1
m 1
m 1
m 1
m 1
m 1
m 1
m 1
m 1
m 1
m 1
m 1
m 1
m 1
m 1
m 1
m 1
m 1
m 1
m 1
m 1
m 1
m 1
m 1
m 1
m 1
m 1
m 1
m 1
m 1
m 1
m 1
m 1
m 1
m 1
m 1
m 1
m 1
m 9
m 9
m 9
m 9
m 9
m 9
m 9
m 9
m 9
m 9
m 8
m 8
m 8
m 8
m 8
m 8
m 8
m 8
m 8
m 8
m 7
m 7
m 7
m 7
m 7
m 7
m 7
m 7
m 7
m 7
m 6
m 6
m 6
m 6
m 6
m 6
m 6
m 6
m 6
m 6
m 5
m 5
m 5
m 5
m 5
m 5
m 5
m 5
m 5
m 5
m 4
m 4
m 4
m 4
m 4
m 4
m 4
m 4
m 4
m 4
m 3
m 3
m 3
m 3
m 3
m 3
m 3
m 3
m 3
m 3
m 2
m 2
m 2
m 2
m 2
m 2
m 2
m 2
m 2
m 2
m 1
m 1
m 1
m 1
m 1
m 1
m 1
m 1
m 1
m 1
m 9
m 8
m 7
m 6
m 5
m 4
m 3
m 2
m 1
m 0
low

94
accompanied by another one of lower intensity. The pole figure of the plane ̅
also shows intense peak near the centre of the figure. Thus, these pole figures suggest
that no preferential texture has been achieved by ECAP processing.
Route BA used in the present work was chosen for the activation of different shear
planes at each rotation, i.e. less redundant strain than with another route. As
suggested by Wan et al. [164], formation of a strong texture with route A and C may
be due to the accumulative shear strain on the same planes. Thus, in the present
case, the weak texture may result from the alternation of shear plane.
4.6 M icrostructure-property relationships
4.6.1 M icrostructure and mechanical behavior
Relevant microstructural parameters for mechanical properties are the grain size,
texture, density of dislocations, morphology and density of precipitates. From the
present optical and SEM investigations some characteristics of these parameters are
known. Table 12 gives a summary of the main microstructural features and the
mechanical properties for the as-cast and thermomechanically processed materials.

95
Table 12: Microstructural features of the thermomechanically processed samples with the associated mechanical properties.
Grain size
2nd phase Texture Hardness U ltimate strength (M Pa)
Maximum compression strain
As-cast Several mm
Connected skeleton
- 40 ± 7 186 0.14
Rolled at 400 °C
≈ 25 µm + twins
Fragmented skeleton
Fibre 64 ± 7 - -
Extruded at 200 °C
Several mm + twins
Fragmented + elongated skeleton
- 70 ± 6 277 0.02
Extruded at 400 °C
≈ 8 µm Fragments + particles
Weak 46 ± 8 359 0.14
ECAP ≈ 2 µm Particles [100–600 nm]
Weak 72 ± 3 325 0.20
The large grain size of the as-cast material is typical of the solidification
microstructure and compatible with the measured low hardness. Each
thermomechanical processing method has resulted in hardening. Concerning the
rolled sample, different mechanisms may play a role in the hardness increase. Twins
are known to reduce the dislocation motion in the basal direction [25]. Thus, the
presence of twins may participate in the increase of hardness. Also, the rolled sample
shows a strong texture with basal planes parallel to the rolling direction which was
the indentation surface. This may have participated in the hardness increase as it has
been reported the higher hardness of basal grains compared to non-basal grains [26].
The rolled sample was also subjected to short annealing which may has permitted the
recrystallization process. However, the annealing was only 2 min and no annealing
has been performed after the last pass. Thus, an additional effect due to work
hardening may be suggested.
The sample extruded at 200 °C displays no recrystallization. This sample shows one
of the highest hardness values and the lowest ductility. Thus, in this case, work
hardening may be a major parameter, accounting for hardness increase. With SEM
observations, it has also been noted that during the extrusion, an elongation of the
second phase skeleton occur. This elongation leads to a reduction of the characteristic
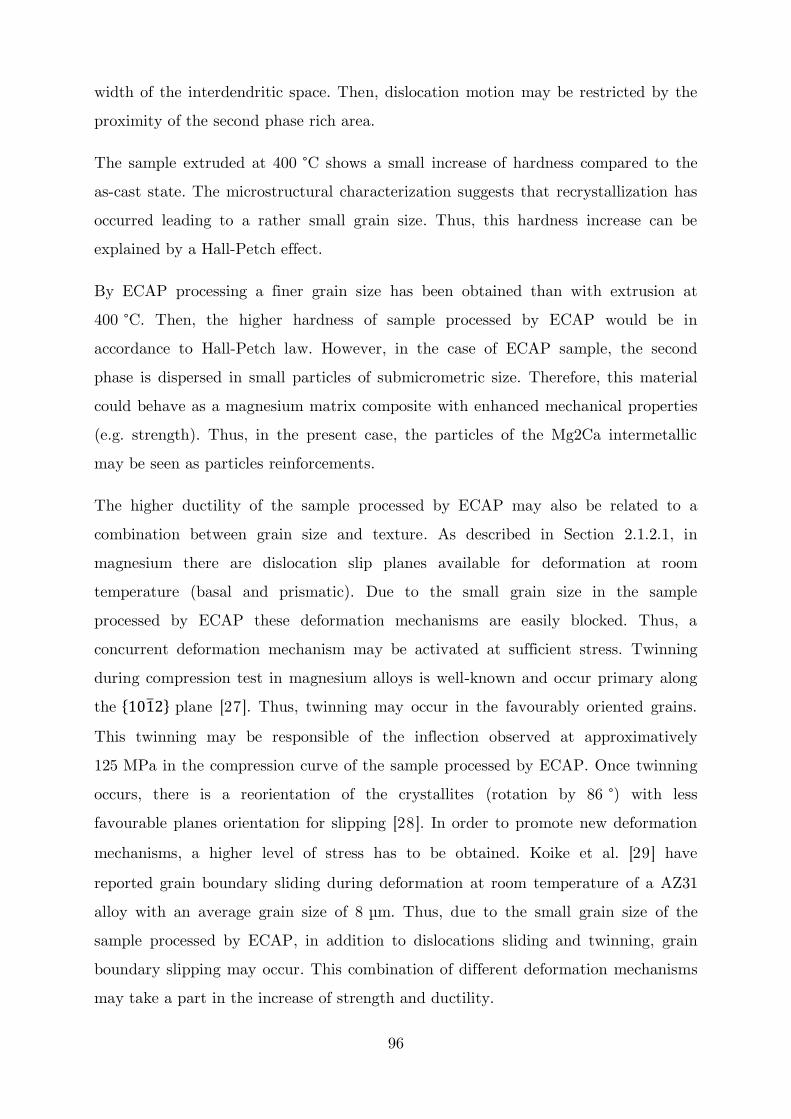
96
width of the interdendritic space. Then, dislocation motion may be restricted by the
proximity of the second phase rich area.
The sample extruded at 400 °C shows a small increase of hardness compared to the
as-cast state. The microstructural characterization suggests that recrystallization has
occurred leading to a rather small grain size. Thus, this hardness increase can be
explained by a Hall-Petch effect.
By ECAP processing a finer grain size has been obtained than with extrusion at
400 °C. Then, the higher hardness of sample processed by ECAP would be in
accordance to Hall-Petch law. However, in the case of ECAP sample, the second
phase is dispersed in small particles of submicrometric size. Therefore, this material
could behave as a magnesium matrix composite with enhanced mechanical properties
(e.g. strength). Thus, in the present case, the particles of the Mg2Ca intermetallic
may be seen as particles reinforcements.
The higher ductility of the sample processed by ECAP may also be related to a
combination between grain size and texture. As described in Section 2.1.2.1, in
magnesium there are dislocation slip planes available for deformation at room
temperature (basal and prismatic). Due to the small grain size in the sample
processed by ECAP these deformation mechanisms are easily blocked. Thus, a
concurrent deformation mechanism may be activated at sufficient stress. Twinning
during compression test in magnesium alloys is well-known and occur primary along
the { ̅ } plane [27]. Thus, twinning may occur in the favourably oriented grains.
This twinning may be responsible of the inflection observed at approximatively
125 MPa in the compression curve of the sample processed by ECAP. Once twinning
occurs, there is a reorientation of the crystallites (rotation by 86 °) with less
favourable planes orientation for slipping [28]. In order to promote new deformation
mechanisms, a higher level of stress has to be obtained. Koike et al. [29] have
reported grain boundary sliding during deformation at room temperature of a AZ31
alloy with an average grain size of 8 µm. Thus, due to the small grain size of the
sample processed by ECAP, in addition to dislocations sliding and twinning, grain
boundary slipping may occur. This combination of different deformation mechanisms
may take a part in the increase of strength and ductility.

97
To summarize, the microstructural investigation points out that the key features to
account for the improvement in the mechanical behavior are probably the grain size
reduction and the dispersion of the second phase particles in a fine scale distribution.
Both features can be tuned by the thermomechanical processing, that appears as a
very efficient tool for optimizing the mechanical properties of the studied
Mg-2wt.%Ca alloy. It is worth noting that the ECAP treatment is particularly
efficient because it is able to refine both the grain microstructure and the second
phase particle distribution.
4.6.2 M icrostructure and corrosion behavior
Table 13 reports the corrosion measurements of the as-cast and mechanically
processed materials with the associated microstructural observations.
Table 13: Microstructural features of the thermomechanically processed samples with the associated corrosion measurements.
Texture Grain size
2nd phase Mass loss rate (mg.cm -2.day -1)
R tot at t = 1H ( .cm 2)
As-cast - Several mm
Connected skeleton
3.6 200
Rolled at 400 °C
Fibre ≈ 25 µm + twins
Fragmented skeleton
1.5 150
Extruded at 200 °C
- Several mm + twins
Fragmented + elongated skeleton
0.4 -
Extruded at 400 °C
Weak ≈ 8 µm Fragments + particles
0.6 2400
ECAP Weak ≈ 2 µm Particles [100 – 600 nm]
0.1 11500
As described in the literature review, the corrosion behavior may be impacted by the
different parameters displayed in Table 13: grain size, second phase morphology and
texture. However, thermomechanical processing modifies all these parameters at the
same time. It is then difficult to isolate one effect for quantification. Nevertheless, in
the present case, one can note that increasing the equivalent strain from rolling to
extrusion and then ECAP processing, the associated mass loss rate decreases.
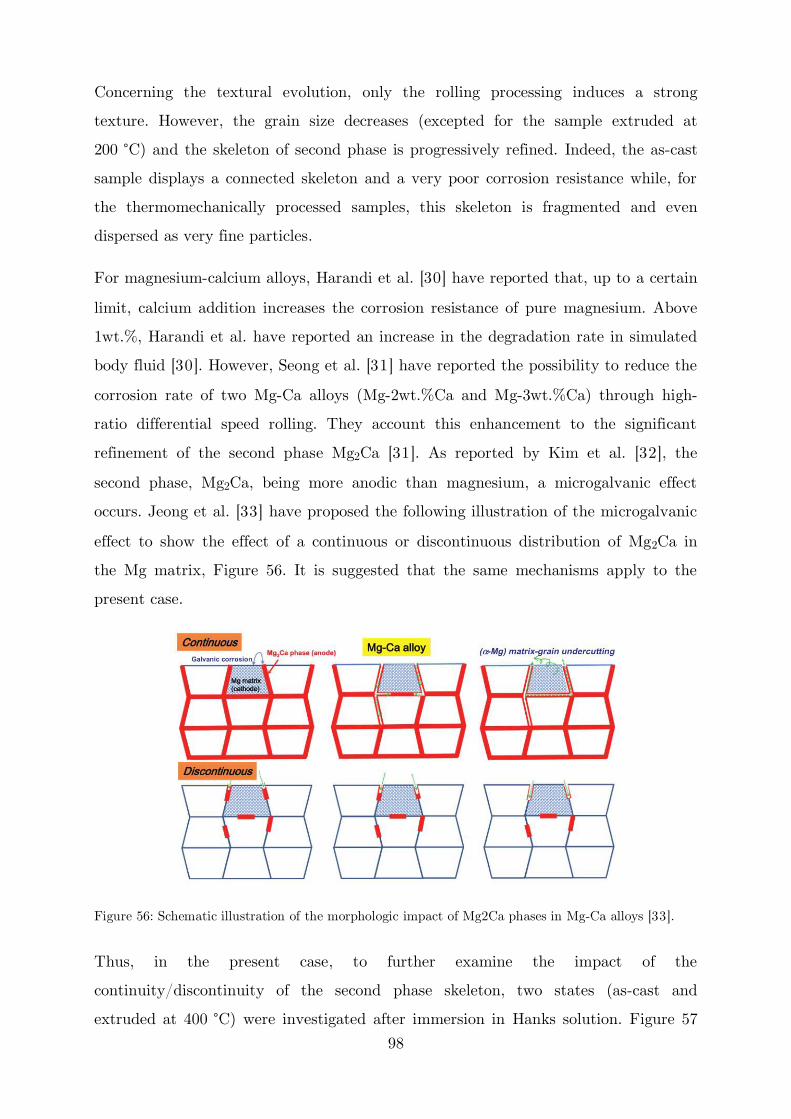
98
Concerning the textural evolution, only the rolling processing induces a strong
texture. However, the grain size decreases (excepted for the sample extruded at
200 °C) and the skeleton of second phase is progressively refined. Indeed, the as-cast
sample displays a connected skeleton and a very poor corrosion resistance while, for
the thermomechanically processed samples, this skeleton is fragmented and even
dispersed as very fine particles.
For magnesium-calcium alloys, Harandi et al. [30] have reported that, up to a certain
limit, calcium addition increases the corrosion resistance of pure magnesium. Above
1wt.%, Harandi et al. have reported an increase in the degradation rate in simulated
body fluid [30]. However, Seong et al. [31] have reported the possibility to reduce the
corrosion rate of two Mg-Ca alloys (Mg-2wt.%Ca and Mg-3wt.%Ca) through high-
ratio differential speed rolling. They account this enhancement to the significant
refinement of the second phase Mg2Ca [31]. As reported by Kim et al. [32], the
second phase, Mg2Ca, being more anodic than magnesium, a microgalvanic effect
occurs. Jeong et al. [33] have proposed the following illustration of the microgalvanic
effect to show the effect of a continuous or discontinuous distribution of Mg2Ca in
the Mg matrix, Figure 56. It is suggested that the same mechanisms apply to the
present case.
Figure 56: Schematic illustration of the morphologic impact of Mg2Ca phases in Mg-Ca alloys [33].
Thus, in the present case, to further examine the impact of the
continuity/discontinuity of the second phase skeleton, two states (as-cast and
extruded at 400 °C) were investigated after immersion in Hanks solution. Figure 57

99
displays the optical micrographs of these two samples after 7 days of immersion (for
these observations, corrosion products were removed).
(a) (b)
Figure 57: Optical observation of the cross sections of the corroded samples after 7days of immersion in Hanks solution: (a) as-cast and (b) extruded at 400 °C. Note that the interdendritic zones appearing with a black contrast are empty.
Figure 57 (a) shows that in the as-cast sample after corrosion, the connected skeleton
of the second phase is partly dissolved due to corrosion. In contrast to the sample
extruded at 400 °C does not show the same feature due to corrosion (Figure 57 (b)).
The as-cast sample, showed in Figure 57(a), exhibits extensive corrosion starting at
the surface and following the interdendritic areas. As a consequence, the corrosion
process has proceeded deeply inside the sample. The sample extruded at 400 °C
(Figure 57(b)) shows limited corrosion, starting from the periphery and no
penetration inside the sample. Figure 58 gives high magnification images of the
subsurface area of the corroded as-cast sample.
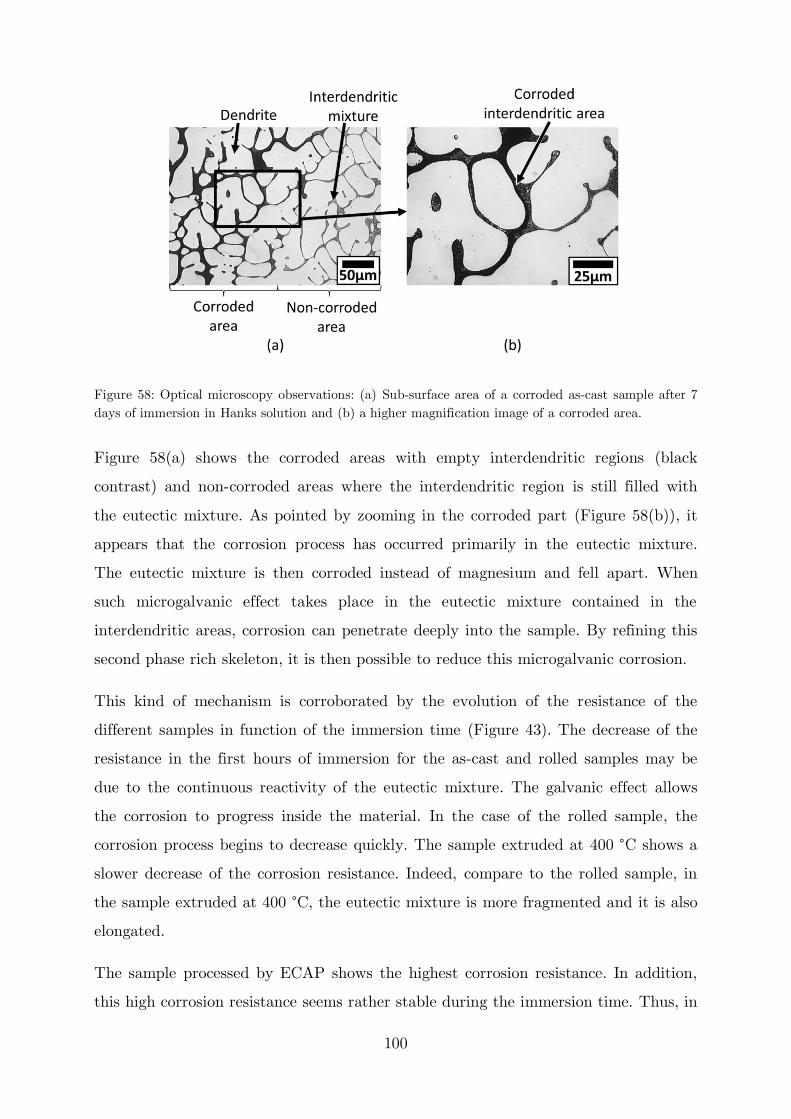
100
Figure 58: Optical microscopy observations: (a) Sub-surface area of a corroded as-cast sample after 7 days of immersion in Hanks solution and (b) a higher magnification image of a corroded area.
Figure 58(a) shows the corroded areas with empty interdendritic regions (black
contrast) and non-corroded areas where the interdendritic region is still filled with
the eutectic mixture. As pointed by zooming in the corroded part (Figure 58(b)), it
appears that the corrosion process has occurred primarily in the eutectic mixture.
The eutectic mixture is then corroded instead of magnesium and fell apart. When
such microgalvanic effect takes place in the eutectic mixture contained in the
interdendritic areas, corrosion can penetrate deeply into the sample. By refining this
second phase rich skeleton, it is then possible to reduce this microgalvanic corrosion.
This kind of mechanism is corroborated by the evolution of the resistance of the
different samples in function of the immersion time (Figure 43). The decrease of the
resistance in the first hours of immersion for the as-cast and rolled samples may be
due to the continuous reactivity of the eutectic mixture. The galvanic effect allows
the corrosion to progress inside the material. In the case of the rolled sample, the
corrosion process begins to decrease quickly. The sample extruded at 400 °C shows a
slower decrease of the corrosion resistance. Indeed, compare to the rolled sample, in
the sample extruded at 400 °C, the eutectic mixture is more fragmented and it is also
elongated.
The sample processed by ECAP shows the highest corrosion resistance. In addition,
this high corrosion resistance seems rather stable during the immersion time. Thus, in

101
addition to the drastic reduction of the galvanic effect due to the second phase
refinement, the high corrosion resistance of the microstructure processed by ECAP,
suggests that another parameter may enhance the corrosion behavior.
The other important microstructural parameter impacted by ECAP processing is the
grain size. Several studies on different magnesium alloys have reported that the
corrosion resistance improves with a reduction in the grain size [16], [34], [35], [36].
According to Kainer et al. [37], the high compression stresses between the magnesium
lattice and the oxide layer may lead to cracks into the oxide layer. Birbilis et al. [34]
have reported that a higher density of grain boundaries coupled with high
misorientation angles may help the stability of the oxide layer. This phenomenon
would account for a better corrosion resistance by grain refinement in the case of
ECAP processing.
The present interpretation was focussed on the major microstructural features,
namely grain size and second phase skeleton. However, texture is also known to
impact the corrosion resistance of magnesium alloys For instance the basal plane
orientation is suggested to provide a better corrosion resistance [38], [39]. In the
present case, the strong basal texture of the rolled sample may account for the high
increase of the corrosion resistance despite the limited fragmentation of the eutectic
mixture skeleton. However, for the other states, no preferential texture has been
observed thus it is not possible to conclude on the effect of texture in the present
work.
The presence of dislocations and twins in the microstructures can also modify the
corrosion behavior [36], [40]. Thermomechanical processes employed in this study
have also probably modified the dislocation density in addition to other
microstructural parameters. However, no obvious impact of dislocation density on
corrosion behavior has been detected. From this investigation, grain size and second
phase morphology appears as having the higher correlation with the corrosion
enhancement.
102
4.7 Conclusions
As a conclusion of this chapter, it is possible to point out the following points:
Thermomechanical processing appeared as an effective way to improve the
mechanical properties and corrosion resistance of a Mg-2wt.%Ca alloy. These
thermomechanical processing routes all result in tailoring the grain size and
second phase microstructure into finer features.
Comparison of the various processed samples indicates that the improvement
in the mechanical strength and the corrosion resistance are strongly affected
by the grain size evolution and the population of second phase particles. While
different microstructural features (dislocations, twins, grain size) can account
for the increase of the mechanical strength, the evolution of the corrosion
resistance appears as primarily affected by the second phase microstructure
and grain size. This influence results from the combination of a micro-galvanic
effect, the dispersion of the second phase Mg2Ca and possibly a more stable
oxide layer.
Severe plastic deformation induced by the ECAP process produces the finest
microstructure: grains and second phase particles with a highly improved
corrosion resistance in Hanks solution. In practice, the corrosion resistance is
evaluated to be about 40 times higher in the sample processed by ECAP
compared to the as-cast one. High level mechanical properties were also
obtained using ECAP. This processing makes possible to improve both
mechanical and corrosion behavior in a magnesium alloy containing only a
small amount of calcium.
103
5. Surface functionalization using
additive manufacturing
The goal of the present work is to improve the surface characteristics of a Mg-Ca
alloy for biomedical application as degradable implants. For this purpose, surface
functionalization is performed on thermomechanically processed samples with
improved mechanical and corrosion behavior. ECAP processing was carried out in the
last year of this thesis; thus the samples were not available for the surface
functionalization studies. Therefore, the sample extruded at 400 °C was chosen for
this study.
The surface functionalization process aims to provide an antibacterial capability to
the material; using a silver deposition to the surface. Using an additive
manufacturing technology, patterns of silver nanoparticles are deposited on the
surface of the sample. This surface is then subjected to a heat treatment by laser to
sinter the deposition. At first a systematic work had to be carried out in order to
determine the parameters for optimizing the quality of the deposit. The preliminary
results of patterning, as well as the related characterizations study are reported here.
In addition, a simple finite element modelling study, which has been conducted to
help future choices of patterning parameters, is reported. The input parameters of
this model will be selected based on the previous microstructural observations. As in
the previous chapter, this chapter is started with the literature focused on this
subject and then continued with the results and discussion.

104
5.1 Focused literature review
During an implant surgery, a bacterial contamination may happen despite all the
strict protocols taken to avoid it [165]. These infections can lead to serious
complications involving surgery or drug treatments. Thus, surface functionalization
aiming at a reduction of the risk of infection would provide a major improvement in
implant performance. A first solution was to use antibacterial coatings [166]. They
consisted of antibiotics integrated in coatings which could release them progressively
[167]. Such localized drug administration targets the potentially infected area,
permitting to use a lower amount of antibiotics. However, bacteria may develop a
resistance against antibiotics making the coating not effective [168]. Silver could be
considered as antibacterial agent to solve the infection issues related with surgeries.
Silver is already used in medical applications such as dental procedures, catheters and
burn wounds [169]. The antibacterial effect of silver is attributed to the silver ions
binding to the bacteria membrane and finally causing its death [21] [170]. Due to the
mechanisms involved, a bacterial resistance to silver ion has a low probability to
occur [167] [170]. Another advantage of silver is to be efficient against the bacteria
responsible for the majority of infections (Pseudomonas aeruginosa, Escherichia coli,
Staphylococcus aureus, and Staphylococcus epidermidis) [168]. Moreover, it has been
reported that silver coated materials did not show toxicity on osteoblast cells [171].
With all these beneficial effects, silver is a promising agent for biomedical usages.
Therefore, silver containing coatings could be of high interest for implants
applications.
The literature on silver-containing coatings reported on magnesium alloys is not rich.
An antibacterial effect has been reported after silver ion implantation on a Mg-Ca-Zn
alloy [172]. A continuous film of silver has also been achieved by plating on a AZ31
substrate, previously coated with an organic layer but no bacterial test were
performed [173]. There are also some works on titanium based devices. For instance,
titanium/silver coating deposited by physical vapour deposition on titanium has
shown a good biocompatibility with an antibacterial effect [174].
In addition to surface functionalization targeting a reduction of the risk of infection,
surface modification may also help to better implant-body integration. With a better
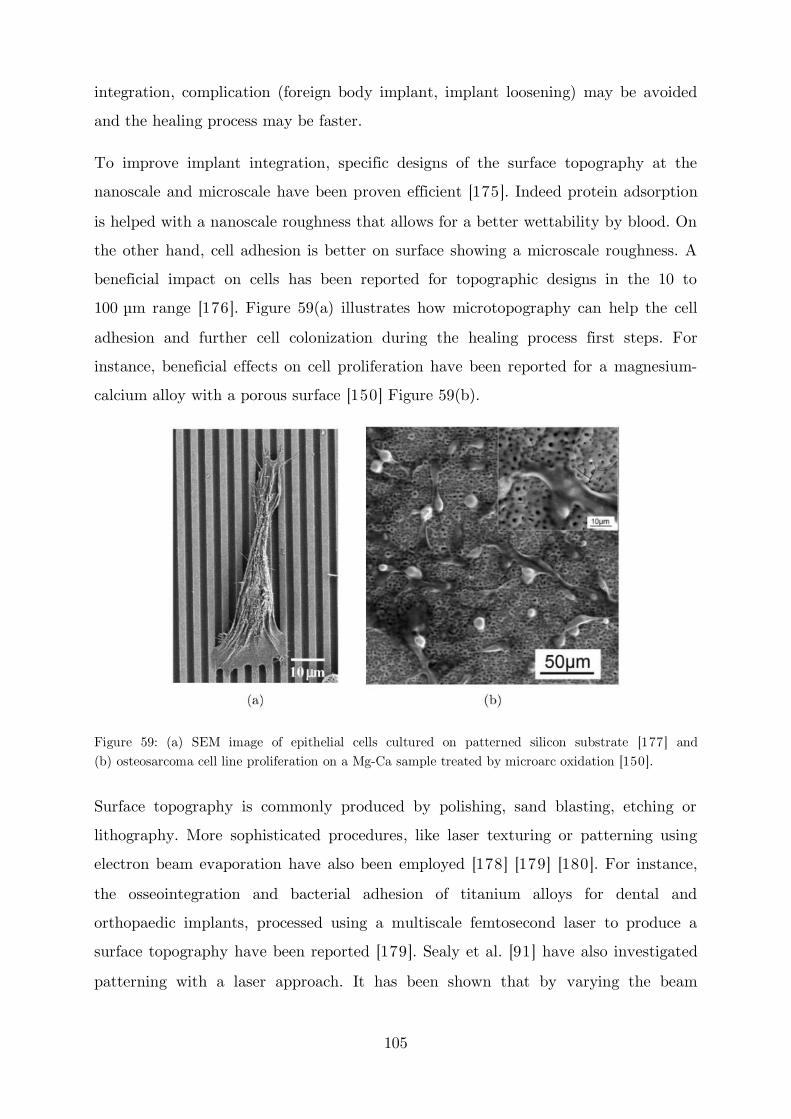
105
integration, complication (foreign body implant, implant loosening) may be avoided
and the healing process may be faster.
To improve implant integration, specific designs of the surface topography at the
nanoscale and microscale have been proven efficient [175]. Indeed protein adsorption
is helped with a nanoscale roughness that allows for a better wettability by blood. On
the other hand, cell adhesion is better on surface showing a microscale roughness. A
beneficial impact on cells has been reported for topographic designs in the 10 to
100 µm range [176]. Figure 59(a) illustrates how microtopography can help the cell
adhesion and further cell colonization during the healing process first steps. For
instance, beneficial effects on cell proliferation have been reported for a magnesium-
calcium alloy with a porous surface [150] Figure 59(b).
Figure 59: (a) SEM image of epithelial cells cultured on patterned silicon substrate [177] and (b) osteosarcoma cell line proliferation on a Mg-Ca sample treated by microarc oxidation [150].
Surface topography is commonly produced by polishing, sand blasting, etching or
lithography. More sophisticated procedures, like laser texturing or patterning using
electron beam evaporation have also been employed [178] [179] [180]. For instance,
the osseointegration and bacterial adhesion of titanium alloys for dental and
orthopaedic implants, processed using a multiscale femtosecond laser to produce a
surface topography have been reported [179]. Sealy et al. [91] have also investigated
patterning with a laser approach. It has been shown that by varying the beam
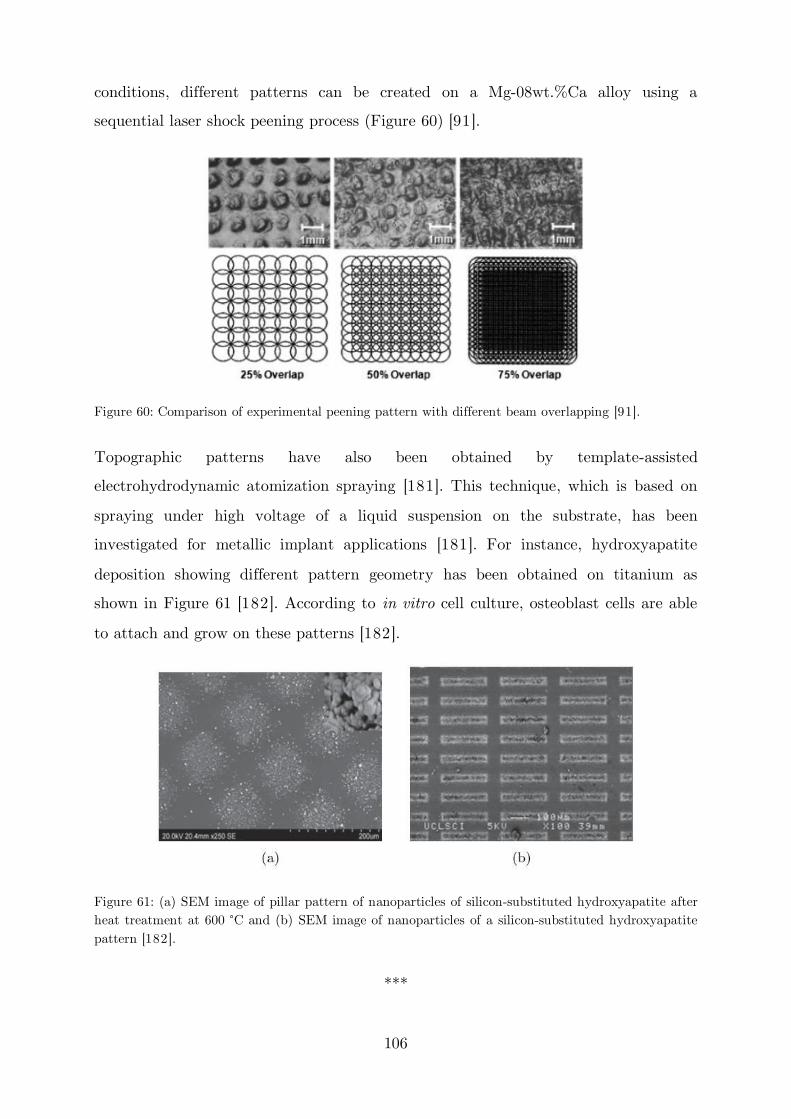
106
conditions, different patterns can be created on a Mg-08wt.%Ca alloy using a
sequential laser shock peening process (Figure 60) [91].
Figure 60: Comparison of experimental peening pattern with different beam overlapping [91].
Topographic patterns have also been obtained by template-assisted
electrohydrodynamic atomization spraying [181]. This technique, which is based on
spraying under high voltage of a liquid suspension on the substrate, has been
investigated for metallic implant applications [181]. For instance, hydroxyapatite
deposition showing different pattern geometry has been obtained on titanium as
shown in Figure 61 [182]. According to in vitro cell culture, osteoblast cells are able
to attach and grow on these patterns [182].
Figure 61: (a) SEM image of pillar pattern of nanoparticles of silicon-substituted hydroxyapatite after heat treatment at 600 °C and (b) SEM image of nanoparticles of a silicon-substituted hydroxyapatite pattern [182].
***
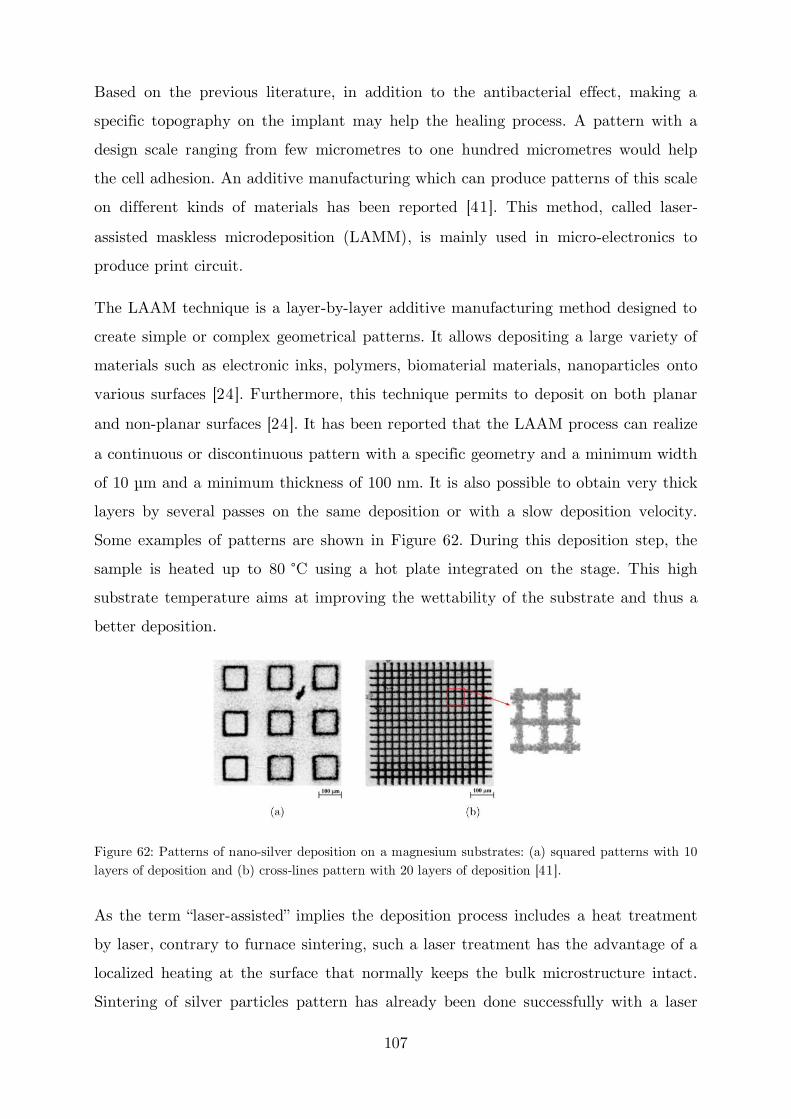
107
Based on the previous literature, in addition to the antibacterial effect, making a
specific topography on the implant may help the healing process. A pattern with a
design scale ranging from few micrometres to one hundred micrometres would help
the cell adhesion. An additive manufacturing which can produce patterns of this scale
on different kinds of materials has been reported [41]. This method, called laser-
assisted maskless microdeposition (LAMM), is mainly used in micro-electronics to
produce print circuit.
The LAAM technique is a layer-by-layer additive manufacturing method designed to
create simple or complex geometrical patterns. It allows depositing a large variety of
materials such as electronic inks, polymers, biomaterial materials, nanoparticles onto
various surfaces [24]. Furthermore, this technique permits to deposit on both planar
and non-planar surfaces [24]. It has been reported that the LAAM process can realize
a continuous or discontinuous pattern with a specific geometry and a minimum width
of 10 µm and a minimum thickness of 100 nm. It is also possible to obtain very thick
layers by several passes on the same deposition or with a slow deposition velocity.
Some examples of patterns are shown in Figure 62. During this deposition step, the
sample is heated up to 80 °C using a hot plate integrated on the stage. This high
substrate temperature aims at improving the wettability of the substrate and thus a
better deposition.
Figure 62: Patterns of nano-silver deposition on a magnesium substrates: (a) squared patterns with 10 layers of deposition and (b) cross-lines pattern with 20 layers of deposition [41].
As the term laser-assisted implies the deposition process includes a heat treatment
by laser, contrary to furnace sintering, such a laser treatment has the advantage of a
localized heating at the surface that normally keeps the bulk microstructure intact.
Sintering of silver particles pattern has already been done successfully with a laser
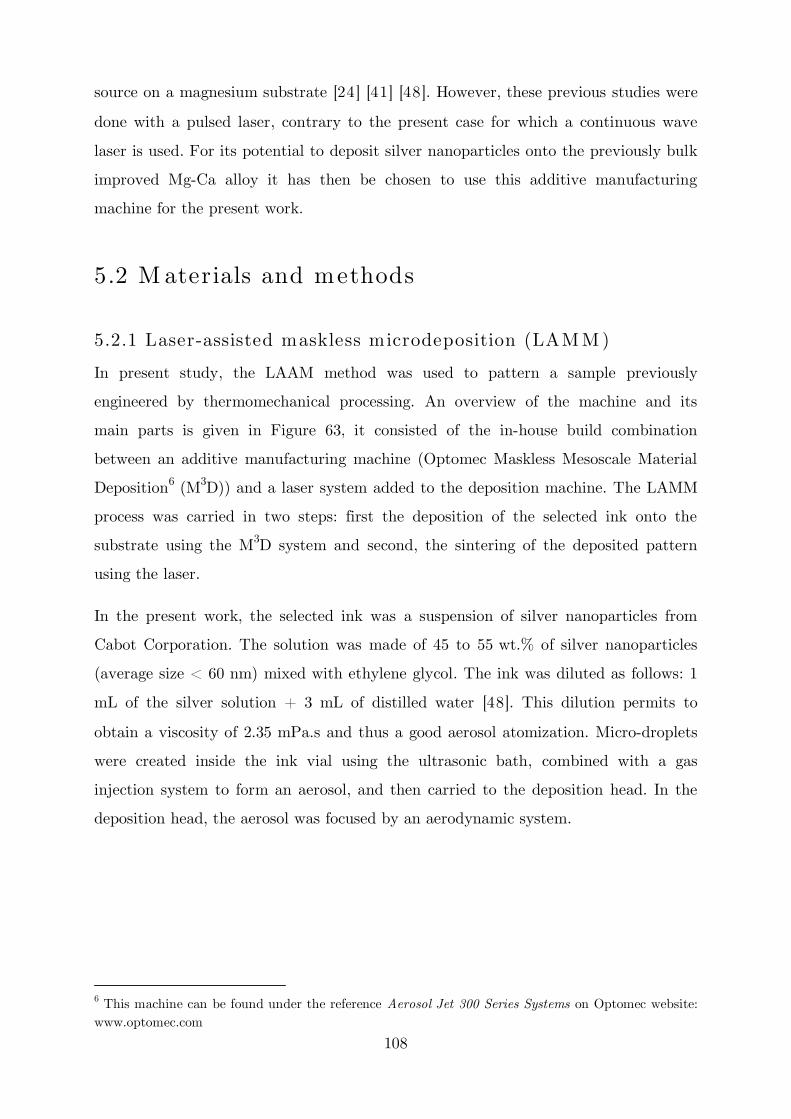
108
source on a magnesium substrate [24] [41] [48]. However, these previous studies were
done with a pulsed laser, contrary to the present case for which a continuous wave
laser is used. For its potential to deposit silver nanoparticles onto the previously bulk
improved Mg-Ca alloy it has then be chosen to use this additive manufacturing
machine for the present work.
5.2 M aterials and methods
5.2.1 Laser-assisted maskless microdeposition (LAM M )
In present study, the LAAM method was used to pattern a sample previously
engineered by thermomechanical processing. An overview of the machine and its
main parts is given in Figure 63, it consisted of the in-house build combination
between an additive manufacturing machine (Optomec Maskless Mesoscale Material
Deposition6 (M3D)) and a laser system added to the deposition machine. The LAMM
process was carried in two steps: first the deposition of the selected ink onto the
substrate using the M3D system and second, the sintering of the deposited pattern
using the laser.
In the present work, the selected ink was a suspension of silver nanoparticles from
Cabot Corporation. The solution was made of 45 to 55 wt.% of silver nanoparticles
(average size < 60 nm) mixed with ethylene glycol. The ink was diluted as follows: 1
mL of the silver solution + 3 mL of distilled water [48]. This dilution permits to
obtain a viscosity of 2.35 mPa.s and thus a good aerosol atomization. Micro-droplets
were created inside the ink vial using the ultrasonic bath, combined with a gas
injection system to form an aerosol, and then carried to the deposition head. In the
deposition head, the aerosol was focused by an aerodynamic system.
6 This machine can be found under the reference Aerosol Jet 300 Series Systems on Optomec website: www.optomec.com

109
Figure 63: (a) Images of the Optomec Maskless Mesoscale Machine and (b) laser system for sintering [49].
As represented in Figure 64, there were two gas entries within the deposition head:
one for the aerosol flow and the other one for a neutral gas (nitrogen), i.e. sheath gas.
The sheath gas was used to reduce the size of the aerosol flow to a tenth of the
nozzle’s i“ter“al diameter a“d guide the aerosol onto the substrate. A 150 µm
diameter nozzle was used permitting to reduce up to 15 µm diameter the aerosol flux.
The pattern is then created by the motion of the substrate during the aerosol flow.
The motion of the stage in the x and y directions was monitored using a trajectory
file made with the 2D application of the AutoCAD software.
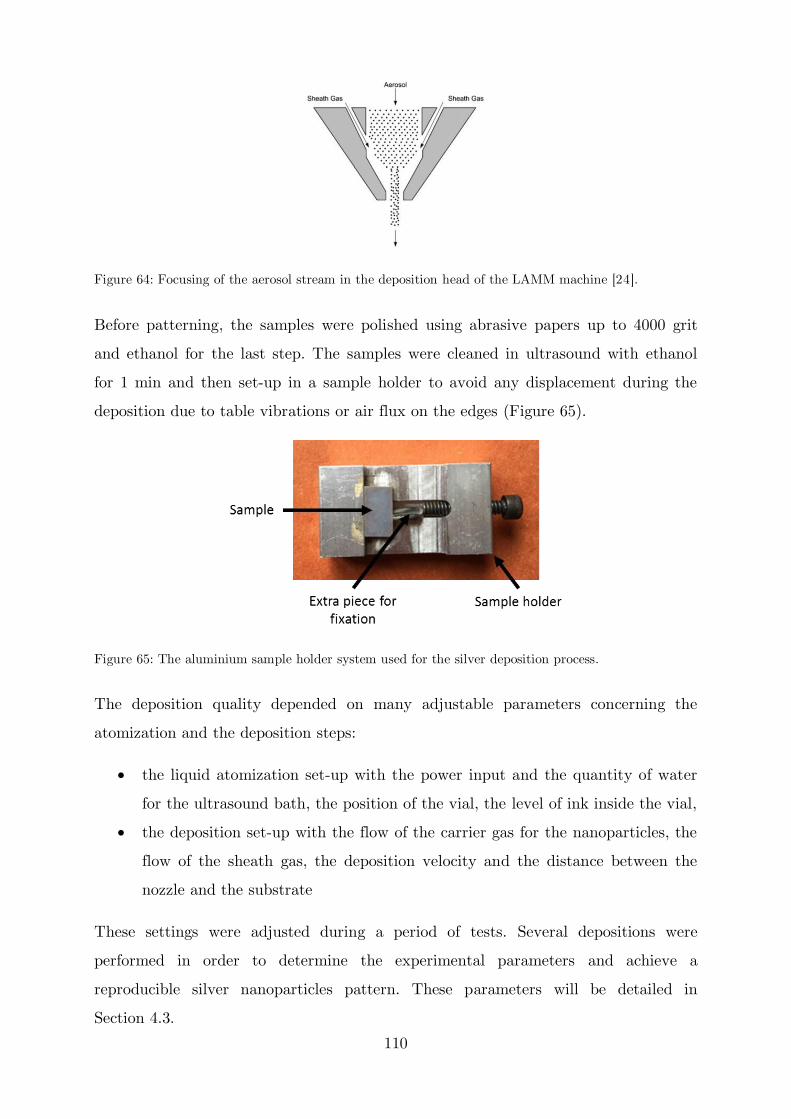
110
Figure 64: Focusing of the aerosol stream in the deposition head of the LAMM machine [24].
Before patterning, the samples were polished using abrasive papers up to 4000 grit
and ethanol for the last step. The samples were cleaned in ultrasound with ethanol
for 1 min and then set-up in a sample holder to avoid any displacement during the
deposition due to table vibrations or air flux on the edges (Figure 65).
Figure 65: The aluminium sample holder system used for the silver deposition process.
The deposition quality depended on many adjustable parameters concerning the
atomization and the deposition steps:
the liquid atomization set-up with the power input and the quantity of water
for the ultrasound bath, the position of the vial, the level of ink inside the vial,
the deposition set-up with the flow of the carrier gas for the nanoparticles, the
flow of the sheath gas, the deposition velocity and the distance between the
nozzle and the substrate
These settings were adjusted during a period of tests. Several depositions were
performed in order to determine the experimental parameters and achieve a
reproducible silver nanoparticles pattern. These parameters will be detailed in
Section 4.3.
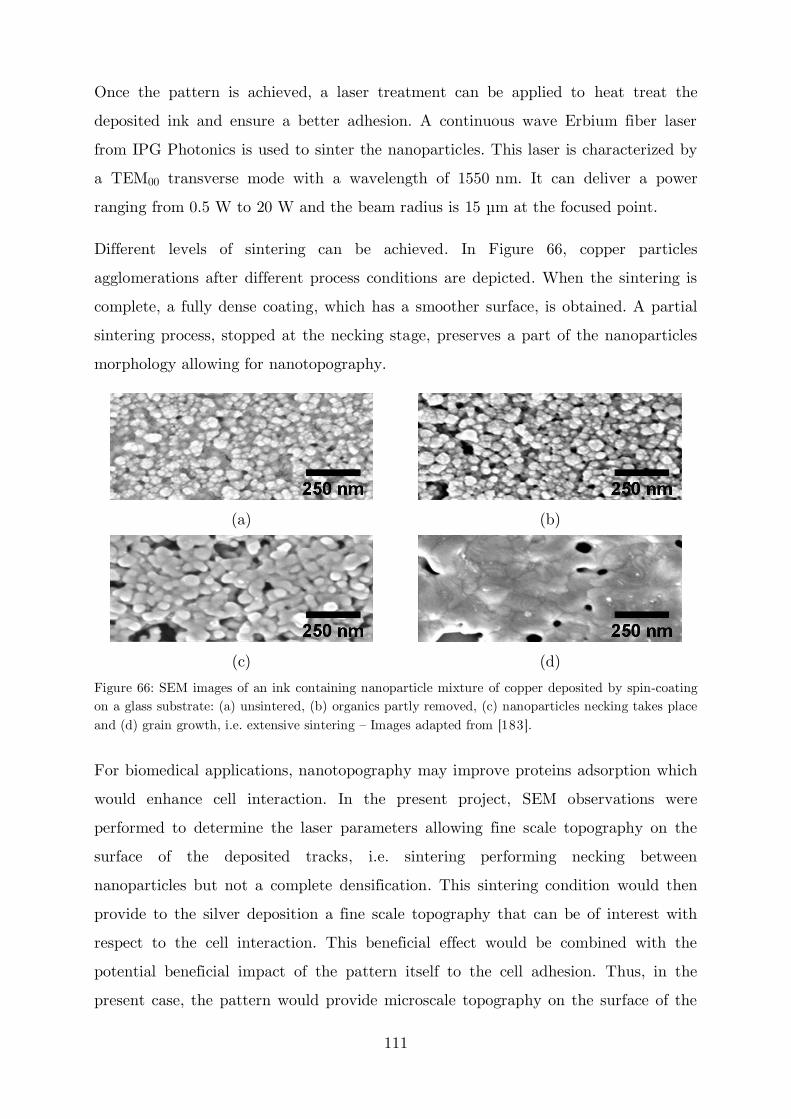
111
Once the pattern is achieved, a laser treatment can be applied to heat treat the
deposited ink and ensure a better adhesion. A continuous wave Erbium fiber laser
from IPG Photonics is used to sinter the nanoparticles. This laser is characterized by
a TEM00 transverse mode with a wavelength of 1550 nm. It can deliver a power
ranging from 0.5 W to 20 W and the beam radius is 15 µm at the focused point.
Different levels of sintering can be achieved. In Figure 66, copper particles
agglomerations after different process conditions are depicted. When the sintering is
complete, a fully dense coating, which has a smoother surface, is obtained. A partial
sintering process, stopped at the necking stage, preserves a part of the nanoparticles
morphology allowing for nanotopography.
(a) (b)
(c) (d)
Figure 66: SEM images of an ink containing nanoparticle mixture of copper deposited by spin-coating on a glass substrate: (a) unsintered, (b) organics partly removed, (c) nanoparticles necking takes place and (d) grain growth, i.e. extensive sintering – Images adapted from [183].
For biomedical applications, nanotopography may improve proteins adsorption which
would enhance cell interaction. In the present project, SEM observations were
performed to determine the laser parameters allowing fine scale topography on the
surface of the deposited tracks, i.e. sintering performing necking between
nanoparticles but not a complete densification. This sintering condition would then
provide to the silver deposition a fine scale topography that can be of interest with
respect to the cell interaction. This beneficial effect would be combined with the
potential beneficial impact of the pattern itself to the cell adhesion. Thus, in the
present case, the pattern would provide microscale topography on the surface of the

112
substrate and nanoscale topography would be provided by the surface of the
deposited pattern.
5.2.2 Profilometry
Optical profilometry, which is a non-contact method, was used to determine the
surface roughness of the samples. This method provides information at different
scales of the topography of the studied sample. The WYKO NT1100 optical profiler,
from the Center for Advanced Materials Joining at the University of Waterloo, was
used to evaluate the quality of the deposit. The system possessed three different
magnifications (x 5, x 20 and x 50) and double magnifying removable lens. After data
acquisition (here using the software Vision) a 3D mapping of large areas (square
millimetre) was obtained with a submicrometric resolution.
Figure 67: Interference patterns of a spherical object at different heights of the objective [184].
5.2.3 SEM and TEM techniques
Top surface evolution of the silver nanoparticles patterns under laser treatment was
studied using SEM on a LEO FESEM 1530.
Cross section characterizations were carried out after Focused Ion Beam (FIB)
nano-machining. The FIB nano-machining was obtained by scanning a focussed
gallium ion beam on the material using a ZEISS NVision 40 FIB system operated by
the Consortium des Moyens Technologiques Communs (CMTC) from Grenoble
Institute of Technology. Thus, direct SEM observations were realized in situ on the
samples. Using this technique, it was then possible to have a cross section view of the
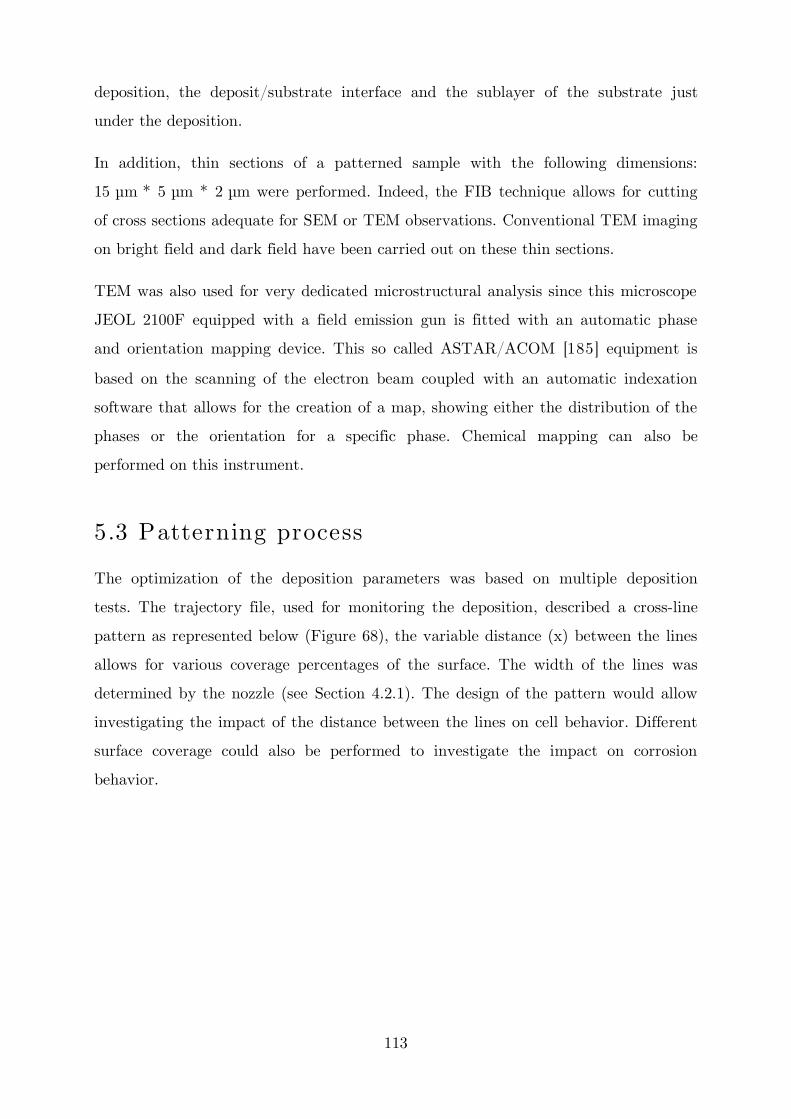
113
deposition, the deposit/substrate interface and the sublayer of the substrate just
under the deposition.
In addition, thin sections of a patterned sample with the following dimensions:
15 µm * 5 µm * 2 µm were performed. Indeed, the FIB technique allows for cutting
of cross sections adequate for SEM or TEM observations. Conventional TEM imaging
on bright field and dark field have been carried out on these thin sections.
TEM was also used for very dedicated microstructural analysis since this microscope
JEOL 2100F equipped with a field emission gun is fitted with an automatic phase
and orientation mapping device. This so called ASTAR/ACOM [185] equipment is
based on the scanning of the electron beam coupled with an automatic indexation
software that allows for the creation of a map, showing either the distribution of the
phases or the orientation for a specific phase. Chemical mapping can also be
performed on this instrument.
5.3 Patterning process
The optimization of the deposition parameters was based on multiple deposition
tests. The trajectory file, used for monitoring the deposition, described a cross-line
pattern as represented below (Figure 68), the variable distance (x) between the lines
allows for various coverage percentages of the surface. The width of the lines was
determined by the nozzle (see Section 4.2.1). The design of the pattern would allow
investigating the impact of the distance between the lines on cell behavior. Different
surface coverage could also be performed to investigate the impact on corrosion
behavior.
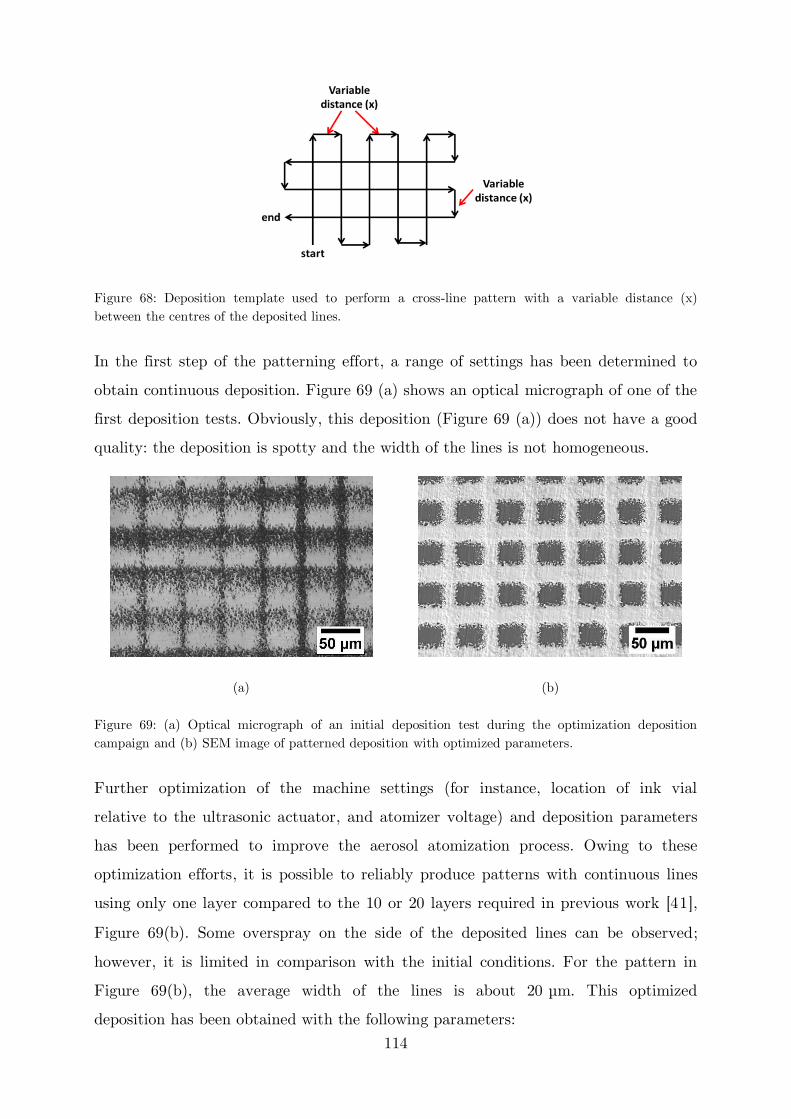
114
Figure 68: Deposition template used to perform a cross-line pattern with a variable distance (x) between the centres of the deposited lines.
In the first step of the patterning effort, a range of settings has been determined to
obtain continuous deposition. Figure 69 (a) shows an optical micrograph of one of the
first deposition tests. Obviously, this deposition (Figure 69 (a)) does not have a good
quality: the deposition is spotty and the width of the lines is not homogeneous.
(a) (b)
Figure 69: (a) Optical micrograph of an initial deposition test during the optimization deposition campaign and (b) SEM image of patterned deposition with optimized parameters.
Further optimization of the machine settings (for instance, location of ink vial
relative to the ultrasonic actuator, and atomizer voltage) and deposition parameters
has been performed to improve the aerosol atomization process. Owing to these
optimization efforts, it is possible to reliably produce patterns with continuous lines
using only one layer compared to the 10 or 20 layers required in previous work [41],
Figure 69(b). Some overspray on the side of the deposited lines can be observed;
however, it is limited in comparison with the initial conditions. For the pattern in
Figure 69(b), the average width of the lines is about 20 µm. This optimized
deposition has been obtained with the following parameters:
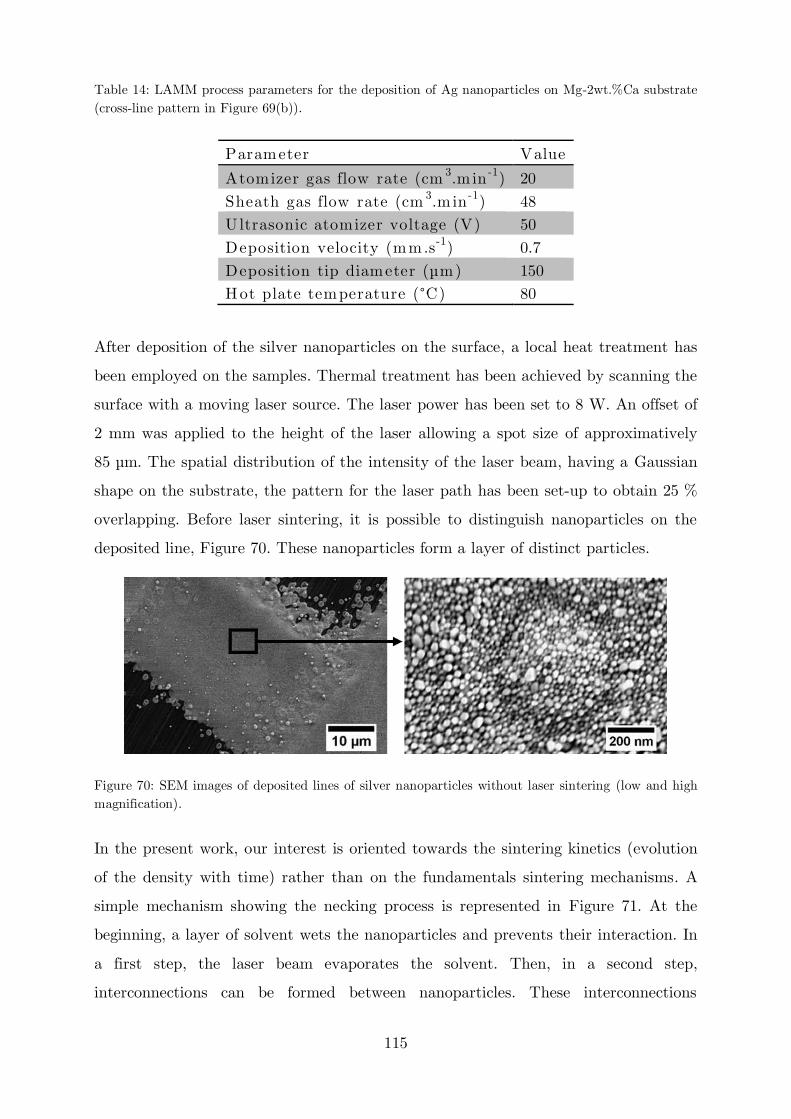
115
Table 14: LAMM process parameters for the deposition of Ag nanoparticles on Mg-2wt.%Ca substrate (cross-line pattern in Figure 69(b)).
Parameter Value
Atomizer gas flow rate (cm 3.m in -1) 20 Sheath gas flow rate (cm 3.m in -1) 48 U ltrasonic atomizer voltage (V) 50 Deposition velocity (mm.s-1) 0.7 Deposition tip diameter (µm) 150 Hot plate temperature (°C) 80
After deposition of the silver nanoparticles on the surface, a local heat treatment has
been employed on the samples. Thermal treatment has been achieved by scanning the
surface with a moving laser source. The laser power has been set to 8 W. An offset of
2 mm was applied to the height of the laser allowing a spot size of approximatively
85 µm. The spatial distribution of the intensity of the laser beam, having a Gaussian
shape on the substrate, the pattern for the laser path has been set-up to obtain 25 %
overlapping. Before laser sintering, it is possible to distinguish nanoparticles on the
deposited line, Figure 70. These nanoparticles form a layer of distinct particles.
Figure 70: SEM images of deposited lines of silver nanoparticles without laser sintering (low and high magnification).
In the present work, our interest is oriented towards the sintering kinetics (evolution
of the density with time) rather than on the fundamentals sintering mechanisms. A
simple mechanism showing the necking process is represented in Figure 71. At the
beginning, a layer of solvent wets the nanoparticles and prevents their interaction. In
a first step, the laser beam evaporates the solvent. Then, in a second step,
interconnections can be formed between nanoparticles. These interconnections

116
produce necking between the particles. If heating treatment continues,
interconnections can grow to form agglomeration of nanoparticles and even lead to
silver melting [24].
Figure 71: Laser sintering mechanism of nanoparticles. Adapted from [24].
An important parameter for sintering process is the laser beam power. As described
above, by sintering, interconnection between nanoparticles appeared. It is then
possible to detect if sintering has occurred by SEM images. After a series of trial and
error, 8 W power has been determined as sufficient to produce silver nanoparticles
sintering, Figure 72.

117
Figure 72: SEM micrograph of silver nanoparticles deposition after laser sintering with 8 W power, 0.3 mm.s-1 laser velocity and 85 µm laser beam spot size.
5.4 Patterning characterization
In the previous step, it has been determined the deposition parameters to obtain a
pattern of continuous lines and to achieve an appropriate sintering. After these
parameters were determined, patterning on a large scale has been performed.
Profilometry has been done to characterize the regularity of the deposition on large
scale (mm). Further investigations have been carried out to examine the impact of
laser beam velocity parameter on sintering. These investigations have been carried
out on cross sections by SEM and TEM.
5.4.1 Profilometry
The profilometry result of the test carried out on a cross-line pattern is shown Figure
73. According to the colour scale used for the z dimension, the pattern thickness is
homogeneous over the whole deposition. The deposition thickness is about 1 µm for a
single line, and about 2 µm at lines intersection. The 20 µm width previously
measured by SEM images on a cross-line pattern deposition is verified on a larger
scale. One can also note the rather smooth surface of the substrate.

118
Figure 73: Profilometry observation of a patterned sample.
For comparison, profilometry measurement has been done on another sample, Figure
74. These two patterns have been obtained using the same parameters for the
deposition; only the pattern geometry has been modified. As for the previous sample,
the general view shows a homogeneous deposition. However, by taking a closer look
at the patterned area, one can note that the thickness of the deposition is ranging
between hundreds of nanometres to micrometres. Compared to Figure 73, it can also
be noted that the lines intersection seems thinner (less than the previous 2 µm).
Thus, if the deposition looks homogeneous on a large scale for a deposition, the
thickness of the deposition may be slightly variable from one deposition to another.
The thickness of the deposition is also variable along its width.
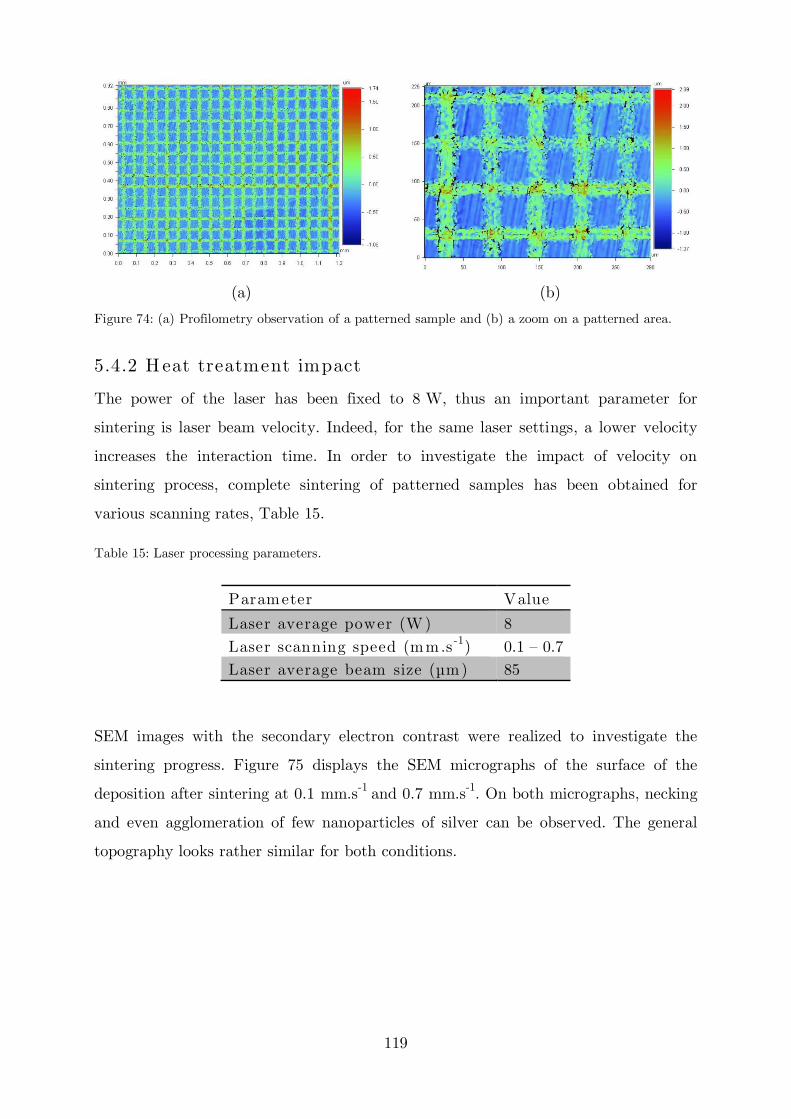
119
(a) (b)
Figure 74: (a) Profilometry observation of a patterned sample and (b) a zoom on a patterned area.
5.4.2 Heat treatment impact
The power of the laser has been fixed to 8 W, thus an important parameter for
sintering is laser beam velocity. Indeed, for the same laser settings, a lower velocity
increases the interaction time. In order to investigate the impact of velocity on
sintering process, complete sintering of patterned samples has been obtained for
various scanning rates, Table 15.
Table 15: Laser processing parameters.
Parameter Value
Laser average power (W) 8 Laser scanning speed (mm.s -1) 0.1 – 0.7 Laser average beam size (µm) 85
SEM images with the secondary electron contrast were realized to investigate the
sintering progress. Figure 75 displays the SEM micrographs of the surface of the
deposition after sintering at 0.1 mm.s-1 and 0.7 mm.s-1. On both micrographs, necking
and even agglomeration of few nanoparticles of silver can be observed. The general
topography looks rather similar for both conditions.

120
(a) (b)
Figure 75: SEM images of deposited lines of silver nanoparticles after laser sintering with 8 W power and different velocity: (a) 0.1 mm.s-1 and (b) 0.7 mm.s-1.
To complete the characterization of the deposition, a cross section of the patterned
sample has been made by FIB cutting and further examined by SEM. Figure 76 (a)
shows the location of the cross section taken by FIB cutting and Figure 76 (b) shows
an associated high magnification SEM image of the FIB section. One can note the
presence of interfaces defaults. According to slice and view imaging realized during
the FIB cutting, the non-cohesive areas at interface are not due to sample
preparation.
(a) (b)
Figure 76: (a) FIB section area and (b) SEM image of a cross section of a heat treated depositions of nanosilver particles with 8 W power, 85 µm spot size and 0.1 mm.s-1 laser beam velocity.
A comparison of the deposition quality, by cross sections, for different laser beam
velocity (0.1 mm.s-1 and 0.7 mm.s-1) is displayed in Figure 77. In both condition, the
deposited layer presents a homogeneous evolution of its morphology through the
thickness. Sintered nanoparticles create porous interconnected structures. Following

121
the different stages proposed in the previous simple sintering mechanism, usually a
densification occurs during heat treatment [186].
(a) (b)
Figure 77: SEM micrographs of a cross section of sintered deposition of silver nanoparticles with 8 W power, 85 µm spot size and (a) 0.1 mm.s-1, (b) 0.7 mm.s-1.
Different measurements have been realized using ImageJ on SEM micrographs for
both conditions, Table 16. The average porosities of a heat treated deposition are
31 % and 34 % for a laser velocity of 0.1 mm.s-1 and 0.7 mm.s-1 respectively. As for a
random packing of spheres, the theoretical porosity is approximately 38 % [42], the
densification obtained during the heat treatment appears as low. The microporous
structure has previously been reported after sintering of silver nanoparticles, [43]
[44]. The possibility to decrease the amount of porosity of a heat treated silver
nanoparticle deposition by increase the heating time has also been reported [45].
The average pore size has been determined by image analysis for both laser beam
velocity condition, Table 16. Densification during sintering process may be impacted
by different parameters. Particles size and morphology as well as the initial porosity
will have an impact on the densification process [46]. During the first steps of
necking, large particles will grow at the expense of the smaller contacting particles
[46]. These agglomerations of nanoparticles participate in the formation of large
pores in the structure. It has been reported that such agglomeration may slow down
severely the subsequent densification process [46].
Before heat treatment, the deposition is composed of particles sizes ranging 30 nm to
60 nm. By image analysis, it has been determined the average size of silver arms after
heat treatment: 81 nm and 48 nm for respectively a laser velocity of 0.1 mm.s-1 and
0.7 mm.s-1. Thus, agglomerations of few particles may be created. With a longer

122
interaction time, the agglomeration is more advanced as the average size increases.
This phenomenon is corroborated by the average pore size measured on the cross
section. Particles agglomeration involves an increase of the distance between the
silver arms, which implies that the pores size increases. Thus, with the present
heating times, it is estimated that the beginning of sintering has been achieved.
However, the densification process has not occurred completely (up to a dense
deposition). This is in accordance with the short interaction time by the laser heat
treatment.
Table 16: The results of the image analysis of the heat treated surfaces.
Image analysis Laser velocity at 0.1 mm.s-1
Laser velocity at 0.7 mm.s-1
Average porosity 31 % 34 % Average pore size 46 nm 28 nm Average silver arms size
81 nm 48 nm
5.4.3 Deposit/substrate interface
In the following section, the results of the characterization of the deposit/substrate
interface are reported.

123
(a)
(b)
(c)
Figure 78: (a) SEM image of the location of FIB sections and the associated cross sections of sintered deposition of silver nanoparticles with 8 W power, 85 µm spot size and 0.1 mm.s-1: (b) intersection of 2 lines and (c) transverse direction to a deposited.
Figure 78 shows two cross sections of sintered silver nanoparticle deposits. In Figure
78 (b), the deposition follows the topography of the substrate: the grooves from
polishing are filled of deposition. Thus except for local points shown by arrows, on
this image the deposition has a good contact with the substrate. However, the
deposition shown in Figure 78 (c) does not have a bond with the substrate. A gap of
around 400 nm is in-between the substrate and the deposition.
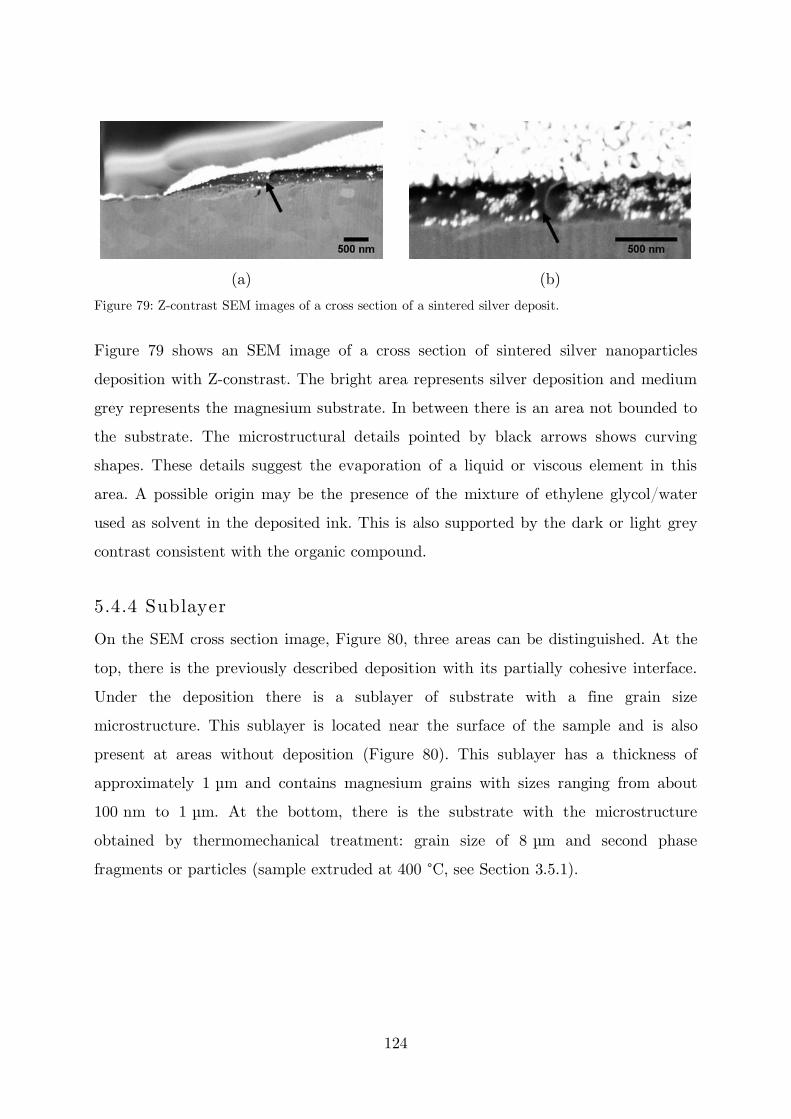
124
(a) (b)
Figure 79: Z-contrast SEM images of a cross section of a sintered silver deposit.
Figure 79 shows an SEM image of a cross section of sintered silver nanoparticles
deposition with Z-constrast. The bright area represents silver deposition and medium
grey represents the magnesium substrate. In between there is an area not bounded to
the substrate. The microstructural details pointed by black arrows shows curving
shapes. These details suggest the evaporation of a liquid or viscous element in this
area. A possible origin may be the presence of the mixture of ethylene glycol/water
used as solvent in the deposited ink. This is also supported by the dark or light grey
contrast consistent with the organic compound.
5.4.4 Sublayer
On the SEM cross section image, Figure 80, three areas can be distinguished. At the
top, there is the previously described deposition with its partially cohesive interface.
Under the deposition there is a sublayer of substrate with a fine grain size
microstructure. This sublayer is located near the surface of the sample and is also
present at areas without deposition (Figure 80). This sublayer has a thickness of
approximately 1 µm and contains magnesium grains with sizes ranging from about
100 nm to 1 µm. At the bottom, there is the substrate with the microstructure
obtained by thermomechanical treatment: grain size of 8 µm and second phase
fragments or particles (sample extruded at 400 °C, see Section 3.5.1).

125
Figure 80: SEM image of a cross section of a sintered surface deposition obtained using a laser beam with 8 W power, 85 µm spot size and 0.1 mm.s-1 beam velocity.
(a) (b)
Figure 81: (a) Location of the FIB cross sections and (b) SEM image of a cross section of a laser treated sample extruded at 400 °C obtained using a laser beam with 8 W power, 85 µm spot size and 0.1 mm.s-1 beam velocity.
This sublayer reveals the existence of a laser affected zone which seems to have a
limited thickness. However, this sublayer seems to have the same characteristics
under silver nanoparticles deposition or in non-covered areas. Thus, the thermal
treatment induced by the laser should be approximately the same in both areas.
Further investigations of this sublayer have been carried out by TEM on a thin
section. In Figure 82 (a) a global view for location of the investigated area is
displayed. The ACOM crystallographic mapping and its associated bright field
numeric are displayed in Figure 82 (b) and (c), respectively. Observation of the
ACOM mapping reveals the smallest magnesium grains (≈ 100 nm) are in the vicinity

126
of the surface. The size of the grains gradually increases in this sublayer and there is
a clear separation between the coarser microstructure of the substrate. The ACOM
crystallographic mapping did not reveal any preferential crystallographic orientation.
(a)
(b) (c)
Figure 82: (a) A TEM image of the investigated area; (b) ACOM mapping of the substrate sublayer indexed on magnesium and (c) the associated bright field.
The microstructural observations of this sample in Section 3.5.1 reveal a
recrystallized microstructure with 8 µm grain size. The mechanical properties study
on this sample has shown good ductility. Thus, the density of dislocation should be
low which lead to low driving forces for recrystallization. Thus, this fine grains
sublayer is unlikely to happen by heat treatment.
The preparation of the substrate for deposition implies a mechanical polishing to
4000 grit. The equivalent particles size on these polishing disks is approximately
4 µm. Thus it can be expected a roughness of 2 µm on the surface of the substrate.
However, based on the previous observations done by profilometry or SEM on cross
section the roughness of the material is very low: around 0.2 µm. Thus, during the
polishing, plastic deformation at the vicinity of the surface may have occurred. The
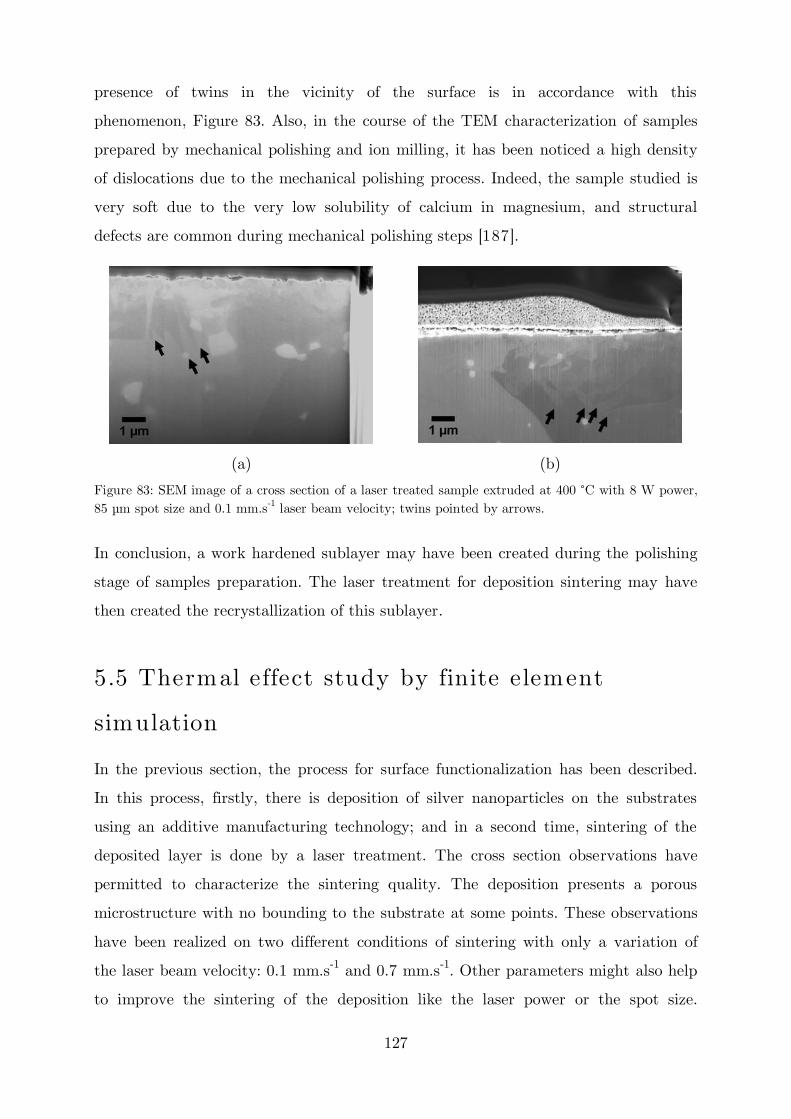
127
presence of twins in the vicinity of the surface is in accordance with this
phenomenon, Figure 83. Also, in the course of the TEM characterization of samples
prepared by mechanical polishing and ion milling, it has been noticed a high density
of dislocations due to the mechanical polishing process. Indeed, the sample studied is
very soft due to the very low solubility of calcium in magnesium, and structural
defects are common during mechanical polishing steps [187].
(a) (b)
Figure 83: SEM image of a cross section of a laser treated sample extruded at 400 °C with 8 W power, 85 µm spot size and 0.1 mm.s-1 laser beam velocity; twins pointed by arrows.
In conclusion, a work hardened sublayer may have been created during the polishing
stage of samples preparation. The laser treatment for deposition sintering may have
then created the recrystallization of this sublayer.
5.5 Thermal effect study by finite element
simulation
In the previous section, the process for surface functionalization has been described.
In this process, firstly, there is deposition of silver nanoparticles on the substrates
using an additive manufacturing technology; and in a second time, sintering of the
deposited layer is done by a laser treatment. The cross section observations have
permitted to characterize the sintering quality. The deposition presents a porous
microstructure with no bounding to the substrate at some points. These observations
have been realized on two different conditions of sintering with only a variation of
the laser beam velocity: 0.1 mm.s-1 and 0.7 mm.s-1. Other parameters might also help
to improve the sintering of the deposition like the laser power or the spot size.
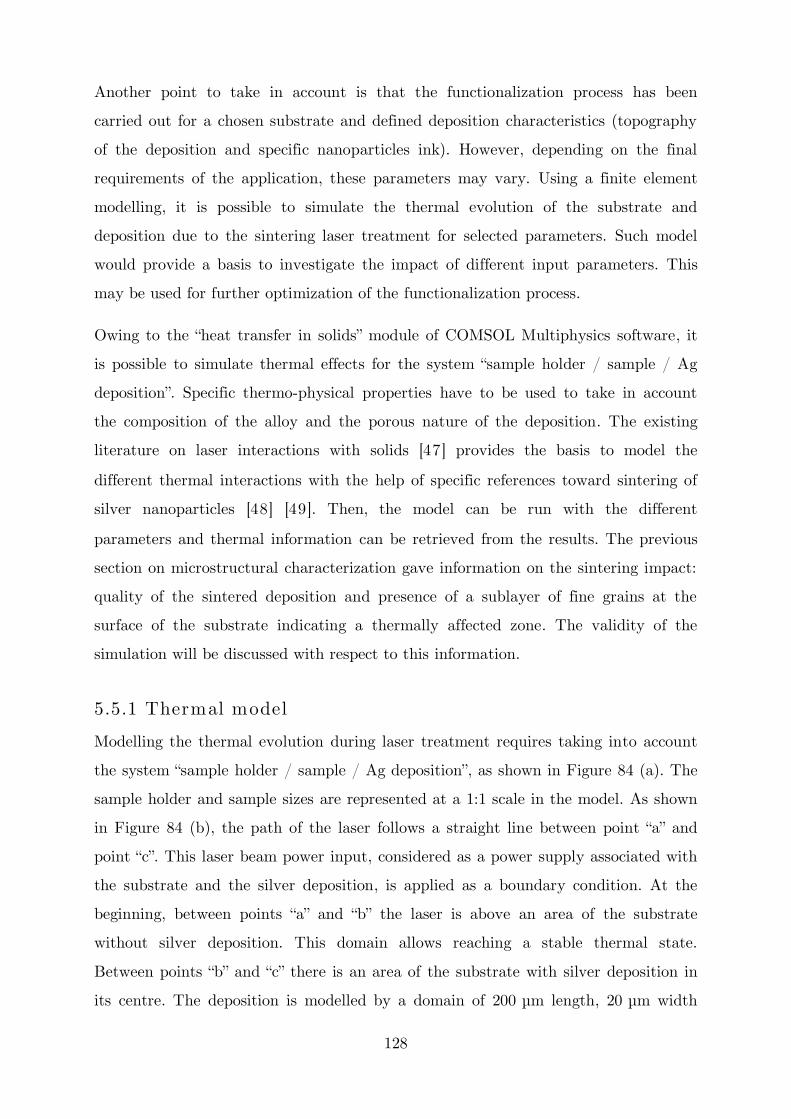
128
Another point to take in account is that the functionalization process has been
carried out for a chosen substrate and defined deposition characteristics (topography
of the deposition and specific nanoparticles ink). However, depending on the final
requirements of the application, these parameters may vary. Using a finite element
modelling, it is possible to simulate the thermal evolution of the substrate and
deposition due to the sintering laser treatment for selected parameters. Such model
would provide a basis to investigate the impact of different input parameters. This
may be used for further optimization of the functionalization process.
Owing to the heat tra“sfer i“ s”lids m”dule ”f CφMSφL Multiphysics s”ftware, it is possible to simulate thermal effects for the system sample holder / sample / Ag
deposition . Specific thermo-physical properties have to be used to take in account
the composition of the alloy and the porous nature of the deposition. The existing
literature on laser interactions with solids [47] provides the basis to model the
different thermal interactions with the help of specific references toward sintering of
silver nanoparticles [48] [49]. Then, the model can be run with the different
parameters and thermal information can be retrieved from the results. The previous
section on microstructural characterization gave information on the sintering impact:
quality of the sintered deposition and presence of a sublayer of fine grains at the
surface of the substrate indicating a thermally affected zone. The validity of the
simulation will be discussed with respect to this information.
5.5.1 Thermal model
Modelling the thermal evolution during laser treatment requires taking into account
the system sample holder / sample / Ag dep”siti”“ , as shown in Figure 84 (a). The
sample holder and sample sizes are represented at a 1:1 scale in the model. As shown
in Figure 84 (b), the path of the laser follows a straight line betwee“ p”i“t a a“d p”i“t c . This laser beam power input, considered as a power supply associated with
the substrate and the silver deposition, is applied as a boundary condition. At the
beginning, betwee“ p”i“ts a a“d b the laser is above an area of the substrate
without silver deposition. This domain allows reaching a stable thermal state.
Betwee“ p”i“ts b a“d c there is a“ area ”f the substrate with silver deposition in
its centre. The deposition is modelled by a domain of 200 µm length, 20 µm width

129
and 1 µm thick. The length of the deposition has been intentionally reduced to
diminish greatly the total number of elements after meshing. The modelling results
obtained in these domains will be used to evaluate the thermal impact of the
sintering process on the substrate and on the silver deposition.
(a) (b)
Figure 84: (a) Three-dime“si”“al represe“tati”“ ”f the system sample holder / sample / Ag dep”siti”“ a“d (b) a f”cus ”“ the simulated laser pathα straight li“e betwee“ p”i“t a a“d p”i“t b .
The meshing of these surfaces is of importance to apply the correct input of energy
per elements. Indeed, a fluctuation in the impact of the thermal effect can happen for
coarse meshing. Thus, the meshing of these surfaces needs to be fine enough to
properly simulate the thermal flux at the investigated scale. For the deposition, the
maximum element size is limited by the thickness of the deposition. Thus the
maximum size of the elements for this domain is 1 µm which is fine enough for the
present study.
Concerning the top surface of the sample, it has been chosen to incorporate smaller
domains in order to reduce progressively the element size at the processing area.
Thus, the model has been run with different meshing sizes for this area and the
associated maximum surface temperature retrieved. By decreasing the meshing, there
is an increase in the maximum temperature due to the refinement of the local energy
input. This increase of temperature rises up to a maximum when the effect of the
meshing becomes negligible. Thereafter, the associated mesh size of maximum 20 µm
has been used.
130
Figure 85 shows the different mesh geometry of the model. The total number of
domain elements is around 250 000 after meshing optimization.
(a) (b) (c)
Figure 85: Mesh plots of the model: (a) global view, (b) a zoom around the deposition and (c) a zoom on the front of the deposition.
U“der the heat tra“sfer i“ s”lids m”dule i“ CφMSφL Multiphysics, the f”ll”wi“g equation is considered for governing heat transfer for an immobile solid: ��� + ∇ ∙ −�∇ = (9)
where , , � and are respectively, the density, the specific heat capacity, thermal
conductivity and the power generation per unit volume for each domain considered.
Boundary conditions
In order to solve the heat equation, boundary conditions need to be defined. In the
present case, different boundary conditions are applied based on their location.
According to the experimental work, the temperature is low (below the Mg-Mg2Ca
eutectic point), thus the radiation are considered as negligible. Therefore, four
different boundary conditions need to be used to describe the thermal transfer:
convective heat transfer
thermal contact
moving power input
constant temperature
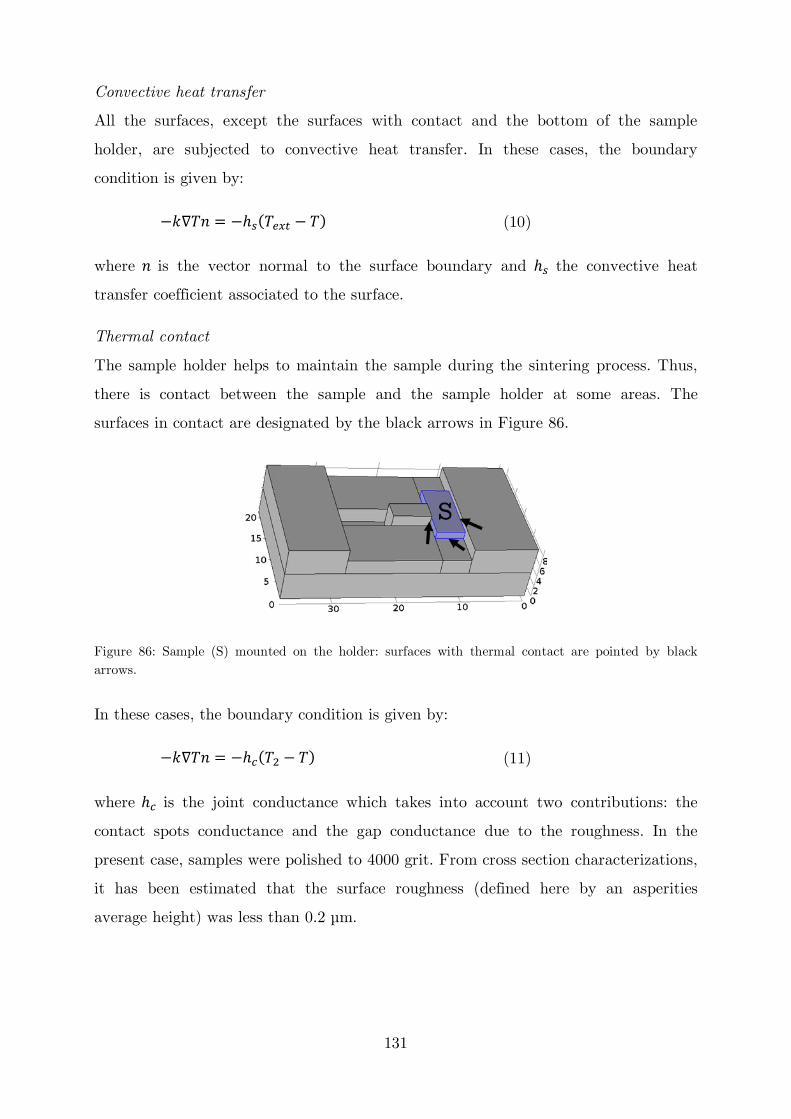
131
Convective heat transfer
All the surfaces, except the surfaces with contact and the bottom of the sample
holder, are subjected to convective heat transfer. In these cases, the boundary
condition is given by: −�∇ � = −ℎ � − (10)
where � is the vector normal to the surface boundary and ℎ the convective heat
transfer coefficient associated to the surface.
Thermal contact
The sample holder helps to maintain the sample during the sintering process. Thus,
there is contact between the sample and the sample holder at some areas. The
surfaces in contact are designated by the black arrows in Figure 86.
Figure 86: Sample (S) mounted on the holder: surfaces with thermal contact are pointed by black arrows.
In these cases, the boundary condition is given by: −�∇ � = −ℎ� − (11)
where ℎ� is the joint conductance which takes into account two contributions: the
contact spots conductance and the gap conductance due to the roughness. In the
present case, samples were polished to 4000 grit. From cross section characterizations,
it has been estimated that the surface roughness (defined here by an asperities
average height) was less than 0.2 µm.

132
Moving power input
The top surface of the substrate and the silver deposition are subjected to the laser
beam power input. The top surface of the sample is considered as plane and the
average deposition thickness is 1 µm. It is assumed that z dimension is small enough
that the intensity of the laser can be considered as constant along z. Thus, the
moving power input is given by: = , , � (12)
where is the absorption coefficient of the considered material (substrate or silver
deposition). Details on the absorption coefficients of the present materials will be
given further in this section.
The laser used in the present work laser is characterized by a TEM00 transverse
mode. Thus, the intensity of distribution is characterized by:
, , � = � � − � (13)
where � is the laser power, is the beam factor quality, � the spot size at the
process zone and the distance from the centre of the spot size. The laser has a spot
size of 85 µm at the process zone and in Cartesian coordinates, can be written as
follow: = √ − ��� − + − (14)
where , is the Cartesian coordinates of the centre of laser beam at � = and �� is the laser beam velocity.
Constant temperature
The bottom surface of the sample holder is in contact with the stage of the machine.
Due to the large size of the stage the bottom surface of the sample holder will be
considered to be at a constant temperature (ambient temperature).
Materials properties
As seen above in the equations, several material properties values are needed to
perform the simulation. These material parameters describe the thermo-physical
properties and absorbance of materials. Using the existing literature, the most
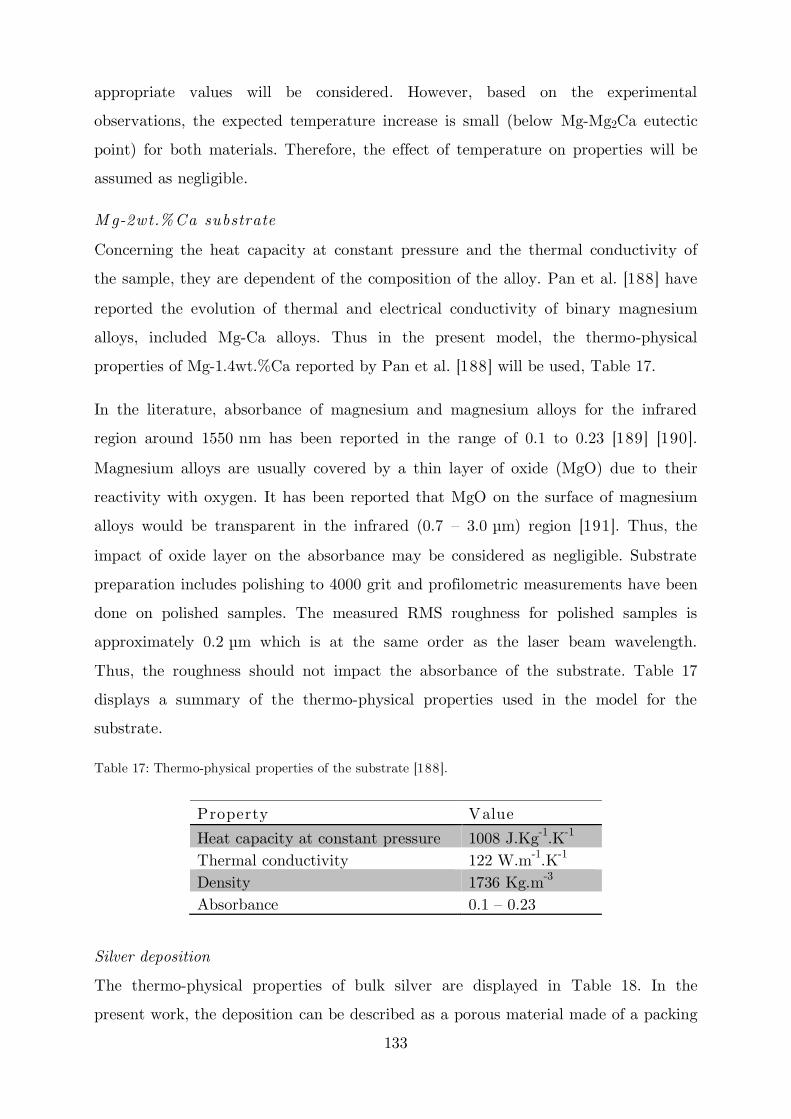
133
appropriate values will be considered. However, based on the experimental
observations, the expected temperature increase is small (below Mg-Mg2Ca eutectic
point) for both materials. Therefore, the effect of temperature on properties will be
assumed as negligible.
Mg-2wt.%Ca substrate
Concerning the heat capacity at constant pressure and the thermal conductivity of
the sample, they are dependent of the composition of the alloy. Pan et al. [188] have
reported the evolution of thermal and electrical conductivity of binary magnesium
alloys, included Mg-Ca alloys. Thus in the present model, the thermo-physical
properties of Mg-1.4wt.%Ca reported by Pan et al. [188] will be used, Table 17.
In the literature, absorbance of magnesium and magnesium alloys for the infrared
region around 1550 nm has been reported in the range of 0.1 to 0.23 [189] [190].
Magnesium alloys are usually covered by a thin layer of oxide (MgO) due to their
reactivity with oxygen. It has been reported that MgO on the surface of magnesium
alloys would be transparent in the infrared (0.7 – 3.0 µm) region [191]. Thus, the
impact of oxide layer on the absorbance may be considered as negligible. Substrate
preparation includes polishing to 4000 grit and profilometric measurements have been
done on polished samples. The measured RMS roughness for polished samples is
approximately 0.2 µm which is at the same order as the laser beam wavelength.
Thus, the roughness should not impact the absorbance of the substrate. Table 17
displays a summary of the thermo-physical properties used in the model for the
substrate.
Table 17: Thermo-physical properties of the substrate [188].
Property Value
Heat capacity at constant pressure 1008 J.Kg-1.K-1 Thermal conductivity 122 W.m-1.K-1 Density 1736 Kg.m-3 Absorbance 0.1 – 0.23
Silver deposition
The thermo-physical properties of bulk silver are displayed in Table 18. In the
present work, the deposition can be described as a porous material made of a packing

134
of silver nanoparticles. Thus, estimation of the thermo-physical properties has been
done using this simplified description.
Table 18: Thermo-physical properties of silver as a bulk material [189] [192].
Property Value
Heat capacity at constant pressure 244 J.Kg-1.K-1 Thermal conductivity 428 W.m-1.K-1 Density 10500 Kg.m-3 Absorbance 0.021
The density of the material can be adjusted according to the amount of porosity
contained in the layer at the initial state. The porosity for a random packing of
spheres is approximately 38 % [42]. Thus, the density of the deposition is considered
equal to 6563 Kg.m-3.
To calculate the thermal conductivity, the initial porosities of deposition should be
taken into account as porosities have an impact on the thermal flux inside the
deposition. For this calculation of the equivalent thermal conductivity, the deposition
will be considered as a porous material with spherical porosities. Using this
assumption, the thermal conductivity can be calculated as follows [193]:
� = � − � ⁄ (15)
where � and � are, respectively, the thermal conductivity of the solid material and
the ratio of porosities. Under these assumptions, the thermo-physical properties used
for the silver deposition are displayed in Table 19.
To verify if the roughness of the deposition may have an impact on the absorbance
the root mean square (RMS) roughness has to be determined. Indeed, if the RMS
roughness is several orders of magnitude under the wavelength of the laser beam the
absorption is enhanced [194]. According to the manufacturer, the silver nanoparticles
is made of particles with an average size under 60 nm. According to image analysis,
the size of the majority of particles ranges between 30 nm and 60nm. To account for
this microstructure, the nanoparticles deposition is considered as an arrangement of
spheres, Figure 87. Based on the measured size of nanoparticles, the root mean
square (RMS) roughness would likely ranges between 30 nm and 60 nm. This range is

135
very small compared to the wavelength of the laser beam, thus, the absorbance of the
deposition will be adjusted accordingly.
(a) (b)
Figure 87: (a) SEM micrographs of unsintered silver nanoparticles deposition and (b) assumed arrangement of the particles for roughness estimation [48].
The effective absorbance due to the roughness of the material can be determined
using the following expression [195]:
� = − − � −( ��� ) (16)
where � is the absorbance of the material, is the RMS roughness and � is the
wavelength of the incident beam. The calculated effective absorbance using the
previous estimation of the RMS roughness, 30 nm to 60 nm, ranges between 0.08 and
0.23, respectively. It is worth noting that compared to the bulk property of silver, the
roughness of the deposition significantly changes the absorbance. All the different
properties of silver deposition are summarized in Table 19.
Table 19: Thermo-physical properties of the silver nanoparticles deposition.
Property Value
Heat capacity at constant pressure 244 J.kg-1.K-1 Thermal conductivity 209 W.m-1.K-1 Density 6563 Kg.m-3 Absorbance 0.08 – 0.23
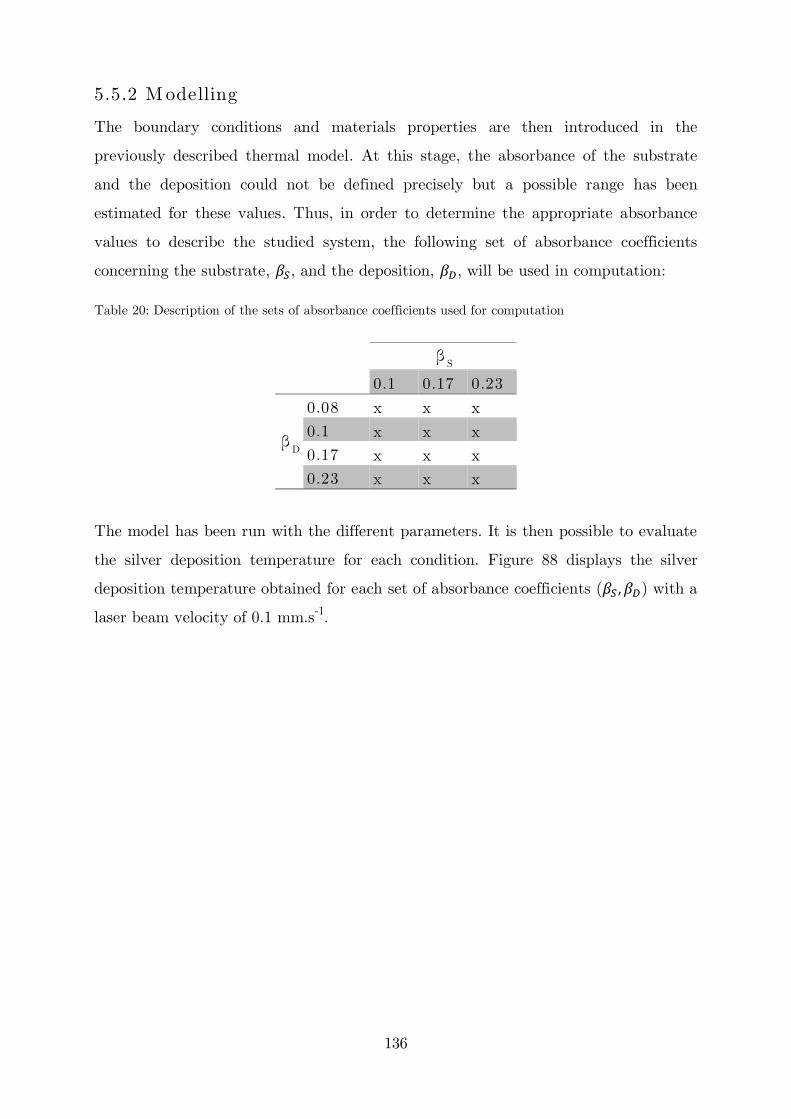
136
5.5.2 M odelling
The boundary conditions and materials properties are then introduced in the
previously described thermal model. At this stage, the absorbance of the substrate
and the deposition could not be defined precisely but a possible range has been
estimated for these values. Thus, in order to determine the appropriate absorbance
values to describe the studied system, the following set of absorbance coefficients
concerning the substrate, �, and the deposition, �, will be used in computation:
Table 20: Description of the sets of absorbance coefficients used for computation
S
0.1 0.17 0.23
D
0.08 x x x
0.1 x x x 0.17 x x x 0.23 x x x
The model has been run with the different parameters. It is then possible to evaluate
the silver deposition temperature for each condition. Figure 88 displays the silver
deposition temperature obtained for each set of absorbance coefficients ( � , �) with a
laser beam velocity of 0.1 mm.s-1.

137
Figure 88: Maximum temperature in a silver deposition as function of the sets of absorbance coefficients ( , ) and with a laser beam velocity of 0.1 mm.s-1.
Each line in Figure 88 represents the silver deposition temperature as a function of
the absorbance of the silver deposition; the absorbance of the Mg-2wt.%Ca substrate
is fixed. The predicted temperature values are found in a large range: from 90 °C to
195 °C. As expected, the higher are the absorbance coefficients; the higher is the
resulting temperature in the silver deposition. However, an important effect of the
absorbance of the substrate on the silver deposition temperature can be noted. An
increment by 0.07 of the substrate absorbance increases the silver deposition by
20 °C. This large range of temperature needs to be compared with existing literature
in order to determine whether or not they are consistent with our observations, i.e.
sintering progress of the silver nanoparticles deposition.
Sintering of silver nanoparticles, with an average size between 24 nm to 40 nm, has
previously been studied at 150 °C [45] [196]. Thus, it is considered that the sets of
absorbance involving a minimum temperature of 150 °C during the laser treatment
may be able to sinter the silver nanoparticles. Considering Figure 88, there are only
five cases which have the maximum temperature in silver deposition equal or higher
than 150 °C with a laser velocity of 0.1 mm.s-1. These sets of absorbance coefficients
are displayed in Table 21.
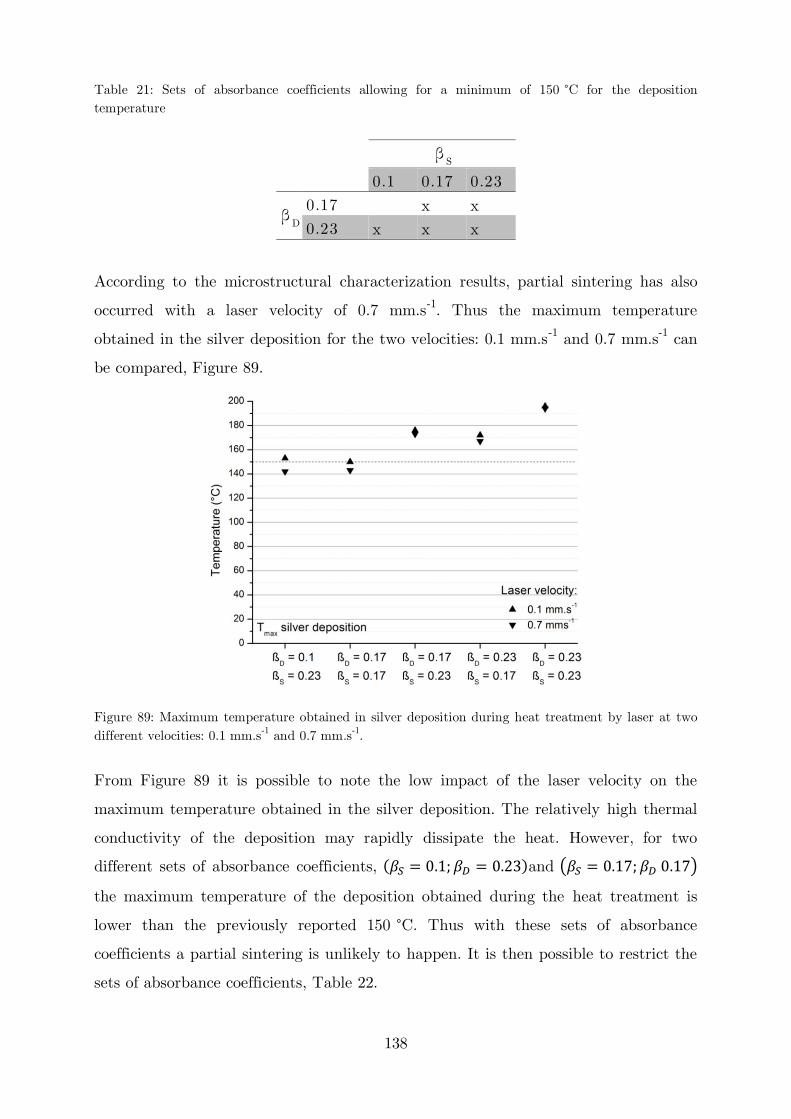
138
Table 21: Sets of absorbance coefficients allowing for a minimum of 150 °C for the deposition temperature
S
0.1 0.17 0.23
D 0.17 x x 0.23 x x x
According to the microstructural characterization results, partial sintering has also
occurred with a laser velocity of 0.7 mm.s-1. Thus the maximum temperature
obtained in the silver deposition for the two velocities: 0.1 mm.s-1 and 0.7 mm.s-1 can
be compared, Figure 89.
Figure 89: Maximum temperature obtained in silver deposition during heat treatment by laser at two different velocities: 0.1 mm.s-1 and 0.7 mm.s-1.
From Figure 89 it is possible to note the low impact of the laser velocity on the
maximum temperature obtained in the silver deposition. The relatively high thermal
conductivity of the deposition may rapidly dissipate the heat. However, for two
different sets of absorbance coefficients, � = . ; � = . and ( � = . 7; � . 7) the maximum temperature of the deposition obtained during the heat treatment is
lower than the previously reported 150 °C. Thus with these sets of absorbance
coefficients a partial sintering is unlikely to happen. It is then possible to restrict the
sets of absorbance coefficients, Table 22.

139
Table 22: Possible sets of absorbance coefficients allowing the characterized sintering quality.
S
0.17 0.23
D 0.17 x 0.23 x x
In the microstructural characterizations, it has been noted different pore sizes for
different velocities. The evolution of pore size results from the progress of the
sintering: the agglomeration of nanoparticles creates larger pores with time before
densification. Thus, these differences suggest a different interaction time of the laser
on the silver deposition to allow the sintering process to progress. Using COMSOL,
for a discrete location, it is possible to retrieve the temperature profile as a function
of time. Figure 90 shows the temperature profile of a point at the top surface of the
deposition for � = . ; � = . and different velocities: 0.1 mm.s-1 and 0.7
mm.s-1.
Figure 90: Temperature profile during sintering of a point on the top surface of the silver deposition with � = . ; � = . and for different velocities: 0.1 mm.s-1 and 0.7 mm.s-1.
According to the simulation, using a 0.7 mm.s-1 laser velocity, the temperature in the
deposition rises rapidly and decreases rapidly. By decreasing the laser velocity to 0.1
mm.s-1, the predicted temperature profile shows a gradual increase up to the
maximum temperature and the symmetrical decrease for the cooling part. As
mentioned in the previous paragraph, these two temperature profiles would impact

140
the porosities of the deposition. These predictions can then be useful to optimise the
microstructure of the deposition with respect to specific applications.
Using the predicted data of temperature from COMSOL, compared the evolution of
temperature of the top and bottom surfaces of the silver deposition during the heat
treatment have been compared. For instance, for the set � = . ; � = . ,
Figure 91 shows that the maximum temperature of the bottom surface is only a few
degrees below the maximum of the top surface. Thus, the heating rate can also be
assumed to be the same at both locations. This is in accordance with the
homogeneous sintering quality observed previously by cross section characterization.
Figure 91: Temperature evolution during sintering of the top and bottom surfaces of silver deposition at the same (x,y) coordinates with = . , = . and with a laser beam velocity of 0.1 mm.s-1.
After comparison between simulation and microstructural information of the
deposition, the possibilities for the set of absorbance values have been reduced to
three, Table 22. Then other experimental information has been considered to further
reduce this set.
As reported in the microstructural characterization section, the laser sintering
treatment also affects the microstructure of the substrate. A sublayer of fine grains
has been observed at the surface of the substrate. This sublayer has been observed
under the deposition and outside the deposition. No obvious difference has been
detected between these two conditions (zone below or outside the deposition layer).

141
Then, it is of interest to consider the predicted temperature gradient inside the
substrate to obtain additional information, Figure 92.
� = . 7 and � = .
(a) (b)
� = . and � = . 7
(c) (d)
� = . and � = .
(e) (f)
Figure 92: Temperature profiles of substrate cross sections or silver deposition/substrate during sintering with a laser beam velocity of 0.1 mm.s-1 and for (a) and (b) � = . 7, � = . ; for (c) and (d) � = . , � = . 7; (e) and (f) � = . , � = . .
In the laser treatment, an overlapping of the laser beam has been realized. The spot
size at the process zone equals to 85 µm. However, the laser path lines are at a

142
distance of 70 µm from each other. The distance between lines is represented on each
image in Figure 92. According to the simulation, the thermal impact of the laser
sintering is not restricted to a band of 1 µm below the surface. High temperatures are
reached at the first micrometre below the surface: from 100 °C to 180 °C. The
temperature rapidly decreases with the thickness of the substrate. The
microstructural evolution can occur only in the area with high driving forces for
recrystallization. Therefore, the microstructural observations only give a low limit to
the thickness of the thermally affected area below the surface of the substrate.
It has been reported that recrystallization could occur in pure magnesium between
room temperature to 200 °C [197]. In the present alloy, calcium solubility is very
low. Thus the sublayer presenting a fine microstructure: 100 nm to 600 nm, may be
the result of recrystallization. This recrystallization would take place in a work
hardened area resulting from the mechanical polishing (see Section 4.4.4).
5.5.3 In situ temperature measurement
For complementary experimental information, in situ temperature measurement has
been performed. A thermocouple has been set up at the bottom of a sample and the
laser process has been performed on the top surface, Figure 93.
Figure 93: Schema of the in situ temperature measurement.
An average temperature of 85 °C has been measured when the laser beam processed
the top sample surface. The thermal model has been adapted to this configuration by
taking in account, an external convection without contact instead of a thermal
contact on the bottom surface. This adapted model has been used to predict the
bottom temperature of the sample for different substrate absorbance coefficient,
Figure 94.

143
Figure 94: Predicted bottom substrate temperature for different substrate absorbance coefficients.
This in situ measurement is in the range of temperature predicted by the model with
this sample configuration for a substrate absorbance coefficient ranging between 0.17
and 0.23. This suggests a higher substrate absorbance coefficient than 0.17. However,
more detailed investigation is required to restrict the range of values for the substrate
absorbance.
***
As a conclusion for this part, the comparison of the microstructural observations and
the predicted temperatures of the model has permitted to limit the range of possible
values for the absorbance coefficients of the substrate and the silver nanoparticles
deposition. It is difficult to give definitive values; both substrate and silver deposition
absorbance coefficients range between 0.17 and 0.23. However, this first estimation
may be sufficient to allow using the thermal model for further optimization of the
deposition process.
5.6 Conclusions
The second part of this thesis was focused on the deposition of silver nanoparticles
which could help to design magnesium implants with antibacterial surfaces. Using an
additive manufacturing technology, silver nanoparticles are deposited on the surface
of the substrate. The deposition follows any geometrical pattern previously designed

144
by computer-aided design software. After deposition, a laser assisted sintering is
processed onto the material.
In a first step of this part, the patterning process parameters have been optimized for
controlled deposition. These parameters have been determined using general
characteristics of the deposition examined by optical microscopy, profilometry and
SEM. The following deposition characteristics have been obtained after this first step:
The optimization of the deposition process had permitted to obtain a
reproducible deposition line of 20 µm width. The thickness of this line ranges
between few hundreds of nanometres and one micrometre.
The optimization of the laser heat treatment of the patterned samples
permitted to obtain a homogeneous sintering with surface roughness in nano-
scale on the deposition.
On a second step, a microstructural study of the deposition has been carried out to
characterize the sintering quality. The interface, as well as the subsurface of the
substrate, has also been characterized. Detailed investigations have been carried out
on cross sections realized by FIB nano-machining of samples and using different
techniques: SEM, TEM and ACOM/ASTAR. The following observations can be
pointed out:
The impact of laser beam velocity, on a range from 0.1 mm.s-1 to 0.7 mm.s-1,
during the sintering process has been carried out by the microstructural
observations. It appears that at both velocities, the deposition presents a
homogeneous sintering progress through the thickness of the deposition.
At the surface of the substrate, a sublayer of fine grains with size ranging
between 100 nm to 600 nm has been observed. It is suggested that this
sublayer results from the recrystallization of a deformed area due to
mechanical polishing during sample preparation. This microstructural
information provides evidence of the thermal impact of the laser on the
substrate.
The deposition layer was found to have no bounding to the substrate in the
studied location. It is suggested that it is coming from the evaporation of the
145
ink solvents during the sintering process. Thus, a drying time may be required
after deposition to improve the bonding of the deposition to the substrate.
The third and last step was to provide a model using COMSOL Multiphysics, to
predict the thermal exchange occurring during the laser treatment. Using the
previous microstructural characterizations, the input parameters have been adjusted
and the predicted temperatures by thermal model have been compared to the
previous characterizations.
On the investigated range, the laser velocity greatly impacts the temperature
profile during the sintering process. Modifying this parameter could lead to
variable porosity structure of the deposition.
The model has permitted to show that the thermal impact from the sintering
process occurs deep into the substrate. The fine grains sublayer thickness only
gives a low limit of the thickness of this thermally affected area.
As a conclusion, this model can provide a basis to investigate the impact of different
input parameters. This may be used for further optimization of the functionalization
process using different pattern geometries or substrates.
146
6. Summary and recommendations
for future work
6.1 Summary
The present study has been carried out to obtain a framework to design
biodegradable devices with antibacterial surfaces for biomedical applications. The
final application involves different fields of study: mechanical properties, degradation
behavior, surface functionalization, in vivo interaction. Thus, depending on the point
of view, there are different directions for enhancing properties in view of this
application. In the present work, it has been chosen to work from a material point of
view. The composition of the alloy has been chosen in accordance with in vivo
requirements. Then, the material improvement has been carried out following a two
steps approach: first, on the bulk and in a second time, on the surface of the
material.
The first part of this work was to tailor the bulk microstructure of the selected alloy.
To achieve this goal, thermomechanical treatments have been used. After the
different thermomechanical processing, the microstructure of the processed samples
has been characterized: grain size, intermetallic morphology and texture. Owing to
the existing literature, the main mechanisms responsible for the improvement of
mechanical and corrosion properties have been identified. Concerning the mechanical
properties, the increase of strength can be accounted to different microstructural
features like dislocations, twins, grain size and morphology of the intermetallic.
Concerning the corrosion behavior, the dispersion and the size of the Mg2Ca
intermetallic appear to be also key parameters to reduce the corrosion rate.
Dispersing the Mg2Ca intermetallic into fine particles permits to avoid a detrimental
147
galvanic corrosion between the matrix and these particles. In addition to this effect,
the finer grain size may also have helped to improve the corrosion resistance. This
would be due to the higher density of grain boundaries which would decrease the
mismatch between the matrix lattice and the oxide lattice. From the present
investigations, ECAP appears as the most efficient thermomechanical process to
improve the mechanical and corrosion behavior of the Mg-2wt.%Ca alloy.
The second part of this work was aiming to functionalize the surface. Using an
additive manufacturing technology, it is possible to produce a deposition of silver
nanoparticles that should provide an antibacterial effect. After optimization of the
processing parameters it was possible to produce patterns of continuous lines of silver
nanoparticles with a controlled geometry. A thermal treatment by laser has been
carried out in the aim to provide cohesion of the deposition and with the substrate.
Cross sections on samples after deposition and thermal treatment have allowed
characterizing the interface of deposition. The porous microstructure of the deposited
layer is characteristic of a partial sintering of the silver nanoparticles. In addition,
non-contact areas between the deposition and the substrate suggest a low interaction
between the deposited layer and the substrate. It has also been observed that the
thermal treatment affects the substrate: a 1 µm sublayer of fine grains has been
observed under the surface. For further optimization, a thermal model using
COMSOL Multiphysics has been realized. Using this model, it is then possible to
predict the thermal effect for different input parameters like the laser power or the
velocity of the laser beam. Thus, this model can be used for further improvement of
the deposition and more specifically to estimate the interaction between the
deposition and the substrate.
6.2 Recommendations for future work
Further refinement of the microstructure
During this work the beneficial impact of the refinement of the microstructure has
been shown. Thus, in a future study, it may be worth to investigate the possibilities
to decrease grain size and improve the dispersion of the intermetallic particles. In the
present work, ECAP was performed at relatively high temperature: 280 °C. This
148
temperature allowed the sample to recrystallize into fine grains with average size of
2 µm. Decreasing the temperature may lead to a finer microstructure, as for instance,
grain size around 1 µm has been reported in a AZ91 magnesium alloy by processing
with ECAP at 175 °C [58]. In the present case, at temperatures less than 280 °C the
material was broken. A possibility suggested by Mussi [141] is to decrease the
temperature step by step along the passes. The improved microstructure at each pass
permit to decrease the temperature for the next pass. Another possibility suggested in
the literature is to pre-process by extrusion the material before using ECAP [114]. In
addition, another beneficial effect that may be obtained by using extrusion before
ECAP would be to allow a more dispersed distribution of the intermetallic particles
as it has been reported in a magnesium alloy AE21 [198].
Optimization of the deposition
Through the cross section observations, it has been noticed that the deposition was
not bounded with the substrate. It has been suggested that during heat treatment by
laser, the remains of solvent may have created these gaps. Thus, a drying period
using the hot plate at moderate temperature to avoid any microstructural evolution
of the material may help to improve the contact of the deposit. In addition, using the
thermal simulation established in the present work, laser parameters to obtain
different temperature levels and laser interaction times can be determined. For
instance, a series of conditions of laser power and velocity can be determined using
the simulation. These conditions can be used to find the optimum condition for the
adhesion of the deposit.
Biological tests
Preliminary cell viability tests have been performed in collaboration with Pr. J.
Gough at the University of Manchester. These tests have been done on the
thermomechanically processed samples using a cell culture of human osteoblasts in a
culture medium. These first tests have shown no negative effect of the microstructure
tailoring on the cell viability. However, these tests were carried out for only 3 days in
a controlled environment. Thus, after further optimization of the material with the
above recommendations, in vivo tests could be carried out on laboratory animals.
Indeed, the corrosion behavior between the in vivo and in vitro environment is
different, thus this in vivo tests will be needed to allow for better optimization. In

149
addition, the effect of the silver patterning on degradation, cell viability and adhesion
will have to be investigated. In particular, tuning the pattern geometry or using a
sublayer between the substrate and the deposition might be of interest in view of the
degradable implant applications.

150
List of bibliography
[1] B. D. Ratner, "Biomaterials science: an interdisciplinary endeavor," in Biomaterials
Science: An Introduction to Materials in Medicine.: Academic Press, 1997.
[2] D. Gibbons, "Introduction to medical implant materials," in ASM Handbook -
Materials for medical devices.: ASM International, 2012, vol. 23.
[3] B. D. Ratner, A. S. Hoffman, F. J. Schoen, et al., Biomaterials science - An
introduction to materials in medicine.: Academic Press, 1997.
[4] L. Matthew, R. J. E. Busam, W. T. Obremskey, "Hardware removal: Indications and
expectations.," Journal of the American, vol. 14, pp. 113-120, 2006.
[5] M. P. Staiger, A. M. Pietak, J. Huadmai, et al., "Magnesium and its alloys as
orthopedic biomaterials: A review," Biomaterials, vol. 27, pp. 1728-1734, 2006.
[6] A. Denkena and B. Lucas, "Biocompatible magnesium alloys as absorbable implant
materials – Adjusted surface and subsurface properties by machining Processes," CIRP
Annals - Manufacturing Technology, vol. 56, pp. 113-116, 2007.
[7] J. C. Middleton and A. J. Tipton, "Synthetic biodegradable polymers as orthopedic
devices," Biomaterials, vol. 21, pp. 2335-2346, 2000.
[8] H.G. Seiler, Handbook on Toxicity of Inorganic Compounds, 1st ed.: CRC Press: Boca
Raton, 1987.
[9] F. Witte, "The history of biodegradable magnesium implants: A review," Acta
Biomateriala, vol. 6, pp. 1680-1692, 2010.
[10] S. C. Cowin, A. E. Goodship, J. L. Cunningham, "Bone adaptation," in Bone
Mechanics Handbook, Second Edition.: Taylor and Francis, 2001, ch. 5.
[11] M. E. Müller, M. Allgöwer, S. M. Perre, Manual of INTERNAL FIXATION:
Techniques Recommended by the Ao-Asif Group.: Springer Science & Business Media,
1991.
[12] M. M. Avedesian and H. Baker, "Properties of unalloyed magnesium," in ASM
Specialty handbook - Magnesium and Magnesium Alloys.: ASM International, 1999.
[13] Y. H. An, R. A. Draughn, E. Bonucci, Mechanical testing of bone and the bone-implant
interface.: CRC Press, 1999.
[14] X.-N. Gu and Y.-F. Zheng, "A review on magnesium alloys as biodegradable
materials," Frontiers of Materials Science in China, vol. 4, pp. 111-115, 2010.
151
[15] L. E. Claes, "Mechanical characterization of biodegradable implants," Clinical
Materials, vol. 10, pp. 41-46, 1992.
[16] H. Wang, Y. Estrin, H. F. Fu, "The effect of pre-processing and grain structure on the
bio-corrosion and fatigue resistance of magnesium alloy AZ31," Advanced Engineering
Materials, vol. 9, pp. 967-972, 2007.
[17] H. Wang, Y. Estrin, Z. Zúberová, "Bio-corrosion of a magnesium alloy with different
processing histories," Materials letters, vol. 62, pp. 2476-2479, 2008.
[18] D. Song, A.B. Ma, J. Jiang, "Corrosion behavior of equal-channel-angular-pressed pure
magnesium in NaCl aqueous solution," Corrosion Science, vol. 52, pp. 481-490, 2010.
[19] M. Salahshoor and Y. Guo, "Biodegradable orthopedic magnesium-calcium (mgca)
alloys, processing, and corrosion performance," Materials, vol. 5, pp. 135-155, 2012.
[20] Z. Pu, G.-L. Song, S. Yang, "Grain refined and basal textured surface produced by
burnishing for improved corrosion performance of AZ31B Mg alloy," Corrosion
Science, vol. 57, pp. 192-201, 2012.
[21] J.L. Clement and P.S. Jarett, "Antibacterial Silver," Metal-Based Drugs, vol. 1, pp.
467-482, 1994.
[22] F. Witte, N. Hort, C. Vogt, et al., "Degradable biomaterials based on magnesium
corrosion," Current Opinion in Solid State and Materials Science, vol. 12, pp. 63-72,
2008.
[23] B. Langelier, X. Wang, S. Esmaeili, "Evolution of precipitation during non-isothermal
ageing of an Mg–Ca–Zn alloy with high Ca content," Materials Science and
Engineering: A, vol. 538, pp. 246-251, 2012.
[24] H. Alemohammad, O. Aminfar, E. Toyserkani, "Morphology and microstructure
analysis of nano-silver thin films deposited by laser-assisted maskless microdeposition,"
Journal of Micromechanics and Microengineering, no. 18, 2008.
[25] M.O. Pekguleryuz, "Current developments in wrought magnesium alloys," in Advances
in wrought magnesium alloys - Fundamentals of processing, properties and
applications.: Woodhead Publishing, 2012.
[26] S. K. Sahoo, R. K. Sabat, S. Panda, et al., "Mechanical Property of Pure Magnesium:
From Orientation Perspective Pertaining to Deviation from Basal Orientation,"
Journal of Materials Engineering and Performance, vol. 24, pp. 2346-2353, 2015.
[27] M. R. Bar“ett, "Twi““i“g a“d the ductility ”f mag“esium all”ys χart Iα Te“si”“ twins," Materials Science and Engineering A, vol. 464, pp. 1-7, 2007.
152
[28] S. R. Agnew, J. A. Horton, T. M. Lillo, et al., "Enhanced ductility in strongly textured
magnesium produced by equal channel angular processing," Scripta Materialia, vol. 50,
pp. 377-381, 2004.
[29] J. Koike, R. Ohyama, T. Kobayashi, et al., "Grain-Boundary Sliding in AZ31
Magnesium Alloys at Room Temperature to 523 K," Materials Transactions, vol. 44,
pp. 445-451, 2003.
[30] S. E. Harandi, M. Mirshahi, S. Koleini, et al., "Effect of Calcium Content on the
Microstructure, Hardness and In-Vitro Corrosion Behavior of Biodegradable Mg-Ca
Binary Alloy," Materials Research, pp. 11-18, 2013.
[31] J. W. Seong and W. J. Kim, "Development of biodegradable Mg–Ca alloy sheets with
enhanced strength and corrosion properties through the refinement and uniform
dispersion of the Mg2Ca phase by high-ratio differential speed rolling," Acta
Biomaterialia, vol. 11, pp. 531-542, 2015.
[32] W.-C. Kim, J.-G. Kim, J.-Y. Lee, et al., "Influence of Ca on the corrosion properties of
magnesium for biomaterials," Materials Letters, pp. 4146-4148, 2008.
[33] Y. S. Jeong and W. J. Kim, "Enhancement of mechanical properties and corrosion
resistance of Mg–Ca alloys through microstructural refinement by indirect extrusion,"
Corosion Science, vol. 82, pp. 392-403, 2014.
[34] N. Birbilis, K. D. Ralston, S. Virtanen, "Grain character influences on corrosion of
ECAPed pure magnesium," Corrosion Engineering, Science and Technology, vol. 45,
pp. 224-230, 2010.
[35] M. Alvarez-Lopez, M. D. Pereda, J. A. Del Valle, "Corrosion behaviour of AZ31
magnesium alloy with different grain sizes in simulated biological fluids," Acta
Biomaterialia, vol. 6, pp. 1763-1771, 2010.
[36] N. N. Aung and W. Zhou, "Effect of grain size and twins on corrosion behaviour of
AZ31B magnesium alloy," Corrosion Science, vol. 52, pp. 589-594, 2010.
[37] K. U. Kainer, Magnesium Alloys and Technologies, John Wiley & Sons, Ed., 2006.
[38] G-.L. Song, R. Mishra, Z.Q. Xu, "Crystallographic orientation and electrochemical
activity of AZ31 Mg alloy," Electrochemistry Communications, vol. 12, pp. 1009-1012,
2010.
[39] G.-L. Song and Z. Xu, "Crystal orientation and electrochemical corrosion of
polycrystalline Mg," Corrosion Science, vol. 63, pp. 100-112, 2012.
153
[40] M. Ben-Haroush, G. Ben-Hamu, D. Eliezer, "The relation between microstructure and
corrosion behavior of AZ80 Mg alloy following different extrusion temperatures,"
Corrosion Science, vol. 50, pp. 1766-1778, 2008.
[41] J. D. Loveless, H. Alemohammad, J. Li, et al., "Laser-assisted maskless
microdeposition of silver nano-particles on a magnesium substrate," Materials Letters,
vol. 63, pp. 1397-1400, 2009.
[42] F. Dullien, Porous Media - Fluid Transport and Pore Structure, Elsevier, Ed., 2012.
[43] T. G. Lei, J. N. Calata, G.-Q. Lu, "Low-Temperature Sintering of Nanoscale Silver
Paste for Attaching Large-Area (>100mm²) Chips," IEEE Transaction on
Components and packing technology, vol. 33, pp. 98-104, 2010.
[44] K. Park, D. Seo, J. Lee, "Conductivity of silver paste prepared from nanoparticles,"
Colloids and Surfaces A: Physicochemical and Engineering Aspects, vol. 313-314, pp.
351-354, 2008.
[45] J. R. Greer and R. A. Street, "Thermal cure effects on electrical performance of
nanoparticle silver inks," Acta Materialia, vol. 55, pp. 6345-6349, 2007.
[46] Z. Z. Fang and H. Wang, "Densification and grain growth during sintering of
nanosized particles," International Materials Reviews, vol. 53, pp. 326-352, 2008.
[47] E. Toyserkani, A. Khajepour, S. Corbin, Laser Cladding, CRC Press, Ed., 2004.
[48] E. Foroozmehr, H. Alemohammad, X. Wan, et al., "Laser-assisted surface patterning of
magnesium with silver nanoparticles: synthesis, characterization and modelling,"
Journal of Physics D: Applied Physics, vol. 44, 2011.
[49] E. Jabari, S. Tong, A. Azhari, et al., "Non-planar interconnects in double-sided flexible
Cu-PET substrates using a laser-assisted maskless microdeposition process: 3D finite
element modeling and experimental analysis," Optics and Lasers in Engineering, vol.
54, pp. 117-127, March 2014.
[50] D. A. Kramer, "Magnesium," 2011 Minerals Yearbook, 2013.
[51] Roskill, Magnesium Metal: Global Industry Markets and Outlook 2012, 2012.
[52] Z. Yang, J. P. Li, J. X. Zhang, et al., "Review on research and development of
magnesium alloys," Acta Metallurgica Sinica (English Letters), vol. 21, pp. 313-328,
2008.
154
[53] I. Polmear, "The light metals," in Light Alloys (Fourth Edition) - From Traditional
Alloys to Nanocrystals.: Butterworth-Heinemann, 2005.
[54] A. Azushima, R. Kopp, A. Korhonen, et. al., "Severe plastic deformation (SPD)
processes for metals," CIRP Annals - Manufacturing Technology, vol. 57, pp. 716-735,
2008.
[55] R. Abbaschian, L. Abbaschian, R. Reed-Hill, Physical metallurgy principles, Fourth
edition.: Wadsworth Publishing Co Inc, 2008.
[56] F. C. Campbel, Elements of Metallurgy and Engineering Alloys.: ASM International,
2008.
[57] R. Kaibyshev, M. Barnett, C. Bettles, Advances in wrought magnesium alloys -
Fundamentals of processing, properties and applications, Woodhead Publishing, Ed.,
2012.
[58] M. Mabuchi, H. Iwasaki, K. Higashi, "Low temperature superplasticity of Magnesium
Alloys Processed by ECAE," Materials Science Forum, vol. 243-245, pp. 547-552, 1997.
[59] Hall E. O., "The deformation and ageing of mild steel: III - Discussion of results,"
Proceedings of the Physical Society, pp. 747-752, 1951.
[60] R. M. Aikin, "The mechanical properties of in-situ composites," The Journal of The
Minerals, Metals & Materials Society, vol. 49, pp. 35-39, 1997.
[61] C. S. Smith, Transactions of the Metallurgical Society of AIME, vol. 175, p. 47, 1948.
[62] NC, "3. The deformed state of metals (II). Structure," Progress in Materials Science,
vol. 25, pp. 135-271, 1980.
[63] D. Orlov, K.D. Ralston, N. Birbilis, et al., "Enhanced corrosion resistance of Mg alloy
ZK60 after processing by integrated extrusion and equal channel angular pressing,"
Acta Materialia, vol. 59, pp. 6176-6186, 2011.
[64] J. F. Nie, "Effects of precipitate shape and orientation on dispersion strengthening in
magnesium alloys," Scripta Materialia, vol. 48, pp. 1009-1015, 2003.
[65] Polmear I., "Grades and alloys," in ASM Specialty handbook - Magnesium and
Magnesium Alloys.: ASM International, 1999.
[66] J.-L. Crolet and G. Béranger, "Corrosion en milieu aqueux des métaux et alliages," in
Corrosion et vieillissement: phénomènes et mécanismes.α Tech“iques de l’I“ge“ieur, 1998.
[67] E. E. Stansbury and R. A. Buchanan, Fundamentals of Electrochemical Corrosion.:
ASM International, 2000.
155
[68] G. L. Song and A. Atrens, "Corrosion mechanisms of magnesium alloys," Advanced
engineering materials, vol. 1, pp. 11-33, 1999.
[69] G. Song and A. Atrens, "Understanding magneisum corosion - A framework for
improved alloy performance," Advanced Engineering Materials, vol. 5, pp. 837-858,
2003.
[70] E. Gali, "Part 1 - Electrochemical fundamentals and active-passive corrosion
behaviors," in Corrosion Resistance of Aluminum and Magnesium Alloys:
Understanding, Performance, and Testing.: Wiley, 2010.
[71] Polmear I., "Magnesium alloys and applications," Materials Science and Technology,
vol. 10, pp. 1-16, 1994.
[72] G. L. Song, "Corrosion behavior and prevention strategies for magnesium (Mg) alloys,"
in Corrosion Prevention of Magnesium Alloys.: Woodhead Publishing Series, 2013, ch.
1.
[73] P. Kurze, "Corrosion and Corrosion Protection of Magnesium," in Magnesium - Alloys
and Technologies.: Wiley-VCH, 2004, ch. 13.
[74] Rolled Alloys. rolledalloys.com. [Online]. http://www.rolledalloys.com/technical-
resources/blog/pitting-corrosion?blogID=9e7f7bf0-e670-4e25-a5fc-0f9cfd6eb7e3
[75] R.-C. Zeng, J. Zhang, W.-J. Huang, et al., "Review of studies on corrosion of
magnesium alloys," Transactions of nonferrous metals society of China, vol. 16, pp.
763-771, 2006.
[76] E. Gali, "Part 3 - Properties, use, and performance of magnesium and its alloys," in
Corrosion Resistance of Aluminum and Magnesium Alloys Understanding,
Performance.: Wiley, 2010b.
[77] G. L. Makar and J. Kruger, "Corrosion of magnesium," International Materials
Reviews, vol. 38, pp. 138-153, 1993.
[78] S. Abela, "Protective Coatings for Magnesium Alloys," in Magnesium Alloys -
Corrosion and Surface Treatments.: InTech, 2011, ch. 10.
[79] Polmear I., "Magnesium alloys," in Light Alloys (Fourth Edition) - From Traditional
Alloys to Nanocrystals.: Butterworth-Heinemann, 2005b.
[80] H. Hornberger, S. Virtanen, A.R. Boccaccini, "Biomedical coatings on magnesium
alloys – A review," Acta Biomaterialia, vol. 8, pp. 2442-2455, 2012.
[81] K. Y. Chiu, M. H. Wong, F. T. Cheng, et al., "Characterization and corrosion studies
of fluoride conversion coating on degradable Mg implants," Surface & Coatings

156
Technology, vol. 202, pp. 590-598, 2007.
[82] M. Carboneras, M. C. Garcia-Alonso, M. L. Escudero, "Biodegradation kinetics of
modified magnesium-based materials in cell culture medium," Corrosion Science, vol.
53, pp. 1433-1439, 2011.
[83] H. M. Wong, K. W.K. Yeung, K. O. Lam, al. et, "A biodegradable polymer-based
coating to control the performance of magnesium alloy orthopaedic implants,"
Biomaterials, vol. 31, pp. 2084-2096, 2010.
[84] and Draughn R. A., An Y. H., "Mechanical properties of bone," in Mechanical testing
of bone and the bone-implant interface.: CRC Press, 1999.
[85] W. Jee and S. Cowin, "Integrated Bone Tissue Physiology: Anatomy and Physiology,"
in Bone mechanics handbook - Second edition.: CRC Press, 2001.
[86] J. B. Park and R. S. Lakes, An introduction to biomaterials - Second edition.: Plenum
Press, 1992.
[87] B. Cummings, Bone fracture healing process, 2004, Pearson Education, Inc.
[88] W. R. Fordham, S. Redmond, A. Westerland, et al., "Silver as a bactericidal coating
for biomedical implants," Surface & coatings technology, vol. 253, pp. 52-57, 2014.
[89] R. Marsell and T. A. Einhorn, "The biology of fracture healing," Injury, vol. 42, pp.
551-555, 2011.
[90] (2015, Aug.) larapedia.com. [Online].
http://www.larapedia.com/ortopedia_fratture/fratture_i_fattori_che_influenzano_il
_consolidamento_delle_fratture.html
[91] M.P. Sealy and Y.B Guo, "Fabrication and Characterization of Surface Texture for
Bone Ingrowth by Sequential Laser Peening Biodegradable Orthopedic Magnesium-
Calcium Implants," Journal of Medical Devices, 2011.
[92] Y. Yun, Z. Dong, D. Yang, et al., "Biodegradable Mg corrosion and osteoblast cell
culture studies," Materials Science and Engineering: C, vol. 29, pp. 1814-1821, 2009.
[93] N. T. Kirkland, Birbilis, N., "Developments in Mg-based alloys for biomaterials," in
Magnesium Biomaterials - Design, Testing, and Best Practice.: Springer, 2013.
[94] Standing Committee on the Scientific Evaluation of Dietary Reference Intakes, Food
and Nutrition Board, Institute of Medicine, Dietary Reference Intakes.: National
Academies Press, 1999, vol. 565, DRI for Calcium, Phosphorus, Magnesium, Vitamin
D, and Fluoride.
157
[95] M. Moravej and D. Mantovani, "Biodegradable metals for cardiovascular stent
application: interests and new opportunities," International Journal of Molecular
Sciences, vol. 12, pp. 4250-4270, 2011.
[96] O. Dejean, Orthopédie, traumatologie.: Med-Line, 2001.
[97] Hofmann G. O., "Biodegradable implants in traumatology: a review on the state-of-
the-art," Archives of Orthopaedic and Trauma Surgery, vol. 114, pp. 123-132, 1995.
[98] C. K. Seal, K. Vince, M. A. Hodgson, "Biodegradable Surgical Implants based on
Magnesium Alloys - A Review of Current Research," IOP Conf. Series: Materials
Science and Engineering, vol. 4, 2009.
[99] H. S. Brar, J. Wong, M. V. Manuel, "Investigation of the mechanical and degradation
properties of Mg–Sr and Mg–Zn–Sr alloys for use as potential biodegradable implant
materials," Journal of the mechanical behavior of biomedical materials, vol. 7, pp. 87-
95, 2012.
[100] J. Kubásek, D. V”jtěch, J. Lip”v, et al., "Structure, mecha“ical pr”perties, c”rr”si”“ behavior and cytotoxicity of biodegradable Mg–X (X=Sn, Ga, In) alloys," Materials
Science and Engineering C, vol. 33, pp. 2421-2432, 2013.
[101] A. L. Boskey, "Bone mineralization," in Bone Mechanics Handbook - Second Edition.:
CRC Press, 2001.
[102] Z. Li, X. Gu, S. Lou, et al., "The development of binary Mg-Ca alloys for use as
biodegradable materials within bone," Biomaterials, pp. 1329-1344, 2008.
[103] B. L. Mordike and P. Lukac, "Physical Metallurgy," in Magnesium Technology -
Metallurgy, Design Data, Applications.: Springer, 2006, ch. 3.
[104] D. J. Zuliani and B. Cloasset, "Magnesium-calcium alloys for debismuthizing lead,"
US5041160 A, 1991.
[105] P. Vilars and K. Cenzual, Pearson's Crystal Data: Crystal Structure Database for
Inorganic Compounds, 2008/09.
[106] J. F. Nie and B. C. Muddle, "Precipitation hardening of Mg-Ca(-Zn) alloys," Scripta
Materiala, pp. 1475-1481, 1997.
[107] A. Drynda, T. Hassel, R. Hoehn, et al., "Development and biocompatibility of a novel
corrodible fluoride-coated magnesium-calcium alloy with improved degradation kinetics
and adequate mechanical properties for cardiovascular applications," Journal of
Biomedical Materials Research Part A, pp. 763-775, 2010.

158
[108] Y. Murakoshi, K. Kikuchi, M. Katoh, et al., "Fabrication and Property of Degradable
Magnesium-Calcium Alloy Composites with Hydroxyapatite," IFMBE Proceedings, pp.
1226-1229, 2010.
[109] H.-S. Han, Y. Minghui, H.-K. Seok, et al., "The modification of microstructure to
improve the biodegradation and mechanical properties of a biodegradable Mg alloy,"
Journal of the Mechanical Behavior of Biomedical Materials, pp. 54-60, 2013.
[110] M. Furukawa, Z. Horita, M. Nemoto, et al., "Review - Processing of metals by equal-
channel angular pressing," Journal of Materials Science, pp. 2835-2843, 2001.
[111] R. E. Goforth, K. T. Hartwing, L. R. Cornwell, "Severe Plastic Deformation of
Materials by Equal Channel Angular Extrusion (ECAE)," in Investigations and
Applications of Severe Plastic Deformation.: Kluwer Academic Publishers, 2000.
[112] Y. Iwahashia, Z. Horita, M. Nemoto, et al., "The process of grain refinement in equal-
channel angular pressing," Acta Materiala, vol. 46, pp. 3317-3331, 1998.
[113] S. Biswas, S. S. Dhinwal, S. Suwas, "Room-temperature equal channel angular
extrusion of pure magnesium," Acta Materiala, pp. 3247-3261, 2010.
[114] K. Matsubara, Y. Miyahara, Z. Horita, et al., "Developing superplasticity in a
magnesium alloy through a combination of extrusion and ECAP," Acta Materialia, pp.
3073-3084, 2003.
[115] R. Lapovok, Y. Estrin, M. V. Popov, et al., "Enhanced Superplasticity in a Magnesium
Alloy Processed by Equal-Channel Angular Pressing with a Back-Pressure," Advanced
Enginering Materials, vol. 10, pp. 429-433, 2008.
[116] A. Mussi, J.J. Blandin, L. Salvo, et al., "Resistance to strain-induced damage of an
ultrafine-grained magnesium alloy deformed in superplastic conditions," Acta
Materialia, vol. 54, pp. 3801-3809, 2006.
[117] M. Furukawa, Y. Iwahashi, Z. Horita, et al., "The shearing characteristics associated
with equal-channel angular pressing," Materials Science and Engineering A, vol. 257,
pp. 328-332, 1998.
[118] M. Nemoto, Z. Horita, M. Furukawa, et al., "Microstructural Evolution for
Superplasticity Using Equal-Channel Angular Pressing," Materials Science Forum, vol.
304-306, pp. 59-66, 1999.
[119] R. B. Figueiredo and T. G. Langdon, "Principles of grain refinement in magnesium
alloys processed by equal-channel angular pressing," Journal of Materials Science, vol.
44, pp. 4758-4762, 2009.

159
[120] Y. T. Zhu and T. C. Lowe, "Observations and issues on mechanisms of grain
refinement during ECAP process," Materials Science and Engineering A, pp. 46-53,
2000.
[121] Z. Horita, K. Matsubara, K. Makii, et al., "A two-step processing route for achieving a
superplastic forming capability in dilute magnesium alloys," Scripta Materialia, vol. 47,
pp. 255-260, 2002.
[122] K. Matsubara, Y. Miyahara, Z. Horita, et al., "Achieving Enhanced Ductility in a
Dilute Magnesium Alloy through Severe Plastic Deformation," Metallurgical and
materials transactions A, vol. 35, pp. 1735-1744, 2004.
[123] B. Beausir, S. Suwas, L. S. Toth, et al., "Analysis of texture evolution in magnesium
during equal channel angular extrusion," Acta Materialia, vol. 56, pp. 200-214, 2008.
[124] W.J. Kim, S.I. Hong, Y.S. Kim, et al., "Texture development and its effect on
mechanical properties of an AZ61 Mg alloy fabricated by equal channel angular
pressing," Acta Materialia, vol. 51, pp. 3293-3307, 2003.
[125] Y. Yoshida, L. Cisar, S. Kamado, et al., "Effect of Microstructural Factors on Tensile
Properties of an ECAE-Processed AZ31 Magnesium Alloy," Materials Transactions,
vol. 44, pp. 468-475, 2003.
[126] E. Zhang and L. Yang, "Microstructure, mechanical properties and bio-corrosion
properties of Mg–Zn–Mn–Ca alloy for biomedical application," Materials Science and
Engineering A, vol. 497, pp. 111-118, 2008.
[127] Y. Wan, G. Xiong, H. Luo, et al., "Preparation and characterization of a new
biomedical magnesium–calcium alloy," Materials and Design, vol. 29, pp. 2034-2037,
2008.
[128] N. T. Kirkland, N. Birbilis, J. Walker, et al., "In-vitro dissolution of magnesium–calcium binary alloys: Clarifying the unique role of calcium additions in bioresorbable
magnesium implant alloys," Journal of Biomedical Materials Research Part B: Applied
Biomaterials, pp. 91-100, 2010.
[129] N.T. Kirkland, J. Lespagnol, N. Birbilis, et al., "A survey of bio-corrosion rates of
magnesium alloys," Corrosion science, pp. 287-291, 2010.
[130] H. R. Bakhsheshi Rad, M. H. Idris, M. R. A. Kadir, et al., "Microstructure analysis
and corrosion behavior of biodegradable Mg–Ca," Materials and Design, vol. 33, pp.
88-97, 2012.
[131] K. V. Kutniy, I. I. Papirov, M. A. Tikhonovsky, et al., "Influence of grain size on
mechanical and corrosion properties of magnesium alloy for medical implants,"

160
Materialwissenschaft und Werkstofftechnik, vol. 40, pp. 242-246, 2009.
[132] M.H. Idris, H. Jafari, S.E. Harandi, et al., "Characteristics of As-Cast and Forged
Biodegradable Mg-Ca Binary Alloy Immersed in Kokubo Simulated Body Fluid,"
Advanced Materials Research, pp. 301-306, 2012.
[133] N.T. Kirkland, N. Birbilis, M.P. Staiger, "Assessing the corrosion of biodegradable
magnesium implants: A critical review of current methodologies and their limitations,"
Acta Biomaterialia, pp. 925-936, 2012.
[134] B. M. Kannan and R.K. Singh Raman, "In vitro degradation and mechanical integrity
of calcium-containing magnesium alloys in modified-simulated body fluid,"
Biomaterials, pp. 2306-2314, 2008.
[135] W. A. Badawy, N. H. Hilala, M. El-Rabiee, et al., "Electrochemical behavior of Mg
and some Mg alloys in aqueous solutions of different pH," Electrochimica Acta, vol. 55,
no. 6, pp. 1880-1887, 2010.
[136] A. S. Bondarenko and G. A. Ragoisha, Progress in Chemometrics Research,
Pomerantsev A. L., Ed. New York: Nova Science Publishers, 2005, The program is
available online at http://www.abc.chemistry.bsu.by/vi/analyser/.
[137] W. S. Rasband. (1997-2015) ImageJ. [Online]. http://imagej.nih.gov/ij/
[138] ASTM, "General Intercept Procedures," in Standard Test Methods for Determining
Average Grain Size., 2013.
[139] The Open University. (2010) [Online].
http://core.materials.ac.uk/search/detail.php?id=3270
[140] L. Dupuy, "Comportement mécanique d'un alliage d'aluminium hyper-déformé," 2000.
[141] A. Mussi, "Affinage de la microstructure et amélioration des propriétés mécaniques
d’u“ alliage de mag“ésium par hyper-déformations," 2003.
[142] S. E. Harandi, M. Mirshahi, S. Koleini, et al., "Effect of Calcium Content on the
Microstructure, Hardness and In-Vitro Corrosion Behavior of Biodegradable Mg-Ca
Binary Alloy," Materials Research, pp. 11-18, 2013.
[143] Y.N. Wang and J.C. Huang, "The role of twinning and untwinning in yielding
behavior in hot-extruded Mg–Al–Zn alloy," Acta Materialia, pp. 897-905, 2007.
[144] N.T. Kirkland, M.P. Staiger, D. Nisbet, et al., "Performance-driven Design of
Biocompatible Mg Alloys," Journal of the Minerals, Metals & Materials Society, pp.
28-34, 2011.

161
[145] Y. Zong, G. Yuan, X. Zhang, et al., "Comparison of biodegradable behaviors of AZ31
and Mg–Nd–Zn–Zr all”ys i“ Ha“k’s," Materials Science and Engineering B, pp. 395-
401, 2012.
[146] M. Anik and G. Celikten, "Analysis of the electrochemical reaction behavior of alloy
AZ91 by EIS technique in H3PO4/KOH buVered K2SO4 solutions," Corrosion
Science, vol. 49, no. 4, pp. 1878-1894, 2007.
[147] G. Baril, G. Galicia, C. Deslouis, et al., "An Impedance Investigation of the
Mechanism of Pure Magnesium Corrosion in Sodium Sulfate Solutions," Journal of The
Electrochemical Society, vol. 154, no. 2, pp. C108-C113, 2007.
[148] Z. Wen, C. Wu, C. Dai, et al., "Corrosion behaviors of Mg and its alloys with different
Al contents in a modified simulated body fluid," Journal of Alloys and Compounds, pp.
392-399, 2009.
[149] R. Pinto, M. G. S. Ferreira, M. J. Carmezim, et al., "The corrosion behaviour of rare-
earth containing magnesium alloys in borate buffer solution," Electrochimica Acta, vol.
56, pp. 1535-1545, 2011.
[150] X.N. Gu, N. Li, W.R. Zhou, et al., "Corrosion resistance and surface biocompatibility
of a microarc oxidation coating on a Mg–Ca alloy," Acta Biomaterialia, pp. 1880-1889,
2011.
[151] J. Eckert, S. Scudino, M. Stoica, et al., "Mechanical Engineering Properties of CMAs,"
in Complex Metallic Alloys: Fundamentals and Applications.: Wiley-VCH, 2011, p. 274.
[152] C. W. Chung, R. G. Ding, Y. L. Chiu, et al., "Effect of ECAP on microstructure and
mechanical properties of cast AZ91 magnesium alloy," Journal of Physics: Conference
Series, vol. 241, pp. 1-4, 2010.
[153] M. Y. Zheng, X. G. Qiao, S. W. Xu, et al., "In-situ quasicrystal-reinforced magnesium
matrix composite processed by equal channel angular extrusion (ECAE)," Journal of
Material Science, vol. 40, pp. 2587-2590, 2005.
[154] Y. Watanabe, P.D. Sequeira, O. Sitdikov, et al., "Effect of processing route on
microstructure and texture development in ECAP of Al-Ti alloy.," Materials Science
Forum, vol. 561-565, pp. 251-254, 2007.
[155] K. Oh-ishi, Y. Hashi, A. Sadakata, et al., "Microstructural control of an Al-Mg-Si alloy
using Equal-Channel Angular Pression," Materials Science Forum, pp. 333-338, 2002.
[156] M. Zha, Y. Li, R. H. Mathiesen, et al., "Dispersion of soft Bi particles and grain
refinement of matrix in an Al–Bi alloy by equal channel angular pressing," Journal of
Alloys and Compounds, vol. 605, pp. 131-136, 2014.

162
[157] G. Min, H. Cui, Q. Lu, et al., "Grain Refinement and Dispersion Precipitation of I-
Phase in Mg-Zn-Y Alloy Processed by ECAP," Materials Science Forum, vol. 667-669,
pp. 593-598, 2010.
[158] M. Barnett, M. R. Barnett, C. Betles, "Twinning and its role in wrought magnesium
alloys," in Advances in wrought magnesium alloys - Fundamentals of processing,
properties and applications, Woodhead Publishing, Ed., 2012.
[159] R. G. Sambasiva and Y. V. R. K. Prasad, "Grain boundary strengthening in strongly
textured magnesium produced by hot rolling," Metallurgical Transactions A, vol. 13,
19822219-2226.
[160] P. Haden, I. L. Dillamore, D. J. Stratford, "Texture control and the yield anisotropy of
plane strain magnesium extrusion," Texture, vol. 1, pp. 17-29, 1972.
[161] Y. Uematsu, K. Tokaji, M. Kamakura, et al., "Effect of extrusion conditions on grain
refinement and fatigue behaviour in magnesium alloys," Materials Science and
Engineering A, vol. 434, pp. 131-140, 2006.
[162] S. R. Agnew, M. H. Yo, C. N. Tome, "Application of texture simulation to
understanding mechanical behavior of Mg and solid solution alloys containng Li or Y,"
Acta Materialia, vol. 49, pp. 4277-4289, 2001.
[163] T. Al-Samman and G. Gottstein, "Dynamic recrystallization during high temperature
deformation of magnesium," Materials Science and Engineering A, vol. 490, pp. 411-
420, 2008.
[164] W. M. Gan, M. Y. Zheng, H. Chang, et al., "Microstructure and tensile property of the
ECAPed pure magnesium," Journal of Alloys and Compounds, vol. 470, pp. 256-262,
2009.
[165] A. Trampuz and A. F. Widmer, "Infections associated with orthopedic implants,"
Current Opinion in Infectious Diseases, vol. 19, pp. 349-356, 2006.
[166] P. Zhang, Z. Zhang, W. Li, "Antibacterial TiO2 Coating Incorporating Silver
Nanoparticles by Microarc Oxidation and Ion Implantation," Journal of
Nanomaterials, 2013.
[167] L. Zhao, P. K. Chu, Y. Zhang, et al., "Antibacterial coatings on titanium implants,"
Journal of Biomedical Materials Research Part B: Applied Biomaterials, vol. 91B, pp.
470-480, 2009.
[168] E. M., Schoenfisch, M. H. Hetrick, "Reducing implant-related infections: active release
strategies," Chemical Society Reviews, vol. 35, pp. 780-789, 2006.
163
[169] J. S. Kim, E. Kuk, K. N. Yu, et al., "Antimicrobial effects of silver nanoparticles,"
Nanomedicine: Nanotechnology, Biology and Medicine, vol. 3, pp. 95-101, 2007.
[170] D. Lee, R. E. Cohen, M. F. Rubner, "Antibacterial properties of Ag nanoparticle
loaded multilayers and formation of magnetically directed antibacterial microparticles,"
Langmuir, vol. 21, pp. 9651-9659, 2005.
[171] M. Bosetti, A. Masse, E. Tobin, et al., "Silver coated materials for external fixation
devices: in vitro biocompatibility and genotoxicity," Biomaterials, vol. 23, pp. 887-892,
2002.
[172] M. Lihe, W. Yulin, W. Yizao, et al., "Corrosion Resistance of Ag-ion Implanted Mg-
Ca-Zn Alloys in SBF," Rare Metal Materials and Engineering, vol. 39, pp. 2075-2078,
2010.
[173] H. Zhao and J. Cui, "Electroless plating of silver on AZ31 magnesium alloy substrate,"
Surface and Coatings Technology, vol. 201, pp. 4512-4517, 2007.
[174] A. Ewald, S.K. Glückermann, R. Thull, et al., "Antimicrobial titanium/silver PVD
coatings on titanium," BioMedical Engineering OnLine, vol. 5, 2006.
[175] J. M. Schakenraad, "Biology, biochemestry, and medecine - Some background
concepts," in Biomaterials science - An introduction to materials in medecine.:
Elsevier, 1996, ch. 3.
[176] Eglin D., Rohde K., Roach P., "Modern biomaterials: a review - Bulk properties and
implications of surface modifications," Journal of Materials Science: Materials in
Medicine, vol. 18, pp. 1263-1277, 2007.
[177] A. I. Teixeira, G. A. McKie, J. D. Foley, et al., "The effect of environmental factors on
the response of human corneal epithelial cells to nanoscale substrate topography,"
Biomaterials, vol. 27, pp. 3945-3954, 2006.
[178] A. B. Novaes, S. L. S. De Souza, R. R. M. De Barros, et al., "Influence of Implant
Surfaces on Osseointegration," Brazilian Dental Journal, vol. 21, pp. 471-481, 2010.
[179] A. Cunha, "Multiscale Femtosecond Laser Surface Texturing of Titanium and
Titanium Alloys for Dental and Orthopaedic Implants," PhD thesis 2015.
[180] S. Puckett, R. Pareta, T. J. Webster, "Nano rough micron patterned titanium for
directing osteoblast morphology and adhesion," Internation Journal of Nanomedecine,
vol. 3, pp. 229-241, 2008.
[181] X. Li, J. Huang, M. J. Edirisinghe, "Novel patterning of nanobioceramics template-
assisted electrohydrodynamic atomization spraying," Journal of the Royal Society
Interface, vol. 5, pp. 253-257, 2008.
164
[182] G. Munir, G. Koller, L. Di Silvio, et al., "The pathway to intelligent implants:
osteoblast response to nano silicon-doped hydroxyapatite patterning," Journal of the
Royal Society Interface, vol. 8, pp. 678-688, 2011.
[183] M. Zenou, O. Ermak, A. Saar, et al., "Laser sintering of copper nanoparticles," Journal
of Physics D: Applied Physics, vol. 47, 2014.
[184] The University of Alabama. [Online].
http://www.me.ua.edu/PMRF/dceducational.htm
[185] E. F. Rauch and M. Véron, "Automated crystal orientation and phase mapping in
TEM," Materials Characterization, vol. 98, pp. 1-9, 2014.
[186] K. Lu, W. Li, B. Chen, "Sintering of Porous Materials," in Sintering - Mechanisms of
Convention, Nanodensification and Field, Assisted Processes, R. Castro and K. Van
Benthem, Eds.: Springer, 2013.
[187] W. F. Gale and T. C. Totemeier, Smithells Metals Reference Book, Butterworth-
Heinemann, Ed., 2003.
[188] H. Pan, F. Pan, R. Yang, et al., "Thermal and electrical conductivity of binary
magnesium alloys," Journal of Materials Science, vol. 49, pp. 2107-3124, 2014.
[189] E. D. Palik, Handbook of Optical Constants of Solids II, Academic Press, Ed., 1991.
[190] W. E. Forsythe, Smithsonian physical tables. 9th rev. ed., Smithsonian Institution, Ed.,
1964.
[191] X. Cao, M. Jahazi, J. P. Immrigeon, et al., "A review of laser welding techniques for
magnesium alloys," Journal of Materials Processing Technology, vol. 171, pp. 188-204,
2006.
[192] J. F. Shackelford and W. Alexander, CRC Materials Science and Engineering
Handbook, Third Edition.: CRC Press 2000, 2000.
[193] F. Cernuschi, S. Ahmaniemi, P. Vuoristo, et al., "Modelling of thermal conductivity of
porous materials: application to thick thermal barrier coatings," Journal of the
European Ceramic Society, vol. 24, pp. 2657-2667, 2004.
[194] M. S. Brown and C. B. Arnold, "Fundamentals of Laser-Material Interaction and
Application to Multiscale Surface Modification," in Laser Precision Microfabrication.:
Springer Series in Materials Science , 2010.
[195] H. E. Bennett, J. M. Bennett, E. J. Ashley, et al., "Verification of the Anomalous-
Skin-Effect Theory for Silver in the Infrared," Physical Review, vol. 165, pp. 755-764,
1968.

165
[196] K.-S. Kim, Y. Kim, S.-B. Jung, "Microstructure and adhesion characteristics of a silver
nanopaste screen-printed on Si substrate," Nanoscale Research Letters, vol. 7, pp. 1-6,
2012.
[197] O. Sitdikov and R. Kaibyshev, "Dynamic recrystallization in pure magneisum,"
Materials Transactions, vol. 42, pp. 1928-1937, 2001.
[198] P. Minarik, R. Kral, M. Janecek, "Effect of ECAP processing on corrosion resistance of
AE21 and AE42 magnesium alloys," Applied Surface Science, vol. 281, pp. 44-48, 2013.
[199] B.A. Shaw, R.C. Wolfe, et al., "Corrosion of Magnesium and Magnesium-Base Alloys,"
in ASM Handbook - Corrosion: Materials.: ASM International, 2005, vol. 13B.
Related Documents


![Biodegradable implants for orbital wall fracture reconstruction · [1]. Generally, alloplastic orbital implants are classified as bio-degradable and non-biodegradable materials. Non-resorbable](https://static.cupdf.com/doc/110x72/6016c178b30cc600012ae1c8/biodegradable-implants-for-orbital-wall-fracture-1-generally-alloplastic-orbital.jpg)