UNIVERSIDAD DE CHILE FACULTAD DE CIENCIAS FÍSICAS Y MATEMÁTICAS DEPARTAMENTO DE GEOLOGÍA MAGMATIC EVOLUTION THROUGH MELT INCLUSIONS OF THE HOLOCENE ALKALINE LAVAS OF PUYUHUAPI VOLCANIC GROUP, CHILEAN SOUTHERN ANDES TESIS PARA OPTAR AL GRADO DE MAGÍSTER EN CIENCIAS, MENCIÓN GEOLOGÍA MEMORIA PARA OPTAR AL TÍTULO DE GEOLOGA MARIANA ALEJANDRA WONG AGUIRRE PROFESORA GUÍA: CLAUDIA CANNATELLI MIEMBROS DE LA COMISIÓN: DOLORINDA DANIELE DANIEL MONCADA DE LA ROSA JAMIE BUSCHER SANTIAGO DE CHILE 2019

Welcome message from author
This document is posted to help you gain knowledge. Please leave a comment to let me know what you think about it! Share it to your friends and learn new things together.
Transcript

UNIVERSIDAD DE CHILE FACULTAD DE CIENCIAS FÍSICAS Y MATEMÁTICAS DEPARTAMENTO DE GEOLOGÍA
MAGMATIC EVOLUTION THROUGH MELT INCLUSIONS OF THE
HOLOCENE ALKALINE LAVAS OF PUYUHUAPI VOLCANIC GROUP,
CHILEAN SOUTHERN ANDES
TESIS PARA OPTAR AL GRADO DE MAGÍSTER EN
CIENCIAS, MENCIÓN GEOLOGÍA
MEMORIA PARA OPTAR AL TÍTULO DE GEOLOGA
MARIANA ALEJANDRA WONG AGUIRRE
PROFESORA GUÍA:
CLAUDIA CANNATELLI
MIEMBROS DE LA COMISIÓN:
DOLORINDA DANIELE
DANIEL MONCADA DE LA ROSA
JAMIE BUSCHER
SANTIAGO DE CHILE
2019

i
“GEOCHEMICAL EVOLUTION THROUGH MELT INCLUSIONS OF THE HOLOCENE
ALKALINE LAVAS OF PUYUHUAPI VOLCANIC GROUP, CHILEAN SOUTHERN ANDES,
AYSEN REGION”
Los nueve centros eruptivos menores del grupo volcánico Puyuhuapi (PVG) ubicados en el segmento sur de la Zona Volcánica sur, se distribuyen en dos lineamientos, siguiendo una de las trazas principales de la zona de falla Liquiñe – Ofqui, estructura mayor (>1000 km de extensión) de rumbo NS. Sus productos son de composición basáltica y de afinidad alcalina.
El principal enfoque de este estudio es determinar condiciones y procesos pre-eruptivos registrados por las lavas en cuanto a su mineralogía y a la petrografía de las inclusiones vítreas y determinar que procesos magmáticos generan variabilidad en la composición de los distintos centros eruptivos. Para ello se analizan inclusiones vítreas alojadas en fenocristales de olivino, utilizando distintas metodologías como Microsonda electrónica, ablación laser y espectroscopia Raman.
Se encontraron variados tipos de inclusiones que se distinguieron por su forma y composición entre homogéneas y recristalizadas. Inclusiones homogéneas muestran fraccionamiento y reequilibrio con el mineral hospedante, por lo que la composición inicial del magma parental tuvo que ser modelada.
La temperatura pre-eruptiva máxima registrada por las inclusiones vítreas es de 1280°C y la presión mínima se encuentra entre 4-5 Kbar, condiciones obtenidas a partir del equilibrio con el mineral hospedante y con la presión de vapor de CO2 y H2O retenido en las inclusiones. Lo que implica la existencia de un reservorio donde se detectaron procesos de fraccionamiento temprano de olivino y contaminación cortical, preferentemente en el lineamiento norte.
Diferencias sistemáticas en la composición de los centros eruptivos, sugiere que el magma que forma las lavas PVG se genera a partir de dos fuentes de manto diferentes, en el campo de estabilidad del granate como se sugiere para las altas razones de LILE/HFSE. El cono Puyu 9 del lineamiento norte tendría una fuente magmática más profunda con un contenido de granate mayor, evolucionando químicamente de manera independiente al lineamiento sur. Menor enriquecimiento en elementos incompatibles y mayor contenido de magnesio muestran que el magma que forma el cono Puyu 4, sería el magma más primitivo del PVG.
La firma geoquímica particular de las lavas alcalinas de PVG estaría más influenciada por la fusión sedimentos que de fluidos de la placa subductante, lo que es consistente con los bajos grados de fusión parcial (Nb/Y, La/Sm elevados) que producen volúmenes pequeños de magma.
RESUMEN DE LA MEMORIA PARA OPTAR AL TÍTULO DE:
Geóloga y grado de Magíster en Ciencias, mención geología.
Por: Mariana Alejandra Wong Aguirre
Fecha: octubre 2019
Profesora guía: Claudia Cannatelli
ii
AGRADECIMIENTOS
En primer lugar, quiero agradecer a mi familia y en especial a mis padres, Gilda y Fernando por
todo el apoyo y amor que me han brindado, por creer en mí y enseñarme que ningún desafío es
demasiado grande si hace con perseverancia y dedicación; mis hermanas Javiera y Valentina,
por el infinito apañe, porque somos el triángulo perfecto y no podría pedir mejores brothers en
este mundo; Cristian mi querido cuñi, por ayudarme cada vez que lo necesité y los vinitos de
viernes; a mis abuelos, Darío, Nelly, Carlos y Carmen, todos ellos pilares fundamentales en mi
vida.
Agradezco al proyecto CONICYT-FONDAP 15090013, Centro de Excelencia en Geotermia de los
Andes (CEGA), ya que mis estudios fueron financiados por la Beca de Magíster y por el
financiamiento otorgado para la obtención de las muestras, diversos análisis, pasantías y
congresos a los que asistí.
Agradezco a todos los profesores del departamento de Geología con los que me cruce en estos
años, de cada uno me llevo aprendizajes, en especial agradezco a mi profesora guía Claudia
Cannatelli por creer en mi desde el día uno, por su apoyo a toda hora y por motivarme a sacar la
mejor versión de mí. A los profesores de la comisión Daniel Moncada, Jamie Buscher y Linda
Daniele, por su cooperación en el desarrollo de este trabajo, por sus correcciones y preguntas
desafiantes, ingredientes clave para el desarrollo de la tesis.
A los funcionarios del Departamento de Geología, especialmente Blanca Baccola, Maritza Acuña
y Rosita por su incansable ayuda y por resolver mis dudas siempre amables y cariñosas. A
Roberto, por recibirme siempre con una sonrisa y por haber hecho que el trabajo de laboratorio
fuera siempre grato.
A todos mis amigos y compañeros que hecho en este camino que comenzó el año 2010 en
Bachillerato, lugar donde conocí a quienes hoy son mis grandes amigas, Javi, Pati, Ale, Caro,
Lore y Maca, por esas noches de no estudio en la casa de la Javi y por estar siempre. A mis
compañeros y amigos de generación, Natu, Cami Lizana, Marta, Inca, Aquiles, Coni Bravo, Ara,
Franco, Fran Sandoval, Fonseca, Guille, Fonsi, Naty, España, etc. En especial Mati Paredes por
los cafecitos y lindas conversaciones. Domi Kausel, gracias por ayudarme en etapas clave de la
tesis, por las risas y todos los stickers. También a los chi@s de Post grado, en especial a los
inclusionistas Lore, Cami Pineda, Fabi, Marce por la linda cooperación que nos hemos dado entre
todos.
Y, por último, pero no menos importante a Phía Bustamante, por todo tu amor, por darle luz a mi
vida y por acompañarme en esta titánica misión.

iii
Tabla de Contenido
1 INTRODUCCIÓN ................................................................................................................. 1
1.1 Estructura de la tesis .................................................................................................... 1
1.2 Motivación (Formulación del problema) ........................................................................ 1
1.3 Objetivos ...................................................................................................................... 2
1.3.1 Objetivo general .................................................................................................... 2
1.3.2 Objetivos específicos ............................................................................................. 2
1.4 Hipótesis de trabajo ...................................................................................................... 2
1.5 Fundamento teórico ...................................................................................................... 2
1.5.1 Que es una inclusión vítrea y como de forman ...................................................... 2
1.5.2 Rocas intrusivas de Batolito Nor-Patagónico ......................................................... 5
1.5.3 Volcanismo monogenético ..................................................................................... 6
1.5.4 Condiciones de oxidación magmáticas .................................................................. 7
1.5.5 Condiciones P-T de cristalización .......................................................................... 8
1.6 Marco geológico y tectónico regional ............................................................................ 9
1.6.1 Geología del área de Puyuhuapi.......................................................................... 12
1.6.2 Rocas volcanosedimentarias y volcánicas. .......................................................... 12
1.6.3 Depósitos sedimentarios no consolidados ........................................................... 14
2 MAGMATIC EVOLUTION THROUGH MELT INCLUSIONS OF THE HOLOCENE ALKALINE
LAVAS OF PUYUHUAPI VOLCANIC GROUP, CHILEAN SOUTHERN ANDES ...................... 16
Abstract ................................................................................................................................. 16
2.1 Introduction ................................................................................................................. 17
2.2 Geologic background .................................................................................................. 18
2.3 Sample description and preparation ........................................................................... 19
2.4 Analytical procedures ................................................................................................. 21
2.5 Results ....................................................................................................................... 23
2.5.1 Mineral Chemistry ................................................................................................ 23
2.5.2 Melt inclusion petrography ................................................................................... 28

iv
2.5.3 Melt inclusion post-entrapment modifications....................................................... 29
2.5.4 Melt inclusion and bulk rock compositions ........................................................... 31
2.5.5 Trace elements .................................................................................................... 40
2.5.6 Raman CO2 densities ........................................................................................... 45
2.5.7 Volatiles ............................................................................................................... 49
2.6 Discussion .................................................................................................................. 51
2.6.1 Storage and pre-eruptive conditions .................................................................... 52
2.6.2 Different magma sources ..................................................................................... 56
2.6.3 Chemical modeling .............................................................................................. 62
2.6.4 Petrogenetic model .............................................................................................. 65
2.7 Conclusions ................................................................................................................ 66
3 BIBLIOGRAPHY ................................................................................................................ 68
4 Appendix............................................................................................................................ 73
v
Índice de figuras
Fig. 1: Ilustraciones esquemáticas de mecanismos comunes de formación de inclusión vítreas
relevantes para rocas basálticas. Las imágenes superior e inferior en cada panel representan
fases tempranas y posteriores en el crecimiento de los cristales. Imagen modificada de (Kent,
2008). a) Por desarrollo de un borde esqueletal, b) otros cristales que se apoyan en la
superficie, c) defecto localizado en la interfaz del cristal, d) crecimiento dendrítico, la
distribución de las inclusiones siguen la orientación cristalográfica, e) crecimiento esqueletal
en cristales tolva, inclusiones con localización geométrica, f) vidrio rellenado fracturas,
inclusiones pequeñas que definen una superficie. ............................................................... 3
Fig. 2: Relación inversa de CO2 - H2O en fundido basáltico, saturado en vapor a 1200°C. Curvas
continuas para cada presión constante (isobaras), línea discontinuas son corresponden a
isopletas de composición de vapor. Ambas curvas calculadas usando modelos
termodinámicos calibrados con datos experimentales (Dixon y Stolper, 1995). Figura de
Metrich y Wallace, 2008. ...................................................................................................... 9
Fig. 3: SSVZ con las principales trazas de la LOFZ y la ubicación de diferentes edificios
volcánicos. Imagen modificada de Cembrano y Lara (2009) .............................................. 11
Fig. 4: Mapa geología base puerto Puyuhuapi. Fuente: Servicio nacional de Geología y Minería –
Gobierno Regional de Aysén. Mella y Duhart (2011) ......................................................... 13
Fig. 5: satellite image with the location of the sampled eruptive centers (red circles), black circles:
other minor eruptive centers of PVG. LOFZ: fault orientation from Mella and Duhart (2011) .
Source: servicio aerofotogramétrico – Fuerza Aérea de Chile 20
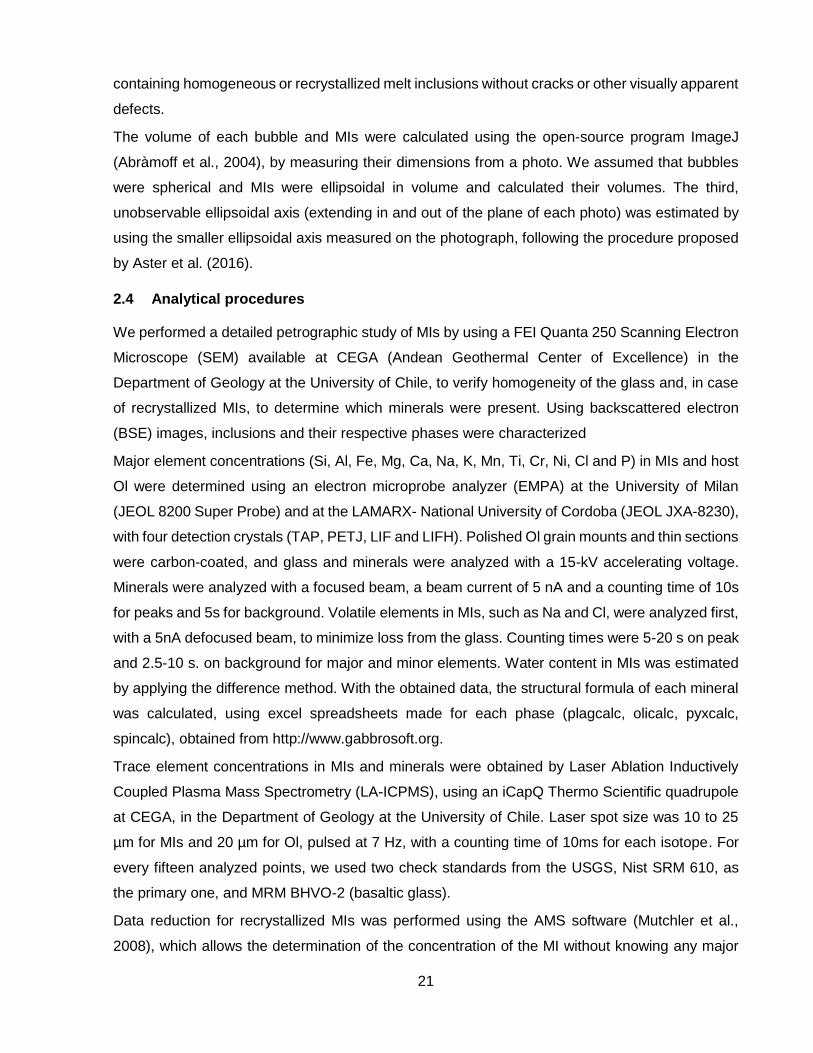
Fig. 6: Histogram of forsterite content for olivine, measured in the core of phenocrysts. ........... 24
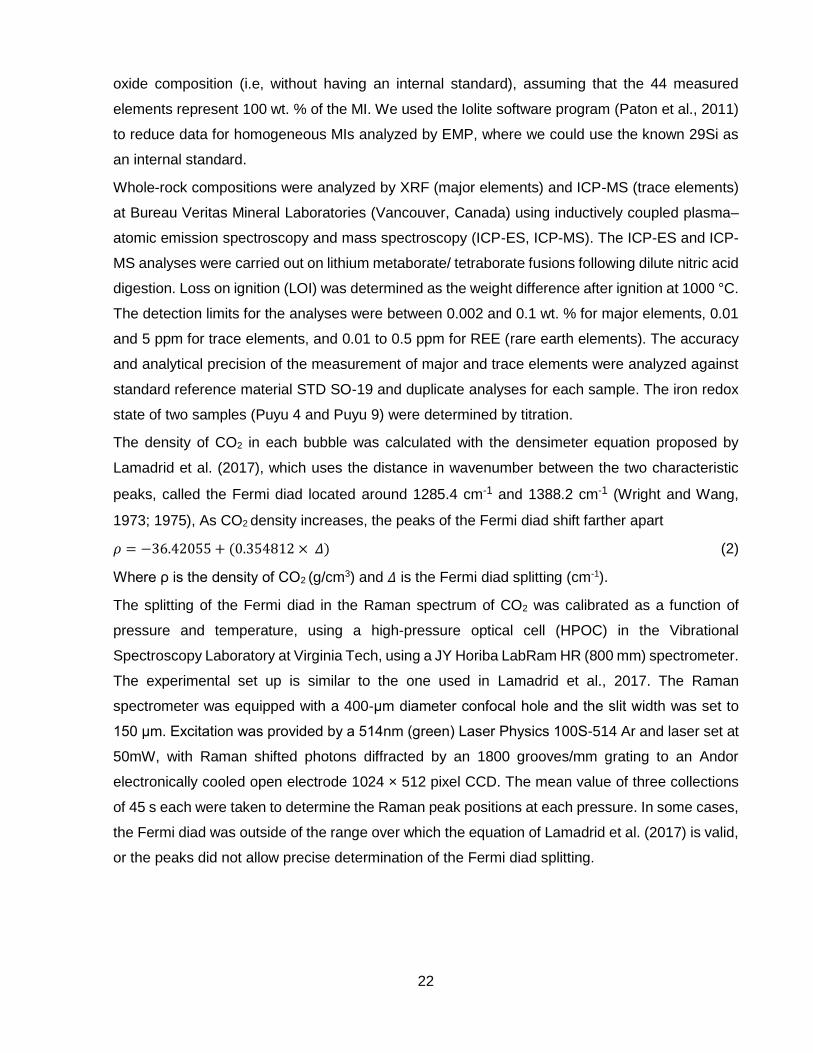
Fig. 7: (a) Cpx composition from samples Puyu9 and Puyu18 (microlites). (b) Pl compositions of
the studied samples. .......................................................................................................... 24
Fig. 8: BSE images taken by EMPA (a) Puyu9: Ol phenocryst with numerous spinel inclusions,
distributed throughout the crystal. (b) Puyu3: aggregate of Ol crystals with large spinel
inclusions. (c) Puyu9: Cpx microphenocrysts with sector (blue triangular zone) and/or
oscillatory zoning: black circles: olivine inclusions. (d) Puyu18: pristine Ol phenocryst, with
central melt inclusion. ........................................................................................................ 25
Fig. 9: BDE image by EMPA of sample Puyu9 (D14) showing glomerophyric texture. .............. 26
Fig. 10: (a) Spinel prism for the multi-component system: spinel (MgAl2O4) - hercynite (Fe Al2O4)-
chromite (FeCr2O4) – magnesiochromite (MgCr2O4) – magnesioferrite (MgFe2O4) -
magnetite FeFe2O4), after Deer et al.,1992.The projections of the basal face and the lateral-
right face of the prism, represent the diagrams in “b” and “c” (b) Binary classification diagram
considering the Cr-Al and Mg-Fe+2 exchange; 1=Magnesiochromite, 2=chromite, 3= spinel,

vi
4= Hercynite. (c) Binary classification diagram considering the Fe+3-Al and Fe+2-Mg
exchange; 1=magnesioferrite, 2= magnetite, 3= ferrian-spinel, 4= ferrian-pleonaste, 5=Al-
magnetite, 6= ferrian-picotite, 7= spinel, 8= pleonaste, 9= Hercynite. ................................ 27
Fig. 11: thin section images taken by optic microscope. a) Puyu4: homogenous MI, b) Puyu9:
homogenous MI, c) Puyu18: MI with a large trapped spinel crystal, d) Puyu3: recrystallized
MI, e) Puyu9: recrystallized MI, f) Puyu18: melt inclusion assemblage together with FIs. .. 29
Fig. 12: Rhodes diagram. The solid line, within some established error bound, here given as KD
(Fe-Mg) ol-liq = 0.30±0.03. ................................................................................................. 30
Fig. 13: Box plot of the grouping of water content data in the inclusions. .................................. 32
Fig. 14: TAS (Total alkalis v/s silica Le Bas et al., 1986) classification diagram. Dotted curve
divides the alkaline and sub-alkaline fields (Irvine and Baragar, 1971).a) Bulk rock analysis
from Gonzalez-Ferran et al. (1994). (b) Detail of the trachy basalt field. ............................ 37
Fig. 15: Harker diagram of MgO v/s total FeO (calculated as FeO*=FeO+Fe2O3/1.11). a) Bulk rock
analysis from Gonzalez-Ferran et al. (1994). *MIs: corresponds to data of MI without
recalculation.* 4-9-18: correspond to the inclusions of each MEC modeled according to the
host Fo %. The yellow area represents the compositional track from primitive MI and to
groundmass glass. ............................................................................................................. 38
Fig. 16: Harker diagrams of major elements variation (wt. %) versus Mg#, Circles= oval shaped
MI. Diamonds= irregular MI. Triangle= recrystallized MI. Square= Bulk rock data. Yellow=
Puyu3, Green=Puyu18, Blue=Puyu9, Magenta= Puyu4. .................................................... 39
Fig. 17: Primitive mantle normalized trace elements patterns for each sample; normalization
factors were taken from Sun and McDonough (1989). ....................................................... 41
Fig. 18: REE content on melt inclusion, measured by LAICPMS. (a) LREE (ppm) versus SiO2 wt.
%, (b) HREE (ppm) versus SiO2 wt. %. .............................................................................. 42
Fig. 19: trace elements versus MgO content. ............................................................................ 44
Fig. 20: Trace elemennts contents on Ol phenocrysts. Measured by Electro micro-probe analizer.
.......................................................................................................................................... 45
Fig. 21: Boxplot diagrams for bubble volume/ MI volume percentage. ...................................... 46
Fig. 22: model restored CO2 content in relation with the forsterite content of the olivine host. ... 49
Fig. 23: H2O versus CO2 content in melt inclusions. OD: open degassing system, CD: closed
degassing system; both curves calculated with VolatileCalc using a starting composition of
2.5wt.% H2O, 5000 ppm CO2, 48 wt.% SiO2 and T of 13002°C. CD-4: a possible degassing
path for Puyu4. Calculated equilibrium isobaric H2O–CO2 dissolved pairs in liquids basaltic
compositions, each at two different temperatures. Numbers are pressure in MPa. Curves

vii
obtained from Papale et al., 2006. Error bars: H2O of standard deviation of 1wt. %. Grey area
represents the most reliable water content. ........................................................................ 50
Fig. 24: melt inclusion chlorine content in relation to the Fo content of their host olivines. ........ 50
Fig. 25: Melt inclusion (4, 9, and 18) and matrix glass (Puyu 9 and Puyu 18) Cl concentration in
comparison with the H2O content. ...................................................................................... 51
Fig. 26: chlorine versus K2O melt inclusion content. .................................................................. 51
Fig. 27: Fo host content (mol %) versus entrapment temperature of MIs. ................................. 53
Fig. 28: oxygen fugacity according to the fayalite-quartz-magnetite buffer, calculated by equation
(4) ...................................................................................................................................... 55
Fig. 29: Oxidation state of olivine-spinel pairs versus forsterite content of olivine from contrasting
basalts. Calculations performed following Ballhaus et al. (1991). Modified image from Evans
et al., 2012. ........................................................................................................................ 55
Fig. 30: melt inclusions (a) MI Nb/Y versus La/Sm with the respective trend line. (b) MI Nb/Y versus
MgO (wt. %). (c) La/Sm versus MgO (wt. %). (d) Pb/Ce versus Ba/Nb, with the respective
trend line. Yellow= Puyu 3, Green= Puyu 18, Blue= Puyu 9, Magenta= Puyu 4. ................ 57
Fig. 31: MI fluid mobile element ratios, Ba/Th versus La/Sm. Circle: Melt inclusions, Square: bulk
rock. ................................................................................................................................... 58
Fig. 32: incompatible element ratio versus Rb diagram. Symbols are the same from Fig. 32. ... 58
Fig. 33: Ba/La versus La/Yb, S-type= Paleozoic metasedimentary rocks, I-type= plutonic rocks of
the Patagonian batholith, sediments= southern Chile trench sediments. Data from Kilian and
Behrman 2003. .................................................................................................................. 59
Fig. 34: Sr*N is calculated as 𝐒𝐫𝐍/√(𝐏𝐫𝐍 ∗ 𝐍𝐝𝐍), where each element is normalized to primitive
mantle after McDonough and Sun (1995). Blue circles= Puyu 9, black circles= Puyu3, Puyu4
and Puyu 18 altogether. ..................................................................................................... 60
Fig. 35: MI FeO versus MgO content, dotted line represent the compositional path followed by the
extraction of a solid phase (green circle). ........................................................................... 61
Fig. 36: a) Schematic representation of the succession of mineral disequilibrium and subsequent
crystallization. b) MgO and FeO (wt. %) content in melt inclusion and groundmass. .......... 62
Fig. 37: SiO2 versus MgO content for the Puyuhuapi lavas and melt inclusions. Curves represent
the evolution paths of residual melts modeled using Rhyolite-MELTS (Gualdaet al., 2012;
Ghiorso and Gualda, 2015). a) Initial composition Puyu9 bulk rock. b) Initial composition
Puyu4 bulk rock. The fo2 curves they have been modeled with the oxygen fugacity that
calculates the algorithm and the fqm1 have been modeled by imposing a fugacity of FQM +
1. ....................................................................................................................................... 63
viii
Fig. 38: SiO2 versus MgO content for the Puyuhuapi lavas and melt inclusions. Curves represent
the evolution paths of residual melts modeled using Rhyolite-MELTS (Gualdaet al., 2012;
Ghiorso and Gualda, 2015). Initial composition C7 Melt inclusion from Puyu3. The fo2 curves
they have been modeled with the oxygen fugacity that calculates the algorithm and the fqm1
have been modeled by imposing a fugacity of FQM + 1. .................................................... 64
Fig. 39: Schematic representation of the depths of the reservoirs associated to the Puyuhuapi
cones. ................................................................................................................................ 65
Índice de tablas
Table 1; Olivine compositions measured with electron microprobe. * Data obtained by LAICPMS
.......................................................................................................................................... 23
Table 2: Whole rock major element compositions (wt. %) of studied lava samples. .................. 31
Table 3: recalculated type-I MI composition for Puyu4, 9, 18, measured by EMPA and type-II MI
composition, measured by LAICMS (α) for Puyu3. Total =sum of all oxides plus Cl in original
(uncorrected) electron microprobe analyses, %PEC= percentage post-entrapment olivine
crystallization. Major element oxides reported are normalized to 100% on a volatile-free basis.
H2O= estimated by the difference method assuming all of the missing components in the
analyses was H2O. Shape= 1: ellipsoidal shape MIs, 2= irregular shape MIs, 1*= ellipsoidal
shape on microlites. ........................................................................................................... 32
Table 4: Reconstructed CO2 concentrations of MI and calculated trapping pressures. ** Calculated
pressures considering that the bubble retains 50% of the CO2, ** Calculated pressures
considering that the bubble retains 90% of the CO2. In both cases, pressures were calculated
using VolatileCalc (Newman and Lowenstern 2002). Depths were calculated using a nominal
gradient of 3.65 km/Kbar. ................................................................................................... 48
Table 5: results of the average entrapment temperature of MIs per sample, olivine %= average
percentage of olivine that was returned to the composition of the MI. ................................ 53
Table 6: Results of geothermometer (3) applied on glass from MI hosted on olivine microlites. 53
Table 7: Estimated oxygen temperature and fugacity for olivine spinel pairs, a pressure of 1 GPa
is assumed for the calculations .......................................................................................... 54
Table 8: major elements composition (wt. %) of MI without recalculation, measured with electron
microprobe analyzer. MI type=1: homogenous oval shaped MI, 1*: homogenous oval shaped
microlite hosted MI, 2: homogenous irregular shaped MI, 3: oval shaped recrystallized MI, 4:
irregular shaped recrystallized MI. α: correspond to inclusions measured with LAICPMS. . 73
Table 9: melt inclusion trace element composition (ppm). ......................................................... 76
Table 10: Representative chemical analyses of olivine phenocrysts. ........................................ 78

ix
Table 11: Representative chemical analyses of pyroxenes, whit the compositional classification
calculated based on 6 oxygen. ........................................................................................... 80
Table 12: Results of the calculation of the structural formula of plagioclase based on 32 oxygen.
.......................................................................................................................................... 81
1
CAPÍTULO 1:
1 INTRODUCCIÓN
1.1 Estructura de la tesis
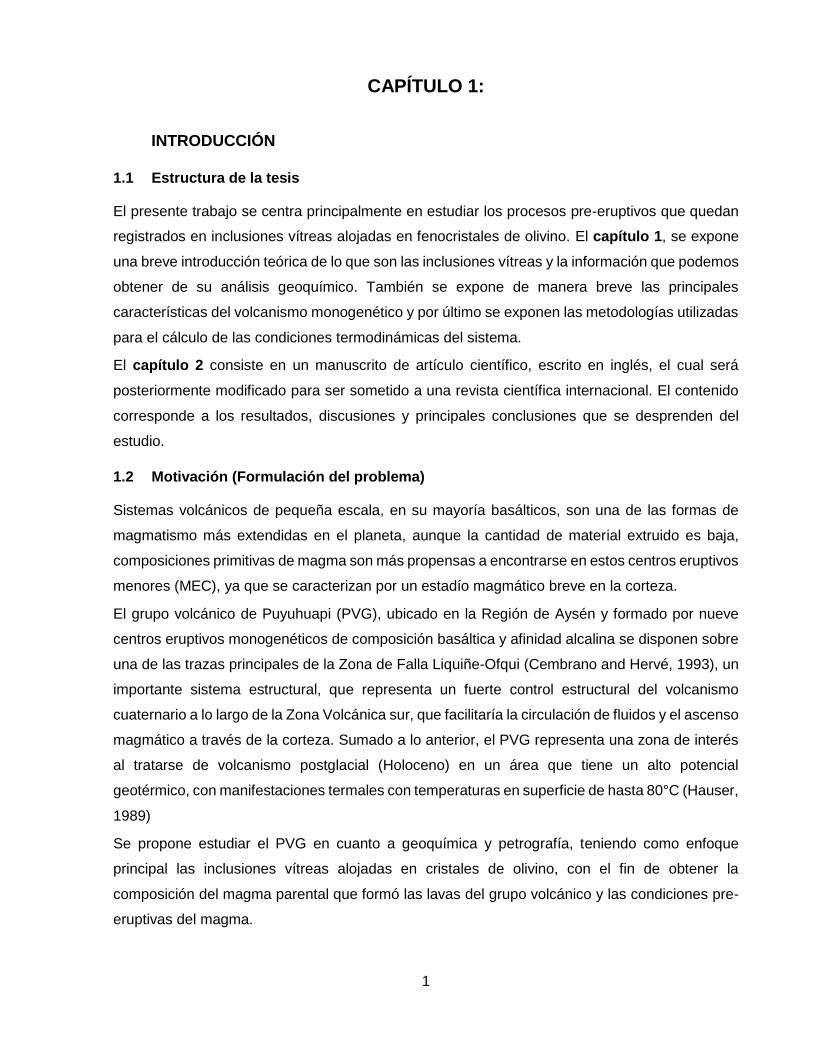
El presente trabajo se centra principalmente en estudiar los procesos pre-eruptivos que quedan
registrados en inclusiones vítreas alojadas en fenocristales de olivino. El capítulo 1, se expone
una breve introducción teórica de lo que son las inclusiones vítreas y la información que podemos
obtener de su análisis geoquímico. También se expone de manera breve las principales
características del volcanismo monogenético y por último se exponen las metodologías utilizadas
para el cálculo de las condiciones termodinámicas del sistema.
El capítulo 2 consiste en un manuscrito de artículo científico, escrito en inglés, el cual será
posteriormente modificado para ser sometido a una revista científica internacional. El contenido
corresponde a los resultados, discusiones y principales conclusiones que se desprenden del
estudio.
1.2 Motivación (Formulación del problema)
Sistemas volcánicos de pequeña escala, en su mayoría basálticos, son una de las formas de
magmatismo más extendidas en el planeta, aunque la cantidad de material extruido es baja,
composiciones primitivas de magma son más propensas a encontrarse en estos centros eruptivos
menores (MEC), ya que se caracterizan por un estadío magmático breve en la corteza.
El grupo volcánico de Puyuhuapi (PVG), ubicado en la Región de Aysén y formado por nueve
centros eruptivos monogenéticos de composición basáltica y afinidad alcalina se disponen sobre
una de las trazas principales de la Zona de Falla Liquiñe-Ofqui (Cembrano and Hervé, 1993), un
importante sistema estructural, que representa un fuerte control estructural del volcanismo
cuaternario a lo largo de la Zona Volcánica sur, que facilitaría la circulación de fluidos y el ascenso
magmático a través de la corteza. Sumado a lo anterior, el PVG representa una zona de interés
al tratarse de volcanismo postglacial (Holoceno) en un área que tiene un alto potencial
geotérmico, con manifestaciones termales con temperaturas en superficie de hasta 80°C (Hauser,
1989)
Se propone estudiar el PVG en cuanto a geoquímica y petrografía, teniendo como enfoque
principal las inclusiones vítreas alojadas en cristales de olivino, con el fin de obtener la
composición del magma parental que formó las lavas del grupo volcánico y las condiciones pre-
eruptivas del magma.

2
¿Qué rol desempeña la ZFLO en el área de estudio, ¿bajo qué condiciones termodinámicas se
forman los fenocristales?, ¿el magma habría ascendido directamente desde profundidades
mantélicas o hubo un periodo de asentamiento en la corteza?, ¿El magma que formo el PVG
corresponde a una fuente única? Son algunas de las preguntas a las cuales se intentará dar
respuesta con el presente trabajo.
1.3 Objetivos
1.3.1 Objetivo general
Proponer un modelo petrogenético que describa las posibles fuentes y procesos pre-eruptivos
necesarios para la formación del grupo volcánico Puyuhuapi
1.3.2 Objetivos específicos
-Determinar la mineralogía y petrografía de las lavas
-Determinar la composición química (elementos mayoritarios y trazas) de las inclusiones vítreas
alojadas en olivino, a través de técnicas microanalíticas (EMPA y LAICPMS)
-Determinar el contenido de volátiles en el magma a través de análisis de espectroscopia Raman
en las inclusiones vítreas alojadas en olivino
-Determinar la composición del magma parental
1.4 Hipótesis de trabajo
El estudio de inclusiones vítreas alojadas en fases que cristalizan en etapas tempranas del
sistema magmático, como por ejemplo el olivino, brinda una fuente de información importante
sobre la composición de magmas primitivos y las condiciones en que se forma. Esta información,
al ser complementada con la composición de los minerales, nos permite estimar condiciones de
temperatura, presión y de oxidación/reducción del magma parental necesarias para generar
modelos termodinámicos de evolución. Centros eruptivos menores con depósitos de similar
composición y bajo contenido de fenocristales pueden compartir un mismo reservorio magmático.
Por el contrario, fuentes distintas, evolución magmática independiente, variable participación de
fluidos producto de la subducción o distintos grados de contaminación cortical, pueden registrarse
en heterogeneidades preservadas en las inclusiones vítreas alojadas en los fenocristales.
1.5 Fundamento teórico
1.5.1 Que es una inclusión vítrea y como de forman
Las inclusiones vítreas (MI, por su sigla en inglés melt inclusion) son pequeñas parcelas de
magma (típicamente <100 µm en la dimensión más larga) atrapadas en cristales durante su

3
crecimiento dentro de sistemas magmáticos (Sorby, 1858). Audétat and Lowenstern (2014)
definen como inclusión vítrea a fundidos atrapados durante el crecimiento de cristales
magmáticos que contienen >50 % de fases silicatadas disueltas. En sistemas volcanicos las
inclusiones vitreas consisten en vidrio + una o mas burbujas ± fases de minerales hijos. Se
denomina cristal hijo a todos aquellos que cristalizan a partir del fundido de la MI, de lo contrario
si el mineral es previo, se denomina cristal atrapado.
Las inclusiones se atrapan generalmente debido a irregularidades en la superficie de los cristales.
En la Fig. 1, se detallan los principales mecanismos de atrapamiento (Roedder, 1979). Cambios
repentinos en las condiciones del magma, como una despresurización pueden aumentan el grado
de supersaturación, y causar el crecimiento de un borde esqueletal que luego al cubrirse con el
crecimiento cristalino puede atrapar zonas de inclusiones (Fig. 1.a; Roedder, 1979), también un
aumento de temperatura u otros desequilibrios podría generar periodos de rápida disolución
mineral, dando lugar a la textura sieve, común en cristales de plagioclasa. En general los
desequilibrios se dan por etapas de alta tasa de crecimiento seguido de una etapa de crecimiento
lento, permitiendo el atrapamiento de inclusiones a lo largo de las zonas de crecimiento (Audétat
and Lowenstern, 2014).
Solidos que cubran el cristal en crecimiento pueden quedar atrapados y pueden causar el
atrapamiento de magma (Fig. 1.b), estas inclusiones minerales son útiles para determinar que el
magma se encontraba saturado, al menos localmente, con respecto a esta fase. Un mecanismo
común en la formación de inclusiones en olivino es por defectos localizados en la interfaz del
cristal, quedando inclusiones distribuidas al azar en el cristal hospedante (Fig. 1.c).
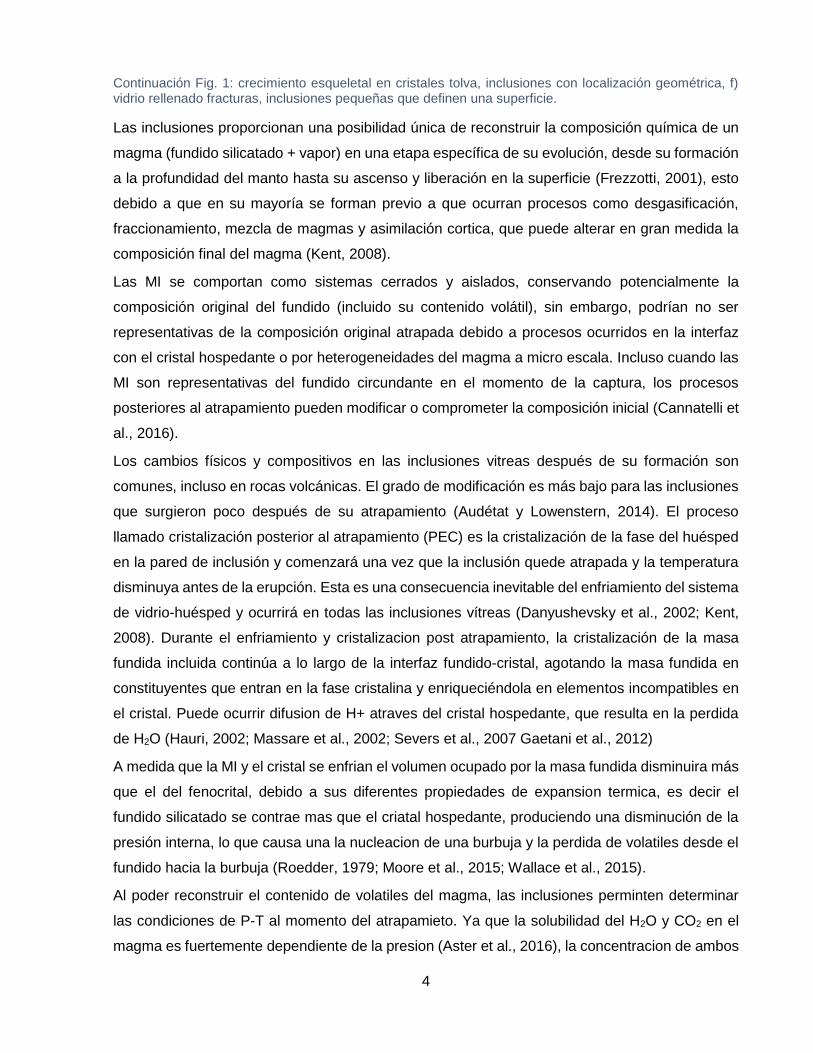
Fig. 1: Ilustraciones esquemáticas de mecanismos comunes de formación de inclusión vítreas relevantes para rocas basálticas. Las imágenes superior e inferior en cada panel representan fases tempranas y posteriores en el crecimiento de los cristales. Imagen modificada de (Kent, 2008). a) Por desarrollo de un borde esqueletal, b) otros cristales que se apoyan en la superficie, c) defecto localizado en la interfaz del cristal, d) crecimiento dendrítico, la distribución de las inclusiones siguen la orientación cristalográfica, e)
4
Continuación Fig. 1: crecimiento esqueletal en cristales tolva, inclusiones con localización geométrica, f) vidrio rellenado fracturas, inclusiones pequeñas que definen una superficie.
Las inclusiones proporcionan una posibilidad única de reconstruir la composición química de un
magma (fundido silicatado + vapor) en una etapa específica de su evolución, desde su formación
a la profundidad del manto hasta su ascenso y liberación en la superficie (Frezzotti, 2001), esto
debido a que en su mayoría se forman previo a que ocurran procesos como desgasificación,
fraccionamiento, mezcla de magmas y asimilación cortica, que puede alterar en gran medida la
composición final del magma (Kent, 2008).
Las MI se comportan como sistemas cerrados y aislados, conservando potencialmente la
composición original del fundido (incluido su contenido volátil), sin embargo, podrían no ser
representativas de la composición original atrapada debido a procesos ocurridos en la interfaz
con el cristal hospedante o por heterogeneidades del magma a micro escala. Incluso cuando las
MI son representativas del fundido circundante en el momento de la captura, los procesos
posteriores al atrapamiento pueden modificar o comprometer la composición inicial (Cannatelli et
al., 2016).
Los cambios físicos y compositivos en las inclusiones vitreas después de su formación son
comunes, incluso en rocas volcánicas. El grado de modificación es más bajo para las inclusiones
que surgieron poco después de su atrapamiento (Audétat y Lowenstern, 2014). El proceso
llamado cristalización posterior al atrapamiento (PEC) es la cristalización de la fase del huésped
en la pared de inclusión y comenzará una vez que la inclusión quede atrapada y la temperatura
disminuya antes de la erupción. Esta es una consecuencia inevitable del enfriamiento del sistema
de vidrio-huésped y ocurrirá en todas las inclusiones vítreas (Danyushevsky et al., 2002; Kent,
2008). Durante el enfriamiento y cristalizacion post atrapamiento, la cristalización de la masa
fundida incluida continúa a lo largo de la interfaz fundido-cristal, agotando la masa fundida en
constituyentes que entran en la fase cristalina y enriqueciéndola en elementos incompatibles en
el cristal. Puede ocurrir difusion de H+ atraves del cristal hospedante, que resulta en la perdida
de H2O (Hauri, 2002; Massare et al., 2002; Severs et al., 2007 Gaetani et al., 2012)
A medida que la MI y el cristal se enfrian el volumen ocupado por la masa fundida disminuira más
que el del fenocrital, debido a sus diferentes propiedades de expansion termica, es decir el
fundido silicatado se contrae mas que el criatal hospedante, produciendo una disminución de la
presión interna, lo que causa una la nucleacion de una burbuja y la perdida de volatiles desde el
fundido hacia la burbuja (Roedder, 1979; Moore et al., 2015; Wallace et al., 2015).
Al poder reconstruir el contenido de volatiles del magma, las inclusiones perminten determinar
las condiciones de P-T al momento del atrapamieto. Ya que la solubilidad del H2O y CO2 en el
magma es fuertemente dependiente de la presion (Aster et al., 2016), la concentracion de ambos

5
puede ser utilizada para calcular la profundidad minima de atrapamiemto basado en una
temperatura conocida del magma y asumiendo que este estaba saturado en fluidos (Audétat and
Lowenstern, 2014)
1.5.2 Rocas intrusivas de Batolito Nor-Patagónico
El Batolito Patagónico, que se extiende por más de 1300 Km (40-56° S) es producto de la
amalgamación de plutones que representan actividad ígnea extendida por ca. 150 Ma a lo largo
del margen occidental de América de Sur (Pankhurst et al., 1999). El Batolito Patagónico norte
corresponde a la parte más septentrional, al norte del Golfo de Penas (47°S; Hervé et al., 1993)
Al sur de los 44°S las rocas plutónicas expuestas son típicamente, granodioritas y tonalitas de
hornblenda y biotita y escasos cueros de leucogranitos de biotita. Afloran principalmente a ambos
lados de canal Moraleda y fiordos transversales asociados como los fiordos Puyuhuapi y Aysén.
En el área de estudio se pueden distinguir dos unidades graníticas mayores, una diorítica y otra
tonalítica.
1.5.2.1 Diorita Risopatrón, BMdr (Mioceno)
Unidad informal definida en la Investigación geológica minera ambiental de Aysén por
SERNAGEOMIN-GORE Aysén (2011), aflora en el borde oriental del canal Puyuhuapi, hacia el
norte del rio Oscuro y en los alrededores del puerto de Puyuhuapi, corresponde a un cuerpo
ígneo, elongado en dirección NNE-SSW, las rocas características corresponden a dioritas
mesocráticas a melanocráticas, equigranulares, de grano fino a medio, compuestas
esencialmente por plagioclasa, anfíbola y escasa biotita, además de algunos cuerpos de
granodioritas. En el puerto Puyuhuapi se presenta cortada por fallas normales (N65°-80°E/70°-
85°S) y por diques microdioriticos (N103°E/45°S). Es común que esta unidad se encuentre
intruida por diques de tonalita y se exprese, además, como inclusiones máficas en cuerpos
tonalíticos.
Estudios petrográficos muestran presencia de plagioclasa sódica, euhedral a subhedral, zonadas
y macladas. Los ferromagnesianos corresponden a cristales subhedrales de hornblenda verde,
como accesorios se encuentran cuarzo y piroxeno. Antecedentes geocronológicos disponibles
para esta unidad permiten asignarla al Mioceno, con un importante evento de deformación dúctil
ocurrido en el Plioceno (Cembrano et al., 2002).
1.5.2.2 Tonalita Puyuhuapi, BMtp (Mioceno)
Corresponde a afloramientos de tonalitas y granodioritas y escasos cuerpos de leucotonalitas,
equigranulares, de grano grueso a medio, leucocráticas a mesocráticas, compuestas,
esencialmente, por plagioclasa, hornblenda, cuarzo y en menor medida biotita, con apatito, zircón
6
y titanita como minerales accesorios. Los afloramientos se distribuyen principalmente, al Sur-este
de Rio Oscuro, como una franja N-S que es limitada por la traza principal del sistema de falla
Liquiñe-Ofqui que define el canal de Puyuhuapi. Es común encontrar en esta unidad, inclusiones
de diques microdioríticos y enclaves máficos centrimétricos a métricos de microdioritas y dioritas
de grano fino.
Estudios petrográficos muestran la presencia de plagioclasa subhedral con zonación oscilatoria,
la biotita es anhedral, mientras que la hornblenda se presenta con bordes corroídos y extinción
ondulosa. Antecedentes geocronológicos permiten asignar esta unidad al Mioceno, con un
importante evento de exhumación ocurrido en Plioceno y hasta posiblemente Pleistoceno
superior (Pankhurst et al., 1999).
1.5.3 Volcanismo monogenético
Centros eruptivos menores (MEC) , en su mayoría basálticos, son una de las formas de
magmatismo más extendidas en el planeta, ocurriendo en todos los ambientes tectónicos
mayores (Cañón-Tapia and Walker, 2004) y producen magmas con un rango composicional
desde insaturados en sílice hasta saturados y sobresaturados, dentro del espectro basáltico, SiO2
wt.%. <53 (Mcgee and Smith, 2016).
Los volcanes monogenéticos ocurren como conos de escoria, conos y anillos de ceniza y maars,
su expresión en la superficie terrestre ocurre de dos maneras: (1) como campos aislados de uno
o varios MEC, en corteza que va desde una litosfera delgada (<30 Km) resultado de extensión a
una litosfera normal a engrosada; (2) como conductos parasito a lo largo de zonas de dorsal o en
flancos de volcanes poligenéticos mayores.
Los conos de escoria son volcanes que se forman por erupción de magma basáltico, de baja
viscosidad en erupciones estrombolianas o hawaiianas y se forman en condiciones secas o a una
razón agua/magma muy baja (<0,1). En cambio, los anillos de toba, conos de toba y maars son
formados en ambientes subaéreos o en presencia de aguas superficiales. Ellos se generan desde
una erupción freatomagmática debido a la mezcla de magma ascendente y agua superficial
(Sigurdsson, 1999).
Un volcán monogenético según Németh and Kereszturi 2015 se define como un edificio volcánico
con bajo volumen acumulado (típicamente ≤ 1Km3) que ha sido construido por una pequeña
erupción continua o muchas discontinuas alimentadas por uno o múltiples lotes de magma a
través de un sistema de dique alimentador relativamente simple y poco espaciado, con un sistema
de cámara magmática poco desarrolladas.
A partir de estudios como los de McGee et al., 2015, 2012; Németh et al., 2003 y Smith et al.,
2008 se ha determinado que existe una evolución sistemática en la composición del magma

7
durante el desarrollo de una erupción de un volcán monogenético. Muestreos a través de la
secuencia estratigráfica de una secuencia volcánica revelan variaciones composicionales que
serían el resultado del fraccionamiento del magma a nivel profundo, cercano a la fuente (Smith
et al., 2008).
Por otro lado, también se ha encontrado que hay una significante correlación positiva entre el
volumen de magma de un pulso individual y su composición dentro del espectro basáltico.
En genera volúmenes de magma menores tienen composiciones en el extremo de bajo SiO2 y
alto álcalis del espectro, mientras que los volúmenes más grandes tienden hacia composiciones
menos alcalinas y más saturadas de sílice. (McGee and Smith, 2016).
Debido a que están involucrados volúmenes de magma muy pequeños y su existencia en la
superficie requiere un ascenso rápido desde la fuente mantélica, las erupciones monogenéticas
tienen el potencial de revelar características sutiles de procesos magmáticos que se enmascaran
en sistemas más grandes como estratovolcanes, islas oceánicas y grandes provincias ígnea
(McGee et al., 2013).
1.5.4 Condiciones de oxidación magmáticas
La fugacidad de oxigeno ejerce un importante control sobre la mineralogía y la composición de
un basalto, es el resultado de la compleja historia de fusión parcial, extracción, ascensión y
emplazamiento del magma (Herd, 2008). Su influencia en el transporte de metales y en la
formación de óxidos magmáticos la convierten en una variable clave al estudiar la evolución
magmática ya que esta varía durante la cristalización y exsolución de volátiles (Burgisser and
Scaillet, 2007), cualquier cambio en la fugacidad de oxigeno debería dar como resultado un
cambio en la relación redox de hierro tanto en los sólidos como en los líquidos, controlando la
aparición de óxidos de Fe-Ti, silicatos ferro magnesianos, y la composición química del fundido
coexistente (Carmichael y Ghiorso, 1990)
El estado redox de magmas derivados del manto varían con la configuración tectónica
(Carmichael, 1991), trabajos como Eggins, 1993; Kelley and Cottrell, 2009; Wood et al., 1990 han
sugerido que lavas de arco volcánico tienen un estado de oxidación significativamente mayor que
el basaltos de dorsal oceánica (MORB). Evans 2012 determino fO2 para basaltos de arco de 2 a
4 unidades sobre el buffer QFM (cuarzo-fayalita-magnetita), magmas ricos en K presentan los
niveles más altos, con un ∆QFM de 2.9 ±0.7 en promedio, superior a lo encontrado en magmas
K-intermedios (2.1±0.6).
Existen varios métodos (oxibarómetro) para determinar la fO2 en los basaltos, basados en la
partición de hierro ferroso y férrico entre pares de óxidos, tales como los propuestos por Ghiorso
y Sack, 1991; Lindsley y Frost, 1992; Lattard et al., 2005 aunque la limitación de estos es que los

8
óxidos de Fe-Ti como la titanomagnetita y la ilmenita en general aparecen tardíamente en la
evolución de cristalización de los magmas basálticos y en rocas primitivas con poco
fraccionamiento no se encuentran tales fases.
El oxibarómetro olivino-piroxeno-espinela fue desarrollado para su aplicación en xenolítos
mantélicos en facies de espinela. Ballhaus et al. (1991) proporciona una calibración empírica del
oxibarómetro de olivino-piroxeno-espinela de O’Neill y Wall (1987), usando pares de harzburgita
de espinela y lherzolita sintéticas entre 1040 y 1300 ° C y 0.3 a 2.7 Gpa, el modelo se limita a
fundidos primitivos, derivados del manto, y no es apropiado para basaltos más evolucionados. La
ventaja de la formulación es que evita la necesidad de un cálculo explícito de la actividad del
componente de magnetita en la espinela; sin embargo, se simplifica suprimiendo el ortopiroxeno
usando la parte ideal de la actividad de fayalita en el olivino. No se puede esperar que esta
simplificación sea válida en XFe Ol> 0.15.
1.5.5 Condiciones P-T de cristalización
Las condiciones temperatura se determinaron mediante el uso de geotermómetros de olivino –
vidrio, basado en una relación empírica independiente de la presión propuesta por Putirka (2008),
con un error asociado de 52° C.
Además, se utilizó el software de modelamiento Petrolog para reconstruir la composición inicial
de las inclusiones y la respectiva temperatura de atrapamiento (Danyushevsky and Plechov 2011)
El algoritmo simula en intercambio de Fe y Mg entre el olivino y el fundido de acuerdo al modelo
de Ford et al., 1983, se compara el contenido de FeO en la inclusión con una cantidad
especificada por el usuario, si la cantidad de FeO ingresada por el usuario es mayor que la
contenida en la inclusión, el software simula un aumento de Temperatura y la consiguiente fusión
de olivino, en el caso contrario ocurre cristalización de olivino en la pared de la inclusión lo que
disminuye la cantidad de FeO y MgO en esta.
Para determinar las condiciones de presión, se estiman las presiones de saturación de vapor de
las inclusiones utilizando la concentración de H2O-CO2 (Fig. 2)
La solubilidad de ambos volátiles en el magma dependen de la composición del fundido y de la
temperatura, por lo que estos efectos también deben tenerse en cuenta al realizar los cálculos de
presión de saturación de vapor (Metrich y Wallace, 2008).
9
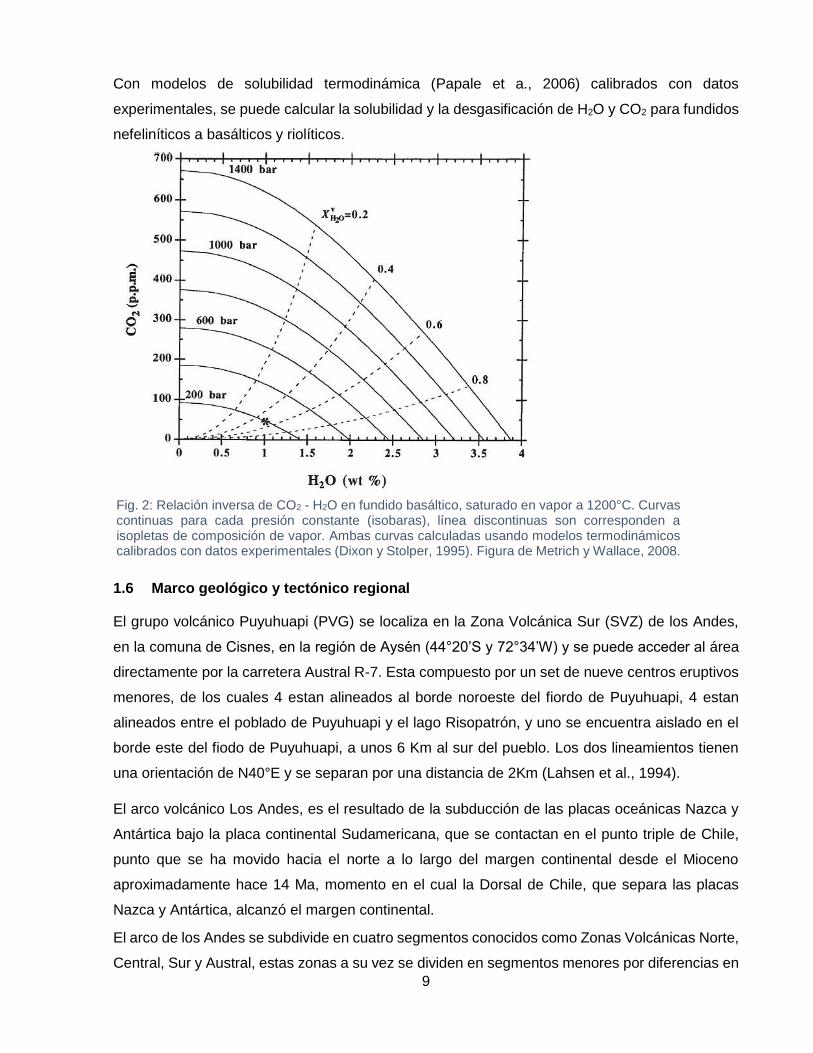
Con modelos de solubilidad termodinámica (Papale et a., 2006) calibrados con datos
experimentales, se puede calcular la solubilidad y la desgasificación de H2O y CO2 para fundidos
nefeliníticos a basálticos y riolíticos.
1.6 Marco geológico y tectónico regional
El grupo volcánico Puyuhuapi (PVG) se localiza en la Zona Volcánica Sur (SVZ) de los Andes,
en la comuna de Cisnes, en la región de Aysén (44°20’S y 72°34’W) y se puede acceder al área
directamente por la carretera Austral R-7. Esta compuesto por un set de nueve centros eruptivos
menores, de los cuales 4 estan alineados al borde noroeste del fiordo de Puyuhuapi, 4 estan
alineados entre el poblado de Puyuhuapi y el lago Risopatrón, y uno se encuentra aislado en el
borde este del fiodo de Puyuhuapi, a unos 6 Km al sur del pueblo. Los dos lineamientos tienen
una orientación de N40°E y se separan por una distancia de 2Km (Lahsen et al., 1994).
El arco volcánico Los Andes, es el resultado de la subducción de las placas oceánicas Nazca y
Antártica bajo la placa continental Sudamericana, que se contactan en el punto triple de Chile,
punto que se ha movido hacia el norte a lo largo del margen continental desde el Mioceno
aproximadamente hace 14 Ma, momento en el cual la Dorsal de Chile, que separa las placas
Nazca y Antártica, alcanzó el margen continental.
El arco de los Andes se subdivide en cuatro segmentos conocidos como Zonas Volcánicas Norte,
Central, Sur y Austral, estas zonas a su vez se dividen en segmentos menores por diferencias en
Fig. 2: Relación inversa de CO2 - H2O en fundido basáltico, saturado en vapor a 1200°C. Curvas continuas para cada presión constante (isobaras), línea discontinuas son corresponden a isopletas de composición de vapor. Ambas curvas calculadas usando modelos termodinámicos calibrados con datos experimentales (Dixon y Stolper, 1995). Figura de Metrich y Wallace, 2008.

10
la distribución del volcanismo y diferencian es la composición de los productos volcánicos. Los
segmentos de mayor escala con volcanismo activo ocurren en zonas donde el ángulo de
subducción es relativamente inclinado (25°) y entre ellos existen zonas en que el ángulo de
subducción es relativamente plano (11°) donde el volcanismo está ausente (Pardo et al., 2002)
La SVZ, se ubica entre las latitudes 33º y 46ºS, se limita al norte por la subducción de la dorsal
de Juan Fernández y al sur por la subducción de la dorsal de Chile. En este tramo la placa de
Nazca subduce bajo el continente a una tasa de 7-9 cm/año que ha prevalecido durante los
últimos 20 Ma (Pardo-Casas y Molnar, 1987), esta placa subduce en una dirección de 22-30º NE
de la ortogonal con la trinchera, y el ángulo de subducción aumenta de ~20° en el límite al norte
a >25° hacia el sur. En consecuencia, la distancia del arco a la fosa varia de >290 Km al norte a
<270 Km hacia el sur (Stern, 2004).
La subducción ligeramente oblicua de la placa de Nazca bajo la placa Sudamericana producen
características geológicas complejas a lo largo del borde continental. En la SVZ los esfuerzos son
acomodados a través de la zona de falla Liquiñe-Ofqui (LOFZ, Hervé 1994), esta se extiende por
aproximadamente 1000 Km, entre las longitudes 38° y 47° S. La LOFZ es una megafalla intra-
arco transcurrente dextral. Representada por lineamientos de rocas cataclásticas y miloníticas
con dirección NNE-SSW, NE-SW y NNW-SSE, y fracturas de orientación preferente N50°-60°W
y N50°-70°E que la cortan transversalmente (Cembrano et al., 1996).
Esta estructura favorece la ubicación de muchos edificios volcánicos a lo largo de su traza
principal y ramas asociadas (Fig. 3). La distribución de la mayoría de los MEC está controlada
por la traza de la LOFZ. Los basaltos de olivino de algunos MEC podrían representar alguna de
las rocas más primitivas de todo el arco volcánico de Los Andes (López-Escobar y Moreno, 1994).

11
Fig. 3: SSVZ con las principales trazas de la LOFZ y la ubicación de diferentes edificios volcánicos. Imagen modificada de Cembrano y Lara (2009)
La SVZ incluye al menos unos 60 edificios volcánicos, del tipo estratovolcán (SV), histórica y
potencialmente activos, además de 3 complejos de calderas silícicas y cientos de centros
eruptivos menores, distribuidos en las provincias norte (NSVZ= 33,0°-34,5° S), transicional
(TSVZ= 34,5°-37,0° S), central (CSVZ= 37,0°-41,5° S) y sur (SSVZ= 41,5°-46,0° S). (Stern, 2004).
A lo largo de la SVZ, en las provincias centro y sur, el volcanismo es activo e intenso, el ancho
del arco volcánico es de aproximadamente 80 Km (en la CSVZ) y 40 Km (en la SSVZ), y la
actividad volcánica post glacial ha sido continua con erupciones en volcanes del tipo SV y MEC.
Las rocas son predominantemente basaltos y basalto andesitas, aunque algunos SV exhiben
productos de intermedios a ácidos (López-Escobar and Moreno, 1994)
12
1.6.1 Geología del área de Puyuhuapi
A continuación, se presenta una descripción de la geología base realizada en el área de Puerto
Puyuhuapi, por SERNAGEOMIN-GORE Aysén, 2011 (Fig. 4)
El área se caracteriza por una geomorfología dominada por un modelado glacial de serranías
elevadas, con altitudes máximas del orden de 1.600 s.n.d.m. y pendientes abruptas, en ocasiones
>45°, con valles glaciales profundizados por sistemas fluviales tardíos, estrechos y profundos.
Además, posterior a la erosión glaciar, el paisaje ha sido modelado por actividad volcánica
reciente. Lo anterior se ve representado por el valle glacial de orientación N-NW sobre el cual se
localiza el lago Risopatrón, el cual fue represado por lo cono monogenéticos en estudio, y su
continuidad hacia el sur se expresa en el Canal Puyuhuapi. Se reconocen tres unidades
geológicas mayores: Rocas volcanosedimentarias y volcánicas, rocas Intrusivas de Batolito Nor
Patagónico y Depósitos sedimentarios no consolidados
1.6.2 Rocas volcanosedimentarias y volcánicas.
1.6.2.1 Formación Traiguén, EMt (Eoceno-Mioceno)
Sucesión volcanosedimentaria (Espinoza y Fuenzalida, 1971; Fuenzalida y Etchart, 1975; Hervé,
et al., 1995), compuesta por basaltos almohadillados, lutitas, areniscas y cherts, generalmente
metamorfoseados y con enjambre de diques asociados. En el área de estudio los afloramientos
se distribuyen, en el costado occidental del Canal Puyuhuapi en especial en el borde occidental
de la Isla Magdalena, corresponden principalmente a lavas macizas, en algunos casos con
litofacies de lavas almohadilladas (‘pillow lavas’) cuerpos gábricos y en menor proporción, tobas
de lapilli y brechas volcánicas y areniscas. Estos se disponen en franjas discontinuas de
orientación N-NE a S-SW, definiendo pliegues isoclinales de orientación semejante al eje del
canal Puyuhuapi (137°/50°)

13
Fig. 4: Mapa geología base puerto Puyuhuapi. Fuente: Servicio nacional de Geología y Minería – Gobierno Regional de Aysén. Mella y Duhart (2011) Estudios geocronológicos Rb-Sr en roca total permitieron asignar una edad de entre 46 y 20 Ma
(Hervé, et al., 1995), sin embargo, estudios recientes U-Pb SHRIMP en circones detríticos han
revelado una edad neógena para la Formación Traiguén.
1.6.2.2 Grupo volcánico Puyuhuapi, Hvp (Holoceno)
Grupo de al menos nueve centros eruptivos menores (Fuenzalida y Etchart, 1974; Lahsen et al.,
1994) se disponen como centros aislados de conos de escoria y flujos de lava basáltica, que
cubren una superficie aproximada de 9 Km2. Los MEC están distribuidos dos lineamientos con
dirección N40°E, consistente con una de las trazas principales del sistema de Falla Liquiñe –
Ofqui. Uno de los lineamientos con cuatro MEC se emplaza en el borde NW del Fiordo Puyuhuapi

14
y el otro, a una distancia de 2 Km, también con al menos 4 MEC, se emplaza al norte del poblado
Puyuhuapi hasta el Lago Risopatrón, además por el borde este del fiordo Puyuhuapi se observa
un flujo de lava basáltica que desciende de lo alto de un acantilado, que habría eruptado también
desde una fractura con dirección N40°E, falla llamada Puyuhuapi-Rio Frio. (Lahsen et al., 1994)
El grupo volcánico se encuentra emplazado en un basamento de tonalitas, dioritas y gabros que
forman parte del Batolito Norpatagónico y se caracteriza por flujos de lavas menores y conos
piroclásticos bien preservados, sin erosión glaciar, por lo que el complejo seria de edad post
glaciar.
El material extruido de los conos son basaltos vesiculares de olivino, de textura porfídica con
fenocristales de olivino magnésico y pequeños fenocristales de clinopiroxeno y plagioclasa
cálcica, la masa fundamental va de hialopilítica a fluidal pilotaxítica y contiene microlitos de
plagioclasa, gránulos de olivino, minerales opacos y vidrio basáltico. De acuerdo a su
composición los basaltos de Puyuhuapi pueden ser considerados como calcoalcalinos ricos en
K, aunque debido al alto contenido de Na, estas rocas también pueden ser consideradas como
alcalinas (Lahsen et al., 1994).
En general la actividad que produjo estos centros eruptivos fue en una primera etapa fisural, en
que se produjeron los flujos de lava y luego se volvió centralizada formando los conos
piroclásticos, además es probable que la actividad del lineamiento norte haya sido sub-acuática
(freatomagmática), lo que habría represado el canal Puyuhuapi, formando el lago Risopatrón.
1.6.3 Depósitos sedimentarios no consolidados
Corresponden a Depósitos de playa, fluviales, de remociones en masa, glacioestuarinos,
morrénicos, glaciofluviales y glaciolacustres.
Los depósitos de playa (Hp), se encuentran en las playas al sur del poblado de Puyuhuapi,
presentan buena selección, constituidos por guijarros redondeados, de tamaño variable y arenas
gruesas y finas con laminación paralela y ondulitas en el fondo.
Los depósitos fluviales (Hf), generados por los cursos de actuales de agua, asociados a los
márgenes de los ríos Ventisqueros y Pascua, están constituidos principalmente por gravas
clastosoportadas e incluyen intercalaciones de lentes de arena, con estratificación cruzada o
plana y de limos laminados y arenas indicando planicies de inundación.
Los depósitos de remociones en masa (Hrm) son de tipo diamicto, polimícticos a monomícticos,
mal seleccionados, de tamaños variables clasto a matriz soportados. Se encuentran en zonas al
pie de las laderas de alta pendiente y en la descarga de los cursos de agua desde dichas laderas,
15
formando morfologías de abanico de diferente magnitud y extensión, en el área de estudio se
pueden observar en ambas vertientes del canal Puyuhuapi y en los valles secundarios interiores.
Los depósitos glacioestuarinos (Hge), localizados en los entornos del poblado de Puyuhuapi en
el aeródromo, son bien seleccionados, caracterizados por una sucesión rítmica de limos y arena
fina con laminación paralela y ondulitas de fondo, con intercalaciones de gravas, en ocasiones,
se observan guijarros inmersos en una matriz soportada de arena fina, indicando un ambiente
transicional entre estuario y glaciar.
Los depósitos morrénicos (PIHm)son macizos con mala selección, matriz a clasto soportado,
polimícticos, compuestos por guijarros y bloques angulosos a subredondeados, localmente
estriados y facetados, en una matriz de arena fina y limo. Se encuentran bien expuestos en los
valles glaciares asociados a las descargas del nevado de Queulat en la porción superior del valle
del rio Ventisquero.
Los depósitos glaciofluviales (PIHgf), están escasamente representados en el área, en los
alrededores de los ríos Ventisquero y Oscuro, se componen de gravas, parcialmente imbricadas,
moderadamente a bien seleccionadas, clasto a matriz soportadas, con clastos redondeados a
subangulosos de tamaño guijarro, en una matriz de arena gruesa, intercaladas con lentes de
arena, con estratificación planar y cruzada, y limos laminados.
Los depósitos glaciolacustres (PIHgl), se componen de una sucesión rítmica de arenas finas,
limos y arcillas e intercalaciones menores de gravas. Se exponen en la ribera sur del Lago
Risopatrón y en los valles glaciares colgados del Rio Ventisquero.
16
CAPÍTULO 2:
2 MAGMATIC EVOLUTION THROUGH MELT INCLUSIONS OF THE HOLOCENE
ALKALINE LAVAS OF PUYUHUAPI VOLCANIC GROUP, CHILEAN SOUTHERN
ANDES
Wong, M.1*, Cannatelli, C.1, Moncada, D.2, Buscher J.1, Frezzotti, M.L.3, Morata, D1
1 Departamento de Geología y Centro de Excelencia en Geotermia de Los Andes (CEGA),
Facultad de Ciencias Físicas y Matemáticas, Universidad de Chile, Chile
2 Departamento de Geología, Facultad de Ciencias Físicas y Matemáticas, Universidad de Chile,
Chile
3 Department of Earth and Environmental Sciences, University of Milano-Bicocca, Milano, Italy
* Corresponding author: Centro de Excelencia de Geotermia de Los Andes (CEGA),
Departamento de Geología, Facultad de Ciencias Físicas y Matemáticas, Universidad de Chile,
Santiago 8370450, Chile. E-mail address: [email protected]
Abstract
The Puyuhuapi volcanic group (PVG) comprises nine minor eruptive centers (MEC), located at
44°16’-44°22’S/72°31’-72°37’W. The centers are pyroclastic cones associated with limited lava
flows, separated into two lineaments with a N40°E direction. Products of the PVG show an alkaline
affinity whereas large active stratovolcanoes in this region have a calc-alkaline affinity. Two
compositional groups associated with each lineament are inferred to belong to two magmatic
sources. This study focuses on olivine-hosted melt inclusions (MI) to constrain the primitive
magma composition and determine the igneous processes that caused the compositional
differences between and along lineaments of the PVG.
The composition of the melt phase before the eruption was determined by analyzing the major,
minor, trace element, and volatile contents of olivine-hosted MIs from four cones of the PVG.
These results are combined with major and trace element compositions of the mineral host and
whole rocks. Several types of MIs were observed and were classified according to petrographic
characteristics. MIs show a spectrum of basaltic compositions from Mg# 55 to #Mg 68 and
basanite to trachy basalt andesite. Olivine compositions vary from Fo75 to Fo87, with some
displaying resorption and/or reverse zoning.
The particular geochemical signature of the PVG alkaline lavas are expected to be influence
largely by the melting of slab sediments rather than fluid input, which would be consistent with a
low degree of melting. The lower amount of SiO2 and greater amount of alkalis of Puyu 9, in
17
addition to the greater enrichment of incompatible elements (Sr, Zr, Rb), allow us to determine
that Puyu 9 would not only have a deeper source of magma but was probably one of the first MEC
to erupt.
2.1 Introduction
Melt inclusions (MIs) are small volumes of melt typically 1–100 μm in size, that are trapped in
surface irregularities or defects of crystals during growth in a magma body (Sorby,1858), in
volcanic rocks, silicate-melt inclusions consist of glass + one or more gas bubbles ± daughter
mineral phases (Frezzotti, 2001). They can record pristine concentrations of volatiles and metals
usually lost by degassing and fractionation during magma solidification (Audétat and Lowenstern,
2014)
Because melt inclusions trap silicate melts prior to eruptive degassing, they are useful recorders
of melt volatile concentrations during crystallization (e.g. Lowenstern, 1995; Metrich and Wallace,
2008). However, during post-entrapment cooling and crystallization, the pressure within a melt
inclusion decreases. This causes nucleation of a vapor bubble and loss of volatiles from the melt
into the bubble. The pressure drop within a melt inclusion has a particularly strong effect on CO2
because of its strong pressure-dependent solubility in silicate melts (Aster et al., 2016). Therefore,
to access the initial volatile content it is necessary to measure them both in the glass and in the
bubble.
When studying the composition of melt inclusions in early formation phases such as olivine it is
more likely to obtain the parental magma composition. This study aims to determine pre-eruptive
conditions and processes recorded by the lavas of different minor eruptive centers from the PVG,
in terms of their mineral chemistry and the olivine-hosted melt inclusion composition to determine
the origin and magmatic evolution.
Small eruptive centers representing short-lived, isolated eruptions are effectively samples of
mantle heterogeneity over a given area, as they are generally of a basaltic composition and show
evidence of little magmatic processing. This is particularly powerful in volcanic arcs where the
original melting process generating stratovolcanoes is often obscured by additions from the down-
going slab (fluids and sediments) and the overlying crust (McGee et al., 2017).
The PVG lavas represent a point of interest since they are almost the only products of alkaline
signature in the arc of the Southern Volcanic Zone. Through this study, it is determined how small
scale heterogeneities in the magma source can generate compositional changes in low volumes
of magma.

18
2.2 Geologic background
The Andean Southern Volcanic Zone (SVZ) is a ~1400 Km-long volcanic chain whose activity has
produced 60 Quaternary stratovolcanoes (SV) and numerous minor eruptive centers (MEC; Stern,
2004). The SVZ is the result of the subduction of the Nazca plate beneath the South American
plate between latitudes 33°S and 46°S. The tectonic setting is characterized by slightly dextral-
oblique convergence between the Nazca and the South American plates at a rate of ca. 7-9
cm/year that has prevailed for the last 20Ma (Cembrano and Lara, 2009).
This segment of the Andes reflects important variations from north to south in its composition and
cortical thickness. Between 33° and 37°S, the basement is made up of extensive outcrops of
Meso–Cenozoic volcano–sedimentary rocks and south of 38°S, volcanoes are built directly onto
Meso–Cenozoic plutonic rocks of the Patagonian Batholith (Cembrano and Lara, 2009). The
overriding plate thickness ranges from 25 to 60 Km, with an average of 25-30 Km between
latitudes 42.5-45°S and 34-40 Km between latitudes 37-42.5° S, increasing systematically up to
60 Km northwards to latitude 33° S (Stern, 2004). In addition, the trench morphology changes
from deep and sediment poor in the north to shallow and sediment filled toward the south (Voelker
et al., 2013).
According to Thomson (2002) and references therein, large intra-arc strike slip faults are a
common feature in the overriding plate where subduction convergence is oblique to the plate
margin, and their existence can be explained by intraplate coupling causing partitioning of the
convergence vector into two orthogonal components: trench orthogonal compression and trench-
parallel strike-slip motion accommodated by discrete transcurrent faults. In the SVZ the stress is
accommodated by the Liquiñe-Ofqui Fault Zone (LOFZ), a major intra-arc fault system with dextral
transpresional displacement (Pankhurst et al, 1999).
Spatial volcanic distribution and differences in the geochemistry of the erupted rocks have been
used to subdivide the SVZ into four arc segments (Lopez-Escobar et al., 1995), northern (NSVZ;
33°S–34.5°S), transitional SVZ (TSVZ; 34.5°S–37°S), central (CSVZ; 37°S–425°S) and southern
(SSVZ: 42°S–46°S).
Based on magnetic anomaly patterns, the age of the subducting oceanic lithosphere on the SVZ
varies from about 35 Ma in the north to zero age at the Chile Rise (Tebbens et al., 1997). In
addition, the southern part hosts a number of fracture zones from north to south, named, Mocha,
Valdivia, Chiloé, Guafo, Guamblin and Darwin (Weller and Stern, 2018). Fracture zones are likely
to promote an enhanced transport of water via altered oceanic crust and possibly serpentinized
mantle into the subduction system (Wehrmann et al., 2014)
Crustal deformation not only plays a significant role in magma migration, but it may a exert a
fundamental control on magma differentiation processes that in turn can determine the nature and
19
composition of volcanism along and across continental margins (Cembrano and Lara, 2009). The
distribution of most MEC are controlled mainly by the LOFZ, which are predominantly basaltic,
and basaltic-andesites, which may represent some of the most primitive magmas erupted in the
entire Andean range (Lopez-Escobar and Moreno, 1994).
In a summary of SVZ magmatism, López-Escobar et al. (1995a) divided all SVZ basaltic rocks
into two types. Type 1, having low LREE/HREE common in largely basaltic CSVZ volcanoes and
depleted in K and in other incompatible elements such as Rb, La and Th. Type 2, having higher
LREE/HREE, that are K-rich and also enriched on incompatible elements, as found in back arc
volcanoes, most NSVZ and TSVZ centers, and numerous MEC found along the LOFS in the CSVZ
and SSVZ.
The Puyuhuapi volcanic group (PVG) comprises nine small basaltic centers located at 44°16’-
44°22’S/72°31’-72°37’W, in the southernmost border of the SVZ, about 260 Km east of the Nazca-
South American trench. PVG is composed by pyroclastic cones associated with limited lava flows,
predominantly basaltic in composition (Gonzalez-Ferran et al., 1994), separated into two
lineaments with a N40°E direction, following the principal trace of LOFZ (Hervé et al., 1995).
According to López-Escobar et al., 1995a, Puyuhuapi lavas belong to Type 2 basalts.
2.3 Sample description and preparation
We collected lava samples from four MEC; labeled Puyu3, Puyu4, Puyu9 and Puyu18 (Fig. 5)
Petrographic observations indicate that all samples are porphyritic basalts. The samples display
different degrees of vesicularity and phenocrysts content, ranging from 7% for Puyu 3 and Puyu
18, 10% for Puyu 4 and 13% for Puyu 9.

20
Fig. 5: satellite image with the location of the sampled eruptive centers (red circles), black circles: other minor eruptive centers of PVG. LOFZ: fault orientation from Mella and Duhart (2011). Source: servicio aerofotogramétrico – Fuerza Aérea de Chile
Puyu3, Puyu4 and Puyu18 samples display subhedral olivine (Ol) as the only phenocrysts phase
(up to 2 mm in size), which it is often found forming glomerophyric aggregates or as isolated
crystal, as well as microphenocrysts (0.03 mm). Generally, Ol contains numerous spinel inclusions
and melt inclusions (MIs) in varying amounts. Some Ol show disequilibrium, as normal zoning and
resorption that can occur in the core of the crystals or at the rim. Puyu 9 also presents subhedral
Ol as phenocrysts together with euhedral to subhedral clinopyroxene (Cpx) microphenocrysts.
Cpx, reaches just 1% in volume, and contains olivine and Fe-Ti oxides inclusions.
Plagioclase (Pl) is distinctly smaller than olivine, up to 0.2 mm on average, with some exceptions
of 0.8 mm, but most are found as microlites. The intergranular groundmass generally contains
anhedral Ol and Cpx, euhedral Pl and Ox, and very little glass. Puyu 9 is the only sample that
differs from the others, by displaying an intersertal groundmass texture with a blackish iron-rich
glass.
In order to study the mineralogy and geochemistry of collected Puyuhuapi lavas, we performed a
petrographic study on thin sections to establish both the paragenesis of our collected rocks and
the type of mineral phase hosting the MIs. Based on this first step, we crushed and sieved all
samples in order to handpick Ol crystals and then mount them into 1 inch-round glass slides using
an acetone-soluble resin. The obtained mounts were then polished with disks starting from 800 to
5000 grit, and then finishing with 0.1 µm alumina powder. We selected and analyzed crystals
21
containing homogeneous or recrystallized melt inclusions without cracks or other visually apparent
defects.
The volume of each bubble and MIs were calculated using the open-source program ImageJ
(Abràmoff et al., 2004), by measuring their dimensions from a photo. We assumed that bubbles
were spherical and MIs were ellipsoidal in volume and calculated their volumes. The third,
unobservable ellipsoidal axis (extending in and out of the plane of each photo) was estimated by
using the smaller ellipsoidal axis measured on the photograph, following the procedure proposed
by Aster et al. (2016).
2.4 Analytical procedures
We performed a detailed petrographic study of MIs by using a FEI Quanta 250 Scanning Electron
Microscope (SEM) available at CEGA (Andean Geothermal Center of Excellence) in the
Department of Geology at the University of Chile, to verify homogeneity of the glass and, in case
of recrystallized MIs, to determine which minerals were present. Using backscattered electron
(BSE) images, inclusions and their respective phases were characterized
Major element concentrations (Si, Al, Fe, Mg, Ca, Na, K, Mn, Ti, Cr, Ni, Cl and P) in MIs and host
Ol were determined using an electron microprobe analyzer (EMPA) at the University of Milan
(JEOL 8200 Super Probe) and at the LAMARX- National University of Cordoba (JEOL JXA-8230),
with four detection crystals (TAP, PETJ, LIF and LIFH). Polished Ol grain mounts and thin sections
were carbon-coated, and glass and minerals were analyzed with a 15-kV accelerating voltage.
Minerals were analyzed with a focused beam, a beam current of 5 nA and a counting time of 10s
for peaks and 5s for background. Volatile elements in MIs, such as Na and Cl, were analyzed first,
with a 5nA defocused beam, to minimize loss from the glass. Counting times were 5-20 s on peak
and 2.5-10 s. on background for major and minor elements. Water content in MIs was estimated
by applying the difference method. With the obtained data, the structural formula of each mineral
was calculated, using excel spreadsheets made for each phase (plagcalc, olicalc, pyxcalc,
spincalc), obtained from http://www.gabbrosoft.org.
Trace element concentrations in MIs and minerals were obtained by Laser Ablation Inductively
Coupled Plasma Mass Spectrometry (LA-ICPMS), using an iCapQ Thermo Scientific quadrupole
at CEGA, in the Department of Geology at the University of Chile. Laser spot size was 10 to 25
µm for MIs and 20 µm for Ol, pulsed at 7 Hz, with a counting time of 10ms for each isotope. For
every fifteen analyzed points, we used two check standards from the USGS, Nist SRM 610, as
the primary one, and MRM BHVO-2 (basaltic glass).
Data reduction for recrystallized MIs was performed using the AMS software (Mutchler et al.,
2008), which allows the determination of the concentration of the MI without knowing any major
22
oxide composition (i.e, without having an internal standard), assuming that the 44 measured
elements represent 100 wt. % of the MI. We used the Iolite software program (Paton et al., 2011)
to reduce data for homogeneous MIs analyzed by EMP, where we could use the known 29Si as
an internal standard.
Whole-rock compositions were analyzed by XRF (major elements) and ICP-MS (trace elements)
at Bureau Veritas Mineral Laboratories (Vancouver, Canada) using inductively coupled plasma–
atomic emission spectroscopy and mass spectroscopy (ICP-ES, ICP-MS). The ICP-ES and ICP-
MS analyses were carried out on lithium metaborate/ tetraborate fusions following dilute nitric acid
digestion. Loss on ignition (LOI) was determined as the weight difference after ignition at 1000 °C.
The detection limits for the analyses were between 0.002 and 0.1 wt. % for major elements, 0.01
and 5 ppm for trace elements, and 0.01 to 0.5 ppm for REE (rare earth elements). The accuracy
and analytical precision of the measurement of major and trace elements were analyzed against
standard reference material STD SO-19 and duplicate analyses for each sample. The iron redox
state of two samples (Puyu 4 and Puyu 9) were determined by titration.
The density of CO2 in each bubble was calculated with the densimeter equation proposed by
Lamadrid et al. (2017), which uses the distance in wavenumber between the two characteristic
peaks, called the Fermi diad located around 1285.4 cm-1 and 1388.2 cm-1 (Wright and Wang,
1973; 1975), As CO2 density increases, the peaks of the Fermi diad shift farther apart
𝜌 = −36.42055 + (0.354812 × 𝛥) (2)
Where ρ is the density of CO2 (g/cm3) and 𝛥 is the Fermi diad splitting (cm-1).
The splitting of the Fermi diad in the Raman spectrum of CO2 was calibrated as a function of
pressure and temperature, using a high-pressure optical cell (HPOC) in the Vibrational
Spectroscopy Laboratory at Virginia Tech, using a JY Horiba LabRam HR (800 mm) spectrometer.
The experimental set up is similar to the one used in Lamadrid et al., 2017. The Raman
spectrometer was equipped with a 400-μm diameter confocal hole and the slit width was set to
150 μm. Excitation was provided by a 514nm (green) Laser Physics 100S-514 Ar and laser set at
50mW, with Raman shifted photons diffracted by an 1800 grooves/mm grating to an Andor
electronically cooled open electrode 1024 × 512 pixel CCD. The mean value of three collections
of 45 s each were taken to determine the Raman peak positions at each pressure. In some cases,
the Fermi diad was outside of the range over which the equation of Lamadrid et al. (2017) is valid,
or the peaks did not allow precise determination of the Fermi diad splitting.

23
2.5 Results
2.5.1 Mineral Chemistry
2.5.1.1 Mafic minerals
Olivine (Ol) is the most abundant and large mineral phase in all studied lavas. Ol compositions for
all samples range from Fo74 to Fo87, Table 1 shows compositional ranges for each sample, with
forsteritic percentage calculated including the Mn content.
Most Ol has sub-euhedral shapes and displays minor zoning on the rims. Fig. 8 a-b-d shows
typical Ol phenocryst from Puyu 9, Puyu3 and Puyu18 respectively, with a very slight zoning at
the rim, mineral inclusions and MIs. Some Ol present disequilibrium features such as partial
resorption (i.e., embayments and dissolution zones) and/or reverse zoning. Olivine B21 from
Puyu9 has a central resorption and reverse zoning (Fig. 8d) showing Fo77 at the core and Fo84 at
the rim, olivine A21 from Puyu3 presents widespread resorption, and reverse zoning with Fo74 at
the core and Fo80 at the rim (Fig. 8 e), suggesting dissolution and recrystallization processes.
We identified a bimodal composition for Ol in Puyu 9 and Puyu 3; these samples also had larger
crystals than the others did, Puyu 4 shows a more limited compositional range, displaying mostly
smaller crystals of higher Fo content. In all of the samples, Ol microlites occur as intergranular
grains of 40-100 μm in size, with compositions in the Fo73 - Fo79 range, compositionally coinciding
with the rims of phenocrysts.
Table 1; Olivine compositions measured with electron microprobe. * Data obtained by LAICPMS
Sample Phenocrysts size (mm) Fo (%) core Fo(%) rim
Puyu3 0.5-1.9 74-87* 80-84
Puyu4 0.5-1.6 82-87 81-86
Puyu9 0.5-2.6 75-87 78-84
Puyu18 0.5-1.9 83-86 77-84
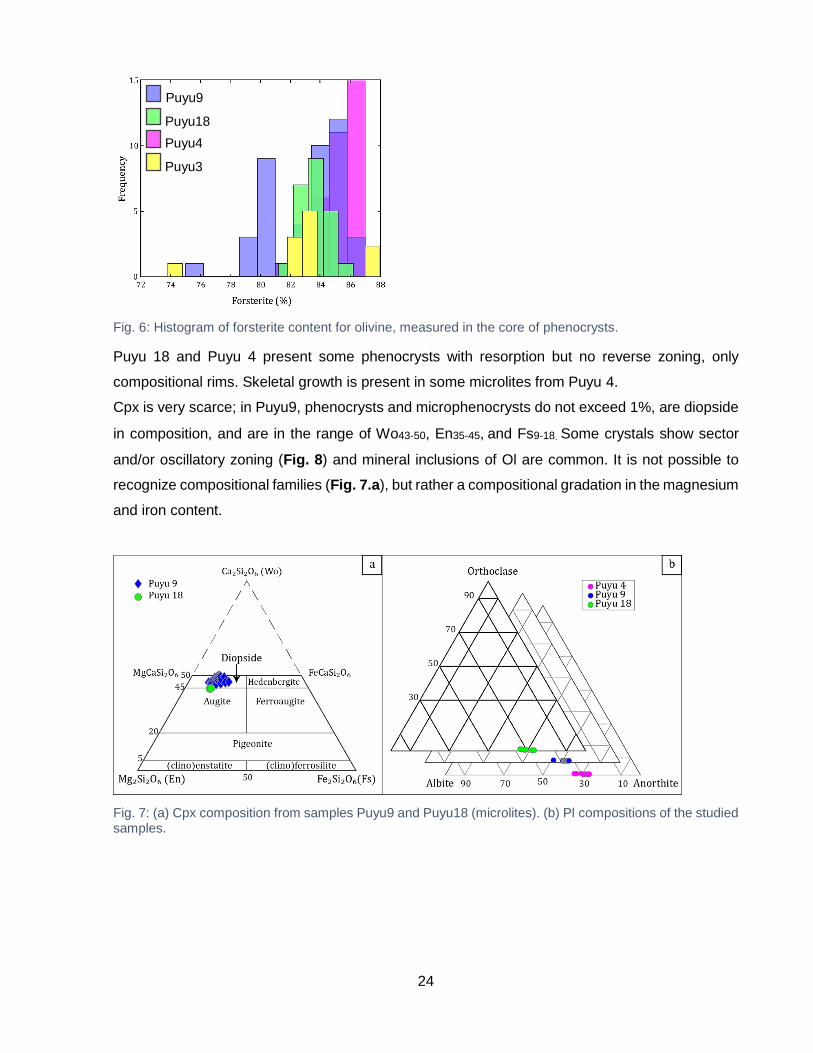
24
Fig. 6: Histogram of forsterite content for olivine, measured in the core of phenocrysts.
Puyu 18 and Puyu 4 present some phenocrysts with resorption but no reverse zoning, only
compositional rims. Skeletal growth is present in some microlites from Puyu 4.
Cpx is very scarce; in Puyu9, phenocrysts and microphenocrysts do not exceed 1%, are diopside
in composition, and are in the range of Wo43-50, En35-45, and Fs9-18. Some crystals show sector
and/or oscillatory zoning (Fig. 8) and mineral inclusions of Ol are common. It is not possible to
recognize compositional families (Fig. 7.a), but rather a compositional gradation in the magnesium
and iron content.
Fig. 7: (a) Cpx composition from samples Puyu9 and Puyu18 (microlites). (b) Pl compositions of the studied samples.
Puyu3
Puyu9
Puyu18
Puyu4

25
Fig. 8: BSE images taken by EMPA (a) Puyu9: Ol phenocryst with numerous spinel inclusions, distributed throughout the crystal. (b) Puyu3: aggregate of Ol crystals with large spinel inclusions. (c) Puyu9: Cpx microphenocrysts with sector (blue triangular zone) and/or oscillatory zoning: black circles: olivine inclusions. (d) Puyu18: pristine Ol phenocryst, with central melt inclusion. Red box: inclusion detail with trapped spinel crystal (e) Puyu3: Ol phenocryst with resorption and reverse zoning. Fo percentage in red (f) Puyu9: Ol phenocryst with resorption and reverse zoning. Fo percentage in red. Yellow zone marks the original crystal.
(d) (c)
(f)
(b) (a)
(e)
26
2.5.1.2 Plagioclase
Plagioclase (Pl) phenocrysts are scarce, with sizes distinctly smaller than olivine, being the largest
in Puyu9, where they reache up to 0.8 mm. Generally, in all of the samples Pl varies from 0.1-0.4
mm in size and some microphenocrysts are found forming aggregates (Fig. 9). The composition
at the core of Pl phenocrysts is relatively constant from An64 to An73 (Fig. 7.b).
Fig. 9: BDE image by EMPA of sample Puyu9 (D14) showing glomerophyric texture.
Pl is mostly subhedral and display well-preserved edge and normal zoning, without disequilibrium
features. Microlites are euhedral in shape and range from An65-70, Ab28-33. Puyu3, Puyu4, and
Puyu18 lavas have glass-free matrices with abundant microlites commonly forming part of a
trachytic or intergranular texture. MIs are scarce in this phase and are found only in Puyu 9, but
in general, they are recrystallized and angled shaped.
2.5.1.3 Spinel
Spinel-group minerals (general formula: AB2O4) are important geological tools to understand the
petrogenetic properties and geodynamic environment of the rocks in which they occur. Generally,
MgAl2O4-rich spinel is considered the characteristic mineral of the uppermost lherzolite facies of
the mantle. The spinels may be subdivided on the basis of the dominant A2+ (as Mg, Fe+2, Zn,
Mn) and B3+ (Al, Fe+3, Cr, V) ions, the varieties being designated by the next most dominant
constituent, picotite, which is conventionally used to describe Cr-bearing spinel and pleonaste for
spinel containing some Fe2+.
Spinel inclusions are abundant in Ol phenocrysts, and depending on the size of the host, we could
observe up to ~30 inclusions in a single crystal, with size varying between 10 and 60 µm. Spinel
also occur as isolated crystals in the groundmass, with the groundmass of Puyu 3 being the
sample with greater amounts.

27
Fig. 10: (a) Spinel prism for the multi-component system: spinel (MgAl2O4) - hercynite (Fe Al2O4)-chromite (FeCr2O4) – magnesiochromite (MgCr2O4) – magnesioferrite (MgFe2O4) - magnetite FeFe2O4), after Deer et al.,1992.The projections of the basal face and the lateral-right face of the prism, represent the diagrams in “b” and “c” (b) Binary classification diagram considering the Cr-Al and Mg-Fe+2 exchange; 1=Magnesiochromite, 2=chromite, 3= spinel, 4= Hercynite. (c) Binary classification diagram considering the Fe+3-Al and Fe+2-Mg exchange; 1=magnesioferrite, 2= magnetite, 3= ferrian-spinel, 4= ferrian-pleonaste, 5=Al-magnetite, 6= ferrian-picotite, 7= spinel, 8= pleonaste, 9= Hercynite.
The composition of Ol-hosted spinels inclusions were obtained by EMPA and are plotted in (Fig.
10), using a simplified classification diagram of the main members of the spinel group. It can be
seen that the trend in the composition is from pleonaste to ferrian pleonaste in which Fe+2 and
Fe+3 increases with decreasing Mg and Al, with some more extreme compositions (magnetite) in
the case of Puyu9 and Puyu3 (higher Cr#= 100 × Cr/[Cr+Al]). Their Cr# and Mg# range from 0.54
to 63.84 and from 15.60 to 76.62 respectively. Spinels also occurs frequently as trapped mineral
in MIs, based on the inclusion/crystal volume ratio, suggesting that the magma was saturated in
oxides.
0.0
0.1
0.2
0.3
0.4
0.5
0.6
0.7
0.00.20.40.60.81.0
Cr/
(Cr+
Al)
Mg/(Mg+Fe+2)
0.0
0.1
0.2
0.3
0.4
0.5
0.6
0.7
0.8
0.9
1.0
0.0 0.1 0.2 0.3 0.4 0.5 0.6 0.7 0.8 0.9 1.0
Fe
+3/F
e+
3+
Al)
Fe+2/(Fe+2+Mg)
18
9
4
3
1 2
3 4
b a
c
1 2
3 4
6
5
9 8 7

28
2.5.2 Melt inclusion petrography
Several types of MIs were observed and were classified according to petrographic characteristics,
although it was difficult to identify melt inclusion assemblages (MIAs, Cannatelli et al., 2016 and
references therein) in Ol since most MI were randomly trapped in the crystals. Compositionally,
we distinguished Type I MIs, which include inclusions that contained only homogeneous glass and
MIs that contained one or more bubbles, and Type II MIs, which includes all recrystallized MIs with
daughter and/or trapped crystals.
Both types are also classified by shape, which can be regular (oval or ellipsoidal) or irregular (from
polygonal or negative crystal-shape to completely irregular). Recrystallized MIs were not re-
homogenized, but analyzed directly by LA-ICPMS, and previously analyzed by SEM to document
the mineral phase(s).
The vast majority of MIs hosted in phenocrysts from Puyu3 were completely recrystallized (Fig.
11.d), with sizes ranging from 20 to 80 µm, and daughter crystals of clinopyroxene were observed.
Some crystals contained MIs coexisting with fluid inclusions (FIs) where a rapidly moving vapor
bubble was visible at room temperature, although the analysis of fluid inclusions is beyond the
scope of this study.
In Puyu4, homogenous MIs have colorless to transparent light brown glass, sizes ranges from a
few microns up to 100 µm (Fig. 11.a); the majority being between 15 to 20 µm), and Vbubble/Vmelt is
3.9% in average. Recrystallized MIs are less abundant, and the majority of them contains only Ox
crystals. In general, the shape of the MIs varies between oval and irregular, and sometimes coexist
with FIs.
Homogenous MIs from Puyu9 have colorless to pale brown glass (Fig. 11.b) and shapes varying
from oval to completely irregular, sizes range from a few microns up to 40 µm, and Vbubble/Vmelt is
about 5.4%. Recrystallized MIs contain only Ox crystals or are completely recrystallized (Fig.
11.e), with the last ones displaying the biggest sizes, up to 75 µm.
In Puyu18, homogenous MIs have colorless to pale brown glass, sizes range from a few microns
up to 60 µm, and Vbubble/Vmelt is 5.2% on average. Recrystallized MIs containing daughter crystals
are less abundant, although inclusions with Ox trapped crystals are found easily (Fig. 11.c), and
reach sizes of 155 µm. Some crystals contain MIs along with FIs and some MIs are decrepitated
(Fig. 11.f)
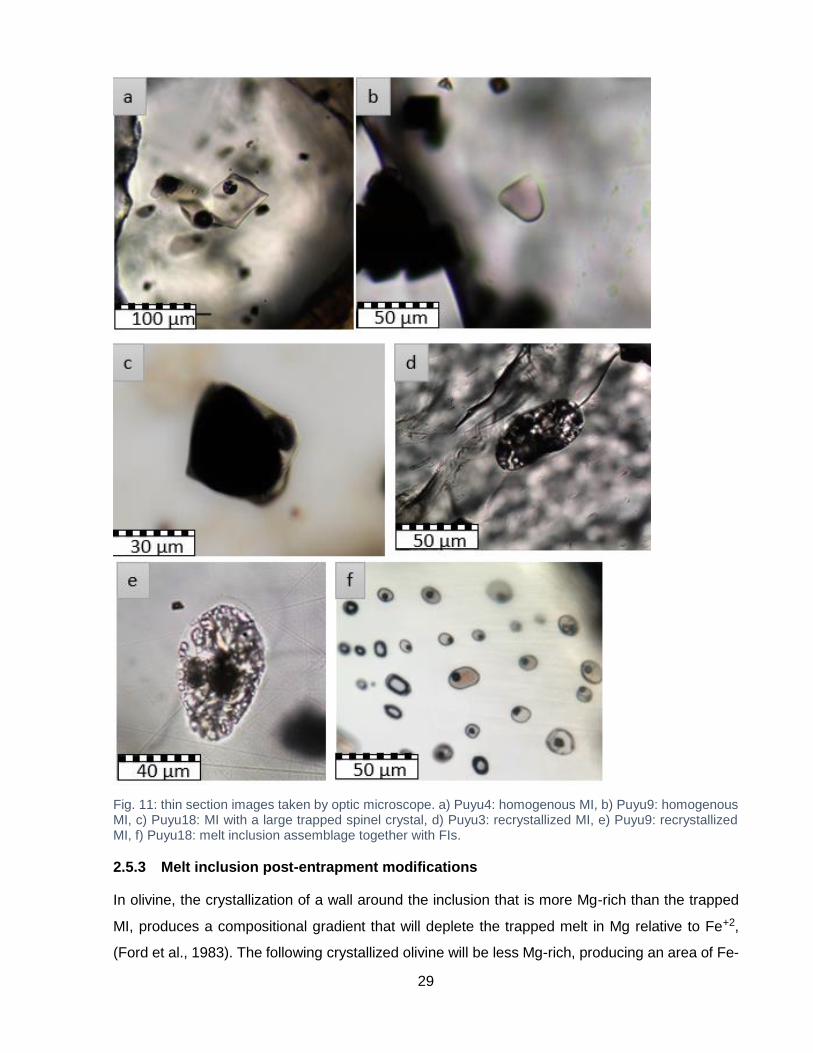
29
Fig. 11: thin section images taken by optic microscope. a) Puyu4: homogenous MI, b) Puyu9: homogenous MI, c) Puyu18: MI with a large trapped spinel crystal, d) Puyu3: recrystallized MI, e) Puyu9: recrystallized MI, f) Puyu18: melt inclusion assemblage together with FIs.
2.5.3 Melt inclusion post-entrapment modifications
In olivine, the crystallization of a wall around the inclusion that is more Mg-rich than the trapped
MI, produces a compositional gradient that will deplete the trapped melt in Mg relative to Fe+2,
(Ford et al., 1983). The following crystallized olivine will be less Mg-rich, producing an area of Fe-
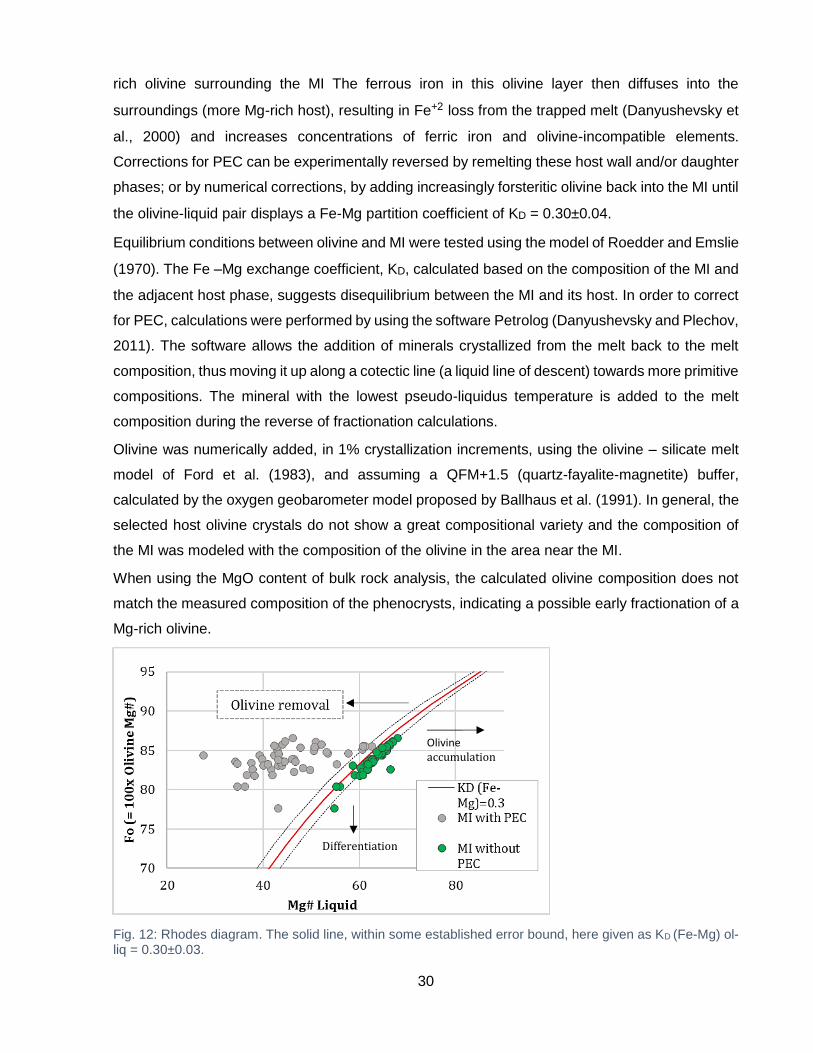
30
rich olivine surrounding the MI The ferrous iron in this olivine layer then diffuses into the
surroundings (more Mg-rich host), resulting in Fe+2 loss from the trapped melt (Danyushevsky et
al., 2000) and increases concentrations of ferric iron and olivine-incompatible elements.
Corrections for PEC can be experimentally reversed by remelting these host wall and/or daughter
phases; or by numerical corrections, by adding increasingly forsteritic olivine back into the MI until
the olivine-liquid pair displays a Fe-Mg partition coefficient of KD = 0.30±0.04.
Equilibrium conditions between olivine and MI were tested using the model of Roedder and Emslie
(1970). The Fe –Mg exchange coefficient, KD, calculated based on the composition of the MI and
the adjacent host phase, suggests disequilibrium between the MI and its host. In order to correct
for PEC, calculations were performed by using the software Petrolog (Danyushevsky and Plechov,
2011). The software allows the addition of minerals crystallized from the melt back to the melt
composition, thus moving it up along a cotectic line (a liquid line of descent) towards more primitive
compositions. The mineral with the lowest pseudo-liquidus temperature is added to the melt
composition during the reverse of fractionation calculations.
Olivine was numerically added, in 1% crystallization increments, using the olivine – silicate melt
model of Ford et al. (1983), and assuming a QFM+1.5 (quartz-fayalite-magnetite) buffer,
calculated by the oxygen geobarometer model proposed by Ballhaus et al. (1991). In general, the
selected host olivine crystals do not show a great compositional variety and the composition of
the MI was modeled with the composition of the olivine in the area near the MI.
When using the MgO content of bulk rock analysis, the calculated olivine composition does not
match the measured composition of the phenocrysts, indicating a possible early fractionation of a
Mg-rich olivine.
Fig. 12: Rhodes diagram. The solid line, within some established error bound, here given as KD (Fe-Mg) ol-liq = 0.30±0.03.
Olivine accumulation
Differentiation

31
We show in Fig. 12 the plot of Mg number (#Mg= 100*Mg/ (Mg+Fe+2)) of MI versus the host Fo
content, where the original measured MI compositions without correction (gray circles) are located
in the Ol removal field expected by the crystallization of olivine in the inclusion-host interphase.
The effect of adding olivine back to the composition of the inclusions (green circles) is displayed,
locating the recalculated MI in the area of equilibrium with the host composition. The amount of
olivine correction needed to achieve the goal ranged from 1.65 to 17.46 % (6.8% average), values
that are expected for Ol-hosted MI from monogenetic lavas.
2.5.4 Melt inclusion and bulk rock compositions
In this section, we present MI and whole-rock compositions (Table 2), recalculated and
uncorrected volatile-free MIs compositions (Table 3 and Appendix Table 8 respectively.
Table 2: Whole rock major element compositions (wt. %) of studied lava samples.
Sample Puyu3 Puyu4 Puyu9 Puyu18
SiO2 48.49 49.21 45.75 48.40
Al2O3 16.59 17.06 16.14 16.38
Fe2O3* 10.43 9.49 10.49 10.39
MgO 8.23 8.53 8.41 7.95
CaO 9.42 9.08 10.21 9.45
Na2O 3.40 3.29 3.03 3.33
K2O 1.30 1.30 1.70 1.26
TiO2 1.66 1.31 2.04 1.67
P2O5 0.37 0.35 0.54 0.38
MnO 0.15 0.16 0.17 0.15
Cr2O3 0.04 0.05 0.04 0.04
LOI -0.50 -0.20 1.00 0.20
Total 99.80 99.80 99.00 99.80
We analyzed a total of 120 MIs, and used 90 of them, which were considered further for data
reduction. Thirty analyzed points were discarded because the oxides total was low (less than 95
wt %), or we observed that the system was open and a contamination of the host occurred. We
considered MIs with a total oxide content ≥95% acceptable, although most data close around 98%
(Fig. 13).
We analyzed homogeneous MIs (N=63) by electron microprobe, of these only 31 qualified for size
to be analyzed by LAICPMS. Recrystallized MIs (N=27) were analyzed only by LAICPMS. For
sample Puyu3, phenocryst phases only contained recrystallized inclusions, and therefore we did
not obtain EMPA data for them.

32
Fig. 13: Box plot of the grouping of water content data in the inclusions.
The low oxidation degree (Fe2O3/FeO<0.2) of Puyu 4 (0.22) and Puyu 9 (0.16) together with the
low volatile content (LOI≤1); suggest that the samples are chemically representative of PVG’s
volcanic products. Samples Puyu 4 and Puyu 9 show whole rock Mg# of 68.05 and 64.51
respectively.
Table 3: recalculated type-I MI composition for Puyu4, 9, 18, measured by EMPA and type-II MI composition, measured by LAICMS (α) for Puyu3. Total =sum of all oxides plus Cl in original (uncorrected) electron microprobe analyses, %PEC= percentage post-entrapment olivine crystallization. Major element oxides reported are normalized to 100% on a volatile-free basis. H2O= estimated by the difference method assuming all of the missing components in the analyses was H2O. Shape= 1: ellipsoidal shape MIs, 2= irregular shape MIs, 1*= ellipsoidal shape on microlites.
Sample 4-A14 4-A16 4-A34 4-B15 4-B16 4-B23
Shape 1 1 1 2 1 1
SiO2 50.538 49.966 49.763 50.072 49.67 49.218
TiO2 1.48 1.456 1.644 1.444 1.572 1.525
Cr2O3 0.027 0 0.048 0 0 0.009
Al2O3 17.729 19.168 20.199 19.249 19.88 20.727
FeO* 8.575 7.827 6.77 7.007 7.09 6.589 MnO 0.117 0.146 0.124 0.102 0.084 0.074 MgO 6.25 5.635 4.524 5.857 4.762 4.819 CaO 9.943 10.253 10.983 10.476 10.68 11.03
Na2O 3.6 3.748 4.104 3.887 4.212 4.003
K2O 1.389 1.419 1.454 1.416 1.601 1.507
P2O5 0.352 0.382 0.39 0.49 0.449 0.499
H2O 1.941 0.721 1.678 1.813 1.833 0.914
Total 98.059 99.279 98.322 98.187 98.167 99.086 % PEC 11.56 9.62 7.01 9.42 8.4 8.07
#Mg 64.838 64.469 62.914 67.957 63.174 64.914
Sample 4-D31 4-D41 4-01-d 4-02-d 4-03-d 4-04-d
Shape 2 2 2 2 2 2
SiO2 50.06 49.76 49.9 50.16 50.15 50.1
TiO2 1.56 1.53 1.43 1.31 1.5 1.43
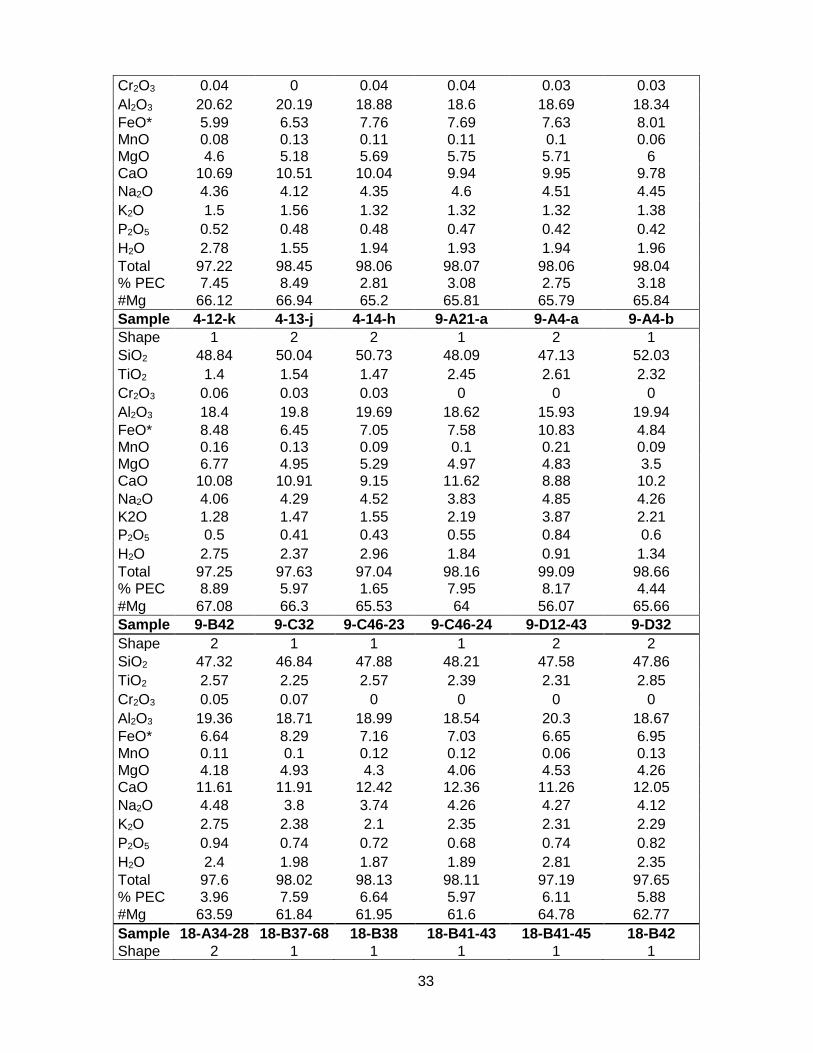
33
Cr2O3 0.04 0 0.04 0.04 0.03 0.03
Al2O3 20.62 20.19 18.88 18.6 18.69 18.34
FeO* 5.99 6.53 7.76 7.69 7.63 8.01 MnO 0.08 0.13 0.11 0.11 0.1 0.06 MgO 4.6 5.18 5.69 5.75 5.71 6 CaO 10.69 10.51 10.04 9.94 9.95 9.78
Na2O 4.36 4.12 4.35 4.6 4.51 4.45
K2O 1.5 1.56 1.32 1.32 1.32 1.38
P2O5 0.52 0.48 0.48 0.47 0.42 0.42
H2O 2.78 1.55 1.94 1.93 1.94 1.96
Total 97.22 98.45 98.06 98.07 98.06 98.04 % PEC 7.45 8.49 2.81 3.08 2.75 3.18
#Mg 66.12 66.94 65.2 65.81 65.79 65.84
Sample 4-12-k 4-13-j 4-14-h 9-A21-a 9-A4-a 9-A4-b
Shape 1 2 2 1 2 1
SiO2 48.84 50.04 50.73 48.09 47.13 52.03
TiO2 1.4 1.54 1.47 2.45 2.61 2.32
Cr2O3 0.06 0.03 0.03 0 0 0
Al2O3 18.4 19.8 19.69 18.62 15.93 19.94
FeO* 8.48 6.45 7.05 7.58 10.83 4.84 MnO 0.16 0.13 0.09 0.1 0.21 0.09 MgO 6.77 4.95 5.29 4.97 4.83 3.5 CaO 10.08 10.91 9.15 11.62 8.88 10.2
Na2O 4.06 4.29 4.52 3.83 4.85 4.26
K2O 1.28 1.47 1.55 2.19 3.87 2.21
P2O5 0.5 0.41 0.43 0.55 0.84 0.6
H2O 2.75 2.37 2.96 1.84 0.91 1.34
Total 97.25 97.63 97.04 98.16 99.09 98.66 % PEC 8.89 5.97 1.65 7.95 8.17 4.44
#Mg 67.08 66.3 65.53 64 56.07 65.66
Sample 9-B42 9-C32 9-C46-23 9-C46-24 9-D12-43 9-D32
Shape 2 1 1 1 2 2
SiO2 47.32 46.84 47.88 48.21 47.58 47.86
TiO2 2.57 2.25 2.57 2.39 2.31 2.85
Cr2O3 0.05 0.07 0 0 0 0
Al2O3 19.36 18.71 18.99 18.54 20.3 18.67
FeO* 6.64 8.29 7.16 7.03 6.65 6.95 MnO 0.11 0.1 0.12 0.12 0.06 0.13 MgO 4.18 4.93 4.3 4.06 4.53 4.26 CaO 11.61 11.91 12.42 12.36 11.26 12.05
Na2O 4.48 3.8 3.74 4.26 4.27 4.12
K2O 2.75 2.38 2.1 2.35 2.31 2.29
P2O5 0.94 0.74 0.72 0.68 0.74 0.82
H2O 2.4 1.98 1.87 1.89 2.81 2.35
Total 97.6 98.02 98.13 98.11 97.19 97.65 % PEC 3.96 7.59 6.64 5.97 6.11 5.88
#Mg 63.59 61.84 61.95 61.6 64.78 62.77
Sample 18-A34-28 18-B37-68 18-B38 18-B41-43 18-B41-45 18-B42
Shape 2 1 1 1 1 1
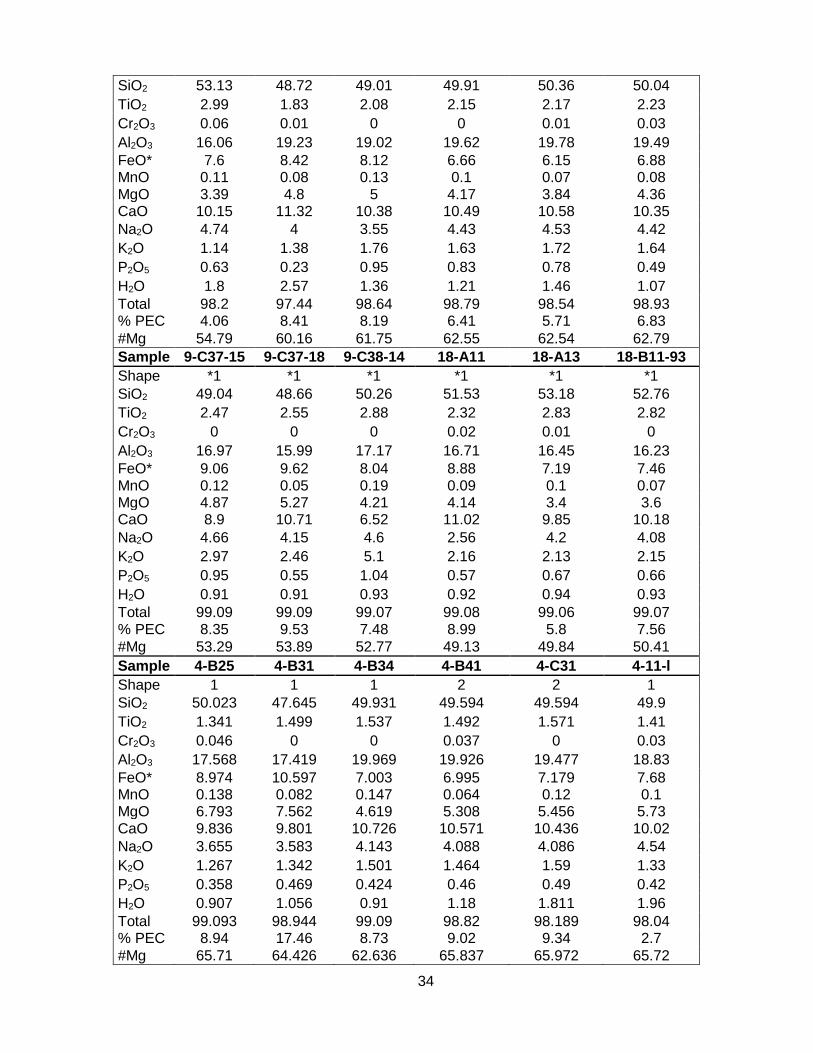
34
SiO2 53.13 48.72 49.01 49.91 50.36 50.04
TiO2 2.99 1.83 2.08 2.15 2.17 2.23
Cr2O3 0.06 0.01 0 0 0.01 0.03
Al2O3 16.06 19.23 19.02 19.62 19.78 19.49
FeO* 7.6 8.42 8.12 6.66 6.15 6.88 MnO 0.11 0.08 0.13 0.1 0.07 0.08 MgO 3.39 4.8 5 4.17 3.84 4.36 CaO 10.15 11.32 10.38 10.49 10.58 10.35
Na2O 4.74 4 3.55 4.43 4.53 4.42
K2O 1.14 1.38 1.76 1.63 1.72 1.64
P2O5 0.63 0.23 0.95 0.83 0.78 0.49
H2O 1.8 2.57 1.36 1.21 1.46 1.07
Total 98.2 97.44 98.64 98.79 98.54 98.93 % PEC 4.06 8.41 8.19 6.41 5.71 6.83
#Mg 54.79 60.16 61.75 62.55 62.54 62.79
Sample 9-C37-15 9-C37-18 9-C38-14 18-A11 18-A13 18-B11-93
Shape *1 *1 *1 *1 *1 *1
SiO2 49.04 48.66 50.26 51.53 53.18 52.76
TiO2 2.47 2.55 2.88 2.32 2.83 2.82
Cr2O3 0 0 0 0.02 0.01 0
Al2O3 16.97 15.99 17.17 16.71 16.45 16.23
FeO* 9.06 9.62 8.04 8.88 7.19 7.46 MnO 0.12 0.05 0.19 0.09 0.1 0.07 MgO 4.87 5.27 4.21 4.14 3.4 3.6 CaO 8.9 10.71 6.52 11.02 9.85 10.18
Na2O 4.66 4.15 4.6 2.56 4.2 4.08
K2O 2.97 2.46 5.1 2.16 2.13 2.15
P2O5 0.95 0.55 1.04 0.57 0.67 0.66
H2O 0.91 0.91 0.93 0.92 0.94 0.93
Total 99.09 99.09 99.07 99.08 99.06 99.07 % PEC 8.35 9.53 7.48 8.99 5.8 7.56
#Mg 53.29 53.89 52.77 49.13 49.84 50.41
Sample 4-B25 4-B31 4-B34 4-B41 4-C31 4-11-l
Shape 1 1 1 2 2 1
SiO2 50.023 47.645 49.931 49.594 49.594 49.9
TiO2 1.341 1.499 1.537 1.492 1.571 1.41
Cr2O3 0.046 0 0 0.037 0 0.03
Al2O3 17.568 17.419 19.969 19.926 19.477 18.83
FeO* 8.974 10.597 7.003 6.995 7.179 7.68 MnO 0.138 0.082 0.147 0.064 0.12 0.1 MgO 6.793 7.562 4.619 5.308 5.456 5.73 CaO 9.836 9.801 10.726 10.571 10.436 10.02
Na2O 3.655 3.583 4.143 4.088 4.086 4.54
K2O 1.267 1.342 1.501 1.464 1.59 1.33
P2O5 0.358 0.469 0.424 0.46 0.49 0.42
H2O 0.907 1.056 0.91 1.18 1.811 1.96
Total 99.093 98.944 99.09 98.82 98.189 98.04 % PEC 8.94 17.46 8.73 9.02 9.34 2.7
#Mg 65.71 64.426 62.636 65.837 65.972 65.72

35
Sample 4-05-d 4-07-i 4-08-a 4-09-a 9-B31-81 9-B31-79
Shape 2 2 2 2 1 2
SiO2 50.02 48.83 49.19 48.84 46.18 49.59
TiO2 1.4 1.43 1.41 1.41 2.46 2.43
Cr2O3 0.01 0 0.02 0.02 0 0
Al2O3 18.18 16.22 18.65 19.48 19.32 18.55
FeO* 8.09 10.31 8.25 8.3 8.13 6.91 MnO 0.18 0.21 0.12 0.11 0.14 0.18 MgO 6.06 7.91 5.61 6.04 4.79 3.44 CaO 9.83 9.16 10.01 10.27 11.59 8.13
Na2O 4.47 4.03 4.72 3.7 4.1 5.7
K2O 1.38 1.5 1.61 1.44 2.5 4.1
P2O5 0.39 0.38 0.42 0.38 0.79 0.96
H2O 1.94 1.34 2.42 2.87 2.74 0.95
Total 98.06 98.66 97.59 97.13 97.26 99.05 % PEC 3.28 10.22 3.52 6.21 9.29 5.13
#Mg 65.86 66.43 63.89 64.68 61.69 58.67
Sample 9-A43 9-A45-107 9-B31-77 18-A24-9 18-A32 18-D24-114
Shape 2 1 2 2 2 *1
SiO2 45.95 46.16 49.66 48.44 52.03 58.28
TiO2 2.39 2.4 2.51 2.04 2.14 2.18
Cr2O3 0.01 0.06 0 0.05 0 0.01
Al2O3 19.19 19.42 18.25 19.34 15.9 18.32
FeO* 8.3 8.02 7.17 8.71 8.56 4.7 MnO 0.13 0.14 0.14 0.1 0.06 0.08 MgO 5.02 4.63 3.1 6.09 5.3 1.45 CaO 11.83 11.82 8.5 9.28 9.27 2.56
Na2O 3.98 4.1 5.44 4.34 2.38 5.28
K2O 2.44 2.48 4.1 1.04 3.38 6.12
P2O5 0.76 0.77 1.13 0.57 0.97 1.01
H2O 2.8 1.85 1.78 1.06 1.79 1.96
Total 97.2 98.15 98.22 98.94 98.21 98.04 % PEC 6.63 7.41 5.31 11.37 9.96 1.7
#Mg 62.32 61.24 55.2 59.13 62.77 39.39
Sample 18-A21 18-A24-7 18-A24-8 18-D22-116 18-D22-118 4-C26
Shape 1 2 1 2 2 *1
SiO2 50.36 48.73 49.15 49.89 52.97 53.93
TiO2 2.31 1.83 2.03 2.17 2.28 2.22
Cr2O3 0 0.02 0.04 0.06 0 0
Al2O3 20.98 19.01 19.6 18.61 19.9 17.34
FeO* 5.95 8.74 8.43 7.24 5.01 5.39 MnO 0.07 0.14 0.1 0.1 0.12 0.09 MgO 3.3 5.21 4.79 4.58 3.07 2.49 CaO 9.42 10.85 9.75 10.84 9.44 8.27
Na2O 5.07 3.86 4.61 4.15 4.7 5.65
K2O 1.86 1.11 1.04 1.63 1.92 4.02
P2O5 0.67 0.5 0.46 0.74 0.59 0.58
H2O 1.41 1.13 0.94 1.12 1.86 1.91
Total 98.59 98.87 99.06 98.88 98.14 98.09

36
% PEC 3.59 5.82 6.08 6.34 2.03 4.76
#Mg 60.28 61.71 60.59 62.92 61.84 49.98
Sample 18-C11 18-C22 18-B43 3-C𝟕𝜶 3-C𝟏𝟑𝜶 Shape 1 1 *1 3 3 SiO2 49.01 49.59 53.87 48.08 46.63 TiO2 1.98 2.07 3.05 2.51 2.16 Cr2O3 0.01 0.00 0.04 0.00 0.04 Al2O3 18.88 19.05 16.1 12.10 13.05 FeO* 8.55 7.6 6.64 9.51 9.49 MnO 0.13 0.07 0.15 0.06 0.10 MgO 5.06 4.65 2.79 9.65 8.68 CaO 10.87 10.36 9.91 11.64 13.66 Na2O 3.44 4.29 4.28 2.47 2.42 K2O 1.56 1.73 2.41 1.69 1.23 P2O5 0.51 0.59 0.76 0.43 0.48 H2O 0.92 1.28 0.95 1.7 1.92 Total 99.08 98.72 99.05 98.3 98.08 % PEC 8.15 7.73 4.82 12.05 0.4 #Mg 60.81 62.07 47.05 68.25 66.04
According to the TAS diagram (Fig. 14), 54 analyzed type-I MIs normalized 100% water-free can
be classified as basanite and trachybasalt andesite (46.0 - 53.1 wt.% SiO2, 4.9-9.8 wt% alkali),
with the majority falling in the trachybasalt field following an alkaline affinity.
The Composition of MIs from Puyu 4 and Puyu 18 follow a similar positive slope, while MIs from
Puyu9 display similar amount of silica but higher contents of alkali, following a different chemical
evolution. Groundmass glasses have higher alkalis (9.5-12.4 wt. %) and higher SiO2 (47.3-61.5
wt. %) than MIs, suggesting that extensive crystallization occurred after melt inclusion entrapment.
Bulk rocks in general contain less silica and alkali than MIs (Fig. 14.b), and are located on the
most primitive extreme of the evolution trend. The greater difference between MIs and bulk rock
composition can be observed in Puyu 9.

37
Fig. 14: TAS (Total alkalis v/s silica Le Bas et al., 1986) classification diagram. Dotted curve divides the alkaline and sub-alkaline fields (Irvine and Baragar, 1971).a) Bulk rock analysis from Gonzalez-Ferran et al. (1994). (b) Detail of the trachy basalt field.
According to the location of MEC, and considering the distinction in groups of cones made by
Gonzalez-Ferran et al. (1994), Puyu 9, which belongs to the northern alignment, has a similar
chemistry as Group 1 (but with less silica), while Puyu 3, 4 and 18, belonging to the southern
lineament, show similarities with Group 2 (straddling more between the alkaline and calc-alkaline
fields). In terms of silica, MIs have a greater range of variability than bulk rock, reflecting their
trapping throughout the magmatic evolution.
Data from non-recalculated MIs show much lower MgO content than the bulk rock (1.05 - 4.71 wt.
% and 7.95 - 8.53 wt.% respectively), which may indicate an important Ol crystallization at the
host-inclusion interface, or a change in the magmatic conditions not reflected in the analyzed
inclusions.
Concentrations of MgO in PEC corrected MIs range from 3.07 to 7.91 wt. %, showing an increase
of 177.5% and #Mg of PEC-corrected MI range from 54.8 to 68. Despite this increase of MgO in
MIs achieved by PEC correction, those contents are still lower than bulk rock ones, which could
indicate a certain evolution in the composition of magma during the eruption of the monogenetic
cones.
The grouping of MIs by shape is not very noticeable and most irregular inclusions have a
composition similar to those with an oval shape.
b

38
Fig. 15: Harker diagram of MgO v/s total FeO (calculated as FeO*=FeO+Fe2O3/1.11). a) Bulk rock analysis from Gonzalez-Ferran et al. (1994). *MIs: corresponds to data of MI without recalculation.* 4-9-18: correspond to the inclusions of each MEC modeled according to the host Fo %. The yellow area represents the compositional track from primitive MI and to groundmass glass.
In Fig. 15, we plotted bulk rock analysis from Gonzalez-Ferran et al. (1994) and we can observe
that the distinction in north and south lineaments groups determined by the authors is not clear in
terms of the bulk rock Fe content of our samples. Defining an evolution path from Puyu 4 MIs with
higher FeO and MgO content to the groundmass glass composition (yellow field, Fig. 15), most
MIs fall in the area of most differentiated composition, and although PEC corrected MIs display a
similar slope, the majority falls below this area, suggesting a possible loss of FeO in inclusions.
Data from Puyu 18 and 9 show some overlapping, and Puyu 4 MIs display higher MgO contents.

39
Fig. 16: Harker diagrams of major elements variation (wt. %) versus Mg#, Circles= oval shaped MI. Diamonds= irregular MI. Triangle= recrystallized MI. Square= Bulk rock data. Yellow= Puyu3, Green=Puyu18, Blue=Puyu9, Magenta= Puyu4.
To better visualize the trend of MI according to the crystallization path, we plotted major elements
vs Mg# (Fig. 16). Puyu 4, in addition of containing Ol with the highest forsterite content, also
contains MI with the highest Mg# values. The Al2O3 content follows a negative slope, from the bulk
rock composition, with the aluminum content, higher in inclusions. In the MgO content a trend of
differentiation of MIs can be observed, with the amount in Puyu 9 and Puyu 18 being very close,
with respect to the FeO* content, in which the MIs follow a slight positive slope, i.e. the less the
amount of #Mg the greater the amount of FeO*. In the SiO2 diagram, we can observe clear groups
of MIs according to each MEC, and although the #Mg in Puyu18 and Puyu9 is similar, Puyu9 is
more silica unsaturated.
Puyu9 shows a particular composition, besides having a lower silica content; it has the highest
levels of TiO2, CaO and K2O, a characteristic that is repeated in the bulk rock data.

40
Calcium and sodium values tend to increase as #Mg decreases, which occurs because the
formation of plagioclase is late in the crystallization of magma, appearing more towards the end,
forming part of the groundmass.
We can observe that MIs showing extreme values correspond to MIs of irregular shape. In these
cases the crystallization of the host in the wall of the inclusion could be of greater proportion and
would have modified in a more important way the composition of the MIs. Oval shaped MIs of
Puyu 4 and the recrystallized MIs from Puyu 3 would be the most similar to the bulk rock
composition.
2.5.5 Trace elements
Puyuhuapi magmas have elevated incompatible elements (i.e., LILE, HFSE and REE) relative to
other SVZ calc-alkaline rocks (Hickey-Vargas et al., 2016; López-Escobar & Moreno, 1994) In
general, the incompatible trace element concentrations increase with increasing SiO2 content for
each sample, but in general, Puyu 9 has a higher incompatible content and a lower silica content.
Samples display similar primitive mantle-normalized patterns (Fig. 17), with high LREE/HREE
ratios, spider diagrams follow a typical trend for alkali magmas; they show enrichment in highly
incompatible trace elements (Cs, Ba, Rb and Th). It is repeated as positive Pb and K anomaly and
as a negative Nb anomaly, although to a lesser extent in Puyu 9. A slight negative Eu anomaly
can be observed that may have been in equilibrium with a plagioclase-bearing mantle source. The
relatively low concentrations of heavy REE suggests the presence of residual garnet in the source.
Ca rich clinopyroxene, generally have D < 1, with values for the light REE being slightly lower than
for the heavier REE, which may lead to light REE enrichment in the melt (Wilson, 1997).

41
Fig. 17: Primitive mantle normalized trace elements patterns for each sample; normalization factors were taken from Sun and McDonough (1989).
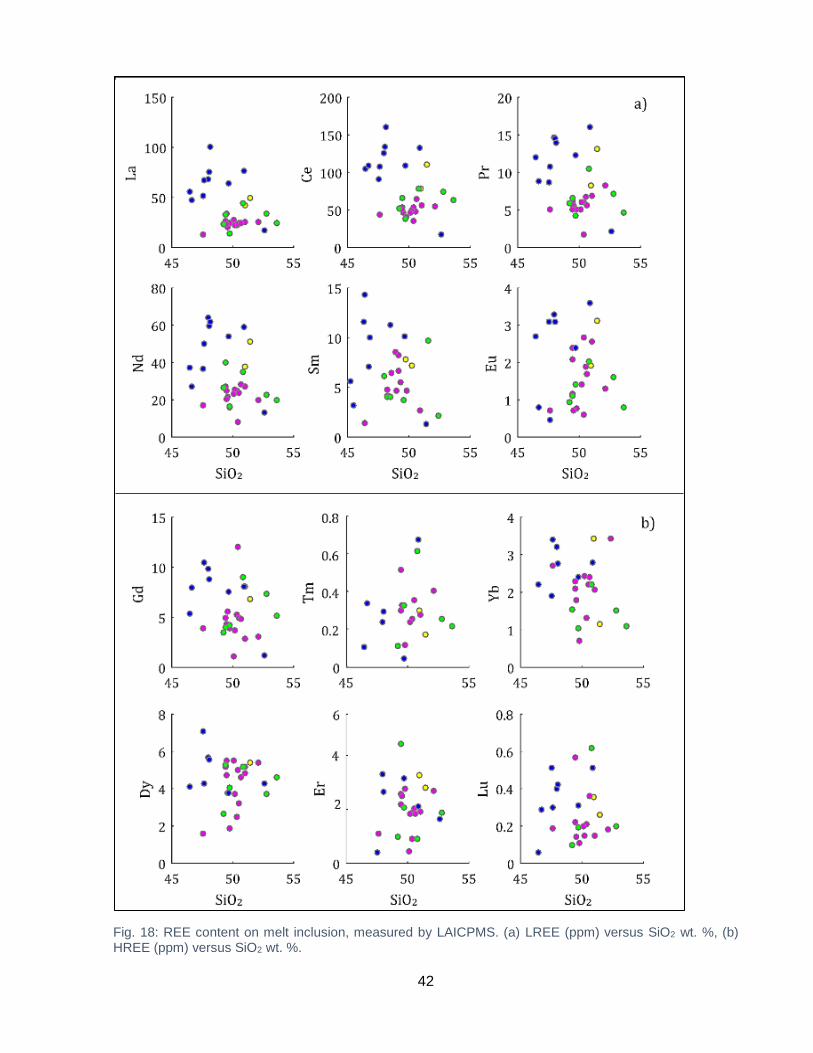
42
Fig. 18: REE content on melt inclusion, measured by LAICPMS. (a) LREE (ppm) versus SiO2 wt. %, (b) HREE (ppm) versus SiO2 wt. %.
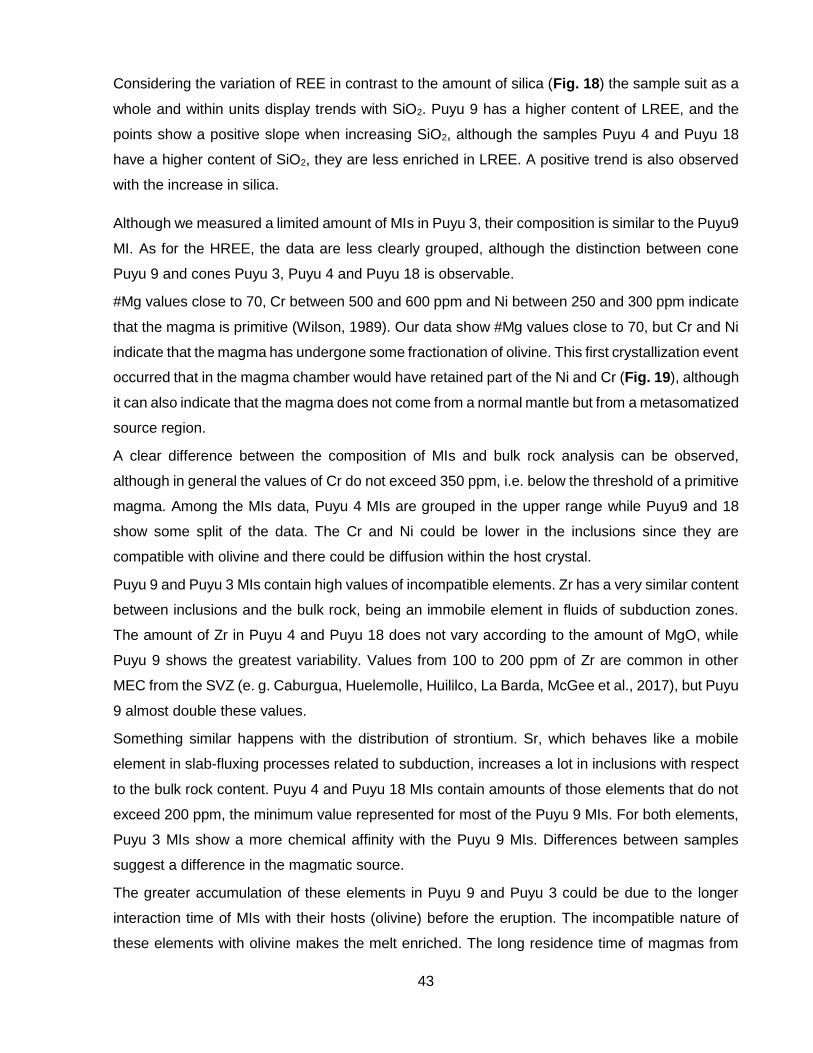
43
Considering the variation of REE in contrast to the amount of silica (Fig. 18) the sample suit as a
whole and within units display trends with SiO2. Puyu 9 has a higher content of LREE, and the
points show a positive slope when increasing SiO2, although the samples Puyu 4 and Puyu 18
have a higher content of SiO2, they are less enriched in LREE. A positive trend is also observed
with the increase in silica.
Although we measured a limited amount of MIs in Puyu 3, their composition is similar to the Puyu9
MI. As for the HREE, the data are less clearly grouped, although the distinction between cone
Puyu 9 and cones Puyu 3, Puyu 4 and Puyu 18 is observable.
#Mg values close to 70, Cr between 500 and 600 ppm and Ni between 250 and 300 ppm indicate
that the magma is primitive (Wilson, 1989). Our data show #Mg values close to 70, but Cr and Ni
indicate that the magma has undergone some fractionation of olivine. This first crystallization event
occurred that in the magma chamber would have retained part of the Ni and Cr (Fig. 19), although
it can also indicate that the magma does not come from a normal mantle but from a metasomatized
source region.
A clear difference between the composition of MIs and bulk rock analysis can be observed,
although in general the values of Cr do not exceed 350 ppm, i.e. below the threshold of a primitive
magma. Among the MIs data, Puyu 4 MIs are grouped in the upper range while Puyu9 and 18
show some split of the data. The Cr and Ni could be lower in the inclusions since they are
compatible with olivine and there could be diffusion within the host crystal.
Puyu 9 and Puyu 3 MIs contain high values of incompatible elements. Zr has a very similar content
between inclusions and the bulk rock, being an immobile element in fluids of subduction zones.
The amount of Zr in Puyu 4 and Puyu 18 does not vary according to the amount of MgO, while
Puyu 9 shows the greatest variability. Values from 100 to 200 ppm of Zr are common in other
MEC from the SVZ (e. g. Caburgua, Huelemolle, Huililco, La Barda, McGee et al., 2017), but Puyu
9 almost double these values.
Something similar happens with the distribution of strontium. Sr, which behaves like a mobile
element in slab-fluxing processes related to subduction, increases a lot in inclusions with respect
to the bulk rock content. Puyu 4 and Puyu 18 MIs contain amounts of those elements that do not
exceed 200 ppm, the minimum value represented for most of the Puyu 9 MIs. For both elements,
Puyu 3 MIs show a more chemical affinity with the Puyu 9 MIs. Differences between samples
suggest a difference in the magmatic source.
The greater accumulation of these elements in Puyu 9 and Puyu 3 could be due to the longer
interaction time of MIs with their hosts (olivine) before the eruption. The incompatible nature of
these elements with olivine makes the melt enriched. The long residence time of magmas from
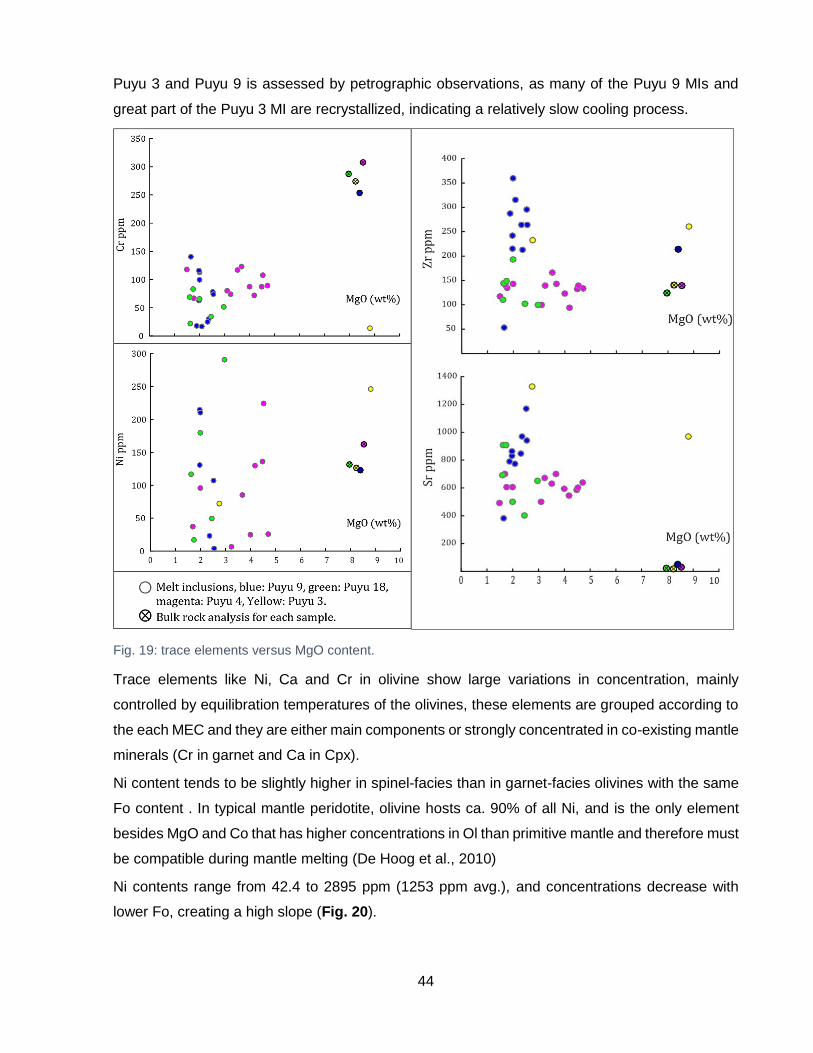
44
Puyu 3 and Puyu 9 is assessed by petrographic observations, as many of the Puyu 9 MIs and
great part of the Puyu 3 MI are recrystallized, indicating a relatively slow cooling process.
Fig. 19: trace elements versus MgO content.
Trace elements like Ni, Ca and Cr in olivine show large variations in concentration, mainly
controlled by equilibration temperatures of the olivines, these elements are grouped according to
the each MEC and they are either main components or strongly concentrated in co-existing mantle
minerals (Cr in garnet and Ca in Cpx).
Ni content tends to be slightly higher in spinel-facies than in garnet-facies olivines with the same
Fo content . In typical mantle peridotite, olivine hosts ca. 90% of all Ni, and is the only element
besides MgO and Co that has higher concentrations in Ol than primitive mantle and therefore must
be compatible during mantle melting (De Hoog et al., 2010)
Ni contents range from 42.4 to 2895 ppm (1253 ppm avg.), and concentrations decrease with
lower Fo, creating a high slope (Fig. 20).

45
The highest Ni levels were measured at the center of Ol and the lowets at the rim of Puyu9 and
Puyu18, Puyu3 displays a a continuous decrease, between rim and center points.
Chrome contents range from 1.37 to 1050 ppm (238.9 ppm avg.) discarding data out of range.
There is no clear difference between points analyzed at the center of the crystals and those at the
edge. In Puyu9 and Puyu18, we can distinguish two families of data showing an increase of Cr in
more fayalitic rims.
Calcium values range from 809.8 to 4044 ppm (1854.1 ppm avg) and are the opposite of what is
expected, as the amounts of calcium at the rim are greater than those measured at the cores.
Puyu9 has the highest levels, as in the MIs. In Puyu 4 olivines followig this trend are also observed
but limited to the Mg#, suggesting that the magma had a shorter residence time in the crust, and
the growth of the crystals was limited by the triggering of the eruption.
2.5.6 Raman CO2 densities
Fifty bubbles were analyzed by Raman spectroscopy, of which 23 have detectable CO2 (i.e., a
Fermi diad is present in the Raman spectrum). Thirteen from Puyu 4, four from Puyu 18 and six
Fig. 20: Trace elemennts contents on Ol phenocrysts. Measured by Electro micro-probe analizer.
46
from Puyu 9. First, the percentage of volume occupied by the bubbles with respect to each MI was
measured to determine the range in which there is a linear relationship between MI and bubble
volume. This procedure is applied to get a range in which MIs contain the same volume proportion
as vapor, suggesting that MIs trapped only melt and that the bubbles were generated in the MIs
after trapping (Moore et al., 2015).
Fig. 21: Boxplot diagrams for bubble volume/ MI volume percentage.
Fig. 21 shows the volume percentage data distribution for each MEC. The outlier data were
discarded, since these phenocrysts may have trapped a mixture of melt and vapor, and the
proportion of those volatiles would not represent those that were originally dissolved in the magma.
It is possible to notice that the values are similar for the different cones, with Puyu 9 being the one
with slightly higher values.
To reconstruct the original dissolved CO2 concentrations of the melt inclusions at the time of
trapping, the amount of CO2 in the melt inclusion glass and the bubble must be known. Calculated
CO2 densities are converted to mass using the melt inclusion volume that is occupied by the vapor
bubble. In this case, the CO2 content of the glass is not known. If we assume that the glass
contains 0 ppm CO2, a minimum CO2 content for the MI can be determined by adding the CO2 in
the bubble into the glass, using the relative volume proportions of bubble and glass determined
previously and the magma density.
In several previous studies (e.g. Moore et al., 2015; Shaw et al., 2008; Wallace et al., 2015)
bubbles typically contain 40 to 90% of the total CO2 in the MI. The reconstructed CO2 content
based on some finite amount of CO2 in the glass is equal to the CO2 content estimated by
assuming that the glass contains no CO2, plus the finite amount of CO2 that is assumed for the
glass because of the simplifying assumption that the mass of the bubble is negligible compared
to the mass of the glass.
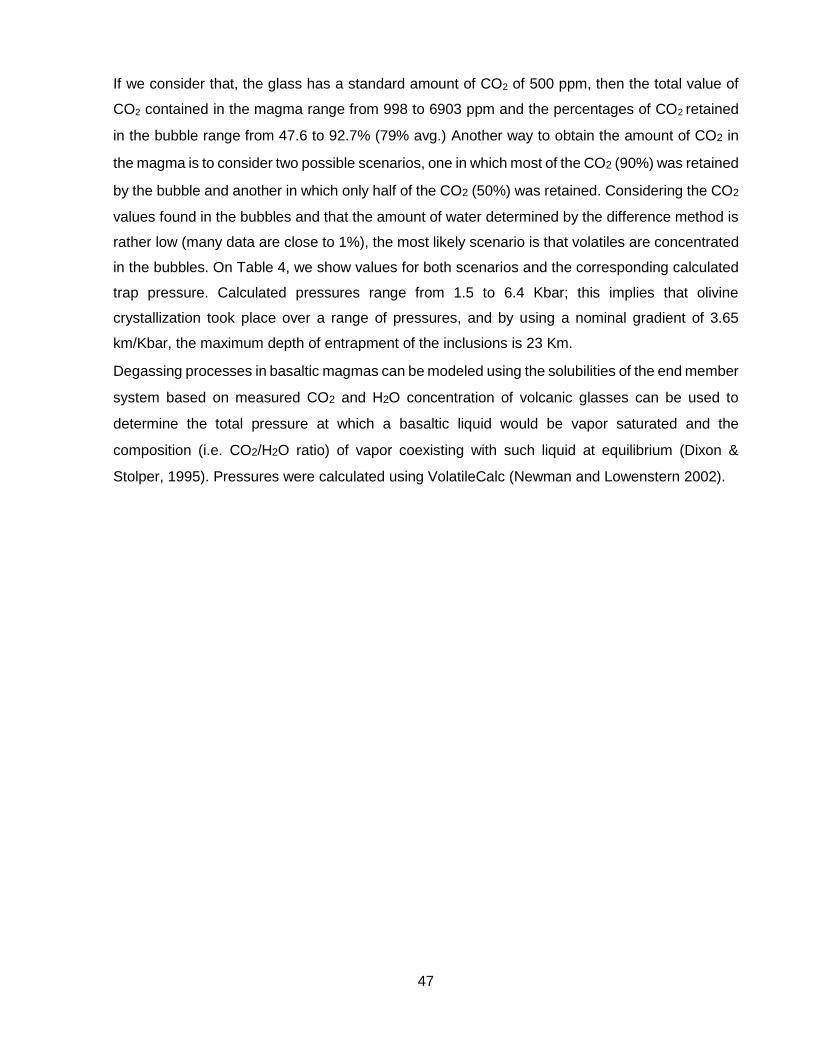
47
If we consider that, the glass has a standard amount of CO2 of 500 ppm, then the total value of
CO2 contained in the magma range from 998 to 6903 ppm and the percentages of CO2 retained
in the bubble range from 47.6 to 92.7% (79% avg.) Another way to obtain the amount of CO2 in
the magma is to consider two possible scenarios, one in which most of the CO2 (90%) was retained
by the bubble and another in which only half of the CO2 (50%) was retained. Considering the CO2
values found in the bubbles and that the amount of water determined by the difference method is
rather low (many data are close to 1%), the most likely scenario is that volatiles are concentrated
in the bubbles. On Table 4, we show values for both scenarios and the corresponding calculated
trap pressure. Calculated pressures range from 1.5 to 6.4 Kbar; this implies that olivine
crystallization took place over a range of pressures, and by using a nominal gradient of 3.65
km/Kbar, the maximum depth of entrapment of the inclusions is 23 Km.
Degassing processes in basaltic magmas can be modeled using the solubilities of the end member
system based on measured CO2 and H2O concentration of volcanic glasses can be used to
determine the total pressure at which a basaltic liquid would be vapor saturated and the
composition (i.e. CO2/H2O ratio) of vapor coexisting with such liquid at equilibrium (Dixon &
Stolper, 1995). Pressures were calculated using VolatileCalc (Newman and Lowenstern 2002).

48
Table 4: Reconstructed CO2 concentrations of MI and calculated trapping pressures. ** Calculated pressures considering that the bubble retains 50% of the CO2, ** Calculated pressures considering that the bubble retains 90% of the CO2. In both cases, pressures were calculated using VolatileCalc (Newman and Lowenstern 2002). Depths were calculated using a nominal gradient of 3.65 km/Kbar.
MEC Inclusion Mass of CO2
in glass* (ppm)
Mass of CO2 total*
(ppm)
P* (Kbar)
Depth* (km)
Mass of CO2 in glass** (ppm)
Mass of CO2 total** (ppm)
P** (Kbar)
Depth** (km)
4 Puyu4-b 498 996 2.4 9 55 553 1.6 6
4 Puyu4-c-1 2306 4612 7.6 28 256 2562 4.9 18
4 Puyu4-c-2 1375 2751 5.2 19 153 1528 3.3 12
4 Puyu4-e 2947 5893 8.9 33 327 3274 5.9 22
4 Puyu4-f-3 4374 8748 7.6 28 486 4860 5.1 19
4 Puyu4-a-1 1731 3463 4.7 17 192 1924 3.1 11
4 Puyu4-l-1 2629 5257 7.8 29 292 2921 5.1 19
4 Puyu4-l-2 3155 6309 8.8 32 351 3505 5.9 21
4 Puyu4-l-3 1005 2011 3.9 14 112 1117 2.5 9
4 Puyu4-k 1086 2172 3.2 12 121 1207 2.0 7
4 Puyu4-i-1 3348 6696 9.0 33 372 3720 5.9 22
4 Puyu4-i-2 2105 4209 6.5 24 234 2338 4.2 15
18 C7-1 454 908 2.2 8 50 505 1.5 5
18 C2 3567 7134 8.9 32 396 3963 5.9 22
18 C8-1 2025 4050 6.9 25 225 2250 4.5 16
18 C8-2 1750 3501 6.2 23 194 1945 4.0 15
9 B31 2629 5258 8.3 30 292 2921 5.1 19
9 C11 4222 8444 8.9 32 469 4691 5.9 22
9 C34 2765 5530 6.6 24 307 3072 4.3 16
9 C41 1386 2772 4.0 15 154 1540 2.5 9
9 D33 3988 7975 9.6 35 443 4431 6.4 23
9 C43-1 6403 - - - 711 7115 5.2 19

49
2.5.7 Volatiles
We do not observe a clear pattern when CO2 content of MIs is plotted against the Fo content of
the host (Fig. 22) When comparing chlorine levels with host forsteritic content (Fig. 24), we can
observe that Puyu 9 and Puyu 4 have a relatively more degassed magma. The chemistry of
microlite hosted MIs, shows a slight increase in chlorine content, suggesting that the predominant
effect is magma crystallization and although the entrapment of glass in more Fe-rich microlites is
late, no important degassing is observed.
Fig. 22: model restored CO2 content in relation with the forsterite content of the olivine host.
From Fig. 23 it can be seen that the volatile content was slightly modified by PEC, being more
visible in Puyu9. In spite of this and giving a range of reliability for the water content of the
inclusions, it is possible to approximate the system as a closed degassing system in which the
loss of CO2 would be more important than the loss of water.
As for the water content (Fig. 25) we observe a similar trend, Puyu 4 and 9 have a similar volatile
content, with water contents decreasing successively, until the composition of the groundmass
glass, although chlorine levels on Puyu 18 increase, up to 0.7 wt. %.
Plots of the chlorine content versus K2O content (Fig. 26) show that there is a clear grouping of
data, where Puyu 9, as noted before has higher levels of K2O, along with the groundmass
composition of Puyu 18, which increases its K2O content, in a linear relationship with chlorine.
0
1000
2000
3000
4000
5000
6000
7000
8000
82 84 86 88
CO
2(p
pm
)
Fo host (mol%)
4 189
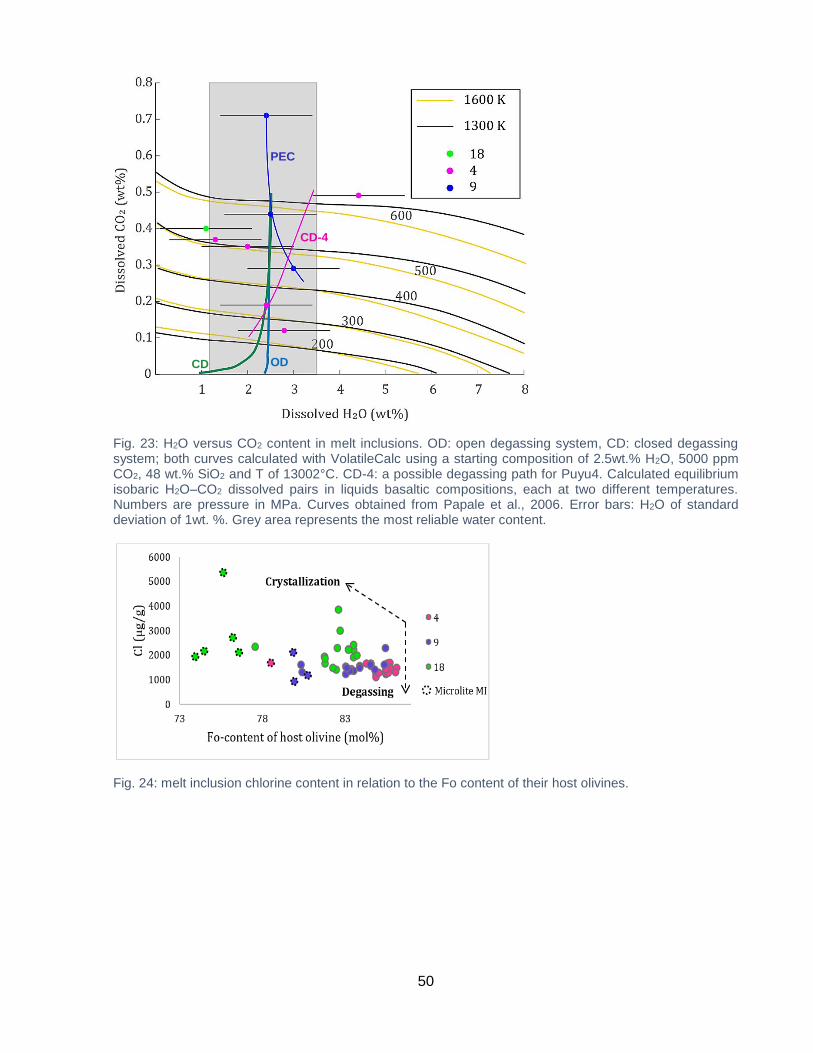
50
Fig. 23: H2O versus CO2 content in melt inclusions. OD: open degassing system, CD: closed degassing system; both curves calculated with VolatileCalc using a starting composition of 2.5wt.% H2O, 5000 ppm CO2, 48 wt.% SiO2 and T of 13002°C. CD-4: a possible degassing path for Puyu4. Calculated equilibrium isobaric H2O–CO2 dissolved pairs in liquids basaltic compositions, each at two different temperatures. Numbers are pressure in MPa. Curves obtained from Papale et al., 2006. Error bars: H2O of standard deviation of 1wt. %. Grey area represents the most reliable water content.
Fig. 24: melt inclusion chlorine content in relation to the Fo content of their host olivines.
OD CD
PEC
CD-4
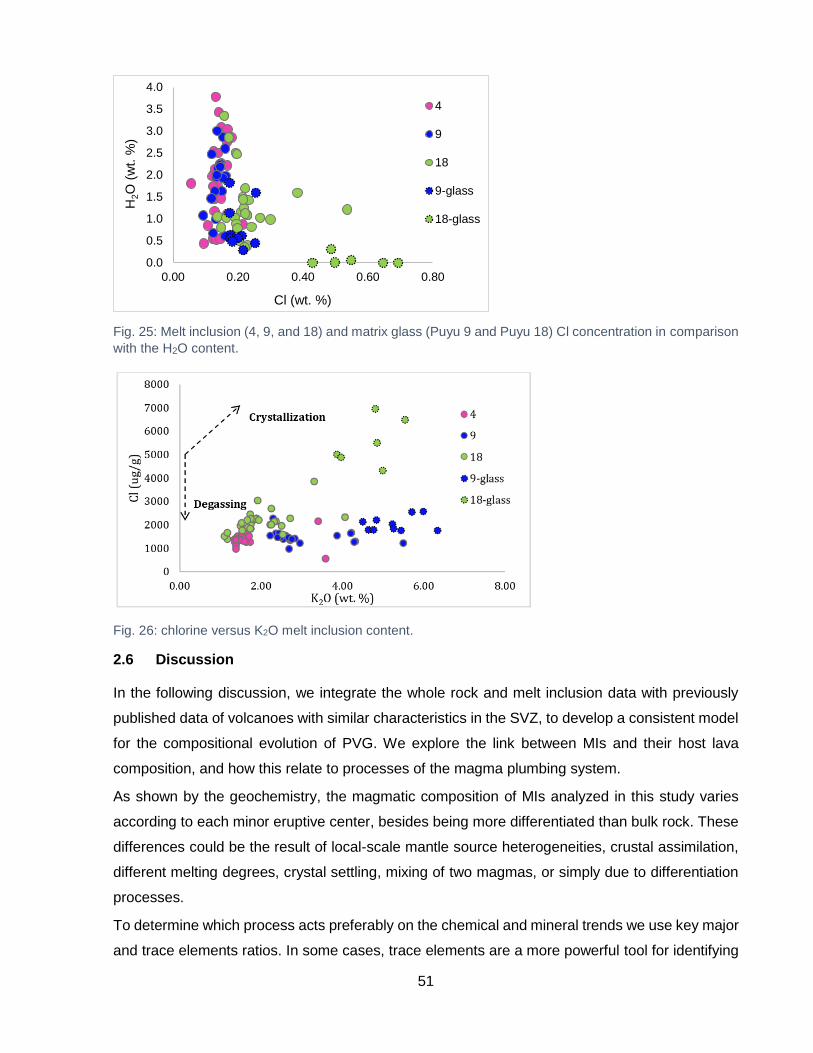
51
Fig. 25: Melt inclusion (4, 9, and 18) and matrix glass (Puyu 9 and Puyu 18) Cl concentration in comparison
with the H2O content.
Fig. 26: chlorine versus K2O melt inclusion content.
2.6 Discussion
In the following discussion, we integrate the whole rock and melt inclusion data with previously
published data of volcanoes with similar characteristics in the SVZ, to develop a consistent model
for the compositional evolution of PVG. We explore the link between MIs and their host lava
composition, and how this relate to processes of the magma plumbing system.
As shown by the geochemistry, the magmatic composition of MIs analyzed in this study varies
according to each minor eruptive center, besides being more differentiated than bulk rock. These
differences could be the result of local-scale mantle source heterogeneities, crustal assimilation,
different melting degrees, crystal settling, mixing of two magmas, or simply due to differentiation
processes.
To determine which process acts preferably on the chemical and mineral trends we use key major
and trace elements ratios. In some cases, trace elements are a more powerful tool for identifying
0.0
0.5
1.0
1.5
2.0
2.5
3.0
3.5
4.0
0.00 0.20 0.40 0.60 0.80
H2O
(w
t. %
)
Cl (wt. %)
4
9
18
9-glass
18-glass
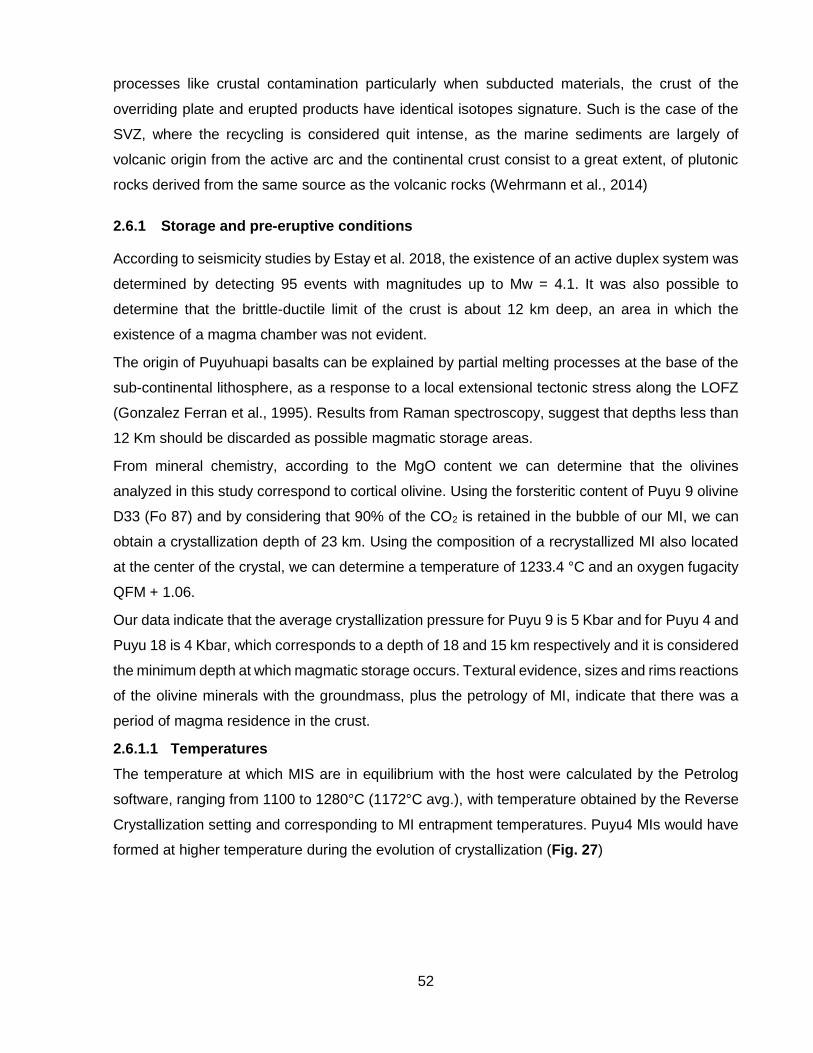
52
processes like crustal contamination particularly when subducted materials, the crust of the
overriding plate and erupted products have identical isotopes signature. Such is the case of the
SVZ, where the recycling is considered quit intense, as the marine sediments are largely of
volcanic origin from the active arc and the continental crust consist to a great extent, of plutonic
rocks derived from the same source as the volcanic rocks (Wehrmann et al., 2014)
2.6.1 Storage and pre-eruptive conditions
According to seismicity studies by Estay et al. 2018, the existence of an active duplex system was
determined by detecting 95 events with magnitudes up to Mw = 4.1. It was also possible to
determine that the brittle-ductile limit of the crust is about 12 km deep, an area in which the
existence of a magma chamber was not evident.
The origin of Puyuhuapi basalts can be explained by partial melting processes at the base of the
sub-continental lithosphere, as a response to a local extensional tectonic stress along the LOFZ
(Gonzalez Ferran et al., 1995). Results from Raman spectroscopy, suggest that depths less than
12 Km should be discarded as possible magmatic storage areas.
From mineral chemistry, according to the MgO content we can determine that the olivines
analyzed in this study correspond to cortical olivine. Using the forsteritic content of Puyu 9 olivine
D33 (Fo 87) and by considering that 90% of the CO2 is retained in the bubble of our MI, we can
obtain a crystallization depth of 23 km. Using the composition of a recrystallized MI also located
at the center of the crystal, we can determine a temperature of 1233.4 °C and an oxygen fugacity
QFM + 1.06.
Our data indicate that the average crystallization pressure for Puyu 9 is 5 Kbar and for Puyu 4 and
Puyu 18 is 4 Kbar, which corresponds to a depth of 18 and 15 km respectively and it is considered
the minimum depth at which magmatic storage occurs. Textural evidence, sizes and rims reactions
of the olivine minerals with the groundmass, plus the petrology of MI, indicate that there was a
period of magma residence in the crust.
2.6.1.1 Temperatures
The temperature at which MIS are in equilibrium with the host were calculated by the Petrolog
software, ranging from 1100 to 1280°C (1172°C avg.), with temperature obtained by the Reverse
Crystallization setting and corresponding to MI entrapment temperatures. Puyu4 MIs would have
formed at higher temperature during the evolution of crystallization (Fig. 27)
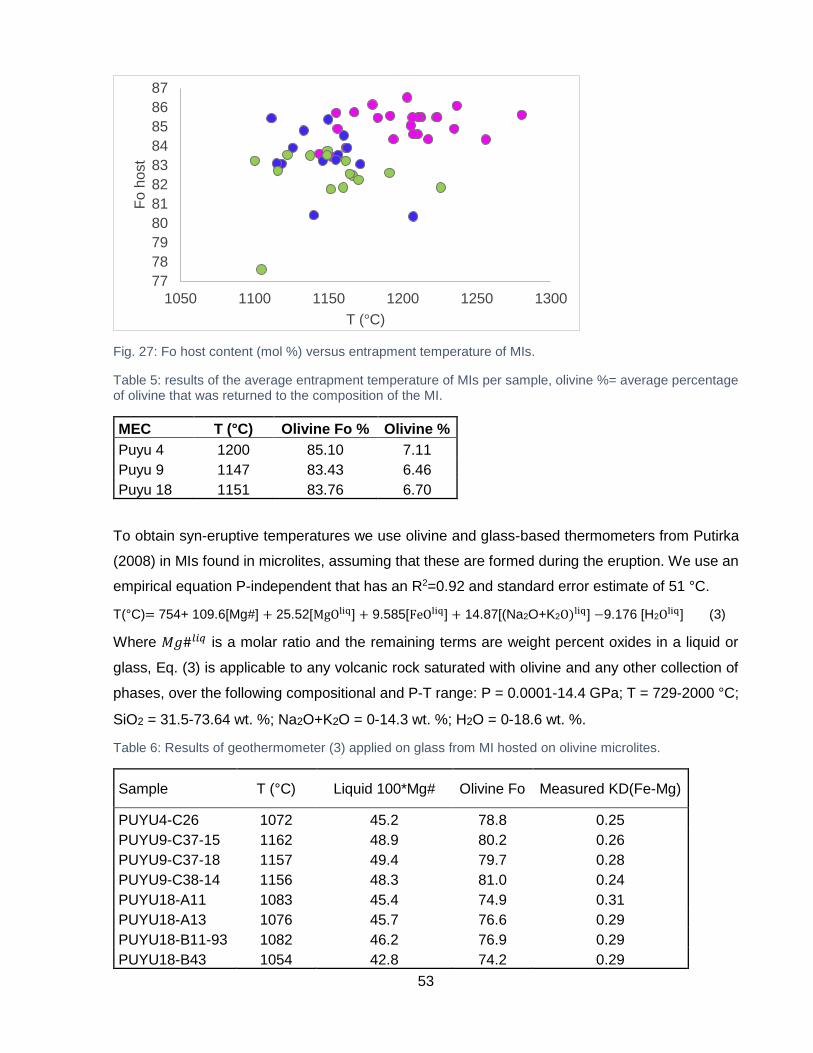
53
Fig. 27: Fo host content (mol %) versus entrapment temperature of MIs.
Table 5: results of the average entrapment temperature of MIs per sample, olivine %= average percentage of olivine that was returned to the composition of the MI.
MEC T (°C) Olivine Fo % Olivine %
Puyu 4 1200 85.10 7.11
Puyu 9 1147 83.43 6.46
Puyu 18 1151 83.76 6.70
To obtain syn-eruptive temperatures we use olivine and glass-based thermometers from Putirka
(2008) in MIs found in microlites, assuming that these are formed during the eruption. We use an
empirical equation P-independent that has an R2=0.92 and standard error estimate of 51 °C.
T(°C)= 754+ 109.6[Mg#] + 25.52[MgOliq] + 9.585[FeOliq] + 14.87[(Na2O+K2O)liq] −9.176 [H2Oliq] (3)
Where 𝑀𝑔#𝑙𝑖𝑞 is a molar ratio and the remaining terms are weight percent oxides in a liquid or
glass, Eq. (3) is applicable to any volcanic rock saturated with olivine and any other collection of
phases, over the following compositional and P-T range: P = 0.0001-14.4 GPa; T = 729-2000 °C;
SiO2 = 31.5-73.64 wt. %; Na2O+K2O = 0-14.3 wt. %; H2O = 0-18.6 wt. %.
Table 6: Results of geothermometer (3) applied on glass from MI hosted on olivine microlites.
Sample T (°C) Liquid 100*Mg# Olivine Fo Measured KD(Fe-Mg)
PUYU4-C26 1072 45.2 78.8 0.25
PUYU9-C37-15 1162 48.9 80.2 0.26
PUYU9-C37-18 1157 49.4 79.7 0.28
PUYU9-C38-14 1156 48.3 81.0 0.24
PUYU18-A11 1083 45.4 74.9 0.31
PUYU18-A13 1076 45.7 76.6 0.29
PUYU18-B11-93 1082 46.2 76.9 0.29
PUYU18-B43 1054 42.8 74.2 0.29
77
78
79
80
81
82
83
84
85
86
87
1050 1100 1150 1200 1250 1300
Fo h
ost
T (°C)
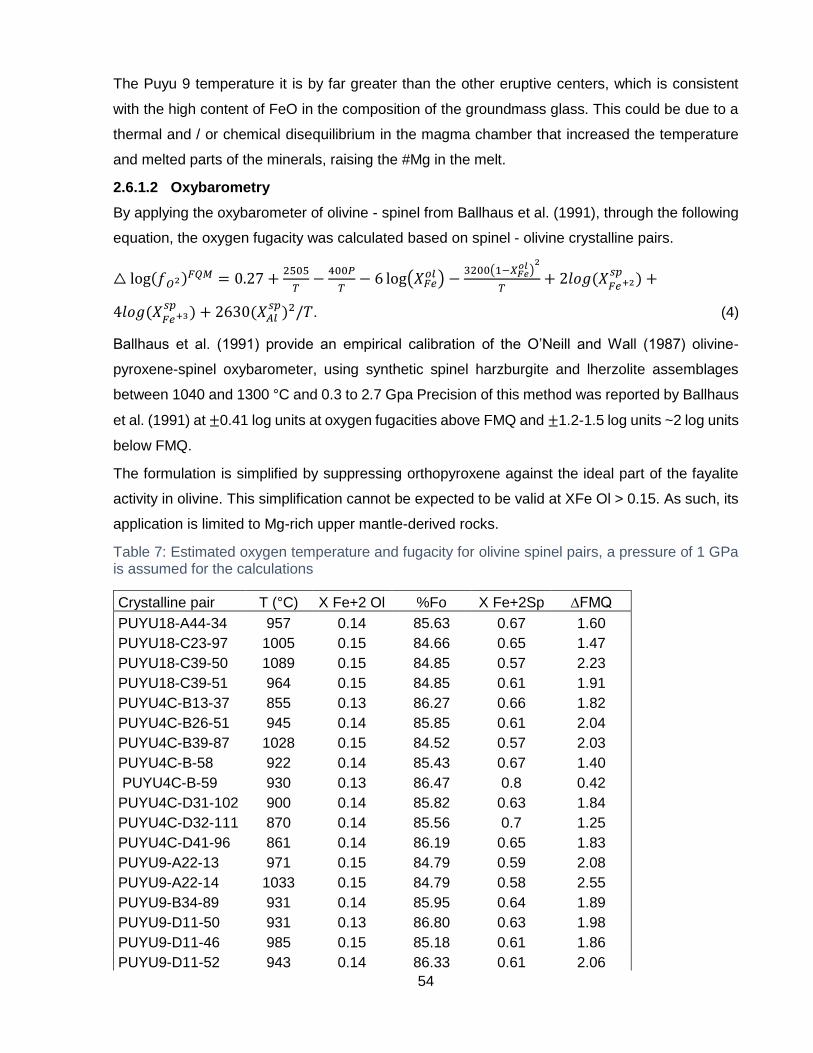
54
The Puyu 9 temperature it is by far greater than the other eruptive centers, which is consistent
with the high content of FeO in the composition of the groundmass glass. This could be due to a
thermal and / or chemical disequilibrium in the magma chamber that increased the temperature
and melted parts of the minerals, raising the #Mg in the melt.
2.6.1.2 Oxybarometry
By applying the oxybarometer of olivine - spinel from Ballhaus et al. (1991), through the following
equation, the oxygen fugacity was calculated based on spinel - olivine crystalline pairs.
△ log(𝑓𝑂2)𝐹𝑄𝑀 = 0.27 +2505
𝑇−
400𝑃
𝑇− 6 log(𝑋𝐹𝑒
𝑜𝑙 ) −3200(1−𝑋𝐹𝑒
𝑜𝑙 )2
𝑇+ 2𝑙𝑜𝑔(𝑋
𝐹𝑒+2𝑠𝑝
) +
4𝑙𝑜𝑔(𝑋𝐹𝑒+3𝑠𝑝
) + 2630(𝑋𝐴𝑙𝑠𝑝)2/𝑇. (4)
Ballhaus et al. (1991) provide an empirical calibration of the O’Neill and Wall (1987) olivine-
pyroxene-spinel oxybarometer, using synthetic spinel harzburgite and lherzolite assemblages
between 1040 and 1300 °C and 0.3 to 2.7 Gpa Precision of this method was reported by Ballhaus
et al. (1991) at ±0.41 log units at oxygen fugacities above FMQ and ±1.2-1.5 log units ~2 log units
below FMQ.
The formulation is simplified by suppressing orthopyroxene against the ideal part of the fayalite
activity in olivine. This simplification cannot be expected to be valid at XFe Ol > 0.15. As such, its
application is limited to Mg-rich upper mantle-derived rocks.
Table 7: Estimated oxygen temperature and fugacity for olivine spinel pairs, a pressure of 1 GPa is assumed for the calculations
Crystalline pair T (°C) X Fe+2 Ol %Fo X Fe+2Sp ∆FMQ
PUYU18-A44-34 957 0.14 85.63 0.67 1.60
PUYU18-C23-97 1005 0.15 84.66 0.65 1.47
PUYU18-C39-50 1089 0.15 84.85 0.57 2.23
PUYU18-C39-51 964 0.15 84.85 0.61 1.91
PUYU4C-B13-37 855 0.13 86.27 0.66 1.82
PUYU4C-B26-51 945 0.14 85.85 0.61 2.04
PUYU4C-B39-87 1028 0.15 84.52 0.57 2.03
PUYU4C-B-58 922 0.14 85.43 0.67 1.40
PUYU4C-B-59 930 0.13 86.47 0.8 0.42
PUYU4C-D31-102 900 0.14 85.82 0.63 1.84
PUYU4C-D32-111 870 0.14 85.56 0.7 1.25
PUYU4C-D41-96 861 0.14 86.19 0.65 1.83
PUYU9-A22-13 971 0.15 84.79 0.59 2.08
PUYU9-A22-14 1033 0.15 84.79 0.58 2.55
PUYU9-B34-89 931 0.14 85.95 0.64 1.89
PUYU9-D11-50 931 0.13 86.80 0.63 1.98
PUYU9-D11-46 985 0.15 85.18 0.61 1.86
PUYU9-D11-52 943 0.14 86.33 0.61 2.06

55
PUYU9-D13-40 976 0.15 84.80 0.58 2.03
Table 7, specifies the calculated values for the different crystalline pairs, the composition of spinel
inclusions in olivine was used to determine the oxygen fugacity, the calculated fO2 of PVG basalts
is 1.8 average log units above the QFM buffer (Fig. 28)
Fig. 28: oxygen fugacity according to the fayalite-quartz-magnetite buffer, calculated by equation (4)
The value found for the PVG from this study is one of the highest calculated for the SVZ. At the
SVZ, fO2 values were determined at several TSVZ and CSVZ volcanoes. Ruprecht et al. (2012)
estimate NNO + 0.24 to NNO + 0.53 for mafic melts at Quizapu, Rodríguez et al. (2007) show
highly oxidizing conditions of NNO + 1.5 to NNO + 2 for Longaví, while Witter et al. (2004) indicate
a range from QFM to NNO + 1 at Villarrica. Bouvet de Maisonneuve et al. (2012) determine QFM
to NNO for Llaima, and Watt et al. (2013) estimate QFM + 1 for Apagado and Minchinmávida.
Fig. 29: Oxidation state of olivine-spinel pairs versus forsterite content of olivine from contrasting basalts. Calculations performed following Ballhaus et al. (1991). Modified image from Evans et al., 2012.
Mid-ocean ridges and subduction related volcanic arcs are the two major contributors to the global
magma budget, and previous work has suggested that arc lavas have a significantly higher
oxidation state than mid-oceanic ridge basalt (MORB, e.g., Eggins, 1993; Kelley and Cottrell,
2009). Potential oxidants include water, oxidized iron, sulfur, and carbon (Kelley and Cottrell,
2009) from the subducting slab, sediments, and mantle lithosphere. As seen on Fig. 29 oxygen
fugacity calculated for the PVG is in the range found for arc magmas.
1.0
2.0
3.0
4.0
∆ log 𝑓𝑂2 (respect to FQM)
Mid oceanic ridge basalts (MORB)
Ocean island basalts (OIB)
Low-K arc magmas
Boninites
High-K arc magmas
Samples this study

56
Re-equilibration between the olivine and spinel inclusions may have occurred naturally as a result
of slower cooling at the time of entrapment from temperatures slightly above the estimated
liquidus. Considering that, the PVG is located in one of the main alignments of the LOFZ. This
structure could facilitate a direct transport to the surface of their magmas ponded at the base of
the crust and explain the observed differences with the chemical signature of larger systems in
the rest of the volcanic products of the Andean arc. The high fugacity of oxygen could be a local
disequilibrium registered in minerals of a restricted stage of crystallization that ascended quickly
through the crust.
2.6.2 Different magma sources
The geochemical composition of the PVG alkaline lavas allows us to classify them as type 2
basalts (López-Escobar et al., 1995a), K-rich and generally enriched in incompatible elements.
However, differences of trace element abundances reveals systematic differences between each
MEC. Although all samples exhibit enrichment, Puyu 9 MIs are most enriched in all of the
incompatible elements (Fig. 18). Lava samples belonging to the south lineament tend to have a
similar composition and differ from the lava sample of Puyu9 located along the north lineament,
allowing us to conclude that the magmas that originated from the MEC from the northern lineament
differs from the south lineament, which could be due to different sources or different melting
degrees.
Ratios of highly-mobile fluid over less mobile or fluid-immobile elements that should be unaffected
by early differentiation like Ba/Nb and Pb/Ce display a clear distinction between samples. From
Fig. 30.d it can be observed that MIs have a weak fluid signal, not exceeding 0.2 in Pb/Ce and 50
in Ba/b, i.e. the input of slab fluids it is a minor factor in the formation of the PVG lavas. This is
also consistent with what is observed in Fig. 30.a, where elevated Nb/Y and La/Sm can be used
to trace low degrees of melting and-or the presence of enriched components in the mantle wedge.
When slab fluids have a small influence, a lower degree of melting is expected, with or without
assimilation of crustal material. The low Ba/La ratio (14.9 ppm in avg.) can indicate as well a low
degree of aqueous influx from the subducted oceanic crust.
Plotting Nb/Y and La/Sm versus MgO content (Fig. 30. b, c), the data show no much trend for
differentiation, as different MECs display bounded ranges of Nb/Y, for variable contents of MgO.
Conversely, data from Puyu9, show higher levels of Nb, similar to what is observed in primitive
mantle normalized trace elements patterns (Fig. 17).
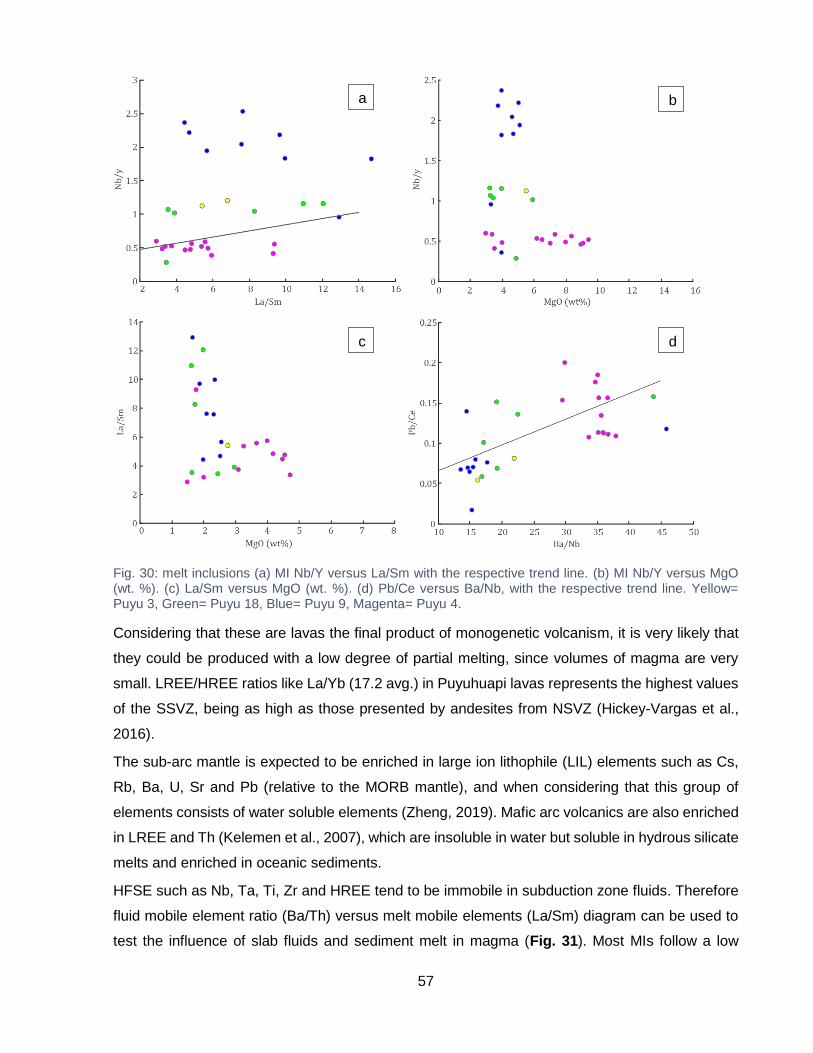
57
Fig. 30: melt inclusions (a) MI Nb/Y versus La/Sm with the respective trend line. (b) MI Nb/Y versus MgO (wt. %). (c) La/Sm versus MgO (wt. %). (d) Pb/Ce versus Ba/Nb, with the respective trend line. Yellow= Puyu 3, Green= Puyu 18, Blue= Puyu 9, Magenta= Puyu 4.
Considering that these are lavas the final product of monogenetic volcanism, it is very likely that
they could be produced with a low degree of partial melting, since volumes of magma are very
small. LREE/HREE ratios like La/Yb (17.2 avg.) in Puyuhuapi lavas represents the highest values
of the SSVZ, being as high as those presented by andesites from NSVZ (Hickey-Vargas et al.,
2016).
The sub-arc mantle is expected to be enriched in large ion lithophile (LIL) elements such as Cs,
Rb, Ba, U, Sr and Pb (relative to the MORB mantle), and when considering that this group of
elements consists of water soluble elements (Zheng, 2019). Mafic arc volcanics are also enriched
in LREE and Th (Kelemen et al., 2007), which are insoluble in water but soluble in hydrous silicate
melts and enriched in oceanic sediments.
HFSE such as Nb, Ta, Ti, Zr and HREE tend to be immobile in subduction zone fluids. Therefore
fluid mobile element ratio (Ba/Th) versus melt mobile elements (La/Sm) diagram can be used to
test the influence of slab fluids and sediment melt in magma (Fig. 31). Most MIs follow a low
a
d c
b
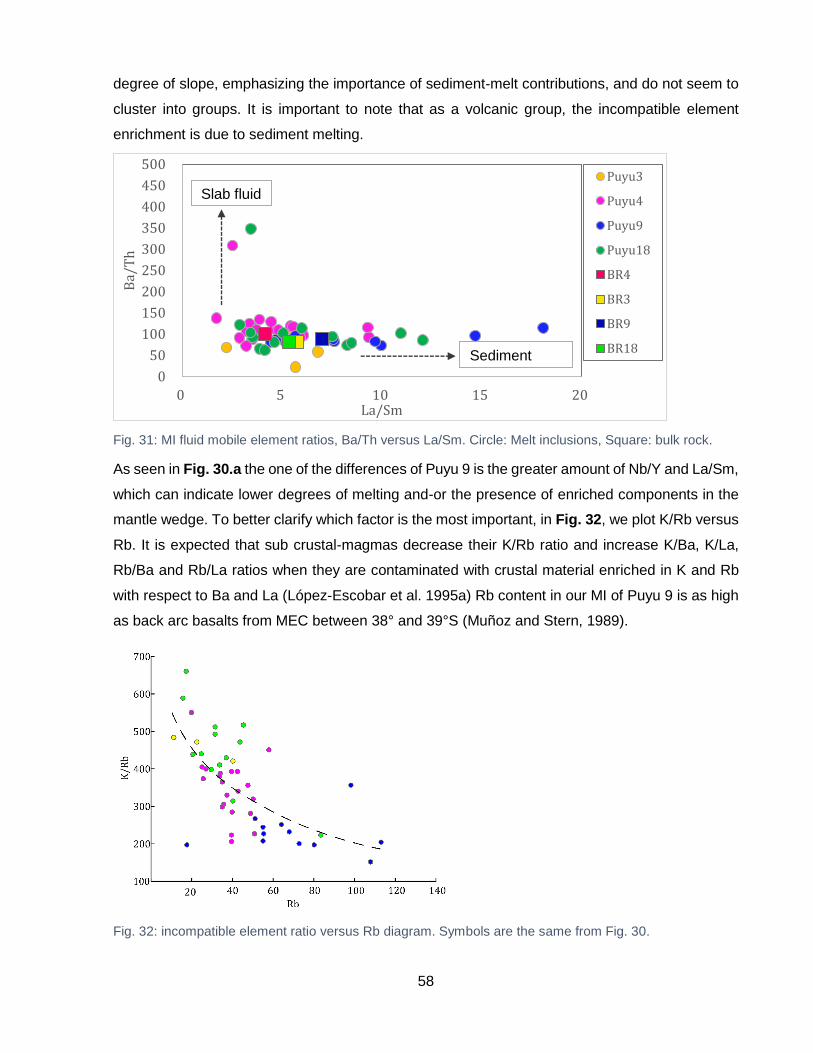
58
degree of slope, emphasizing the importance of sediment-melt contributions, and do not seem to
cluster into groups. It is important to note that as a volcanic group, the incompatible element
enrichment is due to sediment melting.
Fig. 31: MI fluid mobile element ratios, Ba/Th versus La/Sm. Circle: Melt inclusions, Square: bulk rock.
As seen in Fig. 30.a the one of the differences of Puyu 9 is the greater amount of Nb/Y and La/Sm,
which can indicate lower degrees of melting and-or the presence of enriched components in the
mantle wedge. To better clarify which factor is the most important, in Fig. 32, we plot K/Rb versus
Rb. It is expected that sub crustal-magmas decrease their K/Rb ratio and increase K/Ba, K/La,
Rb/Ba and Rb/La ratios when they are contaminated with crustal material enriched in K and Rb
with respect to Ba and La (López-Escobar et al. 1995a) Rb content in our MI of Puyu 9 is as high
as back arc basalts from MEC between 38° and 39°S (Muñoz and Stern, 1989).
Fig. 32: incompatible element ratio versus Rb diagram. Symbols are the same from Fig. 30.
0
50
100
150
200
250
300
350
400
450
500
0 5 10 15 20
Ba/
Th
La/Sm
Puyu3
Puyu4
Puyu9
Puyu18
BR4
BR3
BR9
BR18Sediment
Slab fluid
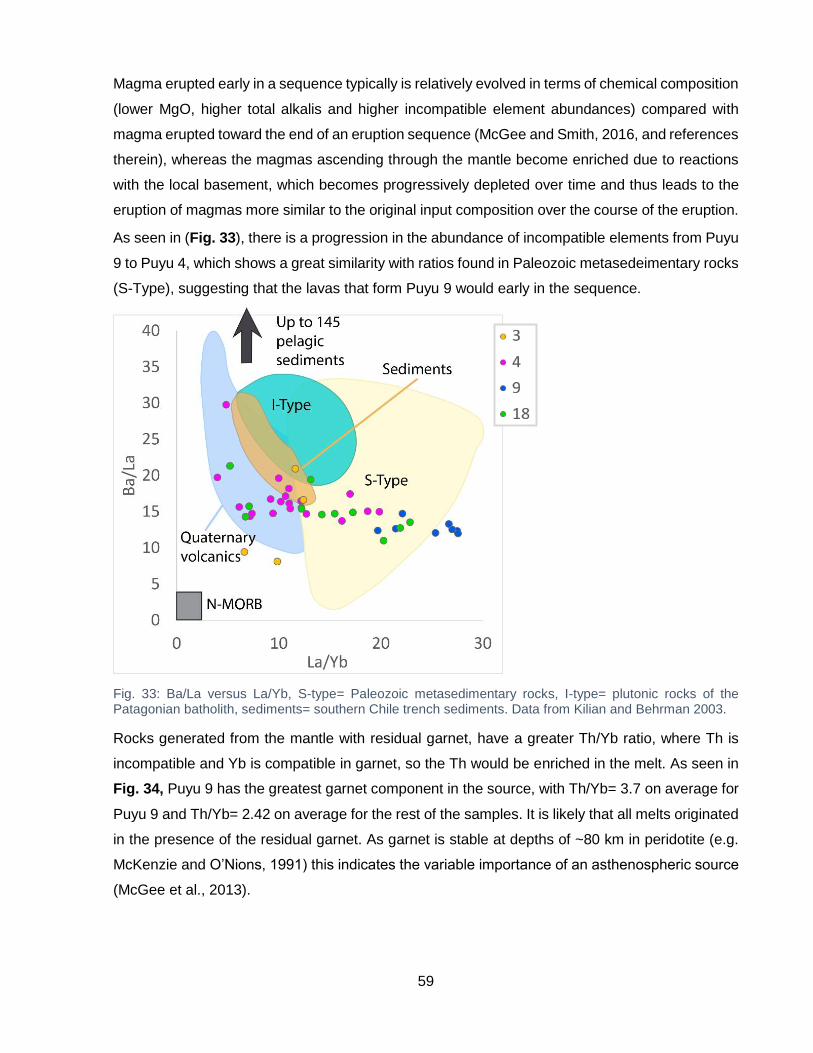
59
Magma erupted early in a sequence typically is relatively evolved in terms of chemical composition
(lower MgO, higher total alkalis and higher incompatible element abundances) compared with
magma erupted toward the end of an eruption sequence (McGee and Smith, 2016, and references
therein), whereas the magmas ascending through the mantle become enriched due to reactions
with the local basement, which becomes progressively depleted over time and thus leads to the
eruption of magmas more similar to the original input composition over the course of the eruption.
As seen in (Fig. 33), there is a progression in the abundance of incompatible elements from Puyu
9 to Puyu 4, which shows a great similarity with ratios found in Paleozoic metasedeimentary rocks
(S-Type), suggesting that the lavas that form Puyu 9 would early in the sequence.
Fig. 33: Ba/La versus La/Yb, S-type= Paleozoic metasedimentary rocks, I-type= plutonic rocks of the Patagonian batholith, sediments= southern Chile trench sediments. Data from Kilian and Behrman 2003.
Rocks generated from the mantle with residual garnet, have a greater Th/Yb ratio, where Th is
incompatible and Yb is compatible in garnet, so the Th would be enriched in the melt. As seen in
Fig. 34, Puyu 9 has the greatest garnet component in the source, with Th/Yb= 3.7 on average for
Puyu 9 and Th/Yb= 2.42 on average for the rest of the samples. It is likely that all melts originated
in the presence of the residual garnet. As garnet is stable at depths of ~80 km in peridotite (e.g.
McKenzie and O’Nions, 1991) this indicates the variable importance of an asthenospheric source
(McGee et al., 2013).
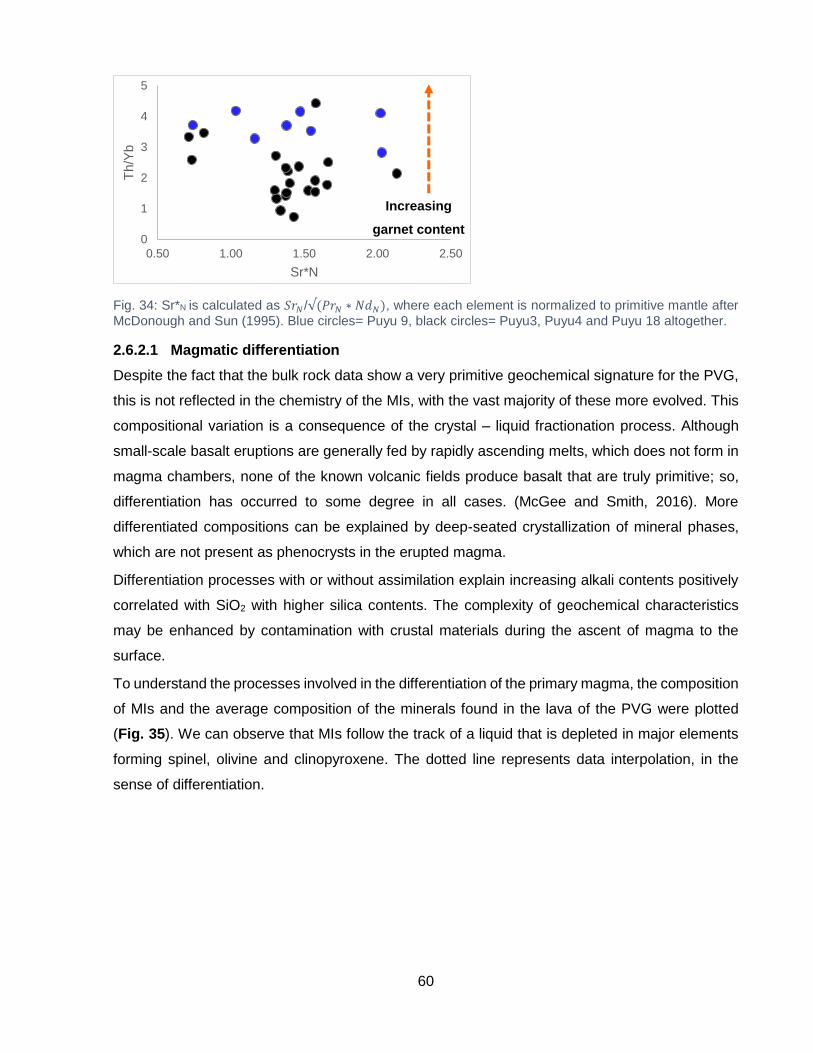
60
Fig. 34: Sr*N is calculated as 𝑆𝑟𝑁/√(𝑃𝑟𝑁 ∗ 𝑁𝑑𝑁), where each element is normalized to primitive mantle after
McDonough and Sun (1995). Blue circles= Puyu 9, black circles= Puyu3, Puyu4 and Puyu 18 altogether.
2.6.2.1 Magmatic differentiation
Despite the fact that the bulk rock data show a very primitive geochemical signature for the PVG,
this is not reflected in the chemistry of the MIs, with the vast majority of these more evolved. This
compositional variation is a consequence of the crystal – liquid fractionation process. Although
small-scale basalt eruptions are generally fed by rapidly ascending melts, which does not form in
magma chambers, none of the known volcanic fields produce basalt that are truly primitive; so,
differentiation has occurred to some degree in all cases. (McGee and Smith, 2016). More
differentiated compositions can be explained by deep-seated crystallization of mineral phases,
which are not present as phenocrysts in the erupted magma.
Differentiation processes with or without assimilation explain increasing alkali contents positively
correlated with SiO2 with higher silica contents. The complexity of geochemical characteristics
may be enhanced by contamination with crustal materials during the ascent of magma to the
surface.
To understand the processes involved in the differentiation of the primary magma, the composition
of MIs and the average composition of the minerals found in the lava of the PVG were plotted
(Fig. 35). We can observe that MIs follow the track of a liquid that is depleted in major elements
forming spinel, olivine and clinopyroxene. The dotted line represents data interpolation, in the
sense of differentiation.
0
1
2
3
4
5
0.50 1.00 1.50 2.00 2.50
Th/Y
b
Sr*N
Increasing
garnet content

61
Fig. 35: MI FeO versus MgO content, dotted line represent the compositional path followed by the extraction of a solid phase (green circle).
Taking into account that Cpx is not an abundant phase in our paragenesis, the probable fractioned
solid corresponds to 66 % of spinel and 34 % of Ol. Another feature to be considered is the
systematic evolution in the composition of magma during eruption.
Trace elements data show enrichment of Rb, Ba, Y, Zr, Nb, REE in MIs, consistent with a model
dominated by fractional crystallization of olivine + spinel ± clinopyroxene.
2.6.2.2 Disequilibrium conditions recorded in the PVG lavas
Textual evidence in Ol and Cpx crystals, such as resorptions and zoning, allow us to determine a
change in the magmatic conditions. Trace element distribution in the olivine crystals, with a higher
level of Ca towards the rims, and the increases of iron content in the groundmass glass on Puyu
18 and Puyu 9 (Fig. 36), indicate a possible heating of the magmatic system. The heating, melted
part of the minerals and increased the amount of iron in the glass (Fig. 36)
It is unlikely that the heating can be due to an input of primitive magma because MIs do not register
a notable variability in their composition. Such heating input occurs at a late stage of crystallization
since it affects crystals with a border of Fo76. This same increase in FeO content allows
crystallization of magnetite in Puyu9 and magnetite high in chromium in Puyu 3
Puyu 4 is the cone with the most primitive MIs and does not show greater disequilibrium conditions,
suggesting that it could be responsible for the heating that affected the other CEM.
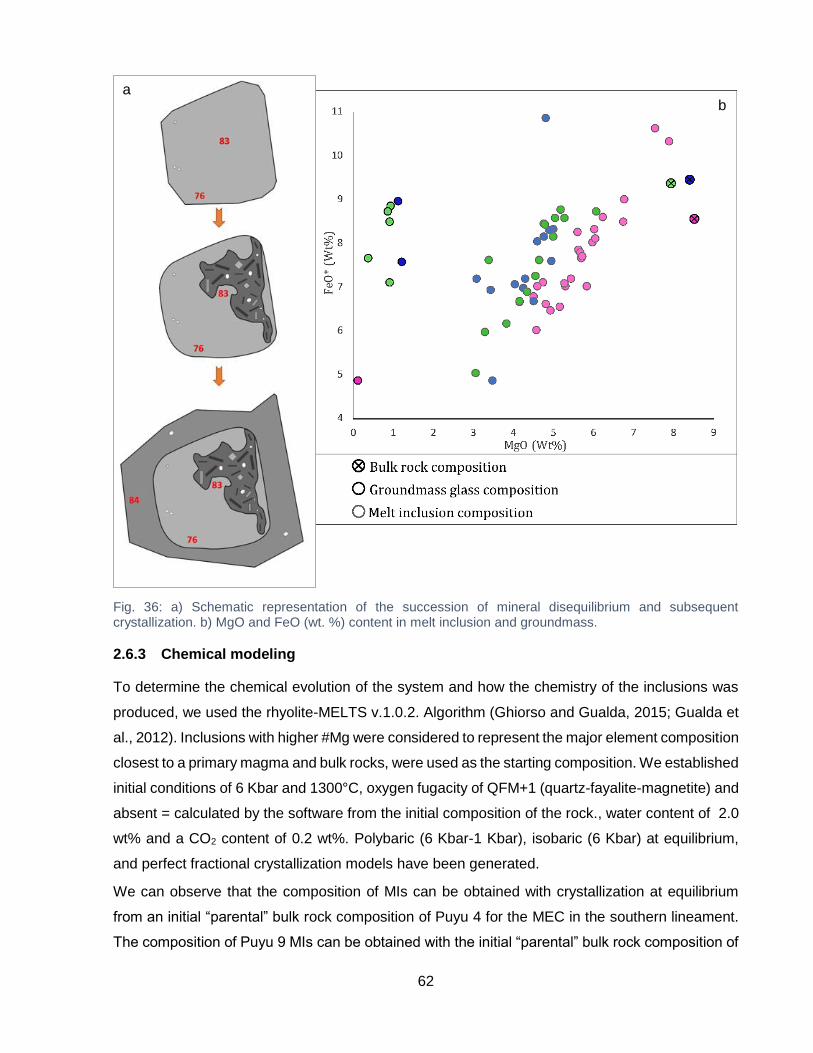
62
Fig. 36: a) Schematic representation of the succession of mineral disequilibrium and subsequent crystallization. b) MgO and FeO (wt. %) content in melt inclusion and groundmass.
2.6.3 Chemical modeling
To determine the chemical evolution of the system and how the chemistry of the inclusions was
produced, we used the rhyolite-MELTS v.1.0.2. Algorithm (Ghiorso and Gualda, 2015; Gualda et
al., 2012). Inclusions with higher #Mg were considered to represent the major element composition
closest to a primary magma and bulk rocks, were used as the starting composition. We established
initial conditions of 6 Kbar and 1300°C, oxygen fugacity of QFM+1 (quartz-fayalite-magnetite) and
absent = calculated by the software from the initial composition of the rock., water content of 2.0
wt% and a CO2 content of 0.2 wt%. Polybaric (6 Kbar-1 Kbar), isobaric (6 Kbar) at equilibrium,
and perfect fractional crystallization models have been generated.
We can observe that the composition of MIs can be obtained with crystallization at equilibrium
from an initial “parental” bulk rock composition of Puyu 4 for the MEC in the southern lineament.
The composition of Puyu 9 MIs can be obtained with the initial “parental” bulk rock composition of
a b
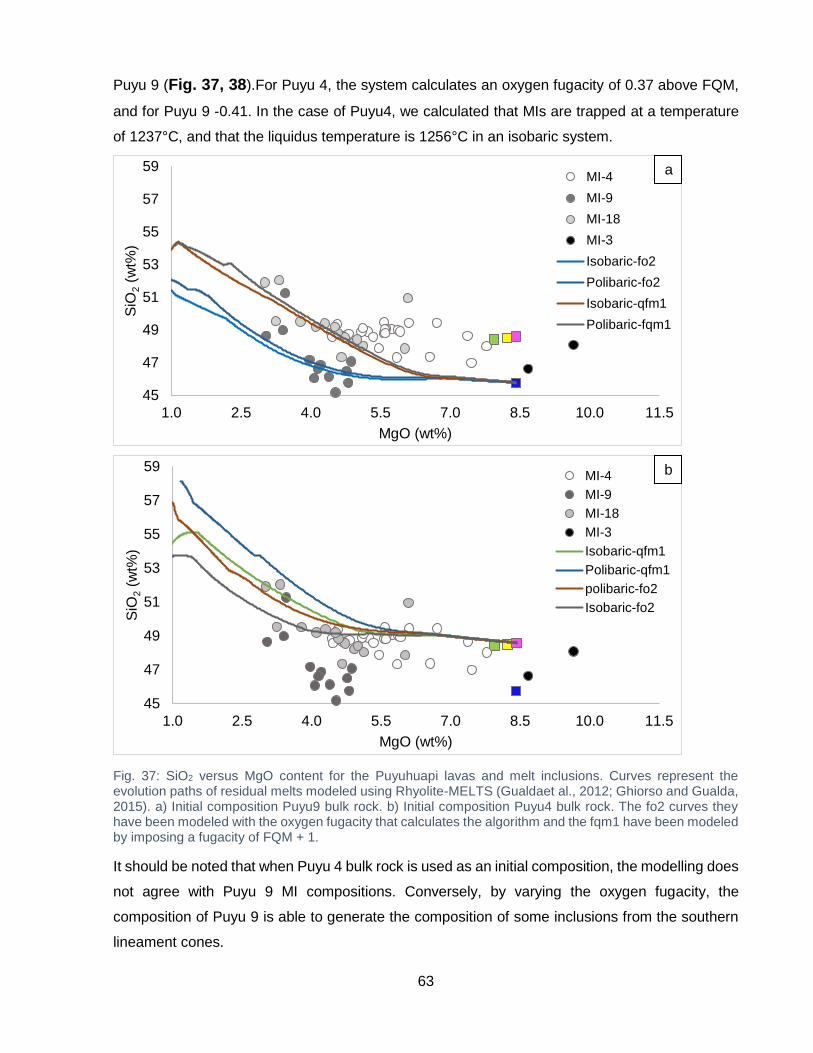
63
Puyu 9 (Fig. 37, 38).For Puyu 4, the system calculates an oxygen fugacity of 0.37 above FQM,
and for Puyu 9 -0.41. In the case of Puyu4, we calculated that MIs are trapped at a temperature
of 1237°C, and that the liquidus temperature is 1256°C in an isobaric system.
Fig. 37: SiO2 versus MgO content for the Puyuhuapi lavas and melt inclusions. Curves represent the evolution paths of residual melts modeled using Rhyolite-MELTS (Gualdaet al., 2012; Ghiorso and Gualda, 2015). a) Initial composition Puyu9 bulk rock. b) Initial composition Puyu4 bulk rock. The fo2 curves they have been modeled with the oxygen fugacity that calculates the algorithm and the fqm1 have been modeled by imposing a fugacity of FQM + 1.
It should be noted that when Puyu 4 bulk rock is used as an initial composition, the modelling does
not agree with Puyu 9 MI compositions. Conversely, by varying the oxygen fugacity, the
composition of Puyu 9 is able to generate the composition of some inclusions from the southern
lineament cones.
45
47
49
51
53
55
57
59
1.0 2.5 4.0 5.5 7.0 8.5 10.0 11.5
SiO
2(w
t%)
MgO (wt%)
MI-4
MI-9
MI-18
MI-3
Isobaric-fo2
Polibaric-fo2
Isobaric-qfm1
Polibaric-fqm1
45
47
49
51
53
55
57
59
1.0 2.5 4.0 5.5 7.0 8.5 10.0 11.5
SiO
2(w
t%)
MgO (wt%)
MI-4
MI-9
MI-18
MI-3
Isobaric-qfm1
Polibaric-qfm1
polibaric-fo2
Isobaric-fo2
b
a

64
Fig. 38: SiO2 versus MgO content for the Puyuhuapi lavas and melt inclusions. Curves represent the evolution paths of residual melts modeled using Rhyolite-MELTS (Gualdaet al., 2012; Ghiorso and Gualda, 2015). Initial composition C7 Melt inclusion from Puyu3. The fo2 curves they have been modeled with the oxygen fugacity that calculates the algorithm and the fqm1 have been modeled by imposing a fugacity of FQM + 1.
Using the composition of a recrystallized melt inclusion (C-7) of Puyu3 as the initial composition,
we can also generate the composition of the majority of the inclusions of the southern lineament
and the composition of the bulk rock. With an oxygen fugacity of QFM + 0.05, we can generate
the composition of Puyu 18 and Puyu 4. In addition, an oxygen fugacity of QFM +1 can generate
compositions close to Puyu 4 MI. Puyu 9 follows an independent compositional evolution.
45
47
49
51
53
55
57
59
1.0 2.5 4.0 5.5 7.0 8.5 10.0 11.5
SiO
2(w
t%)
MgO (wt%)
MI-4
MI-9
MI-18
MI-3
Isobaric-fo2
Isobaric-fqm1

65
2.6.4 Petrogenetic model
Considering the depth and temperature at which melt inclusions formed the following magmatic
model of multi transient reservoirs, considering that the chemistry of melt inclusions evolves
independently (Fig. 39). Low volumes of magma are generated at the base of the asthenosphere
in the garnet stability field.
Fig. 39: Schematic representation of the depths of the reservoirs associated to the Puyuhuapi cones.
The crystallization begins with an early fractionation of olivine. Even the most primitive basalts
show evidence of having undergone fractional crystallization, as their MgO contents are <11%,
and their Ni and Cr abundances are both lower than those expected in mantle-derived primary
magmas.
The magma would then ascend from its source to a depth of about 20 km, where a geothermal
gradient of 45°◦C/kmin is assessed for the Chilean Plio-Quaternary volcanic belt (Aravena et al.,
2016). At this stage, a temporary stagnation of magma occurs, along with a heat input that
increases the temperature of the system and generates disequilibrium in mineral textures and a
increase of FeO and MgO on the groundmass. This same heat input could be the trigger for the
cone Puyu 9 eruption, which in turn initiated hydraulic fracturing of the overlying rock lavas and
consequent enrichment in incompatible elements of the magma.
Brittle – ductile limit
Transient magma
chamber depth
Crust thickness
ZVS (34-40 Km)
3
18
4
9

66
2.7 Conclusions
The Puyuhuapi volcanic group is an example of how complex a monogenetic volcanic system can
be, as has been verified in different studies. Mantle source regions are almost never homogenous
or simple and very few volcanoes involve the melting of a compositionally discrete source.
Although in this type of magmatism the residence time in the crust is shorter compared to larger
volcanic systems, the magma would not ascend directly from the mantle, new magma recharges
can generate imbalance in the minerals that have already crystallized in different the transient
reservoirs. The biggest difference in terms of a major volcanic system is the plumbing system.
When the fracture of the wall rock and the exit of the magma take place, the different conducts
would be closed, becoming extinct.
This opening of new conducts for the magma extrusion through each minor eruptive center allows
the magma to be quite enriched (equivalent even with some values found in the SVZN) despite
being in an area where the crust is thinned.
The analysis of geochemical data from MIs helped determine that the magma that forms the PVG
lavas is generated from two different mantle sources, and is probably localized in the garnet
stability field as suggested for high LILE/HFSE ratios. Puyu 9 lavas would have a deeper magmatic
source with a high content of garnet.
Characteristics such as the lower amount of MgO and higher amount of alkalis of Puyu 9, in
addition to the greater enrichment of incompatible elements (Sr, Zr, Rb), allowed us to determine
that Puyu 9 not only has a deeper source of magma but was probably one of the first MEC to
erupt, experiencing greater wall-rock contamination that most likely would have generated a more
enriched composition.
The particular geochemical signature of the PVG alkaline lavas would be influenced largely by the
melting of slab sediments rather than fluid input, which would be consistent with low degrees of
melting (elevated Nb/Y and La/Sm), and the location of the system (farther west than most
volcanic features in the southern volcanic zone) makes the slab more dehydrated.
The LOFZ curves in the area of Puyuhuapi, causing a local extension in that area of the crust, the
extensional-shear fractures oriented subparallel to the maximum horizontal stress favored a direct
transport to the surface of a low magma input rate ponded deeper in the crust.
Olivine hosted-MIs allow us to constrain the P-T conditions of the deep reservoirs, with minimum
pressures of 4 K bar (south lineament) and 5 Kbar (north lineament) and a maximum temperature
of 1280°C, with 1.8 average log units above the QFM buffer.
The large amount of recrystallized MIs and disequilibrium features recorded in minerals and the
groundmass are evidence of a magma reservoir in both lineaments. On the other hand, we

67
determined that although olivine-hosted MIs are formed at an early stage of the magmatic
evolution, most of them suffered some degree of fractionation of a solid phase, formed mostly by
olivine and spinel.
When using mostly homogeneous inclusions there is a part of the information recorded in the
recrystallized inclusions that are lost, the latter being recrystallized had a longer residence time in
the cortex, prior to the eruption and could catch less differentiated magma.

68
3 BIBLIOGRAPHY
Abràmoff, M. D., Magalhães, P. J., & Ram, S. J. (2004). Image Processing with ImageJ. Biophotonics International, 11 (7), 36–42.
Aravenaa, D, Muñoz, Morataa, D, Lahsena, Paradaa, M.A., Dobson, P. (2016) Assessment of high enthalpy geothermal resources and promising areas of Chile. Geothermics; 59; 1-13
Aster, E. M., Wallace, P. J., Moore, L. R., Watkins, J., Gazel, E., & Bodnar, R. J. (2016). Reconstructing CO2 concentrations in basaltic melt inclusions using Raman analysis of vapor bubbles. Journal of Volcanology and Geothermal Research, 323, 148–162. https://doi.org/10.1016/j.jvolgeores.2016.04.028
Audétat, A., & Lowenstern, J. B. B. (2014). Melt Inclusions. Treatise on Geochemistry (Vol. 13). https://doi.org/10.1016/B978-0-08-095975-7.01106-2
Bouvet de Maisonneuve, C., Dungan, M. A., Bachmann, O., & Burgisser, A. (2012). Insights into shallow magma storage and crystallization at Volcán Llaima (Andean Southern Volcanic Zone, Chile). Journal of Volcanology and Geothermal Research, 211–212, 76–91. https://doi.org/10.1016/j.jvolgeores.2011.09.010
Burgisser, A., & Scaillet, B. (2007). Redox evolution of a degassing magma rising to the surface. Nature, 445(7124), 194–197. https://doi.org/10.1038/nature05509
Cannatelli, C., Doherty, A. L., Esposito, R., Lima, A., & De Vivo, B. (2016). Understanding a volcano through a droplet: A melt inclusion approach. Journal of Geochemical Exploration, 171, 4–19. https://doi.org/10.1016/j.gexplo.2015.10.003
Cañón-Tapia, E., & Walker, G. P. L. (2004). Global aspects of volcanism: The perspectives of “plate tectonics” and “volcanic systems.” Earth-Science Reviews, 66(1–2), 163–182. https://doi.org/10.1016/j.earscirev.2003.11.001
Carmichael ISE, Ghiorso MS (1990) Controls on oxidation-reduction relations in magmas. Rev Mineral Geochem 24:191-212
Carmichael, I. S. E. (1991). The redox states of basic and silicic magmas: a reflection of their source regions? Contributions to Mineralogy and Petrology, 106(2), 129–141. https://doi.org/10.1007/BF00306429
Cembrano, J., & Hervé, F. (1993). The Liquiñe–Ofqui fault zone: a major Cenozoic strike slip duplex in the Southern Andes. Second International Symposium of Andean Geodynamics, Oxford, extended abstracts, pp. 175–178.
Cembrano, J., Hervé, F., & Lavenu, A. (1996). The Liquine Ofqui fault zone: a long-lived intra-arc fault system in southern Chile. Tectonophysics, 259(1), 55-66.
Cembrano, J., & Lara, L. (2009). The link between volcanism and tectonics in the southern volcanic zone of the Chilean Andes: A review. Tectonophysics, 471(1–2), 96–113. https://doi.org/10.1016/j.tecto.2009.02.038
Cembrano, J., Lavenu, A., Reynolds, P., Arancibia, G., López, G., & Sanhueza, A. (2002). Late Cenozoic transpressional ductile deformation north of the Nazca–South America–Antarctica triple junction. Tectonophysics, 354(3), 289-314.
Danyushevsky, L. V., & Plechov, P. (2011). Petrolog3: Integrated software for modeling crystallization processes. Geochemistry, Geophysics, Geosystems, 12(7). https://doi.org/10.1029/2011GC003516
Deer WA, Howie, RA, Zussman J (1992). An introduction to the rock-forming minerals. Harlow, UK: Longman Scientific and Technical.
Demant, A., Hervé, F., Pankhurst, R., & Magnette, B. (1994). Alkaline and calc-alkaline Holocene basalts Irom minor volcanic centres in the Andes 01 Aysén, Southem Chile. In Congreso Geológico Chileno (No. 7, pp. 1326-1330).
Dixon J & Stolper E (1995) An experimental study of water and carbon dioxide solubilities in mid-ocean ridge basaltic liquids. Part II: Applications to degassing. J Petrol 36:1633-1646
69
Eggins, S. M. (1993). Origin and differentiation of picritic arc magmas, Ambae (Aoba), Vanuatu. Contributions to Mineralogy and Petrology, 114(1), 79–100. https://doi.org/10.1007/BF00307867
Espinoza, W. & Fuenzalida, R., (1971). Geología de las Hojas Isla Riveros, Puerto Aisén y Balmaceda, entre los paralelos 45 y 46° Lat- Sur (Inédito), Instituto de Investigaciones Geológicas-Corporación de Fomento de la Producción, 54p. Santiago.
Fine GJ, Stolper EM (1986) Carbon dioxide in basaltic glasses: concentrations and speciation. Earth Planet Sci Lett 76:263-278
Ford, C. E., Russell, D. G., Craven, J. A., & Fisk, M. R. (1983). Olivine-Liquid Equilibria : Temperature , Pressure and Composition Dependence of the Crystal / Liquid Cation Partition Coefficients for Mg , Fe 2 + , Ca and Mn, 24, 256–265.
Frezzotti, M.-L. (2001). Silicate-melt inclusions in magmatic rocks: applications to petrology. Lithos, 55(1–4), 273–299. https://doi.org/10.1016/S0024-4937(00)00048-7
Fuenzalida, R., & Etchart, H. (1974) Evidencias de migración volcánica reciente desde la línea de volcanes de la Patagonia chilena. Symposium Internacional de Volcanología, 9-14 septiembre 1974. pp.1-5.
Fuenzalida, R., & Etchart, H. (1975). Geología del territorio de Aysén comprendido entre los 43°45’ y los 45 latitud Sur. Inst. Invest. Geol., Santiago, Chile, 99.
Gaetani, G. A., O’Leary, J. A., Shimizu, N., Bucholz, C. E., & Newville, M. (2012). Rapid reequilibration of H 2O and oxygen fugacity in olivine-hosted melt inclusions. Geology, 40(10), 915–918. https://doi.org/10.1130/G32992.1
Ghiorso, M.S. & Gualda, G.A.R. Contrib Mineral Petrol (2015) 169: 53. https://doi.org/10.1007/s00410-015-1141-8
Ghiorso, M. S., & Sack, R. O. (1991). Mineralogy and F e - Ti oxide geothermometry : thermodynamic formulation and the estimation of intensive variables in silicic magmas, (108), 485–510.
Gualda G.A.R., Ghiorso M.S., Lemons R.V., Carley T.L. (2012) Rhyolite-MELTS: A modified calibration of MELTS optimized for silica-rich, fluid-bearing magmatic systems. Journal of Petrology, 53, 875-890.
Haggerty S.E. 1991. Oxide textures a mini-atlas. In: Lindsley D.H. (Ed.). Oxide Minerals: Petrologic and Magnetic Significance. Mineralogical Society of America. Reviews in Mineralogy, 25:129-219.
Haggerty SE, Lindsley DH (editors) (1991). Oxide mineralogy of the upper mantle. Spinel mineral group: Reviews in Mineralogy, Oxide minerals: Petrologic and magnetic significance 25. Mineralogical Society of America.
Hauri, E. (2002). SIMS analysis of volatiles in silicate glasses, 2: Isotopes and abundances in Hawaiian melt inclusions. Chemical Geology, 183(1–4), 115–141. https://doi.org/10.1016/S0009-2541(01)00374-6
Hauser, A. (1989). Fuentes termales y minerales en torno a la carretera austral, Regiones X-XI, Chile. Andean Geology, 16(2), 229-239.
Herd, C. D. K. (2008). Basalts as Probes of Planetary Interior Redox State. Reviews in Mineralogy and Geochemistry, 68(1), 527–553. https://doi.org/10.2138/rmg.2008.68.19
Hervé, F. (1994). The Southern Andes between 39° and 44° S latitude: the geological signature of a transpressive tectonic regime related to a magmatic arc. In Tectonics of the Southern Central Andes (pp. 243-248). Springer Berlin Heidelberg
Hervé, F., Pankhurst, R. J., Drake, R., & Beck, M. E. (1995). Pillow metabasalts in a mid-tertiary extensional basin adjacent to the Liquiñe-Ofqui fault zone: the Isla Magdalena area, Aysén, Chile. Journal of South American Earth Sciences, 8(1), 33-46.
Hickey-Vargas, R., Holbik, S., Tormey, D., Frey, F. A., & Moreno Roa, H. (2016). Basaltic rocks from the Andean Southern Volcanic Zone: Insights from the comparison of along-strike and

70
small-scale geochemical variations and their sources. Lithos, 258–259, 115–132. https://doi.org/10.1016/j.lithos.2016.04.014
Kelley, K. A., & Cottrell, E. (2009). Water and the oxidation state of subduction zone magmas. Science, 325(5940), 605–607. https://doi.org/10.1126/science.1174156
Kent, A. J. R. (2008). Melt Inclusions in Basaltic and Related Volcanic Rocks. Reviews in Mineralogy and Geochemistry, 69(1), 273–331. https://doi.org/10.2138/rmg.2008.69.8
Lahsen, A., López-Escobar, L., & Vergara, M. (1994). The Puyuhuapi volcanic group, Southern Andes (44 20'S): geological and geochemical antecedents. In Congreso Geológico Chileno (No. 7, pp. 1076-1079).
Lamadrid, H. M., Moore, L. R., Moncada, D., Rimstidt, J. D., Burruss, R. C., & Bodnar, R. J. (2017). Reassessment of the Raman CO2 densimeter. Chemical Geology, 450, 210–222. https://doi.org/10.1016/j.chemgeo.2016.12.034
Lattard, D., Sauerzapf, U., & Käsemann, M. (2005). New calibration data for the Fe-Ti oxide thermo-oxybarometers from experiments in the Fe-Ti-O system at 1 bar, 1,000-1,300°C and a large range of oxygen fugacities. Contributions to Mineralogy and Petrology, 149(6), 735–754. https://doi.org/10.1007/s00410-005-0679-2
Lindsley, D., & Frost, B. (1992). Equilibria among Fe-Ti oxides, pyroxenes, olivine and Quartz: Part I. Theory. American Mineralogist, 77, 987-1003.
Lopez-Escobar, L., Cembrano, J., & Moreno, H. (1995). Geochemistry and tectonics of the Chilean southern Andes basaltic Quaternary volcanism (37-46°S). Revista Geologica de Chile, 22(2), 219–234. https://doi.org/10.5027/andgeoV22n2-a06
López-Escobar, L. & Moreno, H. 1994. Geochemical characteristics of the Southern Andes basaltic volcanism associated with the Liquiñe–Ofqui fault zone between 39° and 46°S. Congreso Geológico Chileno, No. 7, Actas, 2, 1388–1393.
Lowenstern, J. B. (1995). Applications of silicate-melt inclusions to the study of magmatic volatiles. Magmas, Fluids and Ore Deposits. Mineralogical Association of Canada Short Course, 23(June), 71–99.
Massare, D., Métrich, N., & Clocchiatti, R. (2002). High-temperature experiments on silicate melt inclusions in olivine at 1 atm: Inference on temperatures of homogenization and H2O concentrations. Chemical Geology, 183(1–4), 87–98. https://doi.org/10.1016/S0009-2541(01)00373-4
McGee, L. E., Brahm, R., Rowe, M. C., Handley, H. K., Morgado, E., Lara, L. E., … Valdivia, P. (2017). A geochemical approach to distinguishing competing tectono-magmatic processes preserved in small eruptive centres. Contributions to Mineralogy and Petrology, 172(6), 1–26. https://doi.org/10.1007/s00410-017-1360-2
McGee, L. E., Millet, M. A., Beier, C., Smith, I. E. M., & Lindsay, J. M. (2015). Mantle heterogeneity controls on small-volume basaltic volcanism. Geology, 43(6), 551–554. https://doi.org/10.1130/G36590.1
McGee, L. E., Millet, M. A., Smith, I. E. M., Németh, K., & Lindsay, J. M. (2012). The inception and progression of melting in a monogenetic eruption: Motukorea Volcano, the Auckland Volcanic Field, New Zealand. Lithos, 155, 360–374. https://doi.org/10.1016/j.lithos.2012.09.012
Mcgee, L. E., & Smith, I. E. M. (2016). Interpreting chemical compositions of small scale basaltic systems : A review. Journal of Volcanology and Geothermal Research, 325, 45–60. https://doi.org/10.1016/j.jvolgeores.2016.06.007
McGee, L. E., & Smith, I. E. M. (2016). Interpreting chemical compositions of small scale basaltic systems: A review. Journal of Volcanology and Geothermal Research, 325, 45–60. https://doi.org/10.1016/j.jvolgeores.2016.06.007
McGee, L. E., Smith, I. E. M., Millet, M. A., Handley, H. K., & Lindsay, J. M. (2013). Asthenospheric control of melting processes in a monogenetic basaltic system: A case study of the Auckland volcanic field, New Zealand. Journal of Petrology, 54(10), 2125–2153.

71
https://doi.org/10.1093/petrology/egt043
Metrich, N., & Wallace, P. J. (2008). Volatile Abundances in Basaltic Magmas and Their Degassing Paths Tracked by Melt Inclusions. Reviews in Mineralogy and Geochemistry, 69(1), 363–402. https://doi.org/10.2138/rmg.2008.69.10
Moore, L. R., Gazel, E., Tuohy, R. M., Lloyd, A., Esposito, R., Steele-macinnis, M., … Bodnar, R. J. (2015). Bubbles matter: An assessment of the contribution of vapor bubbles to melt inclusion volatile budgets. American Mineralogist, 100 (4)(Mi), 806–823.
Mutchler, S.R. & Fedele, L. & Bodnar, R.J.. (2008). Analysis Management System (AMS) for reduction of laser ablation ICPMS data. Laser-Ablation-ICPMS in the Earth Sciences: Current Practices and Outstanding Issues. 40. 318-327.
Németh, K., & Kereszturi, G. (2015). Monogenetic volcanism: personal views and discussion. International Journal of Earth Sciences, 104(8), 2131–2146. https://doi.org/10.1007/s00531-015-1243-6
Németh, K., White, J. D. L., Reay, A., & Martin, U. (2003). Compositional variation during monogenetic volcano growth and its implications for magma supply to continental volcanic fields. Journal of the Geological Society, 160(4), 523–530. https://doi.org/10.1144/0016-764902-131
O'Neill HStC, Wall VJ (1987) The olivine-orthopyroxene-spinel oxygen geobarometer, the nickel precipitation curve, and the oxygen fugacity of the Earth's upper mantle. J Petrol 28:1169-1191
Pankhurst, R. J., Weaver, S. D., Hervé, F., & Larrondo, P. (1999). Mesozoic – Cenozoic evolution of the North Patagonian Batholith in Aysén , southern Chile. Journal of the Geological Society, London, 156, 673–694.
Papale, P., Moretti, R., & Barbato, D. (2006). The compositional dependence of the saturation surface of H 2O + CO 2 fluids in silicate melts. Chemical Geology, 229(1–3), 78–95. https://doi.org/10.1016/j.chemgeo.2006.01.013
Pardo, M., Comte, D., & Monfret, T. (2002). Seismotectonic and stress distribution in the central Chile subduction zone. Journal of South American Earth Sciences, 15(1), 11–22. doi:10.1016/s0895-9811(02)00003-2
Pardo-Casas, F., Molnar, P., 1997. Relative motion of the Nazca (Farallón) and South American plates since late Cretaceous times. Tectonics 6, 233–248. Sigurdsson, H. 1999. Encyclopedia of volcanoes, academic press, pp. 683-694.
Paton, C., Hellstrom, J., Paul, B., & Hergt, J. (2011). Iolite : Freeware for the visualisation and processing of mass spectrometric, 2508–2518. https://doi.org/10.1039/c1ja10172b
Putirka, K. D. (2008). Thermometers and Barometers for Volcanic Systems. Reviews in Mineralogy and Geochemistry, 69(1), 61–120. https://doi.org/10.2138/rmg.2008.69.3
Rodríguez, C., Sellés, D., Dungan, M., Langmuir, C., & Leeman, W. (2007). Adakitic dacites formed by intracrustal crystal fractionation of water-rich parent magmas at Nevado de Longaví volcano (36.2°S; Andean Southern Volcanic Zone, Central Chile). Journal of Petrology, 48(11), 2033–2061. https://doi.org/10.1093/petrology/egm049
Roedder, E. (1979). Origin and significance of magmatic inclusions. Bulletin de Minéralogie, 102(5), 487–510. https://doi.org/10.3406/bulmi.1979.7299
Roeder, P. L., & Emslie, R. F. (1970). Olivine-liquid equilibrium. Contributions to Mineralogy and Petrology, 29(4), 275–289. https://doi.org/10.1007/BF00371276
Ruprecht, P., Bergantz, G. W., Cooper, K. M., & Hildreth, W. (2012). The crustal magma storage system of volcán quizapu, chile, and the effects of magma mixing on magma diversity. Journal of Petrology, 53(4), 801–840. https://doi.org/10.1093/petrology/egs002
Severs, M. J., Azbej, T., Thomas, J. B., Mandeville, C. W., & Bodnar, R. J. (2007). Experimental determination of H 2 O loss from melt inclusions during laboratory heating: Evidence from
72
Raman spectroscopy. Chemical Geology, 237(3–4), 358–371. https://doi.org/10.1016/j.chemgeo.2006.07.008
Shaw, A. M., Hauri, E. H., Fischer, T. P., Hilton, D. R., & Kelley, K. A. (2008). Hydrogen isotopes in Mariana arc melt inclusions: Implications for subduction dehydration and the deep-Earth water cycle. Earth and Planetary Science Letters, 275(1–2), 138–145. https://doi.org/10.1016/j.epsl.2008.08.015
Silver LA, Ihinger PD, Stolper E (1990) The influence of bulk composition on the speciation of water in silicate glasses. Contrib Mineral Petrol 104:142-162
Smith, I. E. M., Blake, S., Wilson, C. J. N., & Houghton, B. F. (2008). Deep-seated fractionation during the rise of a small-volume basalt magma batch: Crater Hill, Auckland, New Zealand. Contributions to Mineralogy and Petrology, 155(4), 511–527. https://doi.org/10.1007/s00410-007-0255-z
Sorby, H.C., 1858. On the microscopic structure of crystals, indicating the origin of minerals and rocks. Geol. Soc. London Q. J. 14, 453–500.
Stern, C. R. (2004). Active Anean volcanism: its geologic and tectonic setting. Revista Geologica de Chile. https://doi.org/10.5027/andgeoV31n2-a01
Thomson, S. N. (2002). Late Cenozoic geomorphic and tectonic evolution of the Patagonian Andes between latitudes 42°S and 46°S: An appraisal based on fission-track results from the transpressional intra-arc Liquiñe-Ofqui fault zone. Bulletin of the Geological Society of America, 114(9), 1159–1173.
Tebbens, S.F., Cande, S.C., Kovacs, L., Parra, J.C., LaBrecque, J.L., Vergara, H., 1997. The Chile ridge: a tectonic framework. Journal of Geophysical Research 102, 12035–12059.
Völker, D., Geersen, J., Contreras-Reyes, E., Sellanes, J., Pantoja, S., Rabbel, W., Thorwart, M., Reichert, C., Block, M., Weinrebe, W. R. (2012). Morphology and geology of the continental shelf and upper slope of southern Central Chile (33°S–43°S). International Journal of Earth Sciences, 103(7), 1765–1787. doi:10.1007/s00531-012-0795-y
Wallace, P. J., Kamenetsky, V. S. V., & Cervantes, P. (2015). Melt inclusion CO2 contents, pressures of olivine crystallization, and the problem of shrinkage bubbles. American Mineralogist, 100(4), 787–794. https://doi.org/doi:10.2138/am-2015-5029
Watt, S. F. L., Pyle, D. M., Mather, T. A., & Naranjo, J. A. (2013). Arc magma compositions controlled by linked thermal and chemical gradients above the subducting slab. Geophysical Research Letters, 40(11), 2550–2556. https://doi.org/10.1002/grl.50513
Wehrmann, H., Hoernle, K., Jacques, G., Garbe-Schönberg, D., Schumann, K., Mahlke, J., & Lara, L. E. (2014). Volatile (sulphur and chlorine), major, and trace element geochemistry of mafic to intermediate tephras from the Chilean Southern Volcanic Zone (33–43°S). International Journal of Earth Sciences, 103(7), 1945–1962. https://doi.org/10.1007/s00531-014-1006-9
Weller, D. J., & Stern, C. R. (2018). Along-strike variability of primitive magmas (major and volatile elements) inferred from olivine-hosted melt inclusions, southernmost Andean Southern Volcanic Zone, Chile. Lithos, 296–299, 233–244. https://doi.org/10.1016/j.lithos.2017.11.009
Wilson, M. (1997). Igneous petrogenesis. Geochimica et Cosmochimica Acta (Vol. 61). https://doi.org/10.1180/minmag.1989.053.372.15
Witter, J. B., Kress, V. C., Delmelle, P., & Stix, J. (2004). Volatile degassing, petrology, and magma dynamics of the Villarrica Lava Lake, Southern Chile. Journal of Volcanology and Geothermal Research, 134(4), 303–337. https://doi.org/10.1016/j.jvolgeores.2004.03.002
Wood, B. J., Taras, B. L., & Johnson, K. E. (1990). Mantle oxidation state and its relationship to tectonic environment and fluid speciation. Science, 248(1973), 337.
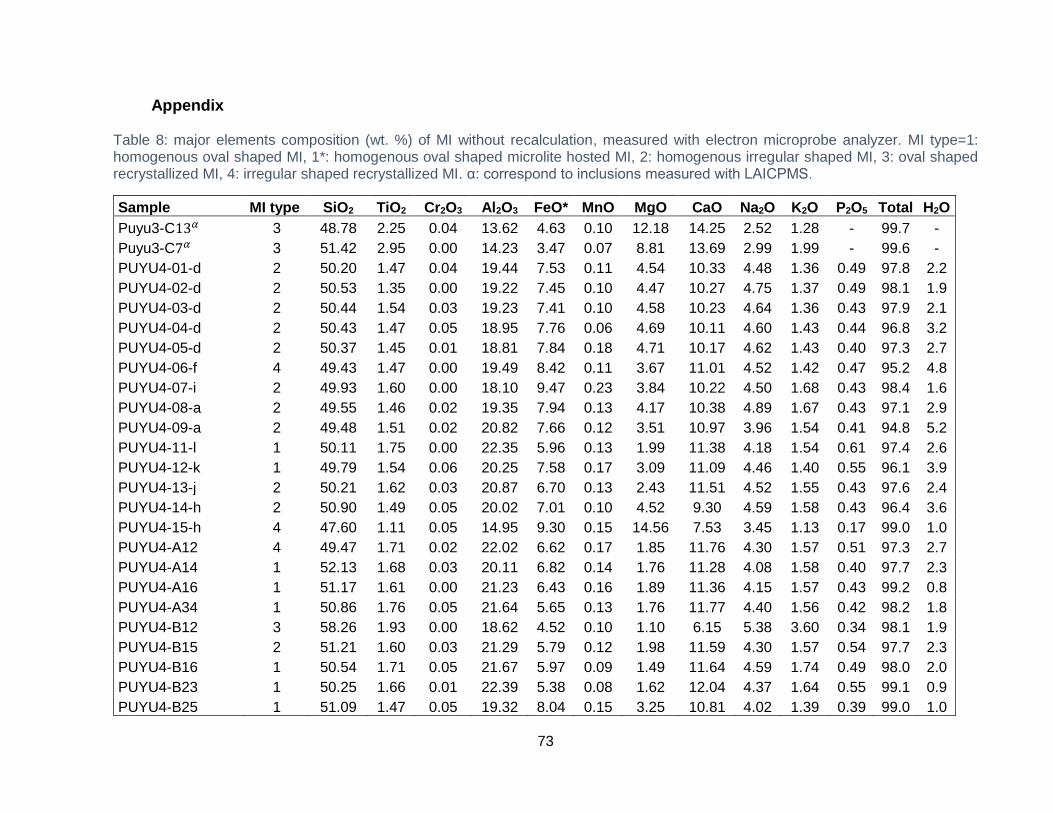
73
4 Appendix
Table 8: major elements composition (wt. %) of MI without recalculation, measured with electron microprobe analyzer. MI type=1: homogenous oval shaped MI, 1*: homogenous oval shaped microlite hosted MI, 2: homogenous irregular shaped MI, 3: oval shaped recrystallized MI, 4: irregular shaped recrystallized MI. α: correspond to inclusions measured with LAICPMS.
Sample MI type SiO2 TiO2 Cr2O3 Al2O3 FeO* MnO MgO CaO Na2O K2O P2O5 Total H2O
Puyu3-C13𝛼 3 48.78 2.25 0.04 13.62 4.63 0.10 12.18 14.25 2.52 1.28 - 99.7 -
Puyu3-C7𝛼 3 51.42 2.95 0.00 14.23 3.47 0.07 8.81 13.69 2.99 1.99 - 99.6 -
PUYU4-01-d 2 50.20 1.47 0.04 19.44 7.53 0.11 4.54 10.33 4.48 1.36 0.49 97.8 2.2
PUYU4-02-d 2 50.53 1.35 0.00 19.22 7.45 0.10 4.47 10.27 4.75 1.37 0.49 98.1 1.9
PUYU4-03-d 2 50.44 1.54 0.03 19.23 7.41 0.10 4.58 10.23 4.64 1.36 0.43 97.9 2.1
PUYU4-04-d 2 50.43 1.47 0.05 18.95 7.76 0.06 4.69 10.11 4.60 1.43 0.44 96.8 3.2
PUYU4-05-d 2 50.37 1.45 0.01 18.81 7.84 0.18 4.71 10.17 4.62 1.43 0.40 97.3 2.7
PUYU4-06-f 4 49.43 1.47 0.00 19.49 8.42 0.11 3.67 11.01 4.52 1.42 0.47 95.2 4.8
PUYU4-07-i 2 49.93 1.60 0.00 18.10 9.47 0.23 3.84 10.22 4.50 1.68 0.43 98.4 1.6
PUYU4-08-a 2 49.55 1.46 0.02 19.35 7.94 0.13 4.17 10.38 4.89 1.67 0.43 97.1 2.9
PUYU4-09-a 2 49.48 1.51 0.02 20.82 7.66 0.12 3.51 10.97 3.96 1.54 0.41 94.8 5.2
PUYU4-11-l 1 50.11 1.75 0.00 22.35 5.96 0.13 1.99 11.38 4.18 1.54 0.61 97.4 2.6
PUYU4-12-k 1 49.79 1.54 0.06 20.25 7.58 0.17 3.09 11.09 4.46 1.40 0.55 96.1 3.9
PUYU4-13-j 2 50.21 1.62 0.03 20.87 6.70 0.13 2.43 11.51 4.52 1.55 0.43 97.6 2.4
PUYU4-14-h 2 50.90 1.49 0.05 20.02 7.01 0.10 4.52 9.30 4.59 1.58 0.43 96.4 3.6
PUYU4-15-h 4 47.60 1.11 0.05 14.95 9.30 0.15 14.56 7.53 3.45 1.13 0.17 99.0 1.0
PUYU4-A12 4 49.47 1.71 0.02 22.02 6.62 0.17 1.85 11.76 4.30 1.57 0.51 97.3 2.7
PUYU4-A14 1 52.13 1.68 0.03 20.11 6.82 0.14 1.76 11.28 4.08 1.58 0.40 97.7 2.3
PUYU4-A16 1 51.17 1.61 0.00 21.23 6.43 0.16 1.89 11.36 4.15 1.57 0.43 99.2 0.8
PUYU4-A34 1 50.86 1.76 0.05 21.64 5.65 0.13 1.76 11.77 4.40 1.56 0.42 98.2 1.8
PUYU4-B12 3 58.26 1.93 0.00 18.62 4.52 0.10 1.10 6.15 5.38 3.60 0.34 98.1 1.9
PUYU4-B15 2 51.21 1.60 0.03 21.29 5.79 0.12 1.98 11.59 4.30 1.57 0.54 97.7 2.3
PUYU4-B16 1 50.54 1.71 0.05 21.67 5.97 0.09 1.49 11.64 4.59 1.74 0.49 98.0 2.0
PUYU4-B23 1 50.25 1.66 0.01 22.39 5.38 0.08 1.62 12.04 4.37 1.64 0.55 99.1 0.9
PUYU4-B25 1 51.09 1.47 0.05 19.32 8.04 0.15 3.25 10.81 4.02 1.39 0.39 99.0 1.0

74
Sample MI type SiO2 TiO2 Cr2O3 Al2O3 FeO* MnO MgO CaO Na2O K2O P2O5 Total H2O
PUYU4-B31 1 50.32 1.84 0.00 21.47 6.03 0.11 1.53 12.06 4.41 1.65 0.57 98.7 1.3
PUYU4-B33 3 50.44 1.63 0.00 21.96 6.29 0.07 1.42 11.48 4.59 1.64 0.48 99.1 0.9
PUYU4-B34 1 51.03 1.68 0.00 21.90 5.47 0.16 1.31 11.76 4.54 1.65 0.50 99.1 0.9
PUYU4-B41 2 50.66 1.64 0.04 21.93 5.70 0.07 1.70 11.63 4.50 1.61 0.51 98.7 1.3
PUYU4-C26 *1 54.76 2.34 0.00 18.22 4.29 0.09 0.81 8.70 5.94 4.23 0.61 97.6 2.4
PUYU4-C31 2 50.72 1.74 0.00 21.53 5.83 0.14 1.69 11.54 4.52 1.76 0.54 97.9 2.1
PUYU4-D31 2 50.97 1.69 0.05 22.33 4.87 0.09 1.53 11.58 4.72 1.62 0.55 96.7 3.3
PUYU4-D41 2 50.76 1.67 0.02 22.10 5.35 0.14 1.71 11.51 4.51 1.71 0.52 98.3 1.7
PUYU9-A21-a 1 48.91 2.66 0.00 20.26 6.44 0.11 1.81 12.65 4.17 2.39 0.59 97.6 2.4
PUYU9-A21-b 4 46.66 3.25 0.00 18.13 8.86 0.20 1.44 9.83 6.00 4.52 1.11 96.7 3.3
PUYU9-A4-a 2 47.94 2.84 0.00 17.37 9.62 0.23 1.88 9.68 5.29 4.22 0.91 99.2 0.8
PUYU9-A4-b 1 52.63 2.43 0.00 20.88 4.22 0.09 1.66 10.69 4.46 2.31 0.63 98.5 1.5
PUYU9-A43 2 46.45 2.56 0.01 20.60 7.45 0.15 2.35 12.70 4.27 2.62 0.82 96.8 3.2
PUYU9-A44 4 50.91 3.06 0.00 17.36 8.52 0.11 2.09 8.15 5.03 3.89 0.87 98.1 1.9
PUYU9-A45-105 4 48.04 2.77 0.00 17.53 9.76 0.18 2.32 9.81 5.03 3.68 0.88 98.4 1.6
PUYU9-A45-107 1 46.78 2.59 0.06 21.01 6.90 0.15 1.75 12.79 4.44 2.69 0.83 97.6 2.4
PUYU9-B21 4 48.02 2.74 0.02 18.29 8.35 0.14 2.25 11.62 4.68 3.06 0.83 97.8 2.2
PUYU9-B31-77 2 50.27 2.65 0.00 19.27 6.16 0.14 1.26 8.98 5.75 4.33 1.19 98.1 1.9
PUYU9-B31-79 2 50.19 2.56 0.00 19.57 6.13 0.19 1.43 8.58 6.02 4.32 1.01 99.1 0.9
PUYU9-B31-81 1 46.67 2.70 0.00 21.21 6.47 0.15 1.98 12.72 4.50 2.74 0.86 96.7 3.3
PUYU9-B32 4 47.73 2.75 0.00 17.26 9.68 0.17 1.96 10.46 5.59 3.77 0.64 97.7 2.3
PUYU9-B42 2 47.65 2.68 0.05 20.18 6.19 0.11 2.52 12.10 4.67 2.86 0.99 97.5 2.5
PUYU9-C32 1 47.52 2.44 0.07 20.29 7.19 0.12 1.97 12.91 4.12 2.58 0.80 97.8 2.2
PUYU9-C33 3 43.30 1.41 0.02 12.71 11.43 0.21 18.99 7.04 2.73 1.66 0.49 99.8 0.2
PUYU9-C37-15 *1 50.05 2.70 0.00 18.53 7.64 0.13 1.86 9.72 5.09 3.24 1.04 99.3 0.7
PUYU9-C37-18 *1 49.64 2.81 0.00 17.64 7.96 0.05 1.88 12.12 4.58 2.72 0.61 98.6 1.4
PUYU9-C38-14 *1 51.24 3.11 0.00 18.57 6.73 0.21 1.47 7.06 4.97 5.51 1.13 98.3 1.7
PUYU9-C43 4 46.51 2.71 0.00 20.10 7.07 0.16 2.14 13.11 4.46 2.80 0.96 97.6 2.4
PUYU9-C46-22 3 47.47 2.80 0.00 19.03 8.25 0.12 2.57 12.87 3.87 2.21 0.80 97.9 2.1
PUYU9-C46-23 1 48.55 2.75 0.00 20.37 6.12 0.13 1.72 13.32 4.01 2.25 0.77 97.7 2.3
PUYU9-C46-24 1 48.83 2.55 0.00 19.74 6.11 0.12 1.71 13.16 4.54 2.51 0.72 97.4 2.6
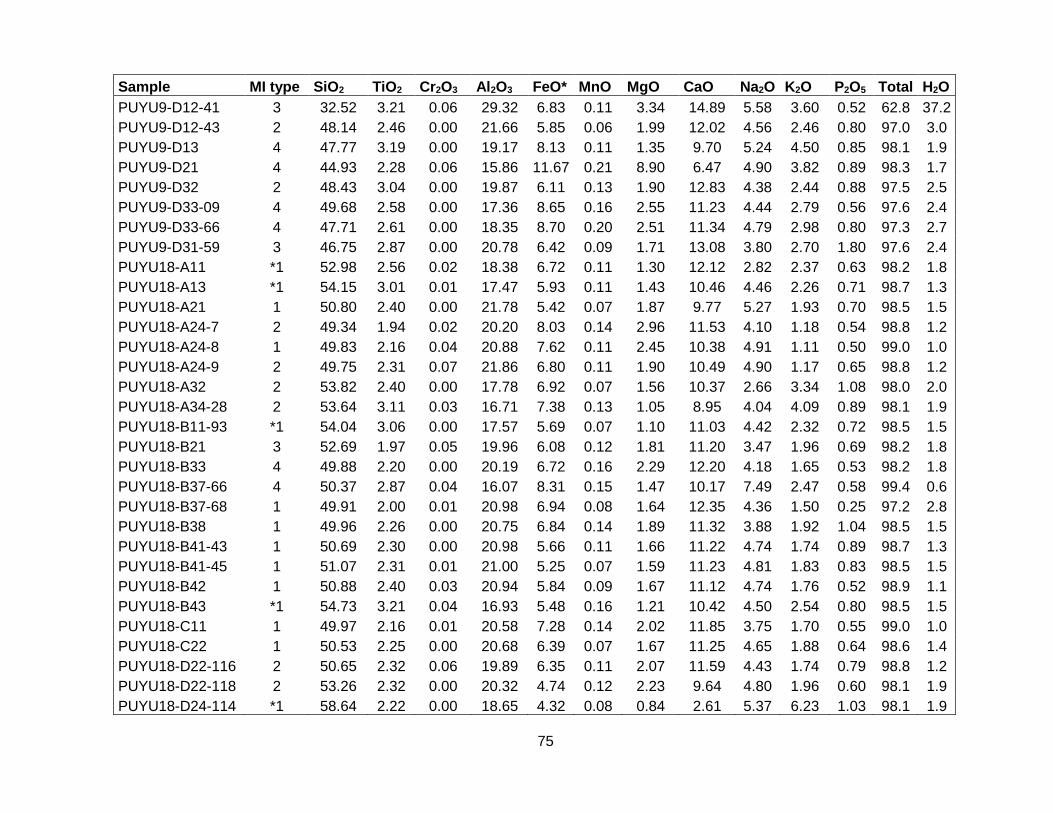
75
Sample MI type SiO2 TiO2 Cr2O3 Al2O3 FeO* MnO MgO CaO Na2O K2O P2O5 Total H2O
PUYU9-D12-41 3 32.52 3.21 0.06 29.32 6.83 0.11 3.34 14.89 5.58 3.60 0.52 62.8 37.2
PUYU9-D12-43 2 48.14 2.46 0.00 21.66 5.85 0.06 1.99 12.02 4.56 2.46 0.80 97.0 3.0
PUYU9-D13 4 47.77 3.19 0.00 19.17 8.13 0.11 1.35 9.70 5.24 4.50 0.85 98.1 1.9
PUYU9-D21 4 44.93 2.28 0.06 15.86 11.67 0.21 8.90 6.47 4.90 3.82 0.89 98.3 1.7
PUYU9-D32 2 48.43 3.04 0.00 19.87 6.11 0.13 1.90 12.83 4.38 2.44 0.88 97.5 2.5
PUYU9-D33-09 4 49.68 2.58 0.00 17.36 8.65 0.16 2.55 11.23 4.44 2.79 0.56 97.6 2.4
PUYU9-D33-66 4 47.71 2.61 0.00 18.35 8.70 0.20 2.51 11.34 4.79 2.98 0.80 97.3 2.7
PUYU9-D31-59 3 46.75 2.87 0.00 20.78 6.42 0.09 1.71 13.08 3.80 2.70 1.80 97.6 2.4
PUYU18-A11 *1 52.98 2.56 0.02 18.38 6.72 0.11 1.30 12.12 2.82 2.37 0.63 98.2 1.8
PUYU18-A13 *1 54.15 3.01 0.01 17.47 5.93 0.11 1.43 10.46 4.46 2.26 0.71 98.7 1.3
PUYU18-A21 1 50.80 2.40 0.00 21.78 5.42 0.07 1.87 9.77 5.27 1.93 0.70 98.5 1.5
PUYU18-A24-7 2 49.34 1.94 0.02 20.20 8.03 0.14 2.96 11.53 4.10 1.18 0.54 98.8 1.2
PUYU18-A24-8 1 49.83 2.16 0.04 20.88 7.62 0.11 2.45 10.38 4.91 1.11 0.50 99.0 1.0
PUYU18-A24-9 2 49.75 2.31 0.07 21.86 6.80 0.11 1.90 10.49 4.90 1.17 0.65 98.8 1.2
PUYU18-A32 2 53.82 2.40 0.00 17.78 6.92 0.07 1.56 10.37 2.66 3.34 1.08 98.0 2.0
PUYU18-A34-28 2 53.64 3.11 0.03 16.71 7.38 0.13 1.05 8.95 4.04 4.09 0.89 98.1 1.9
PUYU18-B11-93 *1 54.04 3.06 0.00 17.57 5.69 0.07 1.10 11.03 4.42 2.32 0.72 98.5 1.5
PUYU18-B21 3 52.69 1.97 0.05 19.96 6.08 0.12 1.81 11.20 3.47 1.96 0.69 98.2 1.8
PUYU18-B33 4 49.88 2.20 0.00 20.19 6.72 0.16 2.29 12.20 4.18 1.65 0.53 98.2 1.8
PUYU18-B37-66 4 50.37 2.87 0.04 16.07 8.31 0.15 1.47 10.17 7.49 2.47 0.58 99.4 0.6
PUYU18-B37-68 1 49.91 2.00 0.01 20.98 6.94 0.08 1.64 12.35 4.36 1.50 0.25 97.2 2.8
PUYU18-B38 1 49.96 2.26 0.00 20.75 6.84 0.14 1.89 11.32 3.88 1.92 1.04 98.5 1.5
PUYU18-B41-43 1 50.69 2.30 0.00 20.98 5.66 0.11 1.66 11.22 4.74 1.74 0.89 98.7 1.3
PUYU18-B41-45 1 51.07 2.31 0.01 21.00 5.25 0.07 1.59 11.23 4.81 1.83 0.83 98.5 1.5
PUYU18-B42 1 50.88 2.40 0.03 20.94 5.84 0.09 1.67 11.12 4.74 1.76 0.52 98.9 1.1
PUYU18-B43 *1 54.73 3.21 0.04 16.93 5.48 0.16 1.21 10.42 4.50 2.54 0.80 98.5 1.5
PUYU18-C11 1 49.97 2.16 0.01 20.58 7.28 0.14 2.02 11.85 3.75 1.70 0.55 99.0 1.0
PUYU18-C22 1 50.53 2.25 0.00 20.68 6.39 0.07 1.67 11.25 4.65 1.88 0.64 98.6 1.4
PUYU18-D22-116 2 50.65 2.32 0.06 19.89 6.35 0.11 2.07 11.59 4.43 1.74 0.79 98.8 1.2
PUYU18-D22-118 2 53.26 2.32 0.00 20.32 4.74 0.12 2.23 9.64 4.80 1.96 0.60 98.1 1.9
PUYU18-D24-114 *1 58.64 2.22 0.00 18.65 4.32 0.08 0.84 2.61 5.37 6.23 1.03 98.1 1.9

76
Sample MI type SiO2 TiO2 Cr2O3 Al2O3 FeO* MnO MgO CaO Na2O K2O P2O5 Total H2O
PUYU18-M-vtr1 2 52.91 2.07 0.00 22.27 4.88 0.09 1.64 10.58 3.22 1.73 0.61 99.2 0.8
PUYU18-M-vtr2 2 48.97 2.10 0.00 19.98 7.98 0.09 3.54 11.42 3.81 1.55 0.56 98.9 1.1
PUYU18-M-vtr3 1 49.77 2.16 0.00 21.60 6.39 0.07 1.91 10.79 4.90 1.77 0.65 98.0 2.0
PUYU18-M-vtr4 2 53.79 3.28 0.00 16.29 8.74 0.21 1.61 10.05 2.56 2.73 0.74 99.3 0.7
PUYU18-M-vtr5 1 51.04 2.12 0.02 20.80 6.32 0.06 2.00 10.83 4.48 1.68 0.67 99.2 0.8
PUYU18-M-vtr6 1 49.53 2.14 0.00 20.24 7.03 0.12 1.73 12.70 4.43 1.56 0.54 96.9 3.1
Table 9: melt inclusion trace element composition (ppm).
Sample V Cr Ni Cu Rb Sr Y Zr Nb Cs Ba La Ce Nd Sm
PUYU3-A22_mi 238 - 72.4 - 40.3 1328 28.7 232.2 32.2 0.8 706 42.5 79.2 37.6 7.9 Puyu3-C7-MI 326 14.0 246.5 12.0 51.7 970 31.0 260.7 37.3 - 606 49.0 110.7 51.3 7.2 PUYU4_C1_M1 230 89.0 25.5 45.0 33.6 637 21.0 134.0 11.0 0.8 394 22.6 53.1 25.1 6.7 PUYU4_C1_M2 226 87.0 136.0 42.6 35.7 584 22.1 132.0 10.3 1.3 378 24.5 48.6 23.9 5.5 PUYU4_C1_M3 216 108.0 224.0 41.4 34.9 601 21.4 138.9 10.2 0.8 373 22.3 48.7 25.7 4.7 PUYU4_C2_M1 242 123.0 85.0 49.0 39.8 700 22.6 143.3 13.3 1.2 392 26.7 54.1 27.4 4.8 PUYU4_C5_MI 242 80.0 580.0 188.0 24.9 502 21.6 100.0 11.5 343 24.2 41.0 16.0 6.5 PUYU4_C11_MI_1 217 113.0 96.0 9.6 37.3 606 20.9 143.0 10.1 1.3 354 27.3 46.0 23.0 8.5 PUYU4_C7_MI_2 190 76.0 970.0 26.0 31.5 510 18.6 96.0 10.3 390 13.1 44.0 16.9 1.4 Secuencia4_C4_MI1 206 72.0 130.0 36.0 29.4 545 18.4 94.0 10.4 0.4 360 19.8 46.6 21.8 4.1 Secuencia4_C4_MI2 224 117.0 530.0 150.0 55.0 630 18.0 166.0 8.6 350 34.0 53.2 25.0 0.0 Secuencia4_C8_MI2 220 87.0 25.0 54.4 29.9 592 21.6 123.1 10.7 0.8 385 23.5 50.5 20.4 4.1 secuencia7_A14_Mi 235 67.0 0.0 4.9 39.5 605 25.3 135.0 10.5 0.3 370 25.1 55.0 20.1 2.7 secuencia7_A21_Mi 249 130.0 5.6 3.1 39.4 670 27.1 153.0 10.6 0.7 376 25.5 55.7 28.7 4.3 b25mi_0 226 74.0 6.6 39.3 42.7 670 21.6 138.9 11.2 1.2 393 25.3 56.5 27.2 4.7 b16mi_0 192 118.0 410.0 24.0 35.0 491 18.7 117.0 11.2 0.0 275 23.6 35.3 8.2 8.2 c31Mi_0 317 4.0 37.0 19.9 47.7 699 23.9 141.0 14.0 471 24.0 64.0 28.4 0.0 Secuencia5_A43_Mi 295 30.0 23.0 5.0 55.2 970 20.7 213.0 38.0 0.6 673 55.8 105.0 37.0 5.6 Secuencia5_A4_Mi1 299 18.0 0.3 113.0 72.7 790 27.2 287.0 59.4 1.0 868 68.7 125.0 63.8 7.1 Secuencia5_A4_Mi2 82 140.0 1500.0 14.0 17.7 380 4.6 53.0 4.4 157 16.8 17.9 13.0 1.3 Secuencia5_A44_Mi 298 16.5 0.0 80.0 108.0 773 27.7 315.0 70.2 1.3 949 77.0 132.0 59.0 10.1 Secuencia5_A45_Mi2 323 25.2 3.1 115.2 80.1 845 28.7 264.0 58.7 1.0 909 75.8 134.2 59.5 10.0 secuencia6MI_B31 272 116.0 131.0 15.0 55.0 830 28.0 242.0 51.0 1.7 760 47.0 109.0 27.0 3.2 secuencia6MI_B42 309 78.0 107.0 7.0 64.0 1170 24.4 296.0 54.1 0.4 830 67.0 107.0 50.0 14.3 secuencia6MI_C32 265 63.0 215.0 280.0 55.0 863 18.7 215.0 44.3 1.3 643 51.3 91.0 36.6 11.6

77
Sample V Cr Ni Cu Rb Sr Y Zr Nb Cs Ba La Ce Nd Sm
secuencia7_D33_Mi 315 74.0 3.7 51.0 68.0 940 27.6 264.0 53.7 1.3 850 64.0 109.0 54.2 11.3 secuencia7_D12_Mi 460 100.0 210.0 0.0 113.0 1820 53.0 360.0 19.0 1.0 870 101.0 161.0 62.0 0.0 C4_MI 176 69.0 920.0 2.6 24.8 690 15.4 110.0 17.9 0.8 307 24.1 63.0 20.0 2.2 C5_MI 290 66.0 180.0 0.0 45.2 500 25.1 193.0 29.0 0.9 490 44.6 78.0 35.0 3.7 C1_MI 270 22.0 117.0 16.4 31.5 910 22.5 144.0 24.1 0.5 464 34.3 74.0 22.8 9.7 C6 305 83.0 17.0 15.0 36.8 910 23.7 149.0 24.7 473 33.1 66.0 40.0 4.0 PUYU18-A24-7 190 51.1 291.0 2.4 20.5 650 15.2 100.0 15.5 0.2 349 23.7 51.6 26.5 6.1 PUYU18-A24-8 234 34.0 49.0 3.1 15.5 404 21.3 101.9 6.1 0.3 268 13.8 38.7 16.3 4.0
Sample Pb Th Ta Hf Eu Gd Tb Tm Yb Lu Pr Dy Ho Er U
PUYU3-A22_mi 6.4 7.3 1.9 6.6 1.9 8.1 1.1 0.3 3.4 0.4 8.3 5.2 1.1 3.5 1.6 Puyu3-C7-MI 6.0 10.4 2.3 5.3 3.1 6.8 1.1 0.2 1.2 0.3 13.1 5.4 0.9 3.0 1.6 PUYU4_C1_M1 6.0 3.2 0.6 2.8 2.7 5.3 0.6 0.3 1.3 0.2 6.1 2.5 1.2 2.0 0.7 PUYU4_C1_M2 5.4 2.9 0.8 2.4 1.9 4.9 0.8 0.4 2.2 0.0 6.7 3.2 0.7 2.2 0.6 PUYU4_C1_M3 7.6 3.5 0.5 3.3 1.4 3.7 0.9 0.2 2.4 0.2 6.0 3.7 1.0 2.0 0.9 PUYU4_C2_M1 8.3 3.3 0.7 3.5 2.1 4.9 0.6 0.3 2.1 0.6 6.2 5.2 0.8 2.8 1.0 PUYU4_C5_MI 8.2 3.1 0.0 0.9 0.8 3.9 0.2 0.1 0.7 0.1 5.1 1.9 0.0 3.0 0.1 PUYU4_C11_MI_1 8.5 4.9 0.2 2.6 0.0 1.1 0.2 0.0 0.0 0.2 5.1 5.5 0.3 0.5 1.2 PUYU4_C7_MI_2 4.8 4.2 0.2 3.3 0.7 3.9 0.4 0.0 2.7 0.2 5.0 1.6 0.2 1.2 0.2 Secuencia4_C4_MI1 8.2 3.3 0.6 3.5 0.7 5.6 0.7 0.3 1.8 0.1 5.6 3.8 0.5 2.7 0.9 Secuencia4_C4_MI2 15.8 5.5 0.0 0.0 2.4 0.0 1.4 0.0 0.0 0.0 5.6 5.5 1.4 0.0 0.9 Secuencia4_C8_MI2 5.7 4.1 0.6 2.8 1.2 4.3 0.6 0.5 2.3 0.2 5.1 4.7 0.8 2.4 1.0 secuencia7_A14_Mi 8.6 3.2 0.5 4.0 1.3 3.1 1.1 0.4 3.4 0.2 8.2 5.4 1.2 2.9 0.3 secuencia7_A21_Mi 7.5 4.1 0.5 3.5 1.5 6.1 0.7 0.4 2.7 0.3 6.6 4.4 1.3 3.4 1.3 b25mi_0 6.4 4.6 0.7 4.2 2.6 2.9 0.9 0.3 2.1 0.2 6.9 4.9 0.7 2.1 1.3 b16mi_0 0.0 3.0 0.9 0.0 0.6 12.0 0.9 0.0 0.0 0.0 1.7 5.0 0.4 1.0 0.9 c31Mi_0 6.9 4.6 0.2 2.0 1.7 4.8 0.6 0.0 2.4 0.4 5.6 4.6 0.6 2.0 0.0 Secuencia5_A43_Mi 8.0 9.2 3.3 7.8 2.7 5.4 0.4 0.1 2.2 0.1 12.0 4.1 0.9 0.0 1.6 Secuencia5_A4_Mi1 8.7 10.5 3.9 5.7 3.3 9.8 1.3 0.2 3.2 0.4 14.7 5.7 0.8 3.6 2.4 Secuencia5_A4_Mi2 0.0 0.3 0.0 0.0 0.0 1.2 0.0 0.0 0.0 0.0 2.2 4.3 0.0 1.8 0.0 Secuencia5_A44_Mi 8.9 11.5 4.4 7.6 3.6 8.1 1.5 0.7 2.8 0.5 16.1 5.2 0.6 2.3 1.9 Secuencia5_A45_Mi2 9.4 10.2 4.0 5.7 3.1 8.8 1.3 0.3 2.8 0.4 14.6 5.6 1.1 2.9 2.1 secuencia6MI_B31 7.0 7.9 1.6 4.0 0.8 8.0 0.4 0.3 0.0 0.3 8.8 0.0 2.2 0.0 2.1 secuencia6MI_B42 1.8 9.6 2.4 2.8 0.5 10.5 0.2 0.0 3.4 0.3 10.8 4.3 1.8 0.0 1.8 secuencia6MI_C32 12.7 7.9 2.8 8.4 3.1 0.0 0.4 0.0 1.9 0.5 8.7 7.1 0.0 0.5 1.7 secuencia7_D33_Mi 8.7 8.9 2.4 7.2 2.4 7.5 0.6 0.0 2.4 0.3 12.3 3.8 0.9 3.4 2.4 secuencia7_D12_Mi 19.0 21.0 7.8 17.0 0.0 0.0 0.0 0.0 0.0 0.0 14.0 0.0 2.8 0.0 6.4 C4_MI 6.3 3.0 1.8 1.7 0.8 5.2 0.3 0.2 1.1 0.0 4.7 4.6 0.3 0.0 1.7

78
Sample Pb Th Ta Hf Eu Gd Tb Tm Yb Lu Pr Dy Ho Er U
C5_MI 4.6 5.7 0.8 6.3 2.0 9.0 0.1 0.6 2.2 0.6 10.5 5.2 0.4 1.0 0.7 C1_MI 5.1 5.0 0.6 3.3 1.6 7.3 0.7 0.3 1.5 0.2 7.1 3.7 0.6 2.0 1.4 C6 10.0 6.4 0.9 5.6 1.1 4.0 0.7 0.0 0.0 0.0 6.6 5.3 0.4 4.8 0.8 PUYU18-A24-7 7.0 5.3 0.9 2.7 0.9 3.5 0.5 0.1 1.5 0.1 5.9 2.6 0.7 1.1 1.2 PUYU18-A24-8 6.1 0.8 0.2 2.6 1.4 4.2 0.7 0.3 1.1 0.2 4.2 4.0 0.8 2.2 0.3
Table 10: Representative chemical analyses of olivine phenocrysts.
Sample SiO2 TiO2 Al2O3 Cr2O3 FeO MnO MgO NiO CaO Total
3-A 21 -107 41.00 0.02 0.06 0.00 21.97 0.47 36.15 0.08 0.00 99.75
3-A25-113 42.28 0.01 0.03 0.02 14.24 0.26 42.94 0.14 0.00 99.92
3-A31-120 41.33 0.01 0.03 0.01 15.54 0.28 42.48 0.11 0.00 99.79
3-B21-54 45.95 0.01 0.03 0.02 11.82 0.22 41.55 0.24 0.00 99.84
3-B42-26 42.34 0.01 0.03 0.00 17.58 0.28 39.30 0.16 0.00 99.70
PUYU18-A24-13 39.56 0.00 0.04 0.05 16.70 0.25 44.38 0.12 0.17 101.27
PUYU18-A32-21 39.91 0.00 0.06 0.03 15.81 0.26 45.66 0.20 0.18 102.10
PUYU18-B21-89 40.06 0.01 0.04 0.00 15.84 0.19 44.97 0.12 0.22 101.45
PUYU18-B26-85 39.84 0.00 0.05 0.00 15.59 0.21 45.03 0.24 0.21 101.17
PUYU18-B37-70 39.82 0.05 0.06 0.00 16.80 0.24 43.92 0.10 0.21 101.20
PUYU18-B41-44 40.11 0.02 0.05 0.03 15.79 0.28 45.65 0.17 0.23 102.33
PUYU18-B42-41 39.84 0.04 0.03 0.00 16.48 0.23 44.81 0.22 0.19 101.83
PUYU18-C22-123 39.88 0.01 0.01 0.00 15.43 0.28 45.33 0.24 0.17 101.34
PUYU18-C39-53 39.99 0.00 0.03 0.03 14.49 0.25 46.31 0.29 0.15 101.52
PUYU18-D16-112 39.95 0.03 0.05 0.01 15.35 0.24 45.37 0.11 0.16 101.26
PUYU18-M-01 39.77 0.00 0.00 0.04 16.05 0.24 45.25 0.18 0.19 101.72
PUYU18-M-03 39.94 0.05 0.00 0.01 15.67 0.20 45.33 0.24 0.21 101.65
PUYU18-M-05 39.75 0.03 0.00 0.03 15.39 0.24 45.66 0.23 0.14 101.47
PUYU18-M-07 39.68 0.00 0.00 0.04 15.98 0.28 45.22 0.30 0.17 101.67
PUYU18-M-11 39.69 0.00 0.00 0.04 16.81 0.24 44.50 0.18 0.24 101.70
Puyu3-A21-1 41.00 0.02 0.06 0.00 21.97 0.47 36.15 0.08 0.00 99.75
PUYU3-C7 46.82 0.00 0.04 0.03 8.42 0.16 43.91 0.33 0.00 99.71
Puyu3-D42-4 39.62 0.00 0.04 0.00 15.64 0.26 45.08 0.16 0.15 100.95
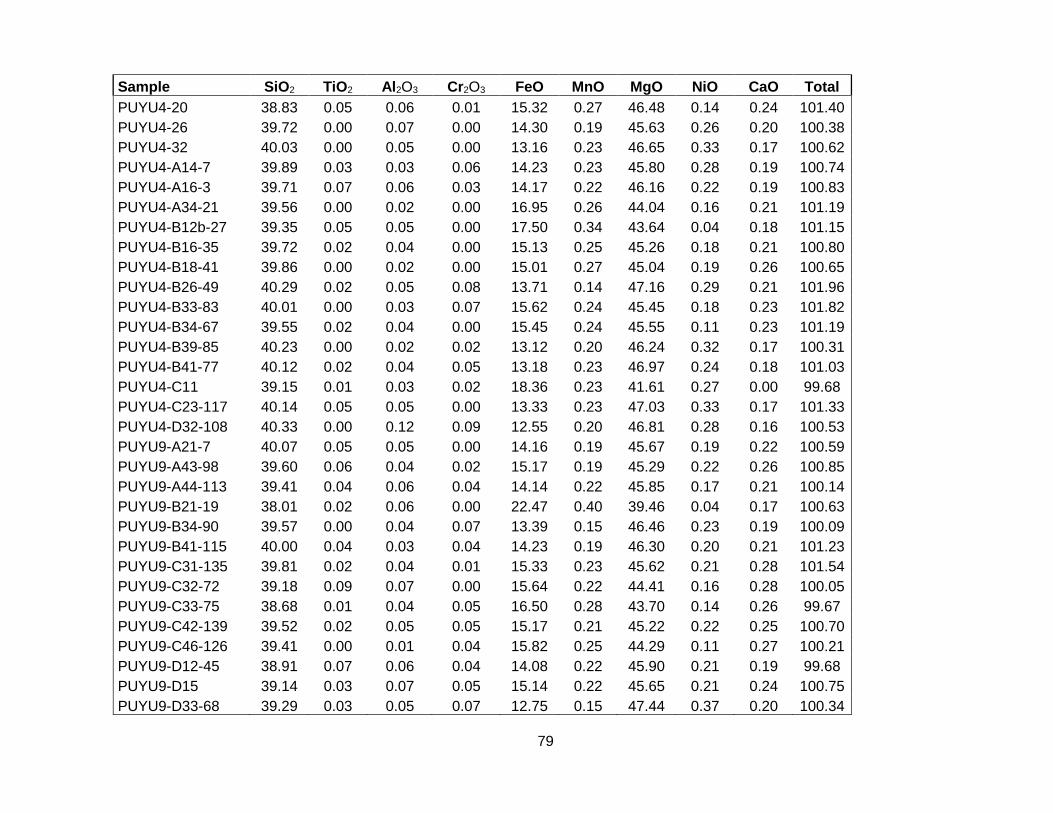
79
Sample SiO2 TiO2 Al2O3 Cr2O3 FeO MnO MgO NiO CaO Total
PUYU4-20 38.83 0.05 0.06 0.01 15.32 0.27 46.48 0.14 0.24 101.40
PUYU4-26 39.72 0.00 0.07 0.00 14.30 0.19 45.63 0.26 0.20 100.38
PUYU4-32 40.03 0.00 0.05 0.00 13.16 0.23 46.65 0.33 0.17 100.62
PUYU4-A14-7 39.89 0.03 0.03 0.06 14.23 0.23 45.80 0.28 0.19 100.74
PUYU4-A16-3 39.71 0.07 0.06 0.03 14.17 0.22 46.16 0.22 0.19 100.83
PUYU4-A34-21 39.56 0.00 0.02 0.00 16.95 0.26 44.04 0.16 0.21 101.19
PUYU4-B12b-27 39.35 0.05 0.05 0.00 17.50 0.34 43.64 0.04 0.18 101.15
PUYU4-B16-35 39.72 0.02 0.04 0.00 15.13 0.25 45.26 0.18 0.21 100.80
PUYU4-B18-41 39.86 0.00 0.02 0.00 15.01 0.27 45.04 0.19 0.26 100.65
PUYU4-B26-49 40.29 0.02 0.05 0.08 13.71 0.14 47.16 0.29 0.21 101.96
PUYU4-B33-83 40.01 0.00 0.03 0.07 15.62 0.24 45.45 0.18 0.23 101.82
PUYU4-B34-67 39.55 0.02 0.04 0.00 15.45 0.24 45.55 0.11 0.23 101.19
PUYU4-B39-85 40.23 0.00 0.02 0.02 13.12 0.20 46.24 0.32 0.17 100.31
PUYU4-B41-77 40.12 0.02 0.04 0.05 13.18 0.23 46.97 0.24 0.18 101.03
PUYU4-C11 39.15 0.01 0.03 0.02 18.36 0.23 41.61 0.27 0.00 99.68
PUYU4-C23-117 40.14 0.05 0.05 0.00 13.33 0.23 47.03 0.33 0.17 101.33
PUYU4-D32-108 40.33 0.00 0.12 0.09 12.55 0.20 46.81 0.28 0.16 100.53
PUYU9-A21-7 40.07 0.05 0.05 0.00 14.16 0.19 45.67 0.19 0.22 100.59
PUYU9-A43-98 39.60 0.06 0.04 0.02 15.17 0.19 45.29 0.22 0.26 100.85
PUYU9-A44-113 39.41 0.04 0.06 0.04 14.14 0.22 45.85 0.17 0.21 100.14
PUYU9-B21-19 38.01 0.02 0.06 0.00 22.47 0.40 39.46 0.04 0.17 100.63
PUYU9-B34-90 39.57 0.00 0.04 0.07 13.39 0.15 46.46 0.23 0.19 100.09
PUYU9-B41-115 40.00 0.04 0.03 0.04 14.23 0.19 46.30 0.20 0.21 101.23
PUYU9-C31-135 39.81 0.02 0.04 0.01 15.33 0.23 45.62 0.21 0.28 101.54
PUYU9-C32-72 39.18 0.09 0.07 0.00 15.64 0.22 44.41 0.16 0.28 100.05
PUYU9-C33-75 38.68 0.01 0.04 0.05 16.50 0.28 43.70 0.14 0.26 99.67
PUYU9-C42-139 39.52 0.02 0.05 0.05 15.17 0.21 45.22 0.22 0.25 100.70
PUYU9-C46-126 39.41 0.00 0.01 0.04 15.82 0.25 44.29 0.11 0.27 100.21
PUYU9-D12-45 38.91 0.07 0.06 0.04 14.08 0.22 45.90 0.21 0.19 99.68
PUYU9-D15 39.14 0.03 0.07 0.05 15.14 0.22 45.65 0.21 0.24 100.75
PUYU9-D33-68 39.29 0.03 0.05 0.07 12.75 0.15 47.44 0.37 0.20 100.34

80
Table 11: Representative chemical analyses of pyroxenes, whit the compositional classification calculated based on 6 oxygen.
Sample SiO2 TiO2 Al2O3 Cr2O3 Fe2O3 FeO MnO MgO CaO Na2O TOTAL Wo En Fs
PUYU-18-60 51.0 1.1 2.9 0.4 2.3 5.3 0.2 15.6 21.1 0.4 100.1 43.5 44.6 11.9
PUYU-18-61 51.7 0.9 2.3 0.3 1.8 5.4 0.2 15.9 21.2 0.3 100.0 43.3 45.3 11.4
PUYU9-A13 - Px 3 45.8 2.9 7.3 0.5 3.7 3.9 0.2 12.8 22.7 0.3 100.0 49.1 38.5 12.4
PUYU9-A31-92 46.1 2.7 7.7 0.4 3.2 4.2 0.2 12.6 22.6 0.4 100.2 49.4 38.3 12.3
PUYU9-A48-101 45.3 2.4 7.9 0.4 6.6 1.1 0.1 13.3 22.8 0.5 100.4 48.8 39.4 11.8
PUYU9-A49-104 48.6 1.8 4.6 0.1 4.2 4.3 0.2 14.2 22.0 0.4 100.3 45.6 41.1 13.2
PUYU9-B45-123 50.0 1.5 4.1 0.3 2.4 4.4 0.1 15.2 22.0 0.3 100.2 45.5 43.8 10.8
PUYU9-B45-124 44.5 3.1 9.1 0.6 4.2 3.8 0.1 12.2 22.5 0.4 100.4 49.6 37.4 13.1
PUYU9-C14-33 46.2 2.1 7.2 0.4 5.7 2.1 0.1 13.4 22.7 0.4 100.2 48.3 39.6 12.1
PUYU9-C14-34 49.5 1.5 4.0 0.2 4.2 2.9 0.1 15.3 22.4 0.3 100.3 45.8 43.6 10.7
PUYU9-C21-21 49.7 1.5 4.1 0.2 3.0 3.7 0.2 15.0 22.5 0.3 100.1 46.5 43.1 10.4
PUYU9-C21-22 45.5 2.7 7.9 0.4 4.9 2.7 0.1 13.0 22.7 0.4 100.4 49.0 38.9 12.1
PUYU 9 - C21 - Px 20 49.6 1.5 3.9 0.3 3.7 3.2 0.1 15.0 22.6 0.4 100.3 46.6 42.8 10.6
PUYU 9 - C21 - Px 21 49.7 1.7 3.7 0.1 2.8 4.9 0.2 14.1 22.7 0.3 100.1 47.1 40.6 12.3
PUYU9-C37 - Px 108 45.1 3.1 7.9 0.6 3.0 4.8 0.1 12.8 22.6 0.0 100.1 48.8 38.4 12.7
PUYU9-C44-146 50.2 1.4 3.7 0.2 2.8 3.8 0.1 15.3 22.3 0.3 100.2 45.8 43.8 10.4
PUYU9-C44-147 44.7 3.1 8.9 0.4 4.4 3.6 0.2 12.3 22.4 0.3 100.3 49.3 37.7 13.0
PUYU9-C44-148 49.8 1.4 3.9 0.3 3.2 3.7 0.2 15.1 22.4 0.3 100.2 46.0 43.3 10.7
PUYU9-C44-149 46.1 2.4 6.8 0.0 5.7 3.4 0.1 12.8 22.5 0.5 100.3 47.9 37.8 14.3
PUYU9-D15 - Px 101 45.6 3.1 7.0 0.1 5.2 5.5 0.1 12.2 21.6 0.4 100.9 46.4 36.5 17.0
PUYU9-D15 - Px 102 44.2 3.6 8.0 0.1 5.4 5.7 0.2 11.3 21.2 0.6 100.4 46.9 34.7 18.4
PUYU9-D21-57 45.9 2.2 7.3 0.4 5.9 1.9 0.1 13.4 22.7 0.4 100.2 48.3 39.8 11.9
PUYU 9 - D14 - Px 56 49.5 1.4 3.9 0.3 3.6 3.6 0.1 14.9 22.4 0.3 99.9 46.2 42.7 11.1
PUYU 9 - D14 - Px 57 44.2 3.3 8.0 0.5 5.5 2.7 0.1 12.2 22.6 0.5 99.6 49.7 37.2 13.1
PUYU 9 - D14 - Px 60 46.1 2.7 7.4 0.5 4.3 3.1 0.1 13.1 22.9 0.4 100.7 49.1 39.1 11.8
PUYU 9 - D23 - Px 84 50.6 1.3 3.7 0.3 1.5 4.3 0.1 15.2 22.2 0.3 99.5 46.5 44.3 9.3
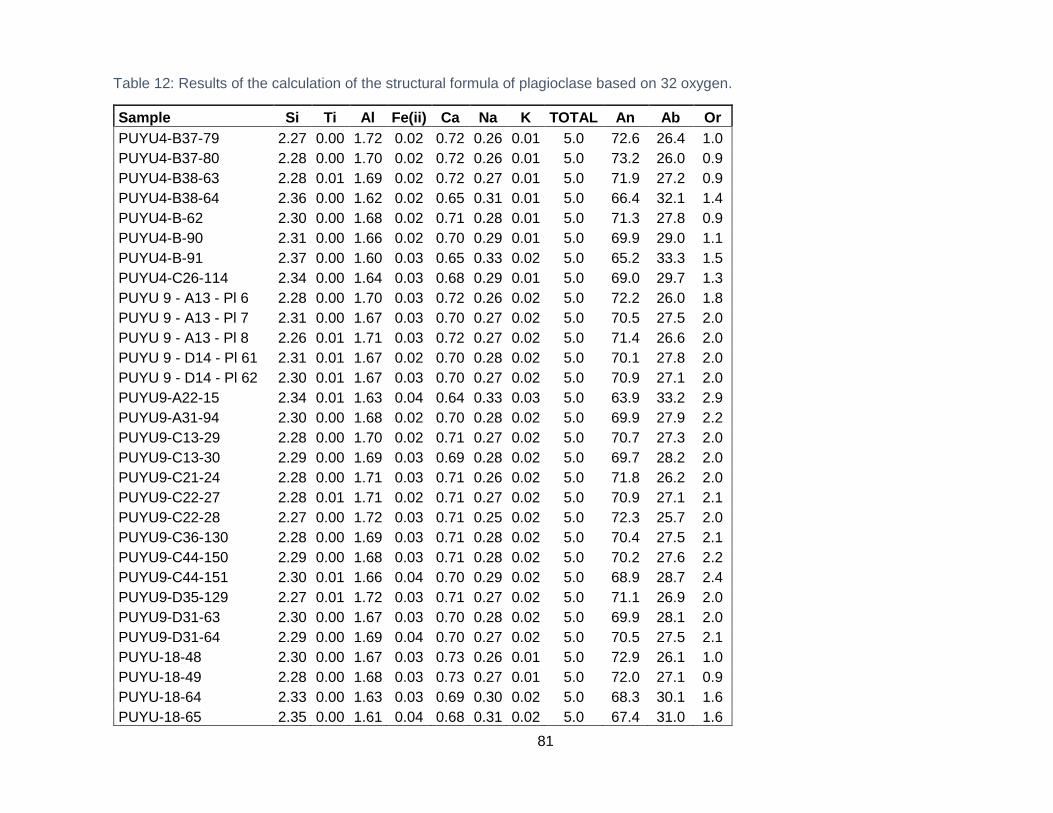
81
Table 12: Results of the calculation of the structural formula of plagioclase based on 32 oxygen.
Sample Si Ti Al Fe(ii) Ca Na K TOTAL An Ab Or
PUYU4-B37-79 2.27 0.00 1.72 0.02 0.72 0.26 0.01 5.0 72.6 26.4 1.0
PUYU4-B37-80 2.28 0.00 1.70 0.02 0.72 0.26 0.01 5.0 73.2 26.0 0.9
PUYU4-B38-63 2.28 0.01 1.69 0.02 0.72 0.27 0.01 5.0 71.9 27.2 0.9
PUYU4-B38-64 2.36 0.00 1.62 0.02 0.65 0.31 0.01 5.0 66.4 32.1 1.4
PUYU4-B-62 2.30 0.00 1.68 0.02 0.71 0.28 0.01 5.0 71.3 27.8 0.9
PUYU4-B-90 2.31 0.00 1.66 0.02 0.70 0.29 0.01 5.0 69.9 29.0 1.1
PUYU4-B-91 2.37 0.00 1.60 0.03 0.65 0.33 0.02 5.0 65.2 33.3 1.5
PUYU4-C26-114 2.34 0.00 1.64 0.03 0.68 0.29 0.01 5.0 69.0 29.7 1.3
PUYU 9 - A13 - Pl 6 2.28 0.00 1.70 0.03 0.72 0.26 0.02 5.0 72.2 26.0 1.8
PUYU 9 - A13 - Pl 7 2.31 0.00 1.67 0.03 0.70 0.27 0.02 5.0 70.5 27.5 2.0
PUYU 9 - A13 - Pl 8 2.26 0.01 1.71 0.03 0.72 0.27 0.02 5.0 71.4 26.6 2.0
PUYU 9 - D14 - Pl 61 2.31 0.01 1.67 0.02 0.70 0.28 0.02 5.0 70.1 27.8 2.0
PUYU 9 - D14 - Pl 62 2.30 0.01 1.67 0.03 0.70 0.27 0.02 5.0 70.9 27.1 2.0
PUYU9-A22-15 2.34 0.01 1.63 0.04 0.64 0.33 0.03 5.0 63.9 33.2 2.9
PUYU9-A31-94 2.30 0.00 1.68 0.02 0.70 0.28 0.02 5.0 69.9 27.9 2.2
PUYU9-C13-29 2.28 0.00 1.70 0.02 0.71 0.27 0.02 5.0 70.7 27.3 2.0
PUYU9-C13-30 2.29 0.00 1.69 0.03 0.69 0.28 0.02 5.0 69.7 28.2 2.0
PUYU9-C21-24 2.28 0.00 1.71 0.03 0.71 0.26 0.02 5.0 71.8 26.2 2.0
PUYU9-C22-27 2.28 0.01 1.71 0.02 0.71 0.27 0.02 5.0 70.9 27.1 2.1
PUYU9-C22-28 2.27 0.00 1.72 0.03 0.71 0.25 0.02 5.0 72.3 25.7 2.0
PUYU9-C36-130 2.28 0.00 1.69 0.03 0.71 0.28 0.02 5.0 70.4 27.5 2.1
PUYU9-C44-150 2.29 0.00 1.68 0.03 0.71 0.28 0.02 5.0 70.2 27.6 2.2
PUYU9-C44-151 2.30 0.01 1.66 0.04 0.70 0.29 0.02 5.0 68.9 28.7 2.4
PUYU9-D35-129 2.27 0.01 1.72 0.03 0.71 0.27 0.02 5.0 71.1 26.9 2.0
PUYU9-D31-63 2.30 0.00 1.67 0.03 0.70 0.28 0.02 5.0 69.9 28.1 2.0
PUYU9-D31-64 2.29 0.00 1.69 0.04 0.70 0.27 0.02 5.0 70.5 27.5 2.1
PUYU-18-48 2.30 0.00 1.67 0.03 0.73 0.26 0.01 5.0 72.9 26.1 1.0
PUYU-18-49 2.28 0.00 1.68 0.03 0.73 0.27 0.01 5.0 72.0 27.1 0.9
PUYU-18-64 2.33 0.00 1.63 0.03 0.69 0.30 0.02 5.0 68.3 30.1 1.6
PUYU-18-65 2.35 0.00 1.61 0.04 0.68 0.31 0.02 5.0 67.4 31.0 1.6
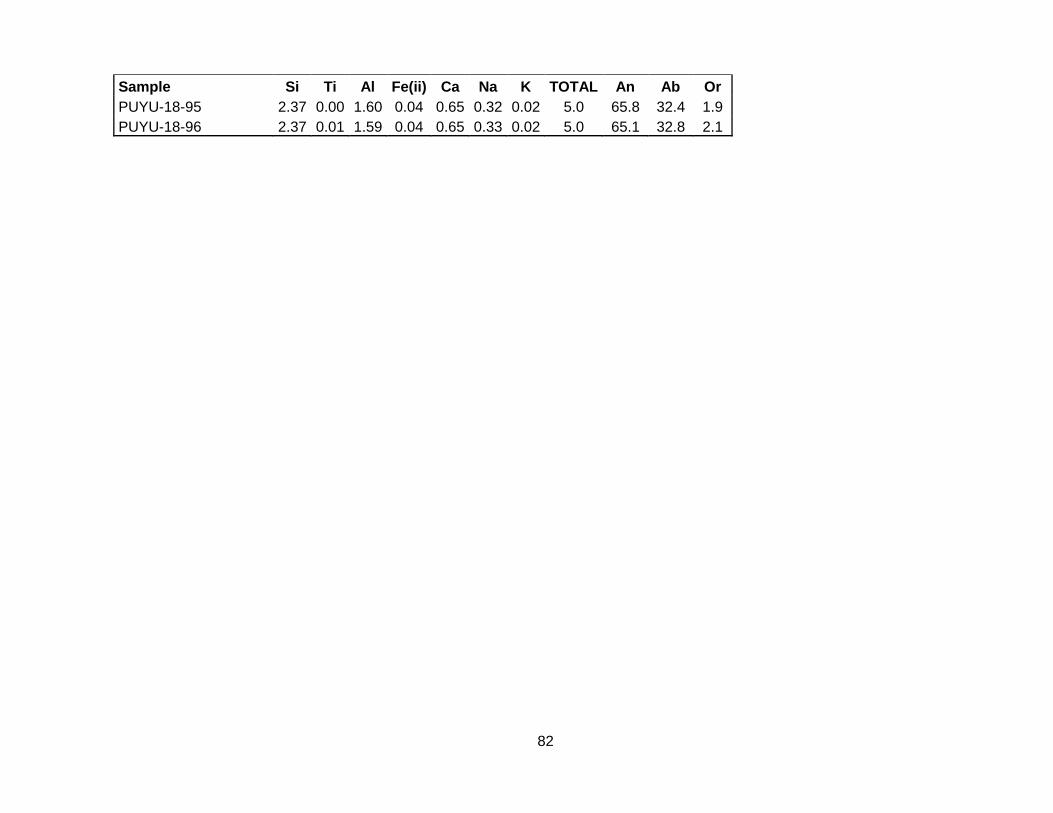
82
Sample Si Ti Al Fe(ii) Ca Na K TOTAL An Ab Or
PUYU-18-95 2.37 0.00 1.60 0.04 0.65 0.32 0.02 5.0 65.8 32.4 1.9
PUYU-18-96 2.37 0.01 1.59 0.04 0.65 0.33 0.02 5.0 65.1 32.8 2.1

83
Related Documents


![Magmatic affinity of modern and ancient subalkaline ...espace.inrs.ca/1898/1/Ross-Bedard(magmatic-affinity)2009[1].pdf · determined from trace element discriminant diagrams ... Magmatic](https://static.cupdf.com/doc/110x72/5b98e05509d3f219118ce71e/magmatic-affinity-of-modern-and-ancient-subalkaline-magmatic-affinity20091pdf.jpg)